We are pleased to present this annual report for Dreyfus Floating Rate Income Fund, covering the 12-month period from September 1, 2017 through August 31, 2018. For information about how the fund performed during the reporting period, as well as general market perspectives, we provide a Discussion of Fund Performance on the pages that follow.
The 12-month period started on solid footing which gave way to a shifting landscape. Through February of 2018, major global economies appeared to be in lock-step as they moved towards less accommodative monetary policy and concurrent growth. In the equity markets, both U.S. and non-U.S. markets enjoyed an upward trek across sectors and market caps. Interest rates rose across the curve putting pressure on bond prices, but sectors such as investment grade and high yield corporates, non-U.S. dollar denominated bonds and emerging market debt, were able to outperform like-duration U.S. Treasuries.
In February, the first rumblings of discontent shook equity markets. Global growth and monetary policy paths began to diverge. Non-U.S. economies weakened. Momentum sputtered, and equities began to struggle. Emerging market debt, non-U.S. denominated bonds and corporate debt gave up much of the performance earned earlier in the period. Long-term U.S. interest rates started to fall. The shockwave ended in April and pressure on U.S. equity markets eased, allowing U.S. equity markets to end the 12-month period with double-digit gains.
Despite new concerns regarding trade, U.S. inflationary pressures and global growth, we are optimistic that U.S. consumer spending, corporate earnings, and economic data will remain strong in the near term. However, we will stay attentive to signs that might signal possible changes on the horizon. As always, we encourage you to discuss the risks and opportunities of today’s investment environment with your financial advisor.
Thank you for your continued confidence and support.
DISCUSSION OF FUND PERFORMANCE (Unaudited)
For the period from September 1, 2017 through August 31, 2018, as provided by the fund’s primary portfolio managers, Kevin Cronk, Chris Barris, and Leland Hart of Alcentra NY, LLC, Sub-Investment Adviser
Market and Fund Performance Overview
For the 12-month period ended August 31, 2018, Dreyfus Floating Rate Income Fund’s Class A shares produced a total return of 3.38%, Class C shares returned 2.62%, Class I shares returned 3.68%, and Class Y shares returned 3.60%.1 The fund’s benchmark, The S&P/LSTA U.S. Leveraged Loan Index (the “Index”), produced a total return of 4.88% for the same period.2
Floating rate notes generally produced positive total returns over the reporting period amid rising interest rates and low defaults. The fund lagged the Index, partially due to underweighted exposure to low-quality CCC-rated loans.
The Fund’s Investment Approach
The fund seeks high current income. To pursue its goal, the fund normally invests at least 80% of its net assets, plus any borrowings for investment purposes, in floating-rate loans and other floating-rate securities. These investments effectively should enable the fund to achieve a floating rate of income. The fund currently intends to invest principally in floating-rate loans and other floating-rate securities of U.S. issuers, but may invest up to 30% of its net assets in securities of foreign issuers.
We buy and sell securities through a value-oriented, bottom-up research process that incorporates a top-down overlay. We use fundamental credit analysis to identify favorable and unfavorable risk/reward opportunities across quality segments, industries, and credits while seeking to mitigate downside risk.
Interest Rates Fluctuate in a Growing Economy
In late 2017, the U.S. Federal Reserve (the “Fed”) began to unwind its balance sheet through sales of U.S. government securities and started to raise the overnight target federal funds rate by 25 basis points at approximately every other meeting. Longer-term interest rates climbed during the first portion of the reporting period. Corporate and emerging market debt soundly outperformed like-duration Treasuries. However, market volatility appeared in February and a paradigm shift occurred. Concerns over high U.S. inflation sprouted, and while the U.S. economy continued to strengthen, the rest of the world softened. Corporates and emerging market debt gave up much of their earlier return. In a flight to quality, long-term U.S. Treasury rates declined as well. When coupled with the Fed’s rate hikes which boost the short end of the curve, the U.S. yield curve began a flattening trend that would last through the end of the period. In general, securities with a high degree of interest-rate sensitivity lost value during the period, while those with less fared better.
In this environment, demand for floating-rate investments increased as investors looked for insulation against rising rates. Senior loans outpaced the broader markets with the best performances coming from the lowest-quality segments. During the period, loan spreads narrowed, but was more than offset by a nearly 1% increase in the three-month London Interbank Offered Rate (LIBOR).
Distressed Debt Outperforms Broader Market
The fund’s performance compared to the Index was constrained over the reporting period by several factors. First, the fund maintained underweighted exposure to CCC-rated loans, which lie toward the bottom of the credit-quality spectrum. These loans rallied as investors disregarded certain risks and reached for higher yields, but the fund did not participate fully in those gains. From a sector allocation perspective, an overweight position in the consumer sectors weighed on relative performance, as did underweighted exposure to loans issued to retailers. Our security selection strategy also produced some
3
DISCUSSION OF FUND PERFORMANCE (Unaudited) (continued)
disappointments in the retail and health care sectors, as well as in the automotive industry group. Finally, the fund’s cash reserves and holdings of high yield bonds, which are maintained for liquidity purposes, did not keep pace with the floating-rate loan market.
The fund achieved better results through other strategies. The fund’s relatively large overweight to B-rated debt, which occupies a middle tier of the credit-quality spectrum, and underweight to high-quality low-spread BB-rated loans, was additive. In addition, an overweight exposure to the metals and mining industry also helped boost relative results as commodity prices and global economic activity recovered. Security selection within the telecom services industry also contributed to positive performance as did the fund’s collateralized loan obligation (CLO) holdings.
At times during the reporting period, we employed forward contracts to hedge the fund’s positons in instruments denominated in foreign currencies.
Positioned for Continued Economic Growth
We remain optimistic regarding the prospects for senior loans. Business fundamentals remain strong, global economic growth has continued, corporate earnings are rising, and default rates have stayed low. In addition, supply-and-demand dynamics have been supported by robust demand for senior loans from CLOs and moderate retail fund inflows. Most analysts expect additional short-term interest-rate hikes by the Fed, which could translate into higher yields on floating-rate instruments.
Therefore, we have maintained overweight exposure to B-rated loans, and we have continued to participate in carefully selected CCC-rated loans. We continue to avoid the most distressed areas of the market. We’re maintaining our underweight to high-quality, low-yielding BB-rated loans. In this environment, we continue to favor debt from cyclical industries such as services, commodities, and chemicals. We have found fewer loans meeting our investment criteria among loans issued to companies in the fixed-line telecommunications and retail industries. While we maintain a favorable outlook on market fundamentals and technicals, we have noticed some erosion in quality which we will continue to monitor closely.
September 17, 2018
1 Total return includes reinvestment of dividends and any capital gains paid, and does not take into consideration the maximum initial sales charge in the case of Class A shares, or the applicable contingent deferred sales charge imposed on redemptions in the case of Class C shares. Had these charges been reflected, returns would have been lower. Past performance is no guarantee of future results. Share price, yield, and investment return fluctuate such that upon redemption, fund shares may be worth more or less than their original cost. The fund’s returns reflect the absorption of certain fund expenses by the fund’s investment adviser pursuant to an agreement in effect through December 31, 2018, at which time it may be extended, terminated, or modified. Had these expenses not been absorbed, the fund’s returns would have been lower.
2 Source: Lipper Inc. – The S&P/LSTA U.S. Leveraged Loan Index is a market value-weighted index designed to measure the performance of the U.S. leveraged loan market based upon market weightings, spreads, and interest payments. Investors cannot invest directly in any index.
Floating-rate loans are subject generally to interest-rate, credit, liquidity, and market risks, to varying degrees, all of which are more fully described in the fund’s prospectus.
The risks of an investment in a collateralized loan obligation (CLO) depend largely on the type of the collateral and the tranche of the CLO in which the fund invests. CLO tranches can experience substantial losses due to actual defaults, increased sensitivity to defaults due to collateral default, market anticipation of defaults, as well as aversion to CLO securities as an asset class.
The fund may use derivative instruments, such as options, futures, options on futures, forward contracts, and swaps. A small investment in derivatives could have a potentially large impact on the fund’s performance. The use of derivatives involves risks different from, or possibly greater than, the risks associated with investing directly in the underlying assets.
High yield bonds are subject to increased credit risk and are considered speculative in terms of the issuer’s perceived ability to continue making interest payments on a timely basis and to repay principal upon maturity.
4
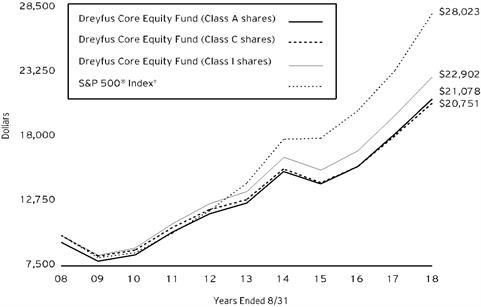
FUND PERFORMANCE (Unaudited)

Comparison of change in value of $10,000 investment in Dreyfus Floating Rate Income Fund Class A shares, Class C shares, Class I shares and Class Y shares and the S&P/LSTA U.S. Leveraged Loan Index (the “Index”)
† Source: Lipper Inc.
Past performance is not predictive of future performance.
The above graph compares a $10,000 investment made in each of the Class A, Class C, Class I and Class Y shares of Dreyfus Floating Rate Income Fund on 9/27/13 (inception date) to a $10,000 investment made in the Index. All dividends and capital gain distributions are reinvested.
The fund’s performance shown in the line graph above takes into account the maximum initial sales charge on Class A shares and all other applicable fees and expenses on all classes. The Index is a market value-weighted index designed to measure the performance of the U.S. leveraged loan market based upon market weightings, spreads and interest payments. Unlike a mutual fund, the Index is not subject to charges, fees and other expenses. Investors cannot invest directly in any index. Further information relating to fund performance, including expense reimbursements, if applicable, is contained in the Financial Highlights section of the prospectus and elsewhere in this report.
5
FUND PERFORMANCE (Unaudited) (continued)
| | | | | |
Average Annual Total Returns as of 8/31/18 | | | |
| Inception Date | 1 Year | From
Inception | |
Class A shares | | | | |
with maximum sales charge (2.50%) | 9/27/13 | 0.80% | 2.39% | |
without sales charge | 9/27/13 | 3.38% | 2.92% | |
Class C shares | | | | |
with applicable redemption charge† | 9/27/13 | 1.63% | 2.15% | |
without redemption | 9/27/13 | 2.62% | 2.15% | |
Class I shares | 9/27/13 | 3.68% | 3.20% | |
Class Y shares | 9/27/13 | 3.60% | 3.20% | |
S&P/LSTA U.S. Leveraged Loan Index | 9/30/13 | 4.88% | 21.60%†† | |
† The maximum contingent deferred sales charge for Class C shares is 1% for shares redeemed within one year of the date of purchase.
†† For comparative purposes, the value of the Index on 9/30/13 is used as the beginning value on 9/27/13.
The performance data quoted represents past performance, which is no guarantee of future results. Share price and investment return fluctuate and an investor’s shares may be worth more or less than original cost upon redemption. Current performance may be lower or higher than the performance quoted. Go to Dreyfus.com for the fund’s most recent month-end returns.
The fund’s performance shown in the graph and table does not reflect the deduction of taxes that a shareholder would pay on fund distributions or the redemption of fund shares. In addition to the performance of Class A shares shown with and without a maximum sales charge, the fund’s performance shown in the table takes into account all other applicable fees and expenses on all classes.
6
UNDERSTANDING YOUR FUND’S EXPENSES (Unaudited)
As a mutual fund investor, you pay ongoing expenses, such as management fees and other expenses. Using the information below, you can estimate how these expenses affect your investment and compare them with the expenses of other funds. You also may pay one-time transaction expenses, including sales charges (loads) and redemption fees, which are not shown in this section and would have resulted in higher total expenses. For more information, see your fund’s prospectus or talk to your financial adviser.
Review your fund’s expenses
The table below shows the expenses you would have paid on a $1,000 investment in Dreyfus Floating Rate Income Fund from March 1, 2018 to August 31, 2018. It also shows how much a $1,000 investment would be worth at the close of the period, assuming actual returns and expenses.
| | | | | | | | | | | | |
Expenses and Value of a $1,000 Investment | | |
assuming actual returns for the six months ended August 31, 2018 |
| | | | | | | | |
| | | | Class A | Class C | Class I | Class Y |
Expenses paid per $1,000† | | $5.02 | | $8.87 | | $3.81 | | $3.66 |
Ending value (after expenses) | | $1,013.10 | | $1,009.80 | | $1,015.30 | | $1,014.50 |
COMPARING YOUR FUND’S EXPENSES
WITH THOSE OF OTHER FUNDS (Unaudited)
Using the SEC’s method to compare expenses
The Securities and Exchange Commission (“SEC”) has established guidelines to help investors assess fund expenses. Per these guidelines, the table below shows your fund’s expenses based on a $1,000 investment, assuming a hypothetical 5% annualized return. You can use this information to compare the ongoing expenses (but not transaction expenses or total cost) of investing in the fund with those of other funds. All mutual fund shareholder reports will provide this information to help you make this comparison. Please note that you cannot use this information to estimate your actual ending account balance and expenses paid during the period.
| | | | | | | | | | | | | | | |
Expenses and Value of a $1,000 Investment | | |
assuming a hypothetical 5% annualized return for the six months ended August 31, 2018 | |
| | | Class A | Class C | | Class I | Class Y |
Expenses paid per $1,000† | | $5.04 | | $8.89 | | $3.82 | | $3.67 |
Ending value (after expenses) | | $1,020.21 | | $1,016.38 | | $1,021.42 | | $1,021.58 |
† Expenses are equal to the fund’s annualized expense ratio of .99% for Class A, 1.75% for Class C, .75% for Class I and .72% for Class Y, multiplied by the average account value over the period, multiplied by 184/365 (to reflect the one-half year period).
7
STATEMENT OF INVESTMENTS
August 31, 2018
| | | | | | | | | | |
| |
Description | Coupon
Rate (%) | | Maturity
Date | | Principal
Amount ($) | a | Value ($) | |
Bonds and Notes - 6.0% | | | | | |
Collateralized Loan Obligations Debt - 4.4% | | | | | |
Arrowpoint CLO,
Ser. 2015-4A, Cl. D, 3 Month LIBOR + 4.50% | | 6.83 | | 4/18/27 | | 2,000,000 | b,c,d | 2,030,869 | |
Babson CLO,
Ser. 2015-1A, Cl. ER, 3 Month LIBOR + 5.50% | | 7.85 | | 1/20/31 | | 3,000,000 | b,c,d | 2,984,781 | |
Babson Euro CLO,
Ser. 2014-2X, Cl. FR, 3 Month EURIBOR + .70% | EUR | 7.00 | | 11/25/29 | | 2,000,000 | b,c,d | 2,268,930 | |
Barings CLO,
Ser. 2018-1A, Cl. D, 3 Month LIBOR + 5.50% | | 7.84 | | 4/15/31 | | 2,900,000 | b,c,d | 2,884,720 | |
Battalion CLO VII,
Ser. 2014-7A, Cl. DRR, 3 Month LIBOR + 6.31% | | 8.65 | | 7/17/28 | | 2,000,000 | b,c,d | 2,005,562 | |
Carlyle Global Market Strategies CLO,
Ser. 2014-1A, Cl. ER, 3 Month LIBOR + 5.40% | | 7.74 | | 4/17/31 | | 4,000,000 | b,c,d | 3,969,716 | |
Catamaran CLO,
Ser. 2015-1A, Cl. E, 3 Month LIBOR + 5.15% | | 7.50 | | 4/22/27 | | 3,000,000 | b,c,d | 2,948,358 | |
CIFC Funding CLO,
Ser. 2012-2RA, Cl. D, 3 Month LIBOR + 5.45% | | 7.80 | | 1/20/28 | | 1,000,000 | b,c,d | 1,000,462 | |
Crown Point CLO IV,
Ser. 2018-4A, Cl. D, 3 Month LIBOR + 2.75% | | 5.10 | | 4/20/31 | | 5,000,000 | b,c,d | 4,964,090 | |
Dryden Senior Loan Fund CLO,
Ser. 2015-37A, Cl. ER, 3 Month LIBOR + 5.15% | | 7.49 | | 1/15/31 | | 5,000,000 | b,c,d | 4,940,865 | |
Goldentree Loan Management US CLO 2,
Ser. 2017-2A, Cl. E, 3 Month LIBOR + 4.70% | | 7.05 | | 11/28/30 | | 1,984,000 | b,c,d | 1,926,809 | |
Marathon CLO X,
Ser. 2017-10A, Cl.D, 3 Month LIBOR + 6.37% | | 8.68 | | 11/15/29 | | 2,500,000 | b,c,d | 2,513,173 | |
Marble Point CLO XII,
Ser. 2018-1A, Cl. E, 3 Month LIBOR + 6.00% | | 8.07 | | 7/16/31 | | 1,250,000 | b,c,d | 1,255,990 | |
OZLM VI CLO,
Ser. 2014-6A, Cl. E, 3 Month LIBOR + 6.05% | | 8.39 | | 4/17/31 | | 4,000,000 | b,c,d | 4,002,144 | |
Parallel CLO,
Ser. 2018-1A, Cl. C, 3 Month LIBOR + 2.80% | | 4.85 | | 4/20/31 | | 1,800,000 | b,c,d | 1,786,919 | |
8
| | | | | | | | | | |
| |
Description | Coupon
Rate (%) | | Maturity
Date | | Principal
Amount ($) | a | Value ($) | |
Bonds and Notes - 6.0% (continued) | | | | | |
Collateralized Loan Obligations Debt - 4.4% (continued) | | | | | |
Rockford Tower CLO,
Ser. 2018-1A, Cl. E, 3 Month LIBOR + 5.85% | | 8.11 | | 5/20/31 | | 1,500,000 | b,c,d | 1,491,924 | |
TICP CLO IX,
Ser. 2017-9A, Cl. E, 3 Month LIBOR + 5.60% | | 7.95 | | 1/20/31 | | 5,000,000 | b,c,d | 4,872,028 | |
TICP CLO X,
Ser. 2018-10A, Cl. E, 3 Month LIBOR + 5.50% | | 7.85 | | 4/20/31 | | 3,000,000 | b,c,d | 2,963,631 | |
| | 50,810,971 | |
Energy - .6% | | | | | |
Alta Mesa Housings,
Gtd. Notes | | 7.88 | | 12/15/24 | | 2,000,000 | | 1,972,500 | |
Genesis Energy,
Gtd. Bonds | | 5.63 | | 6/15/24 | | 2,000,000 | | 1,875,000 | |
Sanchez Energy,
Gtd. Notes | | 6.13 | | 1/15/23 | | 2,350,000 | | 1,338,678 | |
SRC Energy,
Sr. Unscd. Notes | | 6.25 | | 12/1/25 | | 2,000,000 | | 1,950,000 | |
| | 7,136,178 | |
Health Care - .3% | | | | | |
Polaris Intermediate,
Sr. Unscd. Notes | | 8.50 | | 12/1/22 | | 3,000,000 | c | 3,108,750 | |
Materials - .7% | | | | | |
ARD Finance,
Sr. Scd. Notes | | 7.13 | | 9/15/23 | | 3,000,000 | | 3,048,750 | |
ARD Securities Finance,
Sr. Scd. Notes | | 8.75 | | 1/31/23 | | 1,542,399 | c | 1,546,255 | |
Bway Holding,
Sr. Unscd. Notes | | 7.25 | | 4/15/25 | | 2,000,000 | c | 1,955,000 | |
W/S Packaging Holdings,
Sr. Scd. Notes | | 9.00 | | 4/15/23 | | 1,600,000 | c | 1,640,000 | |
| | 8,190,005 | |
Total Bonds and Notes
(cost $70,085,539) | | 69,245,904 | |
| | | | | | | | | |
Floating Rate Loan Interests - 88.0% | | | | | |
Advertising - 1.8% | | | | | |
ABG Intermediate Holdings 2,
First Lien Initial Term Loan, 1 Month LIBOR + 3.50% | | 5.85 | | 9/29/24 | | 3,991,737 | b | 4,004,211 | |
ABG Intermediate Holdings 2,
Second Lien Initial Term Loan, 1 Month LIBOR + 7.75% | | 10.10 | | 9/29/25 | | 325,000 | b,d | 327,031 | |
9
STATEMENT OF INVESTMENTS (continued)
| | | | | | | | | | |
| |
Description | Coupon
Rate (%) | | Maturity Date | | Principal Amount ($) | a | Value ($) | |
Floating Rate Loan Interests - 88.0% (continued) | | | | | |
Advertising - 1.8% (continued) | | | | | |
Advantageles & Marketing,
First Lien Initial Term Loan, 1 Month LIBOR + 3.25% | | 5.58 | | 7/25/21 | | 5,699,604 | b | 5,345,174 | |
Information Resources,
First Lien Initial Term Loan, 3 Month LIBOR + 4.25% | | 6.60 | | 1/18/24 | | 474,000 | b | 477,356 | |
Information Resources,
Second Lien Term Loan, 3 Month LIBOR + 8.25% | | 10.60 | | 1/20/25 | | 2,745,000 | b | 2,772,450 | |
Polyconcept North America Holdings,
First Lien Closing Date Term Loan, 1 Month LIBOR + 3.75% | | 6.07 | | 8/16/23 | | 1,847,288 | b,d | 1,861,724 | |
Red Ventures,
Second Lien Term Loan, 1 Month LIBOR + 8.00% | | 10.34 | | 11/8/25 | | 1,500,000 | b | 1,537,500 | |
Red Ventures,
Term Loan, 1 Month LIBOR + 4.00% | | 6.34 | | 11/8/24 | | 4,359,303 | b | 4,411,985 | |
| | 20,737,431 | |
Aerospace & Defense - .6% | | | | | |
Transdigm,
2018 New Term F Loan, 1 Month LIBOR + 2.50% | | 4.82 | | 6/9/23 | | 6,861,915 | b | 6,856,460 | |
Automobiles & Components - .7% | | | | | |
CH Hold,
First Lien Initial Term Loan, 1 Month LIBOR + 3.00% | | 5.35 | | 2/1/24 | | 245,432 | b | 246,736 | |
CH Hold,
Second Lien Initial Term Loan, 1 Month LIBOR + 7.25% | | 9.60 | | 2/3/25 | | 175,000 | b,d | 177,625 | |
Dealer Tire,
Refinancing Term Loan, 3 Month LIBOR + 3.25% | | 5.58 | | 12/22/21 | | 2,148,070 | b,d | 2,083,628 | |
Innovative Xcessories & Services,
Term Loan, 1 Month LIBOR + 4.75% | | 7.07 | | 11/29/22 | | 4,616,907 | b,d | 4,611,136 | |
UOS,
Initial Term Loan, 1 Month LIBOR + 5.50% | | 7.85 | | 4/7/23 | | 1,476,564 | b,d | 1,509,787 | |
| | 8,628,912 | |
Building Materials - .8% | | | | | |
Forterra Finance,
Replacement Term Loan, 1 Month LIBOR + 3.00% | | 5.35 | | 10/25/23 | | 3,292,335 | b | 3,092,523 | |
LSF10 XL BIdco SCA,
Facility B Term Loan, 3 Month LIBOR + 4.00% | EUR | 4.00 | | 3/13/24 | | 2,500,000 | b | 2,889,179 | |
10
| | | | | | | | | | |
| |
Description | Coupon
Rate (%) | | Maturity Date | | Principal Amount ($) | a | Value ($) | |
Floating Rate Loan Interests - 88.0% (continued) | | | | | |
Building Materials - .8% (continued) | | | | | |
Quikrete Holdings,
Tranche B Term Loan, 1 Month LIBOR + 2.75% | | 5.07 | | 11/15/23 | | 3,419,985 | b | 3,421,233 | |
| | 9,402,935 | |
Chemicals - 4.7% | | | | | |
AgroFresh,
Term Loan, 2 Month LIBOR + 4.75% | | 7.10 | | 7/31/21 | | 1,896,241 | b | 1,886,759 | |
Albaugh,
2017 Refinancing Term Loan, 1 Month LIBOR + 3.50% | | 5.84 | | 12/21/24 | | 2,338,250 | b | 2,329,482 | |
Allnex,
Term B-2 Loan, 1-3 Month LIBOR + 3.25% | | 5.59 | | 9/13/23 | | 2,472,243 | b,d | 2,490,785 | |
Allnex,
Tranche B-3 Term Loan, 1-3 Month LIBOR + 3.25% | | 5.59 | | 9/13/23 | | 1,862,642 | b,d | 1,876,612 | |
Colouroz Investment 1,
First Lien Term C Loan, 3 Month LIBOR + 3.00% | | 5.84 | | 9/7/21 | | 428,419 | b | 406,141 | |
Colouroz Midco,
First Lien Term B-1 Loan, 3 Month LIBOR + 3.00% | | 5.81 | | 9/7/21 | | 2,591,581 | b | 2,456,819 | |
Cyanco Intermediate 2,
First Lien Initial Term Loan, 1 Month LIBOR + 3.50% | | 5.83 | | 3/16/25 | | 3,585,475 | b | 3,616,848 | |
Encapsys,
First Lien Initial Term Loan, 1 Month LIBOR + 3.25% | | 5.59 | | 10/27/24 | | 3,866,855 | b | 3,883,792 | |
Encapsys,
Second Lien Initial Term Loan, 1 Month LIBOR + 7.50% | | 9.84 | | 10/27/25 | | 1,419,000 | b,d | 1,428,756 | |
Novacap Group Bidco,
Facility B, 3 Month LIBOR + 3.50% | EUR | 3.50 | | 6/22/23 | | 1,500,000 | b | 1,733,290 | |
OCI Partners,
Term Loan, 3 Month LIBOR + 4.00% | | 6.58 | | 3/13/25 | | 4,707,911 | b | 4,784,485 | |
Omnova Solutions,
Term B-2 Loan, 1 Month LIBOR + 3.25% | | 5.57 | | 8/26/23 | | 2,878,370 | b,d | 2,896,360 | |
Oxea,
Term B-1 Loan, 3 Month LIBOR + 3.75% | EUR | 3.75 | | 10/12/24 | | 2,000,000 | b | 2,328,755 | |
Oxea,
Term B-2 Loan, 3 Month LIBOR + 3.50% | | 5.84 | | 10/12/24 | | 2,992,462 | b,d | 3,013,050 | |
Polar US Borrower,
First Lien Term Loan, 3 Month LIBOR + 4.75% | | 7.09 | | 8/21/25 | | 5,903,764 | b | 5,815,207 | |
11
STATEMENT OF INVESTMENTS (continued)
| | | | | | | | | | |
| |
Description | Coupon
Rate (%) | | Maturity Date | | Principal Amount ($) | a | Value ($) | |
Floating Rate Loan Interests - 88.0% (continued) | | | | | |
Chemicals - 4.7% (continued) | | | | | |
Road Infrastructure Investment Holdings,
First Lien Term Loan, 1 Month LIBOR + 3.50% | | 6.33 | | 6/9/23 | | 2,824,688 | b | 2,831,749 | |
Solenis International,
First Lien Initial Dollar Term Loan, 1-3 Month LIBOR + 4.00% | | 6.34 | | 12/26/23 | | 4,219,048 | b | 4,245,459 | |
Tronox Finance,
Term Loan, 1 Month LIBOR + 3.00% | | 5.34 | | 9/22/24 | | 1,856,022 | b | 1,865,302 | |
Tronox Finance,
Term Loan, 1 Month LIBOR + 3.00% | | 5.34 | | 9/22/24 | | 4,283,128 | b | 4,304,544 | |
| | 54,194,195 | |
Commercial & Professional Services - 10.0% | | | | | |
AlixPartners,
2017 Refinancing Term Loan, 1 Month LIBOR + 2.75% | | 5.09 | | 4/4/24 | | 3,113,533 | b | 3,126,516 | |
AVSC Holding,
Second Lien Initial Loan, 3 Month LIBOR + 7.25% | | 9.57 | | 9/1/25 | | 1,061,750 | b | 1,051,796 | |
AVSC Holding,
Term Loan, 2-3 Month LIBOR + 3.25% | | 5.59 | | 3/1/25 | | 6,911,812 | b | 6,858,522 | |
Blitz F18 675,
New Facility B-2, 2 Month LIBOR + 3.75% | EUR | 3.75 | | 8/1/25 | | 2,500,000 | b | 2,913,773 | |
Camelot US Acquisition I,
2017-2 Refinancing Term Loan, 1 Month LIBOR + 3.25% | | 5.56 | | 10/3/23 | | 3,519,872 | b | 3,521,702 | |
Cast & Crew Payroll,
Term Loan, 1 Month LIBOR + 2.75% | | 5.33 | | 9/27/24 | | 2,952,962 | b | 2,952,976 | |
CHG Healthcare Services,
New Term Loan, 1-3 Month LIBOR + 3.00% | | 5.33 | | 6/7/23 | | 7,135,016 | b | 7,161,237 | |
Constellis Holdings,
First Lien Initial Term B Loan, 3 Month LIBOR + 5.00% | | 7.34 | | 4/21/24 | | 5,296,500 | b | 5,336,224 | |
Creative Artists Agency,
Amendment No 7 Refinancing Term Loan, 1 Month LIBOR + 3.00% | | 5.34 | | 2/15/24 | | 6,110,273 | b | 6,134,469 | |
Electro Rent,
Tranche B Term Loan, 1-2 Month LIBOR + 5.00% | | 7.35 | | 1/31/24 | | 3,501,007 | b | 3,531,640 | |
Employbridge,
Term Loan, 3 Month LIBOR + 5.00% | | 7.35 | | 4/18/25 | | 3,077,570 | b | 3,119,887 | |
Fort Dearborn Holding,
First Lien Initial Term Loan, 3 Month LIBOR + 4.00% | | 6.35 | | 10/19/23 | | 3,658,516 | b,d | 3,512,175 | |
Lineage Logistics,
Term Loan, 1 Month LIBOR + 3.00% | | 5.32 | | 2/27/25 | | 5,378,852 | b | 5,359,811 | |
12
| | | | | | | | | | |
| |
Description | Coupon
Rate (%) | | Maturity Date | | Principal Amount ($) | a | Value ($) | |
Floating Rate Loan Interests - 88.0% (continued) | | | | | |
Commercial & Professional Services - 10.0% (continued) | | | | | |
National Intergovernmental Purchasing Alliance,
First Lien Term Loan, 2-3 Month LIBOR + 3.75% | | 6.07 | | 5/23/25 | | 3,142,469 | b,d | 3,150,325 | |
Obol France 3S,
Facility B Term Loan, 3 Month LIBOR + 3.75% | EUR | 3.75 | | 4/12/23 | | 2,500,000 | b | 2,912,104 | |
Packers Holdings,
Term Loan, 1 Month LIBOR + 3.25% | | 5.57 | | 12/4/24 | | 4,726,250 | b | 4,728,235 | |
Parexel International,
Term Loan B, 1 Month LIBOR + 2.75% | | 5.09 | | 9/27/24 | | 4,515,875 | b | 4,519,826 | |
Pi US Borrowerco,
Second Lien Facility 1, 1 Month LIBOR + 7.25% | | 9.58 | | 1/1/26 | | 1,250,000 | b,d | 1,237,500 | |
Pi US Mergerco,
Facility B-1, 3 Month LIBOR + 3.50% | | 5.82 | | 12/20/24 | | 5,236,875 | b | 5,216,425 | |
Pre Paid Legal Services,
First Lien Initial Term Loan, 1 Month LIBOR + 3.25% | | 5.60 | | 4/13/25 | | 3,043,810 | b | 3,058,389 | |
Prime Security Services Borrower,
2016-2 Refinancing Term B1 Loan, 1 Month LIBOR + 2.75% | | 5.09 | | 5/2/22 | | 3,597,060 | b | 3,610,765 | |
Safe Fleet Holdings,
Term Loan, 1 Month LIBOR + 3.00% | | 5.35 | | 2/1/25 | | 4,774,897 | b | 4,745,054 | |
Team Health Holdings,
Term Loan, 1 Month LIBOR + 2.75% | | 5.09 | | 2/6/24 | | 6,195,030 | b | 5,944,658 | |
Transaction Network Services,
First Lien Initial Term Loan, 3 Month LIBOR + 4.00% | | 6.32 | | 2/14/20 | | 3,618,472 | b,d | 3,634,883 | |
US Security Associates Holdings,
Term Loan, 3 Month LIBOR + 3.50% | | 5.84 | | 7/28/23 | | 1,523,153 | b | 1,526,961 | |
USS Ultimate Holdings,
Tranche B Term Loan, 1 Month LIBOR + 3.75% | | 6.08 | | 8/10/24 | | 3,078,516 | b | 3,097,756 | |
Verscend Holding,
Term B Loan, 3 Month LIBOR + 4.50% | | 6.82 | | 8/27/25 | | 6,480,716 | b | 6,533,405 | |
Wand Intermediate I,
Refinancing Term B Loan, 1 Month LIBOR + 3.00% | | 5.34 | | 9/17/21 | | 1,904,379 | b | 1,908,550 | |
Weight Watchers International,
Term B Loan, 1-3 Month LIBOR + 4.75% | | 7.07 | | 11/29/24 | | 5,624,280 | b | 5,699,870 | |
| | 116,105,434 | |
Consumer Discretionary - 6.0% | | | | | |
Alpha Topco,
2018 Incremental New Facility B-3 Loan, 1 Month LIBOR + 2.50% | | 4.85 | | 2/1/24 | | 2,814,722 | b | 2,797,833 | |
13
STATEMENT OF INVESTMENTS (continued)
| | | | | | | | | | |
| |
Description | Coupon
Rate (%) | | Maturity Date | | Principal Amount ($) | a | Value ($) | |
Floating Rate Loan Interests - 88.0% (continued) | | | | | |
Consumer Discretionary - 6.0% (continued) | | | | | |
Crown Finance US,
Initial Euro Term Loan, 1 Month LIBOR + 2.625% | EUR | 2.63 | | 2/28/25 | | 3,117,187 | b | 3,617,190 | |
Deluxe Entertainment Services Group,
Initial Term Loan, 3 Month LIBOR + 5.50% | | 7.85 | | 2/28/20 | | 1,474,479 | b | 1,386,011 | |
FPC Holdings,
First Lien Term B-1 Loan, 1 Month LIBOR + 4.50% | | 6.84 | | 11/19/22 | | 2,878,249 | b | 2,911,824 | |
FPC Holdings,
Second Lien Term B-1 Loan, 1 Month LIBOR + 9.00% | | 11.34 | | 5/19/23 | | 1,018,519 | b,d | 1,015,127 | |
Golden Entertainment,
First Lien Term B Facility Loan, 1 Month LIBOR + 3.00% | | 5.34 | | 8/15/24 | | 4,552,125 | b | 4,561,616 | |
Greektown Holdings,
Term Loan, 1 Month LIBOR + 2.75% | | 5.34 | | 3/20/24 | | 3,564,000 | b | 3,571,431 | |
GVC Holdings,
Facility B-1, 3 Month LIBOR + 2.75% | EUR | 2.75 | | 3/2/23 | | 1,500,000 | b | 1,736,772 | |
GVC Holdings,
Facility B-2 (Eur), 3 Month LIBOR + 2.75% | EUR | 2.75 | | 3/16/24 | | 1,500,000 | b | 1,738,626 | |
Hayward Industries,
Term Loan, 1 Month LIBOR + 3.50% | | 5.84 | | 7/18/24 | | 3,101,563 | b | 3,115,520 | |
Hercules Achievement,
First Lien Term Loan, 1 Month LIBOR + 3.50% | | 5.83 | | 12/7/24 | | 3,731,250 | b | 3,740,578 | |
Scientific Games International,
Initial Term B-5 Loan, 1 Month LIBOR + 2.75% | | 5.07 | | 8/14/24 | | 7,611,798 | b | 7,600,228 | |
SESAC Holdco II,
First Lien Initial Term Loan, 1 Month LIBOR + 3.00% | | 5.56 | | 2/13/24 | | 2,962,500 | b | 2,942,133 | |
SMG US Midco 2,
Second Lien Term Loan, 1 Month LIBOR + 7.00% | | 9.34 | | 1/23/26 | | 233,918 | b | 236,550 | |
SMG US Midco 2,
Term Loan, 1 Month LIBOR + 3.25% | | 5.59 | | 1/23/25 | | 578,211 | b | 580,258 | |
Stars Group Holdings,
Euro Term Loan, 3 Month LIBOR + 3.75% | EUR | 3.75 | | 7/10/25 | | 4,000,000 | b | 4,687,990 | |
Stars Group Holdings,
Term Loan, 3 Month LIBOR + 3.50% | | 5.84 | | 7/10/25 | | 8,735,215 | b | 8,814,967 | |
Technicolor,
First Incremental Term Loan, 3 Month LIBOR + 2.75% | | 5.09 | | 12/31/23 | | 2,364,000 | b | 2,254,677 | |
14
| | | | | | | | | | |
| |
Description | Coupon
Rate (%) | | Maturity Date | | Principal Amount ($) | a | Value ($) | |
Floating Rate Loan Interests - 88.0% (continued) | | | | | |
Consumer Discretionary - 6.0% (continued) | | | | | |
Travel Leaders Group,
2018 Refinancing Term Loan, 1 Month LIBOR + 4.00% | | 6.34 | | 1/25/24 | | 3,802,911 | b,d | 3,848,090 | |
William Morris Endeavor Entertainment,
New Term B Loan-1, 1 Month LIBOR + 2.75% | | 5.06 | | 5/18/25 | | 4,675,526 | b | 4,659,466 | |
Yak Access,
First Lien Initial Term Loan, 1 Month LIBOR + 5.00% | | 7.34 | | 7/11/25 | | 4,000,000 | b,d | 3,880,000 | |
| | 69,696,887 | |
Consumer Staples - .7% | | | | | |
Carlisle Foodservice Products,
First Lien Delayed Draw Term Loan, 1 Month LIBOR + 3.00% | | 5.33 | | 3/20/25 | | 609,317 | b,e | 604,939 | |
Carlisle Foodservice Products,
First Lien Initial Term Loan, 1 Month LIBOR + 3.00% | | 5.33 | | 3/20/25 | | 2,694,553 | b | 2,675,192 | |
Kronos Acquisition Holdings,
Term B-3 Loan, 1 Month LIBOR + 4.00% | | 6.32 | | 5/15/23 | | 4,400,000 | b | 4,372,852 | |
| | 7,652,983 | |
Diversified Financials - 1.2% | | | | | |
Blackhawk Network Holdings,
First Lien Term Loan, 2 Month LIBOR + 3.00% | | 5.33 | | 5/22/25 | | 5,531,278 | b | 5,557,801 | |
Capital Automotive,
Second Lien Intial Term B Loan, 1 Month LIBOR + 6.00% | | 8.34 | | 3/24/25 | | 2,308,166 | b,d | 2,362,985 | |
Citco Funding ,
2017 Term Loan, 1 Month LIBOR + 3.00% | | 5.34 | | 3/31/22 | | 4,660,000 | b | 4,683,323 | |
PGX Holdings,
First Lien Term B Loan, 1 Month LIBOR + 5.25% | | 7.59 | | 9/29/20 | | 1,924,144 | b | 1,884,459 | |
| | 14,488,568 | |
Electronic Components - .3% | | | | | |
Oberthur Technologies,
Facility B Term Loan, 3 Month LIBOR + 3.75% | EUR | 3.75 | | 1/10/24 | | 2,500,000 | b | 2,904,661 | |
Oberthur Technologies Of America,
Facility B Term Loan, 3 Month LIBOR + 3.75% | | 6.07 | | 12/15/23 | | 617,188 | b | 620,813 | |
| | 3,525,474 | |
Energy - 4.6% | | | | | |
Brazos Delaware II,
Term Loan, 1 Month LIBOR + 4.00% | | 6.31 | | 5/16/25 | | 5,398,387 | b,d | 5,361,273 | |
15
STATEMENT OF INVESTMENTS (continued)
| | | | | | | | | | |
| |
Description | Coupon
Rate (%) | | Maturity Date | | Principal Amount ($) | a | Value ($) | |
Floating Rate Loan Interests - 88.0% (continued) | | | | | |
Energy - 4.6% (continued) | | | | | |
California Resource,
Term Loan, 1 Month LIBOR + 10.38% | | 12.69 | | 12/31/21 | | 3,000,000 | b | 3,322,515 | |
California Resources,
Term 11/17 Loan, 1 Month LIBOR + 4.75% | | 7.06 | | 12/31/22 | | 2,864,815 | b | 2,917,642 | |
Chesapeake Energy,
Term A Loan, 1 Month LIBOR + 7.50% | | 9.81 | | 8/23/21 | | 2,375,000 | b | 2,484,214 | |
Gavilan Resources,
Second Lien Term Loan, 1 Month LIBOR + 6.00% | | 8.32 | | 3/1/24 | | 4,935,000 | b | 4,808,541 | |
GIP III Stetson I,
Term Loan, 3 Month LIBOR + 4.25% | | 6.60 | | 7/18/25 | | 5,504,231 | b | 5,557,567 | |
Granite Acquisition,
First Lien Term B Loan, 3 Month LIBOR + 3.50% | | 6.33 | | 12/17/21 | | 3,614,660 | b | 3,649,831 | |
Granite Acquisition,
First Lien Term C Loan, 3 Month LIBOR + 3.50% | | 6.33 | | 12/17/21 | | 164,382 | b | 165,982 | |
Granite Acquisition,
Second Lien Term B Loan, 3 Month LIBOR + 7.25% | | 9.58 | | 12/19/22 | | 471,490 | b | 476,208 | |
HFOTCO,
7 Year Term B Loan, 3 Month LIBOR + 2.75% | | 5.09 | | 6/26/25 | | 3,097,166 | b | 3,103,469 | |
Keane Group Holdings,
Term Loan, 1 Month LIBOR + 3.75% | | 6.07 | | 5/18/25 | | 3,602,500 | b,d | 3,597,997 | |
Lucid Energy Group II Borrower,
Term Loan, 1 Month LIBOR + 3.00% | | 5.32 | | 2/18/25 | | 5,557,500 | b,d | 5,484,558 | |
Navios Maritime Midstream Partners,
Term Loan, 3 Month LIBOR + 4.50% | | 6.83 | | 6/12/20 | | 1,258,668 | b,d | 1,230,355 | |
Oryx Southern Delaware Holdings,
Term Loan, 1 Month LIBOR + 3.25% | | 5.57 | | 2/28/25 | | 5,268,054 | b,d | 5,172,570 | |
Oxbow Carbon ,
First Lien Term B Loan, 1 Month LIBOR + 3.75% | | 6.09 | | 1/4/23 | | 3,487,687 | b,d | 3,518,221 | |
Oxbow Carbon ,
Second Lien Term Loan, 1 Month LIBOR + 7.50% | | 9.84 | | 1/4/24 | | 2,107,143 | b,d | 2,149,286 | |
| | 53,000,229 | |
Environmental Control - 1.2% | | | | | |
EnergySolutions,
Term Loan, 3 Month LIBOR + 3.75% | | 6.07 | | 5/11/25 | | 5,014,624 | b,d | 5,058,502 | |
Filtration Group,
Initial Dollar Term Loan, 1 Month LIBOR + 3.00% | | 5.34 | | 3/29/25 | | 5,860,937 | b | 5,889,655 | |
16
| | | | | | | | | | |
| |
Description | Coupon
Rate (%) | | Maturity Date | | Principal Amount ($) | a | Value ($) | |
Floating Rate Loan Interests - 88.0% (continued) | | | | | |
Environmental Control - 1.2% (continued) | | | | | |
GFL Environmental,
2018 Incremental Term Loan, 3 Month LIBOR + 2.75% | | 5.07 | | 5/31/25 | | 2,488,964 | b,d | 2,480,153 | |
GFL Environmental,
Delayed Draw Term Loan, 3 Month LIBOR + 2.75% | | 5.07 | | 5/31/25 | | 309,188 | b,d,e | 308,093 | |
| | 13,736,403 | |
Financials - .3% | | | | | |
IBC Capital,
First Lien Term B-1 Loan, 3 Month LIBOR + 3.75% | | 6.08 | | 9/18/23 | | 3,591,000 | b | 3,614,934 | |
Food Products - 1.1% | | | | | |
Albertson's,
Replacement 2017-1 Term B-4 Loan, 1 Month LIBOR + 2.75% | | 5.08 | | 8/25/21 | | 1,364,398 | b | 1,363,477 | |
Albertson's,
Replacement 2017-1 Term B-5 Loan, 3 Month LIBOR + 3.00% | | 5.33 | | 12/21/22 | | 1,414,286 | b | 1,412,299 | |
Albertson's,
Replacement 2017-1 Term B-6 Loan, 3 Month LIBOR + 3.00% | | 5.33 | | 6/22/23 | | 6,987,386 | b | 6,969,917 | |
UTZ Quality Foods,
First Lien Term Loan, 1 Month LIBOR + 3.50% | | 5.83 | | 11/21/24 | | 2,985,000 | b | 3,002,716 | |
| | 12,748,409 | |
Forest Products & Other - .2% | | | | | |
Dunn Paper,
First Lien Term Loan, 1 Month LIBOR + 4.75% | | 7.09 | | 8/26/22 | | 2,091,402 | b,d | 2,114,930 | |
Health Care - 8.7% | | | | | |
Air Medical Group Holdings,
2018 Term Loan, 1 Month LIBOR + 3.25% | | 5.57 | | 4/28/22 | | 6,658,308 | b | 6,552,907 | |
Air Methods,
Term Loan, 3 Month LIBOR + 3.50% | | 5.83 | | 4/13/24 | | 5,552,409 | b | 5,110,521 | |
Albany Molecular Research,
First Lien Initial Term Loan, 1 Month LIBOR + 3.25% | | 5.57 | | 7/28/24 | | 3,389,698 | b | 3,391,817 | |
Alphabet Holding,
First Lien Initial Term Loan, 1 Month LIBOR + 3.50% | | 5.84 | | 8/15/24 | | 3,771,500 | b | 3,592,354 | |
Alphabet Holding,
Second Lien Initial Term Loan, 1 Month LIBOR + 7.75% | | 10.09 | | 8/15/25 | | 1,600,000 | b | 1,437,000 | |
Auris LuxCo,
First Lien Term B Loan, 3 Month LIBOR + 4.00% | EUR | 4.00 | | 7/24/25 | | 1,250,000 | b | 1,459,498 | |
17
STATEMENT OF INVESTMENTS (continued)
| | | | | | | | | | |
| |
Description | Coupon
Rate (%) | | Maturity Date | | Principal Amount ($) | a | Value ($) | |
Floating Rate Loan Interests - 88.0% (continued) | | | | | |
Health Care - 8.7% (continued) | | | | | |
Auris Luxembourg III,
Facility B7 Term Loan, 3 Month LIBOR + 3.00% | | 5.32 | | 1/17/22 | | 1,451,362 | b | 1,464,062 | |
Avantor,
Initial Dollar Term Loan, 1 Month LIBOR + 4.00% | | 6.31 | | 11/22/24 | | 4,721,174 | b | 4,782,290 | |
Avantor,
Initial Euro Term Loan, 1 Month LIBOR + 4.25% | EUR | 4.25 | | 11/22/24 | | 2,493,734 | b | 2,917,339 | |
Bausch Health,
Initial Term B Loan, 1 Month LIBOR + 3.00% | | 5.32 | | 6/1/25 | | 6,218,027 | b | 6,247,935 | |
Change Healthcare Holdings,
Closing Date Term Loan, 1 Month LIBOR + 2.75% | | 5.07 | | 3/1/24 | | 3,887,829 | b | 3,894,321 | |
CVS Holdings I,
First Lien Initial Term Loan, 1 Month LIBOR + 3.00% | | 5.34 | | 2/6/25 | | 5,247,562 | b,d | 5,241,029 | |
Dentalcorp Perfect Smile ULC,
Delayed Draw Term Loan, 1-3 Month LIBOR + 3.75% | | 6.08 | | 6/6/25 | | 910,565 | b,d,e | 916,634 | |
Dentalcorp Perfect Smile ULC,
Term Loan, 1 Month LIBOR + 3.75% | | 6.08 | | 6/6/25 | | 3,642,261 | b | 3,666,536 | |
Elsan SAS,
Facility B2 Term Loan, 3 Month LIBOR + 3.75% | EUR | 3.75 | | 10/30/22 | | 2,500,000 | b | 2,922,188 | |
Immucor,
Term Loan B-3, 2 Month LIBOR + 5.00% | | 7.34 | | 6/15/21 | | 3,702,487 | b | 3,753,396 | |
MPH Acquisition Holdings,
Initial Term Loan, 3 Month LIBOR + 2.75% | | 5.33 | | 6/7/23 | | 3,510,491 | b | 3,511,966 | |
NVA Holdings,
First Lien Term B-3 Loan, 1 Month LIBOR + 2.75% | | 5.09 | | 1/30/25 | | 4,657,260 | b | 4,647,084 | |
Ortho Clinical Diagnostics,
Refinancing Term Loan, 1 Month LIBOR + 3.25% | | 5.58 | | 6/1/25 | | 5,330,000 | b | 5,336,183 | |
Pearl Intermediate Parent,
First Lien Delayed Draw Term Loan, 3 Month LIBOR + 2.75% | | 5.06 | | 2/14/25 | | 906,224 | b,d,e | 891,072 | |
Pearl Intermediate Parent,
First Lien Term Loan, 1 Month LIBOR + 2.75% | | 5.06 | | 2/14/25 | | 3,073,459 | b,d | 3,022,070 | |
Pearl Intermediate Parent,
Second Lien Term Loan, 1 Month LIBOR + 6.25% | | 8.56 | | 2/1/26 | | 1,488,652 | b | 1,485,861 | |
18
| | | | | | | | | | |
| |
Description | Coupon
Rate (%) | | Maturity Date | | Principal Amount ($) | a | Value ($) | |
Floating Rate Loan Interests - 88.0% (continued) | | | | | |
Health Care - 8.7% (continued) | | | | | |
PharMerica,
First Lien Term Loan, 1 Month LIBOR + 3.50% | | 5.83 | | 12/6/24 | | 5,628,645 | b | 5,671,761 | |
PharMerica,
Second Lien Term Loan, 1 Month LIBOR + 7.75% | | 10.08 | | 12/7/25 | | 1,500,000 | b,d | 1,500,000 | |
Sam Bidco,
Facility B-2, 3 Month LIBOR + 3.50% | | 5.83 | | 10/24/24 | | 2,075,000 | b | 2,062,031 | |
Surgery Center Holdings,
Term B Loan, 3 Month LIBOR + 3.25% | | 5.57 | | 6/20/24 | | 6,195,834 | b | 6,197,754 | |
U.S. Anesthesia Partners,
First Lien Term Loan, 1 Month LIBOR + 3.00% | | 5.59 | | 6/23/24 | | 4,407,970 | b | 4,422,671 | |
Wink Holdco,
First Lien Initial Term Loan, 1 Month LIBOR + 3.00% | | 5.32 | | 12/1/24 | | 4,530,000 | b | 4,525,470 | |
| | 100,623,750 | |
Industrials - 3.9% | | | | | |
American Traffic Solutions,
First Lien Initial Term Loan, 1 Month LIBOR + 3.75% | | 6.07 | | 2/28/25 | | 4,397,075 | b | 4,431,416 | |
Brand Energy & Infrastructure Services,
Term Loan, 3 Month LIBOR + 4.25% | | 6.59 | | 6/21/24 | | 7,756,111 | b | 7,805,401 | |
DG Investment Intermediate Holdings 2,
First Lien First Amendment Incremental Term Loan, 1 Month LIBOR + 3.00% | | 5.34 | | 2/1/25 | | 112,500 | b | 111,832 | |
Engineered Machinery Holdings ,
First Lien Initial Term Loan, 3 Month LIBOR + 3.25% | | 5.58 | | 7/25/24 | | 2,766,125 | b | 2,767,854 | |
Engineered Machinery Holdings ,
Second Lien Initial Term Loan, 3 Month LIBOR + 7.25% | | 9.58 | | 7/25/25 | | 1,774,277 | b | 1,783,148 | |
Gates Global,
Initial B-2 Dollar Term Loan, 3 Month LIBOR + 2.75% | | 5.06 | | 3/31/24 | | 5,020,846 | b | 5,051,046 | |
Loparex International,
Term B Loan, 3 Month LIBOR + 4.25% | | 6.59 | | 4/11/25 | | 4,260,452 | b,d | 4,303,056 | |
New VAC US,
Term B Loan, 3 Month LIBOR + 4.00% | | 6.33 | | 3/18/25 | | 3,092,250 | b,d | 3,117,375 | |
North American Lifting Holdings,
First Lien Term Loan, 3 Month LIBOR + 4.50% | | 6.82 | | 11/27/20 | | 1,480,643 | b | 1,438,696 | |
Pisces Midco,
Term Loan, 3 Month LIBOR + 3.75% | | 6.09 | | 4/12/25 | | 6,999,491 | b | 7,034,488 | |
Titan Acquisition,
Term Loan, 1 Month LIBOR + 3.00% | | 5.34 | | 3/28/25 | | 5,600,962 | b | 5,323,911 | |
19
STATEMENT OF INVESTMENTS (continued)
| | | | | | | | | | |
| |
Description | Coupon
Rate (%) | | Maturity Date | | Principal Amount ($) | a | Value ($) | |
Floating Rate Loan Interests - 88.0% (continued) | | | | | |
Industrials - 3.9% (continued) | | | | | |
USIC Holdings,
Term B Loan, 1 Month LIBOR + 3.25% | | 5.59 | | 12/9/23 | | 1,781,496 | b | 1,793,192 | |
| | 44,961,415 | |
Information Technology - 8.8% | | | | | |
Applied Systems,
First Lien Term Loan, 3 Month LIBOR + 3.00% | | 5.33 | | 9/19/24 | | 6,644,738 | b | 6,681,184 | |
Ascend Learning,
Term Loan, 1 Month LIBOR + 3.00% | | 5.34 | | 7/12/24 | | 4,342,187 | b | 4,341,514 | |
BMC Software Finance,
Initial B-2 US Term Loan, 1 Month LIBOR + 3.25% | | 5.59 | | 9/10/22 | | 7,508,357 | b | 7,524,199 | |
Capri Acquisitions BidCo,
Initial Dollar Term Loan, 3 Month LIBOR + 3.25% | | 5.60 | | 11/1/24 | | 3,233,750 | b | 3,227,687 | |
Compuware,
Senior Secured Term Loan, 1 Month LIBOR + 3.50% | | 5.81 | | 8/23/25 | | 4,270,977 | b | 4,304,354 | |
Compuware,
Term B-3 Loan, 1 Month LIBOR + 3.50% | | 5.84 | | 12/15/21 | | 1,200,000 | b | 1,204,638 | |
Cypress Intermediate Holdings III,
First Lien Term Loan, 1 Month LIBOR + 3.00% | | 5.34 | | 3/31/24 | | 3,267,000 | b | 3,270,316 | |
DigiCert Holdings,
First Lien Term Loan, 1 Month LIBOR + 5.25% | | 7.10 | | 10/31/24 | | 5,693,120 | b | 5,725,173 | |
Dynatrace,
Senior Secured First Lien Term Loan, 3 Month LIBOR + 3.25% | | 5.56 | | 8/23/25 | | 2,552,271 | b | 2,566,104 | |
Dynatrace,
Senior Secured Second Lien Term Loan, 3 Month LIBOR + 7.00% | | 9.31 | | 8/23/26 | | 435,185 | b | 439,174 | |
Greeneden US Holdings II,
Dollar Term B-3 Loan, 1 Month LIBOR + 3.50% | | 5.82 | | 12/1/23 | | 7,271,987 | b | 7,299,257 | |
Hyland Software,
First Lien Term Loan, 1 Month LIBOR + 3.25% | | 5.59 | | 7/1/22 | | 4,837,181 | b | 4,872,855 | |
Hyland Software,
Second Lien Term Loan, 1 Month LIBOR + 7.00% | | 9.34 | | 5/23/25 | | 1,000,000 | b | 1,017,190 | |
Kronosorporated,
2018 New Incremental Term Loan, 2-3 Month LIBOR + 3.00% | | 5.34 | | 11/1/23 | | 5,568,526 | b | 5,590,104 | |
Mitchell International,
First Lien Term Loan, 1 Month LIBOR + 3.25% | | 5.57 | | 11/30/24 | | 5,480,750 | b | 5,477,900 | |
20
| | | | | | | | | | |
| |
Description | Coupon
Rate (%) | | Maturity Date | | Principal Amount ($) | a | Value ($) | |
Floating Rate Loan Interests - 88.0% (continued) | | | | | |
Information Technology - 8.8% (continued) | | | | | |
Mitchell International,
Second Lien Term Loan, 1 Month LIBOR + 7.25% | | 9.57 | | 11/30/25 | | 1,265,000 | b | 1,271,325 | |
Press Ganey Holdings,
First Lien Initial Term Loan, 1 Month LIBOR + 2.75% | | 5.08 | | 10/23/23 | | 4,491,149 | b | 4,506,577 | |
Press Ganey Holdings,
Second Lien Term Loan, 1 Month LIBOR + 6.50% | | 8.84 | | 10/23/25 | | 269,664 | b | 273,372 | |
Quest Software US Holdings,
First Lien Term Loan, 3 Month LIBOR + 4.25% | | 6.56 | | 5/17/25 | | 6,124,660 | b | 6,111,247 | |
Riverbed Technology,
First Lien Term Loan, 1 Month LIBOR + 3.25% | | 5.59 | | 4/24/22 | | 3,181,844 | b | 3,169,594 | |
Rocket Software,
First Lien Term Loan, 3 Month LIBOR + 3.75% | | 6.09 | | 10/1/23 | | 3,242,374 | b | 3,269,123 | |
Rocket Software,
Second Lien Term Loan, 3 Month LIBOR + 9.50% | | 11.84 | | 10/14/24 | | 575,000 | b,d | 577,875 | |
RP Crown Parent,
Term Loan, 1 Month LIBOR + 2.75% | | 5.09 | | 10/12/23 | | 8,032,379 | b | 8,062,501 | |
Sophia,
Tranche B Term Loan, 3 Month LIBOR + 3.25% | | 5.59 | | 9/30/22 | | 6,652,072 | b | 6,676,186 | |
Sound Inpatient Physicians,
First Lien Initial Term Loan, 1 Month LIBOR + 3.00% | | 5.34 | | 6/28/25 | | 2,027,566 | b | 2,036,437 | |
Sound Inpatient Physicians,
Second Lien Initial Loan, 1 Month LIBOR + 6.75% | | 9.09 | | 6/28/26 | | 2,974,297 | b,d | 2,992,887 | |
| | 102,488,773 | |
Insurance - 5.3% | | | | | |
Alliant Holdings Intermediate,
2018 Initial Term Loan, 1 Month LIBOR + 3.00% | | 5.32 | | 5/10/25 | | 6,936,556 | b | 6,944,498 | |
AssuredPartners,
2017 September Refinancing Term Loan, 1 Month LIBOR + 3.25% | | 5.59 | | 10/22/24 | | 3,997,440 | b | 4,000,438 | |
Asurion,
Amendment No. 14 Replacement B-4 Term Loan, 1 Month LIBOR + 3.00% | | 5.34 | | 8/4/22 | | 1,400,404 | b | 1,408,863 | |
Asurion,
Replacement B-6 Term Loan, 1 Month LIBOR + 3.00% | | 5.32 | | 11/3/23 | | 4,162,757 | b | 4,180,240 | |
21
STATEMENT OF INVESTMENTS (continued)
| | | | | | | | | | |
| |
Description | Coupon
Rate (%) | | Maturity Date | | Principal Amount ($) | a | Value ($) | |
Floating Rate Loan Interests - 88.0% (continued) | | | | | |
Insurance - 5.3% (continued) | | | | | |
Asurion,
Second Lien Replacement B-2 Term Loan, 1 Month LIBOR + 6.50% | | 8.83 | | 7/14/25 | | 12,537,453 | b | 12,923,982 | |
HUB International,
Term Loan, 2-3 Month LIBOR + 3.00% | | 5.34 | | 4/25/25 | | 7,550,000 | b | 7,550,491 | |
Mayfield Agency Borrower,
First Lien Term B Loan, 1 Month LIBOR + 4.50% | | 6.82 | | 1/31/25 | | 5,322,523 | b | 5,369,095 | |
Mayfield Agency Borrower,
Second Lien Term B Loan, 1 Month LIBOR + 8.50% | | 10.82 | | 1/31/26 | | 1,310,367 | b,d | 1,300,539 | |
Sedgwick Claims Management Services,
First Lien Term Loan, 1 Month LIBOR + 2.75% | | 5.08 | | 2/28/21 | | 2,696,941 | b | 2,694,689 | |
Sedgwick Claims Management Services,
First Lien Term Loan, 1-3 Month LIBOR + 0% | | 8.08 | | 2/28/22 | | 5,640,556 | b | 5,673,468 | |
USI,
Term B Loan, 3 Month LIBOR + 3.00% | | 5.32 | | 4/5/24 | | 5,265,559 | b | 5,259,530 | |
York Risk Services Holding (Onex York Finance),
Initial Term Loan, 1 Month LIBOR + 3.75% | | 6.09 | | 10/1/21 | | 4,074,353 | b | 3,955,749 | |
| | 61,261,582 | |
Internet Software & Services - 1.2% | | | | | |
Infinitas Learning Holding,
Facility B-3 Term Loan, 3 Month LIBOR + 3.75% | EUR | 3.75 | | 5/31/24 | | 2,000,000 | b | 2,323,311 | |
Ion Trading Finance,
Initial Dollar Term Loan, 1 Month LIBOR + 4.00% | | 6.31 | | 11/21/24 | | 1,100,000 | b | 1,096,739 | |
Ion Trading Finance,
Initial Euro Term Loan, 1 Month LIBOR + 3.25% | EUR | 4.25 | | 11/21/24 | | 1,203,522 | b | 1,385,854 | |
Rodan & Fields,
Closing Date Term Loan, 1 Month LIBOR + 4.00% | | 6.33 | | 6/7/25 | | 4,592,245 | b | 4,631,004 | |
Trader,
Senior Secured First Lien Term Loan, 1 Month LIBOR + 3.00% | | 5.32 | | 9/28/23 | | 4,429,841 | b | 4,443,707 | |
| | 13,880,615 | |
Materials - 5.0% | | | | | |
Albea Beauty Holdings,
Facility B-2 - Euro, 6 Month LIBOR + 3.25% | EUR | 3.25 | | 4/12/24 | | 2,000,000 | b | 2,329,335 | |
Albea Beauty Holdings,
Facility Term B-2 Loan, 3-6 Month LIBOR + 3.00% | | 5.33 | | 4/12/24 | | 2,714,671 | b | 2,692,044 | |
22
| | | | | | | | | | |
| |
Description | Coupon
Rate (%) | | Maturity Date | | Principal Amount ($) | a | Value ($) | |
Floating Rate Loan Interests - 88.0% (continued) | | | | | |
Materials - 5.0% (continued) | | | | | |
Ball Metalpack Finco,
First Lien Initial Term Loan, 1 Month LIBOR + 4.50% | | 6.85 | | 7/31/25 | | 3,785,703 | b | 3,830,659 | |
BWay Holding,
Term Loan, 3 Month LIBOR + 3.25% | | 5.57 | | 4/3/24 | | 9,248,500 | b | 9,225,379 | |
Circor International,
Term Loan, 1 Month LIBOR + 3.50% | | 5.83 | | 12/11/24 | | 4,789,025 | b | 4,811,486 | |
Dynacast International,
First Lien B1 Term Loan, 3 Month LIBOR + 3.25% | | 5.59 | | 1/28/22 | | 6,040,225 | b | 6,025,124 | |
Klockner Pentaplast of America,
Euro Term Loan, 3 Month EURIBOR + 4.75% | EUR | 4.75 | | 6/29/22 | | 3,586,881 | b | 3,979,010 | |
Murray Energy,
Superpriority Term B-2 Loan, 1 Month LIBOR + 7.25% | | 9.59 | | 10/17/22 | | 5,182,553 | b | 4,858,643 | |
Peabody Energy,
2018 Refinancing Term Loan, 1 Month LIBOR + 2.75% | | 5.09 | | 3/31/25 | | 2,025,424 | b | 2,028,807 | |
Penn Engineering & Manufacturing.,
Term B Loan, 1 Month LIBOR + 2.75% | | 5.08 | | 6/13/24 | | 1,930,500 | b | 1,940,761 | |
Reynolds Group Holdings,
Incremental Term Loan, 1 Month LIBOR + 2.75% | | 5.09 | | 2/5/23 | | 5,494,606 | b | 5,518,644 | |
TecoStar Holdings,
2017 First Lien Term Loan, 1 Month LIBOR + 3.50% | | 5.82 | | 5/1/24 | | 5,363,150 | b | 5,387,472 | |
TricorBraun Holdings,
First Lien Closing Date Term Loan, 3 Month LIBOR + 3.75% | | 6.07 | | 11/30/23 | | 5,336,850 | b | 5,373,541 | |
TricorBraun Holdings,
First Lien Delayed Draw Term Loan, 3 Month LIBOR + 3.75% | | 6.07 | | 11/30/23 | | 537,749 | b | 541,446 | |
| | 58,542,351 | |
Media - 4.6% | | | | | |
Altice Financing,
2017 Term Loan, 1 Month LIBOR + 2.75% | | 5.06 | | 1/31/26 | | 2,575,689 | b | 2,496,487 | |
CBS Radio,
Term B Loan-1, 1-3 Month LIBOR + 2.75% | | 5.06 | | 11/18/24 | | 2,783,160 | b | 2,764,262 | |
Ion Media Networks,
Term B Loan-3, 1 Month LIBOR + 2.75% | | 5.08 | | 12/18/20 | | 5,961,648 | b | 5,998,909 | |
Meredith,
Term Loan, 1 Month LIBOR + 3.00% | | 5.35 | | 1/31/25 | | 4,832,967 | b | 4,852,420 | |
23
STATEMENT OF INVESTMENTS (continued)
| | | | | | | | | | |
| |
Description | Coupon
Rate (%) | | Maturity Date | | Principal Amount ($) | a | Value ($) | |
Floating Rate Loan Interests - 88.0% (continued) | | | | | |
Media - 4.6% (continued) | | | | | |
Numericable U.S.,
Incremental Term B Loan-13, 3 Month LIBOR + 4.00% | | 6.33 | | 1/31/26 | | 7,216,667 | b | 7,038,162 | |
Radiate Holdco,
Term Loan, 1 Month LIBOR + 3.00% | | 5.34 | | 2/1/24 | | 9,424,718 | b | 9,382,307 | |
Springer Science & Business Media Deutschland,
Initial Term B-12 Loan, 3 Month LIBOR + 3.25% | EUR | 3.75 | | 8/24/22 | | 2,926,011 | b | 3,397,132 | |
Townsquare Media,
Term B Loan, 1 Month LIBOR + 3.00% | | 5.34 | | 4/1/22 | | 3,791,591 | b | 3,799,895 | |
Tribune Media,
Tranche C Term Loan, 1 Month LIBOR + 3.00% | | 5.34 | | 1/27/24 | | 3,395,981 | b | 3,409,259 | |
Univision Communications,
2017 Replacement Term Loan, 1 Month LIBOR + 2.75% | | 5.08 | | 3/15/24 | | 5,326,588 | b | 5,125,509 | |
WideOpenWest Finance,
Refinancing Term B Loan, 1 Month LIBOR + 3.25% | | 5.59 | | 8/6/23 | | 5,519,294 | b | 5,395,110 | |
| | 53,659,452 | |
Metals & Mining - 1.5% | | | | | |
Aleris International,
First Lien Initial Term Loan, 1 Month LIBOR + 4.75% | | 7.09 | | 2/27/23 | | 5,225,000 | b | 5,307,477 | |
Big River Steel,
Closing Date Term Loan, 3 Month LIBOR + 5.00% | | 7.31 | | 8/15/23 | | 4,390,424 | b | 4,472,744 | |
Covia Holdings,
Term Loan, 3 Month LIBOR + 3.75% | | 6.07 | | 5/21/25 | | 3,964,961 | b | 3,927,790 | |
Phoenix Services International,
Term B Loan, 1 Month LIBOR + 3.75% | | 6.07 | | 1/30/25 | | 3,493,651 | b | 3,515,487 | |
| | 17,223,498 | |
Real Estate - .8% | | | | | |
DTZ US Borrower,
Closing Date Term Loan, 1 Month LIBOR + 3.25% | | 5.56 | | 8/21/25 | | 7,700,000 | b | 7,683,175 | |
Flamingo LUX II,
Senior Facility B-3, 3 Month LIBOR + 3.25% | EUR | 3.25 | | 8/1/23 | | 1,482,447 | b | 1,724,192 | |
| | 9,407,367 | |
Registered Investment Companies - .9% | | | | | |
Masergy Holdings,
2017 Replacement First Lien Term Loan, 3 Month LIBOR + 3.25% | | 5.56 | | 12/15/23 | | 3,692,405 | b | 3,700,104 | |
24
| | | | | | | | | | |
| |
Description | Coupon
Rate (%) | | Maturity Date | | Principal Amount ($) | a | Value ($) | |
Floating Rate Loan Interests - 88.0% (continued) | | | | | |
Registered Investment Companies - .9% (continued) | | | | | |
TKC Holdings,
First Lien Term Loan, 1 Month LIBOR + 3.75% | | 6.08 | | 2/1/23 | | 4,577,062 | b | 4,583,859 | |
TKC Holdings,
Second Lien Term Loan, 1 Month LIBOR + 8.00% | | 10.33 | | 2/1/24 | | 2,075,000 | b | 2,077,417 | |
| | 10,361,380 | |
Retailing - 4.6% | | | | | |
Atkins Nutritionals,
Term Loan, 3 Month LIBOR + 3.50% | | 5.83 | | 7/7/24 | | 3,382,000 | b,d | 3,420,047 | |
Comfort Holding,
Term Loan, 1 Month LIBOR + 4.75% | | 7.09 | | 2/3/24 | | 2,715,625 | b | 2,596,816 | |
CWGS Group,
Term Loan, 1 Month LIBOR + 2.75% | | 5.09 | | 11/8/23 | | 3,132,084 | b | 3,095,282 | |
Douglas,
Term B-7 Loan, 3 Month EURIBOR + 3.50% | EUR | 3.50 | | 8/13/22 | | 47,166 | b | 45,606 | |
Douglas Holdings,
Term B-1 Loan, 3 Month EURIBOR + 3.50% | EUR | 3.50 | | 8/13/22 | | 379,473 | b | 366,914 | |
Douglas Holdings,
Term B-2 Loan, 3 Month EURIBOR + 3.50% | EUR | 3.50 | | 8/13/22 | | 113,228 | b | 109,481 | |
Douglas Holdings,
Term B-3 Loan, 3 Month EURIBOR + 3.50% | EUR | 3.50 | | 8/13/22 | | 349,253 | b | 337,694 | |
Douglas Holdings,
Term B-4 Loan, 3 Month EURIBOR + 3.50% | EUR | 3.50 | | 8/13/22 | | 130,804 | b | 126,475 | |
Douglas Holdings,
Term B-5 Loan, 3 Month EURIBOR + 3.50% | EUR | 3.50 | | 8/13/22 | | 9,627 | b | 9,309 | |
Douglas Holdings,
Term B-6 Loan, 3 Month EURIBOR + 3.50% | EUR | 3.50 | | 8/13/22 | | 158,902 | b | 153,643 | |
EG America,
Additional Facility Loan, 3 Month LIBOR + 4.00% | | 6.34 | | 2/6/25 | | 1,757,423 | b | 1,761,816 | |
Foundation Building Materials Holding,
Term Loan, 3 Month LIBOR + 3.25% | | 5.59 | | 7/30/25 | | 3,948,684 | b | 3,961,024 | |
Kirk Beauty One - Douglas,
Facility B8, 3 Month LIBOR + 3.25% | EUR | 3.25 | | 8/13/22 | | 2,811,546 | b | 2,718,498 | |
Leslie's Poolmart,
Term B-2 Loan, 2 Month LIBOR + 3.50% | | 5.82 | | 8/16/23 | | 4,072,779 | b | 4,077,035 | |
Men's Wearhouse,
Term B-2 Loan, 1 Month LIBOR + 3.50% | | 5.83 | | 4/9/25 | | 3,631,750 | b | 3,661,258 | |
25
STATEMENT OF INVESTMENTS (continued)
| | | | | | | | | | |
| |
Description | Coupon
Rate (%) | | Maturity Date | | Principal Amount ($) | a | Value ($) | |
Floating Rate Loan Interests - 88.0% (continued) | | | | | |
Retailing - 4.6% (continued) | | | | | |
Neiman Marcus Group ,
Term Loan, 1 Month LIBOR + 3.25% | | 5.58 | | 10/25/20 | | 3,751,674 | b | 3,493,747 | |
NPC International ,
First Lien Term Loan, 1 Month LIBOR + 3.50% | | 5.84 | | 4/3/24 | | 3,390,750 | b | 3,418,317 | |
Peer Holding III,
Facility B, 3 Month LIBOR + 3.50% | EUR | 3.50 | | 3/8/25 | | 2,000,000 | b | 2,289,301 | |
Serta Simmons Bedding,
First Lien Initial Term Loan, 1 Month LIBOR + 3.50% | | 5.84 | | 11/8/23 | | 3,250,500 | b | 2,804,905 | |
SRS Distribution,
Term Loan, 2 Month LIBOR + 3.25% | | 5.57 | | 5/18/25 | | 5,400,000 | b | 5,284,764 | |
Staples,
Term Loan, 3 Month LIBOR + 4.00% | | 6.33 | | 8/15/24 | | 5,511,791 | b | 5,505,894 | |
Tacala Investment,
First Lien Term Loan, 1 Month LIBOR + 3.25% | | 5.60 | | 2/1/25 | | 4,282,828 | b | 4,301,565 | |
| | 53,539,391 | |
Semiconductors & Semiconductor Equipment - .6% | | | | | |
Bright Bidco,
2018 Refinancing Term B Loan, 1-3 Month LIBOR + 3.50% | | 5.82 | | 6/30/24 | | 6,541,605 | b | 6,491,202 | |
Technology Hardware & Equipment - 3.0% | | | | | |
BMC Software Finance,
Term Loan, 1 Month LIBOR + 4.25% | | 6.56 | | 10/2/25 | | 9,075,000 | b | 9,094,874 | |
Everi Payments,
New Term B Loan, 1 Month LIBOR + 3.00% | | 5.81 | | 5/9/24 | | 5,648,744 | b | 5,681,112 | |
Harland Clarke Holdings,
Term Loan, 3 Month LIBOR + 4.75% | | 7.09 | | 11/3/23 | | 4,649,565 | b | 4,388,027 | |
McAfee,
Tranche B Term Loan, 1 Month LIBOR + 4.50% | | 6.84 | | 9/29/24 | | 6,897,048 | b | 6,962,570 | |
Tempo Acquisition,
Term Loan, 1 Month LIBOR + 3.00% | | 5.35 | | 5/1/24 | | 7,741,752 | b | 7,768,732 | |
VeriFone Systems,
First Lien Initial Term Loan, 3 Month LIBOR + 4.00% | | 6.31 | | 8/20/25 | | 704,120 | b | 706,584 | |
| | 34,601,899 | |
Telecommunication Services - 2.5% | | | | | |
CenturyLink,
Initial Term A Loan, 1 Month LIBOR + 2.75% | | 5.10 | | 10/31/21 | | 3,208,861 | b | 3,210,866 | |
Colorado Buyer,
Second Lien Initial Term Loan, 1 Month LIBOR + 7.25% | | 9.60 | | 3/15/25 | | 2,775,000 | b | 2,784,255 | |
26
| | | | | | | | | | |
| |
Description | Coupon
Rate (%) | | Maturity Date | | Principal Amount ($) | a | Value ($) | |
Floating Rate Loan Interests - 88.0% (continued) | | | | | |
Telecommunication Services - 2.5% (continued) | | | | | |
Consolidated Communications,
Term Loan, 1 Month LIBOR + 3.00% | | 5.34 | | 10/5/23 | | 3,327,791 | b | 3,279,622 | |
GTT Communications,
EMEA Term Loan, 1 Month LIBOR + 3.25% | EUR | 3.25 | | 5/31/25 | | 2,500,000 | b | 2,869,229 | |
Intelsat Jackson Holdings,
Term B4 Loan, 1 Month LIBOR + 4.50% | | 6.84 | | 1/2/24 | | 3,619,048 | b | 3,808,306 | |
IPC,
First Lien Term B-1 Loan, 3 Month LIBOR + 4.50% | | 6.84 | | 8/6/21 | | 773,537 | b | 756,136 | |
MTN Infrastructure TopCo ,
Term Loan, 1 Month LIBOR + 3.00% | | 5.31 | | 11/17/24 | | 4,492,875 | b | 4,518,844 | |
West,
Term Loan B, 1 Month LIBOR + 4.00% | | 6.34 | | 10/10/24 | | 8,101,123 | b | 8,082,125 | |
| | 29,309,383 | |
Transportation - .5% | | | | | |
Kenan Advantage Group,
Initial U.S. Term Loan, 1 Month LIBOR + 3.00% | | 5.33 | | 7/31/22 | | 2,061,791 | b | 2,055,358 | |
Kenan Canada GP,
Initial Canadian Term Loan, 1 Month LIBOR + 3.00% | | 5.35 | | 7/31/22 | | 626,746 | b | 624,791 | |
PODS,
Term B4 Loan, 1 Month LIBOR + 2.75% | | 5.08 | | 11/21/24 | | 3,354,661 | b | 3,365,665 | |
| | 6,045,814 | |
Utilities - 1.9% | | | | | |
Eastern Power,
Term Loan, 3 Month LIBOR + 3.75% | | 6.06 | | 10/2/23 | | 8,078,920 | b | 8,090,675 | |
EFS Cogen Holdings I,
Term B Advance, 3 Month LIBOR + 3.25% | | 5.59 | | 6/28/23 | | 4,391,063 | b | 4,389,702 | |
Helix Gen Funding,
Term Loan, 1 Month LIBOR + 3.75% | | 6.07 | | 6/2/24 | | 6,382,850 | b | 6,169,025 | |
Pike,
2018 Initial Term Loan, 1 Month LIBOR + 3.50% | | 5.84 | | 3/23/25 | | 3,686,049 | b | 3,718,301 | |
| | 22,367,703 | |
Total Floating Rate Loan Interests
(cost $1,025,009,643) | | 1,021,269,759 | |
| | | | | | Shares | | | |
Exchange-Traded Funds - 1.8% | | | | | |
Registered Investment Companies - 1.8% | | | | | |
Invesco Senior Loan ETF
(cost $21,658,817) | | | | | | 936,972 | | 21,606,574 | |
27
STATEMENT OF INVESTMENTS (continued)
| | | | | | | | | | |
| |
Description | 7-Day
Yield (%) | | | | Shares | | Value ($) | |
Investment Companies - 10.7% | | | | | |
Registered Investment Companies - 10.7% | | | | | |
Dreyfus Institutional Preferred Government Plus Money Market Fund
(cost $123,778,748) | | 1.91 | | | | 123,778,748 | f | 123,778,748 | |
Total Investments (cost $1,240,532,747) | | 106.5% | 1,235,900,985 | |
Liabilities, Less Cash and Receivables | | (6.5%) | (74,894,910) | |
Net Assets | | 100.0% | 1,161,006,075 | |
ETF—Exchange-Traded Fund
EURIBOR—Euro Interbank Offered Rate
LIBOR—London Interbank Offered Rate
EUR—Euro
a Amount stated in U.S. Dollars unless otherwise noted above.
b Variable rate security—rate shown is the interest rate in effect at period end.
c Security exempt from registration pursuant to Rule 144A under the Securities Act of 1933. These securities may be resold in transactions exempt from registration, normally to qualified institutional buyers. At August 31, 2018, these securities were valued at $59,060,976 or 5.09% of net assets.
d These securities are deemed Illiquid security by Board. At the period end, the value of these securities amounted to $159,487,072 or 13.74% of net assets.
e Investment, or portion of investment, represents an unfunded floating note loan interest outstanding.
f Investment in affiliated issuer. The investment objective of this investment company is publicly available and can be found within the respective investment company’s prospectus.
| | |
Portfolio Summary (Unaudited) † | Value (%) |
Consumer, Non-cyclical | 20.4 |
Industrial | 12.8 |
Investment Companies | 12.5 |
Technology | 12.4 |
Consumer, Cyclical | 11.7 |
Communications | 10.1 |
Financial | 8.2 |
Basic Materials | 6.3 |
Energy | 5.8 |
Collateralized Loan Obligations | 4.4 |
Utilities | 1.9 |
| | 106.5 |
† Based on net assets.
See notes to financial statements.
28
STATEMENT OF INVESTMENTS IN AFFILIATED ISSUERS
| | | | | | | |
Registered Investment Company | Value
8/31/17 ($) | Purchases ($) | Sales ($) | Value
8/31/18 ($) | Net
Assets (%) | Dividends/
Distributions ($) |
Dreyfus Institutional Preferred Government Plus Money Market Fund | 94,487,366 | 463,407,402 | 434,116,020 | 123,778,748 | 10.7 | 1,474,160 |
See notes to financial statements.
29
STATEMENT OF FORWARD FOREIGN CURRENCY EXCHANGE CONTRACTS August 31, 2018
| | | | | | |
Counterparty/ Purchased
Currency | Purchased Currency
Amounts | Currency
Sold | Sold
Currency
Amounts | Settlement Date | Unrealized Appreciation ($) |
Credit Suisse International | | | |
United States Dollar | 36,682,857 | Euro | 31,285,000 | 10/16/18 | 241,156 |
Gross Unrealized Appreciation | | | 241,156 |
See notes to financial statements.
30
STATEMENT OF ASSETS AND LIABILITIES
August 31, 2018
| | | | | | | |
| | | | | | |
| | | Cost | | Value | |
Assets ($): | | | | |
Investments in securities—See Statement of Investments: | | | |
Unaffiliated issuers | 1,116,753,999 | | 1,112,122,237 | |
Affiliated issuers | | 123,778,748 | | 123,778,748 | |
Cash | | | | | 6,863,561 | |
Cash denominated in foreign currency | | | 3,367,035 | | 3,367,035 | |
Receivable for investment securities sold | | 18,297,761 | |
Interest receivable | | 3,952,128 | |
Receivable for shares of Common Stock subscribed | | 2,568,184 | |
Unrealized appreciation on foreign currency transactions | | 349,548 | |
Unrealized appreciation on forward foreign
currency exchange contracts—Note 4 | | 241,156 | |
Prepaid expenses | | | | | 73,613 | |
| | | | | 1,271,613,971 | |
Liabilities ($): | | | | |
Due to The Dreyfus Corporation and affiliates—Note 3(c) | | | | 647,124 | |
Payable for investment securities purchased | | 102,841,681 | |
Payable for shares of Common Stock redeemed | | 1,805,444 | |
Directors fees and expenses payable | | 16,680 | |
Interest payable—Note 2 | | 2,019 | |
Accrued expenses and other liabilities | | | | | 5,294,948 | |
| | | | | 110,607,896 | |
Net Assets ($) | | | 1,161,006,075 | |
Composition of Net Assets ($): | | | | |
Paid-in capital | | | | | 1,188,787,836 | |
Accumulated undistributed investment income—net | | 7,396,559 | |
Accumulated net realized gain (loss) on investments | | | | | (31,137,262) | |
Accumulated net unrealized appreciation (depreciation)
on investments and foreign currency transactions | | (4,041,058) | |
Net Assets ($) | | | 1,161,006,075 | |
| | | | | | |
Net Asset Value Per Share | Class A | Class C | Class I | Class Y | |
Net Assets ($) | 19,165,168 | 2,166,417 | 18,280,209 | 1,121,394,281 | |
Shares Outstanding | 1,587,357 | 179,636 | 1,517,298 | 93,182,814 | |
Net Asset Value Per Share ($) | 12.07 | 12.06 | 12.05 | 12.03 | |
| | | | | | |
See notes to financial statements. | | | | | |
31
STATEMENT OF OPERATIONS
Year Ended August 31, 2018
| | | | | | | |
| | | | | | |
| | | | | | |
Investment Income ($): | | | | |
Income: | | | | |
Interest | | | 51,858,571 | |
Dividends: | |
Unaffiliated issuers | | | 534,446 | |
Affiliated issuers | | | 1,474,160 | |
Total Income | | | 53,867,177 | |
Expenses: | | | | |
Management fee—Note 3(a) | | | 6,757,426 | |
Professional fees | | | 141,627 | |
Loan commitment fees—Note 2 | | | 92,387 | |
Directors’ fees and expenses—Note 3(d) | | | 81,147 | |
Registration fees | | | 79,436 | |
Shareholder servicing costs—Note 3(c) | | | 70,685 | |
Distribution fees—Note 3(b) | | | 17,205 | |
Custodian fees—Note 3(c) | | | 10,694 | |
Prospectus and shareholders’ reports | | | 2,493 | |
Miscellaneous | | | 300,077 | |
Total Expenses | | | 7,553,177 | |
Less—reduction in expenses due to undertaking—Note 3(a) | | | (5,543) | |
Less—reduction in fees due to earnings credits—Note 3(c) | | | (4,520) | |
Net Expenses | | | 7,543,114 | |
Investment Income—Net | | | 46,324,063 | |
Realized and Unrealized Gain (Loss) on Investments—Note 4 ($): | | |
Net realized gain (loss) on investments and foreign currency transactions | (3,853,562) | |
Net realized gain (loss) on forward foreign currency exchange contracts | 899,203 | |
Net Realized Gain (Loss) | | | (2,954,359) | |
Net unrealized appreciation (depreciation) on investments
and foreign currency transactions | | | (6,863,649) | |
Net unrealized appreciation (depreciation) on
forward foreign currency exchange contracts | | | 445,938 | |
Net Unrealized Appreciation (Depreciation) | | | (6,417,711) | |
Net Realized and Unrealized Gain (Loss) on Investments | | | (9,372,070) | |
Net Increase in Net Assets Resulting from Operations | | 36,951,993 | |
| | | | | | | |
See notes to financial statements. | | | | | |
32
STATEMENT OF CHANGES IN NET ASSETS
| | | | | | | | | | |
| | | | Year Ended August 31, |
| | | | 2018 | | 2017 | |
Operations ($): | | | | | | | | |
Investment income—net | | | 46,324,063 | | | | 27,904,856 | |
Net realized gain (loss) on investments | | (2,954,359) | | | | (3,244,557) | |
Net unrealized appreciation (depreciation)
on investments | | (6,417,711) | | | | 3,976,756 | |
Net Increase (Decrease) in Net Assets
Resulting from Operations | 36,951,993 | | | | 28,637,055 | |
Distributions to Shareholders from ($): | |
Investment income—net: | | | | | | | | |
Class A | | | (726,137) | | | | (439,124) | |
Class C | | | (68,485) | | | | (76,376) | |
Class I | | | (884,361) | | | | (779,372) | |
Class Y | | | (40,747,816) | | | | (25,202,771) | |
Total Distributions | | | (42,426,799) | | | | (26,497,643) | |
Capital Stock Transactions ($): | |
Net proceeds from shares sold: | | | | | | | | |
Class A | | | 12,526,410 | | | | 12,313,342 | |
Class C | | | 431,944 | | | | 1,469,121 | |
Class I | | | 30,962,912 | | | | 48,823,802 | |
Class Y | | | 352,642,182 | | | | 469,824,657 | |
Distributions reinvested: | | | | | | | | |
Class A | | | 712,848 | | | | 418,239 | |
Class C | | | 65,581 | | | | 73,719 | |
Class I | | | 762,556 | | | | 661,698 | |
Class Y | | | 12,908,518 | | | | 9,010,491 | |
Cost of shares redeemed: | | | | | | | | |
Class A | | | (8,449,840) | | | | (5,523,110) | |
Class C | | | (974,115) | | | | (856,786) | |
Class I | | | (31,783,402) | | | | (43,917,071) | |
Class Y | | | (116,114,361) | | | | (85,234,090) | |
Increase (Decrease) in Net Assets
from Capital Stock Transactions | 253,691,233 | | | | 407,064,012 | |
Total Increase (Decrease) in Net Assets | 248,216,427 | | | | 409,203,424 | |
Net Assets ($): | |
Beginning of Period | | | 912,789,648 | | | | 503,586,224 | |
End of Period | | | 1,161,006,075 | | | | 912,789,648 | |
Undistributed investment income—net | 7,396,559 | | | | 1,778,815 | |
33
STATEMENT OF CHANGES IN NET ASSETS (continued)
| | | | | | | | | | |
| | | | Year Ended August 31, |
| | | | 2018 | | 2017 | |
Capital Share Transactions (Shares): | |
Class Aa | | | | | | | | |
Shares sold | | | 1,033,381 | | | | 1,016,419 | |
Shares issued for distributions reinvested | | | 58,986 | | | | 34,514 | |
Shares redeemed | | | (698,732) | | | | (454,952) | |
Net Increase (Decrease) in Shares Outstanding | 393,635 | | | | 595,981 | |
Class Ca | | | | | | | | |
Shares sold | | | 35,761 | | | | 121,518 | |
Shares issued for distributions reinvested | | | 5,430 | | | | 6,094 | |
Shares redeemed | | | (80,554) | | | | (70,735) | |
Net Increase (Decrease) in Shares Outstanding | (39,363) | | | | 56,877 | |
Class Ib | | | | | | | | |
Shares sold | | | 2,559,900 | | | | 4,030,579 | |
Shares issued for distributions reinvested | | | 63,235 | | | | 54,699 | |
Shares redeemed | | | (2,632,716) | | | | (3,624,840) | |
Net Increase (Decrease) in Shares Outstanding | (9,581) | | | | 460,438 | |
Class Yb | | | | | | | | |
Shares sold | | | 29,213,576 | | | | 38,800,687 | |
Shares issued for distributions reinvested | | | 1,071,834 | | | | 746,227 | |
Shares redeemed | | | (9,627,009) | | | | (7,048,673) | |
Net Increase (Decrease) in Shares Outstanding | 20,658,401 | | | | 32,498,241 | |
| | | | | | | | | | |
a | During the period ended August 31, 2018, 2,502 Class C shares representing $30,272 were automatically converted to 2,498 Class A shares. | |
b | During the period ended August 31, 2018, 833,605 Class Y shares representing $10,051,397 were exchanged for 832,612 Class I shares and during the period ended August 31, 2017, 871,441 Class Y shares representing $10,544,135 were exchanged for 870,512 Class I shares. | |
See notes to financial statements. | | | | | | | | |
34
FINANCIAL HIGHLIGHTS
The following tables describe the performance for each share class for the fiscal periods indicated. All information (except portfolio turnover rate) reflects financial results for a single fund share. Total return shows how much your investment in the fund would have increased (or decreased) during each period, assuming you had reinvested all dividends and distributions. These figures have been derived from the fund’s financial statements.
| | | | | | | | | | |
| | | | | | |
| | | Year Ended August 31, |
Class A Shares | 2018 | 2017 | 2016 | 2015 | 2014a |
Per Share Data ($): | | | | | |
Net asset value, beginning of period | 12.13 | 12.06 | 12.29 | 12.64 | 12.50 |
Investment Operations: | | | | | |
Investment income—net b | .51 | .44 | .47 | .48 | .38 |
Net realized and unrealized
gain (loss) on investments | (.11) | .05 | (.21) | (.33) | .05 |
Total from Investment Operations | .40 | .49 | .26 | .15 | .43 |
Distributions: | | | | | |
Dividends from investment income—net | (.46) | (.42) | (.49) | (.48) | (.29) |
Dividends from net realized gain on investments | - | - | - | (.02) | - |
Total Distributions | (.46) | (.42) | (.49) | (.50) | (.29) |
Net asset value, end of period | 12.07 | 12.13 | 12.06 | 12.29 | 12.64 |
Total Return (%)c | 3.38 | 4.14 | 2.23 | 1.28 | 3.39d |
Ratios/Supplemental Data (%): | | | | | |
Ratio of total expenses to average net assets | .99 | 1.02 | 1.04 | 1.04 | 1.13e |
Ratio of net expenses to average net assets | .99 | 1.02 | 1.04 | 1.04 | 1.03e |
Ratio of net investment income
to average net assets | 4.19 | 3.61 | 3.98 | 3.88 | 3.17e |
Portfolio Turnover Rate | 91.78 | 97.82 | 66.45 | 76.63 | 51.30d |
Net Assets, end of period ($ x 1,000) | 19,165 | 14,483 | 7,210 | 7,824 | 4,402 |
a From September 27, 2013 (commencement of operations) to August 31, 2014.
b Based on average shares outstanding.
c Exclusive of sales charge.
d Not annualized.
e Annualized.
See notes to financial statements.
35
FINANCIAL HIGHLIGHTS (continued)
| | | | | | | | | |
| | | | | | |
| | Year Ended August 31, |
Class C Shares | 2018 | 2017 | 2016 | 2015 | 2014a |
Per Share Data ($): | | | | | |
Net asset value, beginning of period | 12.11 | 12.04 | 12.28 | 12.63 | 12.50 |
Investment Operations: | | | | | |
Investment income—netb | .41 | .35 | .38 | .39 | .28 |
Net realized and unrealized
gain (loss) on investments | (.10) | .05 | (.22) | (.33) | .06 |
Total from Investment Operations | .31 | .40 | .16 | .06 | .34 |
Distributions: | | | | | |
Dividends from investment income—net | (.36) | (.33) | (.40) | (.39) | (.21) |
Dividends from net realized gain on investments | - | - | - | (.02) | - |
Total Distributions | (.36) | (.33) | (.40) | (.41) | (.21) |
Net asset value, end of period | 12.06 | 12.11 | 12.04 | 12.28 | 12.63 |
Total Return (%)c | 2.62 | 3.38 | 1.43 | .47 | 2.73d |
Ratios/Supplemental Data (%): | | | | | |
Ratio of total expenses to average net assets | 1.78 | 1.81 | 1.84 | 1.84 | 1.98e |
Ratio of net expenses to average net assets | 1.75 | 1.78 | 1.80 | 1.80 | 1.80e |
Ratio of net investment income
to average net assets | 3.40 | 2.85 | 3.22 | 3.11 | 2.40e |
Portfolio Turnover Rate | 91.78 | 97.82 | 66.45 | 76.63 | 51.30d |
Net Assets, end of period ($ x 1,000) | 2,166 | 2,652 | 1,952 | 803 | 475 |
a From September 27, 2013 (commencement of operations) to August 31, 2014.
b Based on average shares outstanding.
c Exclusive of sales charge.
d Not annualized.
e Annualized.
See notes to financial statements.
36
| | | | | | | |
| | | | | | |
| | Year Ended August 31, |
Class I Shares | 2018 | 2017 | 2016 | 2015 | 2014a |
Per Share Data ($): | | | | | |
Net asset value, beginning of period | 12.11 | 12.05 | 12.28 | 12.62 | 12.50 |
Investment Operations: | | | | | |
Investment income—netb | .54 | .47 | .50 | .56 | .43 |
Net realized and unrealized
gain (loss) on investments | (.10) | .05 | (.20) | (.36) | .01 |
Total from Investment Operations | .44 | .52 | .30 | .20 | .44 |
Distributions: | | | | | |
Dividends from investment income—net | (.50) | (.46) | (.53) | (.52) | (.32) |
Dividends from net realized gain on investments | - | - | - | (.02) | - |
Total Distributions | (.50) | (.46) | (.53) | (.54) | (.32) |
Net asset value, end of period | 12.05 | 12.11 | 12.05 | 12.28 | 12.62 |
Total Return (%) | 3.68 | 4.47 | 2.49 | 1.58 | 3.59c |
Ratios/Supplemental Data (%): | | | | | |
Ratio of total expenses to average net assets | .77 | .80 | .81 | .77 | .85d |
Ratio of net expenses to average net assets | .75 | .78 | .80 | .77 | .79d |
Ratio of net investment income
to average net assets | 4.45 | 3.87 | 4.22 | 4.19 | 3.40d |
Portfolio Turnover Rate | 91.78 | 97.82 | 66.45 | 76.63 | 51.30c |
Net Assets, end of period ($ x 1,000) | 18,280 | 18,492 | 12,845 | 10,187 | 6,876 |
a From September 27, 2013 (commencement of operations) to August 31, 2014.
b Based on average shares outstanding.
c Not annualized.
d Annualized.
See notes to financial statements.
37
FINANCIAL HIGHLIGHTS (continued)
| | | | | | | |
| | | | | | |
| | Year Ended August 31, |
Class Y Shares | 2018 | 2017 | 2016 | 2015 | 2014a |
Per Share Data ($): | | | | | |
Net asset value, beginning of period | 12.09 | 12.03 | 12.27 | 12.63 | 12.50 |
Investment Operations: | | | | | |
Investment income—netb | .54 | .47 | .51 | .51 | .36 |
Net realized and unrealized
gain (loss) on investments | (.10) | .05 | (.22) | (.32) | .09 |
Total from Investment Operations | .44 | .52 | .29 | (.19) | .45 |
Distributions: | | | | | |
Dividends from investment income—net | (.50) | (.46) | (.53) | (.53) | (.32) |
Dividends from net realized gain on investments | - | - | - | (.02) | - |
Total Distributions | (.50) | (.46) | (.53) | (.55) | (.32) |
Net asset value, end of period | 12.03 | 12.09 | 12.03 | 12.27 | 12.63 |
Total Return (%) | 3.60 | 4.51 | 2.54 | 1.56 | 3.59c |
Ratios/Supplemental Data (%): | | | | | |
Ratio of total expenses to average net assets | .72 | .74 | .76 | .75 | .86d |
Ratio of net expenses to average net assets | .72 | .74 | .76 | .75 | .79d |
Ratio of net investment income
to average net assets | 4.46 | 3.91 | 4.27 | 4.14 | 3.41d |
Portfolio Turnover Rate | 91.78 | 97.82 | 66.45 | 76.63 | 51.30c |
Net Assets, end of period ($ x 1,000) | 1,121,392 | 877,163 | 481,579 | 490,699 | 519,996 |
a From September 27, 2013 (commencement of operations) to August 31, 2014.
b Based on average shares outstanding.
c Not annualized.
d Annualized.
See notes to financial statements.
38
NOTES TO FINANCIAL STATEMENTS
NOTE 1—Significant Accounting Policies:
Dreyfus Floating Rate Income Fund (the “fund”) is a separate non-diversified series of The Dreyfus/Laurel Funds, Inc. (the “Company”), which is registered under the Investment Company Act of 1940, as amended (the “Act”), as an open-end management investment company and operates as a series company currently offering eight series, including the fund. The fund’s investment objective is to seek high current income. The Dreyfus Corporation (the “Manager” or “Dreyfus”), a wholly-owned subsidiary of The Bank of New York Mellon Corporation (“BNY Mellon”), serves as the fund’s investment adviser. Alcentra NY, LLC (“Alcentra”), a wholly-owned subsidiary of BNY Mellon and an affiliate of Dreyfus, serves as the fund’s sub-investment adviser.
Effective February 22, 2018, the Company’s Board of Directors (the “Board”) approved a proposal to re-allocate 25 million Class A shares, 25 million Class C shares, 25 million Class I shares and 25 million Class T shares as 100 million new Class Y shares, raising the total of authorized Class Y shares to 200 million (up from 100 million).
MBSC Securities Corporation (the “Distributor”), a wholly-owned subsidiary of Dreyfus, is the distributor of the fund’s shares. The fund is authorized to issue 500 million shares of $.001 par value Common Stock. The fund currently has authorized five classes of shares: Class A (75 million shares authorized), Class C (75 million shares authorized), Class I (75 million shares authorized), Class T (75 million shares authorized) and Class Y (200 million shares authorized). Class A, Class C and Class T shares are sold primarily to retail investors through financial intermediaries and bear Distribution and/or Shareholder Services Plan fees. Class A and Class T shares generally are subject to a sales charge imposed at the time of purchase. Class C shares are subject to a contingent deferred sales charge (“CDSC”) imposed on Class C shares redeemed within one year of purchase. Class C shares automatically convert to Class A shares ten years after the date of purchase, without the imposition of a sales charge. Class I shares are sold primarily to bank trust departments and other financial service providers (including The Bank of New York Mellon, a subsidiary of BNY Mellon and an affiliate of Dreyfus, and its affiliates), acting on behalf of customers having a qualified trust or an investment account or relationship at such institution, and bear no Distribution or Shareholder Services Plan fees. Class Y shares are sold at net asset value per share generally to institutional investors, and bear no Distribution or Shareholder Services Plan fees. Class I and Class Y shares are offered without a front-end sales charge or CDSC. As of the date of this report, the fund did not offer Class T shares for purchase. Other differences between the classes
39
NOTES TO FINANCIAL STATEMENTS (continued)
include the services offered to and the expenses borne by each class, the allocation of certain transfer agency costs, and certain voting rights. Income, expenses (other than expenses attributable to a specific class), and realized and unrealized gains or losses on investments are allocated to each class of shares based on its relative net assets.
The Company accounts separately for the assets, liabilities and operations of each series. Expenses directly attributable to each series are charged to that series’ operations; expenses which are applicable to all series are allocated among them on a pro rata basis.
The Financial Accounting Standards Board (“FASB”) Accounting Standards Codification (“ASC”) is the exclusive reference of authoritative U.S. generally accepted accounting principles (“GAAP”) recognized by the FASB to be applied by nongovernmental entities. Rules and interpretive releases of the Securities and Exchange Commission (“SEC”) under authority of federal laws are also sources of authoritative GAAP for SEC registrants. The fund’s financial statements are prepared in accordance with GAAP, which may require the use of management estimates and assumptions. Actual results could differ from those estimates.
(a) Portfolio valuation: The fair value of a financial instrument is the amount that would be received to sell an asset or paid to transfer a liability in an orderly transaction between market participants at the measurement date (i.e., the exit price). GAAP establishes a fair value hierarchy that prioritizes the inputs of valuation techniques used to measure fair value. This hierarchy gives the highest priority to unadjusted quoted prices in active markets for identical assets or liabilities (Level 1 measurements) and the lowest priority to unobservable inputs (Level 3 measurements).
Additionally, GAAP provides guidance on determining whether the volume and activity in a market has decreased significantly and whether such a decrease in activity results in transactions that are not orderly. GAAP requires enhanced disclosures around valuation inputs and techniques used during annual and interim periods.
Various inputs are used in determining the value of the fund’s investments relating to fair value measurements. These inputs are summarized in the three broad levels listed below:
Level 1—unadjusted quoted prices in active markets for identical investments.
Level 2—other significant observable inputs (including quoted prices for similar investments, interest rates, prepayment speeds, credit risk, etc.).
40
Level 3—significant unobservable inputs (including the fund’s own assumptions in determining the fair value of investments).
The inputs or methodology used for valuing securities are not necessarily an indication of the risk associated with investing in those securities.
Changes in valuation techniques may result in transfers in or out of an assigned level within the disclosure hierarchy. Valuation techniques used to value the fund’s investments are as follows:
Investments in debt securities, floating rate loan interests and other securities, excluding short-term investments (other than U.S. Treasury Bills), and forward foreign currency exchange contracts (“forward contracts”) are valued each business day by an independent pricing service (the “Service”) approved by the Company’s Board of Directors (the “Board”). Investments for which quoted bid prices are readily available and are representative of the bid side of the market in the judgment of the Service are valued at the mean between the quoted bid prices (as obtained by the Service from dealers in such securities) and asked prices (as calculated by the Service based upon its evaluation of the market for such securities). Other investments (which constitute a majority of the portfolio securities) are valued as determined by the Service, based on methods which include consideration of the following: yields or prices of securities of comparable quality, coupon, maturity and type; indications as to values from dealers; and general market conditions. These securities are generally categorized within Level 2 of the fair value hierarchy.
Investments in equity securities are valued at the last sales price on the securities exchange or national securities market on which such securities are primarily traded. Securities listed on the National Market System for which market quotations are available are valued at the official closing price or, if there is no official closing price that day, at the last sales price. For open short positions, asked prices are used for valuation purposes. Bid price is used when no asked price is available. Registered investment companies that are not traded on an exchange are valued at their net asset value. All of the preceding securities are generally categorized within Level 1 of the fair value hierarchy.
Securities not listed on an exchange or the national securities market, or securities for which there were no transactions, are valued at the average of the most recent bid and asked prices. These securities are generally categorized within Level 2 of the fair value hierarchy.
The Service is engaged under the general supervision of the Board.
41
NOTES TO FINANCIAL STATEMENTS (continued)
Fair valuing of securities may be determined with the assistance of a pricing service using calculations based on indices of domestic securities and other appropriate indicators, such as prices of relevant American Depository Receipts and futures. Utilizing these techniques may result in transfers between Level 1 and Level 2 of the fair value hierarchy.
When market quotations or official closing prices are not readily available, or are determined not to accurately reflect fair value, such as when the value of a security has been significantly affected by events after the close of the exchange or market on which the security is principally traded (for example, a foreign exchange or market), but before the fund calculates its net asset value, the fund may value these investments at fair value as determined in accordance with the procedures approved by the Board. Certain factors may be considered when fair valuing investments such as: fundamental analytical data, the nature and duration of restrictions on disposition, an evaluation of the forces that influence the market in which the securities are purchased and sold, and public trading in similar securities of the issuer or comparable issuers. These securities are either categorized within Level 2 or 3 of the fair value hierarchy depending on the relevant inputs used.
For restricted securities where observable inputs are limited, assumptions about market activity and risk are used and such securities are generally categorized within Level 3 of the fair value hierarchy.
Investments denominated in foreign currencies are translated to U.S. dollars at the prevailing rates of exchange.
Forward contracts are valued at the forward rate and are generally categorized within Level 2 of the fair value hierarchy.
The following is a summary of the inputs used as of August 31, 2018 in valuing the fund’s investments:
| | | | | |
| | Level 1 - Unadjusted Quoted Prices | Level 2 - Other Significant Observable Inputs | Level 3 -Significant Unobservable Inputs | Total |
Assets ($) | | | | |
Investments in Securities: | | | |
Collateralized Loan Obligations Debt | - | 50,810,971 | - | 50,810,971 |
Corporate Bonds† | - | 18,434,933 | - | 18,434,933 |
Exchange-Traded Funds | 21,606,574 | - | - | 21,606,574 |
42
| | | | | |
| | Level 1 - Unadjusted Quoted Prices | Level 2 - Other Significant Observable Inputs | Level 3 -Significant Unobservable Inputs | Total |
Assets ($) | | | | |
Floating Rate Loan Interests† | - | 1,021,269,759 | - | 1,021,269,759 |
Registered Investment Company | 123,778,748 | - | - | 123,778,748 |
Other Financial Instruments: | | | |
Forward Foreign Currency Exchange Contracts†† | - | 241,156 | - | 241,156 |
† See Statement of Investments for additional detailed categorizations.
†† Amount shown represents unrealized appreciation at period end.
At August 31, 2018, there were no transfers between levels of the fair value hierarchy. It is the fund’s policy to recognize transfers between levels at the end of the reporting period.
(b) Foreign currency transactions: The fund does not isolate that portion of the results of operations resulting from changes in foreign exchange rates on investments from the fluctuations arising from changes in the market prices of securities held. Such fluctuations are included with the net realized and unrealized gain or loss on investments.
Net realized foreign exchange gains or losses arise from sales of foreign currencies, currency gains or losses realized on securities transactions between trade and settlement date, and the difference between the amounts of dividends, interest and foreign withholding taxes recorded on the fund’s books and the U.S. dollar equivalent of the amounts actually received or paid. Net unrealized foreign exchange gains and losses arise from changes in the value of assets and liabilities other than investments resulting from changes in exchange rates. Foreign currency gains and losses on foreign currency transactions are also included with net realized and unrealized gain or loss on investments.
(c) Securities transactions and investment income: Securities transactions are recorded on a trade date basis. Realized gains and losses from securities transactions are recorded on the identified cost basis. Dividend income is recognized on the ex-dividend date and interest income, including, where applicable, accretion of discount and amortization of premium on investments, is recognized on the accrual basis.
43
NOTES TO FINANCIAL STATEMENTS (continued)
(d) Affiliated issuers: Investments in other investment companies advised by Dreyfus are defined as “affiliated” under the Act.
(e) Risk: The fund invests in floating rate loan interests. The floating rate loans in which the fund invests typically are below investment grade securities, and inherently speculative. In the event of the bankruptcy of a borrower, the fund could experience delays or limitations imposed by insolvency laws with respect to its ability to realize the benefits of any collateral securing the borrower’s loan.
The fund invests in Collateralized Loan Obligations (“CLOs”). CLO and structured finance securities are generally backed by an asset or a pool of assets (typically senior secured loans and other credit-related assets in the case of a CLO) which serve as collateral. The fund and other investors in CLO and structured finance securities ultimately bear the credit risk of the underlying collateral. If there are defaults or the relevant collateral otherwise underperforms, scheduled payments to senior tranches of such securities take precedence over those of mezzanine tranches, and scheduled payments to mezzanine tranches take precedence over those to subordinated/equity tranches. Therefore, CLO and other structured finance securities may present risks similar to those of the other types of debt obligations and, in fact, such risks may be of greater significance in the case of CLO and other structured finance securities. In addition to the general risks associated with investing in debt securities, CLO securities carry additional risks, including, but not limited to: (1) the possibility that distributions from collateral assets will not be adequate to make interest or other payments; (2) the quality of the collateral may decline in value or default; (3) the fact that investments in CLO equity and junior debt tranches will likely be subordinate to other senior classes of CLO debt; and (4) the complex structure of the security may not be fully understood at the time of investment and may produce disputes with the issuer or unexpected investment results. Additionally, changes in the collateral held by a CLO may cause payments on the instruments the Fund holds to be reduced, either temporarily or permanently. Structured investments, particularly the subordinated interests in which the Fund invests, are less liquid than many other types of securities and may be more volatile than the assets underlying the CLOs the Fund may target. In addition, CLO and other structured finance securities may be subject to prepayment risk.
The fund invests primarily in debt securities. Failure of an issuer of the debt securities to make timely interest or principal payments, or a decline or the perception of a decline in the credit quality of a debt security, can cause the debt security’s price to fall, potentially lowering the fund’s share price. In addition, the value of debt securities may decline due to general
44
market conditions that are not specifically related to a particular issuer, such as real or perceived adverse economic conditions, changes in outlook for corporate earnings, changes in interest or currency rates or adverse investor sentiment. Such values may also decline because of factors that affect a particular industry.
(f) Dividends and distributions to shareholders: Dividends and distributions are recorded on the ex-dividend date. Dividends from investment income-net are normally declared and paid on a monthly basis. Dividends from net realized capital gains, if any, are normally declared and paid annually, but the fund may make distributions on a more frequent basis to comply with the distribution requirements of the Internal Revenue Code of 1986, as amended (the “Code”). To the extent that net realized capital gains can be offset by capital loss carryovers, it is the policy of the fund not to distribute such gains. Income and capital gain distributions are determined in accordance with income tax regulations, which may differ from GAAP.
On August 31, 2018, the Board declared a cash dividend of $.043, $.036, $.044 and $.046 per share from undistributed investment income-net for Class A, Class C, Class I and Class Y shares, respectively, payable on September 5, 2018, to shareholders of record as of the close of business on August 31, 2018. The ex-dividend date was September 4, 2018.
(g) Federal income taxes: It is the policy of the fund to continue to qualify as a regulated investment company, if such qualification is in the best interests of its shareholders, by complying with the applicable provisions of the Code, and to make distributions of taxable income sufficient to relieve it from substantially all federal income and excise taxes.
As of and during the period ended August 31, 2018, the fund did not have any liabilities for any uncertain tax positions. The fund recognizes interest and penalties, if any, related to uncertain tax positions as income tax expense in the Statement of Operations. During the period ended August 31, 2018, the fund did not incur any interest or penalties.
Each tax year in the four-year period ended August 31, 2018 remains subject to examination by the Internal Revenue Service and state taxing authorities.
At August 31, 2018, the components of accumulated earnings on a tax basis were as follows: undistributed ordinary income $7,396,559, accumulated capital losses $30,223,031 and unrealized depreciation $4,955,289.
45
NOTES TO FINANCIAL STATEMENTS (continued)
Under the Regulated Investment Company Modernization Act of 2010, the fund is permitted to carry forward capital losses for an unlimited period. Furthermore, capital loss carryovers retain their character as either short-term or long-term capital losses.
The accumulated capital loss carryover is available for federal income tax purposes to be applied against future net realized capital gains, if any, realized subsequent to August 31, 2018. The fund has $8,498,348 of short-term capital losses and $21,724,683 of long-term capital losses which can be carried forward for an unlimited period.
The tax character of distributions paid to shareholders during the fiscal periods ended August 31, 2018 and August 31, 2017 were as follows: ordinary income $42,426,799 and $26,497,643, respectively.
During the period ended August 31, 2018, as a result of permanent book to tax differences, primarily due to the tax treatment for amortization adjustments, foreign currency transactions, paydown gains and losses and consent fees, the fund increased accumulated undistributed investment income-net by $1,720,480 and decreased accumulated net realized gain (loss) on investments by the same amount. Net assets and net asset value per share were not affected by this reclassification.
(h) New Accounting Pronouncements: In March 2017, the FASB issued Accounting Standards Update 2017-08, Receivables—Nonrefundable Fees and Other Costs (Subtopic 310-20): Premium Amortization On Purchased Callable Debt Securities (“ASU 2017-08”). The update shortens the amortization period for the premium on certain purchased callable debt securities to the earliest call date. ASU 2017-08 will be effective for annual periods beginning after December 15, 2018.
Also in August 2018, the FASB issued Accounting Standards Update 2018-13, Fair Value Measurement (Topic 820): Disclosure Framework—Changes to the Disclosure Requirements for Fair Value Measurement (“ASU 2018-13”). The update provides guidance that eliminates, adds and modifies certain disclosure requirements for fair value measurements. ASU 2018-13 will be effective for annual periods beginning after December 15, 2019. Management is currently assessing the potential impact of these changes to future financial statements.
NOTE 2—Bank Lines of Credit:
The fund participates with other Dreyfus-managed funds in an $830 million unsecured credit facility led by Citibank, N.A. and a $300 million unsecured credit facility provided by The Bank of New York Mellon (each, a “Facility”), each to be utilized primarily for temporary or emergency
46
purposes, including the financing of redemptions. Prior to October 4, 2017, the unsecured credit facility with Citibank, N.A. was $810 million. Effective June 19, 2018, the Board approved a $200 million Citibank, N.A. short-term revolving credit facility (the “FRIF Citibank Credit Facility”), for a term beginning June 20, 2018 and ending October 3, 2018. The FRIF Citibank Credit Facility, is a short-term, committed line of credit used by the fund for shareholder redemptions and other temporary or emergency purposes. Dreyfus is not expecting to utilize the FRIF Citibank Credit Facility under normal business conditions, but believes a dedicated line of credit for the fund is prudent in light of the extended settlement term of its securities. In connection therewith, the fund has agreed to pay its pro rata portion of commitment fees for each Facility and the commitment fees for the FRIF Citibank Credit Facility. Interest is charged to the fund based on rates determined pursuant to the terms of the respective Facility and the FRIF Citibank Credit Facility at the time of borrowing. During the period ended August 31, 2018, the fund did not borrow under the Facilities and the FRIF Citibank Credit Facility.
NOTE 3—Management Fee, Sub-Investment Advisory Fee and Other Transactions with Affiliates:
(a) Pursuant to a management agreement with Dreyfus, the management fee is computed at the annual rate of .65% of the value of the fund’s average daily net assets and is payable monthly. Dreyfus has contractually agreed, from September 1, 2017 through December 31, 2018, to waive receipt of its fees and/or assume the direct expenses of the fund, so that the annual fund operating expense for Class A, C, I and Y shares (excluding Rule 12b-1 Distribution Plan fees, Shareholder Services Plan fees, taxes, interest expense, brokerage commissions, commitment fees on borrowings and extraordinary expenses) do not exceed .75% of the value of the fund’s average daily net assets. The reduction in expenses, pursuant to the undertaking, amounted to $5,543 during the period ended August 31, 2018.
Pursuant to a sub-investment advisory agreement between Dreyfus and Alcentra, Alcentra serves as the fund’s sub-investment adviser responsible for the day-to-day management of the fund’s portfolio. Dreyfus pays the sub-investment adviser a monthly fee at an annual percentage of the value of the fund’s average daily net assets. Dreyfus has obtained an exemptive order from the SEC (the “Order”), upon which the fund may rely, to use a manager of managers approach that permits Dreyfus, subject to certain conditions and approval by the Board, to enter into and materially amend sub-investment advisory agreements with one or more sub-investment advisers who are either unaffiliated with Dreyfus or are wholly-owned
47
NOTES TO FINANCIAL STATEMENTS (continued)
subsidiaries (as defined under the Act) of Dreyfus’ ultimate parent company, BNY Mellon, without obtaining shareholder approval. The Order also allows the fund to disclose the sub-investment advisory fee paid by Dreyfus to any unaffiliated sub-investment adviser in the aggregate with other unaffiliated sub-investment advisers in documents filed with the SEC and provided to shareholders. In addition, pursuant to the Order, it is not necessary to disclose the sub-investment advisory fee payable by Dreyfus separately to a sub-investment adviser that is a wholly-owned subsidiary of BNY Mellon in documents filed with the SEC and provided to shareholders; such fees are to be aggregated with fees payable to Dreyfus. Dreyfus has ultimate responsibility (subject to oversight by the Board) to supervise any sub-investment adviser and recommend the hiring, termination, and replacement of any sub-investment adviser to the Board.
During the period ended August 31, 2018, the Distributor retained $748 from commissions earned on sales of the fund’s Class A shares and $1,998 from CDSCs on redemptions of the fund’s Class C shares.
(b) Under the Distribution Plan adopted pursuant to Rule 12b-1 under the Act, Class C shares pay the Distributor for distributing its shares at an annual rate of .75% of the value of its average daily net assets. During the period ended August 31, 2018, Class C shares were charged $17,205 pursuant to the Distribution Plan.
(c) Under the Shareholder Services Plan, Class A and Class C shares pay the Distributor at an annual rate of .25% of the value of their average daily net assets for the provision of certain services. The services provided may include personal services relating to shareholder accounts, such as answering shareholder inquiries regarding the fund and providing reports and other information, and services related to the maintenance of shareholder accounts. The Distributor may make payments to Service Agents (securities dealers, financial institutions or other industry professionals) with respect to these services. The Distributor determines the amounts to be paid to Service Agents. During the period ended August 31, 2018, Class A and Class C shares were charged $47,701 and $5,735, respectively, pursuant to the Shareholder Services Plan.
Under its terms, the Distribution Plan and Shareholder Services Plan shall remain in effect from year to year, provided such continuance is approved annually by a vote of a majority of those Directors who are not “interested persons” of the Company and who have no direct or indirect financial interest in the operation of or in any agreement related to the Distribution Plan or Shareholder Services Plan.
48
The fund has arrangements with the transfer agent and the custodian whereby the fund may receive earnings credits when positive cash balances are maintained, which are used to offset transfer agency and custody fees. For financial reporting purposes, the fund includes net earnings credits, if any, as an expense offset in the Statement of Operations.
The fund compensates Dreyfus Transfer, Inc., a wholly-owned subsidiary of Dreyfus, under a transfer agency agreement for providing transfer agency and cash management services for the fund. The majority of transfer agency fees are comprised of amounts paid on a per account basis, while cash management fees are related to fund subscriptions and redemptions. During the period ended August 31, 2018, the fund was charged $4,657 for transfer agency services. These fees are included in Shareholder servicing costs in the Statement of Operations.
The fund compensates The Bank of New York Mellon under a custody agreement for providing custodial services for the fund. These fees are determined based on net assets, geographic region and transaction activity. During the period ended August 31, 2018, the fund was charged $10,694 pursuant to the custody agreement. These fees were partially offset by earnings credits of $4,520.
During the period ended August 31, 2018, the fund was charged $13,269 for services performed by the Chief Compliance Officer and his staff. These fees are included in Miscellaneous in the Statement of Operations.
The components of “Due to The Dreyfus Corporation and affiliates” in the Statement of Assets and Liabilities consist of: management fees $633,716, Distribution Plan fees $1,336, Shareholder Services Plan fees $4,631, custodian fees $2,484, Chief Compliance Officer fees $5,693 and transfer agency fees $303, which are offset against an expense reimbursement currently in effect in the amount of $1,039.
(d) Each Board member also serves as a Board member of other funds within the Dreyfus complex. Annual retainer fees and attendance fees are allocated to each fund based on net assets.
NOTE 4—Securities Transactions:
The aggregate amount of purchases and sales (including paydowns) of investment securities, excluding short-term securities and forward contracts, during the period ended August 31, 2018, amounted to $1,187,199,513 and $914,445,723, respectively.
Floating Rate Loan Interests: Floating rate instruments are loans and other securities with interest rates that adjust or “float” periodically. Floating rate loans are made by banks and other financial institutions to
49
NOTES TO FINANCIAL STATEMENTS (continued)
their corporate clients. The rates of interest on the loans adjust periodically by reference to a base lending rate, such as the London Interbank Offered Rate (“LIBOR”) plus a premium or credit spread. Floating rate loans reset on periodic set dates, typically 30 to 90 days, but not to exceed one year. The fund may invest in multiple series or tranches of a loan. A different series or tranche may have varying terms and carry different associated risks.
The fund may enter into certain credit agreements all or a portion of which may be unfunded. The fund is obligated to fund these commitments at the borrower’s discretion. The commitments are disclosed in the accompanying Statement of Investments. At August 31, 2018, the fund had sufficient cash and/or securities to cover these commitments.
Derivatives: A derivative is a financial instrument whose performance is derived from the performance of another asset. The fund enters into International Swaps and Derivatives Association, Inc. Master Agreements or similar agreements (collectively, “Master Agreements”) with its over-the-counter (“OTC”) derivative contract counterparties in order to, among other things, reduce its credit risk to counterparties. Master Agreements include provisions for general obligations, representations, collateral and events of default or termination. Under a Master Agreement, the fund may offset with the counterparty certain derivative financial instrument’s payables and/or receivables with collateral held and/or posted and create one single net payment in the event of default or termination.
Each type of derivative instrument that was held by the fund during the period ended August 31, 2018 is discussed below.
Forward Foreign Currency Exchange Contracts: The fund enters into forward contracts in order to hedge its exposure to changes in foreign currency exchange rates on its foreign portfolio holdings, to settle foreign currency transactions or as a part of its investment strategy. When executing forward contracts, the fund is obligated to buy or sell a foreign currency at a specified rate on a certain date in the future. With respect to sales of forward contracts, the fund incurs a loss if the value of the contract increases between the date the forward contract is opened and the date the forward contract is closed. The fund realizes a gain if the value of the contract decreases between those dates. With respect to purchases of forward contracts, the fund incurs a loss if the value of the contract decreases between the date the forward contract is opened and the date the forward contract is closed. The fund realizes a gain if the value of the contract increases between those dates. Any realized or unrealized gains or losses which occurred during the period are reflected in the Statement of Operations. The fund is exposed to foreign currency risk as a result of
50
changes in value of underlying financial instruments. The fund is also exposed to credit risk associated with counterparty nonperformance on these forward contracts, which is generally limited to the unrealized gain on each open contract. This risk may be mitigated by Master Agreements, if any, between the fund and the counterparty and the posting of collateral, if any, by the counterparty to the fund to cover the fund’s exposure to the counterparty. Forward contracts open at February 28, 2018 are set forth in the Statement of Forward Foreign Currency Exchange Contracts.
The following summarizes the average market value of derivatives outstanding during the period ended August 31, 2018:
| | | |
| | Average Market Value ($) |
Forward contracts | | 25,561,435 |
| | | |
At August 31, 2018, the cost of investments inclusive of derivative contracts for federal income tax purposes was $1,241,205,822; accordingly, accumulated net unrealized depreciation on investments inclusive of derivative contracts was $5,063,681, consisting of $4,375,812 gross unrealized appreciation and $9,439,493 gross unrealized depreciation.
51
REPORT OF INDEPENDENT REGISTERED PUBLIC ACCOUNTING FIRM
To the Shareholders and Board of Directors
The Dreyfus/Laurel Funds, Inc.:
Opinion on the Financial Statements
We have audited the accompanying statement of assets and liabilities of Dreyfus Floating Rate Income Fund (the “Fund”), a series of The Dreyfus/Laurel Funds, Inc., including the statements of investments, investments in affiliated issuers, and forward foreign currency exchange contracts, as of August 31, 2018, the related statement of operations for the year then ended, the statements of changes in net assets for each of the years in the two-year period then ended, and the related notes (collectively, the financial statements) and the financial highlights for each of the years or periods in the five-year period then ended. In our opinion, the financial statements and financial highlights present fairly, in all material respects, the financial position of the Fund as of August 31, 2018, the results of its operations for the year then ended, the changes in its net assets for each of the years in the two-year period then ended, and the financial highlights for each of the years or periods in the five-year period then ended, in conformity with U.S. generally accepted accounting principles.
Basis for Opinion
These financial statements and financial highlights are the responsibility of the Fund’s management. Our responsibility is to express an opinion on these financial statements and financial highlights based on our audits. We are a public accounting firm registered with the Public Company Accounting Oversight Board (United States) (PCAOB) and are required to be independent with respect to the Fund in accordance with the U.S. federal securities laws and the applicable rules and regulations of the Securities and Exchange Commission and the PCAOB.
We conducted our audits in accordance with the standards of the PCAOB. Those standards require that we plan and perform the audit to obtain reasonable assurance about whether the financial statements and financial highlights are free of material misstatement, whether due to error or fraud. Our audits included performing procedures to assess the risks of material misstatement of the financial statements and financial highlights, whether due to error or fraud, and performing procedures that respond to those risks. Such procedures included examining, on a test basis, evidence regarding the amounts and disclosures in the financial statements and financial highlights. Such procedures also included confirmation of securities owned as of August 31, 2018, by correspondence with the custodian and brokers or by other appropriate auditing procedures when replies from brokers were not received. Our audits also included evaluating the accounting principles used and significant estimates made by management, as well as evaluating the overall presentation of the financial statements and financial highlights. We believe that our audits provide a reasonable basis for our opinion.

We have served as the auditor of one or more Dreyfus Corporation investment companies since 1994.
New York, New York
October 29, 2018
52
IMPORTANT TAX INFORMATION (Unaudited)
For federal tax purposes the fund designates the maximum amount allowable but not less than 88.24% as interest-related dividends in accordance with Sections 871(k)(1) and 881(e) of the Internal Revenue Code. Where required by federal tax law rules, shareholders will receive notification of their portion of the Fund’s taxable ordinary dividends and capital gains distributions paid for the 2018 calendar year on Form 1099-DIV which will be mailed in early 2019.
53
BOARD MEMBERS INFORMATION (Unaudited)
INDEPENDENT BOARD MEMBERS
Joseph S. DiMartino (74)
Chairman of the Board (1999)
Principal Occupation During Past 5 Years:
· Corporate Director and Trustee (1995-present)
Other Public Company Board Memberships During Past 5 Years:
· CBIZ (formerly, Century Business Services, Inc.), a provider of outsourcing functions for small and medium size companies, Director (1997-present)
No. of Portfolios for which Board Member Serves: 125
———————
Francine J. Bovich (67)
Board Member (2012)
Principal Occupation During Past 5 Years:
· Trustee, The Bradley Trusts, private trust funds (2011-present)
Other Public Company Board Memberships During Past 5 Years:
· Annaly Capital Management, Inc., a real estate trust, Director (2014-present)
No. of Portfolios for which Board Member Serves: 73
———————
Kenneth A. Himmel (72)
Board Member (1994)
Principal Occupation During Past 5 Years:
· Managing Partner, Gulf Related, an international real estate development company (2010-present)
· President and CEO, Related Urban Development, a real estate development company (1996-present)
· President and CEO, Himmel & Company, a real estate development company (1980-present)
· CEO, American Food Management, a restaurant company (1983-present)
No. of Portfolios for which Board Member Serves: 25
———————
54
Stephen J. Lockwood (71)
Board Member (1994)
Principal Occupation During Past 5 Years:
· Chairman of the Board, Stephen J. Lockwood and Company LLC, a real estate investment company (2000-present)
No. of Portfolios for which Board Member Serves: 25
———————
Roslyn M. Watson (68)
Board Member (2015)
Principal Occupation During Past 5 Years:
· Principal, Watson Ventures, Inc., a real estate investment company (1993-present)
No. of Portfolios for which Board Member Serves: 59
———————
Benaree Pratt Wiley (72)
Board Member (1998)
Principal Occupation During Past 5 Years:
· Principal, The Wiley Group, a firm specializing in strategy and business development (2005-present)
Other Public Company Board Memberships During Past 5 Years:
· CBIZ (formerly, Century Business Services, Inc.), a provider of outsourcing functions for small and medium size companies, Director (2008-present)
No. of Portfolios for which Board Member Serves: 80
———————
Once elected all Board Members serve for an indefinite term, but achieve Emeritus status upon reaching age 80. The address of the Board Members and Officers is c/o The Dreyfus Corporation, 200 Park Avenue, New York, New York 10166. Additional information about the Board Members is available in the fund’s Statement of Additional Information which can be obtained from Dreyfus free of charge by calling this toll free number: 1-800-DREYFUS.
James M. Fitzgibbons, Emeritus Board Member
55
OFFICERS OF THE FUND (Unaudited)
BRADLEY J. SKAPYAK, President since January 2010.
Chief Operating Officer and a director of the Manager since June 2009, Chairman of Dreyfus Transfer, Inc., an affiliate of the Manager and the transfer agent of the funds, since May 2011 and Chief Executive Officer of MBSC Securities Corporation since August 2016. He is an officer of 62 investment companies (comprised of 125 portfolios) managed by the Manager. He is 59 years old and has been an employee of the Manager since February 1988.
BENNETT A. MACDOUGALL, Chief Legal Officer since October 2015.
Chief Legal Officer of the Manager and Associate General Counsel and Managing Director of BNY Mellon since June 2015; from June 2005 to June 2015, he served in various capacities with Deutsche Bank – Asset & Wealth Management Division, including as Director and Associate General Counsel, and Chief Legal Officer of Deutsche Investment Management Americas Inc. from June 2012 to May 2015. He is an officer of 63 investment companies (comprised of 150 portfolios) managed by the Manager. He is 46 years old and has been an employee of the Manager since June 2015.
JAMES BITETTO, Vice President since August 2005 and Secretary since February 2018.
Managing Counsel of BNY Mellon and Secretary of the Manager, and an officer of 63 investment companies (comprised of 150 portfolios) managed by the Manager. He is 52 years old and has been an employee of the Manager since December 1996.
JOSEPH M. CHIOFFI, Vice President and Assistant Secretary since August 2005.
Managing Counsel of BNY Mellon, and an officer of 63 investment companies (comprised of 150 portfolios) managed by the Manager. He is 56 years old and has been an employee of the Manager since June 2000.
SONALEE CROSS, Vice President and Assistant Secretary since March 2018.
Counsel of BNY Mellon since October 2016; Associate at Proskauer Rose LLP from April 2016 to September 2016; Attorney at EnTrust Capital from August 2015 to February 2016; Associate at Sidley Austin LLP from September 2013 until August 2015. She is an officer of 63 investment companies (comprised of 150 portfolios) managed by Dreyfus. She is 30 years old and has been an employee of the Manager since October 2016.
MAUREEN E. KANE, Vice President and Assistant Secretary since April 2015.
Managing Counsel of BNY Mellon since July 2014; from October 2004 until July 2014, General Counsel, and from May 2009 until July 2014, Chief Compliance Officer of Century Capital Management. She is an officer of 63 investment companies (comprised of 150 portfolios) managed by the Manager. She is 56 years old and has been an employee of the Manager since July 2014.
SARAH S. KELLEHER, Vice President and Assistant Secretary since April 2014.
Managing Counsel of BNY Mellon. She is an officer of 63 investment companies (comprised of 150 portfolios) managed by the Manager. She is 42 years old and has been an employee of the Manager since March 2013.
JEFF PRUSNOFSKY, Vice President and Assistant Secretary since August 2005.
Senior Managing Counsel of BNY Mellon, and an officer of 63 investment companies (comprised of 150 portfolios) managed by the Manager. He is 53 years old and has been an employee of the Manager since October 1990.
NATALYA ZELENSKY, Vice President and Assistant Secretary since March 2017.
Counsel of BNY Mellon since May 2016; Attorney at Wildermuth Endowment Strategy Fund/Wildermuth Advisory, LLC from November 2015 until May 2016; Assistant General Counsel at RCS Advisory Services from July 2014 until November 2015; Associate at Sutherland, Asbill & Brennan from January 2013 until January 2014. She is an officer of 63 investment companies (comprised of 150 portfolios) managed by Dreyfus. She is 33 years old and has been an employee of the Manager since May 2016.
JAMES WINDELS, Treasurer since November 2001.
Director – Mutual Fund Accounting of the Manager, and an officer of 63 investment companies (comprised of 150 portfolios) managed by the Manager. He is 59 years old and has been an employee of the Manager since April 1985.
RICHARD CASSARO, Assistant Treasurer since January 2008.
Senior Accounting Manager – Money Market and Municipal Bond Funds of the Manager, and an officer of 63 investment companies (comprised of 150 portfolios) managed by the Manager. He is 59 years old and has been an employee of the Manager since September 1982.
56
GAVIN C. REILLY, Assistant Treasurer since December 2005.
Tax Manager of the Investment Accounting and Support Department of the Manager, and an officer of 63 investment companies (comprised of 150 portfolios) managed by the Manager. He is 50 years old and has been an employee of the Manager since April 1991.
ROBERT S. ROBOL, Assistant Treasurer since August 2003.
Senior Accounting Manager – Dreyfus Financial Reporting of the Manager, and an officer of 63 investment companies (comprised of 150 portfolios) managed by the Manager. He is 54 years old and has been an employee of the Manager since October 1988.
ROBERT SALVIOLO, Assistant Treasurer since July 2007.
Senior Accounting Manager – Equity Funds of the Manager, and an officer of 63 investment companies (comprised of 150 portfolios) managed by the Manager. He is 51 years old and has been an employee of the Manager since June 1989.
ROBERT SVAGNA, Assistant Treasurer since August 2005.
Senior Accounting Manager – Fixed Income and Equity Funds of the Manager, and an officer of 63 investment companies (comprised of 150 portfolios) managed by the Manager. He is 51 years old and has been an employee of the Manager since November 1990.
JOSEPH W. CONNOLLY, Chief Compliance Officer since October 2004.
Chief Compliance Officer of the Manager, the Dreyfus Family of Funds and BNY Mellon Funds Trust (63 investment companies, comprised of 150 portfolios). He is 61 years old and has served in various capacities with the Manager since 1980, including manager of the firm’s Fund Accounting Department from 1997 through October 2001.
CARIDAD M. CAROSELLA, Anti-Money Laundering Compliance Officer since January 2016.
Anti-Money Laundering Compliance Officer of the Dreyfus Family of Funds and BNY Mellon Funds Trust since January 2016; from May 2015 to December 2015, Interim Anti-Money Laundering Compliance Officer of the Dreyfus Family of Funds and BNY Mellon Funds Trust and the Distributor; from January 2012 to May 2015, AML Surveillance Officer of the Distributor and from 2007 to December 2011, Financial Processing Manager of the Distributor. She is an officer of 57 investment companies (comprised of 144 portfolios) managed by the Manager. She is 50 years old and has been an employee of the Distributor since 1997.
57
Dreyfus Floating Rate Income Fund
200 Park Avenue
New York, NY 10166
Manager
The Dreyfus Corporation
200 Park Avenue
New York, NY 10166
Sub-Investment Adviser
Alcentra NY, LLC
200 Park Avenue
New York, NY 10166
Custodian
The Bank of New York Mellon
240 Greenwich Street
New York, NY 10286
Transfer Agent &
Dividend Disbursing Agent
Dreyfus Transfer, Inc.
200 Park Avenue
New York, NY 10166
Distributor
MBSC Securities Corporation
200 Park Avenue
New York, NY 10166
| | |
Ticker Symbols: | Class A: DFLAX Class C: DFLCX Class I: DFLIX Class Y: DFLYX |
Telephone Call your financial representative or 1-800-DREYFUS
Mail The Dreyfus Family of Funds, 144 Glenn Curtiss Boulevard, Uniondale, NY 11556-0144
E-mail Send your request to info@dreyfus.com
Internet Information can be viewed online or downloaded at www.dreyfus.com
The fund files its complete schedule of portfolio holdings with the Securities and Exchange Commission (“SEC”) for the first and third quarters of each fiscal year on Form N-Q. The fund’s Forms N-Q are available on the SEC’s website at www.sec.gov and may be reviewed and copied at the SEC’s Public Reference Room in Washington, D.C. (phone 1-800-SEC-0330 for information).
A description of the policies and procedures that the fund uses to determine how to vote proxies relating to portfolio securities and information regarding how the fund voted these proxies for the most recent 12-month period ended June 30 is available at www.dreyfus.com and on the SEC’s website at www.sec.gov and without charge, upon request, by calling 1-800-DREYFUS.
| | |
© 2018 MBSC Securities Corporation
6240AR0818 | 
|