UNITED STATES
SECURITIES AND EXCHANGE COMMISSION
Washington, D.C. 20549
FORM N-CSR
CERTIFIED SHAREHOLDER REPORT OF REGISTERED MANAGEMENT
INVESTMENT COMPANIES
Investment Company Act file number | 811-05202 |
| |
| The Dreyfus/Laurel Funds, Inc. | |
| (Exact name of Registrant as specified in charter) | |
| | |
| c/o The Dreyfus Corporation 200 Park Avenue New York, New York 10166 | |
| (Address of principal executive offices) (Zip code) | |
| | |
| Bennett A. MacDougall, Esq. 200 Park Avenue New York, New York 10166 | |
| (Name and address of agent for service) | |
|
Registrant's telephone number, including area code: | (212) 922-6400 |
| |
Date of fiscal year end: | 10/31 | |
Date of reporting period: | 10/31/18 | |
| | | | | | | |
The following N-CSR relates only to the Registrant's series listed below and does not relate to any series of the Registrant with a different fiscal year end and, therefore, different N-CSR reporting requirements. A separate N-CSR will be filed for any series with a different fiscal year end, as appropriate.
Dreyfus Bond Market Index Fund
Dreyfus Disciplined Stock Fund
Dreyfus Institutional S&P 200 Stock Index Fund
Dreyfus Tax Managed Growth Fund
Dreyfus Unconstrained Bond Fund
FORM N-CSR
Item 1. Reports to Stockholders.
Dreyfus Bond Market Index Fund
| | | |

| | ANNUAL REPORT October 31, 2018 |
| |
Save time. Save paper. View your next shareholder report online as soon as it’s available. Log into www.dreyfus.com and sign up for Dreyfus eCommunications. It’s simple and only takes a few minutes. |
| |
The views expressed in this report reflect those of the portfolio manager(s) only through the end of the period covered and do not necessarily represent the views of Dreyfus or any other person in the Dreyfus organization. Any such views are subject to change at any time based upon market or other conditions and Dreyfus disclaims any responsibility to update such views. These views may not be relied on as investment advice and, because investment decisions for a Dreyfus fund are based on numerous factors, may not be relied on as an indication of trading intent on behalf of any Dreyfus fund. |
| |
Not FDIC-Insured • Not Bank-Guaranteed • May Lose Value |
Contents
THE FUND
FOR MORE INFORMATION
Back Cover
| | | | |
| |
Dreyfus Bond Market Index Fund
| | The Fund |
A LETTER FROM THE PRESIDENT OF DREYFUS
Dear Shareholder:
We are pleased to present this annual report for Dreyfus Bond Market Index Fund, covering the 12-month period from November 1, 2017 through October 31, 2018. For information about how the fund performed during the reporting period, as well as general market perspectives, we provide a Discussion of Fund Performance on the pages that follow.
Markets began the reporting period on solid footing as major global economies experienced above-trend growth across the board. In the United States, the Federal Reserve continued to move away from its accommodative monetary policy while other major central banks also began to consider monetary tightening. In the equity markets, both U.S. and non-U.S. markets enjoyed an upward trend, though investor concerns about volatility and inflation later began to weigh on returns. Interest rates rose across the curve, putting pressure on bond prices.
Later in the reporting period, global growth trends began to diverge. While a strong economic performance continued to bolster U.S. equity markets, slower growth and political concerns pressured markets in the Eurozone. Emerging markets also came under pressure as weakness in their currencies added to investors’ uneasiness. Fixed income markets continued to struggle as interest rates rose; the yield on the benchmark 10-year Treasury bond surged late in the reporting period, but growing investor concerns about global growth helped keep it from rising further.
Despite continuing doubts regarding trade, U.S. inflationary pressures, and global growth, we are optimistic that the U.S. economy will remain strong in the near term. However, we will stay attentive to signs that signal potential changes on the horizon. As always, we encourage you to discuss the risks and opportunities of today’s investment environment with your financial advisor.
Thank you for your continued confidence and support.
Sincerely,

Renee Laroche-Morris
President
The Dreyfus Corporation
November 15, 2018
2
DISCUSSION OF FUND PERFORMANCE (Unaudited)
For the period from November 1, 2017 through October 31, 2018, as provided by Nancy G. Rogers, CFA, Paul Benson, CFA, and Stephanie Shu, CFA, Portfolio Managers
Market and Fund Performance Overview
For the 12-month period ended October 31, 2018, Dreyfus Bond Market Index Fund’s Class I shares produced a total return of -2.27%, and its Investor shares produced a total return of -2.42%.1 In comparison, the Bloomberg Barclays U.S. Aggregate Bond Index (the ��Index”) achieved a total return of -2.05% for the same period.2
Investment-grade U.S. fixed-income securities produced negative returns, on average, over the reporting period in an environment of economic growth and rising interest rates. The difference in returns between the fund and the Index was primarily the result of operating expenses that are not reflected in the Index’s results.
The Fund’s Investment Approach
The fund seeks to match the total return of the Index. To pursue its goal, the fund normally invests at least 80% of its net assets, plus any borrowings for investment purposes, in bonds that are included in the Index (or other instruments with similar economic characteristics). To maintain liquidity, the fund may invest up to 20% of its assets in various short-term, fixed-income securities and money market instruments.
The fund’s investments are selected by a “sampling” process, which is a statistical process used to select bonds so that the fund has investment characteristics that closely approximate those of the Index. By using this sampling process, the fund typically will not invest in all of the securities in the Index.
Rising Interest Rates and Volatility Dampened U.S. Bond Returns
In general, investment-grade debt lost varying degrees of value over the period. In late 2017, the U.S. Federal Reserve (the “Fed”) began to unwind its balance sheet through a reduction in purchases of mortgage-backed securities. Longer-term interest rates climbed during this time. Corporate debt soundly outperformed like-duration Treasuries. A shift occurred early in 2018. While the U.S. economy continued to strengthen, other developed countries started to slow. Equity markets corrected, spooked by rising rates and talk of potential changes to trade policies. The volatility caused concern, sparking a flight to quality. Corporate debt gave up some of its earlier return. However, some asset classes, such as corporate high-yield debt, recovered and outperformed during the last half of the period. At the end of the 12 months, despite the strong fundamentals of the broader market, investment-grade corporate debt, depressed by increased volatility from trade disputes and rising rates, lagged in performance.
During the period, the Fed increased rates four times. Each time, an increase of 25 basis points was instituted. Over the 12 months, the interest rates on the 2-, 10-, and 30-year Treasuries rose from 1.61%, 2.37%, and 2.85% on November 1, 2017, to 2.87%, 3.15%, and 3.39%, respectively, on October 31, 2018. While rates across all maturities rose during the period, the yield curve flattened.
3
DISCUSSION OF FUND PERFORMANCE (Unaudited) (continued)
Corporate Bonds Hurt by Trade Uncertainty
Most bond market sectors, including corporate-backed securities, produced negative returns over the reporting period. Corporate bonds experienced some weakness later in the reporting period, when yield differences widened across the market’s credit-quality range, due to rate increases and uncertainty surrounding trade tariffs. These developments more than offset more positive influences, including lower corporate tax rates, rising earnings, and favorable business conditions in the constructive economy. As a result, most industry groups within the corporate bond market—with the notable exception of the energy and communications industries—underperformed broader market averages.
Some asset-backed securities eked out a small positive return during the reporting period, such as commercial mortgage-backed securities (CMBS). They are only a small part of the Index. Mortgage-backed securities have been directional with Treasuries over the period. Their prices have been under pressure due to supply-and-demand dynamics.
Replicating the Index’s Composition
As an index fund, we attempt to match closely the returns of the Index by approximating its composition and credit quality.
We expect additional, short-term interest-rate hikes from the Fed over the remainder of 2018 and into 2019, as monetary policymakers respond to economic growth.
November 15, 2018
1 Total return includes reinvestment of dividends and any capital gains paid. Past performance is no guarantee of future results. Share price, yield, and investment return fluctuate such that upon redemption, fund shares may be worth more or less than their original cost.
2 Source: Lipper Inc. — The Bloomberg Barclays U.S. Aggregate Bond Index is a broad-based flagship benchmark that measures the investment-grade, U.S. dollar-denominated, fixed-rate taxable bond market. The index includes Treasuries, government-related and corporate securities, MBS (agency fixed-rate and hybrid ARM pass-throughs), ABS and CMBS (agency and nonagency). Investors cannot invest directly in any index.
Bonds are subject generally to interest-rate, credit, liquidity, and market risks, to varying degrees, all of which are more fully described in the fund’s prospectus. Generally, all other factors being equal, bond prices are inversely related to interest-rate changes, and rate increases can cause price declines.
Indexing does not attempt to manage market volatility, use defensive strategies, or reduce the effects of any long-term periods of poor index performance. The correlation between fund and index performance may be affected by the fund’s expenses and use of sampling techniques, changes in securities markets, changes in the composition of the index, and the timing of purchases and redemptions of fund shares.
4
FUND PERFORMANCE (Unaudited)
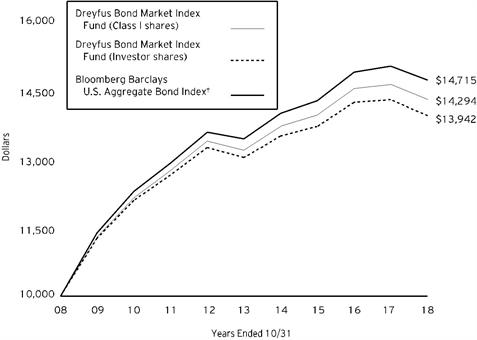
Comparison of change in value of $10,000 investment in Dreyfus Bond Market Index Fund Investor shares and Class I shares and the Bloomberg Barclays U.S. Aggregate Bond Index (the “Index”)
† Source: Lipper Inc.
Past performance is not predictive of future performance.
The above graph compares a $10,000 investment made in each of the Investor and Class I shares of Dreyfus Bond Market Index Fund on 10/31/08 to a $10,000 investment made in the Index on that date. All dividends and capital gain distributions are reinvested.
The fund’s performance shown in the line graph above takes into account all applicable fees and expenses for Class I and Investor shares. The Index is a broad-based flagship benchmark that measures the investment-grade, U.S. dollar-denominated, fixed-rate taxable bond market. The Index includes Treasuries, government-related and corporate securities, MBS (agency fixed-rate and hybrid ARM pass-throughs), ABS and CMBS (agency and nonagency). Unlike a mutual fund, the Index is not subject to charges, fees and other expenses. Investors cannot invest directly in any index. Further information relating to fund performance, including expense reimbursements, if applicable, is contained in the Financial Highlights section of the prospectus and elsewhere in this report.
5
FUND PERFORMANCE (Unaudited) (continued)
| | | | |
Average Annual Total Returns as of 10/31/18 |
| 1 Year | 5 Years | 10 Years |
Class I shares | -2.27% | 1.62% | 3.64% |
Investor shares | -2.42% | 1.37% | 3.38% |
Bloomberg Barclays U.S. Aggregate Bond Index | -2.05% | 1.83% | 3.94% |
The performance data quoted represents past performance, which is no guarantee of future results. Share price and investment return fluctuate and an investor’s shares may be worth more or less than original cost upon redemption. Current performance may be lower or higher than the performance quoted. Go to Dreyfus.com for the fund’s most recent month-end returns.
The fund’s performance shown in the graph and table does not reflect the deduction of taxes that a shareholder would pay on fund distributions or the redemption of fund shares.
6
UNDERSTANDING YOUR FUND’S EXPENSES (Unaudited)
As a mutual fund investor, you pay ongoing expenses, such as management fees and other expenses. Using the information below, you can estimate how these expenses affect your investment and compare them with the expenses of other funds. You also may pay one-time transaction expenses, including sales charges (loads) and redemption fees, which are not shown in this section and would have resulted in higher total expenses. For more information, see your fund’s prospectus or talk to your financial adviser.
Review your fund’s expenses
The table below shows the expenses you would have paid on a $1,000 investment in Dreyfus Bond Market Index Fund from May 1, 2018 to October 31, 2018. It also shows how much a $1,000 investment would be worth at the close of the period, assuming actual returns and expenses.
| | | | | | | | |
Expenses and Value of a $1,000 Investment | | |
assuming actual returns for the six months ended October 31, 2018 | |
| | | | Investor Shares | Class I |
Expenses paid per $1,000† | | | $2.01 | | $.76 |
Ending value (after expenses) | | | $996.60 | | $997.80 |
COMPARING YOUR FUND’S EXPENSES
WITH THOSE OF OTHER FUNDS (Unaudited)
Using the SEC’s method to compare expenses
The Securities and Exchange Commission (“SEC”) has established guidelines to help investors assess fund expenses. Per these guidelines, the table below shows your fund’s expenses based on a $1,000 investment, assuming a hypothetical 5% annualized return. You can use this information to compare the ongoing expenses (but not transaction expenses or total cost) of investing in the fund with those of other funds. All mutual fund shareholder reports will provide this information to help you make this comparison. Please note that you cannot use this information to estimate your actual ending account balance and expenses paid during the period.
| | | | | | | | |
Expenses and Value of a $1,000 Investment | | |
assuming a hypothetical 5% annualized return for the six months ended October 31, 2018 |
| | | | Investor Shares | Class I |
Expenses paid per $1,000† | | | $2.04 | | $.77 |
Ending value (after expenses) | | | $1,023.19 | | $1,024.45 |
† Expenses are equal to the fund’s annualized expense ratio of .40% for Investor shares and .15% for Class I shares, multiplied by the average account value over the period, multiplied by 184/365 (to reflect the one-half year period).
7
STATEMENT OF INVESTMENTS
October 31, 2018
| | | | | | | | | | |
| |
Description | Coupon
Rate (%) | | Maturity
Date | | Principal
Amount ($) | | Value ($) | |
Bonds and Notes - 100.4% | | | | | |
Advertising - .2% | | | | | |
Interpublic Group of Companies,
Sr. Unscd. Notes | | 3.50 | | 10/1/2020 | | 300,000 | | 299,784 | |
Interpublic Group of Companies,
Sr. Unscd. Notes | | 3.75 | | 10/1/2021 | | 300,000 | | 300,063 | |
Interpublic Group of Companies,
Sr. Unscd. Notes | | 4.20 | | 4/15/2024 | | 500,000 | | 497,427 | |
Interpublic Group of Companies,
Sr. Unscd. Notes | | 4.65 | | 10/1/2028 | | 300,000 | | 296,215 | |
Interpublic Group of Companies,
Sr. Unscd. Notes | | 5.40 | | 10/1/2048 | | 300,000 | | 283,514 | |
Omnicom Group,
Sr. Unscd. Notes | | 3.63 | | 5/1/2022 | | 500,000 | | 494,328 | |
WPP Finance 2010,
Gtd. Notes | | 3.75 | | 9/19/2024 | | 350,000 | | 333,854 | |
| | 2,505,185 | |
Aerospace & Defense - .4% | | | | | |
Harris,
Sr. Unscd. Notes | | 5.05 | | 4/27/2045 | | 350,000 | | 361,130 | |
Lockheed Martin,
Sr. Unscd. Bonds | | 3.60 | | 3/1/2035 | | 500,000 | | 453,650 | |
Lockheed Martin,
Sr. Unscd. Notes | | 3.55 | | 1/15/2026 | | 235,000 | | 229,747 | |
Lockheed Martin,
Sr. Unscd. Notes | | 4.07 | | 12/15/2042 | | 500,000 | | 467,117 | |
Northrop Grumman,
Sr. Unscd. Notes | | 3.50 | | 3/15/2021 | | 200,000 | | 200,202 | |
Northrop Grumman,
Sr. Unscd. Notes | | 4.03 | | 10/15/2047 | | 160,000 | | 143,915 | |
Northrop Grumman Systems,
Gtd. Notes | | 7.75 | | 2/15/2031 | | 500,000 | | 653,709 | |
Raytheon,
Sr. Unscd. Debs. | | 7.20 | | 8/15/2027 | | 150,000 | | 185,434 | |
United Technologies,
Sr. Unscd. Notes | | 3.10 | | 6/1/2022 | | 600,000 | | 589,246 | |
United Technologies,
Sr. Unscd. Notes | | 3.13 | | 5/4/2027 | | 110,000 | | 101,368 | |
United Technologies,
Sr. Unscd. Notes | | 3.65 | | 8/16/2023 | | 225,000 | | 222,719 | |
United Technologies,
Sr. Unscd. Notes | | 4.13 | | 11/16/2028 | | 210,000 | | 207,075 | |
United Technologies,
Sr. Unscd. Notes | | 4.50 | | 6/1/2042 | | 380,000 | | 361,492 | |
United Technologies,
Sr. Unscd. Notes | | 4.63 | | 11/16/2048 | | 105,000 | | 101,169 | |
8
| | | | | | | | | | |
| |
Description | Coupon
Rate (%) | | Maturity
Date | | Principal
Amount ($) | | Value ($) | |
Bonds and Notes - 100.4% (continued) | | | | | |
Aerospace & Defense - .4% (continued) | | | | | |
United Technologies,
Sr. Unscd. Notes | | 5.70 | | 4/15/2040 | | 300,000 | | 328,966 | |
United Technologies,
Sr. Unscd. Notes | | 6.70 | | 8/1/2028 | | 50,000 | | 58,689 | |
| | 4,665,628 | |
Agriculture - .3% | | | | | |
Altria Group,
Gtd. Notes | | 2.85 | | 8/9/2022 | | 500,000 | | 486,196 | |
Altria Group,
Gtd. Notes | | 4.25 | | 8/9/2042 | | 500,000 | | 441,612 | |
BAT Capital,
Gtd. Notes | | 2.76 | | 8/15/2022 | | 350,000 | a | 335,340 | |
BAT Capital,
Gtd. Notes | | 3.22 | | 8/15/2024 | | 310,000 | a | 292,944 | |
BAT Capital,
Gtd. Notes | | 3.56 | | 8/15/2027 | | 310,000 | a | 284,778 | |
BAT Capital,
Gtd. Notes | | 4.39 | | 8/15/2037 | | 180,000 | a | 161,131 | |
Philip Morris International,
Sr. Unscd. Notes | | 2.50 | | 8/22/2022 | | 600,000 | | 576,404 | |
Philip Morris International,
Sr. Unscd. Notes | | 4.50 | | 3/20/2042 | | 650,000 | | 612,038 | |
Reynolds American,
Gtd. Notes | | 5.70 | | 8/15/2035 | | 240,000 | | 247,015 | |
| | 3,437,458 | |
Airlines - .1% | | | | | |
American Airlines,
Scd. Notes, Ser. AA | | 3.58 | | 7/15/2029 | | 492,885 | | 477,723 | |
United Airlines,
Pass Thru Certs., Ser. 2013-1, Cl. A | | 4.30 | | 8/15/2025 | | 802,487 | | 816,618 | |
| | 1,294,341 | |
Asset-Backed Ctfs./Auto Receivables - .3% | | | | | |
BMW Vehicle Owner Trust,
Ser. 2018-A | | 2.51 | | 6/25/2024 | | 1,000,000 | | 982,181 | |
GM Financial Automobile Leasing,
Ser. 2018-A, Cl. A3 | | 2.61 | | 1/20/2021 | | 500,000 | | 497,159 | |
Nissan Auto Receivables Owner Trust,
Ser. 2017-B, Cl. A3 | | 1.75 | | 10/15/2021 | | 1,000,000 | | 985,553 | |
Toyota Auto Receivables Owner Trust,
Ser. 2016-C, Cl. A4 | | 1.32 | | 11/15/2021 | | 1,000,000 | | 979,671 | |
| | 3,444,564 | |
Asset-Backed Ctfs./Credit Cards - .3% | | | | | |
Capital One Multi-Asset Execution Trust,
Ser. 2017-A3, Cl. A3 | | 2.43 | | 1/15/2025 | | 280,000 | | 273,054 | |
9
STATEMENT OF INVESTMENTS (continued)
| | | | | | | | | | |
| |
Description | Coupon
Rate (%) | | Maturity
Date | | Principal
Amount ($) | | Value ($) | |
Bonds and Notes - 100.4% (continued) | | | | | |
Asset-Backed Ctfs./Credit Cards - .3% (continued) | | | | | |
Capital One Multi-Asset Execution Trust,
Ser. 2017-A4, Cl. A4 | | 1.99 | | 7/17/2023 | | 500,000 | | 489,345 | |
Chase Issuance Trust,
Ser. 2017-A4, Cl. A4 | | 1.84 | | 4/15/2022 | | 500,000 | | 491,163 | |
Citibank Credit Card Issuance Trust,
Ser. 2014-A5, Cl. A5 | | 2.68 | | 6/7/2023 | | 500,000 | | 492,864 | |
Discover Card Execution Note Trust,
Ser. 2017-A2, Cl. A2 | | 2.39 | | 7/15/2024 | | 1,250,000 | | 1,217,204 | |
| | 2,963,630 | |
Automobiles & Components - .5% | | | | | |
American Honda Finance,
Sr. Unscd. Bonds, Ser. A | | 2.15 | | 3/13/2020 | | 350,000 | | 345,104 | |
Aptiv,
Gtd. Notes | | 4.25 | | 1/15/2026 | | 400,000 | | 393,263 | |
BorgWarner,
Sr. Unscd. Notes | | 3.38 | | 3/15/2025 | | 500,000 | | 479,614 | |
Daimler Finance North America,
Gtd. Notes | | 8.50 | | 1/18/2031 | | 200,000 | | 273,111 | |
Ford Motor,
Sr. Unscd. Bonds | | 6.63 | | 10/1/2028 | | 400,000 | | 410,553 | |
Ford Motor,
Sr. Unscd. Notes | | 5.29 | | 12/8/2046 | | 160,000 | | 134,444 | |
Ford Motor Credit,
Sr. Unscd. Notes | | 3.20 | | 1/15/2021 | | 750,000 | | 732,287 | |
Ford Motor Credit,
Sr. Unscd. Notes | | 4.38 | | 8/6/2023 | | 400,000 | | 389,734 | |
Ford Motor Credit,
Sr. Unscd. Notes | | 8.13 | | 1/15/2020 | | 571,000 | | 598,621 | |
General Motors,
Sr. Unscd. Notes | | 4.20 | | 10/1/2027 | | 180,000 | | 164,830 | |
General Motors,
Sr. Unscd. Notes | | 5.15 | | 4/1/2038 | | 90,000 | | 79,757 | |
General Motors,
Sr. Unscd. Notes | | 5.20 | | 4/1/2045 | | 340,000 | | 296,161 | |
General Motors Financial,
Gtd. Notes | | 3.20 | | 7/13/2020 | | 500,000 | | 495,875 | |
General Motors Financial,
Gtd. Notes | | 4.30 | | 7/13/2025 | | 500,000 | | 478,925 | |
Toyota Motor,
Sr. Unscd. Bonds | | 3.67 | | 7/20/2028 | | 200,000 | b | 195,656 | |
Toyota Motor Credit,
Sr. Unscd. Notes | | 2.15 | | 3/12/2020 | | 500,000 | | 494,567 | |
Toyota Motor Credit,
Sr. Unscd. Notes | | 2.63 | | 1/10/2023 | | 500,000 | | 482,891 | |
| | 6,445,393 | |
10
| | | | | | | | | | |
| |
Description | Coupon
Rate (%) | | Maturity
Date | | Principal
Amount ($) | | Value ($) | |
Bonds and Notes - 100.4% (continued) | | | | | |
Banks - 6.5% | | | | | |
Australia & New Zealand Banking Group,
Sr. Unscd. Notes | | 2.30 | | 6/1/2021 | | 350,000 | | 339,321 | |
Banco Santander,
Sr. Unscd. Notes | | 3.80 | | 2/23/2028 | | 400,000 | | 356,128 | |
Bank of America,
Sr. Unscd. Bonds | | 2.63 | | 4/19/2021 | | 610,000 | | 598,814 | |
Bank of America,
Sr. Unscd. Notes | | 2.37 | | 7/21/2021 | | 500,000 | | 490,544 | |
Bank of America,
Sr. Unscd. Notes | | 3.00 | | 12/20/2023 | | 744,000 | | 716,749 | |
Bank of America,
Sr. Unscd. Notes | | 3.50 | | 4/19/2026 | | 1,030,000 | | 980,853 | |
Bank of America,
Sr. Unscd. Notes | | 3.82 | | 1/20/2028 | | 310,000 | | 297,520 | |
Bank of America,
Sr. Unscd. Notes | | 3.86 | | 7/23/2024 | | 150,000 | | 149,020 | |
Bank of America,
Sr. Unscd. Notes | | 3.95 | | 1/23/2049 | | 75,000 | | 65,853 | |
Bank of America,
Sr. Unscd. Notes | | 3.97 | | 3/5/2029 | | 150,000 | | 144,589 | |
Bank of America,
Sr. Unscd. Notes | | 4.13 | | 1/22/2024 | | 500,000 | | 503,335 | |
Bank of America,
Sr. Unscd. Notes | | 4.24 | | 4/24/2038 | | 160,000 | | 151,148 | |
Bank of America,
Sr. Unscd. Notes | | 4.27 | | 7/23/2029 | | 180,000 | | 177,735 | |
Bank of America,
Sr. Unscd. Notes | | 5.00 | | 1/21/2044 | | 500,000 | | 512,386 | |
Bank of America,
Sr. Unscd. Notes | | 5.63 | | 7/1/2020 | | 800,000 | | 830,391 | |
Bank of America,
Sub. Notes, Ser. L | | 4.18 | | 11/25/2027 | | 500,000 | | 481,072 | |
Bank of Montreal,
Sr. Unscd. Notes | | 2.10 | | 12/12/2019 | | 500,000 | | 494,559 | |
Bank of Nova Scotia,
Sr. Unscd. Notes | | 2.80 | | 7/21/2021 | | 600,000 | | 590,345 | |
Bank of Nova Scotia,
Sub. Notes | | 4.50 | | 12/16/2025 | | 500,000 | | 495,149 | |
Barclays,
Sr. Unscd. Notes | | 3.20 | | 8/10/2021 | | 500,000 | | 489,319 | |
Barclays,
Sr. Unscd. Notes | | 4.34 | | 1/10/2028 | | 200,000 | | 186,869 | |
Barclays,
Sr. Unscd. Notes | | 4.38 | | 1/12/2026 | | 200,000 | | 192,157 | |
Barclays Bank,
Sub. Notes | | 5.14 | | 10/14/2020 | | 500,000 | | 511,405 | |
11
STATEMENT OF INVESTMENTS (continued)
| | | | | | | | | | |
| |
Description | Coupon
Rate (%) | | Maturity
Date | | Principal
Amount ($) | | Value ($) | |
Bonds and Notes - 100.4% (continued) | | | | | |
Banks - 6.5% (continued) | | | | | |
BB&T,
Sr. Unscd. Notes | | 2.45 | | 1/15/2020 | | 1,000,000 | | 991,219 | |
BB&T,
Sr. Unscd. Notes | | 3.70 | | 6/5/2025 | | 300,000 | | 297,107 | |
BNP Paribas,
Gtd. Notes | | 5.00 | | 1/15/2021 | | 500,000 | | 516,076 | |
BPCE,
Gtd. Notes | | 4.00 | | 4/15/2024 | | 200,000 | | 200,393 | |
Capital One Financial,
Sr. Unscd. Notes | | 4.75 | | 7/15/2021 | | 300,000 | | 308,917 | |
Capital One Financial,
Sub. Notes | | 3.75 | | 7/28/2026 | | 750,000 | | 691,063 | |
Citigroup,
Sr. Unscd. Bonds | | 2.90 | | 12/8/2021 | | 500,000 | | 488,806 | |
Citigroup,
Sr. Unscd. Bonds | | 4.28 | | 4/24/2048 | | 480,000 | b | 441,661 | |
Citigroup,
Sr. Unscd. Notes | | 2.40 | | 2/18/2020 | | 250,000 | | 247,336 | |
Citigroup,
Sr. Unscd. Notes | | 2.65 | | 10/26/2020 | | 1,250,000 | | 1,231,498 | |
Citigroup,
Sr. Unscd. Notes | | 2.88 | | 7/24/2023 | | 500,000 | | 481,213 | |
Citigroup,
Sr. Unscd. Notes | | 3.67 | | 7/24/2028 | | 500,000 | | 469,326 | |
Citigroup,
Sr. Unscd. Notes | | 3.88 | | 1/24/2039 | | 60,000 | | 53,343 | |
Citigroup,
Sr. Unscd. Notes | | 4.08 | | 4/23/2029 | | 100,000 | | 96,566 | |
Citigroup,
Sr. Unscd. Notes | | 4.65 | | 7/23/2048 | | 150,000 | | 145,520 | |
Citigroup,
Sr. Unscd. Notes | | 4.65 | | 7/30/2045 | | 350,000 | | 335,965 | |
Citigroup,
Sr. Unscd. Notes | | 5.88 | | 1/30/2042 | | 400,000 | | 453,357 | |
Citigroup,
Sr. Unscd. Notes | | 6.63 | | 1/15/2028 | | 100,000 | | 114,034 | |
Citigroup,
Sub. Notes | | 4.05 | | 7/30/2022 | | 250,000 | | 251,308 | |
Citigroup,
Sub. Notes | | 5.50 | | 9/13/2025 | | 500,000 | | 525,193 | |
Citizens Bank,
Sr. Unscd. Notes | | 2.45 | | 12/4/2019 | | 500,000 | | 496,358 | |
Cooperatieve Rabobank,
Gtd. Notes | | 3.95 | | 11/9/2022 | | 1,000,000 | | 991,606 | |
Cooperatieve Rabobank,
Sr. Unscd. Notes | | 2.50 | | 1/19/2021 | | 400,000 | | 391,406 | |
12
| | | | | | | | | | |
| |
Description | Coupon
Rate (%) | | Maturity
Date | | Principal
Amount ($) | | Value ($) | |
Bonds and Notes - 100.4% (continued) | | | | | |
Banks - 6.5% (continued) | | | | | |
Credit Suisse,
Sr. Unscd. Notes | | 4.38 | | 8/5/2020 | | 1,000,000 | | 1,016,634 | |
Credit Suisse Group Funding,
Gtd. Notes | | 3.75 | | 3/26/2025 | | 500,000 | | 479,314 | |
Credit Suisse Group Funding,
Gtd. Notes | | 4.88 | | 5/15/2045 | | 280,000 | | 274,830 | |
Deutsche Bank,
Sr. Unscd. Notes | | 4.25 | | 10/14/2021 | | 290,000 | | 287,884 | |
Development Bank of Japan,
Sr. Unscd. Notes | | 2.00 | | 10/19/2021 | | 500,000 | | 481,225 | |
Discover Bank,
Sr. Unscd. Notes | | 3.45 | | 7/27/2026 | | 500,000 | | 461,037 | |
Discover Bank,
Sr. Unscd. Notes | | 4.25 | | 3/13/2026 | | 400,000 | | 389,952 | |
Fifth Third Bancorp,
Sr. Unscd. Notes | | 3.50 | | 3/15/2022 | | 600,000 | | 595,463 | |
First Tennessee Bank,
Sr. Unscd. Notes | | 2.95 | | 12/1/2019 | | 500,000 | | 497,750 | |
Goldman Sachs Group,
Sr. Unscd. Bonds | | 4.22 | | 5/1/2029 | | 200,000 | | 194,360 | |
Goldman Sachs Group,
Sr. Unscd. Notes | | 2.35 | | 11/15/2021 | | 500,000 | | 481,493 | |
Goldman Sachs Group,
Sr. Unscd. Notes | | 2.60 | | 4/23/2020 | | 500,000 | | 495,043 | |
Goldman Sachs Group,
Sr. Unscd. Notes | | 2.75 | | 9/15/2020 | | 1,000,000 | | 988,660 | |
Goldman Sachs Group,
Sr. Unscd. Notes | | 3.63 | | 1/22/2023 | | 500,000 | | 494,387 | |
Goldman Sachs Group,
Sr. Unscd. Notes | | 3.75 | | 5/22/2025 | | 1,000,000 | | 969,693 | |
Goldman Sachs Group,
Sr. Unscd. Notes | | 3.81 | | 4/23/2029 | | 150,000 | | 141,067 | |
Goldman Sachs Group,
Sr. Unscd. Notes | | 3.85 | | 1/26/2027 | | 730,000 | | 700,331 | |
Goldman Sachs Group,
Sr. Unscd. Notes | | 4.41 | | 4/23/2039 | | 100,000 | | 94,048 | |
Goldman Sachs Group,
Sr. Unscd. Notes | | 6.25 | | 2/1/2041 | | 700,000 | | 815,296 | |
Goldman Sachs Group,
Sub. Notes | | 4.25 | | 10/21/2025 | | 130,000 | | 126,570 | |
Goldman Sachs Group,
Sub. Notes | | 6.75 | | 10/1/2037 | | 500,000 | | 583,330 | |
HSBC Holdings,
Sr. Unscd. Notes | | 3.40 | | 3/8/2021 | | 600,000 | | 597,266 | |
HSBC Holdings,
Sr. Unscd. Notes | | 3.90 | | 5/25/2026 | | 295,000 | | 283,749 | |
13
STATEMENT OF INVESTMENTS (continued)
| | | | | | | | | | |
| |
Description | Coupon
Rate (%) | | Maturity
Date | | Principal
Amount ($) | | Value ($) | |
Bonds and Notes - 100.4% (continued) | | | | | |
Banks - 6.5% (continued) | | | | | |
HSBC Holdings,
Sr. Unscd. Notes | | 5.10 | | 4/5/2021 | | 750,000 | | 775,992 | |
HSBC Holdings,
Sub. Notes | | 4.25 | | 3/14/2024 | | 500,000 | | 493,831 | |
HSBC Holdings,
Sub. Notes | | 6.50 | | 5/2/2036 | | 850,000 | | 975,671 | |
Industrial & Commercial Bank of China,
Sr. Unscd. Notes | | 2.45 | | 10/20/2021 | | 500,000 | | 479,915 | |
Industrial & Commercial Bank of China,
Sr. Unscd. Notes | | 2.91 | | 11/13/2020 | | 300,000 | | 294,607 | |
ING Groep,
Sr. Unscd. Notes | | 3.15 | | 3/29/2022 | | 300,000 | | 291,994 | |
Intesa Sanpaolo,
Gtd. Bonds | | 5.25 | | 1/12/2024 | | 400,000 | | 385,783 | |
JPMorgan Chase & Co,
Sr. Unscd. Notes | | 3.80 | | 7/23/2024 | | 140,000 | | 139,221 | |
JPMorgan Chase & Co,
Sr. Unscd. Notes | | 4.20 | | 7/23/2029 | | 150,000 | | 147,923 | |
JPMorgan Chase & Co.,
Sr. Unscd. Notes | | 2.25 | | 1/23/2020 | | 1,000,000 | | 988,332 | |
JPMorgan Chase & Co.,
Sr. Unscd. Notes | | 2.40 | | 6/7/2021 | | 1,240,000 | | 1,208,538 | |
JPMorgan Chase & Co.,
Sr. Unscd. Notes | | 2.78 | | 4/25/2023 | | 300,000 | | 290,467 | |
JPMorgan Chase & Co.,
Sr. Unscd. Notes | | 3.09 | | 4/26/2021 | | 300,000 | | 298,918 | |
JPMorgan Chase & Co.,
Sr. Unscd. Notes | | 3.20 | | 1/25/2023 | | 1,000,000 | | 979,483 | |
JPMorgan Chase & Co.,
Sr. Unscd. Notes | | 3.30 | | 4/1/2026 | | 500,000 | | 472,709 | |
JPMorgan Chase & Co.,
Sr. Unscd. Notes | | 3.51 | | 1/23/2029 | | 135,000 | | 126,096 | |
JPMorgan Chase & Co.,
Sr. Unscd. Notes | | 3.90 | | 1/23/2049 | | 105,000 | | 91,597 | |
JPMorgan Chase & Co.,
Sr. Unscd. Notes | | 3.96 | | 11/15/2048 | | 200,000 | | 175,802 | |
JPMorgan Chase & Co.,
Sr. Unscd. Notes | | 4.01 | | 4/23/2029 | | 200,000 | | 194,208 | |
JPMorgan Chase & Co.,
Sr. Unscd. Notes | | 4.25 | | 10/15/2020 | | 500,000 | | 507,852 | |
JPMorgan Chase & Co.,
Sr. Unscd. Notes | | 4.26 | | 2/22/2048 | | 400,000 | | 369,686 | |
JPMorgan Chase & Co.,
Sr. Unscd. Notes | | 6.40 | | 5/15/2038 | | 650,000 | | 782,946 | |
JPMorgan Chase & Co.,
Sub. Notes | | 3.63 | | 12/1/2027 | | 500,000 | | 467,113 | |
14
| | | | | | | | | | |
| |
Description | Coupon
Rate (%) | | Maturity
Date | | Principal
Amount ($) | | Value ($) | |
Bonds and Notes - 100.4% (continued) | | | | | |
Banks - 6.5% (continued) | | | | | |
JPMorgan Chase & Co.,
Sub. Notes | | 3.88 | | 9/10/2024 | | 500,000 | | 491,688 | |
JPMorgan Chase & Co.,
Sub. Notes | | 4.13 | | 12/15/2026 | | 500,000 | | 490,556 | |
KeyBank,
Sr. Unscd. Notes | | 3.30 | | 6/1/2025 | | 400,000 | | 384,573 | |
KeyBank,
Sub. Notes | | 6.95 | | 2/1/2028 | | 100,000 | | 117,727 | |
KFW,
Govt. Gtd. Bonds | | 0.00 | | 6/29/2037 | | 250,000 | c | 129,320 | |
KFW,
Govt. Gtd. Bonds | | 2.13 | | 6/15/2022 | | 320,000 | | 309,200 | |
KFW,
Govt. Gtd. Bonds | | 4.00 | | 1/27/2020 | | 1,000,000 | | 1,013,428 | |
KFW,
Govt. Gtd. Notes | | 1.50 | | 6/15/2021 | | 765,000 | | 735,363 | |
KFW,
Govt. Gtd. Notes | | 1.63 | | 3/15/2021 | | 1,900,000 | | 1,839,260 | |
KFW,
Govt. Gtd. Notes | | 2.00 | | 5/2/2025 | | 1,100,000 | | 1,022,178 | |
KFW,
Govt. Gtd. Notes | | 2.13 | | 3/7/2022 | | 620,000 | b | 600,714 | |
KFW,
Govt. Gtd. Notes | | 2.38 | | 12/29/2022 | | 305,000 | | 295,810 | |
Korea Development Bank,
Sr. Unscd. Notes | | 2.75 | | 3/19/2023 | | 300,000 | | 287,801 | |
Landwirtschaftliche Rentenbank,
Govt. Gtd. Notes | | 2.38 | | 6/10/2025 | | 500,000 | | 474,952 | |
Lloyds Banking Group,
Sr. Unscd. Notes | | 4.55 | | 8/16/2028 | | 500,000 | | 483,682 | |
Llyods Banking Group,
Sub. Notes | | 4.58 | | 12/10/2025 | | 820,000 | | 792,153 | |
Manufacturers & Traders Trust Co.,
Sr. Unscd. Notes | | 2.10 | | 2/6/2020 | | 500,000 | | 493,494 | |
Mitsubishi UFJ Financial Group,
Sr. Unscd. Notes | | 3.00 | | 2/22/2022 | | 500,000 | | 490,310 | |
Mitsubishi UFJ Financial Group,
Sr. Unscd. Notes | | 3.54 | | 7/26/2021 | | 300,000 | | 300,462 | |
Mitsubishi UFJ Financial Group,
Sr. Unscd. Notes | | 3.68 | | 2/22/2027 | | 500,000 | | 482,772 | |
Mitsubishi UFJ Financial Group,
Sr. Unscd. Notes | | 3.76 | | 7/26/2023 | | 300,000 | | 298,666 | |
Mitsubishi UFJ Financial Group,
Sr. Unscd. Notes | | 4.29 | | 7/26/2038 | | 200,000 | | 195,157 | |
Mizuho Financial Group,
Sr. Unscd. Bonds | | 2.27 | | 9/13/2021 | | 500,000 | | 481,339 | |
15
STATEMENT OF INVESTMENTS (continued)
| | | | | | | | | | |
| |
Description | Coupon
Rate (%) | | Maturity
Date | | Principal
Amount ($) | | Value ($) | |
Bonds and Notes - 100.4% (continued) | | | | | |
Banks - 6.5% (continued) | | | | | |
Mizuho Financial Group,
Sr. Unscd. Bonds | | 2.84 | | 9/13/2026 | | 500,000 | | 453,412 | |
Morgan Stanley,
Sr. Unscd. Notes | | 3.13 | | 1/23/2023 | | 150,000 | | 145,307 | |
Morgan Stanley,
Sr. Unscd. Notes | | 3.63 | | 1/20/2027 | | 380,000 | | 359,479 | |
Morgan Stanley,
Sr. Unscd. Notes | | 3.75 | | 2/25/2023 | | 500,000 | | 496,779 | |
Morgan Stanley,
Sr. Unscd. Notes | | 3.77 | | 1/24/2029 | | 180,000 | | 170,793 | |
Morgan Stanley,
Sr. Unscd. Notes | | 4.00 | | 7/23/2025 | | 500,000 | | 491,494 | |
Morgan Stanley,
Sr. Unscd. Notes | | 4.38 | | 1/22/2047 | | 500,000 | | 467,180 | |
Morgan Stanley,
Sr. Unscd. Notes | | 5.50 | | 1/26/2020 | | 1,000,000 | | 1,026,651 | |
Morgan Stanley,
Sr. Unscd. Notes | | 7.25 | | 4/1/2032 | | 300,000 | | 380,208 | |
Morgan Stanley,
Sub. Notes | | 3.95 | | 4/23/2027 | | 500,000 | | 473,281 | |
Morgan Stanley,
Sub. Notes | | 4.10 | | 5/22/2023 | | 500,000 | | 499,962 | |
National Australia Bank,
Sr. Unscd. Bonds | | 2.50 | | 7/12/2026 | | 500,000 | | 446,736 | |
National Australia Bank,
Sr. Unscd. Notes | | 2.63 | | 7/23/2020 | | 260,000 | | 256,842 | |
Northern Trust,
Sub. Notes | | 3.95 | | 10/30/2025 | | 846,000 | | 853,825 | |
Oesterreichische Kontrollbank,
Govt. Gtd. Notes | | 1.50 | | 10/21/2020 | | 500,000 | | 485,461 | |
PNC Bank,
Sr. Unscd. Notes | | 2.60 | | 7/21/2020 | | 500,000 | | 494,100 | |
PNC Bank,
Sr. Unscd. Notes | | 2.63 | | 2/17/2022 | | 500,000 | | 485,483 | |
PNC Bank,
Sub. Notes | | 3.80 | | 7/25/2023 | | 500,000 | | 497,376 | |
Royal Bank of Canada,
Sr. Unscd. Bonds | | 2.15 | | 3/6/2020 | | 750,000 | | 740,723 | |
Royal Bank of Scotland Group,
Sub. Bonds | | 6.13 | | 12/15/2022 | | 300,000 | | 310,639 | |
Royal Bank Scotland Group,
Sr. Unscd. Notes | | 4.80 | | 4/5/2026 | | 500,000 | | 493,689 | |
Santander UK,
Sr. Unscd. Notes | | 2.38 | | 3/16/2020 | | 750,000 | | 740,820 | |
Santander UK Group Holdings,
Sr. Unscd. Notes | | 2.88 | | 10/16/2020 | | 500,000 | | 493,126 | |
16
| | | | | | | | | | |
| |
Description | Coupon
Rate (%) | | Maturity
Date | | Principal
Amount ($) | | Value ($) | |
Bonds and Notes - 100.4% (continued) | | | | | |
Banks - 6.5% (continued) | | | | | |
Skandinaviska Enskilda,
Sr. Unscd. Notes | | 1.88 | | 9/13/2021 | | 250,000 | | 238,153 | |
State Street,
Sr. Unscd. Notes | | 2.55 | | 8/18/2020 | | 310,000 | | 306,834 | |
State Street,
Sr. Unscd. Notes | | 3.55 | | 8/18/2025 | | 290,000 | | 283,563 | |
State Street,
Sr. Unscd. Notes | | 3.70 | | 11/20/2023 | | 250,000 | | 250,051 | |
Sumitomo Mitsui Banking,
Gtd. Bonds | | 3.00 | | 1/18/2023 | | 290,000 | | 281,801 | |
Sumitomo Mitsui Financial Group,
Sr. Unscd. Notes | | 3.45 | | 1/11/2027 | | 160,000 | | 151,639 | |
Sumitomo Mitsui Financial Group,
Sr. Unscd. Notes | | 3.78 | | 3/9/2026 | | 500,000 | | 487,370 | |
SunTrust Bank,
Sr. Unscd. Bonds | | 2.25 | | 1/31/2020 | | 500,000 | | 494,244 | |
SunTrust Bank,
Sr. Unscd. Notes | | 2.75 | | 5/1/2023 | | 500,000 | | 479,376 | |
Toronto-Dominion Bank,
Sr. Unscd. Notes | | 2.50 | | 12/14/2020 | | 500,000 | | 492,452 | |
Toronto-Dominion Bank,
Sr. Unscd. Notes | | 3.00 | | 6/11/2020 | | 500,000 | | 498,617 | |
Toronto-Dominion Bank,
Sr. Unscd. Notes | | 3.50 | | 7/19/2023 | | 350,000 | | 348,658 | |
U.S. Bancorp,
Sr. Unscd. Notes | | 3.00 | | 3/15/2022 | | 900,000 | | 886,430 | |
US Bank,
Sr. Unscd. Notes | | 3.40 | | 7/24/2023 | | 350,000 | | 347,015 | |
Wells Fargo & Co.,
Sr. Unscd. Notes | | 2.10 | | 7/26/2021 | | 620,000 | | 595,459 | |
Wells Fargo & Co.,
Sr. Unscd. Notes | | 3.07 | | 1/24/2023 | | 470,000 | | 455,519 | |
Wells Fargo & Co.,
Sr. Unscd. Notes | | 3.55 | | 9/29/2025 | | 500,000 | | 480,580 | |
Wells Fargo & Co.,
Sub. Notes | | 4.10 | | 6/3/2026 | | 500,000 | | 487,608 | |
Wells Fargo & Co.,
Sub. Notes | | 4.30 | | 7/22/2027 | | 500,000 | | 491,922 | |
Wells Fargo & Co.,
Sub. Notes | | 4.65 | | 11/4/2044 | | 1,000,000 | | 942,669 | |
Wells Fargo & Co.,
Sub. Notes | | 4.75 | | 12/7/2046 | | 500,000 | | 478,060 | |
Wells Fargo & Co.,
Sub. Notes, Ser. M | | 3.45 | | 2/13/2023 | | 500,000 | | 488,852 | |
Wells Fargo Bank,
Sr. Unscd. Notes | | 2.15 | | 12/6/2019 | | 500,000 | | 494,959 | |
17
STATEMENT OF INVESTMENTS (continued)
| | | | | | | | | | |
| |
Description | Coupon
Rate (%) | | Maturity
Date | | Principal
Amount ($) | | Value ($) | |
Bonds and Notes - 100.4% (continued) | | | | | |
Banks - 6.5% (continued) | | | | | |
Wells Fargo Bank,
Sr. Unscd. Notes | | 3.33 | | 7/23/2021 | | 350,000 | | 348,862 | |
Westpac Banking,
Sr. Unscd. Notes | | 2.60 | | 11/23/2020 | | 1,000,000 | | 985,774 | |
Westpac Banking,
Sr. Unscd. Notes | | 2.85 | | 5/13/2026 | | 200,000 | | 183,967 | |
| | 77,817,003 | |
Beverage Products - .6% | | | | | |
Anheuser-Busch InBev Finance,
Gtd. Notes | | 2.63 | | 1/17/2023 | | 500,000 | | 474,029 | |
Anheuser-Busch InBev Finance,
Gtd. Notes | | 2.65 | | 2/1/2021 | | 549,063 | | 538,532 | |
Anheuser-Busch InBev Finance,
Gtd. Notes | | 3.65 | | 2/1/2026 | | 615,000 | | 584,233 | |
Anheuser-Busch InBev Finance,
Gtd. Notes | | 3.70 | | 2/1/2024 | | 500,000 | | 490,668 | |
Anheuser-Busch InBev Finance,
Gtd. Notes | | 4.00 | | 1/17/2043 | | 700,000 | | 591,005 | |
Anheuser-Busch InBev Finance,
Gtd. Notes | | 4.70 | | 2/1/2036 | | 590,000 | | 564,259 | |
Anheuser-Busch InBev Worldwide,
Gtd. Notes | | 4.00 | | 4/13/2028 | | 500,000 | | 480,495 | |
Anheuser-Busch InBev Worldwide,
Gtd. Notes | | 4.60 | | 4/15/2048 | | 500,000 | | 451,876 | |
Coca-Cola,
Sr. Unscd. Notes | | 3.30 | | 9/1/2021 | | 750,000 | | 754,978 | |
Diageo Investment,
Gtd. Notes | | 4.25 | | 5/11/2042 | | 250,000 | | 248,202 | |
Keurig Dr Pepper,
Gtd. Notes | | 4.06 | | 5/25/2023 | | 215,000 | a | 213,929 | |
Molson Coors Brewing,
Gtd. Notes | | 2.10 | | 7/15/2021 | | 500,000 | | 478,983 | |
Molson Coors Brewing,
Gtd. Notes | | 4.20 | | 7/15/2046 | | 150,000 | | 126,871 | |
PepsiCo,
Sr. Unscd. Notes | | 2.15 | | 10/14/2020 | | 810,000 | | 796,264 | |
PepsiCo,
Sr. Unscd. Notes | | 3.50 | | 7/17/2025 | | 500,000 | | 493,854 | |
PepsiCo,
Sr. Unscd. Notes | | 4.45 | | 4/14/2046 | | 210,000 | | 211,565 | |
| | 7,499,743 | |
Building Materials - .0% | | | | | |
Johnson Controls International,
Sr. Unscd. Notes | | 5.13 | | 9/14/2045 | | 100,000 | | 99,529 | |
18
| | | | | | | | | | |
| |
Description | Coupon
Rate (%) | | Maturity
Date | | Principal
Amount ($) | | Value ($) | |
Bonds and Notes - 100.4% (continued) | | | | | |
Building Materials - .0% (continued) | | | | | |
Owens Corning,
Sr. Unscd. Notes | | 7.00 | | 12/1/2036 | | 137,000 | | 153,280 | |
| | 252,809 | |
Chemicals - .3% | | | | | |
Celanese US Holdings,
Gtd. Notes | | 4.63 | | 11/15/2022 | | 350,000 | | 357,347 | |
Dow Chemical,
Sr. Unscd. Notes | | 4.25 | | 11/15/2020 | | 300,000 | | 303,895 | |
E.I. du Pont de Nemours & Co.,
Sr. Unscd. Notes | | 2.80 | | 2/15/2023 | | 250,000 | | 242,254 | |
E.I. du Pont de Nemours & Co.,
Sr. Unscd. Notes | | 4.15 | | 2/15/2043 | | 300,000 | | 269,750 | |
Eastman Chemical,
Sr. Unscd. Notes | | 3.80 | | 3/15/2025 | | 378,000 | | 367,005 | |
LYB International Finance,
Gtd. Notes | | 4.00 | | 7/15/2023 | | 350,000 | | 350,277 | |
Methanex,
Sr. Unscd. Notes | | 3.25 | | 12/15/2019 | | 465,000 | | 462,436 | |
Mosaic,
Sr. Unscd. Notes | | 4.25 | | 11/15/2023 | | 300,000 | | 301,855 | |
Nutrien,
Sr. Unscd. Notes | | 3.63 | | 3/15/2024 | | 500,000 | | 483,116 | |
Nutrien,
Sr. Unscd. Notes | | 5.25 | | 1/15/2045 | | 500,000 | | 495,072 | |
Praxair,
Sr. Unscd. Notes | | 2.45 | | 2/15/2022 | | 400,000 | | 388,199 | |
Sherwin-Williams,
Sr. Unscd. Notes | | 4.50 | | 6/1/2047 | | 100,000 | | 90,147 | |
| | 4,111,353 | |
Commercial & Professional Services - .2% | | | | | |
Cleveland Clinic Foundation,
Unscd. Bonds | | 4.86 | | 1/1/2114 | | 150,000 | | 149,885 | |
Ecolab,
Sr. Unscd. Notes | | 2.70 | | 11/1/2026 | | 250,000 | | 229,122 | |
Ecolab,
Sr. Unscd. Notes | | 4.35 | | 12/8/2021 | | 164,000 | | 168,283 | |
Moody's,
Sr. Unscd. Notes | | 3.25 | | 6/7/2021 | | 250,000 | | 248,664 | |
President & Fellows of Harvard College,
Unscd. Bonds | | 3.15 | | 7/15/2046 | | 750,000 | | 638,238 | |
S&P Global,
Gtd. Notes | | 4.40 | | 2/15/2026 | | 230,000 | | 234,517 | |
Stanford Unversity,
Unscd. Bonds | | 3.65 | | 5/1/2048 | | 30,000 | | 28,030 | |
Total System Services,
Sr. Unscd. Notes | | 4.80 | | 4/1/2026 | | 500,000 | | 510,062 | |
19
STATEMENT OF INVESTMENTS (continued)
| | | | | | | | | | |
| |
Description | Coupon
Rate (%) | | Maturity
Date | | Principal
Amount ($) | | Value ($) | |
Bonds and Notes - 100.4% (continued) | | | | | |
Commercial & Professional Services - .2% (continued) | | | | | |
University of Southern California,
Sr. Unscd. Notes | | 5.25 | | 2/15/2041 | | 40,000 | | 44,620 | |
William Marsh Rice University,
Unscd. Bonds | | 3.57 | | 5/15/2045 | | 250,000 | | 229,377 | |
| | 2,480,798 | |
Commercial Mortgage Pass-Through Ctfs. - 1.9% | | | | | |
CFCRE Commercial Mortgage Trust,
Ser. 2017-C8, Cl. A4 | | 3.57 | | 6/15/2050 | | 500,000 | | 485,898 | |
Citigroup Commercial Mortgage Trust,
Ser. 2014-GC23, Cl. A4 | | 3.62 | | 7/10/2047 | | 1,000,000 | | 995,797 | |
Commercial Mortgage Trust,
Ser. 2013-CR11, Cl. B | | 5.16 | | 10/10/2046 | | 750,000 | | 775,064 | |
Commercial Mortgage Trust,
Ser. 2014-CR16, Cl. A4 | | 4.05 | | 4/10/2047 | | 200,000 | | 203,280 | |
Commercial Mortgage Trust,
Ser. 2016-CR28, Cl. A4 | | 3.76 | | 2/10/2049 | | 1,035,000 | | 1,025,407 | |
Federal Home Loan Mortgage Corp,
Multifamily Structured Pass Through Certificates Ser. K039, Cl. A2 | | 3.30 | | 7/25/2024 | | 1,000,000 | d | 994,857 | |
Federal Home Loan Mortgage Corp.,
Multifamily Structured Pass Through Certificates, Ser. K047, Cl. A | | 3.33 | | 5/25/2025 | | 1,000,000 | d | 991,782 | |
Federal Home Loan Mortgage Corp.,
Multifamily Structured Pass Through Certificates, Ser. K056, Cl. A2 | | 2.53 | | 5/25/2026 | | 1,300,000 | d | 1,212,820 | |
Federal National Mortgage Association,
Ser. 2017-M12, Cl. A2 | | 3.08 | | 6/25/2027 | | 975,000 | d | 929,842 | |
Federal National Mortgage Association,
Ser. 2017-M8, Cl. A1 | | 2.65 | | 5/5/2027 | | 687,302 | d | 670,143 | |
Federal National Mortgage Association,
Ser. 2018-M1, Cl. A2 | | 2.99 | | 12/25/2027 | | 1,000,000 | d | 945,434 | |
Federal National Mortgage Association,
Ser. 2018-M10, Cl. A2 | | 3.39 | | 7/1/2028 | | 750,000 | d | 728,012 | |
GS Mortgage Securities Trust,
Ser. 2014-GC18, Cl. A3 | | 3.80 | | 1/10/2047 | | 500,000 | | 503,606 | |
GS Mortgage Securities Trust,
Ser. 2015-GC28, Cl. AAB | | 3.21 | | 2/10/2048 | | 750,000 | | 742,732 | |
J.P. Morgan Chase Commercial Mortgage Securities Trust,
Ser. 2012-LC9, Cl. A5 | | 2.84 | | 12/15/2047 | | 1,000,000 | | 971,991 | |
JPMBB Commercial Mortgage Securities Trust,
Ser. 2013-C15, Cl. A5 | | 4.13 | | 11/15/2045 | | 500,000 | | 511,948 | |
JPMBB Commercial Mortgage Securities Trust,
Ser. 2014-C24, Cl. A5 | | 3.64 | | 11/15/2047 | | 725,000 | | 719,827 | |
20
| | | | | | | | | | |
| |
Description | Coupon
Rate (%) | | Maturity
Date | | Principal
Amount ($) | | Value ($) | |
Bonds and Notes - 100.4% (continued) | | | | | |
Commercial Mortgage Pass-Through Ctfs. - 1.9% (continued) | | | | | |
JPMBB Commercial Mortgage Securities Trust,
Ser. 2015-C33, Cl. A4 | | 3.77 | | 12/15/2048 | | 2,000,000 | | 1,986,325 | |
Morgan Stanley Bank of America Merrill Lynch Trust,
Ser. 2015-C20, Cl. A4 | | 3.25 | | 2/15/2048 | | 1,175,000 | | 1,136,697 | |
Morgan Stanley Capital I Trust,
Ser. 2012-C4, Cl. AS | | 3.77 | | 3/15/2045 | | 720,000 | | 722,060 | |
SG Commercial Mortgage Securities Trust,
Ser. 2016-C5, Cl. A4 | | 3.06 | | 10/10/2048 | | 2,000,000 | | 1,884,122 | |
UBS-Barclays Commercial Mortgage Trust,
Ser. 2013-C6, Cl. A4 | | 3.24 | | 4/10/2046 | | 1,412,000 | | 1,395,943 | |
Wells Fargo Commercial Mortgage Trust,
Ser. 2017-RC1, Cl. A2 | | 3.12 | | 1/15/2060 | | 500,000 | | 493,565 | |
Wells Fargo Commercial Mortgage Trust,
Ser. 2018-C44 | | 4.21 | | 5/15/2051 | | 900,000 | | 910,524 | |
WF-RBS Commercial Mortgage Trust,
Ser. 2013-C14, Cl. ASB | | 2.98 | | 6/15/2046 | | 472,005 | | 468,359 | |
| | 22,406,035 | |
Consumer Discretionary - .1% | | | | | |
Carnival,
Gtd. Notes | | 3.95 | | 10/15/2020 | | 300,000 | | 303,724 | |
Hasbro,
Sr. Unscd. Notes | | 3.15 | | 5/15/2021 | | 450,000 | | 444,034 | |
Marriott International,
Sr. Unscd. Notes, Ser. N | | 3.13 | | 10/15/2021 | | 600,000 | | 591,966 | |
| | 1,339,724 | |
Consumer Durables & Apparel - .0% | | | | | |
Nike,
Sr. Unscd. Notes | | 2.25 | | 5/1/2023 | | 300,000 | | 284,705 | |
Nike,
Sr. Unscd. Notes | | 3.63 | | 5/1/2043 | | 300,000 | | 267,007 | |
| | 551,712 | |
Consumer Staples - .2% | | | | | |
Church & Dwight Co.,
Sr. Unscd. Notes | | 3.95 | | 8/1/2047 | | 300,000 | | 263,015 | |
Clorox,
Sr. Unscd. Notes | | 3.80 | | 11/15/2021 | | 200,000 | | 202,249 | |
Colgate-Palmolive,
Sr. Unscd. Notes | | 2.45 | | 11/15/2021 | | 500,000 | | 488,992 | |
Newell Rubbermaid,
Sr. Unscd. Notes | | 5.50 | | 4/1/2046 | | 350,000 | | 302,274 | |
21
STATEMENT OF INVESTMENTS (continued)
| | | | | | | | | | |
| |
Description | Coupon
Rate (%) | | Maturity
Date | | Principal
Amount ($) | | Value ($) | |
Bonds and Notes - 100.4% (continued) | | | | | |
Consumer Staples - .2% (continued) | | | | | |
Procter & Gamble,
Sr. Unscd. Notes | | 2.30 | | 2/6/2022 | | 500,000 | | 487,081 | |
Unilever Capital,
Gtd. Notes | | 5.90 | | 11/15/2032 | | 250,000 | | 301,336 | |
| | 2,044,947 | |
Diversified Financials - .6% | | | | | |
Aercap Ireland,
Gtd. Notes | | 3.50 | | 5/26/2022 | | 500,000 | | 487,697 | |
AerCap Ireland Capital,
Gtd. Notes | | 3.95 | | 2/1/2022 | | 500,000 | | 495,359 | |
Affiliated Managers Group,
Sr. Unscd. Notes | | 3.50 | | 8/1/2025 | | 250,000 | | 237,148 | |
Air Lease,
Sr. Unscd. Notes | | 3.75 | | 2/1/2022 | | 100,000 | | 99,513 | |
American Express,
Sub. Notes | | 3.63 | | 12/5/2024 | | 500,000 | | 489,098 | |
Ares Capital,
Sr. Unscd. Notes | | 3.50 | | 2/10/2023 | | 300,000 | | 286,638 | |
Blackrock,
Sr. Unscd. Notes | | 3.50 | | 3/18/2024 | | 250,000 | | 249,441 | |
Blackrock,
Sr. Unscd. Notes, Ser. 2 | | 5.00 | | 12/10/2019 | | 250,000 | | 255,406 | |
CME Group,
Sr. Unscd. Notes | | 3.00 | | 3/15/2025 | | 250,000 | | 238,867 | |
GE Capital International Funding,
Gtd. Notes | | 4.42 | | 11/15/2035 | | 1,000,000 | | 865,511 | |
Intercontinental Exchange,
Gtd. Notes | | 4.00 | | 10/15/2023 | | 350,000 | | 356,584 | |
Intercontinental Exchange,
Sr. Unscd. Notes | | 4.25 | | 9/21/2048 | | 75,000 | | 70,395 | |
Invesco Finance,
Gtd. Notes | | 4.00 | | 1/30/2024 | | 250,000 | | 249,708 | |
Jefferies Group,
Sr. Unscd. Debs. | | 6.45 | | 6/8/2027 | | 35,000 | | 37,187 | |
Jefferies Group,
Sr. Unscd. Notes | | 5.13 | | 1/20/2023 | | 150,000 | | 154,562 | |
Legg Mason,
Sr. Unscd. Notes | | 5.63 | | 1/15/2044 | | 200,000 | | 196,153 | |
Nasdaq,
Sr. Unscd. Notes | | 4.25 | | 6/1/2024 | | 250,000 | | 251,445 | |
Nomura Holdings,
Sr. Unscd. Notes | | 6.70 | | 3/4/2020 | | 350,000 | | 365,053 | |
Synchrony Financial,
Sr. Unscd. Notes | | 4.25 | | 8/15/2024 | | 500,000 | | 475,479 | |
TD Ameritrade Holding,
Sr. Unscd. Notes | | 2.95 | | 4/1/2022 | | 200,000 | | 195,556 | |
22
| | | | | | | | | | |
| |
Description | Coupon
Rate (%) | | Maturity
Date | | Principal
Amount ($) | | Value ($) | |
Bonds and Notes - 100.4% (continued) | | | | | |
Diversified Financials - .6% (continued) | | | | | |
Visa,
Sr. Unscd. Notes | | 2.20 | | 12/14/2020 | | 400,000 | | 391,948 | |
Visa,
Sr. Unscd. Notes | | 3.65 | | 9/15/2047 | | 55,000 | | 49,367 | |
Visa,
Sr. Unscd. Notes | | 4.15 | | 12/14/2035 | | 270,000 | | 270,853 | |
Visa,
Sr. Unscd. Notes | | 4.30 | | 12/14/2045 | | 200,000 | | 198,367 | |
| | 6,967,335 | |
Educational Services - .0% | | | | | |
California Institute of Technology,
Unscd. Bonds | | 4.32 | | 8/1/2045 | | 110,000 | | 110,022 | |
Electronic Components - .2% | | | | | |
Allegion US Holding,
Gtd. Notes | | 3.20 | | 10/1/2024 | | 400,000 | | 370,632 | |
Arrow Electronics,
Sr. Unscd. Notes | | 4.50 | | 3/1/2023 | | 500,000 | | 505,605 | |
Corning,
Sr. Unscd. Notes | | 4.38 | | 11/15/2057 | | 50,000 | | 40,802 | |
Emerson Electric,
Sr. Unscd. Notes | | 2.63 | | 2/15/2023 | | 260,000 | | 250,561 | |
Fortive,
Sr. Unscd. Notes | | 2.35 | | 6/15/2021 | | 250,000 | | 241,905 | |
Keysight Technologies,
Sr. Unscd. Notes | | 3.30 | | 10/30/2019 | | 500,000 | | 499,386 | |
| | 1,908,891 | |
Energy - 2.8% | | | | | |
Anadarko Petroleum,
Sr. Unscd. Notes | | 6.45 | | 9/15/2036 | | 150,000 | | 163,236 | |
Anadarko Petroleum,
Sr. Unscd. Notes | | 6.60 | | 3/15/2046 | | 250,000 | | 277,317 | |
Apache,
Sr. Unscd. Notes | | 6.00 | | 1/15/2037 | | 212,000 | | 224,939 | |
Baker Hughes,
Sr. Unscd. Notes, Ser. WI | | 3.20 | | 8/15/2021 | | 382,000 | | 378,703 | |
BP Capital Markets,
Gtd. Notes | | 2.50 | | 11/6/2022 | | 800,000 | | 768,348 | |
BP Capital Markets,
Gtd. Notes | | 3.25 | | 5/6/2022 | | 700,000 | | 693,398 | |
BP Capital Markets,
Gtd. Notes | | 3.28 | | 9/19/2027 | | 610,000 | | 575,076 | |
BP Capital Markets America,
Gtd. Notes | | 3.80 | | 9/21/2025 | | 300,000 | | 294,324 | |
BP Capital Markets America,
Gtd. Notes | | 3.94 | | 9/21/2028 | | 300,000 | | 296,585 | |
23
STATEMENT OF INVESTMENTS (continued)
| | | | | | | | | | |
| |
Description | Coupon
Rate (%) | | Maturity
Date | | Principal
Amount ($) | | Value ($) | |
Bonds and Notes - 100.4% (continued) | | | | | |
Energy - 2.8% (continued) | | | | | |
Canadian Natural Resources,
Sr. Unscd. Notes | | 3.90 | | 2/1/2025 | | 250,000 | | 243,143 | |
Canadian Natural Resources,
Sr. Unscd. Notes | | 6.25 | | 3/15/2038 | | 200,000 | | 225,955 | |
Cenovus Energy,
Sr. Unscd. Notes | | 4.25 | | 4/15/2027 | | 500,000 | b | 472,278 | |
Chevron,
Sr. Unscd. Notes | | 2.42 | | 11/17/2020 | | 640,000 | | 631,151 | |
Chevron,
Sr. Unscd. Notes | | 2.95 | | 5/16/2026 | | 295,000 | | 278,017 | |
Chevron,
Sr. Unscd. Notes | | 3.33 | | 11/17/2025 | | 165,000 | | 160,232 | |
CNOOC Finance 2013,
Gtd. Notes | | 3.00 | | 5/9/2023 | | 500,000 | | 478,046 | |
Columbia Pipeline Group,
Gtd. Notes | | 3.30 | | 6/1/2020 | | 500,000 | | 498,096 | |
Concho Resources,
Gtd. Notes | | 4.30 | | 8/15/2028 | | 400,000 | | 390,964 | |
Concho Resources,
Gtd. Notes | | 4.85 | | 8/15/2048 | | 250,000 | | 238,386 | |
Concho Resources,
Gtd. Notes | | 4.88 | | 10/1/2047 | | 60,000 | | 56,922 | |
ConocoPhillips,
Gtd. Notes | | 4.95 | | 3/15/2026 | | 150,000 | | 159,391 | |
ConocoPhillips,
Gtd. Notes | | 5.95 | | 3/15/2046 | | 250,000 | | 304,948 | |
ConocoPhillips Holding,
Sr. Unscd. Notes | | 6.95 | | 4/15/2029 | | 125,000 | | 154,277 | |
Devon Energy,
Sr. Unscd. Notes | | 5.85 | | 12/15/2025 | | 71,000 | | 75,592 | |
Ecopetrol,
Sr. Unscd. Notes | | 7.38 | | 9/18/2043 | | 300,000 | | 336,750 | |
Enable Midstream Partners,
Sr. Unscd. Notes | | 5.00 | | 5/15/2044 | | 250,000 | | 217,834 | |
Enbridge,
Sr. Unscd. Notes | | 4.25 | | 12/1/2026 | | 500,000 | | 492,160 | |
Enbridge Energy Partners,
Sr. Unscd. Notes | | 5.50 | | 9/15/2040 | | 370,000 | | 379,811 | |
Enbridge Energy Partners,
Sr. Unscd. Notes | | 5.88 | | 10/15/2025 | | 250,000 | | 272,433 | |
Energy Transfer Partners,
Gtd. Notes | | 5.15 | | 2/1/2043 | | 500,000 | | 442,186 | |
Enterprise Products,
Gtd. Notes | | 4.25 | | 2/15/2048 | | 75,000 | | 66,556 | |
Enterprise Products Operating,
Gtd. Notes | | 3.35 | | 3/15/2023 | | 600,000 | | 588,134 | |
24
| | | | | | | | | | |
| |
Description | Coupon
Rate (%) | | Maturity
Date | | Principal
Amount ($) | | Value ($) | |
Bonds and Notes - 100.4% (continued) | | | | | |
Energy - 2.8% (continued) | | | | | |
Enterprise Products Operating,
Gtd. Notes | | 3.70 | | 2/15/2026 | | 200,000 | | 193,345 | |
Enterprise Products Operating,
Gtd. Notes | | 4.90 | | 5/15/2046 | | 500,000 | | 487,088 | |
EOG Resources,
Sr. Unscd. Notes | | 3.90 | | 4/1/2035 | | 400,000 | | 375,445 | |
Exxon Mobil,
Sr. Unscd. Notes | | 2.22 | | 3/1/2021 | | 500,000 | | 488,689 | |
Exxon Mobil,
Sr. Unscd. Notes | | 4.11 | | 3/1/2046 | | 500,000 | | 483,455 | |
Halliburton,
Sr. Unscd. Bonds | | 3.80 | | 11/15/2025 | | 415,000 | | 404,352 | |
Hess,
Sr. Unscd. Notes | | 4.30 | | 4/1/2027 | | 250,000 | | 235,530 | |
Hess,
Sr. Unscd. Notes | | 5.60 | | 2/15/2041 | | 250,000 | | 239,639 | |
HollyFrontier,
Sr. Unscd. Bonds | | 5.88 | | 4/1/2026 | | 480,000 | | 501,861 | |
Kerr-McGee,
Gtd. Notes | | 6.95 | | 7/1/2024 | | 300,000 | | 336,244 | |
Kinder Morgan,
Gtd. Notes | | 4.30 | | 3/1/2028 | | 500,000 | | 484,304 | |
Kinder Morgan Energy Partner,
Gtd. Notes | | 5.00 | | 10/1/2021 | | 300,000 | | 309,558 | |
Kinder Morgan Energy Partners,
Gtd. Notes | | 3.50 | | 9/1/2023 | | 500,000 | | 486,895 | |
Kinder Morgan Energy Partners,
Gtd. Notes | | 5.00 | | 3/1/2043 | | 300,000 | | 277,144 | |
Kinder Morgan Energy Partners,
Gtd. Notes | | 7.40 | | 3/15/2031 | | 350,000 | | 402,159 | |
Marathon Oil,
Sr. Unscd. Notes | | 6.60 | | 10/1/2037 | | 300,000 | | 341,536 | |
Marathon Petroleum,
Sr. Unscd. Notes | | 4.75 | | 9/15/2044 | | 500,000 | | 460,232 | |
MPLX,
Sr. Unscd. Notes | | 4.50 | | 4/15/2038 | | 105,000 | | 93,838 | |
MPLX,
Sr. Unscd. Notes | | 4.88 | | 12/1/2024 | | 500,000 | | 512,685 | |
MPLX,
Sr. Unscd. Notes | | 4.90 | | 4/15/2058 | | 115,000 | | 100,764 | |
MPLX,
Sr. Unscd. Notes | | 5.20 | | 3/1/2047 | | 130,000 | | 123,357 | |
Nexen Energy,
Gtd. Notes | | 5.88 | | 3/10/2035 | | 125,000 | | 139,562 | |
Noble Energy,
Sr. Unscd. Notes | | 3.90 | | 11/15/2024 | | 500,000 | | 486,649 | |
25
STATEMENT OF INVESTMENTS (continued)
| | | | | | | | | | |
| |
Description | Coupon
Rate (%) | | Maturity
Date | | Principal
Amount ($) | | Value ($) | |
Bonds and Notes - 100.4% (continued) | | | | | |
Energy - 2.8% (continued) | | | | | |
Noble Energy,
Sr. Unscd. Notes | | 4.15 | | 12/15/2021 | | 539,000 | | 543,260 | |
Occidental Petroleum,
Sr. Unscd. Bonds | | 3.00 | | 2/15/2027 | | 300,000 | | 281,495 | |
Occidental Petroleum,
Sr. Unscd. Notes | | 4.10 | | 2/15/2047 | | 310,000 | | 285,542 | |
Occidental Petroleum,
Sr. Unscd. Notes, Ser. 1 | | 4.10 | | 2/1/2021 | | 400,000 | | 405,674 | |
ONEOK,
Gtd. Notes | | 4.00 | | 7/13/2027 | | 300,000 | | 288,157 | |
ONEOK Partners,
Gtd. Notes | | 5.00 | | 9/15/2023 | | 500,000 | | 515,403 | |
ONEOK Partners,
Gtd. Notes | | 6.85 | | 10/15/2037 | | 60,000 | | 68,081 | |
Petroleos Mexicanos,
Gtd. Bonds | | 5.50 | | 6/27/2044 | | 500,000 | | 387,950 | |
Petroleos Mexicanos,
Gtd. Notes | | 4.88 | | 1/18/2024 | | 500,000 | | 476,905 | |
Petroleos Mexicanos,
Gtd. Notes | | 5.35 | | 2/12/2028 | | 195,000 | a | 174,213 | |
Petroleos Mexicanos,
Gtd. Notes | | 6.00 | | 3/5/2020 | | 500,000 | | 507,495 | |
Petroleos Mexicanos,
Gtd. Notes | | 6.35 | | 2/12/2048 | | 500,000 | a | 416,950 | |
Petroleos Mexicanos,
Gtd. Notes | | 6.50 | | 3/13/2027 | | 570,000 | | 553,755 | |
Petroleos Mexicanos,
Gtd. Notes | | 6.75 | | 9/21/2047 | | 400,000 | | 345,560 | |
Phillips 66,
Gtd. Notes | | 4.88 | | 11/15/2044 | | 202,000 | | 196,685 | |
Pioneer Natural Resources,
Sr. Unscd. Notes | | 3.95 | | 7/15/2022 | | 500,000 | | 501,192 | |
Plains All American Pipeline,
Sr. Unscd. Notes | | 3.85 | | 10/15/2023 | | 300,000 | | 291,974 | |
Plains All American Pipeline,
Sr. Unscd. Notes | | 4.90 | | 2/15/2045 | | 250,000 | | 221,578 | |
Regency Energy Partners,
Gtd. Notes | | 4.50 | | 11/1/2023 | | 750,000 | | 755,960 | |
Sabine Pass Liquefaction,
Sr. Scd. Notes | | 5.00 | | 3/15/2027 | | 600,000 | | 603,238 | |
Sabine Pass Liquefaction,
Sr. Scd. Notes | | 5.63 | | 4/15/2023 | | 300,000 | | 316,144 | |
Shell International Finance,
Gtd. Notes | | 1.88 | | 5/10/2021 | | 485,000 | | 468,834 | |
Shell International Finance,
Gtd. Notes | | 2.88 | | 5/10/2026 | | 185,000 | | 173,092 | |
26
| | | | | | | | | | |
| |
Description | Coupon
Rate (%) | | Maturity
Date | | Principal
Amount ($) | | Value ($) | |
Bonds and Notes - 100.4% (continued) | | | | | |
Energy - 2.8% (continued) | | | | | |
Shell International Finance,
Gtd. Notes | | 3.25 | | 5/11/2025 | | 560,000 | | 540,296 | |
Shell International Finance,
Gtd. Notes | | 4.13 | | 5/11/2035 | | 260,000 | | 253,513 | |
Spectra Energy Partners,
Sr. Unscd. Notes | | 5.95 | | 9/25/2043 | | 200,000 | | 219,415 | |
Statoil,
Gtd. Notes | | 2.65 | | 1/15/2024 | | 500,000 | | 477,232 | |
Suncor Energy,
Sr. Unscd. Notes | | 4.00 | | 11/15/2047 | | 50,000 | | 45,045 | |
Suncor Energy,
Sr. Unscd. Notes | | 6.50 | | 6/15/2038 | | 300,000 | | 353,302 | |
Sunoco Logistics Partners Operations,
Gtd. Notes | | 3.45 | | 1/15/2023 | | 200,000 | | 193,318 | |
Sunoco Logistics Partners Operations,
Gtd. Notes | | 4.95 | | 1/15/2043 | | 200,000 | | 172,630 | |
Sunoco Logistics Partners Operations,
Gtd. Notes | | 5.40 | | 10/1/2047 | | 110,000 | | 100,517 | |
Tennessee Gas Pipeline,
Gtd. Debs. | | 7.63 | | 4/1/2037 | | 70,000 | | 85,066 | |
Total Capital,
Gtd. Notes | | 4.45 | | 6/24/2020 | | 450,000 | | 458,630 | |
Total Capital International,
Gtd. Notes | | 3.75 | | 4/10/2024 | | 340,000 | | 341,347 | |
TransCanada Pipelines,
Sr. Unscd. Notes | | 3.75 | | 10/16/2023 | | 500,000 | | 496,029 | |
TransCanada Pipelines,
Sr. Unscd. Notes | | 4.88 | | 5/15/2048 | | 60,000 | | 58,152 | |
TransCanada Pipelines,
Sr. Unscd. Notes | | 6.20 | | 10/15/2037 | | 75,000 | | 83,775 | |
TransCanada Pipelines,
Sr. Unscd. Notes | | 7.63 | | 1/15/2039 | | 300,000 | | 384,242 | |
Valero Energy,
Gtd. Notes | | 7.50 | | 4/15/2032 | | 170,000 | | 208,781 | |
Valero Energy,
Sr. Unscd. Notes | | 6.63 | | 6/15/2037 | | 315,000 | | 361,611 | |
Williams,
Sr. Unscd. Notes | | 3.75 | | 6/15/2027 | | 150,000 | | 139,933 | |
Williams,
Sr. Unscd. Notes | | 4.00 | | 9/15/2025 | | 100,000 | | 96,807 | |
Williams,
Sr. Unscd. Notes | | 4.13 | | 11/15/2020 | | 500,000 | | 504,775 | |
Williams,
Sr. Unscd. Notes | | 6.30 | | 4/15/2040 | | 400,000 | | 426,143 | |
| | 33,579,215 | |
27
STATEMENT OF INVESTMENTS (continued)
| | | | | | | | | | |
| |
Description | Coupon
Rate (%) | | Maturity
Date | | Principal
Amount ($) | | Value ($) | |
Bonds and Notes - 100.4% (continued) | | | | | |
Environmental Control - .1% | | | | | |
Republic Services,
Sr. Unscd. Notes | | 5.25 | | 11/15/2021 | | 500,000 | | 525,275 | |
Waste Management,
Gtd. Notes | | 3.50 | | 5/15/2024 | | 500,000 | | 489,163 | |
| | 1,014,438 | |
Financials - .0% | | | | | |
Brookfield Asset Management,
Sr. Unscd. Notes | | 4.00 | | 1/15/2025 | | 250,000 | | 245,250 | |
Food Products - .4% | | | | | |
Campbell Soup,
Sr. Unscd. Notes | | 3.30 | | 3/19/2025 | | 400,000 | | 364,992 | |
Campbell Soup,
Sr. Unscd. Notes | | 4.15 | | 3/15/2028 | | 80,000 | b | 73,763 | |
Conagra Brands,
Sr. Unscd. Notes | | 3.20 | | 1/25/2023 | | 165,000 | | 159,555 | |
Conagra Brands,
Sr. Unscd. Notes | | 4.85 | | 11/1/2028 | | 100,000 | | 99,901 | |
Conagra Brands,
Sr. Unscd. Notes | | 5.30 | | 11/1/2038 | | 60,000 | | 58,287 | |
Conagra Brands,
Sr. Unscd. Notes | | 5.40 | | 11/1/2048 | | 60,000 | | 57,775 | |
General Mills,
Sr. Unscd. Notes | | 4.20 | | 4/17/2028 | | 110,000 | b | 106,513 | |
General Mills,
Sr. Unscd. Notes | | 5.40 | | 6/15/2040 | | 300,000 | | 301,856 | |
JM Smucker,
Sr. Unscd. Notes | | 2.50 | | 3/15/2020 | | 500,000 | | 495,522 | |
Kellogg,
Sr. Unscd. Notes | | 2.65 | | 12/1/2023 | | 300,000 | | 281,880 | |
Kellogg,
Sr. Unscd. Notes | | 4.15 | | 11/15/2019 | | 400,000 | | 404,261 | |
Kraft Heinz Foods,
Gtd. Notes | | 2.80 | | 7/2/2020 | | 390,000 | | 386,112 | |
Kraft Heinz Foods,
Gtd. Notes | | 4.38 | | 6/1/2046 | | 400,000 | | 334,697 | |
Kraft Heinz Foods,
Gtd. Notes | | 6.75 | | 3/15/2032 | | 525,000 | | 600,258 | |
Kroger,
Gtd. Notes | | 7.50 | | 4/1/2031 | | 400,000 | | 479,841 | |
Kroger,
Sr. Unscd. Notes | | 3.30 | | 1/15/2021 | | 300,000 | | 298,784 | |
Kroger,
Sr. Unscd. Notes | | 3.70 | | 8/1/2027 | | 300,000 | b | 282,141 | |
Sysco,
Gtd. Notes | | 5.38 | | 9/21/2035 | | 200,000 | | 214,661 | |
28
| | | | | | | | | | |
| |
Description | Coupon
Rate (%) | | Maturity
Date | | Principal
Amount ($) | | Value ($) | |
Bonds and Notes - 100.4% (continued) | | | | | |
Food Products - .4% (continued) | | | | | |
Tyson Foods,
Gtd. Bonds | | 5.15 | | 8/15/2044 | | 250,000 | | 248,157 | |
| | 5,248,956 | |
Foreign/Governmental - 3.0% | | | | | |
African Development Bank,
Sr. Unscd. Notes | | 1.38 | | 2/12/2020 | | 500,000 | | 490,515 | |
African Development Bank,
Sr. Unscd. Notes | | 2.38 | | 9/23/2021 | | 500,000 | | 490,358 | |
African Development Bank,
Sr. Unscd. Notes | | 2.63 | | 3/22/2021 | | 500,000 | | 495,228 | |
African Development Bank,
Sr. Unscd. Notes | | 3.00 | | 9/20/2023 | | 300,000 | | 297,752 | |
Alberta Government,
Sr. Unscd. Notes | | 1.90 | | 12/6/2019 | | 500,000 | | 494,472 | |
Asian Development Bank,
Sr. Unscd. Notes | | 1.75 | | 6/8/2021 | | 500,000 | | 483,968 | |
Asian Development Bank,
Sr. Unscd. Notes | | 1.75 | | 9/13/2022 | | 295,000 | | 280,524 | |
Asian Development Bank,
Sr. Unscd. Notes | | 2.00 | | 1/22/2025 | | 1,000,000 | b | 932,928 | |
Asian Development Bank,
Sr. Unscd. Notes | | 2.75 | | 3/17/2023 | | 500,000 | | 492,325 | |
Asian Development Bank,
Sr. Unscd. Notes | | 2.75 | | 1/19/2028 | | 90,000 | b | 86,155 | |
Chilean Government,
Sr. Unscd. Notes | | 3.13 | | 3/27/2025 | | 500,000 | | 479,470 | |
Colombian Government,
Sr. Unscd. Bonds | | 5.00 | | 6/15/2045 | | 500,000 | | 474,005 | |
Colombian Government,
Sr. Unscd. Notes | | 3.88 | | 4/25/2027 | | 500,000 | | 477,125 | |
Council of Europe,
Sr. Unscd. Notes | | 1.75 | | 11/14/2019 | | 500,000 | | 494,474 | |
European Bank for Reconstruction & Development,
Sr. Unscd. Bonds | | 1.75 | | 11/26/2019 | | 1,000,000 | | 988,605 | |
European Investment Bank,
Sr. Unscd. Bonds | | 2.88 | | 9/15/2020 | | 1,000,000 | | 998,064 | |
European Investment Bank,
Sr. Unscd. Notes | | 1.88 | | 2/10/2025 | | 1,000,000 | b | 923,111 | |
European Investment Bank,
Sr. Unscd. Notes | | 2.00 | | 3/15/2021 | | 1,000,000 | | 976,431 | |
European Investment Bank,
Sr. Unscd. Notes | | 2.25 | | 3/15/2022 | | 500,000 | | 486,381 | |
European Investment Bank,
Sr. Unscd. Notes | | 2.38 | | 5/24/2027 | | 500,000 | | 466,037 | |
European Investment Bank,
Sr. Unscd. Notes | | 2.50 | | 3/15/2023 | | 305,000 | | 296,909 | |
29
STATEMENT OF INVESTMENTS (continued)
| | | | | | | | | | |
| |
Description | Coupon
Rate (%) | | Maturity
Date | | Principal
Amount ($) | | Value ($) | |
Bonds and Notes - 100.4% (continued) | | | | | |
Foreign/Governmental - 3.0% (continued) | | | | | |
European Investment Bank,
Sr. Unscd. Notes | | 2.88 | | 12/15/2021 | | 300,000 | | 298,107 | |
European Investment Bank,
Unscd. Notes | | 2.88 | | 8/15/2023 | | 500,000 | | 493,945 | |
Export-Import Bank of Korea,
Sr. Unscd. Notes | | 1.88 | | 10/21/2021 | | 500,000 | | 475,883 | |
Export-Import Bank of Korea,
Sr. Unscd. Notes | | 4.00 | | 1/14/2024 | | 500,000 | | 503,033 | |
Finnish Government,
Sr. Unscd. Bonds | | 6.95 | | 2/15/2026 | | 25,000 | | 30,005 | |
FMS Wertmanagement,
Govt. Gtd. Notes | | 1.75 | | 3/17/2020 | | 750,000 | | 738,109 | |
Hungarian Government,
Sr. Unscd. Notes | | 6.38 | | 3/29/2021 | | 500,000 | | 530,229 | |
Hungarian Government,
Sr. Unscd. Notes | | 7.63 | | 3/29/2041 | | 300,000 | | 408,536 | |
Indonesian Government,
Sr. Unscd. Notes | | 2.95 | | 1/11/2023 | | 300,000 | | 284,115 | |
Indonesian Government,
Sr. Unscd. Notes | | 3.50 | | 1/11/2028 | | 300,000 | b | 270,569 | |
Indonesian Government,
Sr. Unscd. Notes | | 4.35 | | 1/11/2048 | | 300,000 | b | 257,333 | |
Inter-American Development Bank,
Sr. Unscd. Notes | | 2.13 | | 1/15/2025 | | 1,000,000 | | 940,303 | |
Inter-American Development Bank,
Sr. Unscd. Notes | | 2.13 | | 1/18/2022 | | 370,000 | | 358,998 | |
Inter-American Development Bank,
Sr. Unscd. Notes | | 3.13 | | 9/18/2028 | | 300,000 | | 295,369 | |
Inter-American Development Bank,
Unscd. Notes | | 1.63 | | 5/12/2020 | | 400,000 | | 392,342 | |
Inter-American Development Bank,
Unscd. Notes | | 2.50 | | 1/18/2023 | | 225,000 | | 219,741 | |
International Bank For Reconstruction & Development,
Sr. Unscd. Bonds | | 7.63 | | 1/19/2023 | | 300,000 | | 352,910 | |
International Bank For Reconstruction & Development,
Sr. Unscd. Notes | | 1.38 | | 9/20/2021 | | 430,000 | | 410,423 | |
International Bank For Reconstruction & Development,
Sr. Unscd. Notes | | 1.75 | | 4/19/2023 | | 500,000 | b | 472,776 | |
International Bank For Reconstruction & Development,
Sr. Unscd. Notes | | 1.88 | | 4/21/2020 | | 500,000 | | 492,638 | |
International Bank For Reconstruction & Development,
Sr. Unscd. Notes | | 2.50 | | 7/29/2025 | | 1,000,000 | | 957,996 | |
30
| | | | | | | | | | |
| |
Description | Coupon
Rate (%) | | Maturity
Date | | Principal
Amount ($) | | Value ($) | |
Bonds and Notes - 100.4% (continued) | | | | | |
Foreign/Governmental - 3.0% (continued) | | | | | |
International Bank For Reconstruction & Development,
Sr. Unscd. Notes | | 3.00 | | 9/27/2023 | | 300,000 | | 299,574 | |
International Bank For Reconstruction & Development,
Unscd. Bonds | | 2.75 | | 7/23/2021 | | 1,000,000 | | 992,764 | |
International Bank For Reconstruction & Development,
Unscd. Notes | | 2.00 | | 1/26/2022 | | 620,000 | | 599,900 | |
International Finance,
Sr. Unscd. Bonds | | 1.63 | | 7/16/2020 | | 200,000 | | 195,542 | |
International Finance,
Sr. Unscd. Notes | | 1.13 | | 7/20/2021 | | 300,000 | | 285,123 | |
Israeli Government,
Govt. Gtd. Bonds | | 5.50 | | 9/18/2023 | | 450,000 | | 497,982 | |
Italian Government,
Sr. Unscd. Notes | | 6.88 | | 9/27/2023 | | 400,000 | | 429,691 | |
Japan Bank for International Cooperation,
Govt. Gtd. Bonds | | 1.88 | | 7/21/2026 | | 500,000 | | 445,831 | |
Japan Bank for International Cooperation,
Govt. Gtd. Notes | | 1.88 | | 4/20/2021 | | 490,000 | | 474,018 | |
Japan Bank for International Cooperation,
Govt. Gtd. Notes | | 2.75 | | 1/21/2026 | | 750,000 | | 713,899 | |
Mexican Government,
Sr. Unscd. Notes | | 3.60 | | 1/30/2025 | | 250,000 | | 237,375 | |
Mexican Government,
Sr. Unscd. Notes | | 3.63 | | 3/15/2022 | | 500,000 | | 494,750 | |
Mexican Government,
Sr. Unscd. Notes | | 4.15 | | 3/28/2027 | | 345,000 | | 328,914 | |
Mexican Government,
Sr. Unscd. Notes | | 4.60 | | 1/23/2046 | | 600,000 | | 520,356 | |
Mexican Government,
Sr. Unscd. Notes | | 5.55 | | 1/21/2045 | | 850,000 | | 842,996 | |
Panamanian Government,
Sr. Unscd. Bonds | | 4.50 | | 4/16/2050 | | 200,000 | | 184,800 | |
Panamanian Government,
Sr. Unscd. Bonds | | 5.20 | | 1/30/2020 | | 200,000 | | 204,677 | |
Panamanian Government,
Sr. Unscd. Bonds | | 6.70 | | 1/26/2036 | | 400,000 | | 481,000 | |
Peruvian Government,
Sr. Unscd. Bonds | | 6.55 | | 3/14/2037 | | 370,000 | | 452,325 | |
Peruvian Government,
Sr. Unscd. Bonds | | 7.35 | | 7/21/2025 | | 500,000 | | 603,750 | |
31
STATEMENT OF INVESTMENTS (continued)
| | | | | | | | | | |
| |
Description | Coupon
Rate (%) | | Maturity
Date | | Principal
Amount ($) | | Value ($) | |
Bonds and Notes - 100.4% (continued) | | | | | |
Foreign/Governmental - 3.0% (continued) | | | | | |
Philippine Government,
Sr. Unscd. Bonds | | 3.70 | | 2/2/2042 | | 400,000 | b | 355,940 | |
Philippine Government,
Sr. Unscd. Bonds | | 10.63 | | 3/16/2025 | | 800,000 | | 1,085,242 | |
Polish Government,
Sr. Unscd. Notes | | 5.00 | | 3/23/2022 | | 650,000 | | 680,768 | |
Province of Alberta Canada,
Sr. Unscd. Notes | | 3.30 | | 3/15/2028 | | 80,000 | | 78,029 | |
Province of British Columbia Canada,
Sr. Unscd. Bonds, Ser. USD2 | | 6.50 | | 1/15/2026 | | 925,000 | | 1,090,305 | |
Province of Manitoba Canada,
Unscd. Debs. | | 8.88 | | 9/15/2021 | | 450,000 | | 514,086 | |
Province of Ontario Canada,
Sr. Unscd. Notes | | 3.40 | | 10/17/2023 | | 150,000 | | 150,396 | |
Province of Quebec Canada,
Bonds, Ser. NJ | | 7.50 | | 7/15/2023 | | 200,000 | | 233,683 | |
Province of Quebec Canada,
Sr. Unscd. Debs., Ser. PD | | 7.50 | | 9/15/2029 | | 550,000 | | 740,921 | |
Uruguayan Government,
Sr. Unscd. Bonds | | 4.98 | | 4/20/2055 | | 105,000 | | 97,650 | |
Uruguayan Government,
Sr. Unscd. Bonds | | 7.63 | | 3/21/2036 | | 300,000 | b | 387,225 | |
Uruguayan Government,
Sr. Unscd. Notes | | 4.50 | | 8/14/2024 | | 400,000 | b | 404,588 | |
| | 35,892,297 | |
Forest Products & Other - .1% | | | | | |
International Paper,
Sr. Unscd. Notes | | 3.65 | | 6/15/2024 | | 400,000 | | 396,404 | |
International Paper,
Sr. Unscd. Notes | | 4.40 | | 8/15/2047 | | 250,000 | | 216,669 | |
| | 613,073 | |
Health Care - 2.8% | | | | | |
Abbott Laboratories,
Sr. Unscd. Notes | | 2.90 | | 11/30/2021 | | 600,000 | | 589,690 | |
Abbott Laboratories,
Sr. Unscd. Notes | | 4.90 | | 11/30/2046 | | 250,000 | | 258,840 | |
AbbVie,
Sr. Unscd. Notes | | 2.90 | | 11/6/2022 | | 1,000,000 | | 969,009 | |
AbbVie,
Sr. Unscd. Notes | | 3.60 | | 5/14/2025 | | 170,000 | | 162,442 | |
AbbVie,
Sr. Unscd. Notes | | 4.25 | | 11/14/2028 | | 110,000 | | 106,264 | |
AbbVie,
Sr. Unscd. Notes | | 4.30 | | 5/14/2036 | | 235,000 | | 210,130 | |
AbbVie,
Sr. Unscd. Notes | | 4.45 | | 5/14/2046 | | 330,000 | | 289,776 | |
32
| | | | | | | | | | |
| |
Description | Coupon
Rate (%) | | Maturity
Date | | Principal
Amount ($) | | Value ($) | |
Bonds and Notes - 100.4% (continued) | | | | | |
Health Care - 2.8% (continued) | | | | | |
AbbVie,
Sr. Unscd. Notes | | 4.88 | | 11/14/2048 | | 110,000 | | 101,450 | |
Actavis Funding,
Gtd. Notes | | 3.00 | | 3/12/2020 | | 795,000 | | 791,812 | |
Actavis Funding,
Gtd. Notes | | 3.80 | | 3/15/2025 | | 500,000 | | 482,492 | |
Actavis Funding,
Gtd. Notes | | 4.75 | | 3/15/2045 | | 400,000 | | 376,091 | |
Aetna,
Sr. Unscd. Notes | | 4.75 | | 3/15/2044 | | 250,000 | | 236,944 | |
Aetna,
Sr. Unscd. Notes | | 6.63 | | 6/15/2036 | | 150,000 | | 176,640 | |
Amgen,
Sr. Unscd. Notes | | 2.60 | | 8/19/2026 | | 1,000,000 | | 896,488 | |
Amgen,
Sr. Unscd. Notes | | 4.10 | | 6/15/2021 | | 500,000 | | 507,216 | |
Amgen,
Sr. Unscd. Notes | | 4.66 | | 6/15/2051 | | 300,000 | | 277,898 | |
Anthem,
Sr. Unscd. Notes | | 3.30 | | 1/15/2023 | | 500,000 | | 489,606 | |
Anthem,
Sr. Unscd. Notes | | 4.38 | | 12/1/2047 | | 600,000 | | 544,559 | |
AstraZeneca,
Sr. Unscd. Notes | | 2.38 | | 11/16/2020 | | 350,000 | | 343,776 | |
AstraZeneca,
Sr. Unscd. Notes | | 4.38 | | 11/16/2045 | | 205,000 | b | 189,303 | |
AstraZeneca,
Sr. Unscd. Notes | | 4.38 | | 8/17/2048 | | 45,000 | | 41,149 | |
Baxalta,
Gtd. Notes | | 2.88 | | 6/23/2020 | | 72,000 | | 71,230 | |
Baxalta,
Gtd. Notes | | 5.25 | | 6/23/2045 | | 350,000 | b | 354,349 | |
Becton Dickinson and Company,
Sr. Unscd. Notes | | 3.13 | | 11/8/2021 | | 500,000 | | 492,122 | |
Becton Dickinson and Company,
Sr. Unscd. Notes | | 3.73 | | 12/15/2024 | | 386,000 | | 374,697 | |
Biogen,
Sr. Unscd. Notes | | 4.05 | | 9/15/2025 | | 500,000 | | 496,501 | |
Boston Scientific,
Sr. Unscd. Notes | | 6.00 | | 1/15/2020 | | 500,000 | | 515,547 | |
Bristol-Myers Squibb,
Sr. Unscd. Notes | | 2.00 | | 8/1/2022 | | 400,000 | | 381,414 | |
Cardinal Health,
Sr. Unscd. Notes | | 3.20 | | 3/15/2023 | | 300,000 | | 290,655 | |
Cardinal Health,
Sr. Unscd. Notes | | 4.60 | | 3/15/2043 | | 300,000 | | 260,152 | |
33
STATEMENT OF INVESTMENTS (continued)
| | | | | | | | | | |
| |
Description | Coupon
Rate (%) | | Maturity
Date | | Principal
Amount ($) | | Value ($) | |
Bonds and Notes - 100.4% (continued) | | | | | |
Health Care - 2.8% (continued) | | | | | |
Celgene,
Sr. Unscd. Notes | | 3.25 | | 2/20/2023 | | 60,000 | | 58,232 | |
Celgene,
Sr. Unscd. Notes | | 3.88 | | 8/15/2025 | | 190,000 | | 183,591 | |
Celgene,
Sr. Unscd. Notes | | 3.90 | | 2/20/2028 | | 90,000 | | 84,667 | |
Celgene,
Sr. Unscd. Notes | | 4.35 | | 11/15/2047 | | 90,000 | | 75,340 | |
Celgene,
Sr. Unscd. Notes | | 4.55 | | 2/20/2048 | | 90,000 | | 78,221 | |
Cigna,
Sr. Unscd. Notes | | 3.88 | | 10/15/2047 | | 75,000 | | 61,080 | |
Cigna,
Sr. Unscd. Notes | | 4.50 | | 3/15/2021 | | 300,000 | | 305,773 | |
CVS Health,
Sr. Unscd. Notes | | 2.88 | | 6/1/2026 | | 400,000 | | 363,044 | |
CVS Health,
Sr. Unscd. Notes | | 3.13 | | 3/9/2020 | | 400,000 | | 399,047 | |
CVS Health,
Sr. Unscd. Notes | | 3.35 | | 3/9/2021 | | 400,000 | | 398,467 | |
CVS Health,
Sr. Unscd. Notes | | 3.70 | | 3/9/2023 | | 500,000 | | 494,497 | |
CVS Health,
Sr. Unscd. Notes | | 4.10 | | 3/25/2025 | | 400,000 | | 395,897 | |
CVS Health,
Sr. Unscd. Notes | | 4.30 | | 3/25/2028 | | 640,000 | | 625,472 | |
CVS Health,
Sr. Unscd. Notes | | 4.78 | | 3/25/2038 | | 500,000 | | 480,463 | |
CVS Health,
Sr. Unscd. Notes | | 5.05 | | 3/25/2048 | | 550,000 | | 538,186 | |
CVS Health,
Sr. Unscd. Notes | | 5.13 | | 7/20/2045 | | 480,000 | | 472,515 | |
Danaher,
Sr. Unscd. Notes | | 4.38 | | 9/15/2045 | | 250,000 | | 244,027 | |
Dignity Health,
Scd. Bonds | | 2.64 | | 11/1/2019 | | 300,000 | | 298,226 | |
Dignity Health,
Scd. Bonds | | 5.27 | | 11/1/2064 | | 304,000 | | 291,651 | |
Eli Lilly & Co.,
Sr. Unscd. Notes | | 3.10 | | 5/15/2027 | | 500,000 | | 476,720 | |
Eli Lilly & Co.,
Sr. Unscd. Notes | | 5.55 | | 3/15/2037 | | 200,000 | | 231,101 | |
Express Scripts Holdings,
Gtd. Notes | | 3.40 | | 3/1/2027 | | 250,000 | | 230,080 | |
Express Scripts Holdings,
Gtd. Notes | | 4.80 | | 7/15/2046 | | 250,000 | | 235,792 | |
34
| | | | | | | | | | |
| |
Description | Coupon
Rate (%) | | Maturity
Date | | Principal
Amount ($) | | Value ($) | |
Bonds and Notes - 100.4% (continued) | | | | | |
Health Care - 2.8% (continued) | | | | | |
Gilead Sciences,
Sr. Unscd. Notes | | 4.15 | | 3/1/2047 | | 220,000 | | 195,496 | |
Gilead Sciences,
Sr. Unscd. Notes | | 4.50 | | 4/1/2021 | | 500,000 | | 511,797 | |
Gilead Sciences,
Sr. Unscd. Notes | | 4.60 | | 9/1/2035 | | 190,000 | | 189,016 | |
Gilead Sciences,
Sr. Unscd. Notes | | 4.80 | | 4/1/2044 | | 500,000 | | 487,966 | |
GlaxosmithKline Capital,
Gtd. Notes | | 2.85 | | 5/8/2022 | | 500,000 | | 488,789 | |
GlaxoSmithKline Capital,
Gtd. Notes | | 2.80 | | 3/18/2023 | | 300,000 | | 290,773 | |
GlaxoSmithKline Capital,
Gtd. Notes | | 3.38 | | 5/15/2023 | | 140,000 | | 138,711 | |
GlaxoSmithKline Capital,
Gtd. Notes | | 3.88 | | 5/15/2028 | | 125,000 | | 125,003 | |
Halfmoon Parent,
Sr. Scd. Notes | | 3.20 | | 9/17/2020 | | 110,000 | a | 109,455 | |
Halfmoon Parent,
Sr. Scd. Notes | | 3.40 | | 9/17/2021 | | 80,000 | a,b | 79,465 | |
Halfmoon Parent,
Sr. Scd. Notes | | 3.75 | | 7/15/2023 | | 190,000 | a | 188,655 | |
Halfmoon Parent,
Sr. Scd. Notes | | 4.13 | | 11/15/2025 | | 130,000 | a | 128,705 | |
Halfmoon Parent,
Sr. Scd. Notes | | 4.38 | | 10/15/2028 | | 230,000 | a | 225,052 | |
Halfmoon Parent,
Sr. Scd. Notes | | 4.80 | | 8/15/2038 | | 130,000 | a | 125,895 | |
Halfmoon Parent,
Sr. Unscd. Notes | | 4.90 | | 12/15/2048 | | 180,000 | a | 171,050 | |
Humana,
Sr. Unscd. Notes | | 3.85 | | 10/1/2024 | | 500,000 | | 494,342 | |
Johnson & Johnson,
Sr. Unscd. Debs. | | 4.95 | | 5/15/2033 | | 170,000 | | 188,447 | |
Johnson & Johnson,
Sr. Unscd. Notes | | 1.65 | | 3/1/2021 | | 525,000 | | 507,705 | |
Johnson & Johnson,
Sr. Unscd. Notes | | 2.45 | | 3/1/2026 | | 380,000 | | 351,103 | |
Johnson & Johnson,
Sr. Unscd. Notes | | 3.50 | | 1/15/2048 | | 50,000 | | 43,751 | |
Johnson & Johnson,
Sr. Unscd. Notes | | 3.75 | | 3/3/2047 | | 350,000 | | 320,715 | |
Kaiser Foundation Hospitals,
Gtd. Notes | | 3.15 | | 5/1/2027 | | 500,000 | | 473,326 | |
Laboratory of America Holdings,
Sr. Unscd. Notes | | 4.00 | | 11/1/2023 | | 400,000 | | 401,603 | |
35
STATEMENT OF INVESTMENTS (continued)
| | | | | | | | | | |
| |
Description | Coupon
Rate (%) | | Maturity
Date | | Principal
Amount ($) | | Value ($) | |
Bonds and Notes - 100.4% (continued) | | | | | |
Health Care - 2.8% (continued) | | | | | |
McKesson,
Sr. Unscd. Notes | | 4.75 | | 3/1/2021 | | 500,000 | | 512,112 | |
Medtronic,
Gtd. Notes | | 3.50 | | 3/15/2025 | | 550,000 | | 538,950 | |
Medtronic,
Gtd. Notes | | 4.63 | | 3/15/2044 | | 600,000 | | 601,389 | |
Memorial Sloan-Kettering Cancer Center,
Sr. Unscd. Notes, Ser. 2015 | | 4.20 | | 7/1/2055 | | 200,000 | | 190,909 | |
Merck & Co.,
Sr. Unscd. Notes | | 2.75 | | 2/10/2025 | | 500,000 | | 474,594 | |
Mylan,
Gtd. Notes | | 3.15 | | 6/15/2021 | | 200,000 | | 195,416 | |
Mylan,
Gtd. Notes | | 5.40 | | 11/29/2043 | | 300,000 | | 269,002 | |
Northwell Healthcare,
Scd. Notes | | 3.98 | | 11/1/2046 | | 250,000 | | 220,959 | |
Novartis Capital,
Gtd. Notes | | 4.40 | | 5/6/2044 | | 340,000 | | 346,037 | |
Perrigo Finance Unlimited,
Gtd. Notes | | 4.38 | | 3/15/2026 | | 200,000 | | 193,534 | |
Pfizer,
Sr. Unscd. Notes | | 1.95 | | 6/3/2021 | | 355,000 | | 344,739 | |
Pfizer,
Sr. Unscd. Notes | | 2.75 | | 6/3/2026 | | 470,000 | | 438,288 | |
Pfizer,
Sr. Unscd. Notes | | 3.00 | | 12/15/2026 | | 250,000 | | 237,014 | |
Pfizer,
Sr. Unscd. Notes | | 4.13 | | 12/15/2046 | | 300,000 | | 286,712 | |
Pfizer,
Sr. Unscd. Notes | | 4.20 | | 9/15/2048 | | 60,000 | | 57,716 | |
Providence St. Joseph Health Obligated Group,
Unscd. Notes, Ser. I | | 3.74 | | 10/1/2047 | | 250,000 | | 219,456 | |
Quest Diagnostics,
Sr. Unscd. Notes | | 3.50 | | 3/30/2025 | | 500,000 | | 477,816 | |
Sanofi,
Sr. Unscd. Notes | | 4.00 | | 3/29/2021 | | 550,000 | | 558,420 | |
Stryker,
Sr. Unscd. Bonds | | 4.38 | | 5/15/2044 | | 250,000 | | 232,044 | |
Stryker,
Sr. Unscd. Notes | | 3.50 | | 3/15/2026 | | 250,000 | | 238,912 | |
Thermo Fisher Scientific,
Sr. Unscd. Notes | | 5.30 | | 2/1/2044 | | 250,000 | | 266,371 | |
Trinity Health,
Scd. Bonds | | 4.13 | | 12/1/2045 | | 200,000 | | 187,284 | |
36
| | | | | | | | | | |
| |
Description | Coupon
Rate (%) | | Maturity
Date | | Principal
Amount ($) | | Value ($) | |
Bonds and Notes - 100.4% (continued) | | | | | |
Health Care - 2.8% (continued) | | | | | |
UnitedHealth Group,
Sr. Unscd. Notes | | 2.88 | | 12/15/2021 | | 350,000 | | 345,284 | |
UnitedHealth Group,
Sr. Unscd. Notes | | 3.75 | | 10/15/2047 | | 70,000 | | 62,096 | |
UnitedHealth Group,
Sr. Unscd. Notes | | 3.75 | | 7/15/2025 | | 330,000 | | 327,134 | |
UnitedHealth Group,
Sr. Unscd. Notes | | 4.25 | | 6/15/2048 | | 80,000 | | 76,428 | |
UnitedHealth Group,
Sr. Unscd. Notes | | 4.75 | | 7/15/2045 | | 280,000 | | 286,392 | |
UnitedHealth Group,
Sr. Unscd. Notes | | 6.88 | | 2/15/2038 | | 410,000 | | 532,310 | |
Wyeth,
Gtd. Notes | | 6.50 | | 2/1/2034 | | 200,000 | | 244,540 | |
Zimmer Biomet Holdings,
Sr. Unscd. Notes | | 3.55 | | 4/1/2025 | | 250,000 | | 236,177 | |
| | 33,735,186 | |
Industrials - .7% | | | | | |
3M,
Sr. Unscd. Notes | | 2.25 | | 9/19/2026 | | 500,000 | | 451,074 | |
Caterpillar,
Sr. Unscd. Bonds | | 6.05 | | 8/15/2036 | | 237,000 | | 278,900 | |
Caterpillar,
Sr. Unscd. Notes | | 2.60 | | 6/26/2022 | | 800,000 | | 776,950 | |
Caterpillar,
Sr. Unscd. Notes | | 4.30 | | 5/15/2044 | | 200,000 | b | 198,587 | |
Eaton,
Gtd. Notes | | 4.15 | | 11/2/2042 | | 400,000 | | 367,510 | |
General Electric,
Gtd. Notes, Ser. A | | 6.75 | | 3/15/2032 | | 500,000 | | 566,110 | |
General Electric,
Sr. Unscd. Notes | | 2.20 | | 1/9/2020 | | 500,000 | | 491,114 | |
General Electric,
Sr. Unscd. Notes | | 4.50 | | 3/11/2044 | | 500,000 | | 423,705 | |
General Electric,
Sr. Unscd. Notes | | 4.65 | | 10/17/2021 | | 650,000 | | 661,236 | |
Illinois Tool Works,
Sr. Unscd. Notes | | 3.90 | | 9/1/2042 | | 500,000 | | 474,012 | |
John Deere Capital,
Sr. Unscd. Notes | | 2.80 | | 3/6/2023 | | 500,000 | | 485,511 | |
John Deere Capital,
Sr. Unscd. Notes | | 3.15 | | 10/15/2021 | | 300,000 | | 298,535 | |
Rockwell Automation,
Sr. Unscd. Notes | | 2.05 | | 3/1/2020 | | 500,000 | | 492,154 | |
Roper Technologies,
Sr. Unscd. Notes | | 3.80 | | 12/15/2026 | | 500,000 | | 480,901 | |
37
STATEMENT OF INVESTMENTS (continued)
| | | | | | | | | | |
| |
Description | Coupon
Rate (%) | | Maturity
Date | | Principal
Amount ($) | | Value ($) | |
Bonds and Notes - 100.4% (continued) | | | | | |
Industrials - .7% (continued) | | | | | |
Stanley Black & Decker,
Gtd. Notes | | 3.40 | | 12/1/2021 | | 400,000 | | 398,733 | |
Textron,
Sr. Unscd. Notes | | 4.00 | | 3/15/2026 | | 500,000 | | 485,190 | |
Xerox,
Sr. Unscd. Notes | | 3.80 | | 5/15/2024 | | 500,000 | | 442,962 | |
Xylem,
Sr. Unscd. Notes | | 4.38 | | 11/1/2046 | | 250,000 | | 233,002 | |
Xylem,
Sr. Unscd. Notes | | 4.88 | | 10/1/2021 | | 21,000 | | 21,651 | |
| | 8,027,837 | |
Information Technology - .5% | | | | | |
Adobe Systems,
Sr. Unscd. Notes | | 3.25 | | 2/1/2025 | | 500,000 | | 483,990 | |
Autodesk,
Sr. Unscd. Notes | | 4.38 | | 6/15/2025 | | 250,000 | | 248,078 | |
Fidelity National Information Services,
Sr. Unscd. Bonds | | 3.00 | | 8/15/2026 | | 250,000 | | 227,682 | |
Fidelity National Information Services,
Sr. Unscd. Notes | | 3.63 | | 10/15/2020 | | 450,000 | | 451,083 | |
Microsoft,
Sr. Unscd. Notes | | 1.55 | | 8/8/2021 | | 575,000 | | 550,853 | |
Microsoft,
Sr. Unscd. Notes | | 3.75 | | 2/12/2045 | | 1,000,000 | | 928,882 | |
Microsoft,
Sr. Unscd. Notes | | 4.45 | | 11/3/2045 | | 411,000 | | 426,950 | |
Microsoft,
Sr. Unscd. Notes | | 4.50 | | 2/6/2057 | | 160,000 | | 165,355 | |
Microsoft,
Sr. Unscd. Notes | | 4.75 | | 11/3/2055 | | 135,000 | | 146,009 | |
Microsoft,
Sr. Unscd. Notes | | 5.20 | | 6/1/2039 | | 688,000 | | 787,445 | |
Oracle,
Sr. Unscd. Notes | | 3.25 | | 11/15/2027 | | 250,000 | | 236,746 | |
Oracle,
Sr. Unscd. Notes | | 3.40 | | 7/8/2024 | | 500,000 | | 492,712 | |
Oracle,
Sr. Unscd. Notes | | 3.85 | | 7/15/2036 | | 500,000 | | 461,950 | |
Oracle,
Sr. Unscd. Notes | | 3.90 | | 5/15/2035 | | 480,000 | | 448,275 | |
Oracle,
Sr. Unscd. Notes | | 4.00 | | 11/15/2047 | | 160,000 | | 144,767 | |
Oracle,
Sr. Unscd. Notes | | 4.38 | | 5/15/2055 | | 280,000 | | 263,234 | |
| | 6,464,011 | |
38
| | | | | | | | | | |
| |
Description | Coupon
Rate (%) | | Maturity
Date | | Principal
Amount ($) | | Value ($) | |
Bonds and Notes - 100.4% (continued) | | | | | |
Insurance - .9% | | | | | |
Ace Ina Holdings,
Gtd. Notes | | 3.35 | | 5/15/2024 | | 250,000 | | 245,515 | |
Aflac,
Sr. Unscd. Notes | | 3.63 | | 6/15/2023 | | 300,000 | | 300,172 | |
Allstate,
Sub. Debs., Ser. B | | 5.75 | | 8/15/2053 | | 300,000 | | 303,780 | |
American International Group,
Jr. Sub. Notes, Ser. A-9 | | 5.75 | | 4/1/2048 | | 300,000 | | 284,064 | |
American International Group,
Sr. Unscd. Notes | | 3.88 | | 1/15/2035 | | 500,000 | | 430,330 | |
American International Group,
Sr. Unscd. Notes | | 4.20 | | 4/1/2028 | | 90,000 | | 86,595 | |
American International Group,
Sr. Unscd. Notes | | 4.75 | | 4/1/2048 | | 60,000 | | 55,574 | |
American International Group,
Sr. Unscd. Notes | | 4.88 | | 6/1/2022 | | 400,000 | | 411,909 | |
AON,
Gtd. Notes | | 4.60 | | 6/14/2044 | | 500,000 | | 472,666 | |
AXA,
Sub. Bonds | | 8.60 | | 12/15/2030 | | 165,000 | | 209,963 | |
AXA Equitable Holdings,
Sr. Unscd. Notes | | 4.35 | | 4/20/2028 | | 90,000 | a | 86,426 | |
Berkshire Hathaway,
Sr. Unscd. Notes | | 3.13 | | 3/15/2026 | | 500,000 | | 476,616 | |
Berkshire Hathaway Finance,
Gtd. Notes | | 4.20 | | 8/15/2048 | | 135,000 | | 129,533 | |
Chubb,
Gtd. Notes | | 6.00 | | 5/11/2037 | | 540,000 | | 641,603 | |
First American Financial,
Sr. Unscd. Notes | | 4.60 | | 11/15/2024 | | 500,000 | | 502,472 | |
Lincoln National,
Sr. Unscd. Notes | | 3.63 | | 12/12/2026 | | 500,000 | | 476,041 | |
Lincoln National,
Sr. Unscd. Notes | | 6.15 | | 4/7/2036 | | 39,000 | | 44,029 | |
Loews,
Sr. Unscd. Notes | | 2.63 | | 5/15/2023 | | 250,000 | | 238,965 | |
Marsh & McLennan,
Sr. Unscd. Notes | | 2.35 | | 3/6/2020 | | 250,000 | | 246,559 | |
Marsh & McLennan,
Sr. Unscd. Notes | | 5.88 | | 8/1/2033 | | 275,000 | | 315,347 | |
MetLife,
Sr. Unscd. Notes | | 3.60 | | 4/10/2024 | | 250,000 | | 248,556 | |
MetLife,
Sr. Unscd. Notes | | 4.05 | | 3/1/2045 | | 400,000 | | 358,032 | |
MetLife,
Sr. Unscd. Notes | | 6.38 | | 6/15/2034 | | 350,000 | | 414,507 | |
39
STATEMENT OF INVESTMENTS (continued)
| | | | | | | | | | |
| |
Description | Coupon
Rate (%) | | Maturity
Date | | Principal
Amount ($) | | Value ($) | |
Bonds and Notes - 100.4% (continued) | | | | | |
Insurance - .9% (continued) | | | | | |
PartnerRe Finance,
Gtd. Notes | | 5.50 | | 6/1/2020 | | 159,000 | | 163,596 | |
Progressive,
Sr. Unscd. Notes | | 4.13 | | 4/15/2047 | | 70,000 | | 65,790 | |
Progressive,
Sr. Unscd. Notes | | 4.35 | | 4/25/2044 | | 250,000 | | 245,578 | |
Progressive,
Sr. Unscd. Notes | | 6.63 | | 3/1/2029 | | 100,000 | | 118,890 | |
Prudential Financial,
Jr. Sub. Notes | | 5.20 | | 3/15/2044 | | 550,000 | | 536,937 | |
Prudential Financial,
Sr. Unscd. Notes | | 4.60 | | 5/15/2044 | | 400,000 | | 390,041 | |
Reinsurance Group of America,
Sr. Unscd. Notes | | 4.70 | | 9/15/2023 | | 350,000 | | 359,964 | |
Travelers,
Sr. Unscd. Notes | | 3.90 | | 11/1/2020 | | 500,000 | | 506,100 | |
Trinity Acquisition,
Gtd. Notes | | 3.50 | | 9/15/2021 | | 500,000 | | 494,327 | |
XLIT,
Gtd. Notes | | 6.38 | | 11/15/2024 | | 350,000 | | 390,805 | |
| | 10,251,282 | |
Internet Software & Services - .3% | | | | | |
Alibaba Group Holding,
Sr. Unscd. Notes | | 3.13 | | 11/28/2021 | | 290,000 | | 286,364 | |
Alibaba Group Holding,
Sr. Unscd. Notes | | 3.60 | | 11/28/2024 | | 300,000 | b | 292,547 | |
Alibaba Group Holding,
Sr. Unscd. Notes | | 4.00 | | 12/6/2037 | | 400,000 | | 352,650 | |
Alphabet,
Sr. Unscd. Notes | | 2.00 | | 8/15/2026 | | 300,000 | | 266,831 | |
Alphabet,
Sr. Unscd. Notes | | 3.63 | | 5/19/2021 | | 300,000 | | 303,102 | |
Amazon.com,
Sr. Unscd. Notes | | 2.40 | | 2/22/2023 | | 210,000 | | 200,823 | |
Amazon.com,
Sr. Unscd. Notes | | 2.60 | | 12/5/2019 | | 500,000 | | 498,557 | |
Amazon.com,
Sr. Unscd. Notes | | 3.15 | | 8/22/2027 | | 650,000 | | 613,396 | |
Amazon.com,
Sr. Unscd. Notes | | 3.88 | | 8/22/2037 | | 195,000 | | 184,227 | |
eBay,
Sr. Unscd. Notes | | 4.00 | | 7/15/2042 | | 350,000 | | 271,889 | |
| | 3,270,386 | |
Media - .9% | | | | | |
21st Century Fox America,
Gtd. Debs. | | 7.75 | | 12/1/2045 | | 100,000 | | 144,839 | |
40
| | | | | | | | | | |
| |
Description | Coupon
Rate (%) | | Maturity
Date | | Principal
Amount ($) | | Value ($) | |
Bonds and Notes - 100.4% (continued) | | | | | |
Media - .9% (continued) | | | | | |
21st Century Fox America,
Gtd. Notes | | 6.20 | | 12/15/2034 | | 250,000 | | 299,295 | |
21st Century Fox America,
Gtd. Notes, Ser. WI | | 3.70 | | 9/15/2024 | | 400,000 | | 395,716 | |
CBS,
Gtd. Debs. | | 7.88 | | 7/30/2030 | | 300,000 | | 369,047 | |
CBS,
Gtd. Notes | | 4.90 | | 8/15/2044 | | 240,000 | | 222,850 | |
Charter Communications Operating,
Sr. Scd. Notes | | 4.91 | | 7/23/2025 | | 510,000 | | 514,318 | |
Charter Communications Operating,
Sr. Scd. Notes | | 5.75 | | 4/1/2048 | | 100,000 | | 94,732 | |
Charter Communications Operating,
Sr. Scd. Notes | | 6.48 | | 10/23/2045 | | 500,000 | | 512,660 | |
Comcast,
Gtd. Bonds | | 4.00 | | 8/15/2047 | | 60,000 | | 52,390 | |
Comcast,
Gtd. Bonds | | 4.75 | | 3/1/2044 | | 500,000 | | 489,736 | |
Comcast,
Gtd. Notes | | 2.75 | | 3/1/2023 | | 100,000 | | 96,468 | |
Comcast,
Gtd. Notes | | 2.85 | | 1/15/2023 | | 300,000 | | 290,693 | |
Comcast,
Gtd. Notes | | 3.38 | | 8/15/2025 | | 730,000 | | 702,923 | |
Comcast,
Gtd. Notes | | 3.70 | | 4/15/2024 | | 345,000 | | 344,070 | |
Comcast,
Gtd. Notes | | 3.90 | | 3/1/2038 | | 75,000 | | 67,128 | |
Comcast,
Gtd. Notes | | 4.00 | | 3/1/2048 | | 60,000 | | 52,493 | |
Comcast,
Gtd. Notes | | 4.25 | | 1/15/2033 | | 500,000 | | 485,221 | |
Comcast,
Gtd. Notes | | 4.60 | | 10/15/2038 | | 200,000 | | 196,092 | |
Comcast,
Gtd. Notes | | 4.70 | | 10/15/2048 | | 405,000 | | 393,552 | |
Comcast,
Gtd. Notes | | 6.45 | | 3/15/2037 | | 300,000 | | 349,181 | |
Comcast Cable Communications,
Gtd. Notes | | 9.46 | | 11/15/2022 | | 304,000 | | 367,409 | |
Discovery Communications,
Gtd. Notes | | 3.95 | | 3/20/2028 | | 700,000 | | 653,150 | |
Discovery Communications,
Gtd. Notes | | 5.00 | | 9/20/2037 | | 250,000 | | 233,965 | |
Discovery Communications,
Gtd. Notes | | 5.20 | | 9/20/2047 | | 300,000 | | 278,071 | |
41
STATEMENT OF INVESTMENTS (continued)
| | | | | | | | | | |
| |
Description | Coupon
Rate (%) | | Maturity
Date | | Principal
Amount ($) | | Value ($) | |
Bonds and Notes - 100.4% (continued) | | | | | |
Media - .9% (continued) | | | | | |
Grupo Televisa,
Sr. Unscd. Notes | | 5.00 | | 5/13/2045 | | 400,000 | | 346,665 | |
Time Warner,
Gtd. Notes | | 4.75 | | 3/29/2021 | | 500,000 | | 513,414 | |
Time Warner,
Gtd. Notes | | 4.85 | | 7/15/2045 | | 300,000 | | 267,751 | |
Time Warner Cable,
Sr. Scd. Debs. | | 4.50 | | 9/15/2042 | | 250,000 | | 202,889 | |
Time Warner Cable,
Sr. Scd. Debs. | | 6.55 | | 5/1/2037 | | 350,000 | | 363,008 | |
Viacom,
Sr. Unscd. Notes | | 4.38 | | 3/15/2043 | | 400,000 | | 328,514 | |
Walt Disney,
Sr. Unscd. Notes | | 2.30 | | 2/12/2021 | | 500,000 | | 490,248 | |
Walt Disney,
Sr. Unscd. Notes | | 3.00 | | 2/13/2026 | | 500,000 | | 476,252 | |
Walt Disney,
Sr. Unscd. Notes, Ser. B | | 7.00 | | 3/1/2032 | | 150,000 | | 189,772 | |
| | 10,784,512 | |
Metals & Mining - .3% | | | | | |
Barrick PD Australia Finance,
Gtd. Notes | | 5.95 | | 10/15/2039 | | 400,000 | | 432,654 | |
BHP Billiton Finance USA,
Gtd. Notes | | 4.13 | | 2/24/2042 | | 500,000 | | 477,155 | |
Goldcorp,
Sr. Unscd. Notes | | 3.63 | | 6/9/2021 | | 500,000 | | 497,338 | |
Newmont Mining,
Gtd. Notes | | 6.25 | | 10/1/2039 | | 126,000 | | 138,993 | |
Nucor,
Sr. Unscd. Notes | | 6.40 | | 12/1/2037 | | 200,000 | | 238,315 | |
Rio Tinto Alcan,
Sr. Unscd. Debs. | | 7.25 | | 3/15/2031 | | 350,000 | | 437,984 | |
Southern Copper,
Sr. Unscd. Notes | | 5.25 | | 11/8/2042 | | 500,000 | | 488,654 | |
Vale Canada,
Sr. Unscd. Bonds | | 7.20 | | 9/15/2032 | | 100,000 | | 110,900 | |
Vale Overseas,
Gtd. Notes | | 6.88 | | 11/21/2036 | | 550,000 | | 613,409 | |
| | 3,435,402 | |
Municipal Bonds - .5% | | | | | |
American Municipal Power,
Combined Hydroelectic Projects Revenue Bonds (Build America Bonds) | | 8.08 | | 2/15/2050 | | 100,000 | | 152,819 | |
42
| | | | | | | | | | |
| |
Description | Coupon
Rate (%) | | Maturity
Date | | Principal
Amount ($) | | Value ($) | |
Bonds and Notes - 100.4% (continued) | | | | | |
Municipal Bonds - .5% (continued) | | | | | |
Bay Area Toll Authority,
San Francisco Bay Area Toll Bridge Revenue Bonds (Build America Bonds) | | 6.26 | | 4/1/2049 | | 300,000 | | 397,947 | |
California,
GO | | 3.50 | | 4/1/2028 | | 100,000 | | 97,240 | |
California,
GO (Various Purpose) | | 7.50 | | 4/1/2034 | | 500,000 | | 682,635 | |
California,
GO (Various Purpose) | | 7.55 | | 4/1/2039 | | 600,000 | | 854,064 | |
Illinois,
GO (Pension Funding Series) | | 5.10 | | 6/1/2033 | | 730,000 | | 690,032 | |
Los Angeles Unified School District,
GO (Build America Bonds) | | 5.75 | | 7/1/2034 | | 350,000 | | 404,054 | |
Metropolitan Transportation Authority,
Dedicated Tax Funds Bonds | | 7.34 | | 11/15/2039 | | 300,000 | | 420,747 | |
Municipal Electric Authority of Georgia,
GO (Plant Vogtle Units 3 and 4 Project J Bonds) (Build America Bonds) | | 6.64 | | 4/1/2057 | | 350,000 | | 379,746 | |
New Jersey Economic Development Authority,
State Pension Funding Bonds (Insured; National Public Finance Guarantee Corp.) | | 7.43 | | 2/15/2029 | | 250,000 | | 300,935 | |
New Jersey Turnpike Authority,
Turnpike Revenue Bonds (Build America Bonds) | | 7.41 | | 1/1/2040 | | 400,000 | | 558,912 | |
New York City Municipal Water Finance Authority,
Water and Sewer System Second General Resolution Revenue Bonds (Build America Bonds) | | 5.95 | | 6/15/2042 | | 345,000 | | 431,243 | |
Ohio State University,
General Receipts Bonds (Multiyear Debt Issuance Program) | | 3.80 | | 12/1/2046 | | 250,000 | | 231,238 | |
Port Authority of New York and New Jersey,
(Consolidated Bonds, 192nd Series) | | 4.81 | | 10/15/2065 | | 300,000 | | 318,102 | |
San Diego County Water Authority Financing Agency,
Water Revenue Bonds (Build America Bonds) | | 6.14 | | 5/1/2049 | | 300,000 | | 380,979 | |
State of Connecticut,
GO, Ser. A | | 5.85 | | 3/15/2032 | | 200,000 | | 225,554 | |
| | 6,526,247 | |
Real Estate - .8% | | | | | |
Alexandria Real Estate Equities,
Gtd. Notes | | 2.75 | | 1/15/2020 | | 500,000 | | 496,020 | |
43
STATEMENT OF INVESTMENTS (continued)
| | | | | | | | | | |
| |
Description | Coupon
Rate (%) | | Maturity
Date | | Principal
Amount ($) | | Value ($) | |
Bonds and Notes - 100.4% (continued) | | | | | |
Real Estate - .8% (continued) | | | | | |
AvalonBay Communities,
Sr. Unscd. Notes | | 4.20 | | 12/15/2023 | | 400,000 | | 408,168 | |
Boston Properties,
Sr. Unscd. Bonds | | 5.63 | | 11/15/2020 | | 700,000 | | 726,775 | |
Brixmor Operating Partnership,
Sr. Unscd. Notes | | 3.90 | | 3/15/2027 | | 300,000 | | 282,068 | |
Crown Castle International,
Sr. Unscd. Notes | | 3.20 | | 9/1/2024 | | 270,000 | | 255,348 | |
Crown Castle International,
Sr. Unscd. Notes | | 3.70 | | 6/15/2026 | | 430,000 | | 406,894 | |
Duke Realty,
Gtd. Notes | | 3.75 | | 12/1/2024 | | 400,000 | | 391,763 | |
Federal Realty Investment,
Sr. Unscd. Notes | | 4.50 | | 12/1/2044 | | 200,000 | | 192,851 | |
HCP,
Sr. Unscd. Notes | | 4.25 | | 11/15/2023 | | 400,000 | | 398,067 | |
HCP,
Sr. Unscd. Notes | | 6.75 | | 2/1/2041 | | 300,000 | | 361,394 | |
Host Hotels & Resorts,
Sr. Unscd. Notes | | 6.00 | | 10/1/2021 | | 500,000 | | 525,216 | |
Kimco Realty,
Sr. Unscd. Notes | | 3.13 | | 6/1/2023 | | 250,000 | | 240,034 | |
Kimco Realty,
Sr. Unscd. Notes | | 3.20 | | 5/1/2021 | | 250,000 | | 247,582 | |
Mid-America Apartments,
Sr. Unscd. Notes | | 4.30 | | 10/15/2023 | | 400,000 | | 404,555 | |
National Retail Properties,
Sr. Unscd. Notes | | 3.90 | | 6/15/2024 | | 500,000 | | 491,844 | |
Realtyome,
Sr. Unscd. Notes | | 3.88 | | 7/15/2024 | | 500,000 | | 497,420 | |
Simon Property Group,
Sr. Unscd. Notes | | 2.50 | | 7/15/2021 | | 750,000 | | 731,995 | |
Simon Property Group,
Sr. Unscd. Notes | | 6.75 | | 2/1/2040 | | 150,000 | | 188,788 | |
Ventas Realty,
Gtd. Notes | | 2.70 | | 4/1/2020 | | 250,000 | | 247,466 | |
Ventas Realty,
Gtd. Notes | | 4.00 | | 3/1/2028 | | 300,000 | | 287,252 | |
Vereit Operating Partner,
Gtd. Notes | | 3.95 | | 8/15/2027 | | 500,000 | | 465,410 | |
Weingarten Realty Investors,
Sr. Unscd. Notes | | 3.38 | | 10/15/2022 | | 250,000 | | 245,164 | |
Welltower,
Sr. Unscd. Notes | | 4.95 | | 1/15/2021 | | 600,000 | | 613,927 | |
Weyerhaeuser,
Sr. Unscd. Debs. | | 7.38 | | 3/15/2032 | | 500,000 | | 614,941 | |
| | 9,720,942 | |
44
| | | | | | | | | | |
| |
Description | Coupon
Rate (%) | | Maturity
Date | | Principal
Amount ($) | | Value ($) | |
Bonds and Notes - 100.4% (continued) | | | | | |
Retailing - .7% | | | | | |
Autozone,
Sr. Unscd. Notes | | 3.13 | | 4/21/2026 | | 500,000 | | 460,503 | |
Costco Wholesale,
Sr. Unscd. Notes | | 2.25 | | 2/15/2022 | | 500,000 | | 483,681 | |
Costco Wholesale,
Sr. Unscd. Notes | | 3.00 | | 5/18/2027 | | 100,000 | | 94,060 | |
Dollar Tree,
Sr. Unscd. Notes | | 4.20 | | 5/15/2028 | | 95,000 | | 90,058 | |
Home Depot,
Sr. Unscd. Notes | | 2.00 | | 4/1/2021 | | 300,000 | | 291,909 | |
Home Depot,
Sr. Unscd. Notes | | 4.88 | | 2/15/2044 | | 500,000 | | 526,608 | |
Home Depot,
Sr. Unscd. Notes | | 5.88 | | 12/16/2036 | | 300,000 | | 351,863 | |
Loew's,
Sr. Unscd. Notes | | 4.05 | | 5/3/2047 | | 120,000 | | 108,976 | |
Lowe's,
Sr. Unscd. Notes | | 3.13 | | 9/15/2024 | | 500,000 | | 486,809 | |
Lowe's,
Sr. Unscd. Notes | | 4.38 | | 9/15/2045 | | 250,000 | | 240,059 | |
Macy's Retail Holdings,
Gtd. Debs. | | 6.90 | | 4/1/2029 | | 350,000 | | 367,894 | |
McDonald's,
Sr. Unscd. Notes | | 2.75 | | 12/9/2020 | | 300,000 | | 296,826 | |
McDonald's,
Sr. Unscd. Notes | | 4.88 | | 12/9/2045 | | 465,000 | | 466,735 | |
Nordstrom,
Sr. Unscd. Bonds | | 4.75 | | 5/1/2020 | | 500,000 | b | 509,854 | |
QVC,
Sr. Scd. Notes | | 5.45 | | 8/15/2034 | | 250,000 | | 222,117 | |
Starbucks,
Sr. Unscd. Notes | | 4.30 | | 6/15/2045 | | 250,000 | | 225,439 | |
Starbucks,
Sr. Unscd. Notes | | 4.50 | | 11/15/2048 | | 60,000 | | 55,872 | |
Target,
Sr. Unscd. Notes | | 2.50 | | 4/15/2026 | | 400,000 | b | 366,181 | |
Target,
Sr. Unscd. Notes | | 3.90 | | 11/15/2047 | | 50,000 | | 45,080 | |
Walgreens Boots Alliance,
Sr. Unscd. Notes | | 3.30 | | 11/18/2021 | | 400,000 | | 395,600 | |
Walgreens Boots Alliance,
Sr. Unscd. Notes | | 4.50 | | 11/18/2034 | | 400,000 | | 375,862 | |
Walmart,
Sr. Unscd. Notes | | 3.40 | | 6/26/2023 | | 265,000 | | 264,314 | |
Walmart,
Sr. Unscd. Notes | | 3.70 | | 6/26/2028 | | 195,000 | | 192,330 | |
45
STATEMENT OF INVESTMENTS (continued)
| | | | | | | | | | |
| |
Description | Coupon
Rate (%) | | Maturity
Date | | Principal
Amount ($) | | Value ($) | |
Bonds and Notes - 100.4% (continued) | | | | | |
Retailing - .7% (continued) | | | | | |
Walmart,
Sr. Unscd. Notes | | 3.95 | | 6/28/2038 | | 90,000 | | 86,285 | |
Walmart,
Sr. Unscd. Notes | | 4.05 | | 6/29/2048 | | 180,000 | | 171,411 | |
Walmart Stores,
Sr. Unscd. Notes | | 2.35 | | 12/15/2022 | | 300,000 | | 288,292 | |
Walmart Stores,
Sr. Unscd. Notes | | 3.63 | | 12/15/2047 | | 800,000 | | 710,207 | |
Wal-Mart Stores,
Sr. Unscd. Notes | | 3.63 | | 7/8/2020 | | 500,000 | | 507,591 | |
| | 8,682,416 | |
Semiconductors & Semiconductor Equipment - .4% | | | | | |
Analog Devices,
Sr. Unscd. Notes | | 2.95 | | 1/12/2021 | | 300,000 | | 296,516 | |
Applied Materials,
Sr. Unscd. Notes | | 3.90 | | 10/1/2025 | | 500,000 | | 495,917 | |
Broadcom,
Gtd. Notes | | 3.00 | | 1/15/2022 | | 760,000 | | 736,242 | |
Broadcom,
Gtd. Notes | | 3.50 | | 1/15/2028 | | 110,000 | | 97,027 | |
Broadcom,
Gtd. Notes | | 3.88 | | 1/15/2027 | | 300,000 | | 275,585 | |
Intel,
Sr. Unscd. Notes | | 3.15 | | 5/11/2027 | | 110,000 | | 105,211 | |
Intel,
Sr. Unscd. Notes | | 3.30 | | 10/1/2021 | | 850,000 | | 851,312 | |
Intel,
Sr. Unscd. Notes | | 3.73 | | 12/8/2047 | | 120,000 | | 107,128 | |
Intel,
Sr. Unscd. Notes | | 4.10 | | 5/11/2047 | | 80,000 | | 75,983 | |
Nvidia,
Sr. Unscd. Notes | | 2.20 | | 9/16/2021 | | 250,000 | | 242,647 | |
Qualcomm,
Sr. Unscd. Notes | | 2.25 | | 5/20/2020 | | 500,000 | | 493,286 | |
Qualcomm,
Sr. Unscd. Notes | | 4.30 | | 5/20/2047 | | 120,000 | | 107,785 | |
Qualcomm,
Sr. Unscd. Notes | | 4.65 | | 5/20/2035 | | 140,000 | | 138,085 | |
Qualcomm,
Sr. Unscd. Notes | | 4.80 | | 5/20/2045 | | 210,000 | | 203,519 | |
Texas Instruments,
Sr. Unscd. Notes | | 4.15 | | 5/15/2048 | | 80,000 | | 76,911 | |
Xilinx,
Sr. Unscd. Notes | | 3.00 | | 3/15/2021 | | 500,000 | | 493,827 | |
| | 4,796,981 | |
46
| | | | | | | | | | |
| |
Description | Coupon
Rate (%) | | Maturity
Date | | Principal
Amount ($) | | Value ($) | |
Bonds and Notes - 100.4% (continued) | | | | | |
Technology Hardware & Equipment - .6% | | | | | |
Apple,
Sr. Unscd. Notes | | 1.90 | | 2/7/2020 | | 300,000 | | 296,277 | |
Apple,
Sr. Unscd. Notes | | 2.00 | | 5/6/2020 | | 510,000 | | 502,284 | |
Apple,
Sr. Unscd. Notes | | 2.00 | | 11/13/2020 | | 500,000 | | 489,317 | |
Apple,
Sr. Unscd. Notes | | 2.30 | | 5/11/2022 | | 210,000 | | 202,771 | |
Apple,
Sr. Unscd. Notes | | 2.40 | | 1/13/2023 | | 160,000 | | 153,268 | |
Apple,
Sr. Unscd. Notes | | 2.50 | | 2/9/2022 | | 300,000 | | 292,481 | |
Apple,
Sr. Unscd. Notes | | 3.20 | | 5/11/2027 | | 200,000 | | 190,378 | |
Apple,
Sr. Unscd. Notes | | 3.35 | | 2/9/2027 | | 500,000 | | 482,204 | |
Apple,
Sr. Unscd. Notes | | 3.45 | | 5/6/2024 | | 500,000 | | 495,096 | |
Apple,
Sr. Unscd. Notes | | 3.75 | | 11/13/2047 | | 90,000 | | 81,059 | |
Apple,
Sr. Unscd. Notes | | 3.75 | | 9/12/2047 | | 375,000 | | 337,204 | |
Apple,
Sr. Unscd. Notes | | 4.25 | | 2/9/2047 | | 300,000 | | 292,212 | |
Apple,
Sr. Unscd. Notes | | 4.45 | | 5/6/2044 | | 500,000 | | 500,871 | |
Dell International,
Sr. Scd. Notes | | 6.02 | | 6/15/2026 | | 450,000 | a | 467,312 | |
Dell International,
Sr. Scd. Notes | | 8.35 | | 7/15/2046 | | 260,000 | a | 301,961 | |
Hewlett Packard,
Sr. Unscd. Notes | | 6.00 | | 9/15/2041 | | 200,000 | | 197,771 | |
Hewlett Packard Enterprise,
Sr. Unscd. Notes | | 4.90 | | 10/15/2025 | | 500,000 | | 508,432 | |
International Business Machines,
Sr. Unscd. Notes | | 3.45 | | 2/19/2026 | | 230,000 | | 222,397 | |
International Business Machines,
Sr. Unscd. Notes | | 5.60 | | 11/30/2039 | | 605,000 | | 680,578 | |
International Business Machines,
Sr. Unscd. Notes | | 8.38 | | 11/1/2019 | | 300,000 | | 315,792 | |
Seagate HDD,
Gtd. Bonds | | 4.75 | | 6/1/2023 | | 400,000 | | 381,068 | |
| | 7,390,733 | |
Telecommunication Services - 1.2% | | | | | |
America Movil,
Gtd. Notes | | 6.13 | | 3/30/2040 | | 350,000 | | 400,021 | |
47
STATEMENT OF INVESTMENTS (continued)
| | | | | | | | | | |
| |
Description | Coupon
Rate (%) | | Maturity
Date | | Principal
Amount ($) | | Value ($) | |
Bonds and Notes - 100.4% (continued) | | | | | |
Telecommunication Services - 1.2% (continued) | | | | | |
America Movil,
Gtd. Notes | | 6.38 | | 3/1/2035 | | 100,000 | | 114,884 | |
AT&T,
Sr. Unscd. Bonds | | 2.80 | | 2/17/2021 | | 490,000 | | 481,783 | |
AT&T,
Sr. Unscd. Notes | | 4.30 | | 2/15/2030 | | 1,307,000 | a | 1,230,937 | |
AT&T,
Sr. Unscd. Notes | | 4.50 | | 5/15/2035 | | 500,000 | | 453,174 | |
AT&T,
Sr. Unscd. Notes | | 4.50 | | 3/9/2048 | | 341,000 | | 285,219 | |
AT&T,
Sr. Unscd. Notes | | 4.55 | | 3/9/2049 | | 400,000 | | 333,414 | |
AT&T,
Sr. Unscd. Notes | | 5.35 | | 9/1/2040 | | 75,000 | | 72,036 | |
AT&T,
Sr. Unscd. Notes | | 5.70 | | 3/1/2057 | | 360,000 | | 346,713 | |
AT&T,
Sr. Unscd. Notes | | 6.00 | | 8/15/2040 | | 400,000 | | 410,215 | |
British Telecommunications,
Sr. Unscd. Notes | | 9.63 | | 12/15/2030 | | 175,000 | | 244,175 | |
Cisco Systems,
Sr. Unscd. Notes | | 2.50 | | 9/20/2026 | | 500,000 | | 456,232 | |
Cisco Systems,
Sr. Unscd. Notes | | 2.95 | | 2/28/2026 | | 500,000 | | 474,672 | |
Cisco Systems,
Sr. Unscd. Notes | | 4.45 | | 1/15/2020 | | 500,000 | | 508,517 | |
Cisco Systems,
Sr. Unscd. Notes | | 5.50 | | 1/15/2040 | | 250,000 | | 288,977 | |
Deutsche Telekom International Finance,
Gtd. Bonds | | 8.75 | | 6/15/2030 | | 300,000 | | 399,913 | |
Juniper Networks,
Sr. Unscd. Notes | | 4.35 | | 6/15/2025 | | 200,000 | | 197,452 | |
Koninklijke KPN,
Sr. Unscd. Bonds | | 8.38 | | 10/1/2030 | | 250,000 | | 321,743 | |
Motorola Solutions,
Sr. Unscd. Notes | | 3.50 | | 9/1/2021 | | 500,000 | | 493,282 | |
Orange,
Sr. Unscd. Notes | | 9.00 | | 3/1/2031 | | 300,000 | | 413,644 | |
Rogers Communications,
Gtd. Notes | | 7.50 | | 8/15/2038 | | 125,000 | | 162,084 | |
Telefonica Emisiones,
Gtd. Notes | | 5.21 | | 3/8/2047 | | 300,000 | | 280,423 | |
Telefonica Emisiones,
Gtd. Notes | | 7.05 | | 6/20/2036 | | 250,000 | | 291,683 | |
Verizon Communications,
Sr. Unscd. Bonds | | 5.25 | | 3/16/2037 | | 365,000 | | 376,387 | |
48
| | | | | | | | | | |
| |
Description | Coupon
Rate (%) | | Maturity
Date | | Principal
Amount ($) | | Value ($) | |
Bonds and Notes - 100.4% (continued) | | | | | |
Telecommunication Services - 1.2% (continued) | | | | | |
Verizon Communications,
Sr. Unscd. Notes | | 1.75 | | 8/15/2021 | | 1,000,000 | | 956,780 | |
Verizon Communications,
Sr. Unscd. Notes | | 3.38 | | 2/15/2025 | | 787,000 | | 760,960 | |
Verizon Communications,
Sr. Unscd. Notes | | 4.33 | | 9/21/2028 | | 250,000 | | 248,509 | |
Verizon Communications,
Sr. Unscd. Notes | | 4.50 | | 8/10/2033 | | 220,000 | | 214,264 | |
Verizon Communications,
Sr. Unscd. Notes | | 4.86 | | 8/21/2046 | | 750,000 | | 720,296 | |
Verizon Communications,
Sr. Unscd. Notes | | 5.01 | | 8/21/2054 | | 90,000 | | 85,302 | |
Verizon Communications,
Sr. Unscd. Notes | | 5.01 | | 4/15/2049 | | 330,000 | | 322,338 | |
Verizon Communications,
Sr. Unscd. Notes | | 5.15 | | 9/15/2023 | | 1,000,000 | | 1,062,367 | |
Vodafone Group,
Sr. Unscd. Bonds | | 6.15 | | 2/27/2037 | | 250,000 | | 264,459 | |
Vodafone Group,
Sr. Unscd. Notes | | 4.38 | | 5/30/2028 | | 225,000 | | 217,519 | |
Vodafone Group,
Sr. Unscd. Notes | | 5.00 | | 5/30/2038 | | 60,000 | | 56,624 | |
Vodafone Group,
Sr. Unscd. Notes | | 5.25 | | 5/30/2048 | | 180,000 | | 169,905 | |
Vodafone Group,
Sr. Unscd. Notes | | 7.88 | | 2/15/2030 | | 125,000 | | 153,560 | |
| | 14,270,463 | |
Transportation - .4% | | | | | |
Burlington Northern Santa Fe,
Sr. Unscd. Debs. | | 4.55 | | 9/1/2044 | | 300,000 | | 301,371 | |
Burlington Northern Santa Fe,
Sr. Unscd. Debs. | | 6.15 | | 5/1/2037 | | 300,000 | | 357,101 | |
Burlington Northern Santa Fe,
Sr. Unscd. Debs. | | 7.00 | | 12/15/2025 | | 100,000 | | 118,724 | |
Burlington Northern Santa Fe,
Sr. Unscd. Notes | | 3.05 | | 3/15/2022 | | 200,000 | | 197,452 | |
Canadian Pacific Railway,
Sr. Unscd. Notes | | 6.13 | | 3/15/2045 | | 220,000 | | 247,105 | |
CSX,
Sr. Unscd. Notes | | 3.70 | | 11/1/2023 | | 500,000 | | 499,682 | |
CSX,
Sr. Unscd. Notes | | 3.80 | | 3/1/2028 | | 200,000 | | 193,356 | |
CSX,
Sr. Unscd. Notes | | 4.30 | | 3/1/2048 | | 50,000 | | 46,295 | |
CSX,
Sr. Unscd. Notes | | 4.50 | | 8/1/2054 | | 250,000 | | 230,446 | |
49
STATEMENT OF INVESTMENTS (continued)
| | | | | | | | | | |
| |
Description | Coupon
Rate (%) | | Maturity
Date | | Principal
Amount ($) | | Value ($) | |
Bonds and Notes - 100.4% (continued) | | | | | |
Transportation - .4% (continued) | | | | | |
FedEx,
Gtd. Notes | | 4.00 | | 1/15/2024 | | 250,000 | | 254,426 | |
FedEx,
Gtd. Notes | | 4.75 | | 11/15/2045 | | 400,000 | | 381,203 | |
Kansas City Southern,
Gtd. Notes | | 4.95 | | 8/15/2045 | | 300,000 | | 299,114 | |
Norfolk Southern,
Sr. Unscd. Bonds, Ser. WI | | 4.84 | | 10/1/2041 | | 350,000 | | 355,292 | |
Norfolk Southern,
Sr. Unscd. Notes | | 3.85 | | 1/15/2024 | | 300,000 | | 300,812 | |
Union Pacific,
Sr. Unscd. Notes | | 2.75 | | 4/15/2023 | | 400,000 | b | 385,191 | |
Union Pacific,
Sr. Unscd. Notes | | 3.95 | | 9/10/2028 | | 105,000 | | 103,521 | |
Union Pacific,
Sr. Unscd. Notes | | 4.80 | | 9/10/2058 | | 110,000 | | 107,890 | |
Union Pacific,
Sr. Unscd. Notes | | 4.82 | | 2/1/2044 | | 325,000 | | 330,064 | |
United Parcel Service,
Sr. Unscd. Notes | | 3.13 | | 1/15/2021 | | 500,000 | | 499,598 | |
United Parcel Service,
Sr. Unscd. Notes | | 3.75 | | 11/15/2047 | | 80,000 | | 70,379 | |
| | 5,279,022 | |
U.S. Government Agencies - 1.2% | | | | | |
Federal Home Loan Bank,
Bonds | | 2.63 | | 12/10/2021 | | 1,500,000 | | 1,483,885 | |
Federal Home Loan Bank,
Bonds | | 4.13 | | 3/13/2020 | | 1,000,000 | | 1,017,031 | |
Federal Home Loan Bank,
Bonds | | 5.50 | | 7/15/2036 | | 480,000 | | 596,026 | |
Federal Home Loan Bank,
Bonds | | 5.63 | | 6/11/2021 | | 1,200,000 | | 1,278,772 | |
Federal Home Loan Bank,
Notes | | 1.25 | | 8/17/2021 | | 500,000 | d | 477,307 | |
Federal Home Loan Mortgage Corp.,
Notes | | 0.95 | | 1/30/2019 | | 225,000 | d | 224,260 | |
Federal Home Loan Mortgage Corp.,
Notes | | 6.25 | | 7/15/2032 | | 1,000,000 | d | 1,297,851 | |
Federal National Mortgage Association,
Notes | | 1.50 | | 6/22/2020 | | 1,400,000 | d | 1,369,815 | |
Federal National Mortgage Association,
Notes | | 5.50 | | 4/1/2034 | | 29,686 | d | 31,513 | |
Federal National Mortgage Association,
Notes | | 6.25 | | 5/15/2029 | | 540,000 | d | 674,205 | |
Federal National Mortgage Association,
Notes | | 6.63 | | 11/15/2030 | | 1,000,000 | d | 1,306,374 | |
50
| | | | | | | | | | | |
| |
Description | Coupon
Rate (%) | | Maturity
Date | | Principal
Amount ($) | | Value ($) | |
Bonds and Notes - 100.4% (continued) | | | | | |
U.S. Government Agencies - 1.2% (continued) | | | | | |
Federal National Mortgage Association,
Notes, Ser. 3 | | 1.13 | | 7/26/2019 | | 900,000 | d | 890,054 | |
Federal National Mortgage Association:,
Notes | | 1.70 | | 1/27/2020 | | 600,000 | d | 591,752 | |
Federal National Mortgage Association:,
Notes | | 1.75 | | 11/26/2019 | | 1,500,000 | b,d | 1,484,071 | |
Financing,
Scd. Bonds | | 8.60 | | 9/26/2019 | | 40,000 | | 42,045 | |
Tennessee Valley Authority,
Sr. Unscd. Bonds | | 5.25 | | 9/15/2039 | | 700,000 | | 834,534 | |
Tennessee Valley Authority,
Sr. Unscd. Bonds | | 6.15 | | 1/15/2038 | | 165,000 | | 216,619 | |
| | 13,816,114 | |
U.S. Government Agencies Mortgage-Backed - 28.9% | | | | | |
Federal Home Loan Mortgage Corp. | | | |
4.50%, 8/1/34 | | | 1,127 | d | 1,190 | |
7.50%, 6/1/24 | | | 3,396 | d | 3,556 | |
Federal Home Loan Mortgage Corp.: | | | |
3.00% | | | 3,000,000 | d.e | 2,837,397 | |
3.50% | | | 11,175,000 | d.e | 10,891,273 | |
4.00% | | | 7,500,000 | d.e | 7,505,218 | |
4.50% | | | 1,800,000 | d.e | 1,843,283 | |
5.00% | | | 50,000 | d.e | 52,217 | |
2.00%, 8/1/28-3/1/32 | | | 624,432 | d | 596,071 | |
2.50%, 10/1/27-2/1/47 | | | 6,985,937 | d | 6,708,868 | |
Ser. K017, Cl. A2, 2.87%, 12/25/21 | | | 850,000 | d | 843,041 | |
3.00%, 9/1/21-10/1/48 | | | 24,027,956 | d | 23,072,276 | |
Ser. K032, Cl. A1, 3.02%, 2/25/23 | | | 336,331 | d | 335,237 | |
Ser. K043, Cl. A2, 3.06%, 12/25/24 | | | 648,000 | d | 635,485 | |
3.50%, 1/1/21-9/1/48 | | | 18,306,741 | d | 17,962,529 | |
4.00%, 4/1/24-8/1/48 | | | 12,449,058 | d | 12,532,398 | |
4.50%, 11/1/18-7/1/48 | | | 5,237,282 | d | 5,406,393 | |
5.00%, 5/1/23-9/1/48 | | | 2,172,256 | d | 2,292,231 | |
5.50%, 10/1/20-1/1/40 | | | 1,455,618 | d | 1,559,828 | |
6.00%, 6/1/22-7/1/39 | | | 670,141 | d | 733,652 | |
6.50%, 3/1/19-9/1/37 | | | 153,350 | d | 169,012 | |
7.00%, 6/1/21-9/1/31 | | | 27,519 | d | 29,694 | |
7.50%, 2/1/23-11/1/33 | | | 15,619 | d | 16,997 | |
8.00%, 7/1/20-10/1/31 | | | 8,975 | d | 9,926 | |
8.50%, 6/1/30 | | | 387 | d | 441 | |
Federal National Mortgage Association: | | | |
2.50% | | | 600,000 | d,e | 574,441 | |
3.00% | | | 2,150,000 | d,e | 2,049,943 | |
3.50% | | | 17,575,000 | d,e | 17,128,203 | |
51
STATEMENT OF INVESTMENTS (continued)
| | | | | | | | | | |
| |
Description | Coupon
Rate (%) | | Maturity
Date | | Principal
Amount ($) | | Value ($) | |
Bonds and Notes - 100.4% (continued) | | | | | |
U.S. Government Agencies Mortgage-Backed - 28.9% (continued) | | | | | |
4.00% | | | 13,550,000 | d,e | 13,549,502 | |
4.50% | | | 2,900,000 | d,e | 2,968,830 | |
1.25%, 2/26/19 | | | 1,000,000 | d | 996,177 | |
2.00%, 7/1/28-3/1/32 | | | 1,004,661 | d | 953,918 | |
2.50%, 7/1/27-2/1/47 | | | 9,132,815 | d | 8,742,164 | |
Ser. 2013-M14, Cl. APT, 2.52%, 4/25/23 | | | 799,639 | d | 778,512 | |
3.00%, 10/1/26-7/1/48 | | | 36,873,967 | d | 35,404,099 | |
3.50%, 8/1/25-11/1/48 | | | 27,008,088 | d | 26,539,108 | |
3.59%, 11/1/35 | | | 84 | d | 88 | |
Ser. 2010-M7, Cl. A2, 3.66%, 11/25/20 | | | 354,346 | d | 356,220 | |
4.00%, 7/1/24-7/1/48 | | | 20,212,971 | d | 20,336,287 | |
4.50%, 5/1/19-5/1/48 | | | 9,534,921 | d | 9,841,482 | |
5.00%, 4/1/20-1/1/44 | | | 3,654,417 | d | 3,853,037 | |
5.50%, 1/1/32-12/1/38 | | | 1,999,035 | d | 2,137,954 | |
6.00%, 1/1/23-11/1/38 | | | 1,308,022 | d | 1,421,008 | |
6.50%, 10/1/21-12/1/37 | | | 412,626 | d | 452,923 | |
7.00%, 8/1/23-7/1/32 | | | 33,857 | d | 36,854 | |
7.50%, 4/1/26-6/1/31 | | | 23,454 | d | 25,185 | |
8.00%, 3/1/22-8/1/30 | | | 6,550 | d | 7,062 | |
8.50%, 7/1/30 | | | 197 | d | 221 | |
Government National Mortgage Association I: | | | |
2.50%, 2/15/28-9/15/46 | | | 237,243 | | 223,493 | |
3.00%, 9/15/42-8/15/45 | | | 1,390,719 | | 1,335,518 | |
3.50%, 2/15/26-8/15/45 | | | 1,443,101 | | 1,426,662 | |
4.00%, 2/15/41-9/15/45 | | | 1,681,504 | | 1,705,590 | |
4.50%, 1/15/19-2/15/41 | | | 1,708,736 | | 1,770,405 | |
5.00%, 7/15/33-4/15/40 | | | 2,480,876 | | 2,619,007 | |
5.50%, 9/15/20-11/15/38 | | | 827,212 | | 885,138 | |
6.00%, 1/15/29-9/15/38 | | | 164,559 | | 178,130 | |
6.50%, 2/15/24-11/15/33 | | | 79,874 | | 87,526 | |
7.00%, 10/15/27-8/15/32 | | | 44,596 | | 48,725 | |
7.50%, 12/15/23-11/15/30 | | | 20,581 | | 20,869 | |
8.00%, 8/15/24-3/15/32 | | | 10,233 | | 11,701 | |
8.25%, 6/15/27 | | | 980 | | 1,031 | |
8.50%, 10/15/26 | | | 4,255 | | 4,309 | |
9.00%, 2/15/22-2/15/23 | | | 4,521 | | 4,541 | |
Government National Mortgage Association II: | | | |
3.00% | | | 15,500,000 | e | 14,818,242 | |
3.50% | | | 23,850,000 | e | 23,427,500 | |
4.00% | | | 12,775,000 | e | 12,856,160 | |
52
| | | | | | | | | | | |
| |
Description | Coupon
Rate (%) | | Maturity
Date | | Principal
Amount ($) | | Value ($) | |
Bonds and Notes - 100.4% (continued) | | | | | |
U.S. Government Agencies Mortgage-Backed - 28.9% (continued) | | | | | |
4.50% | | | 3,675,000 | e | 3,769,121 | |
5.00% | | | 500,000 | e | 519,883 | |
2.50%, 3/20/27-3/20/47 | | | 1,012,450 | | 954,396 | |
3.00%, 11/20/27-4/20/48 | | | 9,290,854 | | 8,957,126 | |
3.50%, 9/20/28-6/1/48 | | | 13,132,042 | | 12,953,283 | |
4.00%, 9/20/43-7/20/47 | | | 6,714,506 | | 6,807,152 | |
4.50%, 7/20/41-10/20/47 | | | 4,078,006 | | 4,240,374 | |
5.00%, 1/20/39-3/1/48 | | | 1,758,767 | | 1,850,664 | |
5.50%, 10/20/31-6/20/41 | | | 512,752 | | 544,880 | |
6.50%, 2/20/28 | | | 412 | | 456 | |
8.50%, 7/20/25 | | | 181 | | 192 | |
| | 346,213,505 | |
U.S. Government Securities - 38.4% | | | | | |
U.S. Treasury Bonds | | 2.25 | | 8/15/2046 | | 4,250,000 | | 3,377,173 | |
U.S. Treasury Bonds | | 2.50 | | 2/15/2046 | | 2,400,000 | | 2,018,344 | |
U.S. Treasury Bonds | | 2.50 | | 5/15/2046 | | 3,040,000 | | 2,554,075 | |
U.S. Treasury Bonds | | 2.50 | | 2/15/2045 | | 3,605,000 | | 3,047,070 | |
U.S. Treasury Bonds | | 2.75 | | 11/15/2042 | | 1,892,000 | | 1,694,522 | |
U.S. Treasury Bonds | | 2.75 | | 8/15/2042 | | 1,150,000 | | 1,031,159 | |
U.S. Treasury Bonds | | 2.75 | | 11/15/2047 | | 2,280,000 | | 2,010,497 | |
U.S. Treasury Bonds | | 2.75 | | 8/15/2047 | | 540,000 | | 476,497 | |
U.S. Treasury Bonds | | 2.88 | | 8/15/2045 | | 3,720,000 | | 3,382,948 | |
U.S. Treasury Bonds | | 2.88 | | 5/15/2043 | | 3,057,000 | | 2,796,140 | |
U.S. Treasury Bonds | | 2.88 | | 11/15/2046 | | 3,000,000 | | 2,720,859 | |
U.S. Treasury Bonds | | 3.00 | | 8/15/2048 | | 2,135,000 | b | 1,980,212 | |
U.S. Treasury Bonds | | 3.00 | | 2/15/2048 | | 2,450,000 | | 2,272,279 | |
U.S. Treasury Bonds | | 3.00 | | 11/15/2044 | | 3,760,000 | | 3,509,137 | |
U.S. Treasury Bonds | | 3.00 | | 2/15/2047 | | 1,950,000 | | 1,812,929 | |
U.S. Treasury Bonds | | 3.00 | | 5/15/2047 | | 2,685,000 | | 2,494,428 | |
U.S. Treasury Bonds | | 3.00 | | 5/15/2045 | | 3,640,000 | | 3,393,589 | |
U.S. Treasury Bonds | | 3.13 | | 8/15/2044 | | 2,685,000 | | 2,564,280 | |
U.S. Treasury Bonds | | 3.13 | | 2/15/2042 | | 2,290,000 | | 2,200,189 | |
U.S. Treasury Bonds | | 3.13 | | 5/15/2048 | | 3,275,000 | | 3,114,256 | |
U.S. Treasury Bonds | | 3.13 | | 2/15/2043 | | 390,000 | | 373,128 | |
U.S. Treasury Bonds | | 3.38 | | 5/15/2044 | | 490,000 | | 489,120 | |
U.S. Treasury Bonds | | 3.50 | | 2/15/2039 | | 1,030,000 | | 1,060,176 | |
U.S. Treasury Bonds | | 3.63 | | 8/15/2043 | | 3,245,000 | | 3,374,230 | |
U.S. Treasury Bonds | | 3.63 | | 2/15/2044 | | 3,070,000 | | 3,193,759 | |
U.S. Treasury Bonds | | 3.75 | | 8/15/2041 | | 810,000 | | 859,961 | |
U.S. Treasury Bonds | | 3.75 | | 11/15/2043 | | 2,615,000 | | 2,775,424 | |
U.S. Treasury Bonds | | 3.88 | | 8/15/2040 | | 370,000 | | 400,344 | |
U.S. Treasury Bonds | | 4.25 | | 5/15/2039 | | 1,015,000 | | 1,156,624 | |
53
STATEMENT OF INVESTMENTS (continued)
| | | | | | | | | | |
| |
Description | Coupon
Rate (%) | | Maturity
Date | | Principal
Amount ($) | | Value ($) | |
Bonds and Notes - 100.4% (continued) | | | | | |
U.S. Government Securities - 38.4% (continued) | | | | | |
U.S. Treasury Bonds | | 4.38 | | 2/15/2038 | | 1,480,000 | | 1,712,291 | |
U.S. Treasury Bonds | | 4.50 | | 5/15/2038 | | 1,395,000 | b | 1,640,215 | |
U.S. Treasury Bonds | | 4.63 | | 2/15/2040 | | 360,000 | | 430,833 | |
U.S. Treasury Bonds | | 4.75 | | 2/15/2041 | | 2,530,000 | | 3,085,809 | |
U.S. Treasury Bonds | | 4.75 | | 2/15/2037 | | 1,350,000 | | 1,628,279 | |
U.S. Treasury Bonds | | 5.25 | | 11/15/2028 | | 805,000 | | 948,988 | |
U.S. Treasury Bonds | | 5.25 | | 2/15/2029 | | 345,000 | | 407,888 | |
U.S. Treasury Bonds | | 5.38 | | 2/15/2031 | | 510,000 | b | 623,156 | |
U.S. Treasury Bonds | | 5.50 | | 8/15/2028 | | 810,000 | | 969,374 | |
U.S. Treasury Bonds | | 6.13 | | 11/15/2027 | | 1,470,000 | | 1,814,101 | |
U.S. Treasury Bonds | | 6.25 | | 8/15/2023 | | 1,110,000 | | 1,271,796 | |
U.S. Treasury Bonds | | 7.13 | | 2/15/2023 | | 2,000,000 | | 2,333,672 | |
U.S. Treasury Bonds | | 7.25 | | 8/15/2022 | | 275,000 | | 317,158 | |
U.S. Treasury Bonds | | 8.13 | | 5/15/2021 | | 190,000 | | 214,073 | |
U.S. Treasury Bonds | | 8.50 | | 2/15/2020 | | 3,950,000 | | 4,234,138 | |
U.S. Treasury Bonds | | 8.75 | | 8/15/2020 | | 470,000 | | 517,909 | |
U.S. Treasury Notes | | 1.13 | | 7/31/2021 | | 2,455,000 | | 2,339,203 | |
U.S. Treasury Notes | | 1.13 | | 9/30/2021 | | 2,260,000 | | 2,146,913 | |
U.S. Treasury Notes | | 1.13 | | 3/31/2020 | | 1,800,000 | | 1,758,340 | |
U.S. Treasury Notes | | 1.13 | | 2/28/2021 | | 3,300,000 | | 3,169,611 | |
U.S. Treasury Notes | | 1.13 | | 6/30/2021 | | 3,000,000 | | 2,864,004 | |
U.S. Treasury Notes | | 1.13 | | 12/31/2019 | | 1,990,000 | | 1,953,193 | |
U.S. Treasury Notes | | 1.13 | | 8/31/2021 | | 1,950,000 | | 1,855,280 | |
U.S. Treasury Notes | | 1.25 | | 7/31/2023 | | 120,000 | | 110,871 | |
U.S. Treasury Notes | | 1.25 | | 1/31/2020 | | 2,220,000 | | 2,178,895 | |
U.S. Treasury Notes | | 1.25 | | 3/31/2021 | | 1,790,000 | | 1,722,176 | |
U.S. Treasury Notes | | 1.25 | | 10/31/2021 | | 2,695,000 | | 2,565,619 | |
U.S. Treasury Notes | | 1.38 | | 9/30/2023 | | 395,000 | | 366,054 | |
U.S. Treasury Notes | | 1.38 | | 4/30/2021 | | 2,000,000 | | 1,926,914 | |
U.S. Treasury Notes | | 1.38 | | 6/30/2023 | | 2,035,000 | | 1,893,742 | |
U.S. Treasury Notes | | 1.38 | | 5/31/2021 | | 1,120,000 | | 1,077,541 | |
U.S. Treasury Notes | | 1.38 | | 2/15/2020 | | 2,020,000 | | 1,984,098 | |
U.S. Treasury Notes | | 1.38 | | 1/31/2021 | | 500,000 | | 483,604 | |
U.S. Treasury Notes | | 1.38 | | 10/31/2020 | | 3,325,000 | | 3,228,692 | |
U.S. Treasury Notes | | 1.38 | | 1/31/2020 | | 1,400,000 | | 1,376,320 | |
U.S. Treasury Notes | | 1.38 | | 12/15/2019 | | 890,000 | | 876,685 | |
U.S. Treasury Notes | | 1.38 | | 8/31/2023 | | 2,180,000 | | 2,023,058 | |
U.S. Treasury Notes | | 1.38 | | 9/30/2020 | | 3,095,000 | | 3,010,008 | |
U.S. Treasury Notes | | 1.38 | | 3/31/2020 | | 995,000 | | 975,236 | |
U.S. Treasury Notes | | 1.38 | | 2/29/2020 | | 3,525,000 | | 3,459,939 | |
U.S. Treasury Notes | | 1.38 | | 4/30/2020 | | 2,525,000 | | 2,471,689 | |
U.S. Treasury Notes | | 1.38 | | 8/31/2020 | | 1,300,000 | | 1,265,672 | |
U.S. Treasury Notes | | 1.38 | | 9/15/2020 | | 1,715,000 | | 1,669,010 | |
54
| | | | | | | | | | |
| |
Description | Coupon
Rate (%) | | Maturity
Date | | Principal
Amount ($) | | Value ($) | |
Bonds and Notes - 100.4% (continued) | | | | | |
U.S. Government Securities - 38.4% (continued) | | | | | |
U.S. Treasury Notes | | 1.50 | | 8/15/2026 | | 3,865,000 | | 3,439,701 | |
U.S. Treasury Notes | | 1.50 | | 11/30/2019 | | 1,850,000 | | 1,825,972 | |
U.S. Treasury Notes | | 1.50 | | 2/28/2023 | | 895,000 | | 841,685 | |
U.S. Treasury Notes | | 1.50 | | 8/15/2020 | | 1,745,000 | | 1,703,965 | |
U.S. Treasury Notes | | 1.50 | | 7/15/2020 | | 2,195,000 | | 2,145,998 | |
U.S. Treasury Notes | | 1.50 | | 5/31/2020 | | 2,610,000 | | 2,556,373 | |
U.S. Treasury Notes | | 1.50 | | 1/31/2022 | | 2,600,000 | | 2,484,371 | |
U.S. Treasury Notes | | 1.50 | | 4/15/2020 | | 2,395,000 | | 2,350,328 | |
U.S. Treasury Notes | | 1.50 | | 5/15/2020 | | 1,925,000 | | 1,886,688 | |
U.S. Treasury Notes | | 1.63 | | 10/31/2023 | | 205,000 | | 192,119 | |
U.S. Treasury Notes | | 1.63 | | 11/15/2022 | | 4,335,000 | | 4,114,863 | |
U.S. Treasury Notes | | 1.63 | | 8/15/2022 | | 55,000 | | 52,380 | |
U.S. Treasury Notes | | 1.63 | | 11/30/2020 | | 2,525,000 | | 2,461,234 | |
U.S. Treasury Notes | | 1.63 | | 4/30/2023 | | 1,460,000 | | 1,377,447 | |
U.S. Treasury Notes | | 1.63 | | 5/31/2023 | | 3,610,000 | | 3,402,354 | |
U.S. Treasury Notes | | 1.63 | | 12/31/2019 | | 1,220,000 | | 1,204,345 | |
U.S. Treasury Notes | | 1.63 | | 2/15/2026 | | 5,270,000 | | 4,770,585 | |
U.S. Treasury Notes | | 1.63 | | 5/15/2026 | | 3,880,000 | | 3,499,881 | |
U.S. Treasury Notes | | 1.63 | | 3/15/2020 | | 3,020,000 | | 2,972,577 | |
U.S. Treasury Notes | | 1.63 | | 10/15/2020 | | 1,365,000 | | 1,332,848 | |
U.S. Treasury Notes | | 1.63 | | 7/31/2020 | | 3,410,000 | | 3,338,470 | |
U.S. Treasury Notes | | 1.63 | | 8/31/2022 | | 1,835,000 | | 1,746,619 | |
U.S. Treasury Notes | | 1.63 | | 6/30/2020 | | 2,700,000 | | 2,646,949 | |
U.S. Treasury Notes | | 1.75 | | 11/15/2020 | | 1,525,000 | | 1,491,104 | |
U.S. Treasury Notes | | 1.75 | | 12/31/2020 | | 2,220,000 | | 2,167,795 | |
U.S. Treasury Notes | | 1.75 | | 4/30/2022 | | 4,000,000 | | 3,841,328 | |
U.S. Treasury Notes | | 1.75 | | 2/28/2022 | | 500,000 | | 481,221 | |
U.S. Treasury Notes | | 1.75 | | 6/30/2022 | | 990,000 | | 948,814 | |
U.S. Treasury Notes | | 1.75 | | 1/31/2023 | | 2,970,000 | | 2,825,619 | |
U.S. Treasury Notes | | 1.75 | | 9/30/2022 | | 1,840,000 | | 1,757,847 | |
U.S. Treasury Notes | | 1.75 | | 5/31/2022 | | 3,035,000 | | 2,911,703 | |
U.S. Treasury Notes | | 1.75 | | 3/31/2022 | | 2,520,000 | | 2,422,793 | |
U.S. Treasury Notes | | 1.75 | | 10/31/2020 | | 3,000,000 | | 2,935,020 | |
U.S. Treasury Notes | | 1.75 | | 11/30/2021 | | 3,360,000 | | 3,243,450 | |
U.S. Treasury Notes | | 1.75 | | 5/15/2023 | | 3,920,000 | | 3,717,798 | |
U.S. Treasury Notes | | 1.75 | | 5/15/2022 | | 1,500,000 | | 1,439,736 | |
U.S. Treasury Notes | | 1.88 | | 8/31/2022 | | 1,000,000 | | 960,762 | |
U.S. Treasury Notes | | 1.88 | | 9/30/2022 | | 2,490,000 | | 2,390,595 | |
U.S. Treasury Notes | | 1.88 | | 3/31/2022 | | 1,980,000 | | 1,911,435 | |
U.S. Treasury Notes | | 1.88 | | 10/31/2022 | | 2,910,000 | | 2,791,213 | |
U.S. Treasury Notes | | 1.88 | | 7/31/2022 | | 2,800,000 | | 2,692,867 | |
U.S. Treasury Notes | | 1.88 | | 8/31/2024 | | 2,035,000 | | 1,911,032 | |
U.S. Treasury Notes | | 1.88 | | 1/31/2022 | | 1,810,000 | | 1,750,468 | |
55
STATEMENT OF INVESTMENTS (continued)
| | | | | | | | | | |
| |
Description | Coupon
Rate (%) | | Maturity
Date | | Principal
Amount ($) | | Value ($) | |
Bonds and Notes - 100.4% (continued) | | | | | |
U.S. Government Securities - 38.4% (continued) | | | | | |
U.S. Treasury Notes | | 1.88 | | 5/31/2022 | | 1,000,000 | | 963,613 | |
U.S. Treasury Notes | | 1.88 | | 11/30/2021 | | 2,800,000 | b | 2,713,375 | |
U.S. Treasury Notes | | 1.88 | | 2/28/2022 | | 2,100,000 | | 2,029,207 | |
U.S. Treasury Notes | | 1.88 | | 12/31/2019 | | 1,645,000 | | 1,628,743 | |
U.S. Treasury Notes | | 1.88 | | 12/15/2020 | | 1,000,000 | | 979,492 | |
U.S. Treasury Notes | | 1.88 | | 4/30/2022 | | 3,305,000 | | 3,187,518 | |
U.S. Treasury Notes | | 2.00 | | 11/15/2026 | | 4,230,000 | | 3,898,044 | |
U.S. Treasury Notes | | 2.00 | | 12/31/2021 | | 1,875,000 | | 1,822,083 | |
U.S. Treasury Notes | | 2.00 | | 4/30/2024 | | 1,960,000 | | 1,860,430 | |
U.S. Treasury Notes | | 2.00 | | 6/30/2024 | | 1,155,000 | | 1,094,114 | |
U.S. Treasury Notes | | 2.00 | | 2/15/2023 | | 3,745,000 | | 3,599,223 | |
U.S. Treasury Notes | | 2.00 | | 2/15/2022 | | 1,300,000 | | 1,261,939 | |
U.S. Treasury Notes | | 2.00 | | 7/31/2020 | | 1,455,000 | | 1,433,800 | |
U.S. Treasury Notes | | 2.00 | | 7/31/2022 | | 1,840,000 | | 1,777,936 | |
U.S. Treasury Notes | | 2.00 | | 11/15/2021 | | 3,180,000 | | 3,095,159 | |
U.S. Treasury Notes | | 2.00 | | 5/31/2024 | | 2,675,000 | | 2,536,809 | |
U.S. Treasury Notes | | 2.00 | | 9/30/2020 | | 745,000 | | 732,967 | |
U.S. Treasury Notes | | 2.00 | | 2/15/2025 | | 1,070,000 | | 1,005,800 | |
U.S. Treasury Notes | | 2.00 | | 8/15/2025 | | 4,815,000 | | 4,499,956 | |
U.S. Treasury Notes | | 2.00 | | 11/30/2020 | | 1,398,000 | | 1,373,344 | |
U.S. Treasury Notes | | 2.00 | | 10/31/2021 | | 2,845,000 | | 2,769,374 | |
U.S. Treasury Notes | | 2.00 | | 1/15/2021 | | 1,950,000 | | 1,913,285 | |
U.S. Treasury Notes | | 2.00 | | 10/31/2022 | | 3,050,000 | | 2,939,854 | |
U.S. Treasury Notes | | 2.00 | | 1/31/2020 | | 70,000 | | 69,346 | |
U.S. Treasury Notes | | 2.00 | | 11/30/2022 | | 2,540,000 | | 2,446,238 | |
U.S. Treasury Notes | | 2.13 | | 11/30/2023 | | 2,560,000 | | 2,456,150 | |
U.S. Treasury Notes | | 2.13 | | 5/15/2025 | | 2,575,000 | | 2,432,570 | |
U.S. Treasury Notes | | 2.13 | | 8/15/2021 | | 2,925,000 | | 2,862,958 | |
U.S. Treasury Notes | | 2.13 | | 3/31/2024 | | 910,000 | | 870,223 | |
U.S. Treasury Notes | | 2.13 | | 8/31/2020 | | 1,710,000 | | 1,687,523 | |
U.S. Treasury Notes | | 2.13 | | 2/29/2024 | | 2,510,000 | | 2,402,246 | |
U.S. Treasury Notes | | 2.13 | | 6/30/2021 | | 1,500,000 | | 1,470,059 | |
U.S. Treasury Notes | | 2.13 | | 12/31/2022 | | 4,480,000 | | 4,331,775 | |
U.S. Treasury Notes | | 2.13 | | 7/31/2024 | | 3,000,000 | | 2,858,145 | |
U.S. Treasury Notes | | 2.13 | | 12/31/2021 | | 1,265,000 | | 1,234,190 | |
U.S. Treasury Notes | | 2.13 | | 9/30/2024 | | 1,590,000 | | 1,512,301 | |
U.S. Treasury Notes | | 2.13 | | 6/30/2022 | | 2,500,000 | | 2,428,369 | |
U.S. Treasury Notes | | 2.13 | | 9/30/2021 | | 2,100,000 | | 2,053,119 | |
U.S. Treasury Notes | | 2.25 | | 4/30/2021 | | 1,790,000 | | 1,762,276 | |
U.S. Treasury Notes | | 2.25 | | 8/15/2027 | | 3,155,000 | | 2,941,914 | |
U.S. Treasury Notes | | 2.25 | | 12/31/2023 | | 1,430,000 | | 1,379,391 | |
U.S. Treasury Notes | | 2.25 | | 1/31/2024 | | 2,065,000 | | 1,990,224 | |
U.S. Treasury Notes | | 2.25 | | 2/15/2027 | | 5,350,000 | | 5,012,908 | |
56
| | | | | | | | | | |
| |
Description | Coupon
Rate (%) | | Maturity
Date | | Principal
Amount ($) | | Value ($) | |
Bonds and Notes - 100.4% (continued) | | | | | |
U.S. Government Securities - 38.4% (continued) | | | | | |
U.S. Treasury Notes | | 2.25 | | 7/31/2021 | | 2,000,000 | | 1,964,922 | |
U.S. Treasury Notes | | 2.25 | | 12/31/2024 | | 2,000,000 | | 1,911,250 | |
U.S. Treasury Notes | | 2.25 | | 2/29/2020 | | 1,685,000 | | 1,673,054 | |
U.S. Treasury Notes | | 2.25 | | 3/31/2020 | | 1,815,000 | | 1,800,998 | |
U.S. Treasury Notes | | 2.25 | | 2/15/2021 | | 1,565,000 | | 1,542,839 | |
U.S. Treasury Notes | | 2.25 | | 11/15/2027 | | 2,780,000 | | 2,587,192 | |
U.S. Treasury Notes | | 2.25 | | 11/15/2025 | | 4,480,000 | | 4,246,725 | |
U.S. Treasury Notes | | 2.25 | | 3/31/2021 | | 640,000 | | 630,450 | |
U.S. Treasury Notes | | 2.25 | | 11/15/2024 | | 3,580,000 | | 3,424,913 | |
U.S. Treasury Notes | | 2.38 | | 4/15/2021 | | 1,805,000 | | 1,782,579 | |
U.S. Treasury Notes | | 2.38 | | 8/15/2024 | | 2,565,000 | | 2,476,127 | |
U.S. Treasury Notes | | 2.38 | | 1/31/2023 | | 2,055,000 | | 2,006,475 | |
U.S. Treasury Notes | | 2.38 | | 5/15/2027 | | 4,040,000 | | 3,816,143 | |
U.S. Treasury Notes | | 2.38 | | 3/15/2021 | | 2,695,000 | | 2,663,207 | |
U.S. Treasury Notes | | 2.38 | | 4/30/2020 | | 1,925,000 | | 1,912,367 | |
U.S. Treasury Notes | | 2.38 | | 12/31/2020 | | 1,970,000 | | 1,949,107 | |
U.S. Treasury Notes | | 2.50 | | 8/15/2023 | | 1,640,000 | | 1,605,150 | |
U.S. Treasury Notes | | 2.50 | | 1/31/2025 | | 3,200,000 | | 3,101,437 | |
U.S. Treasury Notes | | 2.50 | | 3/31/2023 | | 2,120,000 | | 2,078,925 | |
U.S. Treasury Notes | | 2.50 | | 5/15/2024 | | 4,690,000 | | 4,567,529 | |
U.S. Treasury Notes | | 2.50 | | 6/30/2020 | | 2,050,000 | | 2,038,549 | |
U.S. Treasury Notes | | 2.50 | | 5/31/2020 | | 1,990,000 | | 1,979,661 | |
U.S. Treasury Notes | | 2.63 | | 7/15/2021 | | 2,000,000 | | 1,984,805 | |
U.S. Treasury Notes | | 2.63 | | 6/30/2023 | | 2,170,000 | | 2,137,026 | |
U.S. Treasury Notes | | 2.63 | | 2/28/2023 | | 2,105,000 | | 2,075,974 | |
U.S. Treasury Notes | | 2.63 | | 7/31/2020 | | 2,120,000 | | 2,111,760 | |
U.S. Treasury Notes | | 2.63 | | 5/15/2021 | | 1,870,000 | | 1,857,034 | |
U.S. Treasury Notes | | 2.63 | | 11/15/2020 | | 2,650,000 | | 2,636,698 | |
U.S. Treasury Notes | | 2.63 | | 8/15/2020 | | 2,170,000 | | 2,160,888 | |
U.S. Treasury Notes | | 2.63 | | 6/15/2021 | | 2,000,000 | | 1,985,664 | |
U.S. Treasury Notes | | 2.63 | | 8/31/2020 | | 2,175,000 | | 2,165,952 | |
U.S. Treasury Notes | | 2.75 | | 2/28/2025 | | 3,000,000 | | 2,949,023 | |
U.S. Treasury Notes | | 2.75 | | 7/31/2023 | | 2,180,000 | | 2,158,200 | |
U.S. Treasury Notes | | 2.75 | | 2/15/2028 | | 5,510,000 | | 5,336,952 | |
U.S. Treasury Notes | | 2.75 | | 2/15/2024 | | 2,780,000 | | 2,746,173 | |
U.S. Treasury Notes | | 2.75 | | 9/15/2021 | | 2,090,000 | | 2,079,917 | |
U.S. Treasury Notes | | 2.75 | | 8/31/2025 | | 1,870,000 | | 1,833,915 | |
U.S. Treasury Notes | | 2.75 | | 4/30/2023 | | 2,110,000 | | 2,090,631 | |
U.S. Treasury Notes | | 2.75 | | 9/30/2020 | | 2,210,000 | | 2,205,252 | |
U.S. Treasury Notes | | 2.75 | | 8/15/2021 | | 2,050,000 | | 2,040,271 | |
U.S. Treasury Notes | | 2.75 | | 8/31/2023 | | 2,235,000 | | 2,213,130 | |
U.S. Treasury Notes | | 2.75 | | 11/15/2023 | | 2,865,000 | | 2,833,608 | |
U.S. Treasury Notes | | 2.75 | | 5/31/2023 | | 3,500,000 | | 3,467,803 | |
57
STATEMENT OF INVESTMENTS (continued)
| | | | | | | | | | |
| |
Description | Coupon
Rate (%) | | Maturity
Date | | Principal
Amount ($) | | Value ($) | |
Bonds and Notes - 100.4% (continued) | | | | | |
U.S. Government Securities - 38.4% (continued) | | | | | |
U.S. Treasury Notes | | 2.88 | | 10/31/2023 | | 2,320,000 | | 2,308,717 | |
U.S. Treasury Notes | | 2.88 | | 10/31/2020 | | 2,260,000 | | 2,260,132 | |
U.S. Treasury Notes | | 2.88 | | 10/15/2021 | | 2,145,000 | | 2,141,858 | |
U.S. Treasury Notes | | 2.88 | | 8/15/2028 | | 3,425,000 | | 3,346,600 | |
U.S. Treasury Notes | | 2.88 | | 5/15/2028 | | 4,925,000 | | 4,816,400 | |
U.S. Treasury Notes | | 2.88 | | 5/31/2025 | | 810,000 | | 801,251 | |
U.S. Treasury Notes | | 2.88 | | 4/30/2025 | | 1,745,000 | b | 1,726,800 | |
U.S. Treasury Notes | | 2.88 | | 9/30/2023 | | 2,270,000 | b | 2,258,960 | |
U.S. Treasury Notes | | 3.00 | | 10/31/2025 | | 850,000 | | 846,314 | |
U.S. Treasury Notes | | 3.00 | | 9/30/2025 | | 4,000,000 | | 3,983,594 | |
U.S. Treasury Notes | | 3.13 | | 5/15/2021 | | 2,700,000 | | 2,714,924 | |
U.S. Treasury Notes | | 3.50 | | 5/15/2020 | | 1,770,000 | | 1,787,977 | |
U.S. Treasury Notes | | 3.63 | | 2/15/2021 | | 1,040,000 | | 1,056,656 | |
U.S. Treasury Notes | | 3.63 | | 2/15/2020 | | 2,400,000 | | 2,425,031 | |
| | 460,599,227 | |
Utilities - 1.8% | | | | | |
AGL Capital,
Gtd. Notes | | 3.50 | | 9/15/2021 | | 193,000 | | 192,593 | |
Alabama Power,
Sr. Unscd. Notes, Ser. B | | 3.70 | | 12/1/2047 | | 200,000 | | 175,415 | |
American Water Capital,
Sr. Unscd. Notes | | 3.75 | | 9/1/2047 | | 110,000 | | 96,107 | |
American Water Capital,
Sr. Unscd. Notes | | 3.85 | | 3/1/2024 | | 250,000 | | 251,389 | |
Atmos Energy,
Sr. Unscd. Notes | | 4.13 | | 10/15/2044 | | 350,000 | | 333,624 | |
Berkshire Hathaway Energy,
Sr. Unscd. Notes | | 3.80 | | 7/15/2048 | | 445,000 | | 386,362 | |
Berkshire Hathaway Energy,
Sr. Unscd. Notes | | 5.15 | | 11/15/2043 | | 250,000 | | 264,946 | |
Commonwealth Edison,
First Mortgage Bonds | | 5.90 | | 3/15/2036 | | 471,000 | | 545,930 | |
Consolidated Edison of New York,
Sr. Unscd. Debs., Ser. 06-B | | 6.20 | | 6/15/2036 | | 200,000 | | 238,067 | |
Consolidated Edison of New York,
Sr. Unscd. Notes, Ser. C | | 4.30 | | 12/1/2056 | | 450,000 | | 413,747 | |
Dominion Resources,
Sr. Unscd. Notes, Ser. B | | 2.75 | | 9/15/2022 | | 200,000 | | 193,089 | |
Dominion Resources,
Sr. Unscd. Notes, Ser. C | | 4.05 | | 9/15/2042 | | 400,000 | | 356,460 | |
Dominion Resources,
Sr. Unscd. Notes, Ser. E | | 6.30 | | 3/15/2033 | | 100,000 | | 115,783 | |
DTE Electric,
Mortgage Bonds | | 3.38 | | 3/1/2025 | | 500,000 | b | 487,957 | |
58
| | | | | | | | | | |
| |
Description | Coupon
Rate (%) | | Maturity
Date | | Principal
Amount ($) | | Value ($) | |
Bonds and Notes - 100.4% (continued) | | | | | |
Utilities - 1.8% (continued) | | | | | |
DTE Electric,
Sr. Scd. Notes | | 3.45 | | 10/1/2020 | | 350,000 | | 350,585 | |
Duke Energy,
Sr. Unscd. Notes | | 3.75 | | 4/15/2024 | | 500,000 | | 496,133 | |
Duke Energy Carolinas,
First Mortgage Bonds | | 3.90 | | 6/15/2021 | | 400,000 | | 406,003 | |
Duke Energy Carolinas,
First Mortgage Bonds | | 4.00 | | 9/30/2042 | | 250,000 | | 233,917 | |
Duke Energy Florida,
First Mortgage Bonds | | 3.40 | | 10/1/2046 | | 300,000 | | 251,193 | |
Duke Energy Florida,
First Mortgage Bonds | | 3.80 | | 7/15/2028 | | 400,000 | | 395,634 | |
Duke Energy Florida,
First Mortgage Bonds | | 6.40 | | 6/15/2038 | | 150,000 | | 187,529 | |
Emera US Finance,
Gtd. Notes | | 4.75 | | 6/15/2046 | | 250,000 | | 232,930 | |
Enel Chile,
Sr. Unscd. Notes | | 4.88 | | 6/12/2028 | | 400,000 | | 397,400 | |
Enel Generacion Chile,
Sr. Unscd. Notes | | 4.25 | | 4/15/2024 | | 250,000 | | 245,251 | |
Exelon Generation,
Sr. Unscd. Notes | | 6.25 | | 10/1/2039 | | 400,000 | | 424,128 | |
FirstEnergy,
Sr. Unscd. Notes, Ser. C | | 4.85 | | 7/15/2047 | | 150,000 | | 146,843 | |
Florida Power & Light,
First Mortgage Bonds | | 3.70 | | 12/1/2047 | | 50,000 | | 44,846 | |
Florida Power & Light,
First Mortgage Bonds | | 4.05 | | 10/1/2044 | | 400,000 | | 384,486 | |
Georgia Power,
Sr. Unscd. Notes | | 3.25 | | 3/30/2027 | | 250,000 | b | 232,275 | |
Georgia Power,
Sr. Unscd. Notes | | 3.25 | | 4/1/2026 | | 500,000 | | 470,306 | |
Hydro-Quebec,
Govt. Gtd. Debs., Ser. HH | | 8.50 | | 12/1/2029 | | 400,000 | | 569,179 | |
Hydro-Quebec,
Govt. Gtd. Debs., Ser. HK | | 9.38 | | 4/15/2030 | | 20,000 | | 29,963 | |
Indiana Michigan Power,
Sr. Unscd. Notes | | 6.05 | | 3/15/2037 | | 300,000 | | 349,867 | |
Interstate Power & Light,
Sr. Unscd. Debs. | | 3.70 | | 9/15/2046 | | 300,000 | | 260,813 | |
Interstate Power & Light,
Sr. Unscd. Notes | | 4.10 | | 9/26/2028 | | 300,000 | | 298,913 | |
MidAmerican Energy,
First Mortgage Bonds | | 3.50 | | 10/15/2024 | | 400,000 | | 398,871 | |
Nevada Power,
Mortgage Notes, Ser. R | | 6.75 | | 7/1/2037 | | 400,000 | | 507,581 | |
59
STATEMENT OF INVESTMENTS (continued)
| | | | | | | | | | |
| |
Description | Coupon
Rate (%) | | Maturity
Date | | Principal
Amount ($) | | Value ($) | |
Bonds and Notes - 100.4% (continued) | | | | | |
Utilities - 1.8% (continued) | | | | | |
Nisource Finance,
Sr. Unscd. Notes | | 3.49 | | 5/15/2027 | | 420,000 | | 395,076 | |
Oncor Electric Delivery,
Sr. Scd. Debs. | | 7.00 | | 9/1/2022 | | 170,000 | | 191,409 | |
Oncor Electric Delivery,
Sr. Scd. Notes | | 7.00 | | 5/1/2032 | | 250,000 | | 320,419 | |
Pacific Gas & Electric,
Sr. Unscd. Bonds | | 6.05 | | 3/1/2034 | | 465,000 | | 499,127 | |
Pacific Gas & Electric,
Sr. Unscd. Notes | | 4.75 | | 2/15/2044 | | 500,000 | | 456,884 | |
Pacific Gas & Electric,
Sr. Unscd. Notes | | 6.25 | | 3/1/2039 | | 400,000 | | 431,585 | |
PPL Capital Funding,
Gtd. Notes | | 3.40 | | 6/1/2023 | | 400,000 | | 392,457 | |
PPL Electric Utilities,
First Mortgage Bonds | | 4.75 | | 7/15/2043 | | 500,000 | | 521,284 | |
Progress Energy,
Sr. Unscd. Notes | | 7.75 | | 3/1/2031 | | 480,000 | | 622,353 | |
Public Service Company of Colorado,
First Mortgage Bonds | | 3.20 | | 11/15/2020 | | 750,000 | | 749,200 | |
Public Service Electric & Gas,
First Mortgage Notes | | 3.25 | | 9/1/2023 | | 300,000 | | 296,451 | |
San Diego Gas & Electric,
First Mortgage Bonds, Ser. NNN | | 3.60 | | 9/1/2023 | | 400,000 | | 400,366 | |
Sempra Energy,
Sr. Unscd. Notes | | 2.88 | | 10/1/2022 | | 1,000,000 | | 965,316 | |
Sempra Energy,
Sr. Unscd. Notes | | 4.00 | | 2/1/2048 | | 50,000 | | 43,379 | |
South Carolina Electric & Gas,
First Mortgage Bonds | | 4.50 | | 6/1/2064 | | 250,000 | | 216,953 | |
South Carolina Electric & Gas,
First Mortgage Bonds | | 6.63 | | 2/1/2032 | | 200,000 | | 234,410 | |
Southern California Edison,
First Mortgage Bonds | | 3.88 | | 6/1/2021 | | 400,000 | | 402,349 | |
Southern California Edison,
First Mortgage Notes, Ser. 08-A | | 5.95 | | 2/1/2038 | | 70,000 | | 80,553 | |
Southern California Edison,
Sr. Unscd. Notes | | 6.65 | | 4/1/2029 | | 450,000 | | 527,264 | |
Southernwestern Public Service,
First Mortgage Bonds | | 3.40 | | 8/15/2046 | | 350,000 | | 291,363 | |
Southwestern Electric Power,
Sr. Unscd. Notes, Ser. M | | 4.10 | | 9/15/2028 | | 300,000 | | 296,943 | |
Tampa Electric,
Sr. Unscd. Notes | | 4.35 | | 5/15/2044 | | 250,000 | | 237,731 | |
Toledo Edison,
Sr. Scd. Notes | | 6.15 | | 5/15/2037 | | 200,000 | | 236,348 | |
60
| | | | | | | | | | |
| |
Description | Coupon
Rate (%) | | Maturity
Date | | Principal
Amount ($) | | Value ($) | |
Bonds and Notes - 100.4% (continued) | | | | | |
Utilities - 1.8% (continued) | | | | | |
Virginia Electric & Power,
Sr. Unscd. Notes | | 4.00 | | 1/15/2043 | | 500,000 | | 465,957 | |
Washington Gas Light,
Sr. Unscd. Notes, Ser. K | | 3.80 | | 9/15/2046 | | 500,000 | | 454,303 | |
Wisconsin Energy,
Sr. Unscd. Bonds | | 3.55 | | 6/15/2025 | | 140,000 | | 137,426 | |
Xcel Energy,
Sr. Unscd. Notes | | 6.50 | | 7/1/2036 | | 200,000 | | 247,814 | |
| | 21,480,835 | |
Total Bonds and Notes
(cost $1,235,795,263) | | 1,203,584,901 | |
Description | 7-Day
Yield (%) | | | | Shares | | Value ($) | |
Investment Companies - 9.3% | | | | | |
Registered Investment Companies - 9.3% | | | | | |
Dreyfus Institutional Preferred Government Plus Money Market Fund
(cost $112,138,042) | | 2.21 | | | | 112,138,042 | f | 112,138,042 | |
| | | | | | | | | |
Investment of Cash Collateral for Securities Loaned - .8% | | | | | |
Registered Investment Companies - .8% | | | | | |
Dreyfus Institutional Preferred Government Money Market Fund, Institutional Shares
(cost $9,124,069) | | 2.12 | | | | 9,124,069 | f | 9,124,069 | |
Total Investments (cost $1,357,057,374) | | 110.5% | 1,324,847,012 | |
Liabilities, Less Cash and Receivables | | (10.5%) | (125,925,660) | |
Net Assets | | 100.0% | 1,198,921,352 | |
a Security exempt from registration pursuant to Rule 144A under the Securities Act of 1933. These securities may be resold in transactions exempt from registration, normally to qualified institutional buyers. At October 31, 2018, these securities were valued at $4,994,198 or .42% of net assets.
b Security, or portion thereof, on loan. At October 31, 2018, the value of the fund’s securities on loan was $16,984,689 and the value of the collateral held by the fund was $17,605,312, consisting of cash collateral of $9,124,069 and U.S. Government & Agency securities valued at $8,481,243.
c Security issued with a zero coupon. Income is recognized through the accretion of discount.
d The Federal Housing Finance Agency (“FHFA”) placed the Federal Home Loan Mortgage Corporation and Federal National Mortgage Association into conservatorship with FHFA as the conservator. As such, the FHFA oversees the continuing affairs of these companies.
e Purchased on a forward commitment basis.
f Investment in affiliated issuer. The investment objective of this investment company is publicly available and can be found within the investment company’s prospectus.
61
STATEMENT OF INVESTMENTS (continued)
| | |
Portfolio Summary (Unaudited) † | Value (%) |
Government | 43.2 |
Mortgage Securities | 30.7 |
Investment Companies | 10.1 |
Financial | 8.8 |
Consumer, Non-cyclical | 4.5 |
Energy | 2.8 |
Communications | 2.6 |
Utilities | 1.8 |
Industrial | 1.7 |
Technology | 1.6 |
Consumer, Cyclical | 1.5 |
Basic Materials | .7 |
Asset Backed Securities | .5 |
| | 110.5 |
† Based on net assets.
See notes to financial statements.
62
Statement of TBA Sale Commitments
October 31, 2018
| | | | | | | | | | |
| |
Description | | | | | Principal
Amount ($) | | Value ($) | |
Bonds and Notes - .4% | | | | | |
U.S. Government Agencies Mortgage-Backed - .4% | | | | | |
Federal Home Loan Mortgage Corp.: | | | |
2.50% | | | 250,000 | a,b | 239,219 | |
3.00% | | | 100,000 | a,b | 97,958 | |
5.50% | | | 200,000 | a,b | 211,703 | |
Federal National Mortgage Association: | | | |
2.50% | | | 75,000 | a,b | 68,560 | |
4.00% | | | 450,000 | a,b | 457,313 | |
4.50% | | | 675,000 | a,b | 684,440 | |
5.00% | | | 350,000 | a,b | 365,285 | |
5.50% | | | 100,000 | a,b | 106,004 | |
Government National Mortgage Association I: | | | |
4.00% | | | 125,000 | a | 125,794 | |
5.00% | | | 1,600,000 | a | 1,661,375 | |
5.50% | | | 500,000 | a | 531,113 | |
Total Sale Commitments (cost $4,546,782) | | | 4,548,764 | |
a Purchased on a forward commitment basis.
b The Federal Housing Finance Agency (“FHFA”) placed the Federal Home Loan Mortgage Corporation and Federal National Mortgage Association into conservatorship with FHFA as the conservator. As such, the FHFA oversees the continuing affairs of these companies.
63
STATEMENT OF INVESTMENTS IN AFFILIATED ISSUERS
| | | | | | | |
Registered Investment Companies | Value
10/31/17($) | Purchases($) | Sales ($) | Value
10/31/18($) | Net
Assets(%) | Dividends/
Distributions($) |
Dreyfus Institutional Preferred Government Plus Money Market Fund | 128,121,390 | 328,287,316 | 344,270,664 | 112,138,042 | 9.3 | 1,799,781 |
Dreyfus Institutional Preferred Government Money Market Fund, Institutional Shares | 10,441,693 | 118,111,226 | 119,428,850 | 9,124,069 | .8 | – |
Total | 138,563,083 | 446,398,542 | 463,699,514 | 121,262,111 | 10.1 | 1,799,781 |
See notes to financial statements.
64
STATEMENT OF ASSETS AND LIABILITIES
October 31, 2018
| | | | | | | |
| | | | | | |
| | | Cost | | Value | |
Assets ($): | | | | |
Investments in securities—See Statement of Investments
(including securities on loan, valued at $16,984,689)—Note 1(b): | | | |
Unaffiliated issuers | 1,235,795,263 | | 1,203,584,901 | |
Affiliated issuers | | 121,262,111 | | 121,262,111 | |
Receivable for investment securities sold | | 16,450,756 | |
Interest and securities lending income receivable | | 7,841,015 | |
Receivable for shares of Common Stock subscribed | | 1,652,538 | |
Cash collateral held by broker—Note 4 | | 86,953 | |
Due from The Dreyfus Corporation and affiliates—Note 3(b) | | 443,145 | |
| | | | | 1,351,321,419 | |
Liabilities ($): | | | | |
Cash overdraft due to Custodian | | | | | 831,082 | |
Payable for open mortgage dollar roll transactions—Note 4 | | 84,214,617 | |
Payable for investment securities purchased | | 46,046,057 | |
Liability for securities on loan—Note 1(b) | | 9,124,069 | |
Payable for shares of Common Stock redeemed | | 6,929,907 | |
TBA sale commitments, at value (proceeds $4,546,782)—Note 4 | | 4,548,764 | |
Directors fees and expenses payable | | 696,426 | |
Interest payable—Note 2 | | 9,145 | |
| | | | | 152,400,067 | |
Net Assets ($) | | | 1,198,921,352 | |
Composition of Net Assets ($): | | | | |
Paid-in capital | | | | | 1,246,670,807 | |
Total distributable earnings (loss) | | | | | (47,749,455) | |
Net Assets ($) | | | 1,198,921,352 | |
| | | | |
Net Asset Value Per Share | Investor Shares | Class I | |
Net Assets ($) | 397,658,038 | 801,263,314 | |
Shares Outstanding | 40,444,264 | 81,476,287 | |
Net Asset Value Per Share ($) | 9.83 | 9.83 | |
| | | | |
See notes to financial statements. | | | |
65
STATEMENT OF OPERATIONS
Year Ended October 31, 2018
| | | | | | | |
| | | | | | |
| | | | | | |
Investment Income ($): | | | | |
Income: | | | | |
Interest | | | 31,802,368 | |
Dividends from affiliated issuers | | | 1,799,781 | |
Income from securities lending—Note 1(b) | | | 87,294 | |
Total Income | | | 33,689,443 | |
Expenses: | | | | |
Management fee—Note 3(a) | | | 1,844,547 | |
Distribution fees—Note 3(b) | | | 1,038,854 | |
Directors’ fees—Note 3(a,c) | | | 762,053 | |
Loan commitment fees—Note 2 | | | 27,241 | |
Total Expenses | | | 3,672,695 | |
Less—Directors’ fees reimbursed by Dreyfus—Note 3(a) | | | (762,053) | |
Net Expenses | | | 2,910,642 | |
Investment Income—Net | | | 30,778,801 | |
Realized and Unrealized Gain (Loss) on Investments—Note 4 ($): | | |
Net realized gain (loss) on investments | (6,711,790) | |
Net unrealized appreciation (depreciation) on investments | | | (51,779,067) | |
Net Realized and Unrealized Gain (Loss) on Investments | | | (58,490,857) | |
Net (Decrease) in Net Assets Resulting from Operations | | (27,712,056) | |
| | | | | | | |
See notes to financial statements. | | | | | |
66
STATEMENT OF CHANGES IN NET ASSETS
| | | | | | | | | | |
| | | | Year Ended October 31, |
| | | | 2018 | | 2017 | a |
Operations ($): | | | | | | | | |
Investment income—net | | | 30,778,801 | | | | 40,275,804 | |
Net realized gain (loss) on investments | | (6,711,790) | | | | (3,397,769) | |
Net unrealized appreciation (depreciation)
on investments | | (51,779,067) | | | | (45,222,806) | |
Net Increase (Decrease) in Net Assets
Resulting from Operations | (27,712,056) | | | | (8,344,771) | |
Distributions ($): | |
Distributions to shareholders: | | | | | | | | |
Investor Shares | | | (10,448,065) | | | | (21,181,908) | |
Class I | | | (22,427,030) | | | | (33,822,504) | |
Total Distributions | | | (32,875,095) | | | | (55,004,412) | |
Capital Stock Transactions ($): | |
Net proceeds from shares sold: | | | | | | | | |
Investor Shares | | | 156,190,286 | | | | 214,786,858 | |
Class I | | | 310,838,854 | | | | 508,333,922 | |
Distributions reinvested: | | | | | | | | |
Investor Shares | | | 10,241,750 | | | | 20,970,958 | |
Class I | | | 19,002,074 | | | | 29,825,623 | |
Cost of shares redeemed: | | | | | | | | |
Investor Shares | | | (245,948,883) | | | | (820,290,943) | |
Class I | | | (387,362,890) | | | | (925,346,555) | |
Increase (Decrease) in Net Assets
from Capital Stock Transactions | (137,038,809) | | | | (971,720,137) | |
Total Increase (Decrease) in Net Assets | (197,625,960) | | | | (1,035,069,320) | |
Net Assets ($): | |
Beginning of Period | | | 1,396,547,312 | | | | 2,431,616,632 | |
End of Period | | | 1,198,921,352 | | | | 1,396,547,312 | |
Capital Share Transactions (Shares): | |
Investor Sharesb | | | | | | | | |
Shares sold | | | 15,509,429 | | | | 20,840,081 | |
Shares issued for distributions reinvested | | | 1,017,689 | | | | 2,043,464 | |
Shares redeemed | | | (24,234,565) | | | | (79,720,111) | |
Net Increase (Decrease) in Shares Outstanding | (7,707,447) | | | | (56,836,566) | |
Class Ib | | | | | | | | |
Shares sold | | | 30,819,919 | | | | 49,324,881 | |
Shares issued for distributions reinvested | | | 1,888,258 | | | | 2,900,716 | |
Shares redeemed | | | (38,209,455) | | | | (90,223,852) | |
Net Increase (Decrease) in Shares Outstanding | (5,501,278) | | | | (37,998,255) | |
| | | | | | | | | | |
aDistributions to shareholders include $16,088,193 of Investor shares and $27,387,856 of Class I from net investment income and $5,093,715 of Investor shares and $6,434,648 of Class I from net realized gains. Undistributed investment income—net was $1,302,389 in 2017 and is no longer presented as a result of the adoption of SEC’s Disclosure Update and Simplification Rule. | |
bDuring the period ended October 31, 2018, 1 Investor share representing $7 was exchanged for 1 Class I share. | |
See notes to financial statements. | | | | | | | | |
67
FINANCIAL HIGHLIGHTS
The following tables describe the performance for each share class for the fiscal periods indicated. All information (except portfolio turnover rate) reflects financial results for a single fund share. Total return shows how much your investment in the fund would have increased (or decreased) during each period, assuming you had reinvested all dividends and distributions. These figures have been derived from the fund’s financial statements.
| | | | | | | | | | |
| | | |
| | | |
Investor Shares | | Year Ended October 31, |
| | 2018 | 2017 | 2016 | 2015 | 2014 |
Per Share Data ($): | | | | | | |
Net asset value, beginning of period | | 10.33 | 10.57 | 10.45 | 10.60 | 10.62 |
Investment Operations: | | | | | | |
Investment income—neta | | .23 | .20 | .21 | .21 | .23 |
Net realized and unrealized
gain (loss) on investments | | (.47) | (.16) | .19 | (.05) | .14 |
Total from Investment Operations | | (.24) | .04 | .40 | .16 | .37 |
Distributions: | | | | | | |
Dividends from
investment income—net | | (.25) | (.23) | (.23) | (.23) | (.25) |
Dividends from net realized
gain on investments | | (.01) | (.05) | (.05) | (.08) | (.14) |
Total Distributions | | (.26) | (.28) | (.28) | (.31) | (.39) |
Net asset value, end of period | | 9.83 | 10.33 | 10.57 | 10.45 | 10.60 |
Total Return (%) | | (2.42) | .39 | 3.85 | 1.54 | 3.62 |
Ratios/Supplemental Data (%): | | | | | | |
Ratio of total expenses
to average net assets | | .46 | .41 | .41 | .41 | .41 |
Ratio of net expenses
to average net assets | | .40 | .40 | .40 | .40 | .40 |
Ratio of net investment income
to average net assets | | 2.33 | 2.01 | 1.97 | 2.00 | 2.22 |
Portfolio Turnover Rateb | | 156.30 | 179.26 | 144.83 | 150.80 | 145.11 |
Net Assets, end of period ($ x 1,000) | | 397,658 | 497,586 | 1,109,787 | 1,040,129 | 1,190,994 |
a Based on average shares outstanding.
b The portfolio turnover rates excluding mortgage dollar roll transactions for the periods ended October 31, 2018, 2017, 2016, 2015 and 2014 were 77.41%, 103.99%, 95.05%, 79.15% and 89.76%, respectively.
See notes to financial statements.
68
| | | | | | | | | |
| | | |
| | | |
Class I Shares | | Year Ended October 31, |
| | 2018 | 2017 | 2016a | 2015 | 2014 |
Per Share Data ($): | | | | | | |
Net asset value, beginning of period | | 10.34 | 10.58 | 10.46 | 10.61 | 10.62 |
Investment Operations: | | | | | | |
Investment income—netb | | .26 | .23 | .23 | .24 | .26 |
Net realized and unrealized
gain (loss) on investments | | (.49) | (.17) | .20 | (.06) | .15 |
Total from Investment Operations | | (.23) | .06 | .43 | .18 | .41 |
Distributions: | | | | | | |
Dividends from
investment income—net | | (.27) | (.25) | (.26) | (.25) | (.28) |
Dividends from net realized
gain on investments | | (.01) | (.05) | (.05) | (.08) | (.14) |
Total Distributions | | (.28) | (.30) | (.31) | (.33) | (.42) |
Net asset value, end of period | | 9.83 | 10.34 | 10.58 | 10.46 | 10.61 |
Total Return (%) | | (2.27) | .64 | 4.11 | 1.79 | 3.97 |
Ratios/Supplemental Data (%): | | | | | | |
Ratio of total expenses
to average net assets | | .21 | .16 | .16 | .16 | .16 |
Ratio of net expenses
to average net assets | | .15 | .15 | .15 | .15 | .15 |
Ratio of net investment income
to average net assets | | 2.58 | 2.27 | 2.23 | 2.24 | 2.47 |
Portfolio Turnover Ratec | | 156.30 | 179.26 | 144.83 | 150.80 | 145.11 |
Net Assets, end of period ($ x 1,000) | | 801,263 | 898,961 | 1,321,830 | 1,457,305 | 1,220,628 |
a On August 31, 2016, the fund redesignated BASIC shares as Class I shares.
b Based on average shares outstanding.
c The portfolio turnover rates excluding mortgage dollar roll transactions for the periods ended October 31, 2018, 2017, 2016, 2015 and 2014 were 77.41%, 103.99%, 95.05%, 79.15% and 89.76%, respectively.
See notes to financial statements.
69
NOTES TO FINANCIAL STATEMENTS
NOTE 1—Significant Accounting Policies:
Dreyfus Bond Market Index Fund (the “fund”) is a separate diversified series of The Dreyfus/Laurel Funds, Inc. (the “Company”), which is registered under the Investment Company Act of 1940, as amended (the “Act”), as an open-end management investment company and operates as a series company currently offering eight series, including the fund. The fund’s investment objective is to seek to match the total return of the Bloomberg Barclays U.S. Aggregate Bond Index. The Dreyfus Corporation (the “Manager” or “Dreyfus”), a wholly-owned subsidiary of The Bank of New York Mellon Corporation (“BNY Mellon”), serves as the fund’s investment adviser.
MBSC Securities Corporation (the “Distributor”), a wholly-owned subsidiary of Dreyfus, is the distributor of the fund’s shares, which are sold to the public without a sales charge. The fund is authorized to issue 500 million shares of $.001 par value Common Stock in each of the following classes of shares: Investor and Class I. Investor shares are sold primarily to retail investors through financial intermediaries and bear Distribution Plan fees. Class I shares are sold primarily to bank trust departments and other financial service providers (including The Bank of New York Mellon, a subsidiary of BNY Mellon and an affiliate of Dreyfus, and its affiliates), acting on behalf of customers having a qualified trust or an investment account or relationship at such institution, and bear no Distribution Plan fees. Differences between the two classes include the services offered to and the expenses borne by each class, as well as their minimum purchase and account balance requirements. Income, expenses (other than expenses attributable to a specific class), and realized and unrealized gains or losses on investments are allocated to each class of shares based on its relative net assets.
The Company accounts separately for the assets, liabilities and operations of each series. Expenses directly attributable to each series are charged to that series’ operations; expenses which are applicable to all series are allocated among them on a pro rata basis.
The Financial Accounting Standards Board (“FASB”) Accounting Standards Codification is the exclusive reference of authoritative U.S. generally accepted accounting principles (“GAAP”) recognized by the FASB to be applied by nongovernmental entities. Rules and interpretive releases of the Securities and Exchange Commission (“SEC”) under authority of federal laws are also sources of authoritative GAAP for SEC registrants. The fund’s financial statements are prepared in accordance with
70
GAAP, which may require the use of management estimates and assumptions. Actual results could differ from those estimates.
(a) Portfolio valuation: The fair value of a financial instrument is the amount that would be received to sell an asset or paid to transfer a liability in an orderly transaction between market participants at the measurement date (i.e., the exit price). GAAP establishes a fair value hierarchy that prioritizes the inputs of valuation techniques used to measure fair value. This hierarchy gives the highest priority to unadjusted quoted prices in active markets for identical assets or liabilities (Level 1 measurements) and the lowest priority to unobservable inputs (Level 3 measurements).
Additionally, GAAP provides guidance on determining whether the volume and activity in a market has decreased significantly and whether such a decrease in activity results in transactions that are not orderly. GAAP requires enhanced disclosures around valuation inputs and techniques used during annual and interim periods.
Various inputs are used in determining the value of the fund’s investments relating to fair value measurements. These inputs are summarized in the three broad levels listed below:
Level 1—unadjusted quoted prices in active markets for identical investments.
Level 2—other significant observable inputs (including quoted prices for similar investments, interest rates, prepayment speeds, credit risk, etc.).
Level 3—significant unobservable inputs (including the fund’s own assumptions in determining the fair value of investments).
The inputs or methodology used for valuing securities are not necessarily an indication of the risk associated with investing in those securities.
Changes in valuation techniques may result in transfers in or out of an assigned level within the disclosure hierarchy. Valuation techniques used to value the fund’s investments are as follows:
Registered investment companies that are not traded on an exchange are valued at their net asset value and are generally categorized within Level 1 of the fair value hierarchy.
Investments in securities, excluding short-term investments (other than U.S. Treasury Bills), are valued each business day by an independent pricing service (the “Service”) approved by the Company’s Board of Directors (the “Board”). Investments for which quoted bid prices are readily available and are representative of the bid side of the market in the
71
NOTES TO FINANCIAL STATEMENTS (continued)
judgment of the Service are valued at the mean between the quoted bid prices (as obtained by the Service from dealers in such securities) and asked prices (as calculated by the Service based upon its evaluation of the market for such securities). Other investments (which constitute a majority of the portfolio securities) are valued as determined by the Service, based on methods which include consideration of the following: yields or prices of securities of comparable quality, coupon, maturity and type; indications as to values from dealers; and general market conditions. These securities are generally categorized within Level 2 of the fair value hierarchy.
The Service is engaged under the general supervision of the Board.
When market quotations or official closing prices are not readily available, or are determined not to accurately reflect fair value, such as when the value of a security has been significantly affected by events after the close of the exchange or market on which the security is principally traded (for example, a foreign exchange or market), but before the fund calculates its net asset value, the fund may value these investments at fair value as determined in accordance with the procedures approved by the Board. Certain factors may be considered when fair valuing investments such as: fundamental analytical data, the nature and duration of restrictions on disposition, an evaluation of the forces that influence the market in which the securities are purchased and sold, and public trading in similar securities of the issuer or comparable issuers. These securities are either categorized within Level 2 or 3 of the fair value hierarchy depending on the relevant inputs used.
For restricted securities where observable inputs are limited, assumptions about market activity and risk are used and such securities are generally categorized within Level 3 of the fair value hierarchy.
The following is a summary of the inputs used as of October 31, 2018 in valuing the fund’s investments:
72
| | | | | | |
| Level 1 -
Unadjusted
Quoted Prices | Level 2 - Other
Significant Observable
Inputs | Level 3 -
Significant
Unobservable
Inputs | Total |
Assets ($) | | | | |
Investments in Securities: | | | | |
Asset-Backed | - | 6,408,194 | - | 6,408,194 |
Commercial Mortgage-Backed | - | 22,406,035 | - | 22,406,035 |
Corporate Bonds† | - | 311,723,282 | - | 311,723,282 |
Foreign Government | - | 35,892,297 | - | 35,892,297 |
Investment Companies | 121,262,111 | - | - | 121,262,111 |
Municipal Bonds | - | 6,526,247 | - | 6,526,247 |
U.S. Government Agencies/
Mortgage-Backed | - | 360,029,619 | - | 360,029,619 |
U.S. Treasury | - | 460,599,227 | - | 460,599,227 |
Liabilities ($) | | | | |
Other Financial Instruments: | | | | |
TBA Sales Commitments | - | (4,548,764) | - | (4,548,764) |
† See Statement of Investments for additional detailed categorizations.
At October 31, 2018, there were no transfers between levels of the fair value hierarchy. It is the fund’s policy to recognize transfers between levels at the end of the reporting period.
(b) Securities transactions and investment income: Securities transactions are recorded on a trade date basis. Realized gains and losses from securities transactions are recorded on the identified cost basis. Dividend income is recognized on the ex-dividend date and interest income, including, where applicable, accretion of discount and amortization of premium on investments, is recognized on the accrual basis.
Pursuant to a securities lending agreement with The Bank of New York Mellon, the fund may lend securities to qualified institutions. It is the fund’s policy that, at origination, all loans are secured by collateral of at least 102% of the value of U.S. securities loaned and 105% of the value of foreign securities loaned. Collateral equivalent to at least 100% of the market value of securities on loan is maintained at all times. Collateral is either in the form of cash, which can be invested in certain money market mutual funds managed by Dreyfus, or U.S. Government and Agency securities. The fund is entitled to receive all dividends, interest and distributions on securities loaned, in addition to income earned as a result of the lending transaction. Should a borrower fail to return the securities in
73
NOTES TO FINANCIAL STATEMENTS (continued)
a timely manner, The Bank of New York Mellon is required to replace the securities for the benefit of the fund or credit the fund with the market value of the unreturned securities and is subrogated to the fund’s rights against the borrower and the collateral. Additionally, the contractual maturity of security lending transactions are on an overnight and continuous basis. During the period ended October 31, 2018, The Bank of New York Mellon earned $16,690 from lending portfolio securities, pursuant to the securities lending agreement.
(c) Affiliated issuers: Investments in other investment companies advised by Dreyfus are considered “affiliated” under the Act.
(d) Risk: The fund invests primarily in debt securities. Failure of an issuer of the debt securities to make timely interest or principal payments, or a decline or the perception of a decline in the credit quality of a debt security, can cause the debt security’s price to fall, potentially lowering the fund’s share price. In addition, the value of debt securities may decline due to general market conditions that are not specifically related to a particular issuer, such as real or perceived adverse economic conditions, changes in outlook for corporate earnings, changes in interest or currency rates or adverse investor sentiment. Such values may also decline because of factors that affect a particular industry.
(e) Dividends and distributions to shareholders: It is the policy of the fund to declare dividends daily from investment income-net. Such dividends are paid monthly. Dividends from net realized capital gains, if any, are normally declared and paid annually, but the fund may make distributions on a more frequent basis to comply with the distribution requirements of the Internal Revenue Code of 1986, as amended (the “Code”). To the extent that net realized capital gains can be offset by capital loss carryovers, it is the policy of the fund not to distribute such gains. Income and capital gain distributions are determined in accordance with income tax regulations, which may differ from GAAP.
(f) Federal income taxes: It is the policy of the fund to continue to qualify as a regulated investment company, if such qualification is in the best interests of its shareholders, by complying with the applicable provisions of the Code, and to make distributions of taxable income and net realized capital gain sufficient to relieve it from substantially all federal income and excise taxes.
As of and during the period ended October 31, 2018, the fund did not have any liabilities for any uncertain tax positions. The fund recognizes interest and penalties, if any, related to uncertain tax positions as income
74
tax expense in the Statement of Operations. During the period ended October 31, 2018, the fund did not incur any interest or penalties.
Each tax year in the four-year period ended October 31, 2018 remains subject to examination by the Internal Revenue Service and state taxing authorities.
At October 31, 2018, the components of accumulated earnings on a tax basis were as follows: undistributed ordinary income $646,791, accumulated capital losses $13,316,126 and unrealized depreciation $35,080,120.
The fund is permitted to carry forward capital losses for an unlimited period. Furthermore, capital loss carryovers retain their character as either short-term or long-term capital losses.
The accumulated capital loss carryover is available for federal income tax purposes to be applied against future net realized capital gains, if any, realized subsequent to October 31, 2018. The funds has $11,267,230 of short-term capital losses and $2,048,896 of long-term capital losses which can be carried forward for an unlimited period.
The tax character of distributions paid to shareholders during the fiscal periods ended October 31, 2018 and October 31, 2017 were as follows: ordinary income $32,875,095 and $50,195,532, and long-term capital gains $0 and $4,808,880, respectively.
During the period ended October 31, 2018, as a result of permanent book to tax differences, primarily due to the tax treatment for paydown gains and losses, amortization adjustments, dividend reclassification and consent fees, the fund decreased total distributable earnings (loss) by $16,797 and increased paid-in capital by the same amount. Net assets and net asset value per share were not affected by this reclassification.
(g) New Accounting Pronouncements: In March 2017, the FASB issued Accounting Standards Update 2017-08, Receivables—Nonrefundable Fees and Other Costs (Subtopic 310-20): Premium Amortization On Purchased Callable Debt Securities (“ASU 2017-08”). The update shortens the amortization period for the premium on certain purchased callable debt securities to the earliest call date. ASU 2017-08 will be effective for annual periods beginning after December 15, 2018.
Also in August 2018, the FASB issued Accounting Standards Update 2018-13, Fair Value Measurement (Topic 820): Disclosure Framework—Changes to the Disclosure Requirements for Fair Value Measurement (“ASU 2018-13”). The update provides guidance that eliminates, adds and modifies certain disclosure requirements for fair value measurements. ASU
75
NOTES TO FINANCIAL STATEMENTS (continued)
2018-13 will be effective for annual periods beginning after December 15, 2019. Management is currently assessing the potential impact of these changes to future financial statements.
NOTE 2—Bank Lines of Credit:
The fund participates with other Dreyfus-managed funds in an $830 million unsecured credit facility led by Citibank, N.A. and a $300 million unsecured credit facility provided by The Bank of New York Mellon (each, a “Facility”), each to be utilized primarily for temporary or emergency purposes, including the financing of redemptions. In connection therewith, the fund has agreed to pay its pro rata portion of commitment fees for each Facility. Interest is charged to the fund based on rates determined pursuant to the terms of the respective Facility at the time of borrowing. During the period ended October 31, 2018, the fund did not borrow under the Facilities.
NOTE 3—Investment Management Fee and Other Transactions with Affiliates:
(a) Pursuant to an investment management agreement with Dreyfus, Dreyfus provides or arranges for one or more third parties and/or affiliates to provide investment advisory, administrative, custody, fund accounting and transfer agency services to the fund. Dreyfus also directs the investments of the fund in accordance with its investment objective, policies and limitations. For these services, the fund is contractually obligated to pay Dreyfus a fee, calculated daily and paid monthly, at the annual rate of .15% of the value of the fund’s average daily net assets. Out of its fee Dreyfus pays all of the expenses of the fund except brokerage fees, taxes, interest expenses, commitment fees on borrowings, Distribution Plan fees, fees and expenses of non-interested Directors (including counsel fees) and extraordinary expenses. In addition, Dreyfus is required to reduce its fee in an amount equal to the fund’s allocable portion of fees and expenses of the non-interested Directors (including counsel fees). During the period ended October 31, 2018, fees reimbursed by Dreyfus amounted to $762,053.
(b) Under the Distribution Plan adopted pursuant to Rule 12b-1 under the Act, Investor shares may pay annually up to .25% of the value of its average daily net assets to compensate the Distributor for shareholder servicing activities primarily intended to result in the sale of Investor shares. During the period ended October 31, 2018, Investor shares were charged $1,038,854 pursuant to the Distribution Plan.
Under its terms, the Distribution Plan shall remain in effect from year to year, provided such continuance is approved annually by a vote of a
76
majority of those Directors who are not “interested persons” of the Company and who have no direct or indirect financial interest in the operation of or in any agreement related to the Distribution Plan.
The components of “Due from The Dreyfus Corporation and affiliates” in the Statement of Assets and Liabilities consist of: management fees $153,178 and Distribution Plan fees $85,518, which are offset against an expense reimbursement currently in effect in the amount of $681,841.
(c) Each Board member also serves as a Board member of other funds within the Dreyfus complex. Annual retainer fees and attendance fees are allocated to each fund based on net assets.
NOTE 4—Securities Transactions:
The aggregate amount of purchases and sales (including paydowns) of investment securities, excluding short-term securities, during the period ended October 31, 2018, amounted to $1,926,579,335 and $2,099,894,257, respectively, of which $973,582,064 in purchases and $972,385,839 in sales were from mortgage dollar transactions.
Mortgage Dollar Rolls: A mortgage dollar roll transaction involves a sale by the fund of mortgage related securities that it holds with an agreement by the fund to repurchase similar securities at an agreed upon price and date. The securities purchased will bear the same interest rate as those sold, but generally will be collateralized by pools of mortgages with different prepayment histories than those securities sold. The fund accounts for mortgage dollar rolls as purchases and sales transactions. The fund executes mortgage dollar rolls entirely in the To-Be-Announced (“TBA”) market.
TBA Securities: During the period ended October 31, 2018, the fund transacted in TBA securities that involved buying or selling mortgage-backed securities on a forward commitment basis. A TBA transaction typically does not designate the actual security to be delivered and only includes an approximate principal amount; however, delivered securities must meet specified terms defined by industry guidelines, including issuer, rate and current principal amount outstanding on underling mortgage pools. TBA securities subject to a forward commitment to sell at period end are included at the end of the fund’s Statement of Investments under the caption “Statement of TBA Sale Commitments.” The proceeds and value of these commitments are reflected in the fund’s Statement of Assets and Liabilities as Receivable for TBA sale commitments (included in receivable securities sold) and TBA sale commitments, at value, respectively.
77
NOTES TO FINANCIAL STATEMENTS (continued)
At October 31, 2018, the cost of investments for federal income tax purposes was $1,359,925,150; accordingly, accumulated net unrealized depreciation on investments was $35,078,178, consisting of $6,708,471 gross unrealized appreciation and $41,786,609 gross unrealized depreciation.
78
REPORT OF INDEPENDENT REGISTERED PUBLIC ACCOUNTING FIRM
To the Shareholders and Board of Directors
The Dreyfus/Laurel Funds, Inc.
Opinion on the Financial Statements
We have audited the accompanying statement of assets and liabilities of Dreyfus Bond Market Index Fund (the “Fund”), a series of The Dreyfus/Laurel Funds, Inc., including the statements of investments, TBA Sale Commitments and investments in affiliated issuers, as of October 31, 2018, the related statement of operations for the year then ended, the statements of changes in net assets for each of the years in the two-year period then ended, and the related notes (collectively, the financial statements) and the financial highlights for each of the years in the five-year period then ended. In our opinion, the financial statements and financial highlights present fairly, in all material respects, the financial position of the Fund as of October 31, 2018, the results of its operations for the year then ended, the changes in its net assets for each of the years in the two-year period then ended, and the financial highlights for each of the years in the five-year period then ended, in conformity with U.S. generally accepted accounting principles.
Basis for Opinion
These financial statements and financial highlights are the responsibility of the Fund’s management. Our responsibility is to express an opinion on these financial statements and financial highlights based on our audits. We are a public accounting firm registered with the Public Company Accounting Oversight Board (United States) (PCAOB) and are required to be independent with respect to the Fund in accordance with the U.S. federal securities laws and the applicable rules and regulations of the Securities and Exchange Commission and the PCAOB.
We conducted our audits in accordance with the standards of the PCAOB. Those standards require that we plan and perform the audit to obtain reasonable assurance about whether the financial statements and financial highlights are free of material misstatement, whether due to error or fraud. Our audits included performing procedures to assess the risks of material misstatement of the financial statements and financial highlights, whether due to error or fraud, and performing procedures that respond to those risks. Such procedures included examining, on a test basis, evidence regarding the amounts and disclosures in the financial statements and financial highlights. Such procedures also included confirmation of securities owned as of October 31, 2018, by correspondence with the custodian and brokers or by other appropriate auditing procedures when replies from brokers were not received. Our audits also included evaluating the accounting principles used and significant estimates made by management, as well as evaluating the overall presentation of the financial statements and financial highlights. We believe that our audits provide a reasonable basis for our opinion.

We have served as the auditor of one or more Dreyfus Corporation investment companies since 1994.
New York, New York
December 28, 2018
79
IMPORTANT TAX INFORMATION (Unaudited)
For federal tax purposes, the fund reports the maximum amount allowable but not less than 90.16% as interest-related dividends in accordance with Sections 871(k)(1) and 881(e) of the Internal Revenue Code. Also, the fund reports the maximum amount allowable but not less than $.0061 as a short-term capital gain dividend paid on December 20, 2017 in accordance with Sections 871(k)(2) and 881(e) of the Internal Revenue Code.
80
BOARD MEMBERS INFORMATION (Unaudited)
INDEPENDENT BOARD MEMBERS
Joseph S. DiMartino (75)
Chairman of the Board (1999)
Principal Occupation During Past 5 Years:
· Corporate Director and Trustee (1995-present)
Other Public Company Board Memberships During Past 5 Years:
· CBIZ (formerly, Century Business Services, Inc.), a provider of outsourcing functions for small and medium size companies, Director (1997-present)
No. of Portfolios for which Board Member Serves: 124
———————
Francine J. Bovich (67)
Board Member (2012)
Principal Occupation During Past 5 Years:
· Trustee, The Bradley Trusts, private trust funds (2011-present)
Other Public Company Board Memberships During Past 5 Years:
· Annaly Capital Management, Inc., a real estate trust, Director (2014-present)
No. of Portfolios for which Board Member Serves: 72
———————
Kenneth A. Himmel (72)
Board Member (1994)
Principal Occupation During Past 5 Years:
· Managing Partner, Gulf Related, an international real estate development company (2010-present)
· President and CEO, Related Urban Development, a real estate development company (1996-present)
· President and CEO, Himmel & Company, a real estate development company (1980-present)
· CEO, American Food Management, a restaurant company (1983-present)
No. of Portfolios for which Board Member Serves: 25
———————
81
BOARD MEMBERS INFORMATION (Unaudited) (continued)
INDEPENDENT BOARD MEMBERS (continued)
Stephen J. Lockwood (71)
Board Member (1994)
Principal Occupation During Past 5 Years:
· Chairman of the Board, Stephen J. Lockwood and Company LLC, a real estate investment company (2000-present)
No. of Portfolios for which Board Member Serves: 25
———————
Roslyn M. Watson (69)
Board Member (1994)
Principal Occupation During Past 5 Years:
· Principal, Watson Ventures, Inc., a real estate investment company (1993-present)
No. of Portfolios for which Board Member Serves: 58
———————
Benaree Pratt Wiley (72)
Board Member (1998)
Principal Occupation During Past 5 Years:
· Principal, The Wiley Group, a firm specializing in strategy and business development (2005-present)
Other Public Company Board Memberships During Past 5 Years:
· CBIZ (formerly, Century Business Services, Inc.), a provider of outsourcing functions for small and medium size companies, Director (2008-present)
No. of Portfolios for which Board Member Serves: 79
———————
Once elected all Board Members serve for an indefinite term, but achieve Emeritus status upon reaching age 80. The address of the Board Members and Officers is c/o The Dreyfus Corporation, 200 Park Avenue, New York, New York 10166. Additional information about the Board Members is available in the fund’s Statement of additional Information which can be obtained from Dreyfus free of charge by calling this toll free number: 1-800-DREYFUS
James M. Fitzgibbons, Emeritus Board Member
82
OFFICERS OF THE FUND (Unaudited)
BRADLEY J. SKAPYAK, President since January 2010.
Chief Operating Officer and a director of the Manager since June 2009, Chairman of Dreyfus Transfer, Inc., an affiliate of the Manager and the transfer agent of the funds, since May 2011 and Chief Executive Officer of MBSC Securities Corporation since August 2016. He is an officer of 62 investment companies (comprised of 124 portfolios) managed by the Manager. He is 59 years old and has been an employee of the Manager since February 1988.
BENNETT A. MACDOUGALL, Chief Legal Officer since October 2015.
Chief Legal Officer of the Manager and Associate General Counsel and Managing Director of BNY Mellon since June 2015; from June 2005 to June 2015, he served in various capacities with Deutsche Bank – Asset & Wealth Management Division, including as Director and Associate General Counsel, and Chief Legal Officer of Deutsche Investment Management Americas Inc. from June 2012 to May 2015. He is an officer of 63 investment companies (comprised of 149 portfolios) managed by the Manager. He is 47 years old and has been an employee of the Manager since June 2015.
JAMES BITETTO, Vice President since August 2005 and Secretary since February 2018.
Managing Counsel of BNY Mellon and Secretary of the Manager, and an officer of 63 investment companies (comprised of 149 portfolios) managed by the Manager. He is 52 years old and has been an employee of the Manager since December 1996.
JOSEPH M. CHIOFFI, Vice President and Assistant Secretary since August 2005.
Managing Counsel of BNY Mellon, and an officer of 63 investment companies (comprised of 149 portfolios) managed by the Manager. He is 56 years old and has been an employee of the Manager since June 2000.
SONALEE CROSS, Vice President and Assistant Secretary since March 2018.
Counsel of BNY Mellon since October 2016; Associate at Proskauer Rose LLP from April 2016 to September 2016; Attorney at EnTrust Capital from August 2015 to February 2016; Associate at Sidley Austin LLP from September 2013 until August 2015. She is an officer of 63 investment companies (comprised of 149 portfolios) managed by Dreyfus. She is 31 years old and has been an employee of the Manager since October 2016.
MAUREEN E. KANE, Vice President and Assistant Secretary since April 2015.
Managing Counsel of BNY Mellon since July 2014; from October 2004 until July 2014, General Counsel, and from May 2009 until July 2014, Chief Compliance Officer of Century Capital Management. She is an officer of 63 investment companies (comprised of 149 portfolios) managed by the Manager. She is 56 years old and has been an employee of the Manager since July 2014.
SARAH S. KELLEHER, Vice President and Assistant Secretary since April 2014.
Managing Counsel of BNY Mellon since December 2017, from March 2013 to December 2017, Senior Counsel of BNY Mellon. She is an officer of 63 investment companies (comprised of 149 portfolios) managed by the Manager. She is 43 years old and has been an employee of the Manager since March 2013.
JEFF PRUSNOFSKY, Vice President and Assistant Secretary since August 2005.
Senior Managing Counsel of BNY Mellon, and an officer of 63 investment companies (comprised of 149 portfolios) managed by the Manager. He is 53 years old and has been an employee of the Manager since October 1990.
NATALYA ZELENSKY, Vice President and Assistant Secretary since March 2017.
Counsel of BNY Mellon since May 2016; Attorney at Wildermuth Endowment Strategy Fund/Wildermuth Advisory, LLC from November 2015 until May 2016; Assistant General Counsel at RCS Advisory Services from July 2014 until November 2015; Associate at Sutherland, Asbill & Brennan from January 2013 until January 2014. She is an officer of 63 investment companies (comprised of 149 portfolios) managed by Dreyfus. She is 33 years old and has been an employee of the Manager since May 2016.
JAMES WINDELS, Treasurer since November 2001.
Director – Mutual Fund Accounting of the Manager, and an officer of 63 investment companies (comprised of 149 portfolios) managed by the Manager. He is 60 years old and has been an employee of the Manager since April 1985.
83
OFFICERS OF THE FUND (Unaudited) (continued)
GAVIN C. REILLY, Assistant Treasurer since December 2005.
Tax Manager of the Investment Accounting and Support Department of the Manager, and an officer of 63 investment companies (comprised of 149 portfolios) managed by the Manager. He is 50 years old and has been an employee of the Manager since April 1991.
ROBERT S. ROBOL, Assistant Treasurer since August 2005.
Senior Accounting Manager – Dreyfus Financial Reporting of the Manager, and an officer of 63 investment companies (comprised of 149 portfolios) managed by the Manager. He is 54 years old and has been an employee of the Manager since October 1988.
ROBERT SALVIOLO, Assistant Treasurer since July 2007.
Senior Accounting Manager – Equity Funds of the Manager, and an officer of 63 investment companies (comprised of 149 portfolios) managed by the Manager. He is 51 years old and has been an employee of the Manager since June 1989.
ROBERT SVAGNA, Assistant Treasurer since December 2002.
Senior Accounting Manager – Fixed Income and Equity Funds of the Manager, and an officer of 63 investment companies (comprised of 149 portfolios) managed by the Manager. He is 51 years old and has been an employee of the Manager since November 1990.
JOSEPH W. CONNOLLY, Chief Compliance Officer since October 2004.
Chief Compliance Officer of the Manager, the Dreyfus Family of Funds and BNY Mellon Funds Trust (63 investment companies, comprised of 149 portfolios). He is 61 years old and has served in various capacities with the Manager since 1980, including manager of the firm’s Fund Accounting Department from 1997 through October 2001.
CARIDAD M. CAROSELLA, Anti-Money Laundering Compliance Officer since January 2016.
Anti-Money Laundering Compliance Officer of the Dreyfus Family of Funds and BNY Mellon Funds Trust since January 2016; from May 2015 to December 2015, Interim Anti-Money Laundering Compliance Officer of the Dreyfus Family of Funds and BNY Mellon Funds Trust and the Distributor; from January 2012 to May 2015, AML Surveillance Officer of the Distributor and from 2007 to December 2011, Financial Processing Manager of the Distributor. She is an officer of 57 investment companies (comprised of 143 portfolios) managed by the Manager. She is 50 years old and has been an employee of the Distributor since 1997.
84
NOTES
85
Dreyfus Bond Market Index Fund
200 Park Avenue
New York, NY 10166
Manager
The Dreyfus Corporation
200 Park Avenue
New York, NY 10166
Custodian
The Bank of New York Mellon
240 Greenwich Street
New York, NY 10286
Transfer Agent &
Dividend Disbursing Agent
Dreyfus Transfer, Inc.
200 Park Avenue
New York, NY 10166
Distributor
MBSC Securities Corporation
200 Park Avenue
New York, NY 10166
| | |
Ticker Symbols: | Investor: DBMIX Class I: DBIRX |
Telephone Call your financial representative or 1-800-DREYFUS
Mail The Dreyfus Family of Funds, 144 Glenn Curtiss Boulevard, Uniondale, NY 11556-0144
E-mail Send your request to info@dreyfus.com
Internet Information can be viewed online or downloaded at www.dreyfus.com
The fund files its complete schedule of portfolio holdings with the Securities and Exchange Commission (“SEC”) for the first and third quarters of each fiscal year on Form N-Q. The fund’s Forms N-Q are available on the SEC’s website at www.sec.gov.
A description of the policies and procedures that the fund uses to determine how to vote proxies relating to portfolio securities and information regarding how the fund voted these proxies for the most recent 12-month period ended June 30 is available at www.dreyfus.com and on the SEC’s website at www.sec.gov and without charge, upon request, by calling 1-800-DREYFUS.
| | |
© 2018 MBSC Securities Corporation
0310AR1018 | 
|
Dreyfus Disciplined Stock Fund
| | | |

| | ANNUAL REPORT October 31, 2018 |
| |
Save time. Save paper. View your next shareholder report online as soon as it’s available. Log into www.dreyfus.com and sign up for Dreyfus eCommunications. It’s simple and only takes a few minutes. |
| |
The views expressed in this report reflect those of the portfolio manager(s) only through the end of the period covered and do not necessarily represent the views of Dreyfus or any other person in the Dreyfus organization. Any such views are subject to change at any time based upon market or other conditions and Dreyfus disclaims any responsibility to update such views. These views may not be relied on as investment advice and, because investment decisions for a Dreyfus fund are based on numerous factors, may not be relied on as an indication of trading intent on behalf of any Dreyfus fund. |
| |
Not FDIC-Insured • Not Bank-Guaranteed • May Lose Value |
Contents
THE FUND
FOR MORE INFORMATION
Back Cover
| | | | |
| |
Dreyfus Disciplined Stock Fund
| | The Fund |
A LETTER FROM THE PRESIDENT OF DREYFUS
Dear Shareholder:
We are pleased to present this annual report for Dreyfus Disciplined Stock Fund, covering the 12-month period from November 1, 2017 through October 31, 2018. For information about how the fund performed during the reporting period, as well as general market perspectives, we provide a Discussion of Fund Performance on the pages that follow.
Markets began the reporting period on solid footing as major global economies experienced above-trend growth across the board. In the United States, the Federal Reserve continued to move away from its accommodative monetary policy while other major central banks also began to consider monetary tightening. In the equity markets, both U.S. and non-U.S. markets enjoyed an upward trend, though investor concerns about volatility and inflation later began to weigh on returns. Interest rates rose across the curve, putting pressure on bond prices.
Later in the reporting period, global growth trends began to diverge. While a strong economic performance continued to bolster U.S. equity markets, slower growth and political concerns pressured markets in the Eurozone. Emerging markets also came under pressure as weakness in their currencies added to investors’ uneasiness. Fixed income markets continued to struggle as interest rates rose; the yield on the benchmark 10-year Treasury bond surged late in the reporting period, but growing investor concerns about global growth helped keep it from rising further.
Despite continuing doubts regarding trade, U.S. inflationary pressures, and global growth, we are optimistic that the U.S. economy will remain strong in the near term. However, we will stay attentive to signs that signal potential changes on the horizon. As always, we encourage you to discuss the risks and opportunities of today’s investment environment with your financial advisor.
Thank you for your continued confidence and support.
Sincerely,

Renee Laroche-Morris
President
The Dreyfus Corporation
November 15, 2018
2
DISCUSSION OF FUND PERFORMANCE (Unaudited)
For the period from November 1, 2017 through October 31, 2018, as provided by George E. DeFina and John C. Bailer, Portfolio Managers
Market and Fund Performance Overview
For the 12-month period ended October 31, 2018, Dreyfus Disciplined Stock Fund produced a total return of 8.34%.1 In comparison, the S&P 500® Index (the “Index”), the fund’s benchmark, returned 7.35% for the same period.2
U.S. equities advanced during the reporting period amid improving economic prospects and better-than-expected corporate earnings. The fund outperformed its benchmark, supported primarily by strong security selection in the information technology, consumer staples, health care, and utilities sectors.
The Fund’s Investment Approach
The fund seeks capital appreciation. To pursue its goal, the fund normally invests at least 80% of its net assets in stocks, with a focus on large-cap companies.
The fund invests in growth and value stocks, which are chosen through a disciplined investment process that combines computer-modeling techniques, fundamental analysis and risk management. We use an investment process designed to provide investors with investment exposure to sector weightings and risk characteristics generally similar to those of the Index.
We use a proprietary computer model to identify and rank stocks within an industry or sector, based on several characteristics, including: Value, or how a stock is priced relative to its perceived intrinsic worth; Growth, in this case the sustainability or growth of earnings; and Financial Profile, which measures the financial health of the company. The model screens each stock for relative attractiveness within its economic sector and industry and, based on fundamental analysis, we generally select the most attractive of the higher-ranked securities, drawing on a variety of sources, including internal as well as Wall Street research, and company management.
Positive Economic Trends in the Face of Rising Volatility
A positive economic backdrop supported equity markets in late 2017, including sustained GDP growth and higher growth forecasts from the Federal Reserve Board (the “Fed”) for 2018. Passage of tax-reform legislation in December 2017 sparked additional market gains, driving the Index to new all-time highs in January 2018. Some of the more economically sensitive market segments, such as the information technology and financials sectors, led the market’s advance.
Economic data in January indicated robust levels of consumer spending during the critical year-end shopping season, and long-awaited signs of wage growth began to appear. However, concerns about rising inflationary pressures, prospects for more aggressive interest-rate hikes by the Fed, and increasing global trade tensions began to weigh on market
3
DISCUSSION OF FUND PERFORMANCE (Unaudited) (continued)
sentiment. As a result, markets experienced volatility and dipped sharply in February. However, information technology stocks continued to produce relatively strong results, while more defensive sectors found greater support, and energy stocks were bolstered by rising petroleum prices.
Despite growing investor concerns about trade relations, rising interest rates, slowing global growth, and a variety of geopolitical developments, stocks continued to climb as the reporting period progressed. Stock market performance was supported by strong business activity in the United States as well as robust growth in corporate earnings. Late in the period, however, equity markets sold off worldwide on concerns about higher interest rates, trade tensions, and slower economic growth.
Stock Selection Supported Fund Results
The fund outperformed its benchmark primarily on the strength of successful stock selection in the information technology, consumer staples, health care, and utilities sectors. In the information technology sector, companies in the software industry, including cybersecurity provider Fortinet, data analysis company Splunk, and cloud services specialist HubSpot, contributed positively to the fund’s performance. Communications equipment provider Cisco Systems also added to the fund’s relative returns. In the consumer staples sector, the fund held relatively little exposure to the lagging tobacco and household products industries, instead it found better-positioned investments among food products producers, such as Kellogg, and retailers, such as Costco Wholesale, and top health care sector holdings included pharmaceutical giants Pfizer and Merck & Co. as well as veterinary products company IDEXX Laboratories. Underweighted exposure to the biotech industry further bolstered relative returns, as did an underweight to the utilities sector. Investments in electric utilities FirstEnergy and PPL also bolstered the fund’s performance.
On the other hand, disappointing returns from the materials sector, including construction materials producer Vulcan Materials and miner Freeport-McMoRan, detracted from the fund’s performance. In the communication services sector, the fund’s lack of exposure to entertainment company Netflix hindered performance, while a position in social media company Facebook also detracted. A lack of exposure to sports apparel giant Nike and to multi-line retailers such as Target, Kohl’s and Macy’s, which experienced strong returns, hurt the fund’s performance as well.
Finding Opportunities in a Growing Economy
We believe that underlying economic conditions remain positive amid sustained U.S. growth and mild inflation. While we remain watchful of the impact of geopolitical developments and rising interest rates, we have continued to find attractive investment opportunities in many areas, particularly the financials, materials, communication services, and energy sectors. In contrast, as of the end of the reporting period, the fund held underweighted exposure to the
4
consumer discretionary, consumer staples, industrials, real estate, health care, information technology, and utilities sectors.
November 15, 2018
1 Total return includes reinvestment of dividends and any capital gains paid. Past performance is no guarantee of future results. Share price and investment return fluctuate such that upon redemption, fund shares may be worth more or less than their original cost.
2 Source: Lipper Inc. — The S&P 500® Index is widely regarded as the best single gauge of large-cap U.S. equities. The index includes 500 leading companies and captures approximately 80% coverage of available market capitalization. Investors cannot invest directly in any index.
Please note: the position in any security highlighted with italicized typeface was sold during the reporting period.
Equities are subject generally to market, market sector, market liquidity, issuer and investment style risks, among other factors, to varying degrees, all of which are more fully described in the fund’s prospectus.
5
FUND PERFORMANCE (Unaudited)
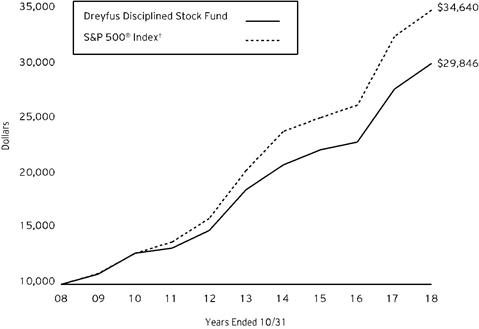
Comparison of change in value of $10,000 investment in Dreyfus Disciplined Stock Fund shares and the S&P 500® Index (the “Index”)
† Source: Lipper Inc.
Past performance is not predictive of future performance.
The above graph compares a $10,000 investment made in Dreyfus Disciplined Stock Fund on 10/31/08 to a $10,000 investment made in the Index on that date. All dividends and capital gain distributions are reinvested.
The fund’s performance shown in the line graph above takes into account all applicable fees and expenses. The Index is widely regarded as the best single gauge of large-cap U.S. equities. The Index includes 500 leading companies and captures approximately 80% coverage of available market capitalization. Unlike a mutual fund, the Index is not subject to charges, fees and other expenses. Investors cannot invest directly in any index. Further information relating to fund performance, including expense reimbursements, if applicable, is contained in the Financial Highlights section of the prospectus and elsewhere in this report.
| | | | |
Average Annual Total Returns as of 10/31/18 | |
| 1 Year | 5 Years | 10 Years |
Fund | 8.34% | 10.01% | 11.56% |
S&P 500® Index | 7.35% | 11.33% | 13.23% |
The performance data quoted represents past performance, which is no guarantee of future results. Share price and investment return fluctuate and an investor’s shares may be worth more or less than original cost upon redemption. Current performance may be lower or higher than the performance quoted. Go to Dreyfus.com for the fund’s most recent month-end returns.
The fund’s performance shown in the graph and table does not reflect the deduction of taxes that a shareholder would pay on fund distributions or the redemption of fund shares.
6
UNDERSTANDING YOUR FUND’S EXPENSES (Unaudited)
As a mutual fund investor, you pay ongoing expenses, such as management fees and other expenses. Using the information below, you can estimate how these expenses affect your investment and compare them with the expenses of other funds. You also may pay one-time transaction expenses, including sales charges (loads) and redemption fees, which are not shown in this section and would have resulted in higher total expenses. For more information, see your fund’s prospectus or talk to your financial adviser.
Review your fund’s expenses
The table below shows the expenses you would have paid on a $1,000 investment in Dreyfus Disciplined Stock Fund from May 1, 2018 to October 31, 2018. It also shows how much a $1,000 investment would be worth at the close of the period, assuming actual returns and expenses.
| | | | | | | | | | |
Expenses and Value of a $1,000 Investment |
assuming actual returns for the six months ended October 31, 2018 | | |
| | | | | | | | | |
Expenses paid per $1,000† | | | | $5.11 | | | |
Ending value (after expenses) | | | | $1,027.80 | | | |
COMPARING YOUR FUND’S EXPENSES
WITH THOSE OF OTHER FUNDS (Unaudited)
Using the SEC’s method to compare expenses
The Securities and Exchange Commission (“SEC”) has established guidelines to help investors assess fund expenses. Per these guidelines, the table below shows your fund’s expenses based on a $1,000 investment, assuming a hypothetical 5% annualized return. You can use this information to compare the ongoing expenses (but not transaction expenses or total cost) of investing in the fund with those of other funds. All mutual fund shareholder reports will provide this information to help you make this comparison. Please note that you cannot use this information to estimate your actual ending account balance and expenses paid during the period.
| | | | | | | | | | | |
Expenses and Value of a $1,000 Investment |
assuming a hypothetical 5% annualized return for the six months ended October 31, 2018 |
| | | | | | | | | |
Expenses paid per $1,000† | | | | $5.09 | | | |
Ending value (after expenses) | | | | $1,020.16 | | | |
† Expenses are equal to the fund’s annualized expense ratio of 1.00%, multiplied by the average account value over the period, multiplied by 184/365 (to reflect the one-half year period).
7
STATEMENT OF INVESTMENTS
October 31, 2018
| | | | | | | | |
| |
Description | | | | Shares | | Value ($) | |
Common Stocks - 96.7% | | | | | |
Automobiles & Components - .6% | | | | | |
General Motors | | | | 101,143 | | 3,700,822 | |
Banks - 7.5% | | | | | |
Bank of America | | | | 515,403 | | 14,173,582 | |
Citigroup | | | | 132,506 | | 8,673,843 | |
JPMorgan Chase & Co. | | | | 169,658 | | 18,496,115 | |
U.S. Bancorp | | | | 55,851 | | 2,919,332 | |
| | | | | 44,262,872 | |
Capital Goods - 4.5% | | | | | |
Honeywell International | | | | 57,307 | | 8,299,200 | |
Quanta Services | | | | 92,695 | a | 2,892,084 | |
Raytheon | | | | 30,917 | | 5,411,712 | |
Resideo Technologies | | | | 9,551 | | 201,052 | |
United Technologies | | | | 80,302 | | 9,974,311 | |
| | | | | 26,778,359 | |
Consumer Services - 2.4% | | | | | |
Chipotle Mexican Grill | | | | 12,577 | a | 5,789,570 | |
Las Vegas Sands | | | | 69,398 | | 3,541,380 | |
McDonald's | | | | 28,272 | | 5,001,317 | |
| | | | | 14,332,267 | |
Diversified Financials - 7.3% | | | | | |
Ameriprise Financial | | | | 32,724 | | 4,163,802 | |
Berkshire Hathaway | | | | 87,878 | a | 18,039,596 | |
Goldman Sachs | | | | 26,203 | | 5,905,370 | |
LPL Financial Holdings | | | | 49,062 | | 3,022,219 | |
Morgan Stanley | | | | 139,698 | | 6,378,611 | |
Voya Financial | | | | 136,829 | | 5,987,637 | |
| | | | | 43,497,235 | |
Energy - 6.9% | | | | | |
Anadarko Petroleum | | | | 72,343 | | 3,848,648 | |
Hess | | | | 69,280 | | 3,976,672 | |
Marathon Petroleum | | | | 136,295 | | 9,601,983 | |
Occidental Petroleum | | | | 126,948 | | 8,514,402 | |
Phillips 66 | | | | 85,227 | | 8,763,040 | |
Valero Energy | | | | 67,855 | | 6,180,912 | |
| | | | | 40,885,657 | |
Food & Staples Retailing - 1.0% | | | | | |
Costco Wholesale | | | | 26,619 | | 6,085,902 | |
Food, Beverage & Tobacco - 3.9% | | | | | |
Coca-Cola European Partners | | | | 76,550 | | 3,482,260 | |
ConAgra Brands | | | | 242,399 | | 8,629,404 | |
Kellogg | | | | 66,993 | | 4,386,702 | |
8
| | | | | | | | |
| |
Description | | | | Shares | | Value ($) | |
Common Stocks - 96.7% (continued) | | | | | |
Food, Beverage & Tobacco - 3.9% (continued) | | | | | |
PepsiCo | | | | 56,574 | | 6,357,786 | |
| | | | | 22,856,152 | |
Health Care Equipment & Services - 6.8% | | | | | |
Becton Dickinson and Co. | | | | 22,247 | | 5,127,933 | |
CVS Health | | | | 88,271 | | 6,389,938 | |
Edwards Lifesciences | | | | 32,917 | a | 4,858,549 | |
HCA Healthcare | | | | 23,575 | | 3,147,970 | |
Humana | | | | 14,957 | | 4,792,372 | |
McKesson | | | | 24,016 | | 2,996,236 | |
Quest Diagnostics | | | | 45,392 | | 4,271,841 | |
UnitedHealth Group | | | | 18,267 | | 4,774,080 | |
WellCare Health Plans | | | | 15,209 | a | 4,197,532 | |
| | | | | 40,556,451 | |
Insurance - 1.6% | | | | | |
American International Group | | | | 103,159 | | 4,259,435 | |
Hartford Financial Services | | | | 115,821 | | 5,260,590 | |
| | | | | 9,520,025 | |
Materials - 5.1% | | | | | |
CF Industries Holdings | | | | 123,124 | | 5,913,646 | |
DowDuPont | | | | 87,540 | | 4,720,157 | |
Freeport-McMoRan | | | | 434,832 | | 5,065,793 | |
Mosaic | | | | 240,124 | | 7,429,437 | |
Vulcan Materials | | | | 72,093 | | 7,291,486 | |
| | | | | 30,420,519 | |
Media & Entertainment - 3.0% | | | | | |
Comcast, Cl. A | | | | 258,884 | | 9,873,836 | |
Omnicom Group | | | | 104,706 | b | 7,781,750 | |
| | | | | 17,655,586 | |
Pharmaceuticals Biotechnology & Life Sciences - 7.0% | | | | | |
Biogen | | | | 19,444 | a | 5,916,226 | |
Illumina | | | | 9,847 | a | 3,063,894 | |
Merck & Co. | | | | 254,253 | | 18,715,563 | |
Pfizer | | | | 328,260 | | 14,134,876 | |
| | | | | 41,830,559 | |
Real Estate - 1.7% | | | | | |
Lamar Advertising, Cl. A | | | | 105,008 | c | 7,699,187 | |
Outfront Media | | | | 148,776 | c | 2,636,311 | |
| | | | | 10,335,498 | |
Retailing - 4.5% | | | | | |
Amazon.com | | | | 12,086 | a | 19,313,549 | |
GrubHub | | | | 24,900 | a | 2,309,226 | |
O'Reilly Automotive | | | | 16,342 | a | 5,241,696 | |
| | | | | 26,864,471 | |
9
STATEMENT OF INVESTMENTS (continued)
| | | | | | | | |
| |
Description | | | | Shares | | Value ($) | |
Common Stocks - 96.7% (continued) | | | | | |
Semiconductors & Semiconductor Equipment - 2.5% | | | | | |
Broadcom | | | | 13,051 | | 2,916,768 | |
NVIDIA | | | | 16,878 | | 3,558,389 | |
Qualcomm | | | | 67,287 | | 4,231,679 | |
Texas Instruments | | | | 43,075 | | 3,998,652 | |
| | | | | 14,705,488 | |
Software & Services - 12.0% | | | | | |
Activision Blizzard | | | | 85,114 | | 5,877,122 | |
Alphabet, Cl. C | | | | 21,558 | a | 23,213,008 | |
FleetCor Technologies | | | | 18,778 | a | 3,756,163 | |
HubSpot | | | | 30,349 | a | 4,116,842 | |
International Business Machines | | | | 65,382 | | 7,547,044 | |
Microsoft | | | | 72,614 | | 7,755,901 | |
Oracle | | | | 94,665 | | 4,623,439 | |
PayPal Holdings | | | | 52,369 | a | 4,408,946 | |
Teradata | | | | 101,229 | a,b | 3,684,736 | |
Visa, Cl. A | | | | 43,158 | | 5,949,330 | |
| | | | | 70,932,531 | |
Technology Hardware & Equipment - 8.7% | | | | | |
Apple | | | | 123,528 | | 27,035,338 | |
Cisco Systems | | | | 366,160 | | 16,751,820 | |
Corning | | | | 116,867 | | 3,733,901 | |
Palo Alto Networks | | | | 22,983 | a | 4,206,808 | |
| | | | | 51,727,867 | |
Telecommunication Services - 4.9% | | | | | |
AT&T | | | | 411,312 | | 12,619,052 | |
Verizon Communications | | | | 291,864 | | 16,662,516 | |
| | | | | 29,281,568 | |
Transportation - 2.5% | | | | | |
Delta Air Lines | | | | 187,124 | | 10,241,297 | |
Union Pacific | | | | 29,314 | | 4,286,293 | |
| | | | | 14,527,590 | |
Utilities - 2.3% | | | | | |
FirstEnergy | | | | 110,501 | | 4,119,477 | |
PPL | | | | 302,976 | | 9,210,470 | |
| | | | | 13,329,947 | |
Total Common Stocks (cost $486,338,605) | | | | 574,087,366 | |
| | | | | | | | |
Exchange-Traded Funds - .5% | | | | | |
Registered Investment Companies - .5% | | | | | |
SPDR S&P 500 ETF Trust
(cost $3,146,393) | | | | 10,802 | b | 2,923,345 | |
10
| | | | | | | | |
| |
Description | | 7-Day
Yield (%) | | Shares | | Value ($) | |
Investment Companies - 1.9% | | | | | |
Registered Investment Companies - 1.9% | | | | | |
Dreyfus Institutional Preferred Government Plus Money Market Fund
(cost $11,270,212) | | 2.21 | | 11,270,212 | d | 11,270,212 | |
Total Investments (cost $500,755,210) | | 99.1% | | 588,280,923 | |
Cash and Receivables (Net) | | .9% | | 5,491,954 | |
Net Assets | | 100.0% | | 593,772,877 | |
ETF—Exchange-Traded Fund
SPDR—Standard & Poor's Depository Receipt
a Non-income producing security.
b Security, or portion thereof, on loan. At October 31, 2018, the value of the fund’s securities on loan was $12,061,747 and the value of the collateral held by the fund was $12,310,703, consisting of U.S. Government & Agency securities.
c Investment in real estate investment trust.
d Investment in affiliated issuer. The investment objective of this investment company is publicly available and can be found within the investment company’s prospectus.
| | |
Portfolio Summary (Unaudited) † | Value (%) |
Information Technology | 23.1 |
Financials | 16.4 |
Health Care | 13.9 |
Consumer Discretionary | 10.5 |
Industrials | 7.0 |
Energy | 6.9 |
Materials | 5.1 |
Telecommunication Services | 4.9 |
Consumer Staples | 4.9 |
Investment Companies | 2.4 |
Utilities | 2.3 |
Real Estate | 1.7 |
| | 99.1 |
† Based on net assets.
See notes to financial statements.
11
STATEMENT OF INVESTMENTS IN AFFILIATED ISSUERS
| | | | | | | |
Registered Investment Companies | Value
10/31/17 ($) | Purchases ($) | Sales ($) | Value
10/31/18 ($) | Net
Assets (%) | Dividends/
Distributions ($) |
Dreyfus Institutional Preferred Government Money Market Fund, Institutional Shares | 7,357,140 | 48,995,661 | 56,352,801 | — | — | — |
Dreyfus Institutional Preferred Government Plus Money Market Fund | 9,300,069 | 163,405,264 | 161,435,121 | 11,270,212 | 1.9 | 106,682 |
Total | 16,657,209 | 212,400,925 | 217,787,922 | 11,270,212 | 1.9 | 106,682 |
See notes to financial statements.
12
STATEMENT OF ASSETS AND LIABILITIES
October 31, 2018
| | | | | | | | | |
| | | | | | |
| | | Cost | | Value | |
Assets ($): | | | | |
Investments in securities—See Statement of Investments
(including securities on loan, valued at $12,061,747)—Note 1(c): | | | |
Unaffiliated issuers | 489,484,998 | | 577,010,711 | |
Affiliated issuers | | 11,270,212 | | 11,270,212 | |
Receivable for investment securities sold | | 8,980,440 | |
Receivable for shares of Common Stock subscribed | | 908,676 | |
Dividends and securities lending income receivable | | 650,064 | |
| | | | | 598,820,103 | |
Liabilities ($): | | | | |
Due to The Dreyfus Corporation and affiliates—Note 3(b) | | | | 511,548 | |
Payable for investment securities purchased | | 4,284,884 | |
Payable for shares of Common Stock redeemed | | 246,094 | |
Directors fees and expenses payable | | 4,700 | |
| | | | | 5,047,226 | |
Net Assets ($) | | | 593,772,877 | |
Composition of Net Assets ($): | | | | |
Paid-in capital | | | | | 416,953,566 | |
Total distributable earnings (loss) | | | | | 176,819,311 | |
Net Assets ($) | | | 593,772,877 | |
Shares Outstanding | | |
(245 million shares of $.001 par value Common Stock authorized) | 15,867,320 | |
Net Asset Value Per Share ($) | | 37.42 | |
| | | | | |
See notes to financial statements. | | | | |
13
STATEMENT OF OPERATIONS
Year Ended October 31, 2018
| | | | | | | |
| | | | | | |
| | | | | | |
Investment Income ($): | | | | |
Income: | | | | |
Cash dividends: | |
Unaffiliated issuers | | | 11,965,118 | |
Affiliated issuers | | | 106,682 | |
Income from securities lending—Note 1(c) | | | 22,658 | |
Total Income | | | 12,094,458 | |
Expenses: | | | | |
Management fee—Note 3(a) | | | 5,577,303 | |
Distribution fees—Note 3(b) | | | 619,700 | |
Directors’ fees—Note 3(a,c) | | | 50,132 | |
Loan commitment fees—Note 2 | | | 13,979 | |
Total Expenses | | | 6,261,114 | |
Less—Directors’ fees reimbursed by Dreyfus—Note 3(a) | | | (50,132) | |
Net Expenses | | | 6,210,982 | |
Investment Income—Net | | | 5,883,476 | |
Realized and Unrealized Gain (Loss) on Investments—Note 4 ($): | | |
Net realized gain (loss) on investments and foreign currency transactions | 87,435,335 | |
Net unrealized appreciation (depreciation) on investments | | | (43,550,698) | |
Net Realized and Unrealized Gain (Loss) on Investments | | | 43,884,637 | |
Net Increase in Net Assets Resulting from Operations | | 49,768,113 | |
| | | | | | | |
See notes to financial statements. | | | | | |
14
STATEMENT OF CHANGES IN NET ASSETS
| | | | | | | | | | |
| | | | Year Ended October 31, |
| | | | 2018 | | 2017a | |
Operations ($): | | | | | | | | |
Investment income—net | | | 5,883,476 | | | | 5,958,792 | |
Net realized gain (loss) on investments | | 87,435,335 | | | | 54,974,431 | |
Net unrealized appreciation (depreciation)
on investments | | (43,550,698) | | | | 48,226,593 | |
Net Increase (Decrease) in Net Assets
Resulting from Operations | 49,768,113 | | | | 109,159,816 | |
Distributions ($): | |
Distributions to shareholders | | | (60,114,651) | | | | (17,300,918) | |
Capital Stock Transactions ($): | |
Net proceeds from shares sold | | | 9,095,494 | | | | 19,011,992 | |
Distributions reinvested | | | 57,606,534 | | | | 16,576,319 | |
Cost of shares redeemed | | | (60,767,858) | | | | (67,559,365) | |
Increase (Decrease) in Net Assets
from Capital Stock Transactions | 5,934,170 | | | | (31,971,054) | |
Total Increase (Decrease) in Net Assets | (4,412,368) | | | | 59,887,844 | |
Net Assets ($): | |
Beginning of Period | | | 598,185,245 | | | | 538,297,401 | |
End of Period | | | 593,772,877 | | | | 598,185,245 | |
Capital Share Transactions (Shares): | |
Shares sold | | | 240,755 | | | | 538,395 | |
Shares issued for distributions reinvested | | | 1,604,164 | | | | 488,454 | |
Shares redeemed | | | (1,599,375) | | | | (1,877,034) | |
Net Increase (Decrease) in Shares Outstanding | 245,544 | | | | (850,185) | |
| | | | | | | | | | |
aDistributions to shareholders include $5,851,063 of distributions from net investment income and $11,449,855 distributions from net realized gains. Undistributed investment income—net was $1,887,354 in 2017 and is no longer presented as a result of the adoption of SEC’s Disclosure Update and Simplification Rule. | |
See notes to financial statements. | | | | | | | | |
15
FINANCIAL HIGHLIGHTS
The following table describes the performance for the fiscal periods indicated. Total return shows how much your investment in the fund would have increased (or decreased) during each period, assuming you had reinvested all dividends and distributions. These figures have been derived from the fund’s financial statements.
| | | | | | | | | | | | |
| | | | | |
| | |
| | Year Ended October 31, |
| | 2018 | 2017 | 2016 | 2015 | 2014 |
Per Share Data ($): | | | | | | |
Net asset value,
beginning of period | | 38.29 | 32.68 | 35.74 | 37.63 | 40.23 |
Investment Operations: | | | | | | |
Investment income—neta | | .36 | .37 | .37 | .32 | .24 |
Net realized and unrealized
gain (loss) on investments | | 2.65 | 6.30 | .60 | 1.96 | 3.86 |
Total from
Investment Operations | | 3.01 | 6.67 | .97 | 2.28 | 4.10 |
Distributions: | | | | | | |
Dividends from
investment income—net | | (.32) | (.36) | (.37) | (.30) | (.24) |
Dividends from net realized
gain on investments | | (3.56) | (.70) | (3.66) | (3.87) | (6.46) |
Total Distributions | | (3.88) | (1.06) | (4.03) | (4.17) | (6.70) |
Net asset value, end of period | | 37.42 | 38.29 | 32.68 | 35.74 | 37.63 |
Total Return (%) | | 8.34 | 20.84 | 3.15 | 6.62 | 11.91 |
Ratios/Supplemental Data (%): |
Ratio of total expenses
to average net assets | | 1.01 | 1.01 | 1.01 | 1.01 | 1.01 |
Ratio of net expenses
to average net assets | | 1.00 | 1.00 | 1.00 | 1.00 | 1.00 |
Ratio of net investment income
to average net assets | | .95 | 1.02 | 1.15 | .90 | .65 |
Portfolio Turnover Rate | | 72.06 | 55.38 | 49.27 | 65.96 | 69.22 |
Net Assets,
end of period ($ x 1,000) | | 593,773 | 598,185 | 538,297 | 564,964 | 588,912 |
a Based on average shares outstanding.
See notes to financial statements.
16
NOTES TO FINANCIAL STATEMENTS
NOTE 1—Significant Accounting Policies:
Dreyfus Disciplined Stock Fund (the “fund”) is a separate diversified series of The Dreyfus/Laurel Funds, Inc. (the “Company”), which is registered under the Investment Company Act of 1940, as amended (the “Act”), as an open-end management investment company and operates as a series company currently offering eight series, including the fund. The fund’s investment objective is to seek capital appreciation. The Dreyfus Corporation (the “Manager” or “Dreyfus”), a wholly-owned subsidiary of The Bank of New York Mellon Corporation (“BNY Mellon”), serves as the fund’s investment adviser. MBSC Securities Corporation (the “Distributor”), a wholly-owned subsidiary of Dreyfus, is the distributor of the fund’s shares, which are sold to the public without a sales charge.
The Company accounts separately for the assets, liabilities and operations of each series. Expenses directly attributable to each series are charged to that series’ operations; expenses which are applicable to all series are allocated among them on a pro rata basis.
The Financial Accounting Standards Board (“FASB”) Accounting Standards Codification is the exclusive reference of authoritative U.S. generally accepted accounting principles (“GAAP”) recognized by the FASB to be applied by nongovernmental entities. Rules and interpretive releases of the Securities and Exchange Commission (“SEC”) under authority of federal laws are also sources of authoritative GAAP for SEC registrants. The fund’s financial statements are prepared in accordance with GAAP, which may require the use of management estimates and assumptions. Actual results could differ from those estimates.
(a) Portfolio valuation: The fair value of a financial instrument is the amount that would be received to sell an asset or paid to transfer a liability in an orderly transaction between market participants at the measurement date (i.e., the exit price). GAAP establishes a fair value hierarchy that prioritizes the inputs of valuation techniques used to measure fair value. This hierarchy gives the highest priority to unadjusted quoted prices in active markets for identical assets or liabilities (Level 1 measurements) and the lowest priority to unobservable inputs (Level 3 measurements).
Additionally, GAAP provides guidance on determining whether the volume and activity in a market has decreased significantly and whether such a decrease in activity results in transactions that are not orderly. GAAP requires enhanced disclosures around valuation inputs and techniques used during annual and interim periods.
17
NOTES TO FINANCIAL STATEMENTS (continued)
Various inputs are used in determining the value of the fund’s investments relating to fair value measurements. These inputs are summarized in the three broad levels listed below:
Level 1—unadjusted quoted prices in active markets for identical investments.
Level 2—other significant observable inputs (including quoted prices for similar investments, interest rates, prepayment speeds, credit risk, etc.).
Level 3—significant unobservable inputs (including the fund’s own assumptions in determining the fair value of investments).
The inputs or methodology used for valuing securities are not necessarily an indication of the risk associated with investing in those securities.
Changes in valuation techniques may result in transfers in or out of an assigned level within the disclosure hierarchy. Valuation techniques used to value the fund’s investments are as follows:
Investments in securities are valued at the last sales price on the securities exchange or national securities market on which such securities are primarily traded. Securities listed on the National Market System for which market quotations are available are valued at the official closing price or, if there is no official closing price that day, at the last sales price. For open short positions, asked prices are used for valuation purposes. Bid price is used when no asked price is available. Registered investment companies that are not traded on an exchange are valued at their net asset value. All of the preceding securities are generally categorized within Level 1 of the fair value hierarchy.
Securities not listed on an exchange or the national securities market, or securities for which there were no transactions, are valued at the average of the most recent bid and asked prices. These securities are generally categorized within Level 2 of the fair value hierarchy.
Fair valuing of securities may be determined with the assistance of a pricing service using calculations based on indices of domestic securities and other appropriate indicators, such as prices of relevant American Depository Receipts and futures. Utilizing these techniques may result in transfers between Level 1 and Level 2 of the fair value hierarchy.
When market quotations or official closing prices are not readily available, or are determined not to accurately reflect fair value, such as when the value of a security has been significantly affected by events after the close of the exchange or market on which the security is principally traded (for
18
example, a foreign exchange or market), but before the fund calculates its net asset value, the fund may value these investments at fair value as determined in accordance with the procedures approved by the Company’s Board of Directors (the “Board”). Certain factors may be considered when fair valuing investments such as: fundamental analytical data, the nature and duration of restrictions on disposition, an evaluation of the forces that influence the market in which the securities are purchased and sold, and public trading in similar securities of the issuer or comparable issuers. These securities are either categorized within Level 2 or 3 of the fair value hierarchy depending on the relevant inputs used.
For restricted securities where observable inputs are limited, assumptions about market activity and risk are used and such securities are generally categorized within Level 3 of the fair value hierarchy.
The following is a summary of the inputs used as of October 31, 2018 in valuing the fund’s investments:
| | | | | | |
| | Level 1 - Unadjusted Quoted Prices | Level 2 - Other Significant Observable Inputs | Level 3 - Significant Unobservable Inputs | Total |
Assets ($) | | | | |
Investments in Securities: | | |
Equity Securities—
Common Stocks† | 574,087,366 | – | – | 574,087,366 |
Exchange-Traded
Funds | 2,923,345 | – | – | 2,923,345 |
Investment Companies | 11,270,212 | – | – | 11,270,212 |
† See Statement of Investments for additional detailed categorizations.
At October 31, 2018, there were no transfers between levels of the fair value hierarchy. It is the fund’s policy to recognize transfers between levels at the end of the reporting period.
(b) Foreign currency transactions: The fund does not isolate that portion of the results of operations resulting from changes in foreign exchange rates on investments from the fluctuations arising from changes in the market prices of securities held. Such fluctuations are included with the net realized and unrealized gain or loss on investments.
Net realized foreign exchange gains or losses arise from sales of foreign currencies, currency gains or losses realized on securities transactions between trade and settlement date, and the difference between the amounts of dividends, interest and foreign withholding taxes recorded on the fund’s books and the U.S. dollar equivalent of the amounts actually
19
NOTES TO FINANCIAL STATEMENTS (continued)
received or paid. Net unrealized foreign exchange gains and losses arise from changes in the value of assets and liabilities other than investments resulting from changes in exchange rates. Foreign currency gains and losses on foreign currency transactions are also included with net realized and unrealized gain or loss on investments.
(c) Securities transactions and investment income: Securities transactions are recorded on a trade date basis. Realized gains and losses from securities transactions are recorded on the identified cost basis. Dividend income is recognized on the ex-dividend date and interest income, including, where applicable, accretion of discount and amortization of premium on investments, is recognized on the accrual basis.
Pursuant to a securities lending agreement with The Bank of New York Mellon, a subsidiary of BNY Mellon and an affiliate of Dreyfus, and its affiliates, the fund may lend securities to qualified institutions. It is the fund’s policy that, at origination, all loans are secured by collateral of at least 102% of the value of U.S. securities loaned and 105% of the value of foreign securities loaned. Collateral equivalent to at least 100% of the market value of securities on loan is maintained at all times. Collateral is either in the form of cash, which can be invested in certain money market mutual funds managed by Dreyfus, or U.S. Government and Agency securities. The fund is entitled to receive all dividends, interest and distributions on securities loaned, in addition to income earned as a result of the lending transaction. Should a borrower fail to return the securities in a timely manner, The Bank of New York Mellon is required to replace the securities for the benefit of the fund or credit the fund with the market value of the unreturned securities and is subrogated to the fund’s rights against the borrower and the collateral. Additionally, the contractual maturity of security lending transactions are on an overnight and continuous basis. During the period ended October 31, 2018, The Bank of New York Mellon earned $4,073 from lending portfolio securities, pursuant to the securities lending agreement.
(d) Affiliated issuers: Investments in other investment companies advised by Dreyfus are considered “affiliated” under the Act.
(e) Dividends and distributions to shareholders: Dividends and distributions are recorded on the ex-dividend date. Dividends from investment income-net are normally declared and paid quarterly. Dividends from net realized capital gains, if any, are normally declared and paid annually, but the fund may make distributions on a more frequent basis to comply with the distribution requirements of the Internal Revenue Code of 1986, as amended (the “Code”). To the extent that net realized capital
20
gains can be offset by capital loss carryovers, it is the policy of the fund not to distribute such gains. Income and capital gain distributions are determined in accordance with income tax regulations, which may differ from GAAP.
(f) Federal income taxes: It is the policy of the fund to continue to qualify as a regulated investment company, if such qualification is in the best interests of its shareholders, by complying with the applicable provisions of the Code, and to make distributions of taxable income and net realized capital gain sufficient to relieve it from substantially all federal income and excise taxes.
As of and during the period ended October 31, 2018, the fund did not have any liabilities for any uncertain tax positions. The fund recognizes interest and penalties, if any, related to uncertain tax positions as income tax expense in the Statement of Operations. During the period ended October 31, 2018, the fund did not incur any interest or penalties.
Each tax year in the four-year period ended October 31, 2018 remains subject to examination by the Internal Revenue Service and state taxing authorities.
At October 31, 2018, the components of accumulated earnings on a tax basis were as follows: undistributed ordinary income $12,090,148, undistributed capital gains $77,702,232 and unrealized appreciation $87,026,931.
The tax character of distributions paid to shareholders during the fiscal periods ended October 31, 2018 and October 31, 2017 were as follows: ordinary income $16,383,703 and $5,851,063, and long-term capital gains $43,730,948 and $11,449,855, respectively.
(g) New Accounting Pronouncements: In August 2018, the FASB issued Accounting Standards Update 2018-13, Fair Value Measurement (Topic 820): Disclosure Framework—Changes to the Disclosure Requirements for Fair Value Measurement (“ASU 2018-13”). The update provides guidance that eliminates, adds and modifies certain disclosure requirements for fair value measurements. ASU 2018-13 will be effective for annual periods beginning after December 15, 2019. Management is currently assessing the potential impact of these changes to future financial statements.
NOTE 2—Bank Lines of Credit:
The fund participates with other Dreyfus-managed funds in an $830 million unsecured credit facility led by Citibank, N.A. and a $300 million unsecured credit facility provided by The Bank of New York Mellon (each,
21
NOTES TO FINANCIAL STATEMENTS (continued)
a “Facility”), each to be utilized primarily for temporary or emergency purposes, including the financing of redemptions. In connection therewith, the fund has agreed to pay its pro rata portion of commitment fees for each Facility. Interest is charged to the fund based on rates determined pursuant to the terms of the respective Facility at the time of borrowing. During the period ended October 31, 2018, the fund did not borrow under the Facilities.
NOTE 3—Investment Management Fee and Other Transactions with Affiliates:
(a) Pursuant to an investment management agreement with Dreyfus, Dreyfus provides or arranges for one or more third parties and/or affiliates to provide investment advisory, administrative, custody, fund accounting and transfer agency services to the fund. Dreyfus also directs the investments of the fund in accordance with its investment objective, policies and limitations. For these services, the fund is contractually obligated to pay Dreyfus a fee, calculated daily and paid monthly, at the annual rate of .90% of the value of the fund’s average daily net assets. Out of its fee, Dreyfus pays all of the expenses of the fund except brokerage fees, taxes, interest expenses, commitment fees on borrowings, Distribution Plan fees, fees and expenses of non-interested Directors (including counsel fees) and extraordinary expenses. In addition, Dreyfus is required to reduce its fee in an amount equal to the fund’s allocable portion of fees and expenses of the non-interested Directors (including counsel fees). During the period ended October 31, 2018, fees reimbursed by Dreyfus amounted to $50,132.
(b) Under the Distribution Plan adopted pursuant to Rule 12b-1 under the Act, the fund may pay annually up to .10% of the value of its average daily net assets to compensate BNY Mellon and Dreyfus for shareholder servicing activities and the Distributor for shareholder servicing activities and expenses primarily intended to result in the sale of fund shares. During the period ended October 31, 2018, the fund was charged $619,700 pursuant to the Distribution Plan.
Under its terms, the Distribution Plan shall remain in effect from year to year, provided such continuance is approved annually by a vote of a majority of those Directors who are not “interested persons” of the Company and who have no direct or indirect financial interest in the operation of or in any agreement related to the Distribution Plan.
The components of “Due to The Dreyfus Corporation and affiliates” in the Statement of Assets and Liabilities consist of: management fees
22
$468,556 and Distribution Plan fees $52,061, which are offset against an expense reimbursement currently in effect in the amount of $9,069.
(c) Each Board member also serves as a Board member of other funds within the Dreyfus complex. Annual retainer fees and attendance fees are allocated to each fund based on net assets.
NOTE 4—Securities Transactions:
The aggregate amount of purchases and sales of investment securities, excluding short-term securities, during the period ended October 31, 2018, amounted to $440,015,330 and $492,775,803, respectively.
At October 31, 2018, the cost of investments for federal income tax purposes was $501,253,992; accordingly, accumulated net unrealized appreciation on investments was $87,026,931, consisting of $110,218,138 gross unrealized appreciation and $23,191,207 gross unrealized depreciation.
23
REPORT OF INDEPENDENT REGISTERED PUBLIC ACCOUNTING FIRM
To the Shareholders and Board of Directors
The Dreyfus/Laurel Funds, Inc.
Opinion on the Financial Statements
We have audited the accompanying statement of assets and liabilities of Dreyfus Disciplined Stock Fund (the “Fund”), a series of The Dreyfus/Laurel Funds, Inc., including the statements of investments and investments in affiliated issuers, as of October 31, 2018, the related statement of operations for the year then ended, the statements of changes in net assets for each of the years in the two-year period then ended and the related notes (collectively, the financial statements) and the financial highlights for each of the years in the five-year period then ended. In our opinion, the financial statements and financial highlights present fairly, in all material respects, the financial position of the Fund as of October 31, 2018, the results of its operations for the year then ended, the changes in its net assets for each of the years in the two-year period then ended and the financial highlights for each of the years in the five-year period then ended, in conformity with U.S. generally accepted accounting principles.
Basis for Opinion
These financial statements and financial highlights are the responsibility of the Fund’s management. Our responsibility is to express an opinion on these financial statements and financial highlights based on our audits. We are a public accounting firm registered with the Public Company Accounting Oversight Board (United States) (PCAOB) and are required to be independent with respect to the Fund in accordance with the U.S. federal securities laws and the applicable rules and regulations of the Securities and Exchange Commission and the PCAOB.
We conducted our audits in accordance with the standards of the PCAOB. Those standards require that we plan and perform the audit to obtain reasonable assurance about whether the financial statements and financial highlights are free of material misstatement, whether due to error or fraud. Our audits included performing procedures to assess the risks of material misstatement of the financial statements and financial highlights, whether due to error or fraud, and performing procedures that respond to those risks. Such procedures included examining, on a test basis, evidence regarding the amounts and disclosures in the financial statements and financial highlights. Such procedures also included confirmation of securities owned as of October 31, 2018, by correspondence with the custodian and brokers or by other appropriate auditing procedures when replies from brokers were not received. Our audits also included evaluating the accounting principles used and significant estimates made by management, as well as evaluating the overall presentation of the financial statements and financial highlights. We believe that our audits provide a reasonable basis for our opinion.

We have served as the auditor of one or more Dreyfus Corporation investment companies since 1994.
New York, New York
December 28, 2018
24
IMPORTANT TAX INFORMATION (Unaudited)
For federal tax purposes, the fund reports the maximum amount allowable, but not less than $10,092,087 as ordinary income dividends paid during the year ended October 31, 2018 as qualified dividend income in accordance with Section 854(b)(1)(B) of the Internal Revenue Code. Also, the fund reports the maximum amount allowable but not less than 70,17% of ordinary income dividends paid during the year ended October 31, 2018 as eligible for the corporate dividends receive notification in early 2019 of the percentage applicable to the preparation of their 2018 income tax returns. Also, the fund reports the maximum amount allowable but not less than $2.8256 per share as a capital gain dividend in accordance with Section 852(b)(3)(C) of the Internal Revenue Code. Also, the fund reports the maximum amount allowable but not less than $.7321 as a short-term capital gain dividend paid on December 6, 2017 in accordance with Sections 871(k)(2) and 881(e) of the Internal Revenue Code.
25
BOARD MEMBERS INFORMATION (Unaudited)
INDEPENDENT BOARD MEMBERS
Joseph S. DiMartino (75)
Chairman of the Board (1999)
Principal Occupation During Past 5 Years:
· Corporate Director and Trustee (1995-present)
Other Public Company Board Memberships During Past 5 Years:
· CBIZ (formerly, Century Business Services, Inc.), a provider of outsourcing functions for small and medium size companies, Director (1997-present)
No. of Portfolios for which Board Member Serves: 124
———————
Francine J. Bovich (67)
Board Member (2012)
Principal Occupation During Past 5 Years:
· Trustee, The Bradley Trusts, private trust funds (2011-present)
Other Public Company Board Memberships During Past 5 Years:
· Annaly Capital Management, Inc., a real estate trust, Director (2014-present)
No. of Portfolios for which Board Member Serves: 72
———————
Kenneth A. Himmel (72)
Board Member (1994)
Principal Occupation During Past 5 Years:
· Managing Partner, Gulf Related, an international real estate development company (2010-present)
· President and CEO, Related Urban Development, a real estate development company (1996-present)
· President and CEO, Himmel & Company, a real estate development company (1980-present)
· CEO, American Food Management, a restaurant company (1983-present)
No. of Portfolios for which Board Member Serves: 25
———————
26
Stephen J. Lockwood (71)
Board Member (1994)
Principal Occupation During Past 5 Years:
· Chairman of the Board, Stephen J. Lockwood and Company LLC, a real estate investment company (2000-present)
No. of Portfolios for which Board Member Serves: 25
———————
Roslyn M. Watson (69)
Board Member (1994)
Principal Occupation During Past 5 Years:
· Principal, Watson Ventures, Inc., a real estate investment company (1993-present)
No. of Portfolios for which Board Member Serves: 58
———————
Benaree Pratt Wiley (72)
Board Member (1998)
Principal Occupation During Past 5 Years:
· Principal, The Wiley Group, a firm specializing in strategy and business development (2005-present)
Other Public Company Board Memberships During Past 5 Years:
· CBIZ (formerly, Century Business Services, Inc.), a provider of outsourcing functions for small and medium size companies, Director (2008-present)
No. of Portfolios for which Board Member Serves: 79
———————
Once elected all Board Members serve for an indefinite term, but achieve Emeritus status upon reaching age 80. The address of the Board Members and Officers is c/o The Dreyfus Corporation, 200 Park Avenue, New York, New York 10166. Additional information about the Board Members is available in the fund’s Statement of Additional Information which can be obtained from Dreyfus free of charge by calling this toll free number: 1-800-DREYFUS.
James M. Fitzgibbons, Emeritus Board Member
27
OFFICERS OF THE FUND (Unaudited)
BRADLEY J. SKAPYAK, President since January 2010.
Chief Operating Officer and a director of the Manager since June 2009, Chairman of Dreyfus Transfer, Inc., an affiliate of the Manager and the transfer agent of the funds, since May 2011 and Chief Executive Officer of MBSC Securities Corporation since August 2016. He is an officer of 62 investment companies (comprised of 124 portfolios) managed by the Manager. He is 59 years old and has been an employee of the Manager since February 1988.
BENNETT A. MACDOUGALL, Chief Legal Officer since October 2015.
Chief Legal Officer of the Manager and Associate General Counsel and Managing Director of BNY Mellon since June 2015; from June 2005 to June 2015, he served in various capacities with Deutsche Bank – Asset & Wealth Management Division, including as Director and Associate General Counsel, and Chief Legal Officer of Deutsche Investment Management Americas Inc. from June 2012 to May 2015. He is an officer of 63 investment companies (comprised of 149 portfolios) managed by the Manager. He is 47 years old and has been an employee of the Manager since June 2015.
JAMES BITETTO, Vice President since August 2005 and Secretary since February 2018.
Managing Counsel of BNY Mellon and Secretary of the Manager, and an officer of 63 investment companies (comprised of 149 portfolios) managed by the Manager. He is 52 years old and has been an employee of the Manager since December 1996.
JOSEPH M. CHIOFFI, Vice President and Assistant Secretary since August 2005.
Managing Counsel of BNY Mellon, and an officer of 63 investment companies (comprised of 149 portfolios) managed by the Manager. He is 56 years old and has been an employee of the Manager since June 2000.
SONALEE CROSS, Vice President and Assistant Secretary since March 2018.
Counsel of BNY Mellon since October 2016; Associate at Proskauer Rose LLP from April 2016 to September 2016; Attorney at EnTrust Capital from August 2015 to February 2016; Associate at Sidley Austin LLP from September 2013 until August 2015. She is an officer of 63 investment companies (comprised of 149 portfolios) managed by Dreyfus. She is 31 years old and has been an employee of the Manager since October 2016.
MAUREEN E. KANE, Vice President and Assistant Secretary since April 2015.
Managing Counsel of BNY Mellon since July 2014; from October 2004 until July 2014, General Counsel, and from May 2009 until July 2014, Chief Compliance Officer of Century Capital Management. She is an officer of 63 investment companies (comprised of 149 portfolios) managed by the Manager. She is 56 years old and has been an employee of the Manager since July 2014.
SARAH S. KELLEHER, Vice President and Assistant Secretary since April 2014.
Managing Counsel of BNY Mellon since December 2017, from March 2013 to December 2017, Senior Counsel of BNY Mellon. She is an officer of 63 investment companies (comprised of 149 portfolios) managed by the Manager. She is 43 years old and has been an employee of the Manager since March 2013.
JEFF PRUSNOFSKY, Vice President and Assistant Secretary since August 2005.
Senior Managing Counsel of BNY Mellon, and an officer of 63 investment companies (comprised of 149 portfolios) managed by the Manager. He is 53 years old and has been an employee of the Manager since October 1990.
NATALYA ZELENSKY, Vice President and Assistant Secretary since March 2017.
Counsel of BNY Mellon since May 2016; Attorney at Wildermuth Endowment Strategy Fund/Wildermuth Advisory, LLC from November 2015 until May 2016; Assistant General Counsel at RCS Advisory Services from July 2014 until November 2015; Associate at Sutherland, Asbill & Brennan from January 2013 until January 2014. She is an officer of 63 investment companies (comprised of 149 portfolios) managed by Dreyfus. She is 33 years old and has been an employee of the Manager since May 2016.
JAMES WINDELS, Treasurer since November 2001.
Director – Mutual Fund Accounting of the Manager, and an officer of 63 investment companies (comprised of 149 portfolios) managed by the Manager. He is 60 years old and has been an employee of the Manager since April 1985.
28
GAVIN C. REILLY, Assistant Treasurer since December 2005.
Tax Manager of the Investment Accounting and Support Department of the Manager, and an officer of 63 investment companies (comprised of 149 portfolios) managed by the Manager. He is 50 years old and has been an employee of the Manager since April 1991.
ROBERT S. ROBOL, Assistant Treasurer since December 2002.
Senior Accounting Manager – Dreyfus Financial Reporting of the Manager, and an officer of 63 investment companies (comprised of 149 portfolios) managed by the Manager. He is 54 years old and has been an employee of the Manager since October 1988.
ROBERT SALVIOLO, Assistant Treasurer since July 2007.
Senior Accounting Manager – Equity Funds of the Manager, and an officer of 63 investment companies (comprised of 149 portfolios) managed by the Manager. He is 51 years old and has been an employee of the Manager since June 1989.
ROBERT SVAGNA, Assistant Treasurer since December 2002.
Senior Accounting Manager – Fixed Income and Equity Funds of the Manager, and an officer of 63 investment companies (comprised of 149 portfolios) managed by the Manager. He is 51 years old and has been an employee of the Manager since November 1990.
JOSEPH W. CONNOLLY, Chief Compliance Officer since October 2004.
Chief Compliance Officer of the Manager, the Dreyfus Family of Funds and BNY Mellon Funds Trust (63 investment companies, comprised of 149 portfolios). He is 61 years old and has served in various capacities with the Manager since 1980, including manager of the firm’s Fund Accounting Department from 1997 through October 2001.
CARIDAD M. CAROSELLA, Anti-Money Laundering Compliance Officer since January 2016.
Anti-Money Laundering Compliance Officer of the Dreyfus Family of Funds and BNY Mellon Funds Trust since January 2016; from May 2015 to December 2015, Interim Anti-Money Laundering Compliance Officer of the Dreyfus Family of Funds and BNY Mellon Funds Trust and the Distributor; from January 2012 to May 2015, AML Surveillance Officer of the Distributor and from 2007 to December 2011, Financial Processing Manager of the Distributor. She is an officer of 57 investment companies (comprised of 143 portfolios) managed by the Manager. She is 50 years old and has been an employee of the Distributor since 1997.
29
Dreyfus Disciplined Stock Fund
200 Park Avenue
New York, NY 10166
Manager
The Dreyfus Corporation
200 Park Avenue
New York, NY 10166
Custodian
The Bank of New York Mellon
240 Greenwich Street
New York, NY 10286
Transfer Agent &
Dividend Disbursing Agent
Dreyfus Transfer, Inc.
200 Park Avenue
New York, NY 10166
Distributor
MBSC Securities Corporation
200 Park Avenue
New York, NY 10166
Telephone Call your financial representative or 1-800-DREYFUS
Mail The Dreyfus Family of Funds, 144 Glenn Curtiss Boulevard, Uniondale, NY 11556-0144
E-mail Send your request to info@dreyfus.com
Internet Information can be viewed online or downloaded at www.dreyfus.com
The fund files its complete schedule of portfolio holdings with the Securities and Exchange Commission (“SEC”) for the first and third quarters of each fiscal year on Form N-Q. The fund’s Forms N-Q are available on the SEC’s website at www.sec.gov.
A description of the policies and procedures that the fund uses to determine how to vote proxies relating to portfolio securities and information regarding how the fund voted these proxies for the most recent 12-month period ended June 30 is available at www.dreyfus.com and on the SEC’s website at www.sec.gov and without charge, upon request, by calling 1-800-DREYFUS.
| | |
© 2018 MBSC Securities Corporation
0728AR1018 | 
|
Dreyfus Institutional S&P 500 Stock Index Fund
| | | |

| | ANNUAL REPORT October 31, 2018 |
| |
Save time. Save paper. View your next shareholder report online as soon as it’s available. Log into www.dreyfus.com and sign up for Dreyfus eCommunications. It’s simple and only takes a few minutes. |
| |
The views expressed in this report reflect those of the portfolio manager(s) only through the end of the period covered and do not necessarily represent the views of Dreyfus or any other person in the Dreyfus organization. Any such views are subject to change at any time based upon market or other conditions and Dreyfus disclaims any responsibility to update such views. These views may not be relied on as investment advice and, because investment decisions for a Dreyfus fund are based on numerous factors, may not be relied on as an indication of trading intent on behalf of any Dreyfus fund. |
| |
Not FDIC-Insured • Not Bank-Guaranteed • May Lose Value |
Contents
THE FUND
FOR MORE INFORMATION
Back Cover
| | | | |
| |
Dreyfus Institutional S&P 500 Stock Index Fund
| | The Fund |
A LETTER FROM THE PRESIDENT OF DREYFUS
Dear Shareholder:
We are pleased to present this annual report for Dreyfus Institutional S&P 500 Stock Index Fund, covering the 12-month period from November 1, 2017 through October 31, 2018. For information about how the fund performed during the reporting period, as well as general market perspectives, we provide a Discussion of Fund Performance on the pages that follow.
Markets began the reporting period on solid footing as major global economies experienced above-trend growth across the board. In the United States, the Federal Reserve continued to move away from its accommodative monetary policy while other major central banks also began to consider monetary tightening. In the equity markets, both U.S. and non-U.S. markets enjoyed an upward trend, though investor concerns about volatility and inflation later began to weigh on returns. Interest rates rose across the curve, putting pressure on bond prices.
Later in the reporting period, global growth trends began to diverge. While a strong economic performance continued to bolster U.S. equity markets, slower growth and political concerns pressured markets in the Eurozone. Emerging markets also came under pressure as weakness in their currencies added to investors’ uneasiness. Fixed income markets continued to struggle as interest rates rose; the yield on the benchmark 10-year Treasury bond surged late in the reporting period, but growing investor concerns about global growth helped keep it from rising further.
Despite continuing doubts regarding trade, U.S. inflationary pressures, and global growth, we are optimistic that the U.S. economy will remain strong in the near term. However, we will stay attentive to signs that signal potential changes on the horizon. As always, we encourage you to discuss the risks and opportunities of today’s investment environment with your financial advisor.
Thank you for your continued confidence and support.
Sincerely,

Renee Laroche-Morris
President
The Dreyfus Corporation
November 15, 2018
2
DISCUSSION OF FUND PERFORMANCE (Unaudited)
For the period from November 1, 2017 through October 31, 2018, as provided by Thomas J. Durante, CFA, Karen Q. Wong, CFA, and Richard A. Brown, CFA, Portfolio Managers
Market and Fund Performance Overview
For the 12-month period ended October 31, 2018, Dreyfus Institutional S&P 500 Stock Index Fund (Class I) produced a total return of 7.11%.1 In comparison, the S&P 500® Index (the “Index”), the fund’s benchmark, returned 7.35% for the same period.2,3
U.S. equities advanced moderately during the reporting period, amid strong economic indicators and high corporate earnings. The difference in returns between the fund and the Index was primarily the result of transaction costs and operating expenses that are not reflected in the Index’s results.
The Fund’s Investment Approach
The fund seeks to match the total return of the Index. To pursue its goal, the fund normally invests at least 95% of its total assets in common stocks included in the Index. To replicate index performance, the fund’s portfolio managers use a passive management approach and generally purchase all of the securities comprising the Index (though, at times, the fund may invest in a representative sample of the Index). Because the fund has expenses, performance will tend to be slightly lower than that of the Index. The fund attempts to have a correlation between its performance and that of the Index of at least 0.95, before expenses. A correlation of 1.00 would mean that the fund and the Index were perfectly correlated.
The Index is an unmanaged index of 500 common stocks, chosen to reflect the industries of the U.S. economy, and is often considered a proxy for the stock market in general.
Positive Economic Trends in the Face of Rising Volatility
A positive economic backdrop supported U.S. equity markets in late 2017, including sustained GDP growth, robust labor markets, and higher growth forecasts from the Federal Reserve Board (the “Fed”) for 2018. Passage of tax-reform legislation in December 2017 sparked additional market gains, driving the Index to new, all-time highs in January 2018. Some of the more economically sensitive market segments, such as the information technology and financials sectors, led the market’s advance at the time.
In the first few months of 2018, volatility entered the picture, as concerns over inflation and the potential for trade disputes roiled markets. However, U.S. markets were able to stabilize, and the upward trend continued, on the back of continued positive economic data, corporate balance-sheet strength, and robust consumer spending. Non-U.S. markets, however, slowed as the rate of economic improvement in areas such as the Eurozone stalled. In late summer, continued political rhetoric in the U.S. regarding trade and midterm elections, and concerns over issues abroad in areas such as Italy, Turkey, Argentina, and the United Kingdom weighed on sentiment. Despite strong underlying fundamentals, volatility crept back into the picture in U.S. markets.
Information Technology Stocks Lead the Market
The information technology sector led the Index over the reporting period, driven higher by software developers and technology service companies. However, investors appeared to
3
DISCUSSION OF FUND PERFORMANCE (Unaudited) (continued)
become more selective in an industry group with rich valuations, favoring profitable companies with sustainable growth rates, such as cloud computing specialists, payment processors, and IT consulting firms. Consumer discretionary stocks also posted high returns, supported primarily by gains in a small number of mega-cap growth stocks. Most notably, online retailer Amazon.com continued to surge, as investors responded positively to its expansion into other industries, such as groceries, travel, and health care. Home improvement companies, such as Lowe’s and Home Depot, also helped the sector, as people make improvements to their homes. Automotive parts companies also benefited from the trend, as people purchase parts to fix their old cars, as opposed to buying new ones. Health care also rebounded to become a top-performing sector during the period.
Laggards for the reporting period included sectors negatively affected by trade disputes, such as materials and industrials. In general, materials companies are affected by trade issues with China. China has traditionally been one of the biggest purchasers of raw materials. They have been purchasing less. Metals and mining companies are also affected. Elsewhere in the sector, the rising price of oil has put pressure on profit margins of chemical companies that use oil-based products as an input for many of their goods. Higher freight costs also hurt returns. Industrial companies also lagged during the period. Industrial conglomerates, such as General Electric, whose stock price dropped throughout the period, resulted in industrials being the worst-performing sector. Machinery companies are also under pressure because of trade tensions, rising costs of raw materials, and revenue delays caused by labor shortages, which prolong the completion of projects.
Replicating the Performance of the Index
Although we do not actively manage the fund’s investments in response to macroeconomic trends, it is worth noting that the U.S. economic recovery appears intact, supported by a strong labor market and sound corporate balance sheets. Although the recovery progress of non-U.S. developed markets seemed to stall in February and remains under fire due to geopolitical issues, the underlying fundamentals remain neutral. The market’s currently constructive conditions could be undermined by unexpected political and economic developments as geopolitical tensions potentially escalate. As always, we have continued to monitor the factors considered by the fund’s investment model in light of current market conditions.
November 15, 2018
¹ Total return includes reinvestment of dividends and any capital gains paid. Past performance is no guarantee of future results. Share price and investment return fluctuate such that upon redemption, fund shares may be worth more or less than their original cost.
² Source: Lipper Inc. — The S&P 500® Index is widely regarded as the best single gauge of large-cap U.S. equities. The index includes 500 leading companies and captures approximately 80% coverage of available market capitalization. Investors cannot invest directly in any index.
³ “Standard & Poor’s®,” “S&P®,” “Standard & Poor’s® 500,” and “S&P 500®” are registered trademarks of Standard & Poor’s Financial Services LLC and have been licensed for use on behalf of the fund. The fund is not sponsored, managed, advised, sold, or promoted by Standard & Poor’s and its affiliates, and Standard & Poor’s and its affiliates make no representation regarding the advisability of investing in the fund.
Equities are subject generally to market, market sector, market liquidity, issuer, and investment style risks, among other factors, to varying degrees, all of which are more fully described in the fund’s prospectus.
4
FUND PERFORMANCE (Unaudited)

Comparison of change in value of $10,000 investment in Dreyfus Institutional S&P 500 Stock Index Fund Class I shares and the S&P 500® Index (the “Index”)
† Source: Lipper Inc.
Past performance is not predictive of future performance.
The above graph compares a $10,000 investment made in the Class I shares of Dreyfus Institutional S&P 500 Stock Index Fund on 10/31/08 to a $10,000 investment made in the Index on that date. All dividends and capital gain distributions are reinvested.
The fund’s performance shown in the line graph above takes into account all applicable fees and expenses. The Index is widely regarded as the best single gauge of large-cap U.S. equities. The Index includes 500 leading companies and captures approximately 80% coverage of available market capitalization. Unlike a mutual fund, the Index is not subject to charges, fees and other expenses. Investors cannot invest directly in any index. Further information relating to fund performance, including expense reimbursements, if applicable, is contained in the Financial Highlights section of the prospectus and elsewhere in this report.
| | | | |
Average Annual Total Returns as of 10/31/18 | |
| 1 Year | 5 Years | 10 Years |
Fund | 7.11% | 11.12% | 13.06% |
S&P 500® Index | 7.35% | 11.33% | 13.23% |
The performance data quoted represents past performance, which is no guarantee of future results. Share price and investment return fluctuate and an investor’s shares may be worth more or less than original cost upon redemption. Current performance may be lower or higher than the performance quoted. Go to Dreyfus.com for the fund’s most recent month-end returns.
The fund’s performance shown in the graph and table does not reflect the deduction of taxes that a shareholder would pay on fund distributions or the redemption of fund shares.
5
UNDERSTANDING YOUR FUND’S EXPENSES (Unaudited)
As a mutual fund investor, you pay ongoing expenses, such as management fees and other expenses. Using the information below, you can estimate how these expenses affect your investment and compare them with the expenses of other funds. You also may pay one-time transaction expenses, including sales charges (loads) and redemption fees, which are not shown in this section and would have resulted in higher total expenses. For more information, see your fund’s prospectus or talk to your financial adviser.
Review your fund’s expenses
The table below shows the expenses you would have paid on a $1,000 investment in Dreyfus Institutional S&P 500 Stock Index Fund from May 1, 2018 to October 31, 2018. It also shows how much a $1,000 investment would be worth at the close of the period, assuming actual returns and expenses.
| | | | | | | | | | | | | | | |
Expenses and Value of a $1,000 Investment | | |
assuming actual returns for the six months ended October 31, 2018 |
| | | | | | | | | |
Expenses paid per $1,000† | | | | | | $1.02 | | | | |
Ending value (after expenses) | | | | | | $1,032.90 | | | | |
COMPARING YOUR FUND’S EXPENSES
WITH THOSE OF OTHER FUNDS (Unaudited)
Using the SEC’s method to compare expenses
The Securities and Exchange Commission (“SEC”) has established guidelines to help investors assess fund expenses. Per these guidelines, the table below shows your fund’s expenses based on a $1,000 investment, assuming a hypothetical 5% annualized return. You can use this information to compare the ongoing expenses (but not transaction expenses or total cost) of investing in the fund with those of other funds. All mutual fund shareholder reports will provide this information to help you make this comparison. Please note that you cannot use this information to estimate your actual ending account balance and expenses paid during the period.
| | | | | | | | | | | | | | | | |
Expenses and Value of a $1,000 Investment | | | |
assuming a hypothetical 5% annualized return for the six months ended October 31, 2018 |
| | | | | | | | | | |
Expenses paid per $1,000† | | | | | | | $1.02 | | | | |
Ending value (after expenses) | | | | | | | $1,024.20 | | | | |
† Expenses are equal to the fund’s annualized expense ratio of .20%, multiplied by the average account value over the period, multiplied by 184/365 (to reflect the one-half year period).
6
STATEMENT OF INVESTMENTS
October 31, 2018
| | | | | | | | |
| |
Description | | | | Shares | | Value ($) | |
Common Stocks - 99.4% | | | | | |
Automobiles & Components - .5% | | | | | |
Aptiv | | | | 29,693 | | 2,280,422 | |
BorgWarner | | | | 21,535 | | 848,694 | |
Ford Motor | | | | 431,770 | | 4,123,404 | |
General Motors | | | | 144,560 | | 5,289,450 | |
Goodyear Tire & Rubber | | | | 25,148 | | 529,617 | |
Harley-Davidson | | | | 17,242 | | 658,989 | |
| | | | | 13,730,576 | |
Banks - 6.0% | | | | | |
Bank of America | | | | 1,026,400 | | 28,226,000 | |
BB&T | | | | 85,846 | | 4,220,189 | |
Citigroup | | | | 278,024 | | 18,199,451 | |
Citizens Financial Group | | | | 53,412 | | 1,994,938 | |
Comerica | | | | 18,624 | | 1,518,973 | |
Fifth Third Bancorp | | | | 76,157 | | 2,055,477 | |
Huntington Bancshares | | | | 120,607 | | 1,728,298 | |
JPMorgan Chase & Co. | | | | 371,289 | | 40,477,927 | |
KeyCorp | | | | 115,981 | | 2,106,215 | |
M&T Bank | | | | 15,970 | | 2,641,598 | |
People's United Financial | | | | 39,010 | a | 610,897 | |
PNC Financial Services | | | | 51,858 | | 6,663,234 | |
Regions Financial | | | | 125,139 | | 2,123,609 | |
SunTrust Banks | | | | 51,749 | | 3,242,592 | |
SVB Financial Group | | | | 5,787 | b | 1,372,850 | |
U.S. Bancorp | | | | 169,292 | | 8,848,893 | |
Wells Fargo & Co. | | | | 478,675 | | 25,479,870 | |
Zions Bancorporation | | | | 21,877 | a | 1,029,313 | |
| | | | | 152,540,324 | |
Capital Goods - 6.5% | | | | | |
3M | | | | 65,102 | | 12,386,307 | |
A.O. Smith | | | | 15,167 | | 690,554 | |
Allegion | | | | 10,666 | | 914,396 | |
AMETEK | | | | 25,359 | | 1,701,082 | |
Arconic | | | | 45,004 | | 914,931 | |
Boeing | | | | 59,088 | | 20,967,968 | |
Caterpillar | | | | 65,407 | | 7,935,177 | |
Cummins | | | | 16,925 | | 2,313,478 | |
Deere & Co. | | | | 35,435 | | 4,799,316 | |
Dover | | | | 16,404 | | 1,358,907 | |
Eaton | | | | 47,895 | | 3,432,635 | |
Emerson Electric | | | | 69,854 | | 4,741,690 | |
Fastenal | | | | 30,751 | a | 1,580,909 | |
7
STATEMENT OF INVESTMENTS (continued)
| | | | | | | | |
| |
Description | | | | Shares | | Value ($) | |
Common Stocks - 99.4% (continued) | | | | | |
Capital Goods - 6.5% (continued) | | | | | |
Flowserve | | | | 15,227 | | 698,919 | |
Fluor | | | | 15,946 | | 699,392 | |
Fortive | | | | 33,167 | | 2,462,650 | |
Fortune Brands Home & Security | | | | 16,065 | | 720,194 | |
General Dynamics | | | | 30,719 | | 5,301,485 | |
General Electric | | | | 954,161 | | 9,637,026 | |
Harris | | | | 13,206 | | 1,963,864 | |
Honeywell International | | | | 82,343 | | 11,924,913 | |
Huntington Ingalls Industries | | | | 5,113 | | 1,117,088 | |
Illinois Tool Works | | | | 33,570 | | 4,282,525 | |
Ingersoll-Rand | | | | 27,364 | | 2,625,302 | |
Jacobs Engineering Group | | | | 13,226 | | 993,140 | |
Johnson Controls International | | | | 100,580 | | 3,215,543 | |
L3 Technologies | | | | 8,544 | | 1,618,832 | |
Lockheed Martin | | | | 27,192 | | 7,990,369 | |
Masco | | | | 33,482 | | 1,004,460 | |
Northrop Grumman | | | | 19,208 | | 5,031,536 | |
PACCAR | | | | 38,564 | | 2,206,246 | |
Parker-Hannifin | | | | 14,802 | | 2,244,427 | |
Pentair | | | | 17,981 | | 721,937 | |
Quanta Services | | | | 18,360 | b | 572,832 | |
Raytheon | | | | 31,487 | | 5,511,484 | |
Resideo Technologies | | | | 51 | | 1,070 | |
Rockwell Automation | | | | 14,008 | | 2,307,538 | |
Rockwell Collins | | | | 18,114 | | 2,318,954 | |
Roper Technologies | | | | 11,393 | | 3,223,080 | |
Snap-on | | | | 6,549 | a | 1,008,153 | |
Stanley Black & Decker | | | | 17,195 | | 2,003,561 | |
Textron | | | | 27,537 | | 1,476,809 | |
TransDigm Group | | | | 5,153 | b | 1,701,778 | |
United Rentals | | | | 9,232 | b | 1,108,486 | |
United Technologies | | | | 82,958 | | 10,304,213 | |
W.W. Grainger | | | | 5,081 | a | 1,442,852 | |
Xylem | | | | 19,141 | | 1,255,267 | |
| | | | | 164,433,275 | |
Commercial & Professional Services - .7% | | | | | |
Cintas | | | | 9,404 | | 1,710,305 | |
Copart | | | | 22,190 | a,b | 1,085,313 | |
Equifax | | | | 12,818 | | 1,300,258 | |
IHS Markit | | | | 39,680 | b | 2,084,390 | |
Nielsen Holdings | | | | 37,563 | | 975,887 | |
Republic Services | | | | 24,370 | | 1,771,212 | |
Robert Half International | | | | 13,472 | | 815,460 | |
8
| | | | | | | | |
| |
Description | | | | Shares | | Value ($) | |
Common Stocks - 99.4% (continued) | | | | | |
Commercial & Professional Services - .7% (continued) | | | | | |
Rollins | | | | 8,593 | a | 508,706 | |
Stericycle | | | | 9,736 | b | 486,508 | |
Verisk Analytics | | | | 18,124 | b | 2,171,980 | |
Waste Management | | | | 43,420 | | 3,884,787 | |
| | | | | 16,794,806 | |
Consumer Durables & Apparel - 1.1% | | | | | |
D.R. Horton | | | | 38,784 | | 1,394,673 | |
Garmin | | | | 12,392 | | 819,855 | |
Hanesbrands | | | | 41,492 | a | 712,003 | |
Hasbro | | | | 12,537 | a | 1,149,768 | |
Leggett & Platt | | | | 15,024 | a | 545,521 | |
Lennar, Cl. A | | | | 32,122 | | 1,380,604 | |
Mattel | | | | 40,381 | a,b | 548,374 | |
Michael Kors Holdings | | | | 15,801 | b | 875,533 | |
Mohawk Industries | | | | 6,775 | b | 845,046 | |
Newell Brands | | | | 48,454 | | 769,450 | |
NIKE, Cl. B | | | | 140,977 | | 10,578,914 | |
PulteGroup | | | | 29,997 | | 737,026 | |
PVH | | | | 8,405 | | 1,015,240 | |
Ralph Lauren | | | | 6,068 | | 786,473 | |
Tapestry | | | | 30,359 | | 1,284,489 | |
Under Armour, Cl. A | | | | 20,587 | a,b | 455,179 | |
Under Armour, Cl. C | | | | 20,737 | b | 411,215 | |
VF | | | | 36,072 | | 2,989,647 | |
Whirlpool | | | | 7,050 | | 773,808 | |
| | | | | 28,072,818 | |
Consumer Services - 1.7% | | | | | |
Carnival | | | | 44,472 | | 2,492,211 | |
Chipotle Mexican Grill | | | | 2,558 | b | 1,177,524 | |
Darden Restaurants | | | | 13,660 | | 1,455,473 | |
H&R Block | | | | 24,076 | | 638,977 | |
Hilton Worldwide Holdings | | | | 32,820 | | 2,335,799 | |
Marriott International, Cl. A | | | | 31,868 | | 3,725,051 | |
McDonald's | | | | 85,698 | | 15,159,976 | |
MGM Resorts International | | | | 54,779 | | 1,461,504 | |
Norwegian Cruise Line Holdings | | | | 23,180 | b | 1,021,543 | |
Royal Caribbean Cruises | | | | 18,562 | | 1,943,998 | |
Starbucks | | | | 149,174 | | 8,692,369 | |
Wynn Resorts | | | | 10,719 | | 1,078,331 | |
Yum! Brands | | | | 35,540 | | 3,213,171 | |
| | | | | 44,395,927 | |
Diversified Financials - 5.2% | | | | | |
Affiliated Managers Group | | | | 6,173 | | 701,623 | |
9
STATEMENT OF INVESTMENTS (continued)
| | | | | | | | |
| |
Description | | | | Shares | | Value ($) | |
Common Stocks - 99.4% (continued) | | | | | |
Diversified Financials - 5.2% (continued) | | | | | |
American Express | | | | 78,496 | | 8,063,894 | |
Ameriprise Financial | | | | 15,962 | | 2,031,005 | |
Bank of New York Mellon | | | | 102,450 | | 4,848,959 | |
Berkshire Hathaway | | | | 215,009 | b | 44,137,048 | |
BlackRock | | | | 13,451 | | 5,534,010 | |
Capital One Financial | | | | 52,751 | | 4,710,664 | |
CBOE Holdings | | | | 12,728 | | 1,436,355 | |
Charles Schwab | | | | 132,657 | | 6,134,060 | |
CME Group | | | | 37,570 | | 6,884,327 | |
Discover Financial Services | | | | 38,370 | | 2,673,238 | |
E*TRADE Financial | | | | 30,026 | | 1,483,885 | |
Franklin Resources | | | | 36,126 | a | 1,101,843 | |
Goldman Sachs | | | | 38,667 | | 8,714,382 | |
Intercontinental Exchange | | | | 63,656 | | 4,904,058 | |
Invesco | | | | 45,450 | | 986,720 | |
Jefferies Financial Group | | | | 32,214 | | 691,635 | |
Moody's | | | | 18,510 | | 2,692,835 | |
Morgan Stanley | | | | 146,690 | | 6,697,865 | |
MSCI | | | | 9,839 | | 1,479,589 | |
Nasdaq | | | | 13,452 | | 1,166,423 | |
Northern Trust | | | | 24,580 | | 2,312,241 | |
Raymond James Financial | | | | 14,629 | | 1,121,898 | |
S&P Global | | | | 27,759 | | 5,061,021 | |
State Street | | | | 41,806 | | 2,874,163 | |
Synchrony Financial | | | | 75,641 | | 2,184,512 | |
T. Rowe Price Group | | | | 26,707 | | 2,590,312 | |
| | | | | 133,218,565 | |
Energy - 5.7% | | | | | |
Anadarko Petroleum | | | | 56,404 | | 3,000,693 | |
Apache | | | | 41,826 | a | 1,582,278 | |
Baker Hughes | | | | 45,852 | | 1,223,790 | |
Cabot Oil & Gas | | | | 49,065 | | 1,188,845 | |
Chevron | | | | 211,443 | | 23,607,611 | |
Cimarex Energy | | | | 10,914 | | 867,336 | |
Concho Resources | | | | 22,045 | b | 3,066,239 | |
ConocoPhillips | | | | 128,628 | | 8,991,097 | |
Devon Energy | | | | 58,148 | | 1,883,995 | |
EOG Resources | | | | 63,591 | | 6,698,676 | |
EQT | | | | 29,062 | | 987,236 | |
Exxon Mobil | | | | 467,257 | | 37,231,038 | |
Halliburton | | | | 96,904 | | 3,360,631 | |
Helmerich & Payne | | | | 12,453 | | 775,697 | |
Hess | | | | 28,808 | | 1,653,579 | |
10
| | | | | | | | |
| |
Description | | | | Shares | | Value ($) | |
Common Stocks - 99.4% (continued) | | | | | |
Energy - 5.7% (continued) | | | | | |
HollyFrontier | | | | 18,028 | | 1,215,808 | |
Kinder Morgan | | | | 207,894 | | 3,538,356 | |
Marathon Oil | | | | 93,627 | | 1,777,977 | |
Marathon Petroleum | | | | 75,651 | | 5,329,613 | |
National Oilwell Varco | | | | 42,152 | | 1,551,194 | |
Newfield Exploration | | | | 22,772 | b | 459,994 | |
Noble Energy | | | | 53,278 | | 1,323,958 | |
Occidental Petroleum | | | | 84,360 | | 5,658,025 | |
ONEOK | | | | 44,991 | | 2,951,410 | |
Phillips 66 | | | | 47,075 | | 4,840,252 | |
Pioneer Natural Resources | | | | 18,922 | | 2,786,643 | |
Schlumberger | | | | 152,175 | | 7,808,099 | |
TechnipFMC | | | | 47,865 | | 1,258,850 | |
Valero Energy | | | | 47,602 | | 4,336,066 | |
Williams Cos. | | | | 133,125 | | 3,238,931 | |
| | | | | 144,193,917 | |
Food & Staples Retailing - 1.6% | | | | | |
Costco Wholesale | | | | 48,392 | | 11,063,863 | |
Kroger | | | | 87,995 | | 2,618,731 | |
Sysco | | | | 52,049 | | 3,712,655 | |
Walgreens Boots Alliance | | | | 93,299 | | 7,442,461 | |
Wal-Mart Stores | | | | 158,915 | | 15,935,996 | |
| | | | | 40,773,706 | |
Food, Beverage & Tobacco - 4.1% | | | | | |
Altria Group | | | | 208,137 | | 13,537,230 | |
Archer-Daniels-Midland | | | | 62,304 | | 2,943,864 | |
Brown-Forman, Cl. B | | | | 19,579 | | 907,291 | |
Campbell Soup | | | | 22,089 | a | 826,349 | |
Coca-Cola | | | | 422,412 | | 20,225,087 | |
ConAgra Brands | | | | 50,671 | | 1,803,888 | |
Constellation Brands, Cl. A | | | | 18,776 | | 3,740,742 | |
General Mills | | | | 65,047 | | 2,849,059 | |
Hershey | | | | 15,512 | | 1,662,111 | |
Hormel Foods | | | | 28,317 | a | 1,235,754 | |
J.M. Smucker | | | | 12,452 | | 1,348,801 | |
Kellogg | | | | 27,884 | | 1,825,844 | |
Kraft Heinz | | | | 68,456 | | 3,763,026 | |
McCormick & Co. | | | | 13,308 | a | 1,916,352 | |
Molson Coors Brewing, Cl. B | | | | 19,729 | | 1,262,656 | |
Mondelez International, Cl. A | | | | 162,817 | | 6,835,058 | |
Monster Beverage | | | | 44,652 | b | 2,359,858 | |
PepsiCo | | | | 156,077 | | 17,539,933 | |
Philip Morris International | | | | 170,778 | | 15,040,418 | |
11
STATEMENT OF INVESTMENTS (continued)
| | | | | | | | |
| |
Description | | | | Shares | | Value ($) | |
Common Stocks - 99.4% (continued) | | | | | |
Food, Beverage & Tobacco - 4.1% (continued) | | | | | |
Tyson Foods, Cl. A | | | | 33,266 | | 1,993,299 | |
| | | | | 103,616,620 | |
Health Care Equipment & Services - 6.7% | | | | | |
Abbott Laboratories | | | | 193,603 | | 13,346,991 | |
ABIOMED | | | | 4,936 | b | 1,684,163 | |
Aetna | | | | 35,932 | | 7,128,909 | |
Align Technology | | | | 7,965 | b | 1,761,858 | |
AmerisourceBergen | | | | 17,306 | | 1,522,928 | |
Anthem | | | | 28,659 | | 7,897,561 | |
Baxter International | | | | 54,488 | | 3,406,045 | |
Becton Dickinson and Co | | | | 29,348 | | 6,764,714 | |
Boston Scientific | | | | 151,556 | b | 5,477,234 | |
Cardinal Health | | | | 33,929 | | 1,716,807 | |
Centene | | | | 22,519 | b | 2,934,676 | |
Cerner | | | | 36,201 | b | 2,073,593 | |
Cigna | | | | 26,824 | | 5,735,239 | |
Cooper | | | | 5,546 | | 1,432,587 | |
CVS Health | | | | 111,677 | | 8,084,298 | |
Danaher | | | | 67,527 | | 6,712,184 | |
DaVita | | | | 14,168 | b | 954,073 | |
Dentsply Sirona | | | | 25,898 | | 896,848 | |
Edwards Lifesciences | | | | 22,985 | b | 3,392,586 | |
Express Scripts Holding | | | | 61,625 | b | 5,975,776 | |
HCA Healthcare | | | | 29,883 | | 3,990,277 | |
Henry Schein | | | | 16,423 | a,b | 1,363,109 | |
Hologic | | | | 31,473 | b | 1,227,132 | |
Humana | | | | 15,086 | | 4,833,705 | |
IDEXX Laboratories | | | | 9,549 | b | 2,025,534 | |
Intuitive Surgical | | | | 12,442 | b | 6,484,522 | |
Laboratory Corporation of America Holdings | | | | 11,171 | b | 1,793,504 | |
McKesson | | | | 22,658 | | 2,826,812 | |
Medtronic | | | | 148,777 | | 13,363,150 | |
Quest Diagnostics | | | | 15,417 | | 1,450,894 | |
ResMed | | | | 15,126 | | 1,602,146 | |
Stryker | | | | 34,336 | | 5,569,986 | |
UnitedHealth Group | | | | 106,222 | | 27,761,120 | |
Universal Health Services, Cl. B | | | | 9,530 | | 1,158,467 | |
Varian Medical Systems | | | | 9,955 | b | 1,188,328 | |
WellCare Health Plans | | | | 5,490 | b | 1,515,185 | |
Zimmer Biomet Holdings | | | | 21,954 | | 2,493,755 | |
| | | | | 169,546,696 | |
12
| | | | | | | | |
| |
Description | | | | Shares | | Value ($) | |
Common Stocks - 99.4% (continued) | | | | | |
Household & Personal Products - 1.6% | | | | | |
Church & Dwight | | | | 27,162 | | 1,612,608 | |
Clorox | | | | 13,797 | | 2,048,165 | |
Colgate-Palmolive | | | | 95,650 | | 5,695,958 | |
Coty | | | | 54,911 | a | 579,311 | |
Estee Lauder, Cl. A | | | | 24,323 | | 3,342,953 | |
Kimberly-Clark | | | | 38,256 | | 3,990,101 | |
Procter & Gamble | | | | 274,887 | | 24,376,979 | |
| | | | | 41,646,075 | |
Insurance - 2.3% | | | | | |
Aflac | | | | 85,488 | | 3,681,968 | |
Allstate | | | | 39,010 | | 3,734,037 | |
American International Group | | | | 97,850 | | 4,040,227 | |
Aon | | | | 27,175 | | 4,244,192 | |
Arthur J. Gallagher & Co. | | | | 20,283 | | 1,501,145 | |
Assurant | | | | 6,114 | | 594,342 | |
Brighthouse Financial | | | | 13,157 | b | 521,412 | |
Chubb | | | | 51,167 | | 6,391,270 | |
Cincinnati Financial | | | | 16,645 | | 1,308,963 | |
Everest Re Group | | | | 4,296 | | 935,927 | |
Hartford Financial Services | | | | 40,308 | | 1,830,789 | |
Lincoln National | | | | 24,355 | | 1,465,927 | |
Loews | | | | 29,447 | | 1,371,052 | |
Marsh & McLennan Cos. | | | | 55,525 | | 4,705,744 | |
MetLife | | | | 109,993 | | 4,530,612 | |
Principal Financial Group | | | | 29,945 | | 1,409,511 | |
Progressive | | | | 63,777 | | 4,445,257 | |
Prudential Financial | | | | 46,144 | | 4,327,384 | |
Torchmark | | | | 11,700 | | 990,522 | |
Travelers Cos | | | | 29,765 | | 3,724,494 | |
Unum | | | | 23,513 | | 852,581 | |
Willis Towers Watson | | | | 14,227 | | 2,036,737 | |
| | | | | 58,644,093 | |
Materials - 2.5% | | | | | |
Air Products & Chemicals | | | | 24,179 | | 3,732,029 | |
Albemarle | | | | 12,118 | a,b | 1,202,348 | |
Avery Dennison | | | | 10,102 | | 916,454 | |
Ball | | | | 39,764 | a | 1,781,427 | |
CF Industries Holdings | | | | 26,013 | | 1,249,404 | |
DowDuPont | | | | 255,315 | | 13,766,585 | |
Eastman Chemical | | | | 15,839 | | 1,240,986 | |
Ecolab | | | | 28,265 | | 4,328,785 | |
FMC | | | | 15,063 | | 1,176,119 | |
Freeport-McMoRan | | | | 159,386 | | 1,856,847 | |
13
STATEMENT OF INVESTMENTS (continued)
| | | | | | | | |
| |
Description | | | | Shares | | Value ($) | |
Common Stocks - 99.4% (continued) | | | | | |
Materials - 2.5% (continued) | | | | | |
International Flavors & Fragrances | | | | 8,607 | a | 1,245,089 | |
International Paper | | | | 44,523 | | 2,019,563 | |
Linde | | | | 59,906 | | 9,912,646 | |
LyondellBasell Industries, Cl. A | | | | 35,160 | | 3,138,733 | |
Martin Marietta Materials | | | | 7,051 | | 1,207,695 | |
Mosaic | | | | 40,304 | | 1,247,006 | |
Newmont Mining | | | | 57,430 | | 1,775,736 | |
Nucor | | | | 35,250 | | 2,083,980 | |
Packaging Corporation of America | | | | 9,888 | | 907,817 | |
PPG Industries | | | | 26,799 | | 2,816,307 | |
Sealed Air | | | | 17,166 | | 555,492 | |
Sherwin-Williams | | | | 8,942 | | 3,518,409 | |
Vulcan Materials | | | | 14,143 | | 1,430,423 | |
WestRock | | | | 27,871 | | 1,197,617 | |
| | | | | 64,307,497 | |
Media & Entertainment - 8.0% | | | | | |
Activision Blizzard | | | | 83,607 | | 5,773,063 | |
Alphabet, Cl. A | | | | 32,997 | b | 35,985,868 | |
Alphabet, Cl. C | | | | 33,988 | b | 36,597,259 | |
CBS, Cl. B | | | | 37,892 | | 2,173,106 | |
Charter Communications, Cl. A | | | | 19,769 | b | 6,333,395 | |
Comcast, Cl. A | | | | 504,717 | | 19,249,906 | |
Discovery Communications, Cl. A | | | | 17,820 | a,b | 577,190 | |
Discovery Communications, Cl. C | | | | 37,222 | b | 1,090,977 | |
DISH Network, Cl. A | | | | 25,877 | b | 795,459 | |
Electronic Arts | | | | 33,490 | b | 3,046,920 | |
Facebook, Cl. A | | | | 266,222 | b | 40,409,837 | |
Interpublic Group of Companies | | | | 44,152 | | 1,022,560 | |
Netflix | | | | 48,054 | b | 14,501,736 | |
News Corp., Cl. A | | | | 44,010 | | 580,492 | |
News Corp., Cl. B | | | | 11,554 | | 154,130 | |
Omnicom Group | | | | 25,352 | | 1,884,161 | |
Take-Two Interactive Software | | | | 12,519 | b | 1,613,324 | |
TripAdvisor | | | | 12,859 | b | 670,468 | |
Twenty-First Century Fox, Cl. A | | | | 116,269 | | 5,292,565 | |
Twenty-First Century Fox, Cl. B | | | | 53,455 | | 2,415,097 | |
Twitter | | | | 79,034 | b | 2,746,432 | |
Viacom, Cl. B | | | | 40,302 | | 1,288,858 | |
Walt Disney | | | | 164,136 | | 18,847,737 | |
| | | | | 203,050,540 | |
Pharmaceuticals Biotechnology & Life Sciences - 8.2% | | | | | |
AbbVie | | | | 166,684 | | 12,976,349 | |
Agilent Technologies | | | | 36,243 | | 2,348,184 | |
14
| | | | | | | | |
| |
Description | | | | Shares | | Value ($) | |
Common Stocks - 99.4% (continued) | | | | | |
Pharmaceuticals Biotechnology & Life Sciences - 8.2% (continued) | | | | | |
Alexion Pharmaceuticals | | | | 24,283 | b | 2,721,396 | |
Allergan | | | | 35,403 | | 5,594,028 | |
Amgen | | | | 71,624 | | 13,808,391 | |
Biogen | | | | 22,308 | b | 6,787,655 | |
Bristol-Myers Squibb | | | | 180,058 | | 9,100,131 | |
Celgene | | | | 77,770 | b | 5,568,332 | |
Eli Lilly & Co. | | | | 105,599 | | 11,451,156 | |
Gilead Sciences | | | | 143,383 | | 9,775,853 | |
Illumina | | | | 16,287 | b | 5,067,700 | |
Incyte | | | | 19,682 | b | 1,275,787 | |
IQVIA Holdings | | | | 17,783 | b | 2,186,064 | |
Johnson & Johnson | | | | 296,073 | | 41,447,259 | |
Merck & Co. | | | | 293,730 | | 21,621,465 | |
Mettler-Toledo International | | | | 2,734 | b | 1,495,006 | |
Mylan | | | | 57,862 | b | 1,808,188 | |
Nektar Therapeutics | | | | 18,958 | b | 733,295 | |
PerkinElmer | | | | 11,843 | a | 1,024,183 | |
Perrigo | | | | 14,446 | a | 1,015,554 | |
Pfizer | | | | 646,902 | | 27,855,600 | |
Regeneron Pharmaceuticals | | | | 8,544 | b | 2,898,467 | |
Thermo Fisher Scientific | | | | 44,195 | | 10,326,162 | |
Vertex Pharmaceuticals | | | | 28,176 | b | 4,774,705 | |
Waters | | | | 8,900 | b | 1,688,241 | |
Zoetis | | | | 53,006 | | 4,778,491 | |
| | | | | 210,127,642 | |
Real Estate - 2.8% | | | | | |
Alexandria Real Estate Equities | | | | 11,644 | c | 1,423,246 | |
American Tower | | | | 48,236 | c | 7,515,651 | |
Apartment Investment & Management, Cl. A | | | | 17,092 | c | 735,640 | |
AvalonBay Communities | | | | 15,359 | c | 2,693,662 | |
Boston Properties | | | | 16,605 | c | 2,005,220 | |
CBRE Group, Cl. A | | | | 34,290 | b | 1,381,544 | |
Crown Castle International | | | | 45,376 | c | 4,934,186 | |
Digital Realty Trust | | | | 22,846 | c | 2,359,078 | |
Duke Realty | | | | 40,874 | c | 1,126,896 | |
Equinix | | | | 8,698 | c | 3,294,281 | |
Equity Residential | | | | 40,850 | c | 2,653,616 | |
Essex Property Trust | | | | 7,059 | c | 1,770,256 | |
Extra Space Storage | | | | 14,141 | c | 1,273,538 | |
Federal Realty Investment Trust | | | | 7,949 | c | 986,073 | |
HCP | | | | 49,076 | c | 1,352,044 | |
15
STATEMENT OF INVESTMENTS (continued)
| | | | | | | | |
| |
Description | | | | Shares | | Value ($) | |
Common Stocks - 99.4% (continued) | | | | | |
Real Estate - 2.8% (continued) | | | | | |
Host Hotels & Resorts | | | | 81,147 | c | 1,550,719 | |
Iron Mountain | | | | 30,034 | c | 919,341 | |
Kimco Realty | | | | 48,850 | c | 785,997 | |
Macerich | | | | 12,689 | c | 655,006 | |
Mid-America Apartment Communities | | | | 12,926 | c | 1,262,999 | |
Prologis | | | | 69,374 | c | 4,472,542 | |
Public Storage | | | | 16,253 | c | 3,339,504 | |
Realty Income | | | | 30,916 | a,c | 1,863,307 | |
Regency Centers | | | | 18,602 | c | 1,178,623 | |
SBA Communications | | | | 12,656 | b,c | 2,052,424 | |
Simon Property Group | | | | 33,833 | c | 6,209,032 | |
SL Green Realty | | | | 9,919 | c | 905,208 | |
UDR | | | | 29,997 | c | 1,175,582 | |
Ventas | | | | 38,163 | c | 2,214,981 | |
Vornado Realty Trust | | | | 19,273 | c | 1,312,106 | |
Welltower | | | | 41,298 | c | 2,728,559 | |
Weyerhaeuser | | | | 83,799 | c | 2,231,567 | |
| | | | | 70,362,428 | |
Retailing - 6.3% | | | | | |
Advance Auto Parts | | | | 8,382 | | 1,339,108 | |
Amazon.com | | | | 45,184 | b | 72,204,484 | |
AutoZone | | | | 2,988 | b | 2,191,608 | |
Best Buy | | | | 27,337 | | 1,917,964 | |
Booking Holdings | | | | 5,247 | b | 9,835,921 | |
CarMax | | | | 19,131 | a,b | 1,299,186 | |
Dollar General | | | | 29,260 | | 3,258,979 | |
Dollar Tree | | | | 25,557 | b | 2,154,455 | |
eBay | | | | 103,132 | b | 2,993,922 | |
Expedia | | | | 13,191 | | 1,654,547 | |
Foot Locker | | | | 12,991 | | 612,396 | |
Gap | | | | 23,522 | | 642,151 | |
Genuine Parts | | | | 15,609 | | 1,528,433 | |
Home Depot | | | | 126,343 | | 22,221,207 | |
Kohl's | | | | 17,617 | | 1,334,135 | |
L Brands | | | | 28,117 | a | 911,553 | |
LKQ | | | | 34,980 | b | 953,905 | |
Lowe's | | | | 89,636 | | 8,535,140 | |
Macy's | | | | 33,603 | a | 1,152,247 | |
Nordstrom | | | | 11,735 | a | 771,811 | |
O'Reilly Automotive | | | | 8,917 | b | 2,860,128 | |
Ross Stores | | | | 41,885 | | 4,146,615 | |
Target | | | | 59,117 | | 4,943,955 | |
The TJX Companies | | | | 69,279 | | 7,612,377 | |
16
| | | | | | | | |
| |
Description | | | | Shares | | Value ($) | |
Common Stocks - 99.4% (continued) | | | | | |
Retailing - 6.3% (continued) | | | | | |
Tiffany & Co. | | | | 11,958 | | 1,330,925 | |
Tractor Supply | | | | 13,635 | | 1,252,920 | |
Ulta Beauty | | | | 6,561 | b | 1,801,126 | |
| | | | | 161,461,198 | |
Semiconductors & Semiconductor Equipment - 3.6% | | | | | |
Advanced Micro Devices | | | | 94,533 | a,b | 1,721,446 | |
Analog Devices | | | | 40,980 | | 3,430,436 | |
Applied Materials | | | | 108,722 | | 3,574,779 | |
Broadcom | | | | 47,475 | | 10,610,188 | |
Intel | | | | 509,295 | | 23,875,750 | |
KLA-Tencor | | | | 17,454 | | 1,597,739 | |
Lam Research | | | | 17,451 | | 2,473,330 | |
Microchip Technology | | | | 26,282 | a | 1,728,830 | |
Micron Technology | | | | 127,391 | b | 4,805,189 | |
NVIDIA | | | | 67,094 | | 14,145,428 | |
Qorvo | | | | 13,299 | b | 977,609 | |
Qualcomm | | | | 154,520 | a | 9,717,763 | |
Skyworks Solutions | | | | 20,324 | | 1,763,310 | |
Texas Instruments | | | | 107,480 | | 9,977,368 | |
Xilinx | | | | 27,431 | | 2,341,784 | |
| | | | | 92,740,949 | |
Software & Services - 10.6% | | | | | |
Accenture | | | | 70,569 | | 11,123,086 | |
Adobe Systems | | | | 54,106 | b | 13,297,091 | |
Akamai Technologies | | | | 18,556 | b | 1,340,671 | |
Alliance Data Systems | | | | 5,035 | | 1,038,116 | |
ANSYS | | | | 9,052 | b | 1,353,727 | |
Autodesk | | | | 23,804 | b | 3,076,667 | |
Automatic Data Processing | | | | 48,281 | | 6,956,326 | |
Broadridge Financial Solutions | | | | 12,958 | | 1,515,309 | |
CA | | | | 34,296 | | 1,521,371 | |
Cadence Design Systems | | | | 32,200 | b | 1,435,154 | |
Citrix Systems | | | | 13,744 | | 1,408,348 | |
Cognizant Technology Solutions, Cl. A | | | | 64,184 | | 4,430,622 | |
DXC Technology | | | | 30,981 | | 2,256,346 | |
Fidelity National Information Services | | | | 36,286 | | 3,777,373 | |
Fiserv | | | | 45,282 | b | 3,590,863 | |
FleetCor Technologies | | | | 9,844 | b | 1,969,095 | |
Fortinet | | | | 14,258 | b | 1,171,722 | |
Gartner | | | | 10,313 | b | 1,521,374 | |
Global Payments | | | | 17,862 | | 2,040,376 | |
International Business Machines | | | | 100,417 | | 11,591,134 | |
Intuit | | | | 28,465 | | 6,006,115 | |
17
STATEMENT OF INVESTMENTS (continued)
| | | | | | | | |
| |
Description | | | | Shares | | Value ($) | |
Common Stocks - 99.4% (continued) | | | | | |
Software & Services - 10.6% (continued) | | | | | |
Mastercard, Cl. A | | | | 100,766 | | 19,918,415 | |
Microsoft | | | | 846,372 | | 90,400,993 | |
Oracle | | | | 313,424 | | 15,307,628 | |
Paychex | | | | 35,507 | | 2,325,353 | |
PayPal Holdings | | | | 130,290 | b | 10,969,115 | |
Red Hat | | | | 19,206 | b | 3,296,518 | |
salesforce.com | | | | 83,227 | b | 11,422,073 | |
Symantec | | | | 67,783 | | 1,230,261 | |
Synopsys | | | | 16,308 | b | 1,460,055 | |
Total System Services | | | | 17,869 | | 1,628,759 | |
VeriSign | | | | 11,776 | b | 1,678,551 | |
Visa, Cl. A | | | | 196,300 | a | 27,059,955 | |
Western Union | | | | 47,723 | a | 860,923 | |
| | | | | 269,979,485 | |
Technology Hardware & Equipment - 6.4% | | | | | |
Amphenol | | | | 33,142 | | 2,966,209 | |
Apple | | | | 506,511 | | 110,854,997 | |
Arista Networks | | | | 5,652 | b | 1,301,938 | |
Cisco Systems | | | | 505,738 | | 23,137,513 | |
Corning | | | | 91,307 | | 2,917,259 | |
F5 Networks | | | | 6,503 | b | 1,139,846 | |
FLIR Systems | | | | 14,624 | | 677,237 | |
Hewlett Packard Enterprise | | | | 162,944 | | 2,484,896 | |
HP | | | | 175,311 | | 4,232,008 | |
IPG Photonics | | | | 4,224 | b | 564,115 | |
Juniper Networks | | | | 39,107 | | 1,144,662 | |
Motorola Solutions | | | | 17,838 | | 2,186,225 | |
NetApp | | | | 28,899 | | 2,268,283 | |
Seagate Technology | | | | 29,072 | | 1,169,567 | |
TE Connectivity | | | | 38,230 | | 2,883,307 | |
Western Digital | | | | 32,123 | | 1,383,538 | |
Xerox | | | | 23,214 | | 646,974 | |
| | | | | 161,958,574 | |
Telecommunication Services - 2.1% | | | | | |
AT&T | | | | 801,642 | | 24,594,377 | |
CenturyLink | | | | 104,432 | | 2,155,476 | |
Verizon Communications | | | | 456,119 | | 26,039,834 | |
| | | | | 52,789,687 | |
Transportation - 2.1% | | | | | |
Alaska Air Group | | | | 14,124 | a | 867,496 | |
American Airlines Group | | | | 46,166 | a | 1,619,503 | |
CH Robinson Worldwide | | | | 14,674 | | 1,306,426 | |
CSX | | | | 90,715 | | 6,246,635 | |
18
| | | | | | | | |
| |
Description | | | | Shares | | Value ($) | |
Common Stocks - 99.4% (continued) | | | | | |
Transportation - 2.1% (continued) | | | | | |
Delta Air Lines | | | | 69,615 | | 3,810,029 | |
Expeditors International of Washington | | | | 19,963 | | 1,341,114 | |
FedEx | | | | 26,871 | | 5,920,756 | |
J.B. Hunt Transport Services | | | | 9,628 | | 1,064,953 | |
Kansas City Southern | | | | 11,465 | | 1,168,971 | |
Norfolk Southern | | | | 31,124 | | 5,223,541 | |
Southwest Airlines | | | | 57,145 | | 2,805,820 | |
Union Pacific | | | | 81,957 | | 11,983,753 | |
United Continental Holdings | | | | 25,393 | b | 2,171,355 | |
United Parcel Service, Cl. B | | | | 76,502 | | 8,150,523 | |
| | | | | 53,680,875 | |
Utilities - 3.1% | | | | | |
AES | | | | 74,373 | | 1,084,358 | |
Alliant Energy | | | | 26,321 | | 1,131,277 | |
Ameren | | | | 25,832 | | 1,668,231 | |
American Electric Power | | | | 53,891 | | 3,953,444 | |
American Water Works | | | | 19,879 | | 1,759,888 | |
CenterPoint Energy | | | | 47,061 | | 1,271,118 | |
CMS Energy | | | | 32,181 | | 1,593,603 | |
Consolidated Edison | | | | 33,623 | | 2,555,348 | |
Dominion Resources | | | | 71,299 | | 5,092,175 | |
DTE Energy | | | | 19,839 | | 2,229,904 | |
Duke Energy | | | | 78,514 | | 6,487,612 | |
Edison International | | | | 36,252 | | 2,515,526 | |
Entergy | | | | 19,215 | a | 1,613,099 | |
Evergy | | | | 29,663 | | 1,660,831 | |
Eversource Energy | | | | 35,050 | | 2,217,263 | |
Exelon | | | | 107,251 | | 4,698,666 | |
FirstEnergy | | | | 53,417 | | 1,991,386 | |
NextEra Energy | | | | 51,789 | | 8,933,602 | |
NiSource | | | | 39,864 | | 1,010,951 | |
NRG Energy | | | | 33,381 | | 1,208,058 | |
PG&E | | | | 56,997 | b | 2,668,030 | |
Pinnacle West Capital | | | | 12,363 | | 1,016,857 | |
PPL | | | | 75,938 | | 2,308,515 | |
Public Service Enterprise Group | | | | 56,284 | | 3,007,254 | |
SCANA | | | | 16,314 | | 653,376 | |
Sempra Energy | | | | 30,127 | a | 3,317,585 | |
Southern | | | | 111,107 | | 5,003,148 | |
WEC Energy Group | | | | 34,933 | | 2,389,417 | |
Xcel Energy | | | | 56,487 | | 2,768,428 | |
| | | | | 77,808,950 | |
Total Common Stocks (cost $1,051,487,143) | | | | 2,529,875,223 | |
19
STATEMENT OF INVESTMENTS (continued)
| | | | | | | | |
| |
Description | | | | Principal Amount ($) | | Value ($) | |
Short-Term Investments - .0% | | | | | |
U.S. Treasury Bills - .0% | | | | | |
2.09%, 12/6/18
(cost $1,057,832) | | | | 1,060,000 | d,e | 1,057,801 | |
| | | 7-Day
Yield (%) | | Shares | | | |
Investment Companies - .7% | | | | | |
Registered Investment Companies - .7% | | | | | |
Dreyfus Institutional Preferred Government Plus Money Market Fund
(cost $17,572,365) | | 2.21 | | 17,572,365 | f | 17,572,365 | |
| | | | | | | | |
Investment of Cash Collateral for Securities Loaned - .1% | | | | | |
Registered Investment Companies - .1% | | | | | |
Dreyfus Institutional Preferred Government Money Market Fund, Institutional Shares
(cost $1,559,075) | | 2.12 | | 1,559,075 | f | 1,559,075 | |
Total Investments (cost $1,071,676,415) | | 100.2% | | 2,550,064,464 | |
Liabilities, Less Cash and Receivables | | (.2%) | | (4,074,424) | |
Net Assets | | 100.0% | | 2,545,990,040 | |
a Security, or portion thereof, on loan. At October 31, 2018, the value of the fund’s securities on loan was $66,256,229 and the value of the collateral held by the fund was $71,868,718, consisting of cash collateral of $1,559,075 and U.S. Government & Agency securities valued at $70,309,643.
b Non-income producing security.
c Investment in real estate investment trust.
d Held by a counterparty for open exchange traded derivative contracts.
e Security is a discount security. Income is recognized through the accretion of discount.
f Investment in affiliated issuer. The investment objective of this investment company is publicly available and can be found within the investment company’s prospectus.
20
| | |
Portfolio Summary (Unaudited) † | Value (%) |
Information Technology | 20.6 |
Health Care | 14.9 |
Financials | 13.5 |
Communication Services | 10.1 |
Consumer Discretionary | 9.7 |
Industrials | 9.2 |
Consumer Staples | 7.3 |
Energy | 5.7 |
Utilities | 3.1 |
Real Estate | 2.8 |
Materials | 2.5 |
Investment Companies | .8 |
Government | .0 |
| | 100.2 |
† Based on net assets.
See notes to financial statements.
21
STATEMENT OF INVESTMENTS IN AFFILIATED ISSUERS
| | | | | | | |
Registered Investment Company | Value
10/31/17 ($) | Purchases ($) | Sales ($) | Value
10/31/18 ($) | Net
Assets (%) | Dividends/
Distributions ($) |
Dreyfus Institutional Preferred Government
Plus Money Market Fund | 17,561,479 | 214,705,159 | 214,694,273 | 17,572,365 | .7 | 304,434 |
Dreyfus Institutional Preferred Government Money Market Fund, Institutional Shares | - | 57,150,250 | 55,591,175 | 1,559,075 | .1 | - |
Total | 17,561,479 | 271,855,409 | 270,285,448 | 19,131,440 | .8 | 304,434 |
See notes to financial statements.
22
STATEMENT OF FUTURES
October 31, 2018
| | | | | | | |
Description | Number of
Contracts | Expiration | Notional
Value ($) | Value ($) | Unrealized (Depreciation) ($) | |
Futures Long | | |
Standard & Poor's 500 E-mini | 128 | 12/18 | 18,170,311 | 17,351,040 | (819,271) | |
Gross Unrealized Depreciation | | (819,271) | |
See notes to financial statements.
23
STATEMENT OF ASSETS AND LIABILITIES
October 31, 2018
| | | | | | | | | |
| | | | | | |
| | | Cost | | Value | |
Assets ($): | | | | |
Investments in securities—See Statement of Investments
(including securities on loan, valued at $66,256,229)—Note 1(b): | | | |
Unaffiliated issuers | 1,052,544,975 | | 2,530,933,024 | |
Affiliated issuers | | 19,131,440 | | 19,131,440 | |
Cash | | | | | 207,331 | |
Dividends, interest and securities lending income receivable | | 2,314,797 | |
Receivable for shares of Common Stock subscribed | | 1,504,498 | |
Receivable for investment securities sold | | 353,032 | |
Receivable for futures variation margin—Note 4 | | 189,699 | |
| | | | | 2,554,633,821 | |
Liabilities ($): | | | | |
Due to The Dreyfus Corporation—Note 3(b) | | | | 379,527 | |
Payable for investment securities purchased | | 4,636,236 | |
Payable for shares of Common Stock redeemed | | 2,061,101 | |
Liability for securities on loan—Note 1(b) | | 1,559,075 | |
Directors fees and expenses payable | | 7,280 | |
Interest payable—Note 2 | | 562 | |
| | | | | 8,643,781 | |
Net Assets ($) | | | 2,545,990,040 | |
Composition of Net Assets ($): | | | | |
Paid-in capital | | | | | 977,260,126 | |
Total distributable earnings (loss) | | | | | 1,568,729,914 | |
Net Assets ($) | | | 2,545,990,040 | |
Shares Outstanding | | |
(150 million shares of $.001 par value Common Stock authorized) | 46,688,523 | |
Net Asset Value Per Share ($) | | 54.53 | |
| | | | | |
See notes to financial statements. | | | | |
24
STATEMENT OF OPERATIONS
Year Ended October 31, 2018
| | | | | | | |
| | | | | | |
| | | | | | |
Investment Income ($): | | | | |
Income: | | | | |
Cash dividends: | |
Unaffiliated issuers | | | 49,791,122 | |
Affiliated issuers | | | 304,434 | |
Income from securities lending—Note 1(b) | | | 83,983 | |
Interest | | | 18,564 | |
Total Income | | | 50,198,103 | |
Expenses: | | | | |
Management fee—Note 3(a) | | | 5,275,802 | |
Directors’ fees—Note 3(a,c) | | | 198,974 | |
Loan commitment fees—Note 2 | | | 60,362 | |
Interest expense—Note 2 | | | 8,052 | |
Total Expenses | | | 5,543,190 | |
Less—Directors’ fees reimbursed by Dreyfus—Note 3(a) | | | (198,974) | |
Net Expenses | | | 5,344,216 | |
Investment Income—Net | | | 44,853,887 | |
Realized and Unrealized Gain (Loss) on Investments—Note 4 ($): | | |
Net realized gain (loss) on investments | 98,203,950 | |
Net realized gain (loss) on futures | 2,029,368 | |
Net Realized Gain (Loss) | | | 100,233,318 | |
Net unrealized appreciation (depreciation) on investments | | | 37,450,847 | |
Net unrealized appreciation (depreciation) on futures | | | (1,332,604) | |
Net Unrealized Appreciation (Depreciation) | | | 36,118,243 | |
Net Realized and Unrealized Gain (Loss) on Investments | | | 136,351,561 | |
Net Increase in Net Assets Resulting from Operations | | 181,205,448 | |
| | | | | | | |
See notes to financial statements. | | | | | |
25
STATEMENT OF CHANGES IN NET ASSETS
| | | | | | | | | | |
| | | | Year Ended October 31, |
| | | | 2018 | | 2017a | |
Operations ($): | | | | | | | | |
Investment income—net | | | 44,853,887 | | | | 45,506,163 | |
Net realized gain (loss) on investments | | 100,233,318 | | | | 23,204,934 | |
Net unrealized appreciation (depreciation)
on investments | | 36,118,243 | | | | 442,486,427 | |
Net Increase (Decrease) in Net Assets
Resulting from Operations | 181,205,448 | | | | 511,197,524 | |
Distributions ($): | |
Distributions to shareholders | | | (67,280,127) | | | | (67,111,951) | |
Capital Stock Transactions ($): | |
Net proceeds from shares sold | | | 332,043,513 | | | | 441,670,667 | |
Distributions reinvested | | | 45,870,390 | | | | 47,592,208 | |
Cost of shares redeemed | | | (560,945,350) | | | | (544,641,017) | |
Increase (Decrease) in Net Assets
from Capital Stock Transactions | (183,031,447) | | | | (55,378,142) | |
Total Increase (Decrease) in Net Assets | (69,106,126) | | | | 388,707,431 | |
Net Assets ($): | |
Beginning of Period | | | 2,615,096,166 | | | | 2,226,388,735 | |
End of Period | | | 2,545,990,040 | | | | 2,615,096,166 | |
Capital Share Transactions (Shares): | |
Shares sold | | | 6,039,805 | | | | 9,282,187 | |
Shares issued for distributions reinvested | | | 854,501 | | | | 1,034,299 | |
Shares redeemed | | | (10,267,178) | | | | (11,363,268) | |
Net Increase (Decrease) in Shares Outstanding | (3,372,872) | | | | (1,046,782) | |
| | | | | | | | | | |
aDistributions to shareholders include $43,692,370 of distributions from net investment income and $23,419,581 distributions from net realized gains. Undistributed investment income—net was $14,342,889 in 2017 and is no longer presented as a result of the adoption of SEC’s Disclosure Update and Simplification Rule. | |
See notes to financial statements. | | | | | | | | |
26
FINANCIAL HIGHLIGHTS
The following table describes the performance for the fiscal periods indicated. Total return shows how much your investment in the fund would have increased (or decreased) during each period, assuming you had reinvested all dividends and distributions. These figures have been derived from the fund’s financial statements.
| | | | | | | | | |
| | | | | | | |
| | | Year Ended October 31, |
| | | 2018 | 2017 | 2016 | 2015 | 2014 |
Per Share Data ($): | | | | | | |
Net asset value,
beginning of period | | 52.24 | 43.56 | 42.87 | 41.56 | 36.17 |
Investment Operations: | | | | | | |
Investment income—neta | | .94 | .89 | .86 | .80 | .70 |
Net realized and unrealized
gain (loss) on investments | | 2.74 | 9.12 | .94 | 1.28 | 5.39 |
Total from
Investment Operations | | 3.68 | 10.01 | 1.80 | 2.08 | 6.09 |
Distributions: | | | | | | |
Dividends from
investment income—net | | (.92) | (.86) | (.83) | (.77) | (.67) |
Dividends from net realized
gain on investments | | (.47) | (.47) | (.28) | - | (.03) |
Total Distributions | | (1.39) | (1.33) | (1.11) | (.77) | (.70) |
Net asset value, end of period | | 54.53 | 52.24 | 43.56 | 42.87 | 41.56 |
Total Return (%) | | 7.11 | 23.42 | 4.28 | 5.02 | 17.03 |
Ratios/Supplemental Data (%): | | | | | |
Ratio of total expenses to
average net assets | | .21 | .21 | .21 | .21 | .21 |
Ratio of net expenses to
average net assets | | .20 | .20 | .20 | .20 | .20 |
Ratio of net investment income | | | | | |
to average net assets | | 1.70 | 1.85 | 2.02 | 1.88 | 1.81 |
Portfolio Turnover Rate | | 3.20 | 6.00 | 5.11 | 8.71 | 5.41 |
Net Assets,
end of period ($ x 1,000) | | 2,545,990 | 2,615,096 | 2,226,389 | 2,155,764 | 2,173,843 |
a Based on average shares outstanding.
See notes to financial statements.
27
NOTES TO FINANCIAL STATEMENTS
NOTE 1—Significant Accounting Policies:
Dreyfus Institutional S&P 500 Stock Index Fund (the “fund”) is a separate diversified series of The Dreyfus/Laurel Funds, Inc. (the “Company”), which is registered under the Investment Company Act of 1940, as amended (the “Act”), as an open-end management investment company and operates as a series company currently offering eight series, including the fund. The fund’s investment objective is to seek to match the total return of the S&P 500® Index. The Dreyfus Corporation (the “Manager” or “Dreyfus”), a wholly-owned subsidiary of The Bank of New York Mellon Corporation (“BNY Mellon”), serves as the fund’s investment adviser. MBSC Securities Corporation (the “Distributor”), a wholly-owned subsidiary of Dreyfus, is the distributor of the fund’s shares.
Class I shares are sold primarily to bank trust departments and other financial service providers (including The Bank of New York Mellon, a subsidiary of BNY Mellon and an affiliate of Dreyfus, and its affiliates), acting on behalf of customers having a qualified trust or an investment account or relationship at such institution, and bear no Distribution or Shareholder Service Plan fees. Class I shares are offered without a front-end sales charge or a contingent deferred sales charge.
The Company accounts separately for the assets, liabilities and operations of each series. Expenses directly attributable to each series are charged to that series’ operations; expenses which are applicable to all series are allocated among them on a pro rata basis.
The Financial Accounting Standards Board (“FASB”) Accounting Standards Codification is the exclusive reference of authoritative U.S. generally accepted accounting principles (“GAAP”) recognized by the FASB to be applied by nongovernmental entities. Rules and interpretive releases of the Securities and Exchange Commission (“SEC”) under authority of federal laws are also sources of authoritative GAAP for SEC registrants. The fund’s financial statements are prepared in accordance with GAAP, which may require the use of management estimates and assumptions. Actual results could differ from those estimates.
(a) Portfolio valuation: The fair value of a financial instrument is the amount that would be received to sell an asset or paid to transfer a liability in an orderly transaction between market participants at the measurement date (i.e., the exit price). GAAP establishes a fair value hierarchy that prioritizes the inputs of valuation techniques used to measure fair value. This hierarchy gives the highest priority to unadjusted quoted prices in active markets for identical assets or liabilities (Level 1 measurements) and the lowest priority to unobservable inputs (Level 3 measurements).
28
Additionally, GAAP provides guidance on determining whether the volume and activity in a market has decreased significantly and whether such a decrease in activity results in transactions that are not orderly. GAAP requires enhanced disclosures around valuation inputs and techniques used during annual and interim periods.
Various inputs are used in determining the value of the fund’s investments relating to fair value measurements. These inputs are summarized in the three broad levels listed below:
Level 1—unadjusted quoted prices in active markets for identical investments.
Level 2—other significant observable inputs (including quoted prices for similar investments, interest rates, prepayment speeds, credit risk, etc.).
Level 3—significant unobservable inputs (including the fund’s own assumptions in determining the fair value of investments).
The inputs or methodology used for valuing securities are not necessarily an indication of the risk associated with investing in those securities.
Changes in valuation techniques may result in transfers in or out of an assigned level within the disclosure hierarchy. Valuation techniques used to value the fund’s investments are as follows:
Investments in securities are valued at the last sales price on the securities exchange or national securities market on which such securities are primarily traded. Securities listed on the National Market System for which market quotations are available are valued at the official closing price or, if there is no official closing price that day, at the last sales price. For open short positions, asked prices are used for valuation purposes. Bid price is used when no asked price is available. Registered investment companies that are not traded on an exchange are valued at their net asset value. All of the preceding securities are generally categorized within Level 1 of the fair value hierarchy.
Securities not listed on an exchange or the national securities market, or securities for which there were no transactions, are valued at the average of the most recent bid and asked prices. U.S. Treasury Bills are valued at the mean price between quoted bid prices and asked prices by an independent pricing service (the “Service”) approved by Company’s Board of Directors (the “Board”). These securities are generally categorized within Level 2 of the fair value hierarchy.
The Service is engaged under the general supervision of the Board.
29
NOTES TO FINANCIAL STATEMENTS (continued)
Fair valuing of securities may be determined with the assistance of a pricing service using calculations based on indices of domestic securities and other appropriate indicators, such as prices of relevant American Depository Receipts and futures. Utilizing these techniques may result in transfers between Level 1 and Level 2 of the fair value hierarchy.
When market quotations or official closing prices are not readily available, or are determined not to accurately reflect fair value, such as when the value of a security has been significantly affected by events after the close of the exchange or market on which the security is principally traded (for example, a foreign exchange or market), but before the fund calculates its net asset value, the fund may value these investments at fair value as determined in accordance with the procedures approved by the the Board. Certain factors may be considered when fair valuing investments such as: fundamental analytical data, the nature and duration of restrictions on disposition, an evaluation of the forces that influence the market in which the securities are purchased and sold, and public trading in similar securities of the issuer or comparable issuers. These securities are either categorized within Level 2 or 3 of the fair value hierarchy depending on the relevant inputs used.
For restricted securities where observable inputs are limited, assumptions about market activity and risk are used and such securities are generally categorized within Level 3 of the fair value hierarchy.
Futures, which are traded on an exchange, are valued at the last sales price on the securities exchange on which such securities are primarily traded or at the last sales price on the national securities market on each business day and are generally categorized within Level 1 of the fair value hierarchy.
The following is a summary of the inputs used as of October 31, 2018 in valuing the fund’s investments:
30
| | | | | |
| | Level 1 - Unadjusted Quoted Prices | Level 2 - Other Significant Observable Inputs | Level 3 -Significant Unobservable Inputs | Total |
Assets ($) | | | | |
Investments in Securities: | | |
Equity Securities—Common Stocks† | 2,529,875,223 | - | - | 2,529,875,223 |
Investment Companies | 19,131,440 | - | - | 19,131,440 |
U.S. Treasury | - | 1,057,801 | - | 1,057,801 |
Liabilities ($) | | | |
Other Financial Instruments: | | | |
Futures†† | (819,271) | - | - | (819,271) |
† See Statement of Investments for additional detailed categorizations.
†† Amount shown represents unrealized appreciation (depreciation) at period end, but only variation margin on exchanged traded and centrally cleared derivatives are reported in the Statement of Assets and Liabilities.
At October 31, 2018, there were no transfers between levels of the fair value hierarchy. It is the fund’s policy to recognize transfers between levels at the end of the reporting period.
(b) Securities transactions and investment income: Securities transactions are recorded on a trade date basis. Realized gains and losses from securities transactions are recorded on the identified cost basis. Dividend income is recognized on the ex-dividend date and interest income, including, where applicable, accretion of discount and amortization of premium on investments, is recognized on the accrual basis.
Pursuant to a securities lending agreement with The Bank of New York Mellon, the fund may lend securities to qualified institutions. It is the fund’s policy that, at origination, all loans are secured by collateral of at least 102% of the value of U.S. securities loaned and 105% of the value of foreign securities loaned. Collateral equivalent to at least 100% of the market value of securities on loan is maintained at all times. Collateral is either in the form of cash, which can be invested in certain money market mutual funds managed by Dreyfus, or U.S. Government and Agency securities. The fund is entitled to receive all dividends, interest and distributions on securities loaned, in addition to income earned as a result of the lending transaction. Should a borrower fail to return the securities in a timely manner, The Bank of New York Mellon is required to replace the securities for the benefit of the fund or credit the fund with the market value of the unreturned securities and is subrogated to the fund’s rights against the borrower and the collateral. Additionally, the contractual maturity of security lending transactions are on an overnight and continuous basis. During the period ended October 31, 2018, The Bank of
31
NOTES TO FINANCIAL STATEMENTS (continued)
New York Mellon earned $16,325 from lending portfolio securities, pursuant to the securities lending agreement.
(c) Affiliated issuers: Investments in other investment companies advised by Dreyfus are considered “affiliated” under the Act.
(d) Dividends and distributions to shareholders: Dividends and distributions are recorded on the ex-dividend date. Dividends from investment income-net are normally declared and paid quarterly. Dividends from net realized capital gains, if any, are normally declared and paid annually, but the fund may make distributions on a more frequent basis to comply with the distribution requirements of the Internal Revenue Code of 1986, as amended (the “Code”). To the extent that net realized capital gains can be offset by capital loss carryovers, it is the policy of the fund not to distribute such gains. Income and capital gain distributions are determined in accordance with income tax regulations, which may differ from GAAP.
(e) Federal income taxes: It is the policy of the fund to continue to qualify as a regulated investment company, if such qualification is in the best interests of its shareholders, by complying with the applicable provisions of the Code, and to make distributions of taxable income and net realized capital gain sufficient to relieve it from substantially all federal income and excise taxes.
As of and during the period ended October 31, 2018, the fund did not have any liabilities for any uncertain tax positions. The fund recognizes interest and penalties, if any, related to uncertain tax positions as income tax expense in the Statement of Operations. During the period ended October 31, 2018, the fund did not incur any interest or penalties.
Each tax year in the four-year period ended October 31, 2018 remains subject to examination by the Internal Revenue Service and state taxing authorities.
At October 31, 2018, the components of accumulated earnings on a tax basis were as follows: undistributed ordinary income $16,718,826, undistributed capital gains $92,824,671 and unrealized appreciation $1,459,186,417.
The tax character of distributions paid to shareholders during the fiscal periods ended October 31, 2018 and October 31, 2017 were as follows: ordinary income $49,777,408 and $45,171,712, and long-term capital gains $17,502,719 and $21,940,239, respectively.
(f) New Accounting Pronouncements: In August 2018, the FASB issued Accounting Standards Update 2018-13, Fair Value Measurement
32
(Topic 820): Disclosure Framework—Changes to the Disclosure Requirements for Fair Value Measurement (“ASU 2018-13”). The update provides guidance that eliminates, adds and modifies certain disclosure requirements for fair value measurements. ASU 2018-13 will be effective for annual periods beginning after December 15, 2019. Management is currently assessing the potential impact of these changes to future financial statements.
NOTE 2—Bank Lines of Credit:
The fund participates with other Dreyfus-managed funds in an $830 million unsecured credit facility led by Citibank, N.A. and a $300 million unsecured credit facility provided by The Bank of New York Mellon (each, a “Facility”), each to be utilized primarily for temporary or emergency purposes, including the financing of redemptions. In connection therewith, the fund has agreed to pay its pro rata portion of commitment fees for each Facility. Interest is charged to the fund based on rates determined pursuant to the terms of the respective Facility at the time of borrowing.
The average amount of borrowings outstanding under the facilities during the period ended October 31, 2018, was approximately $300,500 with a related weighted average annualized interest rate of 2.68%.
NOTE 3—Investment Management Fee and Other Transactions with Affiliates:
(a) Pursuant to an investment management agreement with Dreyfus, Dreyfus provides or arranges for one or more third parties and/or affiliates to provide investment advisory, administrative, custody, fund accounting and transfer agency services to the fund. Dreyfus also directs the investments of the fund in accordance with its investment objective, policies and limitations. For these services, the fund is contractually obligated to pay Dreyfus a fee, calculated daily and paid monthly, at an annual rate of .20% of the value of the fund’s average daily net assets. Out of its fee, Dreyfus pays all of the expenses of the fund except brokerage fees, taxes, interest expense, commitment fees on borrowings, fees and expenses of non-interested Directors (including counsel fees) and extraordinary expenses. In addition, Dreyfus is required to reduce its fee in an amount equal to the fund’s allocable portion of fees and expenses of the non-interested Directors (including counsel fees). During the period ended October 31, 2018, fees reimbursed by Dreyfus amounted to $198,974.
(b) The components of “Due to The Dreyfus Corporation” in the Statement of Assets and Liabilities consist of: management fees $443,888, which are offset against an expense reimbursement currently in effect in the amount of $64,361.
33
NOTES TO FINANCIAL STATEMENTS (continued)
(c) Each Board member also serves as a Board member of other funds within the Dreyfus complex. Annual retainer fees and attendance fees are allocated to each fund based on net assets.
NOTE 4—Securities Transactions:
The aggregate amount of purchases and sales of investment securities, excluding short-term securities and futures, during the period ended October 31, 2018, amounted to $83,318,151 and $281,741,430, respectively.
Derivatives: A derivative is a financial instrument whose performance is derived from the performance of another asset. Each type of derivative instrument that was held by the fund during the period ended October 31, 2018 is discussed below.
Futures: In the normal course of pursuing its investment objective, the fund is exposed to market risk, including equity price risk, as a result of changes in value of underlying financial instruments. The fund invests in futures in order to manage its exposure to or protect against changes in the market. A futures contract represents a commitment for the future purchase or a sale of an asset at a specified date. Upon entering into such contracts, these investments require initial margin deposits with a counterparty, which consist of cash or cash equivalents. The amount of these deposits is determined by the exchange or Board of Trade on which the contract is traded and is subject to change. Accordingly, variation margin payments are received or made to reflect daily unrealized gains or losses which are recorded in the Statement of Operations. When the contracts are closed, the fund recognizes a realized gain or loss which is reflected in the Statement of Operations. There is minimal counterparty credit risk to the fund with futures since they are exchange traded, and the exchange guarantees the futures against default. Futures open at October 31, 2018 are set forth in the Statement of Futures.
The following summarizes the average market value of derivatives outstanding during the period ended October 31, 2018:
| | | |
| | Average Market Value ($) |
Equity futures | | 22,701,489 |
| | | |
At October 31, 2018, the cost of investments for federal income tax purposes was $1,090,878,047; accordingly, accumulated net unrealized appreciation on investments was $1,459,186,417, consisting of $1,521,756,279 gross unrealized appreciation and $62,569,862 gross unrealized depreciation.
34
NOTE 5—Pending Legal Matters:
The fund and many other entities have been named as defendants in numerous pending litigations as a result of their participation in the leveraged buyout transaction (“LBO”) of the Tribune Company (“Tribune”).
The State Law Cases: The Tribune LBO was executed in two-steps - a voluntary tender offer in June 2007, and a mandatory go-private merger in December 2007. In 2008, approximately one year after the LBO was concluded, Tribune filed for bankruptcy protection under Chapter 11 of the Bankruptcy Code (the “Code”). Beginning in June 2011, Tribune creditors filed complaints in various courts throughout the country, which alleged that the payments made to shareholders in the LBO were “fraudulent conveyances” under state and/or federal law, and that the shareholders must return the payments they received for their shares to satisfy the plaintiffs’ unpaid claims (collectively, “the state law cases”). The state law cases were consolidated for pre-trial proceedings in the United States District Court for the Southern District of New York, in a case styled In re Tribune Company Fraudulent Conveyance Litigation (S.D.N.Y. Nos. 11-md-2296 and 12-mc-2296 (RJS) (“Tribune MDL”)). On November 6, 2012, the defendants filed a motion to dismiss most of the cases in the Tribune MDL. On September 23, 2013, the Court dismissed 50 cases, including at least one case in which the fund was a defendant. On September 30, 2013, plaintiffs appealed the District Court’s decision to the U.S. Court of Appeals for the Second Circuit. On March 29, 2016, the Second Circuit affirmed the dismissal on the ground that the plaintiffs’ claims were preempted by section 546(e) of the Code, which exempts qualified transfers that were made “… by or to (or for the benefit of),” among other specified entities, “a financial institution …” On September 9, 2016, Plaintiffs filed a petition for certiorari to the U.S. Supreme Court.
During the pendency of the plaintiffs’ cert. petition, the Supreme Court agreed to hear the appeal of Merit Management Group, LP v. FTI Consulting, Inc. (“Merit Mgmt.”), a Seventh Circuit case that concerned the scope of Section 546(e) of the Code. In contrast to the Second Circuit, the Seventh Circuit had held that Section 546(e) does not exempt qualified transfers from avoidance that passed through “financial institutions.”
On February 27, 2018, the Supreme Court affirmed the Seventh Circuit’s decision. Noting that “the parties … d[id] not contend that either the debtor or petitioner … qualified as a ‘financial institution,’” the Court declined to address the effect that such an assertion would have had on the application Section 546(e). While the Merit Mgmt. decision likely will make it more difficult for some defendants to assert a defense under Section
35
NOTES TO FINANCIAL STATEMENTS (continued)
546(e), the decision appears to be less consequential for registered investment company defendants, such as the Dreyfus Fund defendants, which are specifically defined as “financial institutions” under Section 101(22)(B) of the Code.
On April 3, 2018, Justices Kennedy and Thomas issued a Statement stating that “consideration of [the petition for certiorari filed by the Tribune plaintiffs] will be deferred for an additional period of time” to allow the Second Circuit or the District Court to consider whether to vacate the earlier judgment or provide other relief in light of Merit Mgmt. On April 10, 2018, the plaintiffs/appellants moved the Second Circuit to recall its mandate, vacate its decision, and remand the case to the district court for further proceedings. The defendants’ filed an opposition brief on April 20, 2018; plaintiffs/appellants filed their reply on April 27, 2018. On May 15, 2018, the Second Circuit issued an Order stating that “the mandate in this case is recalled in anticipation of further panel review.” As of December 13, 2018, there has been no subsequent activity in the state law cases.
The FitzSimons Litigation: On November 1, 2010, a case styled The Official Committee of Unsecured Creditors of Tribune Co. v. FitzSimons, et al., Adv. Pro. No-10-54010(KJC) was filed in the United States Bankruptcy Court for the District of Delaware. (“the FitzSimons Litigation”). The case was subsequently transferred to the Tribune MDL. Count One of the multi-count Complaint sought recovery of alleged “fraudulent conveyances” from more than 5,000 Tribune shareholders (“Shareholder Defendants”), including the fund, that participated in the Tribune LBO. On January 10, 2013, Mark S. Kirchner, as Litigation Trustee for the Tribune Litigation Trust, became the successor plaintiff to the Creditors Committee. The case is now proceeding as: Mark S. Kirchner, as Litigation Trustee for the Tribune Litigation Trust v. FitzSimons, et al., S.D.N.Y. No. 12-cv-2652 (RJS). On August 1, 2013, the plaintiff filed a Fifth Amended Complaint, which did not change the legal basis of the claims against the Shareholder Defendants. On May 23, 2014, the defendants filed a motion to dismiss Count One against the Shareholder Defendants, which the Court granted on January 9, 2017. The plaintiff then sought leave to file an interlocutory appeal. On February 23, 2017, the Court entered an order stating that it would permit the plaintiff to file an interlocutory appeal after the Court decided other pending motions.
On March 8, 2018, following the U.S. Supreme Court’s decision in Merit Management, the Plaintiff in the FitzSimons Case submitted a letter to the Court seeking permission to file another amended complaint or a motion for leave to amend in order to add a claim of constructive fraudulent transfer. On June 18, 2018, the Court issued an order staying the Trustee’s
36
request pending further action by the Second Circuit in the state law cases. The Court also ordered counsel for all of the parties to file a joint letter “indicating how they wish to proceed with respect to a potential global resolution of this multi-district litigation.” On July 9, 2018, the parties submitted the joint letter requested by the Court expressing their views regarding a potential mediation. On November 30, 2018, the Court issued an Opinion and Order resolving the remaining motions by dismissing most, but not all, of the claims asserted against the individual defendants. After Judge Richard J. Sullivan issued the Opinion and Order, the U.S. Judicial Panel on Multidistrict Litigation reassigned the entire litigation to Judge Denise Cote.
37
REPORT OF INDEPENDENT REGISTERED PUBLIC ACCOUNTING FIRM
To the Shareholders and Board of Directors
The Dreyfus/Laurel Funds, Inc.
Opinion on the Financial Statements
We have audited the accompanying statement of assets and liabilities of Dreyfus Institutional S&P 500 Stock Index Fund (the “Fund”), a series of The Dreyfus/Laurel funds, Inc., including the statements of investments, investments in affiliated issuers and futures, as of October 31, 2018, the related statement of operations for the year then ended, the statements of changes in net assets for each of the years in the two-year period then ended, and the related notes (collectively, the financial statements) and the financial highlights for each of the years in the five-year period then ended. In our opinion, the financial statements and financial highlights present fairly, in all material respects, the financial position of the Fund as of October 31, 2018, the results of its operations for the year then ended, the changes in its net assets for each of the years in the two-year period then ended, and the financial highlights for each of the years in the five-year period then ended, in conformity with U.S. generally accepted accounting principles.
Basis for Opinion
These financial statements and financial highlights are the responsibility of the Fund’s management. Our responsibility is to express an opinion on these financial statements and financial highlights based on our audits. We are a public accounting firm registered with the Public Company Accounting Oversight Board (United States) (PCAOB) and are required to be independent with respect to the Fund in accordance with the U.S. federal securities laws and the applicable rules and regulations of the Securities and Exchange Commission and the PCAOB.
We conducted our audits in accordance with the standards of the PCAOB. Those standards require that we plan and perform the audit to obtain reasonable assurance about whether the financial statements and financial highlights are free of material misstatement, whether due to error or fraud. Our audits included performing procedures to assess the risks of material misstatement of the financial statements and financial highlights, whether due to error or fraud, and performing procedures that respond to those risks. Such procedures included examining, on a test basis, evidence regarding the amounts and disclosures in the financial statements and financial highlights. Such procedures also included confirmation of securities owned as of October 31, 2018, by correspondence with the custodian and brokers or by other appropriate auditing procedures when replies from brokers were not received. Our audits also included evaluating the accounting principles used and significant estimates made by management, as well as evaluating the overall presentation of the financial statements and financial highlights. We believe that our audits provide a reasonable basis for our opinion.

We have served as the auditor of one or more Dreyfus Corporation investment companies since 1994.
New York, New York
December 28, 2018
38
IMPORTANT TAX INFORMATION (Unaudited)
For federal tax purposes, the fund reports the maximum amount allowable, but not less than $47,319,040 as ordinary income dividends paid during the year ended October 31, 2018 as qualified dividend income in accordance with Section 854(b)(1)(B) of the Internal Revenue Code. Also, the fund reports the maximum amount allowable but not less than 98.88% of ordinary income dividends paid during the year ended October 31, 2018 as eligible for the corporate dividends received deduction provided under Section 243 of the Internal Revenue Code in accordance with Section 854(b)(1)(A) of the Internal Revenue Code. Shareholders will receive notification in early 2019 of the percentage applicable to the preparation of their 2018 income tax returns. Also the fund reports the maximum amount allowable but not less than $.3596 per share as a capital gain dividend in accordance with Section 852(b)(3)(C) of the Internal Revenue Code. Also, the fund reports the maximum amount allowable but not less than $.1089 as a short-term capital gain dividend paid on December 27, 2017 in accordance with Sections 871(k)(2) and 881(e) of the Internal Revenue Code.
39
BOARD MEMBERS INFORMATION (Unaudited)
INDEPENDENT BOARD MEMBERS
Joseph S. DiMartino (75)
Chairman of the Board (1999)
Principal Occupation During Past 5 Years:
· Corporate Director and Trustee (1995-present)
Other Public Company Board Memberships During Past 5 Years:
· CBIZ (formerly, Century Business Services, Inc.), a provider of outsourcing functions for small and medium size companies, Director (1997-present)
No. of Portfolios for which Board Member Serves: 124
———————
Francine J. Bovich (67)
Board Member (2012)
Principal Occupation During Past 5 Years:
· Trustee, The Bradley Trusts, private trust funds (2011-present)
Other Public Company Board Memberships During Past 5 Years:
· Annaly Capital Management, Inc., a real estate trust, Director (2014-present)
No. of Portfolios for which Board Member Serves: 72
———————
Kenneth A. Himmel (72)
Board Member (1994)
Principal Occupation During Past 5 Years:
· Managing Partner, Gulf Related, an international real estate development company (2010-present)
· President and CEO, Related Urban Development, a real estate development company (1996-present)
· President and CEO, Himmel & Company, a real estate development company (1980-present)
· CEO, American Food Management, a restaurant company (1983-present)
No. of Portfolios for which Board Member Serves: 25
———————
40
Stephen J. Lockwood (71)
Board Member (1994)
Principal Occupation During Past 5 Years:
· Chairman of the Board, Stephen J. Lockwood and Company LLC, a real estate investment company (2000-present)
No. of Portfolios for which Board Member Serves: 25
———————
Roslyn M. Watson (69)
Board Member (1994)
Principal Occupation During Past 5 Years:
· Principal, Watson Ventures, Inc., a real estate investment company (1993-present)
No. of Portfolios for which Board Member Serves: 58
———————
Benaree Pratt Wiley (72)
Board Member (1998)
Principal Occupation During Past 5 Years:
· Principal, The Wiley Group, a firm specializing in strategy and business development (2005-present)
Other Public Company Board Memberships During Past 5 Years:
· CBIZ (formerly, Century Business Services, Inc.), a provider of outsourcing functions for small and medium size companies, Director (2008-present)
No. of Portfolios for which Board Member Serves: 79
———————
Once elected all Board Members serve for an indefinite term, but achieve Emeritus status upon reaching age 80. The address of the Board Members and Officers is c/o The Dreyfus Corporation, 200 Park Avenue, New York, New York 10166. Additional information about the Board Members is available in the fund’s Statement of Additional Information which can be obtained from Dreyfus free of charge by calling this toll free number: 1-800-DREYFUS.
James M. Fitzgibbons, Emeritus Board Member
41
OFFICERS OF THE FUND (Unaudited)
BRADLEY J. SKAPYAK, President since January 2010.
Chief Operating Officer and a director of the Manager since June 2009, Chairman of Dreyfus Transfer, Inc., an affiliate of the Manager and the transfer agent of the funds, since May 2011 and Chief Executive Officer of MBSC Securities Corporation since August 2016. He is an officer of 62 investment companies (comprised of 124 portfolios) managed by the Manager. He is 59 years old and has been an employee of the Manager since February 1988.
BENNETT A. MACDOUGALL, Chief Legal Officer since October 2015.
Chief Legal Officer of the Manager and Associate General Counsel and Managing Director of BNY Mellon since June 2015; from June 2005 to June 2015, he served in various capacities with Deutsche Bank – Asset & Wealth Management Division, including as Director and Associate General Counsel, and Chief Legal Officer of Deutsche Investment Management Americas Inc. from June 2012 to May 2015. He is an officer of 63 investment companies (comprised of 149 portfolios) managed by the Manager. He is 47 years old and has been an employee of the Manager since June 2015.
JAMES BITETTO, Vice President since August 2005 and Secretary since February 2018.
Managing Counsel of BNY Mellon and Secretary of the Manager, and an officer of 63 investment companies (comprised of 149 portfolios) managed by the Manager. He is 52 years old and has been an employee of the Manager since December 1996.
JOSEPH M. CHIOFFI, Vice President and Assistant Secretary since August 2005.
Managing Counsel of BNY Mellon, and an officer of 63 investment companies (comprised of 149 portfolios) managed by the Manager. He is 56 years old and has been an employee of the Manager since June 2000.
SONALEE CROSS, Vice President and Assistant Secretary since March 2018.
Counsel of BNY Mellon since October 2016; Associate at Proskauer Rose LLP from April 2016 to September 2016; Attorney at EnTrust Capital from August 2015 to February 2016; Associate at Sidley Austin LLP from September 2013 until August 2015. She is an officer of 63 investment companies (comprised of 149 portfolios) managed by Dreyfus. She is 31 years old and has been an employee of the Manager since October 2016.
MAUREEN E. KANE, Vice President and Assistant Secretary since April 2015.
Managing Counsel of BNY Mellon since July 2014; from October 2004 until July 2014, General Counsel, and from May 2009 until July 2014, Chief Compliance Officer of Century Capital Management. She is an officer of 63 investment companies (comprised of 149 portfolios) managed by the Manager. She is 56 years old and has been an employee of the Manager since July 2014.
SARAH S. KELLEHER, Vice President and Assistant Secretary since April 2014.
Managing Counsel of BNY Mellon since December 2017, from March 2013 to December 2017, Senior Counsel of BNY Mellon. She is an officer of 63 investment companies (comprised of 149 portfolios) managed by the Manager. She is 43 years old and has been an employee of the Manager since March 2013.
JEFF PRUSNOFSKY, Vice President and Assistant Secretary since August 2005.
Senior Managing Counsel of BNY Mellon, and an officer of 63 investment companies (comprised of 149 portfolios) managed by the Manager. He is 53 years old and has been an employee of the Manager since October 1990.
NATALYA ZELENSKY, Vice President and Assistant Secretary since March 2017.
Counsel of BNY Mellon since May 2016; Attorney at Wildermuth Endowment Strategy Fund/Wildermuth Advisory, LLC from November 2015 until May 2016; Assistant General Counsel at RCS Advisory Services from July 2014 until November 2015; Associate at Sutherland, Asbill & Brennan from January 2013 until January 2014. She is an officer of 63 investment companies (comprised of 149 portfolios) managed by Dreyfus. She is 33 years old and has been an employee of the Manager since May 2016.
JAMES WINDELS, Treasurer since November 2001.
Director – Mutual Fund Accounting of the Manager, and an officer of 63 investment companies (comprised of 149 portfolios) managed by the Manager. He is 60 years old and has been an employee of the Manager since April 1985.
42
GAVIN C. REILLY, Assistant Treasurer since December 2005.
Tax Manager of the Investment Accounting and Support Department of the Manager, and an officer of 63 investment companies (comprised of 149 portfolios) managed by the Manager. He is 50 years old and has been an employee of the Manager since April 1991.
ROBERT S. ROBOL, Assistant Treasurer since December 2002.
Senior Accounting Manager – Dreyfus Financial Reporting of the Manager, and an officer of 63 investment companies (comprised of 149 portfolios) managed by the Manager. He is 54 years old and has been an employee of the Manager since October 1988.
ROBERT SALVIOLO, Assistant Treasurer since July 2007.
Senior Accounting Manager – Equity Funds of the Manager, and an officer of 63 investment companies (comprised of 149 portfolios) managed by the Manager. He is 51 years old and has been an employee of the Manager since June 1989.
ROBERT SVAGNA, Assistant Treasurer since December 2002.
Senior Accounting Manager – Fixed Income and Equity Funds of the Manager, and an officer of 63 investment companies (comprised of 149 portfolios) managed by the Manager. He is 51 years old and has been an employee of the Manager since November 1990.
JOSEPH W. CONNOLLY, Chief Compliance Officer since October 2004.
Chief Compliance Officer of the Manager, the Dreyfus Family of Funds and BNY Mellon Funds Trust (63 investment companies, comprised of 149 portfolios). He is 61 years old and has served in various capacities with the Manager since 1980, including manager of the firm’s Fund Accounting Department from 1997 through October 2001.
CARIDAD M. CAROSELLA, Anti-Money Laundering Compliance Officer since January 2016.
Anti-Money Laundering Compliance Officer of the Dreyfus Family of Funds and BNY Mellon Funds Trust since January 2016; from May 2015 to December 2015, Interim Anti-Money Laundering Compliance Officer of the Dreyfus Family of Funds and BNY Mellon Funds Trust and the Distributor; from January 2012 to May 2015, AML Surveillance Officer of the Distributor and from 2007 to December 2011, Financial Processing Manager of the Distributor. She is an officer of 57 investment companies (comprised of 143 portfolios) managed by the Manager. She is 50 years old and has been an employee of the Distributor since 1997.
43
NOTES
44
NOTES
45
Dreyfus Institutional S&P 500 Stock Index Fund
200 Park Avenue
New York, NY 10166
Manager
The Dreyfus Corporation
200 Park Avenue
New York, NY 10166
Custodian
The Bank of New York Mellon
240 Greenwich Street
New York, NY 10286
Transfer Agent &
Dividend Disbursing Agent
Dreyfus Transfer, Inc.
200 Park Avenue
New York, NY 10166
Distributor
MBSC Securities Corporation
200 Park Avenue
New York, NY 10166
Telephone Call your financial representative or 1-800-DREYFUS
Mail The Dreyfus Family of Funds, 144 Glenn Curtiss Boulevard, Uniondale, NY 11556-0144
E-mail Send your request to info@dreyfus.com
Internet Information can be viewed online or downloaded at www.dreyfus.com
The fund files its complete schedule of portfolio holdings with the Securities and Exchange Commission (“SEC”) for the first and third quarters of each fiscal year on Form N-Q. The fund’s Forms N-Q are available on the SEC’s website at www.sec.gov.
A description of the policies and procedures that the fund uses to determine how to vote proxies relating to portfolio securities and information regarding how the fund voted these proxies for the most recent 12-month period ended June 30 is available at www.dreyfus.com and on the SEC’s website at www.sec.gov and without charge, upon request, by calling 1-800-DREYFUS.
| | |
© 2018 MBSC Securities Corporation
0713AR1018 | 
|
Dreyfus Tax Managed Growth Fund
| | | |

| | ANNUAL REPORT October 31, 2018 |
| |
Save time. Save paper. View your next shareholder report online as soon as it’s available. Log into www.dreyfus.com and sign up for Dreyfus eCommunications. It’s simple and only takes a few minutes. |
| |
The views expressed in this report reflect those of the portfolio manager(s) only through the end of the period covered and do not necessarily represent the views of Dreyfus or any other person in the Dreyfus organization. Any such views are subject to change at any time based upon market or other conditions and Dreyfus disclaims any responsibility to update such views. These views may not be relied on as investment advice and, because investment decisions for a Dreyfus fund are based on numerous factors, may not be relied on as an indication of trading intent on behalf of any Dreyfus fund. |
| |
Not FDIC-Insured • Not Bank-Guaranteed • May Lose Value |
Contents
THE FUND
FOR MORE INFORMATION
Back Cover
| | | | |
| |
Dreyfus Tax Managed Growth Fund
| | The Fund |
A LETTER FROM THE PRESIDENT OF DREYFUS
Dear Shareholder:
We are pleased to present this annual report for Dreyfus Tax Managed Growth Fund, covering the 12-month period from November 1, 2017 through October 31, 2018. For information about how the fund performed during the reporting period, as well as general market perspectives, we provide a Discussion of Fund Performance on the pages that follow.
Markets began the reporting period on solid footing as major global economies experienced above-trend growth across the board. In the United States, the Federal Reserve continued to move away from its accommodative monetary policy while other major central banks also began to consider monetary tightening. In the equity markets, both U.S. and non-U.S. markets enjoyed an upward trend, though investor concerns about volatility and inflation later began to weigh on returns. Interest rates rose across the curve, putting pressure on bond prices.
Later in the reporting period, global growth trends began to diverge. While a strong economic performance continued to bolster U.S. equity markets, slower growth and political concerns pressured markets in the Eurozone. Emerging markets also came under pressure as weakness in their currencies added to investors’ uneasiness. Fixed income markets continued to struggle as interest rates rose; the yield on the benchmark 10-year Treasury bond surged late in the reporting period, but growing investor concerns about global growth helped keep it from rising further.
Despite continuing doubts regarding trade, U.S. inflationary pressures, and global growth, we are optimistic that the U.S. economy will remain strong in the near term. However, we will stay attentive to signs that signal potential changes on the horizon. As always, we encourage you to discuss the risks and opportunities of today’s investment environment with your financial advisor.
Thank you for your continued confidence and support.
Sincerely,

Renee Laroche-Morris
President
The Dreyfus Corporation
November 15, 2018
2
DISCUSSION OF FUND PERFORMANCE (Unaudited)
For the period from November 1, 2017 through October 31, 2018, as provided by portfolio manager Fayez Sarofim of Fayez Sarofim & Co., Sub-Investment Adviser.
Market and Fund Performance Overview
For the 12-month period ended October 31, 2018, Dreyfus Tax Managed Growth Fund’s Class A shares produced a total return of 5.19%, Class C shares returned 4.41% and Class I shares returned 5.51%.1 In comparison, the S&P 500® Index (the “Index”), the fund’s benchmark, returned 7.35% for the same period.2
U.S. equities advanced moderately during the reporting period amid improving economic prospects and better-than-expected corporate earnings. The fund modestly lagged its benchmark due to shortfalls in our sector allocation strategy and our security selection strategy.
The Fund’s Investment Approach
The fund seeks long-term capital appreciation consistent with minimizing realized capital gains. To pursue this goal, the fund normally invests at least 80% of its net assets, plus any borrowings for investment purposes, in common stocks and employs a tax-managed strategy, which is an approach to managing a fund that seeks to minimize capital-gains tax liabilities. The fund seeks to minimize capital gains. For example, when selling securities, the fund generally will select those shares bought at the highest price to minimize capital gains. When this would produce short-term capital gains, however, the fund may sell those highest-cost shares with a long-term holding period.
The fund focuses on “blue-chip” companies with market capitalizations exceeding $5 billion at the time of purchase, including multinational companies. In choosing stocks, the fund’s portfolio managers first identify economic sectors they believe will expand over the next three to five years or longer. Using fundamental analysis, the fund’s portfolio managers then seek companies within these sectors that have dominant positions in their industries and that have demonstrated sustained patterns of profitability, strong balance sheets, an expanding global presence, and the potential to achieve predictable, above-average earnings growth. The fund’s portfolio managers also are alert to companies which they consider undervalued in terms of current earnings, assets, or growth prospects.
The fund also may invest in U.S. dollar-denominated American Depositary Receipts (ADRs).
The fund attempts to enhance after-tax returns by minimizing its annual taxable distributions to shareholders. To do so, the fund employs a “buy-and-hold” investment strategy, which has generally resulted in an annual portfolio turnover rate of below 15%.
Volatility Returned to Equity Markets in 2018
The Index achieved a solid gain for the 12-month reporting period, despite back-to-back declines in February and March and another slide in October. Accelerating U.S. economic activity and robust earnings helped push equity markets higher even as trade conflicts heated up, the Federal Reserve stepped up its pace of monetary tightening, and political risks resurfaced in the Eurozone.
Volatility increased as the period progressed, and sector leadership continued to churn. The information technology, consumer discretionary, and health care sectors were the strongest sectors of the Index, although 9 of the 11 sectors recorded gains for the period. Only the materials and industrials sectors ended the reporting period lower.
3
DISCUSSION OF FUND PERFORMANCE (Unaudited) (continued)
Sector Allocations and Security Selections Dampened Results
The fund’s relative performance was restrained by the overweight exposure to and weakness in key positions in the consumer staples sector, particularly in the tobacco and beverages industries. Relative results were also undermined by the positioning in the health care sector, with poor performances by several of the pharmaceutical stocks offsetting strength among the fund’s health care equipment & providers holdings. The stock focus in the financials sector likewise undercut results compared to the Index. The largest detractors from returns included Philip Morris International, Facebook, Chubb, State Street, and Anheuser-Busch InBev.
Factors that supported relative performance included the limited and very selective representation in the industrials sector, which came under pressure from rising fuel prices and concerns over tariffs. The emphasis among professional services stocks and the avoidance of industrial conglomerates were particularly beneficial. The stock focus in information technology proved advantageous, and this benefit was amplified by the above-market allocation to this top-performing sector. The underweighted and selectively focused exposure in the materials sector, and the concentration on the major integrated oils in the energy sector, also added value. Holdings making the largest positive contributions to the fund’s 12-month return included Apple, Microsoft, Visa, Estée Lauder, and Abbott Laboratories.
A Focus on Stable Industry Leaders in a Volatile Market
With global economic data pointing to continued, if less even, expansion, equity markets seem poised to recover from recent weakness and finish out the year with further gains. However, bouts of volatility are likely to become more frequent as the withdrawal of monetary stimulus continues and geopolitical tensions ratchet higher.
We believe the relative performance of higher-quality companies with sustainable earnings prospects and low leverage will continue to strengthen as macro uncertainty increases. The fund’s long-practiced investment strategy focuses on such companies. The industry-leading multinationals in our portfolios have strong balance sheets and ample financial resources that enable them to invest prudently for sustained growth, even as the cost of capital rises. Furthermore, their commitment to enhancing long-term shareholder value through disciplined capital redeployment, dividend increases, and share repurchases offers a degree of downside protection against increased volatility.
November 15, 2018
1 Total return includes reinvestment of dividends and any capital gains paid, and does not take into consideration the maximum initial sales charge in the case of Class A shares or the applicable contingent deferred sales charge imposed on redemptions in the case of Class C shares. Had these charges been reflected, returns would have been lower. Past performance is no guarantee of future results. Share price and investment return fluctuate such that upon redemption, fund shares may be worth more or less than their original cost.
2 Source: Lipper, Inc. — The S&P 500® Index is widely regarded as the best single gauge of large-cap U.S. equities. The index includes 500 leading companies and captures approximately 80% coverage of available market capitalization. Investors cannot invest directly in any index.
Equities are subject generally to market, market sector, market liquidity, issuer, and investment style risks, among other factors, to varying degrees, all of which are more fully described in the fund’s prospectus.
4
FUND PERFORMANCE (Unaudited)

Comparison of change in value of $10,000 investment in Dreyfus Tax Managed Growth Fund Class A shares, Class C shares and Class I shares and the S&P 500® Index (the “Index”)
† Source: Lipper Inc.
Past performance is not predictive of future performance.
The above graph compares a $10,000 investment made in each of the Class A, Class C and Class I shares of Dreyfus Tax Managed Growth Fund on 10/31/08 to a $10,000 investment made in the Index on that date. All dividends and capital gain distributions are reinvested.
The fund’s performance shown in the line graph above takes into account the maximum initial sales charge on Class A shares and all other applicable fees and expenses on all classes. The Index is widely regarded as the best single gauge of large-cap U.S. equities. The Index includes 500 leading companies and captures approximately 80% coverage of available market capitalization. Unlike a mutual fund, the Index is not subject to charges, fees and other expenses. Investors cannot invest directly in any index. Further information relating to fund performance, including expense reimbursements, if applicable, is contained in the Financial Highlights section of the prospectus and elsewhere in this report.
5
FUND PERFORMANCE (Unaudited) (continued)
| | | | |
Average Annual Total Returns as of 10/31/18 |
| | 1 Year | 5 Years | 10 Years |
Class A shares | | | |
with maximum sales charge (5.75%) | -0.88% | 6.50% | 9.61% |
without sales charge | 5.19% | 7.77% | 10.27% |
Class C shares | | | |
with applicable redemption charge † | 3.42% | 6.96% | 9.44% |
without redemption | 4.41% | 6.96% | 9.44% |
Class I shares | 5.51% | 8.05% | 10.54% |
S&P 500® Index | 7.35% | 11.33% | 13.23% |
† The maximum contingent deferred sales charge for Class C shares is 1% for shares redeemed within one year of the date of purchase.
The performance data quoted represents past performance, which is no guarantee of future results. Share price and investment return fluctuate and an investor’s shares may be worth more or less than original cost upon redemption. Current performance may be lower or higher than the performance quoted. Go to Dreyfus.com for the fund’s most recent month-end returns.
The fund’s performance shown in the graph and table does not reflect the deduction of taxes that a shareholder would pay on fund distributions or the redemption of fund shares. In addition to the performance of Class A shares shown with and without a maximum sales charge, the fund’s performance shown in the table takes into account all other applicable fees and expenses on all classes.
6
UNDERSTANDING YOUR FUND’S EXPENSES (Unaudited)
As a mutual fund investor, you pay ongoing expenses, such as management fees and other expenses. Using the information below, you can estimate how these expenses affect your investment and compare them with the expenses of other funds. You also may pay one-time transaction expenses, including sales charges (loads) and redemption fees, which are not shown in this section and would have resulted in higher total expenses. For more information, see your fund’s prospectus or talk to your financial adviser.
Review your fund’s expenses
The table below shows the expenses you would have paid on a $1,000 investment in Dreyfus Tax Managed Growth Fund from May 1, 2018 to October 31, 2018. It also shows how much a $1,000 investment would be worth at the close of the period, assuming actual returns and expenses.
| | | | | | | | | | | | | |
Expenses and Value of a $1,000 Investment | | |
assuming actual returns for the six months ended October 31, 2018 |
| | | | Class A | Class C | Class I | |
Expenses paid per $1,000† | | $6.17 | | $10.00 | | $4.88 | |
Ending value (after expenses) | | $1,038.40 | | $1,034.30 | | $1,040.00 | |
COMPARING YOUR FUND’S EXPENSES
WITH THOSE OF OTHER FUNDS (Unaudited)
Using the SEC’s method to compare expenses
The Securities and Exchange Commission (“SEC”) has established guidelines to help investors assess fund expenses. Per these guidelines, the table below shows your fund’s expenses based on a $1,000 investment, assuming a hypothetical 5% annualized return. You can use this information to compare the ongoing expenses (but not transaction expenses or total cost) of investing in the fund with those of other funds. All mutual fund shareholder reports will provide this information to help you make this comparison. Please note that you cannot use this information to estimate your actual ending account balance and expenses paid during the period.
| | | | | | | | | | | | | | |
Expenses and Value of a $1,000 Investment | | |
assuming a hypothetical 5% annualized return for the six months ended October 31, 2018 |
| | | | Class A | Class C | Class I | |
Expenses paid per $1,000† | | $6.11 | | $9.91 | | $4.84 | |
Ending value (after expenses) | | $1,019.16 | | $1,015.38 | | $1,020.42 | |
† Expenses are equal to the fund’s annualized expense ratio of 1.20% for Class A, 1.95% for Class C and .95% for Class I, multiplied by the average account value over the period, multiplied by 184/365 (to reflect the one-half year period).
7
STATEMENT OF INVESTMENTS
October 31, 2018
| | | | | | | | |
| |
Description | | | | Shares | | Value ($) | |
Common Stocks - 99.2% | | | | | |
Banks - 5.0% | | | | | |
JPMorgan Chase & Co. | | | | 39,190 | | 4,272,494 | |
Wells Fargo & Co. | | | | 19,500 | | 1,037,985 | |
| | | | | 5,310,479 | |
Capital Goods - 1.6% | | | | | |
United Technologies | | | | 13,605 | | 1,689,877 | |
Commercial & Professional Services - .9% | | | | | |
Verisk Analytics | | | | 7,740 | a | 927,562 | |
Consumer Durables & Apparel - 1.2% | | | | | |
NIKE, Cl. B | | | | 17,170 | | 1,288,437 | |
Consumer Services - 2.4% | | | | | |
McDonald's | | | | 14,090 | | 2,492,521 | |
Diversified Financials - 6.7% | | | | | |
American Express | | | | 18,040 | | 1,853,249 | |
BlackRock | | | | 5,885 | | 2,421,207 | |
Intercontinental Exchange | | | | 16,790 | | 1,293,502 | |
State Street | | | | 21,020 | | 1,445,125 | |
| | | | | 7,013,083 | |
Energy - 6.3% | | | | | |
Chevron | | | | 18,390 | | 2,053,243 | |
ConocoPhillips | | | | 20,230 | | 1,414,077 | |
Exxon Mobil | | | | 40,132 | | 3,197,718 | |
| | | | | 6,665,038 | |
Food, Beverage & Tobacco - 17.0% | | | | | |
Altria | | | | 53,990 | | 3,511,510 | |
Anheuser-Busch InBev, ADR | | | | 7,575 | b | 560,399 | |
Coca-Cola | | | | 62,405 | | 2,987,951 | |
Constellation Brands, Cl. A | | | | 1,740 | | 346,660 | |
Nestle, ADR | | | | 30,935 | | 2,607,202 | |
PepsiCo | | | | 21,620 | | 2,429,656 | |
Philip Morris International | | | | 61,555 | | 5,421,149 | |
| | | | | 17,864,527 | |
Health Care Equipment & Services - 4.2% | | | | | |
Abbott Laboratories | | | | 35,180 | | 2,425,309 | |
UnitedHealth | | | | 7,575 | | 1,979,726 | |
| | | | | 4,405,035 | |
Household & Personal Products - 3.1% | | | | | |
Estee Lauder, Cl. A | | | | 24,025 | | 3,301,996 | |
Insurance - 2.7% | | | | | |
Chubb | | | | 22,300 | | 2,785,493 | |
Materials - 1.4% | | | | | |
Air Products & Chemicals | | | | 7,135 | | 1,101,287 | |
8
| | | | | | | | |
| |
Description | | | | Shares | | Value ($) | |
Common Stocks - 99.2% (continued) | | | | | |
Materials - 1.4% (continued) | | | | | |
Sherwin-Williams | | | | 1,000 | | 393,470 | |
| | | | | 1,494,757 | |
Media & Entertainment - 14.1% | | | | | |
Alphabet, Cl. C | | | | 4,088 | a | 4,401,836 | |
Comcast, Cl. A | | | | 72,320 | | 2,758,285 | |
Facebook, Cl. A | | | | 31,865 | a | 4,836,788 | |
Twenty-First Century Fox, Cl. A | | | | 20,250 | | 921,780 | |
Twenty-First Century Fox, Cl. B | | | | 18,660 | | 843,059 | |
Walt Disney | | | | 9,560 | | 1,097,775 | |
| | | | | 14,859,523 | |
Pharmaceuticals Biotechnology & Life Sciences - 5.1% | | | | | |
AbbVie | | | | 28,285 | | 2,201,987 | |
Novo Nordisk, ADR | | | | 39,855 | | 1,720,939 | |
Roche Holding, ADR | | | | 49,050 | | 1,489,158 | |
| | | | | 5,412,084 | |
Retailing - 1.8% | | | | | |
Amazon.com | | | | 1,200 | a | 1,917,612 | |
Semiconductors & Semiconductor Equipment - 5.4% | | | | | |
ASML Holding | | | | 9,845 | | 1,696,884 | |
Infineon Technologies, ADR | | | | 25,090 | | 505,814 | |
Texas Instruments | | | | 36,980 | | 3,432,853 | |
| | | | | 5,635,551 | |
Software & Services - 10.1% | | | | | |
Automatic Data Processing | | | | 5,265 | | 758,581 | |
Microsoft | | | | 60,330 | | 6,443,847 | |
Visa, Cl. A | | | | 24,525 | b | 3,380,771 | |
| | | | | 10,583,199 | |
Technology Hardware & Equipment - 7.6% | | | | | |
Apple | | | | 36,610 | | 8,012,465 | |
Transportation - 2.6% | | | | | |
Canadian Pacific Railway | | | | 10,435 | | 2,139,175 | |
Union Pacific | | | | 4,350 | | 636,057 | |
| | | | | 2,775,232 | |
Total Common Stocks (cost $51,346,239) | | | | 104,434,471 | |
| | | 7-Day
Yield (%) | | | | | |
Investment Companies - .8% | | | | | |
Registered Investment Companies - .8% | | | | | |
Dreyfus Institutional Preferred Government Plus Money Market Fund
(cost $852,918) | | 2.21 | | 852,918 | c | 852,918 | |
9
STATEMENT OF INVESTMENTS (continued)
| | | | | | | | |
| |
Description | | 7-Day
Yield (%) | | Shares | | Value ($) | |
Investment of Cash Collateral for Securities Loaned - .5% | | | | | |
Registered Investment Companies - .5% | | | | | |
Dreyfus Institutional Preferred Government Money Market Fund, Institutional Shares
(cost $569,924) | | 2.12 | | 569,924 | c | 569,924 | |
Total Investments (cost $52,769,081) | | 100.5% | | 105,857,313 | |
Liabilities, Less Cash and Receivables | | (.5%) | | (528,893) | |
Net Assets | | 100.0% | | 105,328,420 | |
ADR—American Depository Receipt
a Non-income producing security.
b Security, or portion thereof, on loan. At October 31, 2018, the value of the fund’s securities on loan was $3,178,062 and the value of the collateral held by the fund was $3,147,224, consisting of cash collateral of $569,924 and U.S. Government & Agency securities valued at $2,577,300.
c Investment in affiliated issuer. The investment objective of this investment company is publicly available and can be found within the investment company’s prospectus.
| | |
Portfolio Summary (Unaudited) † | Value (%) |
Information Technology | 23.0 |
Consumer Staples | 20.1 |
Financials | 14.4 |
Communication Services | 14.1 |
Health Care | 9.3 |
Energy | 6.3 |
Consumer Discretionary | 5.4 |
Industrials | 5.1 |
Materials | 1.4 |
Investment Companies | 1.4 |
| | 100.5 |
† Based on net assets.
See notes to financial statements.
10
STATEMENT OF INVESTMENTS IN AFFILIATED ISSUERS
| | | | | | | |
Registered Investment Companies | Value
10/31/17($) | Purchases($) | Sales ($) | Value
10/31/18($) | Net
Assets(%) | Dividends/
Distributions($) |
Dreyfus Institutional Preferred Government Money Market Fund, Institutional Shares | - | 34,176,829 | 33,606,905 | 569,924 | .5 | - |
Dreyfus Institutional Preferred Government Plus Money Market Fund | 4,000,306 | 16,780,112 | 19,927,500 | 852,918 | .8 | 17,870 |
Total | 4,000,306 | 50,956,941 | 53,534,405 | 1,422,842 | 1.3 | 17,870 |
See notes to financial statements.
11
STATEMENT OF ASSETS AND LIABILITIES
October 31, 2018
| | | | | | | |
| | | | | | |
| | | Cost | | Value | |
Assets ($): | | | | |
Investments in securities—See Statement of Investments
(including securities on loan, valued at $3,178,062)—Note 1(b): | | | |
Unaffiliated issuers | 51,346,239 | | 104,434,471 | |
Affiliated issuers | | 1,422,842 | | 1,422,842 | |
Dividends and securities lending income receivable | | 190,710 | |
Receivable for shares of Common Stock subscribed | | 181 | |
| | | | | 106,048,204 | |
Liabilities ($): | | | | |
Due to The Dreyfus Corporation and affiliates—Note 3(b) | | | | 111,456 | |
Liability for securities on loan—Note 1(b) | | 569,924 | |
Payable for shares of Common Stock redeemed | | 37,829 | |
Directors fees and expenses payable | | 575 | |
| | | | | 719,784 | |
Net Assets ($) | | | 105,328,420 | |
Composition of Net Assets ($): | | | | |
Paid-in capital | | | | | 42,147,945 | |
Total distributable earnings (loss) | | | | | 63,180,475 | |
Net Assets ($) | | | 105,328,420 | |
| | | | | |
Net Asset Value Per Share | Class A | Class C | Class I | |
Net Assets ($) | 77,180,086 | 13,122,771 | 15,025,563 | |
Shares Outstanding | 2,629,776 | 475,692 | 510,537 | |
Net Asset Value Per Share ($) | 29.35 | 27.59 | 29.43 | |
| | | | | |
See notes to financial statements. | | | | |
12
STATEMENT OF OPERATIONS
Year Ended October 31, 2018
| | | | | | | |
| | | | | | |
| | | | | | |
Investment Income ($): | | | | |
Income: | | | | |
Cash dividends (net of $103,996 foreign taxes withheld at source): | |
Unaffiliated issuers | | | 3,469,739 | |
Affiliated issuers | | | 17,870 | |
Income from securities lending—Note 1(b) | | | 13,649 | |
Total Income | | | 3,501,258 | |
Expenses: | | | | |
Management fee—Note 3(a) | | | 1,679,866 | |
Distribution/Service Plan fees—Note 3(b) | | | 349,761 | |
Directors’ fees—Note 3(a,c) | | | 13,456 | |
Loan commitment fees—Note 2 | | | 3,718 | |
Interest expense—Note 2 | | | 184 | |
Total Expenses | | | 2,046,985 | |
Less—Directors’ fees reimbursed by Dreyfus—Note 3(a) | | | (13,456) | |
Net Expenses | | | 2,033,529 | |
Investment Income—Net | | | 1,467,729 | |
Realized and Unrealized Gain (Loss) on Investments—Note 4 ($): | | |
Net realized gain (loss) on investments | 9,743,962 | |
Net realized gain (loss) on In-kind-redemptions | | | | 34,951,698 | |
Net Realized Gain (Loss) | | | 44,695,660 | |
Net unrealized appreciation (depreciation) on investments | | | (34,631,962) | |
Net Realized and Unrealized Gain (Loss) on Investments | | | 10,063,698 | |
Net Increase in Net Assets Resulting from Operations | | 11,531,427 | |
| | | | | | | |
See notes to financial statements. | | | | | |
13
STATEMENT OF CHANGES IN NET ASSETS
| | | | | | | | | | |
| | | | Year Ended October 31, |
| | | | 2018 | | 2017 | a |
Operations ($): | | | | | | | | |
Investment income—net | | | 1,467,729 | | | | 1,558,943 | |
Net realized gain (loss) on investments | | 44,695,660 | | | | 8,173,220 | |
Net unrealized appreciation (depreciation)
on investments | | (34,631,962) | | | | 26,427,794 | |
Net Increase (Decrease) in Net Assets
Resulting from Operations | 11,531,427 | | | | 36,159,957 | |
Distributions ($): | |
Distributions to shareholders: | | | | | | | | |
Class A | | | (3,803,785) | | | | (618,841) | |
Class C | | | (1,177,451) | | | | (64,897) | |
Class I | | | (4,661,261) | | | | (977,007) | |
Total Distributions | | | (9,642,497) | | | | (1,660,745) | |
Capital Stock Transactions ($): | |
Net proceeds from shares sold: | | | | | | | | |
Class A | | | 13,098,558 | | | | 5,551,428 | |
Class C | | | 742,812 | | | | 708,201 | |
Class I | | | 9,898,938 | | | | 19,586,701 | |
Distributions reinvested: | | | | | | | | |
Class A | | | 3,194,431 | | | | 534,952 | |
Class C | | | 1,045,602 | | | | 46,697 | |
Class I | | | 4,497,755 | | | | 955,233 | |
Cost of shares redeemed: | | | | | | | | |
Class A | | | (9,084,977) | | | | (12,210,846) | |
Class C | | | (12,611,158) | | | | (8,254,619) | |
Class I | | | (84,457,937) | | | | (36,942,445) | |
Increase (Decrease) in Net Assets
from Capital Stock Transactions | (73,675,976) | | | | (30,024,698) | |
Total Increase (Decrease) in Net Assets | (71,787,046) | | | | 4,474,514 | |
Net Assets ($): | |
Beginning of Period | | | 177,115,466 | | | | 172,640,952 | |
End of Period | | | 105,328,420 | | | | 177,115,466 | |
14
| | | | | | | | | | |
| | | | Year Ended October 31, |
| | | | 2018 | | 2017 | a |
Capital Share Transactions (Shares): | |
Class Ab,c | | | | | | | | |
Shares sold | | | 443,873 | | | | 204,325 | |
Shares issued for distributions reinvested | | | 110,391 | | | | 20,948 | |
Shares redeemed | | | (304,960) | | | | (462,518) | |
Net Increase (Decrease) in Shares Outstanding | 249,304 | | | | (237,245) | |
Class Cb,c | | | | | | | | |
Shares sold | | | 26,658 | | | | 29,392 | |
Shares issued for distributions reinvested | | | 38,367 | | | | 1,961 | |
Shares redeemed | | | (453,238) | | | | (322,871) | |
Net Increase (Decrease) in Shares Outstanding | (388,213) | | | | (291,518) | |
Class Ib | | | | | | | | |
Shares sold | | | 332,619 | | | | 744,127 | |
Shares issued for distributions reinvested | | | 155,172 | | | | 37,497 | |
Shares redeemed | | | (2,792,124) | | | | (1,425,690) | |
Net Increase (Decrease) in Shares Outstanding | (2,304,333) | | | | (644,066) | |
| | | | | | | | | | |
aDistributions to shareholders include $588,152 Class A, $51,422 Class C and $935,814 Class I of distributions from net investment income and $30,689 Class A, $13,475 Class C and $41,193 Class I distributions from net realized gains. Undistributed investment income—net was $350,709 in 2017 and is no longer presented as a result of the adoption of SEC’s Disclosure Update and Simplification Rule. | |
bDuring the period ended October 31, 2018, 392 Class C shares representing $11,279 were exchanged for 368 Class I shares and during the period ended October 31, 2017, 988 Class A shares representing $26,789 were exchanged for 986 Class I shares. | |
cDuring the period ended October 31, 2018, 31,352 Class C shares representing $871,409 were automatically converted to 29,560 Class A shares. | |
See notes to financial statements. | | | | | | | | |
15
FINANCIAL HIGHLIGHTS
The following tables describe the performance for each share class for the fiscal periods indicated. All information (except portfolio turnover rate) reflects financial results for a single fund share. Total return shows how much your investment in the fund would have increased (or decreased) during each period, assuming you had reinvested all dividends and distributions. These figures have been derived from the fund’s financial statements.
| | | | | | | | | |
| | | | |
| | | |
Class A Shares | | Year Ended October 31, |
| | 2018 | 2017 | 2016 | 2015 | 2014 |
Per Share Data ($): | | | | | | |
Net asset value, beginning of period | | 29.44 | 24.06 | 25.52 | 26.65 | 24.09 |
Investment Operations: | | | | | | |
Investment income—neta | | .24 | .24 | .26 | .31 | .33 |
Net realized and unrealized
gain (loss) on investments | | 1.25 | 5.39 | (.12) | (.47) | 2.54 |
Total from Investment Operations | | 1.49 | 5.63 | .14 | (.16) | 2.87 |
Distributions: | | | | | | |
Dividends from
investment income—net | | (.23) | (.24) | (.28) | (.31) | (.31) |
Dividends from net realized
gain on investments | | (1.35) | (.01) | (1.32) | (.66) | - |
Total Distributions | | (1.58) | (.25) | (1.60) | (.97) | (.31) |
Net asset value, end of period | | 29.35 | 29.44 | 24.06 | 25.52 | 26.65 |
Total Return (%)b | | 5.19 | 23.55 | .54 | (.65) | 12.00 |
Ratios/Supplemental Data (%): | | | | | | |
Ratio of total expenses
to average net assets | | 1.26 | 1.36 | 1.36 | 1.36 | 1.36 |
Ratio of net expenses
to average net assets | | 1.25 | 1.35 | 1.35 | 1.35 | 1.35 |
Ratio of net investment income
to average net assets | | .82 | .91 | 1.07 | 1.20 | 1.30 |
Portfolio Turnover Rate | | 5.63 | 1.14 | 10.84 | 11.02 | 2.44 |
Net Assets, end of period ($ x 1,000) | | 77,180 | 70,073 | 62,985 | 74,091 | 87,549 |
a Based on average shares outstanding.
b Exclusive of sales charge.
See notes to financial statements.
16
| | | | | | | | | | |
| | | | |
| | | |
Class C Shares | | Year Ended October 31, |
| | 2018 | 2017 | 2016 | 2015 | 2014 |
Per Share Data ($): | | | | | | |
Net asset value, beginning of period | | 27.77 | 22.71 | 24.17 | 25.30 | 22.90 |
Investment Operations: | | | | | | |
Investment income—neta | | .02 | .05 | .07 | .11 | .12 |
Net realized and unrealized
gain (loss) on investments | | 1.18 | 5.07 | (.10) | (.45) | 2.42 |
Total from Investment Operations | | 1.20 | 5.12 | (.03) | (.34) | 2.54 |
Distributions: | | | | | | |
Dividends from
investment income—net | | (.03) | (.05) | (.11) | (.13) | (.14) |
Dividends from net realized
gain on investments | | (1.35) | (.01) | (1.32) | (.66) | - |
Total Distributions | | (1.38) | (.06) | (1.43) | (.79) | (.14) |
Net asset value, end of period | | 27.59 | 27.77 | 22.71 | 24.17 | 25.30 |
Total Return (%)b | | 4.41 | 22.58 | (.18) | (1.42) | 11.16 |
Ratios/Supplemental Data (%): | | | | | | |
Ratio of total expenses
to average net assets | | 2.01 | 2.11 | 2.11 | 2.11 | 2.11 |
Ratio of net expenses
to average net assets | | 2.00 | 2.10 | 2.10 | 2.10 | 2.10 |
Ratio of net investment income
to average net assets | | .06 | .19 | .32 | .45 | .48 |
Portfolio Turnover Rate | | 5.63 | 1.14 | 10.84 | 11.02 | 2.44 |
Net Assets, end of period ($ x 1,000) | | 13,123 | 23,993 | 26,237 | 32,241 | 35,570 |
a Based on average shares outstanding.
b Exclusive of sales charge.
See notes to financial statements.
17
FINANCIAL HIGHLIGHTS (continued)
| | | | | | | | | | | | |
| | | | | | | |
| | | |
Class I Shares | | Year Ended October 31, |
| | 2018 | 2017 | 2016 | 2015 | 2014 |
Per Share Data ($): | | | | | | |
Net asset value, beginning of period | | 29.50 | 24.12 | 25.57 | 26.71 | 24.15 |
Investment Operations: | | | | | | |
Investment income—neta | | .33 | .30 | .31 | .37 | .32 |
Net realized and unrealized
gain (loss) on investments | | 1.26 | 5.39 | (.10) | (.47) | 2.62 |
Total from Investment Operations | | 1.59 | 5.69 | .21 | (.10) | 2.94 |
Distributions: | | | | | | |
Dividends from
investment income—net | | (.31) | (.30) | (.34) | (.38) | (.38) |
Dividends from net realized
gain on investments | | (1.35) | (.01) | (1.32) | (.66) | - |
Total Distributions | | (1.66) | (.31) | (1.66) | (1.04) | (.38) |
Net asset value, end of period | | 29.43 | 29.50 | 24.12 | 25.57 | 26.71 |
Total Return (%) | | 5.51 | 23.80 | .83 | (.43) | 12.29 |
Ratios/Supplemental Data (%): | | | | | | |
Ratio of total expenses
to average net assets | | 1.01 | 1.11 | 1.11 | 1.11 | 1.11 |
Ratio of net expenses
to average net assets | | 1.00 | 1.10 | 1.10 | 1.10 | 1.10 |
Ratio of net investment income
to average net assets | | 1.11 | 1.14 | 1.30 | 1.44 | 1.24 |
Portfolio Turnover Rate | | 5.63 | 1.14 | 10.84 | 11.02 | 2.44 |
Net Assets, end of period ($ x 1,000) | | 15,026 | 83,050 | 83,419 | 71,785 | 70,336 |
a Based on average shares outstanding.
See notes to financial statements.
18
NOTES TO FINANCIAL STATEMENTS
NOTE 1—Significant Accounting Policies:
Dreyfus Tax Managed Growth Fund (the “fund”) is a separate diversified series of The Dreyfus/Laurel Funds, Inc. (the “Company”), which is registered under the Investment Company Act of 1940, as amended (the “Act”), as an open-end management investment company and operates as a series company currently offering eight series, including the fund. The fund’s investment objective is to seek long-term capital appreciation consistent with minimizing realized capital gains. The Dreyfus Corporation (the “Manager” or “Dreyfus”), a wholly-owned subsidiary of The Bank of New York Mellon Corporation (“BNY Mellon”), serves as the fund’s investment adviser. Fayez Sarofim & Co. (“Sarofim & Co.”), serves as the fund’s sub-investment adviser.
MBSC Securities Corporation (the “Distributor”), a wholly-owned subsidiary of Dreyfus, is the distributor of the fund’s shares. The fund is authorized to issue 600 million shares of $.001 par value Common Stock. The fund currently has authorized four classes of shares: Class A (300 million shares authorized), Class C (100 million shares authorized), Class I (100 million shares authorized) and Class T (100 million shares authorized). Class A, Class C and Class T shares are sold primarily to retail investors through financial intermediaries and bear Distribution fees and/or Service Plan fees. Class A and Class T shares generally are subject to a sales charge imposed at the time of purchase. Class C shares are subject to a contingent deferred sales charge (“CDSC”) imposed on Class C shares redeemed within one year of purchase. Class C shares automatically convert to Class A shares ten years after the date of purchase, without the imposition of a sales charge. Class I shares are sold primarily to bank trust departments and other financial service providers (including The Bank of New York Mellon, a subsidiary of BNY Mellon and an affiliate of Dreyfus, and its affiliates), acting on behalf of customers having a qualified trust or an investment account or relationship at such institution, and bear no Distribution or Service Plan fees. Class I shares are offered without a front-end sales charge or CDSC. As of the date of this report, the fund did not offer Class T shares for purchase. Other differences between the classes include the services offered to and the expenses borne by each class, and certain voting rights. Income, expenses (other than expenses attributable to a specific class), and realized and unrealized gains or losses on investments are allocated to each class of shares based on its relative net assets.
19
NOTES TO FINANCIAL STATEMENTS (continued)
The Company accounts separately for the assets, liabilities and operations of each series. Expenses directly attributable to each series are charged to that series’ operations; expenses which are applicable to all series are allocated among them on a pro rata basis.
The Financial Accounting Standards Board (“FASB”) Accounting Standards Codification is the exclusive reference of authoritative U.S. generally accepted accounting principles (“GAAP”) recognized by the FASB to be applied by nongovernmental entities. Rules and interpretive releases of the Securities and Exchange Commission (“SEC”) under authority of federal laws are also sources of authoritative GAAP for SEC registrants. The fund’s financial statements are prepared in accordance with GAAP, which may require the use of management estimates and assumptions. Actual results could differ from those estimates.
(a) Portfolio valuation: The fair value of a financial instrument is the amount that would be received to sell an asset or paid to transfer a liability in an orderly transaction between market participants at the measurement date (i.e., the exit price). GAAP establishes a fair value hierarchy that prioritizes the inputs of valuation techniques used to measure fair value. This hierarchy gives the highest priority to unadjusted quoted prices in active markets for identical assets or liabilities (Level 1 measurements) and the lowest priority to unobservable inputs (Level 3 measurements).
Additionally, GAAP provides guidance on determining whether the volume and activity in a market has decreased significantly and whether such a decrease in activity results in transactions that are not orderly. GAAP requires enhanced disclosures around valuation inputs and techniques used during annual and interim periods.
Various inputs are used in determining the value of the fund’s investments relating to fair value measurements. These inputs are summarized in the three broad levels listed below:
Level 1—unadjusted quoted prices in active markets for identical investments.
Level 2—other significant observable inputs (including quoted prices for similar investments, interest rates, prepayment speeds, credit risk, etc.).
Level 3—significant unobservable inputs (including the fund’s own assumptions in determining the fair value of investments).
The inputs or methodology used for valuing securities are not necessarily an indication of the risk associated with investing in those securities.
20
Changes in valuation techniques may result in transfers in or out of an assigned level within the disclosure hierarchy. Valuation techniques used to value the fund’s investments are as follows:
Investments in securities are valued at the last sales price on the securities exchange or national securities market on which such securities are primarily traded. Securities listed on the National Market System for which market quotations are available are valued at the official closing price or, if there is no official closing price that day, at the last sales price. For open short positions, asked prices are used for valuation purposes. Bid price is used when no asked price is available. Registered investment companies that are not traded on an exchange are valued at their net asset value. All of the preceding securities are generally categorized within Level 1 of the fair value hierarchy.
Securities not listed on an exchange or the national securities market, or securities for which there were no transactions, are valued at the average of the most recent bid and asked prices. These securities are generally categorized within Level 2 of the fair value hierarchy.
Fair valuing of securities may be determined with the assistance of a pricing service using calculations based on indices of domestic securities and other appropriate indicators, such as prices of relevant ADRs and futures. Utilizing these techniques may result in transfers between Level 1 and Level 2 of the fair value hierarchy.
When market quotations or official closing prices are not readily available, or are determined not to accurately reflect fair value, such as when the value of a security has been significantly affected by events after the close of the exchange or market on which the security is principally traded (for example, a foreign exchange or market), but before the fund calculates its net asset value, the fund may value these investments at fair value as determined in accordance with the procedures approved by the Company’s Board of Directors (the “Board”). Certain factors may be considered when fair valuing investments such as: fundamental analytical data, the nature and duration of restrictions on disposition, an evaluation of the forces that influence the market in which the securities are purchased and sold, and public trading in similar securities of the issuer or comparable issuers. These securities are either categorized within Level 2 or 3 of the fair value hierarchy depending on the relevant inputs used.
For restricted securities where observable inputs are limited, assumptions about market activity and risk are used and such securities are generally categorized within Level 3 of the fair value hierarchy.
21
NOTES TO FINANCIAL STATEMENTS (continued)
The following is a summary of the inputs used as of October 31, 2018 in valuing the fund’s investments:
| | | | | | |
| | Level 1 - Unadjusted Quoted Prices | Level 2 - Other Significant Observable
Inputs | Level 3 -Significant Unobservable Inputs | Total |
Assets ($) | | | |
Investments in Securities: | | | |
Equity Securities - Common Stocks† | 104,434,471 | - | - | 104,434,471 |
Investment
Companies | 1,422,842 | - | - | 1,422,842 |
† See Statement of Investments for additional detailed categorizations.
At October 31, 2018, there were no transfers between levels of the fair value hierarchy. It is the fund’s policy to recognize transfers between levels at the end of the reporting period.
(b) Securities transactions and investment income: Securities transactions are recorded on a trade date basis. Realized gains and losses from securities transactions are recorded on the identified cost basis. Dividend income is recognized on the ex-dividend date and interest income, including, where applicable, accretion of discount and amortization of premium on investments, is recognized on the accrual basis.
Pursuant to a securities lending agreement with The Bank of New York Mellon, the fund may lend securities to qualified institutions. It is the fund’s policy that, at origination, all loans are secured by collateral of at least 102% of the value of U.S. securities loaned and 105% of the value of foreign securities loaned. Collateral equivalent to at least 100% of the market value of securities on loan is maintained at all times. At October 31, 2018, the market value of the collateral was 99.0% of the market value of the securities on loan. The fund received additional collateral subsequent to year end which resulted in the market value of the collateral to be at least 100% of the market value of the securities on loan. Collateral is either in the form of cash, which can be invested in certain money market mutual funds managed by Dreyfus, or U.S. Government and Agency securities. The fund is entitled to receive all dividends, interest and distributions on securities loaned, in addition to income earned as a result of the lending transaction. Should a borrower fail to return the securities in a timely manner, The Bank of New York Mellon is required to replace the securities for the benefit of the fund or credit the fund with the market value of the unreturned securities and is subrogated to the fund’s rights against the borrower and the collateral. Additionally, the contractual
22
maturity of security lending transactions are on an overnight and continuous basis. During the period ended October 31, 2018, The Bank of New York Mellon earned $2,562 from lending portfolio securities, pursuant to the securities lending agreement.
(c) Affiliated issuers: Investments in other investment companies advised by Dreyfus are considered “affiliated” under the Act.
(d) Dividends and distributions to shareholders: Dividends and distributions are recorded on the ex-dividend date. Dividends from investment income-net are normally declared and paid quarterly. Dividends from net realized capital gains, if any, are normally declared and paid annually, but the fund may make distributions on a more frequent basis to comply with the distribution requirements of the Internal Revenue Code of 1986, as amended (the “Code”). To the extent that net realized capital gains can be offset by capital loss carryovers, it is the policy of the fund not to distribute such gains. Income and capital gain distributions are determined in accordance with income tax regulations, which may differ from GAAP.
(e) Federal income taxes: It is the policy of the fund to continue to qualify as a regulated investment company, if such qualification is in the best interests of its shareholders, by complying with the applicable provisions of the Code, and to make distributions of taxable income and net realized capital gain sufficient to relieve it from substantially all federal income and excise taxes.
As of and during the period ended October 31, 2018, the fund did not have any liabilities for any uncertain tax positions. The fund recognizes interest and penalties, if any, related to uncertain tax positions as income tax expense in the Statement of Operations. During the period ended October 31, 2018, the fund did not incur any interest or penalties.
Each tax year in the four-year period ended October 31, 2018 remains subject to examination by the Internal Revenue Service and state taxing authorities.
At October 31, 2018, the components of accumulated earnings on a tax basis were as follows: undistributed ordinary income $396,973, undistributed capital gains $9,695,270 and unrealized appreciation $53,088,232.
The tax character of distributions paid to shareholders during the fiscal periods ended October 31, 2018 and October 31, 2017 were as follows: ordinary income $1,687,328 and $1,575,388, and long-term capital gains $7,955,169 and $85,357, respectively.
23
NOTES TO FINANCIAL STATEMENTS (continued)
During the period ended October 31, 2018, as a result of permanent book to tax differences, primarily due to the tax treatment for gains from redemption in-kind, the fund decreased total distributable earnings (loss) by $34,951,698 and increased paid-in capital by the same amount. Net assets and net asset value per share were not affected by this reclassification.
(f) In-Kind Redemptions: The fund transferred securities and cash to shareholders in connection with an in-kind redemption transaction. For financial reporting purposes, these transactions were treated as sales of securities and the resulting gains and losses were recognized based on the market value of the securities on the date of the redemption. For the year ended October 31, 2018, the fund had in-kind redemptions of $66,972,037. For tax purposes, no gains or losses were recognized. Net gains and losses resulting from such in-kind redemptions are shown in the Statement of Operations.
(g) New Accounting Pronouncements: In August 2018, the FASB issued Accounting Standards Update 2018-13, Fair Value Measurement (Topic 820): Disclosure Framework—Changes to the Disclosure Requirements for Fair Value Measurement (“ASU 2018-13”). The update provides guidance that eliminates, adds and modifies certain disclosure requirements for fair value measurements. ASU 2018-13 will be effective for annual periods beginning after December 15, 2019. Management is currently assessing the potential impact of these changes to future financial statements.
NOTE 2—Bank Lines of Credit:
The fund participates with other Dreyfus-managed funds in an $830 million unsecured credit facility led by Citibank, N.A. and a $300 million unsecured credit facility provided by The Bank of New York Mellon (each, a “Facility”), each to be utilized primarily for temporary or emergency purposes, including the financing of redemptions. In connection therewith, the fund has agreed to pay its pro rata portion of commitment fees for each Facility. Interest is charged to the fund based on rates determined pursuant to the terms of the respective Facility at the time of borrowing.
The average amount of borrowings outstanding under the Facilities during the period ended October 31, 2018, was approximately $7,900 with a related weighted average annualized interest rate of 2.33%.
24
NOTE 3—Investment Management Fee, Sub-Investment Advisory Fee and Other Transactions with Affiliates:
(a) Pursuant to an investment management agreement with Dreyfus, Dreyfus provides or arranges for one or more third parties and/or affiliates to provide investment management, administrative, custody, fund accounting and transfer agency services to the fund. Dreyfus also directs the investments of the fund in accordance with its investment objective, policies and limitations. For these services, the fund is contractually obligated to pay Dreyfus a fee, calculated daily and paid monthly, at the annual rate of .95% of the value of the fund’s average daily net assets. Effective as of March 1, 2018, the Board approved a reduction in the management fee for these services from an annual rate of 1.10% to an annual rate of .95% of the value of the fund’s average daily net assets. Out of its fee, Dreyfus pays all of the expenses of the fund except brokerage fees, taxes, interest expenses, commitment fees on borrowings, Distribution Plan fees and Service Plan fees, fees and expenses of the non-interested Directors (including counsel fees) and extraordinary expenses. In addition, Dreyfus is required to reduce its fee in an amount equal to the fund’s allocable portion of fees and expenses of the non-interested Directors (including counsel fees). During the period ended October 31, 2018, fees reimbursed by Dreyfus amount to $13,456.
Pursuant to a sub-investment advisory agreement between Dreyfus and Sarofim & Co., Dreyfus pays Sarofim & Co. a monthly fee at an annual rate of .2175% of the value of the fund’s average daily net assets.
During the period ended October 31, 2018, the Distributor retained $6,038 from commissions earned on sales of the fund’s Class A share and $184 from CDSC fees on redemptions of the fund’s Class C shares.
(b) Under the Distribution Plans adopted pursuant to Rule 12b-1 (the “Distribution Plans”) under the Act, Class A shares pay annually up to .25% of the value of its average daily net assets to compensate the Distributor for shareholder servicing activities and expenses primarily intended to result in the sale of Class A shares. Class C shares pay the Distributor for distributing its shares at an aggregate annual rate of .75% of the value of the average daily net assets of Class C shares. Class C shares are also subject to a service plan adopted pursuant to Rule 12b-1 (the “Service Plan”), under which Class C shares pay the Distributor for providing certain services to the holders of their shares, a fee at an annual rate of .25% of the value of the average daily net assets of Class C shares. During the period ended October 31, 2018, Class A and Class C shares were charged $198,393 and $113,526, respectively, pursuant to their
25
NOTES TO FINANCIAL STATEMENTS (continued)
Distribution Plans. During the period ended October 31, 2018, Class C shares were charged $37,842 pursuant to the Service Plan.
Under its terms, the Distribution Plans and Service Plan shall remain in effect from year to year, provided such continuance is approved annually by a vote of a majority of those Directors who are not “interested persons” of the Company and who have no direct or indirect financial interest in the operation of or in any agreement related to the Distribution Plans or Service Plan.
The components of “Due to The Dreyfus Corporation and affiliates” in the Statement of Assets and Liabilities consist of: management fees $86,150, Distribution Plans fees $25,022 and Service Plan fees $2,812, which are offset against an expense reimbursement currently in effect in the amount of $2,528.
(c) Each Board member also serves as a Board member of other funds within the Dreyfus complex. Annual retainer fees and attendance fees are allocated to each fund based on net assets.
NOTE 4—Securities Transactions:
The aggregate amount of purchases and sales of investment securities, excluding short-term securities, during the period ended October 31, 2018, amounted to $9,288,147 and $88,301,997, respectively.
At October 31, 2018, the cost of investments for federal income tax purposes was $52,769,081; accordingly, accumulated net unrealized appreciation on investments was $53,088,232, consisting of $54,104,032 gross unrealized appreciation and $1,015,800 gross unrealized depreciation.
26
REPORT OF INDEPENDENT REGISTERED PUBLIC ACCOUNTING FIRM
To the Shareholders and Board of Directors
The Dreyfus/Laurel Funds Inc.
Opinion on the Financial Statements
We have audited the accompanying statement of assets and liabilities of Dreyfus Tax Managed Growth Fund (the “Fund”), a series of The Dreyfus/Laurel Funds, Inc., including the statements of investments and investments in affiliated issuers, as of October 31, 2018, the related statement of operations for the year then ended, the statements of changes in net assets for each of the years in the two-year period then ended, and the related notes (collectively, the financial statements) and the financial highlights for each of the years in the five-year period then ended. In our opinion, the financial statements and financial highlights present fairly, in all material respects, the financial position of the Fund as of October 31, 2018, the results of its operations for the year then ended, the changes in its net assets for each of the years in the two-year period then ended and the financial highlights for each of the years in the five-year period then ended, in conformity with U.S. generally accepted accounting principles.
Basis for Opinion
These financial statements and financial highlights are the responsibility of the Fund’s management. Our responsibility is to express an opinion on these financial statements and financial highlights based on our audits. We are a public accounting firm registered with the Public Company Accounting Oversight Board (United States) (PCAOB) and are required to be independent with respect to the Fund in accordance with the U.S. federal securities laws and the applicable rules and regulations of the Securities and Exchange Commission and the PCAOB.
We conducted our audits in accordance with the standards of the PCAOB. Those standards require that we plan and perform the audit to obtain reasonable assurance about whether the financial statements and financial highlights are free of material misstatement, whether due to error or fraud. Our audits included performing procedures to assess the risks of material misstatement of the financial statements and financial highlights, whether due to error or fraud, and performing procedures that respond to those risks. Such procedures included examining, on a test basis, evidence regarding the amounts and disclosures in the financial statements and financial highlights. Such procedures also included confirmation of securities owned as of October 31, 2018, by correspondence with the custodian and brokers or by other appropriate auditing procedures when replies from brokers were not received. Our audits also included evaluating the accounting principles used and significant estimates made by management, as well as evaluating the overall presentation of the financial statements and financial highlights. We believe that our audits provide a reasonable basis for our opinion.

We have served as the auditor of one or more Dreyfus Corporation investment companies since 1994.
New York, New York
December 28, 2018
27
IMPORTANT TAX INFORMATION (Unaudited)
For federal tax purposes, the fund reports the maximum amount allowable, but not less than $1,687,328 as ordinary income dividends paid during the year ended October 31, 2018 as qualified dividend income in accordance with Section 854(b)(1)(B) of the Internal Revenue Code. Also, the fund reports the maximum amount allowable but not less than 100% of ordinary income dividends paid during the year ended October 31, 2018 as eligible for the corporate dividends received deduction provided under Section 243 of the Internal Revenue Code in accordance with Section 854(b)(1)(A) of the Internal Revenue Code. Shareholders will receive notification in early 2019 of the percentage applicable to the preparation of their 2018 income tax returns. Also, the fund reports the maximum amount allowable but not less than $1.3155 per share as a capital gain dividend in accordance with Section 852(b)(3)(C) of the Internal Revenue Code. Also, the fund reports the maximum amount allowable but not less than $.0373 as a short-term capital gain dividend paid on December 6, 2017 in accordance with Sections 871(k)(2) and 881(e) of the Internal Revenue Code.
28
BOARD MEMBERS INFORMATION (Unaudited)
INDEPENDENT BOARD MEMBERS
Joseph S. DiMartino (75)
Chairman of the Board (1999)
Principal Occupation During Past 5 Years:
· Corporate Director and Trustee (1995-present)
Other Public Company Board Memberships During Past 5 Years:
· CBIZ (formerly, Century Business Services, Inc.), a provider of outsourcing functions for small and medium size companies, Director (1997-present)
No. of Portfolios for which Board Member Serves: 124
———————
Francine J. Bovich (67)
Board Member (2012)
Principal Occupation During Past 5 Years:
· Trustee, The Bradley Trusts, private trust funds (2011-present)
Other Public Company Board Memberships During Past 5 Years:
· Annaly Capital Management, Inc., a real estate trust, Director (2014-present)
No. of Portfolios for which Board Member Serves: 72
———————
Kenneth A. Himmel (72)
Board Member (1994)
Principal Occupation During Past 5 Years:
· Managing Partner, Gulf Related, an international real estate development company (2010-present)
· President and CEO, Related Urban Development, a real estate development company (1996-present)
· President and CEO, Himmel & Company, a real estate development company (1980-present)
· CEO, American Food Management, a restaurant company (1983-present)
No. of Portfolios for which Board Member Serves: 25
———————
29
BOARD MEMBERS INFORMATION (Unaudited) (continued)
INDEPENDENT BOARD MEMBERS (continued)
Stephen J. Lockwood (71)
Board Member (1994)
Principal Occupation During Past 5 Years:
· Chairman of the Board, Stephen J. Lockwood and Company LLC, a real estate investment company (2000-present)
No. of Portfolios for which Board Member Serves: 25
———————
Roslyn M. Watson (69)
Board Member (1994)
Principal Occupation During Past 5 Years:
· Principal, Watson Ventures, Inc., a real estate investment company (1993-present)
No. of Portfolios for which Board Member Serves: 58
———————
Benaree Pratt Wiley (72)
Board Member (1998)
Principal Occupation During Past 5 Years:
· Principal, The Wiley Group, a firm specializing in strategy and business development (2005-present)
Other Public Company Board Memberships During Past 5 Years:
· CBIZ (formerly, Century Business Services, Inc.), a provider of outsourcing functions for small and medium size companies, Director (2008-present)
No. of Portfolios for which Board Member Serves: 79
———————
Once elected all Board Members serve for an indefinite term, but achieve Emeritus status upon reaching age 80. The address of the Board Members and Officers is c/o The Dreyfus Corporation, 200 Park Avenue, New York, New York 10166. Additional information about the Board Members is available in the fund’s Statement of Additional Information which can be obtained from Dreyfus free of charge by calling this toll free number: 1-800-DREYFUS.
James M. Fitzgibbons, Emeritus Board Member
30
OFFICERS OF THE FUND (Unaudited)
BRADLEY J. SKAPYAK, President since January 2010.
Chief Operating Officer and a director of the Manager since June 2009, Chairman of Dreyfus Transfer, Inc., an affiliate of the Manager and the transfer agent of the funds, since May 2011 and Chief Executive Officer of MBSC Securities Corporation since August 2016. He is an officer of 62 investment companies (comprised of 124 portfolios) managed by the Manager. He is 59 years old and has been an employee of the Manager since February 1988.
BENNETT A. MACDOUGALL, Chief Legal Officer since October 2015.
Chief Legal Officer of the Manager and Associate General Counsel and Managing Director of BNY Mellon since June 2015; from June 2005 to June 2015, he served in various capacities with Deutsche Bank – Asset & Wealth Management Division, including as Director and Associate General Counsel, and Chief Legal Officer of Deutsche Investment Management Americas Inc. from June 2012 to May 2015. He is an officer of 63 investment companies (comprised of 149 portfolios) managed by the Manager. He is 47 years old and has been an employee of the Manager since June 2015.
JAMES BITETTO, Vice President since August 2005 and Secretary since February 2018.
Managing Counsel of BNY Mellon and Secretary of the Manager, and an officer of 63 investment companies (comprised of 149 portfolios) managed by the Manager. He is 52 years old and has been an employee of the Manager since December 1996.
JOSEPH M. CHIOFFI, Vice President and Assistant Secretary since August 2005.
Managing Counsel of BNY Mellon, and an officer of 63 investment companies (comprised of 149 portfolios) managed by the Manager. He is 56 years old and has been an employee of the Manager since June 2000.
SONALEE CROSS, Vice President and Assistant Secretary since March 2018.
Counsel of BNY Mellon since October 2016; Associate at Proskauer Rose LLP from April 2016 to September 2016; Attorney at EnTrust Capital from August 2015 to February 2016; Associate at Sidley Austin LLP from September 2013 until August 2015. She is an officer of 63 investment companies (comprised of 149 portfolios) managed by Dreyfus. She is 31 years old and has been an employee of the Manager since October 2016.
MAUREEN E. KANE, Vice President and Assistant Secretary since April 2015.
Managing Counsel of BNY Mellon since July 2014; from October 2004 until July 2014, General Counsel, and from May 2009 until July 2014, Chief Compliance Officer of Century Capital Management. She is an officer of 63 investment companies (comprised of 149 portfolios) managed by the Manager. She is 56 years old and has been an employee of the Manager since July 2014.
SARAH S. KELLEHER, Vice President and Assistant Secretary since April 2014.
Managing Counsel of BNY Mellon since December 2017, from March 2013 to December 2017, Senior Counsel of BNY Mellon. She is an officer of 63 investment companies (comprised of 149 portfolios) managed by the Manager. She is 43 years old and has been an employee of the Manager since March 2013.
JEFF PRUSNOFSKY, Vice President and Assistant Secretary since August 2005.
Senior Managing Counsel of BNY Mellon, and an officer of 63 investment companies (comprised of 149 portfolios) managed by the Manager. He is 53 years old and has been an employee of the Manager since October 1990.
NATALYA ZELENSKY, Vice President and Assistant Secretary since March 2017.
Counsel of BNY Mellon since May 2016; Attorney at Wildermuth Endowment Strategy Fund/Wildermuth Advisory, LLC from November 2015 until May 2016; Assistant General Counsel at RCS Advisory Services from July 2014 until November 2015; Associate at Sutherland, Asbill & Brennan from January 2013 until January 2014. She is an officer of 63 investment companies (comprised of 149 portfolios) managed by Dreyfus. She is 33 years old and has been an employee of the Manager since May 2016.
JAMES WINDELS, Treasurer since November 2001.
Director – Mutual Fund Accounting of the Manager, and an officer of 63 investment companies (comprised of 149 portfolios) managed by the Manager. He is 60 years old and has been an employee of the Manager since April 1985.
31
OFFICERS OF THE FUND (Unaudited) (continued)
GAVIN C. REILLY, Assistant Treasurer since December 2005.
Tax Manager of the Investment Accounting and Support Department of the Manager, and an officer of 63 investment companies (comprised of 149 portfolios) managed by the Manager. He is 50 years old and has been an employee of the Manager since April 1991.
ROBERT S. ROBOL, Assistant Treasurer since December 2002.
Senior Accounting Manager – Dreyfus Financial Reporting of the Manager, and an officer of 63 investment companies (comprised of 149 portfolios) managed by the Manager. He is 54 years old and has been an employee of the Manager since October 1988.
ROBERT SALVIOLO, Assistant Treasurer since July 2007.
Senior Accounting Manager – Equity Funds of the Manager, and an officer of 63 investment companies (comprised of 149 portfolios) managed by the Manager. He is 51 years old and has been an employee of the Manager since June 1989.
ROBERT SVAGNA, Assistant Treasurer since December 2002.
Senior Accounting Manager – Fixed Income and Equity Funds of the Manager, and an officer of 63 investment companies (comprised of 149 portfolios) managed by the Manager. He is 51 years old and has been an employee of the Manager since November 1990.
JOSEPH W. CONNOLLY, Chief Compliance Officer since October 2004.
Chief Compliance Officer of the Manager, the Dreyfus Family of Funds and BNY Mellon Funds Trust (63 investment companies, comprised of 149 portfolios). He is 61 years old and has served in various capacities with the Manager since 1980, including manager of the firm’s Fund Accounting Department from 1997 through October 2001.
CARIDAD M. CAROSELLA, Anti-Money Laundering Compliance Officer since January 2016.
Anti-Money Laundering Compliance Officer of the Dreyfus Family of Funds and BNY Mellon Funds Trust since January 2016; from May 2015 to December 2015, Interim Anti-Money Laundering Compliance Officer of the Dreyfus Family of Funds and BNY Mellon Funds Trust and the Distributor; from January 2012 to May 2015, AML Surveillance Officer of the Distributor and from 2007 to December 2011, Financial Processing Manager of the Distributor. She is an officer of 57 investment companies (comprised of 143 portfolios) managed by the Manager. She is 50 years old and has been an employee of the Distributor since 1997.
32
NOTES
33
Dreyfus Tax Managed Growth Fund
200 Park Avenue
New York, NY 10166
Investment Adviser
The Dreyfus Corporation
200 Park Avenue
New York, NY 10166
Sub-Investment Adviser
Fayez Sarofim & Co.
Two Houston Center
Suite 2907
909 Fannin Street
Houston, TX 77010
Custodian
The Bank of New York Mellon
240 Greenwich Street
New York, NY 10286
Transfer Agent &
Dividend Disbursing Agent
Dreyfus Transfer, Inc.
200 Park Avenue
New York, NY 10166
Distributor
MBSC Securities Corporation
200 Park Avenue
New York, NY 10166
| | |
Ticker Symbols: | Class A: DTMGX Class C: DPTAX Class I: DPTRX |
Telephone Call your financial representative or 1-800-DREYFUS
Mail The Dreyfus Family of Funds, 144 Glenn Curtiss Boulevard, Uniondale, NY 11556-0144
E-mail Send your request to info@dreyfus.com
Internet Information can be viewed online or downloaded at www.dreyfus.com
The fund files its complete schedule of portfolio holdings with the Securities and Exchange Commission (“SEC”) for the first and third quarters of each fiscal year on Form N-Q. The fund’s Forms N-Q are available on the SEC’s website at www.sec.gov.
A description of the policies and procedures that the fund uses to determine how to vote proxies relating to portfolio securities and information regarding how the fund voted these proxies for the most recent 12-month period ended June 30 is available at www.dreyfus.com and on the SEC’s website at www.sec.gov and without charge, upon request, by calling 1-800-DREYFUS.
| | |
© 2018 MBSC Securities Corporation
0149AR1018 | 
|
Dreyfus Unconstrained Bond Fund
| | | |

| | ANNUAL REPORT October 31, 2018 |
| |
Save time. Save paper. View your next shareholder report online as soon as it’s available. Log into www.dreyfus.com and sign up for Dreyfus eCommunications. It’s simple and only takes a few minutes. |
| |
The views expressed in this report reflect those of the portfolio manager(s) only through the end of the period covered and do not necessarily represent the views of Dreyfus or any other person in the Dreyfus organization. Any such views are subject to change at any time based upon market or other conditions and Dreyfus disclaims any responsibility to update such views. These views may not be relied on as investment advice and, because investment decisions for a Dreyfus fund are based on numerous factors, may not be relied on as an indication of trading intent on behalf of any Dreyfus fund. |
| |
Not FDIC-Insured • Not Bank-Guaranteed • May Lose Value |
Contents
THE FUND
FOR MORE INFORMATION
Back Cover
| | | | |
| |
Dreyfus Unconstrained Bond Fund
| | The Fund |
A LETTER FROM THE PRESIDENT OF DREYFUS
Dear Shareholder:
We are pleased to present this annual report for Dreyfus Unconstrained Bond Fund, covering the 12-month period from November 1, 2017 through October 31, 2018. For information about how the fund performed during the reporting period, as well as general market perspectives, we provide a Discussion of Fund Performance on the pages that follow.
Markets began the reporting period on solid footing as major global economies experienced above-trend growth across the board. In the United States, the Federal Reserve continued to move away from its accommodative monetary policy while other major central banks also began to consider monetary tightening. In the equity markets, both U.S. and non-U.S. markets enjoyed an upward trend, though investor concerns about volatility and inflation later began to weigh on returns. Interest rates rose across the curve, putting pressure on bond prices.
Later in the reporting period, global growth trends began to diverge. While a strong economic performance continued to bolster U.S. equity markets, slower growth and political concerns pressured markets in the Eurozone. Emerging markets also came under pressure as weakness in their currencies added to investors’ uneasiness. Fixed income markets continued to struggle as interest rates rose; the yield on the benchmark 10-year Treasury bond surged late in the reporting period, but growing investor concerns about global growth helped keep it from rising further.
Despite continuing doubts regarding trade, U.S. inflationary pressures, and global growth, we are optimistic that the U.S. economy will remain strong in the near term. However, we will stay attentive to signs that signal potential changes on the horizon. As always, we encourage you to discuss the risks and opportunities of today’s investment environment with your financial advisor.
Thank you for your continued confidence and support.
Sincerely,

Renee Laroche-Morris
President
The Dreyfus Corporation
November 15, 2018
2
DISCUSSION OF FUND PERFORMANCE (Unaudited)
For the period from November 1, 2017 through October 31, 2018, as provided by David Leduc, CFA, Brendan Murphy, CFA, and Scott Zaleski, CFA, Portfolio Managers
Market and Fund Performance Overview
For the 12-month period ended October 31, 2018, Dreyfus Unconstrained Bond Fund’s Class A shares produced a total return of -3.57%, Class C shares returned -4.37%, Class I shares returned -3.37%, and Class Y shares returned -3.42%.1 In comparison, the FTSE One-Month U.S. Treasury Bill Index (the “Index”) achieved a total return of 1.62% for the same period.2
U.S. and international bonds generally lost value over the reporting period, due to rising interest rates, geopolitical tensions, and a strengthening dollar. The fund underperformed the Index, mainly due to emerging-markets exposure.
On July 31, 2018, the Citi One-Month U.S. Treasury Bill Index was renamed FTSE One-Month U.S. Treasury Bill Index.
The Fund’s Investment Approach
The fund seeks to maximize total return through capital appreciation and income. To pursue its goal, the fund normally invests at least 80% of its net assets, plus any borrowings for investment purposes, in fixed-income securities. The fund’s portfolio managers typically allocate the fund’s assets across the following sectors of the fixed-income market: (i) the below-investment-grade (high-yield) sector, (ii) the U.S. government, investment-grade corporate, mortgage- and asset-backed sectors, (iii) the foreign debt securities of the developed markets sector, and (iv) the foreign debt securities of the emerging-markets sector.
The fund is managed using a blend of macroeconomic, quantitative, and fundamental analysis. Through security selection across fixed-income asset classes and sectors, countries and currencies, the portfolio managers seek to construct a portfolio that will produce absolute returns with low correlation with, and less volatility than, major markets over the long term.
Interest Rate Volatility, Growth Disparities, and a Strong Dollar Drive Markets
In general, bond market performance, with the exception of corporate high-yield debt, was modestly negative during the year. In late 2017, the U.S. Federal Reserve (The “Fed”) began to unwind its balance sheet by selling Treasuries and mortgage-backed securities. It also began down a path of well-projected and predictable, 25-basis point rate hikes. Longer-term rates also rose during this time. The Eurozone and Japan were reporting positive economic advances and began discussions around reducing their stimulus programs. U.S. corporate and emerging market debt outperformed. The globe was still in its period of synchronized, strong growth.
Tightening labor markets led to concerns over inflationary pressures, and while the US economy continued to strengthen, other developed economies started to slow. Debt spreads widened and corporates and emerging-market debt gave up much of their earlier return. The
3
DISCUSSION OF FUND PERFORMANCE (Unaudited) (continued)
volatility sparked concern, triggering a flight to quality which moderated the rise in long term US Treasury rates. Despite the sell-off in EM and investment grade corporate bonds, high yield debt continued its strong performance. At the end of the 12 months, investment-grade corporate debt lagged Treasuries. Emerging-market debt did not rebound after the February volatility, and continued to deteriorate throughout the period, spurred on by a strengthening U.S. dollar, concerns over trade disputes, and political and financial distress upheaval in Turkey and Argentina. Concerns around Brexit, Italy, and U.S. midterm elections put downward pressure on global corporate bond prices, despite strong U.S. corporate earnings and above trend economic growth.
Emerging-Markets Exposure Constrained Fund Performance
The fund’s performance, compared to the Index, was undermined during the reporting period by both local and hard currency emerging market bonds. Specifically, the debt of Argentina and Turkey, but also several other emerging-markets countries. Duration positioning also detracted from relative results. As the fund held, on average, a longer duration than the cash benchmark which was a headwind to performance during the period as short rates rose. In addition, an allocation to corporate bonds, and in particular, General Electric preferred bonds was a drag on performance. The company struggled throughout much of the period due to management changes and poor earnings.
On a more positive note, exposure to global Inflation Protected Securities and asset-backed securities helped performance. The short duration nature of asset-backed securities, in conjunction with strong consumer performance over the period provided protection against market volatility. In addition, an allocation to high-yield corporate debt was beneficial. U.S. high-yield corporate debt was one of the few fixed income asset classes to have positive performance, albeit modest, during the period. Of the credits selected, Tenet Healthcare and Teva Pharmaceutical Industries were among the top contributors.
At times during the reporting period, the fund employed option contracts, futures contracts, and forward contracts to manage its interest-rate and currency exposures.
An Opportunistic Investment Posture
Despite the current climate in Europe, we currently expect above trend global economic growth to persist. As a result, central banks should continue to move away from the accommodative monetary policies of the past decade, and short-term interest rates appear likely to rise in most developed markets. We also believe inflation will start to build, as a result of price increases due to pressures from a removal of slack in the labor force, the closing of output gaps and increased costs due to the expansion of tariffs. We also have taken note of recent heightened volatility in the emerging markets, in response to political developments in the U.S. and abroad.
In this environment, we look for opportunities to reduce risk in the portfolio, while maintaining positioning that will benefit from long-term growth of international markets. We like inflation-protected securities as a hedge against inflation and volatility. We believe the emerging-markets’ fundamentals seem solid, despite recent upsets, and maintain an overweight in attractively-valued higher-quality sovereigns and corporate bonds. As we believe we’ve seen a peak in growth and earnings, we will utilize bouts of market strength to move up in quality in corporate bonds. We are short US dollar exposure and duration as we
4
believe expanding twin deficits will put pressure on both the currency and rates. We reduced high-yield exposure in the portfolio, due to concerns regarding absolute spread levels in the asset class. We also continue to think that supply and demand factors make agency mortgage-backed securities relatively unattractive.
November 15, 2018
1 Total return includes reinvestment of dividends and any capital gains paid, and does not take into consideration the maximum initial sales charge in the case of Class A shares, or the applicable contingent deferred sales charge imposed on redemptions in the case of Class C shares. Had these charges been reflected, returns would have been lower. Class I and Class Y shares are not subject to any initial or deferred sales charges. Share price, yield, and investment return fluctuate such that upon redemption, fund shares may be worth more or less than their original cost. Return figures provided reflect the absorption of certain fund expenses by The Dreyfus Corporation pursuant to an agreement in effect through March 1, 2019, at which time it may be extended, modified, or terminated. Past performance is no guarantee of future results.
2 Source: Lipper Inc. — The FTSE One-Month U.S. Treasury Bill Index consists of the last one-month Treasury bill month-end rates. The FTSE One-Month U.S. Treasury Bill Index measures return equivalents of yield averages. The instruments are not marked to market. Investors cannot invest directly in any index.
Bonds are subject generally to interest-rate, credit, liquidity, and market risks, to varying degrees, all of which are more fully described in the fund’s prospectus. Generally, all other factors being equal, bond prices are inversely related to interest-rate changes, and rate increases can cause price declines.
High-yield bonds are subject to increased credit risk and are considered speculative in terms of the issuer’s perceived ability to continue making interest payments on a timely basis and to repay principal upon maturity.
Foreign bonds are subject to special risks, including exposure to currency fluctuations, changing political and economic conditions, and potentially less liquidity. These risks are generally greater with emerging market countries than with more economically and politically established foreign countries.
Investments in foreign currencies are subject to the risk that those currencies will decline in value relative to the U.S. dollar, or, in the case of hedged positions, that the U.S. dollar will decline relative to the currency being hedged. Currency rates in foreign countries may fluctuate significantly over short periods of time. A decline in the value of foreign currencies relative to the U.S. dollar will reduce the value of securities held by the fund and denominated in those currencies. The use of leverage may magnify the fund’s gains or losses. For derivatives with a leveraging component, adverse changes in the value or level of the underlying asset can result in a loss that is much greater than the original investment in the derivative.
The fund may use derivative instruments, such as options, futures, options on futures, forward contracts, swaps (including credit default swaps on corporate bonds and asset-backed securities), options on swaps, and other credit derivatives. A small investment in derivatives could have a potentially large impact on the fund’s performance. The use of derivatives involves risks different from, or possibly greater than, the risks associated with investing directly in the underlying assets.
5
FUND PERFORMANCE (Unaudited)
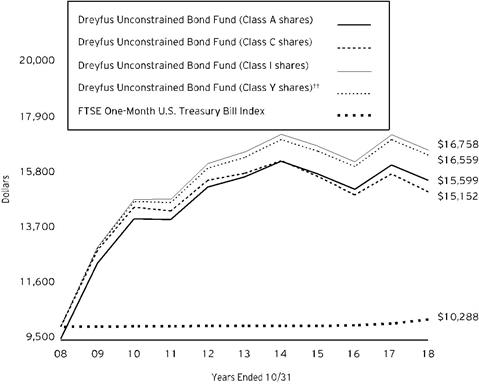
Comparison of change in value of $10,000 investment in Dreyfus Unconstrained Bond Fund Class A shares, Class C shares, Class I shares and Class Y shares and the FTSE One-Month U.S. Treasury Bill Index (the “Index”)
† Source: Lipper Inc.
†† The total return figures presented for Class Y shares of the fund reflect the performance of the fund’s Class A shares for the period prior to 7/1/13 (the inception date for Class Y shares), not reflecting the applicable sales charges for Class A shares.
Past performance is not predictive of future performance.
The above graph compares a $10,000 investment made in each of the Class A, Class C, Class I and Class Y shares of Dreyfus Unconstrained Bond Fund on 10/31/08 to a $10,000 investment made in the Index on that date. All dividends and capital gain distributions are reinvested.
The fund’s performance shown in the line graph above takes into account the maximum initial sales charge on Class A shares and all other applicable fees and expenses on all classes. The Index consists of the last one-month Treasury bill month-end rates. The Index measures returns equivalent of yield averages. The instruments are not marked to market. Unlike a mutual fund, the Index is not subject to charges, fees and other expenses. Investors cannot invest directly in any index. Further information relating to fund performance, including expense reimbursements, if applicable, is contained in the Financial Highlights section of the prospectus and elsewhere in this report.
6
| | | | | | | |
Average Annual Total Returns as of 10/31/18 | | |
| Inception
Date | 1 Year | 5 Years | | 10 Years |
Class A shares | | | | |
with maximum sales charge (4.5%) | 7/11/06 | -7.92% | -1.09% | | 4.55% | |
without sales charge | 7/11/06 | -3.57% | -0.17% | | 5.03% | |
Class C shares | | | | |
with applicable redemption charge † | 7/11/06 | -5.29% | -0.91% | | 4.24% | |
without redemption | 7/11/06 | -4.37% | -0.91% | | 4.24% | |
Class I shares | 7/11/06 | -3.37% | 0.09% | | 5.30% | |
Class Y shares | 7/1/13 | -3.42% | 0.11% | | 5.17% | †† |
FTSE One-Month U.S. Treasury Bill Index | | 1.62% | 0.50% | | 0.28% | |
† The maximum contingent deferred sales charge for Class C shares is 1% for shares redeemed within one year of the date of purchase.
†† The total return performance figures presented for Class Y shares of the fund reflect the performance of the fund’s Class A shares for the period prior to 7/1/13 (the inception date for Class Y shares), not reflecting the applicable sales charges for Class A shares.
The performance data quoted represents past performance, which is no guarantee of future results. Share price and investment return fluctuate and an investor’s shares may be worth more or less than original cost upon redemption. Current performance may be lower or higher than the performance quoted. Go to Dreyfus.com for the fund’s most recent month-end returns.
The fund’s performance shown in the graph and table does not reflect the deduction of taxes that a shareholder would pay on fund distributions or the redemption of fund shares. In addition to the performance of Class A shares shown with and without a maximum sales charge, the fund’s performance shown in the table takes into account all other applicable fees and expenses on all classes.
7
UNDERSTANDING YOUR FUND’S EXPENSES (Unaudited)
As a mutual fund investor, you pay ongoing expenses, such as management fees and other expenses. Using the information below, you can estimate how these expenses affect your investment and compare them with the expenses of other funds. You also may pay one-time transaction expenses, including sales charges (loads) and redemption fees, which are not shown in this section and would have resulted in higher total expenses. For more information, see your fund’s prospectus or talk to your financial adviser.
Review your fund’s expenses
The table below shows the expenses you would have paid on a $1,000 investment in Dreyfus Unconstrained Bond Fund from May 1, 2018 to October 31, 2018. It also shows how much a $1,000 investment would be worth at the close of the period, assuming actual returns and expenses.
| | | | | | | | | | | | |
Expenses and Value of a $1,000 Investment | | |
assuming actual returns for the six months ended October 31, 2018 |
| | | | | | | | |
| | | | Class A | Class C | Class I | Class Y |
Expenses paid per $1,000† | | $4.45 | | $8.14 | | $3.22 | | $3.22 |
Ending value (after expenses) | | $961.80 | | $958.30 | | $962.60 | | $962.80 |
COMPARING YOUR FUND’S EXPENSES
WITH THOSE OF OTHER FUNDS (Unaudited)
Using the SEC’s method to compare expenses
The Securities and Exchange Commission (“SEC”) has established guidelines to help investors assess fund expenses. Per these guidelines, the table below shows your fund’s expenses based on a $1,000 investment, assuming a hypothetical 5% annualized return. You can use this information to compare the ongoing expenses (but not transaction expenses or total cost) of investing in the fund with those of other funds. All mutual fund shareholder reports will provide this information to help you make this comparison. Please note that you cannot use this information to estimate your actual ending account balance and expenses paid during the period.
| | | | | | | | | | | | |
Expenses and Value of a $1,000 Investment | | |
assuming a hypothetical 5% annualized return for the six months ended October 31, 2018 |
| | | | | | | | |
| | | | Class A | Class C | Class I | Class Y |
Expenses paid per $1,000† | | $4.58 | | $8.39 | | $3.31 | | $3.31 |
Ending value (after expenses) | | $1,020.67 | | $1,016.89 | | $1,021.93 | | $1,021.93 |
† Expenses are equal to the fund’s annualized expense ratio of .90% for Class A, 1.65% for Class C, .65% for Class I and .65% for Class Y, multiplied by the average account value over the period, multiplied by 184/365 (to reflect the one-half year period).
8
STATEMENT OF INVESTMENTS
October 31, 2018
| | | | | | | | | | |
| |
Description | Coupon
Rate (%) | | Maturity
Date | | Principal
Amount ($) | a | Value ($) | |
Bonds and Notes - 94.9% | | | | | |
Aerospace & Defense - .2% | | | | | |
United Technologies,
Sr. Unscd. Bonds | EUR | 2.15 | | 5/18/2030 | | 100,000 | | 114,330 | |
Agriculture - .2% | | | | | |
BAT International Finance,
Gtd. Notes | EUR | 2.25 | | 1/16/2030 | | 100,000 | | 109,211 | |
Asset-Backed Certificates - 5.0% | | | | | |
American Homes 4 Rent,
Ser. 2015-SFR1 | | 5.64 | | 4/17/2052 | | 425,000 | b | 443,180 | |
American Homes 4 Rent Trust,
Ser. 2014-SFR3, Cl. A | | 3.68 | | 12/17/2036 | | 139,718 | b | 138,164 | |
Conn's Receivables Funding II,
Ser. 2017-B, Cl. A | | 2.73 | | 3/15/2020 | | 25,274 | b | 25,269 | |
Dell Equipment Finance Trust,
Ser. 2016-1, Cl. D | | 3.24 | | 7/22/2022 | | 275,000 | b | 275,083 | |
Dell Equipment Finance Trust,
Ser. 2017-2, Cl. B | | 2.47 | | 10/24/2022 | | 100,000 | b | 98,533 | |
Dell Equipment Finance Trust,
Ser. 2018-2 | | 3.72 | | 10/22/2023 | | 125,000 | b | 125,219 | |
Invitation Homes Trust,
Ser. 2017-SFR2, Cl. B, 1 Month LIBOR + 1.15% | | 3.44 | | 12/17/2036 | | 400,000 | b,c | 403,291 | |
Invitation Homes Trust,
Ser. 2018-SFR3, 1 Month LIBOR + 0.01% | | 3.28 | | 7/17/2037 | | 124,819 | b,c | 124,901 | |
Marlette Funding Trust,
Ser. 2017-1A, Cl. A | | 2.83 | | 3/15/2024 | | 25,074 | b | 25,067 | |
Prosper Marketplace Issuance Trust,
Ser. 2017-1A, Cl. A | | 2.56 | | 6/15/2023 | | 5,645 | b | 5,643 | |
SOFI Consumer Loan Program Trust,
Ser. 17-1, Cl. A | | 3.28 | | 1/26/2026 | | 326,400 | b | 325,738 | |
Springleaf Funding Trust,
Ser. 2015-AA, Cl. B | | 3.62 | | 11/15/2024 | | 350,000 | b | 348,818 | |
Tricon American Homes,
Ser. 2017-SFR2, Cl. B | | 3.28 | | 1/17/2036 | | 300,000 | b | 287,664 | |
| | 2,626,570 | |
Asset-Backed Ctfs./Auto Receivables - 12.8% | | | | | |
AmeriCredit Automobile Receivable Trust,
Ser. 2017-4, Cl. C | | 2.60 | | 9/18/2023 | | 575,000 | | 561,707 | |
Americredit Automobile Receivables Trust,
Ser. 2016-4, Cl. C | | 2.74 | | 12/8/2022 | | 100,000 | | 97,898 | |
BMW Canada Auto Trust,
Ser. 18-1A, Cl. A3 | CAD | 2.82 | | 4/20/2023 | | 325,000 | b | 245,266 | |
9
STATEMENT OF INVESTMENTS (continued)
| | | | | | | | | | |
| |
Description | Coupon
Rate (%) | | Maturity
Date | | Principal
Amount ($) | a | Value ($) | |
Bonds and Notes - 94.9% (continued) | | | | | |
Asset-Backed Ctfs./Auto Receivables - 12.8% (continued) | | | | | |
Canadian Pacer Auto Receivables Trust,
Ser. 2017-1A, Cl. A4 | | 2.29 | | 1/19/2022 | | 250,000 | b | 245,908 | |
CarMax Auto Owner Trust,
Ser. 2018-1, Cl. D | | 3.37 | | 7/15/2024 | | 45,000 | | 44,091 | |
Drive Auto Receivables Trust,
Ser. 2016-CA, Cl. D | | 4.18 | | 3/15/2024 | | 500,000 | b | 504,287 | |
Drive Auto Receivables Trust,
Ser. 2017-3, Cl. C | | 2.80 | | 7/15/2022 | | 250,000 | | 249,220 | |
Drive Auto Receivables Trust,
Ser. 2018-1, Cl. C | | 3.22 | | 3/15/2023 | | 475,000 | | 473,866 | |
DT Auto Owner Trust,
Ser. 2018-1 | | 3.04 | | 1/18/2022 | | 250,000 | b | 249,264 | |
DT Auto Owner Trust,
Ser. 2018-2 | | 3.67 | | 3/15/2024 | | 200,000 | b | 199,763 | |
Exeter Automobile Receivables Trust,
Ser. 2018-1A, Cl. B | | 2.75 | | 4/15/2022 | | 250,000 | b | 248,675 | |
Ford Auto Securitization Trust,
Ser. 17-R5A, Cl. A3 | CAD | 2.38 | | 3/15/2023 | | 350,000 | b | 261,169 | |
Ford Auto Securitization Trust,
Ser. 18-AA, Cl. A3 | CAD | 2.71 | | 9/15/2023 | | 235,000 | b | 176,245 | |
Ford Auto Securitization Trust,
Ser. 18-BA, Cl. A3 | CAD | 2.84 | | 1/15/2024 | | 225,000 | b | 168,814 | |
GM Financial Automobile Leasing Trust,
Ser. 2018-3 | | 3.48 | | 7/20/2022 | | 125,000 | | 124,843 | |
GM Financial Automobile Leasing Trust,
Ser. 2018-3 | | 3.70 | | 7/20/2022 | | 125,000 | | 124,805 | |
GMF Canada Leasing Trust,
Ser. 17-A, Cl. A3 | CAD | 2.47 | | 9/20/2022 | | 250,000 | b | 188,993 | |
Hertz Fleet Lease Funding,
Ser. 2018-1, Cl. A2 | | 3.23 | | 5/10/2032 | | 225,000 | b | 224,616 | |
Mbarc Credit Canada,
Ser. 18-AA, Cl. A3 | CAD | 2.79 | | 1/17/2023 | | 225,000 | b | 170,203 | |
OSCAR US Funding Trust V,
Ser. 2016-2A, Cl. A3 | | 2.73 | | 12/15/2020 | | 240,165 | b | 239,727 | |
OSCAR US Funding Trust VII,
Ser. 17-2A, Cl. A3 | | 2.45 | | 12/10/2021 | | 130,000 | b | 128,234 | |
OSCAR US Funding Trust VII,
Ser. 17-2A, Cl. A4 | | 2.76 | | 12/10/2024 | | 250,000 | b | 244,396 | |
OSCAR US Funding Trust VIII,
Ser. 18-1A, Cl. A4 | | 3.50 | | 5/12/2025 | | 300,000 | b | 299,179 | |
Santander Drive Auto Receivable Trust,
Ser. 2018-2, Cl. C | | 3.35 | | 7/17/2023 | | 150,000 | | 149,025 | |
Santander Drive Auto Receivables Trust,
Ser. 2016-3 | | 2.80 | | 8/15/2022 | | 100,000 | | 98,828 | |
10
| | | | | | | | | | |
| |
Description | Coupon
Rate (%) | | Maturity
Date | | Principal
Amount ($) | a | Value ($) | |
Bonds and Notes - 94.9% (continued) | | | | | |
Asset-Backed Ctfs./Auto Receivables - 12.8% (continued) | | | | | |
Santander Drive Auto Receivables Trust,
Ser. 2018-1, Cl. D | | 3.32 | | 3/15/2024 | | 200,000 | | 196,074 | |
Santander Drive Auto Receivables Trust,
Ser. 2018-3 | | 4.07 | | 8/15/2024 | | 150,000 | | 149,697 | |
Silver Arrow Canada,
Ser. 18-1A, Cl. A3 | CAD | 3.17 | | 8/15/2025 | | 210,000 | b | 159,520 | |
Tesla Auto Lease Trust,
Ser. 2018-A, Cl. D | | 3.30 | | 5/20/2020 | | 225,000 | b | 223,803 | |
Westlake Automobile Receivables Trust,
Ser. 2018-2 | | 3.20 | | 1/16/2024 | | 100,000 | b | 99,778 | |
Westlake Automobile Receivables Trust,
Ser. 2018-2 | | 3.50 | | 1/16/2024 | | 200,000 | b | 199,587 | |
| | 6,747,481 | |
Asset-Backed Ctfs./Credit Cards - .6% | | | | | |
Master Credit Card Trust II,
Ser. 2018-1A, Cl. A 1 Month LIBOR + 0.49% | | 2.67 | | 7/21/2024 | | 160,000 | b,c | 160,390 | |
Trillium Credit Card Trust II,
Ser. 2018-2A, Cl. A, 1 Month LIBOR + 0.35% | | 2.63 | | 9/26/2023 | | 175,000 | b,c | 175,032 | |
| | 335,422 | |
Banks - 5.5% | | | | | |
Bank of America,
Sr. Unscd. Notes | | 3.37 | | 1/23/2026 | | 225,000 | | 214,688 | |
Bank of America,
Sub. Notes | | 4.25 | | 10/22/2026 | | 100,000 | | 97,214 | |
Barclays,
Jr. Unscd. Bonds | | 7.88 | | 12/31/2049 | | 200,000 | | 206,500 | |
Barclays,
Sr. Unscd. Notes | | 4.97 | | 5/16/2029 | | 325,000 | | 316,058 | |
Citigroup,
Sub. Notes | | 4.30 | | 11/20/2026 | | 160,000 | | 155,638 | |
Credit Agricole,
Sr. Unscd. Bonds | EUR | 2.63 | | 3/17/2027 | | 175,000 | | 204,490 | |
Credit Suisse Group,
Sr. Unscd. Notes | | 4.28 | | 1/9/2028 | | 275,000 | b | 263,887 | |
Development Bank of Japan,
Sr. Unscd. Notes | | 3.13 | | 9/6/2023 | | 200,000 | b | 198,025 | |
Goldman Sachs Group,
Sr. Unscd. Notes | | 3.50 | | 11/16/2026 | | 275,000 | | 257,243 | |
HSBC Holdings,
Jr. Unscd. Bonds | | 6.25 | | 12/31/2049 | | 250,000 | | 243,125 | |
11
STATEMENT OF INVESTMENTS (continued)
| | | | | | | | | | |
| |
Description | Coupon
Rate (%) | | Maturity
Date | | Principal
Amount ($) | a | Value ($) | |
Bonds and Notes - 94.9% (continued) | | | | | |
Banks - 5.5% (continued) | | | | | |
Lloyds Banking Group,
Sr. Unscd. Notes | | 3.75 | | 1/11/2027 | | 275,000 | | 254,926 | |
Morgan Stanley,
Sub. Notes | | 3.95 | | 4/23/2027 | | 75,000 | | 70,992 | |
Royal Bank of Scotland Group,
Sr. Unscd. Notes | | 3.88 | | 9/12/2023 | | 325,000 | | 313,019 | |
Wells Fargo & Co.,
Sub. Notes | | 4.30 | | 7/22/2027 | | 115,000 | | 113,142 | |
| | 2,908,947 | |
Chemicals - 1.1% | | | | | |
OCP Group,
Sr. Unscd. Notes | | 6.88 | | 4/25/2044 | | 200,000 | | 209,505 | |
SABIC Capital II,
Gtd. Bonds | | 4.00 | | 10/10/2023 | | 200,000 | b | 198,120 | |
SASOL Financing USA,
Gtd. Notes | | 5.88 | | 3/27/2024 | | 200,000 | | 201,727 | |
| | 609,352 | |
Commercial & Professional Services - .4% | | | | | |
DP World,
Sr. Unscd. Notes | | 6.85 | | 7/2/2037 | | 170,000 | | 190,008 | |
Commercial Mortgage Pass-Through Ctfs. - 3.1% | | | | | |
Cobalt CMBS Commercial Mortgage Trust,
Ser. 2007-C3, Cl. AJ | | 6.01 | | 5/15/2046 | | 119,222 | | 119,707 | |
Commercial Mortgage Trust,
Ser. 2017-DLTA, Cl. A | | 3.13 | | 8/13/2035 | | 450,000 | b | 450,825 | |
Freddie Mac Multifamily Structured Pass Through Certificates,
Ser. KC02, Cl. A2 | | 3.37 | | 7/25/2025 | | 100,000 | d | 98,531 | |
Freddie Mac Multifamily Structured Pass Through Certificates,
Ser. KL3W, Cl. AFLW | | 2.71 | | 8/25/2025 | | 140,000 | d | 140,209 | |
Hyatt Hotel Portfolio Trust,
Ser. 2017-HYT2, Cl. B | | 3.24 | | 8/9/2032 | | 625,000 | b | 624,373 | |
Intown Hotel Portfolio Trust,
Ser. 2018-STAY, Cl. A, 1 Month LIBOR+.7 | | 2.98 | | 1/15/2033 | | 125,000 | b,c | 125,045 | |
Intown Hotel Portfolio Trust,
Ser. 2018-STAY, Cl. B | | 3.33 | | 1/15/2033 | | 100,000 | b | 99,879 | |
| | 1,658,569 | |
Consumer Discretionary - .4% | | | | | |
Sands China,
Sr. Unscd. Notes | | 4.60 | | 8/8/2023 | | 200,000 | b | 197,759 | |
Energy - 3.4% | | | | | |
Abu Dhabi Crude Oil Pipeline,
Sr. Scd. Bonds | | 4.60 | | 11/2/2047 | | 200,000 | b | 189,798 | |
12
| | | | | | | | | | |
| |
Description | Coupon
Rate (%) | | Maturity
Date | | Principal
Amount ($) | a | Value ($) | |
Bonds and Notes - 94.9% (continued) | | | | | |
Energy - 3.4% (continued) | | | | | |
Andeavor Logistics,
Gtd. Notes | | 3.50 | | 12/1/2022 | | 75,000 | | 73,299 | |
Cheniere Corpus Christi Holdings,
Sr. Scd. Notes | | 5.13 | | 6/30/2027 | | 95,000 | | 93,337 | |
Cheniere Energy Partners,
Notes | | 5.25 | | 10/1/2025 | | 75,000 | | 73,781 | |
Diamondback Energy,
Gtd. Notes | | 4.75 | | 11/1/2024 | | 45,000 | | 43,875 | |
Ecopetrol,
Sr. Unscd. Notes | | 5.88 | | 5/28/2045 | | 145,000 | | 138,584 | |
Enbridge,
Unscd. Sub. Notes | | 5.50 | | 7/15/2077 | | 225,000 | | 200,574 | |
Energy Transfer Operating,
Jr. Sub. Notes, Ser. A | | 6.25 | | 12/31/2049 | | 95,000 | | 89,003 | |
Energy Transfer Operating,
Sr. Unscd. Notes | | 4.20 | | 4/15/2027 | | 100,000 | | 94,521 | |
EQT,
Sr. Unscd. Notes | | 3.00 | | 10/1/2022 | | 50,000 | | 48,014 | |
Gazprom OAO Via Gaz Capital,
Sr. Unscd. Bonds | EUR | 2.50 | | 3/21/2026 | | 250,000 | | 275,189 | |
Kinder Morgan,
Gtd. Notes | | 4.30 | | 6/1/2025 | | 100,000 | | 99,612 | |
Petrobras Global Finance,
Gtd. Notes | | 7.25 | | 3/17/2044 | | 280,000 | | 271,075 | |
Sunoco Logistics Partners Operations,
Gtd. Notes | | 4.00 | | 10/1/2027 | | 125,000 | | 115,735 | |
| | 1,806,397 | |
Food Products - .6% | | | | | |
Kraft Heinz Foods,
Gtd. Notes | EUR | 2.25 | | 5/25/2028 | | 280,000 | | 317,144 | |
Foreign/Governmental - 40.0% | | | | | |
Arab Petroleum Investments,
Sr. Unscd. Notes | | 4.13 | | 9/18/2023 | | 225,000 | b | 225,440 | |
Argentine Government,
Sr. Unscd. Bonds | EUR | 5.25 | | 1/15/2028 | | 550,000 | | 481,007 | |
Argentine Government,
Sr. Unscd. Bonds | | 6.88 | | 1/26/2027 | | 225,000 | | 188,916 | |
Argentine Government,
Sr. Unscd. Notes | ARS | 5.83 | | 12/31/2033 | | 2,602,332 | e | 82,706 | |
Argentine Government,
Sr. Unscd. Notes | | 8.28 | | 12/31/2033 | | 245,357 | | 212,847 | |
Banque Ouest Africaine de Developpement,
Sr. Unscd. Notes | | 5.50 | | 5/6/2021 | | 425,000 | | 433,500 | |
Bonos de la Nacion Argentina con Ajuste por CER,
Unscd. Bonds | ARS | 3.75 | | 2/8/2019 | | 2,391,844 | e,f | 67,143 | |
13
STATEMENT OF INVESTMENTS (continued)
| | | | | | | | | | |
| |
Description | Coupon
Rate (%) | | Maturity
Date | | Principal
Amount ($) | a | Value ($) | |
Bonds and Notes - 94.9% (continued) | | | | | |
Foreign/Governmental - 40.0% (continued) | | | | | |
Bonos de la Tesoreria de la Republica en pesos,
Unscd. Bonds | CLP | 4.50 | | 3/1/2021 | | 360,000,000 | | 524,061 | |
Brazil Notas do Tesouro Nacional,
Ser. F | BRL | 10.00 | | 1/1/2027 | | 3,300,000 | | 888,680 | |
Canadian Government Real Return Bond,
Unscd. Bonds | CAD | 0.50 | | 12/1/2050 | | 413,028 | e | 287,333 | |
Colombian Government,
Sr. Unscd. Notes | | 4.50 | | 3/15/2029 | | 200,000 | | 197,602 | |
Cyprus Government,
Sr. Unscd. Notes | EUR | 4.25 | | 11/4/2025 | | 200,000 | | 261,449 | |
Deutsche Bundesrepublik Inflation Linked Bond,
Unscd. Bonds | EUR | 0.10 | | 4/15/2026 | | 1,015,804 | e | 1,270,930 | |
European Investment Bank,
Sr. Unscd. Notes | AUD | 2.70 | | 1/12/2023 | | 575,000 | | 408,544 | |
German Government,
Bonds | EUR | 2.50 | | 8/15/2046 | | 475,000 | | 735,975 | |
Ghanaian Government,
Sr. Unscd. Notes | | 7.63 | | 5/16/2029 | | 300,000 | b | 287,240 | |
Hellenic Republic Government,
Unscd. Bonds | EUR | 3.90 | | 1/30/2033 | | 575,000 | | 592,434 | |
Hungarian Government,
Sr. Unscd. Bonds | EUR | 1.75 | | 10/10/2027 | | 100,000 | | 114,557 | |
Indonesian Government,
Sr. Unscd. Notes | | 4.35 | | 1/11/2048 | | 300,000 | f | 257,333 | |
International Finance,
Sr. Unscd. Notes | INR | 6.30 | | 11/25/2024 | | 17,590,000 | | 224,118 | |
Ivory Coast Government,
Sr. Unscd. Bonds | EUR | 5.13 | | 6/15/2025 | | 125,000 | b | 139,691 | |
Ivory Coast Government,
Sr. Unscd. Notes | EUR | 5.25 | | 3/22/2030 | | 225,000 | b | 233,890 | |
Japan Bank for International Cooperation,
Gtd. Notes | | 3.38 | | 10/31/2023 | | 350,000 | | 349,466 | |
Japanese Government CPI Linked Bond,
Sr. Unscd. Bonds | JPY | 0.10 | | 3/10/2027 | | 173,047,728 | e | 1,594,981 | |
Japanese Government CPI Linked Bond,
Sr. Unscd. Bonds | JPY | 0.10 | | 3/10/2026 | | 251,744,332 | e | 2,320,327 | |
Kenyan Government,
Sr. Unscd. Notes | | 8.25 | | 2/28/2048 | | 200,000 | b | 183,172 | |
New Zealand Government,
Sr. Unscd. Bonds, Ser. 0925 | NZD | 2.00 | | 9/20/2025 | | 4,025,000 | e | 2,991,678 | |
Provincia de Buenos Aires/Argentina,
Sr. Unscd. Notes | | 9.13 | | 3/16/2024 | | 455,000 | b | 408,367 | |
14
| | | | | | | | | | |
| |
Description | Coupon
Rate (%) | | Maturity
Date | | Principal
Amount ($) | a | Value ($) | |
Bonds and Notes - 94.9% (continued) | | | | | |
Foreign/Governmental - 40.0% (continued) | | | | | |
Provincia de Buenos Aires/Argentina,
Unscd. Bonds, 1 Month BADLAR + 3.83% | ARS | 36.25 | | 5/31/2022 | | 6,000,000 | c | 153,136 | |
Qatari Government,
Sr. Unscd. Notes | | 5.10 | | 4/23/2048 | | 400,000 | | 407,028 | |
Romanian Government,
Sr. Unscd. Notes | EUR | 2.50 | | 2/8/2030 | | 275,000 | b | 292,907 | |
Russian Government,
Bonds, Ser. 6212 | RUB | 7.05 | | 1/19/2028 | | 104,500,000 | | 1,449,948 | |
Saudi Government,
Sr. Unscd. Notes | | 4.63 | | 10/4/2047 | | 325,000 | | 298,988 | |
Senegalese Government,
Sr. Unscd. Bonds | EUR | 4.75 | | 3/13/2028 | | 100,000 | | 105,984 | |
Senegalese Government,
Sr. Unscd. Bonds | EUR | 4.75 | | 3/13/2028 | | 250,000 | b | 264,961 | |
Spanish Government,
Sr. Unscd. Bonds | EUR | 1.50 | | 4/30/2027 | | 250,000 | b | 286,304 | |
Spanish Government,
Sr. Unscd. Bonds | EUR | 2.90 | | 10/31/2046 | | 365,000 | b | 438,698 | |
Ukrainian Government,
Sr. Unscd. Notes | | 4.57 | | 5/31/2040 | | 375,000 | | 193,541 | |
United Kingdom Gilt,
Unscd. Bonds | GBP | 1.50 | | 7/22/2047 | | 1,075,000 | | 1,263,634 | |
| | 21,118,516 | |
Health Care - 1.2% | | | | | |
AbbVie,
Sr. Unscd. Bonds | EUR | 1.38 | | 5/17/2024 | | 325,000 | | 371,932 | |
CVS Health,
Sr. Unscd. Notes | | 4.30 | | 3/25/2028 | | 165,000 | | 161,254 | |
Teva Pharmaceutical Finance Netherlands II,
Gtd. Notes | EUR | 3.25 | | 4/15/2022 | | 100,000 | | 116,944 | |
| | 650,130 | |
Industrials - 1.6% | | | | | |
General Electric,
Jr. Sub. Debs., Ser. D | | 5.00 | | 12/31/2049 | | 900,000 | | 831,375 | |
Information Technology - .1% | | | | | |
Infor US,
Gtd. Notes | | 6.50 | | 5/15/2022 | | 75,000 | | 75,187 | |
Insurance - 1.2% | | | | | |
Allianz Finance II,
Gtd. Notes | EUR | 5.75 | | 7/8/2041 | | 400,000 | | 509,341 | |
Prudential Financial,
Jr. Unscd. Notes | | 4.50 | | 9/15/2047 | | 110,000 | | 100,375 | |
| | 609,716 | |
15
STATEMENT OF INVESTMENTS (continued)
| | | | | | | | | | |
| |
Description | Coupon
Rate (%) | | Maturity
Date | | Principal
Amount ($) | a | Value ($) | |
Bonds and Notes - 94.9% (continued) | | | | | |
Internet Software & Services - .1% | | | | | |
Zayo Group,
Gtd. Notes | | 5.75 | | 1/15/2027 | | 50,000 | b | 49,135 | |
Media - .5% | | | | | |
Comcast,
Gtd. Notes | | 3.70 | | 4/15/2024 | | 120,000 | | 119,677 | |
Cox Communications,
Sr. Unscd. Notes | | 3.35 | | 9/15/2026 | | 150,000 | b | 138,240 | |
| | 257,917 | |
Municipal Bonds - .5% | | | | | |
Autonomous City of Buenos Aires Argentina,
Unscd. Bonds, 1 Month BADLAR + 3.25% | ARS | 38.69 | | 3/29/2024 | | 10,300,000 | c | 260,164 | |
Real Estate - 1.4% | | | | | |
Digital Euro Finco,
Gtd. Bonds | EUR | 2.63 | | 4/15/2024 | | 300,000 | | 358,858 | |
Healthcare Trust of America Holdings,
Gtd. Notes | | 3.75 | | 7/1/2027 | | 170,000 | | 158,882 | |
WPC Eurobond,
Gtd. Bonds | EUR | 2.25 | | 7/19/2024 | | 175,000 | | 202,814 | |
| | 720,554 | |
Technology Hardware & Equipment - .4% | | | | | |
EMC,
Sr. Scd. Notes | | 6.02 | | 6/15/2026 | | 200,000 | b | 207,694 | |
Telecommunication Services - .6% | | | | | |
Sprint,
Gtd. Notes | | 7.88 | | 9/15/2023 | | 95,000 | | 101,650 | |
Sprint Spectrum,
Sr. Scd. Notes | | 4.74 | | 3/20/2025 | | 200,000 | b | 200,250 | |
| | 301,900 | |
U.S. Government Securities - 13.4% | | | | | |
U. S. Treasury Bonds,
Bonds | | 3.13 | | 5/15/2048 | | 425,000 | | 404,140 | |
U. S. Treasury Notes,
Notes | | 2.75 | | 2/15/2028 | | 3,635,000 | | 3,520,838 | |
U.S. Treasury Floating Rate Notes,
3 Month U.S. T-Bill FLAT | | 2.31 | | 1/31/2020 | | 2,600,000 | c | 2,600,533 | |
U.S. Treasury Inflation Protected Securities,
Bonds | | 0.88 | | 2/15/2047 | | 600,616 | e | 539,698 | |
| | 7,065,209 | |
Utilities - .6% | | | | | |
EDP Finance,
Sr. Unscd. Notes | | 3.63 | | 7/15/2024 | | 325,000 | b | 308,471 | |
Total Bonds and Notes
(cost $52,127,599) | | 50,077,158 | |
16
| | | | | | | | | | | | |
| |
Description /Number of Contracts/Counterparty | Exercise
Price | | Expiration Date | | Notional Amount ($) | a | Value ($) | |
Options Purchased - .2% | | | | | |
Call Options - .1% | | | | | |
Australian Dollar,
Contracts 1,550,000 Barclays Capital | AUD | 0.72 | | 12/12/2018 | | 1,550,000 | | 5,957 | |
British Pound,
Contracts 550,000 Citigroup | GBP | 1.35 | | 12/5/2018 | | 550,000 | | 259 | |
Chinese Yuan Renminbi,
Contracts 1,070,000 HSBC | | 6.96 | | 1/18/2019 | | 1,070,000 | | 15,496 | |
South Korean Won Cross Currency,
Contracts 120,500,000 HSBC | JPY | 10.20 | | 1/18/2019 | | 120,500,000 | | 18,673 | |
| | 40,385 | |
Put Options - .1% | | | | | |
Chilean Peso,
Contracts 270,000 J.P. Morgan Securities | | 660.00 | | 1/17/2019 | | 270,000 | | 1,386 | |
Chilean Peso,
Contracts 270,000 Citigroup | | 655.00 | | 12/21/2018 | | 270,000 | | 543 | |
Indian Rupee,
Contracts 550,000 Barclays Capital | | 71.70 | | 12/13/2018 | | 550,000 | | 315 | |
Japanese Yen,
Contracts 2,350,000 Barclays Capital | | 110.25 | | 11/13/2018 | | 2,350,000 | | 1,527 | |
Japanese Yen Cross Currency,
Contracts 940,000 UBS Securities | EUR | 129.90 | | 1/10/2019 | | 940,000 | | 25,162 | |
Japanese Yen Cross Currency,
Contracts 960,000 J.P. Morgan Securities | EUR | 128.00 | | 1/25/2019 | | 960,000 | | 18,899 | |
Poland Zloty,
Contracts 1,070,000 J.P. Morgan Securities | | 3.71 | | 1/15/2019 | | 1,070,000 | | 6,368 | |
South African Rand,
Contracts 750,000 Citigroup | | 12.49 | | 12/6/2018 | | 750,000 | | 17 | |
Swedish Krona,
Contracts 1,080,000 Barclays Capital | | 8.73 | | 12/20/2018 | | 1,080,000 | | 1,572 | |
Turkish Lira,
Contracts 1,450,000 Goldman Sachs | | 4.50 | | 11/30/2018 | | 1,450,000 | | 37 | |
| | 55,826 | |
Total Options Purchased
(cost $248,840) | | 96,211 | |
Description | Yield at Date of Purchase (%) | | Maturity Date | | Principal
Amount ($) | a | | |
Short-Term Investments - .8% | | | | | |
U.S. Government Securities | | | | | |
U. S. Treasury Bills
(cost $398,530) | | 2.14 | | 1/3/2019 | | 400,000 | g,h | 398,450 | |
17
STATEMENT OF INVESTMENTS (continued)
| | | | | | | | | | |
| |
Description | 7-Day
Yield (%) | | | | Shares | | Value ($) | |
Investment Companies - 1.8% | | | | | |
Registered Investment Companies - 1.8% | | | | | |
Dreyfus Institutional Preferred Government Plus Money Market Fund
(cost $976,445) | | 2.21 | | | | 976,445 | i | 976,445 | |
| | | | | | | | | |
Investment of Cash Collateral for Securities Loaned - .1% | | | | | |
Registered Investment Companies - .1% | | | | | |
Dreyfus Institutional Preferred Government Money Market Fund, Institutional Shares
(cost $70,162) | | 2.12 | | | | 70,162 | i | 70,162 | |
Total Investments (cost $53,821,576) | | 97.8% | 51,618,426 | |
Cash and Receivables (Net) | | 2.2% | 1,163,994 | |
Net Assets | | 100.0% | 52,782,420 | |
BADLAR—Buenos Aires Interbank Offer Rate
LIBOR—London Interbank Offered Rate
ARS—Argentine Peso
AUD—Australian Dollar
BRL—Brazilian Real
CAD—Canadian Dollar
CLP—Chilean Peso
EUR—Euro
GBP—British Pound
JPY—Japanese Yen
NZD—New Zealand Dollar
RUB—Russian Ruble
a Amount stated in U.S. Dollars unless otherwise noted above.
b Security exempt from registration pursuant to Rule 144A under the Securities Act of 1933. These securities may be resold in transactions exempt from registration, normally to qualified institutional buyers. At October 31, 2018, these securities were valued at $13,451,590 or 25.48% of net assets.
c Variable rate security—rate shown is the interest rate in effect at period end.
d The Federal Housing Finance Agency (“FHFA”) placed the Federal Home Loan Mortgage Corporation and Federal National Mortgage Association into conservatorship with FHFA as the conservator. As such, the FHFA oversees the continuing affairs of these companies.
e Principal amount for accrual purposes is periodically adjusted based on changes in the Consumer Price Index.
f Security, or portion thereof, on loan. At October 31, 2018, the value of the fund’s securities on loan was $324,477 and the value of the collateral held by the fund was $341,331, consisting of cash collateral of $70,162 and U.S. Government & Agency securities valued at $271,169.
g Held by a counterparty for open exchange traded derivative contracts.
h Security is a discount security. Income is recognized through the accretion of discount.
i Investment in affiliated issuer. The investment objective of this investment company is publicly available and can be found within the investment company’s prospectus.
18
| | |
Portfolio Summary (Unaudited) † | Value (%) |
Government | 54.6 |
Asset Backed Securities | 18.4 |
Financial | 8.0 |
Energy | 3.4 |
Mortgage Securities | 3.1 |
Consumer, Non-cyclical | 2.4 |
Investment Companies | 2.0 |
Industrial | 1.8 |
Basic Materials | 1.2 |
Communications | 1.2 |
Utilities | .6 |
Technology | .5 |
Consumer, Cyclical | .4 |
Options Purchased | .2 |
| | 97.8 |
† Based on net assets.
See notes to financial statements.
19
STATEMENT OF INVESTMENTS IN AFFILIATED ISSUERS
| | | | | | | |
Registered Investment Companies | Value
10/31/17 ($) | Purchases ($) | Sales ($) | Value
10/31/18 ($) | Net
Assets (%) | Dividends/
Distributions ($) |
Dreyfus Institutional Preferred Government Money Market Fund, Institutional Shares | 2,730,750 | 14,530,754 | 17,191,342 | 70,162 | .1 | — |
Dreyfus Institutional Preferred Government Plus Money Market Fund | 2,015,282 | 70,039,504 | 71,078,341 | 976,445 | 1.8 | 19,941 |
Total | 4,746,032 | 84,570,258 | 88,269,683 | 1,046,607 | 1.9 | 19,941 |
See note to financial statements.
20
STATEMENT OF FUTURES
October 31, 2018
| | | | | | | |
Description | Number of
Contracts | Expiration | Notional
Value ($) | Value ($) | Unrealized Appreciation (Depreciation) ($) | |
Futures Long | | |
Euro-Bond | 1 | 12/18 | 181,530a | 181,518 | (12) | |
U.S. Treasury 10 Year Notes | 4 | 12/18 | 476,006 | 473,750 | (2,256) | |
U.S. Treasury Long Bond | 2 | 12/18 | 277,159 | 276,250 | (909) | |
Futures Short | | |
Canadian 10 Year Bond | 21 | 12/18 | 2,144,231a | 2,108,056 | 36,175 | |
Euro BTP Italian Government Bond | 5 | 12/18 | 678,023a | 688,878 | (10,855) | |
Euro-Bobl | 57 | 12/18 | 8,428,034a | 8,485,904 | (57,870) | |
Euro-Bond | 16 | 12/18 | 2,889,637a | 2,904,296 | (14,659) | |
Japanese 10 Year Bond | 2 | 12/18 | 2,663,169a | 2,669,916 | (6,747) | |
Long Gilt | 5 | 12/18 | 783,954a | 782,322 | 1,632 | |
U.S. Treasury 5 Year Notes | 5 | 12/18 | 561,711 | 561,914 | (203) | |
Gross Unrealized Appreciation | | 37,807 | |
Gross Unrealized Depreciation | | (93,511) | |
a Notional amounts in foreign currency have been converted to USD using relevant foreign exchange rates.
See notes to financial statements.
21
STATEMENT OF OPTIONS WRITTEN
October 31, 2018
| | | | | | | |
Description/ Contracts/ Counterparties | Exercise Price | Expiration Date | Notional Amount | | Value ($) | |
Call Options: | | | | | | |
Chilean Peso
Contracts 270,000, J.P. Morgan Securities | 690 | 1/17/19 | 270,000 | | (7,238) | |
Chilean Peso
Contracts 270,000, Citigroup | 690 | 12/21/18 | 270,000 | | (6,144) | |
Total Options Written (premiums received $7,129) | | | | (13,382) | |
See notes to financial statements.
22
STATEMENT OF FORWARD FOREIGN CURRENCY EXCHANGE CONTRACTS October 31, 2018
| | | | | | |
Counterparty/ Purchased
Currency | Purchased Currency
Amounts | Currency
Sold | Sold
Currency
Amounts | Settlement Date | Unrealized Appreciation (Depreciation)($) |
Barclays Capital | | | |
United States Dollar | 852,426 | British Pound | 660,000 | 11/30/18 | 7,692 |
Norwegian Krone | 9,195,000 | United States Dollar | 1,105,579 | 11/30/18 | (13,430) |
United States Dollar | 875,254 | Philippine Peso | 47,360,000 | 12/7/18 | (7,762) |
United States Dollar | 1,192,210 | Taiwan Dollar | 36,360,000 | 12/7/18 | 13,991 |
Indonesian Rupiah | 9,943,620,000 | United States Dollar | 639,976 | 12/7/18 | 10,935 |
United States Dollar | 2,561,400 | Japanese Yen | 286,330,000 | 11/30/18 | 18,268 |
United States Dollar | 180,992 | Malaysian Ringgit | 750,000 | 12/7/18 | 1,892 |
Mexican Peso | 26,110,000 | United States Dollar | 1,334,762 | 12/7/18 | (57,324) |
United States Dollar | 524,627 | Mexican Peso | 10,200,000 | 12/7/18 | 25,590 |
United States Dollar | 1,086,368 | South Korean Won | 1,207,530,000 | 12/7/18 | 25,602 |
United States Dollar | 558,175 | Peruvian Nuevo Sol | 1,850,000 | 11/27/18 | 10,046 |
United States Dollar | 1,198,264 | Russian Ruble | 83,525,000 | 12/7/18 | (63,700) |
United States Dollar | 64,026 | Indian Rupee | 4,590,000 | 12/7/18 | 2,234 |
Citigroup | | | |
Brazilian Real | 1,130,000 | United States Dollar | 278,223 | 12/4/18 | 24,423 |
United States Dollar | 1,564,232 | Brazilian Real | 6,420,000 | 12/4/18 | (155,223) |
Colombian Peso | 763,920,000 | United States Dollar | 246,466 | 12/7/18 | (9,585) |
United States Dollar | 3,148,554 | New Zealand Dollar | 4,810,000 | 11/30/18 | 8,875 |
Swedish Krona | 11,775,000 | United States Dollar | 1,299,721 | 11/30/18 | (9,823) |
Czech Koruna | 6,710,000 | United States Dollar | 303,631 | 12/7/18 | (9,963) |
United States Dollar | 1,717,608 | Canadian Dollar | 2,245,000 | 11/30/18 | 11,357 |
Taiwan Dollar | 16,610,000 | United States Dollar | 545,494 | 12/7/18 | (7,259) |
Euro | 100,000 | United States Dollar | 114,100 | 11/30/18 | (564) |
23
STATEMENT OF FORWARD FOREIGN CURRENCY EXCHANGE CONTRACTS (continued)
| | | | | | |
Counterparty/ Purchased
Currency | Purchased Currency
Amounts | Currency
Sold | Sold
Currency
Amounts | Settlement Date | Unrealized Appreciation (Depreciation)($) |
Citigroup (continued) |
Mexican Peso | 6,530,000 | United States Dollar | 334,281 | 12/7/18 | (14,799) |
United States Dollar | 180,594 | Australian Dollar | 255,000 | 11/30/18 | (43) |
Goldman Sachs | | | |
United States Dollar | 133,063 | Mexican Peso | 2,520,000 | 12/7/18 | 9,771 |
Brazilian Real | 2,160,000 | United States Dollar | 533,704 | 12/4/18 | 44,804 |
United States Dollar | 3,718,942 | Euro | 3,260,000 | 11/30/18 | 17,668 |
HSBC | | | |
Czech Koruna | 29,470,000 | United States Dollar | 1,332,899 | 12/7/18 | (43,125) |
United States Dollar | 318,209 | Romanian Leu | 1,270,000 | 12/7/18 | 10,027 |
Russian Ruble | 23,000,000 | United States Dollar | 346,386 | 12/7/18 | 1,117 |
Hong Kong Dollar | 1,390,000 | United States Dollar | 177,896 | 4/10/19 | (87) |
Czech Koruna | 5,870,000 | United States Dollar | 268,609 | 12/7/18 | (11,705) |
United States Dollar | 268,583 | Czech Koruna | 5,870,000 | 12/7/18 | 11,678 |
J.P. Morgan Securities | | | |
United States Dollar | 4,538,971 | Euro | 3,980,000 | 11/30/18 | 20,238 |
Singapore Dollar | 830,000 | United States Dollar | 604,283 | 12/7/18 | (4,607) |
Taiwan Dollar | 19,750,000 | United States Dollar | 645,530 | 12/7/18 | (5,546) |
Brazilian Real | 1,000,000 | United States Dollar | 273,748 | 12/4/18 | (5,920) |
United States Dollar | 539,613 | Hungarian Forint | 152,160,000 | 12/7/18 | 7,301 |
Hungarian Forint | 50,210,000 | United States Dollar | 181,438 | 12/7/18 | (5,785) |
United States Dollar | 179,709 | Hungarian Forint | 50,210,000 | 12/7/18 | 4,056 |
United States Dollar | 315,316 | Romanian Leu | 1,260,000 | 12/7/18 | 9,560 |
United States Dollar | 792,105 | Hong Kong Dollar | 6,170,000 | 4/10/19 | 2,836 |
Romanian Leu | 780,000 | United States Dollar | 195,704 | 12/7/18 | (6,427) |
United States Dollar | 196,580 | Romanian Leu | 780,000 | 12/7/18 | 7,303 |
United States Dollar | 794,184 | Chilean Peso | 548,940,000 | 12/7/18 | 5,084 |
24
| | | | | | |
Counterparty/ Purchased
Currency | Purchased Currency
Amounts | Currency
Sold | Sold
Currency
Amounts | Settlement Date | Unrealized Appreciation (Depreciation)($) |
J.P. Morgan Securities (continued) |
Hong Kong Dollar | 1,330,000 | United States Dollar | 169,574 | 4/10/19 | 560 |
United States Dollar | 170,052 | Hong Kong Dollar | 1,330,000 | 4/10/19 | (82) |
Merrill Lynch, Pierce, Fenner & Smith | | | |
United States Dollar | 1,321,925 | Mexican Peso | 25,120,000 | 12/7/18 | 92,923 |
Chilean Peso | 175,000,000 | United States Dollar | 264,151 | 12/7/18 | (12,589) |
UBS Securities | | | |
United States Dollar | 1,511,587 | Euro | 1,325,000 | 11/30/18 | 7,235 |
United States Dollar | 89,339 | Malaysian Ringgit | 370,000 | 12/7/18 | 983 |
Gross Unrealized Appreciation | | | 414,049 |
Gross Unrealized Depreciation | | | (445,348) |
See notes to financial statements.
25
STATEMENT OF SWAP AGREEMENTS
October 31, 2018
| | | | | |
Centrally Cleared Interest Rate Swaps | |
Received
Reference
Entity | Paid
Reference
Entity | Maturity Date | Notional
Amount | Unrealized Appreciation (Depreciation) ($) |
NZD Bank Bill 3 Month | NZD at 3.21 | 3/20/28 | 1,770,000 | (42,255) |
NZD Bank Bill 3 Month | NZD at 3.21 | 3/19/28 | 1,700,000 | (40,675) |
USD at 2.795 | LIBOR USD Fix 3 Month | 6/28/20 | 3,200,000 | 11,135 |
LIBOR USD Fix 3 Month | USD at 2.586 | 10/20/47 | 450,000 | 62,034 |
EURIBOR 6 Month | EUR at .372 | 4/17/23 | 9,600,000 | (73,698) |
LIBOR USD Fix 3 Month | USD at 2.82 | 4/19/23 | 2,700,000 | 34,020 |
ICE LIBOR GBP 6 Month | GBP at 1.075 | 12/12/22 | 6,700,000 | 75,345 |
EUR at .1305 | EURIBOR 6 Month | 3/6/22 | 1,840,000 | 10,000 |
LIBOR Fix 3 Month | USD at 1.803 | 9/28/46 | 1,900,000 | 540,382 |
Japanese Yen LIBOR 6 Month | JPY at .62 | 4/4/46 | 57,400,000 | 39,714 |
Gross Unrealized Appreciation | 772,630 |
Gross Unrealized Depreciation | (156,628) |
EUR—Euro
GBP—British Pound
JPY—Japanese Yen
NZD—New Zealand Dollar
USD—United States Dollar
See notes to financial statements.
| | | | | | |
OTC Credit Default Swaps | |
| | | | | | |
Reference
Obligation/
Counterparty | Maturity
Date | Notional
Amount | Market
Value ($) | Upfront
Payments/
Receipts ($) | Unrealized Appreciation ($) |
Purchased Contracts:1 | |
Goldman Sachs | | |
Credit Default Swaps CMBX BBB-CDSI Paid Fixed Rate of 3.00 1 Month | 11/17/59 | 280,000 | 20,352 | 17,243 | 2,875 |
Gross Unrealized Appreciation | 2,875 |
1 If the fund is a buyer of protection and a credit event occurs, as defined under the terms of the swap agreement, the fund will either (i) receive from the seller of protection an amount equal to the notional amount of the swap and deliver the reference obligation or (ii) receive a net settlement amount in the form of cash or securities equal to the notional amount of the swap less the recovery value of the reference obligation.
See notes to financial statements.
26
STATEMENT OF ASSETS AND LIABILITIES
October 31, 2018
| | | | | | | |
| | | | | | |
| | | Cost | | Value | |
Assets ($): | | | | |
Investments in securities—See Statement of Investments
(including securities on loan, valued at $324,477)—Note 1(c): | | | |
Unaffiliated issuers | 52,774,969 | | 50,571,819 | |
Affiliated issuers | | 1,046,607 | | 1,046,607 | |
Cash | | | | | 177,990 | |
Cash denominated in foreign currency | | | 227,116 | | 226,997 | |
Interest and securities lending income receivable | | 428,853 | |
Unrealized appreciation on forward foreign
currency exchange contracts—Note 4 | | 414,049 | |
Cash collateral held by broker—Note 4 | | 400,948 | |
Receivable for investment securities sold | | 385,616 | |
Receivable for swap variation margin—Note 4 | | 52,682 | |
Receivable for futures variation margin—Note 4 | | 18,727 | |
Swap upfront payments—Note 4 | | 17,243 | |
Receivable for shares of Common Stock subscribed | | 14,549 | |
Unrealized appreciation on swap agreements—Note 4 | | 2,875 | |
Prepaid expenses | | | | | 32,864 | |
| | | | | 53,791,819 | |
Liabilities ($): | | | | |
Due to The Dreyfus Corporation and affiliates—Note 3(c) | | | | 13,484 | |
Unrealized depreciation on forward foreign
currency exchange contracts—Note 4 | | 445,348 | |
Payable for shares of Common Stock redeemed | | 261,309 | |
Payable for investment securities purchased | | 109,486 | |
Liability for securities on loan—Note 1(c) | | 70,162 | |
Outstanding options written, at value
(premiums received $7,129)—Note 4 | | 13,382 | |
Unrealized depreciation on foreign currency transactions | | 8,148 | |
Directors fees and expenses payable | | 1,061 | |
Distributions payable | | 486 | |
Accrued expenses and other liabilities | | | | | 86,533 | |
| | | | | 1,009,399 | |
Net Assets ($) | | | 52,782,420 | |
Composition of Net Assets ($): | | | | |
Paid-in capital | | | | | 167,946,133 | |
Total distributable earnings (loss) | | | | | (115,163,713) | |
Net Assets ($) | | | 52,782,420 | |
| | | | | | |
Net Asset Value Per Share | Class A | Class C | Class I | Class Y | |
Net Assets ($) | 18,588,672 | 9,326,634 | 19,186,202 | 5,680,912 | |
Shares Outstanding | 1,722,007 | 870,839 | 1,774,803 | 526,889 | |
Net Asset Value Per Share ($) | 10.79 | 10.71 | 10.81 | 10.78 | |
| | | | | | |
See notes to financial statements. | | | | | |
27
STATEMENT OF OPERATIONS
Year Ended October 31, 2018
| | | | | | | |
| | | | | | |
| | | | | | |
Investment Income ($): | | | | |
Income: | | | | |
Interest (net of $21,478 foreign taxes withheld at source) | | | 3,751,571 | |
Dividends from affiliated issuers | | | 19,941 | |
Income from securities lending—Note 1(c) | | | 8,478 | |
Total Income | | | 3,779,990 | |
Expenses: | | | | |
Management fee—Note 3(a) | | | 410,028 | |
Shareholder servicing costs—Note 3(c) | | | 152,791 | |
Professional fees | | | 105,551 | |
Distribution fees—Note 3(b) | | | 96,420 | |
Registration fees | | | 62,339 | |
Custodian fees—Note 3(c) | | | 31,579 | |
Prospectus and shareholders’ reports | | | 31,252 | |
Directors’ fees and expenses—Note 3(d) | | | 6,429 | |
Loan commitment fees—Note 2 | | | 2,196 | |
Interest expense—Note 2 | | | 160 | |
Miscellaneous | | | 87,619 | |
Total Expenses | | | 986,364 | |
Less—reduction in expenses due to undertaking—Note 3(a) | | | (257,364) | |
Less—reduction in fees due to earnings credits—Note 3(c) | | | (858) | |
Net Expenses | | | 728,142 | |
Investment Income—Net | | | 3,051,848 | |
Realized and Unrealized Gain (Loss) on Investments—Note 4 ($): | | |
Net realized gain (loss) on investments and foreign currency transactions | (1,267,061) | |
Net realized gain (loss) on options transactions | (300,193) | |
Net realized gain (loss) on futures | 483,006 | |
Net realized gain (loss) on swap agreements | (147,078) | |
Net realized gain (loss) on forward foreign currency exchange contracts | 663,470 | |
Net Realized Gain (Loss) | | | (567,856) | |
Net unrealized appreciation (depreciation) on investments
and foreign currency transactions | | | (4,651,713) | |
Net unrealized appreciation (depreciation) on options transactions | (136,296) | |
Net unrealized appreciation (depreciation) on futures | | | 94,347 | |
Net unrealized appreciation (depreciation) on swap agreements | | | 97,366 | |
Net unrealized appreciation (depreciation) on
forward foreign currency exchange contracts | | | (332,315) | |
Net Unrealized Appreciation (Depreciation) | | | (4,928,611) | |
Net Realized and Unrealized Gain (Loss) on Investments | | | (5,496,467) | |
Net (Decrease) in Net Assets Resulting from Operations | | (2,444,619) | |
| | | | | | | |
See notes to financial statements. | | | | | |
28
STATEMENT OF CHANGES IN NET ASSETS
| | | | | | | | | | |
| | | | Year Ended October 31, |
| | | | 2018 | | 2017a | |
Operations ($): | | | | | | | | |
Investment income—net | | | 3,051,848 | | | | 4,742,162 | |
Net realized gain (loss) on investments | | (567,856) | | | | 1,262,887 | |
Net unrealized appreciation (depreciation)
on investments | | (4,928,611) | | | | 2,470,665 | |
Net Increase (Decrease) in Net Assets
Resulting from Operations | (2,444,619) | | | | 8,475,714 | |
Distributions ($): | |
Distributions to shareholders: | | | | | | | | |
Class A | | | (1,129,311) | | | | (1,411,659) | |
Class C | | | (521,742) | | | | (537,957) | |
Class I | | | (1,918,628) | | | | (1,933,465) | |
Class Y | | | (193,686) | | | | (400,900) | |
Total Distributions | | | (3,763,367) | | | | (4,283,981) | |
Capital Stock Transactions ($): | |
Net proceeds from shares sold: | | | | | | | | |
Class A | | | 6,170,786 | | | | 17,899,314 | |
Class C | | | 246,290 | | | | 1,455,402 | |
Class I | | | 3,472,037 | | | | 33,508,987 | |
Class Y | | | 5,625,602 | | | | 2,198,141 | |
Distributions reinvested: | | | | | | | | |
Class A | | | 996,475 | | | | 1,011,561 | |
Class C | | | 336,843 | | | | 342,149 | |
Class I | | | 1,639,419 | | | | 1,521,175 | |
Class Y | | | 134,567 | | | | 61,238 | |
Cost of shares redeemed: | | | | | | | | |
Class A | | | (20,636,916) | | | | (36,216,385) | |
Class C | | | (7,969,889) | | | | (14,986,773) | |
Class I | | | (43,070,265) | | | | (58,287,629) | |
Class Y | | | (7,903,253) | | | | (12,831,503) | |
Increase (Decrease) in Net Assets
from Capital Stock Transactions | (60,958,304) | | | | (64,324,323) | |
Total Increase (Decrease) in Net Assets | (67,166,290) | | | | (60,132,590) | |
Net Assets ($): | |
Beginning of Period | | | 119,948,710 | | | | 180,081,300 | |
End of Period | | | 52,782,420 | | | | 119,948,710 | |
29
STATEMENT OF CHANGES IN NET ASSETS (continued)
| | | | | | | | | | |
| | | | Year Ended October 31, |
| | | | 2018 | | 2017a | |
Capital Share Transactions (Shares): | |
Class Ab | | | | | | | | |
Shares sold | | | 558,080 | | | | 1,589,908 | |
Shares issued for distributions reinvested | | | 88,366 | | | | 90,100 | |
Shares redeemed | | | (1,845,744) | | | | (3,203,159) | |
Net Increase (Decrease) in Shares Outstanding | (1,199,298) | | | | (1,523,151) | |
Class Cb | | | | | | | | |
Shares sold | | | 21,903 | | | | 128,414 | |
Shares issued for distributions reinvested | | | 30,041 | | | | 30,608 | |
Shares redeemed | | | (708,496) | | | | (1,322,648) | |
Net Increase (Decrease) in Shares Outstanding | (656,552) | | | | (1,163,626) | |
Class I | | | | | | | | |
Shares sold | | | 304,949 | | | | 2,953,668 | |
Shares issued for distributions reinvested | | | 145,256 | | | | 135,350 | |
Shares redeemed | | | (3,811,986) | | | | 5,133,780 | |
Net Increase (Decrease) in Shares Outstanding | (3,361,781) | | | | 8,222,798 | |
Class Y | | | | | | | | |
Shares sold | | | 493,907 | | | | 195,034 | |
Shares issued for distributions reinvested | | | 12,118 | | | | 5,455 | |
Shares redeemed | | | (688,065) | | | | (1,135,006) | |
Net Increase (Decrease) in Shares Outstanding | (182,040) | | | | (934,517) | |
| | | | | | | | | | |
aDistributions to shareholders include only distributions from net investment income. Undistributed investment income—net was $1,209,716 in 2017 and is no longer presented as a result of the adoption of SEC’s Disclosure Update and Simplification Rule. | |
bDuring the period ended October 31, 2018, 2,759 Class C shares representing $31,699 were automatically converted for 2,745 Class A shares. | �� |
See notes to financial statements. | | | | | | | | |
30
FINANCIAL HIGHLIGHTS
The following tables describe the performance for each share class for the fiscal periods indicated. All information (except portfolio turnover rate) reflects financial results for a single fund share. Total return shows how much your investment in the fund would have increased (or decreased) during each period, assuming you had reinvested all dividends and distributions. These figures have been derived from the fund’s financial statements.
| | | | | | | | | | | |
| | | | | |
| | |
| | Year Ended October 31, |
Class A Shares | | 2018 | 2017 | 2016 | 2015 | 2014 |
Per Share Data ($): | | | | | | |
Net asset value, beginning of period | | 11.66 | 11.29 | 12.31 | 13.29 | 13.08 |
Investment Operations: | | | | | | |
Investment income—neta | | .45 | .37 | .41 | .48 | .43 |
Net realized and unrealized
gain (loss) on investments | | (.86) | .31 | (.87) | (.85) | .06 |
Total from Investment Operations | | (.41) | .68 | (.46) | (.37) | .49 |
Distributions: | | | | | | |
Dividends from
investment income—net | | (.46) | (.31) | (.56) | (.61) | (.28) |
Net asset value, end of period | | 10.79 | 11.66 | 11.29 | 12.31 | 13.29 |
Total Return (%)b | | (3.57) | 6.12 | (3.80) | (2.93) | 3.77 |
Ratios/Supplemental Data (%): | | | | | | |
Ratio of total expenses
to average net assets | | 1.21 | .99 | .90 | .89 | .98 |
Ratio of net expenses
to average net assets | | .90 | .90 | .90 | .89 | .97 |
Ratio of net investment income
to average net assets | | 3.94 | 3.27 | 3.64 | 3.70 | 3.25 |
Portfolio Turnover Rate | | 116.40 | 85.23 | 158.94 | 182.35 | 230.83 |
Net Assets, end of period ($ x 1,000) | | 18,589 | 34,063 | 50,191 | 195,629 | 184,506 |
a Based on average shares outstanding.
b Exclusive of sales charge.
See notes to financial statements.
31
FINANCIAL HIGHLIGHTS (continued)
| | | | | | | | | | |
| | | | | |
| | |
| | Year Ended October 31, |
Class C Shares | | 2018 | 2017 | 2016 | 2015 | 2014 |
Per Share Data ($): | | | | | | |
Net asset value, beginning of period | | 11.61 | 11.26 | 12.27 | 13.24 | 13.03 |
Investment Operations: | | | | | | |
Investment income—neta | | .36 | .29 | .32 | .38 | .33 |
Net realized and unrealized
gain (loss) on investments | | (.85) | .30 | (.86) | (.85) | .06 |
Total from Investment Operations | | (.49) | .59 | (.54) | (.47) | .39 |
Distributions: | | | | | | |
Dividends from
investment income—net | | (.41) | (.24) | (.47) | (.50) | (.18) |
Net asset value, end of period | | 10.71 | 11.61 | 11.26 | 12.27 | 13.24 |
Total Return (%)b | | (4.37) | 5.34 | (4.46) | (3.66) | 3.02 |
Ratios/Supplemental Data (%): | | | | | | |
Ratio of total expenses
to average net assets | | 2.00 | 1.78 | 1.67 | 1.65 | 1.72 |
Ratio of net expenses
to average net assets | | 1.65 | 1.65 | 1.65 | 1.65 | 1.70 |
Ratio of net investment income
to average net assets | | 3.20 | 2.55 | 2.89 | 2.94 | 2.52 |
Portfolio Turnover Rate | | 116.40 | 85.23 | 158.94 | 182.35 | 230.83 |
Net Assets, end of period ($ x 1,000) | | 9,327 | 17,727 | 30,300 | 64,587 | 58,623 |
a Based on average shares outstanding.
b Exclusive of sales charge.
See notes to financial statements.
32
| | | | | | | | | | | |
| | | | | |
| | |
| | Year Ended October 31, |
Class I Shares | | 2018 | 2017 | 2016 | 2015 | 2014 |
Per Share Data ($): | | | | | | |
Net asset value, beginning of period | | 11.66 | 11.29 | 12.30 | 13.28 | 13.07 |
Investment Operations: | | | | | | |
Investment income—neta | | .47 | .41 | .44 | .52 | .46 |
Net realized and unrealized
gain (loss) on investments | | (.85) | .29 | (.87) | (.85) | .07 |
Total from Investment Operations | | (.38) | .70 | (.43) | (.33) | .53 |
Distributions: | | | | | | |
Dividends from
investment income—net | | (.47) | (.33) | (.58) | (.65) | (.32) |
Net asset value, end of period | | 10.81 | 11.66 | 11.29 | 12.30 | 13.28 |
Total Return (%) | | (3.37) | 6.31 | (3.48) | (2.65) | 4.06 |
Ratios/Supplemental Data (%): | | | | | | |
Ratio of total expenses
to average net assets | | .96 | .76 | .64 | .63 | .72 |
Ratio of net expenses
to average net assets | | .65 | .65 | .64 | .63 | .69 |
Ratio of net investment income
to average net assets | | 4.11 | 3.60 | 3.90 | 3.96 | 3.53 |
Portfolio Turnover Rate | | 116.40 | 85.23 | 158.94 | 182.35 | 230.83 |
Net Assets, end of period ($ x 1,000) | | 19,186 | 59,900 | 81,056 | 320,031 | 349,915 |
a Based on average shares outstanding.
See notes to financial statements.
33
FINANCIAL HIGHLIGHTS (continued)
| | | | | | | | |
| | |
| | | |
| | Year Ended October 31, |
Class Y Shares | | 2018 | 2017 | 2016 | 2015 | 2014 |
Per Share Data ($): | | | | | | |
Net asset value, beginning of period | | 11.65 | 11.28 | 12.30 | 13.28 | 13.07 |
Investment Operations: | | | | | | |
Investment income—neta | | .47 | .39 | .46 | .50 | .47 |
Net realized and unrealized
gain (loss) on investments | | (.87) | .31 | (.89) | (.83) | .07 |
Total from Investment Operations | | (.40) | .70 | (.43) | (.33) | .54 |
Distributions: | | | | | | |
Dividends from
investment income—net | | (.47) | (.33) | (.59) | (.65) | (.33) |
Net asset value, end of period | | 10.78 | 11.65 | 11.28 | 12.30 | 13.28 |
Total Return (%) | | (3.42) | 6.33 | (3.47) | (2.59) | 4.13 |
Ratios/Supplemental Data (%): | | | | | | |
Ratio of total expenses
to average net assets | | .97 | .69 | .58 | .58 | .61 |
Ratio of net expenses
to average net assets | | .65 | .65 | .58 | .58 | .60 |
Ratio of net investment income
to average net assets | | 4.19 | 3.52 | 3.96 | 4.00 | 3.61 |
Portfolio Turnover Rate | | 116.40 | 85.23 | 158.94 | 182.35 | 230.83 |
Net Assets, end of period ($ x 1,000) | | 5,681 | 8,258 | 18,534 | 87,269 | 5,724 |
a Based on average shares outstanding.
See notes to financial statements.
34
NOTES TO FINANCIAL STATEMENTS
NOTE 1—Significant Accounting Policies:
Dreyfus Unconstrained Bond Fund (the “fund”) is a separate non-diversified series of The Dreyfus/Laurel Funds, Inc. (the “Company”), which is registered under the Investment Company Act of 1940, as amended (the “Act”), as an open-end management investment company and operates as a series company currently offering eight series, including the fund. The fund’s investment objective is to seek to maximize total return through capital appreciation and income. The Dreyfus Corporation (the “Manager” or “Dreyfus”), a wholly-owned subsidiary of The Bank of New York Mellon Corporation (“BNY Mellon”), serves as the fund’s investment adviser.
The Company’s Board of Directors (the “Board”) approved, effective May 1, 2018, a change in the fund’s name from “Dreyfus Opportunistic Fixed Income Fund” to “Dreyfus Unconstrained Bond Fund”.
MBSC Securities Corporation (the “Distributor”), a wholly-owned subsidiary of Dreyfus, is the distributor of the fund’s shares. The fund is authorized to issue 100 million shares of $.001 par value Common Stock in each of the following classes of shares: Class A, Class C, Class I, Class T and Class Y. Class A, Class C and Class T shares are sold primarily to retail investors through financial intermediaries and bear Distribution and/or Shareholder Services Plan fees. Class A and Class T shares generally are subject to a sales charge imposed at the time of purchase. Class C shares are subject to a contingent deferred sales charge (“CDSC”) imposed on Class C shares redeemed within one year of purchase. Class C shares automatically convert to Class A shares ten years after the date of purchase, without the imposition of a sales charge. Class I shares are sold primarily to bank trust departments and other financial service providers (including The Bank of New York Mellon, a subsidiary of BNY Mellon and an affiliate of Dreyfus, and its affiliates), acting on behalf of customers having a qualified trust or an investment account or relationship at such institution, and bear no Distribution or Shareholder Services Plan fees. Class Y shares are sold at net asset value per share generally to institutional investors, and bear no Distribution or Shareholder Services Plan fees. Class I and Class Y shares are offered without a front-end sales charge or CDSC. As of the date of this report, the fund did not offer Class T shares for purchase. Other differences between the classes include the services offered to and the expenses borne by each class, the allocation of certain transfer agency costs, and certain voting rights. Income, expenses (other than expenses attributable to a specific class), and realized and unrealized gains or losses on investments are allocated to each class of shares based on its relative net assets.
35
NOTES TO FINANCIAL STATEMENTS (continued)
The Company accounts separately for the assets, liabilities and operations of each series. Expenses directly attributable to each series are charged to that series’ operations; expenses which are applicable to all series are allocated among them on a pro rata basis.
The Financial Accounting Standards Board (“FASB”) Accounting Standards Codification (“ASC”) is the exclusive reference of authoritative U.S. generally accepted accounting principles (“GAAP”) recognized by the FASB to be applied by nongovernmental entities. Rules and interpretive releases of the Securities and Exchange Commission (“SEC”) under authority of federal laws are also sources of authoritative GAAP for SEC registrants. The fund’s financial statements are prepared in accordance with GAAP, which may require the use of management estimates and assumptions. Actual results could differ from those estimates.
(a) Portfolio valuation: The fair value of a financial instrument is the amount that would be received to sell an asset or paid to transfer a liability in an orderly transaction between market participants at the measurement date (i.e., the exit price). GAAP establishes a fair value hierarchy that prioritizes the inputs of valuation techniques used to measure fair value. This hierarchy gives the highest priority to unadjusted quoted prices in active markets for identical assets or liabilities (Level 1 measurements) and the lowest priority to unobservable inputs (Level 3 measurements).
Additionally, GAAP provides guidance on determining whether the volume and activity in a market has decreased significantly and whether such a decrease in activity results in transactions that are not orderly. GAAP requires enhanced disclosures around valuation inputs and techniques used during annual and interim periods.
Various inputs are used in determining the value of the fund’s investments relating to fair value measurements. These inputs are summarized in the three broad levels listed below:
Level 1—unadjusted quoted prices in active markets for identical investments.
Level 2—other significant observable inputs (including quoted prices for similar investments, interest rates, prepayment speeds, credit risk, etc.).
Level 3—significant unobservable inputs (including the fund’s own assumptions in determining the fair value of investments).
The inputs or methodology used for valuing securities are not necessarily an indication of the risk associated with investing in those securities.
36
Changes in valuation techniques may result in transfers in or out of an assigned level within the disclosure hierarchy. Valuation techniques used to value the fund’s investments are as follows:
Registered investment companies that are not traded on an exchange are valued at their net asset value and are generally categorized within Level 1 of the fair value hierarchy.
Investments in securities, excluding short-term investments (other than U.S. Treasury Bills), futures, options and forward foreign currency exchange contracts (“forward contracts”) are valued each business day by an independent pricing service (the “Service”) approved by the Company’s Board of Directors (the “Board”). Investments for which quoted bid prices are readily available and are representative of the bid side of the market in the judgment of the Service are valued at the mean between the quoted bid prices (as obtained by the Service from dealers in such securities) and asked prices (as calculated by the Service based upon its evaluation of the market for such securities). Other investments (which constitute a majority of the portfolio securities) are valued as determined by the Service, based on methods which include consideration of the following: yields or prices of securities of comparable quality, coupon, maturity and type; indications as to values from dealers; and general market conditions. These securities are generally categorized within Level 2 of the fair value hierarchy.
U.S. Treasury Bills are valued at the mean price between quoted bid prices and asked prices by the Service. These securities are generally categorized within Level 2 of the fair value hierarchy.
The Service is engaged under the general supervision of the Board.
When market quotations or official closing prices are not readily available, or are determined not to accurately reflect fair value, such as when the value of a security has been significantly affected by events after the close of the exchange or market on which the security is principally traded (for example, a foreign exchange or market), but before the fund calculates its net asset value, the fund may value these investments at fair value as determined in accordance with the procedures approved by the Board. Certain factors may be considered when fair valuing investments such as: fundamental analytical data, the nature and duration of restrictions on disposition, an evaluation of the forces that influence the market in which the securities are purchased and sold, and public trading in similar securities of the issuer or comparable issuers. These securities are either categorized within Level 2 or 3 of the fair value hierarchy depending on the relevant inputs used.
37
NOTES TO FINANCIAL STATEMENTS (continued)
For restricted securities where observable inputs are limited, assumptions about market activity and risk are used and such securities are generally categorized within Level 3 of the fair value hierarchy.
Investments denominated in foreign currencies are translated to U.S. dollars at the prevailing rates of exchange.
Futures and options, which are traded on an exchange, are valued at the last sales price on the securities exchange on which such securities are primarily traded or at the last sales price on the national securities market on each business day and are generally categorized within Level 1 of the fair value hierarchy. Options traded over-the-counter (“OTC”) are valued at the mean between the bid and asked price and are generally categorized within Level 2 of the fair value hierarchy. Investments in swap agreements are valued each business day by the Service. Swaps are valued by the Service by using a swap pricing model which incorporates among other factors, default probabilities, recovery rates, credit curves of the underlying issuer and swap spreads on interest rates and are generally categorized within Level 2 of the fair value hierarchy. Forward contracts are valued at the forward rate and are generally categorized within Level 2 of the fair value hierarchy.
The following is a summary of the inputs used as of October 31, 2018 in valuing the fund’s investments:
| | | | | | |
| Level 1 - Unadjusted Quoted Prices | Level 2 - Other Significant Observable Inputs | Level 3 -Significant Unobservable Inputs | Total |
Assets ($) | | | | |
Investments in Securities: |
Asset-Backed | — | 9,709,473 | — | 9,709,473 |
Commercial
Mortgage-Backed | — | 1,658,569 | — | 1,658,569 |
Corporate Bonds† | — | 10,265,227 | — | 10,265,227 |
Foreign Government | — | 21,118,516 | — | 21,118,516 |
Investment Companies | 1,046,607 | — | — | 1,046,607 |
Municipal Bonds | — | 260,164 | — | 260,164 |
U.S. Government
Securities | — | 7,065,209 | — | 7,065,209 |
U.S. Treasury | — | 398,450 | — | 398,450 |
Other Financial Instruments: | | | |
Futures†† | 37,807 | — | — | 37,807 |
Forward Foreign
Currency Exchange
Contracts†† | — | 414,049 | — | 414,049 |
38
| | | | | | |
| Level 1 - Unadjusted Quoted Prices | Level 2 - Other Significant Observable Inputs | Level 3 -Significant Unobservable Inputs | Total |
Assets ($) | | | | |
Options Purchased | — | 96,211 | — | 96,211 |
Swaps†† | — | 775,505 | — | 775,505 |
Liabilities ($) | | | | |
Other Financial Instruments: | | | |
Futures†† | (93,511) | — | — | (93,511) |
Forward Foreign
Currency Exchange
Contracts†† | — | (445,348) | — | (445,348) |
Options Written | — | (13,382) | — | (13,382) |
Swaps†† | — | (156,628) | — | (156,628) |
† See Statement of Investments for additional detailed categorizations.
†† Amount shown represents unrealized appreciation (depreciation) at period end, but only variation margin on exchanged traded and centrally cleared derivatives are reported in the Statement of Assets and Liabilities.
At October 31, 2018, there were no transfers between levels of the fair value hierarchy. It is the fund’s policy to recognize transfers between levels at the end of the reporting period.
(b) Foreign currency transactions: The fund does not isolate that portion of the results of operations resulting from changes in foreign exchange rates on investments from the fluctuations arising from changes in the market prices of securities held. Such fluctuations are included with the net realized and unrealized gain or loss on investments.
Net realized foreign exchange gains or losses arise from sales of foreign currencies, currency gains or losses realized on securities transactions between trade and settlement date, and the difference between the amounts of dividends, interest and foreign withholding taxes recorded on the fund’s books and the U.S. dollar equivalent of the amounts actually received or paid. Net unrealized foreign exchange gains and losses arise from changes in the value of assets and liabilities other than investments resulting from changes in exchange rates. Foreign currency gains and losses on foreign currency transactions are also included with net realized and unrealized gain or loss on investments.
(c) Securities transactions and investment income: Securities transactions are recorded on a trade date basis. Realized gains and losses from securities transactions are recorded on the identified cost basis. Dividend income is recognized on the ex-dividend date and interest income, including, where applicable, accretion of discount and amortization of premium on investments, is recognized on the accrual basis.
39
NOTES TO FINANCIAL STATEMENTS (continued)
Pursuant to a securities lending agreement with The Bank of New York Mellon, the fund may lend securities to qualified institutions. It is the fund’s policy that, at origination, all loans are secured by collateral of at least 102% of the value of U.S. securities loaned and 105% of the value of foreign securities loaned. Collateral equivalent to at least 100% of the market value of securities on loan is maintained at all times. Collateral is either in the form of cash, which can be invested in certain money market mutual funds managed by Dreyfus, or U.S. Government and Agency securities. The fund is entitled to receive all dividends, interest and distributions on securities loaned, in addition to income earned as a result of the lending transaction. Should a borrower fail to return the securities in a timely manner, The Bank of New York Mellon is required to replace the securities for the benefit of the fund or credit the fund with the market value of the unreturned securities and is subrogated to the fund’s rights against the borrower and the collateral. Additionally, the contractual maturity of security lending transactions are on an overnight and continuous basis. During the period ended October 31, 2018, The Bank of New York Mellon earned $1,583 from lending portfolio securities, pursuant to the securities lending agreement.
(d) Affiliated issuers: Investments in other investment companies advised by Dreyfus are considered “affiliated” under the Act.
(e) Risk: The fund invests primarily in debt securities. Failure of an issuer of the debt securities to make timely interest or principal payments, or a decline or the perception of a decline in the credit quality of a debt security, can cause the debt security’s price to fall, potentially lowering the fund’s share price. In addition, the value of debt securities may decline due to general market conditions that are not specifically related to a particular issuer, such as real or perceived adverse economic conditions, changes in outlook for corporate earnings, changes in interest or currency rates or adverse investor sentiment. Such values may also decline because of factors that affect a particular industry.
The fund invests in floating rate loan interests. The floating rate loans in which the fund invests typically are below investment grade securities, and inherently speculative. In the event of the bankruptcy of a borrower, the fund could experience delays or limitations imposed by insolvency laws with respect to its ability to realize the benefits of any collateral securing the borrower’s loan.
(f) Dividends and distributions to shareholders: Dividends and distributions are recorded on the ex-dividend date. Dividends from investment income-net are normally declared and paid on a monthly basis. Dividends from net realized capital gains, if any, are normally declared and
40
paid annually, but the fund may make distributions on a more frequent basis to comply with the distribution requirements of the Internal Revenue Code of 1986, as amended (the “Code”). To the extent that net realized capital gains can be offset by capital loss carryovers, it is the policy of the fund not to distribute such gains. Income and capital gain distributions are determined in accordance with income tax regulations, which may differ from GAAP.
(g) Federal income taxes: It is the policy of the fund to continue to qualify as a regulated investment company, if such qualification is in the best interests of its shareholders, by complying with the applicable provisions of the Code, and to make distributions of taxable income and net realized capital gain sufficient to relieve it from substantially all federal income and excise taxes.
As of and during the period ended October 31, 2018, the fund did not have any liabilities for any uncertain tax positions. The fund recognizes interest and penalties, if any, related to uncertain tax positions as income tax expense in the Statement of Operations. During the period ended October 31, 2018, the fund did not incur any interest or penalties.
Each tax year in the four-year period ended October 31, 2018 remains subject to examination by the Internal Revenue Service and state taxing authorities.
At October 31, 2018, the components of accumulated earnings on a tax basis were as follows: undistributed ordinary income $94,623, accumulated capital losses $113,702,365 and unrealized depreciation $1,555,971.
The fund is permitted to carry forward capital losses for an unlimited period. Furthermore, capital loss carryovers retain their character as either short-term or long-term capital losses.
The accumulated capital loss carryover is available for federal income tax purposes to be applied against future net realized capital gains, if any, realized subsequent to October 31, 2018. The fund has $73,895,153 short-term capital losses and $39,807,212 of long-term capital losses which can be carried forward for an unlimited period.
The tax character of distributions paid to shareholders during the fiscal periods ended October 31, 2018 and October 31, 2017 were as follows: ordinary income $3,763,367 and $4,283,981, respectively.
During the period ended October 31, 2018, as a result of permanent book to tax differences, primarily due to the tax treatment for paydown gains and losses, swap periodic payments, foreign currency gains and losses and consent fees, the fund increased total distributable earnings (loss) by
41
NOTES TO FINANCIAL STATEMENTS (continued)
$134,790 and decreased paid-in-capital by the same amount. Net assets and net asset value per share were not affected by this reclassification.
(h) New Accounting Pronouncements: In March 2017, the FASB issued Accounting Standards Update 2017-08, Receivables—Nonrefundable Fees and Other Costs (Subtopic 310-20): Premium Amortization On Purchased Callable Debt Securities (“ASU 2017-08”). The update shortens the amortization period for the premium on certain purchased callable debt securities to the earliest call date. ASU 2017-08 will be effective for annual periods beginning after December 15, 2018.
Also in August 2018, the FASB issued Accounting Standards Update 2018-13, Fair Value Measurement (Topic 820): Disclosure Framework—Changes to the Disclosure Requirements for Fair Value Measurement (“ASU 2018-13”). The update provides guidance that eliminates, adds and modifies certain disclosure requirements for fair value measurements. ASU 2018-13 will be effective for annual periods beginning after December 15, 2019. Management is currently assessing the potential impact of these changes to future financial statements.
NOTE 2—Bank Lines of Credit:
The fund participates with other Dreyfus-managed funds in an $830 million unsecured credit facility led by Citibank, N.A. and a $300 million unsecured credit facility provided by The Bank of New York Mellon (each, a “Facility”), each to be utilized primarily for temporary or emergency purposes, including the financing of redemptions. In connection therewith, the fund has agreed to pay its pro rata portion of commitment fees for each Facility. Interest is charged to the fund based on rates determined pursuant to the terms of the respective Facility at the time of borrowing.
The average amount of borrowings outstanding under the Facilities during the period ended October 31, 2018 was approximately $12,600 with a related weighted average annualized interest rate of 1.27%.
NOTE 3—Management Fee and Other Transactions with Affiliates:
(a) Pursuant to a management agreement with Dreyfus, the management fee is computed at the annual rate of .50% of the value of the fund’s average daily net assets and is payable monthly. Dreyfus has contractually agreed, from November 1, 2017 through March 1, 2019, to waive receipt of its fees and/or assume the expenses of the fund, so that the direct expenses of none of the classes (excluding Rule 12b-1 Distribution Plan fees, Shareholder Services Plan fees, taxes, interest expense, brokerage commissions, commitment fees on borrowings and extraordinary
42
expenses) exceed .65% of the value of the fund’s average daily net assets. On or after March 1, 2019, The Dreyfus Corporation may terminate this expense limitation at any time. The reduction in expenses, pursuant to the undertaking, amounted to $257,364 during the period ended October 31, 2018.
During the period ended October 31, 2018, the Distributor retained $324 from commissions earned on sales of the fund’s Class A shares and $2,599 from CDSC fees on redemptions of the fund’s Class C shares.
(b) Under the Distribution Plan adopted pursuant to Rule 12b-1 under the Act, Class C shares pay the Distributor for distributing its shares at an annual rate of .75% of the value of its average daily net assets. During the period ended October 31, 2018, Class C shares were charged $96,420 pursuant to the Distribution Plan.
(c) Under the Shareholder Services Plan, Class A and Class C shares pay the Distributor at an annual rate of .25% of the value of their average daily net assets for the provision of certain services. The services provided may include personal services relating to shareholder accounts, such as answering shareholder inquiries regarding the fund and providing reports and other information, and services related to the maintenance of shareholder accounts. The Distributor may make payments to Service Agents (securities dealers, financial institutions or other industry professionals) with respect to these services. The Distributor determines the amounts to be paid to Service Agents. During the period ended October 31, 2018, Class A and Class C shares were charged $65,084 and $32,140, respectively, pursuant to the Shareholder Services Plan.
Under its terms, the Distribution Plan and Shareholder Services Plan shall remain in effect from year to year, provided such continuance is approved annually by a vote of a majority of those Directors who are not “interested persons” of the Company and who have no direct or indirect financial interest in the operation of or in any agreement related to the Distribution Plan or Shareholder Services Plan.
The fund has arrangements with the transfer agent and the custodian whereby the fund may receive earnings credits when positive cash balances are maintained, which are used to offset transfer agency and custody fees. For financial reporting purposes, the fund includes net earnings credits, if any, as an expense offset in the Statement of Operations.
The fund compensates Dreyfus Transfer, Inc., a wholly-owned subsidiary of Dreyfus, under a transfer agency agreement for providing transfer agency and cash management services for the fund. The majority of transfer agency fees are comprised of amounts paid on a per account basis,
43
NOTES TO FINANCIAL STATEMENTS (continued)
while cash management fees are related to fund subscriptions and redemptions. During the period ended October 31, 2018, the fund was charged $9,932 for transfer agency services. These fees are included in Shareholder servicing costs in the Statement of Operations.
The fund compensates The Bank of New York Mellon under a custody agreement for providing custodial services for the fund. These fees are determined based on net assets, geographic region and transaction activity. During the period ended October 31, 2018, the fund was charged $31,579 pursuant to the custody agreement. These fees were partially offset by earnings credits of $858.
During the period ended October 31, 2018, the fund was charged $12,797 for services performed by the Chief Compliance Officer and his staff. These fees are included in Miscellaneous in the Statement of Operations.
The components of “Due to The Dreyfus Corporation and affiliates” in the Statement of Assets and Liabilities consist of: management fees $22,856, Distribution Plan fees $6,232, Shareholder Services Plan fees $5,829, custodian fees $13,626, Chief Compliance Officer fees $4,193 and transfer agency fees $1,633, which are offset against an expense reimbursement currently in effect in the amount of $40,885.
(d) Each Board member also serves as a Board member of other funds within the Dreyfus complex. Annual retainer fees and attendance fees are allocated to each fund based on net assets.
NOTE 4—Securities Transactions:
The aggregate amount of purchases and sales (including paydowns) of investment securities, excluding short-term securities, futures, options transactions, forward contracts and swap agreements during the period ended October 31, 2018, amounted to $90,870,790 and $149,530,354, respectively.
Floating Rate Loan Interests: Floating rate instruments are loans and other securities with interest rates that adjust or “float” periodically. Floating rate loans are made by banks and other financial institutions to their corporate clients. The rates of interest on the loans adjust periodically by reference to a base lending rate, such as the London Interbank Offered Rate (“LIBOR”) plus a premium or credit spread. Floating rate loans reset on periodic set dates, typically 30 to 90 days, but not to exceed one year. The fund may invest in multiple series or tranches of a loan. A different series or tranche may have varying terms and carry different associated risks.
44
Derivatives: A derivative is a financial instrument whose performance is derived from the performance of another asset. The fund enters into International Swaps and Derivatives Association, Inc. Master Agreements or similar agreements (collectively, “Master Agreements”) with its OTC derivative contract counterparties in order to, among other things, reduce its credit risk to counterparties. Master Agreements include provisions for general obligations, representations, collateral and events of default or termination. Under a Master Agreement, the fund may offset with the counterparty certain derivative financial instrument’s payables and/or receivables with collateral held and/or posted and create one single net payment in the event of default or termination.
Each type of derivative instrument that was held by the fund during the period ended October 31, 2018 is discussed below.
Futures: In the normal course of pursuing its investment objective, the fund is exposed to market risk, including interest rate risk, as a result of changes in value of underlying financial instruments. The fund invests in futures in order to manage its exposure to or protect against changes in the market. A futures contract represents a commitment for the future purchase or a sale of an asset at a specified date. Upon entering into such contracts, these investments require initial margin deposits with a counterparty, which consist of cash or cash equivalents. The amount of these deposits is determined by the exchange or Board of Trade on which the contract is traded and is subject to change. Accordingly, variation margin payments are received or made to reflect daily unrealized gains or losses which are recorded in the Statement of Operations. When the contracts are closed, the fund recognizes a realized gain or loss which is reflected in the Statement of Operations. There is minimal counterparty credit risk to the fund with futures since they are exchange traded, and the exchange guarantees the futures against default. Futures open at October 31, 2018 are set forth in the Statement of Futures.
Options Transactions: The fund purchases and writes (sells) put and call options to hedge against changes in the values of interest rates and foreign currencies, or as a substitute for an investment. The fund is subject to market risk, interest rate risk and currency risk in the course of pursuing its investment objectives through its investments in options contracts. A call option gives the purchaser of the option the right (but not the obligation) to buy, and obligates the writer to sell, the underlying financial instrument at the exercise price at any time during the option period, or at a specified date. Conversely, a put option gives the purchaser of the option the right (but not the obligation) to sell, and obligates the writer to buy the
45
NOTES TO FINANCIAL STATEMENTS (continued)
underlying financial instrument at the exercise price at any time during the option period, or at a specified date.
As a writer of call options, the fund receives a premium at the outset and then bears the market risk of unfavorable changes in the price of the financial instrument underlying the option. Generally, the fund realizes a gain, to the extent of the premium, if the price of the underlying financial instrument decreases between the date the option is written and the date on which the option is terminated. Generally, the fund incurs a loss if the price of the financial instrument increases between those dates. The maximum payout for those contracts is limited to the number of call option contracts written and the related strike prices, respectively.
As a writer of put options, the fund receives a premium at the outset and then bears the market risk of unfavorable changes in the price of the financial instrument underlying the option. Generally, the fund realizes a gain, to the extent of the premium, if the price of the underlying financial instrument increases between the date the option is written and the date on which the option is terminated. Generally, the fund incurs a loss if the price of the financial instrument decreases between those dates. The maximum payout for those contracts is limited to the number of put option contracts written and the related strike prices, respectively.
As a writer of an option, the fund has no control over whether the underlying financial instrument may be sold (call) or purchased (put) and as a result bears the market risk of an unfavorable change in the price of the financial instrument underlying the written option. There is a risk of loss from a change in value of such options which may exceed the related premiums received. This risk is mitigated by Master Agreements between the fund and the counterparty and the posting of collateral, if any, by the counterparty to the fund to cover the fund’s exposure to the counterparty. The Statement of Operations reflects any unrealized gains or losses which occurred during the period as well as any realized gains or losses which occurred upon the expiration or closing of the option transaction. Options written open at October 31, 2018 are set forth in Statement of Options Written.
Forward Foreign Currency Exchange Contracts: The fund enters into forward contracts in order to hedge its exposure to changes in foreign currency exchange rates on its foreign portfolio holdings, to settle foreign currency transactions or as a part of its investment strategy. When executing forward contracts, the fund is obligated to buy or sell a foreign currency at a specified rate on a certain date in the future. With respect to sales of forward contracts, the fund incurs a loss if the value of the contract increases between the date the forward contract is opened and the
46
date the forward contract is closed. The fund realizes a gain if the value of the contract decreases between those dates. With respect to purchases of forward contracts, the fund incurs a loss if the value of the contract decreases between the date the forward contract is opened and the date the forward contract is closed. The fund realizes a gain if the value of the contract increases between those dates. Any realized or unrealized gains or losses which occurred during the period are reflected in the Statement of Operations. The fund is exposed to foreign currency risk as a result of changes in value of underlying financial instruments. The fund is also exposed to credit risk associated with counterparty nonperformance on these forward contracts, which is generally limited to the unrealized gain on each open contract. This risk may be mitigated by Master Agreements, if any, between the fund and the counterparty and the posting of collateral, if any, by the counterparty to the fund to cover the fund’s exposure to the counterparty. Forward contracts open at October 31, 2018 are set forth in the Statement of Forward Foreign Currency Exchange Contracts.
Swap Agreements: The fund enters into swap agreements to exchange the interest rate on, or return generated by, one nominal instrument for the return generated by another nominal instrument. Swap agreements are privately negotiated in the OTC market or centrally cleared. The fund enters into these agreements to hedge certain market or interest rate risks, to manage the interest rate sensitivity (sometimes called duration) of fixed income securities, to provide a substitute for purchasing or selling particular securities or to increase potential returns.
For OTC swaps, the fund accrues for interim payments on a daily basis, with the net amount recorded within unrealized appreciation (depreciation) on swap agreements in the Statement of Assets and Liabilities. Once the interim payments are settled in cash, the net amount is recorded as a realized gain (loss) on swaps, in addition to realized gain (loss) recorded upon the termination of swap agreements in the Statement of Operations. Upfront payments made and/or received by the fund, are recorded as an asset and/or liability in the Statement of Assets and Liabilities and are recorded as a realized gain or loss ratably over the agreement’s term/event with the exception of forward starting interest rate swaps which are recorded as realized gains or losses on the termination date.
Upon entering into centrally cleared swap agreements, an initial margin deposit is required with a counterparty, which consists of cash or cash equivalents. The amount of these deposits is determined by the exchange on which the agreement is traded and is subject to change. The change in valuation of centrally cleared swaps is recorded as a receivable or payable for variation margin in the Statement of Assets and Liabilities. Payments
47
NOTES TO FINANCIAL STATEMENTS (continued)
received from (paid to) the counterparty, including upon termination, are recorded as realized gain (loss) in the Statement of Operations.
Fluctuations in the value of swap agreements are recorded for financial statement purposes as unrealized appreciation or depreciation on swap agreements.
Interest Rate Swaps: Interest rate swaps involve the exchange of commitments to pay and receive interest based on a notional principal amount. The fund may elect to pay a fixed rate and receive a floating rate, or receive a fixed rate and pay a floating rate on a notional principal amount. The net interest received or paid on interest rate swap agreements is included within realized gain (loss) on swap agreements in the Statement of Operations. Interest rate swap agreements are subject to general market risk, liquidity risk, counterparty risk and interest rate risk.
For OTC swaps, the fund’s maximum risk of loss from counterparty risk is the discounted value of the cash flows to be received from the counterparty over the agreement’s remaining life, to the extent that the amount is positive. This risk may be mitigated by Master Agreements, if any, between the fund and the counterparty and the posting of collateral, if any, by the counterparty to the fund to cover the fund’s exposure to the counterparty. There is minimal counterparty risk to the fund with centrally cleared swaps since they are settled through an exchange and the exchange guarantees these swap against default. Interest rate swaps open at October 31, 2018 are set forth in the Statement of Swap Agreements.
Credit Default Swaps: Credit default swaps involve commitments to pay a fixed interest rate in exchange for payment if a credit event affecting a third party (the referenced obligation or index) occurs. Credit events may include a failure to pay interest or principal, bankruptcy, or restructuring. The fund enters into these agreements to manage its exposure to the market or certain sectors of the market, to reduce its risk exposure to defaults of corporate and sovereign issuers, or to create exposure to corporate or sovereign issuers to which it is not otherwise exposed. For those credit default swaps in which the fund is paying a fixed rate, the fund is buying credit protection on the instrument. In the event of a credit event, the fund would receive the full notional amount for the reference obligation. For those credit default swaps in which the fund is receiving a fixed rate, the fund is selling credit protection on the underlying instrument. The maximum payouts for these agreements are limited to the notional amount of each swap. Credit default swaps may involve greater risks than if the fund had invested in the reference obligation directly and are subject to general market risk, liquidity risk, counterparty risk and credit risk. This risk may be mitigated by Master Agreements, if any, between the
48
fund and the counterparty and the posting of collateral, if any, by the counterparty to the fund to cover the fund’s exposure to the counterparty.
The maximum potential amount of future payments (undiscounted) that a fund as a seller of protection could be required to make under a credit default swap agreement would be an amount equal to the notional amount of the agreement which may exceed the amount of unrealized appreciation or depreciation reflected in the Statement of Assets and Liabilities. Notional amounts of all credit default swap agreements are disclosed in the following chart, which summarizes open credit default swaps entered into by the fund. These potential amounts would be partially offset by any recovery values of the respective referenced obligations, underlying securities comprising the referenced index, upfront payments received upon entering into the agreement, or net amounts received from the settlement of buy protection credit default swap agreements entered into by the fund for the same referenced entity or entities. Credit default swaps open at October 31, 2018 are set forth in the Statement of Swap Agreements.
GAAP requires disclosure for (i) the nature and terms of the credit derivative, reasons for entering into the credit derivative, the events or circumstances that would require the seller to perform under the credit derivative, and the current status of the payment/performance risk of the credit derivative, (ii) the maximum potential amount of future payments (undiscounted) the seller could be required to make under the credit derivative, (iii) the fair value of the credit derivative, and (iv) the nature of any recourse provisions and assets held either as collateral or by third parties. All required disclosures have been made and are incorporated within the current period as part of the Notes to the Statement of Investments and disclosures within this Note.
The following tables show the fund’s exposure to different types of market risk as it relates to the Statement of Assets and Liabilities and the Statement of Operations, respectively.
49
NOTES TO FINANCIAL STATEMENTS (continued)
Fair value of derivative instruments as of October 31, 2018 is shown below:
| | | | | | | | |
| | Derivative
Assets ($) | | | | Derivative
Liabilities ($) | |
Interest rate risk | 810,437 | 1,2 | Interest rate risk | (250,139) | 1,2 |
Foreign exchange risk | 510,260 | 3,4 | Foreign exchange risk | (458,730) | 4,5 |
Credit risk | 2,875 | 2 | Credit risk | - | |
Gross fair value of
derivative contracts | 1,323,572 | | | | (708,869) | |
| | | | | | | |
Statement of Assets and Liabilities location: | |
1Includes cumulative appreciation (depreciation) on futures as reported in the Statement of Futures, but only the unpaid variation margin is reported in the Statement of Assets and Liabilities. |
2Includes cumulative appreciation (depreciation) on swap agreements as reported in the Statement of Swap Agreements. Unrealized appreciation (depreciation) on OTC swap agreements and only unpaid variation margin on cleared swap agreements, are reported in the Statement of Assets and Liabilities. |
3Options purchased are included in Investments in securities—Unaffiliated issuers, at value. |
4Unrealized appreciation (depreciation) on forward foreign currency exchange contracts. |
5Outstanding options written, at value. | |
The effect of derivative instruments in the Statement of Operations during the period ended October 31, 2018 is shown below:
| | | | | | | | | | | |
Amount of realized gain (loss) on derivatives recognized in income ($) | |
Underlying
risk | Futures | 1 | Options
Transactions | 2 | Forward
Contracts | 3 | Swap
Agreements | 4 | Total | |
Interest
rate | 483,006 | | (56,286) | | - | | (170,469) | | 256,251 | |
Foreign
exchange | - | | (243,907) | | 663,470 | | - | | 419,563 | |
Credit | - | | - | | - | | 23,391 | | 23,391 | |
Total | 483,006 | | (300,193) | | 663,470 | | (147,078) | | 699,205 | |
| | | | | | | | | | | |
50
| | | | | | | | | | | | |
Change in unrealized appreciation (depreciation)
on derivatives recognized in income ($) | |
Underlying
risk | Futures | 5 | Options
Transactions | 6 | Forward
Contracts | 7 | Swap
Agreements | 8 | Total | |
Interest
rate | 94,347 | | 867 | | - | | 94,491 | | 189,705 | |
Foreign
exchange | - | | (137,163) | | (332,315) | | - | | (469,478) | |
Credit | - | | - | | - | | 2,875 | | 2,875 | |
Total | 94,347 | | (136,296) | | (332,315) | | 97,366 | | (276,898) | |
| | | | | | | | | | | | |
| | Statement of Operations location: | |
1 | Net realized gain (loss) on futures. | | |
2 | Net realized gain (loss) on options transactions. |
3 | Net realized gain (loss) on forward foreign currency exchange contracts. | | |
4 | Net realized gain (loss) on swap agreements. | | |
5 | Net unrealized appreciation (depreciation) on futures. | | |
6 | Net unrealized appreciation (depreciation) on options transactions. | | |
7 | Net unrealized appreciation (depreciation) on forward foreign currency exchange contracts. | |
8 | Net unrealized appreciation (depreciation) on swap agreements. | | |
The provisions of ASC Topic 210 “Disclosures about Offsetting Assets and Liabilities” require disclosure on the offsetting of financial assets and liabilities. These disclosures are required for certain investments, including derivative financial instruments subject to Master Agreements which are eligible for offsetting in the Statement of Assets and Liabilities and require the fund to disclose both gross and net information with respect to such investments. For financial reporting purposes, the fund does not offset derivative assets and derivative liabilities that are subject to Master Agreements in the Statement of Assets and Liabilities.
At October 31, 2018, derivative assets and liabilities (by type) on a gross basis are as follows:
| | | | | | |
Derivative Financial Instruments: | | Assets ($) | | Liabilities ($) | |
Futures | | 37,807 | | (93,511) | |
Options | | 96,211 | | (13,382) | |
Forward contracts | | 414,049 | | (445,348) | |
Swaps | | 775,505 | | (156,628) | |
Total gross amount of derivative | | | | | |
assets and liabilities in the | | | | | |
Statement of Assets and Liabilities | | 1,323,572 | | (708,869) | |
Derivatives not subject to | | | | | |
Master Agreements | | (810,437) | | 250,139 | |
Total gross amount of assets | | | | | |
and liabilities subject to | | | | | |
Master Agreements | | 513,135 | | (458,730) | |
51
NOTES TO FINANCIAL STATEMENTS (continued)
The following tables present derivative assets and liabilities net of amounts available for offsetting under Master Agreements and net of related collateral received or pledged, if any, as of October 31, 2018:†
| | | | | | | |
| | | | Financial | | | |
| | | | Instruments | | | |
| | | | and Derivatives | | | |
| | Gross Amount of | | Available | Collateral | | Net Amount of |
Counterparty | Assets ($) | 1 | for Offset ($) | Received ($) | | Assets ($) |
Barclays Capital | 125,621 | | (125,621) | - | | - |
Citigroup | 45,474 | | (45,474) | - | | - |
Goldman Sachs
International | 75,155 | | - | - | | 75,155 |
HSBC | 56,991 | | (54,917) | - | | 2,074 |
J.P. Morgan Securities | 83,591 | | (35,605) | - | | 47,986 |
Merrill Lynch, Pierce, Fenner & Smith | 92,923 | | (12,589) | - | | 80,334 |
UBS Securities | 33,380 | | - | - | | 33,380 |
Total | 513,135 | | (274,206) | - | | 238,929 |
| | | | | | | |
| | | | Financial | | | |
| | | | Instruments | | | |
| | | | and Derivatives | | | |
| | Gross Amount of | | Available | Collateral | | Net Amount of |
Counterparty | Liabilities ($) | 1 | for Offset ($) | Pledged ($) | | Liabilities ($) |
Barclays Capital | (142,216) | | 125,621 | - | | (16,595) |
Citigroup | (213,403) | | 45,474 | - | | (167,929) |
HSBC | (54,917) | | 54,917 | - | | - |
J.P. Morgan Securities | (35,605) | | 35,605 | - | | - |
Merrill Lynch, Pierce, Fenner & Smith | (12,589) | | 12,589 | - | | - |
Total | (458,730) | | 274,206 | - | | (184,524) |
| | | | | | | |
1 Absent a default event or early termination, OTC derivative assets and liabilities are presented at gross amounts and are not offset in the Statement of Assets and Liabilities. |
† See Statement of Investments for detailed information regarding collateral held for open exchange traded derivative contracts. |
The following summarizes the average market value of derivatives outstanding during the period ended October 31, 2018:
| | | |
| | Average Market Value ($) |
Interest rate futures | | 34,872,812 |
Interest rate options contracts | | 43,063 |
Foreign currency options contracts | | 227,548 |
Forward contracts | | 88,696,169 |
The following summarizes the average notional value of swap agreements outstanding during the period ended October 31, 2018:
52
| | | |
| | Average Notional Value ($) |
Interest rate swap agreements | | 44,726,249 |
Credit default swap agreements | | 171,154 |
At October 31, 2018, the cost of investments for federal income tax purposes was $53,871,985; accordingly, accumulated net unrealized depreciation on investments inclusive of derivative contracts was $1,560,474, consisting of $1,743,598 gross unrealized appreciation and $3,304,072 gross unrealized depreciation.
53
REPORT OF INDEPENDENT REGISTERED PUBLIC ACCOUNTING FIRM
To the Shareholders and Board of Directors
The Dreyfus/Laurel Funds, Inc.
Opinion on the Financial Statements
We have audited the accompanying statement of assets and liabilities of Dreyfus Unconstrained Bond Fund (the “Fund”), a series of The Dreyfus/Laurel Funds, Inc., including the statements of investments, investments in affiliated issuers, futures, options written, forward foreign currency exchange contracts and swap agreements, as of October 31, 2018, the related statement of operations for the year then ended, the statements of changes in net assets for each of the years in the two-year period then ended and the related notes (collectively, the financial statements) and the financial highlights for each of the years in the five-year period then ended. In our opinion, the financial statements and financial highlights present fairly, in all material respects, the financial position of the Fund as of October 31, 2018, the results of its operations for the year then ended, the changes in its net assets for each of the years in the two-year period then ended and the financial highlights for each of the years in the five-year period then ended, in conformity with U.S. generally accepted accounting principles.
Basis for Opinion
These financial statements and financial highlights are the responsibility of the Fund’s management. Our responsibility is to express an opinion on these financial statements and financial highlights based on our audits. We are a public accounting firm registered with the Public Company Accounting Oversight Board (United States) (PCAOB) and are required to be independent with respect to the Fund in accordance with the U.S. federal securities laws and the applicable rules and regulations of the Securities and Exchange Commission and the PCAOB.
We conducted our audits in accordance with the standards of the PCAOB. Those standards require that we plan and perform the audit to obtain reasonable assurance about whether the financial statements and financial highlights are free of material misstatement, whether due to error or fraud. Our audits included performing procedures to assess the risks of material misstatement of the financial statements and financial highlights, whether due to error or fraud, and performing procedures that respond to those risks. Such procedures included examining, on a test basis, evidence regarding the amounts and disclosures in the financial statements and financial highlights. Such procedures also included confirmation of securities owned as of October 31, 2018, by correspondence with the custodian and brokers or by other appropriate auditing procedures when replies from brokers were not received. Our audits also included evaluating the accounting principles used and significant estimates made by management, as well as evaluating the overall presentation of the financial statements and financial highlights. We believe that our audits provide a reasonable basis for our opinion.

We have served as the auditor of one or more Dreyfus Corporation investment companies since 1994.
New York, New York
December 28, 2018
54
IMPORTANT TAX INFORMATION (Unaudited)
For federal tax purposes the fund designates the maximum amount allowable but not less than 30.94% as interest-related dividends in accordance with Sections 871(k)(1) and 881(e) of the Internal Revenue Code.
55
BOARD MEMBERS INFORMATION (Unaudited)
INDEPENDENT BOARD MEMBERS
Joseph S. DiMartino (75)
Chairman of the Board (1999)
Principal Occupation During Past 5 Years:
· Corporate Director and Trustee (1995-present)
Other Public Company Board Memberships During Past 5 Years:
· CBIZ (formerly, Century Business Services, Inc.), a provider of outsourcing functions for small and medium size companies, Director (1997-present)
No. of Portfolios for which Board Member Serves: 124
———————
Francine J. Bovich (67)
Board Member (2012)
Principal Occupation During Past 5 Years:
· Trustee, The Bradley Trusts, private trust funds (2011-present)
Other Public Company Board Memberships During Past 5 Years:
· Annaly Capital Management, Inc., a real estate trust, Director (2014-present)
No. of Portfolios for which Board Member Serves: 72
———————
Kenneth A. Himmel (72)
Board Member (1994)
Principal Occupation During Past 5 Years:
· Managing Partner, Gulf Related, an international real estate development company (2010-present)
· President and CEO, Related Urban Development, a real estate development company (1996-present)
· President and CEO, Himmel & Company, a real estate development company (1980-present)
· CEO, American Food Management, a restaurant company (1983-present)
No. of Portfolios for which Board Member Serves: 25
———————
56
Stephen J. Lockwood (71)
Board Member (1994)
Principal Occupation During Past 5 Years:
· Chairman of the Board, Stephen J. Lockwood and Company LLC, a real estate investment company (2000-present)
No. of Portfolios for which Board Member Serves: 25
———————
Roslyn M. Watson (69)
Board Member (1994)
Principal Occupation During Past 5 Years:
· Principal, Watson Ventures, Inc., a real estate investment company (1993-present)
No. of Portfolios for which Board Member Serves: 58
———————
Benaree Pratt Wiley (72)
Board Member (1998)
Principal Occupation During Past 5 Years:
· Principal, The Wiley Group, a firm specializing in strategy and business development (2005-present)
Other Public Company Board Memberships During Past 5 Years:
· CBIZ (formerly, Century Business Services, Inc.), a provider of outsourcing functions for small and medium size companies, Director (2008-present)
No. of Portfolios for which Board Member Serves: 79
———————
Once elected all Board Members serve for an indefinite term, but achieve Emeritus status upon reaching age 80. The address of the Board Members and Officers is c/o The Dreyfus Corporation, 200 Park Avenue, New York, New York 10166. Additional information about the Board Members is available in the fund’s Statement of Additional Information which can be obtained from Dreyfus free of charge by calling this toll free number: 1-800-DREYFUS.
James M. Fitzgibbons, Emeritus Board Member
57
OFFICERS OF THE FUND (Unaudited)
BRADLEY J. SKAPYAK, President since January 2010.
Chief Operating Officer and a director of the Manager since June 2009, Chairman of Dreyfus Transfer, Inc., an affiliate of the Manager and the transfer agent of the funds, since May 2011 and Chief Executive Officer of MBSC Securities Corporation since August 2016. He is an officer of 62 investment companies (comprised of 124 portfolios) managed by the Manager. He is 59 years old and has been an employee of the Manager since February 1988.
BENNETT A. MACDOUGALL, Chief Legal Officer since October 2015.
Chief Legal Officer of the Manager and Associate General Counsel and Managing Director of BNY Mellon since June 2015; from June 2005 to June 2015, he served in various capacities with Deutsche Bank – Asset & Wealth Management Division, including as Director and Associate General Counsel, and Chief Legal Officer of Deutsche Investment Management Americas Inc. from June 2012 to May 2015. He is an officer of 63 investment companies (comprised of 149 portfolios) managed by the Manager. He is 47 years old and has been an employee of the Manager since June 2015.
JAMES BITETTO, Vice President since August 2005 and Secretary since February 2018.
Managing Counsel of BNY Mellon and Secretary of the Manager, and an officer of 63 investment companies (comprised of 149 portfolios) managed by the Manager. He is 52 years old and has been an employee of the Manager since December 1996.
JOSEPH M. CHIOFFI, Vice President and Assistant Secretary since August 2005.
Managing Counsel of BNY Mellon, and an officer of 63 investment companies (comprised of 149 portfolios) managed by the Manager. He is 56 years old and has been an employee of the Manager since June 2000.
SONALEE CROSS, Vice President and Assistant Secretary since March 2018.
Counsel of BNY Mellon since October 2016; Associate at Proskauer Rose LLP from April 2016 to September 2016; Attorney at EnTrust Capital from August 2015 to February 2016; Associate at Sidley Austin LLP from September 2013 until August 2015. She is an officer of 63 investment companies (comprised of 149 portfolios) managed by Dreyfus. She is 31 years old and has been an employee of the Manager since October 2016.
MAUREEN E. KANE, Vice President and Assistant Secretary since April 2015.
Managing Counsel of BNY Mellon since July 2014; from October 2004 until July 2014, General Counsel, and from May 2009 until July 2014, Chief Compliance Officer of Century Capital Management. She is an officer of 63 investment companies (comprised of 149 portfolios) managed by the Manager. She is 56 years old and has been an employee of the Manager since July 2014.
SARAH S. KELLEHER, Vice President and Assistant Secretary since April 2014.
Managing Counsel of BNY Mellon since December 2017, from March 2013 to December 2017, Senior Counsel of BNY Mellon. She is an officer of 63 investment companies (comprised of 149 portfolios) managed by the Manager. She is 43 years old and has been an employee of the Manager since March 2013.
JEFF PRUSNOFSKY, Vice President and Assistant Secretary since August 2005.
Senior Managing Counsel of BNY Mellon, and an officer of 63 investment companies (comprised of 149 portfolios) managed by the Manager. He is 53 years old and has been an employee of the Manager since October 1990.
NATALYA ZELENSKY, Vice President and Assistant Secretary since March 2017.
Counsel of BNY Mellon since May 2016; Attorney at Wildermuth Endowment Strategy Fund/Wildermuth Advisory, LLC from November 2015 until May 2016; Assistant General Counsel at RCS Advisory Services from July 2014 until November 2015; Associate at Sutherland, Asbill & Brennan from January 2013 until January 2014. She is an officer of 63 investment companies (comprised of 149 portfolios) managed by Dreyfus. She is 33 years old and has been an employee of the Manager since May 2016.
JAMES WINDELS, Treasurer since November 2001.
Director – Mutual Fund Accounting of the Manager, and an officer of 63 investment companies (comprised of 149 portfolios) managed by the Manager. He is 60 years old and has been an employee of the Manager since April 1985.
58
GAVIN C. REILLY, Assistant Treasurer since December 2005.
Tax Manager of the Investment Accounting and Support Department of the Manager, and an officer of 63 investment companies (comprised of 149 portfolios) managed by the Manager. He is 50 years old and has been an employee of the Manager since April 1991.
ROBERT S. ROBOL, Assistant Treasurer since August 2005.
Senior Accounting Manager – Dreyfus Financial Reporting of the Manager, and an officer of 63 investment companies (comprised of 149 portfolios) managed by the Manager. He is 54 years old and has been an employee of the Manager since October 1988.
ROBERT SALVIOLO, Assistant Treasurer since July 2007.
Senior Accounting Manager – Equity Funds of the Manager, and an officer of 63 investment companies (comprised of 149 portfolios) managed by the Manager. He is 51 years old and has been an employee of the Manager since June 1989.
ROBERT SVAGNA, Assistant Treasurer since December 2002.
Senior Accounting Manager – Fixed Income and Equity Funds of the Manager, and an officer of 63 investment companies (comprised of 149 portfolios) managed by the Manager. He is 51 years old and has been an employee of the Manager since November 1990.
JOSEPH W. CONNOLLY, Chief Compliance Officer since October 2004.
Chief Compliance Officer of the Manager, the Dreyfus Family of Funds and BNY Mellon Funds Trust (63 investment companies, comprised of 149 portfolios). He is 61 years old and has served in various capacities with the Manager since 1980, including manager of the firm’s Fund Accounting Department from 1997 through October 2001.
CARIDAD M. CAROSELLA, Anti-Money Laundering Compliance Officer since January 2016.
Anti-Money Laundering Compliance Officer of the Dreyfus Family of Funds and BNY Mellon Funds Trust since January 2016; from May 2015 to December 2015, Interim Anti-Money Laundering Compliance Officer of the Dreyfus Family of Funds and BNY Mellon Funds Trust and the Distributor; from January 2012 to May 2015, AML Surveillance Officer of the Distributor and from 2007 to December 2011, Financial Processing Manager of the Distributor. She is an officer of 57 investment companies (comprised of 143 portfolios) managed by the Manager. She is 50 years old and has been an employee of the Distributor since 1997.
59
NOTES
60
NOTES
61
Dreyfus Unconstrained Bond Fund
200 Park Avenue
New York, NY 10166
Manager
The Dreyfus Corporation
200 Park Avenue
New York, NY 10166
Custodian
The Bank of New York Mellon
240 Greenwich Street
New York, NY 10286
Transfer Agent &
Dividend Disbursing Agent
Dreyfus Transfer, Inc.
200 Park Avenue
New York, NY 10166
Distributor
MBSC Securities Corporation
200 Park Avenue
New York, NY 10166
| | |
Ticker Symbols: | Class A: DSTAX Class C: DSTCX Class I: DSTRX Class Y: DSTYX |
Telephone Call your financial representative or 1-800-DREYFUS
Mail The Dreyfus Family of Funds, 144 Glenn Curtiss Boulevard, Uniondale, NY 11556-0144
E-mail Send your request to info@dreyfus.com
Internet Information can be viewed online or downloaded at www.dreyfus.com
The fund files its complete schedule of portfolio holdings with the Securities and Exchange Commission (“SEC”) for the first and third quarters of each fiscal year on Form N-Q. The fund’s Forms N-Q are available on the SEC’s website at www.sec.gov.
A description of the policies and procedures that the fund uses to determine how to vote proxies relating to portfolio securities and information regarding how the fund voted these proxies for the most recent 12-month period ended June 30 is available at www.dreyfus.com and on the SEC’s website at www.sec.gov and without charge, upon request, by calling 1-800-DREYFUS.
| | |
© 2018 MBSC Securities Corporation
6148AR1018 | 
|
Item 2. Code of Ethics.
The Registrant has adopted a code of ethics that applies to the Registrant's principal executive officer, principal financial officer, principal accounting officer or controller, or persons performing similar functions. There have been no amendments to, or waivers in connection with, the Code of Ethics during the period covered by this Report.
Item 3. Audit Committee Financial Expert.
The Registrant's Board has determined that Joseph S. DiMartino, a member of the Audit Committee of the Board, is an audit committee financial expert as defined by the Securities and Exchange Commission (the "SEC"). Mr. DiMartino is "independent" as defined by the SEC for purposes of audit committee financial expert determinations.
Item 4. Principal Accountant Fees and Services.
(a) Audit Fees. The aggregate fees billed for each of the last two fiscal years (the "Reporting Periods") for professional services rendered by the Registrant's principal accountant (the "Auditor") for the audit of the Registrant's annual financial statements or services that are normally provided by the Auditor in connection with the statutory and regulatory filings or engagements for the Reporting Periods, were $188,275 in 2017 and $191,100 in 2018.
(b) Audit-Related Fees. The aggregate fees billed in the Reporting Periods for assurance and related services by the Auditor that are reasonably related to the performance of the audit of the Registrant's financial statements and are not reported under paragraph (a) of this Item 4 were $25,540 in 2017 and $25,930 in 2018. These services consisted of one or more of the following: (i) agreed upon procedures related to compliance with Internal Revenue Code section 817(h), (ii) security counts required by Rule 17f-2 under the Investment Company Act of 1940, as amended, (iii) advisory services as to the accounting or disclosure treatment of Registrant transactions or events and (iv) advisory services to the accounting or disclosure treatment of the actual or potential impact to the Registrant of final or proposed rules, standards or interpretations by the Securities and Exchange Commission, the Financial Accounting Standards Boards or other regulatory or standard-setting bodies.
The aggregate fees billed in the Reporting Periods for non-audit assurance and related services by the Auditor to the Registrant's investment adviser (not including any sub-investment adviser whose role is primarily portfolio management and is subcontracted with or overseen by another investment adviser), and any entity controlling, controlled by or under common control with the investment adviser that provides ongoing services to the Registrant ("Service Affiliates"), that were reasonably related to the performance of the annual audit of the Service Affiliate, which required pre-approval by the Audit Committee were $0 in 2017 and $0 in 2018.
(c) Tax Fees. The aggregate fees billed in the Reporting Periods for professional services rendered by the Auditor for tax compliance, tax advice, and tax planning ("Tax Services") were $13,000 in 2017 and $13,250 in 2018. These services consisted of review or preparation of U.S. federal, state, local and excise tax returns. The aggregate fees billed in the Reporting Periods for Tax Services by the Auditor to Service Affiliates, which required pre-approval by the Audit Committee were $0 in 2017 and $0 in 2018.
(d) All Other Fees. The aggregate fees billed in the Reporting Periods for products and services provided by the Auditor, other than the services reported in paragraphs (a) through (c) of this Item, were $0 in 2017 and $0 in 2018.
The aggregate fees billed in the Reporting Periods for Non-Audit Services by the Auditor to Service Affiliates, other than the services reported in paragraphs (b) through (c) of this Item, which required pre-approval by the Audit Committee, were $0 in 2017 and $0 in 2018.
(e)(1) Audit Committee Pre-Approval Policies and Procedures. The Registrant's Audit Committee has established policies and procedures (the "Policy") for pre-approval (within specified fee limits) of the Auditor's engagements for non-audit services to the Registrant and Service Affiliates without specific case-by-case consideration. The pre-approved services in the Policy can include pre-approved audit services, pre-approved audit-related services, pre-approved tax services and pre-approved all other services. Pre-approval considerations include whether the proposed services are compatible with maintaining the Auditor's independence. Pre-approvals pursuant to the Policy are considered annually.
(e)(2) Note. None of the services described in paragraphs (b) through (d) of this Item 4 were approved by the Audit Committee pursuant to paragraph (c)(7)(i)(C) of Rule 2-01 of Regulation S-X.
(f) None of the hours expended on the principal accountant's engagement to audit the registrant's financial statements for the most recent fiscal year were attributed to work performed by persons other than the principal account's full-time, permanent employees.
Non-Audit Fees. The aggregate non-audit fees billed by the Auditor for services rendered to the Registrant, and rendered to Service Affiliates, for the Reporting Periods were $20,070,000 in 2017 and $3,635,000 in 2018.
Auditor Independence. The Registrant's Audit Committee has considered whether the provision of non-audit services that were rendered to Service Affiliates, which were not pre-approved (not requiring pre-approval), is compatible with maintaining the Auditor's independence.
Item 5. Audit Committee of Listed Registrants.
Not applicable.
Item 6. Investments.
(a) Not applicable.
Item 7. Disclosure of Proxy Voting Policies and Procedures for Closed-End Management Investment Companies.
Not applicable.
Item 8. Portfolio Managers of Closed-End Management Investment Companies.
Not applicable.
Item 9. Purchases of Equity Securities by Closed-End Management Investment Companies and Affiliated Purchasers.
Not applicable.
Item 10. Submission of Matters to a Vote of Security Holders.
There have been no material changes to the procedures applicable to Item 10.
Item 11. Controls and Procedures.
(a) The Registrant's principal executive and principal financial officers have concluded, based on their evaluation of the Registrant's disclosure controls and procedures as of a date within 90 days of the filing date of this report, that the Registrant's disclosure controls and procedures are reasonably designed to ensure that information required to be disclosed by the Registrant on Form N-CSR is recorded, processed, summarized and reported within the required time periods and that information required to be disclosed by the Registrant in the reports that it files or submits on Form N-CSR is accumulated and communicated to the Registrant's management, including its principal executive and principal financial officers, as appropriate to allow timely decisions regarding required disclosure.
(b) There were no changes to the Registrant's internal control over financial reporting that occurred during the second fiscal quarter of the period covered by this report that have materially affected, or are reasonably likely to materially affect, the Registrant's internal control over financial reporting.
Item 12. Disclosure of Securities Lending Activities for Closed-End Management Investment Companies.
Not applicable.
Item 13. Exhibits.
(a)(1) Code of ethics referred to in Item 2.
(a)(2) Certifications of principal executive and principal financial officers as required by Rule 30a-2(a) under the Investment Company Act of 1940.
(a)(3) Not applicable.
(b) Certification of principal executive and principal financial officers as required by Rule 30a-2(b) under the Investment Company Act of 1940.
SIGNATURES
Pursuant to the requirements of the Securities Exchange Act of 1934 and the Investment Company Act of 1940, the Registrant has duly caused this Report to be signed on its behalf by the undersigned, thereunto duly authorized.
The Dreyfus/Laurel Funds, Inc.
By: /s/ Bradley J. Skapyak
Bradley J. Skapyak
President
Date: January 2, 2019
Pursuant to the requirements of the Securities Exchange Act of 1934 and the Investment Company Act of 1940, this Report has been signed below by the following persons on behalf of the Registrant and in the capacities and on the dates indicated.
By: /s/ Bradley J. Skapyak
Bradley J. Skapyak
President
Date: January 2, 2019
By: /s/ James Windels
James Windels
Treasurer
Date: January 2, 2019
EXHIBIT INDEX
(a)(1) Code of ethics referred to in Item 2.
(a)(2) Certifications of principal executive and principal financial officers as required by Rule 30a-2(a) under the Investment Company Act of 1940. (EX-99.CERT)
(b) Certification of principal executive and principal financial officers as required by Rule 30a-2(b) under the Investment Company Act of 1940. (EX-99.906CERT)


