We are pleased to present this annual report for BNY Mellon Floating Rate Income Fund, formerly Dreyfus Floating Rate Income Fund, covering the 12-month period from September 1, 2018 through August 31, 2019. For information about how the fund performed during the reporting period, as well as general market perspectives, we provide a Discussion of Fund Performance on the pages that follow.
After a strong summer, equity markets weakened in the fourth quarter of 2018, as concerns about rising interest rates, trade tensions and slowing global growth provided downward pressure on returns. In December 2018, stocks experienced a sharp sell-off, as it appeared that the U.S. Federal Reserve (the “Fed”) would maintain its hawkish stance on monetary policy. In January 2019, the Fed commented that it would slow the pace of interest-rate increases, which helped stimulate a rebound across equity markets that continued into the second quarter. Escalating trade tensions disrupted equity markets again in May. The dip was short-lived, as markets rose once again in June. However, despite continued supportive central bank policies, pockets of volatility persisted through the end of the period.
In fixed-income markets, returns were hampered early in the reporting period by rising interest rates and accelerating inflation. With the return of stock market volatility in October 2018, a flight to quality led to a rise in prices for U.S. Treasuries that continued through the end of the year, leading to a flattening yield curve. After the Fed’s supportive statements in January 2019, other developed market central banks followed suit and reiterated their abilities to bolster flagging growth by continuing supportive policies. This helped to further buoy fixed-income instrument prices. At the end of July, the Fed cut the federal funds rate by 25 basis points. Both the U.S. and Global Bloomberg Barclays Aggregate Bond indices produced strong returns for the 12 months.
We believe that over the near term, the outlook for the U.S. remains positive, but we will monitor relevant data for any signs of a change. As always, we encourage you to discuss the risks and opportunities in today’s investment environment with your financial advisor.
Thank you for your continued confidence and support.
DISCUSSION OF FUND PERFORMANCE(Unaudited)
For the period from September 1, 2018 through August 31, 2019, as provided by the fund’s primary portfolio managers, Kevin Cronk, Chris Barris and Leland Hart of Alcentra NY, LLC, Sub-Investment Adviser
Market and Fund Performance Overview
For the 12-month period ended August 31, 2019, BNY Mellon Floating Rate Income Fund’s (formerly, Dreyfus Floating Rate Income Fund) Class A shares produced a total return of 1.59%, Class C shares returned 0.82%, Class I shares returned 1.78%, and Class Y shares returned 1.90%.1 Effective December 31, 2018, the fund’s benchmark changed to the Credit Suisse Leveraged Loan Index (the “Index”), which produced a total return of 3.38% for the same period. The fund’s former benchmark, the S&P/LSTA U.S. Leveraged Loan Index, produced a total return of 3.31% for the 12 months.2, 3
Floating-rate loans generally produced positive total returns over the reporting period, amid pockets of interest-rate volatility and slowing growth. The fund lagged the Index primarily due to credit and sector selection during the reporting period.
The Fund’s Investment Approach
The fund seeks high current income. To pursue its goal, the fund normally invests at least 80% of its net assets, plus any borrowings for investment purposes, in floating-rate loans and other floating-rate securities. These investments should enable the fund to effectively achieve a floating rate of income. The fund currently intends to invest principally in floating-rate loans and other floating-rate securities of U.S. issuers, but may invest up to 30% of its net assets in securities of foreign issuers.
We buy and sell securities through a value-oriented, bottom-up research process that incorporates a top-down overlay. We use fundamental credit analysis to identify favorable and unfavorable risk/reward opportunities across quality segments, industries and credits, while seeking to mitigate downside risk. Fundamental analysis is complemented by our top-down outlook, which considers market fundamentals, technicals and valuations.
A Tale of Two Markets
Over the reporting period, several shifts in investor sentiment and behavior occurred. During the month of September 2018, markets were still enjoying momentum from strong summer 2018 returns. However, in the final three months of 2018, concerns over slowing global growth, trade disputes, and a continued hawkish trajectory by the U.S. Federal Reserve (the “Fed”) led to a sharp change in sentiment as investors fled risk assets. During this volatility, redemptions from U.S. bank-loan mutual funds accelerated, with December seeing record outflows. Higher-quality BB rated loans, which are typically larger and more liquid, underperformed during this period of mutual fund selling.
Investor sentiment and market performance shifted once again in January 2019 as investors became more comfortable with slowing growth and began to anticipate more accommodative Fed policy. Prices of fixed-income instruments continued to rally throughout much of the latter half of the reporting period on declining interest rates. In this environment, floating-rate bank loans trailed most fixed-income assets. Higher-quality BB rated loans outperformed the broader market while low-quality CCC loans lagged. At its July 2019 meeting, the Fed continued its accommodative policies by cutting the federal funds rate by 25 basis points. Throughout much of the latter half of the period, rates generally fell, and the Treasury yield curve flattened.
Sector Allocation and Credit Selection Dampen Performance
The fund’s performance compared to the Index was constrained over the reporting period by sector allocation and credit selection. Relative overweights in two commodity sectors, energy and metals & mining, contributed to the underperformance. They were among the worst-performing sectors during the 12 months and provided a headwind to returns. This was partially offset by a beneficial underweight position in the retail sector, another lagging industry. Within credit selection, choices
3
DISCUSSION OF FUND PERFORMANCE(Unaudited) (continued)
within the health care, energy, leisure and services sectors were among the top detractors from results. In particular, bonds from Envision Healthcare, Gavilan Resources,NPC International and Constellis Holdings were the most challenged. We have since exited our position inNPC International. Credit selection within the financials and other media sectors benefited performance as the position in York Risk Services appreciated in price and the fund exited underperformingDeluxe Entertainment loans.
The fund achieved better results through other strategies. Quality selection was positive for the period. The fund was underweight to CCC rated securities, which benefited portfolio results as this lower-quality debt underperformed throughout the period. The fund’s underweight to BBs was helpful in the fourth quarter of 2018 but detracted from returns in 2019. In addition, high yield bond holdings in the fund aided performance, especially as interest rates declined in 2019.
Positioned for Moderating Economic Growth
We believe global growth is facing headwinds generated by trade disputes and slowing economies in the euro zone. U.S. growth has also begun to moderate, led by a reduction in corporate spending. Many companies have pulled back capital expenditures due to uncertainty regarding the economic outlook. However, these cutbacks are partially offset by strong consumer spending, bolstered by continuing strength in the U.S. jobs market.
Given this outlook, we are cautious about low-quality CCC and cyclical credits and industries. We have pared back exposure to cyclical sectors, such as automotive, chemicals, and commodities, while favoring more defensive sectors, like cable and certain health care subsectors.
We are maintaining our overweight to B rated securities and underweight to low-yielding BBs. We have reduced our exposure to second lien loans and CLOs but continue to hold select high yield bonds. We expect to actively manage the fund’s quality, sector, and credit exposures as we navigate the evolving credit cycle.
September 16, 2019
1 Total return includes reinvestment of dividends and any capital gains paid and does not take into consideration the maximum initial sales charge in the case of Class A shares, or the applicable contingent deferred sales charge imposed on redemptions in the case of Class C shares. Had these charges been reflected, returns would have been lower. Past performance is no guarantee of future results. Share price, yield and investment return fluctuate such that upon redemption, fund shares may be worth more or less than their original cost. The fund’s returns reflect the absorption of certain fund expenses by the fund’s investment adviser pursuant to an agreement in effect through December 31, 2019, at which time it may be extended, terminated, or modified. Had these expenses not been absorbed, the fund’s returns would have been lower.
2 Source: Morningstar – The Credit Suisse Leveraged Loan Index is a monthly rebalanced index. It is designed to mirror the investable universe of the U.S. dollar-denominated leveraged loan market. Investors cannot invest directly in any index.
3 Source: Lipper Inc. The S&P/LSTA U.S. Leveraged Loan Index is a market value-weighted index designed to measure the performance of the U.S. leveraged loan market based upon market weightings, spreads and interest payments. Investors cannot invest directly in any index.
Floating-rate loans are subject generally to interest-rate, credit, liquidity and market risks, to varying degrees, all of which are more fully described in the fund’s prospectus.
Please note: the position in any security highlighted with italicized typeface was sold during the reporting period.
The risks of an investment in a collateralized loan obligation (CLO) depend largely on the type of the collateral and the tranche of the CLO in which the fund invests. CLO tranches can experience substantial losses due to actual defaults, increased sensitivity to defaults due to collateral default, market anticipation of defaults, as well as aversion to CLO securities as an asset class.
High yield bonds are subject to increased credit risk and are considered speculative in terms of the issuer’s perceived ability to continue making interest payments on a timely basis and to repay principal upon maturity.
The fund may use derivative instruments, such as options, futures, options on futures, forward contracts, and swaps. A small investment in derivatives could have a potentially large impact on the fund’s performance. The use of derivatives involves risks different from, or possibly greater than, the risks associated with investing directly in the underlying assets.
4
FUND PERFORMANCE(Unaudited)
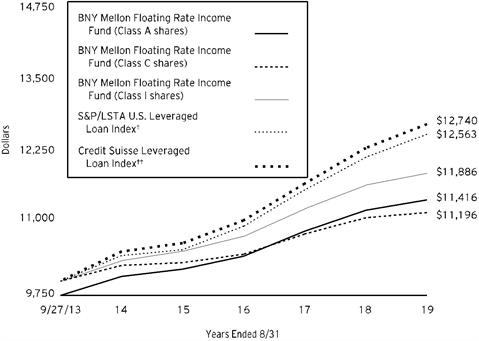
Comparison of change in value of a $10,000 investment in Class A shares, Class C shares and Class I shares of BNY Mellon Floating Rate Income Fund with a hypothetical investment of $10,000 in the Credit Suisse Leveraged Loan Index and, the fund’s benchmark prior to December 31, 2018, the S&P/LSTA U.S. Leveraged Loan Index
† Source: Lipper Inc.
†† Source: Morningstar
Past performance is not predictive of future performance.
The above graph compares a hypothetical $10,000 investment made in each of the Class A, Class C and Class I shares of BNY Mellon Floating Rate Income Fund on9/27/13 (inception date) to a hypothetical investment of $10,000 made in the Credit Suisse Leveraged Loan Index and S&P/LSTA U.S. Leveraged Loan Index on that date. All dividends and capital gain distributions are reinvested.
The fund’s performance shown in the line graph above takes into account the maximum initial sales charge on Class A shares and all other applicable fees and expenses on all classes. The Credit Suisse Leveraged Loan Index is an unmanaged index designed to track the performance of the investable universe of the U.S. dollar denominated leveraged loan market. The S&P/LSTA U.S. Leveraged Loan Index is a market value-weighted index designed to measure the performance of the U.S. leveraged loan market based upon market weightings, spreads and interest payments. Unlike a mutual fund, the Indices are not subject to charges, fees and other expenses. Investors cannot invest directly in any index. Further information relating to fund performance, including expense reimbursements, if applicable, is contained inthe Financial Highlights section of the prospectus and elsewhere in this report.
5
FUND PERFORMANCE(Unaudited) (continued)
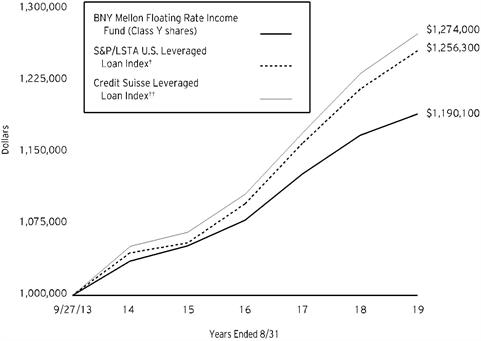
Comparison of change in value of a $1,000,000 investment in Class Y shares of BNY Mellon Floating Rate Income Fund with a hypothetical investment of $1,000,000 in the Credit Suisse Leveraged Loan Index and, the fund’s benchmark prior to December 31, 2018, the S&P/LSTA U.S. Leveraged Loan Index
† Source: Lipper Inc.
†† Source: Morningstar
Past performance is not predictive of future performance.
The above graph compares a hypothetical $1,000,000 investment made in Class Y shares of BNY Mellon Floating Rate Income Fund on9/27/13 (inception date) to a hypothetical investment of $1,000,000 made in the Credit Suisse Leveraged Loan Index and S&P/LSTA U.S. Leveraged Loan Index on that date. All dividends and capital gain distributions are reinvested.
The fund’s performance shown in the line graph above takes into account the maximum initial sales charge on Class Y shares and all other applicable fees and expenses on all classes. The Credit Suisse Leveraged Loan Index is an unmanaged index designed to track the performance of the investable universe of the U.S. dollar denominated leveraged loan market. The S&P/LSTA U.S. Leveraged Loan Index is a market value-weighted index designed to measure the performance of the U.S. leveraged loan market based upon market weightings, spreads and interest payments. Unlike a mutual fund, the Indices are not subject to charges, fees and other expenses. Investors cannot invest directly in any index. Further information relating to fund performance, including expense reimbursements, if applicable, is contained in the Financial Highlights section of the prospectus and elsewhere in this report.
6
| | | | | |
Average Annual Total Returns as of 8/31/19 | | | |
| Inception
Date | 1 Year | 5 Years | From
Inception |
Class A shares | | | | |
with maximum sales charge (2.50%) | 9/27/13 | -0.95% | 2.01% | 2.26% |
without sales charge | 9/27/13 | 1.59% | 2.52% | 2.69% |
Class C shares | | | | |
with applicable redemption charge† | 9/27/13 | -0.14% | 1.74% | 1.92% |
without redemption | 9/27/13 | 0.82% | 1.74% | 1.92% |
Class I shares | 9/27/13 | 1.78% | 2.79% | 2.96% |
Class Y shares | 9/27/13 | 1.90% | 2.81% | 2.98% |
Credit Suisse Leveraged Loan Index | 9/30/13 | 3.38% | 3.91% | 4.12%†† |
S&P/LSTA U.S. Leveraged Loan Index | 9/30/13 | 3.31% | 3.76% | 3.93%†† |
† The maximum contingent deferred sales charge for Class C shares is 1% for shares redeemed within one year of the date of purchase.
†† For comparative purposes, the value of the Index on 9/30/13 is used as the beginning value on 9/27/13.
The performance data quoted represents past performance, which is no guarantee of future results. Share price and investment return fluctuate and an investor’s shares may be worth more or less than original cost upon redemption. Current performance may be lower or higher than the performance quoted. Go to im.bnymellon.com for the fund’s most recent month-end returns.
The fund’s performance shown in the graphs and table does not reflect the deduction of taxes that a shareholder would pay on fund distributions or the redemption of fund shares. In addition to the performance of Class A shares shown with and without a maximum sales charge, the fund’s performance shown in the table takes into account all other applicable fees and expenses on all classes.
7
UNDERSTANDING YOUR FUND’S EXPENSES(Unaudited)
As a mutual fund investor, you pay ongoing expenses, such as management fees and other expenses. Using the information below, you can estimate how these expenses affect your investment and compare them with the expenses of other funds. You also may pay one-time transaction expenses, including sales charges (loads) and redemption fees, which are not shown in this section and would have resulted in higher total expenses. For more information, see your fund’s prospectus or talk to your financial adviser.
Review your fund’s expenses
The table below shows the expenses you would have paid on a $1,000 investment in BNY Mellon Floating Rate Income Fund from March 1, 2019 to August 31, 2019. It also shows how much a $1,000 investment would be worth at the close of the period, assuming actual returns and expenses.
| | | | | | | |
Expenses and Value of a $1,000 Investment | |
Assume actual returns for the six months ended August 31, 2019 | |
| | | | | | |
| | Class A | Class C | Class I | Class Y | |
Expense paid per $1,000† | $5.07 | $8.86 | $3.81 | $3.65 | |
Ending value (after expenses) | $1,012.80 | $1,008.90 | $1,013.40 | $1,013.60 | |
COMPARING YOUR FUND’S EXPENSES
WITH THOSE OF OTHER FUNDS(Unaudited)
Using the SEC’s method to compare expenses
The Securities and Exchange Commission (“SEC”) has established guidelines to help investors assess fund expenses. Per these guidelines, the table below shows your fund’s expenses based on a $1,000 investment, assuming a hypothetical 5% annualized return. You can use this information to compare the ongoing expenses (but not transaction expenses or total cost) of investing in the fund with those of other funds. All mutual fund shareholder reports will provide this information to help you make this comparison. Please note that you cannot use this information to estimate your actual ending account balance and expenses paid during the period.
| | | | | | | |
Expenses and Value of a $1,000 Investment | |
Assuming a hypothetical 5% annualized return for the six months ended August 31, 2019 | |
| | | | | | |
| | Class A | Class C | Class I | Class Y | |
Expense paid per $1,000† | $5.09 | $8.89 | $3.82 | $3.67 | |
Ending value (after expenses) | $1,020.16 | $1,016.38 | $1,021.42 | $1,021.58 | |
† Expenses are equal to the fund‘s annualized expense ratio of 1.00% for Class A, 1.75% for Class C, .75% for Class I and .72% for Class Y, multiplied by the average account value over the period, multiplied by 184/365 (to reflect the one-half year period). |
8
STATEMENT OF INVESTMENTS
August 31, 2019
| | | | | | | | | | |
| |
Description | Coupon
Rate (%) | | Maturity
Date | | Principal
Amount ($)
| a | Value ($) | |
Bonds and Notes - 5.9% | | | | | |
Collateralized Loan Obligations Debt - 3.7% | | | | | |
Babson CLO , Ser. 2015-1A, Cl. ER, 3 Month LIBOR +5.50% | | 7.78 | | 1/20/2031 | | 3,000,000 | b,c | 2,566,689 | |
Babson Euro CLO, Ser. 2014-2A, Cl. FR, 3 Month EURIBOR +7.00% @ Floor | EUR | 7.00 | | 11/25/2029 | | 2,000,000 | b,c | 2,048,862 | |
Barings CLO, Ser. 2018-1A, Cl. D, 3 Month LIBOR +5.50% | | 7.80 | | 4/15/2031 | | 2,900,000 | b,c | 2,626,409 | |
Carlyle Global Market Strategies CLO, Ser. 2014-1A, Cl. ER, 3 Month LIBOR +5.40% | | 7.70 | | 4/17/2031 | | 4,000,000 | b,c | 3,494,863 | |
Catamaran CLO, Ser. 2015-1A, Cl. E, 3 Month LIBOR +5.15% | | 7.43 | | 4/22/2027 | | 3,000,000 | b,c | 2,851,880 | |
CIFC Funding, Ser. 2012-2RA, Cl. D, 3 Month LIBOR +5.45% | | 7.73 | | 1/20/2028 | | 1,000,000 | b,c | 951,451 | |
Dryden 37 Senior Loan Fund, Ser. 2015-37A, Cl. ER, 3 Month LIBOR +5.15% | | 7.45 | | 1/15/2031 | | 5,000,000 | b,c | 4,455,141 | |
Goldentree Loan Management US CLO 2, Ser. 2017-2A, Cl. E, 3 Month LIBOR +4.70% | | 6.98 | | 11/28/2030 | | 1,984,000 | b,c | 1,776,056 | |
Marble Point CLO XII, Ser. 2018-1A, Cl. E, 3 Month LIBOR +6.00% | | 8.32 | | 7/16/2031 | | 1,250,000 | b,c | 1,090,372 | |
OCP CLO, Ser. 2014-6A, Cl. DR, 3 Month LIBOR +6.52% | | 8.82 | | 10/17/2030 | | 2,000,000 | b,c | 1,832,412 | |
OZLM VI, Ser. 2014-6A, Cl. DS, 3 Month LIBOR +6.05% | | 8.35 | | 4/17/2031 | | 4,000,000 | b,c | 3,617,632 | |
Rockford Tower CLO, Ser. 2018-1A, Cl. E, 3 Month LIBOR +5.85% | | 7.99 | | 5/20/2031 | | 1,500,000 | b,c | 1,386,462 | |
Sounds Point CLO IV-R, Ser. 2013-3RA, Cl. E, 3 Month LIBOR +6.25% | | 8.55 | | 4/18/2031 | | 3,000,000 | b,c | 2,701,029 | |
Vibrant CLO III, Ser. 2015-3A, Cl. DRR, 3 Month LIBOR +6.35% | | 8.63 | | 10/20/2031 | | 2,000,000 | b,c | 1,851,481 | |
| | 33,250,739 | |
Commercial & Professional Services - .2% | | | | | |
Verscend Escrow, Sr. Unscd. Notes | | 9.75 | | 8/15/2026 | | 2,000,000 | c | 2,148,660 | |
Diversified Financials - .3% | | | | | |
Nationstar Mortgage, Gtd. Notes | | 6.50 | | 7/1/2021 | | 3,000,000 | | 3,011,250 | |
Health Care - .2% | | | | | |
Polaris Intermediate, Sr. Unscd. Notes | | 8.50 | | 12/1/2022 | | 2,000,000 | c | 1,690,000 | |
Materials - .8% | | | | | |
ARD Securities Finance, Sr. Scd. Notes | | 8.75 | | 1/31/2023 | | 3,291,599 | c | 3,423,263 | |
Peabody Energy, Sr. Scd. Notes | | 6.38 | | 3/31/2025 | | 2,000,000 | c | 2,088,750 | |
9
STATEMENT OF INVESTMENTS (continued)
| | | | | | | | | | |
| |
Description | Coupon
Rate (%) | | Maturity
Date | | Principal
Amount ($) | a | Value ($) | |
Bonds and Notes - 5.9% (continued) | | | | | |
Materials - .8% (continued) | | | | | |
Trivium Packaging Finance, Sr. Scd. Notes | | 5.50 | | 8/15/2026 | | 1,550,000 | c | 1,643,000 | |
| | 7,155,013 | |
Media - .2% | | | | | |
Scripps Escrow, Sr. Unscd. Notes | | 5.88 | | 7/15/2027 | | 2,000,000 | c | 2,022,500 | |
Real Estate - .2% | | | | | |
Greystar Real Estate Partners, Sr. Scd. Notes | | 5.75 | | 12/1/2025 | | 1,250,000 | c | 1,284,813 | |
Retailing - .3% | | | | | |
Staples, Sr. Scd. Notes | | 7.50 | | 4/15/2026 | | 3,000,000 | c | 3,037,500 | |
TotalBonds and Notes
(cost $56,857,049) | | 53,600,475 | |
| | | | | | | | | |
Floating Rate Loan Interests - 91.2% | | | | | |
Advertising - 1.6% | | | | | |
ABG Intermediate Holdings 2, First Lien Initial Term Loan, 1 Month LIBOR +3.50% | | 5.61 | | 9/29/2024 | | 5,003,782 | b | 5,003,782 | |
Clear Channel Outdoor Holdings, Term B Loan, 1 Month LIBOR +3.50% | | 5.67 | | 8/9/2026 | | 3,658,537 | b | 3,660,823 | |
Red Ventures, First Lien Term B-1 Loan, 1 Month LIBOR +3.00% | | 5.11 | | 11/8/2024 | | 5,766,534 | b | 5,771,494 | |
| | 14,436,099 | |
Automobiles & Components - 1.4% | | | | | |
Dealer Tire, Initial Term Loan, 1-3 Month LIBOR +5.50% | | 7.72 | | 12/19/2025 | | 4,438,875 | b | 4,466,618 | |
Panther BF Aggregator 2, First Lien Initial Dollar Term Loan, 1 Month LIBOR +3.50% | | 5.61 | | 4/30/2026 | | 1,854,608 | b | 1,831,426 | |
Panther BF Aggregator 2, First Lien Initial Euro Term Loan, 1 Month EURIBOR +3.75% @ Floor | EUR | 3.75 | | 4/30/2026 | | 3,000,000 | b | 3,305,096 | |
UOS, Initial Term Loan, 3 Month LIBOR +5.50% | | 7.83 | | 4/18/2023 | | 2,715,027 | b | 2,742,178 | |
| | 12,345,318 | |
Building Materials - 1.8% | | | | | |
Forterra Finance, Replacement Term Loan, 1 Month LIBOR +3.00% | | 5.11 | | 10/25/2023 | | 5,287,948 | b | 4,970,671 | |
NCI Building Systems, Initial Term Loan, 1 Month LIBOR +3.75% | | 5.95 | | 4/12/2025 | | 5,939,508 | b | 5,798,445 | |
Tamko Building Products, Initial Term Loan, 3 Month LIBOR +3.25% | | 5.48 | | 5/31/2026 | | 5,794,549 | b | 5,809,035 | |
| | 16,578,151 | |
10
| | | | | | | | | | |
| |
Description | Coupon
Rate (%) | | Maturity Date | | Principal Amount ($) | a | Value ($) | |
Floating Rate Loan Interests - 91.2%(continued) | | | | | |
Chemicals - 2.4% | | | | | |
AgroFresh, Term Loan, 2-3 Month LIBOR +4.75% | | 7.19 | | 7/31/2021 | | 1,876,692 | b | 1,787,549 | |
Colouroz Investment 2, First Lien Initial Term B-2 Loan, 3 Month LIBOR +3.00% | | 5.29 | | 9/7/2021 | | 4,100,717 | b | 3,280,573 | |
Cyanco Intermediate, First Lien Initial Term Loan, 1 Month LIBOR +3.50% | | 5.61 | | 3/16/2025 | | 3,473,917 | b | 3,468,845 | |
Encapsys, First Lien Initial Term Loan, 1 Month LIBOR +3.50% | | 5.61 | | 11/7/2024 | | 4,490,323 | b | 4,496,879 | |
Flint Group, First Lien Initial Term C Loan, 3 Month LIBOR +3.00% | | 5.29 | | 9/7/2021 | | 728,388 | b | 582,711 | |
OCI Partners, Initial Term Loan, 3 Month LIBOR +4.00% | | 6.33 | | 3/13/2025 | | 4,660,714 | b | 4,654,888 | |
Polar US Borrower, Initial Term Loan, 3 Month LIBOR +4.75% | | 7.07 | | 10/16/2025 | | 3,535,995 | b | 3,407,815 | |
| | 21,679,260 | |
Commercial & Professional Services - 8.4% | | | | | |
AVSC Holding, Initial Term Loan, 1-3 Month LIBOR +3.25% | | 5.48 | | 3/1/2025 | | 5,847,559 | b | 5,686,751 | |
AVSC Holding, Second Lien Initial Loan, 3 Month LIBOR +7.25% | | 9.50 | | 9/1/2025 | | 1,061,750 | b | 1,021,934 | |
Camelot Finance, 2017-2 Refinancing Term Loan, 1 Month LIBOR +3.25% | | 5.36 | | 10/3/2023 | | 7,546 | b | 7,579 | |
Cast & Crew Payroll, First Lien Initial Term Loan, 1 Month LIBOR +4.00% | | 6.12 | | 2/7/2026 | | 1,374,339 | b | 1,382,070 | |
CHG Healthcare Services, New Term Loan, 1 Month LIBOR +3.00% | | 5.11 | | 6/7/2023 | | 4,134,969 | b | 4,109,125 | |
Constellis Holdings, First Lien Initial Term B Loan, 2-3 Month LIBOR +5.00% | | 7.26 | | 4/21/2024 | | 5,243,000 | b | 3,691,963 | |
Creative Artists Agency, Amendment No 7 Refinancing Term Loan, 1 Month LIBOR +3.00% | | 5.11 | | 2/15/2024 | | 5,056,420 | b | 5,064,636 | |
Electro Rent, First Lien Initial Term Loan, 3 Month LIBOR +5.00% | | 7.29 | | 1/31/2024 | | 2,475,629 | b | 2,487,239 | |
Employbridge, Refinancing Term Loan, 3 Month LIBOR +4.50% | | 6.83 | | 4/18/2025 | | 2,925,134 | b | 2,922,692 | |
Fort Dearborn Holding, First Lien Initial Term Loan, 1-3 Month LIBOR +4.00% | | 6.29 | | 10/19/2023 | | 2,464,307 | b | 2,424,262 | |
Legalzoom.com, 2018 Term Loan, 1 Month LIBOR +4.50% | | 6.61 | | 11/21/2024 | | 2,388,000 | b | 2,404,418 | |
Lineage Logistics, Term Loan, 1 Month LIBOR +3.00% | | 5.11 | | 2/27/2025 | | 3,329,980 | b | 3,325,834 | |
11
STATEMENT OF INVESTMENTS (continued)
| | | | | | | | | | |
| |
Description | Coupon
Rate (%) | | Maturity Date | | Principal Amount ($) | a | Value ($) | |
Floating Rate Loan Interests - 91.2%(continued) | | | | | |
Commercial & Professional Services - 8.4% (continued) | | | | | |
National Intergovernmental, First Lien Initial Term Loan, 3 Month LIBOR +3.75% | | 6.08 | | 5/23/2025 | | 4,073,632 | b | 4,032,896 | |
Parexel International, Initial Term Loan, 1 Month LIBOR +2.75% | | 4.86 | | 9/27/2024 | | 3,638,401 | b | 3,437,961 | |
Pi Lux Finco, Facility B-2 Term Loan, 1 Month EURIBOR +3.00% @ Floor | EUR | 3.00 | | 1/1/2025 | | 2,000,000 | b | 2,186,010 | |
Pi Lux Finco, Second Lien Facility 1 Term Loan, 1 Month LIBOR +7.25% | | 9.36 | | 1/1/2026 | | 1,250,000 | b | 1,218,750 | |
Pre-Paid Legal Services, First Lien Initial Term Loan, 1 Month LIBOR +3.25% | | 5.36 | | 5/1/2025 | | 3,788,036 | b | 3,773,831 | |
Swordfish Merger Sub., First Lien Initial Term Loan, 1 Month LIBOR +3.00% | | 5.21 | | 2/1/2025 | | 4,727,028 | b | 4,549,765 | |
Transaction Network Services, Initial Term Loan, 3 Month LIBOR +4.00% | | 6.26 | | 2/14/2020 | | 3,618,472 | b | 3,576,625 | |
USS Ultimate Holdings, First Lien Initial Term Loan, 3 Month LIBOR +3.75% | | 6.01 | | 8/25/2024 | | 3,704,937 | b | 3,702,640 | |
Verscend Holding, Term B Loan, 1 Month LIBOR +4.50% | | 6.61 | | 8/27/2025 | | 4,474,342 | b | 4,496,714 | |
Wand NewCo 3, First Lien Initial Term Loan, 1 Month LIBOR +3.50% | | 5.71 | | 2/5/2026 | | 5,590,000 | b | 5,618,816 | |
Weight Watchers International, Initial Term Loan, 1-3 Month LIBOR +4.75% | | 7.03 | | 11/29/2024 | | 5,562,816 | b | 5,583,677 | |
| | 76,706,188 | |
Consumer Discretionary - 3.7% | | | | | |
Ap Gaming, First Lien Incremental Term B Loan, 1 Month LIBOR +3.50% | | 5.61 | | 2/15/2024 | | 5,593,586 | b | 5,511,416 | |
Compuware, Senior Secured Term Loan, 1 Month LIBOR +4.00% | | 6.11 | | 8/23/2025 | | 3,560,837 | b | 3,578,641 | |
Hayward Industries, Initial Term Loan, 1 Month LIBOR +3.50% | | 5.61 | | 8/4/2024 | | 5,413,334 | b | 5,217,101 | |
Scientific Games International, Initial Term B-5 Loan, 1-2 Month LIBOR +2.75% | | 4.87 | | 8/14/2024 | | 4,481,099 | b | 4,435,347 | |
Stars Group Holdings, USD Term Loan, 3 Month LIBOR +3.50% | | 5.83 | | 7/10/2025 | | 4,482,904 | b | 4,502,203 | |
UFC Holdings, Term B Loan, 1 Month LIBOR +3.25% | | 5.37 | | 4/29/2026 | | 3,355,622 | b | 3,364,011 | |
12
| | | | | | | | | | |
| |
Description | Coupon
Rate (%) | | Maturity Date | | Principal Amount ($) | a | Value ($) | |
Floating Rate Loan Interests - 91.2%(continued) | | | | | |
Consumer Discretionary - 3.7% (continued) | | | | | |
Varsity Brands Holding, First Lien Initial Term Loan, 1 Month LIBOR +3.50% | | 5.61 | | 12/15/2024 | | 3,886,171 | b | 3,792,125 | |
William Morris Endeavor, New Term B-1 Loan, 1 Month LIBOR +2.75% | | 4.87 | | 5/29/2025 | | 3,222,230 | b | 3,143,285 | |
| | 33,544,129 | |
Consumer Staples - .4% | | | | | |
Kik Custom Products, Term B-3 Loan, 3 Month LIBOR +4.00% | | 6.26 | | 5/15/2023 | | 4,100,000 | b | 3,901,827 | |
Diversified Financials - 2.5% | | | | | |
Blackhawk Network Holdings, First Lien Term Loan, 1 Month LIBOR +3.00% | | 5.11 | | 6/15/2025 | | 6,170,864 | b | 6,134,240 | |
Capital Automotive, Second Lien Initial Tranche B Term Loan, 1 Month LIBOR +6.00% | | 8.12 | | 3/24/2025 | | 1,638,556 | b | 1,648,806 | |
HNC Holdings, Initial Term Loan, 1 Month LIBOR +4.00% | | 6.11 | | 10/5/2023 | | 2,345,939 | b | 2,348,144 | |
Masergy Communications, 2017 First Lien Replacement Term Loan, 3 Month LIBOR +3.25% | | 5.58 | | 12/15/2023 | | 2,789,956 | b | 2,751,594 | |
PGX Holdings, First Lien Initial Term Loan, 1 Month LIBOR +5.25% | | 7.37 | | 9/29/2020 | | 1,635,723 | b | 1,521,222 | |
Pi US Mergerco, Facility B-1 Term Loan, 1 Month LIBOR +3.25% | | 5.36 | | 1/1/2025 | | 2,699,469 | b | 2,676,416 | |
VFH Parent, Initial Term Loan, 6 Month LIBOR +3.50% | | 6.04 | | 3/1/2026 | | 5,413,961 | b | 5,432,341 | |
| | 22,512,763 | |
Energy - 4.7% | | | | | |
Blackstone CQP Holdco, Initial Term Loan, 3 Month LIBOR +3.50% | | 5.89 | | 6/20/2024 | | 2,807,775 | b | 2,812,170 | |
Brazos Delaware II, Initial Term Loan, 1 Month LIBOR +4.00% | | 6.17 | | 5/29/2025 | | 4,096,557 | b | 3,700,543 | |
Gavilan Resources, Second Lien Initial Term Loan, 1 Month LIBOR +6.00% | | 8.11 | | 3/1/2024 | | 2,684,000 | b | 1,201,090 | |
GIP III Stetson I, Initial Term Loan, 1 Month LIBOR +4.25% | | 6.43 | | 7/18/2025 | | 5,448,649 | b | 5,257,946 | |
Granite Acquisition, First Lien Term B Loan, 3 Month LIBOR +3.50% | | 5.82 | | 12/17/2021 | | 5,313,397 | b | 5,339,964 | |
Granite Acquisition, First Lien Term C Loan, 3 Month LIBOR +3.50% | | 5.83 | | 12/17/2021 | | 407,516 | b | 409,554 | |
Granite Acquisition, Second Lien Term B Loan, 3 Month LIBOR +7.25% | | 9.58 | | 12/19/2022 | | 469,111 | b | 469,846 | |
13
STATEMENT OF INVESTMENTS (continued)
| | | | | | | | | | |
| |
Description | Coupon
Rate (%) | | Maturity Date | | Principal Amount ($) | a | Value ($) | |
Floating Rate Loan Interests - 91.2%(continued) | | | | | |
Energy - 4.7% (continued) | | | | | |
Lower Cadence Holdings, Initial Term Loan, 1 Month LIBOR +4.00% | | 6.15 | | 5/8/2026 | | 6,133,792 | b | 5,997,714 | |
Lucid Energy Group II, Initial Term Loan, 1 Month LIBOR +3.00% | | 5.11 | | 2/18/2025 | | 5,923,767 | b | 5,490,592 | |
Natgasoline, Initial Term Loan, 3 Month LIBOR +3.50% | | 5.81 | | 11/14/2025 | | 3,537,653 | b | 3,555,342 | |
Prairie Eci Acquiror, Initial Term Loan, 3 Month LIBOR +4.75% | | 7.08 | | 3/11/2026 | | 4,802,963 | b | 4,704,502 | |
WaterBridge Midstream Operating, Initial Term Loan, 3 Month LIBOR +5.75% | | 8.14 | | 6/21/2026 | | 3,890,000 | b | 3,734,400 | |
| | 42,673,663 | |
Environmental Control - 2.5% | | | | | |
EnergySolutions, Initial Term Loan, 3 Month LIBOR +3.75% | | 6.08 | | 5/11/2025 | | 4,964,478 | b | 4,710,048 | |
Filtration Group, Initial Dollar Term Loan, 1 Month LIBOR +3.00% | | 5.11 | | 3/29/2025 | | 4,633,356 | b | 4,640,607 | |
GFL Environmental, 2018 Incremental Term Loan, 1 Month LIBOR +3.00% | | 5.11 | | 5/31/2025 | | 6,939,358 | b | 6,884,711 | |
Packers Holdings, Initial Term Loan, 6 Month LIBOR +3.00% | | 5.32 | | 12/4/2024 | | 5,671,193 | b | 5,600,303 | |
US Ecology, Term B Loan, 3 Month LIBOR +2.50% | | 4.79 | | 8/14/2026 | | 731,982 | b | 735,872 | |
| | 22,571,541 | |
Food Products - .7% | | | | | |
Albertson's, 2019-1 Term B-7 Loan, 1 Month LIBOR +2.75% | | 4.86 | | 11/17/2025 | | 3,746,241 | b | 3,763,810 | |
UTZ Quality Foods, First Lien Initial Term Loan, 1 Month LIBOR +3.50% | | 5.61 | | 11/21/2024 | | 2,955,000 | b | 2,950,449 | |
| | 6,714,259 | |
Food Service - .7% | | | | | |
TKC Holdings, First Lien Initial Term Loan, 1 Month LIBOR +3.75% | | 5.87 | | 2/1/2023 | | 4,918,676 | b | 4,814,154 | |
TKC Holdings, Second Lien Initial Term Loan, 1 Month LIBOR +8.00% | | 10.12 | | 2/1/2024 | | 1,224,564 | b | 1,203,141 | |
| | 6,017,295 | |
Forest Products & Other - .0% | | | | | |
Dunn Paper, First Lien Term Loan, 1 Month LIBOR +4.75% | | 6.88 | | 8/26/2022 | | 372,544 | b | 370,448 | |
Health Care - 10.9% | | | | | |
Agiliti Health, Term Loan, 1 Month LIBOR +3.00% | | 5.25 | | 1/4/2026 | | 5,908,281 | b | 5,930,437 | |
14
| | | | | | | | | | |
| |
Description | Coupon
Rate (%) | | Maturity Date | | Principal Amount ($) | a | Value ($) | |
Floating Rate Loan Interests - 91.2%(continued) | | | | | |
Health Care - 10.9% (continued) | | | | | |
Air Medical Group Holdings, 2018 Term Loan, 1 Month LIBOR +3.25% | | 5.43 | | 4/28/2022 | | 6,591,391 | b | 6,245,343 | |
Air Methods, Initial Term Loan, 3 Month LIBOR +3.50% | | 5.83 | | 4/21/2024 | | 5,465,492 | b | 4,543,190 | |
Albany Molecular Research, First Lien Initial Term Loan, 1 Month LIBOR +3.25% | | 5.36 | | 8/31/2024 | | 6,532,970 | b | 6,315,226 | |
Alphabet Holding Company, First Lien Initial Term Loan, 1 Month LIBOR +3.50% | | 5.61 | | 9/28/2024 | | 3,733,500 | b | 3,485,390 | |
Alphabet Holding Company, Second Lien Initial Term Loan, 1 Month LIBOR +7.75% | | 9.86 | | 8/15/2025 | | 1,600,000 | b | 1,408,800 | |
Auris Luxembourg III, Facility B2 Term Loan, 1 Month LIBOR +3.75% | | 5.87 | | 2/21/2026 | | 6,633,375 | b | 6,567,705 | |
Avantor Funding, Initial B-2 Dollar Term Loan, 1 Month LIBOR +3.00% | | 5.11 | | 11/21/2024 | | 1,809,176 | b | 1,827,648 | |
Bausch Health Americas, First Incremental Term Loan, 1 Month LIBOR +2.75% | | 4.95 | | 11/27/2025 | | 2,507,795 | b | 2,509,989 | |
Bausch Health Americas, Initial Term Loan, 1 Month LIBOR +3.00% | | 5.20 | | 6/1/2025 | | 924,055 | b | 926,832 | |
Dentalcorp Perfect Smile, Initial Term Loan, 1 Month LIBOR +3.75% | | 5.86 | | 6/6/2025 | | 4,510,587 | b | 4,426,014 | |
Envision Healthcare, Initial Term Loan, 1 Month LIBOR +3.75% | | 5.86 | | 10/10/2025 | | 9,822,144 | b | 7,644,231 | |
Femur Buyer, First Lien Initial Term Loan, 3 Month LIBOR +4.50% | | 6.98 | | 3/5/2026 | | 1,402,313 | b | 1,405,819 | |
Immucor, Term Loan B-3, 3 Month LIBOR +5.00% | | 7.33 | | 6/15/2021 | | 4,967,595 | b | 4,960,168 | |
Jaguar Holding Company II, 2018 Term Loan, 1 Month LIBOR +2.50% | | 4.61 | | 8/18/2022 | | 2,238,342 | b | 2,229,019 | |
MED ParentCo, Delayed Draw Term Loan, 3 Month LIBOR +4.25% | | 6.55 | | 8/2/2026 | | 732,739 | b,d | 726,632 | |
MED ParentCo, Term B Loan, 3 Month LIBOR +4.25% | | 6.55 | | 8/2/2026 | | 2,934,428 | b | 2,909,970 | |
MPH Acquisition Holdings, Initial Term Loan, 3 Month LIBOR +2.75% | | 5.08 | | 6/7/2023 | | 3,157,295 | b | 2,944,178 | |
NVA Holdings, First Lien Term B-3 Loan, 1 Month LIBOR +2.75% | | 4.86 | | 2/2/2025 | | 3,024,638 | b | 3,024,698 | |
15
STATEMENT OF INVESTMENTS (continued)
| | | | | | | | | | |
| |
Description | Coupon
Rate (%) | | Maturity Date | | Principal Amount ($) | a | Value ($) | |
Floating Rate Loan Interests - 91.2%(continued) | | | | | |
Health Care - 10.9% (continued) | | | | | |
Ortho-Clinical Diagnostics, Refinancing Term Loan, 3 Month LIBOR +3.25% | | 5.56 | | 6/1/2025 | | 6,113,250 | b | 5,782,768 | |
Petvet Care Centers, Delayed Draw First Lien Term Loan, 1 Month LIBOR +2.75% | | 4.86 | | 2/14/2025 | | 900,396 | b,d | 871,696 | |
Petvet Care Centers, First Lien Initial Term Loan, 1 Month LIBOR +2.75% | | 4.86 | | 2/14/2025 | | 3,042,647 | b | 2,945,663 | |
Petvet Care Centers, Second Lien Initial Term Loan, 1 Month LIBOR +6.25% | | 8.36 | | 2/15/2026 | | 1,488,652 | b | 1,451,436 | |
Sound Inpatient Physicians, First Lien Initial Term Loan, 1 Month LIBOR +2.75% | | 4.86 | | 6/28/2025 | | 447,468 | b | 444,392 | |
Surgery Center Holdings, Initial Term Loan, 1 Month LIBOR +3.25% | | 5.37 | | 8/31/2024 | | 7,167,896 | b | 6,863,261 | |
US Anesthesia Partners, First Lien Initial Term Loan, 1 Month LIBOR +3.00% | | 5.11 | | 6/23/2024 | | 4,854,760 | b | 4,671,493 | |
Wink Holdco, First Lien Initial Term Loan, 1 Month LIBOR +3.00% | | 5.11 | | 12/1/2024 | | 5,719,062 | b | 5,583,263 | |
| | 98,645,261 | |
Industrials - 5.5% | | | | | |
AI Alpine US Bidco, Facility B Term Loan, 1 Month LIBOR +2.75% | | 4.99 | | 11/6/2025 | | 5,591,719 | b | 5,465,905 | |
Brand Industrial Service, Initial Term Loan, 2-3 Month LIBOR +4.25% | | 6.53 | | 6/21/2024 | | 5,692,956 | b | 5,408,308 | |
Brookfield WEC Holdings, First Lien Initial Term Loan, 1 Month LIBOR +3.50% | | 5.61 | | 8/1/2025 | | 248,590 | b | 249,212 | |
Dynasty Acquisition Company I, Initial Term B-1 Loan, 3 Month LIBOR +4.00% | | 6.33 | | 4/8/2026 | | 2,466,463 | b | 2,470,212 | |
Dynasty Acquisition Company I, Initial Term B-2 Loan, 3 Month LIBOR +4.00% | | 6.33 | | 4/4/2026 | | 1,326,055 | b | 1,328,071 | |
Engineered Machinery Holdings , First Lien Initial Term Loan, 3 Month LIBOR +3.25% | | 5.58 | | 7/19/2024 | | 2,738,325 | b | 2,657,886 | |
North American Lifting Holdings, First Lien Initial Term Loan, 3 Month LIBOR +4.50% | | 6.83 | | 11/27/2020 | | 2,820,828 | b | 2,631,310 | |
Restaurant Technologies, First Lien Initial Term Loan, 1 Month LIBOR +3.25% | | 5.36 | | 10/1/2025 | | 2,316,037 | b | 2,318,932 | |
16
| | | | | | | | | | |
| |
Description | Coupon
Rate (%) | | Maturity Date | | Principal Amount ($) | a | Value ($) | |
Floating Rate Loan Interests - 91.2%(continued) | | | | | |
Industrials - 5.5% (continued) | | | | | |
Titan Acquisition, Initial Term Loan, 1 Month LIBOR +3.00% | | 5.11 | | 3/28/2025 | | 6,024,941 | b | 5,794,005 | |
Travelport Finance, First Lien Initial Term Loan, 3 Month LIBOR +5.00% | | 7.54 | | 5/30/2026 | | 5,608,163 | b | 5,179,139 | |
USIC Holdings, Term B Loan, 1 Month LIBOR +3.00% | | 5.11 | | 12/9/2023 | | 3,041,187 | b,d | 3,009,498 | |
VAC Germany Holding, Term B Loan, 3 Month LIBOR +4.00% | | 6.33 | | 3/18/2025 | | 3,061,250 | b | 3,045,944 | |
Ventia Deco, 2019 Refinancing Term B Loan, 3 Month LIBOR +3.50% | | 5.84 | | 5/21/2026 | | 1,567,568 | b | 1,569,527 | |
Verra Mobility, First Lien Initial Term Loan, 1 Month LIBOR +3.75% | | 5.86 | | 2/28/2025 | | 4,301,781 | b | 4,323,290 | |
Yak Access, First Lien Initial Term Loan, 1 Month LIBOR +5.00% | | 7.11 | | 7/11/2025 | | 5,200,625 | b | 4,823,580 | |
| | 50,274,819 | |
Information Technology - 8.4% | | | | | |
Boxer Parent Company, Initial Dollar Term Loan, 3 Month LIBOR +4.25% | | 6.58 | | 10/2/2025 | | 4,848,306 | b | 4,605,891 | |
Capri Acquisitions BidCo, Initial Dollar Term Loan, 3 Month LIBOR +3.25% | | 5.51 | | 11/30/2024 | | 4,573,361 | b | 4,493,350 | |
Dcert Buyer, Term Loan, 3 Month LIBOR +4.00% | | 6.26 | | 8/8/2026 | | 5,274,115 | b | 5,263,119 | |
Digicert Holdings, First Lien Term Loan, 1 Month LIBOR +4.00% | | 6.11 | | 10/31/2024 | | 6,392,518 | b | 6,402,107 | |
Dun & Bradstreet, Initial Term Loan, 1 Month LIBOR +5.00% | | 7.15 | | 2/8/2026 | | 6,303,322 | b | 6,327,621 | |
Dynatrace, Senior Secured First Lien Term Loan, 1 Month LIBOR +2.75% | | 4.86 | | 8/23/2025 | | 828,422 | b | 829,975 | |
Emerald TopCo, First Lien Initial Term Loan, 1 Month LIBOR +3.50% | | 5.73 | | 7/26/2026 | | 1,556,357 | b | 1,550,847 | |
Finastra USA, First Lien Dollar Term Loan, 6 Month LIBOR +3.50% | | 5.70 | | 6/16/2024 | | 6,825,224 | b | 6,599,616 | |
Greeneden US Holdings II, Tranche B-3 Dollar Term Loan, 1 Month LIBOR +3.25% | | 5.36 | | 12/1/2023 | | 8,204,626 | b | 8,130,784 | |
Hyland Software, 2018 Refinancing Term Loan, 1 Month LIBOR +3.25% | | 5.36 | | 7/1/2024 | | 6,080,588 | b | 6,067,301 | |
Hyland Software, Senior Secured Second Lien Initial Term Loan, 1 Month LIBOR +7.00% | | 9.11 | | 7/10/2025 | | 1,375,000 | b | 1,383,168 | |
17
STATEMENT OF INVESTMENTS (continued)
| | | | | | | | | | |
| |
Description | Coupon
Rate (%) | | Maturity Date | | Principal Amount ($) | a | Value ($) | |
Floating Rate Loan Interests - 91.2%(continued) | | | | | |
Information Technology - 8.4% (continued) | | | | | |
Marcel Bidco, Facility B1 Term Loan, 1 Month LIBOR +3.25% | | 5.36 | | 3/15/2026 | | 2,862,802 | b | 2,821,650 | |
Mitchell International, First Lien Initial Term Loan, 1 Month LIBOR +3.25% | | 5.36 | | 12/1/2024 | | 4,196,505 | b | 3,942,617 | |
Quest Software US Holdings, First Lien Initial Term Loan, 3 Month LIBOR +4.25% | | 6.51 | | 5/18/2025 | | 7,071,225 | b | 6,905,511 | |
RP Crown Parent, Initial Term Loan, 1 Month LIBOR +2.75% | | 4.86 | | 10/12/2023 | | 2,828,525 | b | 2,827,818 | |
SCS Holdings I, Initial Term Loan, 3 Month LIBOR +4.25% | | 6.57 | | 7/3/2026 | | 4,820,943 | b | 4,828,463 | |
Ultimate Software Group, First Lien Initial Term Loan, 3 Month LIBOR +3.75% | | 6.08 | | 5/3/2026 | | 3,503,641 | b | 3,516,780 | |
| | 76,496,618 | |
Insurance - 5.7% | | | | | |
Alliant Holdings Intermediate, 2018 Initial Term Loan, 1 Month LIBOR +3.00% | | 5.15 | | 5/10/2025 | | 4,511,606 | b | 4,410,095 | |
AssuredPartners, 2017 September Refinancing Term Loan, 1 Month LIBOR +3.50% | | 5.61 | | 10/22/2024 | | 6,567,184 | b | 6,546,070 | |
Asurion, New B-7 Term Loan, 1 Month LIBOR +3.00% | | 5.11 | | 11/3/2024 | | 1,738,712 | b | 1,741,607 | |
Asurion, Replacement B-6 Term Loan, 1 Month LIBOR +3.00% | | 5.11 | | 11/3/2023 | | 997,763 | b | 999,454 | |
Asurion, Second Lien Replacement B-2 Term Loan, 1 Month LIBOR +6.50% | | 8.61 | | 8/4/2025 | | 8,722,453 | b | 8,865,894 | |
HUB International , Initial Term Loan, 3 Month LIBOR +3.00% | | 5.27 | | 4/25/2025 | | 5,502,044 | b | 5,401,989 | |
Mayfield Agency Borrower, First Lien Term B Loan, 1 Month LIBOR +4.50% | | 6.61 | | 2/28/2025 | | 5,823,928 | b | 5,576,411 | |
Mayfield Agency Borrower, Second Lien Term B Loan, 1 Month LIBOR +8.50% | | 10.61 | | 2/28/2026 | | 1,891,367 | b | 1,861,814 | |
Sedgwick Cms, Term B Loan, 3 Month LIBOR +4.00% | | 6.26 | | 8/8/2026 | | 1,283,784 | b | 1,285,389 | |
Sedgwick Cms, Term Loan, 1 Month LIBOR +3.25% | | 5.36 | | 12/31/2025 | | 5,623,183 | b | 5,466,549 | |
USI, Term B Loan, 3 Month LIBOR +3.00% | | 5.33 | | 5/16/2024 | | 5,212,506 | b | 5,097,414 | |
York Risk Services Holding, Term Loan, 1 Month LIBOR +3.75% | | 5.86 | | 10/1/2021 | | 4,217,510 | b | 4,216,181 | |
| | 51,468,867 | |
18
| | | | | | | | | | |
| |
Description | Coupon
Rate (%) | | Maturity Date | | Principal Amount ($) | a | Value ($) | |
Floating Rate Loan Interests - 91.2%(continued) | | | | | |
Internet Software & Services - 2.8% | | | | | |
ION Trading Finance, Initial Dollar Term Loan, 3 Month LIBOR +4.00% | | 6.65 | | 11/21/2024 | | 3,495,199 | b | 3,369,966 | |
ION Trading Finance, Initial Euro Term Loan, 3 Month EURIBOR +3.25% | EUR | 4.25 | | 11/21/2024 | | 1,662,461 | b | 1,800,406 | |
Rodan & Fields, Closing Date Term Loan, 1 Month LIBOR +4.00% | | 6.20 | | 6/7/2025 | | 5,338,323 | b | 4,663,025 | |
Trader, Senior Secured First Lien Term Loan, 1 Month LIBOR +3.00% | | 5.15 | | 9/28/2023 | | 5,429,841 | b | 5,375,543 | |
Web.com Group, First Lien Initial Term Loan, 1 Month LIBOR +3.75% | | 5.95 | | 10/11/2025 | | 5,475,163 | b | 5,415,839 | |
Web.com Group, Second Lien Initial Term Loan, 1 Month LIBOR +7.75% | | 9.95 | | 10/11/2026 | | 675,516 | b | 663,131 | |
WeddingWire, First Lien Initial Term Loan, 1 Month LIBOR +4.50% | | 6.61 | | 12/21/2025 | | 3,794,267 | b | 3,803,752 | |
| | 25,091,662 | |
Materials - 6.5% | | | | | |
Ball Metalpack Finco, First Lien Initial Term Loan, 1 Month LIBOR +4.50% | | 6.62 | | 7/31/2025 | | 4,880,013 | b | 4,751,912 | |
Berlin Packaging, First Lien Initial Term Loan, 1-3 Month LIBOR +3.00% | | 5.22 | | 11/7/2025 | | 5,919,525 | b | 5,830,732 | |
BWAY, Initial Term Loan, 3 Month LIBOR +3.25% | | 5.59 | | 4/3/2024 | | 2,879,485 | b | 2,806,000 | |
Charter NEX US, Incremental Term Loan, 1 Month LIBOR +3.50% | | 5.61 | | 5/16/2024 | | 5,531,978 | b | 5,534,578 | |
Circor international, Initial Term Loan, 1 Month LIBOR +3.50% | | 5.70 | | 12/11/2024 | | 4,544,232 | b | 4,528,145 | |
Flex Acquisition Company, Incremental B-2018 Term Loan, 3 Month LIBOR +3.25% | | 5.57 | | 6/29/2025 | | 3,804,856 | b | 3,643,149 | |
Form Technologies, First Lien Term B-1 Loan, 3 Month LIBOR +3.25% | | 5.58 | | 1/28/2022 | | 4,752,566 | b | 4,574,345 | |
LABL, Initial Dollar Term Loan, 1 Month LIBOR +4.50% | | 6.73 | | 7/2/2026 | | 3,041,601 | b | 3,041,601 | |
Murray Energy, Superpriority Term B-2 Loan, 1 Month LIBOR +7.25% | | 9.36 | | 10/17/2022 | | 4,156,377 | b | 2,060,379 | |
Oxbow Carbon , First Lien Tranche B Term Loan, 1 Month LIBOR +3.75% | | 5.86 | | 1/4/2023 | | 3,843,871 | b | 3,836,664 | |
19
STATEMENT OF INVESTMENTS (continued)
| | | | | | | | | | |
| |
Description | Coupon
Rate (%) | | Maturity Date | | Principal Amount ($) | a | Value ($) | |
Floating Rate Loan Interests - 91.2%(continued) | | | | | |
Materials - 6.5% (continued) | | | | | |
Plaze, Initial Term Loan, 1 Month LIBOR +3.50% | | 5.73 | | 8/3/2026 | | 1,793,807 | b | 1,789,448 | |
Reynolds Group Holdings, Incremental U.S. Term Loan, 1 Month LIBOR +2.75% | | 4.86 | | 2/5/2023 | | 4,979,579 | b | 4,982,691 | |
Tecomet, 2017 First Lien Term Loan, 1 Month LIBOR +3.25% | | 5.45 | | 5/1/2024 | | 6,298,875 | b | 6,255,602 | |
TricorBraun, First Lien Closing Date Term Loan, 2-3 Month LIBOR +3.75% | | 6.07 | | 11/30/2023 | | 5,814,998 | b | 5,684,161 | |
| | 59,319,407 | |
Media - 6.0% | | | | | |
CSC Holdings, February 2019 Incremental Term Loan, 1 Month LIBOR +3.00% | | 5.20 | | 4/15/2027 | | 5,920,058 | b | 5,950,398 | |
CSC Holdings, October 2018 Incremental Term Loan, 1 Month LIBOR +2.25% | | 4.45 | | 1/15/2026 | | 1,915,188 | b | 1,909,605 | |
Diamond Sports Group, Term Loan, 1 Month LIBOR +3.25% | | 5.42 | | 8/24/2026 | | 3,855,585 | b | 3,864,414 | |
EW Scripps, Tranche B-1 Term Loan, 1 Month LIBOR +2.75% | | 4.86 | | 5/1/2026 | | 2,121,499 | b | 2,125,265 | |
ION Media Networks, Term B-4 Loan, 1 Month LIBOR +3.00% | | 5.13 | | 12/18/2024 | | 4,900,000 | b | 4,898,751 | |
NEP Group, First Lien Initial Dollar Term Loan, 1 Month LIBOR +3.25% | | 5.36 | | 10/20/2025 | | 4,434,350 | b | 4,339,012 | |
NEP Group, Second Lien Initial Loan, 1 Month LIBOR +7.00% | | 9.11 | | 10/19/2026 | | 1,158,101 | b | 1,140,729 | |
Nexstar Broadcasting, Term B Loan, 3 Month LIBOR +2.75% | | 4.87 | | 6/20/2026 | | 6,311,856 | b | 6,323,122 | |
Radiate Holdco, Closing Date Term Loan, 1 Month LIBOR +3.00% | | 5.11 | | 2/1/2024 | | 7,839,443 | b | 7,777,394 | |
Townsquare Media, Facility B Term Loan, 1 Month LIBOR +3.00% | | 5.11 | | 4/1/2022 | | 3,791,591 | b | 3,791,591 | |
Univision Communications, 2017 Replacement Term Loan, 1 Month LIBOR +2.75% | | 4.86 | | 3/15/2024 | | 6,337,680 | b | 6,100,017 | |
WideOpenWest Finance, Refinancing Term B Loan, 3 Month LIBOR +3.25% | | 5.40 | | 8/19/2023 | | 6,232,727 | b | 6,014,581 | |
| | 54,234,879 | |
Metals & Mining - .4% | | | | | |
Big River Steel, Closing Date Term Loan, 3 Month LIBOR +5.00% | | 7.33 | | 8/23/2023 | | 3,353,764 | b | 3,368,436 | |
20
| | | | | | | | | | |
| |
Description | Coupon
Rate (%) | | Maturity Date | | Principal Amount ($) | a | Value ($) | |
Floating Rate Loan Interests - 91.2%(continued) | | | | | |
Real Estate - .9% | | | | | |
DTZ US Borrower, Closing Date Term Loan, 1 Month LIBOR +3.25% | | 5.36 | | 8/21/2025 | | 4,664,750 | b | 4,577,286 | |
Ggp Nimbus, Initial Term B Loan, 1 Month LIBOR +2.50% | | 4.61 | | 8/24/2025 | | 3,907,159 | b | 3,814,364 | |
| | 8,391,650 | |
Retailing - 2.6% | | | | | |
Bass Pro Group, Initial Term Loan, 1 Month LIBOR +5.00% | | 7.11 | | 9/25/2024 | | 6,517,156 | b | 6,232,030 | |
Comfort Holding, First Lien Initial Term Loan, 1 Month LIBOR +4.75% | | 6.86 | | 2/3/2024 | | 2,688,125 | b | 2,667,964 | |
EG America, Additional Facility Loan, 3 Month LIBOR +4.00% | | 6.33 | | 2/5/2025 | | 1,739,812 | b | 1,719,430 | |
Foundation Building Materials, Term Loan, 1 Month LIBOR +3.00% | | 5.11 | | 8/13/2025 | | 3,928,941 | b | 3,928,960 | |
Leslie's Poolmart, Tranche B-2 Term Loan, 2 Month LIBOR +3.50% | | 5.76 | | 8/16/2023 | | 2,449,731 | b | 2,300,456 | |
SRS Distribution, Initial Term Loan, 1 Month LIBOR +3.25% | | 5.36 | | 5/24/2025 | | 3,890,700 | b | 3,785,651 | |
Staples, 2019 Refinancing New Term B-1 Loan, 1 Month LIBOR +5.00% | | 7.20 | | 4/12/2026 | | 938,481 | b | 905,635 | |
Talbots, First Lien Initial Term Loan, 3 Month LIBOR +7.00% | | 9.33 | | 11/28/2022 | | 1,833,680 | b | 1,778,670 | |
| | 23,318,796 | |
Semiconductors & Semiconductor Equipment - .4% | | | | | |
Natel Engineering, Initial Term Loan, 1 Month LIBOR +5.00% | | 7.12 | | 4/30/2026 | | 3,364,937 | b | 3,373,350 | |
Technology Hardware & Equipment - 3.4% | | | | | |
Everi Payments, New Term Loan B, 1 Month LIBOR +3.00% | | 5.11 | | 5/9/2024 | | 7,296,031 | b | 7,306,975 | |
Mcafee, Second Lien Initial Loan, 1 Month LIBOR +8.50% | | 10.62 | | 9/28/2025 | | 1,742,045 | b | 1,765,459 | |
McAfee, Term B USD Loan, 1 Month LIBOR +3.75% | | 5.87 | | 9/29/2024 | | 5,743,022 | b | 5,764,558 | |
Perforce Software, First Lien Term Loan, 1 Month LIBOR +4.50% | | 6.61 | | 7/8/2026 | | 2,900,000 | b | 2,892,765 | |
Sandvine, First Lien Initial Term Loan, 1 Month LIBOR +4.50% | | 6.61 | | 11/2/2025 | | 4,151,975 | b | 4,141,595 | |
Tempo Acquisition, Initial Term Loan, 1 Month LIBOR +3.00% | | 5.11 | | 5/1/2024 | | 5,181,287 | b | 5,188,851 | |
21
STATEMENT OF INVESTMENTS (continued)
| | | | | | | | | | |
| |
Description | Coupon
Rate (%) | | Maturity Date | | Principal Amount ($) | a | Value ($) | |
Floating Rate Loan Interests - 91.2%(continued) | | | | | |
Technology Hardware & Equipment - 3.4% (continued) | | | | | |
VeriFone Systems, First Lien Initial Term Loan, 3 Month LIBOR +4.00% | | 6.14 | | 8/20/2025 | | 4,228,697 | b | 4,065,892 | |
| | 31,126,095 | |
Telecommunication Services - 4.5% | | | | | |
Altice France, Incremental Term B-13 Loan, 1 Month LIBOR +4.00% | | 6.20 | | 8/14/2026 | | 8,351,054 | b | 8,330,177 | |
CenturyLink, Initial Term A Loan, 1 Month LIBOR +2.75% | | 4.86 | | 9/30/2022 | | 2,083,265 | b | 2,086,848 | |
CenturyLink, Initial Term B Loan, 1 Month LIBOR +2.75% | | 4.86 | | 1/31/2025 | | 3,972,317 | b | 3,922,048 | |
CommScope, Initial Term Loan, 1 Month LIBOR +3.25% | | 5.36 | | 4/4/2026 | | 4,105,043 | b | 4,093,077 | |
Cyxtera DC Holdings, First Lien Initial Term Loan, 1 Month LIBOR +3.00% | | 5.21 | | 5/1/2024 | | 3,890,076 | b | 3,656,672 | |
Intelsat Jackson Holdings, Tranche B-3 Term Loan, 1 Month LIBOR +3.75% | | 5.90 | | 11/27/2023 | | 2,230,000 | b | 2,232,788 | |
Intelsat Jackson Holdings, Tranche B-4 Term Loan, 1 Month LIBOR +4.50% | | 6.65 | | 1/2/2024 | | 3,619,048 | b | 3,649,031 | |
MTN Infrastructure TopCo , Initial Term Loan, 1 Month LIBOR +3.00% | | 5.11 | | 11/17/2024 | | 3,527,068 | b | 3,472,698 | |
Tech Finance & Company, First Incremental U.S. Term Loan, 3 Month LIBOR +2.75% | | 4.87 | | 12/31/2023 | | 2,340,000 | b | 2,097,225 | |
West, Initial Term Loan B, 1 Month LIBOR +4.00% | | 6.11 | | 10/10/2024 | | 8,014,704 | b | 7,200,370 | |
| | 40,740,934 | |
Utilities - 2.4% | | | | | |
Eastern Power, Term B Loan, 1 Month LIBOR +3.75% | | 5.86 | | 10/2/2023 | | 7,523,754 | b | 7,559,529 | |
EFS Cogen Holdings I, Advance Term Loan B, 1-3 Month LIBOR +3.25% | | 5.48 | | 6/28/2023 | | 5,037,674 | b | 5,027,599 | |
Helix Gen Funding, Term Loan, 1 Month LIBOR +3.75% | | 5.86 | | 6/3/2024 | | 6,961,994 | b | 6,681,321 | |
Pike, 2019 New Term Loan, 3 Month LIBOR +3.25% | | 5.40 | | 7/24/2026 | | 2,661,902 | b | 2,666,879 | |
| | 21,935,328 | |
TotalFloating Rate Loan Interests
(cost $847,783,018) | | 827,837,043 | |
22
| | | | | | | | | | |
| |
Description | 1-Day
Yield (%) | | | | Shares | | Value ($) | |
Investment Companies - 3.4% | | | | | |
Registered Investment Companies - 3.4% | | | | | |
Dreyfus Institutional Preferred Government Plus Money Market Fund
(cost $30,794,018) | | 2.09 | | | | 30,794,018 | e | 30,794,018 | |
Total Investments(cost $935,434,085) | | 100.5% | 912,231,536 | |
Liabilities, Less Cash and Receivables | | (0.5%) | (4,420,547) | |
Net Assets | | 100.0% | 907,810,989 | |
EURIBOR—Euro Interbank Offered Rate
LIBOR—London Interbank Offered Rate
EUR—Euro
a Amount stated in U.S. Dollars unless otherwise noted above.
b Variable rate security—rate shown is the interest rate in effect at period end.
c Security exempt from registration pursuant to Rule 144A under the Securities Act of 1933. These securities may be resold in transactions exempt from registration, normally to qualified institutional buyers. At August 31, 2019, these securities were valued at $50,589,225 or 5.57% of net assets.
d Investment, or portion of investment, represents an unfunded floating note loan interest outstanding.
e Investment in affiliated issuer. The investment objective of this investment company is publicly available and can be found within the investment company’s prospectus.
| | |
Portfolio Summary (Unaudited)† | Value (%) |
Consumer, Non-cyclical | 20.9 |
Industrial | 15.7 |
Communications | 15.0 |
Technology | 12.2 |
Financial | 9.6 |
Consumer, Cyclical | 8.6 |
Energy | 5.6 |
Collateralized Loan Obligations | 3.7 |
Investment Companies | 3.4 |
Basic Materials | 2.8 |
Utilities | 2.4 |
Diversified | .6 |
| | 100.5 |
† Based on net assets.
See notes to financial statements.
23
STATEMENT OF INVESTMENTS IN AFFILIATED ISSUERS
| | | | | | | |
Investment Companies | Value
8/31/18 ($) | Purchases ($) | Sales ($) | Value
8/31/19 ($) | Net
Assets (%) | Dividends/
Distributions ($) |
Registered Investment Companies; | | | | |
Dreyfus Institutional Preferred Government Plus Money Market Fund | 123,778,748 | 477,168,137 | 570,152,867 | 30,794,018 | 3.4 | 653,523 |
See notes to financial statements.
24
STATEMENT OF FORWARD FOREIGN CURRENCY EXCHANGE CONTRACTSAugust 31, 2019
| | | | | | |
Counterparty/ Purchased
Currency | Purchased Currency
Amounts | Currency
Sold | Sold
Currency
Amounts | Settlement Date | Unrealized Appreciation ($) |
Citigroup | | | |
United States Dollar | 11,251,327 | Euro | 10,055,000 | 9/19/19 | 183,500 |
Gross Unrealized Appreciation | | | 183,500 |
See notes to financial statements.
25
STATEMENT OF ASSETS AND LIABILITIES
August 31, 2019
| | | | | | | |
| | | | | | |
| | | Cost | | Value | |
Assets ($): | | | | |
Investments in securities—See Statement of Investments | | | |
Unaffiliated issuers | 904,640,067 | | 881,437,518 | |
Affiliated issuers | | 30,794,018 | | 30,794,018 | |
Cash | | | | | 2,610,966 | |
Cash denominated in foreign currency | | | 69,000 | | 68,244 | |
Receivable for investment securities sold | | 14,791,507 | |
Interest receivable | | 3,376,782 | |
Receivable for shares of Common Stock subscribed | | 577,661 | |
Unrealized appreciation on forward foreign
currency exchange contracts—Note 4 | | 183,500 | |
Prepaid expenses | | | | | 75,665 | |
| | | | | 933,915,861 | |
Liabilities ($): | | | | |
Due to BNY Mellon Investment Adviser, Inc. and affiliates—Note 3(c) | | 515,305 | |
Payable for investment securities purchased | | 22,134,393 | |
Payable for shares of Common Stock redeemed | | 3,323,139 | |
Unrealized depreciation on foreign currency transactions | | 36,263 | |
Directors fees and expenses payable | | 14,330 | |
Other accrued expenses | | | | | 81,442 | |
| | | | | 26,104,872 | |
Net Assets ($) | | | 907,810,989 | |
Composition of Net Assets ($): | | | | |
Paid-in capital | | | | | 982,160,616 | |
Total distributable earnings (loss) | | | | | (74,349,627) | |
Net Assets ($) | | | 907,810,989 | |
| | | | | | |
Net Asset Value Per Share | Class A | Class C | Class I | Class Y | |
Net Assets ($) | 26,637,273 | 1,745,188 | 89,077,745 | 790,350,783 | |
Shares Outstanding | 2,288,271 | 150,044 | 7,667,840 | 68,121,168 | |
Net Asset Value Per Share ($) | 11.64 | 11.63 | 11.62 | 11.60 | |
| | | | | |
See notes to financial statements. | | | | | |
26
STATEMENT OF OPERATIONS
Year Ended August 31, 2019
| | | | | | | |
| | | | | | |
| | | | | | |
Investment Income ($): | | | | |
Income: | | | | |
Interest | | | 64,499,007 | |
Dividends: | |
Unaffiliated issuers | | | 469,308 | |
Affiliated issuers | | | 653,523 | |
Total Income | | | 65,621,838 | |
Expenses: | | | | |
Management fee—Note 3(a) | | | 6,790,087 | |
Shareholder servicing costs—Note 3(c) | | | 215,177 | |
Professional fees | | | 190,076 | |
Loan commitment fees—Note 2 | | | 187,462 | |
Registration fees | | | 115,689 | |
Directors’ fees and expenses—Note 3(d) | | | 85,962 | |
Interest expense—Note 2 | | | 60,184 | |
Prospectus and shareholders’ reports | | | 43,629 | |
Distribution fees—Note 3(b) | | | 14,499 | |
Custodian fees—Note 3(c) | | | 2,117 | |
Miscellaneous | | | 155,920 | |
Total Expenses | | | 7,860,802 | |
Less—reduction in expenses due to undertaking—Note 3(a) | | | (82,883) | |
Net Expenses | | | 7,777,919 | |
Investment Income—Net | | | 57,843,919 | |
Realized and Unrealized Gain (Loss) on Investments—Note 4 ($): | | |
Net realized gain (loss) on investments and foreign currency transactions | (30,279,123) | |
Net realized gain (loss) on forward foreign currency exchange contracts | 2,748,542 | |
Net Realized Gain (Loss) | | | (27,530,581) | |
Net change in unrealized appreciation (depreciation) on investments
and foreign currency transactions | (18,957,354) | |
Net change in unrealized appreciation (depreciation) on
forward foreign currency exchange contracts | (57,656) | |
Net Change in Unrealized Appreciation (Depreciation) | | | (19,015,010) | |
Net Realized and Unrealized Gain (Loss) on Investments | | | (46,545,591) | |
Net Increase in Net Assets Resulting from Operations | | 11,298,328 | |
| | | | | | |
See notes to financial statements. | | | | | |
27
STATEMENT OF CHANGES IN NET ASSETS
| | | | | | | | | | |
| | | | Year Ended August 31, |
| | | | 2019 | | 2018 | a |
Operations ($): | | | | | | | | |
Investment income—net | | | 57,843,919 | | | | 46,324,063 | |
Net realized gain (loss) on investments | | (27,530,581) | | | | (2,954,359) | |
Net change in unrealized appreciation
(depreciation) on investments | | (19,015,010) | | | | (6,417,711) | |
Net Increase (Decrease) in Net Assets
Resulting from Operations | 11,298,328 | | | | 36,951,993 | |
Distributions ($): | |
Distributions to shareholders: | | | | | | | | |
Class A | | | (1,679,274) | | | | (726,137) | |
Class C | | | (85,597) | | | | (68,485) | |
Class I | | | (4,688,673) | | | | (884,361) | |
Class Y | | | (51,412,650) | | | | (40,747,816) | |
Total Distributions | | | (57,866,194) | | | | (42,426,799) | |
Capital Stock Transactions ($): | |
Net proceeds from shares sold: | | | | | | | | |
Class A | | | 34,374,692 | | | | 12,526,410 | |
Class C | | | 329,060 | | | | 431,944 | |
Class I | | | 132,123,681 | | | | 30,962,912 | |
Class Y | | | 252,993,193 | | | | 352,642,182 | |
Distributions reinvested: | | | | | | | | |
Class A | | | 1,545,400 | | | | 712,848 | |
Class C | | | 78,330 | | | | 65,581 | |
Class I | | | 4,587,775 | | | | 762,556 | |
Class Y | | | 16,002,358 | | | | 12,908,518 | |
Cost of shares redeemed: | | | | | | | | |
Class A | | | (27,121,646) | | | | (8,449,840) | |
Class C | | | (758,678) | | | | (974,115) | |
Class I | | | (63,298,464) | | | | (31,783,402) | |
Class Y | | | (557,482,921) | | | | (116,114,361) | |
Increase (Decrease) in Net Assets
from Capital Stock Transactions | (206,627,220) | | | | 253,691,233 | |
Total Increase (Decrease) in Net Assets | (253,195,086) | | | | 248,216,427 | |
Net Assets ($): | |
Beginning of Period | | | 1,161,006,075 | | | | 912,789,648 | |
End of Period | | | 907,810,989 | | | | 1,161,006,075 | |
28
| | | | | | | | | | |
| | | | Year Ended August 31, |
| | | | 2019 | | 2018 | a |
Capital Share Transactions (Shares): | |
Class Ab,c | | | | | | | | |
Shares sold | | | 2,870,308 | | | | 1,033,381 | |
Shares issued for distributions reinvested | | | 131,536 | | | | 58,986 | |
Shares redeemed | | | (2,300,930) | | | | (698,732) | |
Net Increase (Decrease) in Shares Outstanding | 700,914 | | | | 393,635 | |
Class Cc | | | | | | | | |
Shares sold | | | 28,089 | | | | 35,761 | |
Shares issued for distributions reinvested | | | 6,673 | | | | 5,430 | |
Shares redeemed | | | (64,354) | | | | (80,554) | |
Net Increase (Decrease) in Shares Outstanding | (29,592) | | | | (39,363) | |
Class Ib | | | | | | | | |
Shares sold | | | 11,156,737 | | | | 2,559,900 | |
Shares issued for distributions reinvested | | | 392,325 | | | | 63,235 | |
Shares redeemed | | | (5,398,520) | | | | (2,632,716) | |
Net Increase (Decrease) in Shares Outstanding | 6,150,542 | | | | (9,581) | |
Class Yb | | | | | | | | |
Shares sold | | | 21,482,432 | | | | 29,213,576 | |
Shares issued for distributions reinvested | | | 1,365,469 | | | | 1,071,834 | |
Shares redeemed | | | (47,909,547) | | | | (9,627,009) | |
Net Increase (Decrease) in Shares Outstanding | (25,061,646) | | | | 20,658,401 | |
| | | | | | | | | |
a Distributions to shareholders include only distributions from net investment income. Undistributed investment income-net was $7,396,559 in 2018 and is no longer presented as a result of the adoption of SEC’s Disclosure Update and Simplification Rule. | |
b During the period ended August 31, 2019, 973,505 Class Y shares representing $11,473,584 were exchanged for 973,158 Class I shares, 986 Class A shares representing $11,661 were exchanged for 988 Class I shares and during the period ended August 31, 2018, 833,605 Class Y shares representing $10,051,397 were exchanged for 832,612 Class I shares. | |
c During the period ended August 31, 2018, 2,502 Class C shares representing $30,272 were automatically converted to 2,498 Class A shares. | |
See notes to financial statements.
| | | | | | | | |
29
FINANCIAL HIGHLIGHTS
The following tables describe the performance for each share class for the fiscal periods indicated. All information (except portfolio turnover rate) reflects financial results for a single fund share. Total return shows how much your investment in the fund would have increased (or decreased) during each period, assuming you had reinvested all dividends and distributions. These figures have been derived from the fund’s financial statements.
| | | | | | | |
| | | |
| | | Year Ended August 31, |
Class A Shares | | 2019 | 2018 | 2017 | 2016 | 2015 |
Per Share Data ($): | | | | | | |
Net asset value, beginning of period | | 12.07 | 12.13 | 12.06 | 12.29 | 12.64 |
Investment Operations: | | | | | | |
Investment income—neta | | .65 | .51 | .44 | .47 | .48 |
Net realized and unrealized
gain (loss) on investments | | (.47) | (.11) | .05 | (.21) | (.33) |
Total from Investment Operations | | .18 | .40 | .49 | .26 | .15 |
Distributions: | | | | | | |
Dividends from
investment income—net | | (.61) | (.46) | (.42) | (.49) | (.48) |
Dividends from net realized
gain on investments | | - | - | - | - | (.02) |
Total Distributions | | (.61) | (.46) | (.42) | (.49) | (.50) |
Net asset value, end of period | | 11.64 | 12.07 | 12.13 | 12.06 | 12.29 |
Total Return (%)b | | 1.59 | 3.38 | 4.14 | 2.23 | 1.28 |
Ratios/Supplemental Data (%): | | | | | | |
Ratio of total expenses
to average net assets | | 1.12 | .99 | 1.02 | 1.04 | 1.04 |
Ratio of net expenses
to average net assets | | 1.02 | .99 | 1.02 | 1.04 | 1.04 |
Ratio of net investment income
to average net assets | | 5.26 | 4.19 | 3.61 | 3.98 | 3.88 |
Portfolio Turnover Rate | | 86.44 | 91.78 | 97.82 | 66.45 | 76.63 |
Net Assets, end of period ($ x 1,000) | | 26,637 | 19,165 | 14,483 | 7,210 | 7,824 |
a Based on average shares outstanding.
b Exclusive of sales charge.
See notes to financial statements.
30
| | | | | | | |
| | | |
| | | Year Ended August 31, |
Class C Shares | | 2019 | 2018 | 2017 | 2016 | 2015 |
Per Share Data ($): | | | | | | |
Net asset value, beginning of period | | 12.06 | 12.11 | 12.04 | 12.28 | 12.63 |
Investment Operations: | | | | | | |
Investment income—neta | | .54 | .41 | .35 | .38 | .39 |
Net realized and unrealized
gain (loss) on investments | | (.45) | (.10) | .05 | (.22) | (.33) |
Total from Investment Operations | | .09 | .31 | .40 | .16 | .06 |
Distributions: | | | | | | |
Dividends from
investment income—net | | (.52) | (.36) | (.33) | (.40) | (.39) |
Dividends from net realized
gain on investments | | - | - | - | - | (.02) |
Total Distributions | | (.52) | (.36) | (.33) | (.40) | (.41) |
Net asset value, end of period | | 11.63 | 12.06 | 12.11 | 12.04 | 12.28 |
Total Return (%)b | | .82 | 2.62 | 3.38 | 1.43 | .47 |
Ratios/Supplemental Data (%): | | | | | | |
Ratio of total expenses
to average net assets | | 1.80 | 1.78 | 1.81 | 1.84 | 1.84 |
Ratio of net expenses
to average net assets | | 1.77 | 1.75 | 1.78 | 1.80 | 1.80 |
Ratio of net investment income
to average net assets | | 4.52 | 3.40 | 2.85 | 3.22 | 3.11 |
Portfolio Turnover Rate | | 86.44 | 91.78 | 97.82 | 66.45 | 76.63 |
Net Assets, end of period ($ x 1,000) | | 1,745 | 2,166 | 2,652 | 1,952 | 803 |
a Based on average shares outstanding.
b Exclusive of sales charge.
See notes to financial statements.
31
FINANCIAL HIGHLIGHTS (continued)
| | | | | | | |
| | | |
| | | Year Ended August 31, |
Class I Shares | | 2019 | 2018 | 2017 | 2016 | 2015 |
Per Share Data ($): | | | | | | |
Net asset value, beginning of period | | 12.05 | 12.11 | 12.05 | 12.28 | 12.62 |
Investment Operations: | | | | | | |
Investment income—neta | | .68 | .54 | .47 | .50 | .56 |
Net realized and unrealized
gain (loss) on investments | | (.47) | (.10) | .05 | (.20) | (.36) |
Total from Investment Operations | | .21 | .44 | .52 | .30 | .20 |
Distributions: | | | | | | |
Dividends from
investment income—net | | (.64) | (.50) | (.46) | (.53) | (.52) |
Dividends from net realized
gain on investments | | - | - | - | - | (.02) |
Total Distributions | | (.64) | (.50) | (.46) | (.53) | (.54) |
Net asset value, end of period | | 11.62 | 12.05 | 12.11 | 12.05 | 12.28 |
Total Return (%) | | 1.78 | 3.68 | 4.47 | 2.49 | 1.58 |
Ratios/Supplemental Data (%): | | | | | | |
Ratio of total expenses
to average net assets | | .82 | .77 | .80 | .81 | .77 |
Ratio of net expenses
to average net assets | | .77 | .75 | .78 | .80 | .77 |
Ratio of net investment income
to average net assets | | 5.58 | 4.45 | 3.87 | 4.22 | 4.19 |
Portfolio Turnover Rate | | 86.44 | 91.78 | 97.82 | 66.45 | 76.63 |
Net Assets, end of period ($ x 1,000) | | 89,078 | 18,280 | 18,492 | 12,845 | 10,187 |
a Based on average shares outstanding.
See notes to financial statements.
32
| | | | | | | |
| | | |
| | | Year Ended August 31, |
Class Y Shares | | 2019 | 2018 | 2017 | 2016 | 2015 |
Per Share Data ($): | | | | | | |
Net asset value, beginning of period | | 12.03 | 12.09 | 12.03 | 12.27 | 12.63 |
Investment Operations: | | | | | | |
Investment income—neta | | .66 | .54 | .47 | .51 | .51 |
Net realized and unrealized
gain (loss) on investments | | (.44) | (.10) | .05 | (.22) | (.32) |
Total from Investment Operations | | .22 | .44 | .52 | .29 | (.19) |
Distributions: | | | | | | |
Dividends from investment
income—net | | (.65) | (.50) | (.46) | (.53) | (.53) |
Dividends from net realized
gain on investments | | - | - | - | - | (.02) |
Total Distributions | | (.65) | (.50) | (.46) | (.53) | (.55) |
Net asset value, end of period | | 11.60 | 12.03 | 12.09 | 12.03 | 12.27 |
Total Return (%) | | 1.90 | 3.60 | 4.51 | 2.54 | 1.56 |
Ratios/Supplemental Data (%): | | | | | | |
Ratio of total expenses
to average net assets | | .73 | .72 | .74 | .76 | .75 |
Ratio of net expenses
to average net assets | | .73 | .72 | .74 | .76 | .75 |
Ratio of net investment income
to average net assets | | 5.55 | 4.46 | 3.91 | 4.27 | 4.14 |
Portfolio Turnover Rate | | 86.44 | 91.78 | 97.82 | 66.45 | 76.63 |
Net Assets, end of period ($ x 1,000) | | 790,351 | 1,121,392 | 877,163 | 481,579 | 490,699 |
a Based on average shares outstanding.
See notes to financial statements.
33
NOTES TO FINANCIAL STATEMENTS
NOTE 1—Significant Accounting Policies:
BNY Mellon Floating Rate Income Fund (the “fund”) is a separate non-diversified series of BNY Mellon Investment Fund IV, Inc. (the “Company”), which is registered under the Investment Company Act of 1940, as amended (the “Act”), as an open-end management investment company and operates as a series company currently offering six series, including the fund. The fund’s investment objective is to seek high current income. BNY Mellon Investment Adviser, Inc. (the “Adviser”), a wholly-owned subsidiary of The Bank of New York Mellon Corporation (“BNY Mellon”), serves as the fund’s investment adviser. Alcentra NY, LLC (the “Sub-Adviser”), a wholly-owned subsidiary of BNY Mellon and an affiliate of the Adviser, serves as the fund’s sub-investment adviser.
Effective June 3, 2019, the fund changed its name from Dreyfus Floating Rate Income Fund to BNY Mellon Floating Rate Income Fund and the Company changed its name from The Dreyfus/Laurel Funds, Inc. to BNY Mellon Investment Fund IV, Inc. In addition, The Dreyfus Corporation, the fund’s investment adviser, changed its name to “BNY Mellon Investment Adviser, Inc.”, MBSC Securities Corporation, the fund’s distributor, changed its name to “BNY Mellon Securities Corporation” and Dreyfus Transfer, Inc., the fund’s transfer agent, changed its name to “BNY Mellon Transfer, Inc.”
BNY Mellon Securities Corporation (the “Distributor”), a wholly-owned subsidiary of the Adviser, is the distributor of the fund’s shares. The fund is authorized to issue 500 million shares of $.001 par value Common Stock. The fund currently has authorized five classes of shares: Class A (75 million shares authorized), Class C (75 million shares authorized), Class I (75 million shares authorized), Class T (75 million shares authorized) and Class Y (200 million shares authorized). Class A, Class C and Class T shares are sold primarily to retail investors through financial intermediaries and bear Distribution and/or Shareholder Services Plan fees. Class A and Class T shares generally are subject to a sales charge imposed at the time of purchase. Class C shares are subject to a contingent deferred sales charge (“CDSC”) imposed on Class C shares redeemed within one year of purchase. Class C shares automatically convert to Class A shares ten years after the date of purchase, without the imposition of a sales charge. Class I shares are sold primarily to bank trust departments and other financial service providers (including The Bank of New York Mellon, a subsidiary of BNY Mellon and an affiliate of the Adviser, and its affiliates), acting on behalf of customers having a qualified trust or an investment account or relationship at such institution, and bear no Distribution or Shareholder Services Plan fees. Class Y shares are sold at net asset value per share
34
generally to institutional investors, and bear no Distribution or Shareholder Services Plan fees. Class I and Class Y shares are offered without a front-end sales charge or CDSC. As of the date of this report, the fund did not offer Class T shares for purchase. Other differences between the classes include the services offered to and the expenses borne by each class, the allocation of certain transfer agency costs, and certain voting rights. Income, expenses (other than expenses attributable to a specific class), and realized and unrealized gains or losses on investments are allocated to each class of shares based on its relative net assets.
The Company accounts separately for the assets, liabilities and operations of each series. Expenses directly attributable to each series are charged to that series’ operations; expenses which are applicable to all series are allocated among them on a pro rata basis.
The Financial Accounting Standards Board (“FASB”) Accounting Standards Codification (“ASC”) is the exclusive reference of authoritative U.S. generally accepted accounting principles (“GAAP”) recognized by the FASB to be applied by nongovernmental entities. Rules and interpretive releases of the Securities and Exchange Commission (“SEC”) under authority of federal laws are also sources of authoritative GAAP for SEC registrants. The fund is an investment company and applies the accounting and reporting guidance of the FASB ASC Topic 946 Financial Services-Investment Companies. The fund’s financial statements are prepared in accordance with GAAP, which may require the use of management estimates and assumptions. Actual results could differ from those estimates.
(a) Portfolio valuation: The fair value of a financial instrument is the amount that would be received to sell an asset or paid to transfer a liability in an orderly transaction between market participants at the measurement date (i.e., the exit price). GAAP establishes a fair value hierarchy that prioritizes the inputs of valuation techniques used to measure fair value. This hierarchy gives the highest priority to unadjusted quoted prices in active markets for identical assets or liabilities (Level 1 measurements) and the lowest priority to unobservable inputs (Level 3 measurements).
Additionally, GAAP provides guidance on determining whether the volume and activity in a market has decreased significantly and whether such a decrease in activity results in transactions that are not orderly. GAAP requires enhanced disclosures around valuation inputs and techniques used during annual and interim periods.
35
NOTES TO FINANCIAL STATEMENTS(continued)
Various inputs are used in determining the value of the fund’s investments relating to fair value measurements. These inputs are summarized in the three broad levels listed below:
Level 1—unadjusted quoted prices in active markets for identical investments.
Level 2—other significant observable inputs (including quoted prices for similar investments, interest rates, prepayment speeds, credit risk, etc.).
Level 3—significant unobservable inputs (including the fund’s own assumptions in determining the fair value of investments).
The inputs or methodology used for valuing securities are not necessarily an indication of the risk associated with investing in those securities.
Changes in valuation techniques may result in transfers in or out of an assigned level within the disclosure hierarchy. Valuation techniques used to value the fund’s investments are as follows:
Registered investment companies that are not traded on an exchange are valued at their net asset value and are generally categorized within Level 1 of the fair value hierarchy.
Investments in securities, floating rate loan interests and other securities, excluding short-term investments (other than U.S. Treasury Bills), and forward foreign currency exchange contracts (“forward contracts”) are valued each business day by an independent pricing service (the “Service”) approved by the Board.Investments for which quoted bid prices are readily available and are representative of the bid side of the market in the judgment of the Service are valued at the mean between the quoted bid prices (as obtained by the Service from dealers in such securities) and asked prices (as calculated by the Service based upon its evaluation of the market for such securities). Debt investments (which constitute a majority of the portfolio securities) are valued as determined by the Service, based on methods which include consideration of the following: yields or prices of securities of comparable quality, coupon, maturity and type; indications as to values from dealers; and general market conditions. These securities are generally categorized within Level 2 of the fair value hierarchy.
The Service is engaged under the general oversight of the Board.
When market quotations or official closing prices are not readily available, or are determined not to accurately reflect fair value, such as when the value of a security has been significantly affected by events after the close of the exchange or market on which the security is principally traded (for
36
example, a foreign exchange or market), but before the fund calculates its net asset value, the fund may value these investments at fair value as determined in accordance with the procedures approved by the Board. Certain factors may be considered when fair valuing investments such as: fundamental analytical data, the nature and duration of restrictions on disposition, an evaluation of the forces that influence the market in which the securities are purchased and sold, and public trading in similar securities of the issuer or comparable issuers. These securities are either categorized within Level 2 or 3 of the fair value hierarchy depending on the relevant inputs used.
For restricted securities where observable inputs are limited, assumptions about market activity and risk are used and such securities are generally categorized within Level 3 of the fair value hierarchy.
Investments denominated in foreign currencies are translated to U.S. dollars at the prevailing rates of exchange.
Forward contracts are valued at the forward rate and are generally categorized within Level 2 of the fair value hierarchy.
The following is a summary of the inputs used as of August 31, 2019in valuing the fund’s investments:
| | | | | |
| | Level 1 - Unadjusted Quoted Prices | Level 2 - Other Significant Observable Inputs | Level 3 -Significant Unobservable Inputs | Total |
Assets ($) | | | | |
Investments in Securities:† | | | |
Collateralized Loan Obligations | - | 33,250,739 | - | 33,250,739 |
Corporate Bonds | - | 20,349,736 | - | 20,349,736 |
Floating Rate Loan Interests | - | 827,837,043 | - | 827,837,043 |
Investment Companies | 30,794,018 | - | - | 30,794,018 |
Other Financial Instruments: | | | |
Forward Foreign Currency Exchange Contracts†† | - | 183,500 | - | 183,500 |
† See Statement of Investments for additional detailed categorizations, if any.
†† Amount shown represents unrealized appreciation at period end, but only variation margin on exchanged traded and centrally cleared derivatives, if any, are reported in the Statement of Assets and Liabilities.
(b) Foreign currency transactions: The fund does not isolate that portion of the results of operations resulting from changes in foreign exchange rates on investments from the fluctuations arising from changes
37
NOTES TO FINANCIAL STATEMENTS(continued)
in the market prices of securities held. Such fluctuations are included with the net realized and unrealized gain or loss on investments.
Net realized foreign exchange gains or losses arise from sales of foreign currencies, currency gains or losses realized on securities transactions between trade and settlement date, and the difference between the amounts of dividends, interest and foreign withholding taxes recorded on the fund’s books and the U.S. dollar equivalent of the amounts actually received or paid. Net unrealized foreign exchange gains and losses arise from changes in the value of assets and liabilities other than investments resulting from changes in exchange rates. Foreign currency gains and losses on foreign currency transactions are also included with net realized and unrealized gain or loss on investments.
(c)Securities transactions and investment income: Securities transactions are recorded on a trade date basis. Realized gains and losses from securities transactions are recorded on the identified cost basis. Dividend income is recognized on the ex-dividend date and interest income, including, where applicable, accretion of discount and amortization of premium on investments, is recognized on the accrual basis.
(d) Affiliated issuers: Investments in other investment companies advised by the Adviser are considered “affiliated” under the Act.
(e) Risk:The fund invests in floating rate loan interests. The floating rate loans in which the fund invests typically are below investment grade securities, and inherently speculative. In the event of the bankruptcy of a borrower, the fund could experience delays or limitations imposed by insolvency laws with respect to its ability to realize the benefits of any collateral securing the borrower’s loan.
The fund invests in Collateralized Loan Obligations (“CLOs”). CLO and structured finance securities are generally backed by an asset or a pool of assets (typically senior secured loans and other credit-related assets in the case of a CLO) which serve as collateral. The fund and other investors in CLO and structured finance securities ultimately bear the credit risk of the underlying collateral. If there are defaults or the relevant collateral otherwise underperforms, scheduled payments to senior tranches of such securities take precedence over those of mezzanine tranches, and scheduled payments to mezzanine tranches take precedence over those to subordinated/equity tranches. Therefore, CLO and other structured finance securities may present risks similar to those of the other types of debt obligations and, in fact, such risks may be of greater significance in the case of CLO and other structured finance securities. In addition to the
38
general risks associated with investing in debt securities, CLO securities carry additional risks, including, but not limited to:(1) the possibility that distributions from collateral assets will not be adequate to make interest or other payments;(2)the quality of the collateral may decline in value or default;(3) the fact that investments in CLO equity and junior debt tranches will likely be subordinate to other senior classes of CLO debt; and(4) the complex structure of the security may not be fully understood at the time of investment and may produce disputes with the issuer or unexpected investment results. Additionally, changes in the collateral held by a CLO may cause payments on the instruments the Fund holds to be reduced, either temporarily or permanently. Structured investments, particularly the subordinated interests in which the Fund invests, are less liquid than many other types of securities and may be more volatile than the assets underlying the CLOs the Fund may target. In addition, CLO and other structured finance securities may be subject to prepayment risk.
The fund invests primarily in debt securities. Failure of an issuer of the debt securities to make timely interest or principal payments, or a decline or the perception of a decline in the credit quality of a debt security, can cause the debt security’s price to fall, potentially lowering the fund’s share price. In addition, the value of debt securities may decline due to general market conditions that are not specifically related to a particular issuer, such as real or perceived adverse economic conditions, changes in outlook for corporate earnings, changes in interest or currency rates or adverse investor sentiment. Such values may also decline because of factors that affect a particular industry.
(f) Dividends and distributions to shareholders: Dividends and distributions are recorded on the ex-dividend date. Dividends from investment income-net are normally declared and paid on a monthly basis. Dividends from net realized capital gains, if any, are normally declared and paid annually, but the fund may make distributions on a more frequent basis to comply with the distribution requirements of the Internal Revenue Code of 1986, as amended (the “Code”). To the extent that net realized capital gains can be offset by capital loss carryovers, it is the policy of the fund not to distribute such gains. Income and capital gain distributions are determined in accordance with income tax regulations, which may differ from GAAP.
On August 31, 2019, the Board declared a cash dividend of $.053, $.046, $.056 and $.056 per share from undistributed investment income-net for Class A, Class C, Class I and Class Y shares, respectively, payable on September 3, 2019, to shareholders of record as of the close of business on August 30, 2019. The ex-dividend date was September 3, 2019.
39
NOTES TO FINANCIAL STATEMENTS(continued)
(g) Federal income taxes: It is the policy of the fund to continue to qualify as a regulated investment company, if such qualification is in the best interests of its shareholders, by complying with the applicable provisions of the Code, and to make distributions of taxable income and net realized capital gain sufficient to relieve it from substantially all federal income and excise taxes.
As of and during the period ended August 31, 2019, the fund did not have any liabilities for any uncertain tax positions. The fund recognizes interest and penalties, if any, related to uncertain tax positions as income tax expense in the Statement of Operations. During the period ended August 31, 2019, the fund did not incur any interest or penalties.
Each tax year in the four-year period ended August 31, 2019 remains subject to examination by the Internal Revenue Service and state taxing authorities.
At August 31, 2019, the components of accumulated earnings on a tax basis were as follows: undistributed ordinary income $6,207,954, accumulated capital losses $55,228,844 and unrealized depreciation $25,328,737.
The fund is permitted to carry forward capital losses for an unlimited period. Furthermore, capital loss carryovers retain their character as either short-term or long-term capital losses.
The accumulated capital loss carryover is available for federal income tax purposes to be applied against future netrealized capital gains, if any, realized subsequent to August 31, 2019. The fund has $19,327,937 of short-term capital losses and $35,900,907 of long-term capital losses which can be carried forward for an unlimited period.
The tax character of distributions paid to shareholders during the fiscal periods ended August 31, 2019 and August 31, 2018 were as follows: ordinary income $57,866,194 and $42,426,799, respectively.
(h) New Accounting Pronouncements: Effective June 1, 2019, the fund adopted Accounting Standards Update 2017-08, Receivables—Nonrefundable Fees and Other Costs (Subtopic 310-20): Premium Amortization On Purchased Callable Debt Securities (“ASU 2017-08”). The update shortens the amortization period for the premium on certain purchased callable debt securities to the earliest call date.
Also effective June 1, 2019, the fund adopted Accounting Standards Update 2018-13, Fair Value Measurement (Topic 820): Disclosure Framework—Changes to the Disclosure Requirements for Fair Value Measurement (“ASU 2018-13”). The update provides guidance that
40
modifies certain disclosure requirements for fair value measurements. The adoption of ASU 2017-08 and ASU 2018-13 had no impact on the operations of the fund for the period ended August 31, 2019.
NOTE 2—Bank Lines of Credit:
The fund participates with other long-term open-end funds managed by the Adviser in a $1.030 billion unsecured credit facility led by Citibank, N.A. (the “Citibank Credit Facility”) and a $300 million unsecured credit facility provided by The Bank of New York Mellon (the “BNYM Credit Facility”), each to be utilized primarily for temporary or emergency purposes, including the financing of redemptions (each, a “Facility”). The Citibank Credit Facility is available in two tranches: (i) Tranche A is in an amount equal to $830 million and is available to all long-term open-ended funds, including the fund, and (ii) Tranche B is in amount equal to $200 million and is available only to BNY Mellon Floating Rate Income Fund, a series of BNY Mellon Investment Funds IV, Inc. Prior to October 3, 2018, the unsecured credit facility with Citibank, N.A. was $830 million. In connection therewith, the fund has agreed to pay its pro rata portion of commitment fees for Tranche A of the Citibank Credit Facility and the BNYM Credit Facility. Interest is charged to the fund based on rates determined pursuant to the terms of the respective Facility at the time of borrowing.
The average amount of borrowings outstanding under the Facilities during the period ended August 31, 2019 was approximately $1,778,600 with a related weighted average annualized interest rate of 3.38%.
NOTE 3—Management Fee, Sub-Investment Advisory Fee and Other Transactions with Affiliates:
(a)Pursuant to a management agreement with the Adviser, the management fee is computed at the annual rate of .65% of the value of the fund’s average daily net assets and is payable monthly. The Adviser has contractually agreed, from September 1, 2018 through December 31, 2019, to waive receipt of its fees and/or assume the direct expenses of the fund, so that the annual fund operating expense for Class A, C, I and Y shares (excluding Rule 12b-1 Distribution Plan fees, Shareholder Services Plan fees, taxes, interest expense, brokerage commissions, commitment fees on borrowings and extraordinary expenses) do not exceed .75% of the fund’s average daily net assets. On or after December 31, 2019, the Adviser may terminate the expenses limitation agreement at any time. The reduction in expenses, pursuant to the undertaking, amounted to $82,883 during the period ended August 31, 2019.
41
NOTES TO FINANCIAL STATEMENTS(continued)
Pursuant to a sub-investment advisory agreement between the Adviser and the Sub-Adviser, the Sub-Adviser serves as the fund’s sub-investment adviser responsible for the day-to-day management of the fund’s portfolio. The Adviser pays the sub-investment adviser a monthly fee at an annual percentage of the value of the fund’s average daily net assets. The Adviser has obtained an exemptive order from the SEC (the “Order”), upon which the fund may rely, to use a manager of managers approach that permits the Adviser, subject to certain conditions and approval by the Board, to enter into and materially amend sub-investment advisory agreements with one or more sub-investment advisers who are either unaffiliated with the Adviser or are wholly-owned subsidiaries (as defined under the Act) of the Adviser’s ultimate parent company, BNY Mellon, without obtaining shareholder approval. The Order also allows the fund to disclose the sub-investment advisory fee paid by the Adviser to any unaffiliated sub-investment adviser in the aggregate with other unaffiliated sub-investment advisers in documents filed with the SEC and provided to shareholders. In addition, pursuant to the Order, it is not necessary to disclose the sub-investment advisory fee payable by the Adviser separately to a sub-investment adviser that is a wholly-owned subsidiary of BNY Mellon in documents filed with the SEC and provided to shareholders; such fees are to be aggregated with fees payable to the Adviser. The Adviser has ultimate responsibility (subject to oversight by the Board) to supervise any sub-investment adviser and recommend the hiring, termination, and replacement of any sub-investment adviser to the Board.
During the period ended August 31, 2019, the Distributor retained $803 from commissions earned on sales of the fund’s Class A shares.
(b) Under the Distribution Plan adopted pursuant to Rule 12b-1 under the Act, Class C shares pay the Distributor for distributing its shares at an annual rate of .75% of the value of its average daily net assets. During the period ended August 31, 2019, Class C shares were charged $14,499 pursuant to the Distribution Plan.
(c)Under the Shareholder Services Plan, Class A and Class C shares pay the Distributor at an annual rate of .25% of the value of their average daily net assets for the provision of certain services. The services provided may include personal services relating to shareholder accounts, such as answering shareholder inquiries regarding the fund and providing reports and other information, and services related to the maintenance of shareholder accounts. The Distributor may make payments to Service Agents (securities dealers, financial institutions or other industry professionals) with respect to these services. The Distributor determines the amounts to be paid to Service Agents. During the period ended August
42
31, 2019, Class A and Class C shares were charged $83,434and $4,833, respectively, pursuant to the Shareholder Services Plan.
Under its terms, the Distribution Plan and Shareholder Services Plan shall remain in effect from year to year, provided such continuance is approved annually by a vote of a majority of those Directors who are not “interested persons” of the Company and who have no direct or indirect financial interest in the operation of or in any agreement related to the Distribution Plan or Shareholder Services Plan.
The fund has an arrangement with the transfer agent whereby the fund may receive earnings credits when positive cash balances are maintained, which are used to offset transfer agency fees. The fund had an arrangement with the custodian to receive earnings credits when positive cash balances were maintained, which were used to offset custody fees. Effective February 1, 2019, the arrangement with the custodian changed whereby the fund will no longer receive earnings credits to offset its custody fees and will receive interest income or overdraft fees going forward. For financial reporting purposes, the fund includes net earnings credits, if any, as an expense offset in the Statement of Operations.
The fund compensates BNY Mellon Transfer, Inc., a wholly-owned subsidiary of the Adviser, under a transfer agency agreement for providing transfer agency and cash management services for the fund. The majority of transfer agency fees are comprised of amounts paid on a per account basis, while cash management fees are related to fund subscriptions and redemptions. During the period ended August 31, 2019, the fund was charged $19,881 for transfer agency services. These fees are included in Shareholder servicing costs in the Statement of Operations.
The fund compensates The Bank of New York Mellon under a custody agreement for providing custodial services for the fund. These fees are determined based on net assets, geographic region and transaction activity. During the period ended August 31, 2019, the fund was charged $2,117 pursuant to the custody agreement.
During the period ended August 31, 2019, the fund was charged $11,539 for services performed by the Chief Compliance Officer and his staff. These fees are included in Miscellaneous in the Statement of Operations.
The components of “Due to BNY Mellon Investment Adviser, Inc. and affiliates” in the Statement of Assets and Liabilities consist of: management fees $510,379, Distribution Plan fees $1,144, Shareholder Services Plan fees $6,125, custodian fees $4,580, Chief Compliance Officer fees $2,252 and transfer agency fees $4,788, which are offset against an expense reimbursement currently in effect in the amount of $13,963.
43
NOTES TO FINANCIAL STATEMENTS(continued)
(d) Each Board member also serves as a Board member of other funds in the BNY Mellon Family of Funds complex. Annual retainer fees and attendance fees are allocated to each fund based on net assets.
NOTE 4—Securities Transactions:
The aggregate amount of purchases and sales (including paydowns) of investment securities, excluding short-term securities and forward contracts, during the period ended August 31, 2019, amounted to $871,403,443 and $1,052,660,178, respectively.
Floating Rate Loan Interests: Floating rate instruments are loans and other securities with interest rates that adjust or “float” periodically. Floating rate loans are made by banks and other financial institutions to their corporate clients. The rates of interest on the loans adjust periodically by reference to a base lending rate, such as the London Interbank Offered Rate (“LIBOR”) plus a premium or credit spread. Floating rate loans reset on periodic set dates, typically 30 to 90 days, but not to exceed one year. The fund may invest in multiple series or tranches of a loan. A different series or tranche may have varying terms and carry different associated risks.
The fund may enter into certain credit agreements all or a portion of which may be unfunded. The fund is obligated to fund these commitments at the borrower’s discretion. The commitments are disclosed in the accompanying Statement of Investments. At August 31, 2019, the fund had sufficient cash and/or securities to cover these commitments.
Derivatives: A derivative is a financial instrument whose performance is derived from the performance of another asset. The fund enters into International Swaps and Derivatives Association, Inc. Master Agreements or similar agreements (collectively, “Master Agreements”) with its over-the-counter (“OTC”) derivative contract counterparties in order to, among other things, reduce its credit risk to counterparties. Master Agreements include provisions for general obligations, representations, collateral and events of default or termination. Under a Master Agreement, the fund may offset with the counterparty certain derivative financial instruments’ payables and/or receivables with collateral held and/or posted and create one single net payment in the event of default or termination.
Each type of derivative instrument that was held by the fund during the period ended August 31, 2019 is discussed below.
Forward Foreign Currency Exchange Contracts: The fund enters into forward contracts in order to hedge its exposure to changes in foreign currency exchange rates on its foreign portfolio holdings, to settle foreign
44
currency transactions or as a part of its investment strategy. When executing forward contracts, the fund is obligated to buy or sell a foreign currency at a specified rate on a certain date in the future. With respect to sales of forward contracts, the fund incurs a loss if the value of the contract increases between the date the forward contract is opened and the date the forward contract is closed. The fund realizes a gain if the value of the contract decreases between those dates. With respect to purchases of forward contracts, the fund incurs a loss if the value of the contract decreases between the date the forward contract is opened and the date the forward contract is closed. The fund realizes a gain if the value of the contract increases between those dates. Any realized or unrealized gains or losses which occurred during the period are reflected in the Statement of Operations. The fund is exposed to foreign currency risk as a result of changes in value of underlying financial instruments. The fund is also exposed to credit risk associated with counterparty nonperformance on these forward contracts, which is generally limited to the unrealized gain on each open contract. This risk may be mitigated by Master Agreements, if any, between the fund and the counterparty and the posting of collateral, if any, by the counterparty to the fund to cover the fund’s exposure to the counterparty. Forward Contracts open at August 31, 2019 are set forth in the Statement of Forward Foreign Currency Exchange Contracts.
The provisions of ASC Topic 210 “Disclosures about Offsetting Assets and Liabilities” require disclosure on the offsetting of financial assets and liabilities. These disclosures are required for certain investments, including derivative financial instruments subject to Master Agreements which are eligible for offsetting in the Statement of Assets and Liabilities and require the fund to disclose both gross and net information with respect to such investments. For financial reporting purposes, the fund does not offset derivative assets and derivative liabilities that are subject to Master Agreements in the Statement of Assets and Liabilities.
At August 31, 2019, derivative assets and liabilities (by type) on a gross basis are as follows:
| | | | | | |
Derivative Financial Instruments: | | Assets ($) | | Liabilities ($) | |
Forward contracts | | 183,500 | | - | |
Total gross amount of derivative | | | | | |
assets and liabilities in the | | | | | |
Statement of Assets and Liabilities | | 183,500 | | - | |
Derivatives not subject to | | | | | |
Master Agreements | | - | | - | |
Total gross amount of assets | | | | | |
and liabilities subject to | | | | | |
Master Agreements | | 183,500 | | - | |
45
NOTES TO FINANCIAL STATEMENTS(continued)
The following table presents derivative assets net of amounts available for offsetting under Master Agreements and net of related collateral received or pledged, if any, as of August 31, 2019:
| | | | | | | |
| | | Financial | | | |
| | | Instruments | | | |
| | | and Derivatives | | | |
| Gross Amount of | | Available | Collateral | | Net Amount of |
Counterparty | Assets ($) | 1 | for Offset ($) | Received ($) | | Assets ($) |
Citigroup | 183,500 | | - | - | | 183,500 |
| | | | | | |
| | | | | | |
1 Absent a default event or early termination, OTC derivative assets and liabilities are presented at gross amounts
and are not offset in the Statement of Assets and Liabilities. |
The following summarizes the average market value of derivatives outstanding duringthe period ended August 31, 2019:
| | | |
| | Average Market Value ($) |
Forward contracts | | 36,710,286 |
| | |
At August 31, 2019, the cost of investments inclusive of derivative contracts for federal income tax purposes was $937,523,254; accordingly, accumulated net unrealized depreciation on investments was $25,291,718, consisting of $2,922,620 gross unrealized appreciation and $28,214,338 gross unrealized depreciation.
46
REPORT OF INDEPENDENT REGISTERED PUBLIC ACCOUNTING FIRM
To the Shareholders of the Fund and Board of Directors of
BNY Mellon Investment Funds IV, Inc. (formerly, The Dreyfus/Laurel Funds, Inc.)
Opinion on the Financial Statements
We have audited the accompanying statement of assets and liabilities of BNY Mellon Floating Rate Income Fund (formerly, Dreyfus Floating Rate Income Fund) (the “Fund”), a series of BNY Mellon Investment Funds IV, Inc., including the statements of investments, investments in affiliated issuers, and forward foreign currency exchange contracts, as of August 31, 2019, the related statement of operations for the year then ended, the statements of changes in net assets for each of the years in the two-year period then ended, and the related notes (collectively, the financial statements), and the financial highlights for each of the years in the five-year period then ended. In our opinion, the financial statements and financial highlights present fairly, in all material respects, the financial position of the Fund as of August 31, 2019, the results of its operations for the year then ended, the changes in its net assets for each of the years in the two-year period then ended, and the financial highlights for each of the years in the five-year period then ended, in conformity with U.S. generally accepted accounting principles.
Basis for Opinion
These financial statements and financial highlights are the responsibility of the Fund’s management. Our responsibility is to express an opinion on these financial statements and financial highlights based on our audits. We are a public accounting firm registered with the Public Company Accounting Oversight Board (United States) (PCAOB) and are required to be independent with respect to the Fund in accordance with the U.S. federal securities laws and the applicable rules and regulations of the Securities and Exchange Commission and the PCAOB.
We conducted our audits in accordance with the standards of the PCAOB. Those standards require that we plan and perform the audit to obtain reasonable assurance about whether the financial statements and financial highlights are free of material misstatement, whether due to error or fraud. Our audits included performing procedures to assess the risks of material misstatement of the financial statements and financial highlights, whether due to error or fraud, and performing procedures that respond to those risks. Such procedures included examining, on a test basis, evidence regarding the amounts and disclosures in the financial statements and financial highlights. Such procedures also included confirmation of securities owned as of August 31, 2019, by correspondence with the custodian, transfer agent, and brokers or by other appropriate auditing procedures when replies from brokers were not received. Our audits also included evaluating the accounting principles used and significant estimates made by management, as well as evaluating the overall presentation of the financial statements and financial highlights. We believe that our audits provide a reasonable basis for our opinion.

We have served as the auditor of one or more BNY Mellon Investment Adviser, Inc. investment companies since 1994.
New York, New York
October 29, 2019
47
IMPORTANT TAX INFORMATION(Unaudited)
For federal tax purposes the fund designates the maximum amount allowable but not less than 90.73% as interest-related dividends in accordance with Sections 871(k)(1) and 881(e) of the Internal Revenue Code. Where required by federal tax law rules, shareholders will receive notification of their portion of the Fund’s taxable ordinary dividends and capital gains distributions paid for the 2019 calendar year on Form 1099-DIV which will be mailed in early 2020.
48
BOARD MEMBERS INFORMATION(Unaudited)
INDEPENDENT BOARD MEMBERS
Joseph S. DiMartino (75)
Chairman of the Board (1999)
Principal Occupation During Past 5 Years:
· Corporate Director and Trustee (1995-present)
Other Public Company Board Memberships During Past 5 Years:
· CBIZ (formerly, Century Business Services, Inc.), a provider of outsourcing functions for small and medium size companies, Director (1997-present)
No. of Portfolios for which Board Member Serves:120
———————
Francine J. Bovich (68)
Board Member (2012)
Principal Occupation During Past 5 Years:
· Trustee, The Bradley Trusts, private trust funds (2011-present)
Other Public Company Board Memberships During Past 5 Years:
· Annaly Capital Management, Inc., a real estate investment trust, Director (2014-present)
No. of Portfolios for which Board Member Serves:70
———————
Andrew J. Donohue (68)
Board Member (2019)
Principal Occupation During Past 5 Years:
· Of Counsel, Shearman & Sterling LLP (September 2017-July 2019)
· Chief of Staff to the Chair of the SEC (2015-2017)
· Managing Director and Investment Company General Counsel of Goldman Sachs (2012-2015)
Other Public Company Board Memberships During Past 5 Years:
· Oppenheimer Funds (58 funds), Director (2017-2019)
No. of Portfolios for which Board Member Serves:56
———————
Kenneth A. Himmel (72)
Board Member (1994)
Principal Occupation During Past 5 Years:
· Managing Partner, Gulf Related, an international real estate development company (2010-present)
· President and CEO, Related Urban Development, a real estate development company (1996-present)
· President and CEO, Himmel & Company, a real estate development company (1980-present)
· CEO, American Food Management, a restaurant company (1983-present)
No. of Portfolios for which Board Member Serves:23
———————
49
BOARD MEMBERS INFORMATION (Unaudited) (continued)
INDEPENDENT BOARD MEMBERS (continued)
Stephen J. Lockwood (72)
Board Member (1994)
Principal Occupation During Past 5 Years:
· Chairman of the Board, Stephen J. Lockwood and Company LLC, a real estate investment company (2000-present)
No. of Portfolios for which Board Member Serves:23
———————
Roslyn M. Watson (69)
Board Member (2015)
Principal Occupation During Past 5 Years:
· Principal, Watson Ventures, Inc., a real estate investment company (1993-present)
No. of Portfolios for which Board Member Serves:56
———————
Benaree Pratt Wiley (73)
Board Member (1998)
Principal Occupation During Past 5 Years:
· Principal, The Wiley Group, a firm specializing in strategy and business development (2005-present)
Other Public Company Board Memberships During Past 5 Years:
· CBIZ (formerly, Century Business Services, Inc.), a provider of outsourcing functions for small and medium size companies, Director (2008-present)
No. of Portfolios for which Board Member Serves:76
———————
Once elected all Board Members serve for an indefinite term, but achieve Emeritus status upon reaching age 80. The address of the Board Members and Officers is c/o BNY Mellon Investment Adviser, Inc. 240 Greenwich Street, New York, New York 10166. Additional information about the Board Members is available in the fund’s Statement of Additional Information which can be obtained from the Adviser free of charge by calling this toll free number: 1-800-373-9387.
James M. Fitzgibbons, Emeritus Board Member
50
OFFICERS OF THE FUND(Unaudited)
RENEE LAROCHE-MORRIS, President since May 2019.
President and a director of BNY Mellon Investment Adviser, Inc. since January 2018. She is an officer of 63 investment companies (comprised of 120 portfolios) managed by the Adviser. She is 48 years old and has been an employee of BNY Mellon since 2003.
JAMES WINDELS, Treasurer since November 2001.
Director- BNY Mellon Fund Administration, and an officer of 64 investment companies (comprised of 143 portfolios) managed by the Adviser. He is 61 years old and has been an employee of the Adviser since April 1985.
BENNETT A. MACDOUGALL, Chief Legal Officer since October 2015.
Chief Legal Officer of the Adviser and Associate General Counsel and Managing Director of BNY Mellon since June 2015; Director and Associate General Counsel of Deutsche Bank – Asset & Wealth Management Division from June 2005 to June 2015, and as Chief Legal Officer of Deutsche Investment Management Americas Inc. from June 2012 to May 2015. He is an officer of 64 investment companies (comprised of 143 portfolios) managed by the Adviser. He is 48 years old and has been an employee of the Adviser since June 2015.
DAVID DIPETRILLO, Vice President since January 2018.
Head of North America Product, BNY Mellon Investment Management since January 2018, Director of Product Strategy, BNY Mellon Investment Management from January 2016 to December 2017; Head of US Retail Product and Channel Marketing, BNY Mellon Investment Management from January 2014 to December 2015. He is an officer of 63 investment companies (comprised of 120 portfolios) managed by the Adviser. He is 41 years old and has been an employee of BNY Mellon since 2005.
JAMES BITETTO, Vice President since August 2005 and Secretary since February 2018.
Managing Counsel of BNY Mellon and Secretary of the Adviser, and an officer of 64 investment companies (comprised of 143 portfolios) managed by the Adviser. He is 53 years old and has been an employee of the Adviser since December 1996.
SONALEE CROSS, Vice President and Assistant Secretary since March 2018.
Counsel of BNY Mellon since October 2016; Associate at Proskauer Rose LLP from April 2016 to September 2016; Attorney at EnTrust Capital from August 2015 to February 2016; Associate at Sidley Austin LLP from September 2013 to August 2015. She is an officer of 64 investment companies (comprised of 143 portfolios) managed by the Adviser. She is 31 years old and has been an employee of the Adviser since October 2016.
DEIRDRE CUNNANE, Vice President and Assistant Secretary since March 2019.
Counsel of BNY Mellon since August 2018; Senior Regulatory Specialist at BNY Mellon Investment Management Services from February 2016 to August 2018; Trustee Associate at BNY Mellon Trust Company (Ireland) Limited from August 2013 to February 2016. She is an officer of 64 investment companies (comprised of 143 portfolios) managed by the Adviser. She is 29 years old and has been an employee of the Adviser since August 2018.
SARAH S. KELLEHER, Vice President and Assistant Secretary since April 2014.
Managing Counsel of BNY Mellon since December 2017, Senior Counsel of BNY Mellon from March 2013 to December 2017. She is an officer of 64 investment companies (comprised of 143 portfolios) managed by the Adviser. She is 44 years old and has been an employee of the Adviser since March 2013.
JEFF PRUSNOFSKY, Vice President and Assistant Secretary since August 2005.
Senior Managing Counsel of BNY Mellon, and an officer of 64 investment companies (comprised of 143 portfolios) managed by the Adviser. He is 54 years old and has been an employee of the Adviser since October 1990.
PETER M. SULLIVAN, Vice President and Assistant Secretary since March 2019.
Managing Counsel of BNY Mellon, and an officer of 64 investment companies (comprised of 143 portfolios) managed by the Adviser. He is 51 years old and has been an employee of the Adviser since April 2004.
51
OFFICERS OF THE FUND (Unaudited)(continued)
NATALYA ZELENSKY, Vice President and Assistant Secretary since March 2017.
Counsel of BNY Mellon since May 2016; Attorney at Wildermuth Endowment Strategy Fund/Wildermuth Advisory, LLC from November 2015 to May 2016 and Assistant General Counsel at RCS Advisory Services from July 2014 to November 2015. She is an officer of 64 investment companies (comprised of 143 portfolios) managed by the Adviser. She is 34 years old and has been an employee of the Adviser since May 2016.
GAVIN C. REILLY, Assistant Treasurer since December 2005.
Tax Manager - BNY Mellon Fund Administration, and an officer of 64 investment companies (comprised of 143 portfolios) managed by the Adviser. He is 51 years old and has been an employee of the Adviser since April 1991.
ROBERT S. ROBOL, Assistant Treasurer since August 2003.
Senior Accounting Manager- BNY Mellon Fund Administration, and an officer of 64 investment companies (comprised of 143 portfolios) managed by the Adviser. He is 55 years old and has been an employee of the Adviser since October 1988.
ROBERT SALVIOLO, Assistant Treasurer since July 2007.
Senior Accounting Manager – BNY Mellon Fund Administration, and an officer of 64 investment companies (comprised of 143 portfolios) managed by the Adviser. He is 52 years old and has been an employee of the Adviser since June 1989.
ROBERT SVAGNA, Assistant Treasurer since August 2005.
Senior Accounting Manager – BNY Mellon Fund Administration, and an officer of 64 investment companies (comprised of 143 portfolios) managed by the Adviser. He is 52 years old and has been an employee of the Adviser since November 1990.
JOSEPH W. CONNOLLY, Chief Compliance Officer since October 2004.
Chief Compliance Officer of the Adviser, the BNY Mellon Family of Funds and BNY Mellon Funds Trust (64 investment companies, comprised of 143 portfolios). He is 62 years old and has served in various capacities with the Adviser since 1980, including manager of the firm’s Fund Accounting Department from 1997 through October 2001.
CARIDAD M. CAROSELLA, Anti-Money Laundering Compliance Officer since January 2016.
Anti-Money Laundering Compliance Officer of the BNY Mellon Family of Funds and BNY Mellon Funds Trust since January 2016; from May 2015 to December 2015, Interim Anti-Money Laundering Compliance Officer of the BNY Mellon Family of Funds and BNY Mellon Funds Trust and the Distributor; from January 2012 to May 2015, AML Surveillance Officer of the Distributor. She is an officer of 57 investment companies (comprised of 136 portfolios) managed by the Adviser. She is 51 years old and has been an employee of the Distributor since 1997.
52
NOTES
53
BNY Mellon Floating Rate Income Fund
240 Greenwich Street
New York, NY 10286
Adviser
BNY Mellon Investment Adviser, Inc.
240 Greenwich Street
New York, NY 10286
Sub-Adviser
Alcentra NY, LLC
200 Park Avenue
New York, NY 10166
Custodian
The Bank of New York Mellon
240 Greenwich Street
New York, NY 10286
Transfer Agent &
Dividend Disbursing Agent
BNY Mellon Transfer, Inc.
240 Greenwich Street
New York, NY 10286
Distributor
BNY Mellon Securities Corporation
240 Greenwich Street
New York, NY 10286
| | |
Ticker Symbols: | Class A: DFLAX Class C: DFLCX Class I: DFLIX Class Y: DFLYX |
Telephone Call your financial representative or 1-800-373-9387
Mail The BNY Mellon Family of Funds, 144 Glenn Curtiss Boulevard, Uniondale, NY 11556-0144
E-mailSend your request toinfo@bnymellon.com
InternetInformation can be viewed online or downloaded atwww.bnymellonim.com/us
The fund files its complete schedule of portfolio holdings with the Securities and Exchange Commission (“SEC”) for the first and third quarters of each fiscal year on Form N-PORT. The fund’s Forms N-PORT are available on the SEC’s website atwww.sec.gov.
A description of the policies and procedures that the fund uses to determine how to vote proxies relating to portfolio securities and information regarding how the fund voted these proxies for the most recent 12-month period ended June 30 is available atwww.bnymellonim.com/us and on the SEC’s website atwww.sec.gov and without charge, upon request, by calling 1-800-373-9387.
| | |
© 2019 BNY Mellon Securities Corporation
6240AR0819 | 
|