UNITED STATES
SECURITIES AND EXCHANGE COMMISSION
Washington, D.C. 20549
FORM N-CSR
CERTIFIED SHAREHOLDER REPORT OF REGISTERED
MANAGEMENT INVESTMENT COMPANIES
Investment Company Act file Number _811-05276_
Value Line Strategic Asset Management Trust
(Exact name of registrant as specified in charter)
7 Times Square, New York, N.Y. 10036
(Address of principal executive offices) (Zip Code)
Registrant’s telephone number, including area code: 212-907-1900
Date of fiscal year end: December 31
Date of reporting period: June 30, 2014
Item I. Reports to Stockholders.
A copy of the Semi-Annual Report to Stockholders for the period ended 6/30/14
is included with this Form.
| | |
¢ Value Line Strategic Asset Management Trust (Unaudited) | Semiannual Report To Contractowners |
| | | | |
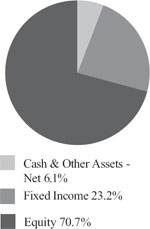
Stephen E. Grant, Portfolio Manager Liane Rosenberg, Director of Fixed Income Jeffrey D. Geffen, Portfolio Manager Objective: High total investment return consistent with reasonable risk Inception Date: October 1, 1987 Net Assets at June 30, 2014: $339,675,380 Portfolio Composition at June 30, 2014: (Percentage of Total Net Assets) | | | An Update from Fund Management (Unaudited) PRESIDENT’S LETTER Dear Shareholders: We are pleased to present you with this semi-annual report for Value Line Strategic Asset Management Trust (the “Trust”) for the six months ended June 30, 2014. The six months ended June 30, 2014 were rewarding ones for the Trust, as it generated solid absolute gains. Most notably, perhaps, the Trust outpaced its peers for the one-, three-, five- and ten-year periods ended June 30, 2014, as noted by leading independent mutual fund advisory service Lipper Inc.1 (mixed asset target allocation growth category). On the following pages, the Trust’s portfolio managers discuss the management of the Trust during the semi-annual period. The discussion highlights key factors influencing recent performance of the Trust. You will also find a schedule of investments and financial statements for the Trust. Before reviewing the performance of your mutual fund investment, we encourage you to take a brief look at the major factors affecting the financial markets over the six months ended June 30, 2014, especially given the newsworthy events of the semi-annual period. Economic Review U.S. real Gross Domestic Product (GDP) got off to a slow start in 2014, contracting at a 2.9% annualized rate from January through March. This was the biggest decline in the pace of U.S. economic growth since the first quarter of 2009. Part of the decline was due to the unusually harsh winter weather conditions throughout much of the nation. In turn, consumer spending grew at the weakest pace in five years, restrained further by a drop in health care outlays. Such low health care spending was largely unexpected, as the U.S. Bureau of Economic Analysis had earlier estimated that major provisions of President Obama’s signature health care law would result in increased medical spending by consumers. Second quarter GDP numbers are widely expected to show a significant increase over those of the first quarter, supported by what many anticipate to be some upside surprises in the labor and housing markets as well as in consumer confidence. Inflation remained modest through the semi-annual period though inching up to hover around the Federal Reserve’s (the Fed’s) target of 2.0%. The headline Consumer Price Index (CPI) rose 2.1% over the 12 months ended June 30, 2014 before seasonal adjustment. Core inflation, which excludes food and energy and which is the price measure tied to consumer spending watched most closely by the Fed, was up 1.9% in June 2014 from a year earlier. Limited wage growth was a key contributor to the relatively benign inflation scenario. The U.S. saw moderate but unspectacular job growth. While the unemployment rate declined from 6.7% at the close of 2013 to 6.1% at the end of June 2014, job creation was lackluster, with hiring generally concentrated in sectors representative of low-wage jobs. Still, the consumer looked more positively on the U.S. economy overall, with the Consumer Confidence Index rising from 78.1 in December 2013 to 85.2 in June 2014, its highest level since January 2008. Consumers indicated that they expect business conditions to improve, and their assessment of the job market also grew more favorable. Against this backdrop of disappointing economic growth but declining unemployment and still modest inflation, the Fed left the targeted federal funds rate unchanged throughout the semi-annual period. By the end of June 2014, the majority of Fed governors saw the first interest rate hike likely to occur in 2015. Despite expectations for improved economic activity in the second half of 2014, Fed Chair Janet Yellen reaffirmed the Fed’s commitment to maintaining accommodative monetary policy until a more robust recovery can be sustained. While there were pockets of economic strength and lower unemployment, these trends were not as strong as the Fed had hoped. Meanwhile, the Fed’s bond-buying program was tapered by $10 billion per month each month since January 2014, with the wind-down targeted for completion in October 2014. |
| | | | |
About information in this report:
| ● | It is important to consider the Trust’s investment objectives, risks, fees and expenses before investing. All funds involve some risk, including possible loss of the principal amount invested. |
| VALUE LINE STRATEGIC ASSET MANAGEMENT TRUST | 1 |
¢ Value Line Strategic Asset Management Trust (Unaudited) | Semiannual Report To Contractowners |
Equity Market Review
U.S. equities, as measured by the S&P 500® Index2, posted a solid gain of 7.13% during the six months ended June 30, 2014, despite the weak U.S. economic data early in the calendar year. Indeed, even with a weak January 2014, the S&P 500® Index experienced a sixth consecutive quarterly gain, a record not matched since 1998. The U.S. equity market’s climb to new highs through the end of June 2014, amidst low volatility and improved economic data in the second calendar quarter, was supported by many U.S. corporate earnings announcements reflecting top-line growth, even as overall management guidance for 2014 was less optimistic than consensus.
All ten sectors of the S&P 500® Index posted positive absolute performance for the semi-annual period, with the utilities, energy and health care sectors leading the way. Consumer discretionary, industrials, telecommunication services and financials were the weakest sectors during the semi-annual period.
Fixed Income Market Review
In contrast to a challenging 2013, the broad U.S. fixed income market, as measured by the Barclays U.S. Aggregate Bond Index3, posted a solid positive return of 3.93% during the semi-annual period. The yield curve flattened, as intermediate-term and longer-term yields declined and shorter-term maturities edged up. The yield on the bellwether 10-year U.S. Treasury note fell approximately 51 basis points during the semi-annual period, while the yield on the 30-year U.S. Treasury declined approximately 62 basis points. (A basis point is 1/100th of a percentage point.) The 30-year U.S. Treasury bond’s especially strong performance stemmed both from low inflation and from a flood of buyers looking for relative safety away from the comparatively slower economic growth seen in the European Union and the BRIC nations (Brazil, Russia, India and China).
Weak first quarter GDP, lackluster job growth and inflation hovering around the Fed’s target level of 2% kept interest rates low during the semi-annual period. A combination of low interest rates and low market volatility led many investors on a search for yield, benefiting the performance of spread, or non-U.S. Treasury, sectors, particularly in the middle and lower credit rating bands, and causing U.S. Treasuries to lag in comparison. Corporate bonds, both investment grade and high yield, and securitized debt most significantly outperformed U.S. Treasuries during the semi-annual period. Another factor supporting investors’ heightened risk tolerance was the progress made in several European countries toward better economic conditions.
* * *
We thank you for trusting us to be a part of your long-term, comprehensive investment strategy. We appreciate your confidence in the Value Line Funds and look forward to serving your investment needs in the years ahead just as we have been helping to secure generations’ financial futures for more than 60 years—based on solid fundamentals, sound investment principles and the power of disciplined and rigorous analytics. If you have any questions or would like additional information on other Value Line Funds, we invite you to visit us at www.vlfunds.com, newly redesigned to be even more informative, user-friendly and comprehensive.
Sincerely,
Mitchell Appel
President of the Value Line Funds
Past performance does not guarantee future results. Investment return and principal value of an investment can fluctuate so that an investor’s shares, when redeemed, may be worth more or less than their original cost; and that current performance may be lower or higher than the performance data quoted. Investors should carefully consider the investment objective, risks, charges and expense of a fund.
| 2 | VALUE LINE STRATEGIC ASSET MANAGEMENT TRUST |
¢ Value Line Strategic Asset Management Trust (Unaudited) | Semiannual Report To Contractowners |
| 1 | Lipper Rankings represent the funds’ ranking within its Lipper asset class peer group and are based on total return performance and do not reflect the effect of sales charges. Although a fund may outperform peers when compared to Lipper peer groups, the returns for that time period may still be negative. Rankings shown include management fees and are provided by Lipper Inc., a leading independent performance analysis service. This information is provided for educational purposes only and should not be considered investment advice. Lipper ratings are not intended to predict future results, and Lipper does not guarantee the accuracy of this information. Past performance is no guarantee of future results. |
| 2 | The S&P 500® Index consists of 500 stocks which are traded on the New York Stock Exchange, American Stock Exchange and the NASDAQ National Market System and is representative of the broad stock market. This is an unmanaged index and does not reflect charges, expenses or taxes, and it is not possible to directly invest in this index. |
| 3 | The Barclays U.S. Aggregate Bond Index is a broad-based benchmark that measures the investment grade, U.S. dollar-denominated, fixed-rate taxable bond market, including Treasuries, government-related and corporate securities, MBS (agency fixed-rate and hybrid ARM pass-throughs), ABS and CMBS. |
| VALUE LINE STRATEGIC ASSET MANAGEMENT TRUST | 3 |
¢ Value Line Strategic Asset Management Trust (Unaudited) | Semiannual Report To Contractowners |
INVESTMENT OBJECTIVE AND STRATEGY
The Trust’s investment objective is to achieve a high total investment return, consistent with reasonable risk.
To achieve the Trust’s objective, the Adviser invests in a broad range of common stocks, bonds and money market instruments in accordance with an asset allocation strategy based primarily on data derived from proprietary computer models for the stock and bond markets, which Value Line, Inc. developed. The Adviser attempts to achieve the Trust’s investment objective by following an asset allocation strategy that enables the Adviser to periodically shift the assets of the Trust among three types of securities: (a) common stocks, (b) debt securities with maturities of more than one year that are principally rated investment grade (i.e., within the four highest categories of a nationally recognized statistical rating organization) and (c) money market instruments (debt securities with maturities of less than one year). On occasion, the Trust may invest in BBB-rated debt securities, which may have certain speculative characteristics and in debt securities issued or guaranteed by the U.S. government, its agencies and instrumentalities, including mortgage-backed securities issued by government sponsored enterprises. While the Trust is actively managed by the Adviser, the Adviser relies primarily on the rankings of companies by the Value Line TimelinessTM Ranking System or the Value Line PerformanceTM Ranking System in selecting securities for purchase or sale.
Manager Discussion of Trust Performance
Below, Value Line Strategic Asset Management Trust portfolio managers Stephen E. Grant, Jeffrey D. Geffen and Liane Rosenberg discuss the Trust’s performance and positioning for the six months ended June 30, 2014.
How did the Trust perform during the semi-annual period?
The Trust generated a cumulative total return of 4.57% during the six months ended June 30, 2014. This compares to the 6.03% return of the Trust’s blended benchmark, comprised 60% of the S&P 500® Index and 40% of the Barclays U.S. Aggregate Bond Index (the “Barclays Index”), during the same semi-annual period.
What key factors were responsible for the Trust’s performance during the six-month reporting period?
The Trust posted solid absolute returns but lagged the blended benchmark due primarily to an average 8% of total net assets held in cash during the six-month period, which yielded little more than zero. Partially offsetting this detractor was effective asset allocation. Throughout the six-month reporting period, the Trust was underweighted in fixed income and overweighted in equities. With U.S. equities, as measured by the S&P 500® Index, up 7.13% during the semi-annual period, and bonds, as measured by the Barclays Index, posting a return of 3.93%, this asset allocation clearly added value.
Also, while the semi-annual period ended June 30, 2014 saw gains for the equity market, value stocks outperformed growth stocks, and large-cap stocks outperformed small-cap stocks. Relative to the S&P 500® Index, both of these factors acted as headwinds to results, as the equity portion of the Trust concentrates its holdings on growth-oriented stocks and on stocks with an average market capitalization well below that of the S&P 500® Index.
Which equity market sectors most significantly affected Trust performance?
The equity portion of the Trust lagged its equity benchmark, the S&P 500® Index, during the semi-annual period. Stock selection in information technology, materials, energy and industrials detracted from the equity portion of the Trust’s performance most during the semi-annual period. Having underweighted allocations to the strongly performing information technology and energy sectors and having an overweighted exposure to the weaker industrials sector also hurt.
In information technology, the equity portion of the Trust held an underweighted position in Apple and no positions in several other strongly performing large-cap stocks in the sector, including Microsoft, Intel and Facebook, each of which saw their shares climb double-digits during the semi-annual period. In materials, positions in FMC, a diversified research company in the chemical industry, and Scotts Miracle-Gro, a lawn and garden products and services company, disappointed most. In energy, an underweighted exposure to the oil services industry particularly hurt, as the equity portion of the Trust held no positions in either Schlumberger or Halliburton, both of which saw robust gains during the semi-annual period. In industrials, positions in railroad systems operator Kansas City Southern and electronic instruments manufacturer Ametek each dampened results, as each saw share price declines during the semi-annual period.
Partially offsetting these detractors were the positive contributions made by effective stock selection in the financials and telecommunication services sectors. Having an underweighted allocation to the weakly-performing financials sector also helped. In financials, not holding positions in laggards Citigroup and JPMorgan Chase buoyed relative performance. In telecommunication services, a position in wireless communications infrastructure owner and operator SBA Communications was a particularly strong performer.
| 4 | VALUE LINE STRATEGIC ASSET MANAGEMENT TRUST |
¢ Value Line Strategic Asset Management Trust (Unaudited) | Semiannual Report To Contractowners |
Which stocks detracted significantly from the Trust’s performance during the semi-annual period?
During the semi-annual period, among the stocks that detracted most from the equity portion of the Trust’s relative performance were TJX Companies, a discount apparel and home fashion retailer; LKQ, an automotive products and services wholesaler; and Wolverine World Wide, a branded footwear and performance leathers manufacturer. Each suffered during the semi-annual period from quarterly earnings reports that were weaker than forecast.
What were some of the Trust’s best-performing individual stocks?
Among the individual stocks that contributed most to the equity portion of the Trust’s relative results were life science equipment firm Idexx Laboratories, specialty pharmaceuticals firm Allergan and biopharmaceutical company Alexion Pharmaceuticals.
Shares of Idexx Laboratories rose on continued strong earnings results that drove a 600%-plus gain in its stock price since we established a Trust position in its shares in 2003. Allergan benefited from a takeover bid from Valeant Pharmaceuticals International. Alexion maintained the strong operating performance that has driven an approximately 1,000% gain in its stock since the Trust purchased its shares seven years ago.
Did the equity portion of the Trust make any significant purchases or sales?
During the semi-annual period, we initiated a position in the equity portion of the Trust in consumer products manufacturing giant Procter & Gamble in recognition of its consistent long-term growth record in earnings and stock price, generated by its powerful product portfolio.
We sold the equity portion of the Trust’s position in natural food supermarket owner and operator Whole Foods Market because its quarterly earnings reports began to disappoint. We also exited the equity portion of the Trust’s position in Internet exchange services provider Equinix because of reduced consistency and predictability in its earnings and stock price.
Were there any notable changes in the equity portion of the Trust’s weightings during the six-month period?
There were no material changes in the equity portion of the Trust’s sector weightings during the six-month period ended June 30, 2014.
How was the equity portion of the Trust positioned relative to its benchmark index at the end of June 2014?
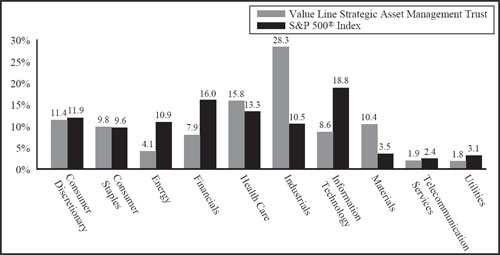
As of June 30, 2014, the Trust was overweighted relative to the S&P 500® Index in the industrials and materials sectors. The Trust was underweighted relative to the S&P 500® Index in the energy, financials and information technology sectors on the same date.
What was the duration strategy of the fixed income portion of the Trust?
We kept the fixed income portion of the Trust’s duration only modestly short relative to that of the Barclays Index—a difference of approximately 1/4 year. The reason for this relatively neutral stance was the market’s moderate volatility and the 10-year U.S. Treasury yield’s trading range of approximately +/- 25 basis points that was in play, especially during the second calendar quarter. (A basis point is 1/100th of a percentage point.) Duration is a measure of the Trust’s sensitivity to changes in interest rates.
While duration positioning had an overall neutral impact on results during the semi-annual period, yield curve positioning detracted. Longer duration assets were the best performers during the semi-annual period, and the fixed income portion of the Trust had an underweighted exposure to the long-term end of the yield curve. Yield curve indicates the spectrum of maturities within a particular sector.
Which fixed income market segments most significantly affected Trust performance?
Overall, the fixed income portion of the Trust performed in line with its benchmark, the Barclays Index. The biggest positive contributors to performance were investment grade and high yield corporate bonds. During the semi-annual period, higher risk assets outperformed lower risk assets, and the fixed income portion of the Trust was significantly overweight investment grade corporate bonds relative to the Barclays Index, while maintaining a significant underweight to U.S. Treasuries. Investment grade corporate bonds outperformed U.S. Treasuries by approximately 300 basis points during the semi-annual period. Within corporate credit, we also maintained an out-of-benchmark exposure to high yield corporate bonds. This high yield corporate bond exposure had a positive impact on relative results, as high yield corporate bonds outperformed the Barclays Index by approximately 150 basis points during the semi-annual period. As U.S. Treasuries, particularly those on the short-term end of the yield curve, were the weakest performers during the semi-annual period, the fixed income portion of the Trust’s underweight to these holdings proved prudent as well.
| VALUE LINE STRATEGIC ASSET MANAGEMENT TRUST | 5 |
¢ Value Line Strategic Asset Management Trust (Unaudited) | Semiannual Report To Contractowners |
Were there any notable changes in the fixed income portion of the Trust’s weightings during the six-month period?
The most significant sector shifts in the fixed income portion of the Trust encompassed a reduction in U.S. Treasuries with a similar incremental increase in corporate bonds, both investment grade and high yield. To a more modest degree, exposure to securitized assets edged up, with the increased exposure coming from commercial mortgage-backed securities. We also modestly increased the fixed income portion of the Trust’s exposures to sovereign debt and taxable municipal bonds during the six-month period.
How was the fixed income portion of the Trust positioned relative to its benchmark index at the end of June 2014?
As of June 30, 2014, the fixed income portion of the Trust was overweight relative to the Barclays Index in investment grade corporate bonds and in securitized debt. It also maintained its out-of-benchmark exposure to high yield corporate bonds. The fixed income portion of the Trust was underweight relative to the Barclays Index in U.S. Treasuries and supranational agency debt and was rather neutrally weighted to the benchmark index in asset-backed securities, sovereign debt and taxable municipal bonds on the same date.
How did the Trust’s overall asset allocation shift from beginning to end of the reporting period?
In allocating assets, we are guided by Value Line’s proprietary asset allocation model. At December 31, 2013, the Trust had weightings of approximately 70% in stocks, 22% in fixed income securities and 8% in cash equivalents. By the end of June 2014, allocation had changed little, with Value Line’s proprietary asset allocation model remaining positive on stocks. At June 30, 2014, the Trust had weightings of approximately 70.5% in stocks, 23.5% in fixed income securities and 6% in cash equivalents.
How did the Trust use derivatives and similar instruments during the reporting period?
The Trust did not use derivatives during the reporting period.
What is your tactical view and strategy for the months ahead?
Regardless of market conditions, in the equity portion of the Trust, we intend to stay true to our time-tested investment discipline going forward, seeking to invest in companies that have demonstrated a solid history of consistent growth in both their earnings and stock price. In our view, these companies possess attractive portfolios of proprietary products and services that give them strong market positions and make them less vulnerable to swings in national and international economic conditions. At the same time, we believe the underlying stocks of these companies tend to be less volatile than the average stock in the S&P 500® Index. By maintaining our investment discipline, the Trust has historically provided a smoother ride to investors than its peer group averages. Putting aside short-term ebbs and flows in the equity market, we believe the equity portion of the Trust’s investments are likely to continue to provide superior returns to our shareholders over the long term.
As for the fixed income market, how far the U.S. economy rebounds from its weak first calendar quarter may well be a key determinant for the asset class’ performance going forward. Any shift in Federal Reserve (Fed) policy, either more or less accommodative, or in its timing for an increase in interest rates is almost sure to affect the fixed income market. Key economic variables likely to affect Fed policy include not only broad economic growth but also job creation, unemployment rates and inflation pressures. Given this view, at the end of the semi-annual period, we continued to favor corporate bonds over U.S. Treasuries within the fixed income portion of the Trust. We especially liked corporate bonds rated BBB, or mid-grade credits, for their incremental yield. That said, given how tight spreads, or yield differentials, were at the end of the semi-annual period and given the fixed income portion of the Trust’s overweighted allocation, we would not be inclined to increase exposure to corporate bonds but intend to maintain exposure near levels held at the end of June 2014.
If stock prices and/or interest rates increase, we could become more neutral toward stocks in our asset allocation. If stock prices or interest rates fall, we could become more bullish on stocks and look to reduce exposure to high yield corporate bonds.
As always, we intend to stay true to our time-tested investment discipline going forward.
| 6 | VALUE LINE STRATEGIC ASSET MANAGEMENT TRUST |
¢ Value Line Strategic Asset Management Trust (Unaudited) | Semiannual Report To Contractowners |
Top Ten Holdings (As of 6/30/2014)
| | Percentage of |
| Company | Total Net Assets |
| SBA Communications Corp. Class A | 1.33% |
| EQT Corp. | 1.32% |
| Sigma-Aldrich Corp. | 1.27% |
| AMETEK, Inc. | 1.26% |
| Alliance Data Systems Corp. | 1.24% |
| O’Reilly Automotive, Inc. | 1.20% |
| Stericycle, Inc. | 1.19% |
| Canadian National Railway Co. | 1.15% |
| Thermo Fisher Scientific, Inc. | 1.11% |
| Henry Schein, Inc. | 1.11% |
Equity Sector Weightings vs. Index (As of 6/30/2014)
| VALUE LINE STRATEGIC ASSET MANAGEMENT TRUST | 7 |
¢ Value Line Strategic Asset Management Trust (Unaudited) | Semiannual Report To Contractowners |
Average Annual Total Returns (For periods ended 6/30/2014)
| | | | | | | |
| | Year | | | | | |
| | to | | | | | |
| | Date | 1 | 3 | 5 | 10 | Since Inception |
| | (not annualized) | Yr | Yrs | Yrs | Yrs | 10/01/1987 |
| Value Line Strategic Asset Management Trust | 4.57% | 17.25% | 12.12% | 14.80% | 8.00% | 10.01% |
60/40 S&P 500® Index/Barclays Capital Aggregate Bond Index | 6.03% | 16.23% | 11.88% | 13.26% | 4.67% | 8.43% |
All performance data quoted is historical and the results represent past performance and neither guarantee nor predict future investment results. To obtain performance data current to the most recent month (available within 7 business days of the most recent month end), please call (800) 221-3253 or visit www.guardianinvestor.com. Current performance may be higher or lower than the performance quoted here. Investment return and principal value will fluctuate so that an investor’s shares, when redeemed, may be worth more or less than the original cost.
Total return figures are historical and assume the reinvestment of dividends and distributions and the deduction of all Trust expenses. The actual total returns for owners of variable annuity contracts or variable life insurance policies that provide for investment in the Trust will be lower to reflect separate account and contract/policy charges. The return figures shown do not reflect the deduction of taxes that a contract owner may pay on distributions or redemption of units.
| 8 | VALUE LINE STRATEGIC ASSET MANAGEMENT TRUST |
¢ Value Line Strategic Asset Management Trust (Unaudited) | Semiannual Report To Contractowners |
Trust Expenses
By investing in the Trust, you incur two types of costs: (1) transaction costs, including, as applicable, sales charges on purchase payments, reinvested dividends, or other distributions; redemption fees and exchange fees; and (2) ongoing costs, including, as applicable, management fees; distribution and/or service (12b-1) fees; and other Trust expenses. This example is intended to help you understand your ongoing costs (in dollars) of investing in the Trust and to compare these costs with the ongoing costs of investing in other mutual funds.
The example below is based on an investment of $1,000 invested on January 1, 2014 and held for six months ended June 30, 2014.
Actual Expenses
The first line of the table below provides information about actual account values and actual expenses. You may use the information in this line, together with the amount you invested, to estimate the expenses that you paid over the period. Simply divide your account value by $1,000 (for example an $8,600 account value divided by $1,000 = 8.6), then multiply the result by the number in the first line under the heading “Expenses Paid During Period” to estimate the expenses you paid on your account during this period.
Hypothetical Example for Comparison Purposes
The second line of the table below provides information about hypothetical account values and hypothetical expenses based on the Trust’s actual expense ratio and an assumed rate of return of 5% per year before expenses, which is not the Trust’s actual return. The hypothetical account values and expenses may not be used to estimate the actual ending account balance or expenses you paid for the period. You may use this information to compare the ongoing costs of investing in the Trust and other funds. To do so, compare this 5% hypothetical example with the 5% hypothetical examples that appear in the shareholder reports of other funds.
Please note that the expenses shown in the table are meant to highlight your ongoing costs only and do not reflect any transactional costs, such as sales charges (loads), redemption fees, or exchange fees. Therefore, the table is useful in comparing ongoing costs only, and will not help you determine the relative total costs of owning different funds. In addition, if transactional costs were included, your costs would have been higher.
| | | | | |
| | Beginning | Ending | Expenses | |
| | Account Value | Account Value | Paid During | Annualized |
| | January 1, 2014 | June 30, 2014 | Period* | Expense Ratio |
| Actual | $1,000 | $1,045.75 | $4.42 | 0.87% |
| Hypothetical (5% return before expenses) | $1,000 | $1,020.47 | $4.37 | 0.87% |
| * | Expenses are equal to the Trust’s annualized expense ratio multiplied by the average account value over the period, multiplied by 181/365 (to reflect the Trust’s most recent fiscal half-year). This expense ratio may differ from the expense ratio shown in the financial highlights. |
| VALUE LINE STRATEGIC ASSET MANAGEMENT TRUST | 9 |
| ¢ | Value Line Strategic Asset Management Trust |
| | Schedule of Investments | | | |
June 30, 2014 (Unaudited) | | | |
| Shares | | | Value |
| | | | | | | |
| | Common Stocks — 70.7% | | | |
| Consumer Discretionary — 8.0% | | | |
| | 6,400 | | AutoZone, Inc. * | | $ | 3,431,936 |
| | 48,000 | | BorgWarner, Inc. | | | 3,129,120 |
| | 36,000 | | Brinker International, Inc. | | | 1,751,400 |
| | 20,000 | | Buckle, Inc. (The) (1) | | | 887,200 |
| | 22,000 | | Domino’s Pizza, Inc. | | | 1,607,980 |
| | 6,000 | | Genuine Parts Co. | | | 526,800 |
| | 89,000 | | LKQ Corp. * | | | 2,375,410 |
| | 27,000 | | O’Reilly Automotive, Inc. * | | | 4,066,200 |
| | 16,000 | | Starbucks Corp. | | | 1,238,080 |
| | 65,000 | | TJX Companies, Inc. (The) | | | 3,454,750 |
| | 56,000 | | Wolverine World Wide, Inc. | | | 1,459,360 |
| | 42,000 | | Yum! Brands, Inc. | | | 3,410,400 |
| | | | | | | 27,338,636 |
| Consumer Staples — 6.9% | | | |
| | 16,900 | | British American Tobacco PLC ADR | | 2,012,452 |
| | 9,000 | | Bunge Ltd. | | | 680,760 |
| | 50,000 | | Church & Dwight Co., Inc. | | | 3,497,500 |
| | 10,000 | | Costco Wholesale Corp. | | | 1,151,600 |
| | 17,000 | | Energizer Holdings, Inc. | | | 2,074,510 |
| | 126,000 | | Flowers Foods, Inc. | | | 2,656,080 |
| | 38,000 | | General Mills, Inc. | | | 1,996,520 |
| | 56,000 | | Hormel Foods Corp. | | | 2,763,600 |
| | 30,000 | | PepsiCo, Inc. | | | 2,680,200 |
| | 24,000 | | Procter & Gamble Co. (The) | | | 1,886,160 |
| | 35,000 | | Reynolds American, Inc. | | | 2,112,250 |
| | | | | | | 23,511,632 |
| Energy — 2.9% | | | |
| | 42,000 | | EQT Corp. | | | 4,489,800 |
| | 34,000 | | FMC Technologies, Inc. * | | | 2,076,380 |
| | 42,000 | | Noble Energy, Inc. | | | 3,253,320 |
| | | | | | | 9,819,500 |
| Financials — 5.6% | | | |
| | 11,200 | | Affiliated Managers Group, Inc. * | | | 2,300,480 |
| | 37,000 | | AFLAC, Inc. | | | 2,303,250 |
| | 36,000 | | American Tower Corp. REIT | | | 3,239,280 |
| | 12,000 | | Arch Capital Group Ltd. * | | | 689,280 |
| | 3,400 | | Bank of Montreal | | | 250,206 |
| | 3,200 | | BlackRock, Inc. | | | 1,022,720 |
| | 9,000 | | M&T Bank Corp. | | | 1,116,450 |
| | 20,000 | | ProAssurance Corp. | | | 888,000 |
| | 28,800 | | Royal Bank of Canada | | | 2,057,184 |
| | 3,800 | | Stifel Financial Corp. * | | | 179,930 |
| | 16,000 | | T. Rowe Price Group, Inc. | | | 1,350,560 |
| | 22,568 | | Toronto-Dominion Bank (The) | | | 1,160,221 |
| | 46,000 | | Wells Fargo & Co. | | | 2,417,760 |
| | | | | | | 18,975,321 |
| Health Care — 11.2% | | | |
| | 20,200 | | Alexion Pharmaceuticals, Inc. * | | | 3,156,250 |
| | 17,400 | | Allergan, Inc. | | | 2,944,428 |
| | 15,000 | | C.R. Bard, Inc. | | | 2,145,150 |
| | 32,000 | | Catamaran Corp. * | | | 1,413,120 |
| | 54,200 | | Cerner Corp. * | | | 2,795,636 |
| | 50,000 | | DENTSPLY International, Inc. | | | 2,367,500 |
| | 42,000 | | Express Scripts Holding Co. * | | | 2,911,860 |
| | 31,800 | | Henry Schein, Inc. * | | | 3,773,706 |
| | 27,800 | | IDEXX Laboratories, Inc. * | | | 3,713,246 |
| | 15,000 | | McKesson Corp. | | | 2,793,150 |
| | 8,000 | | Mednax, Inc. * | | | 465,200 |
| Shares | | | | | Value |
| Health Care — 11.2% (Continued) | | | |
| | 13,200 | | Mettler-Toledo International, Inc. * | | $ | 3,341,976 |
| | 50,000 | | Novo Nordisk A/S ADR | | | 2,309,500 |
| | 32,000 | | Thermo Fisher Scientific, Inc. | | | 3,776,000 |
| | | | | | | 37,906,722 |
| Industrials — 20.0% | | | |
| | 13,000 | | Acuity Brands, Inc. | | | 1,797,250 |
| | 81,575 | | AMETEK, Inc. | | | 4,264,741 |
| | 60,000 | | Canadian National Railway Co. | | | 3,901,200 |
| | 34,000 | | CLARCOR, Inc. | | | 2,102,900 |
| | 13,000 | | Clean Harbors, Inc. * | | | 835,250 |
| | 43,200 | | Danaher Corp. | | | 3,401,136 |
| | 46,000 | | Donaldson Co., Inc. | | | 1,946,720 |
| | 8,000 | | EnerSys | | | 550,320 |
| | 12,400 | | Esterline Technologies Corp. * | | | 1,427,488 |
| | 22,000 | | General Dynamics Corp. | | | 2,564,100 |
| | 42,000 | | IDEX Corp. | | | 3,391,080 |
| | 14,600 | | IHS, Inc. Class A * | | | 1,980,782 |
| | 28,500 | | ITT Corp. | | | 1,370,850 |
| | 12,600 | | J.B. Hunt Transport Services, Inc. | | | 929,628 |
| | 22,000 | | Kansas City Southern | | | 2,365,220 |
| | 24,200 | | Kirby Corp. * | | | 2,834,788 |
| | 22,000 | | Parker Hannifin Corp. | | | 2,766,060 |
| | 10,600 | | Precision Castparts Corp. | | | 2,675,440 |
| | 41,500 | | Republic Services, Inc. | | | 1,575,755 |
| | 24,000 | | Roper Industries, Inc. | | | 3,504,240 |
| | 34,000 | | Stericycle, Inc. * | | | 4,026,280 |
| | 8,000 | | Teledyne Technologies, Inc. * | | | 777,360 |
| | 34,000 | | Toro Co. (The) | | | 2,162,400 |
| | 26,000 | | Union Pacific Corp. | | | 2,593,500 |
| | 28,000 | | United Technologies Corp. | | | 3,232,600 |
| | 12,600 | | Valmont Industries, Inc. (1) | | | 1,914,570 |
| | 13,000 | | W.W. Grainger, Inc. | | | 3,305,510 |
| | 76,500 | | Waste Connections, Inc. | | | 3,714,075 |
| | | | | | | 67,911,243 |
| Information Technology — 6.1% | | | |
| | 23,000 | | Accenture PLC Class A | | | 1,859,320 |
| | 15,000 | | Alliance Data Systems Corp. * | | | 4,218,750 |
| | 30,600 | | Amphenol Corp. Class A | | | 2,948,004 |
| | 2,800 | | Anixter International, Inc. | | | 280,196 |
| | 19,000 | | ANSYS, Inc. * | | | 1,440,580 |
| | 28,000 | | Apple, Inc. | | | 2,602,040 |
| | 48,000 | | Cognizant Technology Solutions Corp. | | | |
| | | | Class A * | | | 2,347,680 |
| | 20,000 | | MasterCard, Inc. Class A | | | 1,469,400 |
| | 53,600 | | Salesforce.com, Inc. * | | | 3,113,088 |
| | 4,900 | | WEX, Inc. * | | | 514,353 |
| | | | | | | 20,793,411 |
| Materials — 7.4% | | | |
| | 12,000 | | Airgas, Inc. | | | 1,306,920 |
| | 25,000 | | AptarGroup, Inc. | | | 1,675,250 |
| | 14,000 | | Ball Corp. | | | 877,520 |
| | 27,000 | | Crown Holdings, Inc. * | | | 1,343,520 |
| | 33,400 | | Ecolab, Inc. | | | 3,718,756 |
| | 44,000 | | FMC Corp. | | | 3,132,360 |
| | 5,400 | | NewMarket Corp. | | | 2,117,394 |
| | 24,000 | | Praxair, Inc. | | | 3,188,160 |
| | 19,000 | | Scotts Miracle-Gro Co. (The) Class A | | | 1,080,340 |
| | 42,400 | | Sigma-Aldrich Corp. | | | 4,302,752 |
| | 31,000 | | Valspar Corp. (The) | | | 2,361,890 |
| | | | | | | 25,104,862 |
| 10 | See Notes to Financial Statements. |
| Value Line Strategic Asset Management Trust |
| | Schedule of Investments (Continued) | | | |
| | | | |
| June 30, 2014 (Unaudited) | | | |
| Shares | | | | | Value |
| | | | | | | |
| Common Stocks — 70.7% (Continued) | |
| Telecommunication Services — 1.3% | | | |
| | 44,000 | | SBA Communications Corp. Class A * | | $ | 4,501,200 |
| Utilities — 1.3% | | | |
| | 46,800 | | ITC Holdings Corp. | | | 1,707,264 |
| | 21,000 | | South Jersey Industries, Inc. | | | 1,268,610 |
| | 31,000 | | Wisconsin Energy Corp. | | | 1,454,520 |
| | | | | | | 4,430,394 |
| | | | Total Common Stocks | | | |
| | | | (Cost $93,878,652) | | | 240,292,921 |
| | | | | | |
| | | | | Value |
| | Asset-Backed Securities — 0.2% | | | |
| $ | 243,707 | | Ford Credit Auto Lease Trust, Series | | | |
| | | | 2013-B, Class A2B, 0.42%, 1/15/16 (2) | 243,791 |
| | 250,000 | | Honda Auto Receivables Owner Trust, | | | |
| | | | Series 2013-4, Class A3, 0.69%, 9/18/17 | 250,453 |
| | | | Total Asset-Backed Securities | | | |
| | | | (Cost $494,185) | | | 494,244 |
| | | | | | | |
| | Commercial Mortgage-Backed Securities — 1.4% | | | |
| | 300,000 | | Banc of America Commercial Mortgage | |
| | | | Trust, Series 2006-2, Class A4, 5.92%, | |
| | | | 5/10/45 (2) | | | 321,500 |
| | 206,384 | | Bear Stearns Commercial Mortgage | | | |
| | | | Securities Trust, Series 2007-T26, | | | |
| | | | Class A4, 5.47%, 1/12/45 (2) | | | 227,299 |
| | 250,000 | | Citigroup Commercial Mortgage Trust, | |
| | | | Series 2006-C5, Class A4, 5.43%, | | | |
| | | | 10/15/49 | | | 271,169 |
| | 450,000 | | Commercial Mortgage Trust, Series | | | |
| | | | 2007-GG9, Class A4, 5.44%, 3/10/39 | 491,025 |
| | 250,000 | | FHLMC Multifamily Structured | | | |
| | | | Pass-Through Certificates, Series K710, | |
| | | | Class A2, 1.88%, 5/25/19 | | | 250,236 |
| | 200,000 | | FREMF Mortgage Trust, Series 2012-K711, | |
| | | | Class B, 3.68%, 8/25/45 (2) (3) | | | 207,373 |
| | 250,000 | | FREMF Mortgage Trust, Series 2014-K715, | |
| | | | Class B, 4.12%, 2/25/46 (2) (3) | | | 261,659 |
| | 400,000 | | GNMA, Series 2013-12, Class B, 2.45%, | |
| | | | 11/16/52 (2) | | | 378,588 |
| | 350,000 | | GS Mortgage Securities Trust, Series | | | |
| | | | 2006-GG6, Class A4, 5.55%, 4/10/38 (2) | 369,785 |
| | 191,561 | | JP Morgan Chase Commercial Mortgage | |
| | | | Securities Trust, Series 2007-CB20, | | | |
| | | | Class A1A, 5.75%, 2/12/51 (2) | | | 213,905 |
| | 273,075 | | ML-CFC Commercial Mortgage Trust, | |
| | | | Series 2006-4, Class A1A, 5.17%, | | | |
| | | | 12/12/49 | | | 294,877 |
| | 250,000 | | ML-CFC Commercial Mortgage Trust, | |
| | | | Series 2006-4, Class A3, 5.17%, 12/12/49 | 269,033 |
| | 250,000 | | ML-CFC Commercial Mortgage Trust, | |
| | | | Series 2007-6, Class A4, 5.49%, | | | |
| | | | 3/12/51 (2) | | | 274,590 |
| | 250,000 | | Morgan Stanley Bank of America Merrill | |
| | | | Lynch Trust, Series 2012-C5, Class A4, | |
| | | | 3.18%, 8/15/45 | | | 252,597 |
| | | | | | |
| | | | | Value |
| | Commercial Mortgage-Backed | | | |
| | Securities — 1.4% (Continued) | | | |
| $ | 200,000 | | Morgan Stanley Bank of America Merrill | | | |
| | | | Lynch Trust, Series 2012-C6, Class A4, | | | |
| | | | 2.86%, 11/15/45 | | $ | 196,699 |
| | 246,355 | | Thornburg Mortgage Securities Trust, Series | | | |
| | | | 2005-1, Class A3, 2.24%, 4/25/45 (2) | | | 249,991 |
| | 250,000 | | Wells Fargo Commercial Mortgage Trust, | | | |
| | | | Series 2013-LC12, Class B, 4.44%, | | | |
| | | | 7/15/46 (2) | | | 261,418 |
| | | | Total Commercial Mortgage-Backed | | | |
| | | | Securities (Cost $4,872,929) | | | 4,791,744 |
| | | | |
| | Corporate Bonds & Notes — 9.9% | | | |
| Basic Materials — 0.6% | | | |
| | 200,000 | | ArcelorMittal, Senior Unsecured Notes, | | | |
| | | | 5.00%, 2/25/17 | | | 211,500 |
| | 250,000 | | Celanese U.S. Holdings LLC, Guaranteed | | | |
| | | | Notes, 4.63%, 11/15/22 | | | 251,250 |
| | 150,000 | | Glencore Funding LLC, Guaranteed Notes, | | | |
| | | | 4.13%, 5/30/23 (3) | | | 150,651 |
| | 250,000 | | LYB International Finance B.V., Guaranteed | | | |
| | | | Notes, 4.00%, 7/15/23 | | | 262,454 |
| | 300,000 | | Mosaic Co. (The), Senior Unsecured Notes, | | | |
| | | | 5.45%, 11/15/33 | | | 336,161 |
| | 150,000 | | Southern Copper Corp., Senior Unsecured | | | |
| | | | Notes, 7.50%, 7/27/35 | | | 174,619 |
| | 150,000 | | Steel Dynamics, Inc., Guaranteed Notes, | | | |
| | | | 6.13%, 8/15/19 | | | 163,125 |
| | 250,000 | | Vale Overseas Ltd., Guaranteed Notes, | | | |
| | | | 5.63%, 9/15/19 | | | 281,176 |
| | 100,000 | | Vale S.A., Senior Unsecured Notes, 5.63%, | | | |
| | | | 9/11/42 | | | 97,970 |
| | | | | | | 1,928,906 |
| Communications — 1.2% | | | |
| | 250,000 | | America Movil S.A.B. de C.V., Senior | | | |
| | | | Unsecured Notes, 3.13%, 7/16/22 | | | 246,000 |
| | 100,000 | | CenturyLink, Inc., Series P, Senior | | | |
| | | | Unsecured Notes, 7.60%, 9/15/39 | | | 100,375 |
| | 250,000 | | Comcast Corp., Guaranteed Notes, 4.25%, | | | |
| | | | 1/15/33 | | | 256,809 |
| | 250,000 | | DIRECTV Holdings LLC/DIRECTV | | | |
| | | | Financing Co., Inc., Guaranteed Notes, | | | |
| | | | 3.80%, 3/15/22 | | | 258,154 |
| | 350,000 | | MetroPCS Wireless, Inc., Guaranteed Notes, | | | |
| | | | 6.63%, 11/15/20 | | | 373,625 |
| | 200,000 | | Motorola Solutions, Inc., Senior Unsecured | | | |
| | | | Notes, 6.00%, 11/15/17 | | | 227,092 |
| | 250,000 | | Netflix, Inc., Senior Unsecured Notes, | | | |
| | | | 5.75%, 3/1/24 (3) | | | 261,250 |
| | 200,000 | | Rogers Communications, Inc., Guaranteed | | | |
| | | | Notes, 5.00%, 3/15/44 | | | 208,562 |
| | 250,000 | | Telefonica Emisiones SAU, Guaranteed | | | |
| | | | Notes, 5.88%, 7/15/19 | | | 289,847 |
| | 250,000 | | Time Warner, Inc., Guaranteed Notes, | | | |
| | | | 3.15%, 7/15/15 | | | 256,895 |
| | 500,000 | | Time Warner, Inc., Guaranteed Notes, | | | |
| | | | 4.70%, 1/15/21 | | | 553,649 |
| | 250,000 | | Verizon Communications, Inc., Senior | | | |
| | | | Unsecured Notes, 1.25%, 11/3/14 | | | 250,758 |
| See Notes to Financial Statements. | 11 |
| Value Line Strategic Asset Management Trust |
| | Schedule of Investments (Continued) | | | |
| | | | | | | |
| June 30, 2014 (Unaudited) | | | |
| | | | | Value |
| | | | | | | |
| | Corporate Bonds & Notes — 9.9% (Continued) | | | |
| Communications — 1.2% (Continued) | | | |
| $ | 300,000 | | Verizon Communications, Inc., Senior | | | |
| | | | Unsecured Notes, 2.50%, 9/15/16 | | $ | 309,223 |
| | 500,000 | | Viacom, Inc., Senior Unsecured Notes, | | | |
| | | | 3.88%, 12/15/21 | | | 523,695 |
| | | | | | | 4,115,934 |
| Consumer, Cyclical — 0.6% | | | |
| | 250,000 | | CVS Caremark Corp., Senior Unsecured | | | |
| | | | Notes, 6.60%, 3/15/19 | | | 294,353 |
| | 250,000 | | D.R. Horton, Inc., Guaranteed Notes, | | | |
| | | | 6.50%, 4/15/16 | | | 270,625 |
| | 250,000 | | Delphi Corp., Guaranteed Notes, 6.13%, | | | |
| | | | 5/15/21 | | | 279,400 |
| | 100,000 | | Kia Motors Corp., Senior Unsecured | | | |
| | | | Notes, 3.63%, 6/14/16 (3) | | | 104,710 |
| | 150,000 | | Lennar Corp., Series B, Guaranteed | | | |
| | | | Notes, 5.60%, 5/31/15 | | | 155,250 |
| | 270,000 | | Macy’s Retail Holdings, Inc., Guaranteed | | | |
| | | | Notes, 4.38%, 9/1/23 (1) | | | 286,125 |
| | 150,000 | | Nissan Motor Acceptance Corp., Senior | | | |
| | | | Unsecured Notes, 2.35%, 3/4/19 (3) | | | 151,061 |
| | 200,000 | | Starwood Hotels & Resorts Worldwide, | | | |
| | | | Inc., Senior Unsecured Notes, 7.38%, | | | |
| | | | 11/15/15 | | | 217,686 |
| | 250,000 | | Wynn Las Vegas LLC/Wynn Las Vegas | | | |
| | | | Capital Corp., Senior Unsecured Notes, | | | |
| | | | 5.38%, 3/15/22 | | | 260,312 |
| | | | | | | 2,019,522 |
| Consumer, Non-cyclical — 1.3% | | | |
| | 500,000 | | AbbVie, Inc., Senior Unsecured Notes, | | | |
| | | | 2.00%, 11/6/18 | | | 499,381 |
| | 150,000 | | ADT Corp. (The), Senior Unsecured | | | |
| | | | Notes, 2.25%, 7/15/17 | | | 148,125 |
| | 200,000 | | Amgen, Inc., Senior Unsecured Notes, | | | |
| | | | 2.50%, 11/15/16 | | | 207,152 |
| | 250,000 | | Anheuser-Busch InBev Finance, Inc., | | | |
| | | | Guaranteed Notes, 4.63%, 2/1/44 | | | 260,105 |
| | 150,000 | | Boston Scientific Corp., Senior Unsecured | | | |
| | | | Notes, 2.65%, 10/1/18 | | | 153,335 |
| | 250,000 | | Celgene Corp., Senior Unsecured Notes, | | | |
| | | | 2.30%, 8/15/18 | | | 254,045 |
| | 250,000 | | Constellation Brands, Inc., Guaranteed | | | |
| | | | Notes, 7.25%, 5/15/17 | | | 286,563 |
| | 150,000 | | Edwards Lifesciences Corp., Senior | | | |
| | | | Unsecured Notes, 2.88%, 10/15/18 | | | 153,285 |
| | 300,000 | | HCA, Inc., Senior Secured Notes, 6.50%, | | | |
| | | | 2/15/20 | | | 337,500 |
| | 260,000 | | Humana, Inc., Senior Unsecured Notes, | | | |
| | | | 3.15%, 12/1/22 | | | 255,162 |
| | 500,000 | | Kroger Co. (The), Senior Unsecured | | | |
| | | | Notes, 3.40%, 4/15/22 | | | 506,777 |
| 1,000,000 | | Medco Health Solutions, Inc., Senior | | | |
| | | | Unsecured Notes, 2.75%, 9/15/15 | | | 1,023,910 |
| | 350,000 | | Mylan, Inc., Senior Unsecured Notes, | | | |
| | | | 1.35%, 11/29/16 | | | 350,583 |
| | | | | | | 4,435,923 |
| | | | | Value |
| Energy — 1.1% | | | |
| $ | 150,000 | | Anadarko Petroleum Corp., Senior | | | |
| | | | Unsecured Notes, 6.38%, 9/15/17 | | $ | 172,701 |
| | 250,000 | | DCP Midstream Operating L.P., | | | |
| | | | Guaranteed Notes, 2.50%, 12/1/17 | | | 257,173 |
| | 250,000 | | Devon Energy Corp., Senior Unsecured | | | |
| | | | Notes, 1.20%, 12/15/16 | | | 250,758 |
| | 150,000 | | Energy Transfer Partners L.P., Senior | | | |
| | | | Unsecured Notes, 9.00%, 4/15/19 | | | 191,688 |
| | 200,000 | | Ensco PLC, Senior Unsecured Notes, | | | |
| | | | 4.70%, 3/15/21 | | | 217,878 |
| | 250,000 | | Enterprise Products Operating LLC, | | | |
| | | | Guaranteed Notes, 5.70%, 2/15/42 | | | 291,451 |
| | 300,000 | | Halliburton Co., Senior Unsecured Notes, | | | |
| | | | 6.15%, 9/15/19 | | | 357,948 |
| | 100,000 | | Hess Corp., Senior Unsecured Notes, | | | |
| | | | 5.60%, 2/15/41 | | | 116,279 |
| | 250,000 | | Kinder Morgan Energy Partners L.P., | | | |
| | | | Senior Unsecured Notes, 2.65%, 2/1/19 | | | 253,023 |
| | 100,000 | | Petrobras Global Finance B.V., Guaranteed | | | |
| | | | Notes, 3.11%, 3/17/20 (1) (2) | | | 102,745 |
| | 200,000 | | Petrobras Global Finance B.V., Guaranteed | | | |
| | | | Notes, 6.25%, 3/17/24 | | | 212,880 |
| | 245,000 | | Phillips 66, Guaranteed Notes, 2.95%, | | | |
| | | | 5/1/17 | | | 256,768 |
| | 97,000 | | Plains Exploration & Production Co., | | | |
| | | | Guaranteed Notes, 6.88%, 2/15/23 | | | 113,490 |
| | 150,000 | | Rowan Companies, Inc., Guaranteed | | | |
| | | | Notes, 7.88%, 8/1/19 | | | 183,190 |
| | 250,000 | | Spectra Energy Partners L.P., Senior | | | |
| | | | Unsecured Notes, 4.75%, 3/15/24 | | | 270,853 |
| | 200,000 | | Tesoro Corp., Guaranteed Notes, 4.25%, | | | |
| | | | 10/1/17 | | | 209,000 |
| | 150,000 | | Valero Energy Corp., Guaranteed Notes, | | | |
| | | | 6.63%, 6/15/37 | | | 186,380 |
| | 150,000 | | Whiting Petroleum Corp., Guaranteed | | | |
| | | | Notes, 5.00%, 3/15/19 | | | 157,875 |
| | | | | | | 3,802,080 |
| Financial — 4.3% | | | |
| | 200,000 | | Aircastle Ltd., Senior Unsecured Notes, | | | |
| | | | 4.63%, 12/15/18 | | | 206,000 |
| | 200,000 | | Ally Financial, Inc., Guaranteed Notes, | | | |
| | | | 4.63%, 6/26/15 | | | 206,500 |
| | 250,000 | | American Express Co., Senior Unsecured | | | |
| | | | Notes, 0.82%, 5/22/18 (2) | | | 251,868 |
| | 250,000 | | American International Group, Inc., | | | |
| | | | Senior Unsecured Notes, 3.38%, 8/15/20 | | | 259,784 |
| | 200,000 | | Australia & New Zealand Banking | | | |
| | | | Group Ltd., Subordinated Notes, 4.50%, | | | |
| | | | 3/19/24 (3) | | | 205,279 |
| | 150,000 | | Bancolombia S.A., Senior Unsecured | | | |
| | | | Notes, 5.95%, 6/3/21 | | | 165,375 |
| | 200,000 | | Bank of America Corp., Senior Unsecured | | | |
| | | | Notes, 4.00%, 4/1/24 | | | 204,106 |
| | 300,000 | | Bank of America Corp. MTN, Series L, | | | |
| | | | Senior Unsecured Notes, 5.65%, 5/1/18 | | | 340,061 |
| | 200,000 | | Bank of China Hong Kong Ltd., Senior | | | |
| | | | Unsecured Notes, 3.75%, 11/8/16 (3) | | | 209,615 |
| | 150,000 | | Bank of New York Mellon Corp. (The), | | | |
| | | | Senior Unsecured Notes, 5.45%, 5/15/19 | | | 172,842 |
| 12 | See Notes to Financial Statements. |
| Value Line Strategic Asset Management Trust |
| | Schedule of Investments (Continued) | | | |
| | | | | | | |
| June 30, 2014 (Unaudited) | | | |
| | | Value |
| | | | | | | |
| | Corporate Bonds & Notes — 9.9% (Continued) | | | |
| | | | | | | |
| Financial — 4.3% (Continued) | | | |
| $ | 250,000 | | Berkshire Hathaway, Inc., Senior Unsecured | | | |
| | | | Notes, 3.75%, 8/15/21 | | $ | 267,707 |
| | 200,000 | | BlackRock, Inc., Series 2, Senior Unsecured | | | |
| | | | Notes, 5.00%, 12/10/19 | | | 228,284 |
| | 350,000 | | BPCE S.A., Guaranteed Notes, 2.50%, | | | |
| | | | 12/10/18 | | | 354,783 |
| | 250,000 | | Branch Banking & Trust Co., Senior | | | |
| | | | Unsecured Notes, 1.05%, 12/1/16 | | | 250,607 |
| | 100,000 | | CIT Group, Inc., Senior Unsecured Notes, | | | |
| | | | 5.00%, 5/15/17 | | | 106,563 |
| | 250,000 | | Citigroup, Inc., Senior Unsecured Notes, | | | |
| | | | 1.70%, 7/25/16 | | | 253,286 |
| | 100,000 | | Citigroup, Inc., Subordinated Notes, | | | |
| | | | 5.30%, 5/6/44 | | | 104,305 |
| | 100,000 | | CNA Financial Corp., Senior Unsecured | | | |
| | | | Notes, 3.95%, 5/15/24 | | | 102,915 |
| | 250,000 | | Cooperatieve Centrale Raiffeisen- | | | |
| | | | Boerenleenbank BA, Guaranteed | | | |
| | | | Notes, 3.95%, 11/9/22 | | | 254,157 |
| | 150,000 | | Deutsche Bank AG, Senior Unsecured | | | |
| | | | Notes, 1.40%, 2/13/17 | | | 150,762 |
| | 100,000 | | Digital Realty Trust L.P., Guaranteed | | | |
| | | | Notes, 5.25%, 3/15/21 (1) | | | 107,423 |
| | 250,000 | | EPR Properties, Guaranteed Notes, | | | |
| | | | 5.25%, 7/15/23 | | | 260,065 |
| | 200,000 | | First Horizon National Corp., Senior | | | |
| | | | Unsecured Notes, 5.38%, 12/15/15 | | | 211,572 |
| | 580,000 | | Ford Motor Credit Co. LLC, Senior | | | |
| | | | Unsecured Notes, 4.38%, 8/6/23 | | | 619,399 |
| | 250,000 | | General Electric Capital Corp. MTN, | | | |
| | | | Senior Unsecured Notes, 1.00%, | | | |
| | | | 8/11/15 (2) | | | 251,792 |
| | 500,000 | | General Electric Capital Corp. MTN, | | | |
| | | | Senior Unsecured Notes, 3.35%, | | | |
| | | | 10/17/16 | | | 527,550 |
| | 300,000 | | Goldman Sachs Group, Inc. (The), | | | |
| | | | Senior Unsecured Notes, 5.75%, | | | |
| | | | 10/1/16 | | | 330,085 |
| | 200,000 | | Goldman Sachs Group, Inc. (The), | | | |
| | | | Subordinated Notes, 6.75%, 10/1/37 | | | 240,607 |
| | 200,000 | | Hartford Financial Services Group, Inc. | | | |
| | | | (The), Senior Unsecured Notes, 4.00%, | | | |
| | | | 10/15/17 | | | 215,813 |
| | 150,000 | | Hospitality Properties Trust, Senior | | | |
| | | | Unsecured Notes, 4.65%, 3/15/24 | | | 157,185 |
| | 250,000 | | Host Hotels & Resorts L.P., Senior | | | |
| | | | Unsecured Notes, 5.25%, 3/15/22 | | | 275,610 |
| | 200,000 | | HSBC Holdings PLC, Senior Unsecured | | | |
| | | | Notes, 4.88%, 1/14/22 | | | 224,448 |
| | 150,000 | | Itau Unibanco Holding S.A., Subordinated | | | |
| | | | Notes, 5.50%, 8/6/22 | | | 153,630 |
| | 150,000 | | Jefferies Group LLC, Senior Unsecured | | | |
| | | | Notes, 8.50%, 7/15/19 | | | 187,500 |
| | 200,000 | | Jefferies Group LLC, Senior Unsecured | | | |
| | | | Notes, 6.25%, 1/15/36 | | | 209,294 |
| | 500,000 | | JPMorgan Chase & Co., Senior Unsecured | | | |
| | | | Notes, 3.45%, 3/1/16 | | | 521,760 |
| | | | | Value |
| Financial — 4.3% (Continued) | | | |
| $ | 300,000 | | JPMorgan Chase & Co., Senior Unsecured | | | |
| | | | Notes, 3.20%, 1/25/23 | | $ | 297,862 |
| | 500,000 | | KeyCorp. MTN, Senior Unsecured Notes, | | | |
| | | | 5.10%, 3/24/21 | | | 566,552 |
| | 100,000 | | Macquarie Bank Ltd., Senior Unsecured | | | |
| | | | Notes, 5.00%, 2/22/17 (3) | | | 108,980 |
| | 500,000 | | Morgan Stanley GMTN, Senior Unsecured | | | |
| | | | Notes, 5.50%, 7/28/21 | | | 574,413 |
| | 250,000 | | Nomura Holdings, Inc. GMTN, Senior | | | |
| | | | Unsecured Notes, 2.75%, 3/19/19 | | | 254,325 |
| | 250,000 | | PNC Bank NA, Senior Unsecured Notes, | | | |
| | | | 1.30%, 10/3/16 | | | 252,386 |
| | 1,000,000 | | Private Export Funding Corp., Series HH, | | | |
| | | | 1.45%, 8/15/19 | | | 978,648 |
| | 250,000 | | ProLogis L.P., Guaranteed Notes, 2.75%, | | | |
| | | | 2/15/19 | | | 254,714 |
| | 250,000 | | Regions Financial Corp., Senior Unsecured | | | |
| | | | Notes, 2.00%, 5/15/18 | | | 249,120 |
| | 250,000 | | Royal Bank of Scotland Group PLC, | | | |
| | | | Senior Unsecured Notes, 1.88%, 3/31/17 | | | 252,227 |
| | 250,000 | | Santander Holdings USA, Inc., Senior | | | |
| | | | Unsecured Notes, 3.00%, 9/24/15 | | | 256,784 |
| | 100,000 | | Standard Chartered PLC, Subordinated | | | |
| | | | Notes, 5.70%, 3/26/44 (3) | | | 104,816 |
| | 1,000,000 | | Wachovia Corp., Senior Unsecured Notes, | | | |
| | | | 0.50%, 6/15/17 (2) | | | 998,630 |
| | 150,000 | | Weyerhaeuser Co., Senior Unsecured Notes, | | | |
| | | | 7.38%, 10/1/19 | | | 184,708 |
| | 150,000 | | Weyerhaeuser Co., Senior Unsecured Notes, | | | |
| | | | 6.95%, 10/1/27 | | | 188,140 |
| | 250,000 | | XLIT Ltd., Guaranteed Notes, 5.25%, | | | |
| | | | 12/15/43 | | | 274,917 |
| | | | | | | 14,585,754 |
| Industrial — 0.4% | | | |
| | 100,000 | | Lafarge S.A., Senior Unsecured Notes, | | | |
| | | | 6.20%, 7/9/15 (3) | | | 104,750 |
| | 300,000 | | Masco Corp., Senior Unsecured Notes, | | | |
| | | | 6.13%, 10/3/16 | | | 330,375 |
| | 250,000 | | Rock-Tenn Co., Guaranteed Notes, 4.90%, | | | |
| | | | 3/1/22 | | | 272,874 |
| | 200,000 | | Textron, Inc., Senior Unsecured Notes, | | | |
| | | | 6.20%, 3/15/15 | | | 208,157 |
| | 500,000 | | Union Pacific Corp., Senior Unsecured | | | |
| | | | Notes, 2.95%, 1/15/23 | | | 498,276 |
| | | | | | | 1,414,432 |
| Technology — 0.2% | | | |
| | 50,000 | | Altera Corp., Senior Unsecured Notes, | | | |
| | | | 1.75%, 5/15/17 | | | 50,558 |
| | 200,000 | | Altera Corp., Senior Unsecured Notes, | | | |
| | | | 2.50%, 11/15/18 | | | 203,072 |
| | 150,000 | | Intel Corp., Senior Unsecured Notes, | | | |
| | | | 4.25%, 12/15/42 | | | 146,969 |
| | 150,000 | | Oracle Corp., Senior Unsecured Notes, | | | |
| | | | 5.00%, 7/8/19 | | | 171,061 |
| | 100,000 | | Seagate HDD Cayman, Guaranteed Notes, | | | |
| | | | 4.75%, 1/1/25 (3) | | | 99,250 |
| | 200,000 | | Xerox Corp., Senior Unsecured Notes, | | | |
| | | | 2.80%, 5/15/20 | | | 199,677 |
| | | | | | | 870,587 |
| See Notes to Financial Statements. | 13 |
¢ | Value Line Strategic Asset Management Trust |
| | Schedule of Investments (Continued) | | |
| | | | | | |
| June 30, 2014 (Unaudited) | | |
| Principal | | | | |
| Amount | | | | Value |
| | | | | | |
| | Corporate Bonds & Notes — 9.9% (Continued) | | |
| Utilities — 0.2% | | |
| $ | 500,000 | | Commonwealth Edison Co., 4.00%, 8/1/20 | | $ | 539,721 |
| | | | Total Corporate Bonds & Notes | | | |
| | | | (Cost $33,060,149) | | | 33,712,859 |
| | | | | | | |
| Foreign Government Obligations — 0.2% | | | |
| | | | | | | |
| | 250,000 | | Mexico Government International Bond, | | | |
| | | | Senior Unsecured Notes, 5.13%, | | | |
| | | | 1/15/20 (1) | | | 283,250 |
| | 250,000 | | Poland Government International Bond, | | | |
| | | | Senior Unsecured Notes, 4.00%, 1/22/24 | | | 259,375 |
| | | | Total Foreign Government Obligations | | | |
| | | | (Cost $522,158) | | | 542,625 |
| | | | | | | |
| | Long-Term Municipal Securities — 0.4% | | | |
| | 400,000 | | City of New York, General Obligation | | | |
| | | | Unlimited, Subser. D2, 2.60%, 8/1/20 | | | 402,484 |
| | 250,000 | | City of New York, General Obligation | | | |
| | | | Unlimited, Subser. D2, 2.30%, 8/1/19 | | | 250,950 |
| | 130,000 | | City of Norfolk, Taxable Build America | | | |
| | | | Bonds, General Obligation Unlimited, | | | |
| | | | Series B, 5.91%, 3/1/29 | | | 158,759 |
| | 70,000 | | County of Clark, Build America Bonds, | | | |
| | | | General Obligation Limited, Series B1, | | | |
| | | | 5.21%, 6/1/16 | | | 75,727 |
| | 250,000 | | Dallas Independent School District | | | |
| | | | Qualified School Construction Notes, | | | |
| | | | General Obligation Limited, 5.05%, | | | |
| | | | 8/15/33 | | | 266,650 |
| | 75,000 | | University of Alabama, Build America | | | |
| | | | Bonds, General Obligation Unlimited, | | | |
| | | | Revenue Bonds, Series B, 5.20%, | | | |
| | | | 10/1/30 | | | 81,311 |
| | | | Total Long-Term Municipal | | | |
| | | | Securities (Cost $1,206,662) | | | 1,235,881 |
| | | | | | | |
| | U.S. Government Agency Obligations �� 7.9% | | | |
| | 500,000 | | FHLMC, 1.00%, 3/8/17 (1) | | | 501,724 |
| | 1,300,000 | | FHLMC, 1.25%, 5/12/17 | | | 1,313,188 |
| | 500,000 | | FHLMC, 1.00%, 7/28/17 | | | 500,307 |
| | 1,500,000 | | FHLMC, 1.75%, 5/30/19 (1) | | | 1,505,631 |
| | 117,226 | | FHLMC, Series 3538, Class BA, 4.50%, | | | |
| | | | 10/15/27 | | | 119,599 |
| | 178,376 | | FHLMC, Series 4151, Class PA, 2.00%, | | | |
| | | | 1/15/33 | | | 176,556 |
| | 361,877 | | FHLMC Gold PC Pool #G05447, 4.50%, | | | |
| | | | 5/1/39 | | | 391,748 |
| | 60,436 | | FHLMC Gold PC Pool #G08488, 3.50%, | | | |
| | | | 4/1/42 | | | 62,202 |
| | 416,503 | | FHLMC Gold PC Pool #J13885, 3.50%, | | | |
| | | | 12/1/25 | | | 441,493 |
| | 542,160 | | FHLMC Gold PC Pool #J17969, 3.00%, | | | |
| | | | 2/1/27 | | | 562,648 |
| | 489,544 | | FHLMC Gold PC Pool #Q23725, 4.00%, | | | |
| | | | 12/1/43 | | | 519,319 |
| | 88,024 | | FHLMC Gold Pool #C04038, 3.50%, | | | |
| | | | 6/1/42 | | | 90,595 |
| | | | | |
| Principal | | | | |
| Amount | | | | Value |
| | | | | |
| | U.S. Government Agency | | |
| | Obligations — 7.9% (Continued) | | |
| $ | 34,799 | | FHLMC Gold Pool #G08479, 3.50%, | | |
| | | | 3/1/42 | | $ | 35,815 |
| | 14,439 | | FHLMC Gold Pool #G18155, 5.00%, | | | |
| | | | 10/1/21 | | | 15,583 |
| | 52,533 | | FHLMC Gold Pool #G18160, 5.00%, | | | |
| | | | 11/1/21 | | | 56,745 |
| | 130,472 | | FHLMC Gold Pool #G18420, 3.00%, | | | |
| | | | 1/1/27 | | | 135,402 |
| | 49,691 | | FHLMC Gold Pool #J00975, 5.00%, | | | |
| | | | 1/1/21 | | | 53,682 |
| | 13,356 | | FHLMC Gold Pool #J03589, 5.00%, | | | |
| | | | 10/1/21 | | | 14,294 |
| | 213,434 | | FHLMC Pool #A96409, 3.50%, 1/1/41 | | | 219,669 |
| | 132 | | FNMA, 4.00%, 8/1/14 | | | 140 |
| | 500,000 | | FNMA, 0.38%, 12/21/15 | | | 500,544 |
| | 22,810 | | FNMA, 4.00%, 4/1/24 | | | 24,390 |
| | 275,679 | | FNMA, 4.00%, 3/1/25 | | | 295,286 |
| | 159,676 | | FNMA, 4.00%, 6/1/26 | | | 169,903 |
| | 559,507 | | FNMA, 3.50%, 7/1/26 | | | 593,683 |
| | 233,840 | | FNMA, 4.00%, 7/1/26 | | | 250,540 |
| | 41,365 | | FNMA, 4.50%, 7/1/40 | | | 44,831 |
| | 9,029 | | FNMA, 4.50%, 8/1/40 | | | 9,786 |
| | 10,235 | | FNMA, 4.50%, 9/1/40 | | | 11,089 |
| | 99,645 | | FNMA, 4.50%, 10/1/40 | | | 108,024 |
| | 480,012 | | FNMA, 4.50%, 2/1/41 | | | 520,087 |
| | 172,511 | | FNMA, 4.50%, 3/1/41 | | | 186,979 |
| | 15,729 | | FNMA, 4.50%, 4/1/41 | | | 17,041 |
| | 175,042 | | FNMA, 4.50%, 4/1/41 | | | 189,649 |
| | 366,581 | | FNMA, 4.50%, 4/1/41 | | | 397,170 |
| | 170,435 | | FNMA, 4.50%, 4/1/41 | | | 184,669 |
| | 460,268 | | FNMA Pool #255667, 5.00%, 3/1/25 | | | 511,451 |
| | 5,836 | | FNMA Pool #745275, 5.00%, 2/1/36 | | | 6,491 |
| | 350,739 | | FNMA Pool #890236, 4.50%, 8/1/40 | | | 380,007 |
| | 667,831 | | FNMA Pool #995245, 5.00%, 1/1/39 | | | 742,095 |
| | 446,936 | | FNMA Pool #AA7720, 4.00%, 8/1/39 | | | 474,988 |
| | 256,777 | | FNMA Pool #AB1259, 5.00%, 7/1/40 | | | 285,649 |
| | 104,758 | | FNMA Pool #AB3218, 3.50%, 7/1/31 | | | 109,545 |
| | 457,385 | | FNMA Pool #AB4449, 4.00%, 2/1/42 | | | 486,642 |
| | 603,651 | | FNMA Pool #AB5472, 3.50%, 6/1/42 | | | 622,355 |
| | 383,907 | | FNMA Pool #AB6286, 2.50%, 9/1/27 | | | 390,514 |
| | 641,213 | | FNMA Pool #AB8144, 5.00%, 4/1/37 | | | 713,199 |
| | 930,299 | | FNMA Pool #AD6374, 5.00%, 5/1/40 | | | 1,035,185 |
| | 9,528 | | FNMA Pool #AE0385, 4.00%, 9/1/40 | | | 10,126 |
| | 8,368 | | FNMA Pool #AE5024, 4.00%, 12/1/40 | | | 8,893 |
| | 139,181 | | FNMA Pool #AH6186, 4.00%, 2/1/41 | | | 147,917 |
| | 379,357 | | FNMA Pool #AH8932, 4.50%, 4/1/41 | | | 411,190 |
| | 48,792 | | FNMA Pool #AI5737, 4.50%, 6/1/41 | | | 52,885 |
| | 358,876 | | FNMA Pool #AJ6932, 3.00%, 11/1/26 | | | 373,246 |
| | 457,865 | | FNMA Pool #AO2961, 4.00%, 5/1/42 | | | 487,139 |
| | 392,803 | | FNMA Pool #AO4137, 3.50%, 6/1/42 | | | 404,974 |
| | 68,151 | | FNMA Pool #AO4299, 3.50%, 8/1/42 | | | 70,262 |
| | 32,170 | | FNMA Pool #AO6770, 3.50%, 6/1/42 | | | 33,167 |
| | 817,921 | | FNMA Pool #AP1340, 3.50%, 7/1/42 | | | 843,264 |
| | 412,725 | | FNMA Pool #AQ0287, 3.00%, 10/1/42 | | | 408,205 |
| | 472,206 | | FNMA Pool #AT0969, 3.00%, 4/1/43 | | | 467,035 |
| | 1,103,419 | | FNMA Pool #AT8849, 4.00%, 6/1/43 | | | 1,172,677 |
| | 197,726 | | FNMA Pool #AU6043, 3.00%, 9/1/43 | | | 195,561 |
| | 342,461 | | FNMA Pool #AU7025, 3.00%, 11/1/43 | | | 338,710 |
| | 338,222 | | FNMA Pool #AU8070, 3.50%, 9/1/43 | | | 348,702 |
| | 281,841 | | FNMA Pool #AU8846, 3.00%, 11/1/43 | | | 278,755 |
| See Notes to Financial Statements. |
| Value Line Strategic Asset Management Trust |
| | | |
| | Schedule of Investments (Continued) | | |
| | | | | | |
| June 30, 2014 (Unaudited) | | |
| Principal | | | | |
| Amount | | | | Value |
| | | |
| | U.S. Government Agency | | |
| | Obligations — 7.9% (Continued) | | |
| $ | 250,000 | | FNMA Pool TBA, 3.50%, 7/1/44 | | $ | 257,344 |
| | 200,000 | | FNMA Pool TBA, 4.50%, 7/1/44 | | | 216,594 |
| | 261,122 | | GNMA, 4.25%, 2/20/37 | | | 264,445 |
| | 393,990 | | GNMA, 3.00%, 4/16/39 | | | 405,702 |
| | 629,880 | | GNMA II Pool #MA1090, 3.50%, 6/20/43 | | | 657,156 |
| | 290,484 | | GNMA II Pool #MA1520, 3.00%, 12/20/43 | | | 293,709 |
| | 2,043,133 | | GNMA Pool #4016, 5.50%, 8/20/37 | | | 2,290,372 |
| | 256,319 | | GNMA Pool #650494, 5.50%, 1/15/36 | | | 287,657 |
| | 239,093 | | GNMA Pool #MA1375, 3.50%, 10/20/43 | | | 249,447 |
| | | | Total U.S. Government Agency | | | |
| | | | Obligations (Cost $26,311,064) | | | 26,953,266 |
| | | | | | | |
| | U.S. Treasury Obligations — 3.2% | | | |
| | 1,400,000 | | U.S. Treasury Bonds, 6.13%, 11/15/27 | | | 1,922,593 |
| | 850,000 | | U.S. Treasury Bonds, 4.50%, 5/15/38 | | | 1,033,547 |
| | 800,000 | | U.S. Treasury Bonds, 4.38%, 5/15/40 | | | 959,375 |
| | 150,000 | | U.S. Treasury Bonds, 2.88%, 5/15/43 | | | 137,063 |
| | 100,000 | | U.S. Treasury Bonds, 3.63%, 8/15/43 | | | 105,625 |
| | 50,000 | | U.S. Treasury Notes, 0.25%, 2/15/15 | | | 50,055 |
| | 250,000 | | U.S. Treasury Notes, 0.38%, 6/30/15 | | | 250,586 |
| | 300,000 | | U.S. Treasury Notes, 0.38%, 4/30/16 | | | 299,906 |
| | 150,000 | | U.S. Treasury Notes, 1.75%, 5/31/16 | | | 153,797 |
| | 250,000 | | U.S. Treasury Notes, 1.50%, 6/30/16 | | | 255,156 |
| | 150,000 | | U.S. Treasury Notes, 1.00%, 10/31/16 | | | 151,406 |
| | 500,000 | | U.S. Treasury Notes, 0.88%, 6/15/17 | | | 500,195 |
| | 500,000 | | U.S. Treasury Notes, 1.88%, 10/31/17 | | | 513,867 |
| | 250,000 | | U.S. Treasury Notes, 2.63%, 4/30/18 | | | 263,067 |
| | 300,000 | | U.S. Treasury Notes, 2.25%, 7/31/18 | | | 310,969 |
| | 800,000 | | U.S. Treasury Notes, 1.38%, 9/30/18 | | | 799,000 |
| | 1,400,000 | | U.S. Treasury Notes, 1.75%, 10/31/18 | | | 1,419,907 |
| | 100,000 | | U.S. Treasury Notes, 1.00%, 8/31/19 | | | 96,594 |
| | 350,000 | | U.S. Treasury Notes, 2.63%, 8/15/20 | | | 364,219 |
| | 150,000 | | U.S. Treasury Notes, 2.13%, 8/31/20 | | | 151,547 |
| | 300,000 | | U.S. Treasury Notes, 2.00%, 11/30/20 | | | 299,836 |
| | 150,000 | | U.S. Treasury Notes, 2.13%, 8/15/21 | | | 149,906 |
| | 250,000 | | U.S. Treasury Notes, 2.00%, 2/15/22 | | | 246,113 |
| | 300,000 | | U.S. Treasury Notes, 2.50%, 5/15/24 | | | 299,578 |
| | | | Total U.S. Treasury Obligations | | | |
| | | | (Cost $9,950,238) | | | 10,733,907 |
| | | | | |
| Shares | | | | Value |
| | | | | | |
| | Short-Term Investments — 6.2% | | |
| Money Market Funds — 6.2% | | |
| | 21,149,211 | | State Street Institutional Liquid Reserves | | |
| | | | Fund | | $ | 21,149,211 |
| | | | Total Short-Term Investments | | | |
| | | | (Cost $21,149,211) | | | 21,149,211 |
| | | | Total Investments — 100.1% | | | |
| | | | (Cost $191,445,248) | | $ | 339,906,658 |
| Excess Of Liabilities Over Cash And Other | | | |
| Assets – (0.1)% | | | (231,278) |
| Net Assets – 100.0% | | $ | 339,675,380 |
| Net Asset Value Per Outstanding Share | | | |
| ($339,675,380 ÷ 14,021,578 shares outstanding) | | $ | 24.23 |
| * | Non-income producing. |
| (1) | A portion or all of the security was held on loan. As of June 30, 2014, the market value of the securities on loan was $4,983,873. |
| (2) | The rate shown on floating rate securities is the rate at the end of the reporting period. |
| (3) | Pursuant to Rule 144A under the Securities Act of 1933, this security can only be sold to qualified institutional investors. |
| ADR | American Depositary Receipt. |
| FHLMC | Federal Home Loan Mortgage Corp. |
| FNMA | Federal National Mortgage Association. |
| GMTN | Global Medium Term Note. |
| GNMA | Government National Mortgage Association. |
| MTN | Medium Term Note. |
| REIT | Real Estate Investment Trust. |
| TBA | To Be Announced. |
The following table summarizes the inputs used to value the Trust’s investments in securities as of June 30, 2014 (See Note 1B):
| | | | | | | | | | | | | |
| Investments in Securities: | | Level 1 | | | Level 2 | | | Level 3 | | | Total | |
| Assets | | | | | | | | | | | | |
| Common Stocks* | | $ | 240,292,921 | | | $ | — | | | $ | — | | | $ | 240,292,921 | |
| Asset-Backed Securities | | | — | | | | 494,244 | | | | — | | | | 494,244 | |
| Commercial Mortgage-Backed Securities | | | — | | | | 4,791,744 | | | | — | | | | 4,791,744 | |
| Corporate Bonds & Notes* | | | — | | | | 33,712,859 | | | | — | | | | 33,712,859 | |
| Foreign Government Obligations | | | — | | | | 542,625 | | | | — | | | | 542,625 | |
| Long-Term Municipal Securities | | | — | | | | 1,235,881 | | | | — | | | | 1,235,881 | |
| U.S. Government Agency Obligations | | | — | | | | 26,953,266 | | | | — | | | | 26,953,266 | |
| U.S. Treasury Obligations | | | — | | | | 10,733,907 | | | | — | | | | 10,733,907 | |
| Short-Term Investments | | | — | | | | 21,149,211 | | | | — | | | | 21,149,211 | |
| Total Investments in Securities | | $ | 240,292,921 | | | $ | 99,613,737 | | | $ | — | | | $ | 339,906,658 | |
*See Schedule of Investments for further classification.
See Notes to Financial Statements. | 15 |
| ¢ | Value Line Strategic Asset Management Trust |
| | | | |
| Statement of Assets and Liabilities | | | |
| | | | |
| June 30, 2014 (Unaudited) | | | |
| | | | |
| ASSETS: | | | |
| Investment securities, at value (Cost - $191,445,248) (securities on loan, at value, $4,983,873) | | $ | 339,906,658 | |
| Cash | | | 565,814 | |
| Cash collateral received for securities on loan (Note 1K) | | | 5,069,838 | |
| Interest and dividends receivable | | | 675,783 | |
| Receivable for securities sold | | | 58,243 | |
| Prepaid expenses | | | 16,072 | |
| Receivable for securities lending income | | | 4,456 | |
| Receivable for trust shares sold | | | 863 | |
| Total Assets | | | 346,297,727 | |
| | | | | |
| LIABILITIES: | | | | |
| Payable upon return of securities on loan (Note 1K) | | | 5,069,838 | |
| Payable for securities purchased | | | 1,171,936 | |
| Payable for trust shares redeemed | | | 139,378 | |
| Accrued expenses: | | | | |
| Advisory fee | | | 139,598 | |
| Service and distribution plan fees | | | 69,799 | |
| Directors’ fees and expenses | | | 1,006 | |
| Other | | | 30,792 | |
| Total Liabilities | | | 6,622,347 | |
| Net Assets | | $ | 339,675,380 | |
| | | | | |
| NET ASSETS CONSIST OF: | | | | |
| Shares of beneficial interest, at $0.01 par value (authorized unlimited, outstanding 14,021,578 shares) | | $ | 140,216 | |
| Additional paid-in capital | | | 140,480,923 | |
| Undistributed net investment income | | | 2,663,297 | |
| Accumulated net realized gain on investments and foreign currency | | | 47,929,534 | |
| Net unrealized appreciation of investments | | | 148,461,410 | |
| Net Assets | | $ | 339,675,380 | |
| | | | | |
| Net Asset Value Per Outstanding Share ($339,675,380 ÷ 14,021,578 shares outstanding) | | $ | 24.23 | |
| Statement of Operations | | | |
| | | | |
| For the Six Months Ended | | | |
| June 30, 2014 (Unaudited) | | | |
| | | | |
| INVESTMENT INCOME: | | | |
| Dividends (net of foreign withholding tax of $20,017) | | $ | 1,384,770 | |
| Interest | | | 1,112,272 | |
| Securities lending income | | | 17,547 | |
| Total Income | | | 2,514,589 | |
| | | | | |
| Expenses: | | | | |
| Advisory fee | | | 839,780 | |
| Service and distribution plan fees | | | 671,824 | |
| Auditing and legal fees | | | 77,895 | |
| Custodian fees | | | 44,103 | |
| Trustees’ fees and expenses | | | 36,231 | |
| Insurance | | | 18,486 | |
| Printing and postage | | | 9,117 | |
| Other | | | 18,521 | |
| Total Expenses Before Fees Waived (Note 5) | | | 1,715,957 | |
| Less: Service and Distribution Plan Fees Waived | | | (251,934 | ) |
| Net Expenses | | | 1,464,023 | |
| Net Investment Income | | | 1,050,566 | |
Net Realized and Unrealized Gain on Investments and Foreign Exchange Transactions: | | | | |
| Net Realized Gain | | | 9,775,498 | |
| Change in Net Unrealized Appreciation/ | | | | |
| (Depreciation) | | | 4,211,522 | |
Net Realized Gain and Change in Net Unrealized Appreciation/(Depreciation) on Investments and Foreign Exchange Transactions | | | 13,987,020 | |
| Net Increase in Net Assets from Operations | | $ | 15,037,586 | |
| | |
| 16 | See Notes to Financial Statements. |
| ¢ | Value Line Strategic Asset Management Trust |
| | |
| Statement of Changes in Net Assets |
| | | | | | | |
| | | Six Months Ended | | | Year Ended | |
| | | June 30, 2014 | | | December 31, | |
| | | (unaudited) | | | 2013 | |
Operations: | | | | | | |
| Net investment income | | $ | 1,050,566 | | | $ | 1,615,771 | |
| Net realized gain on investments and foreign currency | | | 9,775,498 | | | | 38,134,883 | |
| Change in net unrealized appreciation/(depreciation) on investments and foreign currency translations | | | 4,211,522 | | | | 25,785,629 | |
| Net increase in net assets from operations | | | 15,037,586 | | | | 65,536,283 | |
| Distributions to Shareholders from: | | | | | | | | |
| Net investment income | | | — | | | | (2,744,889 | ) |
| Net realized gain from investment transactions | | | — | | | | (26,671,126 | ) |
| Total distributions | | | — | | | | (29,416,015 | ) |
| | | | | | | | | |
| Share Transactions: | | | | | | | | |
| Proceeds from sale of trust shares | | | 1,257,779 | | | | 3,907,578 | |
| Proceeds from reinvestment of dividends and distributions to shareholders | | | — | | | | 29,416,015 | |
| Cost of trust shares redeemed | | | (21,121,841 | ) | | | (46,769,892 | ) |
| Net decrease in net assets from trust share transactions | | | (19,864,062 | ) | | | (13,446,299 | ) |
| Total increase/(decrease) in net assets | | | (4,826,476 | ) | | | 22,673,969 | |
| NET ASSETS: | | | | | | | | |
| Beginning of period | | | 344,501,856 | | | | 321,827,887 | |
| End of period | | $ | 339,675,380 | | | $ | 344,501,856 | |
| Undistributed net investment income included in net assets, at end of period | | $ | 2,663,297 | | | $ | 1,612,731 | |
| | |
| See Notes to Financial Statements. | 17 |
| ¢ | Value Line Strategic Asset Management Trust |
Selected data for a share of beneficial interest outstanding throughout each period:
| | | | | | | | | | | | | | | | | | | |
| | | Six Months Ended | | | | | | | | | | | | | | | | |
| | | June 30, 2014 | | | Years Ended December 31, | |
| | | (unaudited) | | | 2013 | | | 2012 | | | 2011 | | | 2010 | | | 2009 | |
| Net asset value, beginning of period | | $ | 23.17 | | | $ | 20.87 | | | $ | 18.52 | | | $ | 17.96 | | | $ | 15.72 | | | $ | 14.36 | |
| Income from investment operations: | | | | | | | | | | | | | | | | | | | | | | | | |
| Net investment income | | | 0.08 | | | | 0.12 | | | | 0.19 | | | | 0.13 | | | | 0.11 | | | | 0.14 | |
Net gains on securities (both realized and unrealized) | | | 0.98 | | | | 4.22 | | | | 2.64 | | | | 0.54 | | | | 2.27 | | | | 2.67 | |
| Total from investment operations | | | 1.06 | | | | 4.34 | | | | 2.83 | | | | 0.67 | | | | 2.38 | | | | 2.81 | |
| Less distributions: | | | | | | | | | | | | | | | | | | | | | | | | |
| Dividends from net investment income | | | — | | | | (0.19 | ) | | | (0.13 | ) | | | (0.11 | ) | | | (0.14 | ) | | | (0.17 | ) |
| Distributions from net realized gains | | | — | | | | (1.85 | ) | | | (0.35 | ) | | | — | | | | — | | | | (1.28 | ) |
| Total distributions | | | — | | | | (2.04 | ) | | | (0.48 | ) | | | (0.11 | ) | | | (0.14 | ) | | | (1.45 | ) |
| Net asset value, end of period | | $ | 24.23 | | | $ | 23.17 | | | $ | 20.87 | | | $ | 18.52 | | | $ | 17.96 | | | $ | 15.72 | |
Total return* | | | 4.57 | %(1) | | | 21.63 | % | | | 15.43 | % | | | 3.68 | % | | | 15.20 | % | | | 21.16 | % |
| Ratios/Supplemental Data: | | | | | | | | | | | | | | | | | | | | | | | | |
| Net assets, end of period (in thousands) | | $ | 339,675 | | | $ | 344,502 | | | $ | 321,828 | | | $ | 319,894 | | | $ | 356,645 | | | $ | 362,955 | |
Ratio of gross expenses to average net assets(2) | | | 1.02 | %(3) | | | 1.03 | % | | | 1.04 | % | | | 1.03 | % | | | 1.03 | %(4) | | | 1.02 | % |
Ratio of net expenses to average net assets(5) | | | 0.87 | %(3) | | | 0.88 | % | | | 0.89 | % | | | 0.88 | % | | | 0.84 | %(6) | | | 0.87 | % |
| Ratio of net investment income to average net assets | | | 0.63 | %(3) | | | 0.48 | % | | | 0.84 | % | | | 0.60 | % | | | 0.56 | % | | | 0.81 | % |
| Portfolio turnover rate | | | 11 | %(1) | | | 17 | % | | | 24 | % | | | 28 | % | | | 21 | % | | | 16 | % |
| | |
| * | Total returns do not reflect the effects of charges deducted under the terms of Guardian Insurance and Annuity Company, Inc.’s (GIAC) variable contracts. Including such charges would reduce the total returns for all years shown. |
| | |
| (1) | Not annualized. |
| | |
| (2) | Ratio reflects expenses grossed up for the custody credit arrangement and grossed up for the waiver of a portion of the service and distribution plan fees by the Distributor. The custody credit arrangement was discontinued as of January 1, 2013. |
| | |
| (3) | Annualized. |
| | |
| (4) | Ratio reflects expenses grossed up for the reimbursement by Value Line, Inc. of certain expenses incurred by the Trust. |
| | |
| (5) | Ratio reflects expenses net of the custody credit arrangement and net of the waiver of a portion of the service and distribution plan fees by the Distributor. The custody credit arrangement was discontinued as of January 1, 2013. |
| | |
| (6) | Ratio reflects expense net of the reimbursement by Value Line, Inc. of certain expenses incurred by the Trust. |
| | |
| 18 | See Notes to Financial Statements. |
¢ | Value Line Strategic Asset Management Trust |
Notes to Financial Statements |
| |
June 30, 2014 (Unaudited) |
| 1. | Significant Accounting Policies |
Value Line Strategic Asset Management Trust (the “Trust”) is an open-end diversified management investment company registered under the Investment Company Act of 1940, as amended, which seeks to achieve a high total investment return consistent with reasonable risk by investing primarily in a broad range of common stocks, bonds and money market instruments. The Trust will attempt to achieve its objective by following an asset allocation strategy based on data derived from computer models for the stock and bond markets that shifts the assets of the Trust among equity, debt and money market securities as the models indicate and its investment adviser, EULAV Asset Management (the “Adviser”), deems appropriate. The Trust is a part of the Value Line Funds (the “Funds”), a family of 10 mutual funds that include a wide range of solutions designed to meet virtually any investment goal and consists of a variety of equity, fixed income, and hybrid funds.
The following significant accounting policies are in conformity with generally accepted accounting principles for investment companies. Such policies are consistently followed by the Trust in the preparation of its financial statements. Generally accepted accounting principles requires management to make estimates and assumptions that affect the reported amounts and disclosures in the financial statements. Actual results may differ from those estimates.
(A) Security Valuation: Securities listed on a securities exchange are valued at the closing sales prices on the date as of which the net asset value (“NAV”) is being determined. Securities traded on the National Association of Securities Dealers Automated Quotations (“NASDAQ”) Stock Market are valued at the NASDAQ Official Closing Price. In the absence of closing sales prices for such securities and for securities traded in the over-the-counter market, the security is valued at the midpoint between the latest available and representative asked and bid prices. Short-term instruments with maturities of 60 days or less at the date of purchase are valued at amortized cost, which approximates fair value. Short-term instruments with maturities greater than 60 days at the date of purchase are valued at the midpoint between the latest available and representative asked and bid prices, and commencing 60 days prior to maturity such securities are valued at amortized cost.
Investments in shares of open-end mutual funds, including money market funds, are valued at their daily NAV which is calculated as of the close of regular trading on the NYSE (usually 4:00 P.M. Eastern Standard Time) on each day on which the NYSE is open for business. NAV per share is determined by dividing the Trust’s total net assets by the Trust’s total number of shares outstanding at the time of calculation.
The Board of Trustees (the “Board”) has adopted procedures for valuing portfolio securities in circumstances where market quotes are not readily available, and has delegated the responsibility for applying the valuation methods to the Adviser. A valuation committee (the “Valuation Committee”) was established by the Board to oversee the implementation of the Trust’s valuation methods and to make fair value determinations on behalf of the Board, as instructed. The Adviser monitors the continued appropriateness of methods applied and determines if adjustments should be made in light of market changes, events affecting the issuer, or other factors. If the Adviser determines that a valuation method may no longer be appropriate, another valuation method may be selected, or the Valuation Committee will be convened to consider the matter and take any appropriate action in accordance with procedures set forth by the Board. The Board shall review the appropriateness of the valuation methods and these methods may be amended or supplemented from time to time by the Valuation Committee. In addition, the Trust may use the fair value of a security when the closing market price on the primary exchange where the security is traded no longer reflects the value of a security due to factors affecting one or more relevant securities markets or the specific issuer.
The Board has determined that the value of bonds and other fixed-income securities be calculated on the valuation date by reference to valuations obtained from an independent pricing service which determines valuations for normal institutional-size trading units of debt securities, without exclusive reliance upon quoted prices. This service takes into account appropriate factors such as institutional-size trading in similar groups of securities, yield, quality, coupon rate, maturity, type of issue, trading characteristics and other market data in determining valuations.
(B) Fair Value Measurements: The Trust follows fair valuation accounting standards (FASB ASC 820-10) which establish a definition of fair value and set out a hierarchy for measuring fair value. These standards require additional disclosures about the various inputs and valuation techniques used to develop the measurements of fair value and a discussion of changes in valuation techniques and related inputs during the period. These inputs are summarized in the three broad levels listed below:
| | |
| ● | Level 1– Inputs that reflect unadjusted quoted prices in active markets for identical assets or liabilities that the Trust has the ability to access at the measurement date; |
| Value Line Strategic Asset Management Trust |
Notes to Financial Statements (Continued) |
| |
June 30, 2014 (Unaudited) |
| | |
| ● | Level 2 – Inputs other than quoted prices that are observable for the asset or liability either directly or indirectly, including inputs in markets that are not considered to be active; |
| | |
| ● | Level 3 – Inputs that are unobservable. |
Transfers between investment levels may occur as the markets fluctuate and/or the availability of data used in an investment’s valuation changes. The inputs or methodologies used for valuing securities are not necessarily an indication of the risk associated with investing in those securities.
The Trust follows the updated provisions surrounding fair value measurements and disclosures on transfers in and out of all levels of the fair value hierarchy on a gross basis and the reasons for the transfers as well as disclosures about the valuation techniques and inputs used to measure fair value for investments that fall in either Level 2 or Level 3 of the fair value hierarchy.
For the six months ended June 30, 2014, there were no transfers between Level 1, Level 2, and Level 3 assets.
The Trust’s policy is to recognize transfers between levels at the beginning of the reporting period.
The amounts and reasons for all transfers in and out of each level within the three-tier hierarchy are disclosed when the Trust had an amount of total transfers during the reporting period that was meaningful in relation to its net assets as of the end of the reporting period (e.g. greater than 1%). An investment asset’s or liability’s level within the fair value hierarchy is based on the lowest level input, individually or in aggregate, that is significant to fair value measurement. The objective of fair value measurement remains the same even when there is a significant decrease in the volume and level of activity for an asset or liability and regardless of the valuation techniques used.
For the six months ended June 30, 2014, there were no Level 3 investments. The Schedule of Investments includes a breakdown of the Trust’s investments by category.
(C) Repurchase Agreements: The Trust may enter into repurchase agreements, under the terms of a Master Repurchase Agreement, with selected commercial banks and broker-dealers, under which the Trust acquires securities as collateral and agrees to resell the securities at an agreed upon time and at an agreed upon price. The Trust, through the custodian or a sub-custodian, receives delivery of the underlying securities collateralizing repurchase agreements. The Trust’s custodian takes possession of the underlying collateral securities, the value of which exceeds the principal amount of the repurchase transaction, including accrued interest. To the extent that any repurchase transaction exceeds one business day, it is the Trust’s policy to mark-to-market the value of the underlying securities daily to ensure the adequacy of the collateral. In the event of default by either the seller or the Trust, the Master Repurchase Agreement may permit the non-defaulting party to net and close out all transactions. The Trust has the right to liquidate the collateral and apply the proceeds in satisfaction of the obligation. Under certain circumstances, in the event of default or bankruptcy by the other party to the agreement, realization and/or retention of the collateral or proceeds may be subject to legal proceedings. At period end, there were no open repurchase agreements for the Value Line Funds.
(D) Federal Income Taxes: It is the policy of the Trust to continue to qualify as a regulated investment company by complying with the provisions available to regulated investment companies, as defined in applicable sections of the Internal Revenue Code, and to distribute all of its net investment income and capital gains to its shareholders. Therefore, no provision for federal income tax is required.
Management has analyzed the Trust’s tax positions taken on federal and state income tax returns for all open tax years (fiscal years ended December 31, 2010 through December 31, 2013), and has concluded that no provision for federal or state income tax is required in the Trust’s financial statements. The Trust’s federal and state income tax returns for tax years for which the applicable statutes of limitations have not expired are subject to examination by the Internal Revenue Service and state departments of revenue.
(E) Dividends and Distributions: It is the Trust’s policy to distribute annually to its shareholders, as dividends and as capital gains distributions, all the net investment income for the year and all the net capital gains realized by the Trust, if any. Such distributions are determined in accordance with income tax regulations, which may differ from generally accepted accounting principles. All dividends or distributions will be payable in shares of the Trust at the net asset value on the ex-dividend date. This policy is, however, subject to change at any time by the Board.
| Value Line Strategic Asset Management Trust |
Notes to Financial Statements (Continued) |
| |
June 30, 2014 (Unaudited) |
(F) Securities Transactions and Income: Securities transactions are recorded on a trade date basis. Realized gains and losses from securities transactions are recorded on the basis of the first in first out convention (“FIFO”). Interest income on investments, adjusted for amortization of discount and premium, if applicable, is earned from settlement date and recognized on the accrual basis. Dividend income is recorded on the ex-dividend date.
The Trust may invest in Treasury Inflation-Protection Securities (“TIPS”). The principal value and interest payout of TIPS are periodically adjusted according to the rate of the inflation based on the Consumer Price Index. The adjustments for principal and income due to inflation are reflected in interest income in the Statement of Operations.
The Trust may purchase mortgage pass-through securities on a to-be-announced (“TBA”) basis, with payment and delivery scheduled for a future date. The Trust may enter into a TBA agreement, sell the obligation to purchase the pools stipulated in the TBA agreement prior to the stipulated settlement date and enter into a new TBA agreement for future delivery of pools of mortgage pass-through securities (a “TBA roll”). A TBA roll is treated by the Trust as a purchase transaction and a sale transaction in which the Trust realizes a gain or loss. The Trust’s use of TBA rolls may cause the Trust to experience higher portfolio turnover and higher transaction costs. The Trust could be exposed to possible risk if there is an adverse market action, expenses or delays in connection with TBA transactions, or if the counterparty fails to complete the transaction.
(G) Foreign Currency Translation: The books and records of the Trust are maintained in U.S. dollars. Assets and liabilities which are denominated in foreign currencies are translated to U.S. dollars at the prevailing rates of exchange at the valuation date. The Trust does not isolate changes in the value of investments caused by foreign exchange rate differences from the changes due to other circumstances.
Income and expenses are translated to U.S. dollars based upon the rates of exchange on the respective dates of such transactions.
Net realized foreign exchange gains or losses arise from currency fluctuations realized between the trade and settlement dates on securities transactions, the differences between the U.S. dollar amounts of dividends, interest, and foreign withholding taxes recorded by the Trust, and the U.S. dollar equivalent of the amounts actually received or paid. Net unrealized foreign exchange gains and losses arise from changes in the value of assets and liabilities, other than investments, at the end of the fiscal period, resulting from changes in the exchange rates. The effect of the change in foreign exchange rates on the value of investments is included in realized gain/(loss) on investments and change in net unrealized appreciation/(depreciation) on investments.
(H) Representations and Indemnifications: In the normal course of business, the Trust enters into contracts that contain a variety of representations and warranties which provide general indemnifications. The Trust’s maximum exposure under these arrangements is unknown, as this would involve future claims that may be made against the Trust that have not yet occurred. However, based on experience, management expects the risk of loss to be remote.
(I) Accounting for Real Estate Investment Trusts: The Trust owns shares of Real Estate Investment Trusts (“REITs”) which report information on the source of their distributions annually. Distributions received from REITs during the year which represent a return of capital are recorded as a reduction of cost and distributions which represent a capital gain dividend are recorded as a realized long-term capital gain on investments.
(J) Foreign Taxes: The Trust may be subject to foreign taxes on income, gains on investments, or currency repatriation, a portion of which may be recoverable. The Trust will accrue such taxes and recoveries as applicable, based upon its current interpretation of tax rules and regulations that exist in the markets in which it invests.
(K) Securities Lending: Under an agreement with State Street Bank & Trust (“State Street”), the Trust can lend its securities to brokers, dealers and other financial institutions approved by the Board. By lending its investment securities, the Trust attempts to increase its net investment income through receipt of interest on the loan. Any gain or loss in the market price of the securities loaned that might occur and any interest or dividends declared during the term of the loan would accrue to the account of the Trust. Risks of delay in recovery of the securities or even loss of rights in the collateral may occur should the borrower of the securities fail financially. Generally, in the event of a counter-party default, the Trust has the right to use the collateral to offset the losses incurred. The lending fees received and the Trust’s portion of the interest income earned on the cash collateral are included in the Statement of Operations.
| Value Line Strategic Asset Management Trust |
Notes to Financial Statements (Continued) |
| |
June 30, 2014 (Unaudited) |
Upon entering into a securities lending transaction, the Trust receives cash or other securities as collateral in an amount equal to or exceeding 102% of the current market value of the loaned securities. Any cash received as collateral is invested by State Street Global Advisors, acting in its capacity as securities lending agent (the “Agent”), in The Value Line Funds collateral account, which is subsequently invested into joint repurchase agreements. A portion of the dividends received on the collateral is rebated to the borrower of the securities and the remainder is split between the Agent and the Trust.
The Trust enters into a joint repurchase agreement whereby its uninvested cash collateral from securities lending is deposited into a joint cash account with other funds managed by the Adviser and is used to invest in one or more repurchase agreements. The value and face amount of the joint repurchase agreement are allocated to the funds based on their pro-rata interest in the repurchase agreement. A repurchase agreement is accounted for as a loan by the fund to the seller, collateralized by securities which are delivered to the Fund’s custodian. The market value, including accrued interest, of the initial collateralization is required to be at least 102% of the dollar amount invested by the funds, with the value of the underlying securities marked-to-market daily to maintain coverage of at least 100%.
At period end, the Value Line Funds were not invested in joint repurchase agreements.
As of June 30, 2014, the Trust loaned securities which were collateralized by cash. The value of the securities on loan and the value of the related collateral were as follows:
| | | |
| | | Total Collateral |
| Value of Securities Loaned | Value of Collateral | (including Calculated Mark)* |
| | |
* Balances represent the end of day mark-to-market of securities lending collateral that will be reflected by the Trust as of the next business day.
(L) Subsequent Events: Management has evaluated all subsequent transactions and events through the date on which these financial statements were issued and has determined that no additional items require adjustment to or disclosure in the financial statements.
2. Trust Share Transactions, Dividends and Distributions
Shares of the Trust are available to the public only through the purchase of certain contracts issued by The Guardian Insurance and Annuity Company, Inc. (GIAC). Transactions in shares of beneficial interest in the Trust were as follows:
| | | | | | | |
| | | Six Months Ended June 30, 2014 (unaudited) | | | Year Ended December 31, 2013 | |
| Shares sold | | | 53,451 | | | | 175,401 | |
| Shares issued to shareholders in reinvestment of dividends and distributions | | | — | | | | 1,374,580 | |
| Shares redeemed | | | (901,038 | ) | | | (2,103,548 | ) |
| Net decrease | | | (847,587 | ) | | | (553,567 | ) |
| Dividends per share from net investment income | | $ | — | | | $ | 0.1908 | |
| Distributions per share from net realized gains | | $ | — | | | $ | 1.8538 | |
| ¢ | Value Line Strategic Asset Management Trust | |
| | | |
| Notes to Financial Statements (Continued) |
| | | |
| June 30, 2014 (Unaudited) | |
3. Purchases and Sales of Securities
Purchases and sales of investment securities, excluding short-term securities, were as follows:
| | | | |
| | | Six Months Ended | |
| | | June 30, 2014 | |
| | | (unaudited) | |
| PURCHASES: | | | |
| U.S. Treasury & Government Agency Obligations | | $ | 4,486,452 | |
| Other Investment Securities | | | 31,455,989 | |
| Total Purchases | | $ | 35,942,441 | |
| SALES: | | | | |
| U.S. Treasury & Government Agency Obligations | | $ | 17,507,855 | |
| Other Investment Securities | | | 27,881,879 | |
| Total Sales | | $ | 45,389,734 | |
4. Income Taxes
| | | | |
| At June 30, 2014, information on the tax components of capital is as follows: | | | |
| | | | |
| Cost of investments for tax purposes | | $ | 191,445,248 | |
| Gross tax unrealized appreciation | | $ | 148,743,708 | |
| Gross tax unrealized depreciation | | | (282,298 | ) |
| Net tax unrealized appreciation on investments | | $ | 148,461,410 | |
5. Investment Advisory Fee, Service and Distribution Fees and Transactions With Affiliates
An advisory fee of $839,780 was paid or payable to the Adviser for the six months ended June 30, 2014. This was computed at an annual rate of 0.50% of the average daily net assets of the Trust during the period and paid monthly. The Adviser provides research, investment programs, supervision of the investment portfolio and pays costs of administrative services, office space, equipment and compensation of administrative, bookkeeping, and clerical personnel necessary for managing the affairs of the Trust. The Adviser also provides persons, satisfactory to the Trust’s Board, to act as officers and employees of the Trust and pays their salaries.
The Trust has a Service and Distribution Plan (the “Plan”), adopted pursuant to Rule 12b-1 under the Investment Company Act of 1940, which compensates EULAV Securities LLC (the “Distributor”) for advertising, marketing and distributing the Trust’s shares and for servicing the Trust’s shareholders at an annual rate of 0.40% of the Trust’s average daily net assets. For the six months ended June 30, 2014, fees amounting to $671,824, before fee waivers, were accrued under the Plan. Effective May 1, 2007, and voluntarily renewed annually, the Distributor contractually agreed to reduce the fee under the Plan by 0.15% for one year periods. For the six months ended June 30, 2014, the fees waived amounted to $251,934. The Distributor has no right to recoup previously waived amounts.
Direct expenses of the Trust are charged to the Trust while common expenses of the Funds are allocated proportionately based upon the Funds’ respective net assets. The Trust bears all other costs and expenses.
Certain officers and a trustee of the Adviser are also officers and a trustee of the Trust. At June 30, 2014, the officers and trustees of the Trust as a group owned less than 1% of the outstanding shares.
| ¢ | Value Line Strategic Asset Management Trust |
| | |
| Semi-Annual Report |
FACTORS CONSIDERED BY THE BOARD IN APPROVING CONTINUANCE OF
THE INVESTMENT ADVISORY AGREEMENT
FOR VALUE LINE STRATEGIC ASSET MANAGEMENT TRUST
The Investment Company Act of 1940 (the “1940 Act”) requires the Board of Trustees, including a majority of Trustees who are not “interested persons” of Value Line Strategic Asset Management Trust (the “Fund”), as that term is defined in the 1940 Act (the “Independent Trustees”), to annually consider the continuance of the Fund’s investment advisory agreement (“Agreement”) with its investment adviser, EULAV Asset Management.
In considering whether the continuance of the Agreement was in the best interests of the Fund and its shareholders, the Board requested and the Adviser provided such information as the Board deemed to be reasonably necessary to evaluate the terms of the Agreement. At meetings held throughout the year, including the meeting specifically focused upon the review of the Agreement, the Independent Trustees met in executive sessions separately from the non-Independent Trustee of the Fund and any officers of the Adviser. In selecting the Adviser and approving the continuance of the Agreement, the Independent Trustees relied upon the assistance of counsel to the Independent Trustees.
Both in the meeting specifically focused upon the review of the Agreement and at other meetings, the Board, including the Independent Trustees, received materials relating to the Adviser’s investment and management services under the Agreement. These materials included information regarding: (i) the investment performance of the Fund, including comparisons to a peer group of funds consisting of the Fund and all mixed-asset target allocation growth funds underlying variable insurance products regardless of asset size or primary channel of distribution (the “Performance Universe”), and its benchmark index, each as classified and prepared by Lipper Inc., an independent evaluation service (“Lipper”); (ii) the investment process, portfolio holdings, investment restrictions, valuation procedures, and financial statements for the Fund; (iii) purchases and redemptions of the Fund’s shares; (iv) the general investment outlook in the markets in which the Fund invests; (v) arrangements with respect to the distribution of the Fund’s shares; (vi) the allocation and cost of the Fund’s brokerage (none of which was effected through any affiliate of the Adviser, including EULAV Securities LLC (the “Distributor”)); and (vii) the overall nature, quality and extent of services provided by the Adviser.
As part of their review, the Board requested, and the Adviser provided, additional information in order to evaluate the quality of the Adviser’s services and the reasonableness of its fees under the Agreement. In a separate executive session, the Independent Trustees reviewed information, which included data comparing: (i) the Fund’s management fee, transfer agent and custodian fees, Rule 12b-1 fee, and other non-management expenses, to those incurred by a peer group of funds consisting of the Fund and 10 other mixed-asset target allocation growth funds underlying variable insurance products, as selected objectively by Lipper (“Expense Group”), and a peer group of funds consisting of the Fund, the Expense Group and all other mixed-asset target allocation growth funds underlying variable insurance products with similar Rule 12b-1 and non-Rule 12b-1 structures (excluding outliers), as selected objectively by Lipper (“Expense Universe”); (ii) the Fund’s expense ratio to those of its Expense Group and Expense Universe; and (iii) the Fund’s investment performance over various time periods to the average performance of the Performance Universe as well as the appropriate Lipper index, as selected objectively by Lipper (the “Lipper Index”).
In their executive session, the Independent Trustees also reviewed information regarding: (a) the financial results and condition of the Adviser and the Distributor and their profitability from the services that have been performed for the Fund and the Value Line family of funds; (b) the Adviser’s investment management staffing and resources; (c) the ownership, control and day-to-day management of the Adviser; and (d) the Fund’s potential for achieving economies of scale. In support of its review of the statistical information, the Board was provided with a description of the methodology used by Lipper to determine the Expense Group, the Expense Universe and the Performance Universe to prepare its information.
The Board observed that there is a range of investment options available to shareholders of the Fund, including other mutual funds underlying their variable insurance product, and that the Fund’s shareholders have chosen to invest in the Fund.
The following summarizes matters considered by the Board in connection with its continuance of the Agreement. However, the Board did not identify any single factor as all-important or controlling, each Trustee may have weighed certain factors differently, and the summary does not detail all the matters that were considered.
Investment Performance. The Board reviewed the Fund’s overall investment performance and compared it to its Performance Universe and the Lipper Index. The Board noted that the Fund outperformed the Performance Universe average and the Lipper Index for the one-year, three-year, five-year and ten-year periods ended March 31, 2014.
| ¢ | Value Line Strategic Asset Management Trust |
| | |
| Semi-Annual Report |
The Adviser’s Personnel and Methods. The Board reviewed the background of the portfolio managers responsible for the daily management of the Fund’s portfolio, seeking to achieve the Fund’s investment objective and adhering to the Fund’s investment strategies. The Independent Trustees also engaged in discussions with the Adviser’s senior management responsible for the overall functioning of the Fund’s investment operations. The Board viewed favorably (i) the Adviser’s use of analytic tools in support of the portfolio management, compliance and shareholder relation functions which the Adviser previously committed resources to acquire, (ii) the low turnover of the Adviser’s staff attributable in part to its actions taken to attract and retain personnel, including its ongoing improvements to employee benefit programs and previous increases in base compensation and merit-based compensation for certain staff members to be more industry competitive, and (iii) that the Adviser continues to receive the Value Line ranking systems without cost. The Board concluded that the Fund’s management team and the Adviser’s overall resources were adequate and that the Adviser had investment management capabilities and personnel essential to performing its duties under the Agreement.
Management Fee and Expenses. The Board considered the Adviser’s management fee under the Agreement relative to the management fee applicable to the funds in the Expense Group and Expense Universe, both before and after applicable fee waivers. Before giving effect to fee waivers applicable to certain funds in the Expense Group, the Board noted that, for the most recent fiscal year for which audited financial data is available, the Fund’s management fee rate was lower than that of the Expense Group median. After giving effect to fee waivers applicable to certain funds, the Board also noted that, for the most recent fiscal year for which audited financial data is available, the Fund’s management fee rate was lower than that of both the Expense Group median and the Expense Universe median. The Board concluded that the Fund’s management fee rate was satisfactory for the purpose of approving continuance of the Agreement.
The Board also considered the Fund’s total expense ratio relative to its Expense Group and Expense Universe. The Distributor and the Board agreed that the Distributor will extend the existing contractual waiver of a portion of the Fund’s Rule 12b-1 fee for another one-year period ending June 30, 2015. This waiver effectively reduces the Fund’s Rule 12b-1 fee rate from 0.40% to 0.25% of the Fund’s average daily net assets. Such waiver cannot be changed during the contractual waiver period without the approval of the Board and the Distributor. The Board noted that, for the most recent fiscal year for which audited financial data is available, the Fund’s expense ratio was lower than that of the Expense Group median and the Expense Universe median, after giving effect to fee waivers applicable to the Fund and certain funds in the Expense Group and Universe. The Board concluded that the average expense ratio was satisfactory for the purpose of approving continuance of the Agreement.
Nature, Extent and Quality of Services. The Board considered the nature, extent and quality of other services provided by the Adviser and the Distributor. At meetings held throughout the year, the Board reviewed the resources and effectiveness of the Adviser’s overall compliance program, as well as the services provided by the Distributor. The Board viewed favorably the steps taken by the Adviser to enhance the portfolio management process, including the investment of the Fund’s cash balances, the additional resources devoted by the Adviser to enhance its and the Fund’s overall compliance program as well as steps being undertaken to enhance the shareholders’ experience with the Fund, such as a more robust website. The Board reviewed the services provided by the Adviser and the Distributor in supervising the Fund’s third party service providers. Based on this review, the Board concluded that the nature, quality, cost and extent of such other services provided by the Adviser and the Distributor were satisfactory, reliable and beneficial to the Fund’s shareholders.
Profitability. The Board considered the level of profitability of the Adviser and the Distributor with respect to the Fund individually and in the aggregate for all the funds within the Value Line group of funds, including the impact of the restructuring of the Adviser and Distributor in 2010 and certain actions taken during prior years. These actions included the reduction (voluntary in some instances, contractual or permanent in other instances) of management and/or Rule 12b-1 fees for certain funds, the Adviser’s termination of the use of soft dollar research, and the cessation of trading through the Distributor. The Board also considered the Adviser’s continued attention to the rationalization and differentiation of funds within the Value Line group of funds to better identify opportunities for savings and efficiencies among the funds. The Board concluded that the profitability of the Adviser and the Distributor with respect to the Fund, including the financial results derived from the Fund’s Agreement, was within a range the Board considered reasonable.
Other Benefits. The Board also considered the character and amount of other direct and incidental benefits received by the Adviser and the Distributor from their association with the Fund. The Board concluded that potential “fall-out” benefits that the Adviser and the Distributor may receive, such as greater name recognition, appear to be reasonable, and may in some cases benefit the Fund.
| ¢ | Value Line Strategic Asset Management Trust |
| | |
| Semi-Annual Report |
Economies of Scale. The Board considered that, given the current and anticipated size of the Fund, any perceived and potential economies of scale were not yet a significant consideration for the Fund and that the addition of break points to the fee structure was not currently necessary.
Fees and Services Provided for Other Comparable Funds/Accounts Managed by the Adviser. The Board was informed by the Adviser that the Adviser does not currently manage any non-mutual fund account that has similar objectives and policies as those of the Fund.
Conclusion. The Board examined the totality of the information it was provided at the meeting specifically addressing approval of the Agreement and at other meetings held during the past year and did not identify any single controlling factor. Based on its evaluation of all material factors deemed relevant and with the advice of independent counsel, the Board concluded that the rate at which the Fund pays a management fee to the Adviser under the Agreement does not constitute a fee that is so disproportionately large as to bear no reasonable relationship to the services rendered and that could not have been the product of arm’s-length bargaining. Further, the Board concluded that the Fund’s Agreement, and the management fee rate thereunder, is fair and reasonable and voted to continue the Agreement as in the best interest of the Fund and its shareholders.
| ¢ | Value Line Strategic Asset Management Trust |
The Trust files its complete schedule of portfolio holdings with the Securities and Exchange Commission (“SEC”) for the first and third quarters of each fiscal year on Form N-Q. The Trust’s Forms N-Q are available on the SEC’s website at http://www.sec.gov and may be reviewed and copied at the SEC’s Public Reference Room in Washington, D.C. Information on the operation of the Public Reference Room may be obtained by calling 1-800-SEC-0330.
A description of the policies and procedures that the Trust uses to determine how to vote proxies relating to portfolio securities, and information regarding how the Trust voted these proxies for the 12-month period ended June 30 is available through the Trust’s website at http://www.vlfunds.com and on the SEC’s website at http://www.sec.gov. The description of the policies and procedures is also available without charge, upon request, by calling 1-800-243-2729.
Item 5. Audit Committee of Listed Registrants
Not Applicable.
Item 6. Investments
Not Applicable
Item 7. Disclosure of Proxy Voting Policies and Procedures for Closed-End Management Investment Companies
Not Applicable
Item 8. Portfolio Managers of Closed-End Management Investment Companies
Not Applicable
Item 9. Purchases of Equity Securities by Closed-End Management Investment Company and Affiliated Purchasers
Not Applicable
Item 10. Submission of Matters to a Vote of Security Holders
Not Applicable
Item 11. Controls and Procedures.
| (a) | The registrant’s principal executive officer and principal financial officer have concluded that the registrant’s disclosure controls and procedures (as defined in rule 30a-2(c) under the Act (17 CFR 270.30a-2(c) ) based on their evaluation of these controls and procedures as of a date within 90 days of the filing date of this report, are appropriately designed to ensure that material information relating to the registrant is made known to such officers and are operating effectively. |
| (b) | The registrant’s principal executive officer and principal financial officer have determined that there have been no significant changes in the registrant’s internal controls or in other factors that could significantly affect these controls subsequent to the date of their evaluation, including corrective actions with regard to significant deficiencies and material weaknesses. |
Item 12. Exhibits.
| (a) | (1) Certification pursuant to Rule 30a-2(a) under the Investment Company Act of 1940 (17 CFR 270.30a-2) attached hereto as Exhibit 99.CERT. |
| | | |
| | | (2) Certification pursuant to Section 906 of the Sarbanes-Oxley Act of 2002 attached hereto as Exhibit 99.906.CERT. |
SIGNATURES
Pursuant to the requirements of the Securities Exchange Act of 1934 and the Investment Company Act of 1940, the registrant has duly caused this report to be signed on its behalf by the undersigned, thereunto duly authorized.
| By: | /s/ Mitchell E. Appel | |
| | Mitchell E. Appel, President |
| | | |
| Date: | September 9, 2014 | |
| | | |
| Pursuant to the requirements of the Securities Exchange Act of 1934 and the Investment Company Act of 1940, this report has been signed below by the following persons on behalf of the registrant and in the capacities and on the dates indicated. |
| | | |
| By: | /s/ Mitchell E. Appel | |
| | Mitchell E. Appel, President, Principal Executive Officer |
| | | |
| By: | /s/ Emily D. Washington | |
| | Emily D. Washington, Treasurer, Principal Financial Officer |
| | | |
| Date: | September 9, 2014 | |