0000820027us-gaap:PolicyholderAccountBalanceAboveGuaranteedMinimumCreditingRateRangeFrom0151AndGreaterMemberamp:PolicyholderAccountBalanceGuaranteedMinimumCreditingRateRangeFrom0400To0500Memberamp:NonIndexedAccountsOfFixedAnnuitiesMember2024-12-31
| | | | | | | | | | | | | | |
|
|
| UNITED STATES |
| SECURITIES AND EXCHANGE COMMISSION |
| WASHINGTON, D.C. 20549 |
| FORM | 10-K | |
| | | | | | | | | | | | | | |
| ☒ | ANNUAL REPORT PURSUANT TO SECTION 13 OR 15(d) OF THE SECURITIES EXCHANGE ACT OF 1934 |
| For the Fiscal Year Ended | December 31, 2024 |
| OR |
| ☐ | TRANSITION REPORT PURSUANT TO SECTION 13 OR 15(d) OF THE SECURITIES EXCHANGE ACT OF 1934 |
| For the Transition Period from_______________________to_______________________ |
| | | | | |
| Commission File No. | 1-32525 |
| | |
| AMERIPRISE FINANCIAL, INC. |
| (Exact name of registrant as specified in its charter) |
| | | | | | | | | | | | | | |
| Delaware | | 13-3180631 | |
| (State or other jurisdiction of incorporation or organization) | (I.R.S. Employer Identification No.) |
| | | | | | | | | | | | | | | | | | | | | | | | | | |
| 1099 Ameriprise Financial Center | | Minneapolis | | Minnesota | | 55474 | |
| (Address of principal executive offices) | (Zip Code) |
| | | | | | | | | | | | | | |
| Registrant’s telephone number, including area code: | (612) | 671-3131 | |
| | | | | | | | | | | | | | | | | | | | |
| Securities registered pursuant to Section 12(b) of the Act: |
| Title of each class | | Trading Symbol | | Name of each exchange on which registered | |
| Common Stock (par value $.01 per share) | AMP | New York Stock Exchange |
| | | | | | | | | | | | | | |
| Securities registered pursuant to Section 12(g) of the Act: None | |
| | | | | | | | | | | | | | |
| Indicate by check mark if the registrant is a well-known seasoned issuer, as defined in Rule 405 of the Securities Act. | Yes | ☒ | No | ☐ |
| | | | | | | | | | | | | | |
| Indicate by check mark if the registrant is not required to file reports pursuant to Section 13 or Section 15(d) of the Exchange Act. | Yes | ☐ | No | ☒ |
| | | | | | | | | | | | | | |
| Indicate by check mark whether the registrant (1) has filed all reports required to be filed by Section 13 or 15(d) of the Securities Exchange Act of 1934 during the preceding 12 months (or for such shorter period that the registrant was required to file such reports), and (2) has been subject to such filing requirements for the past 90 days. | Yes | ☒ | No | ☐ |
| | | | | | | | | | | | | | |
| Indicate by check mark whether the registrant has submitted electronically every Interactive Data File required to be submitted pursuant to Rule 405 of Regulation S-T (§232.405 of this chapter) during the preceding 12 months (or for such shorter period that the registrant was required to submit such files). | Yes | ☒ | No | ☐ |
| | | | | | | | | | | | | | | | | | | | | | | | | | | | | |
| Indicate by check mark whether the registrant is a large accelerated filer, an accelerated filer, a non-accelerated filer, smaller reporting company, or an emerging growth company. See the definitions of “large accelerated filer,” “accelerated filer,” “smaller reporting company,” and “emerging growth company” in Rule 12b-2 of the Exchange Act. |
| Large Accelerated Filer | ☒ | Accelerated Filer | ☐ | Non-accelerated Filer | ☐ | Smaller reporting company | ☐ | Emerging growth company | ☐ |
| | | | | |
| If an emerging growth company, indicate by check mark if the registrant has elected not to use the extended transition period for complying with any new or revised financial accounting standards provided pursuant to Section 13(a) of the Exchange Act. | ☐ |
| | | | | | | | | | | | | | |
| Indicate by check mark whether the registrant has filed a report on and attestation to its management’s assessment of the effectiveness of its internal control over financial reporting under Section 404(b) of the Sarbanes-Oxley Act by the registered public accounting firm that prepared or issued its audit report. | ☒ |
| | | | | |
| If securities are registered pursuant to Section 12(b) of the Act, indicate by check mark whether the financial statements of the registrant included in the filing reflect the correction of an error to previously issued financial statements. | ☐ |
| | | | | |
| Indicate by check mark whether any of those error corrections are restatements that required a recovery analysis of incentive-based compensation received by any of the registrant’s executive officers during the relevant recovery period pursuant to §240.10D-1(b). | ☐ |
| | | | | | | | | | | | | | |
| Indicate by check mark whether the registrant is a shell company (as defined in Rule 12b-2 of the Exchange Act). | Yes | ☐ | No | ☒ |
The aggregate market value, as of June 30, 2024, of voting shares held by non-affiliates of the registrant was approximately $42.0 billion.
| | | | | | | | | | | | | | |
| Indicate the number of shares outstanding of each of the registrant’s classes of common stock, as of the latest practicable date. |
| Class | | Outstanding at February 7, 2025 | |
| Common Stock (par value $.01 per share) | 96,118,499 shares |
DOCUMENTS INCORPORATED BY REFERENCEPart III: Portions of the registrant’s Proxy Statement to be filed with the Securities and Exchange Commission in connection with the Annual Meeting of Shareholders to be held on April 30, 2025 (“Proxy Statement”).
Ameriprise Financial, Inc.
FORM 10-K
INDEX
Ameriprise Financial, Inc.
PART I.
Item 1. Business
Overview
Ameriprise Financial, Inc. is a diversified financial services company with a 130-year history of providing solutions to help clients confidently achieve their financial objectives. Ameriprise Financial, Inc. is a holding company incorporated in Delaware that primarily engages in business through its subsidiaries. Accordingly, references to “Ameriprise,” “Ameriprise Financial,” the “Company,” “we,” “us,” and “our” may refer to Ameriprise Financial, Inc. exclusively, to our entire family of companies, or to one or more of our subsidiaries.
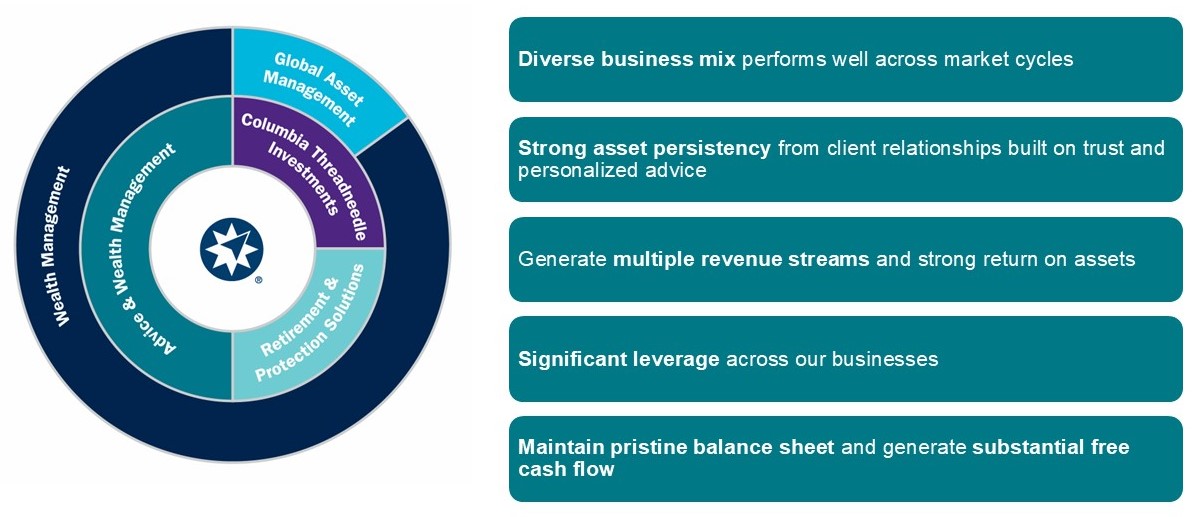
We are a long-standing leader in financial planning and advice offering a broad range of products and services designed to assist individual and institutional clients achieve their financial objectives. Our strategy is centered on helping clients confidently achieve their goals by providing holistic advice and by managing and protecting their assets and income. We utilize two go-to-market approaches in carrying out this strategy: Wealth Management and Asset Management.
Wealth Management
Our wealth management business is the primary growth engine of Ameriprise with a significant market opportunity. We are in a compelling position to capitalize on significant demographic and market trends driving increased demand for financial advice and solutions. In the United States (“U.S.”), the ongoing transition of baby boomers into retirement, as well as younger generations currently building their wealth and planning for retirement, continues to drive demand for financial advice and solutions. Our primary target market is households with $500,000 to $5,000,000 in investable assets. We are also well-suited to serve those outside this asset range as we also offer products and services designed for higher-net worth households.
We are an industry-leading wealth manager with a differentiated advice value proposition. Our network of more than 10,000 financial advisors (our “advisors”) is the primary channel through which we carry out our wealth management activities. Our capabilities are centered on establishing long-term personal relationships between clients and advisors. Through our affiliated advisors, we offer financial planning and advice, cash management and banking products, and full-service brokerage services, primarily to retail clients.
Our branded advisor force is among the largest in the industry and is central to how we serve our clients. We support our advisors with an integrated technology platform, training, leadership and marketing programs to assist them in serving clients and growing their practices. Our nationally recognized brand, combined with these programs and other support, creates a compelling value proposition for financial advisors relative to the broader financial services industry. This is evidenced by our strong advisor retention and satisfaction and our ability to attract and retain experienced and productive advisors. We continuously invest in, develop, and refine capabilities and tools designed to maximize advisor productivity and client satisfaction.
We design products and services as solutions for clients’ cash and liquidity, asset accumulation, retirement, protection, income generation and disbursement and estate and wealth transfer needs. The financial solutions we offer through our advisors include our own products and services as well as other providers’ products. We distribute our life and disability income insurance, as well as annuity products, through our advisor channel under the RiverSource® brand.
Asset Management
Our global asset management business, represented by the Columbia Threadneedle Investments® brand, offers a broad spectrum of capabilities to individual, institutional and high net worth investors. Columbia Threadneedle® investment products are primarily offered through third parties, though we also provide our asset management products through our advisor network, direct retail and through our institutional sales force. Our underlying asset management philosophy is rooted in delivering consistently strong, competitive investment performance.
We are positioned to grow our assets under management and advisement and strengthen our asset management offerings to existing and new clients. We benefit from key strategic relationships we have established and have a strong institutional presence. Our asset management capabilities are designed to address mature markets in the U.S. and Europe while expanding into new global and emerging markets. We have expanded beyond our traditional strengths in the U.S. and the United Kingdom (“U.K.”) to serve more clients and gather assets worldwide. We continue to pursue opportunities to leverage the collective capabilities of our global asset management business in order to enhance our investment solutions and to develop new solutions that are responsive to client demand in an increasingly complex and competitive marketplace.
History and Development
Our company has provided solutions to help clients confidently achieve their financial objectives for 130 years. Our earliest predecessor company, Investors Syndicate, was founded in 1894 to provide face-amount certificates to consumers. In 1983, our company was formed as a Delaware corporation in connection with American Express’ acquisition of IDS Financial Services from Alleghany Corporation. We changed our name to “American Express Financial Corporation” (“AEFC”) and began marketing our
Ameriprise Financial, Inc.
products and services under the American Express brand in 1994. In 2005, AEFC spun off from American Express to form Ameriprise Financial, Inc.
We have grown both organically through the products and services we provide, as well as inorganically through strategic acquisitions. This has allowed us to significantly enhance the scale, performance, and product offerings of our brokerage, financial planning, managed accounts, retail mutual fund and institutional asset management businesses to best serve clients. Our acquisitions have included, among others, Threadneedle Asset Management Holdings, H&R Block Financial Advisors, Inc., J. & W. Seligman & Co. Incorporated, Columbia Management, Investment Professionals, Inc., and, most recently, BMO Financial Group’s European-based asset management business. Beyond traditional acquisitions, we pursue other strategies to grow our wealth management business such as experienced advisor recruiting, practice acquisitions, advisor loans, and partnerships with banks and credit unions.
Over the years, we have also sought to optimize the organizational structure in which we offer certain banking products. In May 2019, we converted Ameriprise National Trust Bank to Ameriprise Bank, FSB (“Ameriprise Bank”) to expand the products and services we provide directly to our clients. At that time, Ameriprise Financial became a savings and loan holding company subject to regulation, supervision and examination by the Board of Governors for the Federal Reserve System (“FRB”), and Ameriprise Financial elected to be classified as a financial holding company subject to applicable regulation under the Bank Holding Company Act of 1956, as amended.
Our Business Mix and Integrated Model
The financial results from the businesses underlying our go-to-market approaches are reflected in our operating segments:
•Advice & Wealth Management;
•Asset Management;
•Retirement & Protection Solutions; and
•Corporate & Other.
As a diversified financial services firm, we believe our ability to gather and retain assets is best measured by our aggregate assets under management and administration metric. As of December 31, 2024, we had $1.5 trillion in assets under management, administration, and advisement, compared to $1.4 trillion as of December 31, 2023. For a more detailed discussion of assets under management, administration, and advisement, see “Management’s Discussion and Analysis of Financial Condition and Results of Operations” included in Part II, Item 7 of this Annual Report on Form 10-K.
Ameriprise Financial, Inc.
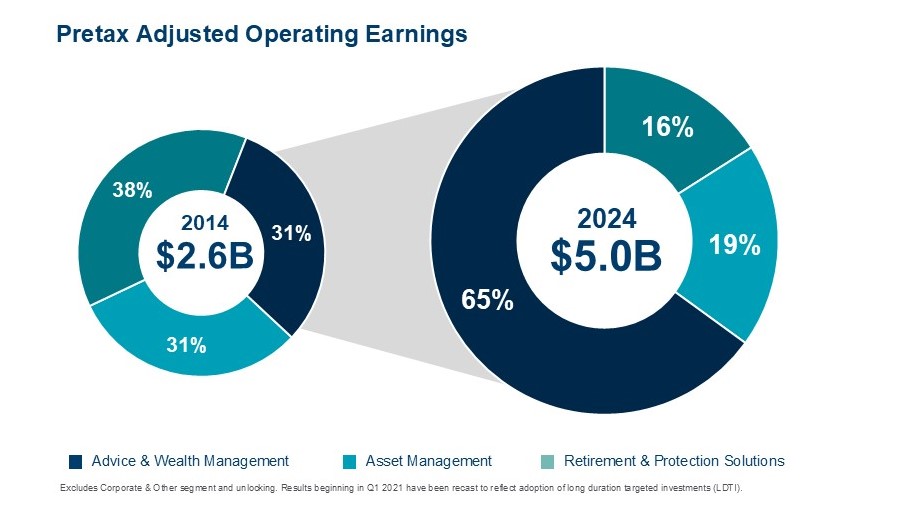
We continue to execute on our strategy to grow our Advice & Wealth Management business with complementary Asset Management and Retirement & Protection Solutions businesses. Our integrated model leverages key business linkages to drive growth and consistency across market cycles. The following chart shows our current business mix represented by the contributions of each segment to our pretax adjusted operating earnings (excluding Corporate & Other segment) as well as a historical comparison.
Our Principal Brands
Our diversified products and services are offered through our brands:
| | | | | |
|
We use the Ameriprise Financial® brand as our enterprise brand, as well as the name of our advisor network and certain of our retail products and services. |
| Our global Columbia Threadneedle® and Columbia Threadneedle Investments® brands represent the combined capabilities, resources and reach of Columbia Management Investment Advisers, LLC (including its subsidiaries, “Columbia Management”), other U.S.-based entities and Threadneedle. The foreign operations of Ameriprise Financial, Inc. are conducted primarily through Columbia Threadneedle Investments UK International Limited, TAM UK International Holdings Limited and Ameriprise Asset Management Holdings Singapore (Pte.) Ltd. and their respective subsidiaries (collectively, “Threadneedle”). |
| We use our RiverSource® brand for our annuity and protection products issued by RiverSource Life Insurance Company (“RiverSource Life”) and RiverSource Life Insurance Co. of New York (“RiverSource Life of NY” and, together with RiverSource Life, the “RiverSource Life companies” or “RiverSource”). |
Our Segments - Advice & Wealth Management
We provide financial planning and advice, as well as full-service brokerage services, primarily to retail clients through our financial advisors. These services are centered on long-term, personal relationships between our advisors and our clients and focus on helping clients confidently achieve their financial goals. Our financial advisors provide a distinctive, holistic approach to financial planning and have access to a broad selection of both our and other providers’ products to help clients meet their financial needs and goals. Banking, lending, and cash management solutions help clients establish financial flexibility while planning for both short and long-term needs. As part of our goal-based approach to financial advice, our advisors help clients actively manage investing, saving and spending so they have a more complete financial picture.
Ameriprise Financial, Inc.
A significant portion of revenues in this segment are fee-based and driven by the level of client assets, which is impacted by both market movements and net flows. We also earn revenue and income through other sources, including the following:
•We earn net investment income on owned assets from Ameriprise Certificate Company (“ACC”) and Ameriprise Bank, both wholly owned subsidiaries of Ameriprise.
•We earn financial planning fees as well as transaction and other fees.
•We earn distribution fees for providing non-affiliated products and intersegment revenues for providing our affiliated products and services to our retail clients. Intersegment expenses for this segment include investment management services provided by our Asset Management segment. All intersegment activity is eliminated in our consolidated results.
Our Financial Advisor Platform
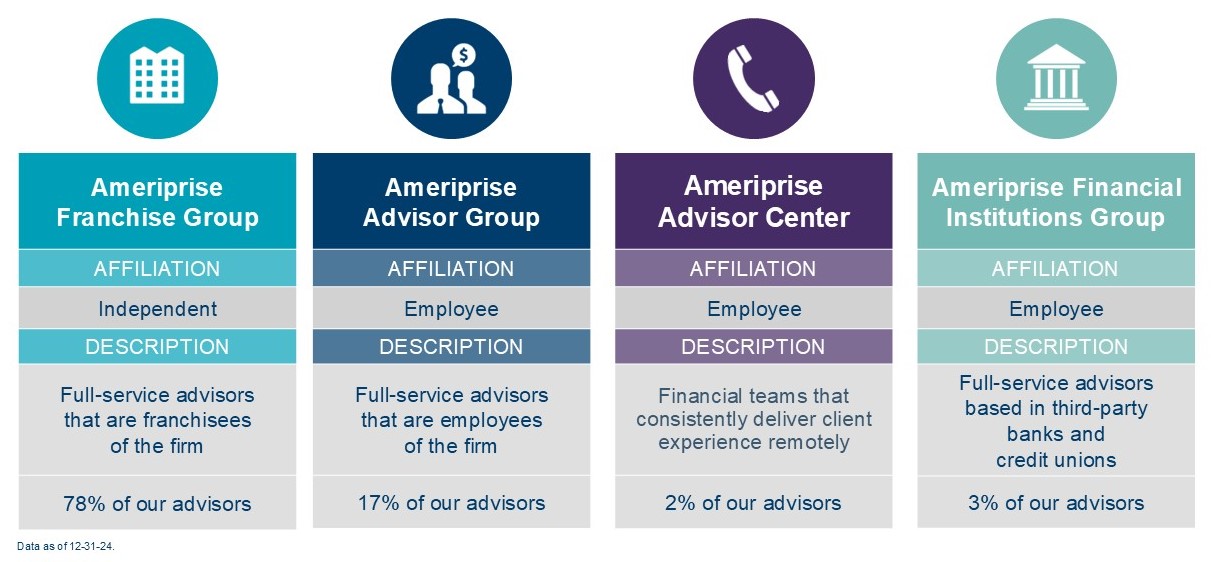
With more than 10,000 advisors, we are one of the top branded advisor platforms in the U.S. market. Advisors can choose to affiliate with us in multiple ways as noted below, and each option offers different levels of support and compensation.
We offer the following products and services through our Advice & Wealth Management segment:
•Financial planning and advice services to provide personalized financial planning and financial solutions for which we charge fees and may receive sales commissions for selling products that aid in our clients’ plans.
•Discretionary and non-discretionary investment advisory accounts (also known as managed accounts) for which we receive fees based on the assets held in that account, as well as related fees or costs associated with the underlying securities held in that account.
•Brokerage products and services for retail and institutional clients.
•Cash management and banking products, including brokerage sweep programs, cash management accounts, savings accounts, residential mortgage loans, credit cards, margin loans and pledged asset lines of credit.
•Face-amount certificates through ACC.
•Mutual fund offerings from our Columbia funds as well as approximately 130 unaffiliated mutual fund families, representing approximately 2,125 mutual funds on our brokerage platform for which mutual fund families and other companies generally pay us a portion of the revenue generated from sales of those funds, administrative fees, and fees from the ongoing management attributable to our clients’ ownership in the fund.
•Insurance and annuities products from both RiverSource Life companies as well as third parties, and we receive a portion of the revenue generated from the sale of unaffiliated products and certain administrative fees.
Our Segments - Asset Management
Through Columbia Threadneedle, we provide investment management, advice and products to retail, high net worth and institutional clients on a global scale.
Columbia Management primarily provides products and services in the U.S. Threadneedle primarily provides products and services internationally.
Ameriprise Financial, Inc.
Revenues in the Asset Management segment are primarily earned based on managed asset balances, which are impacted by market movements, net asset flows, asset allocation and product mix. We may also earn performance fees from certain accounts where investment performance meets or exceeds certain pre-identified targets. As of December 31, 2024, our Asset Management segment had $681 billion in managed and advised assets.
Our Asset Management segment also provides asset management services for Ameriprise Financial subsidiaries. The fees for such services are reflected within the Asset Management segment results through intersegment transfer pricing. Intersegment expenses for this segment include distribution expenses for services provided by our Advice & Wealth Management and Retirement & Protection Solutions segments. All intersegment activity is eliminated in our consolidated results.
Managed assets include external client assets and owned assets. Managed external client assets include client assets for which we provide investment management services, such as the assets of the Columbia Threadneedle Investments fund families and the assets of institutional clients. Managed external client assets also include assets managed by sub-advisers we select but do not include client assets that we advise on a non-discretionary basis such as those assets where we provide voting recommendations and engagement services but do not manage the underlying assets. Our external client assets are not reported on our Consolidated Balance Sheets, although certain investment funds marketed to investors may be consolidated at certain times. See Note 2 and Note 5 to our Consolidated Financial Statements included in Part II, Item 8 of this Annual Report on Form 10-K for additional information on consolidation principles and details regarding the consolidated collateralized loan obligations (“CLOs”). Managed owned assets include certain assets on our Consolidated Balance Sheets (such as the assets of the general account, cash balances invested by Ameriprise Bank and from certificate products, and the variable product funds held in the separate accounts of RiverSource Life companies) for which the Asset Management segment provides management services and receives management fees. For additional details regarding our assets under management and administration, see “Management’s Discussion and Analysis of Financial Condition and Results of Operations” included in Part II, Item 7 of this Annual Report on Form 10-K.
Investment Management Capabilities and Products
Our investment management business has a presence in 16 key markets globally, including France, Germany, Luxembourg, the Netherlands, Singapore, the U.K. and the U.S.
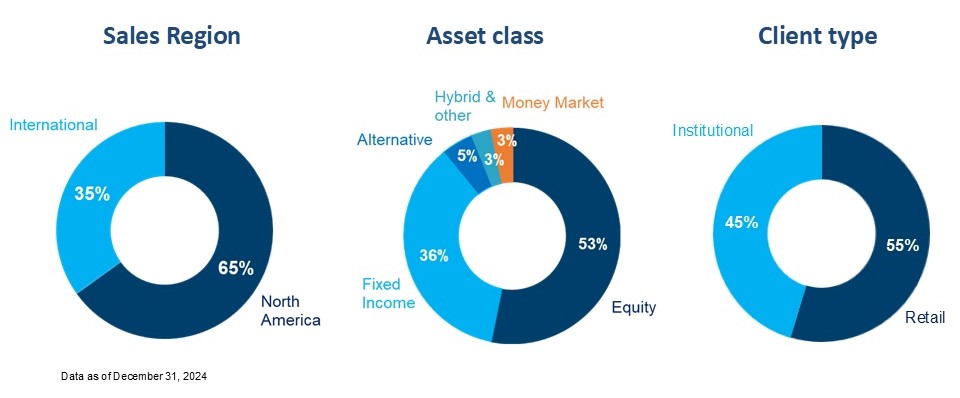
Our investment management capabilities and products span a broad range of asset classes and investment styles to meet a variety of client needs with our $645 billion in assets under management diversified across geographies, strategies and clients as depicted in the graphic below.
Ameriprise Financial, Inc.
We offer or make available the following products and services through our Asset Management segment with a range of investment strategies across these different vehicles and accounts:
•U.S. registered funds through the Columbia Management family of funds, including retail mutual funds, exchange-traded funds and U.S. closed-end funds and variable insurance trust funds (“VIT Funds”) on which we earn management fees based on the underlying value of the assets and service fees.
•Non-U.S. retail focused funds through Columbia Threadneedle, which include different risk-return options across regions, markets, asset classes and product structures, including retail funds that are similar to U.S. mutual funds (such as Undertakings for the Collective Investment in Transferable Securities (“UCITS”) funds organized as Luxembourg-based investment companies with variable capital (“SICAVs”) and Irish and U.K. open-end investment companies (“OEICs”)). In addition, this also includes a range of listed Investment Trusts.
•European-based pooled investment funds designed for pensions, insurance companies and other institutional investors seeking solutions for liability or balance sheet asset management (“Liability Driven Investment” or “LDI”).
•Institutional and retail separately managed accounts for a range of clients, including pension, profit-sharing, employee savings, sovereign wealth funds and endowment funds, accounts of large- and medium-sized businesses and governmental clients, as well as the accounts of high net worth individuals and smaller institutional clients, including tax-exempt and not-for-profit organizations for which we receive management and performance-related fees.
•Other separately managed accounts, including those offered through models that represent assets under advisement, for which we earn asset management fees based on model delivery assets under advisement.
•Management of owned assets such as assets held in the general account of our RiverSource Life companies, ACC and Ameriprise Bank.
•Management of CLOs, which includes providing collateral management services to special purpose vehicles that primarily invest in syndicated bank loans and issue multiple tranches of securities collateralized by the assets for which we earn fees based on the value of assets and performance-based fees.
•Private funds of various types where we provide investment management and related services to private, pooled investment vehicles organized as limited partnerships, limited liability companies, or other entities for which we may receive fees based on the value of the assets or performance-based fees.
•Collective funds and separately managed accounts sponsored by Ameriprise Trust Company (“ATC”), a wholly owned subsidiary, and offered to certain qualified institutional clients such as retirement, pension, and profit-sharing plans for which we receive management fees.
•Sub-advised accounts for certain U.S. and non-U.S. funds, private banking individually managed accounts, common trust funds, and other portfolios sponsored or advised by other firms for which we earn management fees and performance-based fees.
Distribution
We maintain distribution teams and capabilities that aid the sales, marketing, and support of the products and services of our global asset management business. These distribution activities are generally organized into two major categories: retail distribution and institutional/high net worth distribution. However, alternatives and certain other areas have a level of specialized distribution.
Our Segments - Retirement & Protection Solutions
RiverSource solutions are available within the Ameriprise client experience and Confident Retirement® approach. We offer clients annuities, life insurance and disability income insurance products to meet their needs or current stage in life—whether that is covering essentials, ensuring lifestyle, preparing for the unexpected or leaving a legacy. RiverSource seeks to partner with our advisors to address clients’ goals and long-term needs at a differentiated level and provide a strong risk profile.
Retirement Solutions
Through our advisors, we provide RiverSource annuity products to help clients address their asset accumulation and income goals. Our advisor network is the only distributor of new RiverSource annuity products, although our advisors offer fixed, variable, and structured annuities from selected unaffiliated insurers. As part of the continued evolution of the business model for our Retirement & Protection Solutions segment, we focus on the accumulation solutions clients want (such as the structured variable annuity, a registered index-linked annuity).
Revenues for our variable annuity products are primarily earned as fees based on a contractholder’s benefit base, contract value or separate account values, which is impacted by both market movements and net asset flows. We also earn net investment income on general account assets supporting reserves for non-life contingent payout annuities, structured variable annuities, certain guaranteed benefits and fixed investment options offered with variable annuities, and on capital supporting the business. In addition, we receive fees charged on assets allocated to our separate accounts to cover administrative costs and a portion of the management fees from the underlying investment accounts in which assets are invested. Revenues for our payout annuities with a life contingent feature are earned as premium revenue. Intersegment revenues for this segment reflect fees paid by our Asset Management segment for marketing support and other services provided in connection with the availability of VIT Funds. Intersegment expenses for this segment include
Ameriprise Financial, Inc.
distribution expenses for services provided by our Advice & Wealth Management segment, as well as expenses for investment management services provided by our Asset Management segment. All intersegment activity is eliminated in our consolidated results.
Protection Solutions
We provide life and disability income insurance products to address the protection and risk management needs of our retail clients. New RiverSource insurance products are exclusively offered through our advisor network. Our advisors also offer insurance products of unaffiliated carriers. The primary sources of revenues for our protection business are premiums, fees, and charges we receive to assume insurance-related risk. We earn net investment income on owned assets supporting insurance reserves and on capital supporting the business. We also receive fees based on the level of the RiverSource Life companies’ separate account assets supporting variable universal life investment options. The protection products earn intersegment revenues from fees paid by our Asset Management segment for marketing support and other services provided in connection with the availability of VIT Funds under the variable universal life contracts. Intersegment expenses for the protection products include distribution expenses for services provided by our Advice & Wealth Management segment, as well as expenses for investment management services provided by our Asset Management segment. All intersegment activity is eliminated in our consolidated results.
Products
We currently offer the following RiverSource Life products:
•Variable annuities that provide returns linked to underlying investments of the contractholder’s choice of certain funds, as well as additional benefits, such as guaranteed minimum death benefits (but without living benefits for new sales after mid-2022).
•Structured variable annuities that use the performance of an underlying equity market index to determine earnings, subject to either a cap or floor.
•Variable universal life insurance that provides life insurance coverage along with investment returns linked to underlying investment accounts of the policyholder’s choice.
•Universal life insurance that credits interest at fixed interest rates. Universal life insurance may also contain product features that credit interest at a rate linked to an underlying equity market index.
•Term life insurance that provides a death benefit, but does not accumulate cash value.
•Disability income insurance that provides monthly benefits to individuals who are unable to earn income either at their occupation at time of disability or at any suitable occupation for premium payments that are guaranteed not to change.
Our sales of RiverSource individual life insurance in 2024, as measured by scheduled annual premiums, lump sum and excess premiums and single premiums, consisted of approximately 96% variable universal life, 1% universal life and 3% term life.
Reinsurance
We reinsure a portion of the insurance risks associated with our currently offered life and disability income products (as well as previously sold fixed annuity, fixed indexed annuity, life contingent payout annuity and long term care products) through reinsurance agreements with unaffiliated reinsurance companies. We use reinsurance to limit losses, reduce exposure to large risks and provide additional capacity for continued product offerings. To manage exposure to losses from reinsurer insolvencies, we evaluate the financial condition of reinsurers prior to entering into new reinsurance treaties and on a periodic basis during the terms of the treaties. Our RiverSource Life companies remain primarily liable as the direct insurers on all risks reinsured. See Note 7 and Note 8 to our Consolidated Financial Statements included in Part II, Item 8 of this Annual Report on Form 10-K for additional information on reinsurance. At a general level, we reinsure some or all of the following (with the closed blocks in our Corporate & Other segment):
| | | | | | | | |
| Product | | Reinsurance Type |
| Term Life and Disability Income | | Coinsurance |
| Universal Life & Variable Universal Life | | Renewable Term |
| Life Contingent Payout Annuity | | Coinsurance |
| Fixed Annuity (closed block in Corporate & Other) | | Coinsurance |
| Long Term Care (closed block in Corporate & Other) | | Coinsurance |
Our Segments - Corporate & Other
Our Corporate & Other segment consists of closed blocks of business and net investment income or loss on corporate level assets, including excess capital held in our subsidiaries and other unallocated equity and other revenues as well as unallocated corporate expenses.
Closed Block Long Term Care Insurance
Prior to December 31, 2002, the RiverSource Life companies underwrote stand-alone long term care (“LTC”) insurance. We discontinued offering LTC insurance as of December 31, 2002. A large majority of our closed block LTC is comprised of nursing home indemnity LTC or comprehensive reimbursement LTC. Generally, our policyholders are eligible for LTC benefits if they become cognitively impaired or unable to perform certain activities of daily living.
Ameriprise Financial, Inc.
Nursing home indemnity LTC policies provide a predefined daily benefit if the insured is confined to a nursing home, subject to various maximum benefit periods, regardless of actual expenses of the policyholder. Our older generation nursing home indemnity LTC policies were primarily written between 1989 through 1999 and represent nearly one half of our policies.
Comprehensive reimbursement LTC policies provide a predefined maximum daily benefit if the insured is confined to a nursing home and covers a variety of LTC expenses, including assisted living, home and community care, adult day care and similar placement programs, subject to various maximum total benefit payment pools, on a cost-reimbursement basis. Our second-generation comprehensive reimbursement LTC policies were written from 1997 until 2002.
Our closed block of LTC policies was sold on a guaranteed renewable basis which allows us to re-price in force policies, subject to regulatory approval. Premium rates for LTC policies vary by age, benefit period, elimination period, home care coverage and benefit increase option. Premium rates are based on assumptions concerning morbidity, mortality, persistency, administrative expenses, investment income and profit. We develop our assumptions based on our own claims and persistency experience. In line with the market, we have pursued nationwide premium rate increases for many years and expect to continue to pursue rate increases over the next several years. In general, since very little of our LTC business is subject to rate stability regulation, we have historically followed a policy of pursuing smaller, more frequent increases in order to align policyholder and historic shareholder objectives but modified our approach in 2019 to seek larger increases as an additional method to manage our LTC business. We also provide policyholders with options to reduce their coverage to lessen or eliminate the additional financial outlay that would otherwise result.
For existing LTC policies, RiverSource Life has continued ceding 50% of the risk on a coinsurance basis to subsidiaries of Genworth Financial, Inc. (“Genworth”) and retains the remaining risk. For RiverSource Life of NY, this reinsurance arrangement applies for 1996 and later issues only. Under these agreements, we have the right, but never the obligation, to recapture some, or all, of the risk ceded to Genworth.
For more information regarding LTC, see “Management’s Discussion and Analysis of Financial Condition and Results of Operations – Corporate & Other” included in Part II, Item 7 of this Annual Report on Form 10-K.
Closed Block Fixed Annuities
In 2020, we discontinued new sales of fixed annuities and moved the Fixed Annuities and Fixed Indexed Annuities blocks to the Corporate & Other segment as a closed block. In this closed block, as of December 31, 2024, we have $5.7 billion of account value associated with our fixed annuities of which 89% has been ceded by RiverSource Life on a coinsurance basis to Global Atlantic Financial Group’s subsidiary Commonwealth Annuity and Life Insurance Company (“Commonwealth”) under customary reinsurance arrangements with a comfort trust. For the ceded policies, RiverSource Life ceded 100% of the risk on a coinsurance basis.
Competition
We operate in a highly competitive global industry. As a diversified financial services firm, we compete directly with a variety of financial institutions, including registered investment advisers, securities brokers, asset managers, banks and insurance companies. We directly compete for the provision of products and services to clients, as well as for our financial advisors and investment management personnel. Certain of our competitors offer web-based or mobile-based financial services and discount brokerage services, usually with lower levels of service, to individual clients, and we increasingly compete with various financial technology companies.
Our Advice & Wealth Management segment competes with securities broker-dealers, independent broker-dealers, financial planning firms, registered investment advisers, insurance companies and other banks and financial institutions to attract and retain financial advisors and clients. Competitive factors influencing our ability to attract and retain financial advisors include compensation structures, brand recognition and reputation, product offerings and innovation, growth opportunities, and technology and service capabilities and support. Further, our financial advisors compete for clients with a range of other advisors, broker-dealers and direct channels. This includes wirehouses, regional broker-dealers, independent broker-dealers, insurers, banks, asset managers, registered investment advisers and direct distributors. Competitive factors influencing our ability to attract and retain clients include quality of advice provided, price, reputation, advertising and brand recognition, product offerings, technology offerings for clients and advisors and service quality.
Our Asset Management segment competes on a global basis against a substantial number of firms to acquire and retain managed and administered assets, including firms in the categories listed above. Competitive factors influencing our performance in this industry include investment performance, product offerings and innovation, product ratings, fee structures, advertising, technology and service quality, brand recognition, reputation and the ability to attract and retain investment personnel. Furthermore, changes in investment preferences or investment management strategy (for example, “active” or “passive” investing styles), client interest in funds with particular environmental, social, or governance practices, client or regulatory requirements on use of client commissions for research, and downward pressure on fees may present various challenges to our business and could cause clients to favor certain competitors. The impact of these factors on our business may vary from country to country and certain competitors may have competitive advantage in certain jurisdictions.
Competitors of our Retirement & Protection Solutions segment consist of both stock and mutual insurance companies. Competitive factors affecting the sale of variable annuity and insurance products include distribution capabilities, price, product features and innovation, hedging capability, investment performance, commission structure, reinsurance availability and pricing, perceived
Ameriprise Financial, Inc.
financial strength and financial strength ratings, claims-paying ratings, technology and service, advertising, brand recognition and financial strength ratings from rating agencies.
Human Capital Management
Ameriprise Financial has a strong values-driven and inclusive culture that is the foundation of all that we do. While our individual business lines serve different client needs, we have a common vision and values that drive our business and how we work with clients and each other.
Our values are the following:
•Client focused;
•Integrity always;
•Excellence in all we do; and
•Respect for the individuals and for the communities in which we live and work.
To ensure our long-term success, we must continue to attract, retain, engage and develop a high-performing workforce. We are committed to providing an excellent employee and advisor experience for our global workforce. This includes approximately 13,600 employees, including our corporate employees and employee financial advisors. We have approximately 8,200 non-employee advisors who choose to affiliate with us through our franchise advisor group.
Leadership skills and development of all our employees are core to our culture and history. We continue to invest in the development of our leaders and employees with a comprehensive and modern learning strategy to help them grow and achieve their career potential at Ameriprise. We work closely with leaders to prioritize organizational stewardship, leadership excellence and operating effectiveness as we executed our business plans.
We continually invest in our human capital programs and capabilities to ensure a highly competitive employee value proposition. We seek to offer a comprehensive and competitive total rewards program that supports our employees in their overall financial and personal health and well-being. Our total rewards programs are designed to attract, retain, and motivate employees and align their pay outcomes to the achievement of the organization and business unit results, in addition to their individual performance. Weighing both individual goal achievement (the “what”) and leadership performance (the “how”) is critical to driving strong business results. We have a competitive total compensation approach that includes base salary, annual cash awards and long-term incentives, as well as a comprehensive benefits strategy for employees that focuses on physical, social, emotional and financial wellness. We have enhanced our employee value proposition and framework so that current and prospective employees better understand and appreciate the investments we make in them, including our culture, compensation and benefits, well-being, work environment and career development.
Our Board of Directors engages in these topics and annually reviews our senior executive succession plans and broader talent development approach in support of our corporate strategy, and frequently discusses human capital topics at its meetings. The Board and the Compensation and Benefits Committee are regularly updated on topics impacting our workforce and dedicate time to reviewing and discussing our company culture, talent development, retention and recruiting initiatives, and engagement survey feedback.
In 2024, our strong corporate culture yielded the following results:
•Our overall employee engagement remains strong at 84% favorable - exceeding external benchmarks with key strengths in the categories of integrity, leader effectiveness, respect, and client focus. Consistent with prior years, we had strong input with 93% of employees participating in the survey.
•We prioritize professional development, and in 2024, we introduced an enhanced learning curriculum to support leadership excellence across the firm. Over 90% of our global people leaders participated in these leadership development programs. In addition, we invested in a comprehensive modern learning platform for all employees to ensure they have access to relevant curriculum to help support their growth and career development, while still prioritizing our annual compliance training.
•In addition to recruiting talented professionals to join Ameriprise, we retained 95% of our high-performing employees.
•Within our advisor force, the retention rate among affiliated advisors who have been with us for more than 10 years remained strong at 94%.
•We have also continued to attract experienced, productive advisors, with 278 experienced advisors moving their practices to Ameriprise in 2024 and approximately 1,691 over the last 5 years.
Our vision is to continue to foster an inclusive culture where everyone at Ameriprise can belong, grow and contribute to realize their potential and deliver value for our clients, community and shareholders. We ensure employees and advisors understand the goals and needs of our diverse client base and deliver on our value proposition to meet those needs. And we provide the tools, resources and leadership to support them. Our global workforce is comprised of 40% women and, among our U.S. based employees, 22% are ethnically diverse. In our Inclusion Index from our employee engagement survey, we achieved a score of 84% in 2024, which exceeds the industry benchmark.
Ameriprise Financial, Inc.
Our focus on fostering an inclusive culture is also reflected in the policies and practices that promote a safe, inclusive and respectful workplace. Our 13 global business resource networks, with over 23,000 employee engagements, are open to everyone and provide opportunities for connection, community and career development, supporting business growth.
In an evolving and highly competitive industry, we have continued to successfully execute on our strategy while delivering solid performance, reflecting the strength and resiliency of our values-based, inclusive culture and the effectiveness of our human capital strategy.
Intellectual Property
We rely on a combination of contractual rights and copyright, trademark, and patent registrations and trade secret laws to establish and protect our intellectual property. In the U.S. and other jurisdictions, we have established and registered, or filed applications to register, certain trademarks and service marks that we consider important to the marketing of our products and services, including but not limited to the Ameriprise Financial, Threadneedle, RiverSource, Columbia Threadneedle and Columbia Threadneedle Investments brands.
Enterprise Risk Management
Enterprise risk management and our risk management program is an important component in how we manage our business. All operating subsidiaries of Ameriprise must comply with our enterprise risk management policy and framework, which: (i) establishes a structure for effective enterprise risk management, including oversight and governance; (ii) delineates key constituent roles and responsibilities; and (iii) imposes a number of core risk management processes. The enterprise risk management policy is designed to manage risks that may impact Ameriprise, including capital, credit, market, liquidity, operational, strategic, reputational, legal and compliance, and product. The enterprise risk management policy is supported by underlying risk policies at business units that provide further detail on the business unit’s risk governance, appetite, and tolerance.
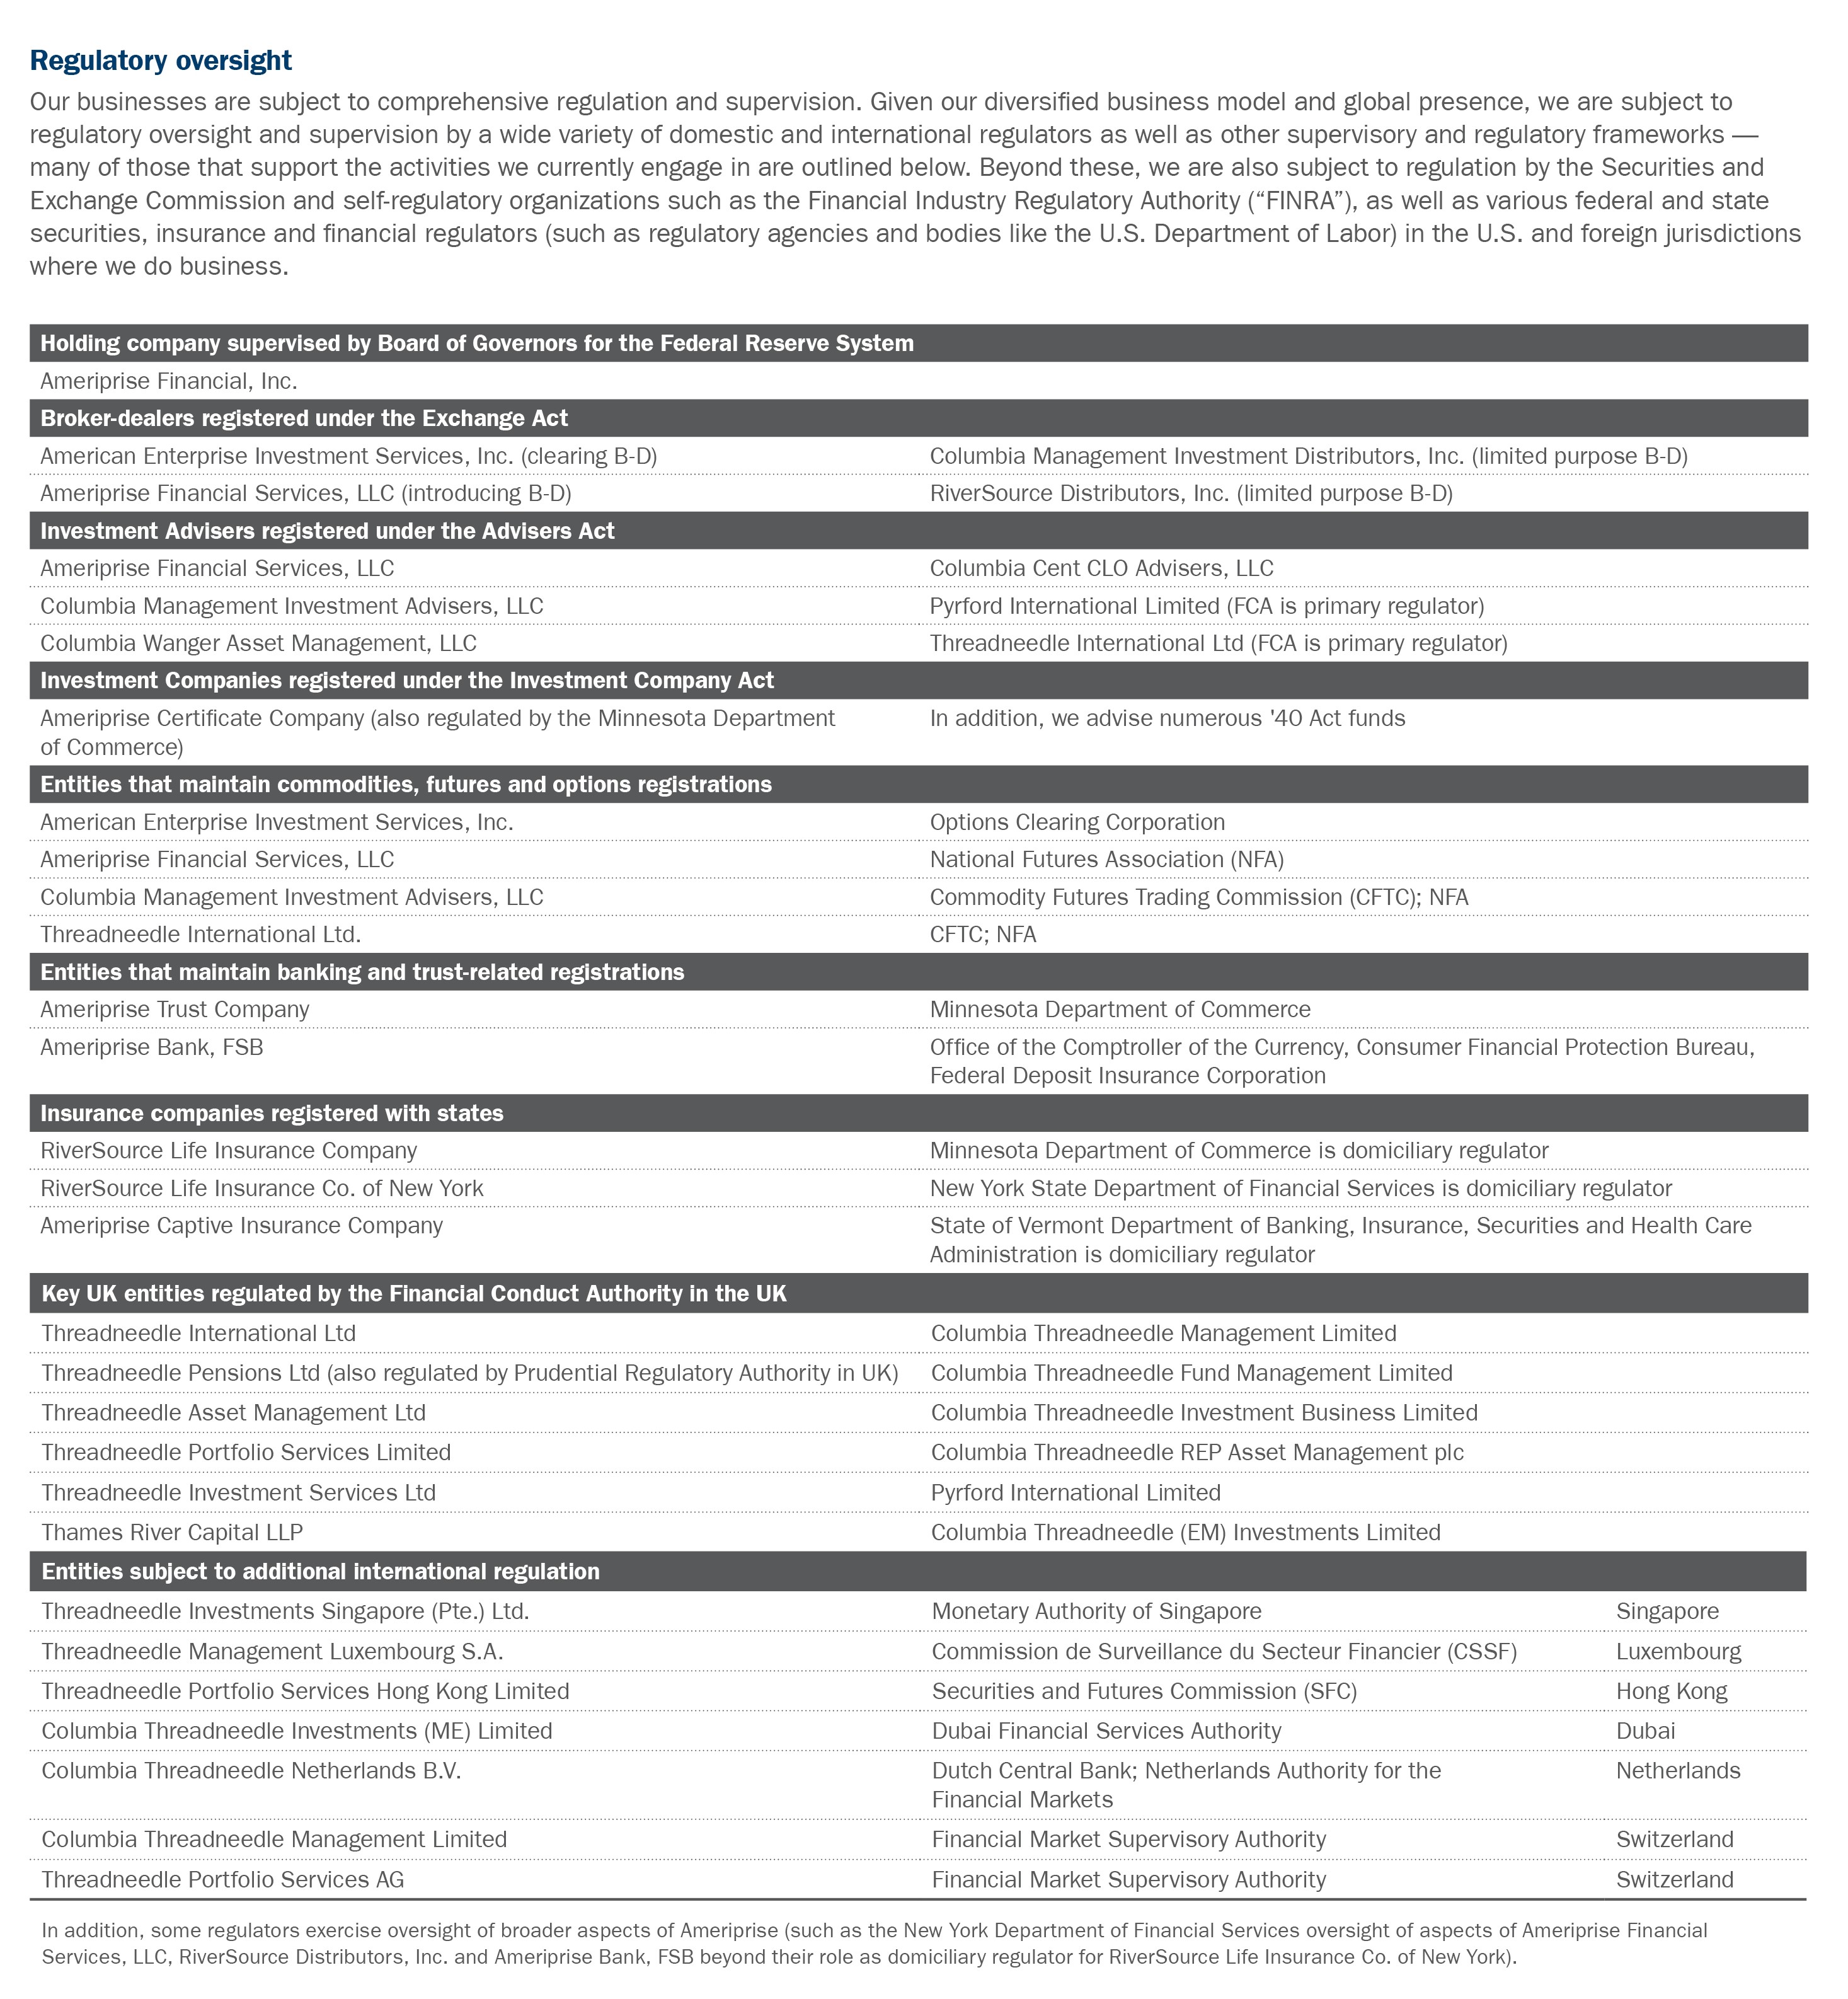
Regulation
Virtually all aspects of our business, including the activities of our parent company and subsidiaries, are subject to various federal, state, local and foreign laws and regulations. These laws and regulations provide broad regulatory, administrative and enforcement powers to supervisory agencies and other bodies, including U.S. federal and state regulatory and law enforcement agencies, foreign government agencies or regulatory bodies and U.S. and foreign securities exchanges. The costs of complying with such laws and regulations are significant and increasing, and the consequences for failing to comply may include civil or criminal charges, fines, censure, the suspension of individual employees, restrictions on or prohibitions from engaging in certain lines of business (or in certain states or countries), revocation of certain registrations and reputational damage. We have made and expect to continue to make significant investments in our compliance and supervision processes, enhancing policies, procedures and oversight to monitor our compliance with the many legal and regulatory requirements applicable to our business.
We operate in a highly scrutinized regulatory environment that remains subject to change. Regulatory developments, both in and outside of the U.S., have resulted or are expected to result in greater regulatory oversight and internal compliance obligations for firms across the financial services industry. We expect the current U.S. administration will seek to implement a regulatory reform agenda that is significantly different from that of the previous administration, impacting the rulemaking, supervision, examination and enforcement priorities of the federal regulators and agencies. In addition, we continue to see enhanced legislative and regulatory interest regarding retirement investing and fiduciary initiatives, as well as environmental, social and governance (“ESG”) consideration and responsible investing; cybersecurity and resilience; the use of artificial intelligence; responsible information and data collection, storage and use; financial crime prevention; and privacy matters, and we will continue to closely review and monitor any legislative or regulatory proposals and changes. For example, the enacted European Union (“EU”) Artificial Intelligence (“AI”) Act and proposed U.S. laws on AI are likely to influence how financial services firms design, build and deploy products and services incorporating AI, and process non-personal data. States in the U.S. and jurisdictions outside the U.S. continue to add new complexity to the patchwork of laws and regulations already in existence relating to privacy, cybersecurity, artificial intelligence and other areas, and we expect this to continue at the federal and state level. Similar complexity resulting from multiple standards exists for retirement investing where individual states and federal regulators continue to propose or enact their own rules. These legal and regulatory changes have impacted and may in the future impact how we are regulated and how we operate and govern our businesses.
The discussion and overview set forth below provides a general framework of the primary laws and regulations impacting our businesses. Certain of our subsidiaries may be subject to one or more elements of this regulatory framework depending on the nature of their business, the products and services they provide and the geographic locations in which they operate. To the extent the discussion includes references to statutory and regulatory provisions, it is qualified in its entirety by reference to these statutory and regulatory provisions and is current only as of the date of this report.
Ameriprise Financial, Inc.
Advice & Wealth Management Regulation
Certain of our subsidiaries are registered with the U.S. Securities and Exchange Commission (“SEC”) as broker-dealers under the Securities Exchange Act of 1934 (“Exchange Act”) and with certain states, the District of Columbia and other U.S. territories. Our broker-dealer subsidiaries are also members of self-regulatory organizations, including the Financial Industry Regulatory Authority (“FINRA”), and are subject to the regulations of these organizations. The SEC and FINRA have stringent rules with respect to the net capital requirements (which includes rules around customer protection) and the marketing and trading activities of broker-dealers. Our broker-dealer subsidiaries, as well as our financial advisors and other personnel, must obtain all required state and FINRA licenses and registrations to engage in the securities business and take certain steps to maintain such registrations in good standing. SEC regulations also impose notice requirements and capital limitations on the payment of dividends by a broker-dealer to a parent, and they have proposed regulations regarding cybersecurity programs and the public reporting of incidents impacting broker-dealers like ours.
Ameriprise Financial, Inc.
Our financial advisors are representatives of a dual registrant, meaning it is registered both as an investment adviser under the Investment Advisers Act of 1940 (“Advisers Act”) and as a broker-dealer. Our advisors are subject to various regulations that impact how they operate their practices, including those related to supervision, sales methods, trading practices, information security, record-keeping and financial reporting. In addition, because our independent contractor advisor platform is structured as a franchise system, we are also subject to Federal Trade Commission and state franchise requirements. We continue to see enhanced legislative and regulatory interest regarding investing and financial advisors, including proposed rules, regulatory priorities or general discussions around transparency and disclosure in advisor compensation and recruiting, identifying and managing conflicts of interest and enhanced data collection.
The SEC’s Regulation Best Interest standard of care became effective June 30, 2020 and the SEC continues to issue various statements and other guidance on complying with the regulation. Furthermore, several states have either issued their own best interest or fiduciary rules or are considering doing so and those rules may be limited to certain types of products (e.g., insurance and annuities, financial planning, etc.) or may broadly cover all recommendations made by financial advisors. The U.S. Department of Labor (“DOL”) finalized its voluntary exemption for providing investment advice to retirement account clients and has reinstated prior guidance for determining who is an investment advice fiduciary under pension regulations. The DOL finalized a new regulation expanding the definition of investment advice fiduciary, but that regulation has been stayed by the courts. While not a regulator, the Certified Financial Planner Board professional standards of conduct includes a fiduciary standard that applies to financial advisors who hold a Certified Financial Planner designation. Considering the various fiduciary rules and regulations that continue to be proposed, finalized, and sometimes withdrawn or amended, we continue to exert significant efforts to evaluate and prepare to comply with each rule.
Other agencies, exchanges and self-regulatory organizations of which certain of our broker-dealer subsidiaries are members, and subject to applicable rules and regulations of, include the Commodities Futures Trading Commission (“CFTC”) and the National Futures Association (“NFA”). Certain subsidiaries may also be registered as insurance agencies and may be subject to the regulations described in the following sections.
Asset Management Regulation
U.S. Regulation
Certain of our asset management subsidiaries are registered as investment advisers under the Advisers Act and are subject to regulation by the SEC. The Advisers Act imposes numerous obligations on registered investment advisers, including fiduciary duties, disclosure obligations and record-keeping, and operational and marketing restrictions. Our registered investment advisers may also be subject to certain obligations of the Investment Company Act based on their status as investment advisers to U.S. registered investment companies that we, or third parties, sponsor. As noted earlier, we continue to see enhanced legislative and regulatory interest regarding financial services in the U.S. through rules, regulatory priorities or general discussion. This trend is especially true globally where regulators remain active, including in Europe. Any future regulation could potentially require new approaches which increase our regulatory burdens and costs.
Many aspects of the regulation that applies to our Advice & Wealth Management segment also apply to our Asset Management segment. For example, Columbia Management Investment Distributors, Inc., a wholly owned subsidiary, is registered as a broker-dealer for the limited purpose of acting as the principal underwriter and distributor for Columbia Management funds and other products. Additionally, the Employee Retirement Income Security Act of 1974, as amended (“ERISA”), the SEC’s best interest standards, state and other fiduciary or best interest rules, as well as other similar standards and any rulemaking from the DOL would be relevant to our global asset management business. We continue to review and analyze the potential impact of these regulations across each of our business lines.
In addition, certain of our asset management subsidiaries are registered with the CFTC as a commodity trading advisor and commodity pool operator and are also members of the NFA. In this regard, we are subject to additional registration and reporting requirements with respect to certain registered investment companies and other pooled vehicles that use or trade in futures, swaps and other derivatives that are subject to CFTC regulation.
U.K. Regulation
Outside of the U.S., Columbia Threadneedle is authorized to conduct its financial services business in the U.K. under the Financial Services and Markets Act 2000. A number of legal entities in the Columbia Threadneedle business are currently regulated by the Financial Conduct Authority (“FCA”) and one entity in the Columbia Threadneedle business is also regulated by the Prudential Regulation Authority (“PRA”). FCA and PRA rules impose certain capital, operational and compliance requirements and allow for disciplinary action in the event of noncompliance. As with the U.S. regulatory environment, we continue to see enhanced legislative and regulatory interest regarding financial services. Key U.K. regulatory developments and trends include the following:
•Operational Resilience: Under this new U.K. regulatory requirement, in scope firms must identify their important business services, which, if unavailable, could cause intolerable harm to clients, which they could not reasonably recover, or market disruption. The regulations introduce a new concept of impact tolerance and firms are also required to stress test their important business services and appoint a senior manager accountable for the regime.
Ameriprise Financial, Inc.
•Financial Resilience: U.K. regulators have revised the prudential regime applying to asset managers. This is being phased in over a five-year period and introduces a number of new capital requirements.
•FCA Consumer Duty: The FCA recently introduced a new Consumer Duty that sets higher expectations for the standard of care that firms provide to retail consumers.
•Sustainability Disclosure Requirements: The FCA recently finalized new requirements that have started to take effect relating to new sustainability product labels, naming and marketing rules, additional ESG disclosure requirements both at an entity and product level, and an anti-greenwashing rule covering client communications.
•Diversity, Equity and Inclusion: The FCA recently launched a consultation on a potential new regulatory framework on diversity and inclusion in the financial sector. The consultation also incorporated additional proposed rules around firms’ handling of non-financial misconduct in the context of adherence to the FCA’s conduct and fitness and propriety regimes.
Our U.K. asset management business must comply with local EU and country requirements as a non-EU firm, which includes leveraging our various EU-based affiliated entities (such as those in Luxembourg and the Netherlands) to provide services and marketing to EU clients and investors. We have an established fund range domiciled in Luxembourg (both UCITS and Alternative Investment Funds), Ireland and the Netherlands, along with Luxembourg-based and Netherlands-based affiliated management companies. Our Luxembourg and Netherlands affiliates may perform fund management, administration and distribution functions. Therefore, we are well placed to continue to serve investors in the EU.
Pan-European and Other Non-U.S. Regulation
In addition to the above, certain of our asset management subsidiaries and branches are required to comply with pan-European directives as issued by the European Commission and adopted by EU member states. Certain of these directives have impacted and will continue to impact our global asset management business. For example, certain of our asset management subsidiaries are required to comply with the Markets in Financial Instruments Directive (“MiFID II”), the Alternative Investment Fund Managers Directive (“AIFMD”), the European Market Infrastructure Regulation (“EMIR”), UCITS, the Sustainable Finance Disclosure Regulation (“SFDR”) and the Packaged Retail and Insurance-based Investment Products Regulation (“PRIIPs”). These requirements impact the way we manage assets and place, settle and report on trades for our clients, as well as market to clients and prospects. Similar to the developments in the U.S., we continue to see enhanced legislative and regulatory interest regarding financial services through international markets, including in the U.K. and EU where we have a substantial asset management business. These international rules, proposed rules, regulatory priorities or general discussions may impact us directly or indirectly, including as a regulated entity or as a service provider to, or a business receiving services from or engaging in transactions with, regulated entities. In addition to regulations noted in this section, within the EU and the U.K. we have been and will continue to address regulatory reforms or structural changes including but not limited to: Consumer Composite Investments, Retail Investment Strategy, AIFMD 2.0, EMIR 3.0, SFDR 2.0, Digital Operational Resilience Act (“DORA”), Corporate Sustainability Reporting Directive (“CSRD”), and Corporate Sustainability Due Diligence Directive (“CSDDD”). In addition , although the U.K. is not a part of the EU, the U.K. regulators may choose to implement future EU regulations and apply them in the U.K. potentially with significant variation from the EU regulations and potentially increasing the complexity and costs for our compliance with divergent sets of rules.
Columbia Threadneedle companies or activities are also subject to various local country or jurisdiction regulations and to corresponding regulators in Europe, Canada, Dubai, Hong Kong, Singapore, South America and Australia. With our growth in the EU, we have (and will continue to have) greater engagement with the Luxembourg, Irish and Dutch regulators.
Other Securities Regulation
ACC is regulated as an investment company under the Investment Company Act. As a registered investment company, ACC must observe certain governance, disclosure, record-keeping, operational and marketing requirements. Ameriprise Certificate Company pays dividends to the parent company and is subject to capital requirements under applicable law and understandings with the SEC and the Minnesota Department of Commerce (“MN DOC”) (Banking Division).
ATC is primarily regulated by the MN DOC (Banking Division) and is subject to capital adequacy requirements under Minnesota law. It is prohibited from accepting deposits or making personal or commercial loans. As a provider of products and services to tax-qualified retirement plans and IRAs, certain aspects of our business, including the activities of our trust company, fall within the compliance oversight of the DOL and the Department of Treasury, particularly regarding the enforcement of ERISA, and the tax reporting requirements applicable to such accounts. ATC, as well as our investment adviser subsidiaries, may be subject to ERISA, and the regulations thereunder, insofar as they act as a “fiduciary” under ERISA with respect to certain ERISA clients.
Insurance Regulation
Our insurance subsidiaries are subject to supervision and regulation by states and other territories where they are domiciled or otherwise licensed to do business. These regulations impact our Retirement & Protection Solutions segment and our closed blocks included in Corporate & Other segment. The primary purpose of this regulation and supervision is to protect the interests of contractholders and policyholders. In general, state insurance laws and regulations govern standards of solvency, capital requirements, the licensing of insurers and their agents, premium rates, policy forms, the nature of and limitations on investments, periodic reporting requirements and other matters. In addition, state regulators conduct periodic examinations into insurer market conduct and
Ameriprise Financial, Inc.
compliance with insurance and securities laws. RiverSource Life Insurance Company is domiciled in Minnesota and regulated by the MN DOC and RiverSource Life Insurance Co. of New York is domiciled in New York and regulated by the New York State Department of Financial Services (“NY DFS”), and together with MN DOC are the “Domiciliary Regulators”. In addition to being regulated by their Domiciliary Regulators, our RiverSource Life companies are regulated by each of the insurance regulators in the states where each is authorized to transact business. Financial regulation of our RiverSource Life companies is extensive, and their financial transactions (such as intercompany dividends and investment activity) may be subject to pre-approval and/or continuing evaluation by the Domiciliary Regulators.
Aspects of the regulation applicable to our Advice & Wealth Management segment also apply to our Retirement & Protection Solutions segment and the closed blocks in our Corporate & Other segment. For example, RiverSource Distributors, Inc., a wholly owned subsidiary, is registered as a broker-dealer for the limited purpose of acting as the principal underwriter and/or distributor for our RiverSource annuities and insurance products sold through Ameriprise Financial Services, LLC (“AFS”), a wholly owned subsidiary, and third-party channels. Additionally, ERISA, the SEC’s best interest standards, state and other fiduciary or best interest rules, as well as other similar standards and any rulemaking from the DOL are relevant to our insurance and annuities business or products. We continue to review and analyze the potential impact of these regulations across each of our business lines.
All states require participation in insurance guaranty associations, which assess fees (subject to statutory limits) to insurance companies in order to fund claims of policyholders and contractholders of insolvent insurance companies. These assessments are generally based on a member insurer’s proportionate share of all premiums written by member insurers in the state during a specified period prior to an insurer’s insolvency. See Note 26 to our Consolidated Financial Statements included in Part II, Item 8 of this Annual Report on Form 10-K for additional information regarding guaranty association assessments.
Certain variable annuity and variable life insurance contracts offered by the RiverSource Life companies, and certain separate accounts supporting such contracts, constitute and are registered as securities under the Securities Act of 1933 and as investment companies under the Investment Company Act of 1940, as amended. As such, these products are subject to regulation by the SEC and FINRA.
The Federal Insurance Office (“FIO”) within the U.S. Department of Treasury does not have substantive regulatory responsibilities, though it is tasked with monitoring the insurance industry and the effectiveness of its regulatory framework in addition to providing periodic reports to the President of the U.S. and Congress. We monitor the FIO’s activity to identify and assess emerging regulatory priorities with potential application to our business.
Each of our insurance subsidiaries is subject to risk-based capital (“RBC”) requirements designed to assess the adequacy of an insurance company’s total adjusted capital in relation to its investment, insurance and other risks. The National Association of Insurance Commissioners (“NAIC”) has established RBC standards that all state insurance departments have adopted. The RBC requirements are used by the NAIC and state insurance regulators to identify companies that merit regulatory actions designed to protect policyholders. The NAIC RBC report is completed as of December 31 and filed annually, along with the statutory financial statements.
Our RiverSource Life companies would be subject to various levels of regulatory intervention if their total adjusted statutory capital falls below defined RBC action levels. At the “company action level,” defined as total adjusted capital level between 100% and 75% of the RBC requirement, an insurer must submit a plan for corrective action with its primary state regulator. The level of regulatory intervention is greater at lower levels of total adjusted capital relative to the RBC requirement.
RiverSource Life and RiverSource Life of NY maintain capital levels well in excess of the company action level required by state insurance regulators as noted below as of December 31, 2024:
| | | | | | | | | | | | | | | | | | | | |
| Entity | | Company Action Level RBC | | Total Adjusted Capital | | % of Company Action Level RBC |
| | (in millions, except percentages) |
| RiverSource Life | | $ | 489 | | | $ | 2,700 | | | 552 | % |
| RiverSource Life of NY | | 38 | | | 219 | | | 579 | % |
Ameriprise Financial, as a direct and indirect owner of its insurance subsidiaries, is subject to the insurance holding company laws of Minnesota and New York (the states where its insurance subsidiaries are domiciled). These laws generally require insurance holding companies to register with the insurance department of the insurance company’s state of domicile and to provide certain financial and other information about the operations of the companies within the holding company structure.
As part of its Solvency Modernization Initiative, in 2010 the NAIC adopted revisions to its Insurance Holding Company System Regulatory Act (“Holding Company Act”) to enhance insurer group supervision and create a new Risk Management and Own Risk and Solvency Assessment (“ORSA”) Model Act. The Holding Company Act revisions focus on the overall insurance holding company system, establish a framework of regulator supervisory colleges, enhancements to corporate governance, and require the annual filing of an Enterprise Risk Management Report. The ORSA Model Act requires that an insurer create and file, annually, its ORSA, which is a complete self-assessment of its risk management functions and capital adequacy. These laws were enacted by the
Ameriprise Financial, Inc.
Domiciliary Regulators. We complete and file these reports as required by the laws and regulations of those states. Insurance regulation and supervision also goes beyond direct regulation of our insurance companies in other ways. For example, while we are now subject to the FRB’s “Building Block Approach” (discussed below in more detail), once Minnesota implements the NAIC’s “Group Capital Calculation,” a new capital calculation will exist for many insurance companies like ours that are not subject to the FRB regulation as we are. And from time to time, we must report other enterprise activities to our state insurance regulators (such as the NAIC’s Liquidity Stress Testing Framework).
Federal Banking and Financial Holding Company Regulation
Ameriprise Bank is subject to regulation by the Office of the Comptroller of the Currency (“OCC”), which is the primary regulator of federal savings banks, the Consumer Financial Protection Bureau (“CFPB”) and by the Federal Deposit Insurance Corporation (“FDIC”) in its role as insurer of Ameriprise Bank's deposits. As a federally chartered savings bank, Ameriprise Bank is subject to numerous rules and regulations governing all aspects of the banking business, including lending practices and transactions with affiliates. Ameriprise Bank is also subject to specific capital rules and limits on capital distributions, including payment of dividends. If Ameriprise Bank's capital falls below certain levels, the OCC would be required to take remedial actions and could take other actions, including imposing further limits on dividends or business activities. In addition, an array of Community Reinvestment Act (“CRA”), fair lending and other consumer protection laws and regulations apply to Ameriprise Bank.
As the controlling company of Ameriprise Bank, Ameriprise Financial is a savings and loan holding company that is subject to regulation, supervision, and examination by the FRB. Ameriprise Financial has elected to be classified as a financial holding company subject to applicable regulation under the Bank Holding Company Act of 1956 (the “Bank Holding Company Act”). Further, FRB regulation and supervisory oversight of Ameriprise Financial includes examinations, regular financial reporting, and prudential standards, such as capital, liquidity risk management, and parameters for business conduct and internal governance.
Under the Bank Holding Company Act, bank holding companies and their banking subsidiaries are generally limited to the business of banking and activities closely related or incidental to banking, and going beyond these activities would require a conformance period request from the FRB. As a financial holding company, we may engage in activities that are financial in nature, incidental to an activity that is financial in nature, or complementary to a financial activity and that do not pose a substantial risk to the safety and soundness of depository institutions or the financial system generally. We may not, however, directly or indirectly acquire the ownership or control of more than 5% of any class of voting shares, or substantially all of the assets, of either a bank holding company (or a bank) without the prior approval of the FRB or of a non-financial company absent an available exemption.
In order to maintain our status as a financial holding company, Ameriprise Bank, as our sole insured depository institution subsidiary, must remain “well-capitalized” and “well-managed” under applicable regulations, and must receive at least a “satisfactory” rating in its most recent examination under the CRA. In addition, Ameriprise, as a financial holding company, must remain “well-capitalized” and “well-managed” in order to maintain its status as a financial holding company. Failure to meet one or more of these requirements would mean, depending on the violation and any agreement then reached with the FRB, Ameriprise Financial could not undertake new activities, continue certain activities or make acquisitions other than those generally permissible for bank holding companies until such violation is cured.
We are subject to what is commonly referred to as the Volcker Rule. The Volcker Rule prohibits “banking entities,” including Ameriprise and our affiliates, from engaging in certain “proprietary trading” activities, as defined in the Volcker Rule, subject to exemptions for underwriting, market-making-related activities, asset management, risk-mitigating hedging and certain other activities. The Volcker Rule also prohibits certain investments and relationships by banking entities with “covered funds,” with a number of exemptions and exclusions. It also requires banking entities to have comprehensive compliance programs reasonably designed to ensure and monitor compliance with the Volcker Rule.
Ameriprise Financial reports to the FRB under a consolidated capital framework termed the “Building Block Approach” (“BBA”) for savings and loan holding companies that are significantly engaged in insurance activities (commonly referred to as insurance savings and loan holding companies). In general, under the rule, insurance savings and loan holding companies like us are required to aggregate state-based insurance capital requirements with banking capital requirements for non-insurance businesses to satisfy specific minimum total requirements and hold an additional capital conservation buffer. The ratio of the amount of available capital to the capital requirement amount is referred to as the BBA ratio and is subject to a 250% minimum, effective January 1, 2024. An additional capital conservation buffer of 150% will be effective as of December 31, 2025, for a total capital requirement of at least 400%.
The BBA available capital, BBA capital requirement, and BBA ratio as of December 31, 2024 are as follows:
| | | | | |
| (in millions, except percentages) |
| BBA available capital | $ | 3,833 | |
| BBA capital requirement | 392 | |
| BBA ratio | 978 | % |
Ameriprise Financial, Inc.
Additional Parent Company Regulation and Other Regulation
We are a publicly traded company subject to SEC and New York Stock Exchange (“NYSE”) rules and regulation and have operations in a number of geographical regions across the U.S. and outside of the U.S. Certain states enact regulations or requirements that can drive enterprise-wide action or disclosures. We evaluate these laws and changes to understand if and when they impact our business, such as the laws in California requiring certain climate-related disclosure. As an international company, we continuously monitor developments in EU legislation, as well as in the other markets in which we operate, to ensure that we comply with all applicable legal requirements, including EU directives applicable to financial institutions as implemented in the various member states. Because of the mix of business activities we conduct, we assess the impact of, and monitor our status under, the EU Financial Conglomerates Directive, which contemplates global supervision and prudential regulation of certain financial conglomerates involved in banking, insurance and investment activities.
Privacy, Environmental and Anti-Money Laundering Laws
Many aspects of our business are subject to comprehensive legal requirements concerning the use and protection of personal information, including client and employee information, from a multitude of different functional regulators and law enforcement bodies. This includes rules adopted pursuant to the Gramm-Leach-Bliley Act, the Fair and Accurate Credit Transactions Act, the Health Insurance Portability and Accountability Act (“HIPAA”), as amended by the Health Information Technology for Economic and Clinical Health (“HITECH”) Act, an ever increasing number of state laws and regulations such as the NY DFS’ Cybersecurity Requirements for Financial Services Companies, and California privacy legislation, as recently amended, EU data protection legislation, known as the Global Data Protection Regulation (“GDPR”), as implemented in the respective EU member states, the U.K. Data Protection Act, 2018 and U.K. GDPR, and data protection rules in other regions in which we operate outside the U.S. and the EU. We have also implemented policies and procedures in response to such requirements. We continue our efforts to safeguard the data entrusted to us in accordance with applicable laws and our internal data protection policies, including taking steps to reduce the potential for identity theft or other improper use or disclosure of personal information, while seeking to collect only the data that is necessary to properly achieve our business objectives and best serve our clients. To the extent we do experience an incident, we have developed and implemented a cybersecurity incident response manual, which we regularly exercise and update, as appropriate.
As the owner and operator of real property, we are subject to federal, state, local and foreign environmental laws and regulations. We periodically conduct certain air and water reviews on our own real estate as well as investment real estate to assess and support our compliance with these laws and regulations.
The Uniting and Strengthening America by Providing Appropriate Tools Required to Intercept and Obstruct Terrorism Act, commonly referred to as the USA Patriot Act, was enacted in October 2001. It substantially broadened existing anti-money laundering legislation and the extraterritorial jurisdiction of the U.S. In response, we enhanced our existing anti-money laundering programs and developed new procedures and programs, including enhancing our “know your customer” and “due diligence” programs. We continuously review, update and enhance our anti-money laundering procedures and programs. In addition, we will continue to comply with anti-money laundering legislation in the U.K. derived from applicable EU directives and international initiatives adopted in other jurisdictions in which we conduct business.
Exchange Act Reports and Additional Information
We maintain an Investor Relations website at ir.ameriprise.com. Investors can also access the website through our main website at ameriprise.com by clicking on the “Investor Relations” link located at the bottom of our homepage (ameriprise.com). We use our Investor Relations website to announce financial and other information to investors and to make available SEC filings, press releases, public conference calls, other communications and webcasts. Investors and others interested in the Company are encouraged to visit the Investor Relations website from time to time, as information is frequently updated and posted. Additionally, users can sign up to receive automatic notifications when new materials are posted. The information found on the website is not incorporated by reference into this report or in any other report or document we furnish or file with the SEC.
Item 1A. Risk Factors
Our operations and financial results are subject to various risks and uncertainties, including those described below, that could have a material adverse effect on our business, financial condition or results of operations and could cause the trading price of our common stock to decline. We believe that the following information identifies the material factors affecting our company based on the information we currently know. However, the risks and uncertainties our company faces are not limited to those described below. Additional risks and uncertainties not presently known to us or that we currently believe to be immaterial may also adversely affect our business.
Market Risks
Our results of operations and financial condition may be adversely affected by market fluctuations and by economic, political and other factors.
Our results of operations and financial condition may be materially affected by market fluctuations and by economic and other factors (whether actual or perceived). Such factors, which can be global, regional, national or local in nature, include: (i) the level and
Ameriprise Financial, Inc.
volatility of the markets, including equity prices, interest rates, commodity prices, currency values and other market indices and drivers; (ii) geopolitical strain, terrorism and armed conflicts, (iii) political dynamics or elections and social, economic and market conditions; (iv) the availability and cost of capital; (v) global health emergencies; (vi) technological changes and events; (vii) U.S. and foreign government fiscal and tax policies; (viii) U.S. and foreign government ability, real or perceived, to avoid defaulting on government securities; (ix) the availability and cost of credit and hedge markets; (x) periods of elevated inflation; (xi) natural disasters such as weather catastrophes; and (xii) other factors affecting investor sentiment and confidence in the financial markets. Furthermore, changes in consumer economic variables, such as the number and size of personal bankruptcy filings, the rate of unemployment, decreases in property values, and the level of consumer confidence and consumer debt, may substantially affect consumer financials, which, in turn, could impact client activity in all of our businesses. These factors also may have an impact on our ability to achieve our strategic objectives or to pay dividends or otherwise return capital from our subsidiaries to our holding company.
Declines and volatility in U.S. and global market conditions have impacted our businesses in the past, are impacting us now and may continue to impact us in the same, new or different ways in the future. Our businesses have been, and in the future may be, adversely affected by U.S. and global capital market and credit crises, the repricing of credit risk, equity market volatility and decline, and stress or recession in the U.S. and global economies generally. Each of our segments operates in these markets with exposure for us and our clients in securities, loans, derivatives, alternative investments, seed capital and other commitments. It is difficult to predict when, how long and to what extent the aforementioned adverse conditions will exist, which of our markets, products and businesses will be directly affected and to what extent our clients may seek to bring claims arising out of investment performance that is affected by these conditions. As a result, these factors could materially adversely impact our financial condition and results of operations.
These factors will also impact client behavior. Market downturns, stagnation, and volatility may cause, and have caused, individual investors to limit or decrease their participation in global markets negatively impacting our retail business and/or our product sales. Market conditions, regulatory actions, tax laws, and our competitive industry environment are among the reasons current shareholders in our mutual funds, closed-end funds, exchange traded funds (“ETFs”), hedge funds, OEICs, SICAVs, unit trusts, investment trusts and other pooled investment vehicles, contractholders in our annuity products and policyholders in our protection products may opt to withdraw cash values for those products (or for certain protection products, to reduce their withdrawal activity). If we are unable to offer appropriate product alternatives which encourage clients to continue purchasing in the face of actual or perceived market volatility, our sales and management fee revenues could decline.
Downturns and volatility in markets or the departure of a key client have had, and may in the future have, an adverse effect on the revenues and returns from our asset management services, retail advisory accounts, variable annuity contracts, banking products and other products. Because the profitability of these products and services depends on fees related primarily to the value of assets under management, declines in the markets will reduce our revenues because the value of the investment assets we manage will be reduced. In addition, a significant portion of our revenue is derived from investment management agreements with the Columbia Management family of mutual funds or other investment managers which are terminable on 60 days’ notice. Although some contracts governing investment management services are subject to termination for failure to meet performance benchmarks, institutional and individual clients can generally terminate their relationships with us or our financial advisors at will or on relatively short notice. Further, a number of the products and services we make available to our clients are those offered by third parties and negative perceptions of these financial products and services (or the financial industry in general) may impact the number of withdrawals and redemptions or reduce purchases made by our clients, which would adversely impact the levels of our assets under management. Our clients can also reduce the aggregate amount of managed assets or shift their funds to other types of accounts with different fee rate structures, for any number of reasons, including investment performance, changes in prevailing interest rates, changes in investment preferences or investment management strategy (for example, “active” or “passive” investing styles or the proliferation of ETFs or other vehicles like separately managed accounts (“SMAs”)), changes in our (or our advisors’) reputation in the marketplace, a client’s view of ESG factors, changes in client or relationship management, loss of key investment management personnel and financial market performance. This reduction in managed assets or significant redemptions, and the associated decrease in revenues and earnings, could have a material adverse effect on our business, particularly in products or services where we have less scale and a reduction in managed assets can make the product not viable or even require us to exit the product.
Most of our variable annuity products contain guaranteed minimum death benefits and a majority of our variable annuity products in force contain guaranteed minimum withdrawal and accumulation benefits. Decline or volatility in equity and/or bond markets could result in guaranteed minimum benefits being higher than what current account values would support, which would adversely affect our financial condition and results of operations. Discontinuing the sale of new fixed annuities and variable annuities with living benefits will lessen this risk over time. Although we have hedged a portion of the guarantees for the variable annuity contracts to mitigate the financial loss of equity and/or bond market declines or volatility, there can be no assurance that such a decline or volatility would not materially impact the profitability of certain products or product lines or our financial condition or results of operations. For example, market fluctuations will impact our statutory reserves and required capital, and that may not be aligned with the hedging impacts. In addition to risks from guarantees discussed above, structured variable annuity contracts contain index-linked risks that adjust the policyholder’s or contractholder’s account value based on equity movements. These risks are hedged with derivatives, which are a material component of our overall hedging program. Collateral requirements for the hedging program are market-sensitive, and certain market environments (e.g., rising interest rates) will result in increased needs for liquidity to satisfy these requirements. Depending on
Ameriprise Financial, Inc.
how rapidly the market moves and other factors, we may need to access liquidity sources that are more costly, which could have an adverse impact on profitability or our results of operations or financial condition.
Changes in interest rates may affect our results of operations and financial condition.
Certain of our insurance, annuity, investment products, wrap fees and banking products are sensitive to interest rate fluctuations (inclusive of changes in credit spreads), which could cause future impacts associated with such fluctuations to differ from our historical results of operations. In addition, interest rate fluctuations could result in fluctuations in the valuation of certain minimum guaranteed benefits contained in some of our variable annuity products. Although we typically hedge to mitigate some of the effect of such fluctuations, significant changes in interest rates (or prolonged periods of low interest rates) could have a material adverse impact on the profitability of certain products or product lines or our results of operations or financial condition.
Interest rate fluctuations also could have an adverse effect on the results of our investment portfolio. During periods of declining market interest rates or stagnancy of low interest rates, the interest we receive on variable interest rate investments decreases and we are forced to reinvest the cash we receive as interest or return of principal on our investments in lower-yielding high-grade instruments or in lower-credit instruments to maintain comparable returns. Issuers of certain callable fixed income securities also may decide to prepay their obligations in order to borrow at lower market rates, which increases the risk that we may have to reinvest the cash proceeds of these securities in lower-yielding or lower-credit instruments.
If there is a return to a period of prolonged low interest rates, our spread may be reduced or could become negative. Due to the long-term nature of the liabilities associated with certain of our businesses, such as long term care and universal life with secondary guarantees as well as guaranteed benefits on variable annuities, sustained declines in or stagnancy of low long-term interest rates may subject us to reinvestment risks and increased hedging costs. We periodically review and, where appropriate, adjust our assumptions.
As market interest rates increase or sustain at relatively higher rates, we may credit clients higher rates on interest-sensitive products, such as universal life insurance, face-amount certificates, and banking products and we may increase these rates on in force products to keep these products competitive (which could have an adverse effect on our financial condition and results of operations). Because yields on invested assets may not increase as quickly as current interest rates, we may have to accept a lower spread and thus lower profitability or face a decline in sales and greater loss of existing contracts and related assets. In addition, increases in market interest rates would further increase the unrealized loss position of our investment portfolio and may cause outflows and other negative impacts through increased policy surrenders, withdrawals from life insurance policies and annuity contracts and requests for policy loans, or changes in demands of certain bank or certificate products as policyholders, contractholders and clients seek to shift assets to products with perceived higher returns. This process may lead to an earlier than expected outflow of cash from many different areas of our business. These withdrawals, surrenders and other client actions may require investment assets to be sold at a time when the prices of those assets are lower because of the increase in market interest rates, which may result in investment losses to be realized in our results of operations. Also, increases in market interest rates may result in extension of certain cash flows from structured mortgage assets. An increase in policy surrenders and withdrawals also may require us to accelerate amortization of deferred acquisition costs (“DAC”) or other intangibles or cause an impairment of goodwill, which would increase our expenses and reduce our net earnings in the period. If higher market interest rates lead to inflows into interest-sensitive products (such as face-amount certificates and certain banking products) or other changes in product behavior, our capital requirements may increase as well.
Adverse capital and credit market conditions or a downgrade in our credit ratings may significantly affect our ability to meet liquidity needs, our access to capital and our cost of capital.
Volatility, uncertainty and disruption in the capital and credit markets may decrease available liquidity, which we may need to pay our expenses and dividends. If the market conditions hinder our availability to obtain capital or liquidity, our business could suffer.
Our liquidity needs are satisfied primarily through our reserves and the cash generated by our operations. We believe the level of cash and securities we maintain, combined with expected cash inflows from investments and operations, is adequate to meet anticipated short-term and long-term payment obligations. In the event current resources are insufficient to satisfy our needs, we may access financing sources such as our committed unsecured revolving credit facility or other bank debt. Additional financing depends on a variety of factors such as market conditions, the general availability of credit, the volume of trading activities, the overall availability of credit to the financial services industry, our credit ratings and credit capacity, actions by our regulators, and perceptions held by stakeholders, clients or lenders.
Further, the financial strength ratings which various rating organizations publish as a measure of an insurance company’s ability to meet contractholder and policyholder obligations, are important to maintain public confidence in our products, our competitive position, and the ability to market our products. Any future downgrade in our financial strength ratings, or the announced or perceived potential for a downgrade, could potentially have a significant adverse effect on our financial condition and results of operations.
Ratings agencies have and may continue to increase the frequency and scope of their credit reviews, adjust upward the capital and other requirements employed in the rating organizations’ models for maintenance of ratings levels (including adjusting the framework under which they view our business mix that drives these requirements), or downgrade ratings applied to particular classes of securities or types of institutions, and our ratings could be changed at any time and without any notice by the rating organizations. In
Ameriprise Financial, Inc.
addition, rating agencies continually evolve their ratings and other methodologies, and these changes can be to our detriment or benefit and have a material impact on how we view our liquidity and capital.
Market conditions or decisions by our ratings agencies that hinder our access to capital may limit our ability to satisfy statutory capital targets, generate fee income and market-related revenue to meet liquidity needs and access the capital necessary to grow our business. As such, we may be forced to delay raising capital, issue different types of capital than we would otherwise, less effectively deploy such capital, or bear an unattractive cost of capital which could decrease our profitability and significantly reduce our financial flexibility.
Business Risks
Intense competition and the economies of scale for larger competitors could negatively impact our ability to maintain or increase our market share and profitability.
Our businesses operate in intensely competitive industries, including broker-dealers, banks, asset managers, insurers and other financial institutions, some of which have a larger market share, greater investments in technology and analytics, greater investment in advertising and brand, less regulation or greater financial resources than we do. Furthermore, our competitors may be better able to address trends, structural changes, or movement of assets resulting from industry changes or in response to the uncertain regulatory environment in the U.S. and around the world. We could experience lower sales, higher costs, technology obsolescence or other developments that could negatively impact our results of operations.
A drop in our investment performance as compared to that of our competitors could negatively impact our revenues and profitability.
Investment performance is a key competitive factor for our retail and institutional asset management products and services and is a key driver of growing assets under management and economies of scale. Strong investment performance supports the retention of our products and services by our clients and creates opportunities for new sales of products and services. It may also result in higher ratings by ratings services such as Morningstar or Lipper, which may compound the foregoing effects.
There can be no assurance as to how future investment performance will compare to our competitors or that historical performance will be indicative of future returns. Any drop or perceived drop in investment performance as compared to our competitors could cause a decline in sales of our investment products, an increase in redemptions and the termination of asset management relationships. These impacts may reduce our aggregate amount of assets under management and reduce management fees. Poor investment performance could also adversely affect our ability to expand the distribution of our products through unaffiliated third parties. Further, any drop in market share of mutual funds sales by our advisors or through third party intermediaries, may further reduce profits as sales of other companies’ mutual funds are less profitable than sales of our proprietary funds.
We face intense competition in attracting and retaining key talent.
Our continued success depends on our ability to attract, motivate, engage and retain high-performing and high-potential talent in a highly competitive industry. Although the employment market is stabilizing compared to recent years, the financial services sector remains a highly competitive industry, especially for top talent. We proactively assess retention risks and invest in our employees to remain an employer of choice. Additionally, we have diversified our geographic footprint to attract and retain top talent globally, including expanding our workforce in India.
We are also dependent on our network of advisors to drive growth and results in our wealth management business (and for a significant portion of the sales of our products). Recruiting and retaining financial advisors is highly competitive and constantly evolving. The investment performance of our asset management products and services, as well as retention of our products and services by our clients, depend on the strategies and decisions of our portfolio managers and analysts.
From time to time there are regulatory-driven or other trends and developments within the industry that could potentially impact the dynamics between us and our competitors or negatively impact our business. If employees or advisors who maintain relationships with our clients leave or retire without succession plans, we may not be able to retain valuable relationships, and our clients may choose to leave for a competitor. If we experience a prolonged inability to attract and retain qualified individuals or our recruiting and retention costs increase significantly, our financial condition and results of operations could be materially adversely impacted.
The negative performance or default by other financial institutions or other third parties could adversely affect us.
We have exposure to many different industries and counterparties, and we routinely execute transactions with counterparties in the financial services industry, including broker-dealers, commercial banks, investment banks, hedge funds, insurers, reinsurers, investment funds and other institutions. The operations of U.S. and global financial services institutions are interconnected and a decline in the financial condition of one or more financial services institutions may expose us to credit losses or defaults, limit our access to liquidity or otherwise disrupt the operations of our businesses. While we regularly assess our exposure to different industries and counterparties, the performance and financial strength of specific institutions are subject to rapid change, the timing and extent of which cannot be known.
Many transactions with and investments in the products and securities of other financial institutions expose us to credit risk in the event of default of our counterparty. With respect to secured transactions, our credit risk may be exacerbated when the collateral we
Ameriprise Financial, Inc.
hold cannot be realized upon or is liquidated at prices insufficient to recover the full amount of the loan or derivative exposure. We also have exposure to financial institutions in the form of unsecured debt instruments, derivative transactions (including with respect to derivatives hedging our exposure on variable annuity contracts with guaranteed benefits and structured variable annuities), reinsurance, repurchase and underwriting arrangements and equity investments. Any such losses or impairments to the carrying value of these assets could materially and adversely impact our business and results of operations.
Issuers of the fixed maturity securities that we own may default on principal and interest payments. Some of our fixed maturity securities may have ratings below investment-grade. Default-related declines in the value of our fixed maturity securities portfolio or consumer credit holdings could cause our net earnings to decline and could also cause us to contribute capital to some of our regulated subsidiaries, which may require us to obtain funding during periods of unfavorable market conditions.
Capital and credit market volatility or a sudden devaluation of a specific product or security (such as the broad impacts experienced from the 2023 regional bank crisis) can exacerbate, and has exacerbated, the risk of third-party defaults, bankruptcy filings, foreclosures, legal actions and other events that may limit the value of or restrict our access and our clients’ access to cash and investments. Although we are not required to do so, we have elected in the past, and we may elect in the future, to compensate clients for losses incurred in response to such events, provide clients with temporary credit or liquidity or other support related to products that we manage, or provide credit liquidity or other support to the financial products we manage. If we elect to provide additional support, we could incur losses from the support we provide and incur additional costs, including financing costs, in connection with the support. These losses and additional costs could be material and could adversely impact our results of operations. If we were to take such actions we may also restrict or otherwise utilize our corporate assets, limiting our flexibility to use these assets for other purposes, and may be required to raise additional capital.
We may not be able to maintain our unaffiliated third-party distribution channels and the sale of unaffiliated products may diminish sales of our own products.
We distribute many of our investment products through unaffiliated third-party advisors and financial institutions. Maintaining and deepening relationships with these unaffiliated distributors is an important part of our growth strategy, as strong third-party distribution arrangements enhance our ability to market our products or service our clients and to increase our assets under management, revenues and profitability. Access to distribution channels is subject to intense competition due to the large number of competitors and products in the investment advisory industry as well as regulatory and consumer trends driving escalating compliance, disclosure and risk management requirements for distributors. Relationships with our distributors are subject to periodic negotiation that may result in increased distribution costs and/or reductions in the amount of our products marketed.
As a result, there can be no assurance that the distribution relationships we have established will continue. Any such reduction in access to (or the economics associated with) third-party distributors may have a material adverse effect on our ability to market our products and to generate revenue in our Advice & Wealth Management and Asset Management segments. Further, any increase in the costs to distribute our products or reduction in the type or amount of products made available for sale may have a material effect on our revenues and profitability.
The sale of third-party products to our clients (and further expansion of our advisor network’s product suite to include additional products of unaffiliated insurance companies and asset managers) may lower sales of our companies’ own products, lead to higher surrenders or redemptions, or other developments which might not be fully offset by higher distribution revenues or other benefits, possibly resulting in an adverse effect on our results of operations.
Our valuation of fixed maturity and equity securities may include methodologies, estimations and assumptions which are subject to differing interpretations and could result in changes to investment valuations that may materially adversely impact our results of operations or financial condition.
Fixed maturity, equity, trading securities and short-term investments, which are reported at fair value on the Consolidated Balance Sheets, represent the majority of our total cash and invested assets. The determination of fair values by management in the absence of quoted market prices is based on valuation methodologies, securities we deem to be comparable, and assumptions deemed appropriate given the circumstances. The fair value estimates are made at a specific point in time, based on available market information and judgments about financial instruments, including estimates of the timing and amounts of expected future cash flows and the credit standing of the issuer or counterparty. Factors considered in estimating fair value include: coupon rate, maturity, estimated duration, call provisions, sinking fund requirements, credit rating, industry sector of the issuer, current interest rates and credit spreads, and quoted market prices of comparable securities. The use of different methodologies and assumptions may have a material effect on the estimated fair value amounts.
During periods of market disruption, including periods of significantly rising or high interest rates and rapidly widening credit spreads or illiquidity, it may be difficult to value certain of our securities and the value of our securities as reported within our Consolidated Financial Statements and the period-to-period changes in value could vary significantly. There may be certain asset classes that were in active markets with significant observable data that become illiquid due to the financial environment. In such cases, the valuation of certain securities may require additional subjectivity and management judgment. As such, valuations may include inputs and assumptions that are less observable and may require greater estimation as well as valuation methods that are more sophisticated,
Ameriprise Financial, Inc.
which may result in values less than the value at which the investments may be ultimately sold. Decreases in value may have a material adverse effect on our results of operations or financial condition.
The determination of the amount of allowances taken on certain loans and investments is subject to management’s evaluation and judgment and could materially impact our results of operations or financial position.
The determination of the amount of allowances varies by investment type and is based upon our periodic evaluation and assessment of inherent and known risks associated with the respective asset class.
Management uses its best judgment in evaluating the cause of the decline in the estimated fair value of the security and in assessing the prospects for recovery. Inherent in management’s evaluation of the security are assumptions and estimates about the operations of the issuer and its future earnings potential. The determination of the amount of allowances on loans is based upon the asset’s expected life, considering past events, current conditions and reasonable and supportable economic forecasts. Such evaluations and assessments are revised as conditions change and new information becomes available. Historical trends may not be indicative of future impairments or allowances.
Some of our investments are relatively illiquid and we may have difficulty selling these investments.
We invest a portion of our owned assets in certain privately placed fixed income securities, mortgage loans, and limited partnership interests, all of which are relatively illiquid. These asset classes represented 8% of the carrying value of our investment portfolio as of December 31, 2024. If we require significant amounts of cash on short notice in excess of our normal cash requirements, we may have difficulty selling these investments in a timely manner or be forced to sell them for an amount less than we would otherwise have been able to realize, or both, which could have an adverse effect on our financial condition and results of operations.
Insurance Risks
If the counterparties to our reinsurance arrangements default or otherwise fail to fulfill their obligations, we may be exposed to risks we had sought to mitigate, which could adversely affect our financial condition and results of operations.
We use reinsurance to mitigate certain of our risks. Reinsurance does not relieve us of our direct liability to our policyholders and contractholders, even when the reinsurer is liable to us. Accordingly, we bear credit and performance risk with respect to our reinsurers, including Commonwealth and Genworth Life Insurance Company. In July 2016, we finalized various confidential enhancements with Genworth Life Insurance Company that have been shared, in the normal course of regular reviews, with our Domiciliary Regulators and rating agencies. A reinsurer’s insolvency or its inability or unwillingness to make payments under the terms of our reinsurance agreement could have a material adverse effect on our financial condition and results of operations.
The failure of other insurers could require us to pay higher assessments to state insurance guaranty funds.
Our insurance companies are required by law to be members of the guaranty fund association in every state where they are licensed to do business. In the event of insolvency of one or more unaffiliated insurance companies, our insurance companies could be adversely affected by the requirement to pay assessments to the guaranty fund associations. Uncertainty and volatility in the U.S. economy and financial markets in recent years have weakened or may weaken the financial condition of numerous insurers, including insurers currently in receivership, increasing the risk of triggering guaranty fund assessments upon order of liquidation.
If our reserves for future policy benefits and claims or for future certificate redemptions and maturities are inadequate, we may be required to increase our reserve liabilities, which would adversely affect our results of operations and financial condition.
We establish reserves as estimates of our liabilities to provide for future obligations under our insurance policies, annuities and investment certificate contracts. Reserves do not represent an exact calculation of the liability but, rather, are estimates of contract benefits and related expenses we expect to incur over time. The assumptions and estimates we make in establishing reserves require certain judgments about future experience and, therefore, are inherently uncertain. We cannot determine with precision the actual amounts that we will pay for contract benefits, the timing of payments, or whether the assets supporting our stated reserves will increase to the levels we estimate before payment of benefits or claims. We monitor our reserve levels continually. If we were to conclude that our reserves are insufficient to cover actual or expected contract benefits, we would be required to increase our reserves and incur income statement charges for the period in which we make the determination, which would adversely affect our results of operations and financial condition.
Our insurance profitability relies on our assumptions including those regarding morbidity rates, mortality rates and benefit utilization as well as the future persistency of our insurance policies and annuity contracts.
We set prices for insurance products as well as some annuity products based upon expected claims payment patterns, derived from assumptions we make about our policyholders and contractholders, including expenses, fees, investment returns, and morbidity and mortality rates. The long-term profitability of these products depends upon how our actual experience compares with our pricing assumptions. Actual experience can differ from our assumptions for many reasons over the time an insurance product is held. If mortality rates are higher than our pricing assumptions, we could be required to make greater payments under our life insurance policies and annuity contracts with guaranteed minimum death benefits than we have projected.
The prices and profitability of our life insurance and deferred annuity products are based in part upon assumptions related to persistency (the probability that a policy or contract will remain in force from one period to the next). For most of our life insurance
Ameriprise Financial, Inc.
and deferred annuity products, actual persistency that is lower than our persistency assumptions could have an adverse impact on profitability, especially in the early years of a policy or contract because we would be required to accelerate the amortization of expenses we deferred in connection with the acquisition of the policy or contract.
For our LTC insurance, universal life insurance policies with secondary guarantees and variable annuities with guaranteed minimum withdrawal benefits, actual persistency that is higher than our persistency assumptions could have a negative impact on profitability. If these policies remain in force longer than we assumed, we could be required to make greater benefit payments than we had anticipated when we priced or partially reinsured these products.
The risk that our claims experience may differ significantly from our pricing assumptions is particularly significant for our LTC insurance products notwithstanding our ability to implement future price increases with regulatory approvals. Though we discontinued offering LTC products in 2003, LTC insurance policies provide for long-duration coverage and, therefore, our actual claims experience will continue to emerge over many years. Our ability to forecast future claim rates for LTC insurance is more limited than life insurance. We have sought to moderate these uncertainties to some extent by partially reinsuring LTC policies at the time the policies were underwritten and limiting our present stand-alone LTC insurance offerings to policies underwritten fully by unaffiliated third-party insurers, and we have also implemented rate increases and provided reduced benefit options on certain in force policies.
Because our assumptions regarding persistency experience are inherently uncertain, reserves for future policy benefits and claims may prove to be inadequate if actual persistency experience is different from those assumptions. Although some of our products permit us to increase premiums during the life of the policy or contract, we cannot guarantee that these increases would be sufficient to maintain profitability. Additionally, some of these pricing changes require regulatory approval, which may not be forthcoming. Moreover, many of our products do not permit us to increase premiums or limit those increases during the life of the policy or contract, while premiums on certain other products (primarily LTC insurance) may not be increased without prior regulatory approval. Significant deviations in experience from pricing expectations regarding persistency could have an adverse effect on the profitability of our products.
Operations Risks
A failure to protect our reputation could adversely affect our businesses.
Our reputation is one of our most important assets. Our ability to attract and retain clients, investors, employees and advisors is highly dependent upon external perceptions of our company. Damage to our reputation could cause significant harm to our business and prospects. Reputational damage may arise from numerous sources, including litigation or regulatory actions, failing to deliver minimum standards of service and quality, compliance failures, any perceived or actual weakness in our financial strength or liquidity, clients’ or potential clients’ perceived failure of how we address certain political, environmental, social or governance topics, technological breakdowns, cybersecurity attacks, or other security breaches (including attempted breaches, breaches impacting our vendors or their subcontractors or inadvertent disclosures) resulting in system unavailability, improper disclosure or loss of data integrity relating to client or employee personal information, unethical or improper behavior and the misconduct or error of our employees, advisors and counterparties. Additionally, a failure to develop new products and services, or successfully manage associated operational risks, could harm our reputation and potentially expose us to additional costs, or negative public relations or social media campaigns. Any negative incidents can quickly erode trust and confidence, particularly if they result in adverse mainstream and social media publicity, governmental audits or investigations or litigation. Adverse developments with respect to our industry may also, by association, negatively impact our reputation or result in greater regulatory or legislative scrutiny or litigation against us.
Misconduct by our employees and advisors may be difficult to detect and deter and may damage our reputation. This can include improper use of their authorized access to sensitive information. Misconduct or errors by our employees and advisors could result in violations of law, regulatory sanctions and/or serious reputational or financial harm. Misconduct or mistakes can occur in each of our businesses. We cannot always prevent misconduct by our employees and advisors, and the precautions we take to prevent and detect this activity may not be effective in all cases. We seek to aid our advisors and provide certain requirements and support to protect our non-employee franchise advisors’ technology solutions to run their businesses, but they control their own technology environment on a day-to-day basis and could have an adverse effect on our business. Our reputation depends on our continued identification of and mitigation against conflicts of interest. We have procedures and controls that are designed to identify, address and appropriately disclose perceived conflicts of interest, though our reputation could be damaged if we fail, or appear to fail, to address conflicts of interest appropriately.
In addition, the SEC and other federal and state regulators, as well as foreign regulators, have increased their scrutiny of potential conflicts of interest and the actions we may be expected to take when a conflict is encountered. It is possible that potential or perceived conflicts could give rise to litigation or enforcement actions. Also, it is possible that the regulatory scrutiny of, and litigation in connection with, conflicts of interest will make our clients less willing to enter into transactions with us or in certain products or services we offer, which would adversely affect our businesses.
Ameriprise Financial, Inc.
The direct and indirect effects of climate change could adversely affect our business and operations, both directly and as a result of impacts on our clients, counterparties and entities whose securities we hold.
We operate in many regions, countries and communities around the world where our business, and the activities of our clients and counterparties, could be adversely affected by climate change. Climate change may increase the severity and frequency of weather-related catastrophes, or adversely affect our investment portfolio or investor sentiment. This includes the potential for an increase in the frequency and severity of weather-related disasters and pandemics. In addition, climate change regulation may affect the prospects of companies and other entities whose securities we hold, or our willingness to continue to hold their securities. Climate change may also influence investor sentiment with respect to the Company and investments in our portfolio and those available to clients through third parties. It may also impact other counterparties, including reinsurers, and affect the value of investments, including real estate investments we hold or manage for others. Climate risks can also arise from the inconsistencies and conflicts in the manner in which climate policy, disclosure requirements and financial regulation is implemented in the many regions where we operate, including initiatives to apply and enforce policy and regulation with extraterritorial effect. Transition risks may arise from societal adjustment to a lower-carbon economy, such as changes in public policy, adoption of new technologies or changes in consumer preferences towards low-carbon goods and services. These risks could also be influenced by changes in the physical climate. Overall, we cannot predict or estimate the long-term impacts on us from climate change or related regulation.
Our operational systems and networks (as well as those of our franchise advisors and third parties) are subject to evolving cybersecurity or other technological risks, which could result in the disclosure of confidential information, loss of our proprietary information, damage to our reputation, additional costs to us, regulatory penalties and other adverse impacts.
Our business is reliant upon internal and third-party-controlled, -developed and -operated software (which includes opensource software), technology systems and networks to process, transmit and store information, including our current, potential and former clients’, employees’ and advisors’ personal information, as well as our proprietary information, and to conduct many of our business activities and transactions. Maintaining the security and integrity of our software, information and these systems and networks, and appropriately responding to any cybersecurity and privacy incidents (including attempts to attack or access our network), is critical to the success of our business operations, including our reputation, the retention of our advisors and clients, and to the protection of our proprietary information and our clients’ personal information.
We rely on the third parties with whom we do business to identify and remediate software and other vulnerabilities in the assets and systems they use to run their business before they can be exploited by bad actors, but the third parties cannot always do so. For example, zero-day vulnerabilities in software and other technology solutions are immediately exploitable by bad actors as occasionally happens with certain of our vendors in the industry. We routinely face attacks and seek to address evolving threats of which we become aware. We have been able to identify, protect, detect, respond to and recover from these attacks to date without a material loss of client financial assets or information through the use of ongoing internal and external threat monitoring and by making continual adjustments to our security and incident response capabilities.
We and our advisors, as well as our service providers and clients, have also been threatened by, among others, phishing, vishing, and spear phishing scams, social engineering attacks (such as direct voice contact and any technology or communication mechanism to contact a person), account takeovers, introductions of malware, attempts at electronic break-ins, and the submission of fraudulent payment requests. The number of threats and events has increased substantially every year, which is expected to continue, particularly as the use of artificial intelligence makes these attempts look more legitimate. Attempted or successful breaches or interference by third parties or by insiders that may occur in the future could have a material adverse impact on our business, reputation, financial condition or results of operations.
On a corporate basis, various laws and regulations, and in some cases contractual obligations, require us to establish and maintain corporate policies and technical and operational measures designed to protect sensitive client, employee, contractor and vendor information, and to respond to cybersecurity incidents in certain ways and timeframes. We have established policies and implemented such technical and operational measures ourselves and have in place policies that require our service providers and franchisee advisors, each of which control locally their own technology operations, to do the same. The hybrid work environment among our employees adds complexity to monitoring and processing procedures. Changes in our business or technological advancements may also require corresponding changes in our systems, networks and data security and response measures. While accessing our products and services, our clients may use computers and other devices that sit outside of our security control environment. In addition, the ever-increasing reliance on technology systems and networks and the occurrence and potential adverse impact of attacks on such systems and networks (including in recent well-publicized security breaches at other companies), both generally and in the financial services industry, have enhanced government and regulatory scrutiny of the measures taken by companies to protect against cybersecurity threats and report incidents they suffer. As these threats, and government and regulatory oversight of associated risks, continue to evolve, we may be required to expend significant additional resources (both direct financial resources and indirect costs like people) to enhance or expand upon the technical and operational security and response measures we currently maintain or that we allow franchise advisors to maintain and control locally. These regulator-driven changes may adversely impact the client experience by, for example, requiring multiple or new means of verifying the identity of a client before they can interact with us.
Despite the measures we have taken and may in the future take to address and mitigate cybersecurity, privacy and technology risks, we cannot be certain that our systems and networks, or those used by our vendors and franchisees, will not be subject to successful
Ameriprise Financial, Inc.
attacks, breaches or interference. Nor can we guarantee that advisors and employees will comply with our policies and procedures in this regard, that clients will engage in safe and secure online practices, or that vendors and franchisees will effectively deploy and maintain the security measures and protocols that we impose. Furthermore, human error occurs from time to time and such mistakes can lead to the inadvertent disclosure of sensitive information. We have a vendor management process, but at times our software or service providers could push through updates that are not fully disclosed to us (or tested by them) and that could alter the control posture of their products. Any such event may result in operational disruptions, as well as unauthorized access to or the disclosure or loss of, our proprietary information or client, employee, vendor, or advisor personal information, which in turn may result in legal claims, regulatory scrutiny and liability, reputational damage, the incurrence of costs to respond to, eliminate, or mitigate further exposure, the loss of clients or advisors, or other damage to our business. While we maintain cyber liability insurance that provides both third-party liability and first-party liability coverages, it may not protect us against all cybersecurity- or privacy-related losses. Furthermore, we may be subject to indemnification costs and liability to third parties if we breach any confidentiality or security obligations regarding vendor data or for losses related to the data. In addition, the trend toward broad consumer and general-public notification of such incidents, including those where our vendors are the party being breached, could exacerbate the harm to our business, reputation, financial condition or results of operations in the event of a breach. Even if we successfully protect our technology infrastructure and the confidentiality of sensitive data and conduct appropriate incident response, we may incur significant expenses in connection with our responses to any such attacks, as well as the adoption, implementation and maintenance of appropriate security measures. In addition, our regulators may seek to hold our company responsible for the acts, mistakes or omissions of our vendors or franchise advisors even where they procure and control much of the physical office space and technology infrastructure they use to operate their businesses locally.
Protection from system interruptions and operating errors is important to our business. If we experience a sustained interruption to our telecommunications or data processing systems, or other failure in operational execution, it could harm our business.
Operating errors and system or network interruptions could delay and disrupt our operations. Interruptions could be caused by mistake, malfeasance or other operational failures by service provider staff, employee or advisor error or malfeasance, interference by third parties, including hackers, our implementation of new technology, maintenance of existing technology, or natural disasters, each of which may impact our ability to run our systems or encounter varying downtime. Though we plan for resiliency in our systems and test these capabilities, we could face additional downtime or data loss if our plans do not work as expected during a real event. Our financial, accounting, human resources, data processing or other operating systems and facilities may fail to operate or report data properly, experience connectivity disruptions or otherwise become disabled as a result of events that are wholly or partially beyond our control, adversely affecting our ability to process transactions or provide products and services to our clients (some of which have regulatory required response times). Further, we cannot control the execution of any business continuity or incident response plans implemented by our service providers or our franchise advisors.
We rely on third-party service providers and vendors for certain communications, technology and business functions and other services, and we face the risk of their operational failure (including, without limitation, loss of staff due to widespread illness, failure caused by an inaccuracy, untimeliness or other deficiency in data reporting), technical or security failures, termination or capacity constraints of any of the clearing agents, exchanges, clearing houses or other third-party service providers that we use to facilitate or are component providers to our securities transactions and other product manufacturing and distribution activities. These risks are heightened by our deployment in response to both investor interest and evolution in the financial markets of increasingly sophisticated products and technological means for interacting with these products or client accounts. Any such failure, termination or constraint or flawed execution or response could adversely impact our ability to effect transactions, service our clients, manage our exposure to risk, or otherwise achieve desired outcomes.
Risk management policies and procedures may not be fully effective in identifying or mitigating risk exposure in all market environments, products, vendors, or against all types of risk, including employee and financial advisor misconduct.
Our policies and procedures to identify, monitor and manage risks may not be fully effective in mitigating our risk exposure in all market environments or against all types of risk. Many of our methods of managing risk and the associated exposures are based upon our use of observed historical experience or expectations about future experience (e.g., market behavior, client/policyholder behavior, employee behavior, mortality, etc.) or statistics based on historical models. Experience may not emerge as expected and during periods of market volatility, or due to unforeseen events, the historically-derived experience and correlations may not be valid. As a result, these methods and models may not predict future exposures accurately, which could be significantly greater than what our models indicate. Further some controls are manual and are subject to inherent limitations and we have a general model risk where there is a risk of loss associated with insufficient or inaccurate models that we use to support our decisions. This could cause us to incur investment losses or cause our hedging and other risk management strategies to be ineffective. Other risk management methods depend upon the evaluation of information regarding markets, clients, catastrophe occurrence or other matters that are publicly available or otherwise accessible to us, which may not always be accurate, complete, up-to-date or properly evaluated.
Our financial performance also requires us to develop, effectively manage, and market new or existing products and services that appropriately anticipate or respond to changes in the industry and evolving client demands. The development and introduction of new products and services, including the creation of Asset Management and other products with a focus on environmental, social and governance matters, require continued innovative effort and may require significant time, resources, and ongoing support. Further, avoiding introducing or encouraging certain new products (such as cryptocurrency) creates the risk of losing assets or new flows to
Ameriprise Financial, Inc.
competitors who encourage or support those products. Substantial risk and uncertainties are associated with the introduction and ongoing maintenance of new products and services, including the implementation of new and appropriate operational controls and procedures, shifting and sometimes contradictory client and market preferences, the introduction of competing products or services and compliance with regulatory requirements.
Artificial intelligence (including generative artificial intelligence) presents many benefits in terms of operating efficiency, but also certain risks that we need to seek to mitigate through our strategic and risk management policies, such as reliance on information that may be inaccurate or unfairly discriminatory results. In addition, the regulatory framework and expectations relating to the use of artificial intelligence are in their early stages as is the use (and how we manage the use) of artificial intelligence in our business.
Management of operational, legal and regulatory risks requires, among other things, policies and procedures to record properly and verify a large number of transactions and events, and these policies and procedures may not be fully effective in mitigating our risk exposure in all market environments or against all types of risk, including those associated with our key vendors. Insurance and other traditional risk-shifting tools may be held by or available to us in order to manage certain exposures, but they are subject to terms such as deductibles, coinsurance, limits and policy exclusions, as well as risk of counterparty denial of coverage, default or insolvency.
As a holding company, we depend on the ability of our subsidiaries to transfer funds to us to pay dividends and to meet our obligations.
We act as a holding company for our subsidiaries, through which substantially all of our operations are conducted. Dividends and returns of capital from our subsidiaries and permitted payments to us under our intercompany arrangements with our subsidiaries are our principal sources of cash to pay shareholder dividends and to meet our financial obligations. These obligations include our operating expenses, interest and principal on our borrowings, and any other contractual commitments. If the cash we receive from our subsidiaries pursuant to dividend payment or return of capital and intercompany arrangements is insufficient for us to fund any of these obligations, we may be required to raise cash through the incurrence of additional debt, the issuance of additional equity or the sale of assets. If any of this happens, it could adversely impact our financial condition and results of operations.
Insurance, banking and securities, and other laws and regulations may regulate the ability of many of our subsidiaries (such as our insurance, banking and brokerage subsidiaries, FCA-regulated asset management entities, and our face-amount certificate company) to pay dividends, return capital or make other permitted payments or practically impact our capital structure and dividends or other payments from our subsidiaries. Additionally, the rating organizations effectively impose various financial and capital requirements on our company and our insurance company subsidiaries in order for us to maintain our ratings and the ratings of our insurance subsidiaries. The regulatory capital requirements, rating agency financial or capital expectations, and dividend-paying ability of our subsidiaries may be affected by a variety of factors, including markets, business plans, policyholder behavior, and investment decisions and performance. These differing requirements and expectations use different accounting frameworks (such as GAAP, statutory accounting principles or a mix). Further, the financial and capital requirements imposed upon our subsidiaries may be impacted by heightened regulatory or rating organization scrutiny and intervention, which could negatively affect our and our subsidiaries’ ability to pay dividends or make other permitted payments. Additionally, in the past we have found it necessary and advisable to provide support to certain of our subsidiaries in order to maintain adequate capital for regulatory or other purposes and we may provide such support in the future. The provision of such support could adversely affect our capital, liquidity, and the dividends or other permitted payments received from our subsidiaries.
The operation of our business in foreign markets and our investments in non-U.S. denominated securities and investment products subjects us to exchange rate and other risks in connection with international operations and earnings and income generated overseas.
While we are a U.S.-based company, a portion of our business operations occurs outside of the U.S. and some of our investments are not denominated in U.S. dollars. As a result, we are exposed to certain foreign currency exchange risks that could reduce U.S. dollar equivalent earnings as well as negatively impact our general account and other proprietary investment portfolios. Appreciation of the U.S. dollar could, and has, unfavorably affect net income from foreign operations, the value of non-U.S. dollar denominated investments and investments in foreign subsidiaries. In comparison, depreciation of the U.S. dollar could positively affect our net income from foreign operations and the value of non-U.S. dollar denominated investments, though such depreciation could also diminish investor, creditor and rating organizations’ perceptions of our company compared to peer companies that have a relatively greater proportion of foreign operations or investments.
In addition, conducting and increasing our international operations subjects us to additional risks that, generally, we do not face in the U.S., including: (i) potentially adverse cross-border tax consequences, including the complexities of transfer pricing, foreign value added tax systems and restrictions on the repatriation of earnings; (ii) the localization of our solutions and related costs; (iii) the burdens of complying with a wide variety of foreign laws and different, potentially conflicting legal standards, including laws and regulations; and (iv) social and economic situations outside of the U.S. The occurrence of any one of these risks could negatively affect our international business and, consequently, our results of operations generally. Additionally, operating in international markets also requires significant management attention and financial resources and we cannot be certain these operations will produce desired levels of revenues or profitability.
Ameriprise Financial, Inc.
The occurrence of natural or man-made disasters and catastrophes could adversely affect our results of operations and financial condition.
The occurrence of natural disasters and catastrophes, including earthquakes, hurricanes, floods, tornadoes, fires, blackouts, severe winter weather, explosions, pandemic disease and global health emergencies and man-made disasters, including acts of terrorism, riots, civil unrest including large-scale protests, insurrections and military actions, could adversely affect our results of operations or financial condition. Such disasters and catastrophes may damage our facilities, preventing our service providers, employees and financial advisors from performing their roles, or otherwise disturbing our ordinary business operations and by impacting insurance claims, as described below. These impacts could be particularly severe to the extent they affect access to physical facilities, the physical well-being of large numbers of our employees, our computer-based data processing, transmission, storage and retrieval systems and destroy or release valuable data. Such disasters and catastrophes may also impact us indirectly by changing the condition and behaviors of our clients, business counterparties and regulators, as well as by causing declines or volatility in the economic and financial markets.
The potential effects of natural and man-made disasters and catastrophes on certain of our businesses include but are not limited to the following: (i) a catastrophic loss of life may materially increase the amount of or accelerate the timing in which benefits are paid under our insurance policies; (ii) an increase in claims and any resulting increase in claims reserves caused by a disaster may harm the financial condition of our reinsurers, thereby impacting the cost and availability of reinsurance and the probability of default on reinsurance recoveries; (iii) widespread unavailability of staff; and (iv) declines and volatility in the financial markets that may decrease the value of our assets under management and administration, which could harm our financial condition and reduce our management fees.
We face risks arising from acquisitions and divestitures.
We have made acquisitions and divestitures in the past and may pursue similar strategic transactions in the future. Risks in acquisition transactions include difficulties in the integration of acquired businesses into our operations and control environment (including our risk management policies and procedures), difficulties in assimilating and retaining employees and intermediaries, difficulties in retaining the existing clients of the acquired entities, assumed or unforeseen liabilities that arise in connection with the acquired businesses, difficulties obtaining regulatory approval or integrating into regulatory regimes, difficulties with the software, technology and systems of the acquired entities that were subject to a different control posture before the acquisition (and until such time as we can replace these or make investments to uplift their capabilities), the failure of counterparties to satisfy any obligations to indemnify us against liabilities arising from the acquired businesses, and unfavorable market conditions that could negatively impact our growth expectations or expected synergies for the acquired businesses. Fully integrating an acquired company or business into our operations (such as our 2021 acquisition of the BMO Global Asset Management (EMEA) business) takes a significant amount of time and attention and incurs both expected and unexpected integration costs over several years. Integrations, particularly larger and more global integrations, are time-consuming and expensive and could significantly disrupt our business.
Risks in divestiture transactions (many of which are present in sales of insurance blocks via reinsurance) include difficulties in the separation of the disposed business, retention of obligations to indemnify for certain liabilities, the failure of counterparties to satisfy payment obligations, unfavorable market conditions that may impact any earnout or contingency payment due to us, if any, and unexpected difficulties in losing employees of the disposed business. We cannot provide assurance that we will be successful in overcoming these risks or any other problems encountered with acquisitions, divestitures and other strategic transactions. Execution of our business strategies also may require certain regulatory approvals or consents, which may include approvals of the FRB and other domestic and non-U.S. regulatory authorities. These regulatory authorities may impose conditions on the activities or transactions contemplated by our business strategies which may negatively impact our ability to realize fully the expected benefits of certain opportunities. These risks may prevent us from realizing the expected benefits from acquisitions or divestitures and could result in the failure to realize the full economic value of a strategic transaction or the impairment of goodwill and/or intangible assets recognized at the time of an acquisition. These risks could be heightened if we complete a large acquisition or multiple acquisitions within a short period of time.
Legal, Regulatory and Tax Risks
Legal and regulatory actions are inherent in our businesses and could result in financial losses or harm our businesses.
We are, and in the future may be, subject to legal and regulatory actions in the ordinary course of our operations, both domestically and internationally. Actions brought against us may result in judgements, verdicts, awards, settlements, penalties, injunctions or other adverse results, including reputational damage. In addition, we may incur significant expenses in connection with our defense against such actions regardless of their outcome. Various regulatory and governmental bodies have the authority to review our products and business practices and those of our employees and independent financial advisors and to bring regulatory or other legal actions against us if, in their view, our practices, or those of our employees or advisors, were or are deemed to be improper. Pending legal and regulatory actions include proceedings relating to aspects of our businesses and operations that are specific to us and proceedings that are typical of the industries and businesses in which we operate. Some of these proceedings have been brought on behalf of various alleged classes of complainants.
Ameriprise Financial, Inc.
Our businesses are heavily regulated, and changes to the laws and regulations applicable to our businesses may have an adverse effect on our operations, reputation and financial condition.
Virtually all aspects of our business, including the activities of our parent company and our various subsidiaries, are subject to various federal, state and international laws and regulations. For a discussion of the regulatory framework in which we operate, see “Business - Regulation” included in Part I, Item 1 of this Annual Report on Form 10-K. Compliance with these applicable laws and regulations is expensive, time-consuming and personnel-intensive, and we have invested and will continue to invest substantial resources to ensure compliance by our parent company and our subsidiaries, directors, officers, employees, registered representatives and agents. In addition, sometimes these laws and regulations (and potential changes) are in conflict. Further, any future legislation or changes to the laws and regulations applicable to our businesses, as well as changes to the interpretation and enforcement of such laws and regulations, may affect our operations and financial condition. Legislation could require changes to our business operations or our regulatory reporting relationships which can require significant cost, effort and trade-offs. Such changes may impact our business operations and profitability, increase our costs of doing business, increase compliance costs as well as have a material effect on fee rates, interest rates and foreign exchange rates, which could materially impact our products, services, investments, results of operations, products and liquidity in ways that we cannot predict. Ongoing changes to regulation and oversight of the financial industry may generate outcomes, the full impact of which cannot be immediately ascertained as government intervention could distort customary and expected commercial behavior.
Some of the legislative and regulatory changes could present operational challenges and increase costs. Ultimately the complexities and increased costs of legislative and regulatory changes could have an impact on our ability to offer cost-effective and innovative products to our clients.
As a Savings and Loan Holding Company, we are subject to supervision by the FRB and various prudential standards that may limit our activities and strategies.
Ameriprise Financial is subject to ongoing supervision by the FRB, including supervision and prudential standards, capital requirements, stress-testing, resolution planning, information security and privacy, and risk management requirements. Further, as a financial holding company, our activities are limited to those that are financial in nature, incidental to a financial activity or, with FRB approval, complementary to a financial activity. Our broker-dealers and bank subsidiary are limited in their ability to lend or transact with affiliates and are subject to minimum regulatory capital and other requirements, as well as limitations on their ability to use funds deposited with them in brokerage or bank accounts to fund their businesses. These requirements may hinder our ability to access funds from our subsidiaries. We may also become subject to a prohibition or limitations on our ability to pay dividends or repurchase our common stock. The federal banking regulators, including the OCC, FRB, FDIC, and SEC (through FINRA) have the authority and under certain circumstances, the obligation, to limit or prohibit dividend payments and stock repurchases by the banking organizations they supervise, including Ameriprise and its bank subsidiaries. Any changes to regulations or changes to the supervisory approach may also result in increased compliance costs to the extent we are required to modify our existing compliance policies, procedures and practices.
Compliance with bank holding company laws and regulations, including the Volcker Rule, impacts the structure and availability of certain of our products and services and our costs in providing those products and services. Costs of compliance may be driven by how these laws and regulations and the scale of Ameriprise Bank evolves over the course of time as well as strategic acquisitions and other growth strategies we pursue in the future.
Failure to meet one or more of these requirements could, depending on the violation, limit Ameriprise’s ability to undertake new activities, continue certain activities, or make acquisitions other than those permitted generally for bank holding companies. Execution of our business strategies also may require certain regulatory approvals or consents, which may include approvals of the FRB and other domestic and non-U.S. regulatory authorities. These regulatory authorities may impose conditions on the activities or transactions contemplated by our business strategies which may negatively impact our ability to realize fully the expected benefits of certain opportunities.
Changes in corporate tax laws and regulations and changes in the interpretation of such laws and regulations, as well as adverse determinations regarding the application of such laws and regulations, could adversely affect our earnings and could make some of our products less attractive to clients.
We are subject to the income tax laws of the U.S., its states and municipalities and those of the foreign jurisdictions in which we have significant business operations. We make judgments and interpretations about the application of these inherently complex tax laws when determining the provision for income taxes and also make estimates about when in the future certain items affect taxable income in the various tax jurisdictions. In addition, changes to the Internal Revenue Code, state or foreign tax laws, administrative rulings or court decisions could increase our provision for income taxes and reduce our earnings. Furthermore, guidance issued by the U.S. Department of Treasury and others has been critical to the application and impact of new laws and in avoiding unintended impacts from legislation. The jurisdictions we operate in may not always provide clear guidance that is responsive to industry questions and concerns. If guidance is unclear, it could increase our taxes or create a potential for disagreement about interpretation of the tax code.
Many of the products we offer or on which our businesses are based (including both insurance products and non-insurance products) receive favorable treatment under current U.S. federal income or estate tax law. Changes in U.S. federal income or estate tax law could
Ameriprise Financial, Inc.
reduce or eliminate the tax advantages of certain of our products and thus make such products less attractive to clients or cause a change in client demand and activity.
We may not be able to protect our intellectual property and may be subject to infringement claims.
We rely on a combination of contractual rights and copyright, trademark, patent registrations and trade secret laws to establish and protect our intellectual property. Although we use a broad range of measures to protect our intellectual property rights, third parties may infringe or misappropriate our intellectual property or attempt to use the same to defraud others. We may have to litigate to enforce and protect our brand and reputation, copyrights, trademarks, patents, trade secrets and know-how, or to determine their scope, validity or enforceability, which represents a diversion of resources that may be significant in amount and may not prove successful. The loss of intellectual property protection, or the inability to secure or enforce the protection of our intellectual property assets, could have a material adverse effect on our business and our ability to compete.
We also may be subject to costly litigation in the event that another party alleges our operations or activities infringe upon, or constitute misappropriation of, such other party’s intellectual property rights. Third parties may have, or may eventually be issued, patents or other protections that could be infringed by our products, methods, processes or services, or could otherwise limit our ability to offer certain product features. Any party that holds a patent could make a claim of infringement against us. The threat of patent litigation from non-practicing entities could impact financial services firms and successful resolution could still have a significant financial impact. We may also be subject to claims by third parties for breach of copyright, trademark, license rights, or misappropriation of trade secret rights. Any such claims and any resulting litigation could result in significant liability for damages. If we were found to have infringed or misappropriated a third-party patent or other intellectual property rights, we could incur substantial liability, and in some circumstances could be enjoined from providing certain products or services to our clients or utilizing and benefiting from certain methods, processes, copyrights, trademarks, trade secrets or licenses, or alternatively could be required to enter into costly licensing arrangements with third parties, all of which could have a material adverse effect on our business, results of operations and financial condition.
Changes in and the adoption of accounting standards could have a material impact on our financial statements.
Our accounting policies provide a standard for how we record and report our results of operations and financial condition. We prepare our financial statements in accordance with U.S. generally accepted accounting principles. It is possible that accounting changes could have a material effect on our results of operations and financial condition. The Financial Accounting Standards Board, the SEC and other regulators often change the financial accounting and reporting standards governing the preparation of our financial statements. These changes are difficult to predict and could impose additional governance, internal control and disclosure demands. In some cases, we could be required to apply a new or revised standard retrospectively, resulting in our restating prior period financial statements.
Item 1B. Unresolved Staff Comments
None.
Item 1C. Cybersecurity
Risk Management and Strategy
Cybersecurity is a key part of our business and client experience and is integrated into our enterprise risk management processes and policies. We maintain written policies, processes and procedures that seek to identify, protect, detect, respond to, and recover from known and emerging cybersecurity risks. Our program includes consuming threat intelligence and ongoing monitoring of known external threats. We also have operating policies and procedures designed to comply with applicable requirements in jurisdictions we operate in globally. Our policies and procedures are regularly reviewed and internally assessed to enhance our corporate security capabilities. We make ongoing investments in our technology infrastructure to support cybersecurity efforts and support reliability and the user experience. We offer clients and advisors a variety of options to help secure their information, including multi-factor authentication and the use of secure messaging sites. We provide our employees and advisors with ongoing security training and periodically test their skills and understanding with various cybersecurity exercises.
We remain vigilant against cybersecurity risks as part of operating our business. Our cybersecurity team is led by experienced staff, including our Chief Information Officer, who has been with the company in various technology positions since 2002. Previously, he worked for other companies holding senior delivery and architecture roles and holds both a bachelor’s degree in engineering and an MBA. Our Chief Information Security Officer has over 30 years of broad IT experience, with expertise in Information Security. His background also includes systems design and development, and he has expertise in database administration and database platforms across both mainframe and distributed platforms. Prior to joining the company, he worked as a consultant and a developer at other companies. Our risk management approach involves a matrixed structure of leaders who bring various levels of cybersecurity and technology expertise to their areas of risk management. Our technology team relies on their enterprise-wide colleagues’ expertise when needed to plan, respond, and mitigate incidents.
We conduct regular vulnerability scanning and related remediation activities for our applications and systems. We have documented expectations for the patching and updating of our software environment and set similar expectations for our financial advisors and third-party service providers where they retain control of their environment. Our cybersecurity approach supports both business
Ameriprise Financial, Inc.
continuity and risk mitigation. Should an incident occur, we have plans in place that are designed to mitigate the impact to our operations while we respond and recover, if necessary. We run a global security operations center that continuously monitors our networks and systems and is prepared to contact the appropriate teams to respond to an incident should one occur. Depending on the incident, the response group may include participation from a wide variety of groups across the enterprise. We conduct regular exercises to verify that our business continuity plans are capable of recovering our operating capabilities in line with our business needs and expectations. In addition, our global privacy team provides oversight and support to business and staff groups in conducting annual risk assessments regarding the secure handling of personally identifiable information.
Additionally, as part of our formal procurement and vendor management process, we ask our third-party service providers to have and maintain cybersecurity programs that are consistent with our legal and regulatory obligations, and we review cybersecurity risk assessments of those third-party service providers who provide key technology and services. For third-party service providers that do go through our formal procurement process and vendor risk management assessment, our Enterprise Third-Party Risk Management team assigns tiers. The tiers are based on a combination of criteria, including the services provided and the information to which they have access, to focus the most detailed reviews and the most frequent assessments on highest tiered third-party service providers, while also maintaining an appropriate level of review and monitoring on lower tiers. Some third-party service providers contracted outside of the formal procurement process may still be subject to providing information about their security programs based on services performed.
Our Enterprise Third-Party Risk Management Office provides oversight and support to the business teams as end-users of the third-party service providers’ goods and services, while also providing a conduit through which oversight can be conducted by our management and Board of Directors. When a third-party service provider is off-boarded through our procurement and third-party risk management process, they are subject to an off-boarding review when the relationship ends that is designed to obtain the return or destruction of our information. Our Enterprise Third-Party Risk Management Office provides risk assessment reporting to business teams, internal risk management committees and our executive leadership. The reporting structure supports an effective design of the program, provides transparency, and drives regulatory compliance. Third-party service providers that participate in the delivery of services to us, as well as their fourth-parties, are also generally expected to have and maintain cybersecurity defenses, so long as they participate in the delivery of services to us to help protect our systems and our clients from incursions through third-party services’ systems. Should one of our third-party service providers suffer a breach in their or their fourth-party systems, we rely on them to inform us and work with us to protect our systems, remediate breaches, and mitigate the impact to our clients and our technology.
Governance
Strong ongoing governance practices and policies support our cybersecurity program. The Board of Directors and the Audit and Risk Committee are central to the oversight of the company’s cybersecurity risk management program operated by senior management. In addition to the Audit and Risk Committee receiving quarterly cybersecurity updates, the Audit and Risk Committee discusses with management, the General Auditor, and others the company’s enterprise-wide risk assessment and risk management processes. These updates to the Audit and Risk Committee include a review of prevailing material risks and exposures, including cybersecurity and data protection threats and risks, the actions taken to address these threats and mitigate these risks, and the design and effectiveness of our processes and controls in light of evolving market, business, regulatory, and other conditions. Our Audit and Risk Committee has semiannual trainings, to which the full Board of Directors is also invited, to stay educated on ever-evolving cybersecurity topics. These processes and information sharing enable the Board of Directors, the Audit and Risk Committee, and our management team to remain informed and aligned about our approach to cybersecurity risk, and the monitoring of these risks and incidents, as appropriate. Our executive Vice President of Technology and Chief Information Officer, our Chief Information Security Officer, and other officers regularly review with our Board of Directors and the Audit and Risk Committee topics such as the following: the cyber threat landscape; the design, effectiveness and ongoing enhancement of our capabilities to identify, protect, detect, respond to and recover from cyber threats and events; and any incidents that merit discussion.
During 2024, the Audit and Risk Committee reviewed and received reports on our identity theft prevention and privacy programs, including the following topics: emerging risks, identity theft threats, experience and trends; the effectiveness of existing controls and planned enhancements to controls; and key areas of focus for the identity theft and privacy programs.
Ameriprise Financial, Inc.
Item 2. Properties
We operate our business from two principal locations, both of which are located in Minneapolis, Minnesota: the Ameriprise Financial Center, a 959,000 square foot building that we lease, and the Ameriprise Financial Headquarters, an 871,000 square foot building, that we own. In 2023, we started the process to consolidate our Minneapolis office footprint, and we plan to move all our Minneapolis based employees to the Ameriprise Financial Headquarters by June 30, 2025. Generally, we lease the premises we occupy in other locations, including the 38,000 square foot executive offices that we lease in New York City and branch offices for our employee advisors throughout the U.S.
Our other principal leases are in the following locations:
•Columbia Threadneedle occupies 82,000 square feet of offices in Boston. Columbia Threadneedle also leases approximately 66,000 square feet of a shared building in London plus an additional 60,000 square feet in three shared buildings in London (as well as additional locations in Swindon, U.K., Dorking, U.K. and Edinburgh, U.K.), approximately 39,000 square feet of a shared building in New York and also leases property in a number of other cities to support its global operations;
•Las Vegas, Nevada (supporting aspects of our Advice & Wealth Management businesses) and Gurugram and Noida, India (supporting our broader business in the U.S. and globally). We are also opening a new support office in Hyderabad, India in early 2025.
•We also occupy a Charlotte, North Carolina location in a 53,000 square feet space that we lease for corporate and business support.
We believe that the facilities owned or occupied by our company suit our needs and are well maintained.
Item 3. Legal Proceedings
For a discussion of material legal proceedings, see Note 26 to our Consolidated Financial Statements included in Part II, Item 8 of this Annual Report on Form 10-K, which is incorporated herein by reference.
Item 4. Mine Safety Disclosures
Not applicable.
Ameriprise Financial, Inc.
PART II.
Item 5. Market for Registrant’s Common Equity, Related Stockholder Matters and Issuer Purchases of Equity Securities
Our common stock trades principally on The New York Stock Exchange under the trading symbol AMP. As of February 7, 2025, we had approximately 11,118 common shareholders of record. Information regarding our equity compensation plans can be found in Part III, Item 12 of this Annual Report on Form 10-K. Information comparing the cumulative total shareholder return on our common stock to the cumulative total return for certain indices is set forth under the heading “Performance Graph” provided in our 2024 Annual Report to Shareholders and is furnished herewith.
We are primarily a holding company and, as a result, our ability to pay dividends in the future will depend on receiving dividends from our subsidiaries. For information regarding our ability to pay dividends, see the information set forth under the heading “Management’s Discussion and Analysis of Financial Condition and Results of Operations — Liquidity and Capital Resources” contained in Part II, Item 7 of this Annual Report on Form 10-K.
Share Repurchases
The following table presents the information with respect to purchases made by or on behalf of Ameriprise Financial, Inc. or any “affiliated purchaser” (as defined in Rule 10b-18(a)(3) under the Exchange Act), of our common stock during the fourth quarter of 2024:
| | | | | | | | | | | | | | | | | | | | | | | | | | |
| | (a) | | (b) | | (c) | | (d) |
| Period | | Total Number of Shares Purchased | | Average Price Paid Per Share | | Total Number of Shares Purchased as part of Publicly Announced Plans or Programs (1) | | Approximate Dollar Value of Shares that May Yet Be Purchased Under the Plans or Programs (1) |
| October 1, 2024 to October 31, 2024 | | | | | | | | |
Share repurchase program (1) | | 355,544 | | | $ | 510.95 | | | 355,544 | | | $ | 1,325,717,875 | |
Employee transactions (2) | | 25,979 | | | $ | 502.42 | | | N/A | | N/A |
| November 1, 2024 to November 30, 2024 | | | | | | | | |
Share repurchase program (1) | | 406,996 | | | $ | 554.89 | | | 406,996 | | | $ | 1,099,878,072 | |
Employee transactions (2) | | 93,420 | | | $ | 560.03 | | | N/A | | N/A |
| December 1, 2024 to December 31, 2024 | | | | | | | | |
Share repurchase program (1) | | 384,296 | | | $ | 551.67 | | | 384,296 | | | $ | 887,872,922 | |
Employee transactions (2) | | 18,229 | | | $ | 556.12 | | | N/A | | N/A |
| Totals | | | | | | | | |
Share repurchase program (1) | | 1,146,836 | | | $ | 540.19 | | | 1,146,836 | | | |
Employee transactions (2) | | 137,628 | | | $ | 548.64 | | | N/A | | |
| | | 1,284,464 | | | | | 1,146,836 | | | |
N/A Not applicable.
(1) On July 24, 2023, our Board of Directors authorized an additional $3.5 billion for the repurchase of our common stock through September 30, 2025. The share repurchase program does not require the purchase of any minimum number of shares, and depending on market conditions and other factors, these purchases may be commenced or suspended at any time without prior notice. Acquisitions under the share repurchase program may be made in the open market, through privately negotiated transactions or block trades or other means.
(2) Includes restricted shares withheld pursuant to the terms of awards under the Company’s share-based compensation plans to offset tax withholding obligations that occur upon vesting and release of restricted shares. The value of the restricted shares withheld is the closing price of common stock of Ameriprise Financial, Inc. on the date the relevant transaction occurs. Also includes shares withheld pursuant to the net settlement of Non-Qualified Stock Option (“NQSO”) exercises to offset tax withholding obligations that occur upon exercise and to cover the strike price of the NQSO. The value of the shares withheld pursuant to the net settlement of NQSO exercises is the closing price of common stock of Ameriprise Financial, Inc. on the day prior to the date the relevant transaction occurs.
Item 6. [Reserved]
Ameriprise Financial, Inc.
Item 7. Management’s Discussion and Analysis of Financial Condition and Results of Operations
The following discussion and analysis of our consolidated financial condition and results of operations should be read in conjunction with the “Forward-Looking Statements,” our Consolidated Financial Statements and Notes that follow and the “Risk Factors” included in our Annual Report on Form 10-K. References to “Ameriprise Financial,” “Ameriprise,” the “Company,” “we,” “us,” and “our” refer to Ameriprise Financial, Inc. exclusively, to our entire family of companies, or to one or more of our subsidiaries.
Overview
Ameriprise Financial is a diversified financial services company with a 130-year history of providing financial solutions. We are a long-standing leader in financial planning and advice with $1.5 trillion in assets under management, administration, and advisement as of December 31, 2024. We offer a broad range of products and services designed to achieve individual and institutional clients’ financial objectives. For additional discussion of our businesses, see Part I, Item 1 of this Annual Report on Form 10-K.
The products and services we provide retail clients and, to a lesser extent, institutional clients, are the primary source of our revenues and net income. Revenues and net income are significantly affected by investment performance and the total value and composition of assets we manage and administer for our retail and institutional clients as well as the distribution fees we receive from other companies. These factors, in turn, are largely determined by overall investment market performance and the depth and breadth of our individual client relationships.
We operate our business in the broader context of the macroeconomic forces around us, including the global and U.S. economies, changes in interest and inflation rates, financial market volatility, fluctuations in foreign exchange rates, geopolitical strain, pandemics, the competitive environment, client and customer activities and preferences, and the various regulatory and legislative developments. Financial markets and macroeconomic conditions have had and will continue to have a significant impact on our operating and performance results. In addition, the business, political and regulatory environments in which we operate are subject to elevated uncertainty and substantial, frequent change. Accordingly, we expect to continue focusing on our key strategic objectives and obtaining operational and strategic leverage from our core capabilities. The success of these and other strategies may be affected by the factors discussed in Item 1A of this Annual Report on Form 10-K - “Risk Factors” - and other factors as discussed herein.
Equity price, credit market and interest rate fluctuations can have a significant impact on our results of operations, primarily due to the effects they have on the asset management and other asset-based fees we earn, the values of market risk benefits and embedded derivatives associated with our variable annuities and the values of derivatives held to hedge these benefits and the “spread” income generated on our deposit products, fixed insurance, the fixed portion of variable annuities and variable insurance contracts and fixed deferred annuities. We have been operating in a historically low interest rate environment but have recently experienced a substantial increase in rates with uncertainty about where rates will go in the future. A higher (lower) interest rate environment may result in decreases (increases) to our long-duration contract reserves, which may impact our adjusted operating earnings after tax. For additional discussion on our interest rate risk, see Item 7A. “Quantitative and Qualitative Disclosures About Market Risk.”
In the third quarter, we conducted our annual review of life insurance, annuity and long term care (“LTC”) valuation assumptions relative to current experience and management expectations including modeling changes. These annual assumption updates are collectively referred to as unlocking throughout this document. See our Consolidated and Segment Results of Operations sections for the pretax impacts on our revenues and expenses attributable to unlocking.
The following discussion includes a comparison of our 2024 and 2023 results. For a discussion of our 2022 results and for a comparison of results for 2023 and 2022, see Item 7, Management’s Discussion and Analysis of Financial Condition and Results of Operations, of our Annual Report on Form 10-K for the year ended December 31, 2023, which was filed with the SEC on February 22, 2024. We consolidate certain variable interest entities for which we provide asset management services. These entities are defined as consolidated investment entities (“CIEs”). While the consolidation of the CIEs impacts our balance sheet and income statement, our exposure to these entities is unchanged and there is no impact to the underlying business results. For further information on CIEs, see Note 5 to our Consolidated Financial Statements. The results of operations of the CIEs are reflected in the Corporate & Other segment. On a consolidated basis, the management fees we earn for the services we provide to the CIEs and the related general and administrative expenses are eliminated and the changes in fair value of assets and liabilities related to the CIEs, primarily syndicated loans and debt, are reflected in Net investment income. We include the fees from these entities in the Management and financial advice fees line within our Asset Management segment.
While our Consolidated Financial Statements are prepared in accordance with U.S. generally accepted accounting principles (“GAAP”), management believes that adjusted operating measures, which exclude net realized investment gains or losses, net of the reinsurance accrual; the market impact on non-traditional long-duration products (including variable and fixed deferred annuity contracts and universal life (“UL”) insurance contracts), net of hedges and the reinsurance accrual; mean reversion related impacts (the impact on variable annuity and variable universal life (“VUL”) products for the difference between assumed and updated separate account investment performance on the reinsurance accrual and additional insurance benefit reserves); the market impact of hedges to offset interest rate and currency changes on unrealized gains or losses for certain investments; block transfer reinsurance transaction impacts; gain or loss on disposal of a business that is not considered discontinued operations; integration and restructuring charges;
Ameriprise Financial, Inc.
income (loss) from discontinued operations; and the impact of consolidating CIEs, best reflect the underlying performance of our core operations and facilitate a more meaningful trend analysis.
The market impact on non-traditional long-duration products includes changes in market risk benefits and embedded derivative values caused by changes in financial market conditions, net of changes in economic hedge values and unhedged items including the difference between assumed and actual underlying separate account investment performance, fixed income credit exposures, transaction costs and certain policyholder contract elections. The market impact also includes certain valuation adjustments made in accordance with FASB Accounting Standards Codification 820, Fair Value Measurements and Disclosures, including the impact on embedded derivative values of discounting projected benefits to reflect a current estimate of our life insurance subsidiaries’ nonperformance spread.
Management uses these non-GAAP measures to evaluate our financial performance on a basis comparable to that used by some securities analysts and investors. Also, certain of these non-GAAP measures are taken into consideration, to varying degrees, for purposes of business planning and analysis and for certain compensation-related matters. Throughout our Management’s Discussion and Analysis, these non-GAAP measures are referred to as adjusted operating measures. These non-GAAP measures should not be viewed as a substitute for U.S. GAAP measures.
Concurrent with the adoption of Accounting Standards Update 2018-12, Targeted Improvements to the Accounting for Long-Duration Contracts, management no longer excludes adjustments for deferred acquisition costs (“DAC”), deferred sales inducement costs (“DSIC”) and unearned revenue amortization from adjusted operating earnings measures. Amortization of DAC, DSIC, and unearned revenue is no longer impacted by markets and is now amortized on a constant-level basis in accordance with GAAP.
It is management’s priority to increase shareholder value over a multi-year horizon by achieving our on-average, over-time financial targets.
Our financial targets are:
•Adjusted operating earnings per diluted share growth of 12% to 15%, and
•Adjusted operating return on equity of over 30%.
The following table reconciles our GAAP measures to adjusted operating measures:
| | | | | | | | | | | | | | | | | | | | | | | |
| | Per Diluted Share |
| | Years Ended December 31, | | Years Ended December 31, |
| 2024 | | 2023 | | 2024 | | 2023 |
| (in millions, except per share amounts) |
| Net income | $ | 3,401 | | | $ | 2,556 | | | $ | 33.05 | | | $ | 23.71 | |
| Less Adjustments: | | | | | | | |
Net realized investment gains (losses) (1) | (21) | | | (32) | | | (0.20) | | | (0.30) | |
Market impact on non-traditional long-duration products (1) | (153) | | | (608) | | | (1.49) | | | (5.63) | |
Mean reversion related impacts (1) | 1 | | | — | | | 0.01 | | | — | |
| | | | | | | |
| | | | | | | |
| | | | | | | |
Integration/restructuring charges (1) | — | | | (62) | | | — | | | (0.58) | |
| Net income (loss) attributable to CIEs | 3 | | | — | | | 0.03 | | | — | |
Tax effect of adjustments (2) | 36 | | | 147 | | | 0.35 | | | 1.36 | |
| Adjusted operating earnings | $ | 3,535 | | | $ | 3,111 | | | $ | 34.35 | | | $ | 28.86 | |
| | | | | | | |
| Weighted average common shares outstanding: | | | | | | | |
| Basic | 101.0 | | | 105.7 | | | | | |
| Diluted | 102.9 | | | 107.8 | | | | | |
(1) Pretax adjusted operating adjustments.
(2) Calculated using the statutory tax rate of 21%.
Ameriprise Financial, Inc.
The following table reconciles net income to adjusted operating earnings and the five-point average of quarter-end equity to adjusted operating equity:
| | | | | | | | | | | |
| | Years Ended December 31, |
| 2024 | | 2023 |
| (in millions) |
| Net income | $ | 3,401 | | | $ | 2,556 | |
Less: Adjustments (1) | (134) | | | (555) | |
| Adjusted operating earnings | $ | 3,535 | | | $ | 3,111 | |
| | | |
| Total Ameriprise Financial, Inc. shareholders’ equity | $ | 5,109 | | | $ | 4,116 | |
| Less: AOCI, net of tax | (1,739) | | | (2,297) | |
| Total Ameriprise Financial, Inc. shareholders’ equity, excluding AOCI | 6,848 | | | 6,413 | |
| Less: Equity impacts attributable to CIEs | (3) | | | (4) | |
| Adjusted operating equity | $ | 6,851 | | | $ | 6,417 | |
| | | |
| Return on equity, excluding AOCI | 49.7 | % | | 39.9 | % |
Adjusted operating return on equity, excluding AOCI (2) | 51.6 | % | | 48.5 | % |
(1) Adjustments reflect the sum of after-tax net realized investment gains/losses, net of the reinsurance accrual; the market impact on non-traditional long-duration products (including variable and fixed deferred annuity contracts and UL insurance contracts), net of hedges and the reinsurance accrual; mean reversion related impacts; block transfer reinsurance transaction impacts; the market impact of hedges to offset interest rate and currency changes on unrealized gains or losses for certain investments; gain or loss on disposal of a business that is not considered discontinued operations; integration and restructuring charges; income (loss) from discontinued operations; and net income (loss) from consolidated investment entities. After-tax is calculated using the statutory tax rate of 21%.
(2) Adjusted operating return on equity, excluding accumulated other comprehensive income (“AOCI”) is calculated using adjusted operating earnings in the numerator and Ameriprise Financial shareholders’ equity, excluding AOCI and the impact of consolidating investment entities using a five-point average of quarter-end equity in the denominator. After-tax is calculated using the statutory rate of 21%.
Critical Accounting Estimates
The accounting and reporting policies that we use affect our Consolidated Financial Statements. Certain of our accounting and reporting policies are critical to an understanding of our consolidated results of operations and financial condition and, in some cases, the application of these policies can be significantly affected by the estimates, judgments and assumptions made by management during the preparation of our Consolidated Financial Statements. The accounting and reporting policies and estimates we have identified as fundamental to a full understanding of our consolidated results of operations and financial condition are described below. See Note 2 to our Consolidated Financial Statements for further information about our accounting policies.
Valuation of Investments
The most significant component of our investments is our Available-for-Sale securities, which we carry at fair value within our Consolidated Balance Sheets. See Note 16 to our Consolidated Financial Statements for discussion of the fair value of our Available-for-Sale securities. Financial markets are subject to significant movements in valuation and liquidity, which can impact our ability to liquidate and the selling price that can be realized for our securities and increases the use of judgment in determining the estimated fair value of certain investments. We are unable to predict impacts and determine sensitivities in reported amounts reflecting such market movements on our aggregate Available-for-Sale portfolio. Changes to these assumptions do not occur in isolation and it is impracticable to predict such impacts at the individual security unit of measure which are predominately Level 2 fair value and based on observable inputs.
Market Risk Benefits
Market risk benefits are contracts or contract features that both provide protection to the contractholder from other-than-nominal capital market risk and expose us to other-than-nominal capital market risk. Market risk benefits include certain contract features on variable annuity products that provide minimum guarantees to policyholders. Guarantees accounted for as market risk benefits include guaranteed minimum death benefit (“GMDB”), guaranteed minimum income benefit (“GMIB”), guaranteed minimum withdrawal benefit (“GMWB”) and guaranteed minimum accumulation benefit (“GMAB”).
Variable Annuities
We have approximately $86 billion of variable annuity account value that has been issued over a period of more than fifty years. The diversified variable annuity block consists of $43 billion of account value with no living benefit guarantees and $43 billion of account value with living benefit guarantees, primarily GMWB provisions. The business is predominately issued through the Ameriprise Financial® advisor network. The majority of the variable annuity contracts currently offered by us contain GMDB provisions. We also previously offered contracts containing GMWB, GMAB or GMIB provisions. See Note 13 to our Consolidated Financial Statements for further discussion of our variable annuity contracts.
Ameriprise Financial, Inc.
In determining the assets or liabilities for market risk benefits, we project these benefits and contract assessments using actuarial models to simulate various equity market scenarios. Significant assumptions made in projecting future benefits and assessments relate to customer asset value growth rates, mortality, surrenders (also referred to as persistency), benefit utilization and investment margins. Management reviews, and where appropriate, adjusts its assumptions each quarter. Unless management identifies a material deviation over the course of quarterly monitoring, management reviews and updates these assumptions annually in the third quarter of each year.
In addition, the valuation of market risk benefits is impacted by an estimate of our nonperformance risk adjustment. This estimate includes a spread over the U.S. Treasury curve as of the balance sheet date. As our estimate of this spread widens or tightens, the liability will decrease or increase, respectively. The change in fair value due to changes in our nonperformance risk is recorded in other comprehensive income.
Regarding the exposure to variable annuity living benefit guarantees, changes to reserves due to behavioral risk are driven by changes in policyholder surrenders and utilization of guaranteed withdrawal benefits. We have extensive experience studies and analysis to monitor changes and trends in policyholder behavior. A significant volume of company-specific policyholder experience data is available and provides management with the ability to regularly analyze policyholder behavior. On a monthly basis, actual surrender and benefit utilization experience is compared to expectations. Experience data includes detailed policy information providing the opportunity to review impacts of multiple variables. The ability to analyze differences in experience, such as presence of a living benefit rider, existence of surrender charges, and tax qualifications provide us an effective approach in detecting changes in policyholder behavior.
At least annually, we perform a thorough policyholder behavior analysis to validate the assumptions included in our market risk benefit reserves. The variable annuity assumptions and resulting reserve computations reflect multiple policyholder variables. Differentiation in assumptions by policyholder age, existence of surrender charges, guaranteed withdrawal utilization, and tax qualification are examples of factors recognized in establishing management’s assumptions used in market risk benefit calculations. The extensive data derived from our variable annuity block informs management in confirming previous assumptions and revising the variable annuity behavior assumptions. Changes in assumptions are governed by a review and approval process to ensure an appropriate measurement of all impacted financial statement balances. Changes in these assumptions can be offsetting and we are unable to predict their movement, sensitivities in reported amounts, offsetting impacts, or future impacts to the Consolidated Financial Statements over time or in any given future period.
Future Policy Benefits and Claims
We establish reserves to cover the benefits associated with non-traditional and traditional long-duration products. Non-traditional long-duration products include variable and structured variable annuity contracts, fixed annuity contracts and UL and VUL policies. Traditional long-duration products include term life insurance, whole life insurance, disability income (“DI”) and LTC insurance and life contingent payout annuity products. UL and VUL policies with product features that result in profits followed by losses are accounted for as insurance liabilities. The portion of structured variable annuities, indexed annuities and indexed universal life (“IUL”) policies allocated to the indexed account is accounted for as an embedded derivative.
The establishment of reserves is an estimation process using a variety of methods, assumptions and data elements. If actual experience is better than or equal to the results of the estimation process, then reserves should be adequate to provide for future benefits and expenses. If actual experience is worse than the results of the estimation process, additional reserves may be required.
Non-Traditional Long-Duration Products, including Embedded Derivatives
UL and VUL
A portion of our UL and VUL policies have product features that result in profits followed by losses from the insurance component of the contract. These profits followed by losses can be generated by the cost structure of the product or secondary guarantees in the contract. The secondary guarantee ensures that, subject to specified conditions, the policy will not terminate and will continue to provide a death benefit even if there is insufficient policy value to cover the monthly deductions and charges. The liability for these future losses is determined at the reporting date using actuarial models to estimate the death benefits in excess of account value and recognizing the excess over the estimated life based on expected assessments (e.g. cost of insurance charges, contractual administrative charges, similar fees and investment margin). Significant assumptions made in projecting future benefits and assessments relate to client asset value growth rates, mortality, persistency and investment margins. Changes in these assumptions can be offsetting and we are unable to predict their movement, sensitivities in reported amounts, offsetting impacts, or future impacts to the Consolidated Financial Statements over time or in any given future period. See Note 11 to our Consolidated Financial Statements for information regarding the liability for contracts with secondary guarantees.
Embedded Derivatives
The fair value of embedded derivatives related to structured variable annuities, indexed annuities and IUL fluctuates based on equity markets and interest rates and is reported within our total liabilities. In addition, the valuation of embedded derivatives is impacted by an estimate of our nonperformance risk adjustment. This estimate includes a spread over the U.S. Treasury curve as of the balance sheet date. As our estimate of this spread widens or tightens, the liability will decrease or increase, respectively.
See Note 16 to our Consolidated Financial Statements for information regarding the fair value measurement of embedded derivatives.
Ameriprise Financial, Inc.
Traditional Long-Duration Products
The liabilities for traditional long-duration products include cash flows related to unpaid amounts on reported claims, estimates of benefits payable on claims incurred but not yet reported and estimates of benefits that will become payable on term life, whole life, DI, LTC, and life contingent payout annuity policies as claims are incurred in the future. Accordingly, the claim liability (also referred to as disabled life reserves) is presented together as one liability for future policy benefits.
A liability for future policy benefits, which is the present value of estimated future policy benefits to be paid to or on behalf of policyholders and certain related expenses less the present value of estimated future net premiums to be collected from policyholders, is accrued as premium revenue is recognized. Expected insurance benefits are accrued over the life of the contract in proportion to premium revenue recognized (referred to as the net premium approach). The net premium ratio reflects cash flows from contract inception to contract termination (i.e., through the claim paying period) and cannot exceed 100%.
The liability for future policy benefits is updated for actual experience at least on an annual basis and concurrent with changes to cash flow assumptions. When net premiums are updated for cash flow changes, the estimated cash flows over the entire life of a group of contracts are updated using historical experience and updated future cash flow assumptions. Changes in these assumptions can be offsetting and we are unable to predict their movement, sensitivities in reported amounts, offsetting impacts, or future impacts to the Consolidated Financial Statements over time or in any given future period.
The cash flows used in the calculation are discounted using the forward rate curve on the original contract issue date. The discount rate represents an upper-medium-grade (i.e., low credit risk) fixed-income instrument yield (i.e., an A rating) that reflects the duration characteristics of the liability.
Derivative Instruments and Hedging Activities
We use derivative instruments to manage our exposure to various market risks. All derivatives are recorded at fair value. The fair value of our derivative instruments is determined using either market quotes or valuation models that are based upon the net present value of estimated future cash flows and incorporate current market observable inputs to the extent available. We are unable to predict impacts and determine sensitivities in reported amounts reflecting such market movements on our aggregate derivative portfolio. Changes to assumptions do not occur in isolation and it is impracticable to predict such impacts at the individual security unit of measure which are predominately Level 2 fair value and based on observable inputs.
For further details on the types of derivatives we use and how we account for them, see Note 2, Note 16 and Note 18 to our Consolidated Financial Statements. For discussion of our market risk exposures and hedging program and related sensitivity testing, see Item 7A. “Quantitative and Qualitative Disclosures About Market Risk.”
Recent Accounting Pronouncements
For information regarding recent accounting pronouncements and their expected impact on our future consolidated results of operations and financial condition, see Note 3 to our Consolidated Financial Statements.
Sources of Revenues and Expenses
Management and Financial Advice Fees
Management and financial advice fees relate primarily to fees earned from managing mutual funds, private funds, separate account and wrap account assets and institutional investments, as well as fees earned from providing financial advice, administrative services (including transfer agent and administration fees earned from providing services to retail mutual funds) and other custodial services. Management and financial advice fees include performance-based incentive management fees, which we may receive on certain management contracts. Management and financial advice fees also include mortality and expense risk fees.
Distribution Fees
Distribution fees primarily include point-of-sale fees (such as mutual fund front-end sales loads) and asset-based fees (such as 12b-1 distribution and shareholder service fees). Distribution fees also include amounts received under marketing support arrangements for sales of mutual funds and other companies’ products, such as through our wrap accounts, as well as surrender charges on annuities and UL and VUL insurance. Distribution fees also include revenue for placing clients’ deposits in its brokerage sweep program with third-party banks as well as revenue from brokerage clients for the execution of requested trades.
Net Investment Income
Net investment income primarily includes interest income on fixed maturity securities classified as Available-for-Sale, mortgage loans, policy loans, margin loans, pledged asset lines of credit, other investments, cash and cash equivalents and investments of CIEs; the changes in fair value of trading securities, certain derivatives and certain assets and liabilities of CIEs; the pro rata share of net income or loss on equity method investments; realized gains and losses on the sale of investments; and changes for the allowance for credit losses.
Premiums, Policy and Contract Charges
Premiums include premiums on traditional life, DI and LTC insurance and payout annuities with a life contingent feature and are net of reinsurance premiums. Policy and contract charges include variable annuity rider charges and UL and VUL insurance charges,
Ameriprise Financial, Inc.
which consist of cost of insurance charges (net of reinsurance premiums and cost of reinsurance for UL and VUL insurance products) and administrative charges.
Other Revenues
Other revenues primarily include the accretion on the fixed annuities reinsurance deposit receivables and other miscellaneous revenues.
Banking and Deposit Interest Expense
Banking and deposit interest expense primarily includes interest expense related to investment certificates and banking deposits.
Distribution Expenses
Distribution expenses primarily include compensation paid to our financial advisors, registered representatives, third-party distributors and wholesalers. The portion of these costs which are incremental and direct to the acquisition of a new or renewal insurance policy or annuity contract issued by the RiverSource Life companies are deferred. The amounts capitalized and amortized are based on actual distribution costs. The majority of these costs, such as advisor and wholesaler compensation, vary directly with the level of sales. Distribution expenses also include marketing support and other distribution and administration related payments made to affiliated and unaffiliated distributors of products provided by our affiliates. The majority of these expenses vary with the level of sales, or assets held, by these distributors, and the remainder is fixed. Distribution expenses also include wholesaling costs.
Interest Credited to Fixed Accounts
Interest credited to fixed accounts represents amounts earned by contractholders and policyholders on fixed account values associated with UL and VUL insurance and annuity contracts. The changes in fair value of fixed deferred indexed annuity and IUL embedded derivatives and the derivatives hedging these products are also included within Interest credited to fixed accounts.
Benefits, Claims, Losses and Settlement Expenses
Benefits, claims, losses and settlement expenses consist of amounts paid and changes in liabilities held for anticipated future benefit payments under insurance policies and annuity contracts, along with costs to process and pay such amounts. Amounts are net of benefit payments recovered or expected to be recovered under reinsurance contracts. Benefits, claims, losses and settlement expenses exclude the impact of remeasurement of future policy benefit reserves, which is separately presented. The changes in fair value of structured variable annuity embedded derivatives and the derivatives hedging this benefit, as well as the amortization of DSIC are also included in Benefits, claims, losses and settlement expenses.
Remeasurement (Gains) Losses of Future Policy Benefit Reserves
Remeasurement (gains) losses of future policy benefit reserves represents changes to the net premium ratio for actual versus expected experience and updates to cash flow assumptions used to measure traditional long-duration and limited-payment insurance contracts.
Change in Fair Value of Market Risk Benefits
Change in fair value of market risk benefits includes the change in fair value of GMDB, GMIB, GMWB and GMAB as well as the changes in fair value of derivatives hedging these market risk benefits. Changes in fair value of market risk benefits are recognized in net income each period with the exception of the portion of the change in fair value due to a change in the instrument-specific credit risk, which is recognized in other comprehensive income (“OCI”).
Amortization of DAC
Direct sales commissions and other costs capitalized as DAC are amortized over time. DAC are amortized on a constant-level basis for the grouped contracts over the expected contract term to approximate straight-line amortization.
Interest and Debt Expense
Interest and debt expense primarily includes interest on corporate debt and CIE debt, the impact of interest rate hedging activities and amortization of debt issuance costs.
General and Administrative Expense
General and administrative expense includes compensation, share-based awards and other benefits for employees (other than employees directly related to distribution, such as financial advisors), professional and consultant fees, information technology, facilities and equipment, advertising and promotion, legal and regulatory and corporate related expenses.
Ameriprise Financial, Inc.
Economic Environment
Global equity market conditions and fluctuations affect our results of operations and financial condition. The following table presents relevant market indices:
| | | | | | | | | | | | | | | | | |
| Years Ended December 31, | | |
| 2024 | | 2023 | Change |
| S&P 500 | | | | | |
| Daily average | 5,428 | | 4,285 | | 27% |
| Period end | 5,882 | | 4,770 | | 23% |
Weighted Equity Index (“WEI”) (1) | | | | | |
| Daily average | 3,456 | | 2,808 | | 23% |
| Period end | 3,676 | | 3,102 | | 19% |
(1) Weighted Equity Index is an Ameriprise calculated proxy for equity market movements calculated using a weighted average of the S&P 500, Russell 2000, Russell Midcap and MSCI EAFE indices based on North America distributed equity assets.
See our segment results of operations discussion below for additional information on how changes in the economic environment have and may continue to impact our results. For further information regarding the impact of the economic environment on our results of operations and financial condition, and potentially material effects, see Part 1 - Item 1A “Risk Factors” of this Annual Report on Form 10-K.
Assets Under Management, Administration, and Advisement
Assets under management (“AUM”) include external client assets for which we provide investment management services, such as the assets of the Columbia Threadneedle Investments funds, institutional clients and clients in our advisor platform held in wrap accounts as well as assets managed by sub-advisors selected by us. AUM also include certain assets on our Consolidated Balance Sheets for which we provide investment management services and recognize management fees in our Asset Management segment, such as the assets of the general account and the variable product funds held in the separate accounts of our life insurance subsidiaries and CIEs.
Assets under administration include assets for which we provide administrative services such as client assets invested in other companies’ products that we offer outside of our wrap accounts. These assets include those held in clients’ brokerage accounts. We generally record revenues received from administered assets as distribution fees. We do not exercise management discretion over these assets and do not earn a management fee. These assets are not reported on our Consolidated Balance Sheets. Assets under administration also include certain assets on our Consolidated Balance Sheets for which we do not provide investment management services and do not recognize management fees, such as investments in non-affiliated funds held in the separate accounts of our life insurance subsidiaries.
Assets under advisement includes assets for which we provide advisory services such as model portfolios but do not have full discretionary investment authority.
The following table presents detail regarding our Assets Under Management, Administration, and Advisement:
| | | | | | | | | | | | | | | | | | | | | | | |
| | December 31, | | Change |
| 2024 | | 2023 |
| (in billions) | | |
| Assets Under Management, Administration, and Advisement | | | | | | | |
| Advice & Wealth Management AUM | $ | 570.1 | | | $ | 484.8 | | | $ | 85.3 | | | 18 | % |
| Asset Management AUM | 644.9 | | | 636.9 | | | 8.0 | | | 1 | |
| Corporate AUM | 0.6 | | | 0.4 | | | 0.2 | | | 50 | |
| Eliminations | (44.8) | | | (41.0) | | | (3.8) | | | (9) | |
| Total Assets Under Management | 1,170.8 | | | 1,081.1 | | | 89.7 | | | 8 | |
| Total Assets Under Administration | 317.2 | | | 279.5 | | | 37.7 | | | 13 | |
| Total Assets Under Advisement (net of eliminations) | 34.0 | | | 25.4 | | | 8.6 | | | 34 | |
| Total Assets Under Management, Administration, and Advisement | $ | 1,522.0 | | | $ | 1,386.0 | | | $ | 136.0 | | | 10 | % |
|
Total AUM increased $89.7 billion, or 8%, to $1.2 trillion as of December 31, 2024 compared to $1.1 trillion as of December 31, 2023 due to a $85.3 billion increase in Advice & Wealth Management AUM driven by market appreciation and wrap account net inflows and an $8.0 billion increase in Asset Management AUM primarily driven by market appreciation, partially offset by net outflows. Total Asset Under Administration increased $37.7 billion, or 13%, to $317.2 billion as of December 31, 2024 compared to the prior year primarily driven by equity market appreciation and an increase in third-party money market funds. Total Assets Under Advisement increased $8.6 billion, or 34%, to $34.0 billion as December 31, 2024 due to market appreciation and net inflows. See our segment results of operations discussion for additional information on changes in our AUM.
Ameriprise Financial, Inc.
Consolidated Results of Operations
Year Ended December 31, 2024 Compared to Year Ended December 31, 2023
The following table presents our consolidated results of operations:
| | | | | | | | | | | | | | | | | | | | | | | |
| | Years Ended December 31, | | Change |
| 2024 | | 2023 |
| (in millions) | | |
| Revenues | | | | | | | |
| Management and financial advice fees | $ | 10,143 | | | $ | 8,907 | | | $ | 1,236 | | | 14 | % |
| Distribution fees | 2,060 | | | 1,931 | | | 129 | | | 7 | |
| Net investment income | 3,648 | | | 3,206 | | | 442 | | | 14 | |
| Premiums, policy and contract charges | 1,559 | | | 1,539 | | | 20 | | | 1 | |
| Other revenues | 516 | | | 513 | | | 3 | | | 1 | |
| | | | | | | |
| Total revenues | 17,926 | | | 16,096 | | | 1,830 | | | 11 | |
| Banking and deposit interest expense | 662 | | | 561 | | | 101 | | | 18 | |
| Total net revenues | 17,264 | | | 15,535 | | | 1,729 | | | 11 | |
| Expenses | | | | | | | |
| Distribution expenses | 6,024 | | | 5,078 | | | 946 | | | 19 | |
| Interest credited to fixed accounts | 616 | | | 654 | | | (38) | | | (6) | |
| Benefits, claims, losses and settlement expenses | 1,299 | | | 1,350 | | | (51) | | | (4) | |
| Remeasurement (gains) losses of future policy benefit reserves | (44) | | | (20) | | | (24) | | | NM |
| Change in fair value of market risk benefits | 628 | | | 798 | | | (170) | | | (21) | |
| Amortization of deferred acquisition costs | 242 | | | 246 | | | (4) | | | (2) | |
| Interest and debt expense | 329 | | | 324 | | | 5 | | | 2 | |
| General and administrative expense | 3,903 | | | 3,871 | | | 32 | | | 1 | |
| Total benefits and expenses | 12,997 | | | 12,301 | | | 696 | | | 6 | |
| Pretax income | 4,267 | | | 3,234 | | | 1,033 | | | 32 | |
| Income tax provision | 866 | | | 678 | | | 188 | | | 28 | |
| Net income | $ | 3,401 | | | $ | 2,556 | | | $ | 845 | | | 33 | % |
| NM Not Meaningful - variance equal to or greater than 100%. |
Overall
Pretax income increased $1.0 billion, or 32%, for 2024 compared to the prior year. The following impacts were significant drivers of the year-over-year change in pretax income:
•The favorable impact from the cumulative impact of wrap net inflows and improved transactional activity.
•A favorable impact from higher investment portfolio yields, along with higher investment balances driven by increased Ameriprise Bank, FSB (“Ameriprise Bank”) customer deposits, as well as higher structured variable annuities (“SVA”) balances.
•A favorable impact from higher average equity markets compared to the prior year period. Our average WEI, which is a proxy for equity movements on AUM, increased 23% in 2024 compared to the prior year.
•The market impact on non-traditional long-duration products, net of hedges was an expense of $153 million for 2024 compared to an expense of $608 million for the prior year.
•The unfavorable impact from the cumulative impact of Asset Management net outflows.
Ameriprise Financial, Inc.
The following table presents the total pretax impacts on our revenues and expenses attributable to unlocking, for the years ended December 31:
| | | | | | | | | | | | | | |
| Pretax Increase (Decrease) | | 2024 | | 2023 |
| | (in millions) |
| | | | |
| Premiums, policy and contract charges | | $ | (4) | | | $ | 1 | |
| | | | |
| Total revenues | | (4) | | | 1 | |
| | | | |
| Interest credited to fixed accounts | | (10) | | | — | |
| Benefits, claims, losses and settlement expenses | | (4) | | | (17) | |
| Remeasurement (gains) losses of future policy benefit reserves: | | | | |
| LTC unlocking | | 4 | | | (5) | |
| Unlocking impact, excluding LTC | | (24) | | | (6) | |
| Total remeasurement (gains) losses of future policy benefit reserves | | (20) | | | (11) | |
| Change in fair value of market risk benefits | | 107 | | | 128 | |
| | | | |
| Total benefits and expenses | | 73 | | | 100 | |
Pretax income (loss) (1) | | $ | (77) | | | $ | (99) | |
(1) Includes a $17 million net benefit related to model changes associated with the market impact on IUL and SVA embedded derivatives for 2024, which is excluded from adjusted operating earnings. Refer to Results of Operations by Segment for the impact to pretax adjusted operating earnings attributable to unlocking.
The primary driver of the unlocking impact was lowered surrender assumptions on variable annuities with living benefits resulting in an expense in 2024, partially offset by the updated claims incident rates on disability insurance. In the prior year, the primary driver of the unlocking impact was lowered surrender assumptions on variable annuities with living benefits resulting in an expense.
Net Revenues
Management and financial advice fees increased $1.2 billion, or 14%, for 2024 compared to the prior year primarily reflecting market appreciation and continued wrap account net inflows, partially offset by the cumulative impact of Asset Management and variable annuity net outflows.
Distribution fees increased $129 million, or 7%, for 2024 compared to the prior year primarily due to higher transactional activity and market appreciation, partially offset by $162 million of lower fees on off-balance sheet brokerage cash.
Net investment income increased $442 million, or 14%, for 2024 compared to the prior year primarily due to the following impacts:
•The favorable impact of growth in Ameriprise Bank customer deposits and SVA products.
•The favorable impact of higher investment portfolio yields.
Banking and deposit interest expense increased $101 million, or 18%, for 2024 compared to the prior year primarily reflecting higher average crediting rates and higher average balances on certificates and Ameriprise Bank cash deposits.
Expenses
Distribution expenses increased $946 million, or 19%, for 2024 compared to the prior year primarily reflecting higher advisor compensation from higher average wrap account assets and increased transactional activity, as well as investments in recruiting experienced advisors, partially offset by the cumulative impact of Asset Management net outflows.
Interest credited to fixed accounts decreased $38 million, or 6%, for 2024 compared to the prior year primarily reflecting the following items:
•A $22 million decrease in expense from other market impacts on IUL benefits, net of hedges, which was an expense of $12 million for 2024 compared to an expense of $34 million for the prior year. The decrease in expense was primarily due to a decrease in the IUL embedded derivative in the current year, which reflected model changes and more discounting due to higher Treasury rates.
•A $4 million increase in expense from the unhedged nonperformance credit spread risk adjustment on IUL benefits. The unfavorable impact of the nonperformance credit spread was $19 million for 2024 compared to an unfavorable impact of $15 million for the prior year.
•A decrease in expense driven by variable annuity net outflows.
Benefits, claims, losses and settlement expenses decreased $51 million, or 4%, for 2024 compared to the prior year primarily reflecting an $196 million decrease in expense from market impacts on SVA embedded derivative, net of hedging activity. This decrease was the result of a favorable $644 million change in the market impact on derivatives hedging the SVA embedded derivative and an unfavorable $448 million change in the market impact on the SVA embedded derivative. This decrease was partially offset by the impact of higher sales of life contingent payout annuities and increased volume in SVAs.
Ameriprise Financial, Inc.
Change in fair value of market risk benefits decreased $170 million, or 21%, for 2024 compared to the prior year primarily reflecting the following items:
•A $227 million decrease in expense from market impacts on variable annuity guaranteed benefits, net of hedges. This decrease was the result of a favorable $538 million change in the market impact on variable annuity guaranteed benefits reserves and an unfavorable $311 million change in the market impact on derivatives hedging the variable annuity guaranteed benefits. The main market drivers contributing to these changes are summarized below:
•Equity market impact on the variable annuity guaranteed benefits liability net of the impact on the corresponding hedge assets resulted in a higher benefit for 2024 compared to the prior year.
•Interest rate and bond impact on the variable annuity guaranteed benefits liability net of the impact on the corresponding hedge assets resulted in a higher benefit for 2024 compared to the prior year.
•Volatility impact on the variable annuity guaranteed benefits liability net of the impact on the corresponding hedge assets resulted in a higher expense for 2024 compared to the prior year.
•Other unhedged items, including the difference between the assumed and actual underlying separate account investment performance, transaction costs and various behavioral items, were a lower net expense for 2024 compared to the prior year.
•An increase in expense due to market appreciation on contractual fees.
General and administrative expense increased $32 million, or 1%, for 2024 compared to the prior year primarily reflecting higher volume related expenses and investments for business growth, increased severance expense related to our expense management initiatives and higher performance fee related compensation, partially offset by ongoing benefits from our initiatives to enhance operational efficiency and effectiveness, as well as prior year expenses including a $50 million accrual for a regulatory matter relating to electronic communication recordkeeping requirements and $62 million of integration related expenses associated with the acquisition of the BMO Global Asset Management (EMEA) business.
Income Taxes
Our effective tax rate was 20.3% for 2024 compared to 21.0% for the prior year. See Note 24 to our Consolidated Financial Statements for additional discussion on income taxes.
Results of Operations by Segment
Year Ended December 31, 2024 Compared to Year Ended December 31, 2023
Adjusted operating earnings is the measure of segment profit or loss management uses to evaluate segment performance. Adjusted operating earnings should not be viewed as a substitute for GAAP pretax income. We believe the presentation of segment adjusted operating earnings as we measure it for management purposes enhances the understanding of our business by reflecting the underlying performance of our core operations and facilitating a more meaningful trend analysis. See Note 28 to the Consolidated Financial Statements for further information on the presentation of segment results and our definition of adjusted operating earnings.
The following table presents summary financial information by segment:
| | | | | | | | | | | |
| | Years Ended December 31, |
| 2024 | | 2023 |
| (in millions) |
| Advice & Wealth Management | | | |
| Net revenues | $ | 10,780 | | | $ | 9,418 | |
| Expenses | 7,547 | | | 6,567 | |
| Adjusted operating earnings | $ | 3,233 | | | $ | 2,851 | |
| Asset Management | | | |
| Net revenues | $ | 3,515 | | | $ | 3,278 | |
| Expenses | 2,595 | | | 2,558 | |
| Adjusted operating earnings | $ | 920 | | | $ | 720 | |
| Retirement & Protection Solutions | | | |
| Net revenues | $ | 3,773 | | | $ | 3,476 | |
| Expenses | 3,047 | | | 2,791 | |
| Adjusted operating earnings | $ | 726 | | | $ | 685 | |
| Corporate & Other | | | |
| Net revenues | $ | 454 | | | $ | 533 | |
| Expenses | 897 | | | 853 | |
| Adjusted operating loss | $ | (443) | | | $ | (320) | |
Ameriprise Financial, Inc.
The following table presents the segment pretax adjusted operating impacts on our revenues and expenses attributable to our annual assumption updates, referred to as unlocking, for the years ended December 31:
| | | | | | | | | | | | | | | | | | | | | | | | | | |
| Segment Pretax Adjusted Operating Increase (Decrease) | | 2024 | | 2023 |
| Retirement & Protection Solutions | | Corporate | Retirement & Protection Solutions | | Corporate |
| | (in millions) |
| | | | | | | | |
| Premiums, policy and contract charges | | $ | (5) | | | $ | — | | | $ | 1 | | | $ | — | |
| | | | | | | | |
| Total revenues | | (5) | | | — | | | 1 | | | — | |
| | | | | | | | |
| | | | | | | | |
| Benefits, claims, losses and settlement expenses | | 4 | | | — | | | (17) | | | — | |
| Remeasurement (gains) losses of future policy benefit reserves: | | | | | | | | |
| LTC unlocking | | — | | | 4 | | | — | | | (5) | |
| Unlocking, excluding LTC | | (24) | | | — | | | (6) | | | — | |
| Total remeasurement (gains) losses of future policy benefit reserves | | (24) | | | 4 | | | (6) | | | (5) | |
| Change in fair value of market risk benefits | | 105 | | | — | | | 128 | | | — | |
| | | | | | | | |
| Total benefits and expenses | | 85 | | | 4 | | | 105 | | | (5) | |
| Pretax income (loss) | | $ | (90) | | | $ | (4) | | | $ | (104) | | | $ | 5 | |
Advice & Wealth Management
The following table presents Advice & Wealth Management total client assets as of December 31:
| | | | | | | | | | | |
| 2024 | | 2023 |
| (in billions) |
Wrap assets (1) | $ | 573.9 | | | $ | 488.2 | |
Brokerage and other assets (1) | 455.0 | | | 412.3 | |
| Total client assets | $ | 1,028.9 | | | $ | 900.5 | |
(1) Total cash balances (included in the wrap and brokerage and other assets above) | $ | 85.4 | | | $ | 81.5 | |
Total client assets increased $128.4 billion, or 14%, to $1.0 trillion compared to a year ago primarily due to market appreciation and client net inflows.
The following table presents the changes in wrap account assets and average balances for the years ended December 31:
| | | | | | | | | | | |
| 2024 | | 2023 |
| (in billions) |
| Beginning balance | $ | 488.2 | | | $ | 412.1 | |
| Net flows | 33.1 | | | 24.2 | |
| Market appreciation (depreciation) and other | 52.6 | | | 51.9 | |
| Ending balance | $ | 573.9 | | | $ | 488.2 | |
| | | |
Advisory wrap account assets ending balance (1) | $ | 568.3 | | | $ | 483.3 | |
Average advisory wrap account assets (2) | $ | 528.3 | | | $ | 437.8 | |
(1) Advisory wrap account assets represent those assets for which clients receive advisory services and are the primary driver of revenue earned on wrap accounts. Clients may hold non-advisory investments in their wrap accounts that do not incur an advisory fee.
(2) Average advisory wrap account assets are calculated using an average of the prior period’s ending balance and all months in the current period excluding the most recent month for the twelve months ended December 31, 2024 and 2023, which is reflective of our billing cycle.
Wrap account assets increased $85.7 billion, or 18%, to $573.9 billion during 2024 primarily due to market appreciation of $52.6 billion and net inflows of $33.1 billion. Average advisory wrap account assets increased $90.5 billion, or 21%, compared to the prior year primarily reflecting market appreciation and continued net inflows.
Ameriprise Financial, Inc.
The following table presents client cash balances as of December 31:
| | | | | | | | | | | |
| Cash and Certificates Balances | 2024 | | 2023 |
| (in billions) |
| On-balance sheet - Ameriprise Bank | $ | 22.3 | | | $ | 21.5 | |
| On-balance sheet - Ameriprise Certificate Company | 11.2 | | | 13.5 | |
| On-balance sheet - broker dealer | 2.3 | | | 2.4 | |
| Total on-balance sheet | $ | 35.8 | | | $ | 37.4 | |
| Off-balance sheet - broker dealer | 5.8 | | | 7.1 | |
| Total cash and certificate balances | $ | 41.6 | | | $ | 44.5 | |
| Third party cash products (money market funds and brokered CDs) | 43.8 | | | 37.0 | |
| Total client cash balances | $ | 85.4 | | | $ | 81.5 | |
Ameriprise Bank is continuing its deposit growth trend, with bank deposit balances increasing 4% from the prior year to $22.3 billion as of December 31, 2024. Ameriprise Certificate Company (“ACC”) client deposits decreased $2.3 billion from the prior year to $11.2 billion. After a period of strong growth during a rising interest rate environment, ACC has experienced net outflows during 2024. Third party cash products increased $6.8 billion to $43.8 billion driven by an increase of money market funds of $9.1 billion, partially offset by a decline in brokered CDs.
The following table presents assets supporting Ameriprise Bank deposits and ACC certificates as of December 31:
| | | | | | | | | | | | | | | | | | | | | | | |
| Ameriprise Bank | | ACC |
| 2024 | | 2023 | | 2024 | | 2023 |
| (in millions) |
| Investments | | | | | | | |
Fixed and adjustable rate (1) | $ | 16,766 | | | $ | 14,808 | | | $ | 6,769 | | | $ | 7,566 | |
Floating rate (1) | 3,463 | | | 5,354 | | | 4,253 | | | 5,569 | |
| Total Available-for-Sale securities | 20,229 | | | 20,162 | | | 11,022 | | | 13,135 | |
| Cash and cash equivalents | 2,537 | | | 2,001 | | | 824 | | | 913 | |
| Loans and other assets | 1,316 | | | 944 | | | 150 | | | 183 | |
| Total assets supporting deposits or certificates | $ | 24,082 | | | $ | 23,107 | | | $ | 11,996 | | | $ | 14,231 | |
(1) Presented on an amortized cost basis. | | | | | | | |
•In Ameriprise Bank, interest-bearing assets included $20.2 billion of Available-for-Sale securities, $2.5 billion of cash and cash equivalents, and $1.3 billion of other assets, primarily loans. The Ameriprise Bank investment portfolio securities are mostly rated AAA and primarily consist of structured assets, of which 17% were floating rate and sensitive to changes in short-term interest rates as of December 31, 2024. We took action to reduce the floating rate allocation from 27% as of December 31, 2023. The duration of Ameriprise Bank investments was 3.6 years as of December 31, 2024 compared to 3.4 years as of December 31, 2023. In 2024, we purchased $5.3 billion of investments, which was primarily sourced from maturities and prepayments.
•In ACC, interest-bearing assets include $11.0 billion of Available-for-Sale securities, $0.8 billion of cash and cash equivalents, and $0.2 billion of loans and other assets. The ACC investment portfolio securities are mostly rated AAA and primarily consist of structured assets and government bonds, of which 39% were floating rate and approximately 23% were 6-month Treasury Bills as of December 31, 2024. The duration of ACC investments was 1.1 years as of December 31, 2024 compared to 0.9 years as of December 31, 2023.
Ameriprise Financial, Inc.
The following table presents the results of operations of our Advice & Wealth Management segment on an adjusted operating basis:
| | | | | | | | | | | | | | | | | | | | | | | |
| Years Ended December 31, | | Change |
| 2024 | | 2023 |
| (in millions) | | |
| Revenues | | | | | | | |
| Management and financial advice fees | $ | 6,492 | | | $ | 5,485 | | | $ | 1,007 | | | 18 | % |
| Distribution fees | 2,453 | | | 2,273 | | | 180 | | | 8 | |
| Net investment income | 2,195 | | | 1,956 | | | 239 | | | 12 | |
| Other revenues | 302 | | | 265 | | | 37 | | | 14 | |
| Total revenues | 11,442 | | | 9,979 | | | 1,463 | | | 15 | |
| Banking and deposit interest expense | 662 | | | 561 | | | 101 | | | 18 | |
| Total net revenues | 10,780 | | | 9,418 | | | 1,362 | | | 14 | |
| Expenses | | | | | | | |
| Distribution expenses | 5,823 | | | 4,888 | | | 935 | | | 19 | |
| Interest and debt expense | 38 | | | 27 | | | 11 | | | 41 | |
| General and administrative expense | 1,686 | | | 1,652 | | | 34 | | | 2 | |
| Total expenses | 7,547 | | | 6,567 | | | 980 | | | 15 | |
| Adjusted operating earnings | $ | 3,233 | | | $ | 2,851 | | | $ | 382 | | | 13 | % |
|
Our Advice & Wealth Management segment pretax adjusted operating earnings, which exclude net realized investment gains or losses, increased $382 million, or 13%, for 2024 compared to the prior year. This growth reflected the benefit from market appreciation and increased advisor productivity through the cumulative impact of client net inflows and higher transactional revenue, as well as a $138 million increase in Net investment income, net of Banking and deposit interest expense. Pretax adjusted operating margin was 30.0% for 2024 compared to 30.3% for the prior year. Adjusted operating net revenue per advisor increased to $1,037,000 for 2024, up 13%, from $916,000 for the prior year.
Net Revenues
Management and financial advice fees increased $1.0 billion, or 18%, for 2024 compared to the prior year primarily due to growth in average wrap account assets. Average advisory wrap account assets increased $90.5 billion, or 21%, compared to the prior year reflecting net inflows and market appreciation.
Distribution fees increased $180 million, or 8%, for 2024 compared to the prior year as non-brokerage cash revenue increased $342 million from strong transactional activity, including strong annuity sales and retail trading, along with market appreciation, while brokerage cash revenue decreased $162 million due to lower off-balance sheet brokerage cash balances and a lower average fee yield.
Net investment income increased $239 million, or 12%, for 2024 compared to the prior year primarily due to higher average invested assets and the favorable impact of higher average investment yields on the investment portfolios supporting the bank and certificate products. The Federal Reserve reduced rates in September, November, and December of 2024, lowering the federal funds effective rate an average of 67 basis points in the fourth quarter compared to the year ago quarter. These rate cuts also impacted various short-term benchmark rates, upon which our floating rate securities and cash rates are indexed, which unfavorably impacted net investment income in the second half of 2024.
Banking and deposit interest expense increased $101 million, or 18%, for 2024 compared to the prior year primarily reflecting higher average crediting rates and higher average balances on certificates and bank cash deposits.
•The average certificate reserve balance for ACC was $12.5 billion for 2024 compared to $11.8 billion for the prior year with the average crediting rate of 4.40% for 2024 compared to 3.96% for 2023.
•The daily average interest-bearing deposit balance for the Ameriprise Bank increased to $21.5 billion for 2024 compared to $20.4 billion for the prior year with the average interest rate paid on deposits increasing to 0.44% for 2024 from 0.41% for 2023, which included both cash sweep and savings products.
Expenses
Distribution expenses increased $935 million, or 19%, for 2024 compared to the prior year primarily reflecting higher advisor compensation from higher average wrap account assets and increased transactional activity, as well as continued investments in recruiting experienced advisors.
General and administrative expense increased $34 million, or 2%, for 2024 compared to the prior year primarily reflecting higher volume related expenses and investments for business growth, partially offset by a $50 million accrual for a regulatory matter relating to electronic communication recordkeeping requirements in the prior year.
Ameriprise Financial, Inc.
Asset Management
The following tables present the mutual fund performance of our retail Columbia Threadneedle Investments funds as of December 31, 2024:
| | | | | | | | | | | | | | |
Retail Fund Rankings in Top 2 Quartiles or Above Index Benchmark - Asset Weighted (1) | 1 year | 3 year | 5 year | 10 year |
| Equity | 68% | 69% | 79% | 87% |
| Fixed Income | 69% | 69% | 80% | 93% |
| Asset Allocation | 89% | 67% | 82% | 91% |
| | | | |
4- or 5-star Morningstar Rated Funds (2) | Overall | 3 year | 5 year | 10 year |
| Number of rated funds | 108 | 73 | 79 | 99 |
| | | | |
(1) Retail Fund performance rankings for each fund are measured on a consistent basis against the most appropriate peer group or index. Peer groupings of Columbia funds are defined by Lipper category and are based on the Primary Share Class (i.e., Institutional if available, otherwise Institutional 3 share class), net of fees. Peer groupings of Threadneedle funds are defined by either IA or Morningstar index and are based on the Primary Share Class. Comparisons to Index are measured gross of fees.
To calculate asset weighted performance, the sum of the total assets of the funds with above median ranking are divided by total assets of all funds. Funds with more assets will receive a greater share of the total percentage above or below median.
Aggregated Asset Allocation Funds may include funds that invest in other Columbia or Threadneedle branded mutual funds included in both equity and fixed income.
(2) Columbia funds are available for purchase by U.S. customers. Out of 89 Columbia funds rated (based on primary share class), 5 received a 5-star Overall Rating and 35 received a 4-star Overall Rating. Out of 137 Threadneedle funds rated (based on highest-rated share class), 20 received a 5-star Overall Rating and 48 received a 4-star Overall Rating. The Overall Morningstar Rating is derived from a weighted average of the performance figures associated with its 3-, 5- and 10-year (if applicable) Morningstar Rating metrics.
The following table presents managed assets by type:
| | | | | | | | | | | | | | | | | | | | | | | | | | | | | | | | | | | | | | | | | | | | | | | |
| December 31, | | Change | | Average (1) | | Change |
| December 31, |
| 2024 | | 2023 | 2024 | | 2023 |
| (in billions) | | | | (in billions) | | |
| Equity | $ | 343.0 | | | $ | 323.0 | | | $ | 20.0 | | | 6 | % | | $ | 340.1 | | | $ | 309.2 | | | $ | 30.9 | | | 10 | % |
| Fixed income | 231.5 | | | 238.4 | | | (6.9) | | | (3) | | | 234.3 | | | 221.7 | | | 12.6 | | | 6 | |
| Money market | 20.3 | | | 23.8 | | | (3.5) | | | (15) | | | 21.9 | | | 22.6 | | | (0.7) | | | (3) | |
| Alternative | 30.9 | | | 33.5 | | | (2.6) | | | (8) | | | 32.7 | | | 34.5 | | | (1.8) | | | (5) | |
| Hybrid and other | 19.2 | | | 18.2 | | | 1.0 | | | 5 | | | 19.0 | | | 17.3 | | | 1.7 | | | 10 | |
| Total managed assets | $ | 644.9 | | | $ | 636.9 | | | $ | 8.0 | | | 1 | % | | $ | 648.0 | | | $ | 605.3 | | | $ | 42.7 | | | 7 | % |
(1) Average ending balances are calculated using an average of the prior period’s ending balance and all months in the current period.
Ameriprise Financial, Inc.
The following table presents the changes in global assets under management and advisement:
| | | | | | | | | | | |
| Years Ended December 31, |
| 2024 | | 2023 |
| (in billions) |
| Global Retail Funds | | | |
| Beginning managed assets | $ | 334.9 | | | $ | 309.3 | |
| Inflows | 54.9 | | | 47.9 | |
| Outflows | (68.5) | | | (65.2) | |
| Net VP/VIT fund flows | (6.6) | | | (5.0) | |
| Net new flows | (20.2) | | | (22.3) | |
| Reinvested dividends | 14.3 | | | 8.1 | |
| Net flows | (5.9) | | | (14.2) | |
| Distributions | (16.2) | | | (9.4) | |
| | | |
| Market appreciation (depreciation) and other | 41.2 | | | 45.1 | |
Foreign currency translation (1) | (1.3) | | | 4.1 | |
| Total ending managed assets | 352.7 | | | 334.9 | |
| | | |
| Global Institutional | | | |
| Beginning managed assets | 302.0 | | | 274.7 | |
Inflows (2) | 35.8 | | | 42.7 | |
Outflows (2) | (50.3) | | | (45.7) | |
| Net flows | (14.5) | | | (3.0) | |
| | | |
Market appreciation (depreciation) and other (3) | 7.4 | | | 21.9 | |
Foreign currency translation (1) | (2.7) | | | 8.4 | |
| Total ending managed assets | 292.2 | | | 302.0 | |
| Total managed assets | 644.9 | | | 636.9 | |
Total assets under advisement (4) | 35.6 | | | 26.2 | |
| Total assets under management and advisement | $ | 680.5 | | | $ | 663.1 | |
| | | |
| Total assets under management net flows | $ | (20.4) | | | $ | (17.2) | |
Model delivery assets under advisement flows (5) | 2.8 | | | 0.7 | |
Total assets under management and advisement flows (5) | $ | (17.6) | | | $ | (16.5) | |
| | | |
Legacy insurance partners net flows (6) | $ | (11.7) | | | $ | (4.3) | |
(1) Amounts represent local currency to U.S. dollar translation for reporting purposes.
(2) Global Institutional inflows and outflows include net flows from our SVA product and Ameriprise Bank.
(3) Included in Market appreciation (depreciation) and other for Global Institutional is the change in affiliated general account balance, excluding net flows related to our structured variable annuity product and Ameriprise Bank.
(4) Assets under advisement are presented on a one-quarter lag.
(5) Assets under advisement flows are estimated flows based on the period-to-period change in assets less calculated performance based on strategy returns on a one-quarter lag.
(6) Legacy insurance partners assets and net flows are included in the rollforwards above.
Total segment AUM increased $8.0 billion, or 1%, during 2024 primarily driven by equity market appreciation, partially offset by net outflows. Net outflows were $20.4 billion for 2024 and included an $8.0 billion asset transfer related to a legacy insurance partner. Model delivery assets under advisement increased $9.4 billion, or 36%, with net inflows of $2.8 billion for 2024 compared to $0.7 billion for the prior year.
Ameriprise Financial, Inc.
The following table presents the results of operations of our Asset Management segment on an adjusted operating basis:
| | | | | | | | | | | | | | | | | | | | | | | |
| Years Ended December 31, | | Change |
| 2024 | | 2023 |
| (in millions) | | |
| Revenues | | | | | | | |
| Management and financial advice fees | $ | 3,051 | | | $ | 2,844 | | | $ | 207 | | | 7 | % |
| Distribution fees | 388 | | | 363 | | | 25 | | | 7 | |
| Net investment income | 55 | | | 44 | | | 11 | | | 25 | |
| Other revenues | 21 | | | 27 | | | (6) | | | (22) | |
| Total revenues | 3,515 | | | 3,278 | | | 237 | | | 7 | |
| Banking and deposit interest expense | — | | | — | | | — | | | — | |
| Total net revenues | 3,515 | | | 3,278 | | | 237 | | | 7 | |
| Expenses | | | | | | | |
| Distribution expenses | 989 | | | 925 | | | 64 | | | 7 | |
| Amortization of deferred acquisition costs | 7 | | | 6 | | | 1 | | | 17 | |
| Interest and debt expense | 7 | | | 7 | | | — | | | — | |
| General and administrative expense | 1,592 | | | 1,620 | | | (28) | | | (2) | |
| Total expenses | 2,595 | | | 2,558 | | | 37 | | | 1 | |
| Adjusted operating earnings | $ | 920 | | | $ | 720 | | | $ | 200 | | | 28 | % |
|
Our Asset Management segment pretax adjusted operating earnings, which exclude net realized investment gains or losses, increased $200 million, or 28%, for 2024 compared to the prior year primarily due to equity market appreciation and the positive impact from expense management actions, partially offset by the cumulative impact of net outflows.
Net Revenues
Management and financial advice fees increased $207 million, or 7%, for 2024 compared to the prior year primarily driven by market appreciation and an increase in performance fees, partially offset by the cumulative impact of net outflows.
Distribution fees increased $25 million, or 7%, for 2024 compared to the prior year primarily due to market appreciation, partially offset by the cumulative impact from net outflows.
Expenses
Distribution expenses increased $64 million, or 7%, for 2024 compared to the prior year primarily due to market appreciation, partially offset by the cumulative impact of net outflows.
General and administrative expense decreased $28 million, or 2%, for 2024 compared to the prior year primarily reflecting the benefits from our initiatives to enhance operational efficiency and effectiveness, partially offset by $17 million of higher performance fee related compensation and an impairment of intangible assets primarily related to certain customer relationships.
Ameriprise Financial, Inc.
Retirement & Protection Solutions
The following table presents the results of operations of our Retirement & Protection Solutions segment on an adjusted operating basis:
| | | | | | | | | | | | | | | | | | | | | | | |
| Years Ended December 31, | | Change |
| 2024 | | 2023 |
| (in millions) | | |
| Revenues | | | | | | | |
| Management and financial advice fees | $ | 768 | | | $ | 735 | | | $ | 33 | | | 4 | % |
| Distribution fees | 422 | | | 398 | | | 24 | | | 6 | |
| Net investment income | 1,080 | | | 858 | | | 222 | | | 26 | |
| Premiums, policy and contract charges | 1,496 | | | 1,475 | | | 21 | | | 1 | |
| Other revenues | 7 | | | 10 | | | (3) | | | (30) | |
| Total revenues | 3,773 | | | 3,476 | | | 297 | | | 9 | |
| Banking and deposit interest expense | — | | | — | | | — | | | — | |
| Total net revenues | 3,773 | | | 3,476 | | | 297 | | | 9 | |
| Expenses | | | | | | | |
| Distribution expenses | 515 | | | 464 | | | 51 | | | 11 | |
| Interest credited to fixed accounts | 367 | | | 369 | | | (2) | | | (1) | |
| Benefits, claims, losses and settlement expenses | 927 | | | 744 | | | 183 | | | 25 | |
| Remeasurement (gains) losses of future policy benefit reserves | (36) | | | (19) | | | (17) | | | (89) | |
| Change in fair value of market risk benefits | 684 | | | 628 | | | 56 | | | 9 | |
| Amortization of deferred acquisition costs | 227 | | | 229 | | | (2) | | | (1) | |
| Interest and debt expense | 45 | | | 51 | | | (6) | | | (12) | |
| General and administrative expense | 318 | | | 325 | | | (7) | | | (2) | |
| Total expenses | 3,047 | | | 2,791 | | | 256 | | | 9 | |
| Adjusted operating earnings | $ | 726 | | | $ | 685 | | | $ | 41 | | | 6 | % |
|
Our Retirement & Protection Solutions segment pretax adjusted operating earnings, which excludes net realized investment gains or losses (net of the reinsurance accrual), the market impact on variable annuity guaranteed benefits (net of hedges), the market impact on IUL benefits (net of hedges and the reinsurance accrual), mean reversion related impacts, and block transfer reinsurance transaction impacts increased $41 million, or 6%, for 2024 compared to the prior year.
Variable annuity account balances increased 6% to $85.7 billion as of December 31, 2024 compared to the prior year due to market appreciation, partially offset by net outflows of $3.7 billion. Variable annuity sales increased 26% to $5.0 billion for 2024 compared to the prior year reflecting an increase in sales of SVAs. Account values with living benefit riders declined to 50% as of December 31, 2024 compared to 54% a year ago reflecting our actions to optimize our business mix. This trend is expected to continue and meaningfully shift the mix of business away from products with living benefit guarantees over time.
Net Revenues
Management and financial advice fees increased $33 million, or 4%, for 2024 compared to the prior year primarily reflecting market appreciation, partially offset by the impact from variable annuity net outflows.
Distribution fees increased $24 million, or 6%, for 2024 compared to the prior year primarily reflecting market appreciation and higher sales, partially offset by variable annuity net outflows.
Net investment income, which excludes net realized investment gains or losses, increased $222 million, or 26%, for 2024 compared to the prior year primarily due to increased SVA balances and higher investment portfolio yields from investment portfolio repositioning.
Premiums, policy and contract charges increased $21 million, or 1%, for 2024 compared to the prior year due to higher sales of life contingent payout annuities.
Expenses
Distribution expenses increased $51 million, or 11%, for 2024 compared to the prior year primarily reflecting higher sales of SVAs and market appreciation.
Benefits, claims, losses and settlement expenses, which exclude the market impact on SVA indexed account embedded derivative (net of hedges) and mean reversion related impacts, increased $183 million, or 25%, for 2024 compared to the prior year primarily reflecting increased volume in SVAs and the impact of higher sales of life contingent payout annuities.
Ameriprise Financial, Inc.
Change in fair value of market risk benefits, which exclude the market impact on variable annuity guaranteed benefits (net of hedges), increased $56 million, or 9%, for 2024 compared to the prior year primarily reflecting market appreciation on contractual fees.
Corporate & Other
The following table presents the results of operations of our Corporate & Other segment on an adjusted operating basis:
| | | | | | | | | | | | | | | | | | | | | | | |
| Years Ended December 31, | | Change |
| 2024 | | 2023 |
| (in millions) | | |
| Revenues | | | | | | | |
| | | | | | | |
| Distribution fees | $ | 1 | | | $ | 1 | | | $ | — | | | — | % |
| Net investment income | 203 | | | 247 | | | (44) | | | (18) | |
| Premiums, policy and contract charges | 94 | | | 96 | | | (2) | | | (2) | |
| Other revenues | 186 | | | 209 | | | (23) | | | (11) | |
| Total revenues | 484 | | | 553 | | | (69) | | | (12) | |
| Banking and deposit interest expense | 30 | | | 20 | | | 10 | | | 50 | |
| Total net revenues | 454 | | | 533 | | | (79) | | | (15) | |
| Expenses | | | | | | | |
| Distribution expenses | (10) | | | (10) | | | — | | | — | |
| Interest credited to fixed accounts | 216 | | | 234 | | | (18) | | | (8) | |
| Benefits, claims, losses and settlement expenses | 217 | | | 236 | | | (19) | | | (8) | |
| Remeasurement (gains) losses of future policy benefit reserves | (8) | | | (1) | | | (7) | | | NM |
| | | | | | | |
| Amortization of deferred acquisition costs | 8 | | | 11 | | | (3) | | | (27) | |
| Interest and debt expense | 108 | | | 97 | | | 11 | | | 11 | |
| General and administrative expense | 366 | | | 286 | | | 80 | | | 28 | |
| Total expenses | 897 | | | 853 | | | 44 | | | 5 | |
| Adjusted operating loss | $ | (443) | | | $ | (320) | | | $ | (123) | | | (38) | % |
| NM Not Meaningful - variance equal to or greater than 100%. |
Our Corporate & Other segment includes our closed blocks of LTC insurance and fixed annuity and fixed indexed annuity (“FA”) business.
Our Corporate & Other segment pretax adjusted operating loss excludes net realized investment gains or losses, the market impact on fixed annuity benefits (net of hedges), the market impact of hedges to offset interest rate and currency changes on unrealized gains or losses for certain investments, block transfer reinsurance transaction impacts, gain or loss on disposal of a business that is not considered discontinued operations, integration and restructuring charges, and the impact of consolidating CIEs.
Our Corporate & Other segment pretax adjusted operating loss increased $123 million, or 38%, for 2024 compared to the prior year, reflecting lower net investment income along with higher severance and technology expenses.
LTC insurance had pretax adjusted operating earnings of $58 million for 2024 compared to pretax adjusted operating earnings of $29 million for the prior year primarily reflecting improved claims experience and the benefit of investment portfolio repositioning.
FA business had a pretax adjusted operating loss of $28 million for 2024 compared to a pretax adjusted operating loss of $29 million for the prior year. Fixed deferred annuity account balances declined 10% to $5.7 billion as of December 31, 2024, compared to the prior year as policies continue to lapse.
Net Revenues
Net investment income, which excludes net realized investment gains or losses, the market impact of hedges to offset interest rate and currency changes on unrealized gains or losses for certain investments, integration and restructuring charges, and the impact of consolidating CIEs, decreased $44 million, or 18%, for 2024 compared to the prior year primarily due to a $12 million benefit in our affordable housing partnerships in the prior year, as well as adjustments and updates made in the fourth quarter of 2023 to the allocation of investment income across business segments that reflected increased market volatility and the interest rate environment.
Other revenues decreased $23 million, or 11%, for 2024 compared to the prior year primarily reflecting the yield on deposit receivables arising from reinsurance transactions.
Ameriprise Financial, Inc.
Expenses
General and administrative expense, which excludes integration and restructuring charges and expenses attributable to CIEs, increased $80 million, or 28%, for 2024 compared to the prior year primarily reflecting $32 million of higher severance expenses associated with our initiatives to enhance operational efficiency and effectiveness and expenses to accelerate our transition to cloud-based technology.
Closed Block LTC Insurance
As of December 31, 2024, our nursing home indemnity LTC block had approximately $63 million in gross in force annual premium and future policyholder benefits and claim reserves of approximately $1.3 billion, net of reinsurance, which was 50% of GAAP reserves. This block has been shrinking over the last few years given the average attained age is 84 and the average attained age of policyholders on claim is 89. Fifty-four percent of daily benefits in force in this block are lifetime benefits.
As of December 31, 2024, our comprehensive reimbursement LTC block had approximately $111 million in gross in force annual premium and future policyholder benefits and claim reserves of approximately $1.3 billion, net of reinsurance. This block has higher premiums per policy than the nursing home indemnity LTC policies. The average attained age is 80 and the average attained age of policyholders on claim is 86. Thirty-four percent of daily benefits in force in this block are lifetime benefits.
We utilize three primary levers to manage our LTC business. First, we have taken an active approach of steadily increasing rates since 2005, with cumulative rate increases of 268% on our nursing home indemnity LTC block (excluding home care riders) and 164% on our comprehensive reimbursement LTC block as of December 31, 2024. Second, we have a reserving process that reflects the policy features and risk characteristics of our blocks. As of December 31, 2024, we had 46,000 policies that were closed with claim activity, as well as 7,000 open claims. We apply this experience to our in force policies, which were 75,000 as of December 31, 2024, at a very granular level by issue year, attained age and benefit features. Our statutory reserves are $346 million higher than our GAAP reserves as they include margins on key assumptions for morbidity and mortality and include $330 million in asset adequacy reserves as of December 31, 2024. Lastly, we have prudently managed our investment portfolio primarily through a liquid, investment grade portfolio.
We undertake an extensive review of the cash flow and expense assumptions supporting the liability for future policy benefits annually during the third quarter of each year, or more frequently if appropriate, using current best estimate assumptions as of the date of the review. Our annual review process includes an analysis of our key reserve assumptions, including those for morbidity, terminations (mortality and lapses), and premium rate increases.
Fair Value Measurements
We report certain assets and liabilities at fair value; specifically, separate account assets, derivatives, market risk benefits, embedded derivatives, and most investments and cash equivalents. Fair value assumes the exchange of assets or liabilities occurs in orderly transactions and is not the result of a forced liquidation or distressed sale. We include actual market prices, or observable inputs, in our fair value measurements to the extent available. Broker quotes are obtained when quotes from pricing services are not available. We validate prices obtained from third parties through a variety of means such as: price variance analysis, subsequent sales testing, stale price review, price comparison across pricing vendors and due diligence reviews of vendors. See Note 16 to the Consolidated Financial Statements for additional information on our fair value measurements.
Fair Value of Liabilities and Nonperformance Risk
Companies are required to measure the fair value of liabilities at the price that would be received to transfer the liability to a market participant (an exit price). Since there is not a market for our obligations of our market risk benefits, fixed deferred indexed annuities, structured variable annuities, and IUL insurance, we consider the assumptions participants in a hypothetical market would make to reflect an exit price. As a result, we adjust the valuation of market risk benefits, fixed deferred indexed annuities, structured variable annuities, and IUL insurance by updating certain contractholder assumptions, adding explicit margins to provide for risk, and adjusting the rates used to discount expected cash flows to reflect a current market estimate of our nonperformance risk. The nonperformance risk adjustment is based on observable market data adjusted to estimate the risk of our life insurance company subsidiaries not fulfilling these liabilities. Consistent with general market conditions, this estimate resulted in a spread over the U.S. Treasury curve as of December 31, 2024. As our estimate of this spread widens or tightens, the liability will decrease or increase, respectively. If this nonperformance credit spread moves to a zero spread over the U.S. Treasury curve, the reduction to future total equity would be approximately $496 million, net of the reinsurance accrual and income taxes (calculated at the statutory tax rate of 21%), based on December 31, 2024 credit spreads.
Ameriprise Financial, Inc.
Liquidity and Capital Resources
Overview
We maintained substantial liquidity during the year ended December 31, 2024. At December 31, 2024 and 2023, we had $8.1 billion and $7.5 billion, respectively, in cash and cash equivalents excluding CIEs and other restricted cash on a consolidated basis.
At December 31, 2024 and 2023, Ameriprise Financial, Inc. had $856 million and $544 million, respectively, in cash, cash equivalents, and unencumbered liquid securities. Liquid securities predominantly include U.S. government agency mortgage back securities. Additional sources of liquidity for Ameriprise Financial, Inc. include a line of credit with an affiliate up to $714 million and an unsecured revolving committed credit facility for up to $1.0 billion that expires in November 2029. Management’s estimate of liquidity available to the Ameriprise Financial, Inc. in a volatile and uncertain economic environment as of December 31, 2024 was $2.1 billion which includes cash, cash equivalents, unencumbered liquid securities, the line of credit with an affiliate and a portion of the committed credit facility.
Under the terms of the committed credit facility, we can increase the availability to $1.25 billion upon satisfaction of certain approval requirements. Available borrowings under this facility are reduced by any outstanding letters of credit. At December 31, 2024, we had no outstanding borrowings under this credit facility and had $1 million of letters of credit issued against the facility. Our credit facility contains various administrative, reporting, legal and financial covenants. We remained in compliance with all such covenants as of December 31, 2024.
In addition, we have access to collateralized borrowings, which may include repurchase agreements, Federal Home Loan Bank (“FHLB”) advances, and advances at the Federal Reserve. Our subsidiaries, RiverSource Life Insurance Company (“RiverSource Life”), and Ameriprise Bank are members of the FHLB of Des Moines, which provides access to collateralized borrowings. As of December 31, 2024 and 2023, we had $8.5 billion and $8.6 billion, respectively, of estimated borrowing capacity under the FHLB facilities, of which $201 million was outstanding as of both December 31, 2024 and 2023, and is collateralized with commercial mortgage backed securities and residential mortgage backed securities. In addition, Ameriprise Bank maintains access to borrowings from the Federal Reserve which are collateralized with residential mortgage backed securities, commercial mortgage backed securities and corporate debt securities. As of December 31, 2024 and 2023, we estimated $11.9 billion and $12.3 billion, respectively, of borrowing capacity from the Federal Reserve in addition to the FHLB capacity and there were no outstanding obligations.
Short-term contractual obligations for the year 2025 include investment certificate maturities of $10.8 billion and estimated insurance and annuity benefits of $2.8 billion in addition to operating liquidity needs and maturing long-term debt in April 2025 of $500 million. We also hold banking and brokerage deposits of $24.6 billion that are payable on demand. Long-term contractual obligations for years after 2025 include estimated insurance and annuity benefits of $57.7 billion.
See Note 15 to our Consolidated Financial Statements for further information about our long-term debt maturities.
We believe cash flows from operating activities, available cash balances, our availability of internal and external borrowings, access to debt markets, and dividends from our subsidiaries will be sufficient to fund our short-term and long-term operating liquidity needs and stress requirements.
In October 2023, the Federal Reserve Board (“FRB”) issued its final rule establishing a consolidated capital framework termed the “Building Block Approach” (“BBA”) for savings and loan holding companies like Ameriprise Financial that are significantly engaged in insurance activities. For information on the impact of the BBA, see “Business - Regulation - Federal Banking and Financial Holding Company Regulation” included in Part I, Item 1 of this Annual Report on Form 10-K.
On August 16, 2022, federal legislation commonly referred to as the Inflation Reduction Act of 2022 (“IRA”) was enacted. We have evaluated the tax provisions of the IRA, the most significant of which are the corporate alternative minimum tax (“CAMT”) and the share repurchase excise tax. Both the CAMT and share repurchase tax were effective beginning in 2023. We are an applicable corporation required to compute CAMT; and, based on current estimates, we recorded a CAMT liability for 2024. The U.S. Department of the Treasury issued proposed CAMT regulations in the third quarter of 2024. The proposed regulations are subject to public review and comment prior to finalizing. The Company is evaluating the potential impact of the proposed regulations. We are a covered corporation subject to the 1% excise tax on the net shares repurchased. We have recorded in shareholders’ equity an estimate of the excise tax liability based on our interpretation of the current guidance. As additional guidance is issued related to the IRA, we will continue to evaluate any impact to our consolidated financial statements.
In December 2021, the Organization for Economic Co-operation and Development published the Pillar Two model rules which introduce new taxing mechanisms aimed at ensuring multinational enterprises pay a minimum level of tax on profits from each jurisdiction in which they operate. Various jurisdictions in which we operate have enacted or substantively enacted Pillar Two legislation that became effective beginning January 1, 2024. We intend to rely on Pillar Two transitional safe harbors where available, and based on the current estimate, the tax impact is not material to the consolidated financial statements. We continue to monitor the adoption and implementation of these rules and evaluate the potential impact on our consolidated financial statements.
Ameriprise Financial, Inc.
Dividends from Subsidiaries
Ameriprise Financial, Inc. is primarily a parent holding company for the operations carried out by our wholly-owned subsidiaries. Because of our holding company structure, our ability to meet our cash requirements, including the payment of dividends on our common stock, substantially depends upon the receipt of dividends or return of capital from our subsidiaries, particularly our life insurance subsidiary, RiverSource Life, our face-amount certificate subsidiary, ACC, Ameriprise Bank, AMPF Holding, LLC, which is the parent company of our retail introducing broker-dealer subsidiary, Ameriprise Financial Services, LLC (“AFS”) and our clearing broker-dealer subsidiary, American Enterprise Investment Services, Inc. (“AEIS”), our transfer agent subsidiary, Columbia Management Investment Services Corp. (“CMIS”), our investment advisory company, Columbia Management Investment Advisers, LLC (“CMIA”), TAM UK International Holdings Ltd., which includes Ameriprise International Holdings GmbH within its organizational structure, and Columbia Threadneedle Investments UK International Ltd. The payment of dividends by many of our subsidiaries is restricted and certain of our subsidiaries are subject to regulatory capital requirements. For example, RiverSource Life payments in excess of statutory unassigned funds require advanced notice to the Minnesota Department of Commerce (“MN DOC”), RiverSource Life’s primary regulator, and are subject to potential disapproval. In addition, dividends and other distributions whose fair market value, together with that of other dividends or distributions made within the preceding 12 months, exceeds the greater of the previous year’s statutory net gain from operations or 10% of the previous year-end statutory capital and surplus are referred to as “extraordinary dividends.” Extraordinary dividends also require advanced notice to MN DOC, and are subject to potential disapproval.
Our broker-dealer subsidiaries are subject to the Uniform Net Capital Rule (Rule 15c3-1) under the Securities Exchange Act of 1934. Rule 15c3-1 provides an “alternative net capital requirement” which AEIS and AFS (significant broker dealers) have elected. Regulations require that minimum net capital, as defined, be equal to the greater of $250 thousand or 2% of aggregate debit items arising from client balances. The Financial Industry Regulatory Authority (“FINRA”) may impose certain restrictions, such as restricting withdrawals of equity capital, if a member firm were to fall below a certain threshold or fail to meet minimum net capital requirements.
Ameriprise Bank is subject to regulation by the Office of the Comptroller of the Currency (“OCC”) and the Federal Deposit Insurance Corporation in its role as insurer of its deposits. Ameriprise Bank is required to maintain minimum amounts and ratios of Total and Tier 1 capital (as defined in the regulations) to risk-weighted assets (as defined), Tier 1 Capital to average assets (as defined), and under rules defined under the Basel III capital framework, Common equity Tier 1 capital (“CEIT”) to risk-weighted assets. Ameriprise Bank calculates these ratios under the Basel III standardized approach in order to assess compliance with both regulatory requirements and Ameriprise Bank’s internal capital policies. As permitted under the rules of the Basel III capital framework, we have elected to exclude AOCI from the calculation of regulatory capital.
ACC is registered as an investment company under the Investment Company Act of 1940 (the “1940 Act”). ACC markets and sells investment certificates to clients. ACC is subject to various capital requirements under the 1940 Act, laws of the State of Minnesota and understandings with the SEC and MN DOC. The terms of the investment certificates issued by ACC and the provisions of the 1940 Act also require the maintenance by ACC of qualified assets.
Actual capital and the regulatory capital requirement for TAM UK International Holdings Ltd. and Columbia Threadneedle Investments UK International Ltd. are calculated and reported as a single consolidated group under TAM UK International Holdings Ltd. Required capital for these entities is predominantly based on the requirements specified by its regulator, the Financial Conduct Authority (“FCA”), under its Capital Adequacy Requirements for investment firms. Required capital reflects 110% of the Own Funds Threshold Requirement (“OFTR”) and is determined by the group through its ongoing Internal Capital Adequacy and Risk Assessment (“ICARA”) process.
Ameriprise Financial, Inc.
Actual capital and regulatory capital requirements for our wholly owned subsidiaries subject to regulatory capital requirements were as follows:
| | | | | | | | | | | | | | | | | |
| | Actual Capital | | Regulatory
Capital Requirements |
| December 31, | December 31, |
| 2024 | 2023 | 2024 | 2023 |
| (in millions) |
RiverSource Life (1) | $ | 2,700 | | $ | 3,093 | | | $ | 489 | | $ | 512 | |
RiverSource Life of NY (1) | 219 | | 244 | | | 38 | | 40 | |
ACC (3)(4) | 644 | | 765 | | | 596 | | 717 | |
TAM UK International Holdings Ltd.(5) | 692 | | 706 | | | 265 | | 317 | |
| | | | | |
Ameriprise Bank, FSB (6) | 1,763 | | 1,715 | | | 1,199 | | 1153 |
AFS (2)(3) | 113 | | 101 | | | # | # |
Ameriprise Captive Insurance Company (2) | 36 | | 39 | | | 13 | | 11 | |
Ameriprise Trust Company (2) | 74 | | 62 | | | 51 | | 45 | |
AEIS (2)(3) | 141 | | 171 | | | 30 | | 29 | |
RiverSource Distributors, Inc. (2)(3) | 13 | | 13 | | | # | # |
Columbia Management Investment Distributors, Inc. (2)(3) | 19 | | 17 | | | # | # |
N/A Not applicable.
# Amounts are less than $1 million.
(1) Actual capital is determined on a statutory basis. Regulatory capital requirement is the company action level and is based on the statutory risk-based capital filing.
(2) Regulatory capital requirement is based on the applicable regulatory requirement, calculated as of December 31, 2024 and 2023.
(3) Actual capital is determined on an adjusted GAAP basis.
(4) ACC is required to hold capital in compliance with the Minnesota Department of Commerce and SEC capital requirements.
(5) Actual capital and regulatory capital requirements are determined in accordance with U.K. regulatory legislation.
(6) Actual capital and regulatory capital requirements are determined in accordance with rules defined under Basel III capital framework. As permitted, AOCI is excluded from the calculation of regulatory capital.
In addition to the particular regulations restricting dividend payments and establishing subsidiary capitalization requirements, we take into account the overall health of the business, capital levels and risk management considerations in determining a strategy for payments to our parent holding company from our subsidiaries, and in deciding to use cash to make capital contributions to our subsidiaries.
The following table presents dividends paid or return of capital to the parent holding company, net of capital contributions made by the parent holding company for the following subsidiaries for the years ended December 31:
| | | | | | | | | | | | | | | | | |
| | 2024 | | 2023 | | 2022 |
| (in millions) |
| RiverSource Life | $ | 600 | | | $ | 600 | | | $ | 600 | |
| Ameriprise Bank | 675 | | | 475 | | | (395) | |
| ACC | 225 | | | (131) | | | (168) | |
| CMIA | 490 | | | 435 | | | 480 | |
| CMIS | — | | | 20 | | | — | |
| TAM UK International Holdings Ltd. | (20) | | | 184 | | | — | |
| | | | | |
| Ameriprise Advisor Capital, LLC | 225 | | | (178) | | | 78 | |
| Ameriprise Captive Insurance Company | 10 | | | 5 | | | — | |
| AMPF Holding, LLC | 1,685 | | | 1,370 | | | 1,375 | |
| | | | | |
| | | | | |
| Ameriprise India | — | | | 13 | | | 6 | |
| | | | | |
| Columbia Threadneedle Investments UK International Ltd. | 46 | | | — | | | — | |
| Columbia Threadneedle Canada, Inc. | 1 | | | — | | | — | |
| Ameriprise Holdings, Inc. | — | | | (15) | | | — | |
| | | | | |
| Total | $ | 3,937 | | | $ | 2,778 | | | $ | 1,976 | |
In 2009, RiverSource Life established an agreement to protect its exposure to Genworth Life Insurance Company (“GLIC”) for its reinsured LTC. In 2016, substantial enhancements to this reinsurance protection agreement were finalized. The terms of these confidential provisions within the agreement have been shared, in the normal course of regular reviews, with our domiciliary regulator
Ameriprise Financial, Inc.
and rating agencies. GLIC is domiciled in Delaware, so in the event GLIC were subjected to rehabilitation or insolvency proceedings, such proceedings would be located in (and governed by) Delaware laws. Delaware courts have a long tradition of respecting commercial and reinsurance affairs, as well as contracts among sophisticated parties. Similar credit protections to what we have with GLIC have been tested and respected in Delaware and elsewhere in the United States, and as a result we believe our credit protections would be respected even in the unlikely event that GLIC becomes subject to rehabilitation or insolvency proceedings in Delaware. Accordingly, while no credit protections are perfect, we believe the correct way to think about the risks represented by our counterparty credit exposure to GLIC is not the full amount of the gross liability that GLIC reinsures, but a much smaller net exposure to GLIC (if any that might exist after taking into account our credit protections). Thus, management believes that our agreement and offsetting non-LTC legacy arrangements with Genworth will enable RiverSource Life to recover on all net exposure in all material respects in the event of a rehabilitation or insolvency of GLIC.
Dividends Paid to Shareholders and Share Repurchases
We paid regular quarterly dividends to our shareholders totaling $593 million and $569 million for the years ended December 31, 2024 and 2023, respectively. On January 29, 2025, we announced a quarterly dividend of $1.48 per common share. The dividend will be paid on February 28, 2025 to our shareholders of record at the close of business on February 10, 2025.
In July 2023, our Board of Directors authorized an additional $3.5 billion for the repurchase of our common stock through September 30, 2025. As of December 31, 2024, we had $888 million remaining under this share repurchase authorization. We intend to fund share repurchases through existing excess capital, future free cash flow generation and other customary financing methods. The share repurchase program does not require the purchase of any minimum number of shares, and depending on market conditions and other factors, these purchases may be commenced or suspended at any time without prior notice. Acquisitions under the share repurchase program may be made in the open market, through privately negotiated transactions or block trades or other means. During the year ended December 31, 2024, we repurchased a total of 4.9 million shares of our common stock at an average price of $453.15 per share.
Cash Flows
Cash flows of CIEs and restricted and segregated cash and cash equivalents are reflected in our cash flows provided by (used in) operating activities, investing activities and financing activities. Cash held by CIEs is not available for general use by Ameriprise Financial, nor is Ameriprise Financial cash available for general use by its CIEs. Cash and cash equivalents segregated under federal and other regulations is held for the exclusive benefit of our brokerage customers and is not available for general use by Ameriprise Financial.
Operating Activities
Net cash provided by operating activities increased $1.9 billion to $6.6 billion for the year ended December 31, 2024 compared to $4.7 billion for the prior year primarily reflecting earnings from our fee based business operations, reduced net cash outflows in brokerage deposits, lower income taxes paid, and higher investment income.
Investing Activities
Our investing activities primarily relate to our Available-for-Sale investment portfolio and in recent quarters is significantly affected by the net flows of our face amount certificates and bank deposit activity.
Net cash used in investing activities decreased $8.7 billion to $551 million for the year ended December 31, 2024 compared to $9.3 billion for the prior year driven by a $6.5 billion increase in proceeds from maturities, sinking fund payments and calls of Available-for-Sale securities, a $1.6 billion increase in proceeds from sales of Available-for-Sale securities and a $1.2 billion decrease in purchases of Available-for-Sale securities.
Financing Activities
Net cash used in financing activities was $5.2 billion for the year ended December 31, 2024 compared to net cash provided by financing activities of $4.4 billion for the prior year. The decrease in net cash provided by financing activities primarily reflects a $6.4 billion decrease in net cash flows from investment certificates and a $2.4 billion decrease in the change in banking deposits, net. After a period of growth during a rising interest rate environment, our face amount certificates experienced net outflows during 2024.
Forward-Looking Statements
This report contains forward-looking statements that reflect management’s plans, estimates and beliefs. Actual results could differ materially from those described in these forward-looking statements. Examples of such forward-looking statements include:
•statements of the Company’s plans, intentions, positioning, expectations, objectives or goals, including those relating to asset flows, mass affluent and affluent client acquisition strategy, client retention and growth of our client base, financial advisor productivity, retention, recruiting and enrollments, the introduction, cessation, terms or pricing of new or existing products and services, acquisition integration, benefits and claims expenses, general and administrative costs, consolidated tax rate, return of capital to shareholders, debt repayment and excess capital position and financial flexibility to capture additional growth
Ameriprise Financial, Inc.
opportunities;
•statements about the expected trend in the shift to lower-risk products, including the exit from variable annuities with living benefit riders;
•statements about the anticipated deposit growth or statements about rising interest rates and the impacts on investment portfolio yield;
•other statements about future economic performance, the performance of equity markets and interest rate variations and the economic performance of the United States and of global markets; and
•statements of assumptions underlying such statements.
The words “believe,” “expect,” “anticipate,” “optimistic,” “intend,” “plan,” “aim,” “will,” “may,” “should,” “could,” “would,” “likely,” “forecast,” “on track,” “project,” “continue,” “able to remain,” “resume,” “deliver,” “develop,” “evolve,” “drive,” “enable,” “flexibility,” “scenario,” “case”, “appear”, “expand” and similar expressions are intended to identify forward-looking statements but are not the exclusive means of identifying such statements. Forward-looking statements are subject to risks and uncertainties, which could cause actual results to differ materially from such statements.
Such factors include, but are not limited to:
•market fluctuations and general economic and political factors, including volatility in the U.S. and global market conditions, client behavior and volatility in the markets for our products;
•changes in interest rates;
•adverse capital and credit market conditions or any downgrade in our credit ratings;
•effects of competition and our larger competitors’ economies of scale;
•declines in our investment management performance;
•our ability to compete in attracting and retaining talent, including financial advisors;
•impairment, negative performance or default by financial institutions or other counterparties;
•the ability to maintain our unaffiliated third-party distribution channels and the impacts of sales of unaffiliated products;
•changes in valuation of securities and investments included in our assets;
•the determination of the amount of allowances taken on loans and investments;
•the illiquidity of some of our investments;
•failures or defaults by counterparties to our reinsurance arrangements;
•failures by other insurers that lead to higher assessments we owe to state insurance guaranty funds;
•inadequate reserves for future policy benefits and claims or for future redemptions and maturities;
•deviations from our assumptions regarding morbidity, mortality and persistency affecting our insurance profitability;
•damage to our reputation arising from employee or advisor misconduct or otherwise;
•direct or indirect effects of or responses to climate change;
•interruptions or other failures in our operating systems and networks, including errors or failures caused by third-party service providers, interference or third-party attacks;
•interruptions or other errors in our telecommunications or data processing systems;
• identification and mitigation of risk exposure in market environments, new products, vendors and other types of risk;
• ability of our subsidiaries to transfer funds to us to pay dividends;
• changes in exchange rates and other risks in connection with our international operations and earnings and income generated overseas;
• occurrence of natural or man-made disasters and catastrophes;
• risks in acquisition transactions, or other potential strategic acquisitions or divestitures;
• legal and regulatory actions brought against us;
• changes to laws and regulations that govern operation of our business;
• supervision by bank regulators and related regulatory and prudential standards as a savings and loan holding company that may limit our activities and strategies;
• changes in corporate tax laws and regulations and interpretations and determinations of tax laws impacting our products;
• protection of our intellectual property and claims we infringe the intellectual property of others; and
•changes in and the adoption of new accounting standards.
Management cautions the reader that the foregoing list of factors is not exhaustive. There may also be other risks that management is unable to predict at this time that may cause actual results to differ materially from those in forward-looking statements. Readers are cautioned not to place undue reliance on these forward-looking statements, which speak only as of the date on which they are made. Management undertakes no obligation to update publicly or revise any forward-looking statements. The foregoing list of factors
Ameriprise Financial, Inc.
should be read in conjunction with the “Risk Factors” discussion included in Item 1A of this Annual Report on Form 10-K - “Risk Factors”.
Ameriprise Financial announces financial and other information to investors through the Company’s investor relations website at ir.ameriprise.com, as well as SEC filings, press releases, public conference calls and webcasts. Investors and others interested in the company are encouraged to visit the investor relations website from time to time, as information is updated and new information is posted. The website also allows users to sign up for automatic notifications in the event new materials are posted. The information found on the website is not incorporated by reference into this report or in any other report or document the Company furnishes or files with the SEC.
Item 7A. Quantitative and Qualitative Disclosures About Market Risk
Market Risk
Our primary market risk exposures are interest rate, equity price, foreign currency exchange rate and credit risk. Equity price and interest rate fluctuations can have a significant impact on our results of operations, primarily due to the effects they have on the asset management and other asset-based fees we earn, the spread income generated on our brokerage client cash balances, banking deposits, face-amount certificate products, fixed portion of our variable annuities and variable insurance contracts, fixed annuity and insurance contracts, the value of market risk benefits and other liabilities associated with our variable annuities and the value of derivatives held to hedge related benefits.
Market risk benefits continue to be managed by utilizing a hedging program which attempts to match the sensitivity of the assets with the sensitivity of the benefits. This approach works with the premise that matched sensitivities will produce a highly effective hedging result. Our comprehensive hedging program focuses mainly on first order sensitivities of assets and liabilities: Equity Market Level (Delta), Interest Rate Level (Rho) and Volatility (Vega). Additionally, various second order sensitivities are managed. We use various options, swaptions, swaps and futures to manage risk exposures. The exposures are measured and monitored daily, and adjustments to the hedge portfolio are made as necessary.
To evaluate interest rate and equity price risk, we perform sensitivity testing which measures the impact on pretax income from the sources listed below for a 12-month period following a hypothetical 100 basis point increase in interest rates or a hypothetical 10% decline in equity prices. The interest rate risk test assumes a sudden 100 basis point parallel shift in the yield curve, with rates then staying at those levels for the next 12 months. The equity price risk test assumes a sudden 10% drop in equity prices, with equity prices then staying at those levels for the next 12 months. In estimating the values of variable annuities, indexed annuities, indexed universal life (“IUL”) insurance and the associated hedging instruments, we assume no change in implied market volatility despite the 10% drop in equity prices.
The following tables present our estimate of the impact on pretax income from the above defined hypothetical market movements as of December 31, 2024:
| | | | | | | | | | | | | | | | | | | | | | | |
| Equity Price Decline 10% | | Equity Price Exposure to Pretax Income | |
| Before Hedge Impact | | Hedge Impact | | Net Impact |
| | | (in millions) |
Asset-based management and distribution fees (1) | | $ | (348) | | | $ | 2 | | | $ | (346) | | |
| Variable annuity and structured variable annuity benefits: | | | | | | | |
| | | | | | | |
| | | | | | | |
| | | | | | | |
| Market risk benefits | | (845) | | | 702 | | | (143) | | |
| Indexing feature for structured variable annuities | | 1,022 | | | (1,043) | | | (21) | | |
| Total variable annuity and structured variable annuity benefits | | 177 | | | (341) | | | (164) | | |
| | | | | | | |
| IUL insurance | | 60 | | | (59) | | | 1 | | |
| Total | | $ | (111) | | | $ | (398) | | | $ | (509) | | (2) |
Ameriprise Financial, Inc.
| | | | | | | | | | | | | | | | | | | | | | | |
| Interest Rate Increase 100 Basis Points | | Interest Rate Exposure to Pretax Income | |
| Before Hedge Impact | | Hedge Impact | | Net Impact |
| | | (in millions) |
Asset-based management and distribution fees (1) | | $ | (62) | | | $ | — | | | $ | (62) | | |
| Variable annuity and structured variable annuity benefits: | | | | | | | |
| Market risk benefits | | 1,044 | | | (776) | | | 268 | | |
| Indexing feature for structured variable annuities | | (12) | | | 174 | | | 162 | | |
| Total variable annuity and structured variable annuity benefits | | 1,032 | | | (602) | | | 430 | | |
| Fixed annuities, fixed insurance and fixed portion of variable annuities and variable insurance products | | 41 | | | — | | | 41 | | |
| Banking deposits | | 49 | | | — | | | 49 | | |
| Brokerage client cash balances | | 52 | | | — | | | 52 | | |
| Certificates | | 1 | | | — | | | 1 | | |
| IUL insurance | | 15 | | | 3 | | | 18 | | |
| Total | | $ | 1,128 | | | $ | (599) | | | $ | 529 | | |
(1) Excludes incentive income which is impacted by market and fund performance during the period and cannot be readily estimated.
(2) Represents the net impact to pretax income. The estimated net impact to pretax adjusted operating income is $(346) million as of December 31, 2024.
The above results compare to an estimated negative net impact to pretax income of $332 million related to a 10% equity price decline and an estimated positive net impact to pretax income of $561 million related to a 100 basis point increase in interest rates as of December 31, 2023.
Net impacts shown in the above tables from market risk benefits result largely from differences between the liability valuation basis and the hedging basis. Liabilities are valued using fair value accounting principles, with risk margins incorporated in contractholder behavior assumptions. Our hedging is based on our determination of economic risk, which excludes certain items in the liability valuation.
Actual results could and likely will differ materially from those illustrated above as fair values have a number of estimates and assumptions. For example, the illustration above includes assuming that implied market volatility does not change when equity prices fall by 10% and that the 100 basis point increase in interest rates is a parallel shift of the yield curve. Furthermore, we have not tried to anticipate changes in client preferences for different types of assets or other changes in client behavior, nor have we tried to anticipate all strategic actions management might take to increase revenues or reduce expenses in these scenarios.
The selection of a 100 basis point interest rate increase as well as a 10% equity price decline should not be construed as a prediction of future market events. Impacts of larger or smaller changes in interest rates or equity prices will not be proportional to those shown for a 100 basis point increase in interest rates or a 10% decline in equity prices.
Asset-Based Management and Distribution Fees
We earn asset-based management fees and distribution fees on our assets under management. As of December 31, 2024, the value of our assets under management was $1.2 trillion. These sources of revenue are subject to both interest rate and equity price risk since the value of these assets and the fees they earn fluctuate inversely with interest rates and directly with equity prices. We currently only hedge certain equity price risk for this exposure, primarily using futures and swaps. We currently do not hedge any of the interest rate risk for this exposure.
Market Risk Benefits
The total contract value of all variable annuities as of December 31, 2024 was $85.7 billion. See Note 13 to our Consolidated Financial Statements for details of the reserves associated with market risk benefits. The changes in fair value of variable annuity market risk benefits are recorded through earnings, with the exception of the portion of the change in fair value due to a change in our nonperformance risk, which is recognized in other comprehensive income (loss). Fair value is calculated based on projected, discounted cash flows over the life of the contract, including projected, discounted benefits and fees.
Equity Price Risk
The variable annuity guaranteed benefits guarantee payouts to the annuity holder under certain specific conditions regardless of the performance of the investment assets. For this reason, when equity prices decline, the returns from the separate account assets coupled with guaranteed benefit fees from annuity holders may not be sufficient to fund expected payouts. In that case, reserves must be increased with a negative impact to earnings.
The core derivative instruments with which we hedge the equity price risk of these benefits are longer dated put and call options; these core instruments are supplemented with equity futures and total return swaps. See Note 18 to our Consolidated Financial Statements
Ameriprise Financial, Inc.
for further information on our derivative instruments.
Interest Rate Risk
Increases in interest rates reduce the fair value of the liabilities and may result in market risk benefits in an asset position. The interest rate exposure is hedged with a portfolio of interest rate swaps, futures and swaptions. We have entered into interest rate swaps according to risk exposures along maturities, thus creating both fixed rate payor and variable rate payor terms. If interest rates were to increase, we would have to pay more to the swap counterparty, and the fair value of our equity puts would decrease, resulting in a negative impact to our pretax income.
Structured Variable Annuities
Structured variable annuities offer the contractholder the ability to allocate account value to either an account that earns fixed interest (fixed account) or an account that is impacted by the performance of various equity indices (indexed account) subject to a cap, floor or buffer. Our earnings are based upon the spread between investment income earned and the credits made to the fixed account and benefits reflected in an indexed account of the structured variable annuities. As of December 31, 2024, we had $16.3 billion in liabilities related to structured variable annuities.
Equity Price Risk
The equity-linked return to contractholders creates equity price risk as the amount paid to contractholders depends on changes in equity prices. The equity price risk for structured variable annuities is evaluated together with the variable annuity riders as part of a hedge program using the derivative instruments consistent with our hedging on variable annuity riders.
Interest Rate Risk
The fair value of the embedded derivative associated with structured variable annuities is based on a discounted cash flow approach. Changes in interest rates impact the discounting of the embedded derivative liability. The spread between the investment income earned and amounts transferred to contractholders is also affected by changes in interest rates. These interest rate risks associated with structured variable annuities are not currently hedged.
Fixed Annuities, Fixed Insurance and Fixed Portion of Variable Annuities and Variable Insurance Contracts
Our earnings from fixed deferred annuities, fixed insurance, and the fixed portion of variable annuities and variable insurance contracts are based upon the spread between rates earned on assets held and the rates at which interest is credited to accounts. We primarily invest in fixed rate securities to fund the rate credited to clients. We guarantee an interest rate to the holders of these products. Investment assets and client liabilities generally differ as it relates to basis, repricing or maturity characteristics. Rates credited to clients’ accounts generally reset at shorter intervals than the yield on the underlying investments. Therefore, in an increasing interest rate environment, higher interest rates may be reflected in crediting rates to clients sooner than in rates earned on invested assets, which could result in a reduced spread between the two rates, reduced earned income and a negative impact on pretax income. While interest rates under the current environment have relieved some pressure from the liability guaranteed minimum interest rates (“GMIRs”), there are still some GMIRs above current levels. Hence, liability credited rates will move more slowly under a modest rise in interest rates while projected asset purchases would capture the full increase in interest rates. This dynamic would result in widening spreads under a modestly rising rate scenario given the current relationship between the current level of interest rates and the underlying GMIRs on the business. Of the $41.9 billion in Policyholder account balances, future policy benefits and claims as of December 31, 2024, $15.9 billion is related to liabilities created by these products. We do not hedge this exposure.
As a result of the current market environment, reinvestment yields are becoming more aligned with the current portfolio yield. The carrying value and weighted average yield of non-structured fixed maturity securities and commercial mortgage loans that may generate proceeds to reinvest through 2026 due to prepayment, maturity or call activity at the option of the issuer, excluding securities with a make-whole provision, were $4.1 billion and 4.7%, respectively, as of December 31, 2024. In addition, residential mortgage backed securities, which can be subject to prepayment risk under a low interest rate environment, totaled $23.3 billion and had a weighted average yield of 4.6% as of December 31, 2024. While these amounts represent investments that could be subject to reinvestment risk, it is also possible that these investments will be used to fund liabilities or may not be prepaid and will remain invested at their current yields. In addition to the interest rate environment, the mix of benefit payments versus product sales as well as the timing and volumes associated with such mix may impact our investment yield. Furthermore, reinvestment activities and the associated investment yield may also be impacted by corporate strategies implemented at management’s discretion. The average yield for investment purchases during the year ended December 31, 2024 was approximately 5.4%.
The reinvestment of proceeds from maturities, calls and prepayments at rates above the current portfolio yields will create potential upside impact to future operating results. In this volatile rate environment, we assess reinvestment risk in our investment portfolio and monitor this risk in accordance with our asset/liability management framework. In addition, we may update the crediting rates on our fixed products when warranted, subject to guaranteed minimums.
Ameriprise Financial, Inc.
See Note 11 to our Consolidated Financial Statements for more information on the account values of fixed deferred annuities, fixed insurance, and the fixed portion of variable annuities and variable insurance contracts by range of GMIRs and the range of the difference between rates credited to policyholders and contractholders as of December 31, 2024 and 2023 and the respective guaranteed minimums, as well as the percentage of account values subject to rate reset in the time period indicated.
Banking Deposits and Brokerage Client Cash Balances
We pay interest on banking deposits and certain brokerage client cash balances and have the ability to reset these rates from time to time based on prevailing economic and business conditions. We earn revenue to fund the interest paid from interest-earning assets or fees from off-balance sheet deposits at Federal Deposit Insurance Corporation insured institutions, which are indexed to short-term interest rates. In general, the change in interest paid lags the change in revenues earned. As of December 31, 2024 we had $22.3 billion of bank deposits and $2.3 billion of brokerage deposits.
Certificate Products
Fixed Rate Certificates
We have interest rate risk from our investment certificates generally ranging in amounts from $1 thousand to $2 million with interest crediting rate terms ranging from 3 months to 36 months. We guarantee an interest rate to the holders of these products. Payments collected from clients are primarily invested in fixed income securities to fund the client credited rate with the spread between the rate earned from investments and the rate credited to clients recorded as earned income. Client liabilities and investment assets generally differ as it relates to basis, repricing or maturity characteristics. Rates credited to clients generally reset at shorter intervals than the yield on underlying investments. This exposure is not currently hedged although we monitor our investment strategy and make modifications based on our changing liabilities and the expected interest rate environment. As of December 31, 2024 we had $11.1 billion related to reserves for our fixed rate certificate products.
Indexed Universal Life
IUL insurance is similar to UL in many regards, although the rate of credited interest above the minimum guarantee for funds allocated to an indexed account is linked to the performance of the specified index for the indexed account (subject to stated account parameters, which include a cap and floor, or a spread and floor). The policyholder may allocate all or a portion of the policy value to a fixed or any available indexed account. As of December 31, 2024, we had $2.9 billion in liabilities related to the indexed accounts of IUL.
Equity Price Risk
The equity-linked return to investors creates equity price risk as the amount credited depends on changes in equity prices. Most of the proceeds received from IUL insurance are invested in fixed income securities. To hedge the equity exposure, a portion of the investment earnings received from the fixed income securities is used to purchase call spreads which generate returns to replicate what we must credit to client accounts.
Interest Rate Risk
As mentioned above, most of the proceeds received from IUL insurance are invested in fixed income securities with the return on those investments intended to fund the purchase of call spreads and options. There are two risks relating to interest rates. First, we have the risk that investment returns are such that we do not have enough investment income to purchase the needed call spreads. Second, in the event the policy is surrendered we pay out a book value surrender amount and there is a risk that we will incur a loss upon having to sell the fixed income securities backing the liability (if interest rates have risen). This risk is not currently hedged.
Foreign Currency Risk
We have foreign currency risk through our net investment in foreign subsidiaries and our operations in foreign countries. We are primarily exposed to changes in British Pounds related to our net investment in Threadneedle, which was approximately £1.3 billion as of December 31, 2024. We also have exposure related to operations in foreign countries to Euros, Indian Rupees and other currencies. We monitor the foreign exchange rates that we have exposure to and enter into foreign currency forward contracts to mitigate risk when economically prudent. As of December 31, 2024, the notional value of outstanding contracts and our remaining foreign currency risk related to operations in foreign countries were not material.
Interest Rate Risk on External Debt
The stated interest rates on our $2.9 billion of senior unsecured notes are fixed.
Credit Risk
We are exposed to credit risk within our investment portfolio, including our loan portfolio, and through our derivative and reinsurance activities. Credit risk relates to the uncertainty of an obligor’s continued ability to make timely payments in accordance with the contractual terms of the financial instrument or contract. We consider our total potential credit exposure to each counterparty and its affiliates to ensure compliance with pre-established credit guidelines at the time we enter into a transaction which would potentially increase our credit risk. These guidelines and oversight of credit risk are managed through a comprehensive enterprise risk management program that includes members of senior management.
Ameriprise Financial, Inc.
We manage the risk of credit-related losses in the event of nonperformance by counterparties by applying disciplined fundamental credit analysis and underwriting standards, prudently limiting exposures to lower-quality, higher-yielding investments, and diversifying exposures by issuer, industry, region and underlying investment type. We remain exposed to occasional adverse cyclical economic downturns during which default rates may be significantly higher than the long-term historical average used in pricing.
We manage our credit risk related to over-the-counter derivatives by entering into transactions with creditworthy counterparties, maintaining collateral arrangements and through the use of master netting arrangements that provide for a single net payment to be made by one counterparty to another at each due date and upon termination. Generally, our current credit exposure on over-the-counter derivative contracts is limited to a derivative counterparty’s net positive fair value of derivative contracts after taking into consideration the existence of netting arrangements and any collateral received. This exposure is monitored and managed to an acceptable threshold level.
The counterparty risk for centrally cleared over-the-counter derivatives is transferred to a central clearing party through contract novation. The central clearing party requires both daily settlement of mark-to-market and initial margin. Because the central clearing party monitors open positions and adjusts collateral requirements daily, we have minimal credit exposure from such derivative instruments.
Exchange-traded derivatives are effected through regulated exchanges that require contract standardization and initial margin to transact through the exchange. Because exchange-traded futures are marked to market and generally cash settled on a daily basis, we have minimal exposure to credit-related losses in the event of nonperformance by counterparties to such derivative instruments. Other exchange-traded derivatives would be exposed to nonperformance by counterparties for amounts in excess of initial margin requirements only if the exchange is unable to fulfill the contract.
We manage our credit risk related to reinsurance treaties by evaluating the financial condition of reinsurance counterparties prior to entering into new reinsurance treaties. In addition, we regularly evaluate their financial strength during the terms of the treaties. As of December 31, 2024, our largest reinsurance credit risks are related to coinsurance treaties with Global Atlantic Financial Group’s subsidiary Commonwealth Annuity and Life Insurance Company and with life insurance subsidiaries of Genworth Financial, Inc. See Note 7 and Note 8 to our Consolidated Financial Statements for additional information on reinsurance.
Ameriprise Financial, Inc.
Item 8. Financial Statements and Supplementary Data
Consolidated Financial Statements:
| | | | | | | | | | | |
| |
| |
| |
| |
| |
| |
| |
| 1. | | |
| 2. | | |
| 3. | | |
| 4. | | |
| 5. | | |
| 6. | | |
| 7. | | |
| 8. | | |
| 9. | | |
| 10. | | |
| 11. | | |
| 12. | | |
| 13. | | |
| 14. | | |
| 15. | | |
| 16. | | |
| 17. | | |
| 18. | | |
| 19. | | |
| | |
| 20. | | |
| 21. | | |
| 22. | | |
| 23. | | |
| 24. | | |
| 25. | | |
| 26. | | |
| 27. | | |
| 28. | | |
| | |
| | |
Report of Independent Registered Public Accounting Firm
To the Board of Directors and Shareholders of Ameriprise Financial, Inc.
Opinions on the Financial Statements and Internal Control over Financial Reporting
We have audited the accompanying consolidated balance sheets of Ameriprise Financial, Inc. and its subsidiaries (the “Company”) as of December 31, 2024 and 2023, and the related consolidated statements of operations, of comprehensive income, of equity and of cash flows for each of the three years in the period ended December 31, 2024, including the related notes and financial statement schedule listed in the index appearing under Item 15(a)(2) (collectively referred to as the “consolidated financial statements”). We also have audited the Company's internal control over financial reporting as of December 31, 2024, based on criteria established in Internal Control - Integrated Framework (2013) issued by the Committee of Sponsoring Organizations of the Treadway Commission (COSO).
In our opinion, the consolidated financial statements referred to above present fairly, in all material respects, the financial position of the Company as of December 31, 2024 and 2023, and the results of its operations and its cash flows for each of the three years in the period ended December 31, 2024 in conformity with accounting principles generally accepted in the United States of America. Also in our opinion, the Company maintained, in all material respects, effective internal control over financial reporting as of December 31, 2024, based on criteria established in Internal Control - Integrated Framework (2013) issued by the COSO.
Basis for Opinions
The Company's management is responsible for these consolidated financial statements, for maintaining effective internal control over financial reporting, and for its assessment of the effectiveness of internal control over financial reporting, included in Management’s Report on Internal Control Over Financial Reporting appearing under Item 9A. Our responsibility is to express opinions on the Company’s consolidated financial statements and on the Company's internal control over financial reporting based on our audits. We are a public accounting firm registered with the Public Company Accounting Oversight Board (United States) (PCAOB) and are required to be independent with respect to the Company in accordance with the U.S. federal securities laws and the applicable rules and regulations of the Securities and Exchange Commission and the PCAOB.
We conducted our audits in accordance with the standards of the PCAOB. Those standards require that we plan and perform the audits to obtain reasonable assurance about whether the consolidated financial statements are free of material misstatement, whether due to error or fraud, and whether effective internal control over financial reporting was maintained in all material respects.
Our audits of the consolidated financial statements included performing procedures to assess the risks of material misstatement of the consolidated financial statements, whether due to error or fraud, and performing procedures that respond to those risks. Such procedures included examining, on a test basis, evidence regarding the amounts and disclosures in the consolidated financial statements. Our audits also included evaluating the accounting principles used and significant estimates made by management, as well as evaluating the overall presentation of the consolidated financial statements. Our audit of internal control over financial reporting included obtaining an understanding of internal control over financial reporting, assessing the risk that a material weakness exists, and testing and evaluating the design and operating effectiveness of internal control based on the assessed risk. Our audits also included performing such other procedures as we considered necessary in the circumstances. We believe that our audits provide a reasonable basis for our opinions.
Definition and Limitations of Internal Control over Financial Reporting
A company’s internal control over financial reporting is a process designed to provide reasonable assurance regarding the reliability of financial reporting and the preparation of financial statements for external purposes in accordance with generally accepted accounting principles. A company’s internal control over financial reporting includes those policies and procedures that (i) pertain to the maintenance of records that, in reasonable detail, accurately and fairly reflect the transactions and dispositions of the assets of the company; (ii) provide reasonable assurance that transactions are recorded as necessary to permit preparation of financial statements in accordance with generally accepted accounting principles, and that receipts and expenditures of the company are being made only in accordance with authorizations of management and directors of the company; and (iii) provide reasonable assurance regarding prevention or timely detection of unauthorized acquisition, use, or disposition of the company’s assets that could have a material effect on the financial statements.
Because of its inherent limitations, internal control over financial reporting may not prevent or detect misstatements. Also, projections of any evaluation of effectiveness to future periods are subject to the risk that controls may become inadequate because of changes in conditions, or that the degree of compliance with the policies or procedures may deteriorate.
Critical Audit Matters
The critical audit matter communicated below is a matter arising from the current period audit of the consolidated financial statements that was communicated or required to be communicated to the audit committee and that (i) relates to accounts or disclosures that are material to the consolidated financial statements and (ii) involved our especially challenging, subjective, or complex judgments. The communication of critical audit matters does not alter in any way our opinion on the consolidated financial statements, taken as a whole, and we are not, by communicating the critical audit matter below, providing a separate opinion on the critical audit matter or on the accounts or disclosures to which it relates.
Valuation of market risk benefits
As described in Notes 2 and 13 to the consolidated financial statements, market risk benefits are contracts or contract features that both provide protection to the contractholder from other-than-nominal capital market risk and expose the Company to other-than-nominal capital market risk. Market risk benefits include certain contract features on variable annuity products that provide minimum guarantees to contractholders. Market risk benefits are measured at fair value, at the individual contract level, using a non-option-based valuation approach or an option-based valuation approach, dependent upon the fee structure of the contract. The significant assumptions used by management to develop the fair value measurements of market risk benefits include utilization of guaranteed withdrawals, surrender rate, market volatility, nonperformance risk and mortality rate. As of December 31, 2024, the market risk benefits asset was $2,182 million and the market risk benefits liability was $1,263 million.
The principal considerations for our determination that performing procedures relating to the valuation of market risk benefits is a critical audit matter are (i) the significant judgment by management when developing the fair value estimate of the market risk benefits, (ii) a high degree of auditor judgment, subjectivity and effort in performing procedures and evaluating audit evidence related to management’s significant assumptions related to utilization of guaranteed withdrawals, surrender rate, market volatility, nonperformance risk and mortality rate (collectively, the significant market risk benefit assumptions), and (iii) the audit effort involved the use of professionals with specialized skill and knowledge.
Addressing the matter involved performing procedures and evaluating audit evidence in connection with forming our overall opinion on the consolidated financial statements. These procedures included testing the effectiveness of controls relating to market risk benefits, including controls over the reasonableness of the significant market risk benefit assumptions. These procedures also included, among others, (i) evaluating management’s process for developing the fair value estimate of the market risk benefits, (ii) testing, on a sample basis, the completeness and accuracy of data used in the estimate, and (iii) the involvement of professionals with specialized skill and knowledge to assist in evaluating the reasonableness of the significant market risk benefit assumptions based on industry knowledge and data as well as historical Company data and experience, and the continued appropriateness of unchanged assumptions.
/s/ PricewaterhouseCoopers LLP
Minneapolis, Minnesota
February 20, 2025
We have served as the Company’s auditor since 2010.
Ameriprise Financial, Inc.
Consolidated Statements of Operations
| | | | | | | | | | | | | | | | | |
| Years Ended December 31, |
| 2024 | | 2023 | | 2022 |
| (in millions, except per share amounts) |
| Revenues | | | | | |
| Management and financial advice fees | $ | 10,143 | | | $ | 8,907 | | | $ | 9,033 | |
| Distribution fees | 2,060 | | | 1,931 | | | 1,939 | |
| Net investment income | 3,648 | | | 3,206 | | | 1,474 | |
| Premiums, policy and contract charges | 1,559 | | | 1,539 | | | 1,397 | |
| Other revenues | 516 | | | 513 | | | 491 | |
| | | | | |
| Total revenues | 17,926 | | | 16,096 | | | 14,334 | |
| Banking and deposit interest expense | 662 | | | 561 | | | 76 | |
| Total net revenues | 17,264 | | | 15,535 | | | 14,258 | |
| Benefits and expenses | | | | | |
| Distribution expenses | 6,024 | | | 5,078 | | | 4,935 | |
| Interest credited to fixed accounts | 616 | | | 654 | | | 665 | |
| Benefits, claims, losses and settlement expenses | 1,299 | | | 1,350 | | | 242 | |
| Remeasurement (gains) losses of future policy benefit reserves | (44) | | | (20) | | | 1 | |
| Change in fair value of market risk benefits | 628 | | | 798 | | | 311 | |
| Amortization of deferred acquisition costs | 242 | | | 246 | | | 252 | |
| Interest and debt expense | 329 | | | 324 | | | 198 | |
| General and administrative expense | 3,903 | | | 3,871 | | | 3,723 | |
| Total benefits and expenses | 12,997 | | | 12,301 | | | 10,327 | |
| Pretax income | 4,267 | | | 3,234 | | | 3,931 | |
| Income tax provision | 866 | | | 678 | | | 782 | |
| Net income | $ | 3,401 | | | $ | 2,556 | | | $ | 3,149 | |
| | | | | |
| Earnings per share | | | | | |
| Basic | $ | 33.67 | | | $ | 24.18 | | | $ | 28.29 | |
| Diluted | $ | 33.05 | | | $ | 23.71 | | | $ | 27.70 | |
See Notes to Consolidated Financial Statements.
Ameriprise Financial, Inc.
Consolidated Statements of Comprehensive Income
| | | | | | | | | | | | | | | | | |
| Years Ended December 31, |
| 2024 | | 2023 | | 2022 |
| (in millions) |
| Net income | $ | 3,401 | | | $ | 2,556 | | | $ | 3,149 | |
| Other comprehensive income (loss), net of tax: | | | | | |
| Net unrealized gains (losses) on securities | (211) | | | 802 | | | (3,076) | |
| Net unrealized gains (losses) on derivatives | — | | | 2 | | | (1) | |
| Effect of changes in discount rate assumptions on certain long-duration contracts | 153 | | | (54) | | | 861 | |
| Effect of changes in instrument-specific credit risk on market risk benefits | (62) | | | (65) | | | 407 | |
| Defined benefit plans | 15 | | | 15 | | | 76 | |
| Foreign currency translation adjustment | (37) | | | 80 | | | (171) | |
| | | | | |
| Total other comprehensive income (loss), net of tax | (142) | | | 780 | | | (1,904) | |
| Total comprehensive income (loss) | $ | 3,259 | | | $ | 3,336 | | | $ | 1,245 | |
See Notes to Consolidated Financial Statements.
Ameriprise Financial, Inc.
Consolidated Balance Sheets
| | | | | | | | | | | |
| December 31, |
| 2024 | | 2023 |
| (in millions, except share amounts) |
| Assets | | | |
| Cash and cash equivalents | $ | 8,149 | | | $ | 7,477 | |
| Cash of consolidated investment entities | 373 | | | 87 | |
| Investments (allowance for credit losses: 2024, $25; 2023, $22) | 56,423 | | | 55,489 | |
| Investments of consolidated investment entities, at fair value | 2,387 | | | 2,099 | |
| Market risk benefits | 2,182 | | | 1,427 | |
| Separate account assets | 78,114 | | | 77,457 | |
| Receivables (allowance for credit losses: 2024, $69; 2023, $81) | 14,472 | | | 15,078 | |
| Receivables of consolidated investment entities, at fair value | 31 | | | 28 | |
| Deferred acquisition costs | 2,677 | | | 2,713 | |
| Restricted and segregated cash, cash equivalents and investments | 1,444 | | | 1,635 | |
| Other assets | 15,149 | | | 11,700 | |
| Other assets of consolidated investment entities, at fair value | 2 | | | 1 | |
| Total assets | $ | 181,403 | | | $ | 175,191 | |
| | | |
| Liabilities and Equity | | | |
| Liabilities: | | | |
| Policyholder account balances, future policy benefits and claims | $ | 41,873 | | | $ | 37,545 | |
| Market risk benefits | 1,263 | | | 1,762 | |
| Separate account liabilities | 78,114 | | | 77,457 | |
| Customer deposits | 35,826 | | | 37,321 | |
| Short-term borrowings | 201 | | | 201 | |
| Long-term debt | 2,842 | | | 3,399 | |
| Debt of consolidated investment entities, at fair value | 2,429 | | | 2,155 | |
| Accounts payable and accrued expenses | 2,704 | | | 2,603 | |
| Other liabilities | 10,609 | | | 7,974 | |
| Other liabilities of consolidated investment entities, at fair value | 314 | | | 45 | |
| Total liabilities | 176,175 | | | 170,462 | |
| | | |
| Equity: | | | |
| Common shares ($0.01 par value; shares authorized, 1,250,000,000; shares issued, 337,729,050 and 336,780,893, respectively) | 3 | | | 3 | |
| Additional paid-in capital | 10,141 | | | 9,824 | |
| Retained earnings | 24,713 | | | 21,905 | |
| Treasury shares, at cost (241,562,357 and 236,607,681 shares, respectively) | (27,721) | | | (25,237) | |
| Accumulated other comprehensive income (loss), net of tax | (1,908) | | | (1,766) | |
| Total equity | 5,228 | | | 4,729 | |
| Total liabilities and equity | $ | 181,403 | | | $ | 175,191 | |
See Notes to Consolidated Financial Statements.
Ameriprise Financial, Inc.
Consolidated Statements of Equity
| | | | | | | | | | | | | | | | | | | | | | | | | | | | | | | | | | | | | | | | | |
| Number of Outstanding Shares | | Common Shares | | Additional Paid-In Capital | | Retained Earnings | | Treasury Shares | | Accumulated Other
Comprehensive Income (Loss) | | Total |
| (in millions, except share data) |
| Balances at January 1, 2022 | 110,861,010 | | | $ | 3 | | | $ | 9,220 | | | $ | 17,322 | | | $ | (21,066) | | | $ | (642) | | | $ | 4,837 | |
| Net income | — | | | — | | | — | | | 3,149 | | | — | | | — | | | 3,149 | |
| Other comprehensive income (loss), net of tax | — | | | — | | | — | | | — | | | — | | | (1,904) | | | (1,904) | |
| Dividends to shareholders | — | | | — | | | — | | | (553) | | | — | | | — | | | (553) | |
| Repurchase of common shares | (7,371,332) | | | — | | | — | | | — | | | (2,095) | | | — | | | (2,095) | |
| Share-based compensation plans | 1,789,312 | | | — | | | 297 | | | — | | | 72 | | | — | | | 369 | |
| Balances at December 31, 2022 | 105,278,990 | | | 3 | | | 9,517 | | | 19,918 | | | (23,089) | | | (2,546) | | | 3,803 | |
| Net income | — | | | — | | | — | | | 2,556 | | | — | | | — | | | 2,556 | |
| Other comprehensive income (loss), net of tax | — | | | — | | | — | | | — | | | — | | | 780 | | | 780 | |
| Dividends to shareholders | — | | | — | | | — | | | (569) | | | — | | | — | | | (569) | |
| Repurchase of common shares | (6,659,042) | | | — | | | — | | | — | | | (2,212) | | | — | | | (2,212) | |
| Share-based compensation plans | 1,553,264 | | | — | | | 307 | | | — | | | 64 | | | — | | | 371 | |
| Balances at December 31, 2023 | 100,173,212 | | | 3 | | | 9,824 | | | 21,905 | | | (25,237) | | | (1,766) | | | 4,729 | |
| Net income | — | | | — | | | — | | | 3,401 | | | — | | | — | | | 3,401 | |
| Other comprehensive income (loss), net of tax | — | | | — | | | — | | | — | | | — | | | (142) | | | (142) | |
| Dividends to shareholders | — | | | — | | | — | | | (593) | | | — | | | — | | | (593) | |
| Repurchase of common shares | (5,717,527) | | | — | | | — | | | — | | | (2,566) | | | — | | | (2,566) | |
| Share-based compensation plans | 1,711,008 | | | — | | | 317 | | | — | | | 82 | | | — | | | 399 | |
| Balances at December 31, 2024 | 96,166,693 | | | $ | 3 | | | $ | 10,141 | | | $ | 24,713 | | | $ | (27,721) | | | $ | (1,908) | | | $ | 5,228 | |
See Notes to Consolidated Financial Statements.
Ameriprise Financial, Inc.
Consolidated Statements of Cash Flows
| | | | | | | | | | | | | | | | | |
| Years Ended December 31, |
| 2024 | | 2023 | | 2022 |
| (in millions) |
| Cash Flows from Operating Activities | | | | | |
| Net income | $ | 3,401 | | | $ | 2,556 | | | $ | 3,149 | |
| Adjustments to reconcile net income to net cash provided by (used in) operating activities: | | | | | |
| Depreciation, amortization and accretion, net | (159) | | | (154) | | | (40) | |
| Deferred income tax expense (benefit) | 125 | | | 18 | | | 155 | |
| Share-based compensation | 193 | | | 187 | | | 170 | |
| | | | | |
| Net realized investment (gains) losses | 15 | | | 47 | | | (1) | |
| Net trading (gains) losses | (7) | | | (9) | | | 16 | |
| Loss from equity method investments | 19 | | | 27 | | | 36 | |
| Impairments and provision for loan and credit losses | 9 | | | (16) | | | 98 | |
| Net (gains) losses of consolidated investment entities | (13) | | | 23 | | | 17 | |
| Changes in operating assets and liabilities | | | | | |
| Restricted and segregated investments | 102 | | | (8) | | | (96) | |
| Deferred acquisition costs | 36 | | | 64 | | | 67 | |
| Policyholder account balances, future policy benefits and claims, and market risk benefits, net | 3,831 | | | 3,071 | | | 623 | |
| Derivatives, net of collateral | (1,696) | | | (624) | | | 315 | |
| Receivables | 215 | | | 276 | | | 39 | |
| Brokerage deposits | (55) | | | (781) | | | (345) | |
| Accounts payable and accrued expenses | 105 | | | 354 | | | (219) | |
| Current income tax, net | 200 | | | (387) | | | 116 | |
| | | | | |
| Other operating assets and liabilities of consolidated investment entities, net | 1 | | | (5) | | | 2 | |
| Other, net | 273 | | | 46 | | | 305 | |
| Net cash provided by (used in) operating activities | 6,595 | | | 4,685 | | | 4,407 | |
| | | | | |
| Cash Flows from Investing Activities | | | | | |
| Available-for-Sale securities: | | | | | |
| Proceeds from sales | 2,340 | | | 734 | | | 1,306 | |
| Maturities, sinking fund payments and calls | 15,684 | | | 9,230 | | | 7,621 | |
| Purchases | (18,536) | | | (19,694) | | | (22,034) | |
| Proceeds from sales, maturities and repayments of mortgage loans | 175 | | | 152 | | | 169 | |
| Funding of mortgage loans | (413) | | | (284) | | | (207) | |
| Proceeds from sales, maturities and collections of other investments | 123 | | | 145 | | | 96 | |
| Purchase of other investments | (158) | | | (116) | | | (99) | |
| Purchase of investments by consolidated investment entities | (1,125) | | | (427) | | | (961) | |
| Proceeds from sales, maturities and repayments of investments by consolidated investment entities | 1,117 | | | 643 | | | 615 | |
| Purchase of land, buildings, equipment and software | (176) | | | (184) | | | (182) | |
| | | | | |
| Cash paid for written options with deferred premiums | (57) | | | (59) | | | (619) | |
| Cash received from written options with deferred premiums | 22 | | | 43 | | | 204 | |
| Cash returned (paid) for acquisition of business, net of cash acquired | — | | | — | | | 34 | |
| Cash paid for deposit receivables | (33) | | | (39) | | | (45) | |
| Cash received for deposit receivables | 592 | | | 774 | | | 550 | |
| Other, net | (106) | | | (180) | | | (31) | |
| Net cash provided by (used in) investing activities | $ | (551) | | | $ | (9,262) | | | $ | (13,583) | |
| See Notes to Consolidated Financial Statements. |
Ameriprise Financial, Inc.
Consolidated Statements of Cash Flows (Continued)
| | | | | | | | | | | | | | | | | |
| Years Ended December 31, |
| 2024 | | 2023 | | 2022 |
| (in millions) |
| Cash Flows from Financing Activities | | | | | |
| Investment certificates: | | | | | |
| Proceeds from additions | $ | 4,942 | | | $ | 11,193 | | | $ | 8,343 | |
| Maturities, withdrawals and cash surrenders | (7,212) | | | (7,039) | | | (4,339) | |
| Policyholder account balances: | | | | | |
| Deposits and other additions | 1,470 | | | 1,476 | | | 1,169 | |
| Net transfers from (to) separate accounts | (176) | | | (132) | | | (162) | |
| Surrenders and other benefits | (1,765) | | | (2,102) | | | (1,459) | |
| Change in banking deposits, net | 809 | | | 3,193 | | | 6,885 | |
| Cash paid for purchased options with deferred premiums | (148) | | | (53) | | | (197) | |
| Cash received for purchased options with deferred premiums | 229 | | | 251 | | | 378 | |
| Issuance of long-term debt, net of issuance costs | — | | | 1,335 | | | 495 | |
| Repayments of long-term debt | (561) | | | (760) | | | (510) | |
| Dividends paid to shareholders | (574) | | | (550) | | | (534) | |
| Repurchase of common shares | (2,448) | | | (2,127) | | | (1,978) | |
| | | | | |
| Borrowings of consolidated investment entities | 1,273 | | | — | | | 341 | |
| Repayments of debt by consolidated investment entities | (1,004) | | | (275) | | | (4) | |
| Other, net | — | | | 1 | | | 2 | |
| Net cash provided by (used in) financing activities | (5,165) | | | 4,411 | | | 8,430 | |
| Effect of exchange rate changes on cash | (10) | | | 31 | | | (68) | |
| Net increase (decrease) in cash and cash equivalents, including amounts restricted | 869 | | | (135) | | | (814) | |
| Cash and cash equivalents, including amounts restricted at beginning of period | 8,620 | | | 8,755 | | | 9,569 | |
| Cash and cash equivalents, including amounts restricted at end of period | $ | 9,489 | | | $ | 8,620 | | | $ | 8,755 | |
| | | | | |
| Supplemental Disclosures: | | | | | |
| Interest paid excluding consolidated investment entities | $ | 834 | | | $ | 682 | | | $ | 152 | |
| Interest paid by consolidated investment entities | 176 | | | 177 | | | 75 | |
| Income taxes paid, net | 496 | | | 1,036 | | | 500 | |
| | | | | |
| Leased assets obtained in exchange for operating lease liabilities | 39 | | | 67 | | | 47 | |
| | | | | |
| | | | | |
| | | | | |
| | | | | |
| |
December 31, |
| 2024 | | 2023 |
| (in millions) |
| Reconciliation of cash and cash equivalents, including amounts restricted: | | | |
| Cash and cash equivalents | $ | 8,149 | | | $ | 7,477 | |
| Cash of consolidated investment entities | 373 | | | 87 | |
| Restricted and segregated cash, cash equivalents and investments | 1,444 | | | 1,635 | |
| Less: Restricted and segregated investments | (477) | | | (579) | |
| Total cash and cash equivalents, including amounts restricted per consolidated statements of cash flows | $ | 9,489 | | | $ | 8,620 | |
See Notes to Consolidated Financial Statements.
Ameriprise Financial, Inc.
Notes to Consolidated Financial Statements
1. Basis of Presentation
Ameriprise Financial, Inc. is a holding company, which primarily conducts business through its subsidiaries to provide financial planning, products and services that are designed to be utilized as solutions for clients’ cash and liquidity, asset accumulation, income, protection and estate and wealth transfer needs. The foreign operations of Ameriprise Financial, Inc. (“Ameriprise Financial”) are conducted primarily through Columbia Threadneedle Investments UK International Limited, TAM UK International Holdings Limited and Ameriprise Asset Management Holdings Singapore (Pte.) Ltd. and their respective subsidiaries (collectively, “Threadneedle”).
The accompanying Consolidated Financial Statements include the accounts of Ameriprise Financial, Inc., companies in which it directly or indirectly has a controlling financial interest and variable interest entities (“VIEs”) in which it is the primary beneficiary (collectively, the “Company”). All intercompany transactions and balances have been eliminated in consolidation.
The accompanying Consolidated Financial Statements are prepared in accordance with U.S. generally accepted accounting principles (“GAAP”). Certain reclassifications of prior period amounts have been made to conform with the current presentation.
The Company evaluated events or transactions that occurred after the balance sheet date for potential recognition or disclosure through the date the financial statements were issued. No subsequent events or transactions requiring recognition or disclosure were identified.
2. Summary of Significant Accounting Policies
Principles of Consolidation
A VIE is an entity that either has equity investors that lack certain essential characteristics of a controlling financial interest (including substantive voting rights, the obligation to absorb the entity’s losses, or the rights to receive the entity’s returns) or has equity investors that do not provide sufficient financial resources for the entity to support its activities.
Voting interest entities (“VOEs”) are those entities that do not qualify as a VIE. The Company consolidates VOEs in which it holds a greater than 50% voting interest. The Company generally accounts for entities using the equity method when it holds a greater than 20% but less than 50% voting interest or when the Company exercises significant influence over the entity. All other investments that are not reported at fair value as trading or Available-for-Sale securities are accounted for using the measurement alternative method when the Company owns less than a 20% voting interest and does not exercise significant influence. Under the measurement alternative, the investment is recorded at the cost basis, less impairments, if any, plus or minus observable price changes of identical or similar investments of the same issuer.
A VIE is consolidated by the reporting entity that determines it has both:
•the power to direct the activities of the VIE that most significantly impact the VIE’s economic performance; and
•the obligation to absorb potentially significant losses or the right to receive potentially significant benefits to the VIE.
All VIEs are assessed for consolidation under this framework. When evaluating entities for consolidation, the Company considers its contractual rights in determining whether it has the power to direct the activities of the VIE that most significantly impact the VIE’s economic performance. In determining whether the Company has this power, it considers whether it is acting in a role that enables it to direct the activities that most significantly impact the economic performance of an entity or if it is acting in an agent role.
In determining whether the Company has the obligation to absorb potential significant losses of the VIE or the right to receive potential significant benefits from the VIE that could potentially be significant to the VIE, the Company considers an analysis of its rights to receive benefits such as investment returns and its obligation to absorb losses associated with any investment in the VIE in conjunction with other qualitative factors. Management and incentive fees that are at market and commensurate with the level of services provided, and where the Company does not hold other interests in the VIE that would absorb more than an insignificant amount of the VIE’s expected losses or receive more than an insignificant amount of the VIE’s expected residual returns, are not considered a variable interest and are excluded from the analysis.
The consolidation guidance has a scope exception for reporting entities with interests in registered money market funds which do not have an explicit support agreement.
Foreign Currency Translation
Assets and liabilities of foreign subsidiaries, whose functional currency is other than the U.S. dollar, are translated into U.S. dollars based upon exchange rates prevailing at the end of each period. Revenues and expenses are translated at average daily exchange rates during the period. The resulting translation adjustment, along with any related hedge and tax effects, are included in accumulated other comprehensive income (loss) (“AOCI”). The determination of the functional currency is based on the primary economic environment in which the entity operates. Gains and losses from foreign currency transactions are included in General and administrative expenses.
Amounts Based on Estimates and Assumptions
Accounting estimates are an integral part of the Consolidated Financial Statements. In part, they are based upon assumptions concerning future events. Among the more significant are those that relate to investment securities valuation and the recognition of credit losses or impairments, valuation of derivative instruments, litigation reserves, future policy benefits, market risk benefits, and
Ameriprise Financial, Inc.
Notes to Consolidated Financial Statements (Continued)
income taxes and the recognition of deferred tax assets and liabilities. These accounting estimates reflect the best judgment of management and actual results could differ.
Cash and Cash Equivalents
Cash equivalents include time deposits and other highly liquid investments with original or remaining maturities at the time of purchase of 90 days or less.
Investments
Available-for-Sale Securities
Available-for-Sale securities are carried at fair value with unrealized gains (losses) recorded in AOCI, net of impacts to benefit reserves, reinsurance recoverables and income taxes. Available-for-Sale securities are recorded within Investments. Gains and losses are recognized on a trade date basis in the Consolidated Statements of Operations upon disposition of the securities.
Available-for-Sale securities are impaired when the fair value of an investment is less than its amortized cost. When an Available-for-Sale security is impaired, the Company first assesses whether or not: (i) it has the intent to sell the security (i.e., made a decision to sell) or (ii) it is more likely than not that the Company will be required to sell the security before its anticipated recovery. If either of these conditions exist, the Company recognizes an impairment by reducing the book value of the security for the difference between the investment’s amortized cost and its fair value with a corresponding charge to earnings. Subsequent increases in the fair value of Available-for-Sale securities that occur in periods after a write-down has occurred are recorded as unrealized gains in other comprehensive income (loss) (“OCI”), while subsequent decreases in fair value would continue to be recorded as reductions of book value with a charge to earnings.
For securities that do not meet the above criteria, the Company determines whether the decrease in fair value is due to a credit loss or due to other factors. The amount of impairment due to credit-related factors, if any, is recognized as an allowance for credit losses with a related charge to Net investment income. The allowance for credit losses is limited to the amount by which the security’s amortized cost basis exceeds its fair value. The amount of the impairment related to other factors is recognized in OCI.
Factors the Company considers in determining whether declines in the fair value of fixed maturity securities are due to credit-related factors include: (i) the extent to which the market value is below amortized cost; (ii) fundamental analysis of the liquidity, business prospects and overall financial condition of the issuer; and (iii) market events that could impact credit ratings, economic and business climate, litigation and government actions, and similar external business factors.
If through subsequent evaluation there is a sustained increase in cash flows expected, both the allowance and related charge to earnings may be reversed to reflect the increase in expected principal and interest payments.
In order to determine the amount of the credit loss component for corporate debt securities, a best estimate of the present value of cash flows expected to be collected discounted at the security’s effective interest rate is compared to the amortized cost basis of the security. The significant inputs to cash flow projections consider potential debt restructuring terms, projected cash flows available to pay creditors and the Company’s position in the debtor’s overall capital structure. When assessing potential credit-related impairments for structured investments (e.g., residential mortgage backed securities, commercial mortgage backed securities, asset backed securities and other structured investments), the Company also considers credit-related factors such as overall deal structure and its position within the structure, quality of underlying collateral, delinquencies and defaults, loss severities, recoveries, prepayments and cumulative loss projections.
Management has elected to exclude accrued interest in its measurement of the allowance for credit losses for Available-for-Sale securities. Accrued interest on Available-for-Sale securities is recorded as earned in Receivables. Available-for-Sale securities are generally placed on nonaccrual status when the accrued balance becomes 90 days past due or earlier based on management’s evaluation of the facts and circumstances of each security under review. All previously accrued interest is reversed through Net investment income.
Financing Receivables
Commercial Loans
Commercial loans include commercial mortgage loans, syndicated loans, and advisor loans and are recorded at amortized cost less the allowance for credit losses. Commercial mortgage loans and syndicated loans are recorded within Investments and advisor loans are recorded within Receivables. Commercial mortgage loans are loans on commercial properties that are originated by the Company. Syndicated loans represent the Company’s investment in loan syndications originated by unrelated third parties.
The Company offers loans to financial advisors primarily for recruiting, transitional cost assistance, retention purposes, practice operations, and growth strategies. These advisor loans are generally repaid over a five- to ten-year period. If the financial advisor is no longer affiliated with the Company, the unpaid balances generally become immediately due.
Ameriprise Financial, Inc.
Notes to Consolidated Financial Statements (Continued)
Interest income is accrued as earned on the unpaid principal balances of the loans. Interest income recognized on commercial mortgage loans and syndicated loans is recorded in Net investment income. Interest income recognized on advisor loans is recorded in Other revenues.
Consumer Loans
Consumer loans consist of credit card receivables, residential mortgage loans, policy loans, brokerage margin loans and pledged asset lines of credit and are recorded at amortized cost less the allowance for loan losses. Credit card receivables, residential mortgage loans and policy loans are recorded within Investments. Brokerage margin loans and pledged asset lines of credit are recorded within Receivables. Credit card receivables are related to Ameriprise-branded credit cards issued to the Company’s customers by a third party. When originated, policy loan balances do not exceed the cash surrender value of the underlying products. The Company’s broker dealer subsidiaries enter into lending arrangements with clients through the normal course of business, which are primarily based on customer margin levels. Ameriprise Bank enters into revolving lines of credit with customers of the Company’s broker dealer subsidiaries, where certain of the customer’s assets held in brokerage accounts serve as collateral.
Interest income is accrued as earned on the unpaid principal balances of the loans. Interest income recognized on consumer loans is recorded in Net investment income.
Deposit Receivables
For each of its reinsurance agreements, the Company determines whether the agreement provides indemnification against loss or liability related to insurance risk in accordance with applicable accounting standards. If the Company determines that a reinsurance agreement does not expose the reinsurer to a reasonable possibility of a significant loss from insurance risk, the Company records the agreement using the deposit method of accounting. Deposits made and any related embedded derivatives are included in Receivables. As amounts are received, consistent with the underlying contracts, deposit receivables are adjusted. Deposit receivables are accreted using the interest method and the accretion is reported in Other revenues.
See Note 7 for additional information on financing receivables.
Allowance for Credit Losses
The allowance for credit losses is a valuation account that is deducted from the amortized cost basis of the financial assets to present the net amount expected to be collected over the asset’s expected life, considering past events, current conditions and reasonable and supportable forecasts of future economic conditions. Estimates of expected credit losses consider both historical charge-off and recovery experience as well as current economic conditions and management’s expectation of future charge-off and recovery levels. Expected losses related to risks other than credit risk are excluded from the allowance for credit losses. The allowance for credit losses is measured and recorded upon initial recognition of the loan, regardless of whether it is originated or purchased. The methods and information used to develop the allowance for credit losses for each class of financing receivable are discussed below.
Commercial Loans
The allowance for credit losses for commercial mortgage loans and syndicated loans utilizes a probability of default and loss severity approach to estimate lifetime expected credit losses. Actual historical default and loss severity data for each type of commercial loan is adjusted for current conditions and reasonable and supportable forecasts of future economic conditions to develop the probability of default and loss severity assumptions that are applied to the amortized cost basis of the loans over the expected life of each portfolio. The allowance for credit losses on commercial mortgage loans and syndicated loans is recorded through provisions charged to Net investment income and is reduced/increased by net charge-offs/recoveries.
Management determines the adequacy of the allowance for credit losses based on the overall loan portfolio composition, recent and historical loss experience, and other pertinent factors, including when applicable, internal risk ratings, loan-to-value (“LTV”) ratios, and occupancy rates, along with reasonable and supportable forecasts of economic and market conditions. This evaluation is inherently subjective as it requires estimates, which may be susceptible to significant change.
While the Company may attribute portions of the allowance to specific loan pools as part of the allowance estimation process, the entire allowance is available to absorb losses expected over the life of the loan portfolio.
When determining the allowance for credit losses for advisor loans, the Company considers its actual historical collection experience and advisor termination experience as well as other factors including amounts due at termination, the reasons for the terminated relationship, length of time since termination, and the former financial advisor’s overall financial position. Management may identify certain pools of advisors at higher risk of termination based on production metrics or other factors. Management uses its best estimate of future termination and collection rates to estimate expected credit losses over the expected life of the loans. The allowance for credit losses on advisor loans is recorded through provisions charged to Distribution expenses and is reduced/increased by net charge-offs/recoveries.
Consumer Loans
The allowance for loan losses for credit card receivables and residential mortgage loans are based on models that project the Company’s receivable exposure over the expected life of the loans using cohorts based on the age of the receivable, geographic
Ameriprise Financial, Inc.
Notes to Consolidated Financial Statements (Continued)
location, and credit scores. The models utilize industry data to derive probability of default and loss given default assumptions, adjusted for current and future economic conditions. Management evaluates actual historical charge-off experience and monitors risk factors including FICO scores and past-due status within the credit card portfolio, and FICO scores, LTV ratios, and past-due status within the residential mortgage loan portfolio, to ensure the allowance for loan losses based on industry data appropriately reserves for risks specific to the Company’s portfolios. The allowance for credit losses for credit card receivables and residential mortgage loans are recorded through provisions charged to Net investment income and are reduced/increased by net charge-offs/recoveries.
The Company monitors the market value of collateral supporting the margin loans and pledged asset lines of credit and requests additional collateral when necessary in order to mitigate the risk of loss. Due to these ongoing monitoring procedures, the allowance for credit losses is only measured for the margin loan balances and pledged asset line of credit balances that are uncollateralized at the balance sheet date.
Policy loans do not exceed the cash surrender value at origination. As there is minimal risk of loss related to policy loans, there is no allowance for credit losses.
Deposit Receivables
The allowance for credit losses is calculated on an individual reinsurer basis. Deposit receivables are collateralized by underlying trust arrangements. Management evaluates the terms of the reinsurance and trust agreements, the nature of the underlying assets, and the potential for changes in the collateral value when considering the need for an allowance for credit losses.
Nonaccrual Loans
Commercial mortgage loans and syndicated loans are placed on nonaccrual status when either the collection of interest or principal has become 90 days past due or is otherwise considered doubtful of collection. Advisor loans are placed on nonaccrual status upon the advisor’s termination. When a loan is placed on nonaccrual status, unpaid accrued interest is reversed. Interest payments received on loans on nonaccrual status are generally applied to principal unless the remaining principal balance has been determined to be fully collectible. Management has elected to exclude accrued interest in its measurement of the allowance for credit losses for commercial mortgage loans, syndicated loans, and consumer loans.
Loan Modifications
A loan is modified when the Company makes certain concessionary modifications to contractual terms such as principal forgiveness, interest rate reductions, other-than-insignificant payment delays, and/or term extensions in an attempt to make the loan more affordable to a borrower experiencing financial difficulties. Generally, performance prior to the modification or significant events that coincide with the modification are considered in assessing whether the borrower can meet the new terms which may result in the loan being returned to accrual status at the time of the modification or after a performance period. If the borrower’s ability to meet the revised payment schedule is not reasonably assured, the loan remains on nonaccrual status.
Charge-off and Foreclosure
Commercial Loans
Charge-offs are recorded when the Company concludes that all or a portion of the commercial mortgage loan or syndicated loan is uncollectible. Factors used by the Company to determine whether all amounts due on commercial mortgage loans will be collected, include but are not limited to, the financial condition of the borrower, performance of the underlying properties, collateral and/or guarantees on the loan, and the borrower’s estimated future ability to pay based on property type and geographic location. Factors used by the Company to determine whether all amounts due on syndicated loans will be collected, include but are not limited to the borrower’s financial condition, industry outlook, and internal risk ratings based on rating agency data and internal analyst expectations.
If it is determined that foreclosure on a commercial mortgage loan is probable and the fair value is less than the current loan balance, expected credit losses are measured as the difference between the amortized cost basis of the asset and fair value less estimated costs to sell, if applicable. Upon foreclosure, the commercial mortgage loan and related allowance are reversed, and the foreclosed property is recorded as real estate owned within Other assets.
Concerns regarding the recoverability of loans to advisors primarily arise in the event that the financial advisor is no longer affiliated with the Company. When the review of these factors indicates that further collection activity is highly unlikely, the outstanding balance of the loan is written-off and the related allowance is reduced.
Consumer Loans
Credit card receivables are not placed on nonaccrual status at 90 days past due; however, they are fully charged off upon reaching 180 days past due.
Separate Account Assets and Liabilities
Separate account assets represent funds held for the benefit of, and Separate account liabilities represent the obligation to, the variable annuity contractholders and variable life insurance policyholders who have a contractual right to receive the benefits of their contract
Ameriprise Financial, Inc.
Notes to Consolidated Financial Statements (Continued)
or policy and bear the related investment risk. Gains and losses on separate account assets accrue directly to the contractholder or policyholder and are not reported in the Consolidated Statements of Operations. Included in separate account assets and liabilities is the fair value of the pooled pension funds that are offered by Threadneedle. Threadneedle provides a range of unitized pooled pension funds, which invest in property, stocks, bonds and cash. The investments are selected by the clients and are based on the level of risk they are willing to assume. All investment performance, net of fees, is passed through to the investors. Separate account assets are recorded at fair value and Separate account liabilities are equal to the assets recognized.
Restricted and Segregated Cash, Cash Equivalents and Investments
Amounts segregated under federal and other regulations are held in special reserve bank accounts for the exclusive benefit of the Company’s brokerage customers. Cash and cash equivalents included in Restricted and segregated cash, cash equivalents and investments are presented as part of cash balances in the Consolidated Statements of Cash Flows.
Land, Buildings, Equipment and Software
Land, buildings, equipment and internally developed software are carried at cost less accumulated depreciation or amortization and are reflected within Other assets. The Company uses the straight-line method of depreciation and amortization over periods ranging from three to 39 years.
As of December 31, 2024 and 2023, land, buildings, equipment and software were $733 million and $681 million, respectively, net of accumulated depreciation of $2.0 billion and $1.9 billion, respectively. Depreciation and amortization expense for the years ended December 31, 2024, 2023 and 2022 was $142 million, $151 million and $142 million, respectively.
Leases
The Company has operating and finance leases for corporate and field offices. The Company determines if an arrangement is a lease at inception or modification. Right-of-use (“ROU”) assets represent the Company’s right to use an underlying asset for the lease term and corresponding lease liabilities represent our obligation to make lease payments arising from the lease. ROU assets and lease liabilities are recognized at the commencement date based on the present value of lease payments over the lease term. The Company uses its incremental borrowing rate to determine the present value of the future lease payments. The incremental borrowing rate is determined at lease commencement date using a secured rate for a similar term as the period of the lease. Certain lease incentives such as free rent periods are recorded as a reduction of the ROU asset. Lease costs for operating ROU assets is recognized on a straight-line basis over the lease term.
Certain leases include one or more options to renew with terms that can extend the lease from one year to 10 years. The exercise of any lease renewal option is at the sole discretion of the Company. Renewal options are included in the ROU assets and lease liabilities when they either provide an economic incentive to renew or when the costs related to the termination of a lease outweigh the benefits of signing a new lease.
Operating and finance ROU assets are reflected in Other assets. Operating lease liabilities and finance lease liabilities are reflected in Other liabilities and Long-term debt, respectively.
Goodwill and Other Intangible Assets
Goodwill represents the amount of an acquired company’s acquisition cost in excess of the fair value of assets acquired and liabilities assumed. The Company evaluates goodwill for impairment annually on the measurement date of July 1 and whenever events and circumstances indicate that an impairment may have occurred, such as a significant adverse change in the business climate or a decision to sell or dispose of a reporting unit. Impairment is the amount carrying value exceeds fair value and is evaluated at the reporting unit level. The Company assesses various qualitative factors to determine whether impairment is likely to have occurred. If impairment were to occur, the Company would use the discounted cash flow method, a variation of the income approach.
Intangible assets are amortized over their estimated useful lives unless they are deemed to have indefinite useful lives. The Company evaluates the definite lived intangible assets remaining useful lives annually and tests for impairment whenever events and circumstances indicate that an impairment may have occurred, such as a significant adverse change in the business climate. For definite lived intangible assets, impairment to fair value is recognized if the carrying amount is not recoverable. Indefinite lived intangibles are also tested for impairment annually or whenever circumstances indicate an impairment may have occurred.
Goodwill and other intangible assets are reflected in Other assets.
Derivative Instruments and Hedging Activities
Freestanding derivative instruments are recorded at fair value and are reflected in Other assets or Other liabilities. The Company’s policy is to not offset fair value amounts recognized for derivatives and collateral arrangements executed with the same counterparty under the same master netting arrangement. The accounting for changes in the fair value of a derivative instrument depends on its intended use and the resulting hedge designation, if any. The Company primarily uses derivatives as economic hedges that are not designated as accounting hedges or do not qualify for hedge accounting treatment. The Company occasionally designates derivatives as (i) hedges of changes in the fair value of assets, liabilities, or firm commitments (“fair value hedges”), (ii) hedges of a forecasted
Ameriprise Financial, Inc.
Notes to Consolidated Financial Statements (Continued)
transaction or of the variability of cash flows to be received or paid related to a recognized asset or liability (“cash flow hedges”), or (iii) hedges of foreign currency exposures of net investments in foreign operations (“net investment hedges in foreign operations”).
Derivative instruments that are entered into for hedging purposes are designated as such at the time the Company enters into the contract. For all derivative instruments that are designated for hedging activities, the Company documents all of the hedging relationships between the hedge instruments and the hedged items at the inception of the relationships. Management also documents its risk management objectives and strategies for entering into the hedge transactions. The Company assesses, at inception and on a quarterly basis, whether derivatives designated as hedges are highly effective in offsetting the fair value or cash flows of hedged items. If it is determined that a derivative is no longer highly effective as a hedge, the Company will discontinue the application of hedge accounting.
For derivative instruments that do not qualify for hedge accounting or are not designated as accounting hedges, changes in fair value are recognized in current period earnings. Changes in fair value of derivatives are presented in the Consolidated Statements of Operations based on the nature and use of the instrument. Changes in fair value of derivatives used as economic hedges are presented in the Consolidated Statements of Operations with the corresponding change in the hedged asset or liability.
For derivative instruments that qualify as fair value hedges, changes in the fair value of the derivatives, as well as changes in the fair value of the hedged assets, liabilities or firm commitments, are recognized on a net basis in current period earnings. The carrying value of the hedged item is adjusted for the change in fair value from the designated hedged risk. If a fair value hedge designation is removed or the hedge is terminated prior to maturity, previous adjustments to the carrying value of the hedged item are recognized into earnings over the remaining life of the hedged item.
For derivative instruments that qualify as cash flow hedges, the effective portion of the gain or loss on the derivative instruments is reported in AOCI and reclassified into earnings when the hedged item or transaction impacts earnings. The amount that is reclassified into earnings is presented in the Consolidated Statements of Operations with the hedged instrument or transaction impact. Any ineffective portion of the gain or loss is reported in current period earnings as a component of Net investment income. If a hedge designation is removed or a hedge is terminated prior to maturity, the amount previously recorded in AOCI is reclassified to earnings over the period that the hedged item impacts earnings. For hedge relationships that are discontinued because the forecasted transaction is not expected to occur according to the original strategy, any related amounts previously recorded in AOCI are recognized in earnings immediately.
For derivative instruments that qualify as net investment hedges in foreign operations, the effective portion of the change in fair value of the derivatives is recorded in AOCI as part of the foreign currency translation adjustment. Any ineffective portion of the net investment hedges in foreign operations is recognized in Net investment income during the period of change.
The equity component of indexed annuity, structured variable annuity, indexed universal life (“IUL”) and stock market certificate (“SMC”) obligations are considered embedded derivatives. Additionally, certain annuities contain guaranteed minimum accumulation benefits (“GMAB”) and guaranteed minimum withdrawal benefits (“GMWB”) provisions accounted for as market risk benefits.
See Note 16 for information regarding the Company’s fair value measurement of derivative instruments and Note 18 for the impact of derivatives on the Consolidated Statements of Operations.
Market Risk Benefits
Market risk benefits are contracts or contract features that both provide protection to the contractholder from other-than-nominal capital market risk and expose the Company to other-than-nominal capital market risk. Market risk benefits include certain contract features on variable annuity products that provide minimum guarantees to contractholders. Guarantees accounted for as market risk benefits include guaranteed minimum death benefit (“GMDB”), guaranteed minimum income benefit (“GMIB”), GMWB and GMAB. If a contract contains multiple market risk benefits, those market risk benefits are bundled together as a single compound market risk benefit.
Market risk benefits are measured at fair value, at the individual contract level, using a non-option-based valuation approach or an option-based valuation approach, dependent upon the fee structure of the contract. Changes in fair value are recognized in net income each period with the exception of the portion of the change in fair value due to a change in the instrument-specific credit risk, which is recognized in OCI.
Deferred Acquisition Costs
The Company incurs costs in connection with acquiring new and renewal insurance and annuity businesses. The portion of these costs which are incremental and direct to the acquisition of a new or renewal insurance policy or annuity contract are deferred. Significant costs capitalized include sales based compensation related to the acquisition of new and renewal insurance policies and annuity contracts, medical inspection costs for successful sales, and a portion of employee compensation and benefit costs based upon the amount of time spent on successful sales. Sales based compensation paid to advisors and employees and third-party distributors is capitalized. Employee compensation and benefits costs which are capitalized relate primarily to sales efforts, underwriting and processing. All other costs which are not incremental direct costs of acquiring an insurance policy or annuity contract are expensed as incurred. The deferred acquisition costs (“DAC”) associated with insurance policies or annuity contracts that are significantly
Ameriprise Financial, Inc.
Notes to Consolidated Financial Statements (Continued)
modified or internally replaced with another contract are accounted for as write-offs. These transactions are anticipated in establishing amortization periods and other valuation assumptions.
The Company monitors other DAC amortization assumptions, such as persistency, mortality, morbidity, and variable annuity benefit utilization each quarter and, when assessed independently, each could impact the Company’s DAC balances. Unamortized DAC is reduced for actual experience in excess of expected experience.
The analysis of DAC balances and the corresponding amortization considers all relevant factors and assumptions described previously. Unless the Company’s management identifies a significant deviation over the course of the quarterly monitoring, management reviews and updates these DAC amortization assumptions annually in the third quarter of each year.
DAC is amortized on a constant-level basis for the grouped contracts over the expected contract term to approximate straight-line amortization. Contracts are grouped by contract type and issue year into cohorts consistent with the grouping used in estimating the associated liability for future policy benefits. DAC related to all long-duration product types (except for life contingent payout annuities) is grouped on a calendar-year annual basis for each legal entity. Further disaggregation is reported for any contracts that include an additional liability for death or other insurance benefit. DAC related to life contingent payout annuities is grouped on a calendar-year annual basis for each legal entity for policies issued prior to 2021 and on a quarterly basis for each legal entity thereafter.
DAC related to annuity products (including variable deferred annuities, structured variable annuities, fixed deferred annuities, and life contingent payout annuities) is amortized based on initial premium. DAC related to life insurance products (including universal life (“UL”) insurance, variable universal life (“VUL”) insurance, IUL insurance, term life insurance, and whole life insurance) is amortized based on original specified amount (i.e., face amount). DAC related to disability income (“DI”) insurance is amortized based on original monthly benefit.
The accounting contract term for annuity products (except for life contingent payout annuities) is the projected accumulation period. Life contingent payout annuities are amortized over the period which annuity payments are expected to be paid. The accounting contract term for life insurance products is the projected life of the contract. DI insurance is amortized over the projected life of the contract, including the claim paying period.
Deferred Sales Inducement Costs
Deferred sales inducements are contract features that are intended to attract new customers or to persuade existing customers to keep their current policy. Sales inducement costs consist of bonus interest credits and premium credits added to certain annuity contract and insurance policy values. These benefits are capitalized to the extent they are incremental to amounts that would be credited on similar contracts without the applicable feature. The amounts capitalized are amortized on a constant level basis using the same methodology and assumptions used to amortize DAC. Deferred sales inducement costs (“DSIC”) is recorded in Other assets and amortization of DSIC is recorded in Benefits, claims, losses and settlement expenses.
Reinsurance
The Company cedes insurance risk to other insurers under reinsurance agreements.
Reinsurance premiums paid and benefits received are accounted for consistently with the basis used in accounting for the policies from which risk is reinsured and consistently with the terms of the reinsurance contracts. Reinsurance premiums for traditional life, long term care (“LTC”) and DI insurance and life contingent payout annuities, net of the change in any prepaid reinsurance asset, are reported as a reduction of Premiums, policy and contract charges. Reinsurance recoveries are reported as components of Benefits, claims, losses and settlement expenses.
UL and VUL reinsurance premiums are reported as a reduction of Premiums, policy and contract charges. In addition, for UL and VUL insurance policies, the net cost of reinsurance ceded, which represents the discounted amount of the expected cash flows between the reinsurer and the Company, is classified as an asset and amortized based on estimated gross profits over the period the reinsured policies are in force. Changes in the net cost of reinsurance are reflected as a component of Premiums, policy and contract charges.
Insurance liabilities are reported before the effects of reinsurance. Policyholder account balances, future policy benefits and claims recoverable under reinsurance contracts are recorded within Receivables, net of the allowance for credit losses. The Company evaluates the financial condition of its reinsurers prior to entering into new reinsurance contracts and on a periodic basis during the contract term. The allowance for credit losses related to reinsurance recoverable is based on applying observable industry data including insurer ratings, default and loss severity data to the Company’s reinsurance recoverable balances. Management evaluates the results of the calculation and considers differences between the industry data and the Company’s data. Such differences include that the Company has no actual history of significant losses and that industry data may contain non-life insurers. This evaluation is inherently subjective as it requires estimates, which may be susceptible to significant change given the long-term nature of these receivables. In addition, the Company has a reinsurance protection agreement that provides credit protections for its reinsured LTC business. The allowance for credit losses on reinsurance recoverable is recorded through provisions charged to Benefits, claims, losses and settlement expenses.
Ameriprise Financial, Inc.
Notes to Consolidated Financial Statements (Continued)
The Company also assumes life insurance and fixed annuity risk from other insurers in limited circumstances. Reinsurance premiums received and benefits paid are accounted for consistently with the basis used in accounting for the policies from which risk is reinsured and consistently with the terms of the reinsurance contracts. Liabilities for assumed business are recorded within Policyholder account balances, future policy benefits and claims.
See Note 8 for additional information on reinsurance.
Policyholder Account Balances, Future Policy Benefits and Claims
The Company establishes reserves to cover the benefits associated with non-traditional and traditional long-duration products. Non-traditional long-duration products include variable and structured variable annuity contracts, fixed annuity contracts and UL and VUL policies. Traditional long-duration products include term life, whole life, DI and LTC insurance products and life contingent payout annuity products.
Non-Traditional Long-Duration Products
The liabilities for non-traditional long-duration products include fixed account values on variable and fixed annuities and UL and VUL policies, non-life contingent payout annuities, liabilities for guaranteed benefits associated with variable annuities (including structured variable annuities), and embedded derivatives for structured variable annuities, indexed annuities and IUL products.
Liabilities for fixed account values on variable annuities, structured variable annuities, fixed deferred annuities, and UL and VUL policies are equal to accumulation values, which are the cumulative gross deposits and credited interest less withdrawals and various charges. The liability for non-life contingent payout annuities is recognized as the present value of future payments using the effective yield at inception of the contract.
A portion of the Company’s UL and VUL policies have product features that result in profits followed by losses from the insurance component of the contract. These profits followed by losses can be generated by the cost structure of the product or secondary guarantees in the contract. The secondary guarantee ensures that, subject to specified conditions, the policy will not terminate and will continue to provide a death benefit even if there is insufficient policy value to cover the monthly deductions and charges. The liability for these future losses is determined at the reporting date by estimating the death benefits in excess of account value and recognizing the excess over the estimated life based on expected assessments (e.g. cost of insurance charges, contractual administrative charges, similar fees and investment margin). See Note 11 for information regarding the liability for contracts with secondary guarantees.
Liabilities for fixed deferred indexed annuity, structured variable annuity and IUL products are equal to the accumulation of host contract values, guaranteed benefits, and the fair value of embedded derivatives.
See Note 13 for information regarding variable annuity guarantees.
Embedded Derivatives
The fair value of embedded derivatives related to structured variable annuities, indexed annuities and IUL fluctuate based on equity markets and interest rates and the estimate of the Company’s nonperformance risk and is recorded in Policyholder account balances, future policy benefits and claims. See Note 16 for information regarding the fair value measurement of embedded derivatives.
Traditional Long-Duration Products
The liabilities for traditional long-duration products include cash flows related to unpaid amounts on reported claims, estimates of benefits payable on claims incurred but not yet reported and estimates of benefits that will become payable on term life, whole life, DI, LTC, and life contingent payout annuity policies as claims are incurred in the future. The claim liability (also referred to as disabled life reserve) is presented together as one liability for future policy benefits.
A liability for future policy benefits, which is the present value of estimated future policy benefits to be paid to or on behalf of policyholders and certain related expenses less the present value of estimated future net premiums to be collected from policyholders, is accrued as premium revenue is recognized. Expected insurance benefits are accrued over the life of the contract in proportion to premium revenue recognized (referred to as the net premium approach). The net premium ratio reflects cash flows from contract inception to contract termination (i.e., through the claim paying period) and cannot exceed 100%.
Assumptions utilized in the net premium approach, including mortality, morbidity, and terminations, are reviewed as part of experience studies at least annually or more frequently if suggested by evidence. Expense assumptions and actual expenses are updated within the net premium calculation consistent with other policyholder assumptions.
The updated cash flows used in the calculation are discounted using a forward rate curve. The discount rate represents an upper-medium-grade (i.e., low credit risk) fixed-income instrument yield (i.e., an A rating) that reflects the duration characteristics of the liability. Discount rates are locked in annually, at the end of each year for all products, except life contingent payout annuities, and calculated as the monthly average discount rate curves for the year. For life contingent payout annuities, the discount rates are locked in quarterly at the end of each quarter based on the average of the three months for the quarter.
Ameriprise Financial, Inc.
Notes to Consolidated Financial Statements (Continued)
The liability for future policy benefits will be updated for actual experience at least on an annual basis and concurrent with changes to cash flow assumptions. When net premiums are updated for cash flow changes, the estimated cash flows over the entire life of a group of contracts are updated using historical experience and updated future cash flow assumptions.
The revised net premiums are used to calculate an updated liability for future policy benefits as of the beginning of the reporting period, discounted at the original locked in rate (i.e., contract issuance rate). The updated liability for future policy benefits as of the beginning of the reporting period is then compared with the carrying amount of the liability as of that date prior to updating cash flow assumptions to determine the current period remeasurement gain or loss reflected in current period earnings. The revised net premiums are then applied as of the beginning of the quarter to calculate the benefit expense for the current reporting period.
The difference between the updated carrying amount of the liability for future policy benefits measured using the current discount rate assumption and the original discount rate assumption is recognized in OCI. The interest accretion rate remains the original discount rate used at contract issue date.
If the updating of cash flow assumptions results in the present value of future benefits and expenses exceeding the present value of future gross premiums, a charge to net income is recorded for the current reporting period such that net premiums are set equal to gross premiums. In subsequent periods, the liability for future policy benefits is accrued with net premiums set equal to gross premiums.
Contracts (except for life contingent payout annuities sold subsequent to December 31, 2020) are grouped into cohorts by contract type and issue year, as well as by legal entity and reportable segment. Life contingent payout annuities sold in periods beginning in 2021 are grouped into quarterly cohorts.
See Note 11 for information regarding the liabilities for traditional long-duration products.
Deferred Profit Liability
For limited-payment products, gross premiums received in excess of net premiums are deferred at initial recognition as a deferred profit liability (“DPL”). Gross premiums are measured using assumptions consistent with those used in the measurement of the liability for future policy benefits, including discount rate, mortality, lapses and expenses.
The DPL is amortized and recognized as premium revenue in proportion to expected future benefit payments from annuity contracts. Interest is accreted on the balance of the DPL using the discount rate determined at contract issuance. The Company reviews and updates its estimate of cash flows from the DPL at the same time as the estimates of cash flows for the liability for future policy benefits. When cash flows are updated, the updated estimates are used to recalculate the DPL at contract issuance. The recalculated DPL as of the beginning of the current reporting period is compared to the carrying amount of the DPL as of the beginning of the current reporting period, and any difference is recognized as either a charge or credit to premium revenue.
DPL is recorded in Policyholder account balances, future policy benefits and claims and included as a reconciling item within Note 11.
Unearned Revenue Liability
The Company’s UL and VUL policies require payment of fees or other policyholder assessments in advance for services to be provided in future periods. These charges are deferred as unearned revenue and amortized using the same assumptions and factors used to amortize DAC. The unearned revenue liability is recorded in Other liabilities and the amortization is recorded in Premiums, policy and contract charges.
For clients who pay financial planning fees prior to the advisor’s delivery of the financial plan, the financial planning fees received in advance are deferred as unearned revenue until the plan is delivered to the client.
Share-Based Compensation
The Company measures and recognizes the cost of share-based awards granted to employees and directors based on the grant-date fair value of the award and recognizes the expense (net of estimated forfeitures) on a straight-line basis over the vesting period. Excess tax benefits or deficiencies are created upon distribution or exercise of awards and are recognized within the Income tax provision. The fair value of each option is estimated on the grant date using a Black-Scholes option-pricing model. The Company recognizes the cost of performance share units granted to the Company’s Executive Leadership Team on a fair value basis until fully vested.
Income Taxes
The Company’s provision for income taxes represents the net amount of income taxes that the Company expects to pay or to receive from various taxing jurisdictions in connection with its operations. The Company provides for income taxes based on amounts that the Company believes it will ultimately owe taking into account the recognition and measurement for uncertain tax positions. Inherent in the provision for income taxes are estimates and judgments regarding the tax treatment of certain items.
In connection with the provision for income taxes, the Consolidated Financial Statements reflect certain amounts related to deferred tax assets and liabilities, which result from temporary differences between the assets and liabilities measured for financial statement purposes versus the assets and liabilities measured for tax return purposes.
Ameriprise Financial, Inc.
Notes to Consolidated Financial Statements (Continued)
The Company is required to establish a valuation allowance for any portion of its deferred tax assets that management believes will not be realized. Significant judgment is required in determining if a valuation allowance should be established and the amount of such allowance if required. Factors used in making this determination include estimates relating to the performance of the business. Consideration is given to, among other things in making this determination: (i) future taxable income exclusive of reversing temporary differences and carryforwards; (ii) future reversals of existing taxable temporary differences; (iii) taxable income in prior carryback years; and (iv) tax planning strategies. Management may need to identify and implement appropriate planning strategies to ensure its ability to realize deferred tax assets and reduce the likelihood of the establishment of a valuation allowance with respect to such assets. With respect to the corporate alternative minimum tax (“CAMT”), we have adopted a policy of excluding future years’ CAMT as a consideration within the Company’s valuation allowance analysis. See Note 24 for additional information on the Company’s valuation allowance.
Changes in tax rates and tax law are accounted for in the period of enactment. Deferred tax assets and liabilities are adjusted for the effect of a change in tax laws or rates and the effect is included in net income.
Revenue Recognition
Mortality and expense risk fees are generally calculated as a percentage of the fair value of assets held in separate accounts and recognized when assessed within Premiums, policy and contract charges.
Interest income is accrued as earned using the effective interest method, which makes an adjustment of the yield for security premiums and discounts on all performing fixed maturity securities classified as Available-for-Sale so that the related security or loan recognizes a constant rate of return on the outstanding balance throughout its term. When actual prepayments differ significantly from originally anticipated prepayments, the retrospective effective yield is recalculated to reflect actual payments to date and updated future payment assumptions and a catch-up adjustment is recorded in the current period. In addition, the new effective yield, which reflects anticipated future payments, is used prospectively. Realized gains and losses on the sale of securities, other than trading securities and equity method investments, are recognized using the specific identification method on a trade date basis.
Premiums on traditional life, DI and LTC insurance and life contingent payout annuities are net of reinsurance ceded and are recognized as revenue when due.
Variable annuity guaranteed benefit rider charges and cost of insurance charges on UL and VUL insurance and contract charges (net of reinsurance premiums and cost of reinsurance for UL insurance products) and surrender charges on annuities and UL and VUL insurance are recognized as revenue when assessed within Premiums, policy and contract charges.
See Note 4 for further discussion of accounting policies on revenue from contracts with customers.
3. Recent Accounting Pronouncements
Adoption of New Accounting Standards
Segment Reporting – Improvements to Reportable Segment Disclosures
In November 2023, the Financial Accounting Standards Board (“FASB”) issued Accounting Standards Update (“ASU”) 2023-07, Improvements to Reportable Segment Disclosures, updating reportable segment disclosure requirements in accordance with Topic 280, Segment Reporting (“Topic 280”), primarily through enhanced disclosures about significant segment expenses. In addition, the amendments enhance interim disclosure requirements, clarify circumstances in which an entity can disclose multiple segment measures of profit or loss and contain other disclosure requirements. The amendments are effective for annual periods beginning after December 15, 2023, and interim periods beginning after December 15, 2024. The Company adopted the standard on January 1, 2024. The adoption of the standard did not have an impact on the Company’s consolidated results of operations and financial condition as the standard is disclosure-related only.
Future Adoption of New Accounting Standards
Income Taxes – Improvements to Income Tax Disclosures
In December 2023, the FASB issued ASU 2023-09, Improvements to Income Tax Disclosures, updating the accounting standards related to income tax disclosures, primarily focused on the disaggregation of income taxes paid and the rate reconciliation table. The standard is to be applied prospectively with an option for retrospective application and is effective for annual periods beginning after December 15, 2024, with early adoption permitted. The Company is assessing changes to the income tax-related disclosures resulting from the standard. The adoption of the standard will not have an impact on the Company’s consolidated results of operations and financial condition as the standard is disclosure-related only.
Expenses – Disaggregation of Income Statement Expenses
In November 2024, the FASB issued ASU 2024-03, Disaggregation of Income Statement Expenses, requiring public business entities to disclose disaggregated information about certain income statement expense line items. The disaggregated disclosures are required to be in the footnotes to the consolidated financial statements on an annual and interim basis. The standard is to be applied prospectively, with an option for retrospective application and is effective for annual periods beginning after December 15, 2026, and interim
Ameriprise Financial, Inc.
Notes to Consolidated Financial Statements (Continued)
reporting periods beginning after December 15, 2027. Early adoption is permitted. The Company is assessing changes to footnote disclosures resulting from the standard. The adoption of the standard will not have an impact on the Company’s consolidated results of operations and financial condition as the standard is disclosure-related only.
4. Revenue from Contracts with Customers
The following tables present revenue disaggregated by segment on an adjusted operating basis with a reconciliation of segment revenues to those reported on the Consolidated Statements of Operations:
| | | | | | | | | | | | | | | | | | | | | | | | | | | | | | | | | | | | | | | | | |
| Year Ended December 31, 2024 |
| Advice & Wealth Management | | Asset Management | | Retirement & Protection Solutions | | Corporate & Other | | Total Segments | | Non-operating Revenue | | Total |
| (in millions) |
| Management and financial advice fees: | | | | | | | | | | | | | |
| Asset management fees: | | | | | | | | | | | | | |
| Retail | $ | — | | | $ | 2,132 | | | $ | — | | | $ | — | | | $ | 2,132 | | | $ | — | | | $ | 2,132 | |
| Institutional | — | | | 618 | | | — | | | — | | | 618 | | | — | | | 618 | |
Model delivery(2) | — | | | 82 | | | — | | | — | | | 82 | | | — | | | 82 | |
| Advisory fees | 5,634 | | | — | | | — | | | — | | | 5,634 | | | — | | | 5,634 | |
| Financial planning fees | 470 | | | — | | | — | | | — | | | 470 | | | — | | | 470 | |
| Transaction and other fees | 388 | | | 207 | | | 60 | | | — | | | 655 | | | — | | | 655 | |
| Total management and financial advice fees | 6,492 | | | 3,039 | | | 60 | | | — | | | 9,591 | | | — | | | 9,591 | |
| Distribution fees: | | | | | | | | | | | | | |
| Mutual funds | 821 | | | 228 | | | — | | | — | | | 1,049 | | | — | | | 1,049 | |
| Insurance and annuity | 1,037 | | | 160 | | | 341 | | | — | | | 1,538 | | | — | | | 1,538 | |
| Off-balance sheet brokerage cash | 154 | | | — | | | — | | | — | | | 154 | | | — | | | 154 | |
| Other products | 441 | | | — | | | — | | | — | | | 441 | | | — | | | 441 | |
| Total distribution fees | 2,453 | | | 388 | | | 341 | | | — | | | 3,182 | | | — | | | 3,182 | |
| Other revenues | 255 | | | 13 | | | — | | | — | | | 268 | | | — | | | 268 | |
| Total revenue from contracts with customers | 9,200 | | | 3,440 | | | 401 | | | — | | | 13,041 | | | — | | | 13,041 | |
Revenue from other sources (1) | 2,242 | | | 75 | | | 3,372 | | | 484 | | | 6,173 | | | 196 | | | 6,369 | |
| Total segment gross revenues | 11,442 | | | 3,515 | | | 3,773 | | | 484 | | | 19,214 | | | 196 | | | 19,410 | |
| Banking and deposit interest expense | (662) | | | — | | | — | | | (30) | | | (692) | | | — | | | (692) | |
| Total segment net revenues | 10,780 | | | 3,515 | | | 3,773 | | | 454 | | | 18,522 | | | 196 | | | 18,718 | |
| Elimination of intersegment revenues | (935) | | | (96) | | | (441) | | | 29 | | | (1,443) | | | (11) | | | (1,454) | |
| Total net revenues | $ | 9,845 | | | $ | 3,419 | | | $ | 3,332 | | | $ | 483 | | | $ | 17,079 | | | $ | 185 | | | $ | 17,264 | |
Ameriprise Financial, Inc.
Notes to Consolidated Financial Statements (Continued)
| | | | | | | | | | | | | | | | | | | | | | | | | | | | | | | | | | | | | | | | | |
| Year Ended December 31, 2023 |
| Advice & Wealth Management | | Asset Management | | Retirement & Protection Solutions | | Corporate & Other | | Total Segments | | Non-operating Revenue | | Total |
| (in millions) |
| Management and financial advice fees: | | | | | | | | | | | | | |
| Asset management fees: | | | | | | | | | | | | | |
| Retail | $ | — | | | $ | 1,959 | | | $ | — | | | $ | — | | | $ | 1,959 | | | $ | — | | | $ | 1,959 | |
| Institutional | — | | | 612 | | | — | | | — | | | 612 | | | — | | | 612 | |
Model delivery(2) | — | | | 65 | | | — | | | — | | | 65 | | | — | | | 65 | |
| Advisory fees | 4,687 | | | — | | | — | | | — | | | 4,687 | | | — | | | 4,687 | |
| Financial planning fees | 426 | | | — | | | — | | | — | | | 426 | | | — | | | 426 | |
| Transaction and other fees | 372 | | | 195 | | | 56 | | | — | | | 623 | | | — | | | 623 | |
| Total management and financial advice fees | 5,485 | | | 2,831 | | | 56 | | | — | | | 8,372 | | | — | | | 8,372 | |
| Distribution fees: | | | | | | | | | | | | | |
| Mutual funds | 723 | | | 209 | | | — | | | — | | | 932 | | | — | | | 932 | |
| Insurance and annuity | 895 | | | 154 | | | 324 | | | — | | | 1,373 | | | — | | | 1,373 | |
| Off-balance sheet brokerage cash | 316 | | | — | | | — | | | — | | | 316 | | | — | | | 316 | |
| Other products | 339 | | | — | | | — | | | — | | | 339 | | | — | | | 339 | |
| Total distribution fees | 2,273 | | | 363 | | | 324 | | | — | | | 2,960 | | | — | | | 2,960 | |
| Other revenues | 227 | | | 20 | | | — | | | — | | | 247 | | | — | | | 247 | |
| Total revenue from contracts with customers | 7,985 | | | 3,214 | | | 380 | | | — | | | 11,579 | | | — | | | 11,579 | |
Revenue from other sources (1) | 1,994 | | | 64 | | | 3,096 | | | 553 | | | 5,707 | | | 160 | | | 5,867 | |
| Total segment gross revenues | 9,979 | | | 3,278 | | | 3,476 | | | 553 | | | 17,286 | | | 160 | | | 17,446 | |
| Banking and deposit interest expense | (561) | | | — | | | — | | | (20) | | | (581) | | | — | | | (581) | |
| Total segment net revenues | 9,418 | | | 3,278 | | | 3,476 | | | 533 | | | 16,705 | | | 160 | | | 16,865 | |
| Elimination of intersegment revenues | (847) | | | (79) | | | (411) | | | 19 | | | (1,318) | | | (12) | | | (1,330) | |
| Total net revenues | $ | 8,571 | | | $ | 3,199 | | | $ | 3,065 | | | $ | 552 | | | $ | 15,387 | | | $ | 148 | | | $ | 15,535 | |
Ameriprise Financial, Inc.
Notes to Consolidated Financial Statements (Continued)
| | | | | | | | | | | | | | | | | | | | | | | | | | | | | | | | | | | | | | | | | |
| Year Ended December 31, 2022 |
| Advice & Wealth Management | | Asset Management | | Retirement & Protection Solutions | | Corporate & Other | | Total Segments | | Non-operating Revenue | | Total |
| (in millions) |
| Management and financial advice fees: | | | | | | | | | | | | | |
| Asset management fees: | | | | | | | | | | | | | |
| Retail | $ | — | | | $ | 2,179 | | | $ | — | | | $ | — | | | $ | 2,179 | | | $ | — | | | $ | 2,179 | |
| Institutional | — | | | 617 | | | — | | | — | | | 617 | | | — | | | 617 | |
Model delivery(2) | — | | | 61 | | | — | | | — | | | 61 | | | — | | | 61 | |
| Advisory fees | 4,526 | | | — | | | — | | | — | | | 4,526 | | | — | | | 4,526 | |
| Financial planning fees | 410 | | | — | | | — | | | — | | | 410 | | | — | | | 410 | |
| Transaction and other fees | 372 | | | 210 | | | 59 | | | — | | | 641 | | | — | | | 641 | |
| Total management and financial advice fees | 5,308 | | | 3,067 | | | 59 | | | — | | | 8,434 | | | — | | | 8,434 | |
| Distribution fees: | | | | | | | | | | | | | |
| Mutual funds | 741 | | | 231 | | | — | | | — | | | 972 | | | — | | | 972 | |
| Insurance and annuity | 845 | | | 166 | | | 348 | | | — | | | 1,359 | | | — | | | 1,359 | |
| Off-balance sheet brokerage cash | 324 | | | — | | | — | | | — | | | 324 | | | — | | | 324 | |
| Other products | 339 | | | — | | | — | | | — | | | 339 | | | — | | | 339 | |
| Total distribution fees | 2,249 | | | 397 | | | 348 | | | — | | | 2,994 | | | — | | | 2,994 | |
| Other revenues | 211 | | | 10 | | | — | | | — | | | 221 | | | — | | | 221 | |
| Total revenue from contracts with customers | 7,768 | | | 3,474 | | | 407 | | | — | | | 11,649 | | | — | | | 11,649 | |
Revenue from other sources (1) | 769 | | | 32 | | | 2,717 | | | 484 | | | 4,002 | | | 14 | | | 4,016 | |
| Total segment gross revenues | 8,537 | | | 3,506 | | | 3,124 | | | 484 | | | 15,651 | | | 14 | | | 15,665 | |
| Banking and deposit interest expense | (76) | | | — | | | — | | | (5) | | | (81) | | | — | | | (81) | |
| Total segment net revenues | 8,461 | | | 3,506 | | | 3,124 | | | 479 | | | 15,570 | | | 14 | | | 15,584 | |
| Elimination of intersegment revenues | (847) | | | (52) | | | (420) | | | 3 | | | (1,316) | | | (10) | | | (1,326) | |
| Total net revenues | $ | 7,614 | | | $ | 3,454 | | | $ | 2,704 | | | $ | 482 | | | $ | 14,254 | | | $ | 4 | | | $ | 14,258 | |
(1) Revenues not included in the scope of the revenue from contracts with customers standard. The amounts primarily consist of revenue associated with insurance and annuity products and investment income from financial instruments.
(2) Current year disclosure has been expanded to separately state model delivery revenue. Prior periods have been updated to conform to current year presentation.
The following discussion describes the nature, timing, and uncertainty of revenues and cash flows arising from the Company’s contracts with customers on a consolidated basis.
Management and Financial Advice Fees
Asset Management Fees
The Company earns revenue for performing asset management services for retail and institutional clients (assets under management). The Company also earns revenue for performing advisory services for model portfolios that the Company does not have full discretionary investment authority (assets under advisement). The revenue is earned based on a fixed or tiered rate applied, as a percentage, to assets under management or advisement. Assets under management and advisement vary with market fluctuations and client behavior. The asset management and advisement performance obligation is considered a series of distinct services that are substantially the same and are satisfied each day over the contract term. Asset management fees are accrued, invoiced and collected on a monthly or quarterly basis.
The Company’s asset management contracts for Open Ended Investment Companies (“OEICs”) in the United Kingdom (“U.K.”) and Société d'Investissement à Capital Variable (“SICAVs”) in Europe include performance obligations for asset management and fund distribution services. The amounts received for these services are reported as Management and financial advice fees. The revenue recognition pattern is the same for both performance obligations as the fund distribution services revenue is variably constrained due to factors outside the Company’s control including market volatility and client behavior (such as how long clients hold their investment) and not recognized until assets under management are known.
Ameriprise Financial, Inc.
Notes to Consolidated Financial Statements (Continued)
The Company may also earn performance-based management fees on institutional accounts, hedge funds, collateralized loan obligations (“CLOs”), OEICs, SICAVs and property and other funds based on a percentage of account returns in excess of either a benchmark index or a contractually specified level. This revenue is variable and impacted primarily by the performance of the assets being managed compared to the benchmark index or contractually specified level. The revenue is not recognized until it is probable that a significant reversal will not occur. Performance-based management fees are invoiced on a quarterly or annual basis.
Advisory Fees
The Company earns revenue for performing investment advisory services for certain brokerage customer’s discretionary and non-discretionary managed accounts. The revenue is earned based on a contractual fixed rate applied, as a percentage, to the market value of assets held in the account. The investment advisory performance obligation is considered a series of distinct services that are substantially the same and are satisfied each day over the contract term. Advisory fees are billed on a monthly basis on the prior month end assets.
Financial Planning Fees
The Company earns revenue for providing financial plans to its clients. The revenue earned for each financial plan is either a fixed fee (received monthly, quarterly or annually) or a variable fee (received monthly) based on a contractual fixed rate applied, as a percentage, to the prior month end assets held in a client’s investment advisory account. The financial planning fee is based on the complexity of a client’s financial and life situation and his or her advisor’s experience. The performance obligation is satisfied at the time the financial plan is delivered to the customer. The Company records a contract liability for the unearned revenue when cash is received before the plan is delivered. The financial plan contracts with clients are annual contracts. Amounts recorded as a contract liability are recognized as revenue when the financial plan is delivered, which occurs within the annual contract period.
For fixed fee arrangements, revenue is recognized when the financial plan is delivered. The Company accrues revenue for any amounts that have not been received at the time the financial plan is delivered.
For variable fee arrangements, revenue is recognized for cash that has been received when the financial plan is delivered. The amount received after the plan is delivered is variably constrained due to factors outside the Company’s control including market volatility and client behavior. The revenue is recognized when it is probable that a significant reversal will not occur and is generally each month end as the advisory account balance uncertainty is resolved.
Contract liabilities for financial planning fees, which are included in Other liabilities, were $181 million and $168 million as of December 31, 2024 and 2023, respectively.
The Company pays sales commissions to advisors when a new financial planning contract is obtained or when an existing contract is renewed. The sales commissions paid to the advisors prior to financial plan delivery are considered costs to obtain a contract with a customer and are initially capitalized. When the performance obligation to deliver the financial plan is satisfied, the commission is recognized as distribution expense. Capitalized costs to obtain these contracts are reported in Other assets, and were $145 million and $135 million as of December 31, 2024 and 2023, respectively.
Transaction and Other Fees
The Company earns revenue for providing customer support, shareholder and administrative services (including transfer agent services) for affiliated mutual funds and networking, sub-accounting and administrative services for unaffiliated mutual funds. The Company also receives revenue for providing custodial services and account maintenance services on brokerage and retirement accounts that are not included in an advisory relationship. Transfer agent and administrative revenue is earned based on either a fixed rate applied, as a percentage, to assets under management or an annual fixed fee for each fund position. Networking and sub-accounting revenue is earned based on either an annual fixed fee for each account or an annual fixed fee for each fund position. Custodial and account maintenance revenue is generally earned based on a quarterly or annual fixed fee for each account. Each of the customer support and administrative services performance obligations are considered a series of distinct services that are substantially the same and are satisfied each day over the contract term. Transaction and other fees (other than custodial service fees) are invoiced or charged to brokerage accounts on a monthly or quarterly basis. Custodial service fees are invoiced or charged to brokerage accounts on an annual basis.
The Company earns revenue for providing trade execution services to franchise advisors. The trade execution performance obligation is satisfied at the time of each trade and the revenue is primarily earned based on a fixed fee per trade. These fees are invoiced and collected on a semi-monthly basis.
Distribution Fees
Mutual Funds and Insurance and Annuity Products
The Company earns revenue for selling affiliated and unaffiliated mutual funds, fixed and variable annuities and insurance products. The performance obligation is satisfied at the time of each individual sale. A portion of the revenue is based on a fixed rate applied, as a percentage, to amounts invested at the time of sale. The remaining revenue is recognized over the time the client owns the investment or holds the contract and is generally earned based on a fixed rate applied, as a percentage, to the net asset value of the
Ameriprise Financial, Inc.
Notes to Consolidated Financial Statements (Continued)
fund, or the value of the insurance policy or annuity contract. The ongoing revenue is not recognized at the time of sale because it is variably constrained due to factors outside the Company’s control including market volatility and client behavior (such as how long clients hold their investment, insurance policy or annuity contract). This ongoing revenue may be recognized for many years after the initial sale. The revenue will not be recognized until it is probable that a significant reversal will not occur.
The Company earns revenue for providing unaffiliated partners an opportunity to educate the Company’s advisors or to support availability and distribution of their products on the Company’s platforms. These payments allow the outside parties to train and support the advisors, explain the features of their products and distribute marketing and educational materials, and support trading and operational systems necessary to enable the Company’s client servicing and production distribution efforts. The Company earns revenue for placing and maintaining unaffiliated fund partners and insurance companies’ products on the Company’s sales platform (subject to the Company’s due diligence standards). The revenue is primarily earned based on a fixed fee or a fixed rate applied, as a percentage, to the market value of assets invested. These performance obligations are considered a series of distinct services that are substantially the same and are satisfied each day over the contract term. These fees are invoiced and collected on monthly basis.
Off-Balance Sheet Brokerage Cash
The Company earns revenue for placing clients’ deposits in its brokerage sweep program with third-party banks. The amount received from the third-party banks is impacted by short-term interest rates. The performance obligation with the financial institutions that participate in the sweep program is considered a series of distinct services that are substantially the same and are satisfied each day over the contract term. The revenue is earned daily and settled monthly based on a rate applied, as a percentage, to the deposits placed.
Other Products
The Company earns revenue for selling unaffiliated alternative products. The performance obligation is satisfied at the time of each individual sale. A portion of the revenue is based on a fixed rate applied, as a percentage, to amounts invested at the time of sale. The remaining revenue is recognized over the time the client owns the investment and is earned generally based on a fixed rate applied, as a percentage, to the market value of the investment. The ongoing revenue is not recognized at the time of sale because it is variably constrained due to factors outside the Company’s control including market volatility and client behavior (such as how long clients hold their investment). The revenue will not be recognized until it is probable that a significant reversal will not occur.
The Company earns revenue from brokerage clients for the execution of requested trades. The performance obligation is satisfied at the time of trade execution and amounts are received on the settlement date. The revenue varies for each trade based on various factors that include the type of investment, dollar amount of the trade and how the trade is executed (online or broker assisted).
Other Revenues
The Company earns revenue from fees charged to franchise advisors for providing various services the advisors need to manage and grow their practices. The primary services include: licensing of intellectual property and software, compliance supervision, insurance coverage, technology services and support, consulting and other services. The services are either provided by the Company or third- party providers. The Company controls the services provided by third parties as it has the right to direct the third parties to perform the services, is primarily responsible for performing the services and sets the prices the advisors are charged. The Company recognizes revenue for the gross amount of the fees received from the advisors. The fees are primarily collected monthly as a reduction of commission payments.
Intellectual property and software licenses, along with compliance supervision, insurance coverage, and technology services and support are primarily earned based on a monthly fixed fee. These services are considered a series of distinct services that are substantially the same and are satisfied each day over the contract term. The consulting and other services performance obligations are satisfied as the services are delivered and revenue is earned based upon the level of service requested.
Receivables
Receivables for revenue from contracts with customers are recognized when the performance obligation is satisfied and the Company has an unconditional right to the revenue. Receivables related to revenues from contracts with customers were $538 million and $537 million as of December 31, 2024 and 2023, respectively.
5. Variable Interest Entities
The Company provides asset management services to investment entities which are considered to be VIEs, such as CLOs, hedge funds and other private funds, property funds, and certain non-U.S. series funds (such as OEICs and SICAVs) (collectively, “investment entities”), which are sponsored by the Company. In addition, the Company invests in structured investments other than CLOs and certain affordable housing partnerships which are considered VIEs. The Company consolidates certain investment entities (collectively, “consolidated investment entities”) if the Company is deemed to be the primary beneficiary. The Company has no obligation to provide financial or other support to the non-consolidated VIEs beyond its initial investment and existing future funding commitments, and the Company has not provided any additional support to these entities. The Company has unfunded commitments related to consolidated CLOs of $2 million and $24 million as of December 31, 2024 and 2023, respectively.
See Note 2 for further discussion of the Company’s accounting policy on consolidation.
Ameriprise Financial, Inc.
Notes to Consolidated Financial Statements (Continued)
Structured Investments
The Company invests in structured investments which are considered VIEs for which it is not the sponsor. These structured investments typically invest in fixed income instruments and are managed by third parties and include asset backed securities and commercial and residential mortgage backed securities. The Company classifies these investments as Available-for-Sale securities. The Company has determined that it is not the primary beneficiary of these structures due to the size of the Company’s investment in the entities and position in the capital structure of these entities.
Additionally, the Company invests in CLOs for which it is the sponsor. CLOs are asset backed financing entities collateralized by a pool of assets, primarily syndicated loans and, to a lesser extent, high-yield bonds. Multiple tranches of debt securities are issued by a CLO, offering investors various maturity and credit risk characteristics. The debt securities issued by the CLOs are non-recourse to the Company. The CLO’s debt holders have recourse only to the assets of the CLO. The assets of the CLOs cannot be used by the Company. Scheduled debt payments are based on the performance of the CLO’s collateral pool. The Company earns management fees from the CLOs based on the value of the CLO’s collateral pool and, in certain instances, may also receive incentive fees. The fee arrangement is at market and commensurate with the level of effort required to provide those services. The Company has invested in a portion of the unrated, junior subordinated notes and highly rated senior notes of certain CLOs. The Company consolidates certain CLOs where it is the primary beneficiary.
The Company's maximum exposure to loss with respect to structured investments and non-consolidated CLOs is limited to its amortized cost. The Company classifies these investments as Available-for-Sale securities. See Note 6 for additional information on these investments.
Other Non-Consolidated VIEs
The Company’s investments in other non-consolidated VIEs are recorded in other investments. The Company’s maximum exposure to loss with respect to its investments in these non-consolidated VIEs is limited to its carrying value. The carrying value of other non-consolidated VIEs was $161 million and $168 million as of December 31, 2024 and 2023, respectively. The Company’s liability related to original purchase commitments not yet remitted to the VIEs was not material as of both December 31, 2024 and 2023. The Company has not provided any additional support to the VIEs beyond the funding commitments.
Property Funds, Non-U.S. Series Funds, Hedge Funds and other Private Funds
The Company provides investment advice and other related services to property funds, non-U.S. series funds, hedge funds and other private funds, some of which are considered VIEs. For investment management services, the Company generally earns management fees based on the market value of assets under management, and in certain instances may also receive performance-based fees. The fee arrangements are at market and commensurate with the level of effort required to provide those services. The Company does not have a significant economic interest and is not required to consolidate any of these funds.
Affordable Housing Partnerships and Other Real Estate Partnerships
The Company is a limited partner in affordable housing partnerships that qualify for government-sponsored low income housing tax credit programs and partnerships that invest in multi-family residential properties that were originally developed with an affordable housing component. The Company has determined it is not the primary beneficiary and therefore does not consolidate these partnerships. A majority of the limited partnerships are VIEs.
Ameriprise Financial, Inc.
Notes to Consolidated Financial Statements (Continued)
Fair Value of Assets and Liabilities
The Company categorizes its fair value measurements according to a three-level hierarchy. See Note 16 for the definition of the three levels of the fair value hierarchy.
The following tables present the balances of assets and liabilities held by consolidated investment entities measured at fair value on a recurring basis:
| | | | | | | | | | | | | | | | | | | | | | | |
| | December 31, 2024 |
| Level 1 | | Level 2 | | Level 3 | | Total |
| (in millions) |
| Assets | | | | | | | |
| Investments: | | | | | | | |
| Corporate debt securities | $ | — | | | $ | 50 | | | $ | — | | | $ | 50 | |
| Common stocks | — | | | 2 | | | 1 | | | 3 | |
| | | | | | | |
| Syndicated loans | — | | | 2,216 | | | 118 | | | 2,334 | |
| Total investments | — | | | 2,268 | | | 119 | | | 2,387 | |
| Receivables | — | | | 31 | | | — | | | 31 | |
| Other assets | — | | | 2 | | | — | | | 2 | |
| Total assets at fair value | $ | — | | | $ | 2,301 | | | $ | 119 | | | $ | 2,420 | |
| | | | | | | |
| Liabilities | | | | | | | |
Debt (1) | $ | — | | | $ | 2,429 | | | $ | — | | | $ | 2,429 | |
| Other liabilities | — | | | 314 | | | — | | | 314 | |
| Total liabilities at fair value | $ | — | | | $ | 2,743 | | | $ | — | | | $ | 2,743 | |
| | | | | | | | | | | | | | | | | | | | | | | |
| | December 31, 2023 |
| Level 1 | | Level 2 | | Level 3 | | Total |
| (in millions) |
| Assets | | | | | | | |
| Investments: | | | | | | | |
| Corporate debt securities | $ | — | | | $ | 40 | | | $ | — | | | $ | 40 | |
| Common stocks | — | | | 5 | | | — | | | 5 | |
| | | | | | | |
| Syndicated loans | — | | | 1,991 | | | 63 | | | 2,054 | |
| Total investments | — | | | 2,036 | | | 63 | | | 2,099 | |
| Receivables | — | | | 28 | | | — | | | 28 | |
| Other assets | — | | | 1 | | | — | | | 1 | |
| Total assets at fair value | $ | — | | | $ | 2,065 | | | $ | 63 | | | $ | 2,128 | |
| | | | | | | |
| Liabilities | | | | | | | |
Debt (1) | $ | — | | | $ | 2,155 | | | $ | — | | | $ | 2,155 | |
| Other liabilities | — | | | 45 | | | — | | | 45 | |
| Total liabilities at fair value | $ | — | | | $ | 2,200 | | | $ | — | | | $ | 2,200 | |
(1) The carrying value of the CLOs’ debt is set equal to the fair value of the CLOs’ assets. The estimated fair value of the CLOs’ debt was $2.4 billion and $2.1 billion as of December 31, 2024 and 2023, respectively.
Ameriprise Financial, Inc.
Notes to Consolidated Financial Statements (Continued)
The following tables provide a summary of changes in Level 3 assets held by consolidated investment entities measured at fair value on a recurring basis:
| | | | | | | | | | | | | | | | |
| | Common Stocks | | Syndicated Loans | | | |
| | (in millions) | |
| Balance at January 1, 2024 | $ | — | | | $ | 63 | | | | |
| Total gains (losses) included in: | | | | | | |
| Net income | (1) | | (1) | (7) | | (1) | | |
| Purchases | — | | | 168 | | | | |
| Sales | (1) | | | — | | | | |
| Settlements | — | | | (5) | | | | |
| Transfers into Level 3 | 4 | | | 103 | | | | |
| Transfers out of Level 3 | (1) | | | (204) | | | | |
| | | | | | |
| | | | | | |
| Balance at December 31, 2024 | $ | 1 | | | $ | 118 | | | | |
| | | | | | |
| Changes in unrealized gains (losses) included in net income relating to assets held at December 31, 2024 | $ | — | | (1) | $ | — | | (1) | | |
| | | | | | | | | | | | | | |
| | | | Syndicated Loans | | Other Assets | |
| | (in millions) | |
| Balance at January 1, 2023 | | | $ | 125 | | | $ | 1 | | |
| Total gains (losses) included in: | | | | | | |
| Net income | | | (4) | | (1) | — | | |
| Purchases | | | 45 | | | — | | |
| Sales | | | (10) | | | — | | |
| Settlements | | | (16) | | | — | | |
| Transfers into Level 3 | | | 122 | | | — | | |
| Transfers out of Level 3 | | | (199) | | | (1) | | |
| | | | | | |
| | | | | | |
| Balance at December 31, 2023 | | | $ | 63 | | | $ | — | | |
| | | | | | |
| Changes in unrealized gains (losses) included in net income relating to assets held at December 31, 2023 | | | $ | (1) | | (1) | $ | — | | |
| | | | | | | | | | | | | | | | | | |
| | Common Stocks | | Syndicated Loans | | Other Assets | |
| (in millions) | |
| Balance at January 1, 2022 | $ | — | | | $ | 64 | | | $ | 3 | | |
| Total gains (losses) included in: | | | | | | |
| Net income | — | | | (11) | | (1) | — | | |
| Purchases | — | | | 69 | | | — | | |
| Sales | — | | | (4) | | | — | | |
| Settlements | — | | | (8) | | | — | | |
| Transfers into Level 3 | 2 | | | 218 | | | 1 | | |
| Transfers out of Level 3 | (2) | | | (203) | | | (3) | | |
| | | | | | |
| | | | | | |
| Balance at December 31, 2022 | $ | — | | | $ | 125 | | | $ | 1 | | |
| | | | | | |
| Changes in unrealized gains (losses) included in net income relating to assets held at December 31, 2022 | $ | — | | | $ | (10) | | (1) | $ | — | | |
(1) Included in Net investment income.
Securities and loans transferred from Level 3 primarily represent assets with fair values that are now obtained from a third-party pricing service with observable inputs or priced in active markets. Securities and loans transferred to Level 3 represent assets with fair values that are now based on a single non-binding broker quote.
All Level 3 measurements as of December 31, 2024 and 2023 were obtained from non-binding broker quotes where unobservable inputs utilized in the fair value calculation are not reasonably available to the Company.
Ameriprise Financial, Inc.
Notes to Consolidated Financial Statements (Continued)
Determination of Fair Value
Assets
Investments
The fair value of syndicated loans obtained from third-party pricing services using a market approach with observable inputs is classified as Level 2. The fair value of syndicated loans obtained from third-party pricing services with a single non-binding broker quote as the underlying valuation source is classified as Level 3. The underlying inputs used in non-binding broker quotes are not readily available to the Company. See Note 16 for a description of the Company’s determination of the fair value of corporate debt securities, common stocks and other investments.
Receivables
For receivables of the consolidated CLOs, the carrying value approximates fair value as the nature of these assets has historically been short-term and the receivables have been collectible. The fair value of these receivables is classified as Level 2.
Liabilities
Debt
The fair value of the CLOs’ assets, typically syndicated bank loans, is more observable than the fair value of the CLOs’ debt tranches for which market activity is limited and less transparent. As a result, the fair value of the CLOs’ debt is set equal to the fair value of the CLOs’ assets and is classified as Level 2.
Other Liabilities
Other liabilities consist primarily of securities purchased but not yet settled by consolidated CLOs. The carrying value approximates fair value as the nature of these liabilities has historically been short-term. The fair value of these liabilities is classified as Level 2. Other liabilities also include accrued interest on CLO debt.
Fair Value Option
The Company has elected the fair value option for the financial assets and liabilities of the consolidated CLOs. Management believes that the use of the fair value option better matches the changes in fair value of assets and liabilities related to the CLOs.
The following table presents the fair value and unpaid principal balance of loans and debt for which the fair value option has been elected:
| | | | | | | | | | | |
| | December 31, |
| 2024 | | 2023 |
| (in millions) |
| Syndicated loans | | | |
| Unpaid principal balance | $ | 2,406 | | | $ | 2,190 | |
| Excess unpaid principal over fair value | (72) | | | (136) | |
| Fair value | $ | 2,334 | | | $ | 2,054 | |
| | | |
| Fair value of loans more than 90 days past due | $ | 1 | | | $ | — | |
| Fair value of loans in nonaccrual status | 1 | | | 13 | |
| Difference between fair value and unpaid principal of loans more than 90 days past due, loans in nonaccrual status or both | 5 | | | 40 | |
| | | |
| Debt | | | |
| Unpaid principal balance | $ | 2,633 | | | $ | 2,362 | |
| Excess unpaid principal over fair value | (204) | | | (207) | |
Carrying value (1) | $ | 2,429 | | | $ | 2,155 | |
(1) The carrying value of the CLOs’ debt is set equal to the fair value of the CLOs’ assets. The estimated fair value of the CLOs’ debt was $2.4 billion and $2.1 billion as of December 31, 2024 and 2023, respectively.
During 2024, the Company launched two new CLOs that issued debt of $816 million in total.
Interest income from syndicated loans, bonds and structured investments is recorded based on contractual rates in Net investment income. Gains and losses related to changes in the fair value of investments and gains and losses on sales of investments are also recorded in Net investment income. Interest expense on debt is recorded in Interest and debt expense with gains and losses related to changes in the fair value of debt recorded in Net investment income.
Total net gains (losses) recognized in Net investment income related to the changes in fair value of investments the Company owns in the consolidated CLOs where it has elected the fair value option and collateralized financing entity accounting were immaterial for the years ended December 31, 2024, 2023 and 2022.
Ameriprise Financial, Inc.
Notes to Consolidated Financial Statements (Continued)
Debt of the consolidated investment entities and the stated interest rates were as follows:
| | | | | | | | | | | | | | | | | | | | | | | |
| | Carrying Value | | Weighted Average
Interest Rate |
| December 31, | December 31, |
| 2024 | | 2023 | 2024 | | 2023 |
| (in millions) | |
| Debt of consolidated CLOs due 2030 -2038 | $ | 2,429 | | | $ | 2,155 | | | 5.9 | % | | 6.6 | % |
The debt of the consolidated CLOs has both fixed and floating interest rates, which range from nil to 14.8%. The interest rates on the debt of CLOs are weighted average rates based on the outstanding principal and contractual interest rates.
6. Investments
The following is a summary of Ameriprise Financial investments:
| | | | | | | | | | | |
| | December 31, |
| 2024 | | 2023 |
| (in millions) |
| Available-for-Sale securities, at fair value | $ | 52,153 | | | $ | 51,562 | |
| Mortgage loans (allowance for credit losses: 2024, $14; 2023, $14) | 2,354 | | | 2,118 | |
| Policy loans | 982 | | | 912 | |
| Other investments (allowance for credit losses: 2024, $6; 2023, $6) | 934 | | | 897 | |
| Total | $ | 56,423 | | | $ | 55,489 | |
Other investments primarily reflect the Company’s interests in affordable housing partnerships, trading securities, equity securities, seed money investments in proprietary funds, syndicated loans, credit card receivables and certificates of deposit with original or remaining maturities at the time of purchase of more than 90 days.
The following is a summary of Net investment income:
| | | | | | | | | | | | | | | | | |
| | Years Ended December 31, |
| 2024 | | 2023 | | 2022(1) |
| (in millions) |
| | | | | |
| | | | | |
| | | | | |
| | | | | |
| | | | | |
| | | | | |
| | | | | |
| Investment income on fixed maturities | $ | 3,039 | | | $ | 2,637 | | | $ | 1,320 | |
| Net realized gains (losses) | (18) | | | (27) | | | (87) | |
| | | | | |
| | | | | |
| | | | | |
| | | | | |
| Consolidated investment entities | 207 | | | 181 | | | 102 | |
| Other | 420 | | | 415 | | | 139 | |
| Total | $ | 3,648 | | | $ | 3,206 | | | $ | 1,474 | |
(1) Prior period amounts associated with affordable housing partnerships have been reclassified to Other to conform to current year presentation.
Available-for-Sale securities distributed by type were as follows:
| | | | | | | | | | | | | | | | | | | | | | | | | | | | | | | | |
| | December 31, 2024 |
| Description of Securities | | Amortized Cost | | Gross Unrealized Gains | | Gross Unrealized Losses | | Allowance for Credit Losses | | Fair Value |
| | (in millions) |
| Corporate debt securities | | $ | 14,509 | | | $ | 201 | | | $ | (711) | | | $ | — | | | $ | 13,999 | |
| Residential mortgage backed securities | | 24,396 | | | 81 | | | (1,133) | | | — | | | 23,344 | |
| Commercial mortgage backed securities | | 5,339 | | | 10 | | | (219) | | | (4) | | | 5,126 | |
| Asset backed securities | | 6,451 | | | 30 | | | (39) | | | — | | | 6,442 | |
| State and municipal obligations | | 629 | | | 29 | | | (19) | | | (1) | | | 638 | |
| U.S. government and agency obligations | | 2,589 | | | 2 | | | — | | | — | | | 2,591 | |
| Foreign government bonds and obligations | | 13 | | | — | | | — | | | — | | | 13 | |
| | | | | | | | | | |
| Total | | $ | 53,926 | | | $ | 353 | | | $ | (2,121) | | | $ | (5) | | | $ | 52,153 | |
Ameriprise Financial, Inc.
Notes to Consolidated Financial Statements (Continued)
| | | | | | | | | | | | | | | | | | | | | | | | | | | | | | | | |
| | December 31, 2023 |
| Description of Securities | | Amortized Cost | | Gross Unrealized Gains | | Gross Unrealized Losses | | Allowance for Credit Losses | | Fair Value |
| | (in millions) |
| Corporate debt securities | | $ | 12,675 | | | $ | 409 | | | $ | (507) | | | $ | (1) | | | $ | 12,576 | |
| Residential mortgage backed securities | | 22,130 | | | 107 | | | (1,171) | | | — | | | 21,066 | |
| Commercial mortgage backed securities | | 6,380 | | | 11 | | | (341) | | | — | | | 6,050 | |
| Asset backed securities | | 8,353 | | | 25 | | | (59) | | | — | | | 8,319 | |
| State and municipal obligations | | 719 | | | 62 | | | (20) | | | (1) | | | 760 | |
| U.S. government and agency obligations | | 2,739 | | | 1 | | | — | | | — | | | 2,740 | |
| Foreign government bonds and obligations | | 19 | | | — | | | (1) | | | — | | | 18 | |
| Other securities | | 33 | | | — | | | — | | | — | | | 33 | |
| Total | | $ | 53,048 | | | $ | 615 | | | $ | (2,099) | | | $ | (2) | | | $ | 51,562 | |
As of December 31, 2024 and 2023, accrued interest of $326 million and $319 million, respectively, is excluded from the amortized cost basis of Available-for-Sale securities in the tables above and is recorded in Receivables.
As of December 31, 2024 and 2023, fixed maturity securities comprised approximately 92% and 93%, respectively, of Ameriprise Financial investments. Rating agency designations are based on the availability of ratings from Nationally Recognized Statistical Rating Organizations (“NRSROs”), including Moody’s Investors Service (“Moody’s”), Standard & Poor’s Ratings Services (“S&P”) and Fitch Ratings Ltd. (“Fitch”). The Company uses the median of available ratings from Moody’s, S&P and Fitch, or if fewer than three ratings are available, the lower rating is used. When ratings from Moody’s, S&P and Fitch are unavailable, the Company may utilize ratings from other NRSROs or rate the securities internally. As of December 31, 2024 and 2023, the Company’s internal analysts rated $508 million and $282 million, respectively, of securities using criteria similar to those used by NRSROs.
A summary of fixed maturity securities by rating was as follows:
| | | | | | | | | | | | | | | | | | | | | | | | | | | | | | | | | | | | | | |
| | December 31, 2024 | | December 31, 2023 |
| Ratings | | Amortized Cost | | Fair Value | | Percent of Total Fair Value | Amortized Cost | | Fair Value | | Percent of Total Fair Value |
| | (in millions, except percentages) |
| AAA | | $ | 25,251 | | | $ | 24,614 | | | 47 | % | | $ | 25,235 | | | $ | 24,342 | | | 47 | % |
| AA | | 13,498 | | | 12,909 | | | 25 | | | 14,013 | | | 13,534 | | | 26 | |
| A | | 2,979 | | | 2,935 | | | 5 | | | 3,073 | | | 3,139 | | | 6 | |
| BBB | | 11,896 | | | 11,402 | | | 22 | | | 10,396 | | | 10,216 | | | 20 | |
| Below investment grade | | 302 | | | 293 | | | 1 | | | 331 | | | 331 | | | 1 | |
| Total fixed maturities | | $ | 53,926 | | | $ | 52,153 | | | 100 | % | | $ | 53,048 | | | $ | 51,562 | | | 100 | % |
As of December 31, 2024 and 2023, approximately 82% and 83% of securities rated AA were GNMA, FNMA and FHLMC mortgage backed securities. No holdings of any issuer were greater than 10% of the Company’s total equity as of both December 31, 2024 and 2023.
Ameriprise Financial, Inc.
Notes to Consolidated Financial Statements (Continued)
The following tables summarize the fair value and gross unrealized losses on Available-for-Sale securities, aggregated by major investment type and the length of time that individual securities have been in a continuous unrealized loss position for which no allowance for credit losses has been recorded:
| | | | | | | | | | | | | | | | | | | | | | | | | | | | | | | | | | | | | | | | | | | | | | | | | | | | | | | | |
| | December 31, 2024 |
| | Less than 12 months | | 12 months or more | | Total |
| Description of Securities | | Number of Securities | | Fair
Value | | Unrealized
Losses | | Number of Securities | | Fair
Value | | Unrealized
Losses | | Number of Securities | | Fair
Value | | Unrealized
Losses |
| | (in millions, except number of securities) |
| Corporate debt securities | | 282 | | | $ | 5,328 | | | $ | (178) | | | 291 | | | $ | 4,042 | | | $ | (533) | | | 573 | | | $ | 9,370 | | | $ | (711) | |
| Residential mortgage backed securities | | 203 | | | 6,728 | | | (96) | | | 659 | | | 9,122 | | | (1,037) | | | 862 | | | 15,850 | | | (1,133) | |
| Commercial mortgage backed securities | | 24 | | | 478 | | | (6) | | | 233 | | | 3,298 | | | (213) | | | 257 | | | 3,776 | | | (219) | |
| Asset backed securities | | 15 | | | 309 | | | (2) | | | 37 | | | 384 | | | (37) | | | 52 | | | 693 | | | (39) | |
| State and municipal obligations | | 21 | | | 57 | | | (2) | | | 45 | | | 133 | | | (17) | | | 66 | | | 190 | | | (19) | |
| U.S. government and agency obligations | | 1 | | | 100 | | | — | | | — | | | — | | | — | | | 1 | | | 100 | | | — | |
| Foreign government bonds and obligations | | — | | | — | | | — | | | 3 | | | 12 | | | — | | | 3 | | | 12 | | | — | |
| | | | | | | | | | | | | | | | | | |
| Total | | 546 | | | $ | 13,000 | | | $ | (284) | | | 1,268 | | | $ | 16,991 | | | $ | (1,837) | | | 1,814 | | | $ | 29,991 | | | $ | (2,121) | |
| | | | | | | | | | | | | | | | | | | | | | | | | | | | | | | | | | | | | | | | | | | | | | | | | | | | | | | | |
| | December 31, 2023 |
| | Less than 12 months | | 12 months or more | | Total |
| Description of Securities | | Number of Securities | | Fair
Value | | Unrealized
Losses | | Number of Securities | | Fair
Value | | Unrealized
Losses | | Number of Securities | | Fair
Value | | Unrealized
Losses |
| | (in millions, except number of securities) |
| Corporate debt securities | | 97 | | | $ | 1,276 | | | $ | (11) | | | 376 | | | $ | 5,197 | | | $ | (496) | | | 473 | | | $ | 6,473 | | | $ | (507) | |
| Residential mortgage backed securities | | 82 | | | 3,052 | | | (25) | | | 734 | | | 10,677 | | | (1,146) | | | 816 | | | 13,729 | | | (1,171) | |
| Commercial mortgage backed securities | | 31 | | | 747 | | | (9) | | | 277 | | | 4,092 | | | (332) | | | 308 | | | 4,839 | | | (341) | |
| Asset backed securities | | 49 | | | 885 | | | (2) | | | 116 | | | 2,840 | | | (57) | | | 165 | | | 3,725 | | | (59) | |
| State and municipal obligations | | 5 | | | 29 | | | (1) | | | 49 | | | 138 | | | (19) | | | 54 | | | 167 | | | (20) | |
| U.S. government and agency obligations | | 11 | | | 955 | | | — | | | 1 | | | — | | | — | | | 12 | | | 955 | | | — | |
| Foreign government bonds and obligations | | — | | | — | | | — | | | 3 | | | 12 | | | (1) | | | 3 | | | 12 | | | (1) | |
| | | | | | | | | | | | | | | | | | |
| Total | | 275 | | | $ | 6,944 | | | $ | (48) | | | 1,556 | | | $ | 22,956 | | | $ | (2,051) | | | 1,831 | | | $ | 29,900 | | | $ | (2,099) | |
As part of the Company’s ongoing monitoring process, management determined that the increase in gross unrealized loss on its Available-for-Sale securities for which an allowance for credit losses has not been recognized during the year ended December 31, 2024 is primarily attributable to higher interest rates. The Company did not recognize these unrealized losses in earnings because it was determined that such losses were due to non-credit factors. The Company does not intend to sell these securities and does not believe that it is more likely than not that the Company will be required to sell these securities before the anticipated recovery of the remaining amortized cost basis. As of December 31, 2024 and 2023, approximately 97% and 96%, respectively, of the total of Available-for-Sale securities with gross unrealized losses were considered investment grade.
Ameriprise Financial, Inc.
Notes to Consolidated Financial Statements (Continued)
The following table presents a rollforward of the allowance for credit losses on Available-for-Sale securities:
| | | | | | | | | | | | | | | | | | | | | | | | | | | |
| | Corporate Debt Securities | | Commercial Mortgage Backed Securities | | | | State and Municipal Obligations | | Total |
| (in millions) |
| Balance at January 1, 2022 | $ | — | | | $ | — | | | | | $ | 1 | | | $ | 1 | |
| Additions for which credit losses were not previously recorded | 20 | | | — | | | | | — | | | 20 | |
| | | | | | | | | |
| Additional increases (decreases) on securities that had an allowance recorded in a previous period | — | | | — | | | | | 1 | | | 1 | |
| | | | | | | | | |
| Balance at December 31, 2022 | 20 | | | — | | | | | 2 | | | 22 | |
| Additions for which credit losses were not previously recorded | 1 | | | — | | | | | — | | | 1 | |
| Reductions for securities sold during the period (realized) | (20) | | | — | | | | | (1) | | | (21) | |
| | | | | | | | | |
| | | | | | | | | |
| Balance at December 31, 2023 | 1 | | | — | | | | | 1 | | | 2 | |
| Additions for which credit losses were not previously recorded | — | | | 4 | | | | | — | | | 4 | |
| Reductions for securities sold during the period (realized) | (1) | | | — | | | | | — | | | (1) | |
| | | | | | | | | |
| | | | | | | | | |
| Balance at December 31, 2024 | $ | — | | | $ | 4 | | | | | $ | 1 | | | $ | 5 | |
Net realized gains and losses on Available-for-Sale securities, determined using the specific identification method, recognized in Net investment income were as follows:
| | | | | | | | | | | | | | | | | |
| | Years Ended December 31, |
| 2024 | | 2023 | | 2022 |
| (in millions) |
| Gross realized investment gains | $ | 41 | | | $ | 11 | | | $ | 28 | |
| Gross realized investment losses | (57) | | | (58) | | | (22) | |
| Credit reversals (losses) | (3) | | | 20 | | | (21) | |
| Other impairments | — | | | (2) | | | (70) | |
| Total | $ | (19) | | | $ | (29) | | | $ | (85) | |
Credit losses recorded during the year ended December 31, 2022 and subsequently reversed due to sale of the security during the year ended December 31, 2023 relate to a corporate debt security in the communications industry. Other impairments for the years ended December 31, 2023 and 2022 related to Available-for-Sale securities which the Company intended to sell.
See Note 21 for a rollforward of net unrealized investment gains (losses) included in AOCI.
Available-for-Sale securities by contractual maturity as of December 31, 2024 were as follows:
| | | | | | | | | | | |
| | Amortized Cost | | Fair Value |
| (in millions) |
| Due within one year | $ | 3,537 | | | $ | 3,536 | |
| Due after one year through five years | 2,423 | | | 2,361 | |
| Due after five years through 10 years | 5,507 | | | 5,216 | |
| Due after 10 years | 6,273 | | | 6,128 | |
| | 17,740 | | | 17,241 | |
| Residential mortgage backed securities | 24,396 | | | 23,344 | |
| Commercial mortgage backed securities | 5,339 | | | 5,126 | |
| Asset backed securities | 6,451 | | | 6,442 | |
| Total | $ | 53,926 | | | $ | 52,153 | |
Actual maturities may differ from contractual maturities because issuers may have the right to call or prepay obligations. Residential mortgage backed securities, commercial mortgage backed securities and asset backed securities are not due at a single maturity date. As such, these securities were not included in the maturities distribution.
Ameriprise Financial, Inc.
Notes to Consolidated Financial Statements (Continued)
7. Financing Receivables
Financing receivables are comprised of commercial loans, consumer loans and deposit receivables. See Note 2 for information regarding the Company’s accounting policies related to financing receivables and the allowance for credit losses.
Allowance for Credit Losses
The following table presents a rollforward of the allowance for credit losses:
| | | | | | | | | | | | | | | | | |
| | Commercial Loans | | Consumer Loans | | Total |
| (in millions) |
| | | | | |
| | | | | |
| Balance at January 1, 2022 | $ | 47 | | | $ | 3 | | | $ | 50 | |
| Provisions | 10 | | | 3 | | | 13 | |
| Charge-offs | (3) | | | (1) | | | (4) | |
| | | | | |
| | | | | |
| Balance at December 31, 2022 | 54 | | | 5 | | | 59 | |
| Provisions | 2 | | | 6 | | | 8 | |
| Charge-offs | (2) | | | (2) | | | (4) | |
| | | | | |
| | | | | |
| Balance at December 31, 2023 | 54 | | | 9 | | | 63 | |
| Provisions | (5) | | | 3 | | | (2) | |
| Charge-offs | (4) | | | (4) | | | (8) | |
| Recoveries | — | | | 1 | | | 1 | |
| | | | | |
| Balance at December 31, 2024 | $ | 45 | | | $ | 9 | | | $ | 54 | |
As of December 31, 2024 and 2023, accrued interest on commercial loans was $20 million and $19 million, respectively, and is recorded in Receivables and excluded from the amortized cost basis of commercial loans.
Purchases and Sales
During the years ended December 31, 2024, 2023 and 2022, the Company purchased $7 million, $21 million and $67 million, respectively, of syndicated loans, and sold $6 million, $4 million and $1 million, respectively, of syndicated loans.
During the years ended December 31, 2024, 2023 and 2022, the Company purchased $212 million, $202 million and $72 million, respectively, of residential mortgage loans.
The Company has not acquired any loans with deteriorated credit quality as of the acquisition date.
Credit Quality Information
Nonperforming loans were $13 million and $12 million as of December 31, 2024 and 2023, respectively. All other loans were considered to be performing.
Commercial Loans
Commercial Mortgage Loans
The Company reviews the credit worthiness of the borrower and the performance of the underlying properties in order to determine the risk of loss on commercial mortgage loans. Loan-to-value ratio is the primary credit quality indicator included in this review.
Based on this review, the commercial mortgage loans are assigned an internal risk rating, which management updates when credit risk changes. Commercial mortgage loans which management has assigned its highest risk rating were less than 1% of total commercial mortgage loans as of both December 31, 2024 and 2023. Loans with the highest risk rating represent distressed loans which the Company has identified as impaired or expects to become delinquent or enter into foreclosure within the next six months. There were no commercial mortgage loans past due as of both December 31, 2024 and 2023.
The tables below present the amortized cost basis of commercial mortgage loans by year of origination and loan-to-value ratio:
| | | | | | | | | | | | | | | | | | | | | | | | | | | | | | | | | | | | | | | | | | | | |
| | December 31, 2024 |
| Loan-to-Value Ratio | | 2024 | | 2023 | | 2022 | | 2021 | | 2020 | | Prior | | Total |
| (in millions) |
| > 100% | | $ | — | | | $ | — | | | $ | — | | | $ | — | | | $ | — | | | $ | 15 | | | $ | 15 | |
| 80% - 100% | | — | | | — | | | — | | | — | | | 10 | | | 48 | | | 58 | |
| 60% - 80% | | 86 | | | 44 | | | 18 | | | 9 | | | 5 | | | 130 | | | 292 | |
| 40% - 60% | | 87 | | | 22 | | | 39 | | | 69 | | | 41 | | | 348 | | | 606 | |
| < 40% | | 15 | | | 10 | | | 48 | | | 102 | | | 50 | | | 706 | | | 931 | |
| Total | | $ | 188 | | | $ | 76 | | | $ | 105 | | | $ | 180 | | | $ | 106 | | | $ | 1,247 | | | $ | 1,902 | |
Ameriprise Financial, Inc.
Notes to Consolidated Financial Statements (Continued)
| | | | | | | | | | | | | | | | | | | | | | | | | | | | | | | | | | | | | | | | | | | | |
| | December 31, 2023 |
| Loan-to-Value Ratio | | 2023 | | 2022 | | 2021 | | 2020 | | 2019 | | Prior | | Total |
| (in millions) |
| > 100% | | $ | — | | | $ | — | | | $ | — | | | $ | — | | | $ | 2 | | | $ | 22 | | | $ | 24 | |
| 80% - 100% | | — | | | 5 | | | — | | | 2 | | | 11 | | | 50 | | | 68 | |
| 60% - 80% | | 59 | | | 26 | | | 6 | | | 14 | | | 40 | | | 106 | | | 251 | |
| 40% - 60% | | 8 | | | 47 | | | 133 | | | 53 | | | 70 | | | 348 | | | 659 | |
| < 40% | | 10 | | | 32 | | | 49 | | | 40 | | | 80 | | | 619 | | | 830 | |
| Total | | $ | 77 | | | $ | 110 | | | $ | 188 | | | $ | 109 | | | $ | 203 | | | $ | 1,145 | | | $ | 1,832 | |
Loan-to-value ratio is based on income and expense data provided by borrowers at least annually and long-term capitalization rate assumptions based on property type. For the year ended December 31, 2024, write-offs of commercial mortgage loans were not material.
In addition, the Company reviews the concentrations of credit risk by region and property type. Concentrations of credit risk of commercial mortgage loans by U.S. region were as follows:
| | | | | | | | | | | | | | | | | | | | | | | |
| | Loans | | Percentage |
| December 31, | December 31, |
| 2024 | | 2023 | 2024 | | 2023 |
| (in millions) | | | |
| East North Central | $ | 185 | | | $ | 189 | | | 10 | % | | 10 | % |
| East South Central | 45 | | | 52 | | | 2 | | | 3 | |
| Middle Atlantic | 133 | | | 112 | | | 7 | | | 6 | |
| Mountain | 157 | | | 138 | | | 8 | | | 8 | |
| New England | 30 | | | 28 | | | 2 | | | 2 | |
| Pacific | 633 | | | 624 | | | 33 | | | 34 | |
| South Atlantic | 489 | | | 465 | | | 26 | | | 25 | |
| West North Central | 119 | | | 109 | | | 6 | | | 6 | |
| West South Central | 111 | | | 115 | | | 6 | | | 6 | |
| Total | $ | 1,902 | | | $ | 1,832 | | | 100 | % | | 100 | % |
| | | | | |
| | | |
Concentrations of credit risk of commercial mortgage loans by property type were as follows:
| | | | | | | | | | | | | | | | | | | | | | | |
| Loans | | Percentage |
| December 31, | | December 31, |
| 2024 | | 2023 | | 2024 | | 2023 |
| (in millions) | | | | |
| Apartments | $ | 522 | | | $ | 485 | | | 27 | % | | 26 | % |
| Hotel | 33 | | | 13 | | | 2 | | | 1 | |
| Industrial | 362 | | | 317 | | | 19 | | | 17 | |
| Mixed use | 68 | | | 64 | | | 4 | | | 4 | |
| Office | 219 | | | 241 | | | 11 | | | 13 | |
| Retail | 546 | | | 561 | | | 29 | | | 31 | |
| Other | 152 | | | 151 | | | 8 | | | 8 | |
| Total | $ | 1,902 | | | $ | 1,832 | | | 100 | % | | 100 | % |
| | | | | |
| | | |
Syndicated Loans
The investment in syndicated loans as of December 31, 2024 and 2023 was $92 million and $145 million, respectively. The Company’s syndicated loan portfolio is diversified across industries and issuers. There were no syndicated loans past due as of December 31, 2024 and syndicated loans past due were not material as of December 31, 2023. The Company assigns an internal risk rating to each syndicated loan in its portfolio ranging from 1 through 5, with 5 reflecting the lowest quality. For the year ended December 31, 2024, write-offs of syndicated loans were not material.
Ameriprise Financial, Inc.
Notes to Consolidated Financial Statements (Continued)
The tables below present the amortized cost basis of syndicated loans by origination year and internal risk rating:
| | | | | | | | | | | | | | | | | | | | | | | | | | | | | | | | | | | | | | | | | | | | |
| | December 31, 2024 |
| Internal Risk Rating | | 2024 | | 2023 | | 2022 | | 2021 | | 2020 | | Prior | | Total |
| (in millions) |
| Risk 5 | | $ | — | | | $ | — | | | $ | — | | | $ | — | | | $ | — | | | $ | — | | | $ | — | |
| Risk 4 | | — | | | — | | | — | | | — | | | — | | | 2 | | | 2 | |
| Risk 3 | | 1 | | | 1 | | | — | | | 8 | | | 1 | | | 1 | | | 12 | |
| Risk 2 | | 29 | | | 5 | | | — | | | 3 | | | — | | | 8 | | | 45 | |
| Risk 1 | | 22 | | | 6 | | | — | | | 3 | | | 2 | | | — | | | 33 | |
| Total | | $ | 52 | | | $ | 12 | | | $ | — | | | $ | 14 | | | $ | 3 | | | $ | 11 | | | $ | 92 | |
| | | | | | | | | | | | | | | | | | | | | | | | | | | | | | | | | | | | | | | | | | | | |
| | December 31, 2023 |
| Internal Risk Rating | | 2023 | | 2022 | | 2021 | | 2020 | | 2019 | | Prior | | Total |
| (in millions) |
| Risk 5 | | $ | — | | | $ | 1 | | | $ | — | | | $ | — | | | $ | — | | | $ | — | | | $ | 1 | |
| Risk 4 | | — | | | — | | | — | | | 1 | | | 2 | | | — | | | 3 | |
| Risk 3 | | 2 | | | — | | | 12 | | | 2 | | | 2 | | | 10 | | | 28 | |
| Risk 2 | | 26 | | | 3 | | | 17 | | | 5 | | | 11 | | | 2 | | | 64 | |
| Risk 1 | | 14 | | | 5 | | | 15 | | | 3 | | | 10 | | | 2 | | | 49 | |
| Total | | $ | 42 | | | $ | 9 | | | $ | 44 | | | $ | 11 | | | $ | 25 | | | $ | 14 | | | $ | 145 | |
Financial Advisor Loans
The Company offers loans to financial advisors for transitional cost assistance and practice operations. Repayment of the loan is highly dependent on the retention of the financial advisor. In the event a financial advisor is no longer affiliated with the Company, the unpaid balances generally become immediately due. Accordingly, the primary risk factor for advisor loans is termination status. The allowance for credit losses related to loans to advisors that have terminated their relationship with the Company was $6 million and $7 million as of December 31, 2024 and 2023, respectively. For the year ended December 31, 2024, write-offs of advisor loans were not material.
The tables below present the amortized cost basis of advisor loans by origination year and termination status:
| | | | | | | | | | | | | | | | | | | | | | | | | | | | | | | | | | | | | | | | | | | | |
| | December 31, 2024 |
| Termination Status | | 2024 | | 2023 | | 2022 | | 2021 | | 2020 | | Prior | | Total |
| (in millions) |
| Active | | $ | 358 | | | $ | 351 | | | $ | 261 | | | $ | 121 | | | $ | 82 | | | $ | 150 | | | $ | 1,323 | |
| Terminated | | — | | | — | | | 2 | | | 2 | | | 2 | | | 6 | | | 12 | |
| Total | | $ | 358 | | | $ | 351 | | | $ | 263 | | | $ | 123 | | | $ | 84 | | | $ | 156 | | | $ | 1,335 | |
| | | | | | | | | | | | | | | | | | | | | | | | | | | | | | | | | | | | | | | | | | | | |
| | December 31, 2023 |
| Termination Status | | 2023 | | 2022 | | 2021 | | 2020 | | 2019 | | Prior | | Total |
| (in millions) |
| Active | | $ | 395 | | | $ | 310 | | | $ | 151 | | | $ | 107 | | | $ | 79 | | | $ | 157 | | | $ | 1,199 | |
| Terminated | | — | | | 2 | | | 1 | | | 1 | | | 4 | | | 4 | | | 12 | |
| Total | | $ | 395 | | | $ | 312 | | | $ | 152 | | | $ | 108 | | | $ | 83 | | | $ | 161 | | | $ | 1,211 | |
Consumer Loans
Residential Mortgage Loans
The Company reviews the credit worthiness of the borrower in order to determine the risk of loss on residential mortgage loans. Geographic location and FICO scores are the primary credit quality indicators included in the model that projects the Company’s risk of credit loss over the life of the residential mortgage loan portfolio. Delinquency rates are measured based on the number of days past due. Residential mortgage loans over 30 days past due were $4 million and $2 million as of December 31, 2024 and 2023, respectively. For the year end December 31, 2024, write-offs of residential mortgage loans were not material.
Ameriprise Financial, Inc.
Notes to Consolidated Financial Statements (Continued)
The tables below present the amortized cost basis of residential mortgage loans by year of origination and FICO score:
| | | | | | | | | | | | | | | | | | | | | | | | | | | | | | | | | | | | | |
| FICO Score | December 31, 2024 |
| 2024 | | 2023 | | 2022 | | 2021 | | 2020 | | | | Total |
| (in millions) |
| > 810 | $ | 5 | | | $ | 9 | | | $ | 2 | | | $ | 2 | | | $ | 1 | | | | | $ | 19 | |
| 780 - 809 | 84 | | | 56 | | | 28 | | | 7 | | | 6 | | | | | 181 | |
| 740 - 779 | 64 | | | 77 | | | 25 | | | 7 | | | 5 | | | | | 178 | |
| 720 - 739 | 17 | | | 15 | | | 5 | | | 5 | | | — | | | | | 42 | |
| 700 - 719 | 9 | | | 8 | | | 5 | | | 3 | | | 1 | | | | | 26 | |
| < 699 | 7 | | | 7 | | | 3 | | | 3 | | | — | | | | | 20 | |
| Total | $ | 186 | | | $ | 172 | | | $ | 68 | | | $ | 27 | | | $ | 13 | | | | | $ | 466 | |
| | | | | | | | | | | | | | | | | | | | | | | | | | | | | | | | | |
| FICO Score | December 31, 2023 |
| 2023 | | 2022 | | 2021 | | 2020 | | | | | | Total |
| (in millions) |
| > 810 | $ | 9 | | | $ | 3 | | | $ | 2 | | | $ | — | | | | | | | $ | 14 | |
| 780 - 809 | 65 | | | 29 | | | 8 | | | 6 | | | | | | | 108 | |
| 740 - 779 | 80 | | | 26 | | | 8 | | | 6 | | | | | | | 120 | |
| 720 - 739 | 15 | | | 6 | | | 4 | | | 1 | | | | | | | 26 | |
| 700 - 719 | 8 | | | 5 | | | 4 | | | 1 | | | | | | | 18 | |
| < 699 | 7 | | | 4 | | | 3 | | | — | | | | | | | 14 | |
| Total | $ | 184 | | | $ | 73 | | | $ | 29 | | | $ | 14 | | | | | | | $ | 300 | |
The table below presents the concentrations of credit risk of residential mortgage loans by U.S. region:
| | | | | | | | | | | | | | | | | | | | | | | |
| Loans | | Percentage |
| December 31, | | December 31, |
| 2024 | | 2023 | | 2024 | | 2023 |
| (in millions) | | | | |
| Minnesota | $ | 284 | | | $ | 178 | | | 61 | % | | 59 | % |
| Other U.S. States | 182 | | | 122 | | | 39 | | | 41 | |
| | | | | | | |
| | | | | | | |
| | | | | | | |
| | | | | | | |
| | | | | | | |
| | | | | | | |
| | | | | | | |
| | | | | | | |
| Total | $ | 466 | | | $ | 300 | | | 100 | % | | 100 | % |
Credit Card Receivables
The credit cards are co-branded with Ameriprise Financial, Inc. and issued to the Company’s customers by a third party. FICO scores and delinquency rates are the primary credit quality indicators for the credit card portfolio. Delinquency rates are measured based on the number of days past due. Credit card receivables over 30 days past due were 2% of total credit card receivables as of both December 31, 2024 and 2023.
The table below presents the amortized cost basis of credit card receivables by FICO score:
| | | | | | | | | | | |
| FICO Score | December 31, |
| 2024 | | 2023 |
| (in millions) |
| > 800 | $ | 38 | | | $ | 32 | |
| 750 - 799 | 32 | | | 28 | |
| 700 - 749 | 29 | | | 30 | |
| 650 - 699 | 16 | | | 19 | |
| < 650 | 8 | | | 8 | |
| Total | $ | 123 | | | $ | 117 | |
Policy Loans
Policy loans do not exceed the cash surrender value at origination. As there is minimal risk of loss related to policy loans, there is no allowance for credit losses.
Ameriprise Financial, Inc.
Notes to Consolidated Financial Statements (Continued)
Margin Loans
The margin loans balance was $1.1 billion as of both December 31, 2024 and 2023. The Company monitors collateral supporting margin loans and requests additional collateral when necessary in order to mitigate the risk of loss. As of both December 31, 2024 and 2023, there was no allowance for credit losses on margin loans.
Pledged Asset Lines of Credit
The pledged asset lines of credit balance was $737 million and $537 million as of December 31, 2024 and 2023, respectively. The Company monitors collateral supporting pledged asset lines of credit and requests additional collateral when necessary in order to mitigate the risk of loss. As of both December 31, 2024 and 2023, there was no allowance for credit losses on pledged asset lines of credit.
Deposit Receivables
Deposit receivables were $5.8 billion and $6.5 billion as of December 31, 2024 and 2023, respectively. Deposit receivables are collateralized by the fair value of the assets held in trusts. Based on management’s evaluation of the collateral value relative to the deposit receivables, the allowance for credit losses for deposit receivables was not material as of both December 31, 2024 and 2023.
Modifications with Borrowers Experiencing Financial Difficulty
Modifications of financing receivables with borrowers experiencing financial difficulty by the Company were not material for the years ended December 31, 2024 and 2023.
8. Reinsurance
The Company reinsures a portion of its insurance risks through reinsurance agreements with unaffiliated reinsurance companies. RiverSource Life Insurance Company (“RiverSource Life”) reinsures 100% of its insurance risk associated with its life contingent payout annuity policies in force as of June 30, 2021 through a reinsurance agreement with Global Atlantic Financial Group’s subsidiary Commonwealth Annuity and Life Insurance Company. Policies issued on or after July 1, 2021 and policies issued by RiverSource Life Insurance Co. of New York (“RiverSource Life of NY”) are not subject to this reinsurance agreement.
Reinsurance contracts do not relieve the Company from its primary obligation to policyholders.
The Company generally reinsures 90% of the death benefit liability for new term life insurance policies beginning in 2001 and new individual UL and VUL insurance policies beginning in 2002. Policies issued prior to these dates are not subject to these same reinsurance levels.
However, for IUL policies issued after September 1, 2013 and VUL policies issued after January 1, 2014, the Company generally reinsures 50% of the death benefit liability. Similarly, the Company reinsures 50% of the death benefit and morbidity liabilities related to its UL product with LTC benefits.
The maximum amount of life insurance risk the Company will retain is $10 million on a single life and $10 million on any flexible premium survivorship life policy; however, reinsurance agreements are in place such that retaining more than $1.5 million of insurance risk on a single life or a flexible premium survivorship life policy is very unusual. Risk on UL and VUL policies is reinsured on a yearly renewable term basis. Risk on most term life policies starting in 2001 is reinsured on a coinsurance basis, a type of reinsurance in which the reinsurer participates proportionally in all material risks and premiums associated with a policy.
For existing LTC policies, the Company has continued ceding 50% of the risk on a coinsurance basis to subsidiaries of Genworth Financial, Inc. (“Genworth”) and retains the remaining risk. For RiverSource Life of NY, this reinsurance arrangement applies for 1996 and later issues only, which are about 90% of the total RiverSource Life of NY in force policies. Under these agreements, the Company has the right, but never the obligation, to recapture some, or all, of the risk ceded to Genworth.
Generally, the Company retains at most $5,000 per month of risk per life on DI policies sold on policy forms introduced in most states starting in 2007 and reinsures the remainder of the risk on a coinsurance basis with unaffiliated reinsurance companies. The Company retains all risk for new claims on DI contracts sold on other policy forms introduced prior to 2007. The Company also retains all risk on accidental death benefit claims and substantially all risk associated with waiver of premium provisions.
As of December 31, 2024 and 2023, traditional life and UL insurance policies in force were $198.1 billion and $198.8 billion, respectively, of which $143.5 billion and $144.7 billion as of December 31, 2024 and 2023 were reinsured at the respective year ends.
Ameriprise Financial, Inc.
Notes to Consolidated Financial Statements (Continued)
The effect of reinsurance on premiums for traditional long-duration products was as follows:
| | | | | | | | | | | | | | | | | |
| | Years Ended December 31, |
| 2024 | | 2023 | | 2022 |
| (in millions) |
| Direct premiums | $ | 696 | | | $ | 674 | | | $ | 530 | |
| Reinsurance ceded | (224) | | | (226) | | | (224) | |
| Net premiums | $ | 472 | | | $ | 448 | | | $ | 306 | |
Cost of insurance and administrative charges for non-traditional long-duration products are reflected in Premiums, policy and contract charges and were net of reinsurance ceded of $188 million, $180 million and $165 million for the years ended December 31, 2024, 2023 and 2022, respectively.
The amount of claims recovered through reinsurance on all contracts was $466 million, $438 million and $435 million for the years ended December 31, 2024, 2023 and 2022, respectively.
Receivables included $4.0 billion and $4.3 billion of reinsurance recoverables as of December 31, 2024 and 2023, respectively, including $2.6 billion and $2.8 billion related to LTC risk ceded to Genworth, respectively.
Policyholder account balances, future policy benefits and claims include $351 million and $376 million related to previously assumed reinsurance arrangements as of December 31, 2024 and 2023, respectively.
9. Goodwill and Other Intangible Assets
Goodwill and intangible assets deemed to have indefinite lives are not amortized but are instead subject to impairment tests. There were $2 million, nil and nil of impairments of indefinite-lived intangible assets recorded for the years ended December 31, 2024, 2023 and 2022, respectively.
The changes in the carrying amount of goodwill reported in the Company’s reportable segments were as follows:
| | | | | | | | | | | | | | | | | | | | | | | |
| Advice & Wealth Management | | Asset
Management | | Retirement & Protection Solutions | | Consolidated |
| (in millions) |
| Balance at January 1, 2023 | $ | 279 | | | $ | 1,019 | | | $ | 91 | | | $ | 1,389 | |
| | | | | | | |
| Foreign currency translation | — | | | 27 | | | — | | | 27 | |
| Other adjustments | — | | | (6) | | | — | | | (6) | |
| Balance at December 31, 2023 | 279 | | | 1,040 | | | 91 | | | 1,410 | |
| | | | | | | |
| Foreign currency translation | — | | | (9) | | | — | | | (9) | |
| Other adjustments | — | | | — | | | — | | | — | |
| Balance at December 31, 2024 | $ | 279 | | | $ | 1,031 | | | $ | 91 | | | $ | 1,401 | |
In 2024 and 2023, the Company completed the annual impairment evaluation for goodwill as of July 1. The Company concluded its goodwill was not impaired in either 2024 or 2023.
The carrying amount of indefinite-lived intangible assets consisted of the following:
| | | | | | | | | | | |
| December 31, |
| 2024 | | 2023 |
| (in millions) |
| Customer contracts | $ | 844 | | | $ | 848 | |
| Trade names | 65 | | | 67 | |
| Total | $ | 909 | | | $ | 915 | |
Definite-lived intangible assets consisted of the following:
| | | | | | | | | | | | | | | | | | | | | | | | | | | | | | | | | | | |
| | December 31, 2024 | | December 31, 2023 |
| Gross Carrying Amount | | Accumulated Amortization | | Net Carrying Amount | Gross Carrying Amount | | Accumulated Amortization | | Net Carrying Amount |
| (in millions) |
| Customer relationships | $ | 370 | | | $ | (204) | | | $ | 166 | | | $ | 380 | | | $ | (191) | | | $ | 189 | |
| Contracts | 226 | | | (218) | | | 8 | | | 228 | | | (219) | | | 9 | |
| Other | 357 | | | (269) | | | 88 | | | 343 | | | (243) | | | 100 | |
| Total | $ | 953 | | | $ | (691) | | | $ | 262 | | | $ | 951 | | | $ | (653) | | | $ | 298 | |
Ameriprise Financial, Inc.
Notes to Consolidated Financial Statements (Continued)
Definite-lived intangible assets acquired during the year ended December 31, 2024 were $29 million with a weighted average amortization period of 6 years. The aggregate amortization expense for definite-lived intangible assets during the years ended December 31, 2024, 2023 and 2022 was $56 million, $52 million and $45 million, respectively. There were $8 million, $1 million and nil of impairments of definite-lived intangible assets recorded for the years ended December 31, 2024, 2023 and 2022, respectively. Impairments recorded through G&A expense during 2024 primarily relate to certain customer relationships within the Asset Management segment.
Estimated intangible amortization expense as of December 31, 2024 for the next five years is as follows:
| | | | | |
| | (in millions) |
| 2025 | $ | 53 | |
| 2026 | 48 | |
| 2027 | 36 | |
| 2028 | 26 | |
| 2029 | 22 | |
10. Deferred Acquisition Costs and Deferred Sales Inducement Costs
The following tables summarize the balances of and changes in DAC:
| | | | | | | | | | | | | | | | | | | | | | | | | | | | | | | | | | | |
| Variable Annuities | | Structured Variable Annuities | | Fixed Annuities | | Fixed Indexed Annuities | | Universal Life Insurance | | Variable Universal Life Insurance |
| (in millions) |
| Balance at January 1, 2024 | $ | 1,496 | | | $ | 208 | | | $ | 35 | | | $ | 5 | | | $ | 110 | | | $ | 534 | |
| Capitalization of acquisition costs | 24 | | | 98 | | | — | | | — | | | — | | | 64 | |
| Amortization | (118) | | | (30) | | | (7) | | | (1) | | | (7) | | | (45) | |
| Balance at December 31, 2024 | $ | 1,402 | | | $ | 276 | | | $ | 28 | | | $ | 4 | | | $ | 103 | | | $ | 553 | |
| | | | | | | | | | | |
| Indexed Universal Life Insurance | | Other Life Insurance | | Life Contingent Payout Annuities | | Term and Whole Life Insurance | | Disability Income Insurance | | Total,
All Products |
| (in millions) |
| Balance at January 1, 2024 | $ | 223 | | | $ | 2 | | | $ | 6 | | | $ | 17 | | | $ | 75 | | | $ | 2,711 | |
| Capitalization of acquisition costs | 3 | | | — | | | 5 | | | 2 | | | 3 | | | 199 | |
| Amortization | (16) | | | — | | | (1) | | | (2) | | | (8) | | | (235) | |
| Balance at December 31, 2024 | $ | 210 | | | $ | 2 | | | $ | 10 | | | $ | 17 | | | $ | 70 | | | $ | 2,675 | |
| Other broker dealer acquisition costs | | | | | | | | | | | 2 | |
| Balance at December 31, 2024 including broker dealer acquisition costs | | | | | | $ | 2,677 | |
Ameriprise Financial, Inc.
Notes to Consolidated Financial Statements (Continued)
| | | | | | | | | | | | | | | | | | | | | | | | | | | | | | | | | | | |
| Variable Annuities | | Structured Variable Annuities | | Fixed Annuities | | Fixed Indexed Annuities | | Universal Life Insurance | | Variable Universal Life Insurance |
| (in millions) |
| Balance at January 1, 2023 | $ | 1,598 | | | $ | 149 | | | $ | 45 | | | $ | 6 | | | $ | 118 | | | $ | 521 | |
| Capitalization of acquisition costs | 23 | | | 83 | | | — | | | — | | | — | | | 57 | |
| Amortization | (125) | | | (24) | | | (10) | | | (1) | | | (8) | | | (44) | |
| Balance at December 31, 2023 | $ | 1,496 | | | $ | 208 | | | $ | 35 | | | $ | 5 | | | $ | 110 | | | $ | 534 | |
| | | | | | | | | | | |
| Indexed Universal Life Insurance | | Other Life Insurance | | Life Contingent Payout Annuities | | Term and Whole Life Insurance | | Disability Income Insurance | | Total,
All Products |
| (in millions) |
| Balance at January 1, 2023 | $ | 236 | | | $ | 3 | | | $ | 2 | | | $ | 18 | | | $ | 79 | | | $ | 2,775 | |
| Capitalization of acquisition costs | 4 | | | — | | | 4 | | | 1 | | | 4 | | | 176 | |
| Amortization | (17) | | | (1) | | | — | | | (2) | | | (8) | | | (240) | |
| Balance at December 31, 2023 | $ | 223 | | | $ | 2 | | | $ | 6 | | | $ | 17 | | | $ | 75 | | | $ | 2,711 | |
| Other broker dealer acquisition costs | | | | | | | | | | | 2 | |
| Balance at December 31, 2023 including broker dealer acquisition costs | | | | | | $ | 2,713 | |
The following tables summarize the balances of and changes in DSIC:
| | | | | | | | | | | | | | | | | | | |
| Variable Annuities | | Fixed Annuities | | | | Total,
All Products |
| (in millions) |
| Balance at January 1, 2024 | $ | 136 | | | $ | 12 | | | | | $ | 148 | |
| | | | | | | |
| Amortization | (14) | | | (2) | | | | | (16) | |
| Balance at December 31, 2024 | $ | 122 | | | $ | 10 | | | | | $ | 132 | |
| | | | | | | | | | | | | | | | | | | |
| Variable Annuities | | Fixed Annuities | | | | Total,
All Products |
| (in millions) |
| Balance at January 1, 2023 | $ | 151 | | | $ | 16 | | | | | $ | 167 | |
| | | | | | | |
| Amortization | (15) | | | (4) | | | | | (19) | |
| Balance at December 31, 2023 | $ | 136 | | | $ | 12 | | | | | $ | 148 | |
11. Policyholder Account Balances, Future Policy Benefits and Claims
Policyholder account balances, future policy benefits and claims consisted of the following:
| | | | | | | | | | | |
| December 31, 2024 | | December 31, 2023 |
| (in millions) |
| Policyholder account balances | | | |
| Policyholder account balances | $ | 32,542 | | | $ | 27,947 | |
| | | |
| Future policy benefits | | | |
| Reserve for future policy benefits | 7,418 | | | 7,763 | |
| Deferred profit liability | 118 | | | 81 | |
| Additional liabilities for insurance guarantees | 1,389 | | | 1,321 | |
| Other insurance and annuity liabilities | 192 | | | 213 | |
| Total future policy benefits | 9,117 | | | 9,378 | |
| Policy claims and other policyholders’ funds | 214 | | | 220 | |
| Total policyholder account balances, future policy benefits and claims | $ | 41,873 | | | $ | 37,545 | |
Ameriprise Financial, Inc.
Notes to Consolidated Financial Statements (Continued)
Variable Annuities
Purchasers of variable annuities can select from a variety of investment options and can elect to allocate a portion to a fixed account. A vast majority of the premiums received for variable annuity contracts are held in separate accounts where the assets are held for the exclusive benefit of those contractholders.
Most of the variable annuity contracts issued by the Company contain a GMDB. The Company previously offered contracts with GMAB, GMWB, and GMIB provisions. See Note 2 and Note 13 for additional information regarding the Company’s variable annuity guarantees. See Note 16 and Note 18 for additional information regarding the Company’s derivative instruments used to hedge risks related to these guarantees.
Structured Variable Annuities
Structured variable annuities provide contractholders the option to allocate a portion of their account value to an indexed account held in a non-insulated separate account with the contractholder’s rate of return, which may be positive or negative, tied to selected indices. The amount allocated by a contractholder to the indexed account creates an embedded derivative which is measured at fair value. The Company hedges the equity and interest rate risk related to the indexed account with freestanding derivative instruments.
Fixed Annuities
Fixed annuities include deferred, payout and fixed deferred indexed annuity contracts. In 2020, the Company discontinued sales of fixed deferred and fixed deferred indexed annuities.
Deferred contracts offer a guaranteed minimum rate of interest and security of the principal invested. Payout contracts guarantee a fixed income payment for life or the term of the contract. Liabilities for fixed annuities in a benefit or payout status are based on future estimated payments using established industry mortality tables and interest rates.
The Company’s fixed index annuity product is a fixed annuity that includes an indexed account. The rate of interest credited above the minimum guarantee for funds allocated to the indexed account is linked to the performance of the specific index for the indexed account (subject to a cap). The amount allocated by a contractholder to the indexed account creates an embedded derivative which is measured at fair value.
See Note 18 for additional information regarding the Company’s derivative instruments used to hedge the risk related to indexed accounts.
Insurance Liabilities
UL policies accumulate cash value that increases by a fixed interest rate. Purchasers of VUL can select from a variety of investment options and can elect to allocate a portion of their account balance to a fixed account or a separate account. A vast majority of the premiums received for VUL policies are held in separate accounts where the assets are held for the exclusive benefit of those policyholders.
IUL is a UL policy that includes an indexed account. The rate of credited interest for funds allocated by a contractholder to the indexed account is linked to the performance of the specific index for the indexed account (subject to stated account parameters, which include a cap and floor, or a spread). The policyholder may allocate all or a portion of the policy value to a fixed or any available indexed account. The amount allocated by a contractholder to the indexed account creates an embedded derivative which is measured at fair value. The Company hedges the interest credited rate including equity and interest rate risk related to the indexed account with freestanding derivative instruments. See Note 18 for additional information regarding the Company’s derivative instruments used to hedge the risk related to IUL.
The Company also offers term life insurance as well as DI products. The Company no longer offers standalone LTC products and whole life insurance but has in force policies from prior years.
Insurance liabilities include accumulation values, incurred but not reported claims, obligations for anticipated future claims, unpaid reported claims and claim adjustment expenses.
Ameriprise Financial, Inc.
Notes to Consolidated Financial Statements (Continued)
The balances of and changes in policyholder account balances were as follows:
| | | | | | | | | | | | | | | | | | | | | | | | | | | | | |
| Variable Annuities | | Structured Variable Annuities | | Fixed Annuities | | Fixed Indexed Annuities | | Non-Life Contingent Payout Annuities |
| (in millions, except percentages) |
| Balance at January 1, 2024 | $ | 4,173 | | | $ | 10,742 | | | $ | 5,982 | | | $ | 307 | | | $ | 444 | |
| Contract deposits | 56 | | | 4,005 | | | 39 | | | — | | | 101 | |
| Policy charges | (14) | | | (3) | | | — | | | — | | | — | |
| Surrenders and other benefits | (628) | | | (383) | | | (856) | | | (16) | | | (110) | |
| | | | | | | | | |
| Net transfer from (to) separate account liabilities | (32) | | | — | | | — | | | — | | | — | |
| Variable account index-linked adjustments | — | | | 1,968 | | | — | | | — | | | — | |
| Interest credited | 125 | | | 1 | | | 204 | | | 14 | | | 12 | |
| Balance at December 31, 2024 | $ | 3,680 | | | $ | 16,330 | | | $ | 5,369 | | | $ | 305 | | | $ | 447 | |
| | | | | | | | | |
| Weighted-average crediting rate | 3.3 | % | | 1.9 | % | | 3.7 | % | | 2.0 | % | | N/A |
| | | | | | | | | |
Cash surrender value (1) | $ | 3,658 | | | $ | 15,467 | | | $ | 5,365 | | | $ | 279 | | | N/A |
| | | | | | | | | |
| Universal Life Insurance | | Variable Universal Life Insurance | | Indexed Universal Life Insurance | | Other Life Insurance | | Total,
All Products |
| (in millions, except percentages) |
| Balance at January 1, 2024 | $ | 1,474 | | | $ | 1,569 | | | $ | 2,755 | | | $ | 501 | | | $ | 27,947 | |
| Contract deposits | 117 | | | 333 | | | 181 | | | — | | | 4,832 | |
| Policy charges | (173) | | | (93) | | | (124) | | | — | | | (407) | |
| Surrenders and other benefits | (62) | | | (80) | | | (79) | | | (52) | | | (2,266) | |
| | | | | | | | | |
| Net transfer from (to) separate account liabilities | — | | | (145) | | | — | | | — | | | (177) | |
| Variable account index-linked adjustments | — | | | — | | | — | | | — | | | 1,968 | |
| Interest credited | 49 | | | 63 | | | 161 | | | 16 | | | 645 | |
| Balance at December 31, 2024 | $ | 1,405 | | | $ | 1,647 | | | $ | 2,894 | | | $ | 465 | | | $ | 32,542 | |
| | | | | | | | | |
| Weighted-average crediting rate | 3.6 | % | | 3.9 | % | | 2.3 | % | | 4.0 | % | | |
| Net amount at risk | $ | 8,312 | | | $ | 57,473 | | | $ | 13,593 | | | $ | 130 | | | |
Cash surrender value (1) | $ | 1,280 | | | $ | 1,092 | | | $ | 2,447 | | | $ | 298 | | | |
Ameriprise Financial, Inc.
Notes to Consolidated Financial Statements (Continued)
| | | | | | | | | | | | | | | | | | | | | | | | | | | | | |
| Variable Annuities | | Structured Variable Annuities | | Fixed Annuities | | Fixed Indexed Annuities | | Non-Life Contingent Payout Annuities |
| (in millions, except percentages) |
| Balance at January 1, 2023 | $ | 4,752 | | | $ | 6,410 | | | $ | 6,799 | | | $ | 312 | | | $ | 471 | |
| Contract deposits | 73 | | | 3,084 | | | 47 | | | — | | | 91 | |
| Policy charges | (10) | | | — | | | — | | | — | | | — | |
| Surrenders and other benefits | (759) | | | (156) | | | (1,086) | | | (10) | | | (127) | |
| | | | | | | | | |
| Net transfer from (to) separate account liabilities | (25) | | | — | | | — | | | — | | | — | |
| Variable account index-linked adjustments | — | | | 1,403 | | | — | | | — | | | — | |
| Interest credited | 142 | | | 1 | | | 222 | | | 5 | | | 9 | |
| Balance at December 31, 2023 | $ | 4,173 | | | $ | 10,742 | | | $ | 5,982 | | | $ | 307 | | | $ | 444 | |
| | | | | | | | | |
| Weighted-average crediting rate | 3.3 | % | | 1.8 | % | | 3.6 | % | | 2.0 | % | | N/A |
| | | | | | | | | |
Cash surrender value (1) | $ | 4,146 | | | $ | 10,129 | | | $ | 5,974 | | | $ | 278 | | | N/A |
| | | | | | | | | |
| Universal Life Insurance | | Variable Universal Life Insurance | | Indexed Universal Life Insurance | | Other Life Insurance | | Total,
All Products |
| (in millions, except percentages) |
| Balance at January 1, 2023 | $ | 1,544 | | | $ | 1,520 | | | $ | 2,654 | | | $ | 524 | | | $ | 24,986 | |
| Contract deposits | 123 | | | 272 | | | 193 | | | 1 | | | 3,884 | |
| Policy charges | (176) | | | (94) | | | (121) | | | — | | | (401) | |
| Surrenders and other benefits | (69) | | | (78) | | | (53) | | | (44) | | | (2,382) | |
| | | | | | | | | |
| Net transfer from (to) separate account liabilities | — | | | (107) | | | — | | | — | | | (132) | |
| Variable account index-linked adjustments | — | | | — | | | — | | | — | | | 1,403 | |
| Interest credited | 52 | | | 56 | | | 82 | | | 20 | | | 589 | |
| Balance at December 31, 2023 | $ | 1,474 | | | $ | 1,569 | | | $ | 2,755 | | | $ | 501 | | | $ | 27,947 | |
| | | | | | | | | |
| Weighted-average crediting rate | 3.6 | % | | 3.9 | % | | 2.0 | % | | 4.0 | % | | |
| Net amount at risk | $ | 8,740 | | | $ | 57,291 | | | $ | 14,407 | | | $ | 141 | | | |
Cash surrender value (1) | $ | 1,330 | | | $ | 1,065 | | | $ | 2,271 | | | $ | 326 | | | |
(1) Cash surrender value represents the amount of the contractholder's account balances distributable at the balance sheet date less certain surrender charges. For variable annuities and VUL, the cash surrender value shown is the proportion of the total cash surrender value related to their fixed account liabilities.
Refer to Note 13 for the net amount at risk for market risk benefits associated with variable and structured variable annuities. Fixed, fixed indexed, and non-life contingent payout annuities do not have net amount at risk in excess of account value. Net amount at risk for insurance products is calculated as the death benefit amount in excess of applicable account values, host, embedded derivative, and separate account liabilities.
Ameriprise Financial, Inc.
Notes to Consolidated Financial Statements (Continued)
The following tables present the account values of fixed deferred annuities, fixed insurance, and the fixed portion of variable annuities and variable insurance contracts by range of guaranteed minimum interest rates (“GMIRs”) and the range of the difference between rates credited to policyholders and contractholders as of December 31, 2024 and 2023 and the respective guaranteed minimums, as well as the percentage of account values subject to rate reset in the time period indicated. Rates are reset at management’s discretion, subject to guaranteed minimums. | | | | | | | | | | | | | | | | | | | | | | | | | | | | | | | | | | | | | | | | | | | | | | | |
| December 31, 2024 |
| | | | | Account Values with Crediting Rates |
| Range of Guaranteed Minimum Crediting Rates | | At Guaranteed Minimum | | 1-49 bps above Guaranteed Minimum | | 50-99 bps above Guaranteed Minimum | | 100-150 bps above Guaranteed Minimum | | Greater than 150 bps above Guaranteed Minimum | | Total |
| | | | | (in millions, except percentages) |
| Fixed accounts of variable annuities | 1 | % | – | 1.99% | | $ | 24 | | | $ | 95 | | | $ | 65 | | | $ | 17 | | | $ | — | | | $ | 201 | |
| 2 | % | – | 2.99% | | 112 | | | — | | | — | | | — | | | — | | | 112 | |
| 3 | % | – | 3.99% | | 1,894 | | | 7 | | | — | | | 1 | | | — | | | 1,902 | |
| 4 | % | – | 5.00% | | 1,412 | | | — | | | — | | | — | | | — | | | 1,412 | |
| Total | | $ | 3,442 | | | $ | 102 | | | $ | 65 | | | $ | 18 | | | $ | — | | | $ | 3,627 | |
| | | | | | | | | | | | | | | |
| Fixed accounts of structured variable annuities | 1 | % | – | 1.99% | | $ | 2 | | | $ | 20 | | | $ | 9 | | | $ | — | | | $ | — | | | $ | 31 | |
| 2 | % | – | 2.99% | | 13 | | | — | | | — | | | — | | | — | | | 13 | |
| 3 | % | – | 3.99% | | 1 | | | — | | | — | | | — | | | — | | | 1 | |
| 4 | % | – | 5.00% | | — | | | — | | | — | | | — | | | — | | | — | |
| Total | | $ | 16 | | | $ | 20 | | | $ | 9 | | | $ | — | | | $ | — | | | $ | 45 | |
| | | | | | | | | | | | | | | |
| Fixed annuities | 1 | % | – | 1.99% | | $ | 85 | | | $ | 237 | | | $ | 152 | | | $ | 89 | | | $ | 14 | | | $ | 577 | |
| 2 | % | – | 2.99% | | 22 | | | 14 | | | 2 | | | — | | | — | | | 38 | |
| 3 | % | – | 3.99% | | 2,410 | | | — | | | — | | | — | | | — | | | 2,410 | |
| 4 | % | – | 5.00% | | 2,331 | | | — | | | — | | | — | | | — | | | 2,331 | |
| Total | | $ | 4,848 | | | $ | 251 | | | $ | 154 | | | $ | 89 | | | $ | 14 | | | $ | 5,356 | |
| | | | | | | | | | | | | | | |
| Non-indexed accounts of fixed indexed annuities | 1 | % | – | 1.99% | | $ | — | | | $ | 2 | | | $ | 5 | | | $ | 14 | | | $ | — | | | $ | 21 | |
| 2 | % | – | 2.99% | | — | | | — | | | — | | | — | | | — | | | — | |
| 3 | % | – | 3.99% | | — | | | — | | | — | | | — | | | — | | | — | |
| 4 | % | – | 5.00% | | — | | | — | | | — | | | — | | | — | | | — | |
| Total | | $ | — | | | $ | 2 | | | $ | 5 | | | $ | 14 | | | $ | — | | | $ | 21 | |
| | | | | | | | | | | | | | | |
| Universal life insurance | 1 | % | – | 1.99% | | $ | — | | | $ | — | | | $ | — | | | $ | — | | | $ | — | | | $ | — | |
| 2 | % | – | 2.99% | | 50 | | | 4 | | | 15 | | | — | | | — | | | 69 | |
| 3 | % | – | 3.99% | | 821 | | | — | | | 4 | | | 6 | | | — | | | 831 | |
| 4 | % | – | 5.00% | | 473 | | | 4 | | | — | | | — | | | — | | | 477 | |
| Total | | $ | 1,344 | | | $ | 8 | | | $ | 19 | | | $ | 6 | | | $ | — | | | $ | 1,377 | |
| | | | | | | | | | | | | | | |
Ameriprise Financial, Inc.
Notes to Consolidated Financial Statements (Continued)
| | | | | | | | | | | | | | | | | | | | | | | | | | | | | | | | | | | | | | | | | | | | | | | |
| | | | | Account Values with Crediting Rates |
| Range of Guaranteed Minimum Crediting Rates | | At Guaranteed Minimum | | 1-49 bps above Guaranteed Minimum | | 50-99 bps above Guaranteed Minimum | | 100-150 bps above Guaranteed Minimum | | Greater than 150 bps above Guaranteed Minimum | | Total |
| | | | | (in millions, except percentages) |
| Fixed accounts of variable universal life insurance | 1 | % | – | 1.99% | | $ | — | | | $ | — | | | $ | 4 | | | $ | 1 | | | $ | 41 | | | $ | 46 | |
| 2 | % | – | 2.99% | | 7 | | | 14 | | | — | | | 1 | | | 12 | | | 34 | |
| 3 | % | – | 3.99% | | 108 | | | 1 | | | 2 | | | 12 | | | — | | | 123 | |
| 4 | % | – | 5.00% | | 564 | | | 21 | | | — | | | — | | | — | | | 585 | |
| Total | | $ | 679 | | | $ | 36 | | | $ | 6 | | | $ | 14 | | | $ | 53 | | | $ | 788 | |
| | | | | | | | | | | | | | | |
| Non-indexed accounts of indexed universal life insurance | 1 | % | – | 1.99% | | $ | — | | | $ | — | | | $ | 4 | | | $ | 2 | | | $ | — | | | $ | 6 | |
| 2 | % | – | 2.99% | | — | | | 125 | | | — | | | — | | | — | | | 125 | |
| 3 | % | – | 3.99% | | — | | | — | | | — | | | — | | | — | | | — | |
| 4 | % | – | 5.00% | | — | | | — | | | — | | | — | | | — | | | — | |
| Total | | $ | — | | | $ | 125 | | | $ | 4 | | | $ | 2 | | | $ | — | | | $ | 131 | |
| | | | | | | | | | | | | | | |
| Other life insurance | 1 | % | – | 1.99% | | $ | — | | | $ | — | | | $ | — | | | $ | — | | | $ | — | | | $ | — | |
| 2 | % | – | 2.99% | | — | | | — | | | — | | | — | | | — | | | — | |
| 3 | % | – | 3.99% | | 28 | | | — | | | — | | | — | | | — | | | 28 | |
| 4 | % | – | 5.00% | | 268 | | | — | | | — | | | — | | | — | | | 268 | |
| Total | | $ | 296 | | | $ | — | | | $ | — | | | $ | — | | | $ | — | | | $ | 296 | |
| | | | | | | | | | | | | | | |
| Total | 1 | % | – | 1.99% | | $ | 111 | | | $ | 354 | | | $ | 239 | | | $ | 123 | | | $ | 55 | | | $ | 882 | |
| 2 | % | – | 2.99% | | 204 | | | 157 | | | 17 | | | 1 | | | 12 | | | 391 | |
| 3 | % | – | 3.99% | | 5,262 | | | 8 | | | 6 | | | 19 | | | — | | | 5,295 | |
| 4 | % | – | 5.00% | | 5,048 | | | 25 | | | — | | | — | | | — | | | 5,073 | |
| Total | | $ | 10,625 | | | $ | 544 | | | $ | 262 | | | $ | 143 | | | $ | 67 | | | $ | 11,641 | |
| | | | | | | | | | | | | | | |
| Percentage of total account values that reset in: | | | | | | | | | | | | |
| Next 12 months | | 100.0 | % | | 100.0 | % | | 99.9 | % | | 100.0 | % | | 99.8 | % | | 100.0 | % |
| > 12 months to 24 months | | — | | | — | | | — | | | — | | | — | | | — | |
| > 24 months | | — | | | — | | | 0.1 | | | — | | | 0.2 | | | — | |
| Total | | 100.0 | % | | 100.0 | % | | 100.0 | % | | 100.0 | % | | 100.0 | % | | 100.0 | % |
| | | | | | | | | | | | | | | | | | | | | | | | | | | | | | | | | | | | | | | | | | | | | | | |
| December 31, 2023 |
| | | | | Account Values with Crediting Rates |
| Range of Guaranteed Minimum Crediting Rates | | At Guaranteed Minimum | | 1-49 bps above Guaranteed Minimum | | 50-99 bps above Guaranteed Minimum | | 100-150 bps above Guaranteed Minimum | | Greater than 150 bps above Guaranteed Minimum | | Total |
| | | | | (in millions, except percentages) |
| Fixed accounts of variable annuities | 1 | % | – | 1.99% | | $ | 43 | | | $ | 131 | | | $ | 52 | | | $ | 15 | | | $ | 2 | | | $ | 243 | |
| 2 | % | – | 2.99% | | 137 | | | 1 | | | — | | | — | | | — | | | 138 | |
| 3 | % | – | 3.99% | | 2,214 | | | — | | | — | | | 1 | | | — | | | 2,215 | |
| 4 | % | – | 5.00% | | 1,514 | | | — | | | — | | | — | | | — | | | 1,514 | |
| Total | | $ | 3,908 | | | $ | 132 | | | $ | 52 | | | $ | 16 | | | $ | 2 | | | $ | 4,110 | |
| | | | | | | | | | | | | | | |
Ameriprise Financial, Inc.
Notes to Consolidated Financial Statements (Continued)
| | | | | | | | | | | | | | | | | | | | | | | | | | | | | | | | | | | | | | | | | | | | | | | |
| | | | | Account Values with Crediting Rates |
| Range of Guaranteed Minimum Crediting Rates | | At Guaranteed Minimum | | 1-49 bps above Guaranteed Minimum | | 50-99 bps above Guaranteed Minimum | | 100-150 bps above Guaranteed Minimum | | Greater than 150 bps above Guaranteed Minimum | | Total |
| | | | | (in millions, except percentages) |
| Fixed accounts of structured variable annuities | 1 | % | – | 1.99% | | $ | 1 | | | $ | 18 | | | $ | 7 | | | $ | 2 | | | $ | — | | | $ | 28 | |
| 2 | % | – | 2.99% | | 11 | | | — | | | — | | | — | | | — | | | 11 | |
| 3 | % | – | 3.99% | | — | | | — | | | — | | | — | | | — | | | — | |
| 4 | % | – | 5.00% | | — | | | — | | | — | | | — | | | — | | | — | |
| Total | | $ | 12 | | | $ | 18 | | | $ | 7 | | | $ | 2 | | | $ | — | | | $ | 39 | |
| | | | | | | | | | | | | | | |
| Fixed annuities | 1 | % | – | 1.99% | | $ | 107 | | | $ | 377 | | | $ | 183 | | | $ | 93 | | | $ | — | | | $ | 760 | |
| 2 | % | – | 2.99% | | 36 | | | 14 | | | 1 | | | — | | | — | | | 51 | |
| 3 | % | – | 3.99% | | 2,816 | | | 1 | | | — | | | — | | | — | | | 2,817 | |
| 4 | % | – | 5.00% | | 2,339 | | | — | | | — | | | — | | | — | | | 2,339 | |
| Total | | $ | 5,298 | | | $ | 392 | | | $ | 184 | | | $ | 93 | | | $ | — | | | $ | 5,967 | |
| | | | | | | | | | | | | | | |
| Non-indexed accounts of fixed indexed annuities | 1 | % | – | 1.99% | | $ | — | | | $ | 2 | | | $ | 7 | | | $ | 13 | | | $ | — | | | $ | 22 | |
| 2 | % | – | 2.99% | | — | | | — | | | — | | | — | | | — | | | — | |
| 3 | % | – | 3.99% | | — | | | — | | | — | | | — | | | — | | | — | |
| 4 | % | – | 5.00% | | — | | | — | | | — | | | — | | | — | | | — | |
| Total | | $ | — | | | $ | 2 | | | $ | 7 | | | $ | 13 | | | $ | — | | | $ | 22 | |
| | | | | | | | | | | | | | | |
| Universal life insurance | 1 | % | – | 1.99% | | $ | — | | | $ | — | | | $ | — | | | $ | — | | | $ | — | | | $ | — | |
| 2 | % | – | 2.99% | | 51 | | | 3 | | | 9 | | | — | | | — | | | 63 | |
| 3 | % | – | 3.99% | | 854 | | | 1 | | | 4 | | | 4 | | | — | | | 863 | |
| 4 | % | – | 5.00% | | 518 | | | 1 | | | — | | | — | | | — | | | 519 | |
| Total | | $ | 1,423 | | | $ | 5 | | | $ | 13 | | | $ | 4 | | | $ | — | | | $ | 1,445 | |
| | | | | | | | | | | | | | | |
| Fixed accounts of variable universal life insurance | 1 | % | – | 1.99% | | $ | — | | | $ | 2 | | | $ | 4 | | | $ | — | | | $ | 24 | | | $ | 30 | |
| 2 | % | – | 2.99% | | 13 | | | 12 | | | — | | | 1 | | | 8 | | | 34 | |
| 3 | % | – | 3.99% | | 122 | | | 2 | | | 3 | | | 6 | | | — | | | 133 | |
| 4 | % | – | 5.00% | | 607 | | | 6 | | | — | | | — | | | — | | | 613 | |
| Total | | $ | 742 | | | $ | 22 | | | $ | 7 | | | $ | 7 | | | $ | 32 | | | $ | 810 | |
| | | | | | | | | | | | | | | |
| Non-indexed accounts of indexed universal life insurance | 1 | % | – | 1.99% | | $ | — | | | $ | — | | | $ | 2 | | | $ | — | | | $ | — | | | $ | 2 | |
| 2 | % | – | 2.99% | | 128 | | | — | | | — | | | — | | | — | | | 128 | |
| 3 | % | – | 3.99% | | — | | | — | | | — | | | — | | | — | | | — | |
| 4 | % | – | 5.00% | | — | | | — | | | — | | | — | | | — | | | — | |
| Total | | $ | 128 | | | $ | — | | | $ | 2 | | | $ | — | | | $ | — | | | $ | 130 | |
| | | | | | | | | | | | | | | |
Ameriprise Financial, Inc.
Notes to Consolidated Financial Statements (Continued)
| | | | | | | | | | | | | | | | | | | | | | | | | | | | | | | | | | | | | | | | | | | | | | | |
| | | | | Account Values with Crediting Rates |
| Range of Guaranteed Minimum Crediting Rates | | At Guaranteed Minimum | | 1-49 bps above Guaranteed Minimum | | 50-99 bps above Guaranteed Minimum | | 100-150 bps above Guaranteed Minimum | | Greater than 150 bps above Guaranteed Minimum | | Total |
| | | | | (in millions, except percentages) |
| Other life insurance | 1 | % | – | 1.99% | | $ | — | | | $ | — | | | $ | — | | | $ | — | | | $ | — | | | $ | — | |
| 2 | % | – | 2.99% | | — | | | — | | | — | | | — | | | — | | | — | |
| 3 | % | – | 3.99% | | 30 | | | — | | | — | | | — | | | — | | | 30 | |
| 4 | % | – | 5.00% | | 295 | | | — | | | — | | | — | | | — | | | 295 | |
| Total | | $ | 325 | | | $ | — | | | $ | — | | | $ | — | | | $ | — | | | $ | 325 | |
| | | | | | | | | | | | | | | |
| Total | 1 | % | – | 1.99% | | $ | 151 | | | $ | 530 | | | $ | 255 | | | $ | 123 | | | $ | 26 | | | $ | 1,085 | |
| 2 | % | – | 2.99% | | 376 | | | 30 | | | 10 | | | 1 | | | 8 | | | 425 | |
| 3 | % | – | 3.99% | | 6,036 | | | 4 | | | 7 | | | 11 | | | — | | | 6,058 | |
| 4 | % | – | 5.00% | | 5,273 | | | 7 | | | — | | | — | | | — | | | 5,280 | |
| Total | | $ | 11,836 | | | $ | 571 | | | $ | 272 | | | $ | 135 | | | $ | 34 | | | $ | 12,848 | |
| | | | | | | | | | | | | | | |
| Percentage of total account values that reset in: | | | | | | | | | | | | |
| Next 12 months | | 99.9 | % | | 99.5 | % | | 99.3 | % | | 100.0 | % | | 100.0 | % | | 99.9 | % |
| > 12 months to 24 months | | 0.1 | | | 0.5 | | | 0.6 | | | — | | | — | | | 0.1 | |
| > 24 months | | — | | | — | | | 0.1 | | | — | | | — | | | — | |
| Total | | 100.0 | % | | 100.0 | % | | 100.0 | % | | 100.0 | % | | 100.0 | % | | 100.0 | % |
Ameriprise Financial, Inc.
Notes to Consolidated Financial Statements (Continued)
The following tables summarize the balances of and changes in the liability for future policy benefits:
| | | | | | | | | | | | | | | | | | | | | | | | | | | | | |
| Life Contingent Payout Annuities | | Term and Whole Life Insurance | | Disability Income Insurance | | Long Term Care Insurance | | Total,
All Products |
| (in millions, except percentages) |
| Present Value of Expected Net Premiums: | | | | | | | | | |
| Balance at January 1, 2024 | $ | — | | | $ | 703 | | | $ | 104 | | | $ | 1,146 | | | $ | 1,953 | |
| Beginning balance at original discount rate | — | | | 708 | | | 105 | | | 1,137 | | | 1,950 | |
| Effect of changes in cash flow assumptions | — | | | 57 | | | (39) | | | 55 | | | 73 | |
| Effect of actual variances from expected experience | — | | | (16) | | | (13) | | | (26) | | | (55) | |
| Adjusted beginning of year balance | $ | — | | | $ | 749 | | | $ | 53 | | | $ | 1,166 | | | $ | 1,968 | |
| Issuances | 201 | | | 63 | | | 9 | | | — | | | 273 | |
| Interest accrual | 1 | | | 38 | | | 3 | | | 55 | | | 97 | |
| Net premiums collected | (202) | | | (76) | | | (6) | | | (149) | | | (433) | |
| Derecognition (lapses) | — | | | — | | | — | | | — | | | — | |
| Ending balance at original discount rate | $ | — | | | $ | 774 | | | $ | 59 | | | $ | 1,072 | | | $ | 1,905 | |
| Effect of changes in discount rate assumptions | — | | | (37) | | | (6) | | | (15) | | | (58) | |
| Balance at December 31, 2024 | $ | — | | | $ | 737 | | | $ | 53 | | | $ | 1,057 | | | $ | 1,847 | |
| | | | | | | | | |
| Present Value of Future Policy Benefits: | | | | | | | | | |
| Balance at January 1, 2024 | $ | 1,164 | | | $ | 1,325 | | | $ | 661 | | | $ | 6,561 | | | $ | 9,711 | |
| Beginning balance at original discount rate | 1,222 | | | 1,291 | | | 621 | | | 6,507 | | | 9,641 | |
| Effect of changes in cash flow assumptions | (24) | | | 67 | | | (61) | | | 58 | | | 40 | |
| Effect of actual variances from expected experience | (8) | | | (16) | | | (25) | | | (48) | | | (97) | |
| Adjusted beginning of year balance | $ | 1,190 | | | $ | 1,342 | | | $ | 535 | | | $ | 6,517 | | | $ | 9,584 | |
| Issuances | 201 | | | 63 | | | 9 | | | — | | | 273 | |
| Interest accrual | 56 | | | 73 | | | 34 | | | 323 | | | 486 | |
| Benefit payments | (158) | | | (125) | | | (43) | | | (432) | | | (758) | |
| Derecognition (lapses) | — | | | — | | | — | | | — | | | — | |
| Ending balance at original discount rate | $ | 1,289 | | | $ | 1,353 | | | $ | 535 | | | $ | 6,408 | | | $ | 9,585 | |
| Effect of changes in discount rate assumptions | (85) | | | (31) | | | 10 | | | (221) | | | (327) | |
| Balance at December 31, 2024 | $ | 1,204 | | | $ | 1,322 | | | $ | 545 | | | $ | 6,187 | | | $ | 9,258 | |
| | | | | | | | | |
| Adjustment due to reserve flooring | $ | — | | | $ | 7 | | | $ | — | | | $ | — | | | $ | 7 | |
| | | | | | | | | |
| Net liability for future policy benefits | $ | 1,204 | | | $ | 592 | | | $ | 492 | | | $ | 5,130 | | | $ | 7,418 | |
| Less: reinsurance recoverable | 759 | | | 424 | | | 20 | | | 2,591 | | | 3,794 | |
| Net liability for future policy benefits, after reinsurance recoverable | $ | 445 | | | $ | 168 | | | $ | 472 | | | $ | 2,539 | | | $ | 3,624 | |
| | | | | | | | | |
| Discounted expected future gross premiums | $ | — | | | $ | 1,672 | | | $ | 836 | | | $ | 1,247 | | | $ | 3,755 | |
| Expected future gross premiums | $ | — | | | $ | 2,921 | | | $ | 1,196 | | | $ | 1,713 | | | $ | 5,830 | |
| Expected future benefit payments | $ | 1,846 | | | $ | 2,286 | | | $ | 899 | | | $ | 10,522 | | | $ | 15,553 | |
| | | | | | | | | |
| Weighted average interest accretion rate | 4.5 | % | | 6.0 | % | | 6.3 | % | | 5.0 | % | | |
| Weighted average discount rate | 5.4 | % | | 5.6 | % | | 5.6 | % | | 5.7 | % | | |
| | | | | | | | | |
| Weighted average duration of liability (in years) | 6 | | 7 | | 7 | | 8 | | |
Ameriprise Financial, Inc.
Notes to Consolidated Financial Statements (Continued)
| | | | | | | | | | | | | | | | | | | | | | | | | | | | | |
| Life Contingent Payout Annuities | | Term and Whole Life Insurance | | Disability Income Insurance | | Long Term Care Insurance | | Total,
All Products |
| (in millions, except percentages) |
| Present Value of Expected Net Premiums: | | | | | | | | | |
| Balance at January 1, 2023 | $ | — | | | $ | 686 | | | $ | 134 | | | $ | 1,207 | | | $ | 2,027 | |
| Beginning balance at original discount rate | — | | | 708 | | | 137 | | | 1,220 | | | 2,065 | |
| Effect of changes in cash flow assumptions | — | | | (19) | | | (19) | | | 19 | | | (19) | |
| Effect of actual variances from expected experience | — | | | (2) | | | (18) | | | (3) | | | (23) | |
| Adjusted beginning of year balance | $ | — | | | $ | 687 | | | $ | 100 | | | $ | 1,236 | | | $ | 2,023 | |
| Issuances | 177 | | | 55 | | | 12 | | | — | | | 244 | |
| Interest accrual | 1 | | | 36 | | | 5 | | | 59 | | | 101 | |
| Net premiums collected | (178) | | | (70) | | | (12) | | | (158) | | | (418) | |
| Derecognition (lapses) | — | | | — | | | — | | | — | | | — | |
| Ending balance at original discount rate | $ | — | | | $ | 708 | | | $ | 105 | | | $ | 1,137 | | | $ | 1,950 | |
| Effect of changes in discount rate assumptions | — | | | (5) | | | (1) | | | 9 | | | 3 | |
| Balance at December 31, 2023 | $ | — | | | $ | 703 | | | $ | 104 | | | $ | 1,146 | | | $ | 1,953 | |
| | | | | | | | | |
| Present Value of Future Policy Benefits: | | | | | | | | | |
| Balance at January 1, 2023 | $ | 1,065 | | | $ | 1,319 | | | $ | 696 | | | $ | 6,439 | | | $ | 9,519 | |
| Beginning balance at original discount rate | 1,155 | | | 1,313 | | | 669 | | | 6,569 | | | 9,706 | |
| Effect of changes in cash flow assumptions | — | | | (18) | | | (25) | | | 9 | | | (34) | |
| Effect of actual variances from expected experience | (10) | | | (1) | | | (29) | | | 5 | | | (35) | |
| Adjusted beginning of year balance | $ | 1,145 | | | $ | 1,294 | | | $ | 615 | | | $ | 6,583 | | | $ | 9,637 | |
| Issuances | 177 | | | 56 | | | 11 | | | — | | | 244 | |
| Interest accrual | 50 | | | 73 | | | 37 | | | 329 | | | 489 | |
| Benefit payments | (150) | | | (132) | | | (42) | | | (405) | | | (729) | |
| Derecognition (lapses) | — | | | — | | | — | | | — | | | — | |
| Ending balance at original discount rate | $ | 1,222 | | | $ | 1,291 | | | $ | 621 | | | $ | 6,507 | | | $ | 9,641 | |
| Effect of changes in discount rate assumptions | (58) | | | 34 | | | 40 | | | 54 | | | 70 | |
| Balance at December 31, 2023 | $ | 1,164 | | | $ | 1,325 | | | $ | 661 | | | $ | 6,561 | | | $ | 9,711 | |
| | | | | | | | | |
| Adjustment due to reserve flooring | $ | — | | | $ | 5 | | | $ | — | | | $ | — | | | $ | 5 | |
| | | | | | | | | |
| Net liability for future policy benefits | $ | 1,164 | | | $ | 627 | | | $ | 557 | | | $ | 5,415 | | | $ | 7,763 | |
| Less: reinsurance recoverable | 880 | | | 440 | | | 22 | | | 2,738 | | | 4,080 | |
| Net liability for future policy benefits, after reinsurance recoverable | $ | 284 | | | $ | 187 | | | $ | 535 | | | $ | 2,677 | | | $ | 3,683 | |
| | | | | | | | | |
| Discounted expected future gross premiums | $ | — | | | $ | 1,764 | | | $ | 904 | | | $ | 1,325 | | | $ | 3,993 | |
| Expected future gross premiums | $ | — | | | $ | 2,938 | | | $ | 1,269 | | | $ | 1,786 | | | $ | 5,993 | |
| Expected future benefit payments | $ | 1,726 | | | $ | 2,166 | | | $ | 1,068 | | | $ | 10,850 | | | $ | 15,810 | |
| | | | | | | | | |
| Weighted average interest accretion rate | 4.2 | % | | 6.2 | % | | 6.1 | % | | 5.0 | % | | |
| Weighted average discount rate | 4.9 | % | | 5.1 | % | | 5.1 | % | | 5.1 | % | | |
| | | | | | | | | |
| Weighted average duration of liability (in years) | 7 | | 7 | | 8 | | 8 | | |
Ameriprise Financial, Inc.
Notes to Consolidated Financial Statements (Continued)
Impacts of the annual review of policy benefit reserves assumptions are reflected within the effect of changes in cash flow assumptions in the disaggregated rollforwards above. The annual review of policy benefit reserves assumptions in the third quarter of 2024 resulted in a net decrease in future policy benefit reserves, primarily due to decreased disability income insurance claim incidence rates. The annual review of policy benefit reserves assumptions in the third quarter of 2023 resulted in a net decrease in future policy benefit reserves, primarily due to updates to LTC premium rate increase assumptions.
The balances of and changes in additional liabilities related to insurance guarantees were as follows:
| | | | | | | | | | | | | | | | | | | | | | | |
| Universal Life Insurance | | Variable Universal Life Insurance | | Other Life Insurance | | Total,
All Products |
| (in millions, except percentages) |
| Balance at January 1, 2024 | $ | 1,225 | | | $ | 81 | | | $ | 15 | | | $ | 1,321 | |
| Interest accrual | 37 | | | 6 | | | 1 | | | 44 | |
| Benefit accrual | 133 | | | 8 | | | 3 | | | 144 | |
| Benefit payments | (69) | | | (13) | | | (5) | | | (87) | |
| Effect of actual variances from expected experience | (2) | | | (1) | | | (1) | | | (4) | |
| Impact of change in net unrealized (gains) losses on securities | (23) | | | (1) | | | (5) | | | (29) | |
| Balance at December 31, 2024 | $ | 1,301 | | | $ | 80 | | | $ | 8 | | | $ | 1,389 | |
| | | | | | | |
| Weighted average interest accretion rate | 3.0 | % | | 7.0 | % | | 3.9 | % | | |
| Weighted average discount rate | 3.2 | % | | 7.1 | % | | 4.0 | % | | |
| | | | | | | |
| Weighted average duration of reserves (in years) | 10 | | 8 | | 6 | | |
| | | | | | | | | | | | | | | | | | | | | | | |
| Universal Life Insurance | | Variable Universal Life Insurance | | Other Life Insurance | | Total,
All Products |
| (in millions, except percentages) |
| Balance at January 1, 2023 | $ | 1,100 | | | $ | 74 | | | $ | 12 | | | $ | 1,186 | |
| Interest accrual | 35 | | | 5 | | | 1 | | | 41 | |
| Benefit accrual | 128 | | | 8 | | | 2 | | | 138 | |
| Benefit payments | (50) | | | (18) | | | (4) | | | (72) | |
| Effect of actual variances from expected experience | (13) | | | 11 | | | (2) | | | (4) | |
| Impact of change in net unrealized (gains) losses on securities | 25 | | | 1 | | | 6 | | | 32 | |
| Balance at December 31, 2023 | $ | 1,225 | | | $ | 81 | | | $ | 15 | | | $ | 1,321 | |
| | | | | | | |
| Weighted average interest accretion rate | 3.0 | % | | 6.9 | % | | 4.0 | % | | |
| Weighted average discount rate | 3.2 | % | | 7.1 | % | | 4.0 | % | | |
| | | | | | | |
| Weighted average duration of reserves (in years) | 10 | | 8 | | 6 | | |
Ameriprise Financial, Inc.
Notes to Consolidated Financial Statements (Continued)
The amount of revenue and interest recognized in the Statement of Operations was as follows:
| | | | | | | | | | | | | | | | | | | | | | | |
| Years Ended December 31, |
| 2024 | | 2023 |
| Gross Premiums | | Interest Expense | | Gross Premiums | | Interest Expense |
| (in millions) |
| Life contingent payout annuities | $ | 226 | | | $ | 55 | | | $ | 196 | | | $ | 49 | |
| Term and whole life insurance | 172 | | | 35 | | | 169 | | | 37 | |
| Disability income insurance | 119 | | | 31 | | | 124 | | | 32 | |
| Long term care insurance | 179 | | | 268 | | | 185 | | | 270 | |
| Total | $ | 696 | | | $ | 389 | | | $ | 674 | | | $ | 388 | |
The following tables summarize the balances of and changes in unearned revenue:
| | | | | | | | | | | | | | | | | | | | | | | | | |
| Universal Life Insurance | | Variable Universal Life Insurance | | Indexed Universal Life Insurance | | | | Total,
All Products |
| (in millions) |
| Balance at January 1, 2024 | $ | 27 | | | $ | 196 | | | $ | 266 | | | | | $ | 489 | |
| Deferral of revenue | — | | | 70 | | | 51 | | | | | 121 | |
| Amortization | (1) | | | (17) | | | (22) | | | | | (40) | |
| Balance at December 31, 2024 | $ | 26 | | | $ | 249 | | | $ | 295 | | | | | $ | 570 | |
| | | | | | | | | |
| Balance at January 1, 2023 | $ | 27 | | | $ | 150 | | | $ | 233 | | | | | $ | 410 | |
| Deferral of revenue | 1 | | | 59 | | | 52 | | | | | 112 | |
| Amortization | (1) | | | (13) | | | (19) | | | | | (33) | |
| Balance at December 31, 2023 | $ | 27 | | | $ | 196 | | | $ | 266 | | | | | $ | 489 | |
12. Separate Account Assets and Liabilities
Aggregate fair value of separate account assets, by major asset category, consisted of the following:
| | | | | | | | | | | |
| December 31, |
| 2024 | | 2023 |
| (in millions) |
| Variable annuities and variable universal life: | | | |
| Mutual funds | $ | 75,576 | | | $ | 74,634 | |
| Unitized pooled pension funds: | | | |
| Property/real estate | 1,682 | | | 1,784 | |
| Equity securities | 514 | | | 553 | |
| Debt securities | 175 | | | 285 | |
| Cash and cash equivalents | 120 | | | 147 | |
| Other | 47 | | | 54 | |
| Total | $ | 78,114 | | | $ | 77,457 | |
No gains or losses were recognized on assets transferred to separate accounts for the years ended December 31, 2024, 2023 and 2022.
Ameriprise Financial, Inc.
Notes to Consolidated Financial Statements (Continued)
The balances of and changes in separate account liabilities were as follows:
| | | | | | | | | | | | | | | | | | | | | | | |
| Variable Annuities | | Variable Universal Life | | Unitized Pooled Pension Funds | | Total |
| (in millions) |
| Balance at January 1, 2024 | $ | 65,839 | | | $ | 8,795 | | | $ | 2,823 | | | $ | 77,457 | |
| Premiums and deposits | 933 | | | 500 | | | 153 | | | 1,586 | |
| Policy charges | (1,365) | | | (307) | | | (5) | | | (1,677) | |
| Surrenders and other benefits | (6,990) | | | (412) | | | (594) | | | (7,996) | |
| | | | | | | |
| Investment return | 7,293 | | | 1,199 | | | 202 | | | 8,694 | |
| Net transfer from (to) general account | 27 | | | 64 | | | — | | | 91 | |
| Other charges | — | | | — | | | (41) | | | (41) | |
| Balance at December 31, 2024 | $ | 65,737 | | | $ | 9,839 | | | $ | 2,538 | | | $ | 78,114 | |
| | | | | | | |
| Cash surrender value | $ | 64,411 | | | $ | 9,220 | | | $ | 2,538 | | | $ | 76,169 | |
| | | | | | | | | | | | | | | | | | | | | | | |
| Variable Annuities | | Variable Universal Life | | Unitized Pooled Pension Funds | | Total |
| (in millions) |
| Balance at January 1, 2023 | $ | 63,223 | | | $ | 7,653 | | | $ | 3,086 | | | $ | 73,962 | |
| Premiums and deposits | 835 | | | 459 | | | 194 | | | 1,488 | |
| Policy charges | (1,343) | | | (292) | | | (7) | | | (1,642) | |
| Surrenders and other benefits | (5,378) | | | (317) | | | (777) | | | (6,472) | |
| | | | | | | |
| Investment return | 8,477 | | | 1,250 | | | 170 | | | 9,897 | |
| Net transfer from (to) general account | 25 | | | 42 | | | — | | | 67 | |
| Other charges | — | | | — | | | 157 | | | 157 | |
| Balance at December 31, 2023 | $ | 65,839 | | | $ | 8,795 | | | $ | 2,823 | | | $ | 77,457 | |
| | | | | | | |
| Cash surrender value | $ | 64,280 | | | $ | 8,263 | | | $ | 2,823 | | | $ | 75,366 | |
13. Market Risk Benefits
Market risk benefits are contracts or contract features that both provide protection to the contractholder from other-than-nominal capital market risk and expose the Company to other-than-nominal capital market risk. Most of the variable annuity contracts issued by the Company contain a GMDB provision. The Company previously offered contracts containing GMWB, GMAB, or GMIB provisions.
The GMDB provisions provide a specified minimum return upon death of the contractholder. The death benefit payable is the greater of (i) the contract value less any purchase payment credits subject to recapture less a pro-rata portion of any rider fees, or (ii) the GMDB provisions specified in the contract. The Company has the following primary GMDB provisions:
•Return of premium – provides purchase payments minus adjusted partial surrenders.
•Reset – provides that the value resets to the account value at specified contract anniversary intervals minus adjusted partial surrenders. This provision was often provided in combination with the return of premium provision and is no longer offered.
•Ratchet – provides that the value ratchets up to the maximum account value at specified anniversary intervals, plus subsequent purchase payments less adjusted partial surrenders.
The variable annuity contracts with GMWB riders typically have account values that are based on an underlying portfolio of mutual funds, the values of which fluctuate based on fund performance. At contract issue, the guaranteed amount is equal to the amount deposited but the guarantee may be increased annually to the account value (a “step-up”) in the case of favorable market performance or by a benefit credit if the contract includes this provision.
Ameriprise Financial, Inc.
Notes to Consolidated Financial Statements (Continued)
The Company has GMWB riders in force, which contain one or more of the following provisions:
•Withdrawals at a specified rate per year until the amount withdrawn is equal to the guaranteed amount.
•Withdrawals at a specified rate per year for the life of the contractholder (“GMWB for life”).
•Withdrawals at a specified rate per year for joint contractholders while either is alive.
•Withdrawals based on performance of the contract.
•Withdrawals based on the age withdrawals begin.
•Credits are applied annually for a specified number of years to increase the guaranteed amount as long as withdrawals have not been taken.
Variable annuity contractholders age 79 or younger at contract issue could obtain a principal-back guarantee by purchasing the optional GMAB rider for an additional charge. The GMAB rider guarantees that, regardless of market performance at the end of the 10-year waiting period, the contract value will be no less than the original investment or a specified percentage of the highest anniversary value, adjusted for withdrawals. If the contract value is less than the guarantee at the end of the 10-year period, a lump sum will be added to the contract value to make the contract value equal to the guarantee value.
Individual variable annuity contracts may have both a death benefit and a living benefit. Net amount at risk is quantified for each benefit and a composite net amount at risk is calculated using the greater of the death benefit or living benefit for each individual contract. The net amount at risk for GMDB and GMAB is defined as the current guaranteed benefit amount in excess of the current contract value. The net amount at risk for GMIB is defined as the greater of the present value of the minimum guaranteed annuity payments less the current contract value or zero. The net amount at risk for GMWB is defined as the greater of the present value of the minimum guaranteed withdrawal payments less the current contract value or zero.
Ameriprise Financial, Inc.
Notes to Consolidated Financial Statements (Continued)
The following tables summarize the balances of and changes in market risk benefits:
| | | | | | | | | | | | | | | | | |
| Years Ended December 31, |
| 2024 | | 2023 | | 2022 |
| (in millions, except age) |
| | | | | |
| | | | | |
| | | | | |
| | | | | |
| | | | | |
| Balance at beginning of period | $ | 335 | | | $ | 1,103 | | | $ | 2,901 | |
| Issuances | 24 | | | 17 | | | 27 | |
| Interest accrual and time decay | (66) | | | (53) | | | (237) | |
| Reserve increase from attributed fees collected | 790 | | | 788 | | | 810 | |
| Reserve release for benefit payments and derecognition | (11) | | | (35) | | | (29) | |
| Effect of changes in interest rates and bond markets | (1,078) | | | (367) | | | (4,193) | |
| Effect of changes in equity markets and subaccount performance | (1,228) | | | (1,267) | | | 2,258 | |
| Effect of changes in equity index volatility | 59 | | | (67) | | | 205 | |
| Actual policyholder behavior different from expected behavior | 71 | | | 5 | | | 17 | |
| Effect of changes in other future expected assumptions | 106 | | | 128 | | | (139) | |
| | | | | |
| Effect of changes in the instrument-specific credit risk on market risk benefits | 79 | | | 83 | | | (517) | |
| Balance at end of period | $ | (919) | | | $ | 335 | | | $ | 1,103 | |
| | | | | |
| Reconciliation of the gross balances in an asset or liability position: | | | | | |
| Asset position | $ | 2,182 | | | $ | 1,427 | | | $ | 1,015 | |
| Liability position | (1,263) | | | (1,762) | | | (2,118) | |
| Net asset (liability) position | $ | 919 | | | $ | (335) | | | $ | (1,103) | |
| | | | | |
| Guaranteed benefit amount in excess of current account balances (net amount at risk): | | | | |
| Death benefits | $ | 462 | | | $ | 913 | | | $ | 2,781 | |
| Living benefits | $ | 2,429 | | | $ | 2,513 | | | $ | 3,364 | |
| Composite (greater of) | $ | 2,829 | | | $ | 3,308 | | | $ | 5,830 | |
| | | | | |
| Weighted average attained age of contractholders | 69 | | 69 | | 68 |
| | | | | |
| Changes in unrealized (gains) losses in net income relating to liabilities held at end of period | $ | (2,111) | | | $ | (1,551) | | | $ | (2,044) | |
| Changes in unrealized (gains) losses in other comprehensive income (loss) relating to liabilities held at end of period | $ | 85 | | | $ | 84 | | | $ | (505) | |
The following tables provide a summary of the significant inputs and assumptions used in the fair value measurements developed by the Company or reasonably available to the Company of market risk benefits:
| | | | | | | | | | | | | | | | | | | | | | | | | | | | | | | | | | | |
| December 31, 2024 |
| Fair Value | | Valuation Technique | | Significant Inputs and Assumptions | | Range | | Weighted
Average |
| (in millions) | | | | | | | | | | |
| | | | | | | | | | | |
| | | | | | | | | | | |
| | | | | | | | | | | |
| | | | | | | | | |
| | | | | | | | | | | |
| | | | | | | | | | | |
| | | | | | | | | | | |
| | | | | | | | | | | |
| | | | | | | | | |
| | | | | | | | | | | |
| Market risk benefits | $ | (919) | | | Discounted cash flow | | Utilization of guaranteed withdrawals (1) | | 0.0% | – | 52.8% | | 11.9% |
| | | | | Surrender rate (2) | | 0.4% | – | 75.0% | | 3.3% |
| | | | | Market volatility (3) | | 0.0% | – | 24.6% | | 10.3% |
| | | | | Nonperformance risk (4) | | 65 bps | | 65 bps |
| | | | | Mortality rate (5) | | 0.0% | – | 41.6% | | 1.7% |
| | | | | | | | | | | |
| | | | | | | | | | | |
| | | | | | | | | | | |
Ameriprise Financial, Inc.
Notes to Consolidated Financial Statements (Continued)
| | | | | | | | | | | | | | | | | | | | | | | | | | | | | | | | | | | |
| December 31, 2023 |
| Fair Value | | Valuation Technique | | Significant Inputs and Assumptions | | Range | | Weighted
Average |
| (in millions) | | | | | | | | | | |
| | | | | | | | | | | |
| | | | | | | | | | | |
| | | | | | | | | | | |
| | | | | | | | | |
| | | | | | | | | | | |
| | | | | | | | | | | |
| | | | | | | | | | | |
| | | | | | | | | | | |
| | | | | | | | | |
| | | | | | | | | | | |
| Market risk benefits | $ | 335 | | | Discounted cash flow | | Utilization of guaranteed withdrawals (1) | | 0.0% | – | 48.0% | | 11.6% |
| | | | | Surrender rate (2) | | 0.3% | – | 75.0% | | 3.7% |
| | | | | Market volatility (3) | | 0.0% | – | 25.2% | | 10.6% |
| | | | | Nonperformance risk (4) | | 85 bps | | 85 bps |
| | | | | Mortality rate (5) | | 0.0% | – | 41.6% | | 1.6% |
| | | | | | | | | | | |
| | | | | | | | | | | |
| | | | | | | | | | | |
(1) The utilization of guaranteed withdrawals represents the percentage of contractholders that will begin withdrawing in any given year. The weighted average utilization rate represents the average assumption, weighted based on the benefit base. The calculation excludes policies that have already started taking withdrawals.
(2) The weighted average surrender rate represents the average assumption weighted based on the account value of each contract.
(3) Market volatility represents the implied volatility of each contractholder’s mix of funds. The weighted average market volatility represents the average volatility across all contracts, weighted by the size of the guaranteed benefit.
(4) The nonperformance risk is the spread added to the U.S. Treasury curve.
(5) The weighted average mortality rate represents the average assumption weighted based on the account value of each contract.
Changes to Significant Inputs and Assumptions:
During the years ended December 31, 2024 and 2023, the Company updated inputs and assumptions based on management’s review of experience studies. These updates resulted in the following notable changes in the fair value estimates of market risk benefits calculations:
Year ended December 31, 2024
•Updates to utilization of guaranteed withdrawal assumptions resulted in a decrease to pretax income of $15 million.
•Updates to surrender assumptions resulted in a decrease to pretax income of $83 million.
Year ended December 31, 2023
•Updates to utilization of guaranteed withdrawal assumptions resulted in a decrease to pretax income of $18 million.
•Updates to surrender assumptions resulted in a decrease to pretax income of $110 million.
Refer to the rollforward of market risk benefits for the impacts of changes to interest rate, equity market, volatility and nonperformance risk assumptions.
Uncertainty of Fair Value Measurements
Significant increases (decreases) in utilization and volatility used in the fair value measurement of market risk benefits in isolation would have resulted in a significantly higher (lower) liability value.
Significant increases (decreases) in nonperformance risk and surrender assumptions used in the fair value measurement of market risk benefits in isolation would have resulted in a significantly lower (higher) liability value.
Significant increases (decreases) in mortality assumptions used in the fair value measurement of the death benefit portion of market risk benefits in isolation would have resulted in a significantly higher (lower) liability value whereas significant increases (decreases) in mortality rates used in the fair value measurement of the life contingent portion of market risk benefits in isolation would have resulted in a significantly lower (higher) liability value.
Surrender assumptions, utilization assumptions and mortality assumptions vary with the type of base product, type of rider, duration of the policy, age of the contractholder, calendar year of the projection, previous withdrawal history, and the relationship between the value of the guaranteed benefit and the contract accumulation value.
Determination of Fair Value
The Company values market risk benefits using internal valuation models. These models include observable capital market assumptions and significant unobservable inputs related to implied volatility, contractholder behavior assumptions that include margins for risk, and the Company’s nonperformance risk. These measurements are classified as Level 3.
Ameriprise Financial, Inc.
Notes to Consolidated Financial Statements (Continued)
14. Customer Deposits
Customer deposits consisted of the following:
| | | | | | | | | | | |
| | December 31, |
| 2024 | | 2023 |
| (in millions) |
| Fixed rate certificates | $ | 11,083 | | | $ | 13,284 | |
| Other | 104 | | | 151 | |
| | | |
| | | |
| | | |
| | | |
| Total investment certificate reserves | 11,187 | | | 13,435 | |
| | | |
| Interest bearing checking | 1,438 | | | 1,258 | |
| Money market | 20,232 | | | 19,940 | |
| Savings | 637 | | | 301 | |
| Brokerage deposits | 2,332 | | | 2,387 | |
| | | |
| Total banking and brokerage deposits | 24,639 | | | 23,886 | |
| | | |
| Total | $ | 35,826 | | | $ | 37,321 | |
Investment Certificates
The Company offers fixed rate investment certificates primarily in amounts ranging from $1 thousand to $2 million with interest crediting rate terms ranging from 3 months to 36 months. Investment certificates may be purchased either with a lump sum payment or installment payments. Certificate owners are entitled to receive a fixed sum at either maturity or upon demand depending on the type of certificate. Payments from certificate owners are credited to investment certificate reserves, which generally accumulate interest at specified percentage rates. Certain investment certificates allow for a surrender charge on premature surrenders. Reserves for certificates that do not allow for a surrender charge were $1.2 billion and $1.5 billion as of December 31, 2024 and 2023, respectively. The Company generally invests the proceeds from investment certificates in fixed and variable rate securities. The interest paid to certificate owners is included in Banking and deposit interest expense.
Banking and Brokerage Deposits
Banking and brokerage deposits are amounts payable to customers related to funds deposited by customers in checking and savings, brokerage sweep balances, free credit balances, and funds accruing to customers as a result of trades or contracts. Money market deposits represent brokerage sweep for client balances held at Ameriprise Bank. Brokerage deposits primarily represent our client’s free credit balances. The Company pays interest on certain customer deposit balances and the interest is included in Banking and deposit interest expense.
15. Debt
The balances and stated interest rates of outstanding debt of Ameriprise Financial were as follows:
| | | | | | | | | | | | | | | | | | | | | | | |
| | Outstanding Balance | | Stated Interest Rate |
| December 31, | December 31, |
| 2024 | | 2023 | 2024 | | 2023 |
| (in millions) | |
| Long-term debt: | | | | | | | |
| | | | | | | |
| | | | | | | |
| Senior notes due 2024 | $ | — | | | $ | 550 | | | — | % | | 3.7 | % |
| Senior notes due 2025 | 500 | | | 500 | | | 3.0 | | | 3.0 | |
| Senior notes due 2026 | 500 | | | 500 | | | 2.9 | | | 2.9 | |
| Senior notes due 2028 | 600 | | | 600 | | | 5.7 | | | 5.7 | |
| Senior notes due 2032 | 500 | | | 500 | | | 4.5 | | | 4.5 | |
| Senior notes due 2033 | 750 | | | 750 | | | 5.2 | | | 5.2 | |
| | | | | | | |
| Finance lease liabilities | 9 | | | 20 | | | N/A | | N/A |
Other (1) | (17) | | | (21) | | | N/A | | N/A |
| Total long-term debt | 2,842 | | | 3,399 | | | | | |
| | | | | | | |
| Short-term borrowings: | | | | | | | |
| Federal Home Loan Bank (“FHLB”) advances | 201 | | | 201 | | | 4.6 | % | | 5.6 | % |
| | | | | | | |
| | | | | | | |
| Total | $ | 3,043 | | | $ | 3,600 | | | | | |
(1) Includes adjustments for net unamortized discounts, debt issuance costs and other lease obligations.
N/A Not Applicable
Ameriprise Financial, Inc.
Notes to Consolidated Financial Statements (Continued)
Long-Term Debt
The Company’s senior notes may be redeemed, in whole or in part, at any time prior to maturity at a price equal to the greater of the principal amount and the present value of remaining scheduled payments, discounted to the redemption date, plus accrued interest.
On October 15, 2024, the Company repaid $550 million principal amount of its 3.7% senior notes at maturity.
Short-Term Borrowings
The Company’s life insurance and bank subsidiaries are members of the FHLB of Des Moines which provides access to collateralized borrowings. The Company’s life insurance subsidiary has accessed collateralized borrowings from the FHLB and has pledged (granted a lien on) certain investments as collateral, primarily commercial mortgage backed securities and residential mortgage backed securities, with an aggregate fair value of $964 million and $1.1 billion as of December 31, 2024 and 2023, respectively. The remaining maturity of outstanding FHLB advances was less than three months as of both December 31, 2024 and 2023. The stated interest rate of the FHLB advances is a weighted average annualized interest rate on the outstanding borrowings as of the balance sheet date.
The Company’s bank subsidiary had no outstanding obligations to the FHLB as of both December 31, 2024 and 2023. The Company’s bank subsidiary maintains access to collateralized borrowings from the Federal Reserve. As of both December 31, 2024 and 2023, there were no outstanding obligations to the Federal Reserve.
On November 25, 2024, the Company entered into agreement to amend and restate its credit agreement that provides for an unsecured committed revolving credit facility of up to $1.0 billion that expires in November 2029. Under the terms of the credit agreement for the facility, the Company may increase the amount of this facility up to $1.25 billion upon satisfaction of certain approval requirements. As of both December 31, 2024 and 2023, the Company had no borrowings outstanding and $1 million of letters of credit issued against the facility. The Company’s credit facility contains various administrative, reporting, legal and financial covenants. The Company was in compliance with all such covenants as of both December 31, 2024 and 2023.
American Enterprise Investment Services, Inc. (“AEIS”), a subsidiary of the Company, has credit agreements for uncommitted lines of credit with third party financial institutions, having a combined credit limit of $500 million. As of both December 31, 2024 and 2023, AEIS had no borrowings outstanding.
16. Fair Values of Assets and Liabilities
GAAP defines fair value as the price that would be received to sell an asset or paid to transfer a liability in an orderly transaction between market participants at the measurement date; that is, an exit price. The exit price assumes the asset or liability is not exchanged subject to a forced liquidation or distressed sale.
Valuation Hierarchy
The Company categorizes its fair value measurements according to a three-level hierarchy. The hierarchy prioritizes the inputs used by the Company’s valuation techniques. A level is assigned to each fair value measurement based on the lowest level input that is significant to the fair value measurement in its entirety.
The three levels of the fair value hierarchy are defined as follows:
Level 1 Unadjusted quoted prices for identical assets or liabilities in active markets that are accessible at the measurement date.
Level 2 Prices or valuations based on observable inputs other than quoted prices in active markets for identical assets and liabilities.
Level 3 Prices or valuations that require inputs that are both significant to the fair value measurement and unobservable.
Ameriprise Financial, Inc.
Notes to Consolidated Financial Statements (Continued)
The following tables present the balances of assets and liabilities of Ameriprise Financial measured at fair value on a recurring basis (See Note 5 for the balances of assets and liabilities for consolidated investment entities):
| | | | | | | | | | | | | | | | | | | | | | | | | | |
| | December 31, 2024 | |
| Level 1 | | Level 2 | | Level 3 | | Total | |
| (in millions) | |
| Assets | | | | | | | | |
| Cash equivalents | $ | 2,526 | | | $ | 2,504 | | | $ | — | | | $ | 5,030 | | |
| Available-for-Sale securities: | | | | | | | | |
| Corporate debt securities | — | | | 13,416 | | | 583 | | | 13,999 | | |
| Residential mortgage backed securities | — | | | 23,306 | | | 38 | | | 23,344 | | |
| Commercial mortgage backed securities | — | | | 5,126 | | | — | | | 5,126 | | |
| Asset backed securities | — | | | 6,316 | | | 126 | | | 6,442 | | |
| State and municipal obligations | — | | | 638 | | | — | | | 638 | | |
| U.S. government and agency obligations | 2,591 | | | — | | | — | | | 2,591 | | |
| Foreign government bonds and obligations | — | | | 13 | | | — | | | 13 | | |
| | | | | | | | |
| Total Available-for-Sale securities | 2,591 | | | 48,815 | | | 747 | | | 52,153 | | |
| | | | | | | | |
| Investments at net asset value (“NAV”) | | | | | | | 12 | | (1) |
| Trading and other securities | 321 | | | 25 | | | — | | | 346 | | |
| Separate account assets at NAV | | | | | | | 78,114 | | (1) |
| Investments and cash equivalents segregated for regulatory purposes | 557 | | | — | | | — | | | 557 | | |
| Market risk benefits | — | | | — | | | 2,182 | | | 2,182 | | (2) |
| Receivables: | | | | | | | | |
| Fixed deferred indexed annuity ceded embedded derivatives | — | | | — | | | 55 | | | 55 | | |
| Other assets: | | | | | | | | |
| Interest rate derivative contracts | — | | | 180 | | | — | | | 180 | | |
| Equity derivative contracts | 114 | | | 8,843 | | | — | | | 8,957 | | |
| Credit derivative contracts | — | | | 59 | | | — | | | 59 | | |
| | | | | | | | |
| Foreign exchange derivative contracts | 2 | | | 41 | | | — | | | 43 | | |
| Total other assets | 116 | | | 9,123 | | | — | | | 9,239 | | |
| Total assets at fair value | $ | 6,111 | | | $ | 60,467 | | | $ | 2,984 | | | $ | 147,688 | | |
| | | | | | | | |
| Liabilities | | | | | | | | |
| Policyholder account balances, future policy benefits and claims: | | | | | | | | |
| Fixed deferred indexed annuity embedded derivatives | $ | — | | | $ | — | | | $ | 53 | | | $ | 53 | | |
| IUL embedded derivatives | — | | | — | | | 1,002 | | | 1,002 | | |
| | | | | | | | |
| Structured variable annuity embedded derivatives | — | | | — | | | 2,461 | | | 2,461 | | |
| Total policyholder account balances, future policy benefits and claims | — | | | — | | | 3,516 | | | 3,516 | | (3) |
| Market risk benefits | — | | | — | | | 1,263 | | | 1,263 | | (2) |
| Customer deposits | — | | | 7 | | | — | | | 7 | | |
| Other liabilities: | | | | | | | | |
| Interest rate derivative contracts | 1 | | | 323 | | | — | | | 324 | | |
| Equity derivative contracts | 173 | | | 5,189 | | | — | | | 5,362 | | |
| Credit derivative contracts | — | | | 4 | | | — | | | 4 | | |
| | | | | | | | |
| Foreign exchange derivative contracts | — | | | 13 | | | — | | | 13 | | |
| Other | 314 | | | 8 | | | 68 | | | 390 | | |
| Total other liabilities | 488 | | | 5,537 | | | 68 | | | 6,093 | | |
| Total liabilities at fair value | $ | 488 | | | $ | 5,544 | | | $ | 4,847 | | | $ | 10,879 | | |
Ameriprise Financial, Inc.
Notes to Consolidated Financial Statements (Continued)
| | | | | | | | | | | | | | | | | | | | | | | | | | |
| | December 31, 2023 | |
| Level 1 | | Level 2 | | Level 3 | | Total | |
| (in millions) | |
| Assets | | | | | | | | |
| Cash equivalents | $ | 704 | | | $ | 4,325 | | | $ | — | | | $ | 5,029 | | |
| Available-for-Sale securities: | | | | | | | | |
| Corporate debt securities | — | | | 12,107 | | | 469 | | | 12,576 | | |
| Residential mortgage backed securities | — | | | 21,066 | | | — | | | 21,066 | | |
| Commercial mortgage backed securities | — | | | 6,050 | | | — | | | 6,050 | | |
| Asset backed securities | — | | | 8,318 | | | 1 | | | 8,319 | | |
| State and municipal obligations | — | | | 760 | | | — | | | 760 | | |
| U.S. government and agency obligations | 2,740 | | | — | | | — | | | 2,740 | | |
| Foreign government bonds and obligations | — | | | 18 | | | — | | | 18 | | |
| Other securities | — | | | 33 | | | — | | | 33 | | |
| Total Available-for-Sale securities | 2,740 | | | 48,352 | | | 470 | | | 51,562 | | |
| | | | | | | | |
| Investments at NAV | | | | | | | 10 | | (1) |
| Trading and other securities | 265 | | | 25 | | | — | | | 290 | | |
| Separate account assets at NAV | | | | | | | 77,457 | | (1) |
| Investments and cash equivalents segregated for regulatory purposes | 699 | | | — | | | — | | | 699 | | |
| Market risk benefits | — | | | — | | | 1,427 | | | 1,427 | | (2) |
| Receivables: | | | | | | | | |
| Fixed deferred indexed annuity ceded embedded derivatives | — | | | — | | | 51 | | | 51 | | |
| Other assets: | | | | | | | | |
| Interest rate derivative contracts | 1 | | | 184 | | | — | | | 185 | | |
| Equity derivative contracts | 66 | | | 4,968 | | | — | | | 5,034 | | |
| Credit derivative contracts | — | | | 4 | | | — | | | 4 | | |
| | | | | | | | |
| Foreign exchange derivative contracts | 1 | | | 21 | | | — | | | 22 | | |
| Total other assets | 68 | | | 5,177 | | | — | | | 5,245 | | |
| Total assets at fair value | $ | 4,476 | | | $ | 57,879 | | | $ | 1,948 | | | $ | 141,770 | | |
| | | | | | | | |
| Liabilities | | | | | | | | |
| Policyholder account balances, future policy benefits and claims: | | | | | | | | |
| Fixed deferred indexed annuity embedded derivatives | $ | — | | | $ | 3 | | | $ | 49 | | | $ | 52 | | |
| IUL embedded derivatives | — | | | — | | | 873 | | | 873 | | |
| | | | | | | | |
| Structured variable annuity embedded derivatives | — | | | — | | | 1,011 | | | 1,011 | | |
| Total policyholder account balances, future policy benefits and claims | — | | | 3 | | | 1,933 | | | 1,936 | | (3) |
| Market risk benefits | — | | | — | | | 1,762 | | | 1,762 | | (2) |
| Customer deposits | — | | | 9 | | | — | | | 9 | | |
| Other liabilities: | | | | | | | | |
| Interest rate derivative contracts | 1 | | | 304 | | | — | | | 305 | | |
| Equity derivative contracts | 96 | | | 3,368 | | | — | | | 3,464 | | |
| Credit derivative contracts | — | | | 107 | | | — | | | 107 | | |
| | | | | | | | |
| Foreign exchange derivative contracts | 1 | | | 6 | | | — | | | 7 | | |
| Other | 259 | | | 3 | | | 76 | | | 338 | | |
| Total other liabilities | 357 | | | 3,788 | | | 76 | | | 4,221 | | |
| Total liabilities at fair value | $ | 357 | | | $ | 3,800 | | | $ | 3,771 | | | $ | 7,928 | | |
(1) Amounts are comprised of financial instruments that are measured at fair value using the NAV per share (or its equivalent) as a practical expedient and have not been classified in the fair value hierarchy.
(2) See Note 13 for additional information related to market risk benefits, including the balances of and changes in market risk benefits as well as the significant inputs and assumptions used in the fair value measurements of market risk benefits.
Ameriprise Financial, Inc.
Notes to Consolidated Financial Statements (Continued)
(3) The Company’s adjustment for nonperformance risk resulted in a $211 million and $195 million cumulative decrease to the embedded derivatives as of December 31, 2024 and 2023, respectfully.
The following tables provide a summary of changes in Level 3 assets and liabilities of Ameriprise Financial measured at fair value on a recurring basis:
| | | | | | | | | | | | | | | | | | | | | | | | | | | | | | | | | | |
| | Available-for-Sale Securities | | | | Receivables | |
| Corporate Debt Securities | | Residential Mortgage Backed Securities | | | | Asset Backed Securities | | Total | | | Fixed Deferred Indexed Annuity Ceded Embedded Derivatives | |
| (in millions) | |
| Balance at January 1, 2024 | $ | 469 | | | $ | — | | | | | $ | 1 | | | $ | 470 | | | | | $ | 51 | | |
| Total gains (losses) included in: | | | | | | | | | | | | | | |
| Net income | 1 | | | — | | | | | — | | | 1 | | (1) | | | 8 | | |
| Other comprehensive income (loss) | 1 | | | — | | | | | — | | | 1 | | | | | — | | |
| Purchases | 228 | | | 150 | | | | | 148 | | | 526 | | | | | — | | |
| | | | | | | | | | | | | | |
| | | | | | | | | | | | | | |
| Settlements | (116) | | | (2) | | | | | — | | | (118) | | | | | (4) | | |
| | | | | | | | | | | | | | |
| Transfers out of Level 3 | — | | | (110) | | | | | (23) | | | (133) | | | | | — | | |
| Balance at December 31, 2024 | $ | 583 | | | $ | 38 | | | | | $ | 126 | | | $ | 747 | | | | | $ | 55 | | |
| | | | | | | | | | | | | | |
| Changes in unrealized gains (losses) in net income relating to assets held at December 31, 2024 | $ | 1 | | | $ | — | | | | | $ | — | | | $ | 1 | | (1) | | | $ | — | | |
| Changes in unrealized gains (losses) in other comprehensive income (loss) relating to assets held at December 31, 2024 | $ | (2) | | | $ | — | | | | | $ | — | | | $ | (2) | | | | | $ | — | | |
| | | | | | | | | | | | | | | | | | | | | | | | | | | | | | | | | | |
| Policyholder Account Balances, Future Policy Benefits and Claims | | Other Liabilities | |
| Fixed Deferred Indexed Annuity Embedded Derivatives | | IUL Embedded Derivatives | | | | Structured Variable Annuity Embedded Derivatives | | Total |
| (in millions) | |
| Balance at January 1, 2024 | $ | 49 | | | $ | 873 | | | | | $ | 1,011 | | | $ | 1,933 | | | $ | 76 | | |
| Total (gains) losses included in: | | | | | | | | | | | | |
| Net income | 8 | | (2) | 255 | | (2) | | | 1,670 | | (3) | 1,933 | | | 2 | | (4) |
| | | | | | | | | | | | |
| Issues | — | | | 23 | | | | | 114 | | | 137 | | | 21 | | |
| Settlements | (4) | | | (149) | | | | | (334) | | | (487) | | | (31) | | |
| Balance at December 31, 2024 | $ | 53 | | | $ | 1,002 | | | | | $ | 2,461 | | | $ | 3,516 | | | $ | 68 | | |
| | | | | | | | | | | | |
| Changes in unrealized (gains) losses in net income relating to liabilities held at December 31, 2024 | $ | — | | | $ | 255 | | (2) | | | $ | 1,670 | | (3) | $ | 1,925 | | | $ | — | | |
Ameriprise Financial, Inc.
Notes to Consolidated Financial Statements (Continued)
| | | | | | | | | | | | | | | | | | | | | | | | | | | | |
| | Available-for-Sale Securities | | Receivables | |
| Corporate Debt Securities | | | | | | Asset Backed Securities | | Total | Fixed Deferred Indexed Annuity Ceded Embedded Derivatives | |
| (in millions) | |
| Balance at January 1, 2023 | $ | 405 | | | | | | | $ | 6 | | | $ | 411 | | | $ | 48 | | |
| Total gains (losses) included in: | | | | | | | | | | | | |
| Net income | — | | | | | | | — | | | — | | (1) | 6 | | |
| Other comprehensive income (loss) | 11 | | | | | | | — | | | 11 | | | — | | |
| Purchases | 126 | | | | | | | — | | | 126 | | | — | | |
| | | | | | | | | | | | |
| | | | | | | | | | | | |
| Settlements | (73) | | | | | | | (5) | | | (78) | | | (3) | | |
| | | | | | | | | | | | |
| | | | | | | | | | | | |
| Balance at December 31, 2023 | $ | 469 | | | | | | | $ | 1 | | | $ | 470 | | | $ | 51 | | |
| | | | | | | | | | | | |
| | | | | | | | | | | | |
| Changes in unrealized gains (losses) in other comprehensive income (loss) relating to assets held at December 31, 2023 | $ | 11 | | | | | | | $ | — | | | $ | 11 | | | $ | — | | |
| | | | | | | | | | | | | | | | | | | | | | | | | | | | | | | | | | |
| Policyholder Account Balances, Future Policy Benefits and Claims | | Other Liabilities | |
| Fixed Deferred Indexed Annuity Embedded Derivatives | | IUL Embedded Derivatives | | | | Structured Variable Annuity Embedded Derivatives | | Total | |
| (in millions) |
| Balance at January 1, 2023 | $ | 44 | | | $ | 739 | | | | | $ | (137) | | (5) | $ | 646 | | | $ | 62 | | |
| Total (gains) losses included in: | | | | | | | | | | | | |
| Net income | 8 | | (2) | 198 | | (2) | | | 1,166 | | (3) | 1,372 | | | 2 | | (4) |
| Other comprehensive income (loss) | — | | | — | | | | | — | | | — | | | 1 | | |
| Issues | — | | | 59 | | | | | 104 | | | 163 | | | 44 | | |
| Settlements | (3) | | | (123) | | | | | (122) | | | (248) | | | (33) | | |
| Balance at December 31, 2023 | $ | 49 | | | $ | 873 | | | | | $ | 1,011 | | | $ | 1,933 | | | $ | 76 | | |
| | | | | | | | | | | | |
| Changes in unrealized (gains) losses in net income relating to liabilities held at December 31, 2023 | $ | — | | | $ | 198 | | (2) | | | $ | 1,166 | | (3) | $ | 1,364 | | | $ | — | | |
| | | | | | | | | | | | | | | | | | | | | | | | | | | | | | | | | | | | |
| | Available-for-Sale Securities | | Receivables | |
| Corporate Debt Securities | | Residential Mortgage Backed Securities | | Commercial Mortgage Backed Securities | | Asset Backed Securities | | Total | Fixed Deferred Indexed Annuity Ceded Embedded Derivatives |
| (in millions) |
| Balance at January 1, 2022 | $ | 502 | | | $ | — | | | $ | 35 | | | $ | 7 | | | $ | 544 | | | $ | 59 | | |
| Total gains (losses) included in: | | | | | | | | | | | | |
| Net income | (1) | | | — | | | — | | | — | | | (1) | | (1) | (8) | | |
| Other comprehensive income (loss) | (44) | | | (4) | | | — | | | (1) | | | (49) | | | — | | |
| Purchases | 39 | | | 389 | | | 112 | | | 32 | | | 572 | | | — | | |
| | | | | | | | | | | | |
| | | | | | | | | | | | |
| Settlements | (91) | | | — | | | — | | | — | | | (91) | | | (3) | | |
| | | | | | | | | | | | |
| Transfers out of Level 3 | — | | | (385) | | | (147) | | | (32) | | | (564) | | | — | | |
| Balance at December 31, 2022 | $ | 405 | | | $ | — | | | $ | — | | | $ | 6 | | | $ | 411 | | | $ | 48 | | |
| | | | | | | | | | | | |
| Changes in unrealized gains (losses) in net income relating to assets held at December 31, 2022 | $ | (1) | | | $ | — | | | $ | — | | | $ | — | | | $ | (1) | | (1) | $ | — | | |
| Changes in unrealized gains (losses) in other comprehensive income (loss) relating to assets held at December 31, 2022 | $ | (42) | | | $ | — | | | $ | — | | | $ | (1) | | | $ | (43) | | | $ | — | | |
Ameriprise Financial, Inc.
Notes to Consolidated Financial Statements (Continued)
| | | | | | | | | | | | | | | | | | | | | | | | | | | | | | | | | | |
| Policyholder Account Balances, Future Policy Benefits and Claims | | Other Liabilities | |
| Fixed Deferred Indexed Annuity Embedded Derivatives | | IUL Embedded Derivatives | | | | Structured Variable Annuity Embedded Derivatives | | Total |
| (in millions) | |
| Balance at January 1, 2022 | $ | 56 | | | $ | 905 | | | | | $ | 406 | | | $ | 1,367 | | | $ | 61 | | |
| Total (gains) losses included in: | | | | | | | | | | | | |
| Net income | (9) | | (2) | (105) | | (2) | | | (633) | | (3) | (747) | | | — | | (4) |
| Other comprehensive income (loss) | — | | | — | | | | | — | | | — | | | (3) | | |
| Issues | — | | | 51 | | | | | 90 | | | 141 | | | 37 | | |
| Settlements | (3) | | | (112) | | | | | — | | | (115) | | | (33) | | |
| Balance at December 31, 2022 | $ | 44 | | | $ | 739 | | | | | $ | (137) | | (5) | $ | 646 | | | $ | 62 | | |
| | | | | | | | | | | | |
| Changes in unrealized (gains) losses in net income relating to liabilities held at December 31, 2022 | $ | — | | | $ | (105) | | (2) | | | $ | (633) | | (3) | $ | (738) | | | $ | — | | |
(1) Included in Net investment income.
(2) Included in Interest credited to fixed accounts.
(3) Included in Benefits, claims, losses and settlement expenses.
(4) Included in General and administrative expense.
(5) The fair value of the structured variable annuity embedded derivatives was a net asset as of January 1, 2023 and December 31, 2022 and the amounts are presented as contra liabilities.
The increase to pretax income of the Company’s adjustment for nonperformance risk on the fair value of its embedded derivatives was $14 million, $51 million and $45 million, net of the reinsurance accrual, for the years ended December 31, 2024, 2023 and 2022, respectively.
Securities transferred from Level 3 primarily represent securities with fair values that are now obtained from a third-party pricing service with observable inputs or fair values that were included in an observable transaction with a market participant. Securities transferred to Level 3 represent securities with fair values that are now based on a single non-binding broker quote.
The following tables provide a summary of the significant unobservable inputs used in the fair value measurements developed by the Company or reasonably available to the Company of Level 3 assets and liabilities:
| | | | | | | | | | | | | | | | | | | | | | | | | | | | | | | | | | | |
| | December 31, 2024 |
| Fair Value | | Valuation Technique | | Unobservable Input | | Range | | Weighted
Average |
| (in millions) | | | | | | | | | | |
| Corporate debt securities (private placements) | $ | 583 | | | Discounted cash flow | | Yield/spread to U.S. Treasuries (1) | 0.8% | – | 1.7% | | 1.1% |
| Asset backed securities | $ | 1 | | | Discounted cash flow | | Annual short-term default rate (2) | 3.5% | | 3.5% |
| | | | | Annual long-term default rate (2) | 3.5% | | 3.5% |
| | | | | Discount rate | 15.3% | | 15.3% |
| | | | | Constant prepayment rate | 20.0% | | 20.0% |
| | | | | Loss recovery | 60.0% | | 60.0% |
| Fixed deferred indexed annuity ceded embedded derivatives | $ | 55 | | | Discounted cash flow | | Surrender rate (3) | 0.0% | – | 89.1% | | 10.6% |
| Fixed deferred indexed annuity embedded derivatives | $ | 53 | | | Discounted cash flow | | Surrender rate (3) | 0.0% | – | 89.1% | | 10.6% |
| | | | | | Nonperformance risk (4) | 65 bps | | 65 bps |
| IUL embedded derivatives | $ | 1,002 | | | Discounted cash flow | | Nonperformance risk (4) | 65 bps | | 65 bps |
| | | | | | | | | |
| | | | | | | | | |
| | | | | | | | | |
| | | | | | | |
| Structured variable annuity embedded derivatives | $ | 2,461 | | | Discounted cash flow | | Surrender rate (3) | 0.5% | – | 75.0% | | 1.7% |
| | | | | Nonperformance risk (4) | 65 bps | | 65 bps |
| Contingent consideration liabilities | $ | 68 | | | Discounted cash flow | | Discount rate (5) | 0.0 | % | – | 10.5% | | 3.3% |
Ameriprise Financial, Inc.
Notes to Consolidated Financial Statements (Continued)
| | | | | | | | | | | | | | | | | | | | | | | | | | | | | | | | | | | |
| | December 31, 2023 |
| Fair Value | | Valuation Technique | | Unobservable Input | | Range | | Weighted
Average |
| (in millions) | | | | | | | | | | |
| Corporate debt securities (private placements) | $ | 469 | | | Discounted cash flow | | Yield/spread to U.S. Treasuries (1) | 1.0% | – | 2.4% | | 1.2% |
| Asset backed securities | $ | 1 | | | Discounted cash flow | | Annual short-term default rate (2) | 3.0% | | 3.0% |
| | | | | Annual long-term default rate (2) | 3.5% | | 3.5% |
| | | | | Discount rate | | 29.0% | | 29.0% |
| | | | | Constant prepayment rate | | 10.0% | | 10.0% |
| | | | | Loss recovery | | 63.6% | | 63.6% |
| Fixed deferred indexed annuity ceded embedded derivatives | $ | 51 | | | Discounted cash flow | | Surrender rate (3) | 0.0% | – | 66.8% | | 1.4% |
| Fixed deferred indexed annuity embedded derivatives | $ | 49 | | | Discounted cash flow | | Surrender rate (3) | 0.0% | – | 66.8% | | 1.4% |
| | | | | Nonperformance risk (4) | | 85 bps | | 85 bps |
| IUL embedded derivatives | $ | 873 | | | Discounted cash flow | | Nonperformance risk (4) | | 85 bps | | 85 bps |
| | | | | | | | | |
| | | | | | | | | |
| | | | | | | | | |
| | | | | | | | |
| Structured variable annuity embedded derivatives | $ | 1,011 | | | Discounted cash flow | | Surrender rate (3) | 0.5% | – | 75.0% | | 2.6% |
| | | | | Nonperformance risk (4) | 85 bps | | 85 bps |
| Contingent consideration liabilities | $ | 76 | | | Discounted cash flow | | Discount rate (5) | 0.0 | % | – | 10.5% | | 2.9% |
(1) The weighted average for the yield/spread to U.S. Treasuries for corporate debt securities (private placements) is weighted based on the security’s market value as a percentage of the aggregate market value of the securities.
(2) The weighted average annual default rates of asset backed securities is weighted based on the security’s market value as a percentage of the aggregate market value of the securities.
(3) The weighted average surrender rate represents the average assumption weighted based on the account value of each contract.
(4) The nonperformance risk is the spread added to the U.S. Treasury curve.
(5) The weighted average discount rate represents the average discount rate across all contingent consideration liabilities, weighted based on the size of the contingent consideration liability.
Level 3 measurements not included in the tables above are obtained from non-binding broker quotes where unobservable inputs utilized in the fair value calculation are not reasonably available to the Company.
Uncertainty of Fair Value Measurements
Significant increases (decreases) in the yield/spread to U.S. Treasuries used in the fair value measurement of Level 3 corporate debt securities in isolation would have resulted in a significantly lower (higher) fair value measurement.
Significant increases (decreases) in the annual default rate and discount rate used in the fair value measurement of Level 3 asset backed securities in isolation, generally, would have resulted in a significantly lower (higher) fair value measurement and significant increases (decreases) in loss recovery in isolation would have resulted in a significantly lower (higher) fair value measurement.
Significant increases (decreases) in the constant prepayment rate in isolation would have resulted in a significantly lower (higher) fair value measurement.
Significant increases (decreases) in the surrender assumption used in the fair value measurement of the fixed deferred indexed annuity ceded embedded derivatives in isolation would have resulted in a significantly lower (higher) fair value measurement.
Significant increases (decreases) in nonperformance risk used in the fair value measurement of the IUL embedded derivatives in isolation would have resulted in a significantly lower (higher) fair value measurement.
Significant increases (decreases) in nonperformance risk and surrender assumption used in the fair value measurements of the fixed deferred indexed annuity embedded derivatives and structured variable annuity embedded derivatives in isolation would have resulted in a significantly lower (higher) liability value.
Significant increases (decreases) in the discount rate used in the fair value measurement of the contingent consideration liability in isolation would have resulted in a significantly lower (higher) fair value measurement.
Determination of Fair Value
The Company uses valuation techniques consistent with the market and income approaches to measure the fair value of its assets and liabilities. The Company’s market approach uses prices and other relevant information generated by market transactions involving identical or comparable assets or liabilities. The Company’s income approach uses valuation techniques to convert future projected cash flows to a single discounted present value amount. When applying either approach, the Company maximizes the use of observable inputs and minimizes the use of unobservable inputs.
Ameriprise Financial, Inc.
Notes to Consolidated Financial Statements (Continued)
The following is a description of the valuation techniques used to measure fair value and the general classification of these instruments pursuant to the fair value hierarchy.
Assets
Cash Equivalents
Cash equivalents include time deposits and other highly liquid investments with original or remaining maturities at the time of purchase of 90 days or less. Actively traded money market funds are measured at their NAV and classified as Level 1. U.S. Treasuries are also classified as Level 1. The Company’s remaining cash equivalents are classified as Level 2 and measured at amortized cost, which is a reasonable estimate of fair value because of the short time between the purchase of the instrument and its expected realization.
Investments (Available-for-Sale Securities, Equity Securities and Trading Securities)
When available, the fair value of securities is based on quoted prices in active markets. If quoted prices are not available, fair values are obtained from third-party pricing services, non-binding broker quotes, or other model-based valuation techniques.
Level 1 securities primarily include trading securities and U.S. Treasuries.
Level 2 securities primarily include corporate bonds, residential mortgage backed securities, commercial mortgage backed securities, asset backed securities, state and municipal obligations, foreign government securities and trading and other securities. The fair value of these Level 2 securities is based on a market approach with prices obtained from third-party pricing services. Observable inputs used to value these securities can include, but are not limited to, reported trades, benchmark yields, issuer spreads and non-binding broker quotes. The fair value of securities included in an observable transaction with a market participant are also considered Level 2 when the market is not active.
Level 3 securities primarily include certain corporate bonds, non-agency residential mortgage backed securities, commercial mortgage backed securities and asset backed securities with fair value typically based on a single non-binding broker quote. The underlying inputs used for some of the non-binding broker quotes are not readily available to the Company. The Company’s privately placed corporate bonds are typically based on a single non-binding broker quote. The fair value of certain asset backed securities is determined using a discounted cash flow model. Inputs used to determine the expected cash flows include assumptions about discount rates and default, prepayment and recovery rates of the underlying assets. Given the significance of the unobservable inputs to this fair value measurement, the fair value of the investment in certain asset backed securities is classified as Level 3.
Management is responsible for the fair values recorded on the financial statements. Prices received from third-party pricing services are subjected to exception reporting that identifies investments with significant daily price movements as well as no movements. The Company reviews the exception reporting and resolves the exceptions through reaffirmation of the price or recording an appropriate fair value estimate. The Company also performs subsequent transaction testing. The Company performs annual due diligence of third-party pricing services. The Company’s due diligence procedures include assessing the vendor’s valuation qualifications, control environment, analysis of asset-class specific valuation methodologies, and understanding of sources of market observable assumptions and unobservable assumptions, if any, employed in the valuation methodology. The Company also considers the results of its exception reporting controls and any resulting price challenges that arise.
Separate Account Assets
The fair value of assets held by separate accounts is determined by the NAV of the funds in which those separate accounts are invested. The NAV is used as a practical expedient for fair value and represents the exit price for the separate account. Separate account assets are excluded from classification in the fair value hierarchy.
Investments and Cash Equivalents Segregated for Regulatory Purposes
Investments and cash equivalents segregated for regulatory purposes includes U.S. Treasuries that are classified as Level 1.
Receivables
The Company reinsured its fixed deferred indexed annuity products which have an indexed account that is accounted for as an embedded derivative. The Company uses discounted cash flow models to determine the fair value of these ceded embedded derivatives. The fair value of fixed deferred indexed annuity ceded embedded derivatives includes significant observable interest rates, volatilities and equity index levels and significant unobservable surrender rates. Given the significance of the unobservable surrender rates, these embedded derivatives are classified as Level 3.
Other Assets
Derivatives that are measured using quoted prices in active markets, such as derivatives that are exchange-traded, are classified as Level 1 measurements. The variation margin on futures contracts is also classified as Level 1. The fair value of derivatives that are traded in less active over-the-counter (“OTC”) markets is generally measured using pricing models with market observable inputs such as interest rates and equity index levels. These measurements are classified as Level 2 within the fair value hierarchy and include swaps, foreign currency forwards and the majority of options. The counterparties’ nonperformance risk associated with
Ameriprise Financial, Inc.
Notes to Consolidated Financial Statements (Continued)
uncollateralized derivative assets was immaterial as of both December 31, 2024 and 2023. See Note 17 and Note 18 for further information on the credit risk of derivative instruments and related collateral.
Liabilities
Policyholder Account Balances, Future Policy Benefits and Claims
There is no active market for the transfer of the Company’s embedded derivatives attributable to the provisions of fixed deferred indexed annuity, structured variable annuity and IUL products.
The Company uses a discounted cash flow model to determine the fair value of the embedded derivatives associated with the provisions of its equity index annuity product. The projected cash flows generated by this model are based on significant observable inputs related to interest rates, volatilities and equity index levels and, therefore, are classified as Level 2.
The Company uses discounted cash flow models to determine the fair value of the embedded derivatives associated with the provisions of its fixed deferred indexed annuity, structured variable annuity and IUL products. The structured variable annuity product is a limited flexible purchase payment annuity that offers 45 different indexed account options providing equity market exposure and a fixed account. Each indexed account includes a protection option (a buffer or a floor). If the index has a negative return, contractholder losses will be reduced by a buffer or limited to a floor. The portion allocated to an indexed account is accounted for as an embedded derivative. The fair value of fixed deferred indexed annuity, structured variable annuity and IUL embedded derivatives includes significant observable interest rates, volatilities and equity index levels and significant unobservable surrender rates and the estimate of the Company’s nonperformance risk. Given the significance of the unobservable surrender rates and the nonperformance risk assumption, the fixed deferred indexed annuity, structured variable annuity and IUL embedded derivatives are classified as Level 3.
The embedded derivatives attributable to these provisions are recorded in Policyholder account balances, future policy benefits and claims.
Customer Deposits
The Company uses Black-Scholes models to determine the fair value of the embedded derivative liability associated with the provisions of its stock market certificates (“SMC”). The inputs to these calculations are primarily market observable and include interest rates, volatilities and equity index levels. As a result, these measurements are classified as Level 2.
Other Liabilities
Derivatives that are measured using quoted prices in active markets, such as derivatives that are exchange-traded, are classified as Level 1 measurements. The variation margin on futures contracts is also classified as Level 1. The fair value of derivatives that are traded in less active OTC markets is generally measured using pricing models with market observable inputs such as interest rates and equity index levels. These measurements are classified as Level 2 within the fair value hierarchy and include swaps, foreign currency forwards and the majority of options. The Company’s nonperformance risk associated with uncollateralized derivative liabilities was immaterial as of both December 31, 2024 and 2023. See Note 17 and Note 18 for further information on the credit risk of derivative instruments and related collateral.
Securities sold but not yet purchased represent obligations of the Company to deliver specified securities that it does not yet own, creating a liability to purchase the security in the market at prevailing prices. When available, the fair value of securities is based on quoted prices in active markets. If quoted prices are not available, fair values are obtained from nationally-recognized pricing services, or other model-based valuation techniques such as the present value of cash flows. Level 1 securities sold but not yet purchased primarily include trading securities and U.S. Treasuries traded in active markets. Level 2 securities sold but not yet purchased primarily include corporate bonds.
Contingent consideration liabilities consist of earn-outs and/or deferred payments related to the Company’s acquisitions. Contingent consideration liabilities are recorded at fair value utilizing a discounted cash flow model using an unobservable input (discount rate). Given the use of a significant unobservable input, the fair value of contingent consideration liabilities is classified as Level 3 within the fair value hierarchy.
Fair Value on a Nonrecurring Basis
The Company assesses its investment in affordable housing partnerships for impairment. The investments that are determined to be impaired are written down to their fair value. The Company uses a discounted cash flow model to measure the fair value of these investments. Inputs to the discounted cash flow model are estimates of future net operating losses and tax credits available to the Company and discount rates based on market condition and the financial strength of the syndicator (general partner). The balance of affordable housing partnerships measured at fair value on a nonrecurring basis was $27 million and $41 million as of December 31, 2024 and 2023, respectively, and is classified as Level 3 in the fair value hierarchy.
Ameriprise Financial, Inc.
Notes to Consolidated Financial Statements (Continued)
Assets and Liabilities Not Reported at Fair Value
The following tables provide the carrying value and the estimated fair value of financial instruments that are not reported at fair value:
| | | | | | | | | | | | | | | | | | | | | | | | | | | | | |
| | December 31, 2024 |
| Carrying Value | | Fair Value |
| Level 1 | | Level 2 | | Level 3 | | Total |
| (in millions) |
| Financial Assets | | | | | | | | | |
| Mortgage loans, net | $ | 2,354 | | | $ | — | | | $ | 433 | | | $ | 1,768 | | | $ | 2,201 | |
| Policy loans | 982 | | | — | | | 982 | | | — | | | 982 | |
| Receivables | 9,236 | | | 218 | | | 1,879 | | | 5,964 | | | 8,061 | |
| Restricted and segregated cash | 887 | | | 887 | | | — | | | — | | | 887 | |
| Other investments and assets | 272 | | | — | | | 220 | | | 53 | | | 273 | |
| | | | | | | | | |
| Financial Liabilities | | | | | | | | | |
| Policyholder account balances, future policy benefits and claims | $ | 20,097 | | | $ | — | | | $ | — | | | $ | 16,826 | | | $ | 16,826 | |
| Investment certificate reserves | 11,205 | | | — | | | — | | | 11,183 | | | 11,183 | |
| Banking and brokerage deposits | 24,639 | | | 24,639 | | | — | | | — | | | 24,639 | |
| Separate account liabilities — investment contracts | 2,902 | | | — | | | 2,902 | | | — | | | 2,902 | |
| Debt and other liabilities | 3,326 | | | 274 | | | 3,031 | | | 4 | | | 3,309 | |
| | | | | | | | | | | | | | | | | | | | | | | | | | | | | |
| | December 31, 2023 |
| Carrying Value | | Fair Value |
| Level 1 | | Level 2 | | Level 3 | | Total |
| (in millions) |
| Financial Assets | | | | | | | | | |
| Mortgage loans, net | $ | 2,118 | | | $ | — | | | $ | 280 | | | $ | 1,692 | | | $ | 1,972 | |
| Policy loans | 912 | | | — | | | 912 | | | — | | | 912 | |
| Receivables | 9,453 | | | 146 | | | 1,621 | | | 6,577 | | | 8,344 | |
| Restricted and segregated cash | 936 | | | 936 | | | — | | | — | | | 936 | |
| Other investments and assets | 338 | | | — | | | 283 | | | 55 | | | 338 | |
| | | | | | | | | |
| Financial Liabilities | | | | | | | | | |
| Policyholder account balances, future policy benefits and claims | $ | 16,641 | | | $ | — | | | $ | — | | | $ | 14,243 | | | $ | 14,243 | |
| Investment certificate reserves | 13,461 | | | — | | | — | | | 13,420 | | | 13,420 | |
| Banking and brokerage deposits | 23,886 | | | 23,886 | | | — | | | — | | | 23,886 | |
| Separate account liabilities — investment contracts | 3,155 | | | — | | | 3,155 | | | — | | | 3,155 | |
| Debt and other liabilities | 3,769 | | | 166 | | | 3,610 | | | 5 | | | 3,781 | |
Receivables include deposit receivables, brokerage margin loans, securities borrowed, pledged asset lines of credit and loans to financial advisors. Restricted and segregated cash includes cash segregated under federal and other regulations held in special reserve bank accounts for the exclusive benefit of the Company’s brokerage customers. Other investments and assets primarily include syndicated loans, credit card receivables, certificate of deposits with original or remaining maturities at the time of purchase of more than 90 days, the Company’s membership in the FHLB and investments related to the Community Reinvestment Act. See Note 7 for additional information on mortgage loans, policy loans, syndicated loans, credit card receivables and deposit receivables.
Policyholder account balances, future policy benefits and claims include fixed annuities in deferral status, non-life contingent fixed annuities in payout status, indexed and structured variable annuity host contracts, and the fixed portion of a small number of variable annuity contracts classified as investment contracts. See Note 11 for additional information on these liabilities. Investment certificate reserves represent customer deposits for fixed rate certificates and stock market certificates. Banking and brokerage deposits are amounts payable to customers related to free credit balances, funds deposited by customers and funds accruing to customers as a result of trades or contracts. Separate account liabilities are primarily investment contracts in pooled pension funds offered by Threadneedle. Debt and other liabilities include the Company’s long-term debt, short-term borrowings, securities loaned and future funding commitments to affordable housing partnerships and other real estate partnerships. See Note 15 for further information on the Company’s long-term debt and short-term borrowings.
Ameriprise Financial, Inc.
Notes to Consolidated Financial Statements (Continued)
17. Offsetting Assets and Liabilities
Certain financial instruments and derivative instruments are eligible for offset in the Consolidated Balance Sheets. The Company’s derivative instruments and securities borrowing and lending agreements are subject to master netting and collateral arrangements and qualify for offset. A master netting arrangement with a counterparty creates a right of offset for amounts due to and from that same counterparty that is enforceable in the event of a default or bankruptcy. Securities borrowed and securities loaned result from transactions between the Company’s broker dealer subsidiary and other financial institutions and are recorded at the amount of cash collateral advanced or received. Securities borrowed and securities loaned are primarily equity securities. The Company’s securities borrowed and securities loaned transactions generally do not have a fixed maturity date and may be terminated by either party under customary terms. The Company’s policy is to recognize amounts subject to master netting arrangements on a gross basis in the Consolidated Balance Sheets.
The following tables present the gross and net information about the Company’s assets subject to master netting arrangements:
| | | | | | | | | | | | | | | | | | | | | | | | | | | | | | | | | | | | | | | | | |
| | December 31, 2024 |
| Gross Amounts of Recognized Assets | | Gross Amounts Offset in the Consolidated Balance Sheets | | Amounts of Assets Presented in the Consolidated Balance Sheets | | Gross Amounts Not Offset in the
Consolidated Balance Sheets | | Net Amount |
Financial Instruments (1) | | Cash Collateral | | Securities Collateral |
| (in millions) |
| Derivatives: | | | | | | | | | | | | | |
| OTC | $ | 9,126 | | | $ | — | | | $ | 9,126 | | | $ | (5,566) | | | $ | (1,554) | | | $ | (1,970) | | | $ | 36 | |
| OTC cleared | 10 | | | — | | | 10 | | | (10) | | | — | | | — | | | — | |
| Exchange-traded | 103 | | | — | | | 103 | | | (18) | | | — | | | — | | | 85 | |
| Total derivatives | 9,239 | | | — | | | 9,239 | | | (5,594) | | | (1,554) | | | (1,970) | | | 121 | |
| Securities borrowed | 218 | | | — | | | 218 | | | (71) | | | — | | | (142) | | | 5 | |
| Total | $ | 9,457 | | | $ | — | | | $ | 9,457 | | | $ | (5,665) | | | $ | (1,554) | | | $ | (2,112) | | | $ | 126 | |
| | | | | | | | | | | | | | | | | | | | | | | | | | | | | | | | | | | | | | | | | |
| | December 31, 2023 |
| Gross Amounts of Recognized Assets | | Gross Amounts Offset in the Consolidated Balance Sheets | | Amounts of Assets Presented in the Consolidated Balance Sheets | | Gross Amounts Not Offset in the
Consolidated Balance Sheets | | Net Amount |
Financial Instruments (1) | | Cash Collateral | | Securities Collateral |
| (in millions) |
| Derivatives: | | | | | | | | | | | | | |
| OTC | $ | 5,197 | | | $ | — | | | $ | 5,197 | | | $ | (3,707) | | | $ | (1,114) | | | $ | (357) | | | $ | 19 | |
| OTC cleared | 9 | | | — | | | 9 | | | (9) | | | — | | | — | | | — | |
| Exchange-traded | 39 | | | — | | | 39 | | | (18) | | | — | | | — | | | 21 | |
| Total derivatives | 5,245 | | | — | | | 5,245 | | | (3,734) | | | (1,114) | | | (357) | | | 40 | |
| Securities borrowed | 146 | | | — | | | 146 | | | (32) | | | — | | | (111) | | | 3 | |
| Total | $ | 5,391 | | | $ | — | | | $ | 5,391 | | | $ | (3,766) | | | $ | (1,114) | | | $ | (468) | | | $ | 43 | |
(1) Represents the amount of assets that could be offset by liabilities with the same counterparty under master netting or similar arrangements that management elects not to offset on the Consolidated Balance Sheets.
The following tables present the gross and net information about the Company’s liabilities subject to master netting arrangements:
| | | | | | | | | | | | | | | | | | | | | | | | | | | | | | | | | | | | | | | | | |
| | December 31, 2024 |
| Gross Amounts of Recognized Liabilities | | Gross Amounts Offset in the Consolidated Balance Sheets | | Amounts of Liabilities Presented in the Consolidated Balance Sheets | | Gross Amounts Not Offset in the
Consolidated Balance Sheets | | Net Amount |
Financial Instruments (1) | | Cash Collateral | | Securities Collateral |
| (in millions) |
| Derivatives: | | | | | | | | | | | | | |
| OTC | $ | 5,662 | | | $ | — | | | $ | 5,662 | | | $ | (5,566) | | | $ | (15) | | | $ | (68) | | | $ | 13 | |
| OTC cleared | 18 | | | — | | | 18 | | | (10) | | | — | | | — | | | 8 | |
| Exchange-traded | 23 | | | — | | | 23 | | | (18) | | | — | | | — | | | 5 | |
| Total derivatives | 5,703 | | | — | | | 5,703 | | | (5,594) | | | (15) | | | (68) | | | 26 | |
| Securities loaned | 273 | | | — | | | 273 | | | (71) | | | — | | | (195) | | | 7 | |
| Total | $ | 5,976 | | | $ | — | | | $ | 5,976 | | | $ | (5,665) | | | $ | (15) | | | $ | (263) | | | $ | 33 | |
Ameriprise Financial, Inc.
Notes to Consolidated Financial Statements (Continued)
| | | | | | | | | | | | | | | | | | | | | | | | | | | | | | | | | | | | | | | | | |
| | December 31, 2023 |
| Gross Amounts of Recognized Liabilities | | Gross Amounts Offset in the Consolidated Balance Sheets | | Amounts of Liabilities Presented in the Consolidated Balance Sheets | | Gross Amounts Not Offset in the
Consolidated Balance Sheets | | Net Amount |
Financial Instruments (1) | | Cash Collateral | | Securities Collateral |
| (in millions) |
| Derivatives: | | | | | | | | | | | | | |
| OTC | $ | 3,829 | | | $ | — | | | $ | 3,829 | | | $ | (3,707) | | | $ | (36) | | | $ | (78) | | | $ | 8 | |
| OTC cleared | 35 | | | — | | | 35 | | | (9) | | | — | | | — | | | 26 | |
| Exchange-traded | 19 | | | — | | | 19 | | | (18) | | | — | | | — | | | 1 | |
| Total derivatives | 3,883 | | | — | | | 3,883 | | | (3,734) | | | (36) | | | (78) | | | 35 | |
| Securities loaned | 163 | | | — | | | 163 | | | (32) | | | — | | | (126) | | | 5 | |
| | | | | | | | | | | | | |
| Total | $ | 4,046 | | | $ | — | | | $ | 4,046 | | | $ | (3,766) | | | $ | (36) | | | $ | (204) | | | $ | 40 | |
(1) Represents the amount of liabilities that could be offset by assets with the same counterparty under master netting or similar arrangements that management elects not to offset on the Consolidated Balance Sheets.
In the tables above, the amount of assets or liabilities presented are offset first by financial instruments that have the right of offset under master netting or similar arrangements, then any remaining amount is reduced by the amount of cash and securities collateral. The actual collateral may be greater than amounts presented in the tables.
When the fair value of collateral accepted by the Company is less than the amount due to the Company, there is a risk of loss if the counterparty fails to perform or provide additional collateral. To mitigate this risk, the Company monitors collateral values regularly and requires additional collateral when necessary. When the value of collateral pledged by the Company declines, it may be required to post additional collateral.
Freestanding derivative instruments are reflected in Other assets and Other liabilities. Cash collateral pledged by the Company is reflected in Other assets and cash collateral accepted by the Company is reflected in Other liabilities. Securities borrowing and lending agreements are reflected in Receivables and Other liabilities, respectively. See Note 18 for additional disclosures related to the Company’s derivative instruments and Note 5 for information related to derivatives held by consolidated investment entities.
18. Derivatives and Hedging Activities
Derivative instruments enable the Company to manage its exposure to various market risks. The value of such instruments is derived from an underlying variable or multiple variables, including equity, foreign exchange and interest rate indices or prices. The Company primarily enters into derivative agreements for risk management purposes related to the Company’s products and operations.
Certain of the Company’s freestanding derivative instruments are subject to master netting arrangements. The Company’s policy on the recognition of derivatives on the Consolidated Balance Sheets is to not offset fair value amounts recognized for derivatives and collateral arrangements executed with the same counterparty under the same master netting arrangement. See Note 17 for additional information regarding the estimated fair value of the Company’s freestanding derivatives after considering the effect of master netting arrangements and collateral.
Ameriprise Financial, Inc.
Notes to Consolidated Financial Statements (Continued)
Generally, the Company uses derivatives as economic hedges and accounting hedges. The following table presents the notional value and gross fair value of derivative instruments, including embedded derivatives:
| | | | | | | | | | | | | | | | | | | | | | | | | | | | | | | | | | | |
| December 31, 2024 | | December 31, 2023 |
| Notional | | Gross Fair Value | Notional | | Gross Fair Value |
Assets (1) | | Liabilities (2) | Assets (1) | | Liabilities (2) |
| (in millions) |
| Derivatives designated as hedging instruments | | | | | | | | | | | |
| | | | | | | | | | | |
| | | | | | | | | | | |
| Foreign exchange contracts - net investment hedges | — | | | $ | — | | | $ | — | | | 61 | | | $ | — | | | $ | 3 | |
| Total qualifying hedges | — | | | — | | | — | | | 61 | | | — | | | 3 | |
| | | | | | | | | | | |
| Derivatives not designated as hedging instruments | | | | | | | | | | | |
| Interest rate contracts | 39,111 | | | 180 | | | 324 | | | 42,523 | | | 185 | | | 305 | |
| Equity contracts | 109,622 | | | 8,957 | | | 5,362 | | | 83,080 | | | 5,034 | | | 3,464 | |
| Credit contracts | 3,122 | | | 59 | | | 4 | | | 3,436 | | | 4 | | | 107 | |
| Foreign exchange contracts | 3,426 | | | 43 | | | 13 | | | 3,262 | | | 22 | | | 4 | |
| | | | | | | | | | | |
| Total non-designated hedges | 155,281 | | | 9,239 | | | 5,703 | | | 132,301 | | | 5,245 | | | 3,880 | |
| | | | | | | | | | | |
| Embedded derivatives | | | | | | | | | | | |
| | | | | | | | | | | |
| IUL | N/A | | — | | | 1,002 | | | N/A | | — | | | 873 | |
| Fixed deferred indexed annuities and deposit receivables | N/A | | 55 | | | 53 | | | N/A | | 51 | | | 52 | |
Structured variable annuities (3) | N/A | | — | | | 2,461 | | | N/A | | — | | | 1,011 | |
| SMC | N/A | | — | | | 7 | | | N/A | | — | | | 9 | |
| Total embedded derivatives | N/A | | 55 | | | 3,523 | | | N/A | | 51 | | | 1,945 | |
| Total derivatives | $ | 155,281 | | | $ | 9,294 | | | $ | 9,226 | | | $ | 132,362 | | | $ | 5,296 | | | $ | 5,828 | |
N/A Not applicable.
(1) The fair value of freestanding derivative assets is included in Other assets and the fair value of ceded embedded derivative assets related to deposit receivables is included in Receivables.
(2) The fair value of freestanding derivative liabilities is included in Other liabilities. The fair value of IUL, fixed deferred indexed annuity and structured variable annuity embedded derivatives is included in Policyholder account balances, future policy benefits and claims. The fair value of the SMC embedded derivative liability is included in Customer deposits.
(3) The fair value of the structured variable annuity embedded derivatives as of December 31, 2024 included $2.5 billion of individual contracts in a liability position and $3 million of individual contracts in an asset position. The fair value of the structured variable annuity embedded derivatives as of December 31, 2023 included $1.0 billion of individual contracts in a liability position and $15 million of individual contracts in an asset position.
See Note 16 for additional information regarding the Company’s fair value measurement of derivative instruments.
As of both December 31, 2024 and 2023, investment securities with a fair value of $1.5 billion were pledged to meet contractual obligations under derivative contracts, of which $85 million and $145 million, respectively, may be sold, pledged or rehypothecated by the counterparty. As of December 31, 2024 and 2023, investment securities with a fair value of $2.2 billion and $376 million, respectively, were received as collateral to meet contractual obligations under derivative contracts, of which $2.0 billion and $314 million, respectively, may be sold, pledged or rehypothecated by the Company. As of both December 31, 2024 and 2023, the Company had sold, pledged or rehypothecated none of these securities. In addition, as of both December 31, 2024 and 2023, non-cash collateral accepted was held in separate custodial accounts and was not included in the Company’s Consolidated Balance Sheets.
Ameriprise Financial, Inc.
Notes to Consolidated Financial Statements (Continued)
Derivatives Not Designated as Hedges
The following tables presents a summary of the impact of derivatives not designated as hedging instruments, including embedded derivatives, on the Consolidated Statements of Operations:
| | | | | | | | | | | | | | | | | | | | | | | | |
| Net Investment Income | Banking and Deposit Interest Expense | Distribution Expenses | Interest Credited to Fixed Accounts | Benefits, Claims, Losses and Settlement Expenses | Change in Fair Value of Market Risk Benefits | | General and Administrative Expense |
| (in millions) |
| Year Ended December 31, 2024 | | | | | | | |
| Interest rate contracts | $ | 1 | | $ | — | | $ | — | | $ | — | | $ | (10) | | $ | (1,128) | | | $ | — | |
| Equity contracts | (12) | | 2 | | 119 | | 71 | | 1,419 | | (1,021) | | | 10 | |
| Credit contracts | — | | — | | (3) | | — | | — | | 124 | | | — | |
| Foreign exchange contracts | — | | — | | — | | — | | — | | 64 | | | (12) | |
| | | | | | | | |
| | | | | | | | |
| IUL embedded derivatives | — | | — | | — | | (106) | | — | | — | | | — | |
| Fixed deferred indexed annuity and deposit receivables embedded derivatives | — | | — | | — | | 16 | | — | | — | | | — | |
| Structured variable annuity embedded derivatives | — | | — | | — | | — | | (1,670) | | — | | | — | |
| SMC embedded derivatives | — | | (2) | | — | | — | | — | | — | | | — | |
| Total gain (loss) | $ | (11) | | $ | — | | $ | 116 | | $ | (19) | | $ | (261) | | $ | (1,961) | | | $ | (2) | |
| | | | | | | | | | | | | | | | | | | | | | | | | | |
| Net Investment Income | Banking and Deposit Interest Expense | Distribution Expenses | Interest Credited to Fixed Accounts | Benefits, Claims, Losses and Settlement Expenses | Change in Fair Value of Market Risk Benefits | Interest and Debt Expense | General and Administrative Expense |
| (in millions) |
| Year Ended December 31, 2023 | | | | | | | |
| Interest rate contracts | $ | — | | $ | — | | $ | — | | $ | — | | $ | (5) | | $ | (422) | | $ | (1) | | $ | — | |
| Equity contracts | (3) | | 4 | | 128 | | 79 | | 770 | | (1,239) | | — | | 10 | |
| Credit contracts | — | | — | | 2 | | — | | — | | 7 | | — | | — | |
| Foreign exchange contracts | — | | — | | — | | — | | — | | 5 | | — | | 7 | |
| | | | | | | | |
| | | | | | | | |
| IUL embedded derivatives | — | | — | | — | | (75) | | — | | — | | — | | — | |
| Fixed deferred indexed annuity and deposit receivables embedded derivatives | — | | — | | — | | (3) | | — | | — | | — | | — | |
| Structured variable annuity embedded derivatives | — | | — | | — | | — | | (1,166) | | — | | — | | — | |
| SMC embedded derivatives | — | | (5) | | — | | — | | — | | — | | — | | — | |
| Total gain (loss) | $ | (3) | | $ | (1) | | $ | 130 | | $ | 1 | | $ | (401) | | $ | (1,649) | | $ | (1) | | $ | 17 | |
Ameriprise Financial, Inc.
Notes to Consolidated Financial Statements (Continued)
| | | | | | | | | | | | | | | | | | | | | | | | | | |
| Net Investment Income | Banking and Deposit Interest Expense | Distribution Expenses | Interest Credited to Fixed Accounts | Benefits, Claims, Losses and Settlement Expenses | Change in Fair Value of Market Risk Benefits | Interest and Debt Expense | General and Administrative Expense |
| (in millions) |
| Year Ended December 31, 2022 | | | | | | | |
| Interest rate contracts | $ | 1 | | $ | — | | $ | (3) | | $ | — | | $ | (26) | | $ | (2,874) | | $ | (1) | | $ | — | |
| Equity contracts | 8 | | (1) | | (177) | | (126) | | (164) | | 899 | | — | | (23) | |
| Credit contracts | — | | — | | (4) | | — | | — | | 279 | | — | | — | |
| Foreign exchange contracts | 2 | | — | | — | | — | | — | | 105 | | — | | (7) | |
| | | | | | | | |
| | | | | | | | |
| IUL embedded derivatives | — | | — | | — | | 217 | | — | | — | | — | | — | |
| Fixed deferred indexed annuity and deposit receivables embedded derivatives | — | | — | | — | | 4 | | — | | — | | — | | — | |
| Structured variable annuity embedded derivatives | — | | — | | — | | — | | 633 | | — | | — | | — | |
| | | | | | | | |
| Total gain (loss) | $ | 11 | | $ | (1) | | $ | (184) | | $ | 95 | | $ | 443 | | $ | (1,591) | | $ | (1) | | $ | (30) | |
The Company holds derivative instruments that either do not qualify or are not designated for hedge accounting treatment. These derivative instruments are used as economic hedges of equity, interest rate, credit and foreign currency exchange rate risk related to various products and transactions of the Company.
The deferred premium associated with certain of the above options is paid or received semi-annually over the life of the contract or at maturity. The following is a summary of the payments the Company is scheduled to make and receive for these options as of December 31, 2024:
| | | | | | | | | | | |
| | Premiums Payable | | Premiums Receivable |
| | (in millions) |
| 2025 | $ | 119 | | | $ | 20 | |
| 2026 | 246 | | | 88 | |
| 2027 | 19 | | | — | |
| 2028 | 29 | | | — | |
| 2029 | 135 | | | — | |
| 2030-2031 | 234 | | | — | |
| Total | $ | 782 | | | $ | 108 | |
Actual timing and payment amounts may differ due to future settlements, modifications or exercises of the contracts prior to the full premium being paid or received.
Structured variable annuity, IUL and stock market certificate products have returns tied to the performance of equity markets. As a result of fluctuations in equity markets, the obligation incurred by the Company related to structured variable annuity, IUL and stock market certificate products will positively or negatively impact earnings over the life of these products. The equity components of structured variable annuity, IUL and stock market certificate product obligations are considered embedded derivatives, which are bifurcated from their host contracts for valuation purposes and reported on the Consolidated Balance Sheets at fair value with changes in fair value reported in earnings. As a means of economically hedging its obligations under the provisions of these products, the Company enters into interest rate swaps, index options and futures contracts.
As discussed in Note 13, the Company issues variable annuity contracts that provide protection to contractholders from other-than-nominal capital market risk and expose the Company to other-than-nominal capital market risk. The Company economically hedges its obligations under these market risk benefits using options, swaptions, swaps and futures.
The Company enters into futures, credit default swaps, commodity swaps, total return swaps and foreign currency forwards to manage its exposure to price risk arising from seed money investments in proprietary investment products. The Company enters into foreign currency forward contracts to economically hedge its exposure to certain foreign transactions. The Company enters into futures contracts, total return swaps and foreign currency forwards to economically hedge its exposure related to compensation plans. The Company enters into interest rate swaps to offset interest rate changes on unrealized gains or losses for certain investments.
Ameriprise Financial, Inc.
Notes to Consolidated Financial Statements (Continued)
Cash Flow Hedges
The Company has designated derivative instruments as a cash flow hedge for equity exposure of certain compensation-related liabilities and interest rate exposure on forecasted debt interest payments. For derivative instruments that qualify as cash flow hedges, the gains or losses on the derivative instruments are reported in AOCI and reclassified into earnings when the hedged item or transaction impacts earnings. The amount that is reclassified into earnings is presented within the same line item as the earnings impact of the hedged item in Interest and debt expense.
For the years ended December 31, 2024, 2023 and 2022, the amounts reclassified from AOCI to earnings related to cash flow hedges were immaterial. The estimated net amount recorded in AOCI as of December 31, 2024 that the Company expects to reclassify to earnings as a reduction to Interest and debt expense within the next twelve months is $0.8 million. Currently, the longest period of time over which the Company is hedging exposure to the variability in future cash flows is 11 years and relates to forecasted debt interest payments. See Note 21 for a rollforward of net unrealized gains (losses) on derivatives included in AOCI related to cash flow hedges.
Net Investment Hedges
The Company entered into, and designated as net investment hedges in foreign operations, forward contracts to hedge a portion of the Company’s foreign currency exchange rate risk associated with its investment in Threadneedle. As the Company determined that the forward contracts are effective, the change in fair value of the derivatives is recognized in AOCI as part of the foreign currency translation adjustment. For the years ended December 31, 2024, 2023 and 2022 , the Company recognized nil, a loss of $3 million and a gain of $15 million, respectively, in OCI.
Credit Risk
Credit risk associated with the Company’s derivatives is the risk that a derivative counterparty will not perform in accordance with the terms of the applicable derivative contract. To mitigate such risk, the Company has established guidelines and oversight of credit risk through a comprehensive enterprise risk management program that includes members of senior management. Key components of this program are to require preapproval of counterparties and the use of master netting and collateral arrangements whenever practical. See Note 17 for additional information on the Company’s credit exposure related to derivative assets.
Certain of the Company’s derivative contracts contain provisions that adjust the level of collateral the Company is required to post based on the Company’s debt rating (or based on the financial strength of the Company’s life insurance subsidiaries for contracts in which those subsidiaries are the counterparty). Additionally, certain of the Company’s derivative contracts contain provisions that allow the counterparty to terminate the contract if the Company’s debt does not maintain a specific credit rating (generally an investment grade rating) or the Company’s life insurance subsidiaries do not maintain a specific financial strength rating. If these termination provisions were to be triggered, the Company’s counterparty could require immediate settlement of any net liability position. As of December 31, 2024 and 2023, the aggregate fair value of derivative contracts in a net liability position containing such credit contingent provisions was $69 million and $65 million, respectively. The aggregate fair value of assets posted as collateral for such instruments as of December 31, 2024 and 2023 was $68 million and $58 million, respectively. If the credit contingent provisions of derivative contracts in a net liability position as of December 31, 2024 and 2023 were triggered, the aggregate fair value of additional assets that would be required to be posted as collateral or needed to settle the instruments immediately would have been $1 million and $7 million, respectively.
19. Leases
The following table presents the balances for operating and finance ROU assets and lease liabilities:
| | | | | | | | | | | | | | | | | | | | |
| Leases | | Balance Sheet Classification | | December 31, 2024 | | December 31, 2023 |
| | | | (in millions) |
| Assets | | | | | | |
| Operating lease assets | | Other assets | | $ | 246 | | | $ | 259 | |
| Finance lease assets | | Other assets | | 8 | | | 18 | |
| Total lease assets | | | | $ | 254 | | | $ | 277 | |
| | | | | | |
| Liabilities | | | | | | |
| Operating lease liabilities | | Other liabilities | | $ | 313 | | | $ | 325 | |
| Finance lease liabilities | | Long-term debt | | 9 | | | 20 | |
| Total lease liabilities | | | | $ | 322 | | | $ | 345 | |
Ameriprise Financial, Inc.
Notes to Consolidated Financial Statements (Continued)
The following table presents the components of lease cost:
| | | | | | | | | | | | | | | | | | | | | | | | | | |
| | | | Years Ended December 31, |
| Lease Cost | | Income Statement Classification | | 2024 | | 2023 | | 2022 |
| | | | (in millions) |
| Operating lease cost | | General and administrative expense | | $ | 61 | | | $ | 55 | | | $ | 61 | |
| Finance lease cost: | | | | | | | | |
| Amortization of ROU assets | | General and administrative expense | | 10 | | | 10 | | | 10 | |
| Interest on lease liabilities | | Interest and debt expense | | 1 | | | 1 | | | 1 | |
| Total lease cost | | | | $ | 72 | | | $ | 66 | | | $ | 72 | |
The following table presents the weighted-average lease term and weighted-average discount rate related to operating and finance leases:
| | | | | | | | | | | | | | | | | | | | | | | | | | |
| | December 31, 2024 | | December 31, 2023 |
| Lease Term and Discount Rate | | Finance Leases | | Operating Leases | | Finance Leases | | Operating Leases |
| Weighted-average remaining lease term (years) | | 1 | | 6 | | 2 | | 6 |
| Weighted-average discount rate | | 3.4 | % | | 2.9 | % | | 3.4 | % | | 2.7 | % |
The following table presents supplemental cash flow information related to operating and finance leases:
| | | | | | | | | | | | | | | | | | | | |
| | Years Ended December 31, |
| Supplemental Cash Flow Information | | 2024 | | 2023 | | 2022 |
| | (in millions) |
| Operating cash flows: | | | | | | |
| Cash paid for amounts included in measurement of operating lease liabilities | | $ | 69 | | | $ | 68 | | | $ | 65 | |
| Cash paid for amounts included in measurement of finance lease liabilities | | 1 | | | 1 | | | 1 | |
| Financing cash flows: | | | | | | |
| Cash paid for amounts included in measurement of finance lease liabilities | | $ | 11 | | | $ | 10 | | | $ | 10 | |
The following table presents the maturities of lease liabilities: | | | | | | | | | | | | | | |
| Maturity of Lease Liabilities | | December 31, 2024 |
| Finance Leases | | Operating Leases |
| | (in millions) |
| 2025 | | $ | 9 | | | $ | 72 | |
| 2026 | | — | | | 68 | |
| 2027 | | — | | | 56 | |
| 2028 | | — | | | 44 | |
| 2029 | | — | | | 35 | |
| Thereafter | | — | | | 65 | |
| Total lease payments | | 9 | | | 340 | |
| Less: interest | | — | | | 27 | |
| Present value of lease liabilities | | $ | 9 | | | $ | 313 | |
20. Share-Based Compensation
The Company’s share-based compensation plans consist of the Amended and Restated Ameriprise Financial 2005 Incentive Compensation Plan (the “2005 ICP”), the Ameriprise Financial Franchise Advisor Deferred Compensation Plan and the Ameriprise Advisor Group Deferred Compensation Plan.
Ameriprise Financial, Inc.
Notes to Consolidated Financial Statements (Continued)
The components of the Company’s share-based compensation expense, net of forfeitures, were as follows:
| | | | | | | | | | | | | | | | | |
| Years Ended December 31, |
| 2024 | | 2023 | | 2022 |
| (in millions) |
| Stock option | $ | 15 | | | $ | 16 | | | $ | 16 | |
| Restricted stock | 25 | | | 27 | | | 27 | |
| Restricted stock units and deferred share units | 153 | | | 144 | | | 127 | |
| Liability awards | 58 | | | 62 | | | 44 | |
| Total | $ | 251 | | | $ | 249 | | | $ | 214 | |
For the years ended December 31, 2024, 2023 and 2022, total income tax benefit using the statutory rate related to share-based compensation expense was $53 million, $52 million and $45 million, respectively.
As of December 31, 2024, there was $183 million of total unrecognized compensation cost related to non-vested awards under the Company’s share-based compensation plans, which is expected to be recognized over a weighted-average period of 3 years.
Amended and Restated Ameriprise Financial 2005 Incentive Compensation Plan
The 2005 ICP, as amended and restated, was approved by shareholders on April 26, 2023, and provides for the grant of cash and equity incentive awards to directors, employees and independent contractors, including stock options, restricted stock awards, restricted stock units, stock appreciation rights, performance shares and similar awards designed to comply with the applicable federal regulations and laws of jurisdiction. Under the 2005 ICP, as amended and restated a maximum of 58.1 million shares may be issued, of which 14.5 million shares are available to be issued as of December 31, 2024. Of this total, no more than 5.0 million shares may be issued after December 31, 2022 for full value awards, which are awards other than stock options and stock appreciation rights. Shares issued under the 2005 ICP may be authorized and unissued shares or treasury shares.
Ameriprise Financial 2008 Employment Incentive Equity Award Plan
Effective February 23, 2023, the Ameriprise Financial 2008 Employment Incentive Equity Award Plan (the “2008 Plan”), which was designed to grant equity incentive awards to new employees in compliance with applicable federal and foreign regulations, was terminated by the Company. At the time of termination, there were no unvested or unexercised awards outstanding under the 2008 Plan and, as a result of the termination of the plan, no future shares could be granted under the 2008 Plan.
Stock Options
Stock options granted under the 2005 ICP have an exercise price not less than 100% of the current fair market value of a share of the Company’s common stock on the grant date and a maximum term of 10 years. Stock options granted generally vest ratably over three to four years. Vesting of option awards may be accelerated based on age and length of service. Stock options granted are expensed on a straight-line basis over the vesting period based on the fair value of the awards on the date of grant. The grant date fair value of the options is calculated using a Black-Scholes option-pricing model.
The following weighted average assumptions were used for stock option grants:
| | | | | | | | | | | | | | | | | |
| 2024 | | 2023 | | 2022 |
| Dividend yield | 1.8 | % | | 2.0 | % | | 2.0 | % |
| Expected volatility | 31 | % | | 33 | % | | 35 | % |
| Risk-free interest rate | 4.0 | % | | 3.6 | % | | 1.7 | % |
| Expected life of stock option (years) | 5.0 | | 5.0 | | 5.0 |
The dividend yield assumption represents the Company’s expected dividend yield based on its historical dividend payouts and management’s expectations. The expected volatility is based on the Company’s historical and implied volatilities. The risk-free interest rate for periods within the expected option life is based on the U.S. Treasury yield curve at the grant date. The expected life of the option is based on the Company’s past experience and other considerations.
The weighted average grant date fair value for options granted during 2024, 2023 and 2022 was $112.88, $99.86 and $80.48, respectively.
Ameriprise Financial, Inc.
Notes to Consolidated Financial Statements (Continued)
A summary of the Company’s stock option activity for 2024 is presented below (shares and intrinsic value in millions):
| | | | | | | | | | | | | | | | | | | | | | | |
| Shares | | Weighted Average Exercise Price | | Weighted Average Remaining Contractual
Term (Years) | | Aggregate Intrinsic Value |
| Outstanding at January 1 | 2.3 | | | $ | 177.60 | | | 5 | | $ | 457 | |
| Granted | 0.1 | | | 391.40 | | | | | |
| Exercised | (0.8) | | | 153.35 | | | | | |
| | | | | | | |
| Outstanding at December 31 | 1.6 | | | 207.11 | | | 5 | | 515 | |
| Exercisable at December 31 | 1.3 | | | 173.69 | | | 5 | | 464 | |
The intrinsic value of a stock option is the amount by which the fair value of the underlying stock exceeds the exercise price of the option. The total intrinsic value of options exercised was $238 million, $136 million and $130 million during the years ended December 31, 2024, 2023 and 2022, respectively.
Restricted Stock Awards
Restricted stock awards granted under the 2005 ICP generally vest ratably over three to four years or at the end of five years. Compensation expense for restricted stock awards is based on the market price of Ameriprise Financial common stock on the date of grant and is amortized on a straight-line basis over the vesting period. Quarterly dividends are paid on restricted stock, as declared by the Company’s Board of Directors, during the vesting period and are not subject to forfeiture.
Restricted Stock Units and Deferred Share Units
The 2005 ICP provides for the grant of deferred share units to non-employee directors of the Company and for the grant of restricted stock units or deferred share units to employees. The director awards are fully vested upon issuance and are settled for Ameriprise Financial common stock upon the director’s termination of service. The employee awards generally vest ratably over three to four years. Compensation expense for deferred share units and restricted stock units is based on the market price of Ameriprise Financial stock on the date of grant. Restricted stock units and deferred stock units granted to employees are expensed on a straight-line basis over the vesting period or on an accelerated basis if certain age and length of service requirements are met. Deferred share units granted to non-employee directors are expensed immediately. Dividends are paid on restricted stock units, as declared by the Company’s Board of Directors, during the vesting period and are not subject to forfeiture. Dividend equivalents are issued on deferred share units, as dividends are declared by the Company's Board of Directors, and are not paid until distribution of the award. Dividend equivalents on the director awards are not subject to forfeiture, but on employee awards they are forfeited if the award is forfeited.
Ameriprise Financial Deferred Compensation Plan
The Ameriprise Financial Deferred Compensation Plan (“DCP”) under the 2005 ICP gives certain employees the choice to defer a portion of their eligible compensation, which can be invested in investment options as provided by the DCP, including the Ameriprise Financial Stock Fund. The DCP is an unfunded non-qualified deferred compensation plan under section 409A of the Internal Revenue Code. The Company provides a match on certain deferrals. Participant deferrals vest immediately and the Company match vests after three years. Distributions are made in shares of the Company’s common stock for the portion of the deferral invested in the Ameriprise Financial Stock Fund and the Company match, for which the Company has recorded in equity. The DCP does allow for accelerated vesting of the share-based awards in cases of death, disability and qualified retirement. Compensation expense related to the Company match is recognized on a straight-line basis over the vesting period or on an accelerated basis if certain age and length of service requirements are met. Dividend equivalents are issued on deferrals into the Ameriprise Financial Stock Fund and the Company match. Dividend equivalents related to deferrals are not subject to forfeiture, whereas dividend equivalents related to the Company match are subject to forfeiture until fully vested.
Ameriprise Financial Franchise Advisor Deferred Compensation Plan
The Franchise Advisor Deferred Compensation Plan (the “AFG Deferral Plan”) is an unfunded, non-qualified deferred compensation plan that provides benefits to certain advisors and leaders associated with the Company. The AFG Deferral Plan has not been approved by the Company’s shareholders, and it is a value-neutral plan (as that term is used by proxy advisory firms) and there will be no additional premium or matching contributions. Under the AFG Deferral Plan, a maximum of 12.5 million Company shares may be issued, of which 10.1 million shares have been issued since inception.
The AFG Deferral Plan allows participants to voluntarily defer a portion of their cash commissions and elect crediting rate alternatives that includes a fund based on Ameriprise Financial stock or other investment options in lieu of receiving the applicable cash compensation. Amounts a participant chooses to invest in the fund tracking Ameriprise Financial stock will be settled in Ameriprise Financial shares; all voluntary deferrals invested in other investment options will be settled in cash. From 2006-2010, the Company provided advisors with a matching contribution with respect to these voluntary deferred amounts; however, the Company has not provided a match since 2010 and has amended the AFG Deferral Plan to remove any matching contributions. There are approximately 104,000 shares outstanding under this prior matching contribution. Other than this historical matching contribution, the Company does not provide any additional premium in connection with the deferred compensation.
Ameriprise Financial, Inc.
Notes to Consolidated Financial Statements (Continued)
In addition to the voluntary deferral of cash commissions, certain participants are eligible to earn amounts in recognition of certain performance achievements that vest ratably over three or four years. When earned, award amounts are credited to a participant’s account and receive a crediting rate based on Ameriprise Financial stock, and a participant elects (when an award is granted) whether to receive payout of these awards in cash or stock. The Company does not provide any additional premium or matching contribution in connection with the deferred compensation. Share units receive dividend equivalents, as dividends are declared by the Company’s Board of Directors, until distribution and are subject to forfeiture until vested.
Ameriprise Advisor Group Deferred Compensation Plan
The Advisor Group Deferred Compensation Plan (the “AAG Deferral Plan”) was established in 2009 as an unfunded, non-qualified deferred compensation plan that provides benefits to certain employee advisors and field leaders of the Company. The AAG Deferral Plan was not approved by the Company’s shareholders and is considered a value-neutral plan (as that term is used by proxy advisory firms) and there will be no additional premium or matching contributions. Under the AAG Deferral Plan, a maximum of 3.0 million Company shares may be issued, of which 1.2 million shares have been issued since inception.
The AAG Deferral Plan allows eligible employees to voluntarily defer a portion of their base salary, bonus and/or commissions and elect crediting rate alternatives that include a fund based on Ameriprise Financial stock or other investment options in lieu of receiving the applicable cash compensation. Such deferrals are fully vested and not subject to future service requirements or forfeitures and the Company does not provide any additional premium or matching contribution in connection with the deferred compensation. Amounts a participant chooses to invest in the fund tracking Ameriprise Financial stock will be settled in Ameriprise Financial shares; all voluntary deferrals invested in other investment options will be settled in cash.
In addition to the voluntary deferral component, participants may earn amounts in recognition of certain performance achievements. These amounts receive a crediting rate based on Ameriprise Financial stock or other investment options, at the participant’s election where applicable. For amounts allocated in the fund that tracks the performance of Ameriprise Financial stock, a participant elects (when an award is granted) whether to receive payout of these awards in cash or Ameriprise Financial shares. For amounts allocated to other options, the participant receives payout in cash. These award types are subject to future service requirements and forfeitures, and the Company does not provide any additional premium or matching contribution in connection with the deferred compensation. Share units receive dividend equivalents, as dividends are declared by the Company’s Board of Directors, until distribution and are subject to forfeiture until vested.
Full Value Share Award Activity
A summary of activity for the Company’s restricted stock awards, restricted stock units granted to employees (including advisors), compensation and commission deferrals into stock and deferred share units for 2024 is presented below (shares in millions):
| | | | | | | | | | | |
| Shares | | Weighted Average Grant-date
Fair Value |
| Non-vested shares at January 1 | 1.3 | | | $ | 250.16 | |
| Granted | 0.3 | | | 405.99 | |
| Deferred | 0.1 | | | 447.19 | |
| Vested | (0.6) | | | 283.08 | |
| Forfeited | — | | | 321.45 | |
| Non-vested shares at December 31 | 1.1 | | | 295.92 | |
The deferred shares in the table above primarily relate to franchise advisor voluntary deferrals of their commissions into Ameriprise Financial stock under the Franchise Advisor Deferral Plan that are fully vested at the deferral date.
The fair value of full value share awards vested during the years ended December 31, 2024, 2023 and 2022 was $263 million, $197 million and $191 million, respectively.
The weighted average grant date fair value for restricted shares, restricted stock units and deferred share units during 2024, 2023 and 2022 was $395.66, $342.66 and $296.50, respectively. The weighted average grant date fair value for franchise advisor and advisor group deferrals during 2024, 2023 and 2022 was $428.36, $336.62 and $280.49, respectively.
Performance Share Units
Under the 2005 ICP, the Company’s Executive Leadership Team may be awarded a target number of performance share units (“PSUs”). PSUs will be earned only to the extent that the Company attains certain goals relating to the Company’s performance and relative total shareholder returns against peers over a three-year period. The awards also have a three-year service condition with cliff vesting with an accelerated service condition based on age and length of service. The actual number of PSUs ultimately earned could vary from zero, if performance goals are not met, to as much as 175% of the target for awards made in 2018 or later, if performance goals are significantly exceeded. The value of each target PSU is equal to the value of one share of Ameriprise Financial common stock. The total number of target PSUs outstanding at the end of December 31, 2024, 2023 and 2022 was 0.1 million, 0.2 million and
Ameriprise Financial, Inc.
Notes to Consolidated Financial Statements (Continued)
0.3 million, respectively. The PSUs are liability awards. During the years ended December 31, 2024, 2023 and 2022, the value of shares settled for PSU awards was $63 million, $68 million and $85 million, respectively.
21. Shareholders’ Equity
The following tables present the amounts related to each component of OCI:
| | | | | | | | | | | | | | | | | |
| Year Ended December 31, 2024 |
| Pretax | | Income Tax Benefit (Expense) | | Net of Tax |
| (in millions) |
| Net unrealized gains (losses) on securities: | | | | | |
Net unrealized gains (losses) on securities arising during the period (1) | $ | (303) | | | $ | 61 | | | $ | (242) | |
Reclassification of net (gains) losses on securities included in net income (2) | 19 | | | (4) | | | 15 | |
| Impact of benefit reserves and reinsurance recoverables | 20 | | | (4) | | | 16 | |
| Net unrealized gains (losses) on securities | (264) | | | 53 | | | (211) | |
| Net unrealized gains (losses) on derivatives: | | | | | |
| | | | | |
Reclassification of net (gains) losses on derivatives included in net income (3) | (1) | | | 1 | | | — | |
| Net unrealized gains (losses) on derivatives | (1) | | | 1 | | | — | |
| Effect of changes in discount rate assumptions on certain long-duration contracts | 194 | | | (41) | | | 153 | |
| Effect of changes in instrument-specific credit risk on market risk benefits (“MRBs”) | (79) | | | 17 | | | (62) | |
| Defined benefit plans: | | | | | |
| Prior service credits (costs) | (2) | | | 1 | | | (1) | |
| Net gains (losses) | 19 | | | (3) | | | 16 | |
| Defined benefit plans | 17 | | | (2) | | | 15 | |
| Foreign currency translation | (37) | | | — | | | (37) | |
| | | | | |
| Total other comprehensive income (loss) | $ | (170) | | | $ | 28 | | | $ | (142) | |
| | | | | | | | | | | | | | | | | |
| Year Ended December 31, 2023 |
| Pretax | | Income Tax Benefit (Expense) | | Net of Tax |
| (in millions) |
| Net unrealized gains (losses) on securities: | | | | | |
Net unrealized gains (losses) on securities arising during the period (1) | $ | 1,038 | | | $ | (240) | | | $ | 798 | |
Reclassification of net (gains) losses on securities included in net income (2) | 29 | | | (6) | | | 23 | |
| Impact of benefit reserves and reinsurance recoverables | (24) | | | 5 | | | (19) | |
| Net unrealized gains (losses) on securities | 1,043 | | | (241) | | | 802 | |
| Net unrealized gains (losses) on derivatives: | | | | | |
| Net unrealized gains (losses) on derivatives arising during the period | 3 | | | (1) | | | 2 | |
Reclassification of net (gains) losses on derivatives included in net income (3) | (1) | | | 1 | | | — | |
| Net unrealized gains (losses) on derivatives | 2 | | | — | | | 2 | |
| Effect of changes in discount rate assumptions on certain long-duration contracts | (69) | | | 15 | | | (54) | |
| Effect of changes in instrument-specific credit risk on MRBs | (83) | | | 18 | | | (65) | |
| Defined benefit plans: | | | | | |
| Prior service credits (costs) | (1) | | | — | | | (1) | |
| Net gains (losses) | 20 | | | (4) | | | 16 | |
| Defined benefit plans | 19 | | | (4) | | | 15 | |
| Foreign currency translation | 79 | | | 1 | | | 80 | |
| | | | | |
| Total other comprehensive income (loss) | $ | 991 | | | $ | (211) | | | $ | 780 | |
Ameriprise Financial, Inc.
Notes to Consolidated Financial Statements (Continued)
| | | | | | | | | | | | | | | | | |
| Year Ended December 31, 2022 |
| Pretax | | Income Tax Benefit (Expense) | | Net of Tax |
| (in millions) |
| Net unrealized gains (losses) on securities: | | | | | |
Net unrealized gains (losses) on securities arising during the period (1) | $ | (4,146) | | | $ | 918 | | | $ | (3,228) | |
Reclassification of net (gains) losses on securities included in net income (2) | 85 | | | (18) | | | 67 | |
| Impact of benefit reserves and reinsurance recoverables | 103 | | | (18) | | | 85 | |
| Net unrealized gains (losses) on securities | (3,958) | | | 882 | | | (3,076) | |
| Net unrealized gains (losses) on derivatives: | | | | | |
| | | | | |
Reclassification of net (gains) losses on derivatives included in net income (3) | (1) | | | — | | | (1) | |
| Net unrealized gains (losses) on derivatives | (1) | | | — | | | (1) | |
| Effect of changes in discount rate assumptions on certain long-duration contracts | 1,095 | | | (234) | | | 861 | |
| Effect of changes in instrument-specific credit risk on MRBs | 517 | | | (110) | | | 407 | |
| Defined benefit plans: | | | | | |
| Prior service credits (costs) | (1) | | | — | | | (1) | |
| Net gains (losses) | 97 | | | (20) | | | 77 | |
| Defined benefit plans | 96 | | | (20) | | | 76 | |
| Foreign currency translation | (216) | | | 45 | | | (171) | |
| | | | | |
| Total other comprehensive income (loss) | $ | (2,467) | | | $ | 563 | | | $ | (1,904) | |
(1) Includes impairments on Available-for-Sale securities related to factors other than credit that were recognized in OCI during the period.
(2) Reclassification amounts are recorded in Net investment income.
(3) Reclassification amounts are recorded in Interest and debt expense.
Other comprehensive income (loss) related to net unrealized gains (losses) on securities includes three components: (i) unrealized gains (losses) that arose from changes in the market value of securities that were held during the period; (ii) (gains) losses that were previously unrealized, but have been recognized in current period net income due to sales of Available-for-Sale securities and due to the reclassification of noncredit losses to credit losses; and (iii) other adjustments primarily consisting of changes in insurance and annuity asset and liability balances, such as benefit reserves and reinsurance recoverables, to reflect the expected impact on their carrying values had the unrealized gains (losses) been realized as of the respective balance sheet dates.
Ameriprise Financial, Inc.
Notes to Consolidated Financial Statements (Continued)
The following table presents the changes in the balances of each component of AOCI, net of tax:
| | | | | | | | | | | | | | | | | | | | | | | | | | | | | | | | | | | | | | | | | | | | | | | |
| Net Unrealized Gains (Losses) on Securities | | Net Unrealized Gains (Losses) on Derivatives | | Effect of Changes in Discount Rate Assumptions | | Effect of Changes in Instrument-Specific Credit Risk on MRBs | | Defined Benefit Plans | | Foreign Currency Translation | | Other | | Total |
| (in millions) |
| Balance at January 1, 2022 | $ | 1,033 | | | $ | 4 | | | $ | (933) | | | $ | (427) | | | $ | (151) | | | $ | (167) | | | $ | (1) | | | $ | (642) | |
| | | | | | | | | | | | | | | |
| OCI before reclassifications | (3,143) | | | — | | | 861 | | | 407 | | | 61 | | | (171) | | | — | | | (1,985) | |
| Amounts reclassified from AOCI | 67 | | | (1) | | | — | | | — | | | 15 | | | — | | | — | | | 81 | |
| Total OCI | (3,076) | | | (1) | | | 861 | | | 407 | | | 76 | | | (171) | | | — | | | (1,904) | |
| Balance at December 31, 2022 | (2,043) | | | 3 | | | (72) | | | (20) | | | (75) | | | (338) | | | (1) | | | (2,546) | |
| | | | | | | | | | | | | | | |
| OCI before reclassifications | 779 | | | 2 | | | (54) | | | (65) | | | 14 | | | 80 | | | — | | | 756 | |
| Amounts reclassified from AOCI | 23 | | | — | | | — | | | — | | | 1 | | | — | | | — | | | 24 | |
| Total OCI | 802 | | | 2 | | | (54) | | | (65) | | | 15 | | | 80 | | | — | | | 780 | |
| Balance at December 31, 2023 | (1,241) | | | 5 | | | (126) | | | (85) | | | (60) | | | (258) | | | (1) | | | (1,766) | |
| | | | | | | | | | | | | | | |
| OCI before reclassifications | (226) | | | — | | | 153 | | | (62) | | | 15 | | | (37) | | | — | | | (157) | |
| Amounts reclassified from AOCI | 15 | | | — | | | — | | | — | | | — | | | — | | | — | | | 15 | |
| Total OCI | (211) | | | — | | | 153 | | | (62) | | | 15 | | | (37) | | | — | | | (142) | |
| Balance at December 31, 2024 | $ | (1,452) | | | $ | 5 | | | $ | 27 | | | $ | (147) | | | $ | (45) | | | $ | (295) | | | $ | (1) | | | $ | (1,908) | |
For the years ended December 31, 2024, 2023 and 2022, the Company repurchased a total of 4.9 million shares, 5.9 million shares and 6.6 million shares, respectively, of its common stock for an aggregate cost of $2.2 billion, $2.0 billion and $1.9 billion, respectively. In July 2023, the Company’s Board of Directors authorized an additional $3.5 billion for the repurchase of the Company’s common stock through September 30, 2025. As of December 31, 2024, the Company had $888 million remaining under this share repurchase authorization.
The Company may also reacquire shares of its common stock under its share-based compensation plans related to restricted stock awards and certain option exercises. The holders of restricted shares may elect to surrender a portion of their shares on the vesting date to cover their income tax obligation. These vested restricted shares are reacquired by the Company and the Company’s payment of the holders’ income tax obligations are recorded as a treasury share purchase.
For the years ended December 31, 2024, 2023 and 2022, the Company reacquired 0.3 million shares, 0.3 million shares and 0.3 million shares, respectively, of its common stock through the surrender of shares upon vesting and paid in the aggregate $115 million, $99 million and $99 million, respectively, related to the holders’ income tax obligations on the vesting date. Option holders may elect to net settle their vested awards resulting in the surrender of the number of shares required to cover the strike price and tax obligation of the options exercised. These shares are reacquired by the Company and recorded as treasury shares. For the years ended December 31, 2024, 2023 and 2022, the Company reacquired 0.5 million shares, 0.4 million shares and 0.5 million shares, respectively, of its common stock through the net settlement of options for an aggregate value of $220 million, $150 million and $145 million, respectively.
For the years ended December 31, 2024, 2023 and 2022, the Company reissued 0.8 million, 0.6 million and 0.8 million, respectively, treasury shares for restricted stock award grants, performance share units, and issuance of shares vested under advisor deferred compensation plans.
Ameriprise Financial, Inc.
Notes to Consolidated Financial Statements (Continued)
22. Earnings per Share
The computations of basic and diluted earnings per share were as follows:
| | | | | | | | | | | | | | | | | |
| | Years Ended December 31, |
| 2024 | | 2023 | | 2022 |
| (in millions, except per share amounts) |
| Numerator: | | | | | |
| Net income | $ | 3,401 | | | $ | 2,556 | | | $ | 3,149 | |
| | | | | |
| Denominator: | | | | | |
| Basic: Weighted-average common shares outstanding | 101.0 | | | 105.7 | | | 111.3 | |
| Effect of potentially dilutive nonqualified stock options and other share-based awards | 1.9 | | | 2.1 | | | 2.4 | |
| Diluted: Weighted-average common shares outstanding | 102.9 | | | 107.8 | | | 113.7 | |
| | | | | |
| Earnings per share attributable to Ameriprise Financial, Inc. common shareholders: | | | | | |
| Basic | $ | 33.67 | | | $ | 24.18 | | | $ | 28.29 | |
| Diluted | $ | 33.05 | | | $ | 23.71 | | | $ | 27.70 | |
The calculation of diluted earnings per share includes the dilutive effect of the assumed exercise or issuance of stock-based awards using the treasury stock method. The calculation excludes the incremental effect of nil, 0.2 million and 0.2 million options for the years ended December 31, 2024, 2023 and 2022, respectively, due to their anti-dilutive effect.
23. Regulatory Requirements
In October 2023, the Federal Reserve Board (“FRB”) issued its final rule establishing a consolidated capital framework termed the “Building Block Approach” (“BBA”) for savings and loan holding companies like Ameriprise Financial that are significantly engaged in insurance activities. The BBA is designed to adjust and aggregate existing legal entity available capital and capital requirements after translating the capital positions, if necessary, into terms of the National Association of Insurance Commissioners (“NAIC”) Risk-Based Capital (“RBC”) framework. The ratio of the amount of available capital to the capital requirement amount is referred to as the BBA ratio and is subject to a 250% minimum, effective January 1, 2024. An additional capital conservation buffer of 150% will be effective as of December 31, 2025, for a total capital requirement of at least 400%.
The BBA available capital, BBA capital requirement, and BBA ratio as of December 31, 2024 are as follows:
| | | | | | |
| (in millions, except percentages) | |
| BBA available capital | $ | 3,833 | | |
| BBA capital requirement | 392 | | |
| BBA ratio | 978 | % | |
Subsidiary regulatory requirements
Restrictions on the transfer of funds exist under regulatory requirements applicable to certain of the Company’s operating subsidiaries.
Insurance subsidiaries
The NAIC defines RBC requirements for insurance companies. The RBC requirements are used by the NAIC and state insurance regulators to identify companies that merit regulatory actions designed to protect policyholders. These requirements apply to the Company’s life insurance companies. The Company’s life insurance companies each met their respective minimum RBC requirements.
The Company’s life insurance companies are required to prepare statutory financial statements in accordance with the accounting practices prescribed or permitted by the insurance departments of their respective states of domicile, which vary materially from GAAP. Prescribed statutory accounting practices include publications of the NAIC, as well as state laws, regulations and general administrative rules. The more significant differences from GAAP include charging policy acquisition costs to expense as incurred, establishing annuity and insurance reserves using different actuarial methods and assumptions, valuing investments on a different basis and excluding certain assets from the balance sheet by charging them directly to surplus, such as a portion of the net deferred income tax assets.
State insurance statutes contain limitations as to the amount of dividends that insurers may make without providing prior notification to state regulators. For RiverSource Life, payments in excess of unassigned surplus, as determined in accordance with accounting practices prescribed by the State of Minnesota, require advance notice to the Minnesota Department of Commerce (“MN DOC”), RiverSource Life’s primary regulator, and are subject to potential disapproval. RiverSource Life’s statutory unassigned deficit was
Ameriprise Financial, Inc.
Notes to Consolidated Financial Statements (Continued)
$736 million and $582 million as of December 31, 2024 and 2023, respectively.
In addition, dividends whose fair market value, together with that of other dividends made within the preceding 12 months, exceed the greater of the previous year’s statutory net gain from operations or 10% of the previous year-end statutory capital and surplus are referred to as “extraordinary dividends.” Extraordinary dividends also require advance notice to the MN DOC, and are subject to potential disapproval. Statutory capital and surplus for RiverSource Life was $2.7 billion and $3.1 billion as of December 31, 2024 and 2023, respectively.
Statutory net gain from operations and net income are summarized as follows:
| | | | | | | | | | | | | | | | | |
| Years Ended December 31, |
| 2024 | | 2023 | | 2022 |
| (in millions) |
| RiverSource Life | | | | | |
| Statutory net gain from operations | $ | 1,097 | | | $ | 1,331 | | | $ | 1,615 | |
| Statutory net income (loss) | (91) | | | 845 | | | 1,769 | |
Government debt securities of $4 million as of both December 31, 2024 and 2023 held by the Company’s life insurance subsidiaries were on deposit with various states as required by law.
Broker-dealer subsidiaries
The Company’s broker-dealer subsidiaries are subject to the Uniform Net Capital Rule (Rule 15c3-1) under the Securities Exchange Act of 1934. Rule 15c3-1 provides an “alternative net capital requirement” which AEIS and Ameriprise Financial Services, LLC (“AFS”) (significant broker dealers) have elected. Regulations require that minimum net capital, as defined, be equal to the greater of $250 thousand or 2% of aggregate debit items arising from client balances. Financial Industry Regulatory Authority (“FINRA”) may impose certain restrictions, such as restricting withdrawals of equity capital, if a member firm were to fall below a certain threshold or fail to meet minimum net capital requirements.
The following table presents the net capital position of both AEIS and AFS:
| | | | | | | | | | | |
| December 31, |
| 2024 | | 2023 |
| (in millions, except percentages) |
| AEIS | | | |
| Net capital as a percent of aggregate debit items | 9.49 | % | | 11.62 | % |
| | | |
| Net capital | $ | 141 | | | $ | 171 | |
| Less: required net capital | 30 | | | 29 | |
| Excess net capital | $ | 111 | | | $ | 142 | |
| | | |
| AFS | | | |
| Net capital | $ | 113 | | | $ | 101 | |
| Less: required net capital | — | | | — | |
| Excess net capital | $ | 113 | | | $ | 101 | |
Bank subsidiary
Ameriprise Bank is subject to regulation by the Office of the Comptroller of the Currency (“OCC”) and the Federal Deposit Insurance Corporation (“FDIC”) in its role as insurer of its deposits. Ameriprise Bank is required to maintain minimum amounts and ratios of Total and Tier 1 capital (as defined in the regulations) to risk-weighted assets (as defined), Tier 1 Capital to average assets (as defined), and under rules defined under the Basel III capital framework, Common equity Tier 1 capital (“CEIT”) to risk-weighted assets. Ameriprise Bank calculates these ratios under the Basel III standardized approach in order to assess compliance with both regulatory requirements and Ameriprise Bank’s internal capital policies. As permitted under the rules of the Basel III capital framework, Ameriprise Bank has elected to exclude AOCI from its calculation of regulatory capital. Ameriprise Bank’s requirements to maintain adequate capital ratios in relation to its risk-weighted asset levels could affect its ability to take capital actions, such as the payment of dividends. As of December 31, 2024, Ameriprise Bank’s capital levels exceeded the capital conservation buffer requirement and was categorized as “well-capitalized.”
Ameriprise Financial, Inc.
Notes to Consolidated Financial Statements (Continued)
To meet requirements for capital adequacy purposes or to be categorized as “well-capitalized,”Ameriprise Bank must maintain minimum CEIT, Tier 1 capital, Total capital and Tier 1 leverage amounts and ratios as set forth in the following table:
| | | | | | | | | | | | | | | | | | | | | | | | | | | | | | | | | | | | | | |
| Regulatory Capital | |
Actual | | Requirement
for capital
adequacy purposes | | To be well
capitalized under
regulatory provisions |
| Amount | | Ratio | | Amount | | Ratio | | Amount | | Ratio |
| | (in millions, except percentages) |
| At December 31, 2024 | | | | | | | | | | | | |
| Common equity Tier 1 capital | | $ | 1,763 | | | 33.88 | % | | $ | 234 | | | 4.50 | % | | $ | 338 | | | 6.50 | % |
| Tier 1 capital | | 1,763 | | | 33.88 | | | 312 | | | 6.00 | | | 416 | | | 8.00 | |
| Total capital | | 1,772 | | | 34.06 | | | 416 | | | 8.00 | | | 520 | | | 10.00 | |
| Tier 1 leverage | | 1,763 | | | 7.35 | | | 959 | | | 4.00 | | | 1,199 | | | 5.00 | |
| | | | | | | | | | | | |
| At December 31, 2023 | | | | | | | | | | | | |
| Common equity Tier 1 capital | | $ | 1,715 | | | 31.72 | % | | $ | 243 | | | 4.50 | % | | $ | 351 | | | 6.50 | % |
| Tier 1 capital | | 1,715 | | | 31.72 | | | 324 | | | 6.00 | | | 433 | | | 8.00 | |
| Total capital | | 1,724 | | | 31.89 | | | 433 | | | 8.00 | | | 541 | | | 10.00 | |
| Tier 1 leverage | | 1,715 | | | 7.44 | | | 922 | | | 4.00 | | | 1,153 | | | 5.00 | |
Asset manager subsidiaries
Actual capital and the regulatory capital requirement for TAM UK International Holdings Ltd. and Columbia Threadneedle Investments UK International Ltd. are calculated and reported as a single consolidated group under TAM UK International Holdings Ltd. Required capital for these entities is predominantly based on the requirements specified by its regulator, the Financial Conduct Authority (“FCA”), under its Capital Adequacy Requirements for investment firms. Required capital reflects 110% of the Own Funds Threshold Requirement (“OFTR”) and is determined by the group through its ongoing Internal Capital Adequacy and Risk Assessment (“ICARA”) process.
Actual capital and regulatory required capital determined in accordance with U.K. regulatory legislation are as follows:
| | | | | | | | | | | |
| December 31, |
| 2024 | | 2023 |
| (in millions) |
| Actual capital | $ | 692 | | | $ | 706 | |
| Required capital | 265 | | | 317 | |
Other subsidiaries
Ameriprise Certificate Company (“ACC”) is registered as an investment company under the Investment Company Act of 1940 (the “1940 Act”). ACC markets and sells investment certificates to clients. ACC is subject to various capital requirements under the 1940 Act, laws of the State of Minnesota and understandings with the Securities and Exchange Commission (“SEC”) and the MN DOC. The terms of the investment certificates issued by ACC and the provisions of the 1940 Act also require the maintenance by ACC of qualified assets. Under the provisions of its certificates and the 1940 Act, ACC was required to have qualified assets (as that term is defined in Section 28(b) of the 1940 Act) in the amount of $11.2 billion and $13.5 billion as of December 31, 2024 and 2023, respectively. ACC had qualified assets of $11.9 billion and $14.3 billion as of December 31, 2024 and 2023, respectively.
Ameriprise Trust Company is subject to capital adequacy requirements under the laws of the State of Minnesota as enforced by the MN DOC.
Ameriprise Financial, Inc.
Notes to Consolidated Financial Statements (Continued)
24. Income Taxes
The components of income tax provision attributable to continuing operations were as follows:
| | | | | | | | | | | | | | | | | |
| Years Ended December 31, |
| 2024 | | 2023 | | 2022 |
| (in millions) |
| Current income tax | | | | | |
| Federal | $ | 583 | | | $ | 518 | | | $ | 509 | |
| State and local | 137 | | | 124 | | | 93 | |
| Foreign | 21 | | | 18 | | | 25 | |
| Total current income tax | 741 | | | 660 | | | 627 | |
| Deferred income tax | | | | | |
| Federal | 164 | | | 45 | | | 155 | |
| State and local | (29) | | | (14) | | | 6 | |
| Foreign | (10) | | | (13) | | | (6) | |
| Total deferred income tax | 125 | | | 18 | | | 155 | |
| Total income tax provision | $ | 866 | | | $ | 678 | | | $ | 782 | |
The geographic sources of pretax income from continuing operations were as follows:
| | | | | | | | | | | | | | | | | |
| Years Ended December 31, |
| 2024 | | 2023 | | 2022 |
| (in millions) |
| United States | $ | 4,221 | | | $ | 3,199 | | | $ | 3,824 | |
| Foreign | 46 | | | 35 | | | 107 | |
| Total | $ | 4,267 | | | $ | 3,234 | | | $ | 3,931 | |
The principal reasons that the aggregate income tax provision attributable to continuing operations is different from that computed by using the U.S. statutory rate of 21% were as follows:
| | | | | | | | | | | | | | | | | |
| Years Ended December 31, |
| 2024 | | 2023 | | 2022 |
| Tax at U.S. statutory rate | 21.0 | % | | 21.0 | % | | 21.0 | % |
| Changes in taxes resulting from: | | | | | |
| State taxes, net of federal benefit | 2.0 | | | 2.7 | | | 2.0 | |
| Incentive compensation | (1.6) | | | (1.5) | | | (1.0) | |
| Low income housing tax credits | (0.6) | | | (1.0) | | | (1.1) | |
| Non-deductible expenses | 0.5 | | | 1.1 | | | 0.5 | |
| | | | | |
| | | | | |
| | | | | |
| | | | | |
| | | | | |
| | | | | |
| Other, net | (1.0) | | | (1.3) | | | (1.5) | |
| Income tax provision | 20.3 | % | | 21.0 | % | | 19.9 | % |
The decrease in the Company’s effective tax rate for the year ended December 31, 2024 compared to 2023 does not contain any significant changes in effective tax rate reconciling items. The increase in the Company’s effective tax rate for the year ended December 31, 2023 compared to 2022 is primarily the result of an increase in state taxes, net of federal benefit, partially offset by incentive compensation and various other adjustments.
Ameriprise Financial, Inc.
Notes to Consolidated Financial Statements (Continued)
Deferred income tax assets and liabilities result from temporary differences between the assets and liabilities measured for GAAP reporting versus income tax return purposes. Deferred income tax assets and liabilities are measured at the statutory rate of 21% as of both December 31, 2024 and 2023. The significant components of the Company’s deferred income tax assets and liabilities, which are included net within Other assets or Other liabilities, were as follows:
| | | | | | | | | | | |
| December 31, |
| 2024 | | 2023 |
| (in millions) |
| Deferred income tax assets |
| Insurance and annuity benefits including corresponding hedges | $ | 802 | | | $ | 1,244 | |
| Deferred compensation including corresponding hedges | 655 | | | 545 | |
| Investments including net unrealized on Available-for-Sale securities | 381 | | | 335 | |
| | | |
| | | |
| | | |
| Net operating loss and tax credit carryforward | 221 | | | 74 | |
| Other | 159 | | | 127 | |
| Gross deferred income tax assets | 2,218 | | | 2,325 | |
| Less: valuation allowance | 67 | | | 65 | |
| Total deferred income tax assets | 2,151 | | | 2,260 | |
| | | |
| Deferred income tax liabilities | | | |
| | | |
| Deferred acquisition costs | 364 | | | 390 | |
| | | |
| Goodwill and intangibles | 323 | | | 313 | |
| | | |
| | | |
| | | |
| | | |
| Other | 137 | | | 131 | |
| Gross deferred income tax liabilities | 824 | | | 834 | |
| Net deferred income tax assets | $ | 1,327 | | | $ | 1,426 | |
Included in the Company’s deferred income tax assets are tax benefits related to foreign net operating losses of $52 million, which do not expire, CAMT credit carryforwards of $131 million, which do not expire, and state net operating losses of $38 million, net of federal benefit, which will expire beginning December 31, 2025. Based on analysis of the Company’s tax position as of December 31, 2024, management believes it is more likely than not that the Company will not realize certain state net operating losses of $32 million, state deferred tax assets of $2 million (both net of federal benefit), and foreign net operating losses of $33 million; therefore, a valuation allowance of $67 million has been established.
A reconciliation of the beginning and ending amount of gross unrecognized tax benefits was as follows:
| | | | | | | | | | | | | | | | | |
| 2024 | | 2023 | | 2022 |
| (in millions) |
| Balance at January 1 | $ | 150 | | | $ | 138 | | | $ | 125 | |
| Additions for tax positions related to the current year | 22 | | | 26 | | | 12 | |
| Reductions for tax positions related to the current year | (2) | | | (3) | | | (1) | |
| Additions for tax positions of prior years | 23 | | | 80 | | | 5 | |
| Reductions for tax positions of prior years | (8) | | | (85) | | | (1) | |
| Reductions due to lapse of statutes of limitations | (20) | | | (5) | | | — | |
| Audit settlements | (1) | | | (1) | | | (2) | |
| Balance at December 31 | $ | 164 | | | $ | 150 | | | $ | 138 | |
If recognized, approximately $134 million, $120 million and $106 million, net of federal tax benefits, of unrecognized tax benefits as of December 31, 2024, 2023 and 2022, respectively, would affect the effective tax rate.
It is reasonably possible that the total amount of unrecognized tax benefits will change in the next 12 months. The Company estimates that the total amount of gross unrecognized tax benefits may decrease by approximately $16 million in the next 12 months primarily due to expected exam closures and state statutes of limitations expirations.
The Company recognizes interest and penalties related to unrecognized tax benefits as a component of the income tax provision. The Company recognized a net increase of $5 million, $12 million and $4 million in interest and penalties for the years ended December 31, 2024, 2023 and 2022, respectively. As of December 31, 2024 and 2023, the Company had a payable of $31 million and $26 million, respectively, related to accrued interest and penalties.
The Company or one or more of its subsidiaries files income tax returns in the U.S. federal jurisdiction and various state and foreign jurisdictions. The Internal Revenue Service (“IRS”) is currently auditing the Company’s U.S. income tax returns for 2019 and 2020.
Ameriprise Financial, Inc.
Notes to Consolidated Financial Statements (Continued)
The Company’s state income tax returns are currently under examination by various jurisdictions for years ranging from 2017 through 2023.
The Company is an applicable corporation required to compute CAMT. As of December 31, 2024 and 2023, the Company recorded an estimate of $131 million and nil, respectively, for the current provision of the CAMT. The provision was offset with a deferred tax asset for the CAMT credit carryover, which does not expire, resulting in no impact to the total tax provision. The estimate is based on interpretations and assumptions of available guidance the Company has made regarding the CAMT provisions of the Inflation Reduction Act of 2022. The U.S. Department of the Treasury issued proposed CAMT regulations in the third quarter of 2024. The proposed regulations are subject to public review and comment prior to finalizing. The Company is evaluating the potential impact of the proposed regulations.
In December 2021, the Organization for Economic Co-operation and Development published the Pillar Two model rules which introduce new taxing mechanisms aimed at ensuring multinational enterprises pay a minimum level of tax on profits from each jurisdiction in which they operate. Various jurisdictions that the Company operates in have enacted or substantively enacted legislation that became effective beginning January 1, 2024. The Company intends to rely on Pillar Two transitional safe harbors where available and, based on its current estimate, the tax impact is not material to the consolidated financial statements. The Company continues to monitor the adoption and implementation of these rules and evaluate the potential impact on its consolidated financial statements.
25. Retirement Plans and Profit Sharing Arrangements
Defined Benefit Plans
Pension Plans and Other Postretirement Benefits
The Company’s U.S. non-advisor employees who were hired prior to April of 2019 are generally eligible for the Ameriprise Financial Retirement Plan (the “Retirement Plan”), a noncontributory defined benefit plan which is a qualified plan under the Employee Retirement Income Security Act of 1974, as amended (“ERISA”). However, effective April 2020, the Company no longer enrolls new employees in the Retirement Plan. Funding of costs for the Retirement Plan complies with the applicable minimum funding requirements specified by ERISA and is held in a trust. The Retirement Plan is a cash balance plan by which the employees’ accrued benefits are based on notional account balances, which are maintained for each individual. Each pay period these balances are credited with an amount equal to a percentage of eligible compensation as defined by the Retirement Plan (which includes, but is not limited to, base pay, performance based incentive pay, commissions, shift differential and overtime). The percentage ranges from 2.5% to 10% depending on several factors including years of service as of April 2020 and will no longer increase with more years of service. Employees’ balances are also credited with a fixed rate of interest that is updated each January 1 and is based on the average of the daily five-year U.S. Treasury Note yields for the previous October 1 through November 30, with a minimum crediting rate of 5% and maximum crediting rate of 10%. Employees are fully vested after 3 years of service or upon retirement at or after age 65, disability or death while employed. Employees have the option to receive annuity payments or a lump sum payout of vested balance after termination or retirement.
In addition, the Company sponsors the Ameriprise Financial Supplemental Retirement Plan (the “SRP”), an unfunded non-qualified deferred compensation plan subject to Section 409A of the Internal Revenue Code. This plan is for certain highly compensated employees to replace the benefit that cannot be provided by the Retirement Plan due to IRS limits. The SRP generally parallels the Retirement Plan but offers different payment options.
The Company also sponsors unfunded defined benefit postretirement plans that provide health care and life insurance to retired U.S. employees. On December 31, 2016, the access to retiree health care coverage was closed to all active employees who had previously met the qualification requirements. Instead, only existing retirees, as of January 1, 2017, qualifying for the plan and electing coverage will be provided a fixed amount to subsidize health care insurance purchased through other providers. Net periodic postretirement benefit costs were not material for the years ended December 31, 2024, 2023 and 2022.
Most employees outside the U.S. are covered by local retirement plans, some of which are funded, while other employees receive payments at the time of retirement or termination under applicable labor laws or agreements. All plans are closed to new participants. The plans provide benefits calculated using salary data of the participants. The plans are based on final salary payments and benefits are adjusted in line with plan rules (e.g. in line with price inflation in the U.K.) once in payment during retirement. The level of benefits provided depends on the member’s length of service and pensionable salary at retirement date or date of termination if earlier.
Ameriprise Financial, Inc.
Notes to Consolidated Financial Statements (Continued)
All components of the net periodic benefit cost are recorded in General and administrative expense and were as follows:
| | | | | | | | | | | | | | | | | |
| Years Ended December 31, |
| 2024 | | 2023 | | 2022 |
| (in millions) |
| Service cost | $ | 28 | | | $ | 29 | | | $ | 43 | |
| Interest cost | 66 | | | 65 | | | 39 | |
| Expected return on plan assets | (79) | | | (76) | | | (70) | |
| Amortization of prior service credits | (1) | | | (1) | | | (1) | |
| Amortization of net loss | — | | | — | | | 18 | |
| Other | 1 | | | 3 | | | 3 | |
| Net periodic benefit cost | $ | 15 | | | $ | 20 | | | $ | 32 | |
The prior service costs are amortized on a straight-line basis over the average remaining service period of active participants. Actuarial gains and losses in excess of 10% of the greater of the projected benefit obligation or the market-related value of assets are amortized on a straight-line basis over the expected average remaining service period of active participants.
The following table provides a reconciliation of changes in the benefit obligation:
| | | | | | | | | | | | | | | | | | | | | | | |
| Pension Plans | | Other Postretirement Plans |
| 2024 | | 2023 | | 2024 | | 2023 |
| (in millions) |
| Benefit obligation at January 1 | $ | 1,355 | | | $ | 1,256 | | | $ | 11 | | | $ | 11 | |
| Service cost | 28 | | | 29 | | | — | | | — | |
| Interest cost | 66 | | | 65 | | | 1 | | | 1 | |
| | | | | | | |
| Benefits paid | (28) | | | (23) | | | (1) | | | (1) | |
| Actuarial (gain) loss | (79) | | | 52 | | | — | | | — | |
| Divestiture | (18) | | | — | | | — | | | — | |
| | | | | | | |
| Settlements | (50) | | | (45) | | | — | | | — | |
| Foreign currency rate changes | (9) | | | 21 | | | — | | | — | |
| Benefit obligation at December 31 | $ | 1,265 | | | $ | 1,355 | | | $ | 11 | | | $ | 11 | |
The actuarial (gain) loss for pension plans were primarily due to changes in the discount rate assumption as of December 31, 2024 and 2023, respectively.
The following table provides a reconciliation of changes in the fair value of assets:
| | | | | | | | | | | |
| Pension Plans |
| 2024 | | 2023 |
| (in millions) |
| Fair value of plan assets, January 1 | $ | 1,292 | | | $ | 1,142 | |
| Actual return on plan assets | 17 | | | 136 | |
| Employer contributions | 50 | | | 56 | |
| Benefits paid | (28) | | | (23) | |
| Divestiture | (18) | | | — | |
| Settlements | (50) | | | (45) | |
| Foreign currency rate changes | (10) | | | 26 | |
| Fair value of plan assets, December 31 | $ | 1,253 | | | $ | 1,292 | |
The Company complies with the minimum funding requirements in all countries. The following table provides the amounts recognized in the Consolidated Balance Sheets as of December 31, which equal the funded status of the plans:
| | | | | | | | | | | | | | | | | | | | | | | |
| Pension Plans | | Other Postretirement Plans |
| 2024 | | 2023 | | 2024 | | 2023 |
| (in millions) |
| Benefit liability | $ | (139) | | | $ | (169) | | | $ | (11) | | | $ | (11) | |
| Benefit asset | 127 | | | 106 | | | — | | | — | |
| Net amount recognized | $ | (12) | | | $ | (63) | | | $ | (11) | | | $ | (11) | |
Ameriprise Financial, Inc.
Notes to Consolidated Financial Statements (Continued)
The accumulated benefit obligation for all pension plans as of December 31, 2024 and 2023 was $1.2 billion and $1.3 billion, respectively. The following table provides information for pension plans with benefit obligations in excess of plan assets:
| | | | | | | | | | | |
| December 31, |
| 2024 | | 2023 |
| (in millions) |
| Pension plans with accumulated benefit obligations in excess of plan assets | | | |
| Accumulated benefit obligation | $ | 158 | | | $ | 945 | |
| Fair value of plan assets | 27 | | | 803 | |
| Pension plans with projected benefit obligations in excess of plan assets | | | |
| Projected benefit obligation | $ | 166 | | | $ | 972 | |
| Fair value of plan assets | 27 | | | 803 | |
The weighted average assumptions used to determine benefit obligations were as follows:
| | | | | | | | | | | | | | | | | | | | | | | |
| Pension Plans | | Other Postretirement Plans |
| 2024 | | 2023 | | 2024 | | 2023 |
| | | | | | | |
| Discount rates | 5.57 | % | | 4.98 | % | | 5.38 | % | | 5.07 | % |
| Rates of increase in compensation levels | 3.64 | | | 3.64 | | | N/A | | N/A |
| Interest crediting rates for cash balance plans | 5.00 | | | 5.00 | | | N/A | | N/A |
N/A Not Applicable
The weighted average assumptions used to determine net periodic benefit cost of pension plans were as follows:
| | | | | | | | | | | | | | | | | |
| 2024 | | 2023 | | 2022 |
| | | | | |
| Discount rates | 4.98 | % | | 5.30 | % | | 2.46 | % |
| Rates of increase in compensation levels | 3.64 | | | 3.72 | | | 3.69 | |
| Expected long-term rates of return on assets | 5.90 | | | 6.04 | | | 4.82 | |
| Interest crediting rates for cash balance plans | 5.00 | | | 5.00 | | | 5.00 | |
In developing the expected long-term rate of return on assets, management evaluated input from an external consulting firm, including their projection of asset class return expectations and long-term inflation assumptions. The Company also considered historical returns on the plans’ assets. Discount rates are based on yields available on high-quality corporate bonds that would generate cash flows necessary to pay the benefits when due.
The Company’s pension plans’ assets are invested in an aggregate diversified portfolio to minimize the impact of any adverse or unexpected results from a security class on the entire portfolio. Diversification is interpreted to include diversification by asset type, performance and risk characteristics and number of investments. When appropriate and consistent with the objectives of the plans, derivative instruments may be used to mitigate risk or provide further diversification, subject to the investment policies of the plans. Asset classes and ranges considered appropriate for investment of the plans’ assets are determined by each plan’s investment committee. The target allocations are 70% equity securities, 20% debt securities and 10% all other types of investments, except for the assets in pooled pension funds and certain collective funds described below, and additional voluntary contribution assets outside the U.S. which are allocated at the discretion of the individual and will be converted at retirement into the defined benefit pension plan. Actual allocations will generally be within 5% of these targets. In addition, assets in pooled pension funds and certain collective funds reflect allocations between growth and liability matching portfolios and may shift based on manager discretion. These funds invest primarily in debt securities, equity securities, and certain derivatives, either directly or through other collective funds. As of December 31, 2024 and 2023, there were no significant holdings of any single issuer and the exposure to derivative instruments was not significant.
Ameriprise Financial, Inc.
Notes to Consolidated Financial Statements (Continued)
The following tables present the Company’s pension plans assets measured at fair value on a recurring basis:
| | | | | | | | | | | | | | | | | | | | | | | | | | | | | |
| Asset Category | | December 31, 2024 | |
| Level 1 | | Level 2 | | Level 3 | | Total | |
| (in millions) | |
| Equity securities: | | | | | | | | |
| | | | | | | | |
| U.S. small cap stocks | $ | 46 | | | $ | 6 | | | $ | — | | | $ | 52 | | |
| | | | | | | | |
| | | | | | | | |
| | | | | | | | |
| | | | | | | | |
| | | | | | | | |
| | | | | | | | |
| | | | | | | | |
| Registered investment companies | | 69 | | | — | | | — | | | 69 | | |
| Insurance contracts | — | | | — | | | 21 | | | 21 | | |
| Cash equivalents at NAV | | | | | | | 7 | | (1) |
| Collective investment funds at NAV | | | | | | | 1,057 | | (1) |
| Real estate investment trusts at NAV | | | | | | | 20 | | (1) |
| Hedge funds at NAV | | | | | | | 27 | | (1) |
| | | | | | | | |
| Total | $ | 115 | | | $ | 6 | | | $ | 21 | | | $ | 1,253 | | |
| | | | | | | | | | | | | | | | | | | | | | | | | | | | | |
| | December 31, 2023 | |
| Asset Category | | Level 1 | | Level 2 | | Level 3 | | Total | |
| (in millions) | |
| Equity securities: | | | | | | | | |
| | | | | | | | |
| U.S. small cap stocks | $ | 90 | | | $ | 7 | | | $ | — | | | $ | 97 | | |
| | | | | | | | |
| | | | | | | | |
| | | | | | | | |
| | | | | | | | |
| | | | | | | | |
| | | | | | | | |
| | | | | | | | |
| Registered investment companies | | 90 | | | — | | | — | | | 90 | | |
| Insurance contracts | — | | | — | | | 23 | | | 23 | | |
| Cash equivalents at NAV | | | | | | | 3 | | (1) |
| Collective investment funds at NAV | | | | | | | 859 | | (1) |
| Real estate investment trusts at NAV | | | | | | | 28 | | (1) |
| Hedge funds at NAV | | | | | | | 24 | | (1) |
| Pooled pension funds at NAV | | | | | | | 168 | | (1) |
| Total | $ | 180 | | | $ | 7 | | | $ | 23 | | | $ | 1,292 | | |
(1) Amounts are comprised of certain investments that are measured at fair value using the NAV per share (or its equivalent) as a practical expedient and have not been classified in the fair value hierarchy.
Equity securities are managed to track the performance of common market indices for both U.S. and non-U.S. securities, primarily across large cap, small cap and emerging market asset classes. Cash equivalents consist of holdings in a money market fund that seeks to equal the return of the three month U.S. Treasury bill. Collective investment funds include equity and debt securities. Real estate funds are managed to track the performance of a broad population of investment grade non-agricultural income producing properties. The Company’s investments in hedge funds include investments in a multi-strategy fund and an off-shore fund managed to track the performance of broad fund of fund indices. Pooled pension funds are managed to track a specific benchmark based on the investment objectives of the fund.
The fair value of equity securities classified as Level 1 use quoted prices in active markets and the fair value of equity securities classified as Level 2 is determined based on a market approach using observable inputs. The fair value of the registered investment companies’ mutual funds is determined by the NAV which represents the exit price. These funds are classified as Level 1 as they are traded in active markets and quoted prices are available. Insurance contracts support certain non-U.S plans and are classified as Level 3.
The following table presents the amounts recognized in AOCI, net of tax, as of December 31, 2024 but not recognized as components of net periodic benefit cost:
| | | | | | | | | | | | | |
| Pension Plans | | Other
Postretirement Plans | | |
| (in millions) | | |
| Unrecognized actuarial gain (loss) | $ | (47) | | | $ | 2 | | | |
| | | | | |
| | | | | |
See Note 21 for a rollforward of AOCI related to the Company’s defined benefit plans.
Ameriprise Financial, Inc.
Notes to Consolidated Financial Statements (Continued)
The Company’s pension plans expect to make benefit payments to retirees as follows:
| | | | | | | | | | | |
| Pension Plans | | Other
Postretirement Plans |
| (in millions) |
| 2025 | $ | 81 | | | $ | 1 | |
| 2026 | 89 | | | 1 | |
| 2027 | 88 | | | 1 | |
| 2028 | 93 | | | 1 | |
| 2029 | 101 | | | 1 | |
| 2030-2034 | 512 | | | 4 | |
The Company expects to contribute $32 million and nil to its pension plans and other postretirement plans, respectively, in 2025.
Defined Contribution Plans
The Company’s U.S. employees are generally eligible to participate in the Ameriprise Financial 401(k) Plan (the “401(k) Plan”). The 401(k) Plan allows eligible employees to make contributions through payroll deductions up to IRS limits and invest their contributions in one or more of the 401(k) Plan investment options, which include the Ameriprise Financial Stock Fund. The Company provides a dollar for dollar match up to the first 5% of eligible compensation an employee contributes on a pretax and/or Roth 401(k) basis for each annual period. Effective April 2020, employees not eligible to participate in the Retirement Plan will receive a 2% company contribution to their 401(k) Plan once they become eligible for contributions.
Under the 401(k) Plan, employees become eligible for contributions under the plan during the pay period they reach 60 days of service. Match contributions are fully vested after five years of service, vesting ratably over the first five years of service, or upon retirement at or after age 65, disability or death while employed. The Company’s defined contribution plan expense was $66 million, $67 million and $67 million for the years ended December 31, 2024, 2023 and 2022, respectively.
Employees outside the U.S. who are not covered by the 401(k) may be covered by local defined contribution plans which are subject to applicable laws and rules of the country where the plan is administered. The Company’s expense related to defined contribution plans outside the U.S. was $16 million, $16 million and $8 million for the years ended December 31, 2024, 2023 and 2022, respectively.
26. Commitments and Contingencies
Commitments
The following table presents the Company’s funding commitments as of December 31:
| | | | | | | | | | | |
| 2024 | | 2023 |
| (in millions) |
| Commercial mortgage loans | $ | 58 | | | $ | 17 | |
| | | |
| Property funds | 63 | | | 27 | |
| | | |
| Pledged asset lines of credit | 2,399 | | | 1,864 | |
| | | |
| Total funding commitments | $ | 2,520 | | | $ | 1,908 | |
Contingencies
The Company and its subsidiaries are involved, in the normal course of business, in legal proceedings, which include regulatory inquiries, arbitration and litigation (including class actions), concerning matters arising in connection with the conduct of its activities as a diversified financial services firm. These include proceedings specific to the Company as well as proceedings generally applicable to business practices in the industries in which it operates. The Company can also be subject to legal proceedings arising out of its general business activities, such as its investments, contracts, leases and employment relationships. Uncertain economic conditions, heightened and sustained volatility in the financial markets and significant financial reform legislation may increase the likelihood that clients and other persons or regulators may present or threaten legal claims or that regulators increase the scope or frequency of examinations of the Company or the financial services industry generally.
As with other financial services firms, the level of regulatory activity concerning the Company’s businesses remains elevated. From time to time, the Company receives requests for information from, and/or has been subject to examination or claims by the SEC, the Financial Industry Regulatory Authority, the OCC, the FDIC, the U.K. Financial Conduct Authority, the Federal Reserve Board, state insurance and securities regulators, state attorneys general and various other domestic and foreign governmental and quasi-governmental authorities on behalf of themselves or clients concerning the Company’s business activities and practices, and the practices of the Company’s financial advisors. The Company is cooperating with the applicable regulators.
Ameriprise Financial, Inc.
Notes to Consolidated Financial Statements (Continued)
The Company typically has numerous pending matters that include information requests, exams, inquiries or disputes regarding certain subjects, including from time to time: sales and distribution of, and disclosure practices related to, mutual and other pooled funds, exchange traded funds, private funds, segregated accounts, annuities, equity and fixed income securities, real estate investment trusts, insurance products, banking products, brokerage offerings, including money settlement options, and financial advice offerings, including managed accounts; wholesaler activity; supervision of the Company’s financial advisors and other associated persons; administration of insurance and annuity claims; security of client information; trading activity and the Company’s monitoring and supervision of such activity; recordkeeping requirements; and transaction monitoring systems and controls.
These pending matters are subject to uncertainties and, as such, it is inherently difficult to determine whether any loss is probable or even reasonably possible, or to reasonably estimate the amount of any loss that may result from such matters. The Company cannot predict with certainty if, how, or when any such proceedings will be initiated or resolved. Matters frequently need to be more developed before a potential loss or range of loss can be reasonably estimated for any matter. An adverse outcome in any matter could result in an adverse judgment, a settlement, fine, penalty, or other sanction, and may lead to further claims, examinations, adverse publicity or reputational damage, each of which could have a material adverse effect on the Company’s consolidated results of operations, financial condition, or liquidity.
In accordance with applicable accounting standards, the Company establishes an accrued liability for contingent litigation and regulatory matters when those matters present loss contingencies that are both probable and can be reasonably estimated. The Company discloses the nature of the contingency when management believes there is at least a reasonable possibility that the outcome may be material to the Company’s consolidated financial statements and, where feasible, an estimate of the possible loss. In such cases, there still may be an exposure to loss in excess of any amounts reasonably estimated and accrued. When a loss contingency is not both probable and reasonably estimable, the Company does not establish an accrued liability, but continues to monitor, in conjunction with any outside counsel handling a matter, further developments that would make such loss contingency both probable and reasonably estimable. Once the Company establishes an accrued liability with respect to a loss contingency, the Company continues to monitor the matter for further developments that could affect the amount of the accrued liability that has been previously established, and any appropriate adjustments are made each quarter.
Guaranty Fund Assessments
RiverSource Life and RiverSource Life of NY are required by law to be a member of the guaranty fund association in every state where they are licensed to do business. In the event of insolvency of one or more unaffiliated insurance companies, the Company could be adversely affected by the requirement to pay assessments to the guaranty fund associations. The Company projects its cost of future guaranty fund assessments based on estimates of insurance company insolvencies provided by the National Organization of Life and Health Insurance Guaranty Associations and the amount of its premiums written relative to the industry-wide premium in each state. The Company accrues the estimated cost of future guaranty fund assessments when it is considered probable that an assessment will be imposed, the event obligating the Company to pay the assessment has occurred and the amount of the assessment can be reasonably estimated.
The Company has a liability for estimated guaranty fund assessments and a related premium tax asset. As of December 31, 2024 and 2023, the estimated liability was $11 million and $34 million, respectively. As of December 31, 2024 and 2023, the related premium tax asset was $9 million and $29 million, respectively. The expected period over which guaranty fund assessments will be made and the related tax credits recovered is not known.
27. Related Party Transactions
The Company may engage in transactions in the ordinary course of business with significant shareholders or their subsidiaries, between the Company and its directors and officers or with other companies whose directors or officers may also serve as directors or officers for the Company or its subsidiaries. The Company carries out these transactions on customary terms.
The Company’s executive officers and directors may have transactions with the Company or its subsidiaries involving financial products and insurance services. All obligations arising from these transactions are in the ordinary course of the Company’s business and are on the same terms in effect for comparable transactions with the general public. Such obligations involve normal risks of collection and do not have features or terms that are unfavorable to the Company or its subsidiaries.
These transactions have not had a material impact on the Company’s consolidated results of operations or financial condition.
28. Segment Information
The Company’s four reporting segments are Advice & Wealth Management, Asset Management, Retirement & Protection Solutions and Corporate & Other.
The accounting policies of the segments are the same as those of the Company, except for operating adjustments defined below, the method of capital allocation, the accounting for gains (losses) from intercompany revenues and expenses and not providing for income taxes on a segment basis.
Ameriprise Financial, Inc.
Notes to Consolidated Financial Statements (Continued)
The largest source of intersegment revenues and expenses is retail distribution services, where segments are charged transfer pricing rates that approximate arm’s length market prices for distribution through the Advice & Wealth Management segment. The Advice & Wealth Management segment provides distribution services for affiliated and non-affiliated products and services. The Asset Management segment provides investment management services for the Company’s owned assets and client assets, and accordingly charges investment and advisory management fees to the other segments. All intersegment activity is eliminated in the Company’s consolidated results.
All costs related to shared services are allocated to the segments based on a rate times volume or fixed basis.
The Advice & Wealth Management segment provides financial planning and advice, as well as full-service brokerage services, primarily to retail clients through the Company’s advisors. These services are centered on long-term, personal relationships between the Company’s advisors and its clients and focus on helping clients achieve their financial goals. The Company’s advisors provide a distinctive, holistic approach to financial planning and have access to a broad selection of both affiliated and non-affiliated products to help clients meet their financial needs and goals. Banking, lending, and cash management solutions help clients establish financial flexibility while planning for both short- and long-term needs. A significant portion of revenues in this segment are fee-based and driven by the level of client assets, which is impacted by both market movements and net asset flows. The Company also earns net investment income on owned assets primarily from certificate and banking products. This segment earns revenues (distribution fees) for distributing non-affiliated products and intersegment revenues for distributing the Company’s affiliated products and services provided to its retail clients. Intersegment expenses for this segment include expenses for investment management services provided by the Asset Management segment.
The Asset Management segment provides investment management, advice and products to retail, high net worth and institutional clients on a global scale through the Columbia Threadneedle Investments® brand, which represents the combined capabilities, resources and reach of Columbia Management Investment Advisers, LLC (“Columbia Management”) and Threadneedle. Columbia Management primarily provides products and services in the U.S. and Threadneedle primarily provides products and services internationally. The Company offers U.S. retail clients a range of products through both unaffiliated third-party financial institutions and the Advice & Wealth Management segment. The Company provides institutional products and services through its institutional sales force. Retail products for non-U.S. investors are primarily distributed through third-party financial institutions and unaffiliated financial advisors. Retail products include U.S. mutual funds and their non-U.S. equivalents, exchange-traded funds and variable product funds underlying insurance and annuity separate accounts. Institutional asset management services are designed to meet specific client objectives and may involve a range of products, including those that focus on traditional asset classes, separately managed accounts, individually managed accounts, CLOs, hedge fund or alternative strategies, collective funds and property and infrastructure funds. CLOs, hedge fund or alternative strategies and certain private funds are often classified as alternative assets. Revenues in this segment are primarily earned as fees based on managed asset balances, which are impacted by market movements, net asset flows, asset allocation and product mix. The Company may also earn performance fees from certain accounts where investment performance meets or exceeds certain pre-identified targets. The Asset Management segment also provides intercompany asset management services for Ameriprise Financial subsidiaries. The fees for these services are reflected within the Asset Management segment results through intersegment transfer pricing. Intersegment expenses for this segment include distribution expenses for services provided by the Advice & Wealth Management and Retirement & Protection Solutions segments.
The Retirement & Protection Solutions segment includes Retirement Solutions (variable annuities and payout annuities) and Protection Solutions (life and disability income insurance). Retirement Solutions provides variable annuity products of RiverSource Life companies to individual clients. The Company provides variable annuity products through its advisors. Revenues for the Company’s variable annuity products are primarily earned as fees based on a contractholder’s benefit base, contract value, or separate account value, which is impacted by both market movements and net asset flows. The Company also earns net investment income on general account assets supporting reserves for non-life contingent payout annuities, structured variable annuities, certain guaranteed benefits and fixed investment options offered with variable annuities and on capital supporting the business. Revenues for the Company’s life contingent payout annuities are earned as premium revenue. Protection Solutions offers a variety of products to address the protection and risk management needs of the Company’s retail clients including life and DI insurance. Life and DI products are primarily provided through the Company’s advisors and these policies are issued through its RiverSource Life companies. The primary sources of revenues for Protection Solutions are premiums, fees and charges that the Company receives to assume insurance-related risk. The Company earns net investment income on owned assets supporting insurance reserves and capital supporting the business. The Company also receives fees based on the level of the RiverSource Life companies’ separate account assets supporting VUL investment options. Intersegment revenues for this segment reflect fees paid by the Asset Management segment for marketing support and other services provided in connection with the availability of variable insurance trust funds under variable annuity contracts and VUL contracts. Intersegment expenses for this segment include distribution expenses for services provided by the Advice & Wealth Management segment, as well as expenses for investment management services provided by the Asset Management segment.
The Corporate & Other segment consists of net investment income or loss on corporate level assets, including excess capital held in the Company’s subsidiaries and other unallocated equity and other revenues as well as unallocated corporate expenses. The Corporate & Other segment also includes the results of the Company’s closed blocks of long term care insurance and fixed annuity and fixed
Ameriprise Financial, Inc.
Notes to Consolidated Financial Statements (Continued)
indexed annuity business. The Corporate & Other segment also includes revenues and expenses of consolidated investment entities, which are excluded on an operating basis. Revenues for the Company’s fixed deferred annuity products are primarily earned as net investment income on the RiverSource Life companies’ general account assets supporting fixed account balances, with profitability significantly impacted by the spread between net investment income earned and interest credited on the fixed account balances.
Management uses segment adjusted operating measures in goal setting, as a basis for determining employee compensation and in evaluating performance on a basis comparable to that used by some securities analysts and investors. Consistent with GAAP accounting guidance for segment reporting, adjusted operating earnings is the Company’s measure of segment performance. Adjusted operating earnings should not be viewed as a substitute for GAAP pretax income. The Company believes the presentation of segment adjusted operating earnings, as the Company measures it for management purposes, enhances the understanding of its business by reflecting the underlying performance of its core operations and facilitating a more meaningful trend analysis. As its chief operating decision maker, (“CODM”) the Company’s Chairman and Chief Executive Officer utilizes these segment adjusted operating measures to allocate resources and assess performance.
Adjusted operating earnings is defined as adjusted operating net revenues less adjusted operating expenses. Adjusted operating net revenues and adjusted operating expenses exclude net realized investment gains or losses (net of reinsurance accrual); the market impact on non-traditional long-duration products (including variable and fixed deferred annuity contracts and UL insurance contracts), net of hedges and reinsurance accrual; mean reversion related impacts (the impact on VUL products for the difference between assumed and updated separate account investment performance on the reinsurance accrual and additional insurance benefit reserves); the market impact of hedges to offset interest rate and currency changes on unrealized gains or losses for certain investments; block transfer reinsurance transaction impacts; gain or loss on disposal of a business that is not considered discontinued operations; integration and restructuring charges; income (loss) from discontinued operations; and the impact of consolidating CIEs. The market impact on non-traditional long-duration products includes changes in market risk benefits and embedded derivative values caused by changes in financial market conditions, net of changes in economic hedge values and unhedged items including the difference between assumed and actual underlying separate account investment performance, fixed income credit exposures, transaction costs and certain policyholder contract elections. The market impact also includes certain valuation adjustments made in accordance with FASB Accounting Standards Codification 820, Fair Value Measurements and Disclosures, including the impact on embedded derivative values of discounting projected benefits to reflect a current estimate of the RiverSource Life companies’ nonperformance spread.
The following tables summarize selected financial information by segment and reconcile segment totals to those reported on the consolidated financial statements:
| | | | | | | | | | | |
| | December 31, |
| 2024 | | 2023 |
| (in millions) |
| Advice & Wealth Management | $ | 41,514 | | | $ | 42,983 | |
| Asset Management | 7,350 | | | 7,288 | |
| Retirement & Protection Solutions | 116,609 | | | 108,451 | |
| Corporate & Other | 15,930 | | | 16,469 | |
| Total assets | $ | 181,403 | | | $ | 175,191 | |
Ameriprise Financial, Inc.
Notes to Consolidated Financial Statements (Continued)
| | | | | | | | | | | | | | | | | |
| | Years Ended December 31, |
| 2024 | | 2023 | | 2022 |
| (in millions) |
| Adjusted operating net revenues: | | | | | |
| Advice & Wealth Management | $ | 10,780 | | | $ | 9,418 | | | $ | 8,461 | |
| Asset Management | 3,515 | | | 3,278 | | | 3,506 | |
| Retirement & Protection Solutions | 3,773 | | | 3,476 | | | 3,124 | |
| Corporate & Other | 454 | | | 533 | | | 479 | |
Elimination of segment revenues (1) | (1,443) | | | (1,318) | | | (1,316) | |
| Total segment adjusted operating net revenues | 17,079 | | | 15,387 | | | 14,254 | |
| Adjustments: | | | | | |
| Net realized investment gains (losses) | (21) | | | (32) | | | (93) | |
| Market impact on non-traditional long-duration products | 3 | | | 2 | | | (1) | |
| Mean reversion related impacts | — | | | — | | | (1) | |
| | | | | |
| | | | | |
| | | | | |
| Revenue attributable to consolidated investment entities | 203 | | | 178 | | | 99 | |
| | | | | |
| Total net revenues per consolidated statements of operations | $ | 17,264 | | | $ | 15,535 | | | $ | 14,258 | |
(1) Represents the elimination of intersegment revenues recognized for the years ended December 31, 2024, 2023 and 2022 in each segment as follows: Advice and Wealth Management ($935, $847 and $847, respectively); Asset Management ($96, $79 and $52, respectively); Retirement & Protection Solutions ($441, $411 and $420, respectively); and Corporate & Other ($(29), $(19) and $(3), respectively).
| | | | | | | | | | | | | | | | | |
| | Years Ended December 31, |
| 2024 | | 2023 | | 2022 |
| (in millions) |
| Adjusted operating earnings: | | | | | |
| Advice & Wealth Management | $ | 3,233 | | | $ | 2,851 | | | $ | 2,192 | |
| Asset Management | 920 | | | 720 | | | 844 | |
| Retirement & Protection Solutions | 726 | | | 685 | | | 867 | |
| Corporate & Other | (443) | | | (320) | | | (306) | |
| Total segment adjusted operating earnings | 4,436 | | | 3,936 | | | 3,597 | |
| Adjustments: | | | | | |
| Net realized investment gains (losses) | (21) | | | (32) | | | (93) | |
| Market impact on non-traditional long-duration products | (153) | | | (608) | | | 483 | |
| Mean reversion related impacts | 1 | | | — | | | (1) | |
| | | | | |
| | | | | |
| Integration/restructuring charges | — | | | (62) | | | (50) | |
| | | | | |
| Net income (loss) attributable to consolidated investment entities | 4 | | | — | | | (5) | |
| Pretax income per consolidated statements of operations | $ | 4,267 | | | $ | 3,234 | | | $ | 3,931 | |
Ameriprise Financial, Inc.
Notes to Consolidated Financial Statements (Continued)
Adjusted operating earnings includes the following significant expense categories:
| | | | | | | | | | | | | | | | | | | | | | | |
| Year Ended December 31, 2024 |
| Advice & Wealth Management | | Asset Management | | Retirement & Protection Solutions | | Corporate & Other |
| (in millions) |
| Expenses: | | | | | | | |
| Distribution expenses | $ | 5,823 | | | $ | 989 | | | $ | 515 | | | $ | (10) | |
| Interest credited to fixed accounts | — | | | — | | | 367 | | | 216 | |
| Benefits, claims, losses and settlement expenses | — | | | — | | | 927 | | | 217 | |
| Remeasurement (gains) losses of future policy benefit reserves | — | | | — | | | (36) | | | (8) | |
| Change in fair value of market risk benefits | — | | | — | | | 684 | | | — | |
| Amortization of deferred acquisition costs | — | | | 7 | | | 227 | | | 8 | |
| Interest and debt expense | 38 | | | 7 | | | 45 | | | 108 | |
| General and administrative expense | 1,686 | | | 1,592 | | | 318 | | | 366 | |
| Total expenses | $ | 7,547 | | | $ | 2,595 | | | $ | 3,047 | | | $ | 897 | |
| | | | | | | | | | | | | | | | | | | | | | | |
| Year Ended December 31, 2023 |
| Advice & Wealth Management | | Asset Management | | Retirement & Protection Solutions | | Corporate & Other |
| (in millions) |
| Expenses: | | | | | | | |
| Distribution expenses | $ | 4,888 | | | $ | 925 | | | $ | 464 | | | $ | (10) | |
| Interest credited to fixed accounts | — | | | — | | | 369 | | | 234 | |
| Benefits, claims, losses and settlement expenses | — | | | — | | | 744 | | | 236 | |
| Remeasurement (gains) losses of future policy benefit reserves | — | | | — | | | (19) | | | (1) | |
| Change in fair value of market risk benefits | — | | | — | | | 628 | | | — | |
| Amortization of deferred acquisition costs | — | | | 6 | | | 229 | | | 11 | |
| Interest and debt expense | 27 | | | 7 | | | 51 | | | 97 | |
| General and administrative expense | 1,652 | | | 1,620 | | | 325 | | | 286 | |
| Total expenses | $ | 6,567 | | | $ | 2,558 | | | $ | 2,791 | | | $ | 853 | |
| | | | | | | |
| | | | | | | | | | | | | | | | | | | | | | | |
| Year Ended December 31, 2022 |
| Advice & Wealth Management | | Asset Management | | Retirement & Protection Solutions | | Corporate & Other |
| (in millions) |
| Expenses: | | | | | | | |
| Distribution expenses | $ | 4,719 | | | $ | 995 | | | $ | 448 | | | $ | (10) | |
| Interest credited to fixed accounts | — | | | — | | | 386 | | | 242 | |
| Benefits, claims, losses and settlement expenses | — | | | — | | | 469 | | | 247 | |
| Remeasurement (gains) losses of future policy benefit reserves | — | | | — | | | 1 | | | — | |
| Change in fair value of market risk benefits | — | | | — | | | 372 | | | — | |
| Amortization of deferred acquisition costs | — | | | 9 | | | 233 | | | 10 | |
| Interest and debt expense | 10 | | | 5 | | | 39 | | | 70 | |
| General and administrative expense | 1,540 | | | 1,653 | | | 309 | | | 226 | |
| Total expenses | $ | 6,269 | | | $ | 2,662 | | | $ | 2,257 | | | $ | 785 | |
| | | | | | | |
Ameriprise Financial, Inc.
Item 9. Changes in and Disagreements with Accountants on Accounting and Financial Disclosure
None.
Item 9A. Controls and Procedures
Disclosure Controls and Procedures
We maintain disclosure controls and procedures (as defined in Rules 13a-15(e) and 15d-15(e) of the Securities Exchange Act of 1934, as amended (the “Exchange Act”) designed to provide reasonable assurance that the information required to be reported in the Exchange Act filings is recorded, processed, summarized and reported within the time periods specified in and pursuant to U.S. Securities and Exchange Commission (“SEC”) regulations, including controls and procedures designed to ensure that this information is accumulated and communicated to our management, including our principal executive officer and principal financial officer, as appropriate, to allow timely decisions regarding the required disclosure. It should be noted that, because of inherent limitations, our Company’s disclosure controls and procedures, however well designed and operated, can provide only reasonable, and not absolute, assurance that the objectives of the disclosure controls and procedures are met.
Our management, under the supervision and with the participation of our principal executive officer and principal financial officer, evaluated the effectiveness of the disclosure controls and procedures as of the end of the period covered by this report. Based upon that evaluation, our principal chief executive officer and principal financial officer have concluded that our disclosure controls and procedures were effective at a reasonable level of assurance as of December 31, 2024.
Changes in Internal Control over Financial Reporting
There have not been any changes in our internal control over financial reporting (as such term is defined in Rules 13a-15(f) and 15d-15(f) under the Exchange Act) during the fourth fiscal quarter of the year to which this report relates that have materially affected, or are reasonably likely to materially affect, our internal control over financial reporting.
Management’s Report on Internal Control Over Financial Reporting
Our management is responsible for establishing and maintaining adequate internal control over financial reporting for the Company.
The Company’s internal control over financial reporting is a process designed by, or under the supervision of, the Company’s principal executive and principal financial officers and effected by the Company’s Board of Directors, management and other personnel to provide reasonable assurance regarding the reliability of financial reporting and the preparation of financial statements for external purposes in accordance with generally accepted accounting principles in the United States of America, and includes those policies and procedures that:
•Pertain to the maintenance of records that, in reasonable detail, accurately and fairly reflect the transactions and dispositions of the assets of the Company;
•Provide reasonable assurance that transactions are recorded as necessary to permit preparation of financial statements in accordance with generally accepted accounting principles, and that receipts and expenditures of the Company are being made only in accordance with authorizations of management and directors of the Company; and
•Provide reasonable assurance regarding prevention or timely detection of unauthorized acquisition, use or disposition of the Company’s assets that could have a material effect on the financial statements.
Because of its inherent limitations, internal control over financial reporting may not prevent or detect misstatements. Also, projections of any evaluation of effectiveness to future periods are subject to the risk that controls may become inadequate because of changes in conditions, or that the degree of compliance with the policies or procedures may deteriorate.
The Company’s management, with the participation of our principal executive officer and principal financial officer, assessed the effectiveness of the Company’s internal control over financial reporting as of December 31, 2024. In making this assessment, the Company’s management used the criteria set forth in Internal Control — Integrated Framework (2013) issued by the Committee of Sponsoring Organizations of the Treadway Commission.
Based on management’s assessment and those criteria, we conclude that, as of December 31, 2024, the Company’s internal control over financial reporting is effective.
PricewaterhouseCoopers LLP, the Company’s independent registered public accounting firm, has issued an audit report on the effectiveness of the Company’s internal control over financial reporting as of December 31, 2024.
Ameriprise Financial, Inc.
Item 9B. Other Information
Amended and Restated Bylaws
On February 20, 2025, the Company’s Board approved, effective immediately, amendments to the Company’s by-laws (“By-Laws”).
The changes to the By-Laws include, among other things, amending:
•Section 1.03 (Notice of Meetings; Waiver) to clarify that the means of remote communication should be included in any notice of a remote meeting;
•Section 1.09 (Organization; Procedure) to provide that the presiding officer of stockholders’ meetings shall be a director or officer of the company and to clarify that determinations regarding whether a matter of business was property brought before a meeting of stockholders will be made by the board in advance of the meeting;
•Section 1.10 (Notice of Stockholder Business and Nominations) to update the advance notice provisions including, without limitation:
◦to require certain information to be provided regarding the affiliates and associates of the stockholder submitting the notice and any beneficial owner on whose behalf the nomination or proposal is made (which are referred to in the By-Laws as a “Stockholder Related Person”);
◦to require a stockholder making a nomination to represent whether such stockholder will solicit proxies in support of such nomination in accordance with the universal proxy rules and to provide evidence that such stockholder has complied with the universal proxy rules;
◦to require certain additional information from the stockholder, beneficial owner and any Stockholder Related Person with respect to proxies to vote shares of the Company’s stock and rights to dividends or distributions on the shares of the Company’s stock that are separated or separable from the underlying shares of stock;
◦to remove any requirements that the stockholder’s notice include information from persons “acting in concert” with the stockholder or beneficial owner;
◦to revise the existing requirement that the proposed nominee provide information on his or her eligibility to serve as an independent director to instead require the proposed nominee to provide information on whether he or she is qualified under the Company’s Certificate of Incorporation, By-Laws, stock exchange rules or other laws applicable to the Company to serve as a director or independent director; and
◦to provide that the white proxy card is reserved for the exclusive use of the board.
•Section 1.12 (Submission of Questionnaire, Representation and Agreement) to clarify information required and time periods for providing and submitting required questionnaires with respect to a stockholder nomination under the advance notice provision;
•Section 1.16 (Proxy Access) to clarify that the “Required Information” to be provided in the notice of nomination only needs to be included in the proxy statement, to reflect the universal proxy rules, which provide another manner for a stockholder nominee to be included in the Company’s proxy materials, and to remove the language that any action, interpretation, or determination by the board under the proxy access provision is final and binding; and
•Section 2.05 (Annual and Regular Meetings) to provide additional flexibility in the timing of the annual meeting of the board.
The amendments to the By-Laws also include other changes to conform to recent amendments to the General Corporation Law of the State of Delaware, to conform various provisions of the By-Laws to the General Corporation Law of the State of Delaware and to other provisions of the By-Laws and to make other general clean-up and clarifying changes.
The foregoing description is qualified in its entirety by reference to the full text of the amended and restated By-Laws, a complete copy of which is attached hereto as Exhibit 3.3.
Rule 10b5-1 and Non-Rule 10b5-1 Trading Arrangements
During the three months ended December 31, 2024, no director or officer of the Company adopted, modified or terminated a “Rule 10b5-1 trading arrangement” or “non-Rule 10b5-1 trading arrangement,” as each term is defined in Item 408(a) of Regulation S-K.
Item 9C. Disclosure Regarding Foreign Jurisdictions that Prevent Inspections
None.
Ameriprise Financial, Inc.
PART III.
Item 10. Directors, Executive Officers and Corporate Governance
The following portions of the Proxy Statement are incorporated herein by reference:
•information included under the caption “Corporate Governance-Item 1-Election of the Eight Director Nominees”;
•information included under the caption “Information About the Annual Meeting and Voting-Requirements and Deadlines for Submission of Shareholder Proposals or Nomination of Directors for the 2026 Annual Meeting”;
•information under the caption “Corporate Governance-Corporate Governance Documents and Policies-Codes of Conduct”;
•information under the caption “Corporate Governance-Corporate Governance Documents and Policies-Insider Trading Policies”;
•information under the caption “Corporate Governance-Corporate Governance Documents and Policies-Hedging Policy”;
•information under the caption “Corporate Governance-Year-Round Review of Board Composition and Succession”;
•information included under the caption “Corporate Governance-Committees of the Board”;
•information included under the caption “Corporate Governance-Committees of the Board-Board Committee Responsibilities - Audit and Risk Committee”;
•information included under the caption “Corporate Governance-Committees of the Board-Audit Committee-Board Committee Responsibilities - Audit and Risk Committee Financial Experts”; and
•information under the caption “Delinquent Section 16(a) Reports”.
EXECUTIVE LEADERSHIP TEAM
Set forth below is a list of the members of our Executive Leadership Team as of the date this Annual Report on Form 10-K has been filed with the SEC. Also included in this list is Dawn M. Brockman, our principal accounting officer. Each such person’s age is indicated by the number in parentheses next to his or her name.
Each individual with an asterisk next to his or her name has been designated as an “executive officer” for purposes of the Exchange Act. None of the below individuals have any family relationship with any other member of the Executive Leadership Team or our principal accounting officer, and none of such individuals became a member of the Executive Leadership Team pursuant to any arrangement or understanding with any other person. Each executive officer has been elected to serve until the next annual election of officers or until his or her successor is elected and qualified.
*James M. Cracchiolo-Chairman and Chief Executive Officer, Ameriprise Financial
Mr. Cracchiolo (66) has been our Chairman and Chief Executive Officer since September 2005 when the Company completed its spinoff from American Express. Prior to his current role, Mr. Cracchiolo held a number of senior-level positions at American Express, including group president of American Express Global Financial Services (2000 - 2005); CEO and president of American Express Financial Corporation (AEFC) (2000 - 2005) and chairman of AEFC (2001 - 2005); chairman of American Express Bank Ltd. (2000 - 2005); president and CEO of Travel Related Services International (TRS) (1998 - 2000); president of Global Network Services (1997 -1998); senior vice president of TRS Quality, Global Reengineering (1993 - 1997); and executive vice president and chief financial officer of Shearson Lehman Brothers (then a unit of American Express) (1990 - 1993). In addition, Mr. Cracchiolo previously served on the boards of directors of the American Council of Life Insurers, the Financial Services Roundtable and on the board of advisors to the March of Dimes Foundation.
*Walter S. Berman-Executive Vice President and Chief Financial Officer
Mr. Berman (82) has been our Executive Vice President and Chief Financial Officer since September 2005. Prior to that, Mr. Berman served as Executive Vice President and Chief Financial Officer of AEFC, a position he held since January 2003. From April 2001 to January 2004, Mr. Berman served as Corporate Treasurer of American Express.
Kelli A. Hunter Petruzillo-Executive Vice President of Human Resources
Ms. Hunter Petruzillo (63) has been our Executive Vice President of Human Resources since September 2005. Prior to that, Ms. Hunter Petruzillo served as Executive Vice President of Human Resources of AEFC since joining our company in June 2005. Prior to joining AEFC, Ms. Hunter Petruzillo was Senior Vice President-Global Human Capital for Crown Castle International Corporation in Houston, Texas. Prior to that, she held a variety of senior level positions in human resources for Software Spectrum, Inc., Mary Kay, Inc., as well as Morgan Stanley Inc. and Bankers Trust New York Corporation.
*Dawn M. Brockman-Senior Vice President and Corporate Controller (Principal Accounting Officer)
Ms. Brockman (52) has been our Senior Vice President and Controller since September 2022, and previously was Interim Controller from July 2022 until September 2022. Prior to that, Ms. Brockman served as Vice President Finance - Controllership since November 2019 until July 2022 and the Vice President Finance - Advice & Wealth Management from October 2013 to November 2019. Ms. Brockman joined the Ameriprise in 1994.
Ameriprise Financial, Inc.
Deirdre D. McGraw-Executive Vice President-Marketing, Communications and Community Relations
Ms. McGraw (54) has been our Executive Vice President-Marketing, Communications and Community Relations since May 2014. Previously, Ms. McGraw served as Executive Vice President, Corporate Communications and Community Relations since February 2010. Prior to that, Ms. McGraw served as Senior Vice President-Corporate Communications and Community Relations since February 2007 and as Vice President-Corporate Communications since May 2006. Prior thereto, Ms. McGraw served as Vice President-Business Planning and Communications for the Group President, Global Financial Services at American Express.
*Gerard Smyth-Executive Vice President and Chief Information Officer
Mr. Smyth (63) has been our Chief Information Officer since August 2020. Prior to that date, Mr. Smyth served as Executive Vice President-Technology for Ameriprise’s AWM Business since August 2013. Prior to joining Ameriprise in 2002, he held senior delivery and architectural roles with American Express, the Australian Stock Exchange and Qantas Airways. He has a bachelor’s degree in electronics engineering from Imperial College London and an MBA from the University of Sydney.
*Heather J. Melloh-Executive Vice President and General Counsel
Ms. Melloh (53) has been our Executive Vice President - General Counsel since June 2022. Ms. Melloh previously served as Senior Vice President & Assistant General Counsel since January 2020 to June 2022. From January 2017 until January 2020, Ms. Melloh was Vice President & Lead Chief Counsel. Ms. Melloh joined Ameriprise in 2005 and had previously been a partner at the law firm of Dorsey & Whitney, LLP in Minneapolis. She is active as a leader in many industry groups and within Ameriprise serves on the board of the Political Action Committee.
Patrick H. O’Connell-Executive Vice President, Ameriprise Advisor Group & Ameriprise Financial Institutions Group
Mr. O'Connell (55) has been our Executive Vice President of the Ameriprise Advisor Group since February 2013. He assumed additional responsibility for the Ameriprise Financial Institutions Group in 2017 following the Company’s purchase of Investment Professionals, Inc. (IPI). In 2022. Mr. O’Connell began to also oversee Experienced Advisor Recruiting for the Company. Prior to 2013, he was Senior Vice President for the employee advisor business in the eastern half of the United States and held a variety of senior leadership positions within the Company. Mr. O'Connell earned his M.B.A. and B.S. from Widener University and is a Certified Financial Planner® professional.
*Joseph E. Sweeney-President-Advice & Wealth Management, Products and Service Delivery
Mr. Sweeney (63) has been our President-Advice & Wealth Management, Products and Service Delivery since June 2012. Prior to that time, Mr. Sweeney served as President-Advice & Wealth Management, Products and Services since May 2009 and as President-Financial Planning, Products and Services since 2005. Prior to that, Mr. Sweeney served as Senior Vice President and General Manager of Banking, Brokerage and Managed Products of AEFC since April 2002. Prior thereto, he served as Senior Vice President and Head, Business Transformation, Global Financial Services of American Express from March 2001 until April 2002. Mr. Sweeney is on the board of directors of the Securities Industry and Financial Markets Association and the American Securities Association.
William J. (Bill) Williams-Executive Vice President, Ameriprise Franchise Group
Mr. Williams (57) has been our Executive Vice President, Ameriprise Franchise Group since February 2013. Mr. Williams joined Ameriprise in 1989 as an advisor. Mr. Williams has held a number of management roles within Ameriprise before assuming his current position. Mr. Williams is a graduate of Bentley University with a B.A. in Finance.
*Gumer Alvero-President-Insurance & Annuities
Mr. Alvero (57) has been our President - Insurance and Annuities since February 2022. Mr. Alvero previously served as Executive Vice President and General Manager -Insurance and Annuities from April 2021 to February 2022 and Executive Vice President and General Manager - Annuities from April 2010 to April 2021. Mr. Alvero joined Ameriprise in 1989. He earned a B.S. in business from the University of Minnesota.
* William Davies-Executive Vice President and Global Chief Investment Officer
Mr. Davies (61) has been our Executive Vice President and Global Chief Investment Officer since February 2022. Mr. Davies previously served as Global Head of Equities from July 2017 until February 2022. Mr. Davies joined Threadneedle Asset Management Limited at its inception in 1994 and previously held roles as head of EMEA equities, head of global equities and head of European equities. He has been a member of the investment community since 1985 and earned a B.A. in economics from Exeter University.
David Logan-Head of EMEA and Global Business Operations, Columbia Threadneedle Investments
Mr. Logan (55) has been our Head of EMEA and Global Business Operations for Columbia Threadneedle Investments since November 2023. Prior to that time, Mr. Logan had served as Global Chief Operating Officer at Columbia Threadneedle Investments since November 2021. Prior to that, Mr. Logan served as Head of Distribution from 2016 to 2021 and as Chief Operating Officer, EMEA from 2014 to 2016 for BMO Global Asset Management. He has worked in the financial services industry since 1994 and earned a B.A. in accounting and economics and is a member of the Institute of Chartered Accountants in Scotland.
Ameriprise Financial, Inc.
*William F. (Ted) Truscott-CEO-Global Asset Management
Mr. Truscott (64) has been our CEO - Global Asset Management since September 2012. Prior to that time, Mr. Truscott had served as CEO - U.S. Asset Management and President, Annuities since May 2010, as President - U.S. Asset Management, Annuities and Chief Investment Officer since February 2008 and as President - U.S. Asset Management and Chief Investment Officer since September 2005. Prior to that, Mr. Truscott served as Senior Vice President and Chief Investment Officer of AEFC, a position he held since he joined the company in September 2001.
CORPORATE GOVERNANCE
We have adopted a set of Corporate Governance Principles and Categorical Standards of Director Independence which, together with the charters of the three standing committees of the Board of Directors (Audit and Risk; Compensation and Benefits; and Nominating and Governance) and our Code of Conduct (which constitutes the Company’s code of ethics), provide the framework for the governance of our company. A complete copy of our Corporate Governance Guidelines and Categorical Standards of Director Independence, the charters of each of the Board committees, the Code of Conduct (which applies not only to our Chief Executive Officer, Chief Financial Officer and Controller, but also to all other employees of our company) and the Code of Business Conduct for the Members of the Board of Directors may be found by clicking the “Corporate Governance” link found on our Investor Relations website at ir.ameriprise.com. You may also access our Investor Relations website through our main website at ameriprise.com by clicking on the “Investor Relations” link, which is located at the bottom of the page. (Information from such sites is not incorporated by reference into this report.) You may also obtain free copies of these materials by writing to our Corporate Secretary at our principal executive offices.
Item 11. Executive Compensation
The following portions of the Proxy Statement are incorporated herein by reference:
•information under the caption “Corporate Governance-Committees of the Board-Board Committee Responsibilities - Compensation and Benefits Committee-Compensation Committee Interlocks and Insider Participation”;
•information included under the caption “Report of the Compensation and Benefits Committee”;
•information included under the captions “Compensation Discussion and Analysis” and “Compensation Tables” (other than under the heading “Pay Versus Performance”), and
•information included under the caption “Compensation of Directors.”
Item 12. Security Ownership of Certain Beneficial Owners and Management and Related Stockholder Matters
| | | | | | | | | | | | | | | | | | | | |
| Equity Compensation Plan Information | (a) | | (b) | | (c) | |
| Plan category | Number of securities to be issued upon exercise of outstanding options, warrants and rights | | Weighted-average exercise price of outstanding options, warrants and rights | | Number of securities remaining available for future issuance under equity compensation plans (excluding securities reflected in column (a)) – shares | |
| | | | | | |
| Equity compensation plans approved by security holders | 2,708,489 | | (1) | $ | 207.11 | | | 11,831,136 | | |
| Equity compensation plans not approved by security holders | 2,750,840 | | (2) | — | | | 1,376,564 | | (3) |
| Total | 5,459,329 | | | $ | 207.11 | | | 13,207,700 | | |
(1) Includes 1,124,808 share units subject to vesting per the terms of the applicable plan which could result in the issuance of common stock. As the terms of these share based awards do not provide for an exercise price, they have been excluded from the weighted average exercise price in column B. The maximum number of PSUs that could be earned under outstanding PSU grants is reflected but will not necessarily be earned subject to performance conditions.
(2) Includes 2,750,840 share units subject to vesting per the terms of the applicable plans which could result in the issuance of common stock. For additional information on the Company’s equity compensation plans see Note 20 — Share-Based Compensation to our Consolidated Financial Statements in Part II, Item 8 of this Annual Report on Form 10-K. The non-shareholder approved plans consist of the Ameriprise Advisor Group Deferred Compensation Plan and the Ameriprise Financial Franchise Advisor Deferred Compensation Plan.
(3) Consists of 611,740 shares of common stock issuable under the Ameriprise Advisor Group Deferred Compensation Plan, and 764,824 shares of common stock issuable under the Ameriprise Financial Franchise Advisor Deferred Compensation Plan.
Descriptions of our equity compensation plans can be found in Note 20 to our Consolidated Financial Statements included in Part II, Item 8 of this Annual Report on Form 10-K. Information concerning the market for our common shares and our shareholders can be found in Part II, Item 5 of this Annual Report on Form 10-K. The information included under the caption “Ownership of Our Common Shares” in the Proxy Statement is incorporated herein by reference.
Ameriprise Financial, Inc.
Item 13. Certain Relationships and Related Transactions, and Director Independence
The information under the captions “Corporate Governance-Board Composition-Director Independence,” “Corporate Governance-Board Composition-Independence of Committee Members” and “Certain Transactions” in the Proxy Statement is incorporated herein by reference.
Item 14. Principal Accountant Fees and Services
The information set forth under the heading “Item 4-Ratification of Audit and Risk Committee’s Selection of PricewaterhouseCoopers LLP as the Company’s Independent Registered Public Accounting Firm for 2025”, “-Independent Registered Public Accounting Firm Fees”; “-Services to Associated Organizations”; and “-Policy on Pre-Approval of Services Provided by Independent Registered Public Accounting Firm,” in the Proxy Statement is incorporated herein by reference.
Ameriprise Financial, Inc.
PART IV.
Item 15. Exhibits and Financial Statement Schedules
| | | | | | | | |
| (a) 1. | Financial Statements: The information required herein has been provided in Item 8, which is incorporated herein by reference. |
| 2. | Financial schedules required to be filed by Item 8 of this form, and by Item 15(b): Schedule I-Condensed Financial Information of Registrant (Parent Company Only) |
| | |
| | |
| | |
| | |
| All other financial schedules are not required under the related instructions, or are inapplicable and therefore have been omitted. |
| 3. | Exhibits: Pursuant to the rules and regulations of the Securities and Exchange Commission, we have filed certain agreements as exhibits to this Annual Report on Form 10-K. These agreements may contain representations and warranties by the parties. These representations and warranties have been made solely for the benefit of the other party or parties to such agreements and (i) may have been qualified by disclosures made to such other party or parties, (ii) were made only as of the date of such agreements or such other date(s) as may be specified in such agreements and are subject to more recent developments, which may not be fully reflected in our public disclosure, (iii) may reflect the allocation of risk among the parties to such agreements and (iv) may apply materiality standards different from what may be viewed as material to investors. Accordingly, these representations and warranties may not describe our actual state of affairs at the date hereof and should not be relied upon. The following exhibits are filed as part of this Annual Report on Form 10-K. The exhibit numbers followed by an asterisk (*) indicate exhibits electronically filed herewith. All other exhibit numbers indicate exhibits previously filed and are hereby incorporated herein by reference. |
| | | | | |
| Exhibit | Description |
| |
| Amended Restated Certificate of Incorporation of Ameriprise Financial, Inc. (incorporated by reference to Exhibit 3.1 to the Current Report on Form 8-K, File No. 1-32525, filed on May 1, 2014). |
| Certificate of Amendment to the Amended and Restated Certificate of Incorporation, as amended (incorporated by reference to Exhibit 3.1 to the Current Report on Form 8-K, File No. 1-32525, filed on April 26, 2024). |
| Amended and Restated Bylaws of Ameriprise Financial, Inc. |
| Description of Securities (incorporated by reference to Exhibit 4.1 to the Annual Report on Form 10-K, File No. 1-32525 filed on February 26, 2020). |
| Form of Specimen Common Stock Certificate (incorporated by reference to Exhibit 4.1 to Amendment No. 3 to Form 10 Registration Statement, File No. 1-32525, filed on August 19, 2005). Other instruments defining the rights of holders of long-term debt securities of the registrant are omitted pursuant to Section (b)(4)(iii)(A) of Item 601 of Regulation S-K. The registrant agrees to furnish copies of these instruments to the SEC upon request. |
| Indenture dated as of October 5, 2005, between Ameriprise Financial, Inc. and U.S. Bank National Association, trustee (incorporated by reference to Exhibit 4(a) to the Registration Statement on Form S-3, File No. 333-128834, filed on October 5, 2005). |
| Indenture dated as of May 5, 2006, between Ameriprise Financial, Inc. and U.S. Bank National Association, trustee (incorporated by reference to Exhibit 4.A to the Registration Statement on Form S-3ASR, File No. 333-133860, filed on May 5, 2006). |
| Junior Subordinated Debt Indenture, dated as of May 5, 2006, between Ameriprise Financial, Inc. and U.S. Bank National Association, trustee (incorporated by reference to Exhibit 4.C to the Registration Statement on Form S-3ASR, File No. 333-133860, filed on May 5, 2006). |
| Subordinated Debt Indenture, dated as of May 5, 2006, between Ameriprise Financial, Inc. and U.S. Bank National Association, trustee (incorporated by reference to Exhibit 4.B to the Registration Statement on Form S-3ASR, File No. 333-133860, filed on May 5, 2006). |
Ameriprise Financial, Inc.
| | | | | |
| Exhibit | Description |
| |
| Amendment to Amend and Restate Credit Agreement as the Fifth Amended and Restated Credit Agreement, dated as of November 25, 2024, among Ameriprise Financial, Inc., as Borrower, the lenders party thereto, Wells Fargo Bank, National Association as Administrative Agent, Swingline Lender and Issuing Lender, Bank of America, N.A. and Citibank, N.A. as Co-Syndication Agents, and Barclays Bank PLC, Goldman Sachs Bank USA, JPMorgan Chase Bank, N.A. and U.S. Bank National Association as Co-Documentation Agents, and Wells Fargo Securities, LLC, BofA Securities, Inc. and CitiGroup Global Markets Inc. as Joint Lead Arrangers and Joint Bookrunners (incorporated by reference to Exhibit 10.1 to the Current Report on Form 8-K, File No. 1-32525, filed on November 26, 2024). |
| Ameriprise Financial 2005 Incentive Compensation Plan, as amended and restated effective April 30, 2014 (incorporated by reference to Exhibit B to the Proxy Statement for the Annual Meeting of Shareholders held on April 30, 2014, File No. 001-32525, filed on March 17, 2014). |
| Ameriprise Financial 2005 Incentive Compensation Plan, as amended and restated (for awards made after April 26, 2023) (incorporated by reference to Exhibit 10.1 to the Current Report on Form 8-K File No. 1-32525, filed on April 28, 2023). |
| Ameriprise Financial Deferred Compensation Plan, as amended and restated effective January 1, 2012 (incorporated by reference to Exhibit 10.3 of the Annual Report on Form 10-K, File No. 1-32525, filed on February 24, 2012). |
| Ameriprise Financial Supplemental Retirement Plan, as amended and restated effective October 3, 2017 (incorporated by reference to Exhibit 10.4 of the Annual Report on Form 10-K, File No. 1-32525, filed on February 23, 2018). |
| Ameriprise Financial Form of Award Certificate — Non-Qualified Stock Option Award (incorporated by reference to Exhibit 10.4 to the Current Report on Form 8-K, File No. 1-32525, filed on October 4, 2005). |
| Ameriprise Financial Form of Award Certificate — Restricted Stock Award (incorporated by reference to Exhibit 10.5 to the Current Report on Form 8-K, File No. 1-32525, filed on October 4, 2005). |
| Ameriprise Financial Form of Award Certificate — Restricted Stock Unit Award (incorporated by reference to Exhibit 10.6 to the Current Report on Form 8-K, File No. 1-32525, filed on October 4, 2005). |
| Ameriprise Financial, Inc. Global Long-Term Incentive Award Program Guide. |
| Ameriprise Financial, Inc. Performance Cash Unit Supplement to the Global Long-Term Incentive Award Program Guide. |
| Ameriprise Financial Form of Award Certificate — Performance Cash Unit Plan Award (incorporated by reference to Exhibit 10.12 of the Annual Report on Form 10-K File No. 1-32525, filed on February 25, 2016). |
| Ameriprise Financial, Inc Performance Share Unit Supplement to the Global Long-Term Incentive Award Program Guide. |
| Ameriprise Financial Form of Award Certificate — Performance Share Unit Plan Award (incorporated by reference to Exhibit 10.14 of the Annual Report on Form 10-K File No. 1-32525, filed on February 25, 2016). |
| Ameriprise Financial Deferred Share Plan for Outside Directors, as amended and restated effective December 3, 2014 (incorporated by reference to Exhibit 10.15 of the Annual Report on Form 10-K File No. 1-32525, filed on February 24, 2015). |
| CEO Security and Compensation Arrangements (incorporated by reference to Item 1.01 of the Current Report on Form 8-K, File No. 1-32525, filed on October 31, 2005). |
| Ameriprise Financial Senior Executive Severance Plan, as amended and restated effective January 1, 2012 (incorporated by reference to Exhibit 10.17 of the Annual Report on Form 10-K, File No. 1-32525, filed on February 24, 2012). |
| First Amendment to the Ameriprise Financial Senior Executive Severance Plan (incorporated by reference to Exhibit 10.40 to the Annual Report on Form 10-K, File No. 1-32525, filed on February 22, 2024). |
| Form of Indemnification Agreement for directors, Chief Executive Officer, Chief Financial Officer and Principal Accounting Officer and any other officers designated by the Chief Executive Officer (incorporated by reference to Exhibit 10.1 to the Current Report on Form 8-K, File No. 1-32525, filed on April 26, 2012). |
| Ameriprise Financial Global Annual Incentive Award Plan, as amended and restated as of January 1, 2025. |
| Threadneedle Deferral Plan (as amended and restated effective January 1, 2025). |
| Deferred Stock Unit Award Certificate - Threadneedle Deferral Plan (incorporated by reference to Exhibit 10.26 of the Annual Report on Form 10-K File No. 1-32525, filed on February 25, 2022). |
| Form of Deferred Stock Unit Award - Threadneedle Deferral Plan (incorporated by reference to Exhibit 10.27 of the Annual Report on Form 10-K File No. 1-32525, filed on February 25, 2022). |
| Severance Plan for William Davies (incorporated by reference to Exhibit 10.1 of the Quarterly Report on Form 10-Q File No. 1-32525, filed on May 2, 2023). |
| Deferred Stock Unit Award Certificate - Threadneedle Deferral Plan (for grants after April 26, 2023) (incorporated by reference to Exhibit 10.2 of the Quarterly Report on Form 10-Q File No. 1-32525, filed on August 8, 2023). |
| Deferred Stock Option Award Certificate - Threadneedle Deferral Plan (for grants after April 26, 2023) (incorporated by reference to Exhibit 10.3 of the Quarterly Report on Form 10-Q File No. 1-32525, filed on August 8, 2023). |
| Form of Deferred Stock Option Award - Threadneedle Deferral Plan (incorporated by reference to Exhibit 10.4 of the Quarterly Report on Form 10-Q File No. 1-32525, filed on August 8, 2023). |
| Threadneedle Deferral Plan Deferred Stock Unit and Deferred Stock Option Programme Guide. |
Ameriprise Financial, Inc.
| | | | | |
| Exhibit | Description |
| |
| Ameriprise Financial Form of Award Certificate - EMEA Performance Share Unit Plan Award (incorporated by reference to Exhibit 10.8 of the Quarterly Report on Form 10-Q File No. 1-32525, filed on August 8, 2023). |
| Ameriprise Financial Form of Award Certificate - EMEA Performance Share Unit Plan Award (for grants after April 26, 2023) (incorporated by reference to Exhibit 10.33 to the Annual Report on Form 10-K, File No. 1-32525, filed on February 22, 2024). |
| Ameriprise Financial Form of Award Certificate - Performance Cash Unit Award (for grants after April 26, 2023) (incorporated by reference to Exhibit 10.34 to the Annual Report on Form 10-K, File No. 1-32525, filed on February 22, 2024). |
| Ameriprise Financial Form of Award Certificate - Performance Share Unit Award (for grants after April 26, 2023) (incorporated by reference to Exhibit 10.35 to the Annual Report on Form 10-K, File No. 1-32525, filed on February 22, 2024). |
| Ameriprise Financial Form of Award Certificate - Restricted Stock Award (for grants after April 26, 2023) (incorporated by reference to Exhibit 10.36 to the Annual Report on Form 10-K, File No. 1-32525, filed on February 22, 2024). |
| Ameriprise Financial Form of Award Certificate - Restricted Stock Unit Award (for grants after April 26, 2023) (incorporated by reference to Exhibit 10.37 to the Annual Report on Form 10-K, File No. 1-32525, filed on February 22, 2024). |
| Ameriprise Financial Form of Award Certificate - Non-Qualified Stock Option Award (for grants after April 26, 2023) (incorporated by reference to Exhibit 10.38 to the Annual Report on Form 10-K, File No. 1-32525, filed on February 22, 2024). |
| Ameriprise Financial Form of Award Certificate - Performance Cash Unit Award (for grants after January 1, 2025). |
| Ameriprise Financial Form of Award Certificate - Performance Share Unit Award (for grants after January 1, 2025). |
| Ameriprise Financial Form of Award Certificate - Restricted Stock Unit Award (for grants after January 1, 2025). |
| Ameriprise Financial Form of Award Certificate - Non-Qualified Stock Option Award (for grants after January 1, 2025). |
| Deferred Stock Unit Award Certificate - Threadneedle Deferral Plan (for grants after January 1, 2025). |
| Deferred Stock Option Award Certificate - Threadneedle Deferral Plan (for grants after January 1, 2025). |
| Portions of the Ameriprise Financial, Inc. 2024 Annual Report to Shareholders, which are furnished solely for the information of the SEC and are not to be deemed “filed.” |
| Securities Trading Policy for Directors, Section 16 Officers and Executive Leadership Team. |
| Enterprise Securities Trading Policies. |
| Subsidiaries of Ameriprise Financial, Inc. |
| Consent of PricewaterhouseCoopers LLP, Independent Registered Public Accounting Firm. |
| Powers of attorney |
| Certification of James M. Cracchiolo pursuant to Rule 13a-14(a) promulgated under the Securities Exchange Act of 1934, as amended. |
| Certification of Walter S. Berman pursuant to Rule 13a-14(a) promulgated under the Securities Exchange Act of 1934, as amended. |
| Certification of James M. Cracchiolo and Walter S. Berman pursuant to 18 U.S.C. Section 1350, as adopted pursuant to Section 906 of the Sarbanes-Oxley Act of 2002. |
| Ameriprise Financial, Inc. Policy for the Recovery of Erroneously Awarded Compensation (incorporated by reference to Exhibit 3.2 to the Annual Report on Form 10-K File No. 1-32525, filed on February 22, 2024). |
| 101 | The following materials from Ameriprise Financial, Inc.’s Annual Report on Form 10-K for the year ended December 31, 2024 are formatted in iXBRL (Inline eXtensible Business Reporting Language): (i) Consolidated Statements of Operations for the years ended December 31, 2024, 2023 and 2022; (ii) Consolidated Statements of Comprehensive Income for the years ended December 31, 2024, 2023 and 2022; (iii) Consolidated Balance Sheets at December 31, 2024 and 2023; (iv) Consolidated Statements of Equity for the years ended December 31, 2024, 2023 and 2022; (v) Consolidated Statements of Cash Flows for the years ended December 31, 2024, 2023 and 2022; and (vi) Notes to the Consolidated Financial Statements. |
| 104 | The cover page from Ameriprise Financial, Inc.’s Annual Report on Form 10-K for the year ended December 31, 2024 is formatted in iXBRL and contained in Exhibit 101. |
| * Filed electronically herewith. |
| † Management contract or compensation plan or arrangement |
Item 16. Form 10-K Summary
None.
Ameriprise Financial, Inc.
Signatures
Pursuant to the requirements of Section 13 or 15(d) of the Securities Exchange Act of 1934, the registrant has duly caused this report to be signed on its behalf by the undersigned, thereunto duly authorized.
AMERIPRISE FINANCIAL, INC.
Registrant
| | | | | | | | | | | |
| Date: | February 20, 2025 | By | /s/ Walter S. Berman |
| Walter S. Berman
Executive Vice President and Chief Financial Officer |
Pursuant to the requirements of the Securities Exchange Act of 1934, this report has been signed below by the following persons on behalf of the registrant and in the capacity and on the dates indicated.
| | | | | | | | | | | |
| Date: | February 20, 2025 | By | /s/ James M. Cracchiolo |
| James M. Cracchiolo Chairman and Chief Executive Officer (Principal Executive Officer and Director) |
| | | | | | | | | | | |
| Date: | February 20, 2025 | By | /s/ Walter S. Berman |
| Walter S. Berman
Executive Vice President and Chief Financial Officer
(Principal Financial Officer) |
| | | | | | | | | | | |
| Date: | February 20, 2025 | By | /s/ Dawn M. Brockman |
| Dawn M. Brockman
Senior Vice President and Controller
(Principal Accounting Officer) |
| | | | | | | | | | | |
| Date: | February 20, 2025 | By | /s/ Dianne Neal Blixt* |
| Dianne Neal Blixt
Director |
| | | | | | | | | | | |
| Date: | February 20, 2025 | By | /s/ Amy DiGeso* |
| Amy DiGeso
Director |
| | | | | | | | | | | |
| Date: | February 20, 2025 | By | /s/ Armando Pimentel, Jr.* |
| Armando Pimentel, Jr.
Director |
| | | | | | | | | | | |
| Date: | February 20, 2025 | By | /s/ Robert F. Sharpe, Jr.* |
| Robert F. Sharpe, Jr.
Director |
| | | | | | | | | | | |
| Date: | February 20, 2025 | By | /s/ Brian T. Shea* |
| Brian T. Shea
Director |
| | | | | | | | | | | |
| Date: | February 20, 2025 | By | /s/ W. Edward Walter III* |
| W. Edward Walter III
Director |
Ameriprise Financial, Inc.
| | | | | | | | | | | |
| Date: | February 20, 2025 | By | /s/ Christopher J. Williams* |
| Christopher J. Williams
Director |
| | | | | |
| *By | /s/ Walter S. Berman |
| Walter S. Berman
Executive Vice President and Chief Financial Officer |
*Walter S. Berman, by signing his name hereto on the 20th day of February, 2025 does hereby sign this document pursuant to powers of attorney duly executed by the Directors named, filed with the Securities and Exchange Commission on behalf of such Directors as Exhibit 24 to this Form 10-K, all in the capacities and on the date stated, such persons being the majority of the Directors of the Registrant.
Ameriprise Financial, Inc.
Schedule I - Condensed Financial Information of Registrant
(Parent Company Only)
Ameriprise Financial, Inc.
| | | | | | | | | | | | | | | | | |
Schedule I — Condensed Financial Information of Registrant
Condensed Statements of Operations (Parent Company Only) |
| Years Ended December 31, |
| 2024 | | 2023 | | 2022 |
| (in millions) |
| Revenues | | | | | |
| | | | | |
| Net investment income | $ | 94 | | | $ | 77 | | | $ | 16 | |
| Other revenues | 11 | | | 5 | | | 6 | |
| | | | | |
| Total revenues | 105 | | | 82 | | | 22 | |
| Banking and deposit interest expense | 35 | | | 35 | | | 8 | |
| Total net revenues | 70 | | | 47 | | | 14 | |
| | | | | |
| Expenses | | | | | |
| | | | | |
| Distribution expenses | 61 | | | 46 | | | 4 | |
| Interest and debt expense | 144 | | | 138 | | | 104 | |
| General and administrative expense | 328 | | | 306 | | | 265 | |
| Total expenses | 533 | | | 490 | | | 373 | |
| Pretax loss before equity in earnings of subsidiaries | (463) | | | (443) | | | (359) | |
| Income tax provision | 182 | | | 142 | | | 139 | |
| Loss before equity in earnings of subsidiaries | (645) | | | (585) | | | (498) | |
| Equity in earnings of subsidiaries, net of tax | 4,046 | | | 3,141 | | | 3,647 | |
| Net income | 3,401 | | | 2,556 | | | 3,149 | |
| Other comprehensive income (loss), net of tax | (142) | | | 780 | | | (1,904) | |
| Total comprehensive income (loss) | $ | 3,259 | | | $ | 3,336 | | | $ | 1,245 | |
See Notes to Condensed Financial Information of Registrant.
Ameriprise Financial, Inc.
| | | | | | | | | | | |
Schedule I — Condensed Financial Information of Registrant
Condensed Balance Sheets (Parent Company Only) |
| December 31, |
| 2024 | | 2023 |
| (in millions, except share amounts) |
| Assets | | | |
| Cash and cash equivalents | $ | 844 | | | $ | 519 | |
| Investments | 921 | | | 841 | |
| Loans to subsidiaries | 343 | | | 489 | |
| Due from subsidiaries | 273 | | | 246 | |
| Receivables | 26 | | | 49 | |
| Land, buildings, equipment, and software, net of accumulated depreciation of $779 and $791, respectively | 303 | | | 265 | |
| Investments in subsidiaries | 6,910 | | | 6,974 | |
| Other assets | 1,605 | | | 1,580 | |
| Total assets | $ | 11,225 | | | $ | 10,963 | |
| | | |
| Liabilities and Equity | | | |
| Liabilities: | | | |
| Accounts payable and accrued expenses | $ | 1,422 | | | $ | 1,229 | |
| Due to subsidiaries | 347 | | | 347 | |
| Borrowings from subsidiaries | 756 | | | 580 | |
| Long-term debt | 2,842 | | | 3,398 | |
| Other liabilities | 630 | | | 680 | |
| Total liabilities | 5,997 | | | 6,234 | |
| | | |
| Equity: | | | |
| Common shares ($0.01 par value; shares authorized, 1,250,000,000; shares issued, 337,729,050 and 336,780,893, respectively) | 3 | | | 3 | |
| Additional paid-in capital | 10,141 | | | 9,824 | |
| Retained earnings | 24,713 | | | 21,905 | |
| Treasury shares, at cost (241,562,357 and 236,607,681 shares, respectively) | (27,721) | | | (25,237) | |
| Accumulated other comprehensive income (loss), net of tax, including amounts applicable to equity investments in subsidiaries | (1,908) | | | (1,766) | |
| Total equity | 5,228 | | | 4,729 | |
| Total liabilities and equity | $ | 11,225 | | | $ | 10,963 | |
See Notes to Condensed Financial Information of Registrant.
Ameriprise Financial, Inc.
| | | | | | | | | | | | | | | | | |
Schedule I — Condensed Financial Information of Registrant
Condensed Statements of Cash Flows (Parent Company Only) |
| Years Ended December 31, |
| 2024 | | 2023 | | 2022 |
| (in millions) |
| Cash Flows from Operating Activities | | | | | |
| Net income | $ | 3,401 | | | $ | 2,556 | | | $ | 3,149 | |
| Equity in earnings of subsidiaries | (4,046) | | | (3,141) | | | (3,647) | |
| Dividends received from subsidiaries | 3,731 | | | 3,025 | | | 2,512 | |
| | | | | |
| Other operating activities, primarily with subsidiaries | 422 | | | 453 | | | 226 | |
| Net cash provided by (used in) operating activities | 3,508 | | | 2,893 | | | 2,240 | |
| | | | | |
| Cash Flows from Investing Activities | | | | | |
| Available-for-Sale securities: | | | | | |
| Proceeds from sales | — | | | 4 | | | — | |
| Maturities, sinking fund payments and calls | 55 | | | 43 | | | 153 | |
| Purchases | (128) | | | (38) | | | (124) | |
| Proceeds from sales of other investments | — | | | — | | | 7 | |
| Purchase of other investments | — | | | (10) | | | (1) | |
| | | | | |
| Purchase of land, buildings, equipment and software | (59) | | | (87) | | | (70) | |
| | | | | |
| | | | | |
| | | | | |
| Contributions to subsidiaries | (145) | | | (324) | | | (743) | |
| Return of capital from subsidiaries | 351 | | | — | | | 207 | |
| Repayment of loans to subsidiaries | 3,406 | | | 1,992 | | | 1,960 | |
| Issuance of loans to subsidiaries | (3,260) | | | (2,232) | | | (1,726) | |
| | | | | |
| Other, net | (1) | | | 2 | | | — | |
| Net cash provided by (used in) investing activities | 219 | | | (650) | | | (337) | |
| | | | | |
| Cash Flows from Financing Activities | | | | | |
| Dividends paid to shareholders | (574) | | | (550) | | | (534) | |
| Repurchase of common shares | (2,448) | | | (2,127) | | | (1,978) | |
| | | | | |
| Issuance of long-term debt, net of issuance costs | — | | | 1,335 | | | 495 | |
| Repayments of long-term debt | (561) | | | (760) | | | (510) | |
| Borrowings from subsidiaries | 726 | | | 1,003 | | | 1,210 | |
| Repayments of borrowings from subsidiaries | (586) | | | (951) | | | (1,034) | |
| | | | | |
| Other, net | 41 | | | (35) | | | (18) | |
| Net cash provided by (used in) financing activities | (3,402) | | | (2,085) | | | (2,369) | |
| Net increase (decrease) in cash and cash equivalents | 325 | | | 158 | | | (466) | |
| Cash and cash equivalents at beginning of period | 519 | | | 361 | | | 827 | |
| Cash and cash equivalents at end of period | $ | 844 | | | $ | 519 | | | $ | 361 | |
| | | | | |
| Supplemental Disclosures: | | | | | |
| Interest paid on debt | $ | 148 | | | $ | 129 | | | $ | 98 | |
| Income taxes paid, net | 179 | | | 233 | | | 91 | |
| Non-cash dividends from subsidiaries | — | | | 77 | | | — | |
| | | | | |
See Notes to Condensed Financial Information of Registrant.
Ameriprise Financial, Inc.
Schedule I — Condensed Financial Information of Registrant
Notes to Condensed Financial Information of Registrant
(Parent Company Only)
1. Basis of Presentation
The accompanying Condensed Financial Statements include the accounts of Ameriprise Financial, Inc. (the “Parent Company”) and, on an equity basis, its subsidiaries and affiliates. The Condensed Financial Statements have been prepared in accordance with U.S. generally accepted accounting principles. The financial information of the Parent Company should be read in conjunction with the Consolidated Financial Statements and Notes of Ameriprise Financial, Inc. and its subsidiaries (“Ameriprise Financial”). Parent Company revenues and expenses, other than interest and debt expense, are primarily related to intercompany transactions with subsidiaries and affiliates.
2. Investments
On December 23, 2020, RiverSource Life Insurance Company (“RiverSource Life”) issued a $500 million unsecured 3.5% surplus note due December 31, 2050 to the Parent Company. The surplus note is subordinate in right of payment to the prior payment in full of RiverSource Life’s obligations to policyholders, claimants and beneficiaries and all other creditors. No payment of principal or interest shall be made without the prior approval of the Minnesota Department of Commerce and such payments shall be made only from RiverSource Life’s statutory surplus. Interest payments, which commenced on June 30, 2021, are due semi-annually in arrears on June 30 and December 31. Subject to the preceding conditions, RiverSource Life may prepay all or a portion of the principal at any time. The held-to-maturity investment was $500 million as of both December 31, 2024 and 2023 and is recorded in Investments on the Parent Company’s Condensed Balance Sheets. For the years ended December 31, 2024, 2023 and 2022, interest income was $18 million and is reported in Net investment income on the Parent Company’s Condensed Statements of Operations.
In June of 2024, the Parent Company invested $69 million in an unrated residual tranche issued by Ameriprise Installment Financing, LLC, a subsidiary of the Parent Company. The residual tranche is collateralized by a portfolio of loans issued to advisors affiliated with Ameriprise Financial Services, LLC (“AFS”), a subsidiary of the Parent Company. As of December 31, 2024, the fair value of the residual tranche was $60 million and is reported in Investments on the Parent Company’s Condensed Balance Sheets. Interest income from the residual tranche was $2 million for the year ending December 31, 2024 and is reported in Net investment income on the Parent Company’s Condensed Statements of Operations.
In September of 2022, the Parent Company redeemed the outstanding unrated residual tranche issued by Ameriprise Advisor Financing, LLC (“AAF”), a subsidiary of the Parent Company, realizing a $23 million loss, and invested $30 million in a new unrated residual tranche issued by Ameriprise Advisor Financing 2, LLC (“AAF 2”). As of December 31, 2024 and 2023, the fair value of the residual tranche was $56 million and $30 million, respectively, and is reported in Investments on the Parent Company’s Condensed Balance Sheets. Interest income from the residual tranche was $7 million for the years ended December 31, 2024, 2023 and 2022 and is reported in Net investment income on the Parent Company’s Condensed Statements of Operations.
3. Debt
All of the debt of Ameriprise Financial is borrowings of the Parent Company, except as indicated below.
•As of both December 31, 2024 and 2023, Ameriprise Financial had $201 million of borrowings from the Federal Home Loan Bank of Des Moines, which is primarily collateralized with commercial mortgage backed securities and residential mortgage backed securities.
•As of December 31, 2024 and 2023, Ameriprise Financial debt included nil and $1 million, respectively, of other subsidiary lease obligations.
4. Borrowings from Subsidiaries
The Parent Company has intercompany lending arrangements with its subsidiaries. At the end of each business day, taking into consideration all legal and regulatory requirements associated with its subsidiaries, the Parent Company is entitled to draw on all funds in specified bank accounts. Repayment of all or a portion of the funds is due on demand. As of December 31, 2024 and 2023, the Company had $415 million and $375 million, respectively, available for repayment due on demand. The Parent Company also has revolving credit agreements with its subsidiaries as the borrower aggregating $1.3 billion as of both December 31, 2024 and 2023, of which $340 million and $205 million was outstanding as of December 31, 2024 and 2023, respectively.
5. Guarantees, Commitments and Contingencies
The Parent Company is the guarantor for operating leases of certain subsidiaries. All consolidated legal, regulatory and arbitration proceedings, including class actions of Ameriprise Financial are potential or current obligations of the Parent Company. The Parent Company has committed revolving credit agreements with its subsidiaries as the lender aggregating $363 million as of both December 31, 2024 and 2023, of which $99 million and $246 million was outstanding as of December 31, 2024 and 2023, respectively.
The Parent Company and Ameriprise Certificate Company (“ACC”) entered into a Capital Support Agreement on March 2, 2009, pursuant to which the Parent Company agrees to commit such capital to ACC as is necessary to satisfy applicable minimum capital requirements. Effective April 30, 2014, this agreement was amended to revise the maximum commitment to $50 million. For the years ended December 31, 2024, 2023 and 2022, ACC did not draw upon the Capital Support Agreement and had met all applicable capital requirements.
Ameriprise Financial, Inc.
AFS entered into a Financial Industry Regulatory Authority (“FINRA”) approved subordinated loan agreement with the Parent Company on December 15, 2014 for regulatory net capital purposes. The agreement consists of a $200 million secured demand note. The note is secured by cash and securities equal to the principal value of the note pledged by the Parent Company. As of both December 31, 2024 and 2023, AFS had not made a demand of the principal amount.
Ameriprise Enterprise Investment Services, Inc. (“AEIS”) entered into a FINRA approved subordinated loan agreement with the Parent Company on January 25, 2017 for regulatory net capital purposes. Under this agreement, AEIS borrowed $60 million from the Parent Company with an initial term of five years to be repaid no later than January 25, 2022. Both companies have the option to renew the agreement in one year-increments in perpetuity. The agreement was renewed in January 2022 and each year thereafter, extending the current maturity date to January 25, 2026.
6. Subsequent Events
The Parent Company made two $30 million cash contributions to Ameriprise Advisor Capital, LLC. The first occured on January 6, 2025 and the second occurred on January 27, 2025.