| |
|
| OMB APPROVAL |
|
| OMB Number: 3235-0570 |
| Expires: September 30, 2007 |
| Estimated average burden |
| hours per response: 19.4 |
|
UNITED STATES
SECURITIES AND EXCHANGE COMMISSION
Washington, D.C. 20549
FORM N-CSR
CERTIFIED SHAREHOLDER REPORT OF REGISTERED
MANAGEMENT INVESTMENT COMPANIES
Investment Company Act file number 811-05309
First American Investment Funds, Inc.
(Exact name of registrant as specified in charter)
| | | |
800 Nicollet Mall, Minneapolis, MN
(Address of principal executive offices) | | 55402
(Zip code) |
Charles D. Gariboldi, Jr., 800 Nicollet Mall, Minneapolis, MN 55402
(Name and address of agent for service)
Registrant’s telephone number, including area code: 800-677-3863
Date of fiscal period end: October 31
Date of reporting period: October 31, 2006
Form N-CSR is to be used by management investment companies to file reports with the Commission not later than 10 days after the transmission to stockholders of any report that is required to be transmitted to stockholders under Rule 30e-1 under the Investment Company Act of 1940 (17 CFR 270.30e-1). The Commission may use the information provided on Form N-CSR in its regulatory, disclosure review, inspection, and policymaking roles.
A registrant is required to disclose the information specified by Form N-CSR, and the Commission will make this information public. A registrant is not required to respond to the collection of information contained in Form N-CSR unless the Form displays a currently valid Office of Management and Budget (“OMB”) control number. Please direct comments concerning the accuracy of the information collection burden estimate and any suggestions for reducing the burden to Secretary, Securities and Exchange Commission, 450 Fifth Street, NW, Washington, DC 20549-0609. The OMB has reviewed this collection of information under the clearance requirements of 44 U.S.C. Section 3507.
Item 1. Report to Shareholders
Table of Contents
Mutual fund investing involves risk; principal loss is possible.
| |
| | NOT FDIC INSURED NO BANK GUARANTEE MAY LOSE VALUE |
Message to SHAREHOLDERS December 11, 2006
| |
| Dear Shareholders: | |
| |
| We invite you to take a few minutes to review the results of the fiscal year ended October 31, 2006. | |
This report includes comparative performance graphs and tables, portfolio commentaries, complete listings of portfolio holdings, and additional fund information. We hope you will find this helpful in monitoring your investment portfolio.
Also, through our website, firstamericanfunds.com, we provide quarterly performance fact sheets on all First American Funds, the economic outlook as viewed by our senior investment officers, and other information about fund investments and portfolio strategies.
Please contact your financial professional if you have questions about First American Funds or contact First American Investor Services at 800.677.FUND.
We appreciate your investment with First American Funds and look forward to serving your financial needs in the future.
Sincerely,
| | | |
 | |  |
| |
Virginia L. Stringer
Chairperson of the Board
First American Investment Funds, Inc. | | Thomas S. Schreier, Jr.
President
First American Investment Funds, Inc. |
First American Funds Annual Report 2006 1
Equity Index fund
Investment Objective: to provide investment results that correspond to the performance of the Standard & Poor’s 500 Index* (“S&P 500 Index”)
How did the fund perform for the fiscal year ended October 31, 2006?
The First American Equity Index Fund (the “fund”), Class Y shares, returned 16.07% for the fiscal year October 31, 2006 (Class A shares returned 15.76% without taking the sales charge into account). By comparison, the fund’s benchmark, the S&P 500 Index, returned 16.34% for the same period.
General economic and market conditions
Economic growth slowed from very strong levels through the first quarter of 2006 to below-potential levels by the end of October. Inflation pressures rose through much of this period in a lagging response to the very strong growth through the first portion of this year, but diminished considerably by October. The Federal Reserve (the “Fed”) continued to tighten monetary policy through June as a result of the increase in inflation pressures, but has kept policy steady since that time as its forecast of slowing economic growth and dissipating inflation pressures has been realized. Corporate profit growth remained strong over this 12-month period with third-quarter 2006 earnings of S&P 500 companies advancing by roughly 20% on a year-over-year basis. The strength in corporate earnings, along with lessening inflation pressures and expectations that the Fed will begin easing monetary policy in 2007, has proved to be favorable for the equity markets through October 2006.
Fund overview
The fund is invested to replicate the S&P 500 Index as closely as possible with consideration given to turnover costs and fees. As a result, the fund performed very similarly to the index. The index includes 500 leading companies in the major industries of the U.S. economy and covers about 75% of the dollar value of all traded stocks in the U.S. market.
The best-performing sectors during the fiscal year were telecommunications, materials, and financials, having risen by 33%, 25%, and 20%, respectively. Even the weakest-performing sectors over the same period – technology and healthcare – posted gains, rising by 10% and 11%, respectively. Since August, market leadership has passed from the energy sector, which fell by 2.2% during the last fiscal quarter, to the technology sector, which rose by 17.4%.
| |
| * | Unlike mutual funds, index returns do not reflect any expenses, transaction costs, or cash flow effects. |
Top 10 Holdings as of October 31, 20061 (% of net assets)
| | | | | |
| Exxon Mobil | | | 3.5 | % |
| General Electric | | | 2.9 | |
| Bank of America | | | 2.0 | |
| Citigroup | | | 2.0 | |
| Microsoft | | | 2.0 | |
| Procter & Gamble | | | 1.7 | |
| Johnson & Johnson | | | 1.6 | |
| Pfizer | | | 1.6 | |
| American International Group | | | 1.4 | |
| Altria Group | | | 1.3 | |
Sector Allocation as of October 31, 20061 (% of net assets)
| | | | | |
| Financials | | | 21.8 | % |
| Information Technology | | | 15.5 | |
| Healthcare | | | 12.3 | |
| Industrials | | | 10.8 | |
| Consumer Discretionary | | | 10.4 | |
| Energy | | | 9.5 | |
| Consumer Staples | | | 9.4 | |
| Telecommunication Services | | | 3.4 | |
| Utilities | | | 3.4 | |
| Materials | | | 2.9 | |
| Short-Term Investments | | | 0.8 | |
Other Assets and Liabilities, Net2 | | | (0.2 | ) |
| | | | |
| | | | 100.0 | % |
| |
| 1 | Fund holdings and sector allocations are subject to change at any time and are not recommendations to buy or sell any security. |
| |
| 2 | Investments in securities typically comprise substantially all the fund’s net assets. Other assets and liabilities include receivables for items such as income earned but not yet received and payables for items such as fund expenses incurred but not yet paid. |
2 First American Funds Annual Report 2006
Equity Index fund continued
Annual Performance1
| | | | | | | | | | | | | | | | | | | | | | | | | | | | | | | | | | | | | | | | | |
| | | October 31, 2006 | | | September 30, 2006* | |
| | | | | | | |
| | | | | Since Inception | | | | | Since Inception | |
| | | | | | | | | | | |
| | | 1 year | | | 5 years | | | 10 years | | | 2/01/1999 | | | 9/24/2001 | | | 1 year | | | 5 years | | | 10 years | | | 2/01/1999 | | | 9/24/2001 | |
Average annual return with sales charge (POP) | | | | | | | | | | | | | | | | | | | | | | | | | | | | | | | | | | | | | | | | |
| Class A | | | 9.42% | | | | 5.48% | | | | 7.42% | | | | — | | | | — | | | | 4.22% | | | | 5.22% | | | | 7.36% | | | | — | | | | — | |
| |
| Class B | | | 9.94% | | | | 5.57% | | | | 7.22% | | | | — | | | | — | | | | 4.43% | | | | 5.29% | | | | 7.16% | | | | — | | | | — | |
| |
| Class C | | | 13.93% | | | | 5.88% | | | | — | | | | 1.26 | % | | | — | | | | 8.45% | | | | 5.61% | | | | — | | | | 0.86 | % | | | — | |
Average annual return without sales charge (NAV) | | | | | | | | | | | | | | | | | | | | | | | | | | | | | | | | | | | | | | | | |
| Class A | | | 15.76% | | | | 6.68% | | | | 8.02% | | | | — | | | | — | | | | 10.29% | | | | 6.41% | | | | 7.97% | | | | — | | | | — | |
| |
| Class B | | | 14.94% | | | | 5.89% | | | | 7.22% | | | | — | | | | — | | | | 9.43% | | | | 5.61% | | | | 7.16% | | | | — | | | | — | |
| |
| Class C | | | 14.93% | | | | 5.88% | | | | — | | | | 1.26 | % | | | — | | | | 9.45% | | | | 5.61% | | | | — | | | | 0.86 | % | | | — | |
| |
| Class R | | | 15.47% | | | | 6.55% | | | | — | | | | — | | | | 7.57 | % | | | 10.00% | | | | 6.28% | | | | — | | | | — | | | | 7.04 | % |
| |
| Class Y | | | 16.07% | | | | 6.96% | | | | 8.29% | | | | — | | | | — | | | | 10.57% | | | | 6.68% | | | | 8.24% | | | | — | | | | — | |
| |
S&P 500 Index2 | | | 16.34% | | | | 7.26% | | | | 8.64% | | | | 2.63 | % | | | 8.29 | % | | | 10.79% | | | | 6.97% | | | | 8.59% | | | | 2.23 | % | | | 7.74 | % |
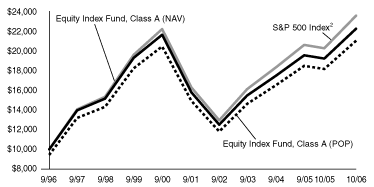
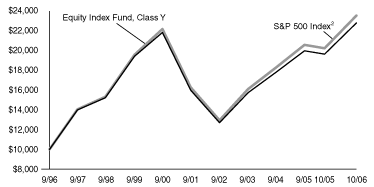
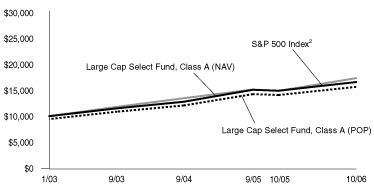
Value of $10,000 Investment1, 3 as of October 31, 2006
The chart above illustrates the total value of an assumed $10,000 investment in the fund’s Class A and Class Y shares (from 09/30/1996 to 10/31/2006) as compared to the S&P 500 Index2.
| |
| The performance data quoted on this page represents past performance and does not guarantee future results. The investment return and principal value of an investment will fluctuate so that an investor’s shares, when redeemed, may be worth more or less than their original cost. Current performance of the fund may be lower or higher than the performance data quoted. Performance data current to the most recent month-end may be obtained by calling 800.677.FUND. |
| |
| * | This table represents average annual total returns through the latest calendar quarter – rather than through the end of the fiscal period. |
| |
| 1 | Performance does not reflect the deduction of taxes that a shareholder would pay on fund distributions or redemption of fund shares. Performance reflects voluntary fee waivers in effect. In the absence of such fee waivers, total returns would be reduced. Index performance is for illustrative purposes only and does not reflect any expenses, transaction costs, or cash flow effects. Direct investment in the index is not available. |
Mutual fund investing involves risk; principal loss is possible. Total returns at net asset value (“NAV”) reflect performance over the time period indicated without including the fund’s maximum sales charge and assume reinvestment of all distributions at NAV.
Total returns at public offering price (“POP”) reflect performance over the time period indicated including maximum sales charges of 5.50% for Class A shares and the contingent deferred sales charge (“CDSC”) for Class B and Class C shares for the relevant period. Maximum CDSC is 5.00% for Class B shares in the first year, decreasing annually to 0% in the seventh year following purchase, and 1.00% for Class C shares. Total returns assume reinvestment of all distributions at NAV.
| |
| 2 | An unmanaged, market capitalization-weighted index based on the average weighted performance of 500 widely held common stocks. |
| |
| 3 | Performance for Class B, Class C, and Class R shares is not presented. Performance for these classes will vary due to the different expense structures. |
First American Funds Annual Report 2006 3
Equity Index fund continued
Expense Example
As a shareholder of the Equity Index Fund (the “fund”), you incur two types of costs: (1) transaction costs, including sales charges (loads) on purchase payments; and (2) ongoing costs, including investment advisory fees, distribution and/or service (12b-1) fees, and other fund expenses. This example is intended to help you understand your ongoing costs (in dollars) of investing in the fund and to compare these costs with the ongoing costs of investing in other mutual funds. The example is based on an investment of $1,000 invested at the beginning of the period and held for the entire period from May 1, 2006, to October 31, 2006.
Actual Expenses
For each class, the first line of the table below provides information about actual account values and actual expenses. You may use the information in this line, together with the amount you invested, to estimate the expenses that you paid over the period. Simply divide your account value by $1,000 (for example, an $8,600 account value divided by $1,000 = 8.6), then multiply the result by the number in the first line under the heading entitled “Expenses Paid During Period” to estimate the expenses you paid on your account during this period.
Hypothetical Example for Comparison Purposes
For each class, the second line of the table below provides information about hypothetical account values and hypothetical expenses based on the fund’s actual expense ratio and an assumed rate of return of 5% per year before expenses, which is not the fund’s actual return. The hypothetical account values and expenses may not be used to estimate the actual ending account balance or expenses you paid for the period. You may use this information to compare the ongoing costs of investing in the fund and other funds. To do so, compare this 5% hypothetical example with the 5% hypothetical examples that appear in the shareholder reports of the other funds.
Please note that the expenses shown in the table are meant to highlight your ongoing costs only and do not reflect any transactional costs, such as sales charges (loads). Therefore, the second line of the table for each class is useful in comparing ongoing costs only, and will not help you determine the relative total costs of owning different funds. In addition, if these transactional costs were included, your costs would have been higher.
Expense Examples
| | | | | | | | | | | | | |
| | | | | | | Expenses Paid During | |
| | | Beginning Account | | | Ending Account | | | Period1 (5/01/06 to | |
| | | Value (5/01/06) | | | Value (10/31/06) | | | 10/31/06) | |
Class A Actual2 | | $ | 1,000.00 | | | $ | 1,058.60 | | | $ | 3.22 | |
| |
| Class A Hypothetical (5% return before expenses) | | $ | 1,000.00 | | | $ | 1,022.08 | | | $ | 3.16 | |
| |
Class B Actual2 | | $ | 1,000.00 | | | $ | 1,054.90 | | | $ | 7.10 | |
| |
| Class B Hypothetical (5% return before expenses) | | $ | 1,000.00 | | | $ | 1,018.30 | | | $ | 6.97 | |
| |
Class C Actual2 | | $ | 1,000.00 | | | $ | 1,054.50 | | | $ | 7.09 | |
| |
| Class C Hypothetical (5% return before expenses) | | $ | 1,000.00 | | | $ | 1,018.30 | | | $ | 6.97 | |
| |
Class R Actual2 | | $ | 1,000.00 | | | $ | 1,057.00 | | | $ | 4.51 | |
| |
| Class R Hypothetical (5% return before expenses) | | $ | 1,000.00 | | | $ | 1,020.82 | | | $ | 4.43 | |
| |
Class Y Actual2 | | $ | 1,000.00 | | | $ | 1,059.60 | | | $ | 1.92 | |
| |
| Class Y Hypothetical (5% return before expenses) | | $ | 1,000.00 | | | $ | 1,023.34 | | | $ | 1.89 | |
| |
| 1 | Expenses are equal to the fund’s annualized expense ratio for the most recent six-month period of 0.62%, 1.37%, 1.37%, 0.87%, and 0.37% for Class A, Class B, Class C, Class R, and Class Y, respectively, multiplied by the average account value over the period, multiplied by the number of days in the most recent fiscal half-year/365 (to reflect the one-half year period). |
| |
| |
| 2 | Based on the actual returns for the six-month period ended October 31, 2006 of 5.86%, 5.49%, 5.45%, 5.70%, and 5.96% for Class A, Class B, Class C, Class R, and Class Y, respectively. |
4 First American Funds Annual Report 2006
Mid Cap Index fund
Investment Objective: to provide investment results that correspond to the performance of the Standard & Poor’s MidCap 400 Index* (“S&P MidCap 400 Index”)
How did the fund perform for the fiscal year ended October 31, 2006?
The First American Mid Cap Index Fund (the “fund”), Class Y shares, returned 13.05% for the fiscal year ended October 31, 2006 (Class A shares returned 12.70% without taking the sales charge into account). By comparison, the fund’s benchmark, the S&P MidCap 400 Index, returned 13.43% for the same period.
General economic and market conditions
Economic growth slowed from very strong levels through the first quarter of 2006 to below-potential levels by the end of October. Inflation pressures rose through much of this period in a lagging response to the very strong growth through the first portion of this year, but diminished considerably by October. The Federal Reserve (the “Fed”) continued to tighten monetary policy through June as a result of the increase in inflation pressures, but has kept policy steady since that time as its forecast of slowing economic growth and dissipating inflation pressures has been realized. Corporate profit growth remained strong over this 12-month period with third-quarter 2006 earnings of S&P 500 companies advancing by roughly 20% on a year-over-year basis. The strength in corporate earnings, along with lessening inflation pressures and expectations that the Fed will begin easing monetary policy in 2007, has proved to be favorable for the equity markets through October 2006.
Fund overview
The fund is invested to replicate the S&P MidCap 400 Index as closely as possible with consideration given to turnover costs and fees. As a result, the fund performed very similarly to the index. The index includes stocks that reflect the risk and return characteristics of the broader mid-cap universe. Mid-cap stocks are now being recognized as an independent asset class and the capitalization range of this index covers about 10% of the U.S. equities market.
The best-performing sectors during the fiscal year were telecommunications and technology, having risen by 28% and 20%, respectively. Even the weakest-performing sectors over the same period – healthcare and consumer discretionary – posted gains, rising by 4% and 5%, respectively. Since August, market leadership has passed from the energy sector, which fell by 6.9% during the last fiscal quarter, to the telecommunications sector, which rose by 19.3%.
| |
| * | Unlike mutual funds, index returns do not reflect any expenses, transaction costs, or cash flow effects. |
Top 10 Holdings as of October 31, 20061 (% of net assets)
| | | | | |
| First American Prime Obligations Fund, Class Z | | | 2.7 | % |
| Peabody Energy | | | 1.0 | |
| Cognizant Technology Solutions | | | 0.9 | |
| Expeditors International of Washington | | | 0.9 | |
| Precision Castparts | | | 0.8 | |
| Noble Energy | | | 0.7 | |
| ENSCO International | | | 0.7 | |
| C.H. Robinson Worldwide | | | 0.6 | |
| Varian Medical Systems | | | 0.6 | |
| Microchip Technology | | | 0.6 | |
Sector Allocation as of October 31, 20061 (% of net assets)
| | | | | |
| Financials | | | 18.0 | % |
| Industrials | | | 15.5 | |
| Information Technology | | | 14.9 | |
| Consumer Discretionary | | | 13.7 | |
| Healthcare | | | 10.3 | |
| Utilities | | | 8.2 | |
| Energy | | | 7.2 | |
| Materials | | | 6.1 | |
| Consumer Staples | | | 2.1 | |
| Telecommunication Services | | | 0.5 | |
| Short-Term Investments | | | 3.0 | |
Other Assets and Liabilities, Net2 | | | 0.5 | |
| | | | |
| | | | 100.0 | % |
| |
| 1 | Fund holdings and sector allocations are subject to change at any time and are not recommendations to buy or sell any security. |
| |
| 2 | Investments in securities typically comprise substantially all the fund’s net assets. Other assets and liabilities include receivables for items such as income earned but not yet received and payables for items such as fund expenses incurred but not yet paid. |
First American Funds Annual Report 2006 5
Mid Cap Index fund continued
Annual Performance1
| | | | | | | | | | | | | | | | | | | | | | | | | | | | | | | | | | | | | | | | | |
| | | October 31, 2006 | | | September 30, 2006* | |
| | | | | | | |
| | | | | Since Inception | | | | | Since Inception | |
| | | | | | | | | | | |
| | | 1 year | | | 5 years | | | 11/04/99 | | | 11/27/2000 | | | 9/24/2001 | | | 1 year | | | 5 years | | | 11/04/99 | | | 11/27/2000 | | | 9/24/2001 | |
Average annual return with sales charge (POP) | | | | | | | | | | | | | | | | | | | | | | | | | | | | | | | | | | | | | | | | |
| Class A | | | 6.47% | | | | 10.95% | | | | 9.00 | % | | | — | | | | — | | | | 0.12% | | | | 10.98% | | | | 8.49 | % | | | — | | | | — | |
| |
| Class B | | | 6.87% | | | | 11.15% | | | | 9.10 | % | | | — | | | | — | | | | 0.16% | | | | 11.18% | | | | 8.60 | % | | | — | | | | — | |
| |
| Class C | | | 10.96% | | | | 11.38% | | | | — | | | | — | | | | 12.77 | % | | | 4.13% | | | | 11.39% | | | | — | | | | — | | | | 12.10 | % |
Average annual return without sales charge (NAV) | | | | | | | | | | | | | | | | | | | | | | | | | | | | | | | | | | | | | | | | |
| Class A | | | 12.70% | | | | 12.21% | | | | 9.89 | % | | | — | | | | — | | | | 5.92% | | | | 12.25% | | | | 9.38 | % | | | — | | | | — | |
| |
| Class B | | | 11.87% | | | | 11.41% | | | | 9.10 | % | | | — | | | | — | | | | 5.10% | | | | 11.44% | | | | 8.60 | % | | | — | | | | — | |
| |
| Class C | | | 11.96% | | | | 11.38% | | | | — | | | | — | | | | 12.77 | % | | | 5.12% | | | | 11.39% | | | | — | | | | — | | | | 12.10 | % |
| |
| Class R | | | 12.40% | | | | 12.07% | | | | — | | | | 7.90 | % | | | — | | | | 5.69% | | | | 12.10% | | | | — | | | | 7.29 | % | | | — | |
| |
| Class Y | | | 13.05% | | | | 12.51% | | | | 10.16 | % | | | — | | | | — | | | | 6.18% | | | | 12.53% | | | | 9.65 | % | | | — | | | | — | |
| |
S&P MidCap 400 Index2 | | | 13.43% | | | | 13.03% | | | | 11.00 | % | | | 8.98 | % | | | 14.47 | % | | | 6.56% | | | | 13.08% | | | | 10.49 | % | | | 8.36 | % | | | 13.81 | % |
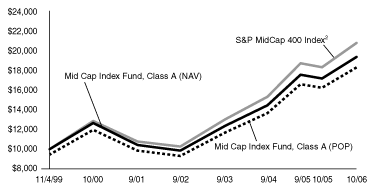
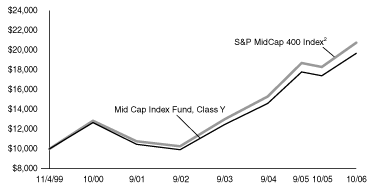
Value of $10,000 Investment1, 3 as of October 31, 2006
The chart above illustrates the total value of an assumed $10,000 investment in the fund’s Class A and Class Y shares (from 11/04/1999 to 10/31/2006) as compared to the S&P MidCap 400 Index2.
| |
| The performance data quoted on this page represents past performance and does not guarantee future results. The investment return and principal value of an investment will fluctuate so that an investor’s shares, when redeemed, may be worth more or less than their original cost. Current performance of the fund may be lower or higher than the performance data quoted. Performance data current to the most recent month-end may be obtained by calling 800.677.FUND. |
| |
| * | This table represents average annual total returns through the latest calendar quarter – rather than through the end of the fiscal period. |
| |
| 1 | Performance does not reflect the deduction of taxes that a shareholder would pay on fund distributions or redemption of fund shares. Performance reflects voluntary fee waivers in effect. In the absence of such fee waivers, total returns would be reduced. Index performance is for illustrative purposes only and does not reflect any expenses, transaction costs, or cash flow effects. Direct investment in the index is not available. |
Stocks of mid-capitalization companies may be slightly less volatile than those of small-capitalization companies, but they still involve substantial risk and may be subject to increased volatility and more price fluctuation than large-capitalization companies.
Total returns at net asset value (“NAV”) reflect performance over the time period indicated without including the fund’s maximum sales charge and assume reinvestment of all distributions at NAV.
Total returns at public offering price (“POP”) reflect performance over the time period indicated including maximum sales charges of 5.50% for Class A shares and the contingent deferred sales charge (“CDSC”) for Class B and Class C shares for the relevant period. Maximum CDSC is 5.00% for Class B shares in the first year, decreasing annually to 0% in the seventh year following purchase, and 1.00% for Class C shares. Total returns assume reinvestment of all distributions at NAV.
| |
| 2 | An unmanaged, market value-weighted index of 400 mid-cap companies. |
| |
| 3 | Performance for Class B, Class C, and Class R shares is not presented. Performance for these classes will vary due to the different expense structures. |
6 First American Funds Annual Report 2006
Mid Cap Index fund continued
Expense Example
As a shareholder of the Mid Cap Index Fund (the “fund”), you incur two types of costs: (1) transaction costs, including sales charges (loads) on purchase payments; and (2) ongoing costs, including investment advisory fees, distribution and/or service (12b-1) fees, and other fund expenses. This example is intended to help you understand your ongoing costs (in dollars) of investing in the fund and to compare these costs with the ongoing costs of investing in other mutual funds. The example is based on an investment of $1,000 invested at the beginning of the period and held for the entire period from May 1, 2006, to October 31, 2006.
Actual Expenses
For each class, the first line of the table below provides information about actual account values and actual expenses. You may use the information in this line, together with the amount you invested, to estimate the expenses that you paid over the period. Simply divide your account value by $1,000 (for example, an $8,600 account value divided by $1,000 = 8.6), then multiply the result by the number in the first line under the heading entitled “Expenses Paid During Period” to estimate the expenses you paid on your account during this period.
Hypothetical Example for Comparison Purposes
For each class, the second line of the table below provides information about hypothetical account values and hypothetical expenses based on the fund’s actual expense ratio and an assumed rate of return of 5% per year before expenses, which is not the fund’s actual return. The hypothetical account values and expenses may not be used to estimate the actual ending account balance or expenses you paid for the period. You may use this information to compare the ongoing costs of investing in the fund and other funds. To do so, compare this 5% hypothetical example with the 5% hypothetical examples that appear in the shareholder reports of the other funds.
Please note that the expenses shown in the table are meant to highlight your ongoing costs only and do not reflect any transactional costs, such as sales charges (loads). Therefore, the second line of the table for each class is useful in comparing ongoing costs only, and will not help you determine the relative total costs of owning different funds. In addition, if these transactional costs were included, your costs would have been higher.
Expense Examples
| | | | | | | | | | | | | |
| | | | | | | Expenses Paid During | |
| | | Beginning Account | | | Ending Account | | | Period1 (5/01/06 to | |
| | | Value (5/01/06) | | | Value (10/31/06) | | | 10/31/06) | |
Class A Actual2 | | $ | 1,000.00 | | | $ | 980.70 | | | $ | 3.74 | |
| |
| Class A Hypothetical (5% return before expenses) | | $ | 1,000.00 | | | $ | 1,021.42 | | | $ | 3.82 | |
| |
Class B Actual2 | | $ | 1,000.00 | | | $ | 977.10 | | | $ | 7.48 | |
| |
| Class B Hypothetical (5% return before expenses) | | $ | 1,000.00 | | | $ | 1,017.64 | | | $ | 7.63 | |
| |
Class C Actual2 | | $ | 1,000.00 | | | $ | 977.60 | | | $ | 7.48 | |
| |
| Class C Hypothetical (5% return before expenses) | | $ | 1,000.00 | | | $ | 1,017.64 | | | $ | 7.63 | |
| |
Class R Actual2 | | $ | 1,000.00 | | | $ | 979.70 | | | $ | 4.99 | |
| |
| Class R Hypothetical (5% return before expenses) | | $ | 1,000.00 | | | $ | 1,020.16 | | | $ | 5.09 | |
| |
Class Y Actual2 | | $ | 1,000.00 | | | $ | 982.00 | | | $ | 2.50 | |
| |
| Class Y Hypothetical (5% return before expenses) | | $ | 1,000.00 | | | $ | 1,022.68 | | | $ | 2.55 | |
| |
| |
| 1 | Expenses are equal to the fund’s annualized expense ratio for the most recent six-month period of 0.75%, 1.50%, 1.50%, 1.00%, and 0.50% for Class A, Class B, Class C, Class R, and Class Y, respectively, multiplied by the average account value over the period, multiplied by the number of days in the most recent fiscal half-year/365 (to reflect the one-half year period). |
| |
| 2 | Based on the actual returns for the six-month period ended October 31, 2006 of -1.93%, -2.29%, -2.24%, -2.03%, and -1.80% for Class A, Class B, Class C, Class R, and Class Y, respectively. |
First American Funds Annual Report 2006 7
Small Cap Index fund
Investment Objective: to provide investment results that correspond to the performance of the Russell 2000 Index*
How did the fund perform for the fiscal year ended October 31, 2006?
The First American Small Cap Index Fund (the “fund”), Class Y shares, returned 19.32% for the fiscal year ended October 31, 2006 (Class A shares returned 19.02% without taking the sales charge into account). By comparison, the fund’s benchmark, the Russell 2000 Index*, returned 19.98% for the same period.
General economic and market conditions
Economic growth slowed from very strong levels through the first quarter of 2006 to below-potential levels by the end of October. Inflation pressures rose through much of this period in a lagging response to the very strong growth through the first portion of this year, but diminished considerably by October. The Federal Reserve (the “Fed”) continued to tighten monetary policy through June as a result of the increase in inflation pressures, but has kept policy steady since that time as its forecast of slowing economic growth and dissipating inflation pressures has been realized. Corporate profit growth remained strong over this 12-month period with third-quarter 2006 earnings of S&P 500 companies advancing by roughly 20% on a year-over-year basis. The strength in corporate earnings, along with lessening inflation pressures and expectations that the Fed will begin easing monetary policy in 2007, has proved to be favorable for the equity markets through October 2006.
Fund overview
The fund is invested to replicate the Russell 2000 Index as closely as possible with consideration given to turnover costs and fees. The index includes the traded shares of U.S. companies ranked 1,001 through 3,000 in size, thereby skipping large- and mid-capitalization names in the list of investable companies.
The best-performing sectors during the fiscal year were materials and telecommunications, having risen by 43% and 33% respectively. Even the weakest-performing sector over the same period – healthcare – posted gains, rising by 13%. Since August, market leadership has passed from the energy sector, which fell by 2.4% during the last fiscal quarter, to the telecommunications sector, which rose by 17.2%.
| |
| * | Unlike mutual funds, index returns do not reflect any expenses, transaction costs, or cash flow effects. |
Top 10 Holdings as of October 31, 20061 (% of net assets)
| | | | | |
| First American Prime Obligations Fund, Class Z | | | 1.6% | |
| Veritas DGC | | | 0.2 | |
| Phillips Van-Heusen | | | 0.2 | |
| Hologic | | | 0.2 | |
| Big Lots | | | 0.2 | |
| Polycom | | | 0.2 | |
| Time Warner Telecom, Class A | | | 0.2 | |
| Alexandria Real Estate Equities – REIT | | | 0.2 | |
| Sotheby’s Holdings, Class A | | | 0.2 | |
| Digital River | | | 0.2 | |
Sector Allocation as of October 31, 20061 (% of net assets)
| | | | | |
| Financials | | | 21.9 | % |
| Information Technology | | | 18.1 | |
| Consumer Discretionary | | | 15.0 | |
| Industrials | | | 14.1 | |
| Healthcare | | | 12.0 | |
| Energy | | | 5.0 | |
| Materials | | | 4.8 | |
| Utilities | | | 2.9 | |
| Consumer Staples | | | 2.8 | |
| Telecommunication Services | | | 1.5 | |
| Short-Term Investments | | | 1.8 | |
Other Assets and Liabilities, Net2 | | | 0.1 | |
| | | | |
| | | | 100.0 | % |
| |
| 1 | Fund holdings and sector allocations are subject to change at any time and are not recommendations to buy or sell any security. |
| |
| 2 | Investments in securities typically comprise substantially all the fund’s net assets. Other assets and liabilities include receivables for items such as income earned but not yet received and payables for items such as fund expenses incurred but not yet paid. |
8 First American Funds Annual Report 2006
Small Cap Index fund continued
Annual Performance1
| | | | | | | | | | | | | | | | | | | | | | | | | | | | | | | | | | | | | | | | | |
| | | October 31, 2006 | | | September 30, 2006* | |
| | | | | | | |
| | | | | Since Inception | | | | | Since Inception | |
| | | | | | | | | | | |
| | | 1 year | | | 5 years | | | 12/30/1998 | | | 12/11/2000 | | | 9/24/2001 | | | 1 year | | | 5 years | | | 12/30/1998 | | | 12/11/2000 | | | 9/24/2001 | |
Average annual return with sales charge (POP) | | | | | | | | | | | | | | | | | | | | | | | | | | | | | | | | | | | | | | | | |
| Class A | | | 12.49% | | | | 11.05% | | | | 8.84 | % | | | — | | | | — | | | | 3.08% | | | | 11.16% | | | | 8.16 | % | | | — | | | | — | |
| |
| Class B | | | 13.07% | | | | 11.15% | | | | — | | | | 8.19 | % | | | — | | | | 3.31% | | | | 11.25% | | | | — | | | | 7.30 | % | | | — | |
| |
| Class C | | | 17.15% | | | | 11.48% | | | | — | | | | — | | | | 13.01 | % | | | 7.26% | | | | 11.58% | | | | — | | | | — | | | | 12.01 | % |
Average annual return without sales charge (NAV) | | | | | | | | | | | | | | | | | | | | | | | | | | | | | | | | | | | | | | | | |
| Class A | | | 19.02% | | | | 12.32% | | | | 9.63 | % | | | — | | | | — | | | | 9.09% | | | | 12.42% | | | | 8.95 | % | | | — | | | | — | |
| |
| Class B | | | 18.07% | | | | 11.41% | | | | — | | | | 8.31 | % | | | — | | | | 8.31% | | | | 11.51% | | | | — | | | | 7.43 | % | | | — | |
| |
| Class C | | | 18.15% | | | | 11.48% | | | | — | | | | — | | | | 13.01 | % | | | 8.26% | | | | 11.58% | | | | — | | | | — | | | | 12.01 | % |
| |
| Class R | | | 18.75% | | | | 12.08% | | | | 9.43 | % | | | — | | | | — | | | | 8.80% | | | | 12.20% | | | | 8.76 | % | | | — | | | | — | |
| |
| Class Y | | | 19.32% | | | | 12.55% | | | | 9.83 | % | | | — | | | | — | | | | 9.36% | | | | 12.63% | | | | 9.15 | % | | | — | | | | — | |
| |
Russell 2000 Index2 | | | 19.98% | | | | 13.76% | | | | 9.63 | % | | | 9.38 | % | | | 15.38 | % | | | 9.92% | | | | 13.78% | | | | 8.95 | % | | | 8.48 | % | | | 14.38 | % |
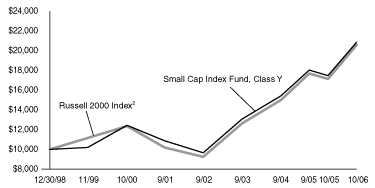
Value of $10,000 Investment 1, 3 as of October 31, 2006
The chart above illustrates the total value of an assumed $10,000 investment in the fund’s Class A and Class Y shares (from 12/30/1998 to 10/31/2006) as compared to the Russell 2000 Index2.
| |
| The performance data quoted on this page represents past performance and does not guarantee future results. The investment return and principal value of an investment will fluctuate so that an investor’s shares, when redeemed, may be worth more or less than their original cost. Current performance of the fund may be lower or higher than the performance data quoted. Performance data current to the most recent month-end may be obtained by calling 800.677.FUND. |
| |
| * | This table represents average annual total returns through the latest calendar quarter – rather than through the end of the fiscal period. |
| |
| 1 | Performance does not reflect the deduction of taxes that a shareholder would pay on fund distributions or redemption of fund shares. Performance reflects voluntary fee waivers in effect. In the absence of such fee waivers, total returns would be reduced. Index performance is for illustrative purposes only and does not reflect any expenses, transaction costs, or cash flow effects. Direct investment in the index is not available. |
Stocks of small-capitalization companies involve substantial risk. These stocks historically have experienced greater price volatility than stocks of larger companies, and they may be expected to do so in the future.
Total returns at net asset value (“NAV”) reflect performance over the time period indicated without including the fund’s maximum sales charge and assume reinvestment of all distributions at NAV.
Total returns at public offering price (“POP”) reflect performance over the time period indicated including maximum sales charges of 5.50% for Class A shares and the contingent deferred sales charge (“CDSC”) for Class B and Class C shares for the relevant period. Maximum CDSC is 5.00% for Class B shares in the first year, decreasing annually to 0% in the seventh year following purchase, and 1.00% for Class C shares. Total returns assume reinvestment of all distributions at NAV.
On September 24, 2001, the Small Cap Index Fund became the successor by merger to the Firstar Small Cap Index Fund, a series of Firstar Funds, Inc. Prior to the merger, the First American Fund had no assets or liabilities. Performance presented prior to September 24, 2001, represents that of the Firstar Small Cap Index Fund. The Firstar Small Cap Index Fund was organized on December 11, 2000, and, prior to that, was a separate series of Mercantile Mutual Funds, Inc.
| |
| 2 | An unmanaged index that measures the performance of the 2,000 smallest companies in the Russell 3000 Index. |
| |
| 3 | Performance for Class B, Class C, and Class R shares is not presented. Performance for these classes will vary due to the different expense structures. |
First American Funds Annual Report 2006 9
Small Cap Index fund continued
Expense Example
As a shareholder of the Small Cap Index Fund (the “fund”), you incur two types of costs: (1) transaction costs, including sales charges (loads) on purchase payments; and (2) ongoing costs, including investment advisory fees, distribution and/or service (12b-1) fees, and other fund expenses. This example is intended to help you understand your ongoing costs (in dollars) of investing in the fund and to compare these costs with the ongoing costs of investing in other mutual funds. The example is based on an investment of $1,000 invested at the beginning of the period and held for the entire period from May 1, 2006, to October 31, 2006.
Actual Expenses
For each class, the first line of the table below provides information about actual account values and actual expenses. You may use the information in this line, together with the amount you invested, to estimate the expenses that you paid over the period. Simply divide your account value by $1,000 (for example, an $8,600 account value divided by $1,000 = 8.6), then multiply the result by the number in the first line under the heading entitled “Expenses Paid During Period” to estimate the expenses you paid on your account during this period.
Hypothetical Example for Comparison Purposes
For each class, the second line of the table below provides information about hypothetical account values and hypothetical expenses based on the fund’s actual expense ratio and an assumed rate of return of 5% per year before expenses, which is not the fund’s actual return. The hypothetical account values and expenses may not be used to estimate the actual ending account balance or expenses you paid for the period. You may use this information to compare the ongoing costs of investing in the fund and other funds. To do so, compare this 5% hypothetical example with the 5% hypothetical examples that appear in the shareholder reports of the other funds.
Please note that the expenses shown in the table are meant to highlight your ongoing costs only and do not reflect any transactional costs, such as sales charges (loads). Therefore, the second line of the table for each class is useful in comparing ongoing costs only, and will not help you determine the relative total costs of owning different funds. In addition, if these transactional costs were included, your costs would have been higher.
Expense Examples
| | | | | | | | | | | | | |
| | | | | | | Expenses Paid During | |
| | | Beginning Account | | | Ending Account | | | Period1 (5/01/06 to | |
| | | Value (5/01/06) | | | Value (10/31/06) | | | 10/31/06) | |
Class A Actual2 | | $ | 1,000.00 | | | $ | 1,004.80 | | | $ | 4.19 | |
| |
| Class A Hypothetical (5% return before expenses) | | $ | 1,000.00 | | | $ | 1,021.02 | | | $ | 4.23 | |
| |
Class B Actual2 | | $ | 1,000.00 | | | $ | 1,000.90 | | | $ | 7.97 | |
| |
| Class B Hypothetical (5% return before expenses) | | $ | 1,000.00 | | | $ | 1,017.24 | | | $ | 8.03 | |
| |
Class C Actual2 | | $ | 1,000.00 | | | $ | 1,001.10 | | | $ | 7.97 | |
| |
| Class C Hypothetical (5% return before expenses) | | $ | 1,000.00 | | | $ | 1,017.24 | | | $ | 8.03 | |
| |
Class R Actual2 | | $ | 1,000.00 | | | $ | 1,003.80 | | | $ | 5.45 | |
| |
| Class R Hypothetical (5% return before expenses) | | $ | 1,000.00 | | | $ | 1,019.76 | | | $ | 5.50 | |
| |
Class Y Actual2 | | $ | 1,000.00 | | | $ | 1,006.10 | | | $ | 2.93 | |
| |
| Class Y Hypothetical (5% return before expenses) | | $ | 1,000.00 | | | $ | 1,022.28 | | | $ | 2.96 | |
| |
| |
| 1 | Expenses are equal to the fund’s annualized expense ratio for the most recent six-month period of 0.83%, 1.58%, 1.58%, 1.08%, and 0.58% for Class A, Class B, Class C, Class R, and Class Y, respectively, multiplied by the average account value over the period, multiplied by the number of days in the most recent fiscal half-year/365 (to reflect the one-half year period). |
| |
| 2 | Based on the actual returns for the six-month period ended October 31, 2006 of 0.48%, 0.09%, 0.11%, 0.38%, and 0.61% for Class A, Class B, Class C, Class R, and Class Y, respectively. |
10 First American Funds Annual Report 2006
Report of Independent Registered Public Accounting Firm
To the Shareholders and Board of Directors
First American Investment Funds, Inc.
We have audited the accompanying statements of assets and liabilities, including the schedules of investments, of the Equity Index, Mid Cap Index, and Small Cap Index funds (series of First American Investment Funds, Inc.) (the “funds”) as of October 31, 2006, and the related statements of operations, statements of changes in net assets and the financial highlights for each of the periods indicated therein. These financial statements and financial highlights are the responsibility of the funds’ management. Our responsibility is to express an opinion on these financial statements and financial highlights on our audits.
We conducted our audits in accordance with the standards of the Public Company Accounting Oversight Board (United States). Those standards require that we plan and perform the audit to obtain reasonable assurance about whether the financial statements and financial highlights are free of material misstatement. We were not engaged to perform an audit of the funds’ internal control over financial reporting. Our audits included consideration of internal control over financial reporting as a basis for designating audit procedures that are appropriate in the circumstances, but not for the purpose of expressing an opinion on the effectiveness of the funds’ internal control over financial reporting. Accordingly, we express no such opinion. An audit also includes examining, on a test basis, evidence supporting the amounts and disclosures in the financial statements and financial highlights, assessing the accounting principles used and significant estimates made by management, and evaluating the overall financial statement presentation. Our procedures included verification by examination of securities held by the custodian as of October 31, 2006 and confirmation of the securities held by correspondence with brokers, or by other appropriate auditing procedures where replies from brokers were not received. We believe that our audits provide a reasonable basis for our opinion.
In our opinion, the financial statements and financial highlights as referred to above present fairly, in all material respects, the financial position of the funds listed above of First American Investment Funds, Inc. at October 31, 2006, the results of their operations, the changes in their net assets, and their financial highlights for the periods indicated therein in conformity with U.S. generally accepted accounting principles.
Minneapolis, Minnesota
December 19, 2006
First American Funds Annual Report 2006 11
Schedule of Investments October 31, 2006, all dollars are rounded to thousands (000)
| | | | | | | | | |
| Equity Index Fund | |
| DESCRIPTION | | SHARES | | | VALUE | |
| | |
| Common Stocks – 99.4% |
| Consumer Discretionary – 10.4% |
| Amazon.com (a) (b) | | | 54,922 | | | $ | 2,092 | |
| Apollo Group, Class A (a) (b) | | | 25,814 | | | | 954 | |
| Autonation (a) (b) | | | 29,603 | | | | 594 | |
| Autozone (a) (b) | | | 9,784 | | | | 1,096 | |
| Bed Bath & Beyond (a) (b) | | | 52,777 | | | | 2,126 | |
| Best Buy (a) | | | 77,865 | | | | 4,302 | |
| Big Lots (a) (b) | | | 20,291 | | | | 428 | |
| Black & Decker (a) | | | 13,904 | | | | 1,166 | |
| Brunswick (a) | | | 16,568 | | | | 522 | |
| Carnival (a) | | | 76,722 | | | | 3,746 | |
| CBS, Class B (a) | | | 137,348 | | | | 3,975 | |
| Centex | | | 22,679 | | | | 1,186 | |
| Circuit City Stores | | | 36,058 | | | | 973 | |
| Clear Channel Communications | | | 84,101 | | | | 2,931 | |
| Coach (a) (b) | | | 67,173 | | | | 2,663 | |
| Comcast, Class A (a) (b) | | | 387,446 | | | | 15,757 | |
| D.R. Horton (a) | | | 48,214 | | | | 1,130 | |
| Darden Restaurants (a) | | | 24,131 | | | | 1,011 | |
| Dillard’s, Class A (a) | | | 10,905 | | | | 329 | |
| Dollar General | | | 53,311 | | | | 748 | |
| Dow Jones & Company | | | 10,446 | | | | 367 | |
| Eastman Kodak | | | 50,541 | | | | 1,233 | |
| Family Dollar Stores (a) | | | 27,499 | | | | 810 | |
| Federated Department Stores (a) | | | 95,455 | | | | 4,191 | |
| Ford Motor (a) | | | 334,787 | | | | 2,772 | |
| Fortune Brands | | | 25,608 | | | | 1,971 | |
| Gannett | | | 42,499 | | | | 2,513 | |
| Gap | | | 101,752 | | | | 2,139 | |
| General Motors (a) | | | 102,540 | | | | 3,581 | |
| Genuine Parts (a) | | | 30,734 | | | | 1,399 | |
| Goodyear Tire & Rubber (a) (b) | | | 31,590 | | | | 484 | |
| Harley-Davidson (a) | | | 48,666 | | | | 3,340 | |
| Harman International Industries (a) | | | 11,134 | | | | 1,140 | |
| Harrah’s Entertainment | | | 27,598 | | | | 2,051 | |
| Hasbro | | | 28,122 | | | | 729 | |
| Hilton Hotels (a) | | | 66,236 | | | | 1,916 | |
| Home Depot (a) | | | 372,536 | | | | 13,907 | |
| International Game Technology (a) | | | 59,662 | | | | 2,536 | |
| Interpublic Group of Companies (a) (b) | | | 75,198 | | | | 820 | |
| J.C. Penney (a) | | | 42,160 | | | | 3,172 | |
| Johnson Controls (a) | | | 33,374 | | | | 2,721 | |
| Jones Apparel Group | | | 20,723 | | | | 692 | |
| KB Home | | | 13,879 | | | | 624 | |
| Kohl’s (b) | | | 55,126 | | | | 3,892 | |
| Leggett & Platt | | | 32,600 | | | | 761 | |
| Lennar | | | 24,855 | | | | 1,180 | |
| Limited (a) | | | 61,691 | | | | 1,818 | |
| Liz Claiborne (a) | | | 18,904 | | | | 797 | |
| Lowe’s (a) | | | 274,537 | | | | 8,275 | |
| Marriott International, Class A (a) | | | 58,337 | | | | 2,437 | |
| Mattel | | | 71,647 | | | | 1,621 | |
| McDonald’s | | | 224,128 | | | | 9,395 | |
| McGraw-Hill | | | 67,776 | | | | 4,349 | |
| New York Times, Class A (a) | | | 25,693 | | | | 621 | |
| Newell Rubbermaid (a) | | | 48,389 | | | | 1,393 | |
| News (a) | | | 433,706 | | | | 9,043 | |
| Nike, Class B (a) | | | 33,673 | | | | 3,094 | |
| Nordstrom (a) | | | 39,949 | | | | 1,892 | |
| Office Depot (a) (b) | | | 56,017 | | | | 2,352 | |
| Officemax | | | 12,522 | | | | 596 | |
| Omnicom Group (a) | | | 31,981 | | | | 3,244 | |
| Pulte Homes (a) | | | 38,208 | | | | 1,184 | |
| RadioShack (a) | | | 23,842 | | | | 425 | |
| Sears (a) (b) | | | 16,424 | | | | 2,865 | |
| Sherwin-Williams (a) | | | 21,613 | | | | 1,280 | |
| Snap-On | | | 10,387 | | | | 488 | |
| Stanley Works (a) | | | 14,433 | | | | 688 | |
| Staples (a) | | | 129,560 | | | | 3,341 | |
| Starbucks (a) (b) | | | 136,125 | | | | 5,139 | |
| Starwood Hotels & Resorts Worldwide | | | 37,803 | | | | 2,258 | |
| Target (a) | | | 155,776 | | | | 9,219 | |
| Tiffany & Company (a) | | | 26,158 | | | | 934 | |
| Time Warner (a) | | | 787,760 | | | | 15,763 | |
| TJX | | | 77,732 | | | | 2,250 | |
| Tribune (a) | | | 53,652 | | | | 1,788 | |
| Univision Communications, Class A (a) (b) | | | 45,361 | | | | 1,590 | |
| V.F. | | | 15,609 | | | | 1,186 | |
| Viacom, Class B (b) | | | 136,006 | | | | 5,293 | |
| Walt Disney (a) | | | 355,771 | | | | 11,193 | |
| Wendy’s International | | | 20,021 | | | | 693 | |
| Whirlpool (a) | | | 13,924 | | | | 1,210 | |
| Wyndham Worldwide (b) | | | 36,337 | | | | 1,072 | |
| Yum! Brands | | | 48,480 | | | | 2,883 | |
| | | | | | | |
| | | | | | | | 232,339 | |
| | | | | | | |
| Consumer Staples – 9.4% |
| Alberto-Culver, Class B | | | 13,374 | | | | 679 | |
| Altria Group | | | 369,122 | | | | 30,021 | |
| Anheuser-Busch | | | 137,503 | | | | 6,520 | |
| Archer-Daniels-Midland (a) | | | 116,664 | | | | 4,492 | |
| Avon Products (a) | | | 84,113 | | | | 2,558 | |
| Brown-Forman, Class B | | | 10,064 | | | | 726 | |
| Campbell Soup | | | 32,974 | | | | 1,233 | |
| Clorox | | | 26,688 | | | | 1,723 | |
| Coca-Cola Enterprises (a) | | | 41,053 | | | | 822 | |
| Coca-Cola | | | 370,821 | | | | 17,325 | |
| Colgate-Palmolive | | | 91,775 | | | | 5,871 | |
| ConAgra Foods (a) | | | 93,818 | | | | 2,453 | |
| Constellation Brands, Class A (b) | | | 32,764 | | | | 901 | |
| Costco Wholesale | | | 83,610 | | | | 4,463 | |
| CVS | | | 141,161 | | | | 4,430 | |
| Dean Foods (b) | | | 5,816 | | | | 244 | |
| Estee Lauder, Class A (a) | | | 9,746 | | | | 394 | |
| General Mills (a) | | | 58,391 | | | | 3,318 | |
| H.J. Heinz | | | 59,268 | | | | 2,499 | |
| Hershey Foods (a) | | | 32,098 | | | | 1,698 | |
| Kellogg (a) | | | 45,564 | | | | 2,292 | |
| Kimberly-Clark (a) | | | 82,802 | | | | 5,508 | |
| Kroger (a) | | | 128,233 | | | | 2,884 | |
| McCormick | | | 23,721 | | | | 887 | |
| Molson Coors Brewing (a) | | | 11,180 | | | | 796 | |
| Pepsi Bottling | | | 24,437 | | | | 773 | |
| PepsiCo | | | 297,435 | | | | 18,869 | |
| Procter & Gamble | | | 588,054 | | | | 37,277 | |
| Reynolds American (a) | | | 30,670 | | | | 1,937 | |
| Safeway (a) | | | 79,477 | | | | 2,333 | |
| Sara Lee | | | 134,514 | | | | 2,300 | |
| SUPERVALU (a) | | | 35,835 | | | | 1,197 | |
| Sysco (a) | | | 116,923 | | | | 4,090 | |
| Tyson Foods, Class A (a) | | | 44,787 | | | | 647 | |
| UST (a) | | | 28,978 | | | | 1,552 | |
| Walgreen | | | 179,241 | | | | 7,829 | |
| Wal-Mart Stores | | | 442,395 | | | | 21,801 | |
| Whole Foods Market (a) | | | 23,013 | | | | 1,469 | |
| Wrigley, William Jr. (a) | | | 36,744 | | | | 1,909 | |
| | | | | | | |
| | | | | | | | 208,720 | |
| | | | | | | |
The accompanying notes are an integral part of the financial statements.
12 First American Funds Annual Report 2006
| | | | | | | | | |
| Equity Index Fund (continued) | |
| DESCRIPTION | | SHARES | | | VALUE | |
| | |
| Energy – 9.5% |
| Anadarko Petroleum (a) | | | 85,273 | | | $ | 3,958 | |
| Apache (a) | | | 59,257 | | | | 3,871 | |
| Baker Hughes | | | 60,541 | | | | 4,180 | |
| BJ Services (a) | | | 53,297 | | | | 1,607 | |
| Chesapeake Energy (a) | | | 65,317 | | | | 2,119 | |
| ChevronTexaco (a) | | | 395,883 | | | | 26,603 | |
| ConocoPhillips | | | 295,165 | | | | 17,781 | |
| Consol Energy | | | 31,678 | | | | 1,121 | |
| Devon Energy (a) | | | 81,733 | | | | 5,463 | |
| El Paso (a) | | | 116,068 | | | | 1,590 | |
| EOG Resources (a) | | | 43,302 | | | | 2,881 | |
| Exxon Mobil | | | 1,082,174 | | | | 77,289 | |
| Halliburton (a) | | | 182,521 | | | | 5,905 | |
| Hess (a) | | | 43,031 | | | | 1,825 | |
| Kinder Morgan | | | 15,162 | | | | 1,594 | |
| Marathon Oil | | | 62,889 | | | | 5,434 | |
| Murphy Oil | | | 27,820 | | | | 1,312 | |
| Nabors Industries (a) (b) | | | 52,419 | | | | 1,619 | |
| National-Oilwell Varco (a) (b) | | | 31,039 | | | | 1,875 | |
| Noble | | | 24,532 | | | | 1,720 | |
| Occidental Petroleum | | | 145,648 | | | | 6,837 | |
| Rowan (a) | | | 19,649 | | | | 656 | |
| Schlumberger (a) | | | 208,631 | | | | 13,160 | |
| Smith International (a) | | | 34,370 | | | | 1,357 | |
| Sunoco | | | 24,137 | | | | 1,596 | |
| Transocean (a) (b) | | | 58,815 | | | | 4,266 | |
| Valero Energy | | | 109,198 | | | | 5,714 | |
| Weatherford International (b) | | | 60,866 | | | | 2,500 | |
| Williams | | | 106,027 | | | | 2,590 | |
| XTO Energy (a) | | | 65,196 | | | | 3,042 | |
| | | | | | | |
| | | | | | | | 211,465 | |
| | | | | | | |
| Financials – 21.8% |
| ACE | | | 52,453 | | | | 3,003 | |
| AFLAC | | | 88,638 | | | | 3,982 | |
| Allstate (a) | | | 124,774 | | | | 7,656 | |
| Ambac Financial Group | | | 19,276 | | | | 1,609 | |
| American Express | | | 219,187 | | | | 12,671 | |
| American International Group | | | 463,664 | | | | 31,144 | |
| Ameriprise Financial | | | 41,625 | | | | 2,144 | |
| AmSouth Bancorp | | | 61,755 | | | | 1,866 | |
| AON | | | 57,403 | | | | 1,997 | |
| Apartment Investment & Management – REIT (a) | | | 17,500 | | | | 1,003 | |
| Archstone-Smith Trust – REIT (a) | | | 35,680 | | | | 2,148 | |
| Bank of America | | | 839,970 | | | | 45,249 | |
| Bank of New York (a) | | | 136,400 | | | | 4,688 | |
| BB&T (a) | | | 96,035 | | | | 4,179 | |
| Bear Stearns (a) | | | 19,101 | | | | 2,891 | |
| Boston Properties – REIT (a) | | | 19,864 | | | | 2,122 | |
| Capital One Financial | | | 51,938 | | | | 4,120 | |
| CB Richard Ellis Group (b) | | | 11,032 | | | | 331 | |
| Charles Schwab | | | 180,279 | | | | 3,285 | |
| Chicago Mercantile Exchange (a) | | | 6,219 | | | | 3,116 | |
| Chubb | | | 65,525 | | | | 3,483 | |
| Cincinnati Financial | | | 27,919 | | | | 1,275 | |
| CIT Group | | | 35,750 | | | | 1,861 | |
| Citigroup | | | 901,446 | | | | 45,217 | |
| Comerica | | | 29,292 | | | | 1,705 | |
| Commerce Bancorp (a) | | | 32,834 | | | | 1,147 | |
| Compass Bancshares | | | 16,432 | | | | 924 | |
| Countrywide Financial | | | 106,376 | | | | 4,055 | |
| E*TRADE Financial (b) | | | 76,433 | | | | 1,779 | |
| Equity Office Properties Trust – REIT (a) | | | 74,397 | | | | 3,162 | |
| Equity Residential Properties Trust – REIT (a) | | | 51,087 | | | | 2,790 | |
| Fannie Mae | | | 171,419 | | | | 10,158 | |
| Federated Investors, Class B | | | 15,000 | | | | 514 | |
| Fifth Third Bancorp (a) | | | 98,257 | | | | 3,916 | |
| First Horizon National | | | 22,217 | | | | 874 | |
| Franklin Resources | | | 26,394 | | | | 3,008 | |
| Freddie Mac | | | 122,034 | | | | 8,419 | |
| Genworth Financial, Class A (a) | | | 59,465 | | | | 1,989 | |
| Goldman Sachs Group (a) | | | 77,559 | | | | 14,720 | |
| Hartford Financial Services Group (a) | | | 51,527 | | | | 4,492 | |
| Huntington Bancshares | | | 37,746 | | | | 921 | |
| J.P. Morgan Chase (a) | | | 626,992 | | | | 29,745 | |
| Janus Capital Group (a) | | | 42,774 | | | | 859 | |
| KeyCorp | | | 72,248 | | | | 2,683 | |
| Kimco Realty – REIT (a) | | | 38,414 | | | | 1,707 | |
| Legg Mason (a) | | | 22,315 | | | | 2,009 | |
| Lehman Brothers Holdings (a) | | | 95,694 | | | | 7,449 | |
| Lincoln National (a) | | | 53,334 | | | | 3,377 | |
| Loew’s | | | 72,057 | | | | 2,804 | |
| M&T Bank (a) | | | 14,136 | | | | 1,722 | |
| Marsh & McLennan (a) | | | 93,679 | | | | 2,758 | |
| Marshall & Ilsley (a) | | | 36,966 | | | | 1,772 | |
| MBIA (a) | | | 23,870 | | | | 1,480 | |
| Mellon Financial | | | 76,322 | | | | 2,961 | |
| Merrill Lynch | | | 162,736 | | | | 14,226 | |
| Metlife | | | 135,187 | | | | 7,723 | |
| MGIC Investment | | | 17,723 | | | | 1,041 | |
| Moody’s (a) | | | 43,988 | | | | 2,916 | |
| Morgan Stanley | | | 191,816 | | | | 14,661 | |
| National City (a) | | | 97,667 | | | | 3,638 | |
| North Fork Bancorp | | | 83,915 | | | | 2,398 | |
| Northern Trust (a) | | | 32,856 | | | | 1,929 | |
| Plum Creek Timber – REIT | | | 32,843 | | | | 1,180 | |
| PNC Financial Services | | | 49,147 | | | | 3,442 | |
| Principal Financial Group (a) | | | 57,950 | | | | 3,274 | |
| Progressive | | | 142,099 | | | | 3,435 | |
| Prologis – REIT (a) | | | 37,273 | | | | 2,358 | |
| Prudential Financial (a) | | | 91,424 | | | | 7,033 | |
| Public Storage – REIT (a) | | | 16,198 | | | | 1,453 | |
| Realogy (a) (b) | | | 39,544 | | | | 1,019 | |
| Regions Financial | | | 81,119 | | | | 3,079 | |
| SAFECO | | | 22,167 | | | | 1,290 | |
| Simon Property Group – REIT (a) | | | 35,752 | | | | 3,472 | |
| SLM | | | 73,936 | | | | 3,599 | |
| Sovereign Bancorp | | | 66,829 | | | | 1,595 | |
| St. Paul Travelers Companies | | | 121,437 | | | | 6,209 | |
| State Street | | | 63,395 | | | | 4,072 | |
| SunTrust Banks | | | 60,781 | | | | 4,801 | |
| Synovus Financial (a) | | | 52,858 | | | | 1,553 | |
| T. Rowe Price Group (a) | | | 44,500 | | | | 2,105 | |
| Torchmark | | | 18,400 | | | | 1,135 | |
| U.S. Bancorp (a) (c) | | | 321,909 | | | | 10,893 | |
| UnumProvident | | | 61,091 | | | | 1,208 | |
| Vornado Realty Trust – REIT | | | 21,613 | | | | 2,577 | |
| Wachovia (a) | | | 322,022 | | | | 17,872 | |
| Washington Mutual | | | 174,842 | | | | 7,396 | |
| Wells Fargo | | | 592,220 | | | | 21,492 | |
| XL Capital Limited, Class A (a) | | | 29,071 | | | | 2,051 | |
| Zions Bancorporation | | | 15,573 | | | | 1,252 | |
| | | | | | | |
| | | | | | | | 486,316 | |
| | | | | | | |
| Healthcare – 12.3% |
| Abbott Laboratories | | | 277,154 | | | | 13,168 | |
| Aetna | | | 103,608 | | | | 4,271 | |
| Allergan (a) | | | 22,848 | | | | 2,639 | |
| AmerisourceBergen (a) | | | 37,452 | | | | 1,768 | |
| Amgen (a) (b) | | | 217,631 | | | | 16,520 | |
| Applied Biosystems Group – Applera | | | 35,032 | | | | 1,307 | |
| Barr Pharmaceuticals (b) | | | 14,896 | | | | 780 | |
| Bausch & Lomb (a) | | | 9,756 | | | | 522 | |
| Baxter International | | | 109,980 | | | | 5,056 | |
First American Funds Annual Report 2006 13
Schedule of Investments October 31, 2006, all dollars are rounded to thousands (000)
| | | | | | | | | |
| Equity Index Fund (continued) | |
| DESCRIPTION | | SHARES | | | VALUE | |
| | |
| Becton, Dickinson & Company (a) | | | 44,792 | | | $ | 3,137 | |
| Biogen IDEC (a) (b) | | | 60,077 | | | | 2,860 | |
| Biomet (a) | | | 44,127 | | | | 1,670 | |
| Boston Scientific (a) (b) | | | 216,600 | | | | 3,446 | |
| Bristol-Myers Squibb | | | 344,369 | | | | 8,523 | |
| C.R. Bard (a) | | | 18,480 | | | | 1,515 | |
| Cardinal Health | | | 76,828 | | | | 5,028 | |
| Caremark Rx (a) | | | 79,792 | | | | 3,928 | |
| Celgene (b) | | | 12,772 | | | | 683 | |
| CIGNA | | | 22,477 | | | | 2,629 | |
| Coventry Health Care (b) | | | 29,313 | | | | 1,376 | |
| Eli Lilly | | | 180,324 | | | | 10,100 | |
| Express Scripts (b) | | | 25,964 | | | | 1,654 | |
| Fisher Scientific International (b) | | | 21,926 | | | | 1,877 | |
| Forest Laboratories, Class A (a) (b) | | | 59,929 | | | | 2,933 | |
| Genzyme (a) (b) | | | 44,044 | | | | 2,973 | |
| Gilead Sciences (a) (b) | | | 77,809 | | | | 5,361 | |
| HCA (a) | | | 74,190 | | | | 3,748 | |
| Health Management Associates, Class A (a) | | | 42,190 | | | | 831 | |
| Hospira (b) | | | 29,188 | | | | 1,061 | |
| Humana (a) (b) | | | 29,352 | | | | 1,761 | |
| IMS Health | | | 41,417 | | | | 1,153 | |
| Johnson & Johnson | | | 527,571 | | | | 35,558 | |
| King Pharmaceuticals (a) (b) | | | 43,863 | | | | 734 | |
| Laboratory Corporation of America (a) (b) | | | 23,738 | | | | 1,626 | |
| Manor Care | | | 14,083 | | | | 676 | |
| McKesson HBOC | | | 53,881 | | | | 2,699 | |
| Medco Health Solutions (a) (b) | | | 54,446 | | | | 2,913 | |
| Medimmune (a) (b) | | | 44,122 | | | | 1,414 | |
| Medtronic (a) | | | 213,882 | | | | 10,412 | |
| Merck (a) | | | 388,811 | | | | 17,660 | |
| Millipore (a) (b) | | | 8,806 | | | | 568 | |
| Mylan Laboratories (a) | | | 38,705 | | | | 793 | |
| Patterson Companies (a) (b) | | | 24,631 | | | | 809 | |
| PerkinElmer | | | 23,733 | | | | 507 | |
| Pfizer | | | 1,312,442 | | | | 34,977 | |
| Quest Diagnostics (a) | | | 29,529 | | | | 1,469 | |
| Schering-Plough | | | 260,962 | | | | 5,778 | |
| St. Jude Medical (a) (b) | | | 65,149 | | | | 2,238 | |
| Stryker (a) | | | 51,914 | | | | 2,715 | |
| Tenet Healthcare (a) (b) | | | 83,901 | | | | 592 | |
| Thermo Electron (a) (b) | | | 28,805 | | | | 1,235 | |
| UnitedHealth Group | | | 232,872 | | | | 11,359 | |
| Watson Pharmaceuticals (a) (b) | | | 19,471 | | | | 524 | |
| Wellpoint (a) (b) | | | 111,874 | | | | 8,538 | |
| Wyeth Pharmaceuticals | | | 236,615 | | | | 12,074 | |
| Zimmer Holdings (a) (b) | | | 44,016 | | | | 3,170 | |
| | | | | | | |
| | | | | | | | 275,316 | |
| | | | | | | |
| Industrials – 10.8% |
| 3M | | | 140,103 | | | | 11,046 | |
| Allied Waste Industries (b) | | | 38,098 | | | | 463 | |
| American Power Conversion (a) | | | 30,754 | | | | 930 | |
| American Standard (a) | | | 31,703 | | | | 1,404 | |
| Avery Dennison | | | 18,965 | | | | 1,197 | |
| Boeing | | | 146,244 | | | | 11,679 | |
| Burlington Northern Santa Fe (a) | | | 66,172 | | | | 5,130 | |
| Caterpillar | | | 121,133 | | | | 7,354 | |
| Cintas (a) | | | 24,476 | | | | 1,013 | |
| Cooper Industries | | | 16,520 | | | | 1,478 | |
| CSX (a) | | | 78,556 | | | | 2,802 | |
| Cummins (a) | | | 7,285 | | | | 925 | |
| Danaher (a) | | | 42,021 | | | | 3,016 | |
| Deere & Company (a) | | | 42,762 | | | | 3,640 | |
| Dover | | | 30,148 | | | | 1,432 | |
| Eaton | | | 26,202 | | | | 1,898 | |
| Emerson Electric | | | 73,538 | | | | 6,207 | |
| Equifax | | | 23,126 | | | | 879 | |
| FedEx (a) | | | 52,915 | | | | 6,061 | |
| Fluor (a) | | | 14,289 | | | | 1,121 | |
| General Dynamics (a) | | | 69,396 | | | | 4,934 | |
| General Electric | | | 1,867,893 | | | | 65,582 | |
| Goodrich | | | 21,156 | | | | 933 | |
| H&R Block (a) | | | 64,216 | | | | 1,404 | |
| Honeywell International (a) | | | 152,226 | | | | 6,412 | |
| Illinois Tool Works | | | 72,513 | | | | 3,476 | |
| Ingersoll-Rand, Class A | | | 58,611 | | | | 2,152 | |
| ITT Industries | | | 32,593 | | | | 1,773 | |
| L-3 Communications Holdings | | | 18,107 | | | | 1,458 | |
| Lockheed Martin | | | 63,132 | | | | 5,488 | |
| Masco (a) | | | 75,204 | | | | 2,079 | |
| Monster Worldwide (a) (b) | | | 22,884 | | | | 927 | |
| Navistar International (a) (b) | | | 10,998 | | | | 305 | |
| Norfolk Southern | | | 73,225 | | | | 3,849 | |
| Northrop Grumman | | | 62,988 | | | | 4,182 | |
| Paccar | | | 44,995 | | | | 2,664 | |
| Pall | | | 21,889 | | | | 698 | |
| Parker Hannifin | | | 20,800 | | | | 1,739 | |
| Pitney Bowes (a) | | | 32,076 | | | | 1,498 | |
| R.R. Donnelley & Sons | | | 38,494 | | | | 1,303 | |
| Raytheon | | | 78,677 | | | | 3,930 | |
| Robert Half International | | | 30,466 | | | | 1,114 | |
| Rockwell Automation (a) | | | 30,324 | | | | 1,880 | |
| Rockwell Collins | | | 31,450 | | | | 1,827 | |
| Ryder System (a) | | | 11,182 | | | | 589 | |
| Southwest Airlines (a) | | | 129,560 | | | | 1,947 | |
| Textron | | | 23,580 | | | | 2,144 | |
| Tyco International | | | 356,414 | | | | 10,489 | |
| Union Pacific | | | 45,174 | | | | 4,094 | |
| United Parcel Service, Class B (a) | | | 191,424 | | | | 14,424 | |
| United Technologies (a) | | | 181,416 | | | | 11,923 | |
| W.W. Grainger | | | 15,118 | | | | 1,100 | |
| Waste Management | | | 97,176 | | | | 3,642 | |
| | | | | | | |
| | | | | | | | 241,634 | |
| | | | | | | |
| Information Technology – 15.5% |
| ADC Telecommunications (b) | | | 20,899 | | | | 299 | |
| Adobe Systems (a) (b) | | | 106,732 | | | | 4,082 | |
| Advanced Micro Devices (a) (b) | | | 85,442 | | | | 1,817 | |
| Affiliated Computer Services, Class A (a) (b) | | | 23,431 | | | | 1,253 | |
| Agilent Technologies (b) | | | 75,909 | | | | 2,702 | |
| Altera (a) (b) | | | 64,220 | | | | 1,184 | |
| Analog Devices | | | 65,000 | | | | 2,068 | |
| Apple Computer (a) (b) | | | 149,889 | | | | 12,153 | |
| Applied Materials | | | 287,757 | | | | 5,004 | |
| Autodesk (a) (b) | | | 40,872 | | | | 1,502 | |
| Automatic Data Processing | | | 103,447 | | | | 5,114 | |
| Avaya (a) (b) | | | 81,979 | | | | 1,050 | |
| BMC Software (a) (b) | | | 38,338 | | | | 1,162 | |
| Broadcom, Class A (a) (b) | | | 80,671 | | | | 2,442 | |
| CA | | | 73,973 | | | | 1,832 | |
| Ciena (b) | | | 15,107 | | | | 355 | |
| Cisco Systems (a) (b) | | | 1,088,007 | | | | 26,254 | |
| Citrix Systems (a) (b) | | | 32,471 | | | | 959 | |
| Computer Sciences (b) | | | 30,381 | | | | 1,606 | |
| Compuware (b) | | | 70,632 | | | | 568 | |
| Comverse Technology (b) | | | 36,011 | | | | 784 | |
| Convergys (b) | | | 24,953 | | | | 529 | |
| Corning (b) | | | 277,659 | | | | 5,673 | |
| Dell (a) (b) | | | 417,129 | | | | 10,149 | |
| eBay (a) (b) | | | 203,303 | | | | 6,532 | |
| Electronic Arts (a) (b) | | | 53,192 | | | | 2,813 | |
The accompanying notes are an integral part of the financial statements.
14 First American Funds Annual Report 2006
| | | | | | | | | |
| Equity Index Fund (continued) |
| DESCRIPTION | | SHARES | | | VALUE | |
| |
| Electronic Data Systems | | | 86,562 | | | $ | 2,193 | |
| EMC (b) | | | 423,576 | | | | 5,189 | |
| First Data | | | 139,956 | | | | 3,394 | |
| Fiserv (a) (b) | | | 32,887 | | | | 1,625 | |
| Freescale Semiconductor, Class B (a) (b) | | | 70,667 | | | | 2,779 | |
| Google, Class A (a) (b) | | | 37,284 | | | | 17,762 | |
| Hewlett-Packard (a) | | | 510,340 | | | | 19,771 | |
| IBM | | | 279,915 | | | | 25,845 | |
| Intel | | | 1,046,306 | | | | 22,328 | |
| Intuit (a) (b) | | | 62,703 | | | | 2,213 | |
| Jabil Circuit (a) | | | 32,352 | | | | 929 | |
| JDS Uniphase (a) (b) | | | 37,682 | | | | 547 | |
| Juniper Networks (a) (b) | | | 100,854 | | | | 1,737 | |
| KLA-Tencor (a) | | | 34,281 | | | | 1,686 | |
| Lexmark International Group, Class A (a) (b) | | | 20,732 | | | | 1,318 | |
| Linear Technology | | | 53,978 | | | | 1,680 | |
| LSI Logic (a) (b) | | | 68,546 | | | | 689 | |
| Lucent Technologies (a) (b) | | | 798,618 | | | | 1,941 | |
| Maxim Integrated Products (a) | | | 58,075 | | | | 1,743 | |
| Micron Technology (a) (b) | | | 107,026 | | | | 1,546 | |
| Microsoft | | | 1,527,871 | | | | 43,865 | |
| Molex | | | 25,574 | | | | 892 | |
| Motorola (a) | | | 436,072 | | | | 10,056 | |
| National Semiconductor (a) | | | 63,410 | | | | 1,540 | |
| NCR (b) | | | 32,528 | | | | 1,351 | |
| Network Appliance (a) (b) | | | 66,112 | | | | 2,413 | |
| Novell (b) | | | 67,805 | | | | 407 | |
| Novellus Systems (a) (b) | | | 23,653 | | | | 654 | |
| NVIDIA (a) (b) | | | 60,768 | | | | 2,119 | |
| Oracle (a) (b) | | | 712,720 | | | | 13,164 | |
| Parametric Technology (a) (b) | | | 19,271 | | | | 377 | |
| Paychex | | | 59,377 | | | | 2,344 | |
| PMC-Sierra (a) (b) | | | 36,808 | | | | 244 | |
| QLogic (b) | | | 28,647 | | | | 590 | |
| QUALCOMM (a) | | | 291,016 | | | | 10,590 | |
| Sabre Holdings, Class A (a) | | | 25,645 | | | | 652 | |
| SanDisk (a) (b) | | | 34,821 | | | | 1,675 | |
| Sanmina – SCI (b) | | | 94,987 | | | | 375 | |
| Seagate Technology, Escrow Shares (b) (d) | | | 44,886 | | | | — | |
| Solectron (b) | | | 163,013 | | | | 544 | |
| Sun Microsystems (a) (b) | | | 623,526 | | | | 3,386 | |
| Symantec (a) (b) | | | 193,324 | | | | 3,835 | |
| Symbol Technologies (a) | | | 44,987 | | | | 672 | |
| Tektronix | | | 14,911 | | | | 453 | |
| Tellabs (b) | | | 81,244 | | | | 856 | |
| Teradyne (a) (b) | | | 34,430 | | | | 483 | |
| Texas Instruments | | | 288,408 | | | | 8,704 | |
| Unisys (b) | | | 58,690 | | | | 384 | |
| VeriSign (a) (b) | | | 40,899 | | | | 846 | |
| Waters (b) | | | 19,660 | | | | 979 | |
| Western Union (b) | | | 139,956 | | | | 3,086 | |
| Xerox (b) | | | 170,056 | | | | 2,891 | |
| Xilinx | | | 61,409 | | | | 1,566 | |
| Yahoo! (a) (b) | | | 220,984 | | | | 5,821 | |
| | | | | | | | | |
| | | | | | | | 344,615 | |
| | | | | | | | | |
| Materials – 2.9% |
| Air Products and Chemicals | | | 40,195 | | | | 2,800 | |
| Alcoa | | | 154,694 | | | | 4,472 | |
| Allegheny Technologies (a) | | | 17,224 | | | | 1,356 | |
| Ashland | | | 12,668 | | | | 749 | |
| Ball | | | 12,519 | | | | 521 | |
| Bemis | | | 18,768 | | | | 631 | |
| Dow Chemical | | | 173,674 | | | | 7,084 | |
| E.I. Du Pont de Nemours (a) | | | 163,687 | | | | 7,497 | |
| Eastman Chemical (a) | | | 13,318 | | | | 811 | |
| Ecolab (a) | | | 32,668 | | | | 1,481 | |
| Freeport McMoran Copper & Gold, Class B | | | 32,538 | | | | 1,968 | |
| Hercules (b) | | | 19,511 | | | | 355 | |
| International Flavors & Fragrances | | | 12,608 | | | | 536 | |
| International Paper (a) | | | 80,407 | | | | 2,681 | |
| Louisiana Pacific | | | 19,377 | | | | 383 | |
| MeadWestvaco | | | 32,333 | | | | 890 | |
| Monsanto | | | 96,554 | | | | 4,270 | |
| Newmont Mining | | | 79,942 | | | | 3,619 | |
| NuCor (a) | | | 58,123 | | | | 3,395 | |
| Pactiv (b) | | | 26,536 | | | | 818 | |
| Phelps Dodge | | | 35,956 | | | | 3,609 | |
| PPG Industries | | | 29,957 | | | | 2,049 | |
| Praxair (a) | | | 58,378 | | | | 3,517 | |
| Rohm & Haas | | | 25,643 | | | | 1,329 | |
| Sealed Air (a) | | | 14,543 | | | | 866 | |
| Sigma-Aldrich (a) | | | 11,912 | | | | 895 | |
| Temple-Inland (a) | | | 20,740 | | | | 818 | |
| United States Steel (a) | | | 20,624 | | | | 1,394 | |
| Vulcan Materials (a) | | | 18,051 | | | | 1,471 | |
| Weyerhaeuser | | | 42,425 | | | | 2,698 | |
| | | | | | | | | |
| | | | | | | | 64,963 | |
| | | | | | | | | |
| Telecommunication Services – 3.4% |
| ALLTEL (a) | | | 64,031 | | | | 3,413 | |
| AT&T (a) | | | 691,769 | | | | 23,693 | |
| BellSouth | | | 324,074 | | | | 14,616 | |
| CenturyTel (a) | | | 23,336 | | | | 939 | |
| Citizens Communications (a) | | | 56,707 | | | | 831 | |
| Embarq | | | 26,154 | | | | 1,265 | |
| Qwest Communications International (a) (b) | | | 282,928 | | | | 2,442 | |
| Sprint (a) | | | 523,094 | | | | 9,777 | |
| Verizon Communications (a) | | | 501,447 | | | | 18,553 | |
| Windstream (a) | | | 78,205 | | | | 1,073 | |
| | | | | | | | | |
| | | | | | | | 76,602 | |
| Utilities – 3.4% |
| AES (b) | | | 118,343 | | | | 2,602 | |
| Allegheny Energy (b) | | | 28,878 | | | | 1,243 | |
| Ameren (a) | | | 33,780 | | | | 1,828 | |
| American Electric Power | | | 69,774 | | | | 2,891 | |
| Centerpoint Energy (a) | | | 53,932 | | | | 835 | |
| CMS Energy (a) (b) | | | 39,554 | | | | 589 | |
| Consolidated Edison (a) | | | 40,254 | | | | 1,946 | |
| Constellation Energy (a) | | | 29,956 | | | | 1,869 | |
| Dominion Resources (a) | | | 61,431 | | | | 4,975 | |
| DTE Energy (a) | | | 29,462 | | | | 1,338 | |
| Duke Energy | | | 213,849 | | | | 6,766 | |
| Dynegy (b) | | | 67,674 | | | | 411 | |
| Edison International | | | 57,496 | | | | 2,555 | |
| Entergy | | | 40,718 | | | | 3,495 | |
| Exelon (a) | | | 120,967 | | | | 7,498 | |
| FirstEnergy | | | 58,211 | | | | 3,426 | |
| FPL Group (a) | �� | | 70,082 | | | | 3,574 | |
| KeySpan | | | 31,608 | | | | 1,283 | |
| NICOR (a) | | | 8,006 | | | | 368 | |
| NiSource | | | 46,130 | | | | 1,073 | |
| People’s Energy (a) | | | 6,883 | | | | 301 | |
| PG&E (a) | | | 68,251 | | | | 2,944 | |
| Pinnacle West Capital | | | 15,933 | | | | 762 | |
| PPL | | | 64,370 | | | | 2,222 | |
| Progress Energy – Contingent Value Obligation (b) | | | 7,906 | | | | 2 | |
| Progress Energy (a) | | | 43,363 | | | | 1,995 | |
| Public Service Enterprises | | | 42,188 | | | | 2,576 | |
| Sempra Energy (a) | | | 46,148 | | | | 2,448 | |
| Southern | | | 131,317 | | | | 4,780 | |
| TECO Energy | | | 35,126 | | | | 579 | |
First American Funds Annual Report 2006 15
Schedule of Investments October 31, 2006, all dollars are rounded to thousands (000)
| | | | | | | | | | |
| Equity Index Fund (concluded) |
| DESCRIPTION | | PAR/SHARES | | | VALUE | |
| |
| TXU | | | 91,047 | | | $ | 5,748 | |
| Xcel Energy (a) | | | 72,636 | | | | 1,603 | |
| | | | | | | | | |
| | | | | | | | 76,525 | |
| | | | | | | | | |
Total Common Stocks | | | | | | | | |
| | (Cost $1,396,905) | | | | | | | 2,218,495 | |
| | | | | | | | | |
| Short-Term Investments – 0.8% |
| Money Market Fund – 0.7% |
| First American Prime Obligations Fund, Class Z (c) (e) | | | 14,837,605 | | | | 14,838 | |
| | | | | | | | | |
| U.S. Treasury Obligation – 0.1% |
U.S. Treasury Bill
4.940%, 03/01/2007 (f) | | $ | 3,000 | | | | 2,951 | |
| | | | | | | | | |
Total Short-Term Investments | | | | | | | | |
| | (Cost $17,789) | | | | | | | 17,789 | |
| | | | | | | | | |
Investments Purchased with Proceeds
from Securities Lending (g) – 16.0% |
| | (Cost $357,390) | | | | | | | 357,390 | |
| | | | | | | | | |
Total Investments – 116.2% | | | | | | | | |
| | (Cost $1,772,084) | | | | | | | 2,593,674 | |
| | | | | | | | | |
Other Assets and Liabilities, Net – (16.2)% | | | | | | | (361,373 | ) |
| | | | | | | | | |
Total Net Assets – 100.0% | | | | | | $ | 2,232,301 | |
| | | | | | | | | |
| |
| (a) | This security or a portion of this security is out on loan at October 31, 2006. Total loaned securities had a market value of $345,441 at October 31, 2006. See note 2 in Notes to Financial Statements. |
| |
| (b) | Non-income producing security. |
| |
| (c) | Investment in affiliated security. As of October 31, 2006, the market value of these investments was $25,731 or 1.2% of total net assets. See notes 3 and 4 in Notes to Financial Statements. |
| |
| (d) | Security is fair valued and illiquid. As of October 31, 2006, the market value of this investment was $0 or 0.0% of total net assets. See note 2 in Notes to Financial Statements. |
| |
| (e) | This money market fund is advised by FAF Advisors, Inc., which also serves as advisor to this fund. See note 3 in Notes to Financial Statements. |
| |
| (f) | Security has been deposited as initial margin on open futures contracts. Yield shown is the effective yield as of October 31, 2006. See note 2 in Notes to Financial Statements. |
| |
| (g) | The fund may loan securities in return for collateral in the form of cash, U.S. government securities, or other high grade debt obligations. The cash collateral is invested in money market funds and various short term, high quality debt obligations, such as repurchase agreements, commercial paper, and other corporate obligations. See note 2 in Notes to Financial Statements. |
REIT – Real Estate Investment Trust
Schedule of Open Futures Contracts
| | | | | | | | | | | | | | | |
| | | Number of | | | Notional | | | | | |
| | | Contracts | | | Contract | | | Settlement | | Unrealized | |
| Description | | Purchased | | | Value | | | Month | | Appreciation | |
| |
| S&P 500 Index Futures | | | 40 | | | $ | 13,832 | | | December 2006 | | $ | 592 | |
| | | | | | | | | | | | | | | |
| | | | | | | | | |
| Mid Cap Index Fund | |
| DESCRIPTION | | SHARES | | | VALUE | |
| | |
| Common Stocks – 96.5% |
| Consumer Discretionary – 13.7% |
| 99 Cents Only Stores (a) | | | 16,427 | | | $ | 197 | |
| Abercrombie & Fitch, Class A (b) | | | 27,474 | | | | 2,106 | |
| Advanced Auto Parts | | | 32,789 | | | | 1,148 | |
| Aeropostale (a) (b) | | | 17,278 | | | | 506 | |
| American Eagle Outfitters (b) | | | 41,825 | | | | 1,916 | |
| American Greetings, Class A (b) | | | 18,149 | | | | 434 | |
| AnnTaylor Stores (a) (b) | | | 23,109 | | | | 1,017 | |
| Applebee’s International (b) | | | 24,247 | | | | 553 | |
| ArvinMeritor (b) | | | 22,354 | | | | 336 | |
| Bandag (b) | | | 3,726 | | | | 164 | |
| Barnes & Noble | | | 16,736 | | | | 691 | |
| Beazer Homes USA (b) | | | 13,426 | | | | 582 | |
| Belo, Class A (b) | | | 27,396 | | | | 480 | |
| BLYTH | | | 8,577 | | | | 205 | |
| Bob Evans Farms | | | 11,552 | | | | 392 | |
| Borders Group (b) | | | 19,352 | | | | 398 | |
| BorgWarner (b) | | | 17,898 | | | | 1,029 | |
| Boyd Gaming | | | 13,199 | | | | 521 | |
| Brinker International | | | 25,802 | | | | 1,198 | |
| Callaway Golf (b) | | | 20,900 | | | | 281 | |
| CarMax (a) (b) | | | 33,278 | | | | 1,474 | |
| Catalina Marketing, Class C | | | 11,410 | | | | 289 | |
| CBRL Group | | | 9,935 | | | | 436 | |
| Charming Shoppes (a) | | | 33,352 | | | | 494 | |
| Cheesecake Factory (a) (b) | | | 24,966 | | | | 705 | |
| Chico’s FAS (a) (b) | | | 54,768 | | | | 1,311 | |
| Claire’s Stores (b) | | | 29,696 | | | | 842 | |
| Coldwater Creek (a) (b) | | | 19,058 | | | | 581 | |
| Corinthian Colleges (a) | | | 27,258 | | | | 334 | |
| DeVry (a) | | | 18,614 | | | | 453 | |
| Dollar Tree Stores (a) (b) | | | 31,810 | | | | 989 | |
| Entercom Communications (b) | | | 8,682 | | | | 240 | |
| Foot Locker | | | 48,531 | | | | 1,125 | |
| Furniture Brands International (b) | | | 15,502 | | | | 288 | |
| Gamestop, Class A (a) (b) | | | 23,066 | | | | 1,178 | |
| Gentex | | | 45,800 | | | | 729 | |
| Hanesbrands (a) | | | 29,363 | | | | 693 | |
| Harte-Hanks | | | 15,522 | | | | 392 | |
| Hovnanian Enterprises, Class A (a) (b) | | | 11,385 | | | | 351 | |
| International Speedway, Class A | | | 11,184 | | | | 581 | |
| Laureate Education (a) (b) | | | 15,821 | | | | 834 | |
| Lear (b) | | | 21,350 | | | | 645 | |
| Lee Enterprises (b) | | | 14,461 | | | | 413 | |
| M.D.C. Holdings (b) | | | 9,471 | | | | 472 | |
| Media General, Class A | | | 7,646 | | | | 284 | |
| Modine Manufacturing | | | 10,641 | | | | 253 | |
| Mohawk Industries (a) (b) | | | 16,804 | | | | 1,222 | |
| O’Reilly Automotive (a) (b) | | | 34,892 | | | | 1,127 | |
| OSI Restaurant Partners (b) | | | 20,706 | | | | 689 | |
| Pacific Sunwear of California (a) | | | 21,626 | | | | 381 | |
| Payless ShoeSource (a) | | | 20,499 | | | | 548 | |
| PETsMART (b) | | | 44,632 | | | | 1,285 | |
| Pier 1 Imports (b) | | | 27,296 | | | | 179 | |
| Polo Ralph Lauren | | | 19,328 | | | | 1,372 | |
| Reader’s Digest Association, Class A | | | 31,325 | | | | 450 | |
| Regis | | | 14,391 | | | | 540 | |
| Rent-A-Center (a) | | | 22,038 | | | | 634 | |
| Ross Stores | | | 44,015 | | | | 1,295 | |
| Ruby Tuesday (b) | | | 19,226 | | | | 534 | |
| Ryland Group (b) | | | 13,621 | | | | 626 | |
| Saks | | | 44,156 | | | | 854 | |
| Scholastic (a) | | | 7,982 | | | | 251 | |
| Scientific Games, Class A (a) (b) | | | 20,511 | | | | 575 | |
The accompanying notes are an integral part of the financial statements.
16 First American Funds Annual Report 2006
| | | | | | | | | |
| Mid Cap Index Fund (continued) | |
| DESCRIPTION | | SHARES | | | VALUE | |
| | |
| Strayer Education | | | 3,123 | | | $ | 353 | |
| Thor Industries (b) | | | 11,056 | | | | 485 | |
| Timberland, Class A (a) (b) | | | 16,225 | | | | 468 | |
| Toll Brothers (a) (b) | | | 37,613 | | | | 1,087 | |
| Tupperware (b) | | | 16,985 | | | | 361 | |
| Urban Outfitters (a) (b) | | | 35,051 | | | | 613 | |
| Valassis Communications (a) (b) | | | 15,129 | | | | 227 | |
| Washington Post, Class B (b) | | | 1,736 | | | | 1,307 | |
| Westwood One | | | 20,267 | | | | 160 | |
| Williams-Sonoma (b) | | | 35,394 | | | | 1,204 | |
| | | | | | | |
| | | | | | | | 49,367 | |
| | | | | | | |
| Consumer Staples – 2.1% |
| BJ’s Wholesale Club (a) (b) | | | 20,244 | | | | 580 | |
| Church & Dwight (b) | | | 19,946 | | | | 809 | |
| Energizer Holdings (a) (b) | | | 18,290 | | | | 1,429 | |
| Hansen Natural (a) (b) | | | 18,848 | | | | 598 | |
| Hormel Foods | | �� | 22,697 | | | | 820 | |
| JM Smucker | | | 18,275 | | | | 896 | |
| Lancaster Colony | | | 7,345 | | | | 298 | |
| PepsiAmericas | | | 18,883 | | | | 386 | |
| Ruddick (b) | | | 10,693 | | | | 302 | |
| Smithfield Foods (a) | | | 30,027 | | | | 807 | |
| Tootsie Roll Industries | | | 8,236 | | | | 262 | |
| Universal | | | 7,392 | | | | 272 | |
| | | | | | | |
| | | | | | | | 7,459 | |
| | | | | | | |
| Energy – 7.2% |
| Arch Coal (b) | | | 45,030 | | | | 1,559 | |
| Cameron International (a) (b) | | | 34,809 | | | | 1,744 | |
| Denbury Resources (a) (b) | | | 37,681 | | | | 1,083 | |
| ENSCO International (b) | | | 47,867 | | | | 2,344 | |
| FMC Technologies (a) (b) | | | 21,889 | | | | 1,323 | |
| Forest Oil (a) | | | 17,374 | | | | 567 | |
| Grant Prideco (a) (b) | | | 40,718 | | | | 1,538 | |
| Hanover Compressor (a) (b) | | | 32,182 | | | | 596 | |
| Helmerich & Payne | | | 32,813 | | | | 786 | |
| Newfield Exploration (a) | | | 40,448 | | | | 1,650 | |
| Noble Energy (b) | | | 55,085 | | | | 2,679 | |
| Overseas Shipholding Group | | | 9,250 | | | | 579 | |
| Patterson-UTI Energy (b) | | | 51,798 | | | | 1,202 | |
| Pioneer Natural Resources (b) | | | 38,904 | | | | 1,585 | |
| Plains Exploration & Production (a) | | | 24,190 | | | | 1,023 | |
| Pogo Producing (b) | | | 18,102 | | | | 810 | |
| Pride International (a) (b) | | | 50,275 | | | | 1,388 | |
| Quicksilver Resources (a) (b) | | | 17,221 | | | | 590 | |
| Southwestern Energy (a) (b) | | | 53,235 | | | | 1,894 | |
| Tidewater (b) | | | 18,201 | | | | 905 | |
| | | | | | | |
| | | | | | | | 25,845 | |
| | | | | | | |
| Financials – 18.0% |
| A.G. Edwards (b) | | | 23,816 | | | | 1,359 | |
| AMB Property – REIT | | | 27,650 | | | | 1,615 | |
| American Financial Group | | | 14,468 | | | | 692 | |
| AmeriCredit (a) (b) | | | 39,197 | | | | 1,002 | |
| AmerUs Group, Class A (b) | | | 13,359 | | | | 915 | |
| Arthur J. Gallagher (b) | | | 27,108 | | | | 755 | |
| Associated Banc-Corp | | | 41,240 | | | | 1,354 | |
| Astoria Financial | | | 28,079 | | | | 815 | |
| Bank of Hawaii (b) | | | 16,313 | | | | 851 | |
| Brown & Brown | | | 35,350 | | | | 1,034 | |
| Cathay General Bancorp | | | 13,144 | | | | 453 | |
| City National (b) | | | 13,213 | | | | 880 | |
| Colonial BancGroup | | | 47,713 | | | | 1,138 | |
| Cullen/Frost Bankers | | | 14,981 | | | | 811 | |
| Developers Diversified Realty – REIT (b) | | | 34,611 | | | | 2,108 | |
| Eaton Vance | | | 39,629 | | | | 1,230 | |
| Everest Re Group | | | 19,479 | | | | 1,932 | |
| Fidelity National Financial | | | 55,170 | | | | 1,230 | |
| Fidelity National Title Group | | | 63,204 | | | | 1,391 | |
| First American (b) | | | 29,389 | | | | 1,200 | |
| First Niagara Financial Group (b) | | | 26,987 | | | | 387 | |
| FirstMerit (b) | | | 26,423 | | | | 614 | |
| GATX (b) | | | 16,236 | | | | 707 | |
| Greater Bay Bancorp (b) | | | 17,060 | | | | 439 | |
| Hanover Insurance Group | | | 15,893 | | | | 721 | |
| HCC Insurance Holdings | | | 35,565 | | | | 1,197 | |
| Highwoods Properties – REIT (b) | | | 17,659 | | | | 675 | |
| Horace Mann Educators (b) | | | 13,965 | | | | 281 | |
| Hospitality Properties Trust – REIT (b) | | | 22,867 | | | | 1,108 | |
| IndyMac Bancorp (b) | | | 20,577 | | | | 935 | |
| Investors Financial Services (b) | | | 20,660 | | | | 812 | |
| Jefferies Group (b) | | | 31,496 | | | | 905 | |
| Leucadia National | | | 50,600 | | | | 1,334 | |
| Liberty Property Trust – REIT (b) | | | 28,058 | | | | 1,352 | |
| Macerich – REIT (b) | | | 22,087 | | | | 1,775 | |
| Mack-Cali Realty – REIT (b) | | | 18,608 | | | | 984 | |
| Mercantile Bankshares | | | 39,148 | | | | 1,765 | |
| Mercury General (b) | | | 11,148 | | | | 577 | |
| MoneyGram International | | | 27,081 | | | | 927 | |
| New Plan Excel Realty Trust – REIT (b) | | | 33,133 | | | | 954 | |
| New York Community Bancorp (b) | | | 80,996 | | | | 1,324 | |
| Ohio Casualty (b) | | | 19,163 | | | | 526 | |
| Old Republic International | | | 71,752 | | | | 1,617 | |
| PMI Group (b) | | | 26,981 | | | | 1,151 | |
| Potlatch – REIT | | | 12,076 | | | | 490 | |
| Protective Life | | | 21,809 | | | | 965 | |
| Radian Group (b) | | | 25,944 | | | | 1,383 | |
| Raymond James Financial | | | 28,009 | | | | 892 | |
| Rayonier – REIT (b) | | | 24,538 | | | | 1,006 | |
| Regency Centers – REIT | | | 20,913 | | | | 1,509 | |
| SEI Investments | | | 19,663 | | | | 1,107 | |
| StanCorp Financial Group | | | 16,959 | | | | 775 | |
| SVB Financial (a) (b) | | | 12,108 | | | | 557 | |
| TCF Financial | | | 34,660 | | | | 902 | |
| Texas Regional Bancshares, Class A (b) | | | 13,766 | | | | 535 | |
| United Dominion Realty Trust – REIT (b) | | | 41,995 | | | | 1,359 | |
| Unitrin | | | 12,749 | | | | 547 | |
| W.R. Berkley | | | 53,475 | | | | 1,971 | |
| Waddell & Reed Financial, Class A (b) | | | 26,432 | | | | 674 | |
| Washington Federal (b) | | | 28,532 | | | | 663 | |
| Webster Financial | | | 17,696 | | | | 855 | |
| Weingarten Realty Investors – REIT (b) | | | 25,553 | | | | 1,188 | |
| Westamerica Bancorporation (b) | | | 10,209 | | | | 509 | |
| Wilmington Trust | | | 21,331 | | | | 887 | |
| | | | | | | |
| | | | | | | | 64,606 | |
| | | | | | | |
| Healthcare – 10.3% |
| Advanced Medical Optics (a) (b) | | | 18,334 | | | | 749 | |
| Affymetrix (a) (b) | | | 21,103 | | | | 538 | |
| Apria Healthcare Group (a) | | | 13,671 | | | | 318 | |
| Beckman Coulter (b) | | | 19,347 | | | | 1,114 | |
| Cephalon (a) (b) | | | 19,224 | | | | 1,349 | |
Charles River Laboratories
International (a) (b) | | | 21,308 | | | | 915 | |
| Community Health Systems (a) | | | 28,913 | | | | 938 | |
| Covance (a) (b) | | | 20,451 | | | | 1,196 | |
| Cytyc (a) (b) | | | 35,098 | | | | 927 | |
| DENTSPLY International | | | 47,983 | | | | 1,501 | |
| Edwards Lifesciences (a) (b) | | | 18,217 | | | | 782 | |
| Gen-Probe (a) | | | 16,158 | | | | 774 | |
| Health Net (a) | | | 36,173 | | | | 1,502 | |
| Henry Schein (a) (b) | | | 27,504 | | | | 1,367 | |
| Hillenbrand Industries | | | 19,141 | | | | 1,123 | |
| Intuitive Surgical (a) (b) | | | 11,572 | | | | 1,148 | |
| Invitrogen (a) (b) | | | 16,661 | | | | 967 | |
First American Funds Annual Report 2006 17
Schedule of Investments October 31, 2006, all dollars are rounded to thousands (000)
| | | | | | | | | |
| Mid Cap Index Fund (continued) | |
| DESCRIPTION | | SHARES | | | VALUE | |
| | |
| Lifepoint Hospitals (a) (b) | | | 18,151 | | | $ | 644 | |
| Lincare Holdings (a) | | | 29,218 | | | | 981 | |
| Martek Biosciences (a) (b) | | | 10,082 | | | | 239 | |
| Medicis Pharmaceutical, Class A (b) | | | 14,748 | | | | 517 | |
| Millennium Pharmaceuticals (a) (b) | | | 98,700 | | | | 1,155 | |
| Mine Safety Appliances (b) | | | 8,360 | | | | 316 | |
| Omnicare (b) | | | 38,341 | | | | 1,452 | |
| Par Pharmaceutical Companies (a) | | | 10,889 | | | | 212 | |
| PDL BioPharma (a) (b) | | | 35,871 | | | | 758 | |
| Perrigo (b) | | | 24,243 | | | | 434 | |
| Pharmaceutical Product Development | | | 30,424 | | | | 963 | |
| Psychiatric Solutions (a) (b) | | | 16,572 | | | | 550 | |
| Resmed (a) (b) | | | 23,457 | | | | 1,032 | |
| Sepracor (a) (b) | | | 34,145 | | | | 1,767 | |
| STERIS | | | 20,223 | | | | 493 | |
| Techne (a) | | | 11,887 | | | | 664 | |
| Triad Hospitals (a) (b) | | | 27,383 | | | | 1,014 | |
| Universal Health Services | | | 17,910 | | | | 948 | |
| Valeant Pharmaceuticals International (b) | | | 29,452 | | | | 550 | |
| Varian (a) | | | 9,899 | | | | 464 | |
| Varian Medical Systems (a) (b) | | | 40,529 | | | | 2,223 | |
| VCA Antech (a) (b) | | | 25,717 | | | | 833 | |
| Vertex Pharmaceuticals (a) (b) | | | 36,384 | | | | 1,477 | |
| | | | | | | |
| | | | | | | | 36,894 | |
| | | | | | | |
| Industrials – 15.5% |
| Adesa (b) | | | 28,475 | | | | 716 | |
| AGCO (a) (b) | | | 28,771 | | | | 770 | |
| AirTran Holdings (a) (b) | | | 28,382 | | | | 283 | |
| Alaska Air Group (a) (b) | | | 12,440 | | | | 499 | |
| Alexander & Baldwin (b) | | | 13,434 | | | | 618 | |
| Alliant Techsystems (a) (b) | | | 10,975 | | | | 847 | |
| AMETEK (b) | | | 22,316 | | | | 1,042 | |
| Avis Budget Group | | | 31,270 | | | | 619 | |
| Banta | | | 7,622 | | | | 338 | |
| Brinks | | | 14,173 | | | | 744 | |
| C.H. Robinson Worldwide (b) | | | 54,088 | | | | 2,258 | |
| Career Education (a) (b) | | | 29,539 | | | | 658 | |
| Carlisle Companies | | | 9,326 | | | | 781 | |
| ChoicePoint (a) (b) | | | 26,503 | | | | 964 | |
| Con-way | | | 14,959 | | | | 706 | |
| Copart (a) | | | 23,447 | | | | 678 | |
| Corporate Executive Board (b) | | | 12,561 | | | | 1,128 | |
| Crane | | | 15,857 | | | | 617 | |
| Deluxe (b) | | | 16,119 | | | | 365 | |
| Donaldson (b) | | | 21,698 | | | | 815 | |
| DRS Technologies (b) | | | 12,400 | | | | 548 | |
| Dun & Bradstreet (a) (b) | | | 19,594 | | | | 1,513 | |
| Dycom Industries (a) (b) | | | 13,114 | | | | 306 | |
| Expeditors International of Washington | | | 66,530 | | | | 3,154 | |
| Fastenal (b) | | | 39,383 | | | | 1,585 | |
| Federal Signal | | | 15,270 | | | | 233 | |
| Flowserve (a) | | | 17,570 | | | | 931 | |
| Graco (b) | | | 21,787 | | | | 888 | |
| Granite Construction | | | 10,725 | | | | 559 | |
| Harsco | | | 13,018 | | | | 1,063 | |
| Herman Miller (b) | | | 21,956 | | | | 753 | |
| HNI (b) | | | 15,625 | | | | 703 | |
| Hubbell, Class B | | | 18,704 | | | | 926 | |
| ITT Educational Services (a) | | | 10,299 | | | | 710 | |
| J.B. Hunt Transport Services | | | 33,095 | | | | 716 | |
| Jacobs Engineering Group (a) | | | 18,495 | | | | 1,397 | |
| JetBlue Airways (a) (b) | | | 54,404 | | | | 683 | |
| Joy Global | | | 37,018 | | | | 1,448 | |
| Kelly Services, Class A (b) | | | 6,397 | | | | 184 | |
| Kennametal | | | 12,255 | | | | 756 | |
| Korn/Ferry International (a) | | | 12,684 | | | | 280 | |
| Lincoln Electric Holdings | | | 13,518 | | | | 831 | |
| Manpower | | | 27,237 | | | | 1,846 | |
| MSC Industrial Direct, Class A | | | 17,040 | | | | 697 | |
| Navigant Consulting (a) (b) | | | 16,271 | | | | 290 | |
| Nordson | | | 10,585 | | | | 487 | |
| Oshkosh Truck | | | 22,969 | | | | 1,038 | |
| Pentair (b) | | | 32,171 | | | | 1,060 | |
| Precision Castparts (b) | | | 42,245 | | | | 2,875 | |
| Quanta Services (a) (b) | | | 39,587 | | | | 724 | |
| Republic Services | | | 35,761 | | | | 1,467 | |
| Rollins | | | 9,609 | | | | 208 | |
| Roper Industries (b) | | | 27,325 | | | | 1,308 | |
| Sequa, Class A (a) | | | 2,102 | | | | 223 | |
| Sotheby’s Holdings, Class A (b) | | | 15,318 | | | | 582 | |
| SPX | | | 18,045 | | | | 1,038 | |
| Stericycle (a) (b) | | | 13,754 | | | | 973 | |
| Swift Transportation (a) (b) | | | 17,162 | | | | 432 | |
| Teleflex | | | 12,743 | | | | 793 | |
| Thomas & Betts (a) | | | 16,840 | | | | 868 | |
| Timken (b) | | | 26,454 | | | | 795 | |
| Trinity Industries (b) | | | 25,098 | | | | 905 | |
| United Rentals (a) | | | 20,804 | | | | 493 | |
| Werner Enterprises (b) | | | 16,406 | | | | 301 | |
| YRC Worldwide (a) (b) | | | 18,462 | | | | 715 | |
| | | | | | | |
| | | | | | | | 55,731 | |
| | | | | | | |
| Information Technology – 14.9% |
| 3Com (a) (b) | | | 123,024 | | | | 598 | |
| Activision (a) (b) | | | 78,118 | | | | 1,205 | |
| Acxiom | | | 21,210 | | | | 525 | |
| ADTRAN (b) | | | 20,199 | | | | 467 | |
| Advent Software (a) | | | 6,320 | | | | 234 | |
| Alliance Data Systems (a) (b) | | | 20,740 | | | | 1,259 | |
| Amphenol, Class A (b) | | | 27,876 | | | | 1,893 | |
| Andrew (a) | | | 47,960 | | | | 444 | |
| Arrow Electronics (a) (b) | | | 38,008 | | | | 1,135 | |
| Atmel (a) | | | 133,625 | | | | 768 | |
| Avnet (a) (b) | | | 40,171 | | | | 951 | |
| Avocent (a) | | | 14,725 | | | | 541 | |
| BISYS Group (a) | | | 38,405 | | | | 424 | |
| Cadence Design Systems (a) (b) | | | 87,541 | | | | 1,563 | |
| CDW (b) | | | 18,717 | | | | 1,229 | |
| Ceridian (a) (b) | | | 43,356 | | | | 1,022 | |
| CheckFree (a) (b) | | | 27,747 | | | | 1,095 | |
| Cognizant Technology Solutions (a) | | | 43,934 | | | | 3,307 | |
| CommScope (a) (b) | | | 16,857 | | | | 538 | |
| Cree (a) (b) | | | 24,585 | | | | 541 | |
| CSG Systems International (a) | | | 15,455 | | | | 417 | |
| Cypress Semiconductor (a) (b) | | | 43,469 | | | | 730 | |
| Diebold (b) | | | 20,679 | | | | 903 | |
| DST Systems (a) (b) | | | 18,459 | | | | 1,141 | |
| F5 Networks (a) | | | 12,562 | | | | 831 | |
| Fair Isaac (b) | | | 19,613 | | | | 718 | |
| Fairchild Semiconductor International, Class A (a) | | | 38,186 | | | | 615 | |
| Fidelity National Information Services (b) | | | 20,300 | | | | 844 | |
| Gartner, Class A (a) (b) | | | 18,902 | | | | 352 | |
| Harris | | | 41,755 | | | | 1,779 | |
| Imation (b) | | | 10,131 | | | | 464 | |
| Ingram Micro (a) | | | 36,617 | | | | 755 | |
| Integrated Device Technology (a) | | | 62,266 | | | | 987 | |
| International Rectifier (a) (b) | | | 22,505 | | | | 809 | |
| Intersil, Class A (b) | | | 43,798 | | | | 1,027 | |
| Jack Henry & Associates (b) | | | 23,790 | | | | 518 | |
| KEMET (a) | | | 27,558 | | | | 203 | |
The accompanying notes are an integral part of the financial statements.
18 First American Funds Annual Report 2006
| | | | | | | | | | |
| Mid Cap Index Fund (continued) | |
| DESCRIPTION | | SHARES | | | VALUE | |
| | |
| Lam Research (a) (b) | | | 43,232 | | | $ | 2,138 | |
| Lattice Semiconductor (a) | | | 35,662 | | | | 221 | |
| Macrovision (a) (b) | | | 16,574 | | | | 441 | |
| McAfee (a) (b) | | | 50,489 | | | | 1,461 | |
| McDATA, Class A (a) | | | 48,632 | | | | 276 | |
| MEMC Electronic Materials (a) (b) | | | 52,273 | | | | 1,856 | |
| Mentor Graphics (a) | | | 25,433 | | | | 429 | |
| Micrel (a) | | | 18,472 | | | | 206 | |
| Microchip Technology | | | 66,824 | | | | 2,200 | |
| MPS Group (a) | | | 32,676 | | | | 498 | |
| National Instruments | | | 17,609 | | | | 549 | |
| Newport (a) | | | 12,697 | | | | 274 | |
| Palm (a) (b) | | | 32,283 | | | | 496 | |
| Plantronics (b) | | | 15,066 | | | | 318 | |
| Plexus (a) | | | 13,845 | | | | 303 | |
| Polycom (a) (b) | | | 27,979 | | | | 767 | |
| Powerwave Technologies (a) (b) | | | 35,305 | | | | 230 | |
| RF Micro Devices (a) | | | 61,258 | | | | 447 | |
| Semtech (a) (b) | | | 23,162 | | | | 302 | |
| Silicon Laboratories (a) | | | 17,466 | | | | 570 | |
| SRA International, Class A (a) (b) | | | 11,742 | | | | 376 | |
| Sybase (a) (b) | | | 28,447 | | | | 693 | |
| Synopsys (a) (b) | | | 44,010 | | | | 991 | |
| Tech Data (a) | | | 17,950 | | | | 706 | |
| Transaction Systems Architects (a) | | | 11,555 | | | | 390 | |
| TriQuint Semiconductor (a) | | | 45,859 | | | | 206 | |
| UTStarcom (a) (b) | | | 34,055 | | | | 367 | |
| Vishay Intertechnology (a) (b) | | | 58,538 | | | | 790 | |
| Western Digital (a) | | | 68,570 | | | | 1,253 | |
| Wind River Systems (a) | | | 23,764 | | | | 261 | |
| Zebra Technology, Class A (a) (b) | | | 22,371 | | | | 834 | |
| | | | | | | |
| | | | | | | | 53,681 | |
| Materials – 6.1% |
| Airgas | | | 21,671 | | | | 819 | |
| Albemarle | | | 12,150 | | | | 790 | |
| Bowater (b) | | | 18,553 | | | | 388 | |
| Cabot Microelectronics (b) | | | 19,715 | | | | 780 | |
| Chemtura (b) | | | 77,210 | | | | 663 | |
| Commercial Metals | | | 38,031 | | | | 1,012 | |
| Cytec Industries (b) | | | 12,611 | | | | 699 | |
| Ferro | | | 13,326 | | | | 263 | |
| Florida Rock Industries | | | 14,130 | | | | 606 | |
| FMC | | | 12,228 | | | | 838 | |
| Glatfelter (b) | | | 11,270 | | | | 165 | |
| Longview Fibre | | | 21,669 | | | | 456 | |
| Lubrizol | | | 21,617 | | | | 973 | |
| Lyondell Chemical (b) | | | 65,151 | | | | 1,672 | |
| Martin Marietta Materials | | | 14,740 | | | | 1,297 | |
| Minerals Technologies (b) | | | 6,389 | | | | 352 | |
| Olin | | | 22,308 | | | | 386 | |
| Packaging Corporation of America | | | 19,934 | | | | 458 | |
| Peabody Energy | | | 83,606 | | | | 3,509 | |
| Reliance Steel & Aluminum | | | 20,046 | | | | 689 | |
| RPM (b) | | | 37,320 | | | | 715 | |
| Scotts | | | 14,190 | | | | 702 | |
| Sensient Technologies | | | 14,463 | | | | 333 | |
| Sonoco Products | | | 31,594 | | | | 1,121 | |
| Steel Dynamics (b) | | | 13,601 | | | | 818 | |
| Valspar | | | 32,196 | | | | 863 | |
| Worthington Industries (b) | | | 22,711 | | | | 392 | |
| | | | | | | |
| | | | | | | | 21,759 | |
| Telecommunication Services – 0.5% |
| Cincinnati Bell (a) | | | 78,719 | | | | 369 | |
| Telephone & Data Systems | | | 31,200 | | | | 1,524 | |
| | | | | | | |
| | | | | | | | 1,893 | |
| | | | | | | |
| Utilities – 8.2% |
| AGL Resources (b) | | | 23,917 | | | | 897 | |
| Alliant Energy (b) | | | 38,510 | | | | 1,477 | |
| Aqua America (b) | | | 40,987 | | | | 994 | |
| Aquila (a) | | | 116,687 | | | | 535 | |
| Black Hills (b) | | | 10,649 | | | | 367 | |
| DPL (b) | | | 36,654 | | | | 1,053 | |
| Duquesne Light Holdings | | | 24,791 | | | | 492 | |
| Energy East (b) | | | 46,954 | | | | 1,141 | |
| Equitable Resources | | | 36,964 | | | | 1,498 | |
| Great Plains Energy (b) | | | 23,749 | | | | 773 | |
| Hawaiian Electric Industries (b) | | | 25,732 | | | | 721 | |
| IDACORP (b) | | | 13,451 | | | | 530 | |
| MDU Resources Group (b) | | | 57,154 | | | | 1,468 | |
| National Fuel Gas (b) | | | 25,056 | | | | 937 | |
| Northeast Utilities | | | 42,610 | | | | 1,066 | |
| NSTAR (b) | | | 33,952 | | | | 1,181 | |
| OGE Energy (b) | | | 27,157 | | | | 1,048 | |
| ONEOK | | | 34,280 | | | | 1,427 | |
| Pepco Holdings (b) | | | 62,091 | | | | 1,578 | |
| PNM Resources (b) | | | 21,862 | | | | 616 | |
| Puget Energy (b) | | | 33,191 | | | | 793 | |
| Questar | | | 26,733 | | | | 2,178 | |
| SCANA | | | 36,401 | | | | 1,454 | |
| Sierra Pacific Resources (a) (b) | | | 63,920 | | | | 969 | |
| Vectren (b) | | | 24,191 | | | | 703 | |
| Westar Energy (b) | | | 27,580 | | | | 698 | |
| WGL Holdings (b) | | | 15,283 | | | | 496 | |
| Wisconsin Energy | | | 37,196 | | | | 1,709 | |
| WPS Resources | | | 13,806 | | | | 735 | |
| | | | | | | |
| | | | | | | | 29,534 | |
| | | | | | | |
Total Common Stocks
(Cost $261,524) | | | | | | | 346,769 | |
| | | | | | | |
| Short-Term Investments – 3.0% |
| Money Market Fund – 2.7% |
| First American Prime Obligations Fund, Class Z (c) | | | 9,718,572 | | | | 9,719 | |
| | | | | | | |
| U.S. Treasury Obligation – 0.3% |
U.S. Treasury Bill
4.940%, 03/01/2007 (d) | | $ | 1,000 | | | | 984 | |
| | | | | | | |
Total Short-Term Investments
(Cost $10,703) | | | | | | | 10,703 | |
| | | | | | | |
Investments Purchased with Proceeds from
Securities Lending (e) – 45.8% |
| | (Cost $164,599) | | | | | | | 164,599 | |
| | | | | | | |
Total Investments – 145.3% | | | | | | | | |
| | (Cost $436,826) | | | | | | | 522,071 | |
| | | | | | | |
| Other Assets and Liabilities, Net – (45.3)% | | | (162,683 | ) |
| | | | |
Total Net Assets – 100.0% | | | | | | $ | 359,388 | |
| | | | | | | |
| |
| (a) | Non-income producing security. |
| |
| (b) | This security or a portion of this security is out on loan at October 31, 2006. Total loaned securities had a market value of $158,121 at October 31, 2006. See note 2 in Notes to Financial Statements. |
| |
| (c) | Investment in affiliated security. This money market fund is advised by FAF Advisors, Inc., which also serves as advisor to this fund. See note 3 in Notes to Financial Statements. |
| |
| (d) | Security has been deposited as initial margin on open futures contracts. Yield shown is the effective yield as of October 31, 2006. See note 2 in Notes to Financial Statements. |
First American Funds Annual Report 2006 19
Schedule of Investments October 31, 2006, all dollars are rounded to thousands (000)
Mid Cap Index Fund (concluded)
| |
| (e) | The fund may loan securities in return for collateral in the form of cash, U.S. government securities, or other high grade debt obligations. The cash collateral is invested in various money market funds and short-term, high quality debt obligations, such as repurchase agreements, commercial paper, and other corporate obligations. See note 2 in Notes to Financial Statements. |
REIT – Real Estate Investment Trust
Schedule of Open Futures Contracts
| | | | | | | | | | | | | | | |
| | | Number of | | | Notional | | | | | |
| | | Contracts | | | Contract | | | Settlement | | Unrealized | |
| Description | | Purchased | | | Value | | | Month | | Appreciation | |
| |
| S&P Mid Cap 400 Futures | | | 31 | | | $ | 12,225 | | | December 2006 | | $ | 322 | |
| | | | | | | | | | | | | | | |
| | | | | | | | | |
| Small Cap Index Fund |
| DESCRIPTION | | SHARES | | | VALUE | |
| |
| Common Stocks – 98.1% |
| Consumer Discretionary – 15.0% |
| 1-800 Flowers (a) | | | 3,395 | | | $ | 19 | |
| 99 Cents Only Stores (a) | | | 5,098 | | | | 61 | |
| A.C. Moore Arts & Crafts (a) (b) | | | 1,799 | | | | 39 | |
| Aaron Rents (b) | | | 4,601 | | | | 114 | |
| ADVO | | | 3,732 | | | | 110 | |
| Aeropostale (a) (b) | | | 6,333 | | | | 186 | |
| AFC Enterprises (a) | | | 2,812 | | | | 46 | |
| Aftermarket Technology (a) | | | 2,424 | | | | 46 | |
| Ambassadors Group | | | 2,116 | | | | 58 | |
| Ambassadors International | | | 797 | | | | 31 | |
| American Axle & Manufacturing Holdings (b) | | | 5,267 | | | | 99 | |
| American Greetings, Class A | | | 5,950 | | | | 142 | |
| America’s Car-Mart (a) (b) | | | 1,053 | | | | 16 | |
| Ameristar Casinos (b) | | | 2,944 | | | | 72 | |
| Andersons (b) | | | 1,588 | | | | 57 | |
| Applebee’s International (b) | | | 7,648 | | | | 175 | |
| Arbitron | | | 3,586 | | | | 151 | |
| Arctic Cat | | | 1,551 | | | | 28 | |
| ArvinMeritor (b) | | | 8,001 | | | | 120 | |
| Asbury Automotive Group | | | 1,478 | | | | 35 | |
| Audible (a) (b) | | | 2,984 | | | | 22 | |
| Avatar Holdings (a) (b) | | | 703 | | | | 46 | |
| Aztar (a) | | | 4,078 | | | | 218 | |
| Bally Technologies (a) (b) | | | 5,833 | | | | 116 | |
| Bally Total Fitness Holding (a) (b) | | | 4,106 | | | | 12 | |
| Bandag (b) | | | 1,329 | | | | 58 | |
| Bebe Stores | | | 2,635 | | | | 65 | |
| Belo, Class A (b) | | | 9,294 | | | | 163 | |
| Big 5 Sporting Goods | | | 2,431 | | | | 58 | |
| Big Lots (a) (b) | | | 12,961 | | | | 273 | |
| BJs Restaurants (a) | | | 1,633 | | | | 35 | |
| Blockbuster, Class A (a) (b) | | | 21,676 | | | | 85 | |
| Blount International (a) | | | 4,231 | | | | 46 | |
| Blue Nile (a) (b) | | | 1,483 | | | | 57 | |
| Bluegreen (a) (b) | | | 2,608 | | | | 33 | |
| BLYTH | | | 2,894 | | | | 69 | |
| Bob Evans Farms | | | 4,168 | | | | 141 | |
| Bon-Ton Stores (b) | | | 527 | | | | 19 | |
| Books-A-Million | | | 1,580 | | | | 32 | |
| Borders Group (b) | | | 7,115 | | | | 146 | |
| Brookfield Homes (b) | | | 1,628 | | | | 53 | |
| Brown Shoe | | | 3,127 | | | | 122 | |
| Buckle | | | 905 | | | | 36 | |
| Buffalo Wild Wings (a) | | | 870 | | | | 45 | |
| Build-A-Bear Workshop (a) (b) | | | 1,641 | | | | 48 | |
| Building Materials Holding (b) | | | 3,288 | | | | 86 | |
| Cabelas (a) (b) | | | 3,246 | | | | 77 | |
| Cache (a) | | | 1,442 | | | | 31 | |
| California Coastal Communities | | | 925 | | | | 18 | |
| California Pizza Kitchen (a) | | | 2,433 | | | | 78 | |
| Callaway Golf (b) | | | 8,707 | | | | 117 | |
| Carmike Cinemas (b) | | | 1,304 | | | | 26 | |
| Carters (a) (b) | | | 4,964 | | | | 140 | |
| Casual Male Retail Group (a) (b) | | | 3,219 | | | | 48 | |
| Catalina Marketing, Class C | | | 5,499 | | | | 139 | |
| Cato, Class A (b) | | | 3,597 | | | | 82 | |
| Cavco Industries (a) | | | 495 | | | | 17 | |
| CBRL Group | | | 3,104 | | | | 136 | |
| CEC Entertainment (a) | | | 4,191 | | | | 144 | |
| Century Casinos (a) | | | 2,265 | | | | 23 | |
| Champion Enterprise (a) | | | 9,041 | | | | 84 | |
| Charlotte Russe Holding (a) | | | 1,755 | | | | 49 | |
| Charming Shoppes (a) (b) | | | 13,674 | | | | 202 | |
The accompanying notes are an integral part of the financial statements.
20 First American Funds Annual Report 2006
| | | | | | | | | |
| Small Cap Index Fund (continued) |
| DESCRIPTION | | SHARES | | | VALUE | |
| |
| Charter Communications, Class A (a) (b) | | | 46,198 | | | $ | 106 | |
| Cherokee | | | 1,064 | | | | 43 | |
| Children’s Place Retail Stores (a) | | | 2,400 | | | | 168 | |
| Chipolte Mexican Grill (a) | | | 2,243 | | | | 131 | |
| Christopher & Banks | | | 4,196 | | | | 113 | |
| Churchill Downs | | | 854 | | | | 36 | |
| Citadel Broadcasting | | | 4,612 | | | | 47 | |
| Citi Trends (a) (b) | | | 704 | | | | 28 | |
| CKE Restaurants | | | 7,045 | | | | 138 | |
| CKX (a) (b) | | | 5,695 | | | | 78 | |
| Coinmach Service | | | 2,774 | | | | 28 | |
| Columbia Sportswear (a) (b) | | | 1,182 | | | | 66 | |
| Conns (a) (b) | | | 870 | | | | 21 | |
| Cooper Tire & Rubber (b) | | | 7,547 | | | | 81 | |
| Core Mark Holding (a) | | | 882 | | | | 28 | |
| Corinthian Colleges (a) (b) | | | 10,079 | | | | 123 | |
| Cosi (a) | | | 3,831 | | | | 17 | |
| Cost Plus (a) (b) | | | 2,628 | | | | 31 | |
| Courier | | | 1,125 | | | | 44 | |
| Cox Radio (a) | | | 4,180 | | | | 70 | |
| Crocs (a) (b) | | | 1,105 | | | | 44 | |
| Crown Media Holdings, Class A (a) | | | 2,275 | | | | 9 | |
| CSK Auto (a) | | | 5,328 | | | | 83 | |
| CSS Industries | | | 767 | | | | 24 | |
| Cumulus Media, Class A (a) | | | 4,592 | | | | 49 | |
| Deb Shops | | | 229 | | | | 6 | |
| Deckers Outdoor (a) (b) | | | 1,215 | | | | 65 | |
| Delias (a) | | | 2,194 | | | | 20 | |
| Denny’s (a) | | | 10,835 | | | | 46 | |
| DeVry (a) | | | 6,647 | | | | 162 | |
| Directed Electronics (a) | | | 1,044 | | | | 14 | |
| Dominos Pizza (b) | | | 4,039 | | | | 110 | |
| Dover Downs Gaming & Entertainment | | | 1,399 | | | | 20 | |
| Dover Motorsports | | | 2,215 | | | | 12 | |
| Dress Barn (a) (b) | | | 5,036 | | | | 109 | |
| Drew Industries (a) (b) | | | 1,875 | | | | 51 | |
| Drugstore.com (a) | | | 8,458 | | | | 31 | |
| DSW (a) (b) | | | 1,570 | | | | 54 | |
| DXP Enterprises (a) | | | 193 | | | | 6 | |
| Emmis Communications, Class A (a) (b) | | | 3,649 | | | | 45 | |
| Entercom Communications (b) | | | 3,655 | | | | 101 | |
| Entravision Communications (a) | | | 7,339 | | | | 54 | |
| Ethan Allen Interiors (b) | | | 3,868 | | | | 138 | |
| Finish Line, Class A | | | 4,804 | | | | 62 | |
| Fisher Communications (a) | | | 610 | | | | 26 | |
| Fleetwood Enterprises (a) (b) | | | 6,848 | | | | 49 | |
| Fossil (a) | | | 5,174 | | | | 113 | �� |
| Fred’s | | | 4,696 | | | | 61 | |
| FTD Group (a) | | | 1,752 | | | | 28 | |
| Fuel Systems Solutions (a) (b) | | | 1,247 | | | | 16 | |
| Furniture Brands International (b) | | | 5,215 | | | | 97 | |
| Gaiam (a) | | | 1,806 | | | | 26 | |
| Gaylord Entertainment (a) | | | 4,545 | | | | 212 | |
| Gemstar-TV Guide International (a) | | | 28,103 | | | | 98 | |
| Genesco (a) (b) | | | 2,655 | | | | 100 | |
| GenTek (a) | | | 1,139 | | | | 37 | |
| Gray Television | | | 4,936 | | | | 32 | |
| Great Wolf Resorts (a) | | | 2,895 | | | | 38 | |
| Group 1 Automotive (b) | | | 2,769 | | | | 159 | |
| GSI Commerce (a) | | | 4,364 | | | | 79 | |
| Guess ? (a) (b) | | | 2,335 | | | | 133 | |
| Guitar Center (a) | | | 3,043 | | | | 132 | |
| Gymboree (a) | | | 3,709 | | | | 172 | |
| Harris Interactive (a) | | | 6,614 | | | | 44 | |
| Hartmarx (a) | | | 3,497 | | | | 25 | |
| Haverty Furniture (b) | | | 2,222 | | | | 35 | |
| Hibbett Sporting Goods (a) | | | 4,075 | | | | 119 | |
| Home Solutions of America (a) (b) | | | 4,196 | | | | 25 | |
| Hooker Furniture | | | 1,013 | | | | 14 | |
| Hot Topic (a) | | | 5,116 | | | | 52 | |
| Hovnanian Enterprises, Class A (a) (b) | | | 5,336 | | | | 165 | |
| Iconix Brand Group (a) (b) | | | 3,909 | | | | 73 | |
| IHOP (b) | | | 2,241 | | | | 117 | |
| Insight Enterprises (a) | | | 5,523 | | | | 119 | |
| Interactive Data (a) | | | 3,459 | | | | 79 | |
| Interface, Class A (a) | | | 5,212 | | | | 76 | |
| INVESTools (a) | | | 5,039 | | | | 65 | |
| iRobot (a) (b) | | | 998 | | | | 20 | |
| Isle of Capri Casinos (a) (b) | | | 1,613 | | | | 40 | |
| J. Crew Group (a) | | | 1,653 | | | | 51 | |
| Jack in the Box (a) | | | 3,937 | | | | 221 | |
| JAKKS Pacific (a) | | | 2,955 | | | | 64 | |
| Jo-Ann Stores (a) (b) | | | 2,875 | | | | 52 | |
| JOS A Bank Clothiers (a) | | | 1,923 | | | | 57 | |
| Journal Communications | | | 4,263 | | | | 50 | |
| Journal Register | | | 4,461 | | | | 35 | |
| K2 (a) | | | 5,681 | | | | 78 | |
| Kellwood | | | 2,947 | | | | 90 | |
| Kenneth Cole Productions | | | 1,288 | | | | 33 | |
| Keystone Automotive Industries (a) | | | 1,877 | | | | 72 | |
| Kimball International | | | 2,118 | | | | 53 | |
| Krispy Kreme Doughnuts (a) (b) | | | 6,308 | | | | 68 | |
| K-Swiss, Class A | | | 2,954 | | | | 104 | |
| Lakes Entertainment (a) | | | 2,032 | | | | 23 | |
| Landry’s Restaurants | | | 2,093 | | | | 61 | |
| La-Z-Boy (b) | | | 6,233 | | | | 76 | |
| LeapFrog Enterprises (a) (b) | | | 3,698 | | | | 36 | |
| Lear (b) | | | 7,469 | | | | 226 | |
| Lee Enterprises (b) | | | 5,100 | | | | 145 | |
| Levitt, Class A (b) | | | 2,037 | | | | 26 | |
| Life Time Fitness (a) (b) | | | 3,204 | | | | 165 | |
| Lifetime Brands (b) | | | 1,256 | | | | 26 | |
| Lin TV, Class A (a) | | | 3,058 | | | | 25 | |
| Lithia Motors | | | 1,760 | | | | 45 | |
| Live Nation (a) | | | 6,685 | | | | 142 | |
| LKQ (a) (b) | | | 4,985 | | | | 115 | |
| LodgeNet Entertainment (a) | | | 2,243 | | | | 52 | |
| Lodgian (a) | | | 2,790 | | | | 40 | |
| Lone Star Steakhouse & Saloon (b) | | | 1,628 | | | | 44 | |
| Luby’s (a) | | | 3,123 | | | | 31 | |
| M/ I Homes | | | 1,418 | | | | 51 | |
| Maidenform Brands (a) | | | 1,621 | | | | 36 | |
| Marcus | | | 2,382 | | | | 60 | |
| Marine Products | | | 1,550 | | | | 17 | |
| MarineMax (a) (b) | | | 1,570 | | | | 45 | |
| Martha Stewart Living (b) | | | 2,669 | | | | 57 | |
| Marvel Entertainment (a) (b) | | | 5,251 | | | | 133 | |
| McCormick & Schmick’s Seafood Restaurant (a) | | | 1,099 | | | | 29 | |
| Media General, Class A | | | 2,405 | | | | 89 | |
| Mediacom Communications (a) | | | 7,365 | | | | 61 | |
| Men’s Wearhouse (b) | | | 5,196 | | | | 207 | |
| Meritage Homes (a) | | | 2,461 | | | | 113 | |
| Midas (a) | | | 1,826 | | | | 38 | |
| Modine Manufacturing | | | 3,553 | | | | 85 | |
| Monaco Coach | | | 3,114 | | | | 37 | |
| Monarch Casino & Resort (a) | | | 1,202 | | | | 27 | |
| Monro Muffler Brake | | | 1,197 | | | | 45 | |
| Morgans Hotel Group (a) | | | 2,006 | | | | 26 | |
| Morningstar (a) (b) | | | 1,568 | | | | 64 | |
| Mortons Restaurant Group (a) | | | 469 | | | | 8 | |
| Movado Group | | | 2,092 | | | | 54 | |
| MTR Gaming Group (a) | | | 2,662 | | | | 28 | |
| Multimedia Games (a) (b) | | | 3,130 | | | | 29 | |
First American Funds Annual Report 2006 21
Schedule of Investments October 31, 2006, all dollars are rounded to thousands (000)
| | | | | | | | | |
| Small Cap Index Fund (continued) |
| DESCRIPTION | | SHARES | | | VALUE | |
| |
| National Presto Industries | | | 467 | | | $ | 29 | |
| Nautilus Group (b) | | | 3,973 | | | | 56 | |
| Netflix (a) (b) | | | 4,650 | | | | 129 | |
| New York & Company (a) | | | 2,384 | | | | 31 | |
| Noble International | | | 1,456 | | | | 26 | |
| Oakley | | | 2,995 | | | | 56 | |
| O’Charleys (a) | | | 2,628 | | | | 52 | |
| Orleans Homebuilders | | | 347 | | | | 4 | |
| Outdoor Channel Holdings (a) | | | 959 | | | | 13 | |
| Overstock.com (a) (b) | | | 1,297 | | | | 24 | |
| Oxford Industries | | | 1,640 | | | | 87 | |
| P.F. Chang’s China Bistro (a) (b) | | | 3,174 | | | | 133 | |
| Pacific Sunwear of California (a) | | | 8,296 | | | | 146 | |
| Palm Harbor Homes (a) (b) | | | 1,139 | | | | 16 | |
| Pantry (a) | | | 2,528 | | | | 138 | |
| Papa John’s International (a) (b) | | | 2,748 | | | | 101 | |
| Payless ShoeSource (a) | | | 7,664 | | | | 205 | |
| Pep Boys – Manny, Moe & Jack | | | 6,607 | | | | 94 | |
| Perry Ellis International (a) | | | 763 | | | | 28 | |
| PetMed Express (a) | | | 2,092 | | | | 26 | |
| Phillips Van-Heusen (b) | | | 6,095 | | | | 279 | |
| Pier 1 Imports (b) | | | 9,825 | | | | 64 | |
| Pinnacle Entertainment (a) | | | 5,148 | | | | 156 | |
| Playboy Enterprises, Class B (a) | | | 2,443 | | | | 26 | |
| Polaris Industries (b) | | | 4,364 | | | | 187 | |
| Prestige Brand Holdings (a) | | | 3,341 | | | | 39 | |
| Priceline.com (a) (b) | | | 2,872 | | | | 116 | |
| PRIMEDIA (a) | | | 22,136 | | | | 37 | |
| Private Media Group (a) (b) | | | 2,809 | | | | 11 | |
| Progressive Gaming International (a) (b) | | | 3,874 | | | | 30 | |
| ProQuest (a) | | | 2,990 | | | | 38 | |
| Quantum Fuel Systems Technologies Worldwide (a) (b) | | | 6,346 | | | | 11 | |
| Quiksilver (a) (b) | | | 12,899 | | | | 180 | |
| Radio One (a) | | | 8,870 | | | | 60 | |
| RARE Hospitality International (a) (b) | | | 4,047 | | | | 127 | |
| Raser Technologies (a) (b) | | | 2,263 | | | | 15 | |
| RC2 (a) (b) | | | 2,322 | | | | 105 | |
| RCN (a) | | | 2,734 | | | | 79 | |
| Reader’s Digest Association, Class A (b) | | | 11,366 | | | | 163 | |
| Red Robin Gourmet Burgers (a) (b) | | | 1,818 | | | | 88 | |
| Regis | | | 5,135 | | | | 193 | |
| Rent-A-Center (a) | | | 7,741 | | | | 223 | |
| Restoration Hardware (a) (b) | | | 4,042 | | | | 38 | |
| Retail Ventures (a) (b) | | | 2,001 | | | | 34 | |
| Riviera Holdings (a) | | | 1,055 | | | | 21 | |
| Ruby Tuesday (b) | | | 6,774 | | | | 188 | |
| Russ Berrie and Company (a) | | | 337 | | | | 5 | |
| Ruth’s Chris Steak House (a) | | | 1,945 | | | | 38 | |
| Ryans Restaurant Group (a) | | | 4,792 | | | | 78 | |
| Salem Communications | | | 1,463 | | | | 19 | |
| Sauer-Danfoss | | | 1,184 | | | | 31 | |
| Scholastic (a) | | | 3,630 | | | | 114 | |
| Sealy | | | 1,690 | | | | 24 | |
| Select Comfort (a) (b) | | | 6,403 | | | | 137 | |
| Shiloh Industries (a) | | | 538 | | | | 8 | |
| Shoe Carnival (a) | | | 938 | | | | 27 | |
| Shuffle Master (a) (b) | | | 4,179 | | | | 117 | |
| Sinclair Broadcast Group, Class A (b) | | | 4,958 | | | | 45 | |
| Six Flags (a) (b) | | | 9,098 | | | | 52 | |
| Skechers USA (a) | | | 1,525 | | | | 46 | |
| Skyline | | | 885 | | | | 35 | |
| Smith & Wesson (a) | | | 3,252 | | | | 45 | |
| Sonic (a) | | | 6,373 | | | | 145 | |
| Sonic Automotive, Class A (b) | | | 3,469 | | | | 91 | |
| Source Interlink Companies (a) (b) | | | 3,794 | | | | 34 | |
| Spanish Broadcasting System (a) | | | 4,912 | | | | 23 | |
| Speedway Motorsports | | | 1,809 | | | | 68 | |
| Stage Stores | | | 3,058 | | | | 99 | |
| Stamps.com (a) | | | 2,055 | | | | 33 | |
| Stanley Furniture | | | 1,561 | | | | 34 | |
| Steak ’N Shake (a) | | | 3,333 | | | | 62 | |
| Stein Mart | | | 2,927 | | | | 48 | |
| Steinway Musical Instruments (a) | | | 911 | | | | 27 | |
| Steven Madden | | | 2,652 | | | | 114 | |
| Stride Rite | | | 4,328 | | | | 64 | |
| Sun-Times Media Group | | | 8,351 | | | | 48 | |
| Superior Industries International (b) | | | 2,530 | | | | 43 | |
| Systemax (a) | | | 1,502 | | | | 16 | |
| Talbots (b) | | | 2,533 | | | | 71 | |
| Tarragon Realty Investors | | | 1,314 | | | | 15 | |
| Technical Olympic USA (b) | | | 1,728 | | | | 19 | |
| Tempur-Pedic International (a) (b) | | | 5,076 | | | | 100 | |
| Tenneco Automotive (a) (b) | | | 4,977 | | | | 113 | |
| Texas Roadhouse, Class A (a) (b) | | | 5,684 | | | | 82 | |
| Timberland, Class A (a) (b) | | | 5,226 | | | | 151 | |
| TiVo (a) | | | 8,547 | | | | 55 | |
| Triarc, Class B | | | 5,955 | | | | 100 | |
| True Religion Apparel (a) (b) | | | 1,469 | | | | 32 | |
| Trump Entertainment Resorts (a) | | | 2,683 | | | | 55 | |
| Tuesday Morning | | | 3,087 | | | | 51 | |
| Tupperware (b) | | | 6,059 | | | | 129 | |
| Tween Brands (a) (b) | | | 3,966 | | | | 166 | |
| Under Armour (a) (b) | | | 2,318 | | | | 107 | |
| UniFirst | | | 1,110 | | | | 40 | |
| Universal Electronics (a) | | | 1,679 | | | | 36 | |
| Vail Resorts (a) | | | 3,400 | | | | 131 | |
| Valassis Communications (a) | | | 5,702 | | | | 86 | |
| ValueVision Media (a) | | | 2,686 | | | | 35 | |
| Visteon (a) | | | 14,900 | | | | 110 | |
| Volcom (a) (b) | | | 1,462 | | | | 48 | |
| Warnaco Group, Class A (a) | | | 5,422 | | | | 115 | |
| WCI Communities (a) (b) | | | 3,708 | | | | 60 | |
| West Marine (a) | | | 1,556 | | | | 26 | |
| Westwood One | | | 6,958 | | | | 55 | |
| Wet Seal, Class A (a) | | | 6,757 | | | | 42 | |
| Weyco Group | | | 293 | | | | 7 | |
| Winnebago Industries (b) | | | 3,963 | | | | 132 | |
| WMS Industries (a) | | | 2,673 | | | | 94 | |
| Wolverine World Wide (b) | | | 6,198 | | | | 176 | |
| World Wrestling Entertainment | | | 2,272 | | | | 38 | |
| Xerium Technologies | | | 1,915 | | | | 24 | |
| Yankee Candle | | | 4,803 | | | | 163 | |
| Zale (a) | | | 5,782 | | | | 167 | |
| Zumiez (a) (b) | | | 1,607 | | | | 53 | |
| | | | | | | | | |
| | | | | | | | 22,689 | |
| | | | | | | | | |
| Consumer Staples – 2.8% |
| Alico | | | 545 | | | | 34 | |
| Alliance One International (a) | | | 10,303 | | | | 50 | |
| American Oriental Bioengineering (a) (b) | | | 4,979 | | | | 38 | |
| Arden Group, Class A | | | 203 | | | | 28 | |
| Boston Beer, Class A (a) | | | 642 | | | | 23 | |
| Casey’s General Stores | | | 5,656 | | | | 137 | |
| Central European Distribution (a) | | | 3,260 | | | | 83 | |
| Central Garden & Pet (a) (b) | | | 2,402 | | | | 120 | |
| Chattem (a) | | | 2,102 | | | | 89 | |
| Chiquita Brands International | | | 4,977 | | | | 68 | |
| Coca-Cola Bottling | | | 529 | | | | 33 | |
| Darling International (a) | | | 7,634 | | | | 33 | |
| Delta & Pine Land | | | 4,265 | | | | 173 | |
The accompanying notes are an integral part of the financial statements.
22 First American Funds Annual Report 2006
| | | | | | | | | |
| Small Cap Index Fund (continued) |
| DESCRIPTION | | SHARES | | | VALUE | |
| |
| Diamond Foods | | | 1,358 | | | $ | 23 | |
| Elizabeth Arden (a) | | | 2,990 | | | | 52 | |
| Farmer Brothers | | | 802 | | | | 18 | |
| Flowers Foods | | | 5,722 | | | | 156 | |
| Gold Kist (a) | | | 5,878 | | | | 116 | |
| Great Atlantic & Pacific Tea (b) | | | 2,085 | | | | 58 | |
| Green Mountain Coffee Roasters (a) | | | 610 | | | | 24 | |
| Hain Celestial Group (a) | | | 3,485 | | | | 98 | |
| Imperial Sugar (b) | | | 1,260 | | | | 33 | |
| Ingles Markets, Class A | | | 1,381 | | | | 39 | |
| Inter Parfums | | | 584 | | | | 12 | |
| J&J Snack Foods | | | 1,492 | | | | 50 | |
| Jones Soda (a) | | | 2,466 | | | | 24 | |
| Lancaster Colony | | | 2,201 | | | | 89 | |
| Lance (b) | | | 3,522 | | | | 69 | |
| Longs Drug Stores | | | 3,509 | | | | 151 | |
| M & F Worldwide (a) | | | 1,373 | | | | 22 | |
| Mannatech (b) | | | 1,887 | | | | 30 | |
| Maui Land & Pineapple (a) | | | 508 | | | | 16 | |
| Medifast (a) | | | 1,295 | | | | 12 | |
| MGP Ingredients | | | 1,064 | | | | 24 | |
| Nash-Finch (b) | | | 1,526 | | | | 40 | |
| National Beverage | | | 1,220 | | | | 14 | |
| NBTY (a) | | | 6,349 | | | | 177 | |
| Nu Skin Enterprises, Class A | | | 6,177 | | | | 118 | |
| Parlux Fragrances (a) (b) | | | 1,482 | | | | 10 | |
| Pathmark Stores (a) | | | 5,440 | | | | 55 | |
| Peets Coffee & Tea (a) (b) | | | 1,807 | | | | 48 | |
| Performance Food Group (a) | | | 3,894 | | | | 113 | |
| Pilgrim’s Pride (b) | | | 4,221 | | | | 105 | |
| Playtex Products (a) | | | 6,227 | | | | 87 | |
| Premium Standard Farms | | | 1,005 | | | | 19 | |
| PriceSmart (a) | | | 887 | | | | 15 | |
| Ralcorp Holdings (a) | | | 2,985 | | | | 148 | |
| Reddy Ice Holdings | | | 1,414 | | | | 34 | |
| Revlon (a) | | | 17,286 | | | | 23 | |
| Ruddick (b) | | | 3,852 | | | | 109 | |
| Sanderson Farms (b) | | | 1,939 | | | | 51 | |
| Seaboard | | | 43 | | | | 61 | |
| Smart & Final (a) | | | 1,500 | | | | 27 | |
| Spartan Stores | | | 2,429 | | | | 50 | |
| Spectrum Brands (a) (b) | | | 3,864 | | | | 38 | |
| Tiens Biotech Group USA (a) | | | 654 | | | | 2 | |
| Tootsie Roll Industries | | | 3,445 | | | | 110 | |
| Topps | | | 4,398 | | | | 38 | |
| Treehouse Foods (a) | | | 3,108 | | | | 79 | |
| United Natural Foods (a) (b) | | | 4,817 | | | | 168 | |
| Universal (b) | | | 2,852 | | | | 105 | |
| Usana Health Sciences (a) (b) | | | 1,211 | | | | 54 | |
| Vector Group (b) | | | 4,479 | | | | 77 | |
| Village Super Market | | | 183 | | | | 13 | |
| WD-40 Company | | | 1,849 | | | | 63 | |
| Weis Markets | | | 912 | | | | 37 | |
| Wild Oats Markets (a) (b) | | | 3,416 | | | | 61 | |
| | | | | | | | | |
| | | | | | | | 4,174 | |
| | | | | | | | | |
| Energy – 5.0% |
| Allis Chalmers Energy (a) | | | 1,824 | | | | 28 | |
| Alon USA Energy | | | 1,056 | | | | 30 | |
| Arena Resources (a) (b) | | | 1,199 | | | | 43 | |
| Atlas America (a) | | | 2,140 | | | | 103 | |
| ATP Oil & Gas (a) (b) | | | 2,139 | | | | 92 | |
| Atwood Oceanics (a) (b) | | | 3,021 | | | | 140 | |
| Aurora Oil & Gas (a) (b) | | | 7,420 | | | | 23 | |
| Aventine Renewable Energy (a) (b) | | | 2,996 | | | | 74 | |
| Basic Energy Services (a) | | | 1,394 | | | | 34 | |
| Berry Petroleum, Class A | | | 4,050 | | | | 121 | |
| Bill Barrett (a) (b) | | | 3,174 | | | | 91 | |
| Bois D’ Arc Energy (a) | | | 1,585 | | | | 25 | |
| Brigham Exploration (a) | | | 5,071 | | | | 40 | |
| Bristow Group (a) | | | 2,785 | | | | 92 | |
| Bronco Drilling (a) | | | 1,515 | | | | 26 | |
| Callon Petroleum (a) | | | 2,265 | | | | 35 | |
| Carbo Ceramics (b) | | | 2,417 | | | | 81 | |
| Carrizo Oil & Gas (a) | | | 2,350 | | | | 67 | |
| Clayton Williams Energy (a) | | | 780 | | | | 31 | |
| Complete Production Services (a) (b) | | | 2,342 | | | | 45 | |
| Comstock Resources (a) (b) | | | 4,848 | | | | 135 | |
| Crosstex Energy (b) | | | 888 | | | | 85 | |
| Dawson Geophysical (a) | | | 839 | | | | 25 | |
| Delek US Holdings (a) | | | 597 | | | | 11 | |
| Delta Petroleum (a) (b) | | | 5,899 | | | | 152 | |
| Dril-Quip (a) | | | 2,468 | | | | 97 | |
| Edge Petroleum (a) | | | 1,966 | | | | 36 | |
| Encore Acquisition (a) | | | 5,375 | | | | 135 | |
| Energy Partners (a) | | | 4,274 | | | | 104 | |
| Evergreen Energy (a) (b) | | | 7,530 | | | | 97 | |
| EXCO Resources (a) (b) | | | 5,798 | | | | 84 | |
| Exploration Company of Delaware (a) | | | 3,252 | | | | 36 | |
| Gasco Energy (a) (b) | | | 8,950 | | | | 24 | |
| GeoGlobal Resources (a) (b) | | | 3,341 | | | | 26 | |
| Giant Industries (a) | | | 1,629 | | | | 132 | |
| GMX Resources (a) (b) | | | 896 | | | | 35 | |
| Goodrich Petroleum (a) (b) | | | 1,416 | | | | 48 | |
| Grey Wolf (a) (b) | | | 22,792 | | | | 160 | |
| Gulf Island Fabrication | | | 764 | | | | 22 | |
| GulfMark Offshore (a) | | | 1,773 | | | | 61 | |
| Gulfport Energy (a) | | | 1,434 | | | | 17 | |
| Hanover Compressor (a) (b) | | | 10,922 | | | | 202 | |
| Harvest Natural Resources (a) | | | 4,296 | | | | 48 | |
| Hercules Offshore (a) | | | 2,260 | | | | 81 | |
| Hornbeck Offshore Services (a) (b) | | | 2,411 | | | | 87 | |
| Houston Exploration (a) | | | 3,231 | | | | 175 | |
| Hydril (a) (b) | | | 2,268 | | | | 136 | |
| Input/ Output (a) (b) | | | 8,216 | | | | 92 | |
| International Coal Group (a) (b) | | | 11,829 | | | | 61 | |
| James River Coal (a) (b) | | | 1,570 | | | | 18 | |
| Lone Star Technologies (a) | | | 3,615 | | | | 175 | |
| Lufkin Industries (b) | | | 1,684 | | | | 102 | |
| Mariner Energy (a) | | | 8,147 | | | | 161 | |
| Maritrans | | | 1,135 | | | | 42 | |
| MarkWest Hydrocarbon | | | 869 | | | | 29 | |
| Matrix Service (a) (b) | | | 2,325 | | | | 33 | |
| McMoRan Exploration (a) (b) | | | 2,602 | | | | 39 | |
| Meridian Resource (a) | | | 9,190 | | | | 31 | |
| Metretek Technologies (a) | | | 1,750 | | | | 23 | |
| Natco Group (a) | | | 1,630 | | | | 54 | |
| Newpark Resources (a) | | | 10,014 | | | | 59 | |
| NGP Capital Resources | | | 2,512 | | | | 39 | |
| NS Group (a) (b) | | | 2,614 | | | | 171 | |
| Oil States International (a) | | | 5,204 | | | | 151 | |
| Pacific Ethanol (a) (b) | | | 2,826 | | | | 47 | |
| Parallel Petroleum (a) | | | 4,015 | | | | 81 | |
| Parker Drilling (a) | | | 11,337 | | | | 93 | |
| Penn Virginia (b) | | | 2,113 | | | | 151 | |
| Petrocorp, Escrow Shares (a) (c) | | | 2,040 | | | | — | |
| Petrohawk Energy (a) (b) | | | 15,941 | | | | 181 | |
| Petroleum Development (a) | | | 2,088 | | | | 96 | |
| PetroQuest Energy (a) | | | 4,807 | | | | 55 | |
| PHI (a) | | | 1,560 | | | | 49 | |
| Pioneer Drilling (a) (b) | | | 4,611 | | | | 61 | |
| PrimeEnergy (a) | | | 83 | | | | 6 | |
| Quest Resource (a) (b) | | | 2,180 | | | | 23 | |
| RAM Energy Resources (a) | | | 2,325 | | | | 12 | |
| Rentech (a) (b) | | | 15,407 | | | | 65 | |
First American Funds Annual Report 2006 23
Schedule of Investments October 31, 2006, all dollars are rounded to thousands (000)
| | | | | | | | | |
| Small Cap Index Fund (continued) |
| DESCRIPTION | | SHARES | | | VALUE | |
| |
| Resource America, Class A | | | 1,902 | | | $ | 44 | |
| Rosetta Resources (a) (b) | | | 5,599 | | | | 101 | |
| RPC | | | 2,732 | | | | 59 | |
| Stone Energy (a) | | | 2,807 | | | | 109 | |
| SulphCo (a) (b) | | | 3,878 | | | | 21 | |
| Superior Well Services (a) | | | 1,186 | | | | 29 | |
| Swift Energy (a) (b) | | | 3,234 | | | | 151 | |
| Syntroleum (a) | | | 4,663 | | | | 18 | |
| Toreador Resources (a) (b) | | | 1,646 | | | | 36 | |
| Transmeridian Exploration (a) (b) | | | 7,729 | | | | 27 | |
| Trico Marine Service (a) (b) | | | 971 | | | | 33 | |
| Union Drilling (a) | | | 1,003 | | | | 13 | |
| Universal Compression Holdings (a) | | | 3,128 | | | | 189 | |
| Vaalco Energy (a) | | | 6,423 | | | | 53 | |
| VeraSun Energy (a) (b) | | | 1,464 | | | | 27 | |
| Veritas DGC (a) (b) | | | 4,182 | | | | 301 | |
| Warren Resources (a) (b) | | | 5,947 | | | | 70 | |
| Warrior Energy (a) | | | 1,078 | | | | 31 | |
| Western Refining (b) | | | 2,485 | | | | 59 | |
| Westmoreland Coal (a) | | | 749 | | | | 17 | |
| W-H Energy Services (a) | | | 3,417 | | | | 160 | |
| Whiting Petroleum (a) (b) | | | 3,860 | | | | 172 | |
| World Fuel Services (b) | | | 3,018 | | | | 130 | |
| | | | | | | | | |
| | | | | | | | 7,522 | |
| | | | | | | | | |
| Financials – 21.9% |
| 1st Source | | | 1,471 | | | | 46 | |
| 21st Century Insurance Group | | | 3,301 | | | | 52 | |
| Acadia Realty Trust – REIT | | | 3,233 | | | | 83 | |
| Accredited Home Lenders Holdings (a) (b) | | | 2,364 | | | | 72 | |
| Advance America Cash Advance Centers (b) | | | 7,791 | | | | 117 | |
| Advanta, Class B | | | 2,269 | | | | 89 | |
| Affirmative Insurance | | | 1,014 | | | | 17 | |
| Affordable Residential Communities – REIT (a) | | | 3,493 | | | | 38 | |
| Agree Realty – REIT | | | 431 | | | | 15 | |
| Alabama National BanCorporation (b) | | | 1,604 | | | | 109 | |
| Alexander’s – REIT (a) | | | 311 | | | | 113 | |
| Alexandria Real Estate Equities – REIT (b) | | | 2,567 | | | | 256 | |
| Alfa | | | 3,711 | | | | 69 | |
| AMCORE Financial | | | 2,417 | | | | 76 | |
| American Campus Communities – REIT | | | 1,804 | | | | 48 | |
| American Equity Investment Life Holding | | | 6,166 | | | | 79 | |
| American Financial Realty Trust – REIT (b) | | | 13,347 | | | | 156 | |
| American Home Mortgage Investment – REIT (b) | | | 4,685 | | | | 160 | |
| American Physicians Capital (a) | | | 799 | | | | 44 | |
| American West Bancorp | | | 1,585 | | | | 33 | |
| Ameris Bancorp | | | 1,345 | | | | 38 | |
| Anchor Bancorp | | | 2,609 | | | | 76 | |
| Anthracite Capital – REIT (b) | | | 6,573 | | | | 94 | |
| Anworth Mortgage Asset – REIT | | | 6,040 | | | | 55 | |
| Apollo Investment | | | 8,091 | | | | 174 | |
| Arbor Realty Trust – REIT | | | 1,015 | | | | 28 | |
| Ares Capital (b) | | | 4,220 | | | | 78 | |
| Argonaut Group (a) (b) | | | 3,481 | | | | 118 | |
| Arrow Financial | | | 1,448 | | | | 37 | |
| Ashford Hospitality Trust – REIT | | | 6,352 | | | | 82 | |
| Asta Funding (b) | | | 1,235 | | | | 42 | |
| Baldwin & Lyons, Class B | | | 971 | | | | 25 | |
| BancFirst | | | 979 | | | | 49 | |
| Bancorp Bank (a) | | | 1,191 | | | | 29 | |
| BancTrust Financial Group | | | 1,320 | | | | 32 | |
| Bank Mutual | | | 7,089 | | | | 86 | |
| Bank of Granite | | | 2,230 | | | | 42 | |
| Bank of the Ozarks (b) | | | 1,648 | | | | 52 | |
| BankAtlantic Bancorp, Class A (b) | | | 4,998 | | | | 65 | |
| BankFinancial | | | 1,930 | | | | 35 | |
| BankUnited Financial, Class A (b) | | | 3,050 | | | | 82 | |
| Banner | | | 1,319 | | | | 57 | |
| Berkshire Hills Bancorp | | | 796 | | | | 29 | |
| BFC Financial (a) | | | 1,089 | | | | 6 | |
| BioMed Realty Trust – REIT (b) | | | 6,749 | | | | 218 | |
| Boston Private Financial (b) | | | 3,681 | | | | 102 | |
| Bristol West Holdings | | | 1,972 | | | | 27 | |
| Brookline Bancorp (b) | | | 7,365 | | | | 98 | |
| Cadence Financial | | | 357 | | | | 7 | |
| Calamos Asset Management (b) | | | 2,751 | | | | 80 | |
| Camden National | | | 950 | | | | 42 | |
| Capital City Bank Group | | | 1,556 | | | | 52 | |
| Capital Corporation of the West | | | 1,110 | | | | 34 | |
| Capital Lease Funding – REIT | | | 3,502 | | | | 41 | |
| Capital Southwest (b) | | | 326 | | | | 39 | |
| Capital Trust – REIT | | | 1,588 | | | | 71 | |
| Capitol Bancorp | | | 1,546 | | | | 73 | |
| Cardinal Financial | | | 2,717 | | | | 28 | |
| Cascade Bancorp | | | 2,008 | | | | 73 | |
| Cash America International (b) | | | 3,495 | | | | 144 | |
| Cathay General Bancorp | | | 5,191 | | | | 179 | |
| Cedar Shopping Centers – REIT | | | 2,848 | | | | 48 | |
| Centennial Bank Holdings (a) | | | 5,438 | | | | 52 | |
| Center Financial | | | 1,475 | | | | 36 | |
| Centerstate Banks of Florida | | | 385 | | | | 8 | |
| Centracore Properties Trust – REIT | | | 1,455 | | | | 47 | |
| Central Pacific Financial (b) | | | 3,629 | | | | 134 | |
| Charter Financial | | | 627 | | | | 30 | |
| CharterMac (b) | | | 5,808 | | | | 118 | |
| Chemical Financial | | | 3,012 | | | | 90 | |
| Chittenden | | | 5,296 | | | | 156 | |
| Citizens Banking (b) | | | 4,758 | | | | 124 | |
| Citizens First Bancorp | | | 611 | | | | 18 | |
| City Bank | | | 927 | | | | 50 | |
| City Holdings | | | 2,052 | | | | 80 | |
| Clark | | | 2,032 | | | | 25 | |
| Clayton Holdings (a) | | | 961 | | | | 14 | |
| Clifton Savings Bancorp | | | 2,145 | | | | 25 | |
| CNA Surety (a) | | | 1,782 | | | | 36 | |
| Coastal Financial (b) | | | 2,097 | | | | 29 | |
| CoBiz | | | 1,973 | | | | 45 | |
| Cohen & Steers | | | 1,428 | | | | 50 | |
| Columbia Bancorp Oregon | | | 646 | | | | 16 | |
| Columbia Banking System | | | 1,787 | | | | 57 | |
| Commerce Group | | | 5,503 | | | | 163 | |
| Community Bancorp – Nevada (a) | | | 288 | | | | 8 | |
| Community Bank System | | | 3,465 | | | | 86 | |
| Community Banks | | | 2,582 | | | | 69 | |
| Community Trust Bancorp | | | 1,774 | | | | 68 | |
| Compass Diversified Trust | | | 1,461 | | | | 25 | |
| CompuCredit (a) (b) | | | 2,385 | | | | 83 | |
| Consolidated-Tomoka Land | | | 750 | | | | 49 | |
| Corporate Office Properties Trust – REIT (b) | | | 4,030 | | | | 193 | |
| Corus Bankshares (b) | | | 4,418 | | | | 91 | |
| Cousins Properties – REIT (b) | | | 4,690 | | | | 168 | |
| Crawford & Company | | | 1,831 | | | | 14 | |
| Credit Acceptance (a) | | | 760 | | | | 25 | |
| Crescent Real Estate Equities – REIT | | | 7,858 | | | | 171 | |
| Crystal River Capital – REIT | | | 259 | | | | 6 | |
| CVB Financial | | | 7,026 | | | | 102 | |
| Deerfield Triarc Capital – REIT | | | 4,659 | | | | 69 | |
| Delphi Financial Group, Class A | | | 4,990 | | | | 196 | |
| DiamondRock Hospitality – REIT | | | 6,142 | | | | 104 | |
| Digital Realty Trust – REIT | | | 2,051 | | | | 68 | |
The accompanying notes are an integral part of the financial statements.
24 First American Funds Annual Report 2006
| | | | | | | | | |
| Small Cap Index Fund (continued) |
| DESCRIPTION | | SHARES | | | VALUE | |
| |
| Dime Community Bancshares | | | 3,397 | | | $ | 47 | |
| Direct General (b) | | | 1,781 | | | | 23 | |
| Dollar Financial (a) | | | 1,072 | | | | 25 | |
| Donegal Group, Class A | | | 1,722 | | | | 35 | |
| Doral Financial (b) | | | 9,829 | | | | 45 | |
| Downey Financial (b) | | | 1,856 | | | | 128 | |
| EastGroup Properties – REIT (b) | | | 2,950 | | | | 157 | |
| Education Realty Trust – REIT | | | 2,861 | | | | 44 | |
| EMC Insurance Group | | | 952 | | | | 29 | |
| Enstar Group (a) | | | 402 | | | | 37 | |
| Enterprise Financial Services | | | 1,076 | | | | 36 | |
| Entertainment Properties Trust – REIT | | | 3,049 | | | | 168 | |
| Equity Inns – REIT | | | 6,442 | | | | 108 | |
| Equity Lifestyle Properties – REIT (b) | | | 2,646 | | | | 130 | |
| Equity One – REIT (b) | | | 4,365 | | | | 110 | |
| eSpeed, Class A (a) | | | 2,673 | | | | 26 | |
| Extra Space Storage – REIT | | | 5,960 | | | | 110 | |
| Ezcorp (a) | | | 1,318 | | | | 60 | |
| F.N.B. (b) | | | 6,638 | | | | 112 | |
| F.N.B. – Virginia | | | 832 | | | | 31 | |
| Farmers Capital Bank | | | 932 | | | | 34 | |
| FBL Financial Group, Class A | | | 1,033 | | | | 37 | |
| Federal Agricultural Mortgage, Class C | | | 1,274 | | | | 34 | |
| FelCor Lodging Trust – REIT | | | 5,978 | | | | 124 | |
| Fidelity Bankshares | | | 2,680 | | | | 106 | |
| Fieldstone Investment – REIT | | | 5,830 | | | | 47 | |
| Financial Federal (b) | | | 2,983 | | | | 82 | |
| First Acceptance (a) | | | 2,078 | | | | 22 | |
| First Bancorp – North Carolina | | | 1,364 | | | | 31 | |
| First Bancorp of Puerto Rico (b) | | | 7,812 | | | | 77 | |
| First Busey | | | 1,597 | | | | 37 | |
| First Cash Financial Services (a) | | | 2,987 | | | | 65 | |
| First Charter | | | 3,469 | | | | 86 | |
| First Commonwealth Financial – Pennsylvania (b) | | | 7,980 | | | | 107 | |
| First Community Bancorp | | | 2,133 | | | | 114 | |
| First Community Bancshares – Nevada | | | 1,332 | | | | 49 | |
| First Financial – Indiana | | | 1,541 | | | | 53 | |
| First Financial Bancorp – Ohio (b) | | | 3,660 | | | | 59 | |
| First Financial Bankshares | | | 2,197 | | | | 88 | |
| First Financial Holdings | | | 1,475 | | | | 53 | |
| First Indiana | | | 1,711 | | | | 44 | |
| First Industrial Realty Trust – REIT (b) | | | 5,131 | | | | 236 | |
| First Merchants | | | 2,214 | | | | 55 | |
| First Midwest Bancorp (b) | | | 5,189 | | | | 197 | |
| First Niagara Financial Group (b) | | | 12,782 | | | | 183 | |
| First Place Financial | | | 1,785 | | | | 42 | |
| First Potomac Realty Trust – REIT (b) | | | 2,276 | | | | 70 | |
| First Regional Bancorp (a) | | | 996 | | | | 32 | |
| First Republic Bank – California (b) | | | 2,585 | | | | 101 | |
| First South Bancorp (b) | | | 473 | | | | 15 | |
| First State Bancorp – New Mexico | | | 1,815 | | | | 45 | |
| FirstBank, Fractional Shares (a) (c) | | | 0.27 | | | | — | |
| FirstFed Financial (a) (b) | | | 1,940 | | | | 120 | |
| FirstMerit (b) | | | 8,035 | | | | 187 | |
| Flag Financial | | | 978 | | | | 25 | |
| Flagstar Bancorp | | | 4,287 | | | | 64 | |
| Flushing Financial | | | 2,596 | | | | 46 | |
| FPIC Insurance Group (a) | | | 1,217 | | | | 44 | |
| Franklin Bank (a) | | | 1,496 | | | | 30 | |
| Franklin Street Properties – REIT (b) | | | 5,780 | | | | 119 | |
| Fremont General (b) | | | 7,409 | | | | 108 | |
| Friedman Billings Ramsey Group – REIT (b) | | | 15,608 | | | | 119 | |
| Frontier Financial (b) | | | 4,402 | | | | 128 | |
| GAMCO Investors | | | 853 | | | | 34 | |
| GB&T Bancshares | | | 1,561 | | | | 34 | |
| Getty Realty – REIT | | | 2,319 | | | | 74 | |
| GFI Group (a) (b) | | | 1,330 | | | | 77 | |
| Glacier Bancorp | | | 3,564 | | | | 124 | |
| Gladstone Capital (b) | | | 1,450 | | | | 34 | |
| Gladstone Investment | | | 2,110 | | | | 31 | |
| Glenborough Realty Trust – REIT | | | 2,896 | | | | 75 | |
| Glimcher Realty Trust – REIT (b) | | | 4,821 | | | | 124 | |
| GMH Communities Trust | | | 4,334 | | | | 61 | |
| Gramercy Capital – REIT | | | 1,375 | | | | 38 | |
| Great American Financial Resources | | | 1,095 | | | | 25 | |
| Great Southern Bancorp | | | 1,247 | | | | 39 | |
| Greater Bay Bancorp (b) | | | 5,840 | | | | 150 | |
| Greene County Bancshares | | | 472 | | | | 18 | |
| Greenhill & Company (b) | | | 1,965 | | | | 134 | |
| Hancock Holding (b) | | | 3,153 | | | | 162 | |
| Hanmi Financial | | | 4,470 | | | | 96 | |
| Harbor Florida Bancshares | | | 2,751 | | | | 125 | |
| Harleysville Group | | | 1,697 | | | | 61 | |
| Harleysville National | | | 3,302 | | | | 71 | |
| Harris & Harris Group (a) (b) | | | 2,337 | | | | 33 | |
| Healthcare Realty Trust – REIT (b) | | | 4,834 | | | | 196 | |
| Heartland Financial USA (b) | | | 1,541 | | | | 44 | |
| Heritage Commerce (b) | | | 1,650 | | | | 40 | |
| Hersha Hospitality Trust – REIT | | | 2,815 | | | | 31 | |
| Highland Hospitality – REIT (b) | | | 6,582 | | | | 91 | |
| Highwoods Properties – REIT (b) | | | 6,358 | | | | 243 | |
| Hilb, Rogal & Hobbs (b) | | | 3,659 | | | | 146 | |
| Home Properties – REIT (b) | | | 3,596 | | | | 227 | |
| HomeBanc – REIT | | | 6,315 | | | | 33 | |
| Horace Mann Educators (b) | | | 5,120 | | | | 103 | |
| Horizon Financial (b) | | | 1,510 | | | | 35 | |
| IBERIABANK | | | 1,202 | | | | 71 | |
| IMPAC Mortgage Holdings – REIT (b) | | | 9,318 | | | | 88 | |
| Independence Holdings | | | 710 | | | | 17 | |
| Independent Bank | | | 1,930 | | | | 65 | |
| Independent Bank – Michigan | | | 2,734 | | | | 65 | |
| Infinity Property & Casualty | | | 2,472 | | | | 106 | |
| Inland Real Estate – REIT | | | 7,341 | | | | 137 | |
| Innkeepers USA Trust – REIT (b) | | | 5,692 | | | | 98 | |
| Integra Bank | | | 1,958 | | | | 52 | |
| Interchange Financial Services | | | 2,551 | | | | 58 | |
| International Bancshares | | | 4,416 | | | | 135 | |
| International Securities Exchange (b) | | | 4,242 | | | | 218 | |
| Intervest Bancshares (a) | | | 540 | | | | 19 | |
| Investors Bancorp (a) | | | 4,417 | | | | 66 | |
| Investors Real Estate Trust – REIT (b) | | | 6,597 | | | | 66 | |
| Irwin Financial | | | 2,350 | | | | 52 | |
| ITLA Capital | | | 690 | | | | 39 | |
| James River Group (a) | | | 1,018 | | | | 31 | |
| JER Investment Trust | | | 2,084 | | | | 37 | |
| Kansas City Life Insurance | | | 93 | | | | 5 | |
| Kearny Financial | | | 3,029 | | | | 48 | |
| Kite Realty Group Trust – REIT | | | 2,886 | | | | 53 | |
| KKR Financial (b) | | | 8,235 | | | | 221 | |
| KNBT Bancorp | | | 3,827 | | | | 65 | |
| Knight Capital Group, Class A (a) | | | 12,257 | | | | 229 | |
| LaBranche (a) (b) | | | 6,291 | | | | 56 | |
| Lakeland Bancorp (b) | | | 2,291 | | | | 31 | |
| Lakeland Financial | | | 1,800 | | | | 47 | |
| LandAmerica Financial Group (b) | | | 2,121 | | | | 134 | |
| LaSalle Hotel Properties – REIT (b) | | | 4,145 | | | | 175 | |
| Lexington Corporate Properties Trust – REIT (b) | | | 6,696 | | | | 143 | |
| LTC Properties – REIT (b) | | | 2,168 | | | | 59 | |
| Luminent Mortgage Capital – REIT | | | 5,100 | | | | 54 | |
| Macatawa Bank | | | 2,034 | | | | 45 | |
| MAF Bancorp | | | 3,559 | | | | 153 | |
| Maguire Properties – REIT | | | 4,400 | | | | 188 | |
First American Funds Annual Report 2006 25
Schedule of Investments October 31, 2006, all dollars are rounded to thousands (000)
| | | | | | | | | |
| Small Cap Index Fund (continued) |
| DESCRIPTION | | SHARES | | | VALUE | |
| |
| MainSource Financial Group | | | 1,483 | | | $ | 27 | |
| MarketAxess Holdings (a) | | | 3,182 | | | | 36 | |
| Marlin Business Services (a) | | | 917 | | | | 21 | |
| MB Financial | | | 3,658 | | | | 132 | |
| MBT Financial | | | 1,830 | | | | 28 | |
| MCG Capital | | | 5,215 | | | | 93 | |
| Meadowbrook Insurance Group (a) | | | 2,805 | | | | 34 | |
| Medallion Financial | | | 1,310 | | | | 16 | |
| Medical Properties Trust – REIT | | | 3,492 | | | | 47 | |
| Mercantile Bank | | | 936 | | | | 37 | |
| MetroCorp Bancshares | | | 268 | | | | 6 | |
| MFA Mortgage Investments – REIT | | | 9,838 | | | | 78 | |
| Mid-America Apartment Communities – REIT (b) | | | 2,275 | | | | 145 | |
| Midland | | | 1,226 | | | | 57 | |
| Mid-State Bancshares | | | 2,732 | | | | 82 | |
| Midwest Banc Holdings (b) | | | 1,639 | | | | 39 | |
| Mills – REIT | | | 6,309 | | | | 115 | |
| MortgageIT Holdings – REIT | | | 3,243 | | | | 46 | |
| Move (a) | | | 12,191 | | | | 58 | |
| MVC Capital | | | 1,907 | | | | 25 | |
| Nara Bancorp | | | 2,268 | | | | 43 | |
| NASB Financial | | | 473 | | | | 19 | |
| National Financial Partners (b) | | | 4,132 | | | | 163 | |
| National Health Investors – REIT | | | 2,802 | | | | 90 | |
| National Interstate | | | 1,767 | | | | 50 | |
| National Penn Bancshares (b) | | | 5,301 | | | | 109 | |
| National Penn Bancshares, Fractional Shares (a) (c) | | | 0.50 | | | | — | |
| National Retail Properties – REIT (b) | | | 6,445 | | | | 145 | |
| National Western Life Insurance, Class A | | | 266 | | | | 64 | |
| Nationwide Health Properties – REIT (b) | | | 7,610 | | | | 219 | |
| Navigators Group (a) | | | 1,292 | | | | 61 | |
| NBT Bancorp | | | 3,685 | | | | 92 | |
| Net Bank | | | 5,895 | | | | 31 | |
| NewAlliance Bancshares (b) | | | 13,248 | | | | 205 | |
| Newcastle Investment – REIT | | | 5,258 | | | | 156 | |
| Newkirk Realty Trust – REIT | | | 1,496 | | | | 25 | |
| Northern Empire Bancshares (a) | | | 1,168 | | | | 34 | |
| NorthStar Realty Finance – REIT | | | 4,693 | | | | 71 | |
| Northwest Bancorp | | | 2,427 | | | | 65 | |
| NovaStar Financial – REIT (b) | | | 3,520 | | | | 112 | |
| NYMAGIC | | | 479 | | | | 15 | |
| OceanFirst Financial | | | 1,391 | | | | 33 | |
| Ocwen Financial (a) | | | 3,925 | | | | 61 | |
| Odyssey Re Holdings | | | 870 | | | | 31 | |
| Ohio Casualty (b) | | | 7,149 | | | | 196 | |
| Old National Bancorp | | | 7,798 | | | | 148 | |
| Old Second Bancorp | | | 1,718 | | | | 52 | |
| Omega Financial | | | 1,585 | | | | 51 | |
| OMEGA Healthcare Investors – REIT | | | 6,249 | | | | 105 | |
| optionsXpress Holdings (b) | | | 2,549 | | | | 79 | |
| Oriental Financial Group | | | 2,537 | | | | 30 | |
| Pacific Capital Bancorp | | | 5,231 | | | | 161 | |
| Park National (b) | | | 1,389 | | | | 141 | |
| Parkway Properties – REIT (b) | | | 1,719 | | | | 85 | |
| Partners Trust Financial Group | | | 4,550 | | | | 51 | |
| PennFed Financial Services | | | 1,352 | | | | 25 | |
| Pennsylvania – REIT | | | 4,301 | | | | 185 | |
| Penson Worldwide (a) | | | 832 | | | | 20 | |
| Peoples Bancorp – Ohio | | | 1,309 | | | | 38 | |
| PFF Bancorp | | | 2,218 | | | | 69 | |
| Phoenix Companies | | | 11,806 | | | | 187 | |
| Pinnacle Financial Partners (a) | | | 1,259 | | | | 42 | |
| Piper Jaffray Companies (a) (b) | | | 2,345 | | | | 162 | |
| Placer Sierra Bancshares | | | 893 | | | | 21 | |
| PMA Capital (a) | | | 4,134 | | | | 39 | |
| Post Properties – REIT (b) | | | 4,746 | | | | 232 | |
| Potlatch – REIT (b) | | | 4,962 | | | | 201 | |
| Premierwest Bancorp | | | 1,899 | | | | 32 | |
| Presidential Life | | | 2,443 | | | | 58 | |
| PrivateBancorp | | | 1,890 | | | | 78 | |
| ProAssurance (a) (b) | | | 3,167 | | | | 154 | |
| Prosperity Bancshares | | | 2,499 | | | | 87 | |
| Provident Bankshares (b) | | | 3,889 | | | | 141 | |
| Provident Financial Services (b) | | | 7,837 | | | | 144 | |
| Provident New York Bancorp | | | 4,396 | | | | 62 | |
| PS Business Parks – REIT | | | 2,161 | | | | 142 | |
| QC Holdings (a) | | | 732 | | | | 10 | |
| R&G Financial | | | 3,322 | | | | 26 | |
| RAIT Investment Trust – REIT | | | 3,520 | | | | 106 | |
| Ramco-Gershenson Properties Trust – REIT | | | 2,216 | | | | 73 | |
| Realty Income – REIT (b) | | | 8,233 | | | | 217 | |
| Redwood Trust – REIT (b) | | | 2,536 | | | | 139 | |
| Renasant | | | 2,064 | | | | 66 | |
| Republic Bancorp | | | 9,207 | | | | 123 | |
| Republic Bancorp – Kentucky, Class A | | | 995 | | | | 21 | |
| Republic Property Trust – REIT | | | 2,890 | | | | 36 | |
| Rewards Network (a) | | | 2,955 | | | | 17 | |
| RLI | | | 2,754 | | | | 149 | |
| Rockville Financial | | | 1,250 | | | | 18 | |
| S&T Bancorp | | | 3,179 | | | | 108 | |
| Safety Insurance Group | | | 1,529 | | | | 76 | |
| Sanders Morris Harris Group | | | 1,866 | | | | 22 | |
| Sandy Spring Bancorp | | | 1,673 | | | | 61 | |
| Santander Bancorp | | | 669 | | | | 13 | |
| Saul Centers – REIT | | | 1,744 | | | | 85 | |
| Saxon Capital | | | 6,180 | | | | 87 | |
| SCBT Financial | | | 963 | | | | 40 | |
| SCPIE Holdings (a) | | | 1,121 | | | | 31 | |
| SeaBright Insurance Holdings (a) | | | 1,773 | | | | 29 | |
| Seacoast Banking | | | 1,784 | | | | 47 | |
| Security Bank | | | 1,420 | | | | 34 | |
| Selective Insurance Group (b) | | | 3,326 | | | | 184 | |
| Senior Housing Properties Trust – REIT (b) | | | 7,130 | | | | 163 | |
| Shore Bancshares | | | 484 | | | | 14 | |
| Sierra Bancorp | | | 493 | | | | 15 | |
| Signature Bank (a) | | | 2,821 | | | | 86 | |
| Simmons First National, Class A | | | 1,714 | | | | 53 | |
| Sizeler Property Investors – REIT | | | 2,565 | | | | 39 | |
| Smithtown Bancorp | | | 868 | | | | 25 | |
| Southside Bancshares | | | 1,211 | | | | 31 | |
| Southwest Bancorp – Oklahoma | | | 1,616 | | | | 44 | |
| Sovran Self Storage – REIT | | | 2,282 | | | | 135 | |
| Spirit Finance – REIT (b) | | | 8,651 | | | | 103 | |
| State Auto Financial | | | 1,731 | | | | 56 | |
| State National Bancshares | | | 801 | | | | 31 | |
| Sterling Bancorp | | | 2,199 | | | | 43 | |
| Sterling Bancshares | | | 5,405 | | | | 99 | |
| Sterling Financial – Pennsylvania | | | 3,053 | | | | 70 | |
| Sterling Financial – Washington (b) | | | 4,001 | | | | 133 | |
| Stewart Information Services | | | 2,040 | | | | 76 | |
| Stifel Financial (a) | | | 1,099 | | | | 40 | |
| Strategic Hotels & Resorts – REIT (b) | | | 7,513 | | | | 160 | |
| Suffolk Bancorp | | | 1,408 | | | | 49 | |
| Summit Bancshares | | | 784 | | | | 21 | |
| Sun Bancorp – New Jersey (a) | | | 1,640 | | | | 34 | |
| Sun Communities – REIT (b) | | | 2,248 | | | | 79 | |
| Sunstone Hotel Investors – REIT (b) | | | 5,961 | | | | 176 | |
| Superior Bancorp (a) | | | 1,844 | | | | 20 | |
The accompanying notes are an integral part of the financial statements.
26 First American Funds Annual Report 2006
| | | | | | | | | |
| Small Cap Index Fund (continued) |
| DESCRIPTION | | SHARES | | | VALUE | |
| |
| Susquehanna Bancshares | | | 5,324 | | | $ | 133 | |
| SVB Financial (a) (b) | | | 4,019 | | | | 185 | |
| SWS Group | | | 1,899 | | | | 53 | |
| SY Bancorp | | | 1,442 | | | | 42 | |
| Tanger Factory Outlet Centers – REIT | | | 4,183 | | | | 156 | |
| Taylor Capital Group | | | 598 | | | | 21 | |
| Technology Investment Capital | | | 1,700 | | | | 26 | |
| Tejon Ranch (a) | | | 1,165 | | | | 57 | |
| Texas Capital Bancshares (a) (b) | | | 2,672 | | | | 54 | |
| Texas Regional Bancshares, Class A | | | 5,168 | | | | 201 | |
| Texas United Bancshares | | | 655 | | | | 22 | |
| Thomas Weisel Partners Group (a) (b) | | | 757 | | | | 12 | |
| TierOne | | | 2,393 | | | | 77 | |
| Tompkins Trustco | | | 949 | | | | 47 | |
| Tower Group | | | 2,213 | | | | 78 | |
| Tradestation Group (a) (b) | | | 2,862 | | | | 45 | |
| Trammell Crow (a) (b) | | | 3,983 | | | | 194 | |
| Triad Guaranty (a) | | | 1,014 | | | | 52 | |
| TriCo Bancshares | | | 1,732 | | | | 45 | |
| TrustCo Bank Corporation of New York (b) | | | 8,588 | | | | 95 | |
| Trustmark | | | 5,397 | | | | 171 | |
| Trustreet Properties – REIT (b) | | | 7,656 | | | | 130 | |
| UCBH Holdings (b) | | | 10,442 | | | | 179 | |
| UMB Financial | | | 2,590 | | | | 93 | |
| Umpqua Holdings (b) | | | 6,921 | | | | 195 | |
| Union Bankshares | | | 1,678 | | | | 50 | |
| United Bankshares | | | 4,271 | | | | 163 | |
| United Community Banks | | | 3,606 | | | | 113 | |
| United Community Financial | | | 3,451 | | | | 44 | |
| United Fire & Casualty | | | 1,942 | | | | 69 | |
| United PanAm Financial (a) | | | 853 | | | | 11 | |
| United Security Bancshares (b) | | | 827 | | | | 21 | |
| Universal American Financial (a) | | | 4,221 | | | | 78 | |
| Universal Health Realty Income Trust – REIT | | | 1,559 | | | | 61 | |
| Univest Corporation of Pennsylvania | | | 1,461 | | | | 44 | |
| Urstadt Biddle Properties, Class A – REIT | | | 2,900 | | | | 55 | |
| USB Holding | | | 1,428 | | | | 32 | |
| USB Holding, Fractional Shares (a) (c) | | | 0.10 | | | | — | |
| USI Holdings (a) | | | 5,352 | | | | 85 | |
| U-Store-It Trust – REIT | | | 4,587 | | | | 101 | |
| Vineyard National Bancorp | | | 1,085 | | | | 24 | |
| Virginia Commerce Bancorp (a) | | | 1,981 | | | | 40 | |
| Virginia Financial Group | | | 1,227 | | | | 34 | |
| W Holding Company | | | 12,837 | | | | 73 | |
| Waddell & Reed Financial, Class A | | | 9,009 | | | | 230 | |
| Washington Real Estate Investment Trust – REIT (b) | | | 5,023 | | | | 212 | |
| Washington Trust Bancorp | | | 1,602 | | | | 43 | |
| WesBanco | | | 2,592 | | | | 85 | |
| West Bancorp (b) | | | 2,097 | | | | 38 | |
| West Coast Bancorp – Oregon | | | 1,883 | | | | 62 | |
| Westamerica Bancorporation | | | 3,704 | | | | 185 | |
| Western Alliance Bancorp (a) | | | 1,008 | | | | 34 | |
| Westfield Financial | | | 491 | | | | 16 | |
| Willow Grove Bancorp | | | 933 | | | | 15 | |
| Wilshire Bancorp | | | 2,143 | | | | 42 | |
| Windrose Medical Properties Trust – REIT | | | 1,280 | | | | 24 | |
| Winston Hotels – REIT | | | 3,561 | | | | 43 | |
| Winthrop Realty Trust – REIT | | | 2,446 | | | | 15 | |
| Wintrust Financial | | | 2,752 | | | | 133 | |
| World Acceptance (a) | | | 2,271 | | | | 114 | |
| WSFS Financial | | | 677 | | | | 44 | |
| Yardville National Bancorp | | | 1,077 | | | | 43 | |
| Zenith National Insurance (b) | | | 4,118 | | | | 192 | |
| | | | | | | | | |
| | | | | | | | 33,026 | |
| | | | | | | | | |
| Healthcare – 12.0% |
| Abaxis (a) | | | 2,362 | | | | 47 | |
| ABIOMED (a) | | | 2,315 | | | | 33 | |
| ACADIA Pharmaceuticals (a) | | | 2,699 | | | | 26 | |
| Adams Respiratory Therapeutics (a) | | | 3,214 | | | | 139 | |
| Adeza Biomedical (a) | | | 1,677 | | | | 23 | |
| Adolor (a) | | | 4,868 | | | | 67 | |
| Advanced Magnetics (a) (b) | | | 890 | | | | 37 | |
| ADVENTRX Pharmaceuticals (a) (b) | | | 6,063 | | | | 20 | |
| Affymetrix (a) (b) | | | 7,522 | | | | 192 | |
| Air Methods (a) | | | 1,157 | | | | 28 | |
| Akorn (a) | | | 4,964 | | | | 22 | |
| Albany Molecular Research (a) | | | 2,711 | | | | 32 | |
| Alderwoods Group (a) | | | 4,788 | | | | 95 | |
| Alexion Pharmaceuticals (a) (b) | | | 3,503 | | | | 131 | |
| Align Technology (a) (b) | | | 7,338 | | | | 102 | |
| Alkermes (a) (b) | | | 10,309 | | | | 173 | |
| Alliance Imaging (a) | | | 1,950 | | | | 17 | |
| Allscripts Healthcare Solutions (a) | | | 4,692 | | | | 111 | |
| Alnylam Pharmaceuticals (a) (b) | | | 3,566 | | | | 70 | |
| Alpharma, Class A | | | 4,523 | | | | 100 | |
| Altus Pharmaceuticals (a) | | | 612 | | | | 10 | |
| AMEDISYS (a) (b) | | | 1,982 | | | | 80 | |
| American Medical Systems (a) (b) | | | 7,882 | | | | 140 | |
| AMERIGROUP (a) | | | 5,517 | | | | 165 | |
| AMN Healthcare Services (a) | | | 3,622 | | | | 92 | |
| Amsurg, Class A (a) (b) | | | 3,477 | | | | 73 | |
| Anadys Pharmaceuticals (a) | | | 3,174 | | | | 11 | |
| Analogic | | | 1,565 | | | | 87 | |
| Andrx Group (a) | | | 8,353 | | | | 205 | |
| AngioDynamics (a) | | | 1,364 | | | | 30 | |
| Applera (a) | | | 7,885 | | | | 122 | |
| Apria Healthcare Group (a) | | | 4,885 | | | | 114 | |
| Arena Pharmaceuticals (a) (b) | | | 5,019 | | | | 77 | |
| Ariad Pharmaceuticals (a) | | | 6,990 | | | | 30 | |
| Array Biopharma (a) | | | 4,005 | | | | 39 | |
| Arrow International | | | 2,112 | | | | 76 | |
| Arthrocare (a) (b) | | | 2,857 | | | | 115 | |
| Aspect Medical Systems (a) | | | 1,867 | | | | 33 | |
| AtheroGenics (a) (b) | | | 4,501 | | | | 59 | |
| Auxilium Pharmaceuticals (a) | | | 2,417 | | | | 30 | |
| AVANIR Pharmaceuticals (a) (b) | | | 3,688 | | | | 15 | |
| AVI BioPharma (a) (b) | | | 5,601 | | | | 22 | |
| Bentley Pharmaceuticals (a) | | | 2,236 | | | | 28 | |
| BioCryst Pharmaceuticals (a) | | | 2,561 | | | | 30 | |
| Bioenvision (a) (b) | | | 4,622 | | | | 24 | |
| BioMarin Pharmaceuticals (a) | | | 9,517 | | | | 153 | |
| Bio-Rad Laboratories, Class A (a) | | | 2,007 | | | | 147 | |
| Bio-Reference Labs (a) | | | 1,278 | | | | 30 | |
| Biosite (a) (b) | | | 1,968 | | | | 90 | |
| Bradley Pharmaceuticals (a) (b) | | | 1,622 | | | | 28 | |
| Bruker BioSciences (a) | | | 3,749 | | | | 30 | |
| Candela (a) | | | 2,700 | | | | 38 | |
| Capital Senior Living (a) | | | 2,424 | | | | 23 | |
| Caraco Pharmaceutical Laboratories (a) | | | 1,406 | | | | 16 | |
| Cell Genesys (a) (b) | | | 5,182 | | | | 23 | |
| Centene (a) (b) | | | 4,773 | | | | 113 | |
| Cepheid (a) | | | 6,083 | | | | 50 | |
| Cerus (a) | | | 3,095 | | | | 22 | |
| Chemed | | | 3,020 | | | | 107 | |
| CNS | | | 1,753 | | | | 65 | |
| Coley Pharmaceutical Group (a) (b) | | | 1,998 | | | | 23 | |
| CombinatoRx (a) | | | 2,101 | | | | 16 | |
| Computer Programs & Systems | | | 897 | | | | 31 | |
| Conceptus (a) | | | 2,540 | | | | 50 | |
| CONMED (a) | | | 3,468 | | | | 77 | |
| Connetics (a) | | | 3,971 | | | | 68 | |
First American Funds Annual Report 2006 27
Schedule of Investments October 31, 2006, all dollars are rounded to thousands (000)
| | | | | | | | | |
| Small Cap Index Fund (continued) |
| DESCRIPTION | | SHARES | | | VALUE | |
| |
| Conor Medsystems (a) | | | 3,017 | | | $ | 74 | |
| Corvel (a) | | | 695 | | | | 30 | |
| Cotherix (a) (b) | | | 2,158 | | | | 16 | |
| Cross Country Healthcare (a) | | | 3,468 | | | | 67 | |
| Cubist Pharmaceuticals (a) | | | 6,075 | | | | 135 | |
| CV Therapeutics (a) (b) | | | 6,132 | | | | 79 | |
| Cyberonics (a) (b) | | | 2,511 | | | | 45 | |
| Cypress Bioscience (a) | | | 3,620 | | | | 29 | |
| Cytokinetics (a) | | | 2,860 | | | | 21 | |
| Datascope | | | 1,397 | | | | 50 | |
| deCODE Genetics (a) | | | 6,753 | | | | 36 | |
| Dendreon (a) (b) | | | 7,387 | | | | 37 | |
| Dendrite International (a) | | | 4,866 | | | | 51 | |
| DepoMed (a) | | | 3,013 | | | | 13 | |
| DexCom (a) (b) | | | 1,876 | | | | 17 | |
| Digene (a) | | | 1,861 | | | | 86 | |
| Diversa (a) | | | 2,882 | | | | 27 | |
| DJ Orthopedics (a) (b) | | | 2,589 | | | | 104 | |
| Durect (a) (b) | | | 6,189 | | | | 29 | |
| Eclipsys (a) | | | 5,041 | | | | 107 | |
| Emageon (a) | | | 2,335 | | | | 37 | |
| Emeritus (a) | | | 551 | | | | 13 | |
| Emisphere Technologies (a) (b) | | | 2,655 | | | | 18 | |
| Encore Medical (a) | | | 6,626 | | | | 43 | |
| Encysive Pharmaceuticals (a) (b) | | | 7,193 | | | | 34 | |
| Enzo Biochem (a) (b) | | | 3,446 | | | | 49 | |
| Enzon (a) (b) | | | 5,238 | | | | 45 | |
| eResearch Technology (a) | | | 6,033 | | | | 50 | |
| ev3 (a) | | | 1,433 | | | | 25 | |
| Exelixis (a) | | | 9,474 | | | | 92 | |
| Five Star Quality Care (a) | | | 3,519 | | | | 36 | |
| FoxHollow Technologies (a) (b) | | | 2,080 | | | | 73 | |
| Genesis HealthCare (a) | | | 2,262 | | | | 110 | |
| Genitope (a) (b) | | | 2,806 | | | | 10 | |
| Genomic Health (a) | | | 1,387 | | | | 23 | |
| Genta (a) | | | 14,904 | | | | 12 | |
| Gentiva Health Services (a) | | | 2,859 | | | | 53 | |
| Geron (a) (b) | | | 7,328 | | | | 59 | |
| Greatbatch (a) (b) | | | 2,676 | | | | 60 | |
| GTx (a) | | | 792 | | | | 9 | |
| Haemonetics (a) | | | 2,955 | | | | 135 | |
| Hana Biosciences (a) (b) | | | 3,201 | | | | 27 | |
| HealthExtras (a) | | | 3,028 | | | | 70 | |
| HealthSpring (a) | | | 2,094 | | | | 42 | |
| HealthTronics (a) | | | 3,862 | | | | 27 | |
| Healthways (a) (b) | | | 3,956 | | | | 168 | |
| Hi-Tech Pharmaceutical (a) | | | 942 | | | | 14 | |
| Hologic (a) (b) | | | 5,714 | | | | 275 | |
| Horizon Health (a) (b) | | | 1,247 | | | | 19 | |
| Human Genome Sciences (a) (b) | | | 14,909 | | | | 199 | |
| Hythiam (a) (b) | | | 2,921 | | | | 24 | |
| ICOS (a) (b) | | | 7,287 | | | | 231 | |
| ICU Medical (a) (b) | | | 1,610 | | | | 68 | |
| Idenix Pharmaceuticals (a) (b) | | | 2,752 | | | | 23 | |
| I-Flow (a) (b) | | | 2,380 | | | | 37 | |
| Illumina (a) (b) | | | 5,104 | | | | 224 | |
| Immucor (a) | | | 7,778 | | | | 214 | |
| Incyte (a) (b) | | | 9,925 | | | | 47 | |
| Indevus Pharmaceuticals (a) | | | 5,309 | | | | 36 | |
| Integra LifeSciences (a) (b) | | | 2,207 | | | | 82 | |
| InterMune (a) (b) | | | 2,854 | | | | 63 | |
| IntraLase (a) | | | 2,390 | | | | 47 | |
| Invacare | | | 3,481 | | | | 76 | |
| inVentiv Health (a) | | | 3,028 | | | | 87 | |
| Inverness Medical Innovations (a) | | | 2,826 | | | | 107 | |
| IRIS International (a) | | | 2,049 | | | | 25 | |
| Isis Pharmaceuticals (a) | | | 7,747 | | | | 66 | |
| Kendle International (a) | | | 1,368 | | | | 47 | |
| Kensey Nash (a) | | | 1,158 | | | | 35 | |
| Keryx Biopharmaceuticals (a) | | | 4,807 | | | | 67 | |
| Kindred Healthcare (a) (b) | | | 3,154 | | | | 85 | |
| K-V Pharmaceutical, Class A (a) (b) | | | 4,098 | | | | 91 | |
| Kyphon (a) (b) | | | 4,930 | | | | 195 | |
| LCA-Vision | | | 2,304 | | | | 81 | |
| Lexicon Genetics (a) | | | 7,590 | | | | 30 | |
| LHC Group (a) | | | 1,023 | | | | 25 | |
| LifeCell (a) (b) | | | 3,836 | | | | 90 | |
| Luminex (a) (b) | | | 3,565 | | | | 57 | |
| Magellan Health Services (a) | | | 4,049 | | | | 177 | |
| MannKind (a) (b) | | | 2,654 | | | | 54 | |
| Martek Biosciences (a) (b) | | | 3,585 | | | | 85 | |
| Matria Healthcare (a) (b) | | | 2,329 | | | | 66 | |
| Matthews International, Class A | | | 3,647 | | | | 140 | |
| Maxygen (a) | | | 3,050 | | | | 26 | |
| Medarex (a) (b) | | | 13,623 | | | | 176 | |
| MedCath (a) | | | 923 | | | | 24 | |
| Medical Action Industries (a) | | | 1,024 | | | | 27 | |
| Medicines (a) | | | 5,639 | | | | 146 | |
| Medicis Pharmaceutical, Class A | | | 6,193 | | | | 217 | |
| Mentor | | | 4,309 | | | | 202 | |
| Merge Technologies (a) | | | 2,040 | | | | 16 | |
| Meridian Bioscience | | | 2,107 | | | | 49 | |
| Merit Medical Systems (a) | | | 3,179 | | | | 50 | |
| Metabasis Therapeutics (a) | | | 2,291 | | | | 16 | |
| MGI Pharma (a) | | | 8,775 | | | | 167 | |
| Mine Safety Appliances | | | 3,293 | | | | 125 | |
| Molecular Devices (a) | | | 1,931 | | | | 39 | |
| Molina Healthcare (a) (b) | | | 1,373 | | | | 54 | |
| Momenta Pharmaceuticals (a) | | | 2,411 | | | | 36 | |
| Monogram Biosciences (a) (b) | | | 14,463 | | | | 26 | |
| MWI Veterinary Supply (a) | | | 388 | | | | 13 | |
| Myogen (a) | | | 4,735 | | | | 248 | |
| Myriad Genetics (a) (b) | | | 4,081 | | | | 110 | |
| NABI Biopharmaceuticals (a) | | | 7,502 | | | | 49 | |
| Nastech Pharmaceutical (a) | | | 2,460 | | | | 43 | |
| National Healthcare | | | 807 | | | | 45 | |
| Natus Medical (a) | | | 2,075 | | | | 34 | |
| Nektar Therapeutics (a) (b) | | | 9,663 | | | | 139 | |
| Neurocrine Biosciences (a) | | | 4,182 | | | | 48 | |
| NeuroMetrix (a) (b) | | | 1,390 | | | | 23 | |
| New River Pharmaceuticals (a) (b) | | | 1,768 | | | | 90 | |
| Nighthawk Radiology Holdings (a) (b) | | | 701 | | | | 14 | |
| Northfield Laboratories (a) (b) | | | 2,803 | | | | 38 | |
| Northstar Neuroscience (a) | | | 1,202 | | | | 18 | |
| Novavax (a) (b) | | | 6,848 | | | | 31 | |
| Noven Pharmaceuticals (a) | | | 2,816 | | | | 63 | |
| NPS Pharmaceuticals (a) | | | 4,762 | | | | 23 | |
| NuVasive (a) | | | 3,692 | | | | 87 | |
| Nuvelo (a) | | | 5,695 | | | | 105 | |
| NxStage Medical (a) | | | 1,349 | | | | 10 | |
| Odyssey Healthcare (a) | | | 4,118 | | | | 55 | |
| Omnicell (a) | | | 3,029 | | | | 57 | |
| Onyx Pharmaceuticals (a) (b) | | | 4,569 | | | | 86 | |
| Option Care (b) | | | 2,588 | | | | 33 | |
| OraSure Technologies (a) | | | 5,101 | | | | 40 | |
| OSI Pharmaceuticals (a) (b) | | | 6,345 | | | | 243 | |
| Owens & Minor | | | 4,532 | | | | 143 | |
| Pain Therapeutics (a) (b) | | | 3,557 | | | | 30 | |
| Palomar Medical Technologies (a) (b) | | | 2,020 | | | | 95 | |
| Panacos Pharmaceuticals (a) | | | 5,614 | | | | 39 | |
The accompanying notes are an integral part of the financial statements.
28 First American Funds Annual Report 2006
| | | | | | | | | |
| Small Cap Index Fund (continued) |
| DESCRIPTION | | SHARES | | | VALUE | |
| |
| Par Pharmaceutical Companies (a) | | | 3,903 | | | $ | 76 | |
| PAREXEL International (a) | | | 2,979 | | | | 88 | |
| Penwest Pharmaceuticals (a) | | | 2,696 | | | | 48 | |
| Peregrine Pharmaceuticals (a) (b) | | | 19,547 | | | | 27 | |
| Perrigo (b) | | | 9,279 | | | | 166 | |
| Per-Se Technologies (a) (b) | | | 3,603 | | | | 88 | |
| PharmaNet Development Group (a) (b) | | | 2,115 | | | | 40 | |
| Pharmion (a) (b) | | | 2,896 | | | | 71 | |
| PolyMedica (b) | | | 2,410 | | | | 100 | |
| POZEN (a) | | | 2,726 | | | | 45 | |
| PRA International (a) (b) | | | 1,568 | | | | 46 | |
| Progenics Pharmaceutical (a) | | | 2,484 | | | | 65 | |
| PSS World Medical (a) (b) | | | 7,377 | | | | 148 | |
| Psychiatric Solutions (a) | | | 6,003 | | | | 199 | |
| Quidel (a) | | | 3,351 | | | | 52 | |
| Radiation Therapy Services (a) (b) | | | 1,370 | | | | 41 | |
| Regeneron Pharmaceutical (a) | | | 5,080 | | | | 102 | |
| RehabCare Group (a) | | | 2,105 | | | | 27 | |
| Renovis (a) (b) | | | 2,630 | | | | 9 | |
| Res-Care (a) | | | 2,416 | | | | 47 | |
| Rigel Pharmaceuticals (a) | | | 2,453 | | | | 27 | |
| Salix Pharmaceuticals (a) | | | 5,188 | | | | 69 | |
| Sangamo BioSciences (a) | | | 2,917 | | | | 16 | |
| Santarus (a) (b) | | | 5,126 | | | | 39 | |
| Savient Pharmaceuticals (a) | | | 7,255 | | | | 55 | |
| Sciele Pharma (a) (b) | | | 3,153 | | | | 69 | |
| Senomyx (a) (b) | | | 3,324 | | | | 51 | |
| Sirna Therapeutics (a) (b) | | | 4,482 | | | | 57 | |
| Sirona Dental Systems | | | 1,864 | | | | 69 | |
| Solexa (a) | | | 2,624 | | | | 27 | |
| Somaxon Pharmaceuticals (a) | | | 407 | | | | 6 | |
| SonoSite (a) (b) | | | 1,814 | | | | 52 | |
| Spectranetics (a) | | | 3,410 | | | | 42 | |
| Stereotaxis (a) (b) | | | 2,611 | | | | 31 | |
| STERIS | | | 7,909 | | | | 193 | |
| Stewart Enterprises, Class A | | | 12,693 | | | | 78 | |
| Sun Healthcare Group (a) | | | 2,579 | | | | 34 | |
| Sunrise Senior Living (a) (b) | | | 4,605 | | | | 144 | |
| SuperGen (a) | | | 6,527 | | | | 37 | |
| SurModics (a) (b) | | | 1,724 | | | | 60 | |
| Symbion (a) (b) | | | 1,592 | | | | 26 | |
| Symmetry Medical (a) | | | 3,889 | | | | 61 | |
| Tanox (a) (b) | | | 2,921 | | | | 39 | |
| Telik (a) (b) | | | 6,211 | | | | 118 | |
| Thoratec (a) | | | 5,478 | | | | 86 | |
| Trimeris (a) | | | 2,401 | | | | 18 | |
| TriPath Imaging (a) | | | 3,858 | | | | 35 | |
| TriZetto Group (a) (b) | | | 4,771 | | | | 81 | |
| United Surgical Partners (a) (b) | | | 5,133 | | | | 127 | |
| United Therapeutics (a) (b) | | | 2,583 | | | | 155 | |
| Valeant Pharmaceuticals International | | | 9,911 | | | | 185 | |
| Varian (a) | | | 3,658 | | | | 172 | |
| Ventana Medical Systems (a) | | | 3,395 | | | | 137 | |
| Viasys Healthcare (a) | | | 3,559 | | | | 102 | |
| ViroPharma (a) | | | 7,647 | | | | 102 | |
| Visicu (a) | | | 769 | | | | 8 | |
| VistaCare, Class A (a) (b) | | | 1,373 | | | | 17 | |
| Vital Images (a) (b) | | | 1,437 | | | | 45 | |
| Vital Signs | | | 628 | | | | 35 | |
| Volcano (a) | | | 431 | | | | 7 | |
| West Pharmaceutical Services | | | 3,549 | | | | 149 | |
| Wright Medical Group (a) | | | 3,469 | | | | 86 | |
| XenoPort (a) | | | 2,131 | | | | 51 | |
| Young Innovations | | | 570 | | | | 21 | |
| Zoll Medical (a) | | | 1,221 | | | | 47 | |
| ZymoGenetics (a) (b) | | | 4,182 | | | | 67 | |
| | | | | | | | | |
| | | | | | | | 18,100 | |
| | | | | | | | | |
| Industrials – 14.1% |
| 3D Systems (a) (b) | | | 1,521 | | | | 26 | |
| A.O. Smith | | | 2,007 | | | | 71 | |
| AAON | | | 1,050 | | | | 25 | |
| AAR (a) (b) | | | 3,793 | | | | 99 | |
| ABM Industries | | | 4,506 | | | | 89 | |
| ABX Air (a) | | | 6,738 | | | | 39 | |
| ACCO Brands (a) | | | 5,021 | | | | 122 | |
| Accuride (a) | | | 2,524 | | | | 31 | |
| Actuant, Class A (b) | | | 3,054 | | | | 157 | |
| Acuity Brands (b) | | | 5,037 | | | | 250 | |
| Administaff | | | 2,546 | | | | 88 | |
| Advisory Board (a) (b) | | | 2,191 | | | | 121 | |
| AirTran Holdings (a) (b) | | | 10,392 | | | | 104 | |
| Alaska Air Group (a) (b) | | | 4,202 | | | | 169 | |
| Albany International, Class A | | | 3,012 | | | | 101 | |
| Amerco (a) (b) | | | 1,171 | | | | 107 | |
| American Commercial Lines (a) (b) | | | 3,271 | | | | 210 | |
| American Ecology | | | 1,737 | | | | 36 | |
| American Railcar Industries | | | 1,007 | | | | 31 | |
| American Reprographics (a) (b) | | | 2,911 | | | | 103 | |
| American Science & Engineering (a) (b) | | | 1,029 | | | | 54 | |
| American Superconductor (a) (b) | | | 3,788 | | | | 36 | |
| American Woodmark (b) | | | 1,292 | | | | 48 | |
| Ameron International | | | 1,083 | | | | 79 | |
| Ampco-Pittsburgh | | | 801 | | | | 27 | |
| Amrep (b) | | | 187 | | | | 13 | |
| Apogee Enterprises | | | 3,317 | | | | 53 | |
| Applied Industrial Technology | | | 5,145 | | | | 148 | |
| ARGON ST (a) (b) | | | 1,424 | | | | 34 | |
| Arkansas Best (b) | | | 3,026 | | | | 124 | |
| Asset Acceptance Capital (a) | | | 1,863 | | | | 33 | |
| Astec Industries (a) | | | 1,873 | | | | 60 | |
| ASV (a) (b) | | | 2,329 | | | | 34 | |
| Atlas Air Worldwide Holdings (a) | | | 2,061 | | | | 94 | |
| Badger Meter | | | 1,342 | | | | 34 | |
| Baldor Electric | | | 3,281 | | | | 105 | |
| Banta | | | 2,832 | | | | 125 | |
| Barnes Group | | | 3,978 | | | | 80 | |
| Barrett Business Services (a) | | | 777 | | | | 17 | |
| Basin Water (a) | | | 668 | | | | 6 | |
| BE Aerospace (a) (b) | | | 8,635 | | | | 218 | |
| Beacon Roofing Supply (a) (b) | | | 4,881 | | | | 97 | |
| BlueLinx Holdings | | | 854 | | | | 9 | |
| Bowne & Company | | | 4,097 | | | | 64 | |
| Brady, Class A (b) | | | 4,705 | | | | 174 | |
| Briggs & Stratton | | | 5,843 | | | | 149 | |
| Bright Horizons Family Solutions (a) | | | 3,091 | | | | 119 | |
| Bucyrus International | | | 3,516 | | | | 147 | |
| Builders FirstSource (a) | | | 1,244 | | | | 20 | |
| Capstone Turbine (a) (b) | | | 11,455 | | | | 18 | |
| Cascade | | | 1,389 | | | | 71 | |
| Casella Waste Systems (a) | | | 2,313 | | | | 26 | |
| CBIZ (a) | | | 6,940 | | | | 49 | |
| CDI | | | 990 | | | | 23 | |
| Celadon Group (a) | | | 2,187 | | | | 41 | |
| Central Parking | | | 1,648 | | | | 28 | |
| Cenveo (a) | | | 6,012 | | | | 119 | |
| Ceradyne (a) (b) | | | 2,900 | | | | 120 | |
| Chart Industries (a) | | | 914 | | | | 13 | |
| China BAK Battery (a) (b) | | | 3,019 | | | | 21 | |
| Circor International | | | 1,866 | | | | 62 | |
| CLARCOR (b) | | | 5,768 | | | | 188 | |
| Clean Harbors (a) (b) | | | 1,835 | | | | 79 | |
| Coinstar (a) | | | 2,882 | | | | 88 | |
| Color Kinetics (a) | | | 1,483 | | | | 29 | |
| Columbus Mckinnon (a) | | | 2,040 | | | | 45 | |
First American Funds Annual Report 2006 29
Schedule of Investments October 31, 2006, all dollars are rounded to thousands (000)
| | | | | | | | | |
| Small Cap Index Fund (continued) |
| DESCRIPTION | | SHARES | | | VALUE | |
| |
| Comfort Systems USA | | | 4,501 | | | $ | 52 | |
| Commercial Vehicle Group (a) | | | 2,349 | | | | 48 | |
| COMSYS IT Partners (a) | | | 1,706 | | | | 35 | |
| Consolidated Graphics (a) | | | 1,352 | | | | 84 | |
| Cornell (a) | | | 738 | | | | 13 | |
| CoStar Group (a) | | | 1,944 | | | | 92 | |
| CRA International (a) | | | 1,380 | | | | 70 | |
| Cubic | | | 1,954 | | | | 41 | |
| Curtiss-Wright (b) | | | 4,999 | | | | 169 | |
| Deluxe | | | 5,720 | | | | 130 | |
| Diamond Management & Technology Consultation (a) | | | 3,167 | | | | 34 | |
| Dollar Thrifty Automotive (a) | | | 2,870 | | | | 115 | |
| Dycom Industries (a) (b) | | | 4,725 | | | | 110 | |
| Dynamex (a) | | | 1,487 | | | | 32 | |
| Dynamic Materials | | | 1,314 | | | | 42 | |
| DynCorp International (a) | | | 2,790 | | | | 29 | |
| EDO (b) | | | 1,785 | | | | 43 | |
| Educate (a) | | | 2,337 | | | | 18 | |
| EGL (a) | | | 3,698 | | | | 126 | |
| Electro Rent (a) | | | 2,142 | | | | 35 | |
| ElkCorp (b) | | | 2,501 | | | | 63 | |
| EMCOR Group (a) | | | 3,505 | | | | 207 | |
| Encore Wire (a) (b) | | | 2,593 | | | | 70 | |
| Energy Conversion Devices (a) (b) | | | 4,353 | | | | 160 | |
| EnerSys (a) | | | 4,842 | | | | 85 | |
| ENGlobal (a) (b) | | | 1,797 | | | | 11 | |
| Ennis Business Forms | | | 2,902 | | | | 67 | |
| EnPro Industries (a) | | | 2,500 | | | | 80 | |
| ESCO Technologies (a) (b) | | | 2,902 | | | | 126 | |
| Essex (a) | | | 2,176 | | | | 43 | |
| Esterline Technologies (a) | | | 2,864 | | | | 108 | |
| Evergreen Solar (a) (b) | | | 7,449 | | | | 65 | |
| Exponent (a) | | | 1,806 | | | | 33 | |
| ExpressJet Holdings (a) | | | 5,151 | | | | 41 | |
| Federal Signal | | | 5,523 | | | | 84 | |
| First Advantage (a) (b) | | | 413 | | | | 9 | |
| First Consulting Group (a) | | | 2,403 | | | | 26 | |
| Flanders (a) | | | 1,630 | | | | 16 | |
| Florida East Coast Industries (b) | | | 3,629 | | | | 217 | |
| Flow International (a) (b) | | | 3,899 | | | | 46 | |
| Forward Air (b) | | | 3,689 | | | | 120 | |
| Franklin Electric (b) | | | 2,382 | | | | 128 | |
| FreightCar America | | | 1,402 | | | | 75 | |
| Frontier Airlines Holdings (a) (b) | | | 4,424 | | | | 36 | |
| FTI Consulting (a) | | | 4,666 | | | | 133 | |
| FuelCell Energy (a) (b) | | | 5,500 | | | | 36 | |
| G&K Services, Class A (b) | | | 2,239 | | | | 85 | |
| Gehl Company (a) | | | 1,387 | | | | 40 | |
| GenCorp (a) (b) | | | 6,139 | | | | 80 | |
| General Cable (a) (b) | | | 5,635 | | | | 212 | |
| Genesee & Wyoming, Class A (a) | | | 4,054 | | | | 114 | |
| Genlyte Group (a) (b) | | | 2,732 | | | | 211 | |
| Geo Group (a) | | | 1,912 | | | | 73 | |
| Geo Group, Fractional Shares (a) (c) | | | 0.50 | | | | — | |
| GEVITY HR (b) | | | 3,271 | | | | 74 | |
| Global Cash Access Holdings (a) (b) | | | 3,712 | | | | 59 | |
| Goodman Global (a) | | | 2,627 | | | | 42 | |
| Gorman-Rupp | | | 1,092 | | | | 41 | |
| Granite Construction | | | 3,952 | | | | 206 | |
| Greenbrier Companies (b) | | | 1,443 | | | | 54 | |
| Griffon (a) (b) | | | 3,486 | | | | 86 | |
| H & E Equipment Services (a) | | | 1,277 | | | | 34 | |
| Healthcare Services Group | | | 2,825 | | | | 77 | |
| Heartland Express (b) | | | 7,231 | | | | 118 | |
| HEICO (b) | | | 2,575 | | | | 93 | |
| Heidrick & Struggles International (a) | | | 2,227 | | | | 91 | |
| Herley Industries (a) | | | 1,382 | | | | 20 | |
| Herman Miller (b) | | | 6,930 | | | | 238 | |
| Hexcel (a) (b) | | | 10,406 | | | | 168 | |
| Horizon Lines, Class A | | | 982 | | | | 23 | |
| Houston Wire & Cable (a) | | | 584 | | | | 12 | |
| Hub Group (a) (b) | | | 4,656 | | | | 126 | |
| Hudson Highland Group (a) | | | 2,867 | | | | 34 | |
| Huron Consulting Group (a) | | | 1,940 | | | | 78 | |
| ICT Group (a) | | | 755 | | | | 24 | |
| IHS, Class A (a) | | | 2,481 | | | | 86 | |
| II-VI (a) | | | 2,754 | | | | 67 | |
| IKON Office Solutions (b) | | | 11,446 | | | | 171 | |
| Infrasource Services (a) | | | 2,582 | | | | 51 | |
| Innovative Solutions & Support (a) | | | 1,587 | | | | 25 | |
| Insituform Technologies, Class A (a) (b) | | | 3,201 | | | | 75 | |
| Insteel Industries | | | 1,554 | | | | 28 | |
| Integrated Electrical Services (a) | | | 1,709 | | | | 29 | |
| Interline Brands (a) | | | 3,023 | | | | 72 | |
| Intermagnetics General (a) | | | 4,804 | | | | 131 | |
| Interpool | | | 1,009 | | | | 24 | |
| Ionatron (a) (b) | | | 2,993 | | | | 13 | |
| Jackson Hewitt Tax Service | | | 4,022 | | | | 139 | |
| Jacuzzi Brands (a) | | | 8,753 | | | | 108 | |
| JetBlue Airways (a) (b) | | | 19,368 | | | | 243 | |
| John H. Harland | | | 3,135 | | | | 128 | |
| K&F Industries Holdings (a) | | | 2,090 | | | | 41 | |
| Kadant (a) | | | 1,659 | | | | 45 | |
| Kaman | | | 2,641 | | | | 54 | |
| Kaydon (b) | | | 3,366 | | | | 141 | |
| Kelly Services, Class A | | | 2,084 | | | | 60 | |
| Kenexa (a) | | | 1,747 | | | | 56 | |
| Kforce (a) | | | 3,874 | | | | 58 | |
| Knight Transportation (b) | | | 6,823 | | | | 124 | |
| Knoll (b) | | | 3,154 | | | | 62 | |
| Korn/ Ferry International (a) | | | 4,725 | | | | 104 | |
| Labor Ready (a) | | | 6,076 | | | | 106 | |
| Ladish (a) | | | 1,563 | | | | 49 | |
| Lawson Products | | | 473 | | | | 23 | |
| Layne Christensen (a) | | | 1,186 | | | | 35 | |
| LB Foster (a) | | | 1,138 | | | | 25 | |
| LECG (a) | | | 2,206 | | | | 43 | |
| Lindsay Manufacturing | | | 1,547 | | | | 51 | |
| LSI Industries | | | 2,259 | | | | 41 | |
| Marten Transport (a) | | | 1,772 | | | | 30 | |
| MasTec (a) | | | 4,054 | | | | 44 | |
| McGrath Rentcorp | | | 2,460 | | | | 66 | |
| Medis Technologies (a) (b) | | | 2,292 | | | | 62 | |
| Mercury Computer Systems (a) | | | 2,506 | | | | 31 | |
| Mesa Air Group (a) (b) | | | 3,792 | | | | 34 | |
| Middleby (a) | | | 744 | | | | 67 | |
| Miller Industries (a) | | | 1,065 | | | | 21 | |
| Mobile Mini (a) | | | 3,930 | | | | 126 | |
| Moog, Class A (a) | | | 4,026 | | | | 150 | |
| MTC Technologies (a) (b) | | | 1,081 | | | | 24 | |
| Mueller Industries (b) | | | 4,177 | | | | 153 | |
| Mueller Water Products, Class A (a) (b) | | | 2,093 | | | | 33 | |
| NACCO Industries, Class A | | | 561 | | | | 84 | |
| Navigant Consulting (a) | | | 5,134 | | | | 91 | |
| Navistar International (a) (b) | | | 6,560 | | | | 182 | |
| NCI Building Systems (a) (b) | | | 2,375 | | | | 142 | |
| NCO Group (a) | | | 3,663 | | | | 99 | |
| Nordson | | | 3,281 | | | | 151 | |
| NuCo2 (a) (b) | | | 1,249 | | | | 35 | |
The accompanying notes are an integral part of the financial statements.
30 First American Funds Annual Report 2006
| | | | | | | | | |
| Small Cap Index Fund (continued) |
| DESCRIPTION | | SHARES | | | VALUE | |
| |
| Old Dominion Freight Lines (a) | | | 3,216 | | | $ | 89 | |
| On Assignment (a) | | | 2,909 | | | | 33 | |
| Orbital Sciences (a) | | | 6,341 | | | | 115 | |
| Pacer International | | | 4,171 | | | | 128 | |
| Patriot Transportation Holdings (a) | | | 73 | | | | 6 | |
| PeopleSupport (a) | | | 2,063 | | | | 40 | |
| Perini (a) | | | 2,060 | | | | 51 | |
| PGT (a) | | | 682 | | | | 10 | |
| PHH (a) | | | 6,007 | | | | 166 | |
| Pico Holdings (a) | | | 1,022 | | | | 33 | |
| Pike Electric (a) | | | 1,342 | | | | 25 | |
| Plug Power (a) (b) | | | 8,063 | | | | 32 | |
| Portfolio Recovery Associates (a) (b) | | | 1,847 | | | | 86 | |
| Powell Industries (a) | | | 804 | | | | 19 | |
| Power-One (a) | | | 8,511 | | | | 58 | |
| Pre-Paid Legal Services (b) | | | 1,224 | | | | 52 | |
| PW Eagle (b) | | | 1,172 | | | | 42 | |
| Quality Distribution (a) | | | 866 | | | | 13 | |
| RailAmerica (a) | | | 4,509 | | | | 53 | |
| Raven Industries | | | 1,843 | | | | 59 | |
| RBC Bearings (a) | | | 2,280 | | | | 62 | |
| Regal-Beloit (b) | | | 3,428 | | | | 170 | |
| Republic Airways Holdings (a) | | | 3,624 | | | | 65 | |
| Resources Connection (a) | | | 5,682 | | | | 164 | |
| Robbins & Myers | | | 1,478 | | | | 57 | |
| Rollins | | | 3,431 | | | | 74 | |
| Rush Enterprises (a) | | | 2,599 | | | | 49 | |
| Saia (a) | | | 1,962 | | | | 53 | |
| Schawk | | | 1,724 | | | | 33 | |
| School Specialty (a) | | | 2,133 | | | | 84 | |
| Sequa, Class A (a) | | | 749 | | | | 79 | |
| SI International (a) | | | 1,162 | | | | 39 | |
| Simpson Manufacturing (b) | | | 4,142 | | | | 118 | |
| SIRVA (a) | | | 5,528 | | | | 18 | |
| Sitel (a) | | | 6,524 | | | | 28 | |
| SkyWest (b) | | | 7,100 | | | | 189 | |
| Sotheby’s Holdings, Class A (b) | | | 6,740 | | | | 256 | |
| Spherion (a) | | | 7,394 | | | | 54 | |
| Standard Parking (a) (b) | | | 569 | | | | 20 | |
| Standard Register | | | 1,757 | | | | 24 | |
| Standex International | | | 1,554 | | | | 45 | |
| Star Maritime Acquisition (a) | | | 2,104 | | | | 20 | |
| Sterling Construction (a) | | | 968 | | | | 20 | |
| Strayer Education | | | 1,672 | | | | 189 | |
| Synagro Technologies | | | 6,847 | | | | 30 | |
| TAL International Group | | | 1,442 | | | | 33 | |
| Taleo (a) | | | 1,517 | | | | 17 | |
| Team (a) | | | 708 | | | | 23 | |
| Tecumseh Products, Class A (a) | | | 1,864 | | | | 31 | |
| Teledyne Technologies (a) | | | 3,799 | | | | 159 | |
| Teletech Holdings (a) | | | 3,799 | | | | 74 | |
| Tennant | | | 1,588 | | | | 44 | |
| Tetra Tech (a) | | | 6,187 | | | | 112 | |
| The Lamson & Sessions Company (a) (b) | | | 1,548 | | | | 34 | |
| The Provident Service (a) (b) | | | 1,094 | | | | 30 | |
| Titan International (b) | | | 1,764 | | | | 33 | |
| TransDigm Group (a) | | | 929 | | | | 22 | |
| Tredegar | | | 3,272 | | | | 57 | |
| Trex (a) (b) | | | 1,316 | | | | 35 | |
| Triumph Group | | | 1,873 | | | | 90 | |
| TurboChef Technologies (a) (b) | | | 1,795 | | | | 22 | |
| U.S. Xpress Enterprises (a) | | | 851 | | | | 17 | |
| UAP Holding | | | 5,676 | | | | 142 | |
| United Industrial | | | 1,121 | | | | 50 | |
| United Stationers (a) | | | 3,377 | | | | 161 | |
| Universal Forest Products (b) | | | 1,818 | | | | 83 | |
| Universal Technical Institute (a) | | | 2,387 | | | | 48 | |
| Universal Truckload Services (a) | | | 404 | | | | 11 | |
| USA Truck (a) | | | 690 | | | | 12 | |
| Valmont Industries | | | 1,964 | | | | 110 | |
| Vertrue (a) (b) | | | 760 | | | | 34 | |
| Viad (b) | | | 2,374 | | | | 88 | |
| Vicor | | | 2,293 | | | | 27 | |
| Volt Information Sciences (a) | | | 1,007 | | | | 40 | |
| Wabash National | | | 3,508 | | | | 49 | |
| Washington Group International | | | 2,949 | | | | 167 | |
| Waste Connections (a) (b) | | | 4,760 | | | | 194 | |
| Waste Industries USA | | | 830 | | | | 24 | |
| Waste Services (a) | | | 2,952 | | | | 30 | |
| Watsco (b) | | | 2,952 | | | | 147 | |
| Watson Wyatt & Company Holdings | | | 4,347 | | | | 196 | |
| Watts Water Technologies, Class A | | | 2,988 | | | | 111 | |
| Werner Enterprises (b) | | | 5,837 | | | | 107 | |
| Westinghouse Air Brake Technologies (b) | | | 5,347 | | | | 168 | |
| Williams Scotsman International (a) (b) | | | 3,318 | | | | 78 | |
| Woodward Governor (b) | | | 3,369 | | | | 120 | |
| | | | | | | | | |
| | | | | | | | 21,329 | |
| | | | | | | | | |
| Information Technology – 18.1% |
| 24/7 Real Media (a) | | | 5,402 | | | | 53 | |
| 3Com (a) (b) | | | 43,787 | | | | 213 | |
| Acacia Research – Acacia Technology (a) | | | 3,105 | | | | 40 | |
| Access Integrated Technology, Class A (a) | | | 1,498 | | | | 16 | |
| Actel (a) | | | 3,157 | | | | 52 | |
| Actuate (a) | | | 6,284 | | | | 33 | |
| Adaptec (a) (b) | | | 12,734 | | | | 58 | |
| ADTRAN (b) | | | 7,505 | | | | 174 | |
| Advanced Analogic Technologies (a) | | | 3,363 | | | | 21 | |
| Advanced Energy Industries (a) | | | 3,371 | | | | 53 | |
| Advent Software (a) (b) | | | 2,576 | | | | 95 | |
| Aeroflex (a) | | | 8,516 | | | | 92 | |
| Agile Software (a) | | | 6,246 | | | | 42 | |
| Agilysys | | | 3,472 | | | | 51 | |
| Altiris (a) | | | 2,590 | | | | 58 | |
| AMIS Holdings (a) | | | 4,715 | | | | 45 | |
| Amkor Technology (a) (b) | | | 11,436 | | | | 79 | |
| ANADIGICS (a) (b) | | | 5,261 | | | | 43 | |
| Anaren (a) | | | 2,069 | | | | 42 | |
| Andrew (a) (b) | | | 16,889 | | | | 156 | |
| Anixter International (a) (b) | | | 3,643 | | | | 218 | |
| Ansoft (a) | | | 1,628 | | | | 43 | |
| ANSYS (a) (b) | | | 3,807 | | | | 175 | |
| Applied Micro Circuits (a) | | | 35,160 | | | | 107 | |
| aQuantive (a) (b) | | | 8,489 | | | | 231 | |
| Ariba (a) | | | 7,854 | | | | 59 | |
| Arris Group (a) (b) | | | 11,858 | | | | 159 | |
| Art Technology Group (a) | | | 12,423 | | | | 31 | |
| Aspen Technology (a) | | | 5,407 | | | | 54 | |
| Asyst Technologies (a) | | | 5,873 | | | | 44 | |
| Atheros Communications (a) (b) | | | 5,755 | | | | 125 | |
| ATMI (a) (b) | | | 4,384 | | | | 139 | |
| Audiovox (a) | | | 1,839 | | | | 24 | |
| Avanex (a) | | | 18,330 | | | | 29 | |
| Avid Technology (a) (b) | | | 4,710 | | | | 170 | |
| Avocent (a) | | | 5,161 | | | | 189 | |
| Axcelis Technologies (a) | | | 11,435 | | | | 79 | |
| Bankrate (a) (b) | | | 1,128 | | | | 36 | |
| BearingPoint (a) (b) | | | 21,916 | | | | 183 | |
| Bel Fuse | | | 1,135 | | | | 40 | |
| Belden CDT (b) | | | 4,946 | | | | 179 | |
| Benchmark Electronics (a) (b) | | | 7,135 | | | | 189 | |
| BISYS Group (a) | | | 12,750 | | | | 141 | |
| Black Box | | | 1,922 | | | | 86 | |
| Blackbaud | | | 4,690 | | | | 117 | |
| Blackboard (a) | | | 3,091 | | | | 86 | |
First American Funds Annual Report 2006 31
Schedule of Investments October 31, 2006, all dollars are rounded to thousands (000)
| | | | | | | | | |
| Small Cap Index Fund (continued) |
| DESCRIPTION | | SHARES | | | VALUE | |
| |
| Blue Coat Systems (a) (b) | | | 1,613 | | | $ | 36 | |
| Bookham (a) (b) | | | 6,464 | | | | 20 | |
| Borland Software (a) | | | 9,386 | | | | 52 | |
| Bottomline Technologies (a) | | | 1,735 | | | | 17 | |
| Brightpoint (a) | | | 5,648 | | | | 68 | |
| Brocade Communications Systems (a) (b) | | | 30,645 | | | | 249 | |
| Brooks Automation (a) | | | 8,759 | | | | 124 | |
| Cabot Microelectronics (a) (b) | | | 2,949 | | | | 84 | |
| CACI International (a) (b) | | | 3,224 | | | | 186 | |
| CAlAmp (a) | | | 2,592 | | | | 17 | |
| Carrier Access (a) | | | 2,318 | | | | 15 | |
| Cass Information Systems | | | 648 | | | | 24 | |
| C-COR.net (a) | | | 5,913 | | | | 59 | |
| Checkpoint Systems (a) | | | 4,319 | | | | 79 | |
| Chordiant Software (a) | | | 8,839 | | | | 28 | |
| CIBER (a) | | | 6,071 | | | | 42 | |
| Cirrus Logic (a) | | | 10,038 | | | | 71 | |
| CMGI (a) | | | 55,049 | | | | 77 | |
| CNET Networks (a) (b) | | | 16,714 | | | | 149 | |
| Cogent (a) (b) | | | 4,822 | | | | 55 | |
| Cognex | | | 4,728 | | | | 109 | |
| Coherent (a) (b) | | | 3,138 | | | | 101 | |
| Cohu | | | 2,470 | | | | 49 | |
| CommScope (a) (b) | | | 6,202 | | | | 198 | |
| Comtech Group (a) (b) | | | 1,630 | | | | 28 | |
| Comtech Telecommunications (a) (b) | | | 2,574 | | | | 92 | |
| Concur Technologies (a) (b) | | | 3,439 | | | | 55 | |
| Conexant Systems (a) | | | 53,783 | | | | 104 | |
| Convera (a) (b) | | | 3,134 | | | | 16 | |
| Covansys (a) | | | 3,276 | | | | 77 | |
| CPI International (a) | | | 788 | | | | 11 | |
| Credence Systems (a) | | | 10,658 | | | | 34 | |
| CSG Systems International (a) | | | 5,748 | | | | 155 | |
| CTS | | | 4,195 | | | | 59 | |
| CyberSource (a) | | | 3,056 | | | | 31 | |
| Cymer (a) (b) | | | 4,141 | | | | 192 | |
| Daktronics | | | 4,324 | | | | 103 | |
| DealerTrack Holdings (a) | | | 1,188 | | | | 30 | |
| Digi International (a) | | | 2,878 | | | | 40 | |
| Digital Insight (a) | | | 3,980 | | | | 123 | |
| Digital River (a) (b) | | | 4,429 | | | | 256 | |
| Digitas (a) (b) | | | 10,522 | | | | 111 | |
| Diodes (a) (b) | | | 1,990 | | | | 88 | |
| Dionex (a) | | | 2,300 | | | | 125 | |
| Ditech Networks (a) | | | 3,820 | | | | 30 | |
| DSP Group (a) | | | 3,277 | | | | 71 | |
| DTS (a) | | | 2,062 | | | | 44 | |
| Eagle Test Systems (a) | | | 336 | | | | 6 | |
| EarthLink (a) | | | 13,846 | | | | 97 | |
| Echelon (a) | | | 3,370 | | | | 28 | |
| eCollege.com (a) | | | 2,018 | | | | 35 | |
| eFunds (a) | | | 5,170 | | | | 128 | |
| Electro Scientific Industries (a) (b) | | | 3,370 | | | | 67 | |
| Electronics for Imaging (a) (b) | | | 6,154 | | | | 145 | |
| EMCORE (a) (b) | | | 4,426 | | | | 25 | |
| Emulex (a) | | | 9,485 | | | | 178 | |
| Entegris (a) | | | 14,207 | | | | 159 | |
| Epicor Software (a) | | | 6,334 | | | | 89 | |
| EPIQ Systems (a) (b) | | | 1,555 | | | | 24 | |
| Equinix (a) (b) | | | 3,189 | | | | 218 | |
| Euronet Worldwide (a) (b) | | | 3,911 | | | | 116 | |
| Exar (a) | | | 4,150 | | | | 54 | |
| Excel Technologies (a) | | | 1,336 | | | | 34 | |
| Extreme Networks (a) | | | 14,550 | | | | 55 | |
| FalconStor Software (a) | | | 4,127 | | | | 32 | |
| FEI (a) (b) | | | 2,808 | | | | 64 | |
| Finisar (a) (b) | | | 24,947 | | | | 87 | |
| Flir Systems (a) (b) | | | 7,707 | | | | 246 | |
| FormFactor (a) | | | 5,104 | | | | 195 | |
| Forrester Research (a) | | | 1,711 | | | | 54 | |
| Foundry Networks (a) | | | 16,244 | | | | 206 | |
| Gartner, Class A (a) (b) | | | 6,634 | | | | 123 | |
| Gateway (a) | | | 29,447 | | | | 49 | |
| Genesis Microchip (a) | | | 4,116 | | | | 42 | |
| Gerber Scientific (a) | | | 2,517 | | | | 37 | |
| Global Imaging Systems (a) | | | 5,076 | | | | 111 | |
| Harmonic (a) (b) | | | 8,733 | | | | 71 | |
| Heartland Payment Systems (b) | | | 1,215 | | | | 32 | |
| Hittite Microwave (a) | | | 1,207 | | | | 41 | |
| HouseValues (a) (b) | | | 1,602 | | | | 9 | |
| Hutchinson Technology (a) | | | 2,884 | | | | 67 | |
| Hypercom (a) | | | 6,255 | | | | 41 | |
| Hyperion Solutions (a) | | | 6,248 | | | | 234 | |
| i2 Technologies (a) (b) | | | 1,579 | | | | 32 | |
| ID Systems (a) (b) | | | 1,235 | | | | 26 | |
| iGATE (a) | | | 2,412 | | | | 14 | |
| Ikanos Communications (a) | | | 1,876 | | | | 16 | |
| Imation (b) | | | 3,811 | | | | 174 | |
| Infocrossing (a) | | | 2,376 | | | | 30 | |
| Informatica (a) (b) | | | 9,912 | | | | 123 | |
| InfoSpace (a) | | | 3,540 | | | | 72 | |
| infoUSA | | | 3,732 | | | | 41 | |
| Integral Systems | | | 1,244 | | | | 33 | |
| InterDigital Communications (a) | | | 5,924 | | | | 212 | |
| Intergraph (a) | | | 3,221 | | | | 141 | |
| Intermec (a) | | | 5,592 | | | | 126 | |
| InterNAP Network Services (a) | | | 3,409 | | | | 56 | |
| International DisplayWorks (a) | | | 4,186 | | | | 27 | |
| Internet Capital Group (a) | | | 4,584 | | | | 48 | |
| Inter-Tel | | | 2,531 | | | | 52 | |
| InterVoice (a) | | | 4,519 | | | | 28 | |
| Interwoven (a) (b) | | | 4,938 | | | | 63 | |
| Intevac (a) | | | 2,325 | | | | 48 | |
| iPass (a) | | | 6,335 | | | | 34 | |
| Itron (a) (b) | | | 2,861 | | | | 156 | |
| Ixia (a) (b) | | | 4,780 | | | | 44 | |
| IXYS (a) | | | 2,845 | | | | 29 | |
| J2 Global Communications (a) (b) | | | 5,416 | | | | 149 | |
| Jack Henry & Associates | | | 8,281 | | | | 180 | |
| JDA Software (a) | | | 3,319 | | | | 49 | |
| Jupitermedia (a) (b) | | | 2,416 | | | | 21 | |
| Kanbay International (a) (b) | | | 3,542 | | | | 101 | |
| Keane (a) (b) | | | 5,408 | | | | 63 | |
| KEMET (a) (b) | | | 9,872 | | | | 73 | |
| Komag (a) (b) | | | 3,292 | | | | 126 | |
| Kopin (a) | | | 7,592 | | | | 27 | |
| Kronos (a) (b) | | | 3,661 | | | | 124 | |
| Kulicke & Soffa (a) | | | 6,417 | | | | 58 | |
| L-1 Identity Solutions (a) (b) | | | 7,286 | | | | 104 | |
| Landauer | | | 989 | | | | 54 | |
| Lattice Semiconductor (a) | | | 13,568 | | | | 84 | |
| Lawson Software (a) | | | 13,870 | | | | 106 | |
| Lightbridge (a) | | | 3,034 | | | | 35 | |
| Lionbridge Technologies (a) | | | 6,655 | | | | 45 | |
| Liquidity Services (a) | | | 865 | | | | 15 | |
| Littelfuse (a) (b) | | | 2,576 | | | | 87 | |
| Lo-Jack (a) | | | 2,010 | | | | 40 | |
| Loral Space & Communications (a) | | | 962 | | | | 28 | |
| LTX (a) | | | 7,332 | | | | 34 | |
| Macrovision (a) (b) | | | 5,759 | | | | 153 | |
The accompanying notes are an integral part of the financial statements.
32 First American Funds Annual Report 2006
| | | | | | | | | |
| Small Cap Index Fund (continued) |
| DESCRIPTION | | SHARES | | | VALUE | |
| |
| Magma Design Automation (a) | | | 3,721 | | | $ | 35 | |
| Magna Entertainment (a) (b) | | | 4,903 | | | | 26 | |
| Manhattan Associates (a) | | | 3,159 | | | | 93 | |
| ManTech International (a) | | | 1,845 | | | | 63 | |
| MapInfo (a) | | | 2,559 | | | | 34 | |
| Marchex (a) (b) | | | 2,351 | | | | 33 | |
| Mattson Technology (a) | | | 5,225 | | | | 51 | |
| Maximus | | | 2,187 | | | | 61 | |
| Maxwell Technologies (a) (b) | | | 1,600 | | | | 29 | |
| McDATA, Class A (a) | | | 17,851 | | | | 101 | |
| Measurement Specialties (a) | | | 1,554 | | | | 34 | |
| Mentor Graphics (a) | | | 8,917 | | | | 150 | |
| Methode Electronics, Class A | | | 3,728 | | | | 41 | |
| Metrologic Instruments (a) | | | 1,467 | | | | 27 | |
| Micrel (a) | | | 7,327 | | | | 82 | |
| Micros Systems (a) (b) | | | 4,341 | | | | 216 | |
| Microsemi (a) | | | 7,476 | | | | 147 | |
| MicroStrategy (a) (b) | | | 1,182 | | | | 141 | |
| Microtune (a) | | | 6,626 | | | | 34 | |
| Midway Games (a) (b) | | | 3,983 | | | | 34 | |
| Mindspeed Technologies (a) (b) | | | 12,281 | | | | 22 | |
| MIPS Technologies, Class A (a) | | | 5,070 | | | | 37 | |
| MKS Instruments (a) | | | 3,725 | | | | 81 | |
| Mobility Electronics (a) | | | 3,320 | | | | 10 | |
| Monolithic Power Systems (a) | | | 2,207 | | | | 22 | |
| MoSys (a) | | | 2,514 | | | | 19 | |
| MPS Group (a) | | | 11,831 | | | | 180 | |
| MRV Communications (a) (b) | | | 13,933 | | | | 48 | |
| MTS Systems (b) | | | 2,258 | | | | 75 | |
| Multi-Fineline Electronix (a) | | | 901 | | | | 22 | |
| Neoware Systems (a) (b) | | | 2,208 | | | | 26 | |
| Ness Technologies (a) | | | 2,317 | | | | 34 | |
| Net 1 UEPS Technologies (a) (b) | | | 5,353 | | | | 132 | |
| NETGEAR (a) (b) | | | 3,632 | | | | 97 | |
| Netlogic Microsystems (a) (b) | | | 1,776 | | | | 35 | |
| NetRatings (a) | | | 1,760 | | | | 31 | |
| NetScout Systems (a) | | | 2,946 | | | | 24 | |
| Newport (a) | | | 4,206 | | | | 91 | |
| Nextest Systems (a) | | | 671 | | | | 7 | |
| NIC (a) | | | 3,824 | | | | 18 | |
| Novatel Wireless (a) | | | 3,465 | | | | 29 | |
| Nuance Communications (a) (b) | | | 14,164 | | | | 163 | |
| Omniture (a) | | | 817 | | | | 7 | |
| OmniVision Technologies (a) (b) | | | 5,989 | | | | 98 | |
| ON Semiconductor (a) | | | 18,619 | | | | 116 | |
| Online Resources (a) | | | 2,498 | | | | 26 | |
| Open Solutions (a) | | | 1,968 | | | | 74 | |
| Openwave Systems (a) | | | 10,206 | | | | 88 | |
| Oplink Communications (a) | | | 1,750 | | | | 35 | |
| OPNET Technologies (a) | | | 1,438 | | | | 21 | |
| Opsware (a) | | | 8,779 | | | | 80 | |
| OSI Systems (a) | | | 1,717 | | | | 36 | |
| OYO Geospace (a) | | | 439 | | | | 25 | |
| Packeteer (a) | | | 4,044 | | | | 45 | |
| Palm (a) (b) | | | 10,218 | | | | 157 | |
| Parametric Technology (a) | | | 12,401 | | | | 242 | |
| Park Electrochemical | | | 2,388 | | | | 73 | |
| ParkerVision (a) (b) | | | 2,099 | | | | 19 | |
| Paxar (a) (b) | | | 4,187 | | | | 84 | |
| PDF Solutions (a) | | | 2,221 | | | | 31 | |
| Pegasystems | | | 1,729 | | | | 17 | |
| Perficient (a) | | | 1,959 | | | | 33 | |
| Pericom Semiconductor (a) | | | 2,924 | | | | 28 | |
| Perot Systems, Class A (a) | | | 9,345 | | | | 138 | |
| Phase Forward (a) | | | 3,783 | | | | 53 | |
| Photon Dynamics (a) | | | 1,968 | | | | 23 | |
| Photronics (a) (b) | | | 4,599 | | | | 64 | |
| Plantronics (b) | | | 5,524 | | | | 117 | |
| Plexus (a) | | | 4,949 | | | | 108 | |
| PLX Technology (a) | | | 2,787 | | | | 35 | |
| Polycom (a) (b) | | | 9,849 | | | | 270 | |
| PortalPlayer (a) | | | 2,753 | | | | 33 | |
| Powerwave Technologies (a) (b) | | | 12,466 | | | | 81 | |
| Presstek (a) | | | 3,488 | | | | 21 | |
| Progress Software (a) | | | 4,150 | | | | 119 | |
| QAD | | | 1,550 | | | | 13 | |
| Quality Systems (b) | | | 1,804 | | | | 77 | |
| Quantum (a) (b) | | | 20,931 | | | | 46 | |
| Quest Software (a) | | | 7,446 | | | | 110 | |
| Rackable Systems (a) (b) | | | 3,086 | | | | 96 | |
| Radiant Systems (a) | | | 2,732 | | | | 30 | |
| RadiSys (a) | | | 2,383 | | | | 44 | |
| Radyne Comstream (a) | | | 2,005 | | | | 20 | |
| RAE Systems (a) | | | 4,296 | | | | 17 | |
| RealNetworks (a) | | | 11,836 | | | | 130 | |
| Redback Networks (a) (b) | | | 6,747 | | | | 107 | |
| Renaissance Learning (b) | | | 1,050 | | | | 16 | |
| RF Micro Devices (a) (b) | | | 21,402 | | | | 156 | |
| RightNow Technologies (a) | | | 1,674 | | | | 28 | |
| Rofin-Sinar Technologies (a) | | | 1,783 | | | | 110 | |
| Rogers (a) | | | 1,960 | | | | 137 | |
| Rudolph Technologies (a) | | | 2,937 | | | | 52 | |
| S1 (a) | | | 8,384 | | | | 41 | |
| Safeguard Scientifics (a) | | | 13,397 | | | | 33 | |
| SAFENET (a) | | | 2,807 | | | | 60 | |
| Sapient (a) (b) | | | 9,513 | | | | 52 | |
| SAVVIS (a) (b) | | | 3,442 | | | | 107 | |
| ScanSource (a) | | | 2,892 | | | | 91 | |
| Secure Computing (a) | | | 5,581 | | | | 40 | |
| Semitool (a) | | | 1,957 | | | | 24 | |
| Semtech (a) (b) | | | 8,418 | | | | 110 | |
| Sigma Designs (a) | | | 2,537 | | | | 53 | |
| Silicon Image (a) | | | 9,440 | | | | 112 | |
| Silicon Storage Technology (a) (b) | | | 10,492 | | | | 44 | |
| Sirenza Microdevices (a) | | | 2,769 | | | | 20 | |
| SiRF Technology Holdings (a) (b) | | | 5,724 | | | | 161 | |
| Skyworks Solutions (a) | | | 17,977 | | | | 119 | |
| Smith Micro Software (a) (b) | | | 2,240 | | | | 38 | |
| Sohu.com (a) (b) | | | 2,963 | | | | 68 | |
| Sonic Solutions (a) | | | 2,852 | | | | 46 | |
| SonicWALL (a) | | | 6,382 | | | | 67 | |
| Sonus Networks (a) (b) | | | 28,325 | | | | 148 | |
| SPSS (a) | | | 2,143 | | | | 59 | |
| SRA International, Class A (a) | | | 3,902 | | | | 125 | |
| Staktek Holdings (a) | | | 1,330 | | | | 8 | |
| Standard Microsystems (a) | | | 2,458 | | | | 76 | |
| StarTek | | | 1,262 | | | | 17 | |
| Stellent | | | 2,846 | | | | 32 | |
| Stratasys (a) (b) | | | 1,244 | | | | 35 | |
| Stratex Networks (a) | | | 10,717 | | | | 50 | |
| SunPower (a) (b) | | | 1,142 | | | | 38 | |
| Superior Essex (a) (b) | | | 2,026 | | | | 76 | |
| Supertex (a) (b) | | | 1,241 | | | | 55 | |
| Sybase (a) (b) | | | 9,493 | | | | 231 | |
| Sycamore Networks (a) | | | 19,916 | | | | 75 | |
| Sykes Enterprises (a) | | | 2,939 | | | | 60 | |
| Symmetricom (a) | | | 5,264 | | | | 45 | |
| Synaptics (a) | | | 2,627 | | | | 75 | |
| SYNNEX (a) | | | 992 | | | | 22 | |
| Syntel | | | 894 | | | | 22 | |
| Take-Two Interactive Software (a) (b) | | | 7,972 | | | | 112 | |
| TALX | | | 3,256 | | | | 79 | |
| TASER International (a) (b) | | | 6,974 | | | | 65 | |
| Technitrol | | | 4,619 | | | | 116 | |
First American Funds Annual Report 2006 33
Schedule of Investments October 31, 2006, all dollars are rounded to thousands (000)
| | | | | | | | | |
| Small Cap Index Fund (continued) |
| DESCRIPTION | | SHARES | | | VALUE | |
| |
| Tekelec (a) | | | 6,450 | | | $ | 95 | |
| Terremark Worldwide (a) | | | 3,819 | | | | 20 | |
| Tessera Technologies (a) | | | 5,175 | | | | 181 | |
| The Knot (a) | | | 1,621 | | | | 39 | |
| ThermoGenesis (a) | | | 6,003 | | | | 25 | |
| TheStreet.com | | | 2,047 | | | | 19 | |
| THQ (a) (b) | | | 7,083 | | | | 213 | |
| TIBCO Software (a) | | | 23,356 | | | | 216 | |
| TNS (a) (b) | | | 2,686 | | | | 44 | |
| Transaction Systems Architects (a) | | | 4,302 | | | | 145 | |
| Transmeta (a) (b) | | | 21,803 | | | | 26 | |
| TranSwitch (a) (b) | | | 14,205 | | | | 21 | |
| Travelzoo (a) | | | 305 | | | | 10 | |
| Trident Microsystems (a) (b) | | | 6,187 | | | | 131 | |
| TriQuint Semiconductor (a) | | | 16,582 | | | | 75 | |
| TTM Technologies (a) | | | 4,709 | | | | 57 | |
| Tyler Technologies (a) | | | 4,326 | | | | 61 | |
| Ulticom (a) | | | 1,577 | | | | 16 | |
| Ultimate Software Group (a) | | | 2,445 | | | | 60 | |
| Ultratech (a) | | | 2,814 | | | | 40 | |
| United Online (b) | | | 6,993 | | | | 95 | |
| Universal Display (a) (b) | | | 2,800 | | | | 32 | |
| UTStarcom (a) (b) | | | 12,762 | | | | 137 | |
| VA Software (a) | | | 6,954 | | | | 28 | |
| ValueClick (a) | | | 11,149 | | | | 210 | |
| Varian Semiconductor Equipment Associates (a) | | | 6,303 | | | | 230 | |
| Vasco Data Security International (a) (b) | | | 3,006 | | | | 35 | |
| Veeco Instruments (a) | | | 3,148 | | | | 59 | |
| Verint Systems (a) | | | 1,542 | | | | 50 | |
| ViaSat (a) | | | 2,464 | | | | 67 | |
| Vignette (a) | | | 3,427 | | | | 56 | |
| Virage Logic (a) | | | 1,892 | | | | 18 | |
| Volterra Semiconductor (a) (b) | | | 2,087 | | | | 36 | |
| WebEx Communications (a) (b) | | | 4,664 | | | | 179 | |
| webMethods (a) | | | 6,369 | | | | 48 | |
| Websense (a) | | | 5,460 | | | | 149 | |
| WebSideStory (a) (b) | | | 1,950 | | | | 25 | |
| Wind River Systems (a) (b) | | | 8,093 | | | | 89 | |
| Witness Systems (a) | | | 3,735 | | | | 66 | |
| Wright Express (a) | | | 4,796 | | | | 131 | |
| X-Rite (b) | | | 2,618 | | | | 30 | |
| Zhone Technologies (a) (b) | | | 10,687 | | | | 15 | |
| Zoran (a) | | | 5,525 | | | | 77 | |
| Zygo (a) | | | 2,013 | | | | 35 | |
| | | | | | | | | |
| | | | | | | | 27,232 | |
| | | | | | | | | |
| Materials – 4.8% |
| A. Schulman | | | 3,500 | | | | 85 | |
| A.M. Castle & Company | | | 1,248 | | | | 42 | |
| AEP Industries (a) | | | 798 | | | | 42 | |
| AK Steel Holding (a) | | | 12,529 | | | | 187 | |
| Aleris International (a) | | | 3,513 | | | | 181 | |
| Alpha Natural Resources (a) | | | 5,683 | | | | 90 | |
| AMCOL International (b) | | | 2,466 | | | | 65 | |
| American Vanguard (b) | | | 2,060 | | | | 33 | |
| AptarGroup (b) | | | 3,584 | | | | 197 | |
| Arch Chemicals | | | 2,929 | | | | 98 | |
| Balchem | | | 1,630 | | | | 36 | |
| Bowater (b) | | | 6,383 | | | | 133 | |
| Brush Engineered Metals (a) (b) | | | 2,292 | | | | 77 | |
| Buckeye Technologies (a) | | | 3,469 | | | | 36 | |
| Calgon Carbon (a) (b) | | | 4,187 | | | | 19 | |
| Cambrex (b) | | | 3,013 | | | | 70 | |
| Caraustar Industries (a) | | | 3,283 | | | | 36 | |
| Century Aluminum (a) (b) | | | 2,682 | | | | 104 | |
| CF Industries Holdings | | | 5,365 | | | | 106 | |
| Chaparral Steel Company (a) | | | 5,176 | | | | 215 | |
| Chesapeake | | | 2,424 | | | | 38 | |
| Cleveland-Cliffs (b) | | | 4,786 | | | | 202 | |
| Coeur D’Alene Mines (a) (b) | | | 30,990 | | | | 152 | |
| Compass Minerals International | | | 3,037 | | | | 94 | |
| Deltic Timber | | | 1,263 | | | | 64 | |
| Ferro | | | 5,005 | | | | 99 | |
| Georgia Gulf | | | 3,893 | | | | 83 | |
| Gibraltar Industries | | | 2,364 | | | | 50 | |
| Glatfelter (b) | | | 4,234 | | | | 62 | |
| GrafTech International (a) | | | 11,088 | | | | 67 | |
| Graphic Packaging (a) | | | 8,775 | | | | 34 | |
| Greif, Class A | | | 1,760 | | | | 165 | |
| H.B. Fuller | | | 6,802 | | | | 169 | |
| Headwaters (a) (b) | | | 4,935 | | | | 122 | |
| Hecla Mining (a) (b) | | | 13,820 | | | | 90 | |
| Hercules (a) | | | 12,833 | | | | 234 | |
| Innospec | | | 1,423 | | | | 48 | |
| Koppers Holdings | | | 1,112 | | | | 23 | |
| Longview Fibre | | | 7,691 | | | | 162 | |
| MacDermid | | | 3,444 | | | | 115 | |
| Mercer International (a) | | | 4,051 | | | | 39 | |
| Metal Management | | | 2,905 | | | | 80 | |
| Minerals Technologies (b) | | | 2,331 | | | | 129 | |
| Myers Industries | | | 3,259 | | | | 59 | |
| Neenah Paper | | | 1,274 | | | | 47 | |
| NewMarket Group (b) | | | 2,081 | | | | 134 | |
| NL Industries | | | 971 | | | | 11 | |
| NN | | | 2,093 | | | | 24 | |
| Olin | | | 8,123 | | | | 141 | |
| Olympic Steel | | | 933 | | | | 23 | |
| OM Group (a) (b) | | | 3,373 | | | | 192 | |
| Omnova Solutions (a) | | | 4,619 | | | | 20 | |
| Oregon Steel Mills (a) | | | 4,044 | | | | 220 | |
| Pioneer Companies (a) | | | 1,569 | | | | 40 | |
| PolyOne (a) | | | 10,483 | | | | 86 | |
| Quanex | | | 4,294 | | | | 144 | |
| Rock-Tenn, Class A | | | 3,363 | | | | 69 | |
| Rockwood Holdings (a) | | | 3,416 | | | | 80 | |
| Royal Gold (b) | | | 2,219 | | | | 65 | |
| RTI International Metals (a) | | | 2,645 | | | | 162 | |
| Ryerson Tull (b) | | | 2,943 | | | | 71 | |
| Schnitzer Steel Industries, Class A | | | 2,497 | | | | 87 | |
| Schweitzer-Mauduit International | | | 1,810 | | | | 42 | |
| Sensient Technologies | | | 5,572 | | | | 128 | |
| Silgan Holdings | | | 2,543 | | | | 105 | |
| Spartech (b) | | | 3,829 | | | | 105 | |
| Steel Technologies | | | 1,331 | | | | 26 | |
| Stepan | | | 420 | | | | 13 | |
| Stillwater Mining (a) (b) | | | 4,808 | | | | 52 | |
| Symyx Technologies (a) | | | 3,722 | | | | 91 | |
| Terra Industries (a) (b) | | | 10,299 | | | | 96 | |
| Texas Industries (b) | | | 2,588 | | | | 161 | |
| Tronox | | | 4,607 | | | | 60 | |
| US Concrete (a) | | | 3,725 | | | | 24 | |
| USEC (b) | | | 9,827 | | | | 110 | |
| W.R. Grace & Company (a) (b) | | | 7,992 | | | | 107 | |
| Wausau-Mosinee Paper | | | 4,850 | | | | 66 | |
| Wheeling-Pittsburgh (a) | | | 1,000 | | | | 20 | |
| Worthington Industries (b) | | | 7,703 | | | | 133 | |
| Zoltek Companies (a) (b) | | | 1,816 | | | | 45 | |
| | | | | | | | | |
| | | | | | | | 7,232 | |
| | | | | | | | | |
The accompanying notes are an integral part of the financial statements.
34 First American Funds Annual Report 2006
| | | | | | | | | |
| Telecommunication Services – 1.5% |
| @Road (a) | | | 6,864 | | | $ | 43 | |
| Alaska Communications Systems Group | | | 4,678 | | | | 67 | |
| Atlantic Tele-Network | | | 596 | | | | 12 | |
| Broadwing (a) (b) | | | 8,241 | | | | 123 | |
| Cbeyond (a) (b) | | | 1,835 | | | | 56 | |
| Centennial Communications, Class A | | | 2,710 | | | | 14 | |
| Cincinnati Bell (a) | | | 28,793 | | | | 135 | |
| Cogent Communications Group (a) | | | 2,339 | | | | 33 | |
| Commonwealth Telephone Enterprises | | | 2,531 | | | | 106 | |
| Consolidated Communications Holdings | | | 2,597 | | | | 48 | |
| Covad Communications Group (a) | | | 32,647 | | | | 43 | |
| CT Communications | | | 2,169 | | | | 51 | |
| Dobson Communications, Class A (a) | | | 16,714 | | | | 130 | |
| EMS Technologies (a) | | | 1,690 | | | | 31 | |
| Eschelon Telecom (a) | | | 1,042 | | | | 18 | |
| FairPoint Communications | | | 3,519 | | | | 63 | |
| Fibertower (a) (b) | | | 12,637 | | | | 92 | |
| General Communication (a) | | | 6,326 | | | | 83 | |
| Golden Telecom | | | 2,474 | | | | 92 | |
| IDT (a) | | | 6,503 | | | | 84 | |
| InPhonic (a) (b) | | | 2,125 | | | | 19 | |
| Iowa Telecommunication Services | | | 3,552 | | | | 71 | |
| iPCS (a) (b) | | | 1,676 | | | | 90 | |
| North Pittsburgh | | | 1,653 | | | | 44 | |
| NTELOS Holdings (a) | | | 1,680 | | | | 24 | |
| Premiere Global Services (a) | | | 8,216 | | | | 68 | |
| Price Communications (a) | | | 5,354 | | | | 105 | |
| Shenandoah Telecommunications | | | 803 | | | | 38 | |
| SureWest Communications | | | 1,665 | | | | 38 | |
| Syniverse Holdings (a) | | | 2,527 | | | | 37 | |
| Talk America Holdings (a) | | | 3,620 | | | | 29 | |
| Time Warner Telecom, Class A (a) (b) | | | 12,926 | | | | 258 | |
| USA Mobility | | | 2,976 | | | | 76 | |
| Vonage Holdings (a) (b) | | | 3,490 | | | | 24 | |
| Wireless Facilities (a) (b) | | | 7,278 | | | | 18 | |
| | | | | | | | | |
| | | | | | | | 2,263 | |
| Utilities – 2.9% |
| Allete (b) | | | 2,994 | | | | 135 | |
| American States Water (b) | | | 2,006 | | | | 84 | |
| Aquila (a) | | | 42,600 | | | | 196 | |
| Avista | | | 5,536 | | | | 142 | |
| Black Hills (b) | | | 3,837 | | | | 132 | |
| California Water Service | | | 2,037 | | | | 79 | |
| Cascade Natural Gas | | | 1,062 | | | | 27 | |
| CH Energy Group | | | 1,859 | | | | 97 | |
| CLECO | | | 5,885 | | | | 151 | |
| Duquesne Light Holdings | | | 8,741 | | | | 173 | |
| El Paso Electric (a) | | | 5,546 | | | | 130 | |
| Empire District Electric | | | 3,229 | | | | 77 | |
| EnergySouth | | | 777 | | | | 30 | |
| IDACORP (b) | | | 4,816 | | | | 190 | |
| ITC Holdings | | | 1,592 | | | | 57 | |
| Laclede Group | | | 2,523 | | | | 90 | |
| MGE Energy | | | 2,440 | | | | 83 | |
| New Jersey Resources | | | 3,174 | | | | 165 | |
| NICOR (b) | | | 4,843 | | | | 223 | |
| Northwest Natural Gas | | | 2,541 | | | | 105 | |
| NorthWestern | | | 4,199 | | | | 149 | |
| Ormat Technologies | | | 822 | | | | 32 | |
| Otter Tail | | | 3,485 | | | | 104 | |
| People’s Energy (b) | | | 3,958 | | | | 173 | |
| Piedmont Natural Gas (b) | | | 8,744 | | | | 236 | |
| PNM Resources | | | 7,190 | | | | 202 | |
| Portland General Electric (b) | | | 2,996 | | | | 77 | |
| SJW | | | 1,746 | | | | 59 | |
| South Jersey Industries | | | 3,334 | | | | 103 | |
| Southern Union, Fractional Shares (a) (c) | | | 0.85 | | | | — | |
| Southwest Gas (b) | | | 4,191 | | | | 150 | |
| Southwest Water | | | 2,457 | | | | 31 | |
| UIL Holdings (b) | | | 2,705 | | | | 108 | |
| UniSource Energy Holding | | | 4,187 | | | | 149 | |
| Westar Energy (b) | | | 8,997 | | | | 228 | |
| WGL Holdings (b) | | | 4,599 | | | | 149 | |
| | | | | | | | | |
| | | | | | | | 4,316 | |
| | | | | | | | | |
Total Common Stocks
(Cost $107,462) | | | | | | | 147,883 | |
| | | | | | | | | |
| | | | | | | | | | |
| Short-Term Investments – 1.8% |
| Money Market Fund – 1.6% |
| First American Prime Obligations Fund, Class Z (d) | | | 2,455,396 | | | | 2,455 | |
| | | | | | | | | |
| U.S. Treasury Obligation – 0.2% |
U.S. Treasury Bill
4.940%, 03/01/2007 (e) | | $ | 300 | | | | 295 | |
| | | | | | | | | |
Total Short-Term Investments
(Cost $2,750) | | | | | | | 2,750 | |
| | | | | | | | | |
Investments Purchased with Proceeds
from Securities Lending (f) – 38.7% |
| | (Cost $58,255) | | | | | | | 58,255 | |
| | | | | | | | | |
| Total Investments – 138.6% | | | | | | | | |
| | (Cost $168,467) | | | | | | | 208,888 | |
| | | | | | | | | |
Other Assets and Liabilities, Net – (38.6)% | | | | | | | (58,172 | ) |
| | | | | | | | | |
Total Net Assets – 100.0% | | | | | | $ | 150,716 | |
| | | | | | | | | |
| |
| (a) | Non-income producing security. |
| |
| (b) | This security or a portion of this security is out on loan at October 31, 2006. Total loaned securities had a market value of $55,592 at October 31, 2006. See note 2 in Notes to Financial Statements. |
| |
| (c) | Security is fair valued and illiquid. As of October 31, 2006, the fair value of these investments was $0 or 0.0% of total net assets. See note 2 in Notes to Financial Statements. |
| |
| (d) | Investment in affiliated security. This money market fund is advised by FAF Advisors, Inc., which also serves as advisor to this fund. See note 3 in Notes to Financial Statements. |
| |
| (e) | Security has been deposited as initial margin on open futures contracts. Yield shown is effective yield as of October 31, 2006. See note 2 in Notes to Financial Statements. |
| |
| (f) | The fund may loan securities in return for collateral in the form of cash, U.S. government securities, or other high grade debt obligations. The cash collateral is invested in various short-term fixed income securities, such as repurchase agreements, commercial paper, money market funds and other corporated obligations. See note 2 in Notes to Financial Statements. |
REIT – Real Estate Investment Trust
Schedule of Open Futures Contracts
| | | | | | | | | | | | | | | | | |
| | | Number of | | | Notional | | | | | |
| | | Contracts | | | Contract | | | Settlement | | | Unrealized | |
| Description | | Purchased | | | Value | | | Month | | | Appreciation | |
| |
| Russell 2000 Index Futures | | | 6 | | | $ | 2,313 | | | December 2006 | | $ | 98 | |
First American Funds Annual Report 2006 35
Statements of Assets and Liabilities October 31, 2006, all dollars and shares are rounded to thousands (000), except for per share data
| | | | | | | | | | | | | | | | | |
| | | Equity | | | | Mid Cap | | | Small Cap | | | |
| | | Index Fund | | | | Index Fund | | | Index Fund | | | |
| | | | | | | |
| Investments in unaffiliated securities, at cost | | $ | 1,392,625 | | | | $ | 262,508 | | | $ | 107,757 | | | |
| Investments in affiliated securities, at cost | | | 22,069 | | | | | 9,719 | | | | 2,455 | | | |
| Investments purchased with proceeds from securities lending (note 2) | | | 357,390 | | | | | 164,599 | | | | 58,255 | | | |
| | | | | | | | |
ASSETS: | | | | | | | | | | | | | | | |
| Investments in unaffiliated securities, at value* (note 2) | | $ | 2,210,553 | | | | $ | 347,753 | | | $ | 148,178 | | | |
| Investments in affiliated securities, at value (note 2) | | | 25,731 | | | | | 9,719 | | | | 2,455 | | | |
| Investments purchased with proceeds from securities lending (note 2) | | | 357,390 | | | | | 164,599 | | | | 58,255 | | | |
| Receivable for dividends and interest | | | 2,024 | | | | | 223 | | | | 102 | | | |
| Receivable for investment securities sold | | | — | | | | | 2,480 | | | | 4 | | | |
| Receivable for capital shares sold | | | 1,230 | | | | | 202 | | | | 207 | | | |
| Prepaid expenses and other assets | | | 40 | | | | | 46 | | | | 41 | | | |
| | | | | | | | |
Total assets | | | 2,596,968 | | | | | 525,022 | | | | 209,242 | | | |
| | | | | | | | |
LIABILITIES: | | | | | | | | | | | | | | | |
| Payable upon return of securities loaned (note 2) | | | 357,390 | | | | | 164,599 | | | | 58,255 | | | |
| Payable for investment securities purchased | | | 675 | | | | | 324 | | | | — | | | |
| Payable for capital shares redeemed | | | 5,717 | | | | | 486 | | | | 162 | | | |
| Payable for variation margin | | | 4 | | | | | 49 | | | | 7 | | | |
| Payable to affiliates (note 3) | | | 708 | | | | | 144 | | | | 78 | | | |
| Payable for distribution and shareholder servicing fees | | | 105 | | | | | 10 | | | | 6 | | | |
| Accrued expenses and other liabilities | | | 68 | | | | | 22 | | | | 18 | | | |
| | | | | | | | |
Total liabilities | | | 364,667 | | | | | 165,634 | | | | 58,526 | | | |
| | | | | | | | |
Net assets | | $ | 2,232,301 | | | | $ | 359,388 | | | $ | 150,716 | | | |
| | | | | | | | |
COMPOSITION OF NET ASSETS: | | | | | | | | | | | | | | | |
| Portfolio capital | | $ | 1,404,050 | | | | $ | 258,439 | | | $ | 92,184 | | | |
| Accumulated net realized gain on investments and futures contracts | | | 6,069 | | | | | 15,382 | | | | 18,013 | | | |
| Net unrealized appreciation of investments | | | 821,590 | | | | | 85,245 | | | | 40,421 | | | |
| Net unrealized appreciation of futures contracts | | | 592 | | | | | 322 | | | | 98 | | | |
| | | | | | | | |
Net assets | | $ | 2,232,301 | | | | $ | 359,388 | | | $ | 150,716 | | | |
| | | | | | | | |
| | * Including securities loaned, at value | | $ | 345,441 | | | | $ | 158,121 | | | $ | 55,592 | | | |
| | | | | | | | |
Class A: | | | | | | | | | | | | | | | |
| Net assets | | $ | 229,185 | | | | $ | 14,722 | | | $ | 10,639 | | | |
| Shares issued and outstanding ($0.0001 par value – 2 billion authorized) | | | 8,882 | | | | | 1,033 | | | | 656 | | | |
| Net asset value, and redemption price per share | | $ | 25.80 | | | | $ | 14.25 | | | $ | 16.23 | | | |
Maximum offering price per share(1) | | $ | 27.30 | | | | $ | 15.08 | | | $ | 17.17 | | | |
Class B: | | | | | | | | | | | | | | | |
| Net assets | | $ | 43,369 | | | | $ | 2,678 | | | $ | 1,333 | | | |
| Shares issued and outstanding ($0.0001 par value – 2 billion authorized) | | | 1,703 | | | | | 191 | | | | 85 | | | |
Net asset value, offering price, and redemption price per share(2) | | $ | 25.47 | | | | $ | 13.98 | | | $ | 15.77 | | | |
Class C: | | | | | | | | | | | | | | | |
| Net assets | | $ | 20,714 | | | | $ | 4,320 | | | $ | 2,662 | | | |
| Shares issued and outstanding ($0.0001 par value – 2 billion authorized) | | | 809 | | | | | 308 | | | | 167 | | | |
Net asset value, offering price, and redemption price per share(2) | | $ | 25.62 | | | | $ | 14.03 | | | $ | 15.92 | | | |
Class R: | | | | | | | | | | | | | | | |
| Net assets | | $ | 3,419 | | | | $ | 4,032 | | | $ | 280 | | | |
| Shares issued and outstanding ($0.0001 par value – 2 billion authorized) | | | 133 | | | | | 284 | | | | 17 | | | |
| Net asset value, offering price, and redemption price per share | | $ | 25.77 | | | | $ | 14.19 | | | $ | 16.04 | | | |
Class Y: | | | | | | | | | | | | | | | |
| Net assets | | $ | 1,935,614 | | | | $ | 333,636 | | | $ | 135,802 | | | |
| Shares issued and outstanding ($0.0001 par value – 2 billion authorized) | | | 75,040 | | | | | 23,386 | | | | 8,368 | | | |
| Net asset value, offering price, and redemption price per share | | $ | 25.79 | | | | $ | 14.27 | | | $ | 16.23 | | | |
| | | | | | | | |
| | |
| | (1) | The offering price is calculated by dividing the net asset value by 1 minus the maximum sales charge of 5.50%. |
| |
| | (2) | Class B and C have a contingent deferred sales charge. For a description of this sales charge, see notes 1 and 3 in Notes to Financial Statements. |
The accompanying notes are an integral part of the financial statements.
36 First American Funds Annual Report 2006
Statements of Operations For the year ended October 31, 2006, all dollars are rounded to thousands (000)
| | | | | | | | | | | | | | | | |
| | | Equity | | | | Mid Cap | | | Small Cap | | | |
| | | Index Fund | | | | Index Fund | | | Index Fund | | | |
| | | | | | | |
INVESTMENT INCOME: | | | | | | | | | | | | | | | |
| Dividends from unaffiliated securities | | $ | 40,974 | | | | $ | 4,947 | | | $ | 1,640 | | | |
| Dividends from affiliated securities | | | 547 | | | | | 69 | | | | 219 | | | |
| Less: Foreign taxes witheld | | | — | | | | | — | | | | (1 | ) | | |
| Interest from unaffiliated securities | | | 1,173 | | | | | 405 | | | | 13 | | | |
| Securities lending income | | | 572 | | | | | 155 | | | | 206 | | | |
| | | | | | | | |
Total investment income | | | 43,266 | | | | | 5,576 | | | | 2,077 | | | |
| | | | | | | | |
EXPENSES (note 3): | | | | | | | | | | | | | | | |
| Investment advisory fees | | | 5,458 | | | | | 908 | | | | 637 | | | |
| Administration fees | | | 3,483 | | | | | 595 | | | | 335 | | | |
| Transfer agent fees | | | 2,111 | | | | | 376 | | | | 191 | | | |
| Custodian fees | | | 115 | | | | | 19 | | | | 9 | | | |
| Registration fees | | | 64 | | | | | 55 | | | | 52 | | | |
| Professional fees | | | 35 | | | | | 36 | | | | 35 | | | |
| Postage and printing fees | | | 104 | | | | | 17 | | | | 8 | | | |
| Directors’ fees | | | 37 | | | | | 18 | | | | 15 | | | |
| Other expenses | | | 63 | | | | | 29 | | | | 37 | | | |
| Distribution and shareholder servicing fees – Class A | | | 589 | | | | | 37 | | | | 27 | | | |
| Distribution and shareholder servicing fees – Class B | | | 491 | | | | | 33 | | | | 14 | | | |
| Distribution and shareholder servicing fees – Class C | | | 227 | | | | | 39 | | | | 24 | | | |
| Distribution and shareholder servicing fees – Class R | | | 15 | | | | | 3 | | | | 1 | | | |
| | | | | | | | |
Total expenses | | | 12,792 | | | | | 2,165 | | | | 1,385 | | | |
| | | | | | | | |
| Less: Fee waivers (note 3) | | | (3,371 | ) | | | | (229 | ) | | | (391 | ) | | |
| Less: Indirect payments from custodian (note 3) | | | (3 | ) | | | | (1 | ) | | | (1 | ) | | |
| | | | | | | | |
Total net expenses | | | 9,418 | | | | | 1,935 | | | | 993 | | | |
| | | | | | | | |
Investment income – net | | | 33,848 | | | | | 3,641 | | | | 1,084 | | | |
| | | | | | | | |
REALIZED AND UNREALIZED GAINS (LOSSES) ON INVESTMENTS AND FUTURES CONTRACTS – NET (note 6): | | | | | | | | | | | | | | | |
| Net realized gain on unaffiliated investments | | | 47,833 | | | | | 16,650 | | | | 19,061 | | | |
| Net realized gain on affiliated investments | | | 394 | | | | | — | | | | — | | | |
| Net realized gain (loss) on futures contracts | | | 1,901 | | | | | (149 | ) | | | 115 | | | |
| Net change in unrealized appreciation or depreciation of unaffiliated investments | | | 241,470 | | | | | 24,440 | | | | 8,715 | | | |
| Net change in unrealized appreciation or depreciation of affiliated investments | | | 1,034 | | | | | — | | | | — | | | |
| Net change in unrealized appreciation or depreciation of future contracts | | | 29 | | | | | 333 | | | | 91 | | | |
| | | | | | | | |
Net gain on investments and futures contracts | | | 292,661 | | | | | 41,274 | | | | 27,982 | | | |
| | | | | | | | |
Net increase in net assets resulting from operations | | $ | 326,509 | | | | $ | 44,915 | | | $ | 29,066 | | | |
| | | | | | | | |
First American Funds Annual Report 2006 37
Statements of Changes in Net Assets all dollars are rounded to thousands (000)
| | | | | | | | | | | | | | | | |
| | | Equity | | | |
| | | Index Fund | | | |
| |
| | | One-Month | | | |
| | | Year | | | Fiscal | | | Year | | | |
| | | Ended | | | Period Ended | | | Ended | | | |
| | | 10/31/06 | | | 10/31/05 | | | 9/30/05 | | | |
| |
OPERATIONS: | | | | | | | | | | | | | | |
| Investment income – net | | $ | 33,848 | | | $ | 1,637 | | | $ | 40,240 | | | |
| Net realized gain (loss) on unaffiliated investments | | | 47,833 | | | | (10,825 | ) | | | (5,937 | ) | | |
| Net realized gain (loss) on affiliated investments | | | 394 | | | | (7 | ) | | | 513 | | | |
| Net realized gain on in-kind distributions (note 8) | | | — | | | | — | | | | 115,666 | | | |
| Net realized gain (loss) on futures contracts | | | 1,901 | | | | (622 | ) | | | (787 | ) | | |
| Net change in unrealized appreciation or depreciation of unaffiliated investments | | | 241,470 | | | | (32,021 | ) | | | 111,289 | | | |
| Net change in unrealized appreciation or depreciation of affiliated investments | | | 1,034 | | | | 2,629 | | | | (819 | ) | | |
| Net change in unrealized appreciation or depreciation of futures contracts | | | 29 | | | | 420 | | | | 277 | | | |
| |
| Net increase (decrease) in net assets resulting from operations | | | 326,509 | | | | (38,789 | ) | | | 260,442 | | | |
| |
DISTRIBUTIONS TO SHAREHOLDERS FROM: | | | | | | | | | | | | | | |
| Investment income – net: | | | | | | | | | | | | | | |
| | Class A | | | (3,188 | ) | | | (147 | ) | | | (3,686 | ) | | |
| | Class B | | | (338 | ) | | | (9 | ) | | | (543 | ) | | |
| | Class C | | | (153 | ) | | | (3 | ) | | | (235 | ) | | |
| | Class R | | | (26 | ) | | | (1 | ) | | | (10 | ) | | |
| | Class Y | | | (30,181 | ) | | | (1,477 | ) | | | (35,527 | ) | | |
| Net realized gain on investments: | | | | | | | | | | | | | | |
| | Class A | | | — | | | | — | | | | — | | | |
| | Class B | | | — | | | | — | | | | — | | | |
| | Class C | | | — | | | | — | | | | — | | | |
| | Class R | | | — | | | | — | | | | — | | | |
| | Class Y | | | — | | | | — | | | | — | | | |
| Return of capital: | | | | | | | | | | | | | | |
| | Class A | | | — | | | | (35 | ) | | | (12 | ) | | |
| | Class B | | | — | | | | (2 | ) | | | (2 | ) | | |
| | Class C | | | — | | | | (1 | ) | | | (1 | ) | | |
| | Class R | | | — | | | | — | * | | | — | * | | |
| | Class Y | | | — | | | | (347 | ) | | | (118 | ) | | |
| |
| Total distributions | | | (33,886 | ) | | | (2,022 | ) | | | (40,134 | ) | | |
| |
CAPITAL SHARE TRANSACTIONS (note 5): | | | | | | | | | | | | | | |
| Class A: | | | | | | | | | | | | | | |
| | Proceeds from sales | | | 41,039 | | | | 4,409 | | | | 44,458 | | | |
| | Reinvestment of distributions | | | 2,685 | | | | 156 | | | | 3,435 | | | |
| | Payments for redemptions | | | (80,483 | ) | | | (4,029 | ) | | | (66,590 | ) | | |
| |
| Increase (decrease) in net assets from Class A transactions | | | (36,759 | ) | | | 536 | | | | (18,697 | ) | | |
| |
| Class B: | | | | | | | | | | | | | | |
| | Proceeds from sales | | | 1,830 | | | | 119 | | | | 2,433 | | | |
| | Reinvestment of distributions | | | 327 | | | | 11 | | | | 531 | | | |
| | Payments for redemptions (note 3) | | | (21,365 | ) | | | (1,831 | ) | | | (20,370 | ) | | |
| |
| Increase (decrease) in net assets from Class B transactions | | | (19,208 | ) | | | (1,701 | ) | | | (17,406 | ) | | |
| |
| Class C: | | | | | | | | | | | | | | |
| | Proceeds from sales | | | 1,467 | | | | 145 | | | | 2,768 | | | |
| | Reinvestment of distributions | | | 145 | | | | 4 | | | | 228 | | | |
| | Payments for redemptions (note 3) | | | (8,052 | ) | | | (1,727 | ) | | | (9,668 | ) | | |
| |
| Increase (decrease) in net assets from Class C transactions | | | (6,440 | ) | | | (1,578 | ) | | | (6,672 | ) | | |
| |
| Class R: | | | | | | | | | | | | | | |
| | Proceeds from sales | | | 2,111 | | | | 85 | | | | 1,362 | | | |
| | Reinvestment of distributions | | | 26 | | | | 1 | | | | 10 | | | |
| | Payments for redemptions | | | (753 | ) | | | (6 | ) | | | (99 | ) | | |
| |
| Increase in net assets from Class R transactions | | | 1,384 | | | | 80 | | | | 1,273 | | | |
| |
| Class Y: | | | | | | | | | | | | | | |
| | Proceeds from sales | | | 279,571 | | | | 16,558 | | | | 363,331 | | | |
| | Reinvestment of distributions | | | 18,320 | | | | 1,126 | | | | 22,938 | | | |
| | Payments for redemptions | | | (496,343 | ) | | | (40,781 | ) | | | (613,170 | ) | | |
| |
| Decrease in net assets from Class Y transactions | | | (198,452 | ) | | | (23,097 | ) | | | (226,901 | ) | | |
| |
| Decrease in net assets from capital share transactions | | | (259,475 | ) | | | (25,760 | ) | | | (268,403 | ) | | |
| |
| Total increase (decrease) in net assets | | | 33,148 | | | | (66,571 | ) | | | (48,095 | ) | | |
Net assets at beginning of period | | | 2,199,153 | | | | 2,265,724 | | | | 2,313,819 | | | |
| |
Net assets at end of period | | $ | 2,232,301 | | | $ | 2,199,153 | | | $ | 2,265,724 | | | |
| |
Undistributed net investment income at end of period | | $ | — | | | $ | — | | | $ | — | | | |
| |
| |
| * | Due to the presentation of the financial statements in thousands, the number rounds to zero. |
The accompanying notes are an integral part of the financial statements.
38 First American Funds Annual Report 2006
| | | | | | | | | | | | | | | | | | | | | | | | | | | | |
| | | Mid Cap | | | Small Cap | | | | |
| | | Index Fund | | | Index Fund | | | | |
| | | | | |
| | | One-Month | | | | | | | One-Month | | | | |
| | | Year | | | Fiscal | | | Year | | | Year | | | Fiscal | | | Year | | | | |
| | | Ended | | | Period Ended | | | Ended | | | Ended | | | Period Ended | | | Ended | | | | |
| | | 10/31/06 | | | 10/31/05 | | | 9/30/05 | | | 10/31/06 | | | 10/31/05 | | | 9/30/05 | | | | |
| | | | | |
| | |
| | | $ | 3,641 | | | $ | 146 | | | $ | 3,270 | | | $ | 1,084 | | | $ | 65 | | | $ | 1,357 | | | | |
| | | | 16,650 | | | | 2,372 | | | | 21,217 | | | | 19,061 | | | | 19 | | | | 9,562 | | | | |
| | | | — | | | | — | | | | — | | | | — | | | | — | | | | — | | | | |
| | | | — | | | | — | | | | — | | | | — | | | | — | | | | — | | | | |
| | | | (149 | ) | | | (122 | ) | | | 1,346 | | | | 115 | | | | (135 | ) | | | 740 | | | | |
| | | | 24,440 | | | | (10,517 | ) | | | 45,063 | | | | 8,715 | | | | (5,614 | ) | | | 16,613 | | | | |
| | | | — | | | | — | | | | — | | | | — | | | | — | | | | — | | | | |
| | | | 333 | | | | (31 | ) | | | (1 | ) | | | 91 | | | | 7 | | | | (11 | ) | | | |
| | | | |
| | | | 44,915 | | | | (8,152 | ) | | | 70,895 | | | | 29,066 | | | | (5,658 | ) | | | 28,261 | | | | |
| | | | |
| | | | (118 | ) | | | — | | | | (93 | ) | | | (65 | ) | | | — | | | | (46 | ) | | | |
| | | | (3 | ) | | | — | | | | (4 | ) | | | — | (1) | | | — | | | | — | | | | |
| | | | (5 | ) | | | — | | | | (3 | ) | | | (1 | ) | | | — | | | | — | | | | |
| | | | (3 | ) | | | — | | | | — | | | | (1 | ) | | | — | | | | — | | | | |
| | | | (3,558 | ) | | | — | | | | (3,117 | ) | | | (1,226 | ) | | | — | | | | (1,212 | ) | | | |
| | | | (865 | ) | | | — | | | | (453 | ) | | | (306 | ) | | | — | | | | (657 | ) | | | |
| | | | (215 | ) | | | — | | | | (114 | ) | | | (45 | ) | | | — | | | | (112 | ) | | | |
| | | | (203 | ) | | | — | | | | (95 | ) | | | (71 | ) | | | — | | | | (140 | ) | | | |
| | | | (7 | ) | | | — | | | | — | | | | (5 | ) | | | — | | | | — | | | | |
| | | | (20,352 | ) | | | — | | | | (11,737 | ) | | | (4,372 | ) | | | — | | | | (12,476 | ) | | | |
| | | | — | | | | — | | | | — | | | | — | | | | — | | | | — | | | | |
| | | | — | | | | — | | | | — | | | | — | | | | — | | | | — | | | | |
| | | | — | | | | — | | | | — | | | | — | | | | — | | | | — | | | | |
| | | | — | | | | — | | | | — | | | | — | | | | — | | | | — | | | | |
| | | | — | | | | — | | | | — | | | | — | | | | — | | | | — | | | | |
| | | | |
| | | | (25,329 | ) | | | — | | | | (15,616 | ) | | | (6,092 | ) | | | — | | | | (14,643 | ) | | | |
| | | | |
| | | | 4,721 | | | | 189 | | | | 4,932 | | | | 2,728 | | | | 143 | | | | 2,981 | | | | |
| | | | 948 | | | | — | | | | 532 | | | | 366 | | | | — | | | | 694 | | | | |
| | | | (6,088 | ) | | | (374 | ) | | | (4,723 | ) | | | (4,016 | ) | | | (77 | ) | | | (2,870 | ) | | | |
| | | | |
| | | | (419 | ) | | | (185 | ) | | | 741 | | | | (922 | ) | | | 66 | | | | 805 | | | | |
| | | | |
| | | | 226 | | | | 25 | | | | 306 | | | | 267 | | | | 5 | | | | 215 | | | | |
| | | | 210 | | | | — | | | | 116 | | | | 42 | | | | — | | | | 108 | | | | |
| | | | (1,406 | ) | | | (7 | ) | | | (523 | ) | | | (668 | ) | | | (12 | ) | | | (379 | ) | | | |
| | | | |
| | | | (970 | ) | | | 18 | | | | (101 | ) | | | (359 | ) | | | (7 | ) | | | (56 | ) | | | |
| | | | |
| | | | 1,893 | | | | 194 | | | | 1,082 | | | | 1,234 | | | | 24 | | | | 705 | | | | |
| | | | 190 | | | | — | | | | 92 | | | | 68 | | | | — | | | | 133 | | | | |
| | | | (1,365 | ) | | | (258 | ) | | | (747 | ) | | | (1,040 | ) | | | (137 | ) | | | (676 | ) | | | |
| | | | |
| | | | 718 | | | | (64 | ) | | | 427 | | | | 262 | | | | (113 | ) | | | 162 | | | | |
| | | | |
| | | | 3,997 | | | | 12 | | | | 119 | | | | 264 | | | | 12 | | | | 11 | | | | |
| | | | 9 | | | | — | | | | — | | | | 6 | | | | — | | | | — | | | | |
| | | | (130 | ) | | | — | | | | — | | | | (38 | ) | | | — | | | | (2 | ) | | | |
| | | | |
| | | | 3,876 | | | | 12 | | | | 119 | | | | 232 | | | | 12 | | | | 9 | | | | |
| | | | |
| | | | 46,865 | | | | 3,157 | | | | 73,080 | | | | 25,574 | | | | 1,010 | | | | 49,781 | | | | |
| | | | 13,587 | | | | — | | | | 8,661 | | | | 3,038 | | | | — | | | | 8,310 | | | | |
| | | | (87,249 | ) | | | (6,774 | ) | | | (93,999 | ) | | | (67,311 | ) | | | (6,383 | ) | | | (62,922 | ) | | | |
| | | | |
| | | | (26,797 | ) | | | (3,617 | ) | | | (12,258 | ) | | | (38,699 | ) | | | (5,373 | ) | | | (4,831 | ) | | | |
| | | | |
| | | | (23,592 | ) | | | (3,836 | ) | | | (11,072 | ) | | | (39,486 | ) | | | (5,415 | ) | | | (3,911 | ) | | | |
| | | | |
| | | | (4,006 | ) | | | (11,988 | ) | | | 44,207 | | | | (16,512 | ) | | | (11,073 | ) | | | 9,707 | | | | |
| | | | 363,394 | | | | 375,382 | | | | 331,175 | | | | 167,228 | | | | 178,301 | | | | 168,594 | | | | |
| | | | |
| | | $ | 359,388 | | | $ | 363,394 | | | $ | 375,382 | | | $ | 150,716 | | | $ | 167,228 | | | $ | 178,301 | | | | |
| | | | |
| | | $ | — | | | $ | 245 | | | $ | 99 | | | $ | — | | | $ | 65 | | | $ | — | | | | |
| | | | |
First American Funds Annual Report 2006 39
Financial Highlights For a share outstanding throughout the indicated periods.
| | | | | | | | | | | | | | | | | | | | | | | | | | | | | | | | | | |
| | | | | | | | | Realized and | | | | | | | | | | | | | |
| | | Net Asset | | | | | | | Unrealized | | | | Distributions | | | | | | | Net Asset | | | | |
| | | Value | | | | Net | | | | Gains | | | | from Net | | | | Distributions | | | | Value | | | | |
| | | Beginning | | | | Investment | | | | (Losses) on | | | | Investment | | | | from Return | | | | End of | | | | |
| | | of Period | | | | Income | | | | Investments | | | | Income | | | | of Capital | | | | Period | | | | |
| | | | | | | | | | | | | | | | | | | | | |
Equity Index Fund (1) | | | | | | | | | | | | | | | | | | | | | | | | | | | | | | | | |
| Class A | | | | | | | | | | | | | | | | | | | | | | | | | | | | | | | | |
| | 2006 (2) | | $ | 22.59 | | | | $ | 0.33 | | | | $ | 3.21 | | | | $ | (0.33 | ) | | | $ | — | | | | $ | 25.80 | | | | |
| | 2005 (3) | | | 23.00 | | | | | 0.01 | | | | | (0.40 | ) | | | | (0.02 | ) | | | | — | (6) | | | | 22.59 | | | | |
| | 2005 (4) | | | 20.91 | | | | | 0.34 | | | | | 2.09 | | | | | (0.34 | ) | | | | — | (6) | | | | 23.00 | | | | |
| | 2004 (4) | | | 18.70 | | | | | 0.23 | | | | | 2.22 | | | | | (0.24 | ) | | | | — | (6) | | | | 20.91 | | | | |
| | 2003 (4) | | | 15.31 | | | | | 0.21 | | | | | 3.38 | | | | | (0.20 | ) | | | | — | | | | | 18.70 | | | | |
| | 2002 (4) | | | 19.50 | | | | | 0.18 | | | | | (4.19 | ) | | | | (0.18 | ) | | | | — | | | | | 15.31 | | | | |
| Class B | | | | | | | | | | | | | | | | | | | | | | | | | | | | | | | | |
| | 2006 (2) | | $ | 22.31 | | | | $ | 0.15 | | | | $ | 3.17 | | | | $ | (0.16 | ) | | | $ | — | | | | $ | 25.47 | | | | |
| | 2005 (3) | | | 22.72 | | | | | — | | | | | (0.40 | ) | | | | (0.01 | ) | | | | — | (6) | | | | 22.31 | | | | |
| | 2005 (4) | | | 20.66 | | | | | 0.18 | | | | | 2.06 | | | | | (0.18 | ) | | | | — | (6) | | | | 22.72 | | | | |
| | 2004 (4) | | | 18.48 | | | | | 0.08 | | | | | 2.19 | | | | | (0.09 | ) | | | | — | (6) | | | | 20.66 | | | | |
| | 2003 (4) | | | 15.13 | | | | | 0.08 | | | | | 3.35 | | | | | (0.08 | ) | | | | — | | | | | 18.48 | | | | |
| | 2002 (4) | | | 19.29 | | | | | 0.03 | | | | | (4.15 | ) | | | | (0.04 | ) | | | | — | | | | | 15.13 | | | | |
| Class C | | | | | | | | | | | | | | | | | | | | | | | | | | | | | | | | |
| | 2006 (2) | | $ | 22.44 | | | | $ | 0.15 | | | | $ | 3.19 | | | | $ | (0.16 | ) | | | $ | — | | | | $ | 25.62 | | | | |
| | 2005 (3) | | | 22.85 | | | | | — | | | | | (0.40 | ) | | | | (0.01 | ) | | | | — | (6) | | | | 22.44 | | | | |
| | 2005 (4) | | | 20.78 | | | | | 0.18 | | | | | 2.07 | | | | | (0.18 | ) | | | | — | (6) | | | | 22.85 | | | | |
| | 2004 (4) | | | 18.59 | | | | | 0.08 | | | | | 2.20 | | | | | (0.09 | ) | | | | — | (6) | | | | 20.78 | | | | |
| | 2003 (4) | | | 15.23 | | | | | 0.08 | | | | | 3.36 | | | | | (0.08 | ) | | | | — | | | | | 18.59 | | | | |
| | 2002 (4) | | | 19.41 | | | | | 0.03 | | | | | (4.17 | ) | | | | (0.04 | ) | | | | — | | | | | 15.23 | | | | |
| Class R (5) | | | | | | | | | | | | | | | | | | | | | | | | | | | | | | | | |
| | 2006 (2) | | $ | 22.57 | | | | $ | 0.26 | | | | $ | 3.21 | | | | $ | (0.27 | ) | | | $ | — | | | | $ | 25.77 | | | | |
| | 2005 (3) | | | 22.98 | | | | | 0.01 | | | | | (0.40 | ) | | | | (0.02 | ) | | | | — | (6) | | | | 22.57 | | | | |
| | 2005 (4) | | | 20.91 | | | | | 0.26 | | | | | 2.11 | | | | | (0.30 | ) | | | | — | (6) | | | | 22.98 | | | | |
| | 2004 (4) | | | 18.70 | | | | | 0.23 | | | | | 2.20 | | | | | (0.22 | ) | | | | — | (6) | | | | 20.91 | | | | |
| | 2003 (4) | | | 15.30 | | | | | 0.21 | | | | | 3.39 | | | | | (0.20 | ) | | | | — | | | | | 18.70 | | | | |
| | 2002 (4) | | | 19.50 | | | | | 0.18 | | | | | (4.20 | ) | | | | (0.18 | ) | | | | — | | | | | 15.30 | | | | |
| Class Y | | | | | | | | | | | | | | | | | | | | | | | | | | | | | | | | |
| | 2006 (2) | | $ | 22.58 | | | | $ | 0.39 | | | | $ | 3.21 | | | | $ | (0.39 | ) | | | $ | — | | | | $ | 25.79 | | | | |
| | 2005 (3) | | | 22.99 | | | | | 0.02 | | | | | (0.41 | ) | | | | (0.02 | ) | | | | — | (6) | | | | 22.58 | | | | |
| | 2005 (4) | | | 20.91 | | | | | 0.40 | | | | | 2.08 | | | | | (0.40 | ) | | | | — | (6) | | | | 22.99 | | | | |
| | 2004 (4) | | | 18.69 | | | | | 0.29 | | | | | 2.22 | | | | | (0.29 | ) | | | | — | (6) | | | | 20.91 | | | | |
| | 2003 (4) | | | 15.30 | | | | | 0.25 | | | | | 3.38 | | | | | (0.24 | ) | | | | — | | | | | 18.69 | | | | |
| | 2002 (4) | | | 19.49 | | | | | 0.23 | | | | | (4.19 | ) | | | | (0.23 | ) | | | | — | | | | | 15.30 | | | | |
| | | | | | | | | | | | | | | | | | | | | | | | | |
| | |
| | (1) | Per share data calculated using average shares outstanding method. |
| |
| | (2) | For the period November 1 to October 31 in the year indicated. |
| |
| | (3) | For the period October 1, 2005 to October 31, 2005. Effective October 1, 2005, the fund’s fiscal year-end was changed from September 30 to October 31. All ratios for the period have been annualized, except total return and portfolio turnover. |
| |
| | (4) | For the period October 1 to September 30 in the year indicated. |
| |
| | (5) | Prior to July 1, 2004, Class R shares were named Class S shares, which had lower fees and expenses. |
| |
| | (6) | Includes a tax return of capital of less than $0.01. |
| |
| | (7) | Total return does not reflect sales charges. Total return would have been lower had certain expenses not been waived. |
The accompanying notes are an integral part of the financial statements.
40 First American Funds Annual Report 2006
| | | | | | | | | | | | | | | | | | | | | | | | | | | | | | | | | | | | | |
| | | | | | | | | | | | | | | | | | Ratio of Net | | | | | | |
| | | | | | | | | | | | | | | Ratio of | | | | Investment | | | | | | |
| | | | | | | | | | | | Ratio of Net | | | | Expenses to | | | | Income (Loss) | | | | | | |
| | | | | | | | | Ratio of | | | | Investment | | | | Average | | | | to Average | | | | | | |
| | | | | | Net Assets | | | | Expenses to | | | | Income (Loss) | | | | Net Assets | | | | Net Assets | | | | Portfolio | | | |
| | | Total | | | | End of | | | | Average | | | | to Average | | | | (Excluding | | | | (Excluding | | | | Turnover | | | |
| | | Return (7) | | | | Period (000) | | | | Net Assets | | | | Net Assets | | | | Waivers) | | | | Waivers) | | | | Rate | | | |
| | | | | | | | | | | | | | | | | | | | | | | | | | | |
| | | | | | | | |
| | | | | | | | |
| | | | 15.76 | % | | | $ | 229,185 | | | | | 0.62 | % | | | | 1.36 | % | | | | 0.77 | % | | | | 1.21 | % | | | | 3 | % | | |
| | | | (1.70 | ) | | | | 234,629 | | | | | 0.62 | | | | | 0.69 | | | | | 0.79 | | | | | 0.52 | | | | | — | | | |
| | | | 11.69 | | | | | 238,379 | | | | | 0.62 | | | | | 1.53 | | | | | 0.79 | | | | | 1.36 | | | | | 4 | | | |
| | | | 13.12 | | | | | 234,349 | | | | | 0.62 | | | | | 1.13 | | | | | 0.79 | | | | | 0.96 | | | | | 1 | | | |
| | | | 23.58 | | | | | 158,324 | | | | | 0.62 | | | | | 1.22 | | | | | 0.80 | | | | | 1.04 | | | | | 1 | | | |
| | | | (20.75 | ) | | | | 139,007 | | | | | 0.62 | | | | | 0.91 | | | | | 0.80 | | | | | 0.73 | | | | | 8 | | | |
| | | | | | | | |
| | | | 14.94 | % | | | $ | 43,369 | | | | | 1.37 | % | | | | 0.63 | % | | | | 1.52 | % | | | | 0.48 | % | | | | 3 | % | | |
| | | | (1.78 | ) | | | | 56,097 | | | | | 1.37 | | | | | (0.06 | ) | | | | 1.54 | | | | | (0.23 | ) | | | | — | | | |
| | | | 10.86 | | | | | 58,857 | | | | | 1.37 | | | | | 0.79 | | | | | 1.54 | | | | | 0.62 | | | | | 4 | | | |
| | | | 12.31 | | | | | 69,828 | | | | | 1.37 | | | | | 0.38 | | | | | 1.54 | | | | | 0.21 | | | | | 1 | | | |
| | | | 22.72 | | | | | 71,624 | | | | | 1.37 | | | | | 0.47 | | | | | 1.55 | | | | | 0.29 | | | | | 1 | | | |
| | | | (21.40 | ) | | | | 66,835 | | | | | 1.37 | | | | | 0.16 | | | | | 1.55 | | | | | (0.02 | ) | | | | 8 | | | |
| | | | | | | | |
| | | | 14.93 | % | | | $ | 20,714 | | | | | 1.37 | % | | | | 0.62 | % | | | | 1.52 | % | | | | 0.47 | % | | | | 3 | % | | |
| | | | (1.78 | ) | | | | 24,195 | | | | | 1.37 | | | | | (0.05 | ) | | | | 1.54 | | | | | (0.22 | ) | | | | — | | | |
| | | | 10.84 | | | | | 26,258 | | | | | 1.37 | | | | | 0.79 | | | | | 1.54 | | | | | 0.62 | | | | | 4 | | | |
| | | | 12.28 | | | | | 30,111 | | | | | 1.37 | | | | | 0.38 | | | | | 1.54 | | | | | 0.21 | | | | | 1 | | | |
| | | | 22.65 | | | | | 31,330 | | | | | 1.37 | | | | | 0.47 | | | | | 1.55 | | | | | 0.29 | | | | | 1 | | | |
| | | | (21.38 | ) | | | | 21,637 | | | | | 1.37 | | | | | 0.16 | | | | | 1.55 | | | | | (0.02 | ) | | | | 8 | | | |
| | | | | | | | |
| | | | 15.47 | % | | | $ | 3,419 | | | | | 0.87 | % | | | | 1.08 | % | | | | 1.15 | % | | | | 0.80 | % | | | | 3 | % | | |
| | | | (1.72 | ) | | | | 1,715 | | | | | 0.87 | | | | | 0.44 | | | | | 1.19 | | | | | 0.12 | | | | | — | | | |
| | | | 11.38 | | | | | 1,663 | | | | | 0.87 | | | | | 1.14 | | | | | 1.19 | | | | | 0.82 | | | | | 4 | | | |
| | | | 13.00 | | | | | 333 | | | | | 0.62 | | | | | 1.13 | | | | | 0.79 | | | | | 0.96 | | | | | 1 | | | |
| | | | 23.66 | | | | | 52,925 | | | | | 0.62 | | | | | 1.22 | | | | | 0.80 | | | | | 1.04 | | | | | 1 | | | |
| | | | (20.79 | ) | | | | 42,964 | | | | | 0.62 | | | | | 0.93 | | | | | 0.80 | | | | | 0.75 | | | | | 8 | | | |
| | | | | | | | |
| | | | 16.07 | % | | | $ | 1,935,614 | | | | | 0.37 | % | | | | 1.61 | % | | | | 0.52 | % | | | | 1.46 | % | | | | 3 | % | | |
| | | | (1.69 | ) | | | | 1,882,517 | | | | | 0.37 | | | | | 0.94 | | | | | 0.54 | | | | | 0.77 | | | | | — | | | |
| | | | 11.92 | | | | | 1,940,567 | | | | | 0.37 | | | | | 1.78 | | | | | 0.54 | | | | | 1.61 | | | | | 4 | | | |
| | | | 13.45 | | | | | 1,979,198 | | | | | 0.37 | | | | | 1.38 | | | | | 0.54 | | | | | 1.21 | | | | | 1 | | | |
| | | | 23.89 | | | | | 1,771,795 | | | | | 0.37 | | | | | 1.46 | | | | | 0.55 | | | | | 1.28 | | | | | 1 | | | |
| | | | (20.56 | ) | | | | 1,135,653 | | | | | 0.37 | | | | | 1.16 | | | | | 0.55 | | | | | 0.98 | | | | | 8 | | | |
| | | | | | | | | | | | | | | | | | | | | | | | | | | | | | | | | |
First American Funds Annual Report 2006 41
Financial Highlights For a share outstanding throughout the indicated periods.
| | | | | | | | | | | | | | | | | | | | | | | | | | | | | | | | | | |
| | | | | | | | | Realized and | | | | | | | | | | | | | |
| | | Net Asset | | | | | | | Unrealized | | | | Distributions | | | | Distributions | | | | Net Asset | | | | |
| | | Value | | | | Net | | | | Gains | | | | from Net | | | | from Net | | | | Value | | | | |
| | | Beginning | | | | Investment | | | | (Losses) on | | | | Investment | | | | Realized | | | | End of | | | | |
| | | of Period | | | | Income (Loss) | | | | Investments | | | | Income | | | | Gains | | | | Period | | | | |
| | | | | | | | | | | | | | | | | | | | | |
Mid Cap Index Fund (1) | | | | | | | | | | | | | | | | | | | | | | | | | | | | | | | | |
| Class A | | | | | | | | | | | | | | | | | | | | | | | | | | | | | | | | |
| | 2006 (2) | | $ | 13.52 | | | | $ | 0.11 | | | | $ | 1.55 | | | | $ | (0.11 | ) | | | $ | (0.82 | ) | | | $ | 14.25 | | | | |
| | 2005 (3) | | | 13.82 | | | | | — | | | | | (0.30 | ) | | | | — | | | | | — | | | | | 13.52 | | | | |
| | 2005 (4) | | | 11.84 | | | | | 0.09 | | | | | 2.40 | | | | | (0.09 | ) | | | | (0.42 | ) | | | | 13.82 | | | | |
| | 2004 (4) | | | 10.36 | | | | | 0.05 | | | | | 1.67 | | | | | (0.05 | ) | | | | (0.19 | ) | | | | 11.84 | | | | |
| | 2003 (4) | | | 8.51 | | | | | 0.04 | | | | | 2.08 | | | | | (0.04 | ) | | | | (0.23 | ) | | | | 10.36 | | | | |
| | 2002 (4) | | | 9.38 | | | | | 0.04 | | | | | (0.49 | ) | | | | (0.04 | ) | | | | (0.38 | ) | | | | 8.51 | | | | |
| Class B | | | | | | | | | | | | | | | | | | | | | | | | | | | | | | | | |
| | 2006 (2) | | $ | 13.28 | | | | $ | — | | | | $ | 1.53 | | | | $ | (0.01 | ) | | | $ | (0.82 | ) | | | $ | 13.98 | | | | |
| | 2005 (3) | | | 13.59 | | | | | (0.01 | ) | | | | (0.30 | ) | | | | — | | | | | — | | | | | 13.28 | | | | |
| | 2005 (4) | | | 11.67 | | | | | (0.01 | ) | | | | 2.37 | | | | | (0.02 | ) | | | | (0.42 | ) | | | | 13.59 | | | | |
| | 2004 (4) | | | 10.25 | | | | | (0.03 | ) | | | | 1.64 | | | | | — | | | | | (0.19 | ) | | | | 11.67 | | | | |
| | 2003 (4) | | | 8.44 | | | | | (0.03 | ) | | | | 2.07 | | | | | — | | | | | (0.23 | ) | | | | 10.25 | | | | |
| | 2002 (4) | | | 9.33 | | | | | (0.03 | ) | | | | (0.48 | ) | | | | — | | | | | (0.38 | ) | | | | 8.44 | | | | |
| Class C | | | | | | | | | | | | | | | | | | | | | | | | | | | | | | | | |
| | 2006 (2) | | $ | 13.32 | | | | $ | — | | | | $ | 1.55 | | | | $ | (0.02 | ) | | | $ | (0.82 | ) | | | $ | 14.03 | | | | |
| | 2005 (3) | | | 13.63 | | | | | (0.01 | ) | | | | (0.30 | ) | | | | — | | | | | — | | | | | 13.32 | | | | |
| | 2005 (4) | | | 11.70 | | | | | (0.01 | ) | | | | 2.38 | | | | | (0.02 | ) | | | | (0.42 | ) | | | | 13.63 | | | | |
| | 2004 (4) | | | 10.28 | | | | | (0.03 | ) | | | | 1.64 | | | | | — | | | | | (0.19 | ) | | | | 11.70 | | | | |
| | 2003 (4) | | | 8.47 | | | | | (0.03 | ) | | | | 2.07 | | | | | — | | | | | (0.23 | ) | | | | 10.28 | | | | |
| | 2002 (4) | | | 9.38 | | | | | (0.02 | ) | | | | (0.51 | ) | | | | — | | | | | (0.38 | ) | | | | 8.47 | | | | |
| Class R (5) | | | | | | | | | | | | | | | | | | | | | | | | | | | | | | | | |
| | 2006 (2) | | $ | 13.48 | | | | $ | 0.07 | | | | $ | 1.55 | | | | $ | (0.09 | ) | | | $ | (0.82 | ) | | | $ | 14.19 | | | | |
| | 2005 (3) | | | 13.78 | | | | | — | | | | | (0.30 | ) | | | | — | | | | | — | | | | | 13.48 | | | | |
| | 2005 (4) | | | 11.83 | | | | | 0.04 | | | | | 2.41 | | | | | (0.08 | ) | | | | (0.42 | ) | | | | 13.78 | | | | |
| | 2004 (4) | | | 10.36 | | | | | 0.06 | | | | | 1.65 | | | | | (0.05 | ) | | | | (0.19 | ) | | | | 11.83 | | | | |
| | 2003 (4) | | | 8.50 | | | | | 0.04 | | | | | 2.09 | | | | | (0.04 | ) | | | | (0.23 | ) | | | | 10.36 | | | | |
| | 2002 (4) | | | 9.38 | | | | | 0.04 | | | | | (0.50 | ) | | | | (0.04 | ) | | | | (0.38 | ) | | | | 8.50 | | | | |
| Class Y | | | | | | | | | | | | | | | | | | | | | | | | | | | | | | | | |
| | 2006 (2) | | $ | 13.53 | | | | $ | 0.15 | | | | $ | 1.56 | | | | $ | (0.15 | ) | | | $ | (0.82 | ) | | | $ | 14.27 | | | | |
| | 2005 (3) | | | 13.83 | | | | | 0.01 | | | | | (0.31 | ) | | | | — | | | | | — | | | | | 13.53 | | | | |
| | 2005 (4) | | | 11.84 | | | | | 0.12 | | | | | 2.41 | | | | | (0.12 | ) | | | | (0.42 | ) | | | | 13.83 | | | | |
| | 2004 (4) | | | 10.37 | | | | | 0.08 | | | | | 1.66 | | | | | (0.08 | ) | | | | (0.19 | ) | | | | 11.84 | | | | |
| | 2003 (4) | | | 8.51 | | | | | 0.06 | | | | | 2.09 | | | | | (0.06 | ) | | | | (0.23 | ) | | | | 10.37 | | | | |
| | 2002 (4) | | | 9.38 | | | | | 0.06 | | | | | (0.49 | ) | | | | (0.06 | ) | | | | (0.38 | ) | | | | 8.51 | | | | |
| | | | | | | | | | | | | | | | | | | | | | | | | |
| | |
| | (1) | Per share data calculated using average shares outstanding method. |
| |
| | (2) | For the period November 1 to October 31 in the year indicated. |
| |
| | (3) | For the period October 1, 2005 to October 31, 2005. Effective in 2005, the fund’s fiscal year-end was changed from September 30 to October 31. All ratios for the period have been annualized, except total return and portfolio turnover. |
| |
| | (4) | For the period October 1 to September 30 in the year indicated. |
| |
| | (5) | Prior to July 1, 2004, Class R shares were named Class S shares, which had lower fees and expenses. |
| |
| | (6) | Total return does not reflect sales charges. Total return would have been lower had certain expenses not been waived. |
The accompanying notes are an integral part of the financial statements.
42 First American Funds Annual Report 2006
| | | | | | | | | | | | | | | | | | | | | | | | | | | | | | | | | | | | | |
| | | | | | | | | | | | | | | | | | Ratio of Net | | | | | | |
| | | | | | | | | | | | | | | Ratio of | | | | Investment | | | | | | |
| | | | | | | | | | | | Ratio of Net | | | | Expenses to | | | | Income (Loss) | | | | | | |
| | | | | | | | | Ratio of | | | | Investment | | | | Average | | | | to Average | | | | | | |
| | | | | | Net Assets | | | | Expenses to | | | | Income (Loss) | | | | Net Assets | | | | Net Assets | | | | Portfolio | | | |
| | | Total | | | | End of | | | | Average | | | | to Average | | | | (Excluding | | | | (Excluding | | | | Turnover | | | |
| | | Return (6) | | | | Period (000) | | | | Net Assets | | | | Net Assets | | | | Waivers) | | | | Waivers) | | | | Rate | | | |
| | | | | | | | | | | | | | | | | | | | | | | | | | | |
| | | | | | | | |
| | | | | | | | |
| | | | 12.70 | % | | | $ | 14,722 | | | | | 0.75 | % | | | | 0.77 | % | | | | 0.81 | % | | | | 0.71 | % | | | | 7 | % | | |
| | | | (2.17 | ) | | | | 14,318 | | | | | 0.75 | | | | | 0.26 | | | | | 0.80 | | | | | 0.21 | | | | | 1 | | | |
| | | | 21.43 | | | | | 14,827 | | | | | 0.75 | | | | | 0.68 | | | | | 0.82 | | | | | 0.61 | | | | | 15 | | | |
| | | | 16.80 | | | | | 11,987 | | | | | 0.75 | | | | | 0.47 | | | | | 0.80 | | | | | 0.42 | | | | | 14 | | | |
| | | | 25.45 | | | | | 5,332 | | | | | 0.75 | | | | | 0.45 | | | | | 0.84 | | | | | 0.36 | | | | | 23 | | | |
| | | | (5.45 | ) | | | | 3,581 | | | | | 0.75 | | | | | 0.37 | | | | | 0.83 | | | | | 0.29 | | | | | 19 | | | |
| | | | | | | | |
| | | | 11.87 | % | | | $ | 2,678 | | | | | 1.50 | % | | | | 0.03 | % | | | | 1.56 | % | | | | (0.03 | )% | | | | 7 | % | | |
| | | | (2.28 | ) | | | | 3,485 | | | | | 1.50 | | | | | (0.49 | ) | | | | 1.55 | | | | | (0.54 | ) | | | | 1 | | | |
| | | | 20.57 | | | | | 3,546 | | | | | 1.50 | | | | | (0.08 | ) | | | | 1.57 | | | | | (0.15 | ) | | | | 15 | | | |
| | | | 15.88 | | | | | 3,133 | | | | | 1.50 | | | | | (0.27 | ) | | | | 1.55 | | | | | (0.32 | ) | | | | 14 | | | |
| | | | 24.63 | | | | | 2,419 | | | | | 1.50 | | | | | (0.30 | ) | | | | 1.59 | | | | | (0.39 | ) | | | | 23 | | | |
| | | | (6.07 | ) | | | | 1,475 | | | | | 1.50 | | | | | (0.37 | ) | | | | 1.58 | | | | | (0.45 | ) | | | | 19 | | | |
| | | | | | | | |
| | | | 11.96 | % | | | $ | 4,320 | | | | | 1.50 | % | | | | 0.02 | % | | | | 1.56 | % | | | | (0.04 | )% | | | | 7 | % | | |
| | | | (2.27 | ) | | | | 3,388 | | | | | 1.50 | | | | | (0.49 | ) | | | | 1.55 | | | | | (0.54 | ) | | | | 1 | | | |
| | | | 20.60 | | | | | 3,533 | | | | | 1.50 | | | | | (0.08 | ) | | | | 1.57 | | | | | (0.15 | ) | | | | 15 | | | |
| | | | 15.83 | | | | | 2,653 | | | | | 1.50 | | | | | (0.27 | ) | | | | 1.55 | | | | | (0.32 | ) | | | | 14 | | | |
| | | | 24.55 | | | | | 1,756 | | | | | 1.50 | | | | | (0.30 | ) | | | | 1.59 | | | | | (0.39 | ) | | | | 23 | | | |
| | | | (6.22 | ) | | | | 795 | | | | | 1.50 | | | | | (0.37 | ) | | | | 1.58 | | | | | (0.45 | ) | | | | 19 | | | |
| | | | | | | | |
| | | | 12.40 | % | | | $ | 4,032 | | | | | 1.00 | % | | | | 0.47 | % | | | | 1.17 | % | | | | 0.30 | % | | | | 7 | % | | |
| | | | (2.18 | ) | | | | 131 | | | | | 1.00 | | | | | 0.01 | | | | | 1.20 | | | | | (0.19 | ) | | | | 1 | | | |
| | | | 21.09 | | | | | 122 | | | | | 1.00 | | | | | 0.28 | | | | | 1.22 | | | | | 0.06 | | | | | 15 | | | |
| | | | 16.62 | | | | | 1 | | | | | 0.75 | | | | | 0.49 | | | | | 0.80 | | | | | 0.44 | | | | | 14 | | | |
| | | | 25.60 | | | | | 4,134 | | | | | 0.75 | | | | | 0.46 | | | | | 0.84 | | | | | 0.37 | | | | | 23 | | | |
| | | | (5.56 | ) | | | | 3,393 | | | | | 0.75 | | | | | 0.37 | | | | | 0.83 | | | | | 0.29 | | | | | 19 | | | |
| | | | | | | | |
| | | | 13.05 | % | | | $ | 333,636 | | | | | 0.50 | % | | | | 1.03 | % | | | | 0.56 | % | | | | 0.97 | % | | | | 7 | % | | |
| | | | (2.17 | ) | | | | 342,072 | | | | | 0.50 | | | | | 0.51 | | | | | 0.55 | | | | | 0.46 | | | | | 1 | | | |
| | | | 21.82 | | | | | 353,354 | | | | | 0.50 | | | | | 0.92 | | | | | 0.57 | | | | | 0.85 | | | | | 15 | | | |
| | | | 16.97 | | | | | 313,403 | | | | | 0.50 | | | | | 0.73 | | | | | 0.55 | | | | | 0.68 | | | | | 14 | | | |
| | | | 25.86 | | | | | 239,174 | | | | | 0.50 | | | | | 0.71 | | | | | 0.59 | | | | | 0.62 | | | | | 23 | | | |
| | | | (5.23 | ) | | | | 198,545 | | | | | 0.50 | | | | | 0.63 | | | | | 0.58 | | | | | 0.55 | | | | | 19 | | | |
| | | | | | | | | | | | | | | | | | | | | | | | | | | | | | | | | |
First American Funds Annual Report 2006 43
Financial Highlights For a share outstanding throughout the indicated periods.
| | | | | | | | | | | | | | | | | | | | | | | | | | | | | | | | | | |
| | | | | | | | | Realized and | | | | | | | | | | | | | |
| | | Net Asset | | | | | | | Unrealized | | | | Distributions | | | | Distributions | | | | Net Asset | | | | |
| | | Value | | | | Net | | | | Gains | | | | from Net | | | | from Net | | | | Value | | | | |
| | | Beginning | | | | Investment | | | | (Losses) on | | | | Investment | | | | Realized | | | | End of | | | | |
| | | of Period | | | | Income (Loss) | | | | Investments | | | | Income | | | | Gains | | | | Period | | | | |
| | | | | | | | | | | | | | | | | | | | | |
Small Cap Index Fund (1) | | | | | | | | | | | | | | | | | | | | | | | | | | | | | | | | |
| Class A | | | | | | | | | | | | | | | | | | | | | | | | | | | | | | | | |
| | 2006 (2) | | $ | 14.12 | | | | $ | 0.07 | | | | $ | 2.56 | | | | $ | (0.10 | ) | | | $ | (0.42 | ) | | | $ | 16.23 | | | | |
| | 2005 (3) | | | 14.57 | | | | | — | | | | | (0.45 | ) | | | | — | | | | | — | | | | | 14.12 | | | | |
| | 2005 (4) | | | 13.38 | | | | | 0.07 | | | | | 2.17 | | | | | (0.06 | ) | | | | (0.99 | ) | | | | 14.57 | | | | |
| | 2004 (4) | | | 11.47 | | | | | 0.04 | | | | | 1.98 | | | | | (0.03 | ) | | | | (0.08 | ) | | | | 13.38 | | | | |
| | 2003 (4) | | | 8.55 | | | | | 0.04 | | | | | 2.92 | | | | | (0.04 | ) | | | | — | | | | | 11.47 | | | | |
| | 2002 (4) | | | 9.68 | | | | | 0.05 | | | | | (1.13 | ) | | | | (0.05 | ) | | | | — | | | | | 8.55 | | | | |
| Class B | | | | | | | | | | | | | | | | | | | | | | | | | | | | | | | | |
| | 2006 (2) | | $ | 13.76 | | | | $ | (0.04 | ) | | | $ | 2.48 | | | | $ | (0.01 | ) | | | $ | (0.42 | ) | | | $ | 15.77 | | | | |
| | 2005 (3) | | | 14.21 | | | | | (0.01 | ) | | | | (0.44 | ) | | | | — | | | | | — | | | | | 13.76 | | | | |
| | 2005 (4) | | | 13.15 | | | | | (0.03 | ) | | | | 2.08 | | | | | — | | | | | (0.99 | ) | | | | 14.21 | | | | |
| | 2004 (4) | | | 11.33 | | | | | (0.06 | ) | | | | 1.96 | | | | | — | | | | | (0.08 | ) | | | | 13.15 | | | | |
| | 2003 (4) | | | 8.47 | | | | | (0.03 | ) | | | | 2.90 | | | | | (0.01 | ) | | | | — | | | | | 11.33 | | | | |
| | 2002 (4) | | | 9.63 | | | | | (0.03 | ) | | | | (1.13 | ) | | | | — | | | | | — | | | | | 8.47 | | | | |
| Class C | | | | | | | | | | | | | | | | | | | | | | | | | | | | | | | | |
| | 2006 (2) | | $ | 13.88 | | | | $ | (0.04 | ) | | | $ | 2.51 | | | | $ | (0.01 | ) | | | $ | (0.42 | ) | | | $ | 15.92 | | | | |
| | 2005 (3) | | | 14.34 | | | | | (0.01 | ) | | | | (0.45 | ) | | | | — | | | | | — | | | | | 13.88 | | | | |
| | 2005 (4) | | | 13.26 | | | | | (0.03 | ) | | | | 2.10 | | | | | — | | | | | (0.99 | ) | | | | 14.34 | | | | |
| | 2004 (4) | | | 11.43 | | | | | (0.06 | ) | | | | 1.97 | | | | | — | | | | | (0.08 | ) | | | | 13.26 | | | | |
| | 2003 (4) | | | 8.54 | | | | | (0.03 | ) | | | | 2.93 | | | | | (0.01 | ) | | | | — | | | | | 11.43 | | | | |
| | 2002 (4) | | | 9.68 | | | | | (0.03 | ) | | | | (1.11 | ) | | | | — | | | | | — | | | | | 8.54 | | | | |
| Class R (5) | | | | | | | | | | | | | | | | | | | | | | | | | | | | | | | | |
| | 2006 (2) | | $ | 13.97 | | | | $ | 0.03 | | | | $ | 2.53 | | | | $ | (0.07 | ) | | | $ | (0.42 | ) | | | $ | 16.04 | | | | |
| | 2005 (3) | | | 14.43 | | | | | — | | | | | (0.46 | ) | | | | — | | | | | — | | | | | 13.97 | | | | |
| | 2005 (4) | | | 13.31 | | | | | 0.04 | | | | | 2.11 | | | | | (0.04 | ) | | | | (0.99 | ) | | | | 14.43 | | | | |
| | 2004 (4) | | | 11.41 | | | | | 0.03 | | | | | 1.97 | | | | | (0.02 | ) | | | | (0.08 | ) | | | | 13.31 | | | | |
| | 2003 (4) | | | 8.52 | | | | | 0.05 | | | | | 2.88 | | | | | (0.04 | ) | | | | — | | | | | 11.41 | | | | |
| | 2002 (4) | | | 9.64 | | | | | 0.05 | | | | | (1.12 | ) | | | | (0.05 | ) | | | | — | | | | | 8.52 | | | | |
| Class Y | | | | | | | | | | | | | | | | | | | | | | | | | | | | | | | | |
| | 2006 (2) | | $ | 14.12 | | | | $ | 0.11 | | | | $ | 2.55 | | | | $ | (0.13 | ) | | | $ | (0.42 | ) | | | $ | 16.23 | | | | |
| | 2005 (3) | | | 14.57 | | | | | 0.01 | | | | | (0.46 | ) | | | | — | | | | | — | | | | | 14.12 | | | | |
| | 2005 (4) | | | 13.43 | | | | | 0.11 | | | | | 2.12 | | | | | (0.10 | ) | | | | (0.99 | ) | | | | 14.57 | | | | |
| | 2004 (4) | | | 11.51 | | | | | 0.07 | | | | | 1.99 | | | | | (0.06 | ) | | | | (0.08 | ) | | | | 13.43 | | | | |
| | 2003 (4) | | | 8.57 | | | | | 0.07 | | | | | 2.94 | | | | | (0.07 | ) | | | | — | | | | | 11.51 | | | | |
| | 2002 (4) | | | 9.70 | | | | | 0.07 | | | | | (1.13 | ) | | | | (0.07 | ) | | | | — | | | | | 8.57 | | | | |
| | | | | | | | | | | | | | | | | | | | | | | | | |
| | |
| | (1) | Per share data calculated using average shares outstanding method. |
| |
| | (2) | For the period November 1 to October 31 in the year indicated. |
| |
| | (3) | For the period October 1, 2005 to October 31, 2005. Effective in 2005, the Fund’s fiscal year-end was changed from September 30 to October 31. All ratios for the period have been annualized, except total return and portfolio turnover. |
| |
| | (4) | For the period October 1 to September 30 in the year indicated. |
| |
| | (5) | Prior to July 1, 2004, Class R shares were named Class S shares, which had lower fees and expenses. |
| |
| | (6) | Total return does not reflect sales charges. Total return would have been lower had certain expenses not been waived. |
The accompanying notes are an integral part of the financial statements.
44 First American Funds Annual Report 2006
| | | | | | | | | | | | | | | | | | | | | | | | | | | | | | | | | | | | | |
| | | | | | | | | | | | | | | | | | Ratio of Net | | | | | | |
| | | | | | | | | | | | | | | Ratio of | | | | Investment | | | | | | |
| | | | | | | | | | | | Ratio of Net | | | | Expenses to | | | | Income (Loss) | | | | | | |
| | | | | | | | | Ratio of | | | | Investment | | | | Average | | | | to Average | | | | | | |
| | | | | | Net Assets | | | | Expenses to | | | | Income (Loss) | | | | Net Assets | | | | Net Assets | | | | Portfolio | | | |
| | | Total | | | | End of | | | | Average | | | | to Average | | | | (Excluding | | | | (Excluding | | | | Turnover | | | |
| | | Return (6) | | | | Period (000) | | | | Net Assets | | | | Net Assets | | | | Waivers) | | | | Waivers) | | | | Rate | | | |
| | | | | | | | | | | | | | | | | | | | | | | | | | | |
| | | | | | | | |
| | | | | | | | |
| | | | 19.02 | % | | | $ | 10,639 | | | | | 0.83 | % | | | | 0.47 | % | | | | 1.08 | % | | | | 0.22 | % | | | | 17 | % | | |
| | | | (3.09 | ) | | | | 10,067 | | | | | 0.83 | | | | | 0.27 | | | | | 1.01 | | | | | 0.09 | | | | | — | | | |
| | | | 17.08 | | | | | 10,323 | | | | | 0.90 | | | | | 0.53 | | | | | 1.03 | | | | | 0.40 | | | | | 23 | | | |
| | | | 17.71 | | | | | 8,749 | | | | | 0.93 | | | | | 0.30 | | | | | 1.02 | | | | | 0.21 | | | | | 25 | | | |
| | | | 34.77 | | | | | 3,480 | | | | | 0.93 | | | | | 0.42 | | | | | 1.05 | | | | | 0.30 | | | | | 41 | | | |
| | | | (11.28 | ) | | | | 1,908 | | | | | 0.93 | | | | | 0.46 | | | | | 1.09 | | | | | 0.30 | | | | | 49 | | | |
| | | | | | | | |
| | | | 18.07 | % | | | $ | 1,333 | | | | | 1.58 | % | | | | (0.28 | )% | | | | 1.83 | % | | | | (0.53 | )% | | | | 17 | % | | |
| | | | (3.17 | ) | | | | 1,498 | | | | | 1.58 | | | | | (0.48 | ) | | | | 1.76 | | | | | (0.66 | ) | | | | — | | | |
| | | | 15.82 | | | | | 1,555 | | | | | 1.65 | | | | | (0.23 | ) | | | | 1.78 | | | | | (0.36 | ) | | | | 23 | | | |
| | | | 16.83 | | | | | 1,494 | | | | | 1.68 | | | | | (0.46 | ) | | | | 1.77 | | | | | (0.55 | ) | | | | 25 | | | |
| | | | 33.87 | | | | | 993 | | | | | 1.68 | | | | | (0.33 | ) | | | | 1.80 | | | | | (0.45 | ) | | | | 41 | | | |
| | | | (12.03 | ) | | | | 424 | | | | | 1.68 | | | | | (0.29 | ) | | | | 1.84 | | | | | (0.45 | ) | | | | 49 | | | |
| | | | | | | | |
| | | | 18.15 | % | | | $ | 2,662 | | | | | 1.58 | % | | | | (0.28 | )% | | | | 1.83 | % | | | | (0.53 | )% | | | | 17 | % | | |
| | | | (3.21 | ) | | | | 2,068 | | | | | 1.58 | | | | | (0.48 | ) | | | | 1.76 | | | | | (0.66 | ) | | | | — | | | |
| | | | 15.84 | | | | | 2,256 | | | | | 1.65 | | | | | (0.23 | ) | | | | 1.78 | | | | | (0.36 | ) | | | | 23 | | | |
| | | | 16.77 | | | | | 1,939 | | | | | 1.68 | | | | | (0.46 | ) | | | | 1.77 | | | | | (0.55 | ) | | | | 25 | | | |
| | | | 33.94 | | | | | 1,268 | | | | | 1.68 | | | | | (0.33 | ) | | | | 1.80 | | | | | (0.45 | ) | | | | 41 | | | |
| | | | (11.72 | ) | | | | 447 | | | | | 1.68 | | | | | (0.26 | ) | | | | 1.84 | | | | | (0.42 | ) | | | | 49 | | | |
| | | | | | | | |
| | | | 18.75 | % | | | $ | 280 | | | | | 1.08 | % | | | | 0.23 | % | | | | 1.47 | % | | | | (0.16 | )% | | | | 17 | % | | |
| | | | (3.19 | ) | | | | 23 | | | | | 1.08 | | | | | 0.02 | | | | | 1.41 | | | | | (0.31 | ) | | | | — | | | |
| | | | 16.45 | | | | | 11 | | | | | 1.15 | | | | | 0.30 | | | | | 1.43 | | | | | 0.02 | | | | | 23 | | | |
| | | | 17.65 | | | | | 1 | | | | | 0.93 | | | | | 0.24 | | | | | 0.99 | | | | | 0.18 | | | | | 25 | | | |
| | | | 34.54 | | | | | 3,210 | | | | | 0.93 | | | | | 0.52 | | | | | 1.05 | | | | | 0.40 | | | | | 41 | | | |
| | | | (11.26 | ) | | | | 13,576 | | | | | 0.93 | | | | | 0.42 | | | | | 1.09 | | | | | 0.26 | | | | | 49 | | | |
| | | | | | | | |
| | | | 19.32 | % | | | $ | 135,802 | | | | | 0.58 | % | | | | 0.72 | % | | | | 0.83 | % | | | | 0.47 | % | | | | 17 | % | | |
| | | | (3.09 | ) | | | | 153,572 | | | | | 0.58 | | | | | 0.52 | | | | | 0.76 | | | | | 0.34 | | | | | — | | | |
| | | | 16.93 | | | | | 164,156 | | | | | 0.65 | | | | | 0.78 | | | | | 0.78 | | | | | 0.65 | | | | | 23 | | | |
| | | | 18.02 | | | | | 156,411 | | | | | 0.68 | | | | | 0.54 | | | | | 0.77 | | | | | 0.45 | | | | | 25 | | | |
| | | | 35.23 | | | | | 119,102 | | | | | 0.68 | | | | | 0.68 | | | | | 0.80 | | | | | 0.56 | | | | | 41 | | | |
| | | | (11.09 | ) | | | | 94,749 | | | | | 0.68 | | | | | 0.68 | | | | | 0.84 | | | | | 0.52 | | | | | 49 | | | |
| | | | | | | | | | | | | | | | | | | | | | | | | | | | | | | | | |
First American Funds Annual Report 2006 45
Notes to Financial Statements October 31, 2006, all dollars and shares are rounded to thousands (000)
| |
| | The Equity Index Fund, Mid Cap Index Fund, and Small Cap Index Fund (each a “fund” and collectively, the “funds”) are mutual funds offered by First American Investment Funds, Inc. (“FAIF”) which is a member of the First American Family of Funds. As of October 31, 2006, FAIF offered 38 funds, including the funds listed above. FAIF is registered under the Investment Company Act of 1940, as amended, as an open-end management investment company. FAIF’s articles of incorporation permit the funds’ board of directors to create additional funds in the future. The Equity Index Fund, Mid Cap Index Fund, and Small Cap Index Fund are each diversified open-end management investment companies. |
| |
| | FAIF offers Class A, Class B, Class C, Class R, and Class Y shares. Class A shares are sold with a front-end sales charge. Class B shares are subject to a contingent deferred sales charge for six years and automatically convert to Class A shares after eight years. Class C shares may be subject to a contingent deferred sales charge for 12 months, and will not convert to Class A shares. Class R shares have no sales charge and are offered only through certain tax-deferred retirement plans. Class Y shares have no sales charge and are offered only to qualifying institutional investors and certain other qualifying accounts. |
| |
| | The funds’ prospectuses provide descriptions of each fund’s investment objective, principal investment strategies, and principal risks. All classes of shares have identical voting, dividend, liquidation, and other rights, and the same terms and conditions, except that certain fees, including distribution and shareholder servicing fees, may differ among classes. Each class has exclusive voting rights on any matters relating to that class’ servicing or distribution arrangements. |
| |
| 2 > | Summary of Significant Accounting Policies |
| |
| | The significant accounting policies followed by the funds are as follows: |
| |
| | SECURITY VALUATIONS – Security valuations for the funds’ investments are furnished by an independent pricing service that has been approved by the funds’ board of directors. Investments in equity securities that are traded on a national securities exchange (or reported on the Nasdaq national market system) are stated at the last quoted sales price if readily available for such securities on each business day. For securities traded on the Nasdaq national market system, the funds utilize the Nasdaq Official Closing Price which compares the last trade to the bid/ask range of a security. If the last trade falls within the bid/ask range, then that price will be the closing price. If the last trade is outside the bid/ask range, and falls above the ask, the ask will be the closing price. If the last trade is below the bid, the bid will be the closing price. Other equity securities traded in the over-the-counter market and listed equity securities for which no sale was reported on that date are stated at the last quoted bid price. Debt obligations exceeding 60 days to maturity are valued by an independent pricing service. The pricing service may employ methodologies that utilize actual market transactions, broker-dealer supplied valuations, or other formula-driven valuation techniques. These techniques generally consider such factors as yields or prices of bonds of comparable quality, type of issue, coupon, maturity, ratings, and general market conditions. Securities for which prices are not available from an independent pricing service, but where an active market exists, are valued using market quotations obtained from one or more dealers that make markets in the securities or from a widely-used quotation system. When market quotations are not readily available, securities are valued at fair value as determined in good faith by procedures established and approved by the funds’ board of directors. Some of the factors which may be considered in determining fair value are fundamental analytical data relating to the investment; the nature and duration of any restrictions on disposition; trading in similar securities of the same issuer or comparable companies; information from broker-dealers; and an evaluation of the forces that influence the market in which the securities are purchased and sold. If events occur that materially affect the value of securities (including non-U.S. securities) between the close of trading in those securities and the close of regular trading on the New York Stock Exchange, the securities will be valued at fair value. As of October 31, 2006, the Equity Index Fund and Small Cap Index Fund had fair valued securities with a total market value of $0 and $0 or 0.0% and 0.0%, respectively, of total net assets for the fund. Debt obligations with 60 days or less remaining until maturity may be valued at their amortized cost, which approximates market value. Investments in open-end mutual funds are valued at their respective net asset value on the valuation date. |
| |
| | SECURITY TRANSACTIONS AND INVESTMENT INCOME – For financial statement purposes, the funds record security transactions on the trade date of the security purchase or sale. Dividend income is recorded on the ex-dividend date. Interest income, including amortization of bond premium and discount, is recorded on an accrual basis. Security gains and losses are determined on the basis of identified cost, which is the same basis used for federal income tax purposes. The resulting gain/loss is calculated as the difference between the fair value and the underlying cost of the security on the transaction date. Each fund reserves the right to pay part or all of the proceeds from a redemption request in a proportionate share of readily marketable securities in the fund instead of cash. |
46 First American Funds Annual Report 2006
| |
| | DISTRIBUTIONS TO SHAREHOLDERS – Distributions from net investment income are declared and paid quarterly for Mid Cap Index Fund and Small Cap Index Fund and monthly for Equity Index Fund. Distributions are payable in cash or reinvested in additional shares of the fund. Any net realized capital gains on sales of a fund’s securities are distributed to shareholders at least annually. |
| |
| | FEDERAL TAXES – Each fund is treated as a separate taxable entity. Each fund intends to continue to qualify as a regulated investment company as provided in Subchapter M of the Internal Revenue Code, as amended, and to distribute all taxable income, if any, to its shareholders. Accordingly, no provision for federal income taxes is required. |
| |
| | Net investment income and net realized gains (losses) may differ for financial statement and tax purposes because of temporary or permanent book-to-tax differences. These differences are primarily due to losses deferred from wash sales, the tax recognition of mark to market gains (losses) on open futures contracts, proceeds from securities litigation, and the sale of real estate investment trust securities (“REITs”). To the extent these differences are permanent, reclassifications are made to the appropriate equity accounts in the period that the differences arise. |
| |
| | On the Statements of Assets and Liabilities the following reclassifications were made: |
| | | | | | | | | |
| | | Accumulated | | | Undistributed | |
| | | Net Realized | | | Net Investment | |
| Fund | | Gain (Loss) | | | Income | |
| |
| Equity Index Fund | | $ | (38 | ) | | $ | 38 | |
| Mid Cap Index Fund | | | 100 | | | | (100 | ) |
| Small Cap Index Fund | | | (144 | ) | | | 144 | |
| |
| |
| | The tax character of distributions made during the year from net investment income or net realized gains may differ from its ultimate characterization for federal income tax purposes. In addition, due to the timing of dividend distributions, the fiscal period or year in which the amounts are distributed may differ from the period or year that the income or realized gains (losses) are recorded by the fund. The distributions paid during the fiscal year ended October 31, 2006, the one-month fiscal period ended October 31, 2005, and the fiscal year ended September 30, 2005, were as follows: |
| | | | | | | | | | | | | |
| | | October 31, 2006 |
| |
| | | Ordinary | | | Long Term | | | |
| Fund | | Income | | | Gain | | | Total | |
| |
| Equity Index Fund | | $ | 33,446 | | | $ | 440 | | | $ | 33,886 | |
| Mid Cap Index Fund | | | 4,985 | | | | 20,344 | | | | 25,329 | |
| Small Cap Index Fund | | | 1,293 | | | | 4,799 | | | | 6,092 | |
| |
| | | | | | | | | | | | | |
| | | October 31, 2005 |
| |
| | | Ordinary | | | Return | | | |
| Fund | | Income | | | of Capital | | | Total | |
| |
| Equity Index Fund | | $ | 1,637 | | | $ | 385 | | | $ | 2,022 | |
| |
| | | | | | | | | | | | | | | | | |
| | | September 30, 2005 |
| |
| | | Ordinary | | | Long Term | | | Return | | | |
| Fund | | Income | | | Gain | | | of Capital | | | Total | |
| |
| Equity Index Fund | | $ | 40,001 | | | $ | — | | | $ | 133 | | | $ | 40,134 | |
| Mid Cap Index Fund | | | 4,638 | | | | 10,978 | | | | — | | | | 15,616 | |
| Small Cap Index Fund | | | 6,571 | | | | 8,072 | | | | — | | | | 14,643 | |
| |
| |
| | As of October 31, 2006, the components of accumulated earnings (deficit) on a tax basis were as follows: |
| | | | | | | | | | | | | | | | | |
| | | | | | | | | Total | |
| | | Undistributed | | | Undistributed | | | Unrealized | | | Accumulated | |
| | | Ordinary | | | Long Term | | | Appreciation | | | Earnings | |
| Fund | | Income | | | Capital Gains | | | (Depreciation) | | | (Deficit) | |
| |
| Equity Index Fund | | $ | — | | | $ | 23,507 | | | $ | 804,744 | | | $ | 828,251 | |
| Mid Cap Index Fund | | | 424 | | | | 16,416 | | | | 84,109 | | | | 100,949 | |
| Small Cap Index Fund | | | 765 | | | | 18,059 | | | | 39,708 | | | | 58,532 | |
| |
| |
| | The difference between book and tax basis unrealized appreciation (depreciation) is primarily due to the tax deferral of losses on wash sales and the amount of gain (loss) recognized for tax purposes due to mark to market adjustments on open futures contracts. |
First American Funds Annual Report 2006 47
Notes to Financial Statements October 31, 2006, all dollars and shares are rounded to thousands (000)
| |
| | FUTURES TRANSACTIONS – In order to gain exposure to or protect against changes in the market, the funds may enter into S&P and Russell Index futures contracts and other stock index futures contracts. Upon entering into a futures contract, the fund is required to deposit cash or pledge U.S. government securities. The margin required for a futures contract is set by the exchange on which the contract is traded. Subsequent payments, which are dependent on the daily fluctuations in the value of the underlying security or securities, are made or received by the fund each day (daily variation margin) and are recorded as unrealized gains (losses) until the contract is closed. When the contract is closed, the fund records a realized gain (loss) equal to the difference between the proceeds from (or cost of) the closing transaction and the fund’s basis in the contract. |
| |
| | The funds’ investment in stock index futures contracts is designed to maintain sufficient liquidity to meet redemption requests and to increase the level of fund assets devoted to replicating the composition of the S&P and Russell Indices while reducing transaction costs. Risks of entering into futures contracts, in general, include the possibility that there will not be a perfect price correlation between the futures contracts and the underlying securities. Second, it is possible that a lack of liquidity for futures contracts could exist in the secondary market, resulting in an inability to close a futures position prior to its maturity date. Third, the purchase of a futures contract involves the risk that a fund could lose more than the original margin deposit required to initiate a futures transaction. These contracts involve market risk in excess of the amount reflected in the fund’s statement of assets and liabilities. Unrealized gains (losses) on outstanding positions in futures contracts held at the close of the year will be recognized as capital gains (losses) for federal income tax purposes. |
| |
| | As of October 31, 2006, Equity Index Fund, Mid Cap Index Fund, and Small Cap Index Fund had outstanding futures contracts. |
| |
| | ILLIQUID OR RESTRICTED SECURITIES – A security may be considered illiquid if it lacks a readily available market. Securities are generally considered liquid if they can be sold or disposed of in the ordinary course of business within seven days at approximately the price at which the security is valued by the fund. Illiquid securities may be valued under methods approved by the funds’ board of directors as reflecting fair value. Each fund intends to invest no more than 15% of its net assets (determined at the time of purchase and reviewed periodically) in illiquid securities. Certain restricted securities may be considered illiquid. Restricted securities are often purchased in private placement transactions, are not registered under the Securities Act of 1933, and may have contractual restrictions on resale. Certain restricted securities eligible for resale to qualified institutional investors, including Rule 144A securities, are not subject to the limitation on a fund’s investment in illiquid securities if they are determined to be liquid in accordance with procedures adopted by the funds’ board of directors. At October 31, 2006, Equity Index Fund and Small Cap Index Fund had investments in illiquid securities with a total value of $0 and $0 or 0.0% and 0.0%, respectively, of total net assets. |
| |
| | Information concerning illiquid securities, including restricted securities considered to be illiquid, is as follows: |
| | | | | | | | | | | | | |
| Equity Index Fund | | Shares | | | Dates Acquired | | | Cost Basis | |
| |
| Seagate, Escrow Shares | | | 45 | | | | 11/00 to 11/02 | | | | $— | |
| |
| | | | | | | | | | | | | |
| Small Cap Index Fund | | Shares | | | Dates Acquired | | | Cost Basis | |
| |
| FirstBank, Fractional Shares | | | — | * | | | 8/05 | | | | $— | |
| Geo Group, Fractional Shares | | | — | * | | | 10/06 | | | | — | |
| National Penn, Fractional Shares | | | — | * | | | 10/05 | | | | — | |
| Petrocorp, Escrow Shares | | | 2 | | | | 6/03 to 8/05 | | | | — | |
| Southern Union Company, Fractional Shares | | | — | * | | | 11/03 to 8/05 | | | | — | |
| USB Holding Company, Fractional Shares | | | — | * | | | 8/05 | | | | — | |
| |
| | |
| | * | Due to the presentation of the financial statements in thousands, the number rounds to zero. |
48 First American Funds Annual Report 2006
| |
| | SECURITIES LENDING – In order to generate additional income, each fund may lend securities representing up to one-third of the value of its total assets (which includes collateral for securities on loan) to broker-dealers, banks, or other institutional borrowers of securities. Each fund’s policy is to maintain collateral in the form of cash, U.S. government securities, or other high-grade debt obligations equal to at least 100% of the value of securities loaned. The collateral is then marked-to-market daily until the securities are returned. As with other extensions of credit, there may be risks of delay in recovery of the securities or even loss of rights in the collateral should the borrower of the security fail financially. Cash collateral is invested in short-term, high-quality, U.S. dollar denominated securities that would be eligible for investment by a money market fund under Investment Company Act Rule 2a-7. As of October 31, 2006, cash collateral invested was as follows: |
| | | | | | | | | | | | | | | | | | | | | | | | | |
| | | | | | | | | | | Other | | | |
| | | Commercial | | | Corporate | | | Repurchase | | | Money Market | | | Short-Term | | | |
| | | Paper | | | Obligations | | | Agreements | | | Funds | | | Securities | | | Total | |
| |
| Equity Index Fund | | $ | 90,709 | | | $ | 106,743 | | | $ | 144,340 | | | $ | 8,678 | | | $ | 6,920 | | | $ | 357,390 | |
| Mid Cap Index Fund | | | 41,777 | | | | 49,161 | | | | 66,477 | | | | 3,997 | | | | 3,187 | | | | 164,599 | |
| Small Cap Index Fund | | | 14,786 | | | | 17,399 | | | | 23,528 | | | | 1,414 | | | | 1,128 | | | | 58,255 | |
| |
| |
| | FAF Advisors, Inc. (“FAF Advisors”), formerly U.S. Bancorp Asset Management, Inc., serves as the securities lending agent for the funds in transactions involving the lending of portfolio securities on behalf of the funds. FAF Advisors acts as the securities lending agent pursuant to, and subject to compliance with conditions contained in, an exemptive order issued by the Securities and Exchange Commission (“SEC”). Effective January 1, 2006, FAF Advisors receives fees equal to 32% of each fund’s income from securities lending transactions. Prior to January 1, 2006, such fees were 35% of each fund’s income from securities lending transactions. Effective January 1, 2007, FAF Advisors will receive fees of up to 25% of each fund’s net income from securities lending transactions. In addition, beginning February 1, 2007, collateral for securities on loan will be invested in a money market fund administered by FAF Advisors and FAF Advisors will receive an administration fee equal to 0.02% of such fund’s average daily net assets. Fees paid to FAF Advisors by the funds for the fiscal year ended October 31, 2006, were as follows: |
| | | | | |
| Fund | | Amount | |
| |
| Equity Index Fund | | $ | 253 | |
| Mid Cap Index Fund | | | 69 | |
| Small Cap Index Fund | | | 91 | |
| |
| |
| | Income from securities lending is recorded on the Statement of Operations as securities lending income net of fees paid to FAF Advisors. |
| |
| | SECURITY LITIGATION SETTLEMENTS – Income from settlement proceeds related to portfolio securities is recorded as an adjustment to realized or unrealized gains or losses. For the fiscal year ended October 31, 2006, Equity Index Fund, Mid Cap Index Fund, and Small Cap Index Fund recorded $93, $12, and $34, respectively, as an adjustment to realized gains or losses for settlement proceeds related to securities no longer included in the portfolios. |
| |
| | EXPENSES – Expenses that are directly related to one of the funds are charged directly to that fund. Other operating expenses are allocated to the funds on several bases, including evenly across all funds, allocated based on relative net assets of all funds within the First American Family of Funds, or a combination of both methods. Class specific expenses, such as distribution fees and shareholder servicing fees, are borne by that class. Income, other expenses, and realized and unrealized gains and losses of a fund are allocated to each respective class in proportion to the relative net assets of each class. |
| |
| | INTERFUND LENDING PROGRAM – Pursuant to an exemptive order issued by the SEC, the funds, along with other registered investment companies in the First American Family of Funds, may participate in an interfund lending program. This program provides an alternative credit facility allowing the funds to borrow from, or lend money to, other participating funds. The funds did not have any interfund lending transactions during the fiscal year ended October 31, 2006. |
| |
| | DEFERRED COMPENSATION PLAN – Under a Deferred Compensation Plan (the “Plan”), non-interested directors of the First American Family of Funds may participate and elect to defer receipt of part or all of their annual compensation. Deferred amounts are treated as though equivalent dollar amounts had been invested in shares of selected open-end First American Funds as designated by the board of directors. All amounts in the Plan are 100% vested and accounts under the Plan are obligations of the funds. Deferred amounts remain in the funds until distributed in accordance with the Plan. |
| |
| | USE OF ESTIMATES IN PREPARATION OF FINANCIAL STATEMENTS – The preparation of financial statements, in conformity with U.S. generally accepted accounting principles, requires management to make estimates and assumptions that affect the reported amounts of assets and liabilities and disclosure of contingent assets and liabilities at the date of the financial |
First American Funds Annual Report 2006 49
Notes to Financial Statements October 31, 2006, all dollars and shares are rounded to thousands (000)
| |
| | statements and the reported results of operations during the reporting period. Actual results could differ from those estimates. |
| |
| | INVESTMENT ADVISORY FEES – Pursuant to an investment advisory agreement (the “Agreement”), FAF Advisors manages each fund’s assets and furnishes related office facilities, equipment, research, and personnel. The Agreement requires each fund to pay FAF Advisors a monthly fee based upon average daily net assets. The annual fee for Equity Index Fund, Mid Cap Index Fund, and Small Cap Index Fund is 0.25%, 0.25%, and 0.40%, respectively. FAF Advisors has agreed to waive fees and reimburse other fund expenses through June 30, 2007, so that total fund operating expenses, as a percentage of average daily net assets, do not exceed the following amounts: |
| | | | | | | | | | | | | | | | | | | | | | | |
| | | Share Class | | |
| |
| Fund | | A | | B | | C | | R | | Y | | |
| |
| Equity Index Fund | | | 0.62 | % | | | 1.37 | % | | | 1.37 | % | | | 0.87 | % | | | 0.37 | % | | |
| Mid Cap Index Fund | | | 0.75 | | | | 1.50 | | | | 1.50 | | | | 1.00 | | | | 0.50 | | | |
| Small Cap Index Fund | | | 0.83 | | | | 1.58 | | | | 1.58 | | | | 1.08 | | | | 0.58 | | | |
| |
| |
| | The funds may invest in related money market funds that are series of First American Funds, Inc. , subject to certain limitations. In order to avoid the payment of duplicative investment advisory fees to FAF Advisors, which acts as the investment advisor to both the investing funds and the related money market funds, FAF Advisors will reimburse each investing fund an amount equal to that portion of FAF Advisors’ investment advisory fee received from the related money market funds that is attributable to the assets of the investing fund. For financial statement purposes, these reimbursements are recorded as investment income. |
| |
| | ADMINISTRATION FEES – FAF Advisors serves as the funds’ administrator pursuant to an administration agreement between FAF Advisors and the funds. U.S. Bancorp Fund Services, LLC (“USBFS”) serves as sub-administrator pursuant to a sub-administration agreement between USBFS and FAF Advisors. FAF Advisors is a subsidiary of U.S. Bank National Association (“U.S. Bank”). Both U.S. Bank and USBFS are direct subsidiaries of U.S. Bancorp. Under the administration agreement, FAF Advisors provides, or engages other entities to provide, services to the funds. These services include various legal, oversight and administrative services, and accounting services. The funds pay FAF Advisors administration fees, which are calculated daily and paid monthly. Prior to July 1, 2006, such fees were equal to each fund’s pro rata share of an amount equal, on an annual basis, to 0.15% of the aggregate average daily net assets of all open-end mutual funds in the First American Family of Funds, up to $8 billion, 0.135% on the next $17 billion of the aggregate average daily net assets, 0.12% on the next $25 billion of the aggregate average daily net assets, and 0.10% of the aggregate average daily net assets in excess of $50 billion. |
| |
| | Effective July 1, 2006, the administration fee was increased to an amount equal, on an annualized basis, to 0.25% of the aggregate average daily net assets of all open-end mutual funds in the First American Family of Funds up to $8 billion, 0.235% on the next $17 billion of the aggregate average daily net assets, 0.22% on the next $25 billion of the aggregate average daily net assets and 0.20% of the aggregate average daily net assets in excess of $50 billion. This increase was a result of incorporating into the administration fee a fee equal to 0.10% of the funds’ average daily net assets that had previously been paid to USBFS as part of the transfer agent fee for providing certain shareholder services, and to reimburse USBFS for its payments to financial institutions that establish and maintain omnibus accounts and provide customary services for such accounts. All fees paid to the sub-administrator are paid from the administration fee. In addition to the foregoing fees, the funds may reimburse FAF Advisors and USBFS for any out-of-pocket expenses incurred in providing administration services. |
| |
| | For the fiscal year ended October 31, 2006, administration fees paid to FAF Advisors by the funds included in this annual report were as follows: |
| | | | | |
| Fund | | Amount | |
| |
| Equity Index Fund | | $ | 3,392 | |
| Mid Cap Index Fund | | | 561 | |
| Small Cap Index Fund | | | 244 | |
| |
| |
| | TRANSFER AGENT FEES – USBFS serves as the funds’ transfer agent pursuant to a transfer agent agreement with FAIF. Prior to July 1, 2006, the funds paid transfer agent fees of $18,500 per share class and additional per account fees for transfer agent services. These fees were allocated to each fund based upon the fund’s pro rata share of the aggregate average daily net assets of the funds that comprise FAIF. Under the transfer agent agreement, the funds also paid USBFS a fee equal, on an annual basis, to 0.10% of each fund’s average daily net assets. This fee was intended to compensate USBFS for |
50 First American Funds Annual Report 2006
| |
| | providing certain shareholder services and to reimburse USBFS for its payments to financial institutions that establish and maintain omnibus accounts and provide customary services for such accounts. In addition to these fees, the funds reimbursed USBFS for out-of-pocket expenses incurred in providing transfer agent services. |
| |
| | Effective July 1, 2006, the funds are charged transfer agent fees on a per shareholder account basis, subject to a minimum fee per share class. These fees are charged to each fund based on the number of accounts within that fund. The $18,500 fee per share class that was charged in addition to per account fees was eliminated. As noted above, effective July 1, 2006, the 0.10% fee for shareholder services and payments to financial services was incorporated into the administration fee. The funds continue to reimburse USBFS for out-of-pocket expenses incurred in providing transfer agent services. |
| |
| | For the fiscal year ended October 31, 2006, transfer agent fees paid to USBFS by the funds included in this annual report were as follows: |
| | | | | |
| Fund | | Amount | |
| |
| Equity Index Fund | | $ | 2,122 | |
| Mid Cap Index Fund | | | 371 | |
| Small Cap Index Fund | | | 186 | |
| |
| |
| | CUSTODIAN FEES – U.S. Bank serves as the funds’ custodian pursuant to a custodian agreement with FAIF. The custodian fee charged for each fund is equal to an annual rate of 0.005% of average daily net assets. All fees are computed daily and paid monthly. |
| |
| | Under the custodian agreement, interest earned on uninvested cash balances is used to reduce a portion of each fund’s custodian expenses. These credits, if any, are disclosed as “Indirect payments from the custodian” in the Statement of Operations. Conversely, the custodian charges a fee for any cash overdrafts incurred which will increase the fund’s custodian expenses. For the fiscal year ended October 31, 2006, custodian fees for Equity Index Fund, Mid Cap Index Fund, and Small Cap Index Fund were increased by $6, $1, and $1 as a result of overdrafts and decreased by $3, $1, and $1 as a result of interest earned, respectively. |
| |
| | DISTRIBUTION AND SHAREHOLDER SERVICING FEES – Quasar Distributors, LLC (“Quasar”), a subsidiary of U.S. Bancorp, serves as distributor of the funds pursuant to a distribution agreement with FAIF. Under the distribution agreement, and pursuant to a plan adopted by each fund under rule 12b-1 of the Investment Company Act, each fund pays Quasar a monthly distribution and/or shareholder servicing fee equal to an annual rate of 0.25%, 1.00%, 1.00% and 0.50% of each fund’s average daily net assets attributable to Class A shares, Class B shares, Class C shares and Class R shares, respectively. Class Y shares pay no distribution or shareholder servicing fees. These fees may be used by Quasar to provide compensation for sales support, distribution activities, and/or shareholder servicing activities. |
| |
| | During the period, FAF Advisors also provided shareholder services pursuant to a shareholder servicing plan and agreement with FAIF with respect to the funds’ Class R shares. Under the shareholder servicing plan and agreement, each fund was required to pay FAF Advisors a monthly shareholder servicing fee equal to an annual rate of 0.15% of each fund’s average daily net assets attributable to Class R shares. FAF Advisors waived all fees under this plan and agreement. This agreement was terminated in September 2006. |
| |
| | Under these distribution and shareholder servicing agreements, the following amounts were retained by affiliates of FAF Advisors for the fiscal year ended October 31, 2006: |
| | | | | |
| Fund | | Amount | |
| |
| Equity Index Fund | | $ | 582 | |
| Mid Cap Index Fund | | | 57 | |
| Small Cap Index Fund | | | 32 | |
| |
| |
| | OTHER FEES AND EXPENSES – In addition to the investment advisory fees, administration fees, transfer agent fees, custodian fees, and distribution and shareholder servicing fees, each fund is responsible for paying most other operating expenses including: legal, auditing, registration fees, postage and printing of shareholder reports, fees and expenses of independent directors, insurance, and other miscellaneous expenses. For the fiscal year ended October 31, 2006, legal fees and expenses of $21 were paid to a law firm of which an Assistant Secretary of the funds is a partner. |
First American Funds Annual Report 2006 51
Notes to Financial Statements October 31, 2006, all dollars and shares are rounded to thousands (000)
| |
| | CONTINGENT DEFERRED SALES CHARGES – A contingent deferred sales charge (“CDSC”) is imposed on redemptions made in Class B shares. The CDSC varies depending on the number of years from time of payment for the purchase of Class B shares until the redemption of such shares. Class B shares automatically convert to Class A shares after eight years. |
| | | | | | | |
| | | CDSC as a Percentage | | | |
| | | of Dollar Amount | | | |
| Year Since Purchase | | Subject to Charge | | | |
| |
| First | | | 5.00 | % | | |
| Second | | | 5.00 | | | |
| Third | | | 4.00 | | | |
| Fourth | | | 3.00 | | | |
| Fifth | | | 2.00 | | | |
| Sixth | | | 1.00 | | | |
| Seventh | | | — | | | |
| Eighth | | | — | | | |
| |
| |
| | A CDSC of 1.00% is imposed on redemptions made in Class C shares for the first twelve months. |
| |
| | The CDSC for Class B shares and Class C shares is imposed on the value of the purchased shares or the value at the time of redemption, whichever is less. |
| |
| | For the fiscal year ended October 31, 2006, total front-end sales charges and CDSCs retained by affiliates of FAF Advisors for distributing the funds’ shares were as follows: |
| | | | | |
| Fund | | Amount | |
| |
| Equity Index Fund | | $ | 193 | |
| Mid Cap Index Fund | | | 39 | |
| Small Cap Index Fund | | | 14 | |
| |
| |
| 4 > | Investment in Common Stock of Affiliate |
| |
| | As disclosed in the Schedule of Investments, Equity Index Fund owns common stock issued by U.S. Bancorp. For the fiscal year ended October 31, 2006, Equity Index Fund recorded a net realized gain from the sale of U.S. Bancorp common stock of $394 and $443 of dividend income from U.S. Bancorp common stock. At October 31, 2006, Equity Index Fund had an unrealized gain of $3,662 with respect to its investment in U.S. Bancorp common stock. |
52 First American Funds Annual Report 2006
| |
| 5 > | Capital Share Transactions |
| |
| | FAIF has 324 billion shares of $0.0001 par value capital stock authorized. Capital share transactions for the funds were as follows: |
| | | | | | | | | | | | | | | | | | | | | | | | | | | | | | | | | | | | | | | | | | |
| | | Equity | | | | Mid Cap | | | | Small Cap | | | |
| | | Index Fund | | | | Index Fund | | | | Index Fund | | | |
| | | | | | | | | | | |
| | | One- | | | | | | | | One- | | | | | | | | One- | | | | | |
| | | Month | | | | | | | | Month | | | | | | | | Month | | | | | |
| | | Fiscal | | | | | | | | Fiscal | | | | | | | | Fiscal | | | | | |
| | | Year | | | Period | | | Year | | | | Year | | | Period | | | Year | | | | Year | | | Period | | | Year | | | |
| | | Ended | | | Ended | | | Ended | | | | Ended | | | Ended | | | Ended | | | | Ended | | | Ended | | | Ended | | | |
| | | 10/31/06 | | | 10/31/05 | | | 9/30/05 | | | | 10/31/06 | | | 10/31/05 | | | 9/30/05 | | | | 10/31/06 | | | 10/31/05 | | | 9/30/05 | | | |
| | | | | | | | | | | |
| Class A: | | | | | | | | | | | | | | | | | | | | | | | | | | | | | | | | | | | | | | | | |
| | Shares issued | | | 1,707 | | | | 196 | | | | 1,995 | | | | | 338 | | | | 14 | | | | 385 | | | | | 177 | | | | 10 | | | | 212 | | | |
| | Shares issued in lieu of cash distributions | | | 111 | | | | 7 | | | | 155 | | | | | 70 | | | | — | | | | 42 | | | | | 25 | | | | — | | | | 49 | | | |
| | Shares redeemed | | | (3,323 | ) | | | (180 | ) | | | (2,991 | ) | | | | (434 | ) | | | (28 | ) | | | (367 | ) | | | | (259 | ) | | | (5 | ) | | | (207 | ) | | |
| | | | | | | | | |
Total Class A transactions | | | (1,505 | ) | | | 23 | | | | (841 | ) | | | | (26 | ) | | | (14 | ) | | | 60 | | | | | (57 | ) | | | 5 | | | | 54 | | | |
| | | | | | | | | |
| Class B: | | | | | | | | | | | | | | | | | | | | | | | | | | | | | | | | | | | | | | | | |
| | Shares issued | | | 78 | | | | 5 | | | | 111 | | | | | 16 | | | | 2 | | | | 24 | | | | | 18 | | | | — | | | | 16 | | | |
| | Shares issued in lieu of cash distributions | | | 14 | | | | — | | | | 25 | | | | | 16 | | | | — | | | | 9 | | | | | 3 | | | | — | | | | 8 | | | |
| | Shares redeemed | | | (903 | ) | | | (82 | ) | | | (924 | ) | | | | (103 | ) | | | (1 | ) | | | (41 | ) | | | | (45 | ) | | | (1 | ) | | | (28 | ) | | |
| | | | | | | | | |
Total Class B transactions | | | (811 | ) | | | (77 | ) | | | (788 | ) | | | | (71 | ) | | | 1 | | | | (8 | ) | | | | (24 | ) | | | (1 | ) | | | (4 | ) | | |
| | | | | | | | | |
| Class C: | | | | | | | | | | | | | | | | | | | | | | | | | | | | | | | | | | | | | | | | |
| | Shares issued | | | 62 | | | | 7 | | | | 126 | | | | | 139 | | | | 15 | | | | 83 | | | | | 84 | | | | 2 | | | | 51 | | | |
| | Shares issued in lieu of cash distributions | | | 6 | | | | — | | | | 10 | | | | | 14 | | | | — | | | | 7 | | | | | 5 | | | | — | | | | 10 | | | |
| | Shares redeemed | | | (337 | ) | | | (78 | ) | | | (436 | ) | | | | (99 | ) | | | (20 | ) | | | (58 | ) | | | | (71 | ) | | | (10 | ) | | | (50 | ) | | |
| | | | | | | | | |
Total Class C transactions | | | (269 | ) | | | (71 | ) | | | (300 | ) | | | | 54 | | | | (5 | ) | | | 32 | | | | | 18 | | | | (8 | ) | | | 11 | | | |
| | | | | | | | | |
| Class R: | | | | | | | | | | | | | | | | | | | | | | | | | | | | | | | | | | | | | | | | |
| | Shares issued | | | 87 | | | | 4 | | | | 60 | | | | | 283 | | | | 1 | | | | 9 | | | | | 18 | | | | 1 | | | | 1 | | | |
| | Shares issued in lieu of cash distributions | | | 1 | | | | — | | | | — | | | | | — | | | | — | | | | — | | | | | — | | | | — | | | | — | | | |
| | Shares redeemed | | | (31 | ) | | | — | | | | (4 | ) | | | | (9 | ) | | | — | | | | — | | | | | (3 | ) | | | — | | | | — | | | |
| | | | | | | | | |
Total Class R transactions | | | 57 | | | | 4 | | | | 56 | | | | | 274 | | | | 1 | | | | 9 | | | | | 15 | | | | 1 | | | | 1 | | | |
| | | | | | | | | |
| Class Y: | | | | | | | | | | | | | | | | | | | | | | | | | | | | | | | | | | | | | | | | |
| | Shares issued | | | 11,626 | | | | 741 | | | | 16,348 | | | | | 3,363 | | | | 237 | | | | 5,681 | | | | | 1,699 | | | | 73 | | | | 3,545 | | | |
| | Shares issued in lieu of cash distributions | | | 762 | | | | 51 | | | | 1,034 | | | | | 998 | | | | — | | | | 684 | | | | | 208 | | | | — | | | | 591 | | | |
| | Shares redeemed | | | (20,707 | ) | | | (1,825 | ) | | | (27,653 | ) | | | | (6,256 | ) | | | (506 | ) | | | (7,277 | ) | | | | (4,415 | ) | | | (460 | ) | | | (4,520 | ) | | |
| | | | | | | | | |
Total Class Y transactions | | | (8,319 | ) | | | (1,033 | ) | | | (10,271 | ) | | | | (1,895 | ) | | | (269 | ) | | | (912 | ) | | | | (2,508 | ) | | | (387 | ) | | | (384 | ) | | |
| | | | | | | | | |
Net decrease in capital shares | | | (10,847 | ) | | | (1,154 | ) | | | (12,144 | ) | | | | (1,664 | ) | | | (286 | ) | | | (819 | ) | | | | (2,556 | ) | | | (390 | ) | | | (322 | ) | | |
| | | | | | | | | |
| |
| | Class B shares converted to Class A shares (reflected as Class A shares issued and Class B shares redeemed) during the fiscal year ended October 31, 2006, the one-month fiscal period ended October 31, 2005, and the fiscal year ended September 30, 2005, were as follows: |
| | | | | | | | | | | | | |
| | | | | One-Month | | | |
| | | Year Ended | | | Fiscal Period | | | Year Ended | |
| Fund | | 10/31/06 | | | Ended 10/31/05 | | | 9/30/05 | |
| |
| Equity Index Fund | | | 373 | | | | 30 | | | | 231 | |
| Mid Cap Index Fund | | | 42 | | | | — | * | | | 5 | |
| Small Cap Index Fund | | | 2 | | | | — | | | | 1 | |
| |
| | |
| | * | Due to the presentation of the financial statements in thousands, this number rounds to zero. |
| |
| 6 > | Investment Security Transactions |
| |
| | During the fiscal year ended October 31, 2006, purchases of securities and proceeds from sales of securities other than temporary investments in short-term securities, were as follows: |
| | | | | | | | | |
| Fund | | Purchases | | | Sales | |
| |
| Equity Index Fund | | $ | 64,685 | | | $ | 307,119 | |
| Mid Cap Index Fund | | | 24,873 | | | | 77,966 | |
| Small Cap Index Fund | | | 25,816 | | | | 71,410 | |
| |
First American Funds Annual Report 2006 53
Notes to Financial Statements October 31, 2006, all dollars and shares are rounded to thousands (000)
| |
| | The aggregate gross unrealized appreciation and depreciation of securities held by the funds and the total cost of securities (including cost of securities purchased with proceeds from securities lending) for federal income tax purposes at October 31, 2006, were as follows: |
| | | | | | | | | | | | | | | | | |
| | | Aggregate | | | Aggregate | | | | | Federal | |
| | | Gross | | | Gross | | | | | Income | |
| Fund | | Appreciation | | | Depreciation | | | Net | | | Tax Cost | |
| |
| Equity Index Fund | | $ | 964,887 | | | $ | (160,143 | ) | | $ | 804,744 | | | $ | 1,788,930 | |
| Mid Cap Index Fund | | | 113,489 | | | | (29,380 | ) | | | 84,109 | | | | 437,962 | |
| Small Cap Index Fund | | | 48,619 | | | | (8,911 | ) | | | 39,708 | | | | 169,180 | |
| |
| |
| | The funds enter into contracts that contain a variety of indemnifications. The funds’ maximum exposure under these arrangements is unknown. However, the funds have not had prior claims or losses pursuant to these contracts and expect the risk of loss to be remote. |
| |
| 8 > | Redemption-in-Kind Transaction |
| |
| | In March 2005, the U.S. Bancorp Pension Plan redeemed $186,709 from the First American Equity Index Fund as a redemption-in-kind transaction. In this transaction, the fund distributed a proportionate amount of securities in the fund’s portfolio to the U.S. Bancorp Pension Plan. Remaining shareholders in the fund did not recognize any additional capital gains from the transaction. |
| |
| 9 > | New Accounting Pronouncements |
| |
| | On July 13, 2006, the Financial Accounting Standards Board (FASB) released FASB Interpretation No. 48 “Accounting for Uncertainty in Income Taxes” (FIN 48). FIN 48 provides guidance for how uncertain tax positions should be recognized, measured, presented, and disclosed in the financial statements. FIN 48 requires the evaluation of tax positions taken or expected to be taken in the course of preparing the funds’ tax returns to determine whether the tax positions are “more-likely-than-not” of being sustained by the applicable tax authority. Tax positions not deemed to meet the more-likely-than-not threshold would be recorded as a tax benefit or expense in the current year. Adoption of FIN 48 is required for fiscal years beginning after December 15, 2006 and is to be applied to all open tax years as of the effective date. At this time, management is evaluating the implications of FIN 48, and its impact in the financial statements has not yet been determined. |
| |
| | In September 2006, FASB issued Statement on Financial Accounting Standards No. 157, “Fair Value Measurements” (FAS 157). FAS 157 clarifies the definition of fair value for financial reporting, establishes a framework for measuring fair value, and requires additional disclosures about the use of fair value measurements. FAS 157 is effective for financial statements issued for fiscal years beginning after November 15, 2007 and interim periods within those fiscal years. As of October 31, 2006, the funds do not believe the adoption of FAS 157 will impact the amounts reported in the financial statements, however, additional disclosures will be required about the inputs used to develop the measurements of fair value and the effect of certain of the measurements reported in the Statement of Operations for a fiscal period. |
| |
| | On November 1, 2006, the U.S. Bancorp Pension Plan redeemed $205,549 from the First American Equity Index Fund as a redemption-in-kind transaction. In this transaction, the fund distributed a proportionate amount of securities in the fund’s portfolio to the U.S. Bancorp Pension Plan. Remaining shareholders in the fund did not recognize any additional capital gains from the transactions. |
54 First American Funds Annual Report 2006
NOTICE TO SHAREHOLDERS October 31, 2006 (unaudited)
TAX INFORMATION
| |
| | The information set forth below is for each fund’s fiscal period as required by federal laws. Most shareholders, however, must report distributions on a calendar year basis for income tax purposes, which may include distributions for portions of two fiscal periods of a fund. Accordingly, the information needed for income tax purposes will be sent in early 2007 on Form 1099-DIV. Please consult your tax advisor for proper treatment of this information. |
| |
| | For the fiscal year ended October 31, 2006, each fund has designated long term capital gains, ordinary income, and tax exempt income with regard to distributions paid during the period as follows: |
| | | | | | | | | | | | | |
| | | Long Term Capital | | | Ordinary Income | | | |
| | | Gains Distributions | | | Distributions | | | Total Distributions | |
| Fund | | (Tax Basis) (a) | | | (Tax Basis) (a) | | | (Tax Basis) (b) | |
| |
| Equity Index Fund | | | 1 | % | | | 99 | % | | | 100 | % |
| Mid Cap Index Fund | | | 80 | | | | 20 | | | | 100 | |
| Small Cap Index Fund | | | 79 | | | | 21 | | | | 100 | |
| |
| | |
| | (a) | Based on a percentage of the fund’s total distributions. |
| |
| | (b) | None of the distributions made by these funds are eligible for the dividends received deduction or are characterized as qualified dividend income. |
| |
| | Shareholder Notification of Federal Tax Status: |
| |
| | Each fund has designated the following percentages of the ordinary income distributions during the fiscal year ended October 31, 2006 as dividends qualifying for the dividends received deduction available to corporate shareholders: |
| | | | | |
| |
| Equity Index Fund | | | 100.00 | % |
| Mid Cap Index Fund | | | 96.68 | |
| Small Cap Index Fund | | | 66.88 | |
| |
| |
| | In addition, each fund has designated the following percentages of the ordinary income distributions from net investment income during the fiscal year ended October 31, 2006 as qualified dividend income available to individual shareholders under the Jobs and Growth Tax Relief Reconciliation Act of 2003: |
| | | | | |
| |
| Equity Index Fund | | | 100.00 | % |
| Mid Cap Index Fund | | | 96.68 | |
| Small Cap Index Fund | | | 67.31 | |
| |
| |
| | Additional Information Applicable to Foreign Shareholders Only: |
| |
| | The percentage of ordinary income distributions that are designated as interest-related dividends under Internal Revenue Code Section 871(k)(1)(c) for each fund were as follows: |
| | | | | |
| Fund | | |
| |
| Equity Index Fund | | | 2.93 | % |
| Mid Cap Index Fund | | | 6.88 | |
| Small Cap Index Fund | | | 7.37 | |
| |
| |
| | The percentage of ordinary income distributions that are designated as short-term capital gain distributions under Internal Revenue Code Section 871(k)(2)(c) for each fund were as follows: |
| | | | | |
| Fund | | |
| |
| Equity Index Fund | | | 0.00 | % |
| Mid Cap Index Fund | | | 31.82 | |
| Small Cap Index Fund | | | 21.75 | |
| |
HOW TO OBTAIN A COPY OF THE FUNDS’ PROXY VOTING POLICIES AND PROXY VOTING RECORD
| |
| | A description of the policies and procedures that the funds use to determine how to vote proxies relating to portfolio securities, as well as information regarding how the funds voted proxies relating to portfolio securities during the most recent 12 month period ended June 30 is available (1) without charge upon request by calling 800.677.FUND; (2) at firstamericanfunds.com; and (3) on the U.S. Securities and Exchange Commission’s website at www.sec.gov. |
First American Funds Annual Report 2006 55
NOTICE TO SHAREHOLDERS October 31, 2006 (unaudited)
FORM N-Q HOLDINGS INFORMATION
| |
| | Each fund is required to file its complete schedule of portfolio holdings for the first and third quarters of each fiscal year with the Securities and Exchange Commission on Form N-Q. The funds’ Forms N-Q are available (1) without charge upon request by calling 800.677.FUND and (2) on the U.S. Securities and Exchange Commission’s website at www.sec.gov. In addition, you may review and copy the funds’ Forms N-Q at the Commission’s Public Reference Room in Washington, D.C. You may obtain information on the operation of the Public Reference Room by calling 1-800-SEC-0330. |
APPROVAL OF INVESTMENT ADVISORY AGREEMENT
| |
| | The Board of Directors of the funds (the “Board”), which is comprised entirely of independent directors, oversees the management of each fund and, as required by law, determines annually whether to renew the funds’ advisory agreement with FAF Advisors, Inc. (“FAF Advisors”). |
| |
| | At a meeting on May 1-3, 2006, the Board considered information relating to the funds’ investment advisory agreement with FAF Advisors (the “Agreement”). In advance of the meeting, the Board received materials relating to the Agreement, and had the opportunity to ask questions and request further information in connection with their consideration. At a subsequent meeting on June 19-21, 2006, the Board concluded its consideration of and approved the Agreement through June 30, 2007. |
| |
| | Although the Agreement, which is with First American Investment Funds, Inc., relates to all of the funds, the Board separately considered and approved the Agreement with respect to each fund. In considering the Agreement, the Board, advised by independent legal counsel, reviewed and considered the factors it deemed relevant, including: (1) the nature, quality and extent of FAF Advisors’ services to the fund, (2) the investment performance of the fund, (3) the profitability of FAF Advisors related to the fund, including an analysis of FAF Advisors’ cost of providing services and comparative expense information, (4) whether economies of scale may be realized as the fund grows and whether fee levels are adjusted to enable fund investors to share in these potential economies of scale, and (5) other benefits that accrue to FAF Advisors through its relationship with the funds. In its deliberations, the Board did not identify any single factor which alone was responsible for the Board’s decision to approve the Agreement. |
| |
| | Before approving the Agreement, the Board met in executive session with its independent counsel on numerous occasions to consider the materials provided by FAF Advisors and the terms of the Agreement. Based on its evaluation of those materials, the Board concluded that the Agreement is fair and in the interests of the shareholders of each fund. In reaching its conclusions, the Board considered the following: |
Nature, Quality and Extent of Investment Advisory Services
| |
| | The Board examined the nature, quality and extent of the services provided by FAF Advisors to each fund. The Board reviewed FAF Advisors’ key personnel who provide investment management services to each fund as well as the fact that, under the Agreement, FAF Advisors has the authority and responsibility to make and execute investment decisions for each fund within the framework of that fund’s investment policies and restrictions, subject to review by the Board. The Board further considered that FAF Advisors’ duties with respect to each fund include (i) investment research and security selection, (ii) adherence to (and monitoring compliance with) the fund’s investment policies and restrictions and the Investment Company Act of 1940, and (iii) monitoring the performance of the various organizations providing services to the fund, including the fund’s distributor, sub-administrator, transfer agent and custodian. Finally, the Board considered FAF Advisors’ representation that the services provided by FAF Advisors under the Agreement are the type of services customarily provided by investment advisors in the fund industry. |
| |
| | The Board also considered compliance reports about FAF Advisors from the funds’ Chief Compliance Officer. |
| |
| | Based on the foregoing, the Board concluded that each fund is likely to benefit from the nature, extent and quality of the services provided by FAF Advisors under the Agreement. |
Investment Performance of the Funds
| |
| | The Board considered the performance of each fund, including how the fund performed versus the median performance of a group of comparable funds selected by an independent data service (the “performance universe”) and how the fund performed versus its benchmark index. The performance periods reviewed by the Board ended on January 31, 2006. |
| |
| | Equity Index Fund. The Board noted that the objective of the fund is to provide investment results that correspond to the performance of the Standard & Poor’s 500 Composite Index. The Board considered that on a gross-of-fees basis, the fund |
56 First American Funds Annual Report 2006
| |
| | achieved a correlation with its benchmark index over the past three years of over 99%, though it performed slightly below its benchmark index on a net-of-fee basis for the one-, three-, five- and ten-year periods. The fund’s performance was comparable to that of its performance universe for all periods, being above the performance universe for Class Y shares and generally slightly below the performance universe for Class A shares, which have higher expenses. The Board concluded that, in light of the fund’s close tracking of its benchmark index and competitive performance vis-à-vis its performance universe, it would be in the interest of the fund and its shareholders to renew the Agreement. |
| |
| | Mid Cap Index Fund. The Board noted that the objective of the fund is to provide investment results that correspond to the performance of the Standard & Poor’s MidCap 400 Composite Index. The Board considered that on a gross-of-fees basis, the fund achieved a correlation with its benchmark index over the past three years of over 99%, while the fund performed slightly below its benchmark index on a net-of-fee basis for the one-, three-, and five-year periods. The fund’s performance was equal to or better than that of its performance universe for all periods, though FAF Advisors noted that the universe is only of limited comparative value because it includes funds that are actively managed or indexed to a different benchmark. The Board concluded that, in light of the fund’s close tracking of its benchmark index and competitive performance vis-à-vis its performance universe, it would be in the interest of the fund and its shareholders to renew the Agreement. |
| |
| | Small Cap Index Fund. The Board noted that the objective of the fund is to provide investment results that correspond to the performance of the Russell 2000 Index. The Board considered that on a gross-of-fees basis, the fund achieved a correlation with its benchmark index over the past three years of over 99%, though it performed slightly below its benchmark index for the one- and three-year periods. For the five-year period, the fund performed competitively against its benchmark index. This performance period, however, included a period of time when the fund was benchmarked against a different index. Though the fund slightly underperformed its performance universe for the one- and three-year periods, the Board considered FAF Advisors’ assertion that only a small number of funds in the performance universe track the Russell 2000 Index. The Board concluded that, in light of the fund’s close tracking of its benchmark index and its competitive performance against the performance universe (even though it is not as meaningful for comparative purposes as the benchmark) it would be in the interest of the fund and its shareholders to renew the Agreement. |
Costs of Services and Profits Realized by FAF Advisors
| |
| | The Board reviewed FAF Advisors’ estimated costs in serving as the funds’ investment manager, including the costs associated with the personnel and systems necessary to manage each fund. The Board also considered the reported profitability of FAF Advisors and its affiliates resulting from their relationship with each fund. For each fund, the Board reviewed fee and expense information as compared to that of other funds and accounts managed by FAF Advisors and of comparable funds managed by other advisers. The Board found that while the management fees for FAF Advisors’ institutional separate accounts are lower than the funds’ management fees, the funds receive additional services from FAF Advisors that separate accounts do not receive. |
| |
| | Using information provided by an independent data service, the Board also evaluated each fund’s advisory fee compared to the median advisory fee for other mutual funds of similar size, character and investment strategy, and each fund’s expense ratio after waivers compared to the median expense ratio, after waivers, of comparable funds. In connection with its review of fund fees and expenses, the Board asked FAF Advisors to articulate its pricing philosophy. FAF Advisors responded that it attempts generally to maintain each fund’s total operating expenses at a level that approximates its peer group median expense ratio. FAF Advisors noted that, in keeping with this pricing philosophy, it intended to waive its investment advisory fees to the extent necessary to maintain the funds’ total expense ratios at levels generally in line with their respective peer groups. Accordingly, FAF Advisors agreed to maintain expense caps of the funds at their current levels through at least June 30, 2007. |
| |
| | Further detail considered by the Board regarding the advisory fees and expense ratios of each fund is set forth below: |
| |
| | Equity Index Fund. The Board considered that the fund’s advisory fee, after waivers, and the expense ratio, after waivers, are lower than the peer group median. The Board concluded that the fund’s advisory fee and expense ratio are reasonable. |
| |
| | Mid Cap Index Fund. The Board considered that the fund’s advisory fee, after waivers, is lower than the peer group median. In addition, the fund’s expense ratio, after waivers, is only slightly higher than the peer group median. The Board concluded that the fund’s advisory fee and expense ratio are reasonable. |
| |
| | Small Cap Index Fund. The Board considered that the fund’s advisory fee, after waivers, is lower than the peer group median. The Board also noted that the fund’s total expense ratio, after waivers, is higher than the peer group median. The Board, however, considered that in 2005 the Board and FAF Advisors agreed to an expense cap that would have kept the |
First American Funds Annual Report 2006 57
NOTICE TO SHAREHOLDERS October 31, 2006 (unaudited)
| |
| | expense ratio below the expense group median had the cap been in place for the fund’s entire fiscal year. The Board concluded that the fund’s advisory fee and expense ratio are reasonable. |
Economies of Scale in Providing Investment Advisory Services
| |
| | The Board considered whether each fund’s investment advisory fee reflects the potential for economies of scale for the benefit of fund shareholders. Based on information provided by FAF Advisors, the Board noted that profitability will likely increase somewhat as assets grow over time. The Board considered that, although the funds do not have advisory fee breakpoints in place, FAF Advisors has committed to waive advisory fees to the extent necessary to keep each fund’s total expenses generally in line with the median total expenses of a peer group of funds as selected by an independent data service. The median total expense ratio of a fund’s peer group will reflect the effect of any breakpoints in the advisory fee schedules of the funds in that group. Therefore, by capping a fund’s total expense ratio at a level close to the median, fund shareholders should receive the benefit of any breakpoints in the comparable funds’ advisory fee schedules. In light of FAF Advisors’ commitment to keep total fund expenses competitive, the Board concluded that it would be reasonable and in the best interest of each fund and its shareholders to renew the Agreement. |
Other Benefits to FAF Advisors
| |
| | In evaluating the benefits that accrue to FAF Advisors through its relationship with the funds, the Board noted that FAF Advisors and certain of its affiliates serve the funds in various capacities, including as advisor, administrator, sub-administrator, transfer agent, distributor, custodian and securities lending agent, and receive compensation from the funds in connection with providing services to the funds. The Board considered that each service provided to the funds by FAF Advisors or one of its affiliates is pursuant to a written agreement, which the Board evaluates periodically as required by law. |
| |
| | After full consideration of these and other factors, the Board concluded that approval of the Agreement was in the best interest of each fund and its shareholders. |
58 First American Funds Annual Report 2006
Directors and Officers of the Funds
| | | | | | | | | | | | | |
| Independent Directors |
| |
| | | Other |
| | | Position(s) | | Term of Office | | | | Number of Portfolios | | Directorships |
| Name, Address, and | | Held | | and Length of | | Principal Occupation(s) | | in Fund Complex | | Held by |
| Year of Birth | | with Funds | | Time Served | | During Past 5 Years | | Overseen by Director | | Director † |
| |
Benjamin R. Field III
P.O. Box 1329
Minneapolis, MN
55440-1329
(1938) | | Director | | Term expiring earlier of death, resignation, removal, disqualification, or successor duly elected and qualified. Director of FAIF since September 2003 | | Retired; Senior Financial Advisor, Bemis Company, Inc. from May 2002 through June 2004; Senior Vice President, Chief Financial Officer & Treasurer, Bemis Company, Inc., through April 2002 | | First American Funds Complex: twelve registered investment companies, including fifty-eight portfolios | | | None | |
| |
Roger A. Gibson
P.O. Box 1329
Minneapolis, MN
55440-1329
(1946) | | Director | | Term expiring earlier of death, resignation, removal, disqualification, or successor duly elected and qualified. Director of FAIF since October 1997 | | Director, Charterhouse Group, Inc., a private equity firm, since October 2005; Vice President and Chief Operating Officer, Cargo – United Airlines from July 2001 through July 2004 | | First American Funds Complex: twelve registered investment companies, including fifty-eight portfolios | | | None | |
| |
Victoria J. Herget
P.O. Box 1329
Minneapolis, MN
55440-1329
(1951) | | Director | | Term expiring earlier of death, resignation, removal, disqualification, or successor duly elected and qualified. Director of FAIF since September 2003 | | Investment consultant and non-profit board member since 2001; Managing Director of Zurich Scudder Investments through 2001 | | First American Funds Complex: twelve registered investment companies, including fifty-eight portfolios | | | None | |
| |
John P. Kayser
P.O. Box 1329
Minneapolis, Mn
55440-1329
(1949) | | Director | | Term expiring earlier of death, resignation, removal, disqualification, or successor duly elected and qualified. Director of FAIF since October 2006 | | Retired; Principal from 1983 to 2004 and Chief Financial Officer and Chief Administrative Officer from 1988 to 2002, William Blair & Company, LLC | | First American Funds Complex: twelve registered investment companies, including fifty-eight portfolios | | | None | |
| |
Leonard W. Kedrowski
P.O. Box 1329
Minneapolis, MN
55440-1329
(1941) | | Director | | Term expiring earlier of death, resignation, removal, disqualification, or successor duly elected and qualified. Director of FAIF since November 1993 | | Owner and President, Executive and Management Consulting, Inc., a management consulting firm; Board member, GC McGuiggan Corporation (dba Smyth Companies), a label printer; former Chief Executive Officer, Creative Promotions International, LLC, a promotional award programs and products company, through October 2003; Advisory Board member, Designer Doors, a manufacturer of designer doors, through 2002 | | First American Funds Complex: twelve registered investment companies, including fifty-eight portfolios | | | None | |
| |
Richard K. Riederer
P.O. Box 1329
Minneapolis, MN
55440-1329
(1944) | | Director | | Term expiring earlier of death, resignation, removal, disqualification, or successor duly elected and qualified. Director of FAIF since August 2001 | | Owner and CEO, RKR Consultants, Inc. and non-profit board member since 2005; Director, President, and Chief Executive Officer, Weirton Steel Corporation through 2001 | | First American Funds Complex: twelve registered investment companies, including fifty-eight portfolios | | Cleveland Cliffs Inc (a producer of iron ore pellets) |
| |
First American Funds Annual Report 2006 59
NOTICE TO SHAREHOLDERS October 31, 2006 (unaudited)
| | | | | | | | | | | | | |
| Independent Directors — continued | |
| | |
| | | Other | |
| | | Position(s) | | Term of Office | | | | Number of Portfolios | | Directorships | |
| Name, Address, and | | Held | | and Length of | | Principal Occupation(s) | | in Fund Complex | | Held by | |
| Year of Birth | | with Funds | | Time Served | | During Past 5 Years | | Overseen by Director | | Director † | |
| | |
Joseph D. Strauss
P.O. Box 1329
Minneapolis, MN
55440-1329
(1940) | | Director | | Term expiring earlier of death, resignation, removal, disqualification, or successor duly elected and qualified. Director of FAIF since April 1991 | | Attorney at law; Owner and President, Strauss Management Company, a Minnesota holding company for various organizational management business ventures; Owner, Chairman and Chief Executive Officer, Community Resource Partnerships, Inc., a strategic planning, operations management, government relations, transportation planning and public relations organization; Owner, Chairman and Chief Executive Officer, Excensustm, LLC, a strategic demographic planning and application development firm since 2001 | | First American Funds Complex: twelve registered investment companies, including fifty-eight portfolios | | | None | |
| |
Virginia L. Stringer
P.O. Box 1329
Minneapolis, MN
55440-1329
(1944) | | Chair; Director | | Chair Term three years. Directors Term expiring earlier of death, resignation, removal, disqualification, or successor duly elected and qualified. Chair of FAIF’s Board since September 1997; Director of FAIF since September 1987 | | Governance Consultant and non-profit board member; former Owner and President, Strategic Management Resources, Inc., a management consulting firm; Executive Consultant to State Farm Insurance Company through 2003 | | First American Funds Complex: twelve registered investment companies, including fifty-eight portfolios | | | None | |
| |
James M. Wade
P.O. Box 1329
Minneapolis, MN
55440-1329
(1943) | | Director | | Term expiring earlier of death, resignation, removal, disqualification, or successor duly elected and qualified. Director of FAIF since August 2001 | | Owner and President, Jim Wade Homes, a homebuilding company | | First American Funds Complex: twelve registered investment companies, including fifty-eight portfolios | | | None | |
| |
| |
| † | Includes only directorships in a company with a class of securities registered pursuant to Section 12 of the Securities Exchange Act or subject to the requirements of Section 15(d) of the Securities Exchange Act, or any company registered as an investment company under the Investment Company Act. |
The Statement of Additional Information (SAI) includes additional information about fund directors and is available upon request without charge by calling 800-677-FUND or writing to First American Funds, P.O. Box 1330, Minneapolis, Minnesota, 55440-1330.
60 First American Funds Annual Report 2006
| | | | | | | |
| Officers |
| |
| | | Position(s) | | Term of Office | | |
| Name, Address, and | | Held | | and Length of | | |
| Year of Birth | | with Funds | | Time Served | | Principal Occupation(s) During Past 5 Years |
| |
Thomas S. Schreier, Jr.
FAF Advisors, Inc.
800 Nicollet Mall
Minneapolis, MN 55402
(1962)* | | President | | Re-elected by the Board annually; President of FAIF since February 2001 | | Chief Executive Officer of FAF Advisors, Inc. |
| |
Mark S. Jordahl
FAF Advisors, Inc.
800 Nicollet Mall
Minneapolis, MN 55402
(1960)* | | Vice President – Investments | | Re-elected by the Board annually; Vice President – Investments of FAIF since September 2001 | | Chief Investment Officer of FAF Advisors, Inc. |
| |
Jeffery M. Wilson
FAF Advisors, Inc.
800 Nicollet Mall
Minneapolis, MN 55402
(1956)* | | Vice President – Administration | | Re-elected by the Board annually; Vice President – Administration of FAIF since March 2000 | | Senior Vice President of FAF Advisors, Inc. |
| |
Charles D. Gariboldi, Jr.
FAF Advisors, Inc.
800 Nicollet Mall
Minneapolis, MN 55402
(1959)* | | Treasurer | | Re-elected by the Board annually; Treasurer of FAIF since December 2004 | | Treasurer, FAF Advisors, Inc., since October 2004; prior thereto, Vice President of Investment Accounting and Fund Treasurer for Thrivent Financial for Lutherans |
| |
Jill M. Stevenson
FAF Advisors, Inc.
800 Nicollet Mall
Minneapolis, MN 55402
(1965)* | | Assistant Treasurer | | Re-elected by the Board annually; Assistant Treasurer of FAIF since September 2005 | | Assistant Treasurer, FAF Advisors, Inc., since September 2005; prior thereto, Director, Senior Project Manager, FAF Advisors, Inc. from May 2003 to September 2005; prior to that, Vice President, Director of Operations, Paladin Investment Associates, LLC |
| |
David H. Lui
FAF Advisors, Inc.
800 Nicollet Mall
Minneapolis, MN 55402
(1960)* | | Chief Compliance Officer | | Re-elected by the Board annually; Chief Compliance Officer of FAIF since March 2005 | | Chief Compliance Officer, FAF Advisors, Inc., since March 2005; prior thereto, Chief Compliance Officer, Franklin Advisors, Inc. and Chief Compliance Counsel, Franklin Templeton Investments from March 2004 to March 2005; prior to that, Vice President, Charles Schwab & Co., Inc. |
| |
Jason K. Mitchell
FAF Advisors, Inc.
800 Nicollet Mall
Minneapolis, MN 55402
(1976)* | | Anti-Money Laundering Officer | | Re-elected by the Board annually: Anti-Money Laundering Officer of FAIF since September 2006 | | Compliance Manager, FAF Advisors, Inc., since June 2006; prior to that, Compliance Analyst, FAF Advisors, Inc., from October 2004 to June 2006; prior to that, Senior Systems Helpdesk Analyst, Wachovia Retirement Services from November 2002 to October 2004; prior thereto, Senior Retirement Plan Specialist, PFPC, Inc. |
| |
Kathleen L. Prudhomme
FAF Advisors, Inc.
800 Nicollet Mall
Minneapolis, MN 55402
(1953)* | | Secretary | | Re-elected by the Board annually; Secretary of FAIF since December 2004; prior thereto, Assistant Secretary of FAIF from September 1998 through December 2004 | | Deputy General Counsel, FAF Advisors, Inc., since November 2004; prior thereto, Partner, Dorsey & Whitney LLP, a Minneapolis-based law firm |
| |
Brett L. Agnew
FAF Advisors, Inc.
800 Nicollet Mall
Minneapolis, MN 55402
(1971)* | | Assistant Secretary | | Re-elected by the Board annually; Assistant Secretary of FAIF since December 2004 | | Counsel, FAF Advisors, Inc., since August 2004; prior thereto, Senior Counsel, Thrivent Financial for Lutherans |
| |
James D. Alt
Dorsey & Whitney LLP
50 South Sixth Street
Suite 1500
Minneapolis, MN 55402
(1951) | | Assistant Secretary | | Re-elected by the Board annually; Assistant Secretary of FAIF since December 2004; prior thereto, Secretary of FAIF since June 2002; Assistant Secretary of FAIF from September 1998 through June 2002 | | Partner, Dorsey & Whitney LLP, a Minneapolis-based law firm |
| |
James R. Arnold
U.S. Bancorp Fund Services, LLC
615 E. Michigan Street
Milwaukee, WI 53202
(1957)* | | Assistant Secretary | | Re-elected by the Board annually; Assistant Secretary of FAIF since June 2003 | | Vice President, U.S. Bancorp Fund Services, LLC since March 2002; prior thereto, Senior Administration Services Manager, UMB Fund Services, Inc. |
| |
First American Funds Annual Report 2006 61
NOTICE TO SHAREHOLDERS October 31, 2006 (unaudited)
| | | | | | | |
| Officers — continued |
| |
| | | Position(s) | | Term of Office | | |
| Name, Address, and | | Held | | and Length of | | |
| Year of Birth | | with Funds | | Time Served | | Principal Occupation(s) During Past 5 Years |
| |
Richard J. Ertel
FAF Advisors, Inc.
800 Nicollet Mall,
Minneapolis, MN 55042
(1967)* | | Assistant Secretary | | Re-elected by the Board annually; Assistant Secretary of FAIF since June 2006 and from June 2003 through August 2004 | | Counsel, FAF Advisors, Inc., since May 2006; prior thereto, Counsel, Ameriprise Financial Services, Inc. from September 2004 to May 2006; prior to that, Counsel, FAF Advisors, Inc. from May 2003 to August 2004; prior to May 2003, Associate Counsel, Hartford Life and Accident Insurance Company |
| |
Douglas G. Hess
U.S. Bancorp Fund Services, LLC
615 E. Michigan Street
Milwaukee, WI 53202
(1967)* | | Assistant Secretary | | Re-elected by the Board annually; Assistant Secretary of FAIF since September 2001 | | Vice President, U.S. Bancorp Fund Services, LLC since November 2002; prior thereto, Assistant Vice President, Fund Compliance Administrator, U.S. Bancorp Fund Services, LLC |
| |
| |
| * | Messrs. Schreier, Jordahl, Wilson, Gariboldi, Lui, Mitchell, Agnew and Ertel, Ms. Stevenson and Ms. Prudhomme are each officers and/or employees of FAF Advisors, Inc., which serves as investment adviser and administrator for FAIF. Messrs. Hess and Arnold are officers of U.S. Bancorp Fund Services, LLC, which is a subsidiary of U.S. Bancorp and which serves as Transfer Agent for FAIF. |
62 First American Funds Annual Report 2006
(This page intentionally left blank.)
(This page intentionally left blank.)
Board of Directors First American Investment Funds, Inc.
| |
| | Virginia Stringer |
| |
| | Chairperson of First American Investment Funds, Inc. |
| | Governance Consultant; former Owner and President of Strategic Management Resources, Inc. |
| |
| | Benjamin Field III |
| |
| | Director of First American Investment Funds, Inc. |
| | Retired; former Senior Financial Advisor, Senior Vice President, Chief |
| | Financial Officer, and Treasurer of Bemis Company, Inc. |
| |
| | Roger Gibson |
| |
| | Director of First American Investment Funds, Inc. |
| | Director of Charterhouse Group, Inc. |
| |
| | Victoria Herget |
| |
| | Director of First American Investment Funds, Inc. |
| | Investment Consultant; former Managing Director of Zurich Scudder Investments |
| |
| | John Kayser |
| |
| | Director of First American Investment Funds, Inc. |
| | Retired; former Principal, Chief Financial Officer, and Chief Administrative |
| | Officer of William Blair & Company, LLC. |
| |
| | Leonard Kedrowski |
| |
| | Director of First American Investment Funds, Inc. |
| | Owner and President of Executive and Management Consulting, Inc. |
| |
| | Richard Riederer |
| |
| | Director of First American Investment Funds, Inc. |
| | Owner and CEO of RKR Consultants, Inc. |
| |
| | Joseph Strauss |
| |
| | Director of First American Investment Funds, Inc. |
| | Owner and President of Strauss Management Company |
| |
| | James Wade |
| |
| | Director of First American Investment Funds, Inc. |
| | Owner and President of Jim Wade Homes |
| |
| | First American Investment Funds’ Board of Directors is comprised entirely of independent directors. |

Direct fund correspondence to:
First American Funds
P.O. Box 1330
Minneapolis, MN 55440-1330
| |
| This report and the financial statements contained herein are not intended to be a forecast of future events, a guarantee of future results, or investment advice. Further, there is no assurance that certain securities will remain in or out of each fund’s portfolio. The views expressed in this report reflect those of the portfolio managers only through the year ended October 31, 2006. The portfolio managers’ views are subject to change at any time based upon market or other conditions. | |
| |
| This report is for the information of shareholders of the First American Investment Funds, Inc. It may also be used as sales literature when preceded or accompanied by a current prospectus, which contains information concerning investment objectives, risks, and charges and expenses of the funds. Read the prospectus carefully before investing. | |
| |
| The figures in this report represent past performance and do not guarantee future results. The principal value of an investment and investment return will fluctuate so that an investor’s shares, when redeemed, may be worth more or less than their original cost. | |
INVESTMENT ADVISOR
| | |
| | FAF Advisors, Inc. | |
| | 800 Nicollet Mall | |
| | Minneapolis, Minnesota 55402 | |
ADMINISTRATOR
| | |
| | FAF Advisors, Inc. | |
| | 800 Nicollet Mall | |
| | Minneapolis, Minnesota 55402 | |
TRANSFER AGENT
| | |
| | U.S. Bancorp Fund Services, LLC | |
| | 615 East Michigan Street | |
| | Milwaukee, Wisconsin 53202 | |
CUSTODIAN
| | |
| | U.S. Bank National Association | |
| | 60 Livingston Avenue | |
| | St. Paul, Minnesota 55101 | |
DISTRIBUTOR
| | |
| | Quasar Distributors, LLC | |
| | 615 East Michigan Street | |
| | Milwaukee, Wisconsin 53202 | |
INDEPENDENT REGISTERED
PUBLIC ACCOUNTING FIRM
| | |
| | Ernst & Young LLP | |
| | 220 South Sixth Street | |
| | Suite 1400 | |
| | Minneapolis, Minnesota 55402 | |
COUNSEL
| | |
| | Dorsey & Whitney LLP | |
| | 50 South Sixth Street | |
| | Suite 1500 | |
| | Minneapolis, Minnesota 55402 | |
First American Funds
P.O. Box 1330
Minneapolis, MN 55440-1330
In an attempt to reduce shareholder costs and help eliminate duplication, First American Funds will try to limit their mailing to one report for each address that lists one or more shareholders with the same last name. If you would like additional copies, please call First American Investor Services at 800.677.FUND or visit firstamericanfunds.com.
0308-06 12/2006 AR-INDEX
Table of Contents
| | | | | | |
| | | 1 | |
| | | 41 | |
Real Estate Securities Fund | | | | |
| | | | | 42 | |
| | | | | 44 | |
| | | | | 45 | |
| | | | | 46 | |
| | | | | 48 | |
International Fund | | | | |
| | | | | 50 | |
| | | | | 52 | |
| | | | | 53 | |
| | | | | 54 | |
| | | | | 56 | |
Small Cap Funds | | | | |
| | | | | 58 | |
| | | | | 66 | |
| | | | | 67 | |
| | | | | 68 | |
| | | | | 70 | |
Mid Cap Funds | | | | |
| | | | | 78 | |
| | | | | 82 | |
| | | | | 83 | |
| | | | | 84 | |
| | | | | 86 | |
Large Cap Funds | | | | |
| | | | | 90 | |
| | | | | 93 | |
| | | | | 94 | |
| | | | | 96 | |
| | | | | 98 | |
Growth & Income Funds | | | | |
| | | | | 104 | |
| | | | | 112 | |
| | | | | 113 | |
| | | | | 114 | |
| | | | | 116 | |
| | | 120 | |
| | | 136 | |
Mutual fund investing involves risk; principal loss is possible.
| |
| | NOT FDIC INSURED NO BANK GUARANTEE MAY LOSE VALUE |
Message to SHAREHOLDERS December 11, 2006
| |
| Dear Shareholders: | |
| |
| We invite you to take a few minutes to review the results of the fiscal year ended October 31, 2006. | |
This report includes comparative performance graphs and tables, portfolio commentaries, complete listings of portfolio holdings, and additional fund information. We hope you will find this helpful in monitoring your investment portfolio.
Also, through our website, firstamericanfunds.com, we provide quarterly performance fact sheets on all First American Funds, the economic outlook as viewed by our senior investment officers, and other information about fund investments and portfolio strategies.
Please contact your financial professional if you have questions about First American Funds or contact First American Investor Services at 800.677.FUND.
We appreciate your investment with First American Funds and look forward to serving your financial needs in the future.
Sincerely,
| | | |
 | |  |
| |
Virginia L. Stringer
Chairperson of the Board
First American Investment Funds, Inc. | | Thomas S. Schreier, Jr.
President
First American Investment Funds, Inc. |
First American Funds Annual Report 2006 1
Real Estate Securities fund
Investment Objective: provide above-average current income and long-term capital appreciation
How did the fund perform for the fiscal year ended October 31, 2006?
The First American Real Estate Securities Fund (the “fund”), Class Y shares, returned 43.58% for the fiscal year ended October 31, 2006 (Class A shares returned 43.25% without taking the sales charge into account). By comparison, the fund’s benchmark, the MSCI U.S. REIT Index*, returned 37.78% for the same period.
What were the general economic and market conditions during the fiscal year?
Economic growth slowed from very strong levels through the first quarter of 2006 to below-potential levels by the end of October. Inflation pressures rose through much of this period in a lagging response to the very strong growth through the first portion of this year, but diminished considerably by October. The Federal Reserve (“Fed”) continued to tighten monetary policy through June as a result of the increase in inflation pressures, but has kept policy steady since that time as its forecast of slowing economic growth and dissipating inflation pressures has been realized. Corporate profit growth remained strong over this 12-month period with third-quarter 2006 earnings of S&P 500 companies advancing by roughly 20% on a year-over-year basis. The strength in corporate earnings, along with lessening inflation pressures and expectations that the Fed will begin easing monetary policy in 2007, has proved to be favorable for the equity markets through October 2006. Positive job growth was beneficial for the commercial real estate sector. Generally, the sector experienced improving occupancy levels and increased rental rates during this fiscal year.
What worked for the fund and why?
The fund benefited from strong individual stock selection. The portfolio had a bias toward growth and higher quality companies, and continues to invest on a relative-value basis (with a focus on individual stocks rather than economic or market cycles). An emphasis on coastal markets, which experienced better job growth and better supply/demand dynamics, proved beneficial. The fund’s best-performing sectors were office, hotels, healthcare, and diversified (i.e., companies owning more than one property type). The fund had positive returns across all property types except mortgage real estate investment trusts (“REITs”).
What did not work for the fund and why?
In what was another year of strong performance for the REIT sector, even the fund’s average cash position of 1.32% was detrimental to the fund’s performance. The mortgage REITs sector underperformed in the strong momentum market REITS experienced during the fiscal year.
What strategic moves were made by the fund and why?
The fund’s emphasis on coastal markets was a successful strategy. The fund invests on a relative-value basis. One result of this is a fairly balanced position across the various property types. The fund was overweight in the industrial sector, given employment and gross domestic product growth and favorable supply/demand characteristics in that sector.
| |
| * | Unlike mutual funds, index returns do not reflect any expenses, transaction costs, or cash flow effects. |
Top 10 Holdings as of October 31, 20061 (% of net assets)
| | | | | |
| Simon Property Group | | | 6.1 | % |
| Prologis | | | 5.7 | |
| Boston Properties | | | 4.3 | |
| Avalonbay Communities | | | 3.9 | |
| Vornado Realty Trust | | | 3.8 | |
| Equity Residential Properties Trust | | | 3.8 | |
| First American Prime Obligations Fund, Class Z | | | 3.6 | |
| Archstone-Smith Trust | | | 3.6 | |
| Regency Centers | | | 3.4 | |
| Host Marriott | | | 3.4 | |
Sector Allocation as of October 31, 20061 (% of net assets)
| | | | | |
| Office | | | 24.2 | % |
| Apartments | | | 18.0 | |
| Malls | | | 11.3 | |
| Community Centers | | | 10.8 | |
| Industrials | | | 9.6 | |
| Hotels | | | 7.8 | |
| Healthcare | | | 6.3 | |
| Diversified | | | 5.5 | |
| Self Storage | | | 2.6 | |
| Net Lease | | | 0.8 | |
| Manufactured Homes | | | 0.6 | |
| Multifamily | | | 0.4 | |
| Real Estate Service Provider | | | 0.3 | |
| Private Real Estate Companies | | | 0.0 | |
| Short-Term Investment | | | 3.6 | |
Other Assets and Liabilities, Net2 | | | (1.8 | ) |
| | | | |
| | | | 100.0 | % |
| |
| 1 | Fund holdings and sector allocations are subject to change at any time and are not recommendations to buy or sell any security. |
| |
| 2 | Investments in securities typically comprise substantially all of the fund’s net assets. Other assets and liabilities include receivables for items such as income earned but not yet received and payables for items such as fund expenses incurred but not yet paid. |
2 First American Funds Annual Report 2006
Real Estate Securities fund continued
Annual Performance1
| | | | | | | | | | | | | | | | | | | | | | | | | | | | | | | | | | | | | | | | | |
| | | October 31, 2006 | | | September 30, 2006* | |
| | | | | | | |
| | | | | Since Inception | | | | | Since Inception | |
| | | | | | | | | | | |
| | | 1 year | | | 5 years | | | 10 years | | | 2/1/2000 | | | 9/24/2001 | | | 1 year | | | 5 years | | | 10 years | | | 2/1/2000 | | | 9/24/2001 | |
| Average annual return with sales charge (POP) |
| Class A | | | 35.35% | | | | 25.12% | | | | 16.21% | | | | — | | | | — | | | | 24.92% | | | | 22.80% | | | | 15.79% | | | | — | | | | — | |
| |
| Class B | | | 37.17% | | | | 25.45% | | | | 16.01% | | | | — | | | | — | | | | 26.24% | | | | 23.09% | | | | 15.59% | | | | — | | | | — | |
| |
| Class C | | | 41.16% | | | | 25.60% | | | | — | | | | 23.25% | | | | — | | | | 30.21% | | | | 23.26% | | | | — | | | | 22.45% | | | | — | |
| Average annual return without sales charge (NAV) |
| Class A | | | 43.25% | | | | 26.55% | | | | 16.87% | | | | — | | | | — | | | | 32.20% | | | | 24.19% | | | | 16.45% | | | | — | | | | — | |
| |
| Class B | | | 42.17% | | | | 25.61% | | | | 16.01% | | | | — | | | | — | | | | 31.24% | | | | 23.26% | | | | 15.59% | | | | — | | | | — | |
| |
| Class C | | | 42.16% | | | | 25.60% | | | | — | | | | 23.25% | | | | — | | | | 31.21% | | | | 23.26% | | | | — | | | | 22.45% | | | | — | |
| |
| Class R | | | 42.87% | | | | 26.39% | | | | — | | | | — | | | | 26.17% | | | | 31.93% | | | | 24.03% | | | | — | | | | — | | | | 25.12% | |
| |
| Class Y | | | 43.58% | | | | 26.87% | | | | 17.53% | | | | — | | | | — | | | | 32.57% | | | | 24.50% | | | | 16.75% | | | | — | | | | — | |
| |
MSCI U.S. REIT Index2 | | | 37.78% | | | | 24.56% | | | | 15.82% | | | | 22.38% | | | | 24.52% | | | | 26.55% | | | | 22.22% | | | | 15.42% | | | | 21.58% | | | | 23.48% | |
Value of $10,000 Investment1,3 as of October 31, 2006
The chart above illustrates the total value of an assumed $10,000 investment in the fund’s Class A and Class Y shares (from 9/30/1996 to 10/31/2006) as compared to the MSCI U.S. REIT Index2.
| |
| The performance data quoted on this page represents past performance and does not guarantee future results. The investment return and principal value of an investment will fluctuate so that an investor’s shares, when redeemed, may be worth more or less than their original cost. Current performance of the fund may be lower or higher than the performance data quoted. Performance data current to the most recent month-end may be obtained by calling 800.677.FUND. |
| |
| * | This table represents average annual total returns through the latest calendar quarter – rather than through the end of the fiscal period. |
| |
| 1 | Performance does not reflect the deduction of taxes that a shareholder would pay on fund distributions or redemption of fund shares. In certain years and/or for certain classes, performance reflects voluntary fee waivers in effect. In the absence of such fee waivers, total returns would be reduced. Index performance is for illustrative purposes only and does not reflect any expenses, transaction costs, or cash flow effects. Direct investment in the index is not available. |
| |
| Sector funds such as the First American Real Estate Securities Fund are more vulnerable to price fluctuation as a result of events that may affect the industry in which they focus than are funds that invest in multiple industries. Share prices of sector funds also will fluctuate with changing market conditions, as will share prices of other stock funds. Sector funds should not be treated as a core investment; rather, their role is to round out the growth portion of a well-diversified investment portfolio. |
| |
| Total returns at net asset value (“NAV”) reflect performance over the time period indicated without including the fund’s maximum sales charge and assume reinvestment of all distributions at NAV. |
| |
| Total returns at public offering price (“POP”) reflect performance over the time period indicated including maximum sales charges of 5.50% for Class A shares and the contingent deferred sales charge (“CDSC”) for Class B and Class C shares for the relevant period. Maximum CDSC is 5.00% for Class B shares in the first year, decreasing annually to 0% in the seventh year following purchase, and 1.00% for Class C shares. Total returns assume reinvestment of all distributions at NAV. |
| |
| 2 | An unmanaged index of the most actively traded real estate investment trusts. |
| |
| 3 | Performance for Class B, Class C, and Class R shares is not presented. Performance for these classes will vary due to the different expense structures. |
First American Funds Annual Report 2006 3
Real Estate Securities fund continued
Expense Example
As a shareholder of the Real Estate Securities Fund (the “fund”), you incur two types of costs: (1) transaction costs, including sales charges (loads) on purchase payments; and (2) ongoing costs, including investment advisory fees, distribution and/or service (12b-1) fees, and other fund expenses. This example is intended to help you understand your ongoing costs (in dollars) of investing in the fund and to compare these costs with the ongoing costs of investing in other mutual funds. The example is based on an investment of $1,000 invested at the beginning of the period and held for the entire period from May 1, 2006, to October 31, 2006.
Actual Expenses
For each class, the first line of the table below provides information about actual account values and actual expenses. You may use the information in this line, together with the amount you invested, to estimate the expenses that you paid over the period. Simply divide your account value by $1,000 (for example, an $8,600 account value divided by $1,000 = 8.6), then multiply the result by the number in the first line under the heading entitled “Expenses Paid During Period” to estimate the expenses you paid on your account during this period.
Hypothetical Example for Comparison Purposes
For each class, the second line of the table below provides information about hypothetical account values and hypothetical expenses based on the fund’s actual expense ratio and an assumed rate of return of 5% per year before expenses, which is not the fund’s actual return. The hypothetical account values and expenses may not be used to estimate the actual ending account balance or expenses you paid for the period. You may use this information to compare the ongoing costs of investing in the fund and other funds. To do so, compare this 5% hypothetical example with the 5% hypothetical examples that appear in the shareholder reports of the other funds.
Please note that the expenses shown in the table are meant to highlight your ongoing costs only and do not reflect any transactional costs, such as sales charges (loads). Therefore, the second line of the table for each class is useful in comparing ongoing costs only, and will not help you determine the relative total costs of owning different funds. In addition, if these transactional costs were included, your costs would have been higher.
Expense Examples
| | | | | | | | | | | | | |
| | | | | | | Expenses Paid During |
| | | Beginning Account | | Ending Account | | Period1 (5/01/06 to |
| | | Value (5/01/06) | | Value (10/31/06) | | 10/31/06) |
Class A Actual2 | | $ | 1,000.00 | | | $ | 1,210.30 | | | $ | 6.80 | |
| |
| Class A Hypothetical (5% return before expenses) | | $ | 1,000.00 | | | $ | 1,019.06 | | | $ | 6.21 | |
| |
Class B Actual2 | | $ | 1,000.00 | | | $ | 1,205.60 | | | $ | 10.95 | |
| |
| Class B Hypothetical (5% return before expenses) | | $ | 1,000.00 | | | $ | 1,015.27 | | | $ | 10.01 | |
| |
Class C Actual2 | | $ | 1,000.00 | | | $ | 1,205.20 | | | $ | 10.95 | |
| |
| Class C Hypothetical (5% return before expenses) | | $ | 1,000.00 | | | $ | 1,015.27 | | | $ | 10.01 | |
| |
Class R Actual2 | | $ | 1,000.00 | | | $ | 1,208.60 | | | $ | 8.24 | |
| |
| Class R Hypothetical (5% return before expenses) | | $ | 1,000.00 | | | $ | 1,017.74 | | | $ | 7.53 | |
| |
Class Y Actual2 | | $ | 1,000.00 | | | $ | 1,211.60 | | | $ | 5.41 | |
| |
| Class Y Hypothetical (5% return before expenses) | | $ | 1,000.00 | | | $ | 1,020.32 | | | $ | 4.94 | |
| |
| 1 | Expenses are equal to the fund’s annualized expense ratio for the most recent six-month period of 1.22%, 1.97%, 1.97%, 1.48%, and 0.97% for Class A, Class B, Class C, Class R, and Class Y, respectively, multiplied by the average account value over the period, multiplied by the number of days in the most recent fiscal half-year/365 (to reflect the one-half year period). |
| |
| 2 | Based on the actual returns for the six-month period ended October 31, 2006 of 21.03%, 20.56%, 20.52%, 20.86%, and 21.16% for Class A, Class B, Class C, Class R, and Class Y, respectively. |
4 First American Funds Annual Report 2006
International fund
Investment Objective: long-term growth of capital
How did the fund perform for the fiscal year ended October 31, 2006?
The First American International Fund (the “fund”), Class Y shares, returned 24.81% for the fiscal year ended October 31, 2006 (Class A shares returned 24.50% without taking the sales charge into account). By comparison, the fund’s benchmark, the MSCI EAFE Index*, returned 28.04% for the same period.
What were the general economic and market conditions during the fiscal year?
Global equities rose robustly during the period, with international markets outperforming the U.S. market. Corporate earnings globally have been impressive as the fall in energy prices has helped to ease the future operating burden on global businesses and helped tame the threat of inflation. The biggest gains were in Europe, aided by strong economic data and attractive valuations. Lower-quality and value companies continued to outpace ones characterized by higher quality and growth.
What worked for the fund and why?
Stock selection has been the primary source of performance. The portfolio benefited from holdings in the United Kingdom (U.K.), Pacific Rim countries (excluding Japan), and emerging markets. From a sector perspective, energy, consumer discretionary, and consumer staples added the most value. In terms of specific stocks, British Land, the U.K. real estate company, contributed during the fiscal year as the U.K. real estate market continued to drive company profits. Office rents in 2006 rose at the fastest pace since 2001, especially in London, where most of British Land’s office properties are located.
What did not work for the fund and why?
While the portfolio achieved a very attractive absolute return, it still lagged the benchmark. From a regional perspective, our holdings in Japan turned in a disappointing performance, as did those in Europe (apart from the United Kingdom), despite the strong overall performance of the European markets. At a sector level, our stock selection within industrials, and our underweight in utilities detracted from performance the most. Within Japan, Credit Saison, a financial services company, held back returns on the fear that the ruling party was going to cap rates such companies can charge customers.
What strategic moves were made by the fund and why?
The fund seeks to identify large-cap, high-quality companies with robust growth profiles. We define quality companies as those with high returns on equity**, sustainable earnings, and healthy balance sheets. We remained focused on large-cap securities reflecting the relative attractiveness of their valuations, and continue to view many emerging markets opportunities as fully valued. Convinced that the Japanese domestic recovery was underway, we moved closer to the Japanese consumer through investments in financials and industrials. With energy prices at lower levels, our concerns about inflation remain benign, creating a strong case for investing in equities. Global growth remains robust, pricing pressures are peaking, interest rates in the United States appear to have stabilized, and the profits cycle looks more resilient than many have feared. While European and Japanese monetary conditions may continue to tighten, it is clear that with real interest rates below historical standards global liquidity conditions remain supportive of future growth.
| |
| * | Unlike mutual funds, index returns do not reflect any expenses, transaction costs, or cash flow effects. |
| ** | Return on equity is an indicator of corporate profitability, widely used by investors as a measure of how a company is using its money. |
Top 10 Holdings as of October 31, 20061 (% of net assets)
| | | | | |
| Total | | | 4.0% | |
| HSBC | | | 3.4 | |
| Eni | | | 3.0 | |
| UBS | | | 2.5 | |
| GlaxoSmithKline | | | 2.4 | |
| Tesco | | | 2.4 | |
| Vodafone | | | 2.1 | |
| Barclays | | | 2.0 | |
| Novartis | | | 1.9 | |
| Mitsubishi UFJ Financial Group | | | 1.9 | |
Country Allocation as of October 31, 20061 (% of net assets)
| | | | | |
| Japan | | | 23.2 | % |
| Great Britain | | | 20.7 | |
| France | | | 13.4 | |
| Switzerland | | | 11.3 | |
| Italy | | | 5.6 | |
| Hong Kong | | | 4.6 | |
| Germany | | | 4.3 | |
| Netherlands | | | 3.9 | |
| Spain | | | 2.1 | |
| Belgium | | | 1.9 | |
| Brazil | | | 1.8 | |
| Australia | | | 1.7 | |
| Sweden | | | 1.4 | |
| Finland | | | 1.3 | |
| South Korea | | | 0.8 | |
| Ireland | | | 0.7 | |
| Mexico | | | 0.3 | |
| Short-Term Investment | | | 1.1 | |
Other Assets & Liabilities, Net2 | | | (0.1 | ) |
| | | | |
| | | | 100.0 | % |
| |
| 1 | Fund holdings and country allocations are subject to change at any time and are not recommendations to buy or sell any security. |
| |
| 2 | Investments in securities typically comprise substantially all of the fund’s net assets. Other assets and liabilities include receivables for items such as income earned but not yet received and payables for items such as fund expenses incurred but not yet paid. |
First American Funds Annual Report 2006 5
International fund
Annual Performance1
| | | | | | | | | | | | | | | | | | | | | | | | | | | | | | | | | |
| | | October 31, 2006 | | | September 30, 2006* | |
| | | | | | | |
| | | | | Since Inception | | | | | Since Inception | |
| | | | | | | | | | | |
| | | 1 year | | | 5 years | | | 10 years | | | 9/24/2001 | | | 1 year | | | 5 years | | | 10 years | | | 9/24/2001 | |
Average annual return with sales charge (POP) | | | | | | | | | | | | | | | | | | | | | | | | | | | | | | | | |
| Class A | | | 17.64% | | | | 9.25% | | | | 6.44% | | | | — | | | | 11.17% | | | | 8.92% | | | | 5.86% | | | | — | |
| |
| Class B | | | 18.50% | | | | 9.36% | | | | 6.25% | | | | — | | | | 11.75% | | | | 9.07% | | | | 5.68% | | | | — | |
| |
| Class C | | | 22.53% | | | | 9.63% | | | | — | | | | 11.03% | | | | 15.73% | | | | 9.32% | | | | — | | | | 10.42% | |
Average annual return without sales charge (NAV) | | | | | | | | | | | | | | | | | | | | | | | | | | | | | | | | |
| Class A | | | 24.50% | | | | 10.48% | | | | 7.05% | | | | — | | | | 17.62% | | | | 10.16% | | | | 6.46% | | | | — | |
| |
| Class B | | | 23.50% | | | | 9.64% | | | | 6.25% | | | | — | | | | 16.75% | | | | 9.35% | | | | 5.68% | | | | — | |
| |
| Class C | | | 23.53% | | | | 9.63% | | | | — | | | | 11.03% | | | | 16.73% | | | | 9.32% | | | | — | | | | 10.42% | |
| |
| Class R | | | 24.04% | | | | 10.15% | | | | 6.89% | | | | — | | | | 17.26% | | | | 9.84% | | | | 6.30% | | | | — | |
| |
| Class Y | | | 24.81% | | | | 10.75% | | | | 7.34% | | | | — | | | | 17.91% | | | | 10.44% | | | | 6.75% | | | | — | |
| |
MSCI EAFE Index2 | | | 28.04% | | | | 15.00% | | | | 7.70% | | | | 16.38% | | | | 19.65% | | | | 14.70% | | | | 7.18% | | | | 15.79% | |
Value of $10,000 Investment1,3 as of October 31, 2006
The chart above illustrates the total value of an assumed $10,000 investment in the fund’s Class A and Class Y shares (from 9/30/1996 to 10/31/2006) as compared to the MSCI EAFE Index2.
| |
| | The performance data quoted on this page represents past performance and does not guarantee future results. The investment return and principal value of an investment will fluctuate so that an investor’s shares, when redeemed, may be worth more or less than their original cost. Current performance of the fund may be lower or higher than the performance data quoted. Performance data current to the most recent month-end may be obtained by calling 800.677.FUND. |
| |
| * | This table represents average annual total returns through the latest calendar quarter – rather than through the end of the fiscal period. |
| |
| 1 | Performance does not reflect the deduction of taxes that a shareholder would pay on fund distributions or redemption of fund shares. In certain years and/or for certain classes, performance reflects voluntary fee waivers in effect. In the absence of such fee waivers, total returns would be reduced. Index performance is for illustrative purposes only and does not reflect any expenses, transaction costs, or cash flow effects. Direct investment in the index is not available. |
| |
| | International investing involves risks not typically associated with domestic investing, including risks of adverse currency fluctuations, potential political and economic instability, different accounting standards, foreign government regulations, currency exchange rates, limited liquidity, and volatile prices. |
| |
| | Total returns at net asset value (“NAV”) reflect performance over the time period indicated without including the fund’s maximum sales charge and assume reinvestment of all distributions at NAV. |
| |
| | Total returns at public offering price (“POP”) reflect performance over the time period indicated including maximum sales charges of 5.50% for Class A shares and the contingent deferred sales charge (“CDSC”) for Class B and Class C shares for the relevant period. Maximum CDSC is 5.00% for Class B shares in the first year, decreasing annually to 0% in the seventh year following purchase, and 1.00% for Class C shares. Total returns assume reinvestment of all distributions at NAV. |
| |
| | Effective December 8, 2004, JPMorgan was named the fund’s subadvisor and began managing the fund’s assets. On September 24, 2001, the First American International Fund merged with Firstar International Growth Fund and Firstar International Value Fund, both subadvised by Clay Finlay Inc. Performance history prior to September 24, 2001 represents that of the Firstar International Growth Fund. |
| |
| 2 | An unmanaged index of common stocks in Europe, Australasia, and the Far East. |
| |
| 3 | Performance for Class B, Class C, and Class R shares is not presented. Performance for these classes will vary due to the different expense structures. |
6 First American Funds Annual Report 2006
International fund
Expense Example
As a shareholder of the International Fund (the “fund”), you incur two types of costs: (1) transaction costs, including sales charges (loads) on purchase payments; and (2) ongoing costs, including investment advisory fees, distribution and/or service (12b-1) fees, and other fund expenses. This example is intended to help you understand your ongoing costs (in dollars) of investing in the fund and to compare these costs with the ongoing costs of investing in other mutual funds. The example is based on an investment of $1,000 invested at the beginning of the period and held for the entire period from May 1, 2006, to October 31, 2006.
Actual Expenses
For each class, the first line of the table below provides information about actual account values and actual expenses. You may use the information in this line, together with the amount you invested, to estimate the expenses that you paid over the period. Simply divide your account value by $1,000 (for example, an $8,600 account value divided by $1,000 = 8.6), then multiply the result by the number in the first line under the heading entitled “Expenses Paid During Period” to estimate the expenses you paid on your account during this period.
Hypothetical Example for Comparison Purposes
For each class, the second line of the table below provides information about hypothetical account values and hypothetical expenses based on the fund’s actual expense ratio and an assumed rate of return of 5% per year before expenses, which is not the fund’s actual return. The hypothetical account values and expenses may not be used to estimate the actual ending account balance or expenses you paid for the period. You may use this information to compare the ongoing costs of investing in the fund and other funds. To do so, compare this 5% hypothetical example with the 5% hypothetical examples that appear in the shareholder reports of the other funds.
Please note that the expenses shown in the table are meant to highlight your ongoing costs only and do not reflect any transactional costs, such as sales charges (loads). Therefore, the second line of the table for each class is useful in comparing ongoing costs only, and will not help you determine the relative total costs of owning different funds. In addition, if these transactional costs were included, your costs would have been higher.
Expense Examples
| | | | | | | | | | | | | |
| | | | | | | Expenses Paid During | |
| | | Beginning Account | | | Ending Account | | | Period1 (5/01/06 to | |
| | | Value (5/01/06) | | | Value (10/31/06) | | | 10/31/06) | |
Class A Actual2,3 | | $ | 1,000.00 | | | $ | 1,019.30 | | | $ | 7.63 | |
| |
Class A Hypothetical (5% return before expenses)3 | | $ | 1,000.00 | | | $ | 1,017.64 | | | $ | 7.63 | |
| |
Class B Actual2,3 | | $ | 1,000.00 | | | $ | 1,015.60 | | | $ | 11.43 | |
| |
Class B Hypothetical (5% return before expenses)3 | | $ | 1,000.00 | | | $ | 1,013.86 | | | $ | 11.42 | |
| |
Class C Actual2,3 | | $ | 1,000.00 | | | $ | 1,015.10 | | | $ | 11.43 | |
| |
Class C Hypothetical (5% return before expenses)3 | | $ | 1,000.00 | | | $ | 1,013.86 | | | $ | 11.42 | |
| |
Class R Actual2,3 | | $ | 1,000.00 | | | $ | 1,017.90 | | | $ | 8.90 | |
| |
Class R Hypothetical (5% return before expenses)3 | | $ | 1,000.00 | | | $ | 1,016.38 | | | $ | 8.89 | |
| |
Class Y Actual2,3 | | $ | 1,000.00 | | | $ | 1,020.40 | | | $ | 6.37 | |
| |
Class Y Hypothetical (5% return before expenses)3 | | $ | 1,000.00 | | | $ | 1,018.90 | | | $ | 6.36 | |
| |
| 1 | Expenses are equal to the fund’s annualized expense ratio for the most recent six-month period of 1.50%, 2.25%, 2.25%, 1.75%, and 1.25% for Class A, Class B, Class C, Class R, and Class Y, respectively, multiplied by the average account value over the period, multiplied by the number of days in the most recent fiscal half-year/365 (to reflect the one-half year period). |
| |
| 2 | Based on the actual returns for the six-month period ended October 31, 2006 of 1.93%, 1.56%, 1.51%, 1.79%, and 2.04% for Class A, Class B, Class C, Class R, and Class Y, respectively. |
| |
| 3 | Prior to July 1, 2006, the contractual limitation on annual expenses was 1.52%, 2.27%, 2.27%, 1.77%, and 1.27% for Class A, Class B, Class C, Class R, and Class Y, respectively. Effective July 1, 2006, the contractual limitation on annual expenses for Class A, Class B, Class C, Class R, and Class Y has been decreased to 1.49%, 2.24%, 2.24%, 1.74%, and 1.24%, respectively. If this new limitation had been in place during the entire period, actual and hypothetical ending account balances would have been approximately $1,019.35 and $1,017.69 for Class A, $1,015.65 and $1,013.91 for Class B, $1,015.15 and $1,013.91 for Class C, $1,017.95 and $1,016.43 for Class R, and $1,020.45 and $1,018.95 for Class Y. Actual and hypothetical expenses paid during the period would have been approximately $7.58 and $7.58 for Class A, $11.38 and $11.37 for Class B, $11.38 and $11.37 for Class C, $8.85 and $8.84 for Class R, and $6.31 and $6.31 for Class Y. |
First American Funds Annual Report 2006 7
Small Cap Growth Opportunities fund
Investment Objective: growth of capital
How did the fund perform for the fiscal year ended October 31, 2006?
The First American Small Cap Growth Opportunities Fund (the “fund”), Class Y shares, returned 10.16% for the fiscal year ended October 31, 2006 (Class A shares returned 9.91% without taking the sales charge into account). By comparison, the fund’s benchmark, the Russell 2000 Growth Index*, returned 17.07% for the same period.
What were the general economic and market conditions during the fiscal year?
Economic growth slowed from very strong levels through the first quarter of 2006 to below-potential levels by the end of October. Inflation pressures rose through much of this period in a lagging response to the very strong growth through the first portion of this year, but diminished considerably by October. The Federal Reserve (“Fed”) continued to tighten monetary policy through June as a result of the increase in inflation pressures, but has kept policy steady since that time as its forecast of slowing economic growth and dissipating inflation pressures has been realized. Corporate profit growth remained strong over this 12-month period with third-quarter 2006 earnings of S&P 500 companies advancing by roughly 20% on a year-over-year basis. The strength in corporate earnings, along with lessening inflation pressures and expectations that the Fed will begin easing monetary policy in 2007, has proved to be favorable for the equity markets through October 2006.
What worked for the fund and why?
Technology was the largest positive contributor to the fund’s performance, due both to stock selection and an overweight position in the sector (it is the largest overweight in the portfolio). Among our individual stock selections, Polycom, Inc., maker of videoconferencing and speakerphone systems, generated the largest positive contribution to the fund. Kanbay International, an India-based IT offshoring company, executed its business plan of incorporating the high-end consulting firm Adjoined Consulting, Inc., and ultimately chose to sell the firm to Cap Gemini at a significant premium in October, contributing positively to the fund’s performance. Finally, slot-machine maker WMS Industries, Inc. performed well with new states allowing gaming, thus increasing demand for their product.
What did not work for the fund and why?
During the first half of calendar 2006 the fund performed poorly. Upon detailed review, we concluded that the holdings which detracted the most from performance generally had smaller capitalization levels and relatively low trading volumes. The energy sector was the poorest performer on a relative basis, mostly due to adverse stock selection, as most of our picks in the sector shared the characteristics outlined above. The shares of Ember Resources Company, a natural gas and oil explorer and producer, suffered as natural gas prices fell throughout the fiscal year. In the consumer discretionary sector, weaker results from Cosí, a restaurant chain, and from Kuhlman, a retailer, also detracted from the fund’s performance.
What strategic moves were made by the fund and why?
As a result of our midyear analysis of underperforming holdings, we refined our investment process to address the disappointing performance in the first half of calendar 2006. In particular, we have decreased our exposure to smaller capitalization companies and stocks with lower trading volumes. Since making these changes in June, the fund’s performance, relative to the performance of the Russell 2000 Growth Index, has improved.
| |
| * | Unlike mutual funds, index returns do not reflect any expenses, transaction costs, or cash flow effects. |
Top 10 Holdings as of October 31, 20061 (% of net assets)
| | | | | |
| First American Prime Obligations Fund, Class Z | | | 2.6 | % |
| Emulex | | | 2.6 | |
| Kanbay International | | | 2.0 | |
| Conn’s | | | 1.8 | |
| PMC-Sierra | | | 1.7 | |
| Pediatrix Medical Group | | | 1.7 | |
| Ixia | | | 1.7 | |
| Lawson Software | | | 1.6 | |
| AMETEK | | | 1.6 | |
| Texas Roadhouse, Class A | | | 1.6 | |
Sector Allocation as of October 31, 20061 (% of net assets)
| | | | | |
| Information Technology | | | 30.4 | % |
| Healthcare | | | 18.9 | |
| Consumer Discretionary | | | 15.0 | |
| Industrials | | | 14.9 | |
| Financials | | | 10.7 | |
| Energy | | | 7.7 | |
| Warrants | | | 0.1 | |
| Short-Term Investment | | | 2.6 | |
Other Assets and Liabilities, Net2 | | | (0.3 | ) |
| | | | |
| | | | 100.0 | % |
| |
| 1 | Fund holdings and sector allocations are subject to change at any time and are not recommendations to buy or sell any security. |
| |
| 2 | Investments in securities typically comprise substantially all of the fund’s net assets. Other assets and liabilities include receivables for items such as income earned but not yet received and payables for items such as fund expenses incurred but not yet paid. |
8 First American Funds Annual Report 2006
Small Cap Growth Opportunities fund continued
Annual Performance1
| | | | | | | | | | | | | | | | | | | | | | | | | | | | | | | | | | | | | | | | | | | | | | | | | |
| | | October 31, 2006 | | | September 30, 2006* | |
| | | | | | | |
| | | | | Since Inception | | | | | Since Inception | |
| | | | | | | | | | | |
| | | 1 year | | | 5 years | | | 10 years | | | 3/1/1999 | | | 12/11/2000 | | | 9/24/2001 | | | 1 year | | | 5 years | | | 10 years | | | 3/1/1999 | | | 12/11/2000 | | | 9/24/2001 | |
| Average annual return with sales charge (POP) |
| Class A | | | 3.85% | | | | 7.76% | | | | 15.52% | | | | — | | | | — | | | | — | | | | (6.64)% | | | | 8.49% | | | | 14.74% | | | | — | | | | — | | | | — | |
| |
| Class B | | | 4.64% | | | | 7.88% | | | | — | | | | 18.78% | | | | — | | | | — | | | | (5.89)% | | | | 8.62% | | | | — | | | | 18.00% | | | | — | | | | — | |
| |
| Class C | | | 8.23% | | | | 8.19% | | | | — | | | | — | | | | — | | | | 10.85% | | | | (2.78)% | | | | 8.91% | | | | — | | | | — | | | | — | | | | 9.61% | |
| Average annual return without sales charge (NAV) |
| Class A | | | 9.91% | | | | 8.99% | | | | 16.18% | | | | — | | | | — | | | | — | | | | (1.22)% | | | | 9.72% | | | | 15.39% | | | | — | | | | — | | | | — | |
| |
| Class B | | | 9.03% | | | | 8.17% | | | | — | | | | 18.78% | | | | — | | | | — | | | | (1.94)% | | | | 8.91% | | | | — | | | | 18.00% | | | | — | | | | — | |
| |
| Class C | | | 9.11% | | | | 8.19% | | | | — | | | | — | | | | — | | | | 10.85% | | | | (1.98)% | | | | 8.91% | | | | — | | | | — | | | | — | | | | 9.61% | |
| |
| Class R | | | 9.62% | | | | 8.89% | | | | — | | | | — | | | | 6.23% | | | | — | | | | (1.51)% | | | | 9.63% | | | | — | | | | — | | | | 5.13% | | | | — | |
| |
| Class Y | | | 10.16% | | | | 9.24% | | | | 16.47% | | | | — | | | | — | | | | — | | | | (1.01)% | | | | 9.98% | | | | 15.68% | | | | — | | | | — | | | | — | |
| |
Russell 2000 Growth Index2 | | | 17.07% | | | | 9.51% | | | | 5.15% | | | | 4.89% | | | | 2.65% | | | | 11.73% | | | | 5.88% | | | | 10.15% | | | | 4.03% | | | | 4.08% | | | | 1.59% | | | | 10.55% | |
Value of $10,000 Investment1,3 as of October 31, 2006
The chart above illustrates the total value of an assumed $10,000 investment in the fund’s Class A and Class Y shares (from 10/31/1996 to 10/31/2006) as compared to the Russell 2000 Growth Index2.
| |
| The performance data quoted on this page represents past performance and does not guarantee future results. The investment return and principal value of an investment will fluctuate so that an investor’s shares, when redeemed, may be worth more or less than their original cost. Current performance of the fund may be lower or higher than the performance data quoted. Performance data current to the most recent month-end may be obtained by calling 800.677.FUND. |
| |
| * | This table represents average annual total returns through the latest calendar quarter – rather than through the end of the fiscal period. |
| |
| 1 | Performance does not reflect the deduction of taxes that a shareholder would pay on fund distributions or redemption of fund shares. In certain years and/or for certain classes, performance reflects voluntary fee waivers in effect. In the absence of such fee waivers, total returns would be reduced. Index performance is for illustrative purposes only and does not reflect any expenses, transaction costs, or cash flow effects. Direct investment in the index is not available. |
| |
| Stocks of small-capitalization companies involve substantial risk. These stocks historically have experienced greater price volatility than stocks of larger companies, and they may be expected to do so in the future. |
| |
| Total returns at net asset value (“NAV”) reflect performance over the time period indicated without including the fund’s maximum sales charge and assume reinvestment of all distributions at NAV. |
| |
| Total returns at public offering price (“POP”) reflect performance over the time period indicated including maximum sales charges of 5.50% for Class A shares and the contingent deferred sales charge (“CDSC”) for Class B and Class C shares for the relevant period. Maximum CDSC is 5.00% for Class B shares in the first year, decreasing annually to 0% in the seventh year following purchase, and 1.00% for Class C shares. Total returns assume reinvestment of all distributions at NAV. |
| |
| On December 12, 2002 the fund changed its main investment strategy such that it was permitted to invest in securities of companies with market capitalizations within the range of companies in the Russell 2000 index. Previously, the fund invested primarily in companies with market capitalizations below $500 million at the time of purchase. |
| |
| On September 24, 2001, the First American Small Cap Growth Opportunities Fund became the successor by merger to the Firstar MicroCap Fund, a series of Firstar Funds, Inc. Prior to the merger, the First American Fund had no assets or liabilities. Performance presented prior to September 24, 2001, represents that of the Firstar MicroCap Fund. |
| |
| The First American Small Cap Growth Opportunities Fund’s 1999 returns were higher due in substantial part to its strategy of investing in IPOs in a period favorable for IPO investing. Of course, such favorable returns involve accepting the risk of volatility, and there is no assurance that the fund’s future investment in IPOs will have the same effect on performance as it did in 1999. |
| |
| 2 | An unmanaged index that measures the performance of those companies in the Russell 2000 Index (a small-cap index) with higher price-to-book ratios and higher forecasted growth values. |
| |
| 3 | Performance for Class B, Class C, and Class R shares is not presented. Performance for these classes will vary due to the different expense structures. |
First American Funds Annual Report 2006 9
Small Cap Growth Opportunities fund continued
Expense Example
As a shareholder of the Small Cap Growth Opportunities Fund (the “fund”), you incur two types of costs: (1) transaction costs, including sales charges (loads) on purchase payments; and (2) ongoing costs, including investment advisory fees, distribution and/or service (12b-1) fees, and other fund expenses. This example is intended to help you understand your ongoing costs (in dollars) of investing in the fund and to compare these costs with the ongoing costs of investing in other mutual funds. The example is based on an investment of $1,000 invested at the beginning of the period and held for the entire period from May 1, 2006, to October 31, 2006.
Actual Expenses
For each class, the first line of the table below provides information about actual account values and actual expenses. You may use the information in this line, together with the amount you invested, to estimate the expenses that you paid over the period. Simply divide your account value by $1,000 (for example, an $8,600 account value divided by $1,000 = 8.6), then multiply the result by the number in the first line under the heading entitled “Expenses Paid During Period” to estimate the expenses you paid on your account during this period.
Hypothetical Example for Comparison Purposes
For each class, the second line of the table below provides information about hypothetical account values and hypothetical expenses based on the fund’s actual expense ratio and an assumed rate of return of 5% per year before expenses, which is not the fund’s actual return. The hypothetical account values and expenses may not be used to estimate the actual ending account balance or expenses you paid for the period. You may use this information to compare the ongoing costs of investing in the fund and other funds. To do so, compare this 5% hypothetical example with the 5% hypothetical examples that appear in the shareholder reports of the other funds.
Please note that the expenses shown in the table are meant to highlight your ongoing costs only and do not reflect any transactional costs, such as sales charges (loads). Therefore, the second line of the table for each class is useful in comparing ongoing costs only, and will not help you determine the relative total costs of owning different funds. In addition, if these transactional costs were included, your costs would have been higher.
Expense Examples
| | | | | | | | | | | | | |
| | | | | | | Expenses Paid During |
| | | Beginning Account | | Ending Account | | Period1 (5/01/06 to |
| | | Value (5/01/06) | | Value (10/31/06) | | 10/31/06) |
Class A Actual2 | | $ | 1,000.00 | | | $ | 933.50 | | | $ | 7.16 | |
| |
| Class A Hypothetical (5% return before expenses) | | $ | 1,000.00 | | | $ | 1,017.80 | | | $ | 7.48 | |
| |
Class B Actual2 | | $ | 1,000.00 | | | $ | 929.60 | | | $ | 10.80 | |
| |
| Class B Hypothetical (5% return before expenses) | | $ | 1,000.00 | | | $ | 1,014.01 | | | $ | 11.27 | |
| |
Class C Actual2 | | $ | 1,000.00 | | | $ | 930.00 | | | $ | 10.80 | |
| |
| Class C Hypothetical (5% return before expenses) | | $ | 1,000.00 | | | $ | 1,014.01 | | | $ | 11.27 | |
| |
Class R Actual2 | | $ | 1,000.00 | | | $ | 932.30 | | | $ | 8.38 | |
| |
| Class R Hypothetical (5% return before expenses) | | $ | 1,000.00 | | | $ | 1,016.53 | | | $ | 8.74 | |
| |
Class Y Actual2 | | $ | 1,000.00 | | | $ | 934.80 | | | $ | 5.95 | |
| |
| Class Y Hypothetical (5% return before expenses) | | $ | 1,000.00 | | | $ | 1,019.06 | | | $ | 6.21 | |
| |
| 1 | Expenses are equal to the fund’s annualized expense ratio for the most recent six-month period of 1.47%, 2.22%, 2.22%, 1.72%, and 1.22% for Class A, Class B, Class C, Class R, and Class Y, respectively, multiplied by the average account value over the period, multiplied by the number of days in the most recent fiscal half-year/365 (to reflect the one-half year period). |
| |
| 2 | Based on the actual returns for the six-month period ended October 31, 2006 of -6.65%, -7.04%, -7.00%, -6.77%, and -6.52% for Class A, Class B, Class C, Class R, and Class Y, respectively. |
10 First American Funds Annual Report 2006
Small Cap Select fund
Investment Objective: capital appreciation
How did the fund perform for the fiscal year ended October 31, 2006?
The First American Small Cap Select Fund (the “fund”), Class Y shares, returned 22.81% for the fiscal year ended October 31, 2006 (Class A shares returned 22.46% without taking the sales charge into account). By comparison, the fund’s benchmark, the Russell 2000 Index*, returned 19.98% for the same period.
What were the general economic and market conditions during the fiscal year?
Economic growth slowed from very strong levels through the first quarter of 2006 to below-potential levels by the end of October. Inflation pressures rose through much of this period in a lagging response to the very strong growth through the first portion of this year, but diminished considerably by October. The Federal Reserve (“Fed”) continued to tighten monetary policy through June as a result of the increase in inflation pressures, but has kept policy steady since that time as its forecast of slowing economic growth and dissipating inflation pressures has been realized. Corporate profit growth remained strong over this 12-month period with third-quarter 2006 earnings of S&P 500 companies advancing by roughly 20% on a year-over-year basis. The strength in corporate earnings, along with lessening inflation pressures and expectations that the Fed will begin easing monetary policy in 2007, has proved to be favorable for the equity markets through October 2006.
What worked for the fund and why?
Good stock selection was the driver of fund performance relative to its index for the fiscal year. The consumer sector proved to be our top-performing area, where two holdings – hotel chain LaQuinta and pet food supplier PETCO – were both acquired by private equity, right on our price targets. Clothing retailers The Children’s Place and Christopher & Banks were in the midst of successfully executed turnarounds, which had a positive effect on their stock. In software, Digital River, with a lock on online software distribution business, performed very well. Another standout was M-systems, a manufacturer of flash memory cards, because of its acquisition by Sandisk. Favorable aluminum pricing boosted the results of Century Aluminum in the materials sector, while in industrials Manitowoc and Terex, manufacturers of construction equipment, benefited from the strong demand for their products in the commercial construction market. In financials, SL Green Realty, a real estate investment trust (“REIT”) specializing in downtown New York City office property, owed its positive performance to the very strong market, with higher rents and lower vacancy rates.
What did not work for the fund and why?
Healthcare proved to be the toughest sector for the fund during this fiscal period, largely because of adverse stock selection in the biotechnology area. The biggest disappointment came from Neurocrine Biosciences, whose shares suffered considerably after an FDA approval for the company’s new sleep drug was delayed.
What strategic moves were made by the fund and why?
Relative to the index, the fund keeps its sector weights fairly neutral, allowing stock selection to drive portfolio performance. We trimmed our holdings in SL Green Realty, as the stock reached our price target. For the same reason we considerably reduced our large overweight in industrials. In the ailing healthcare sector, we eliminated our holdings in Sierra Health Inc., a provider of healthcare services in the Las Vegas market. We continued to execute our strategy of owning companies that show good and/or improving fundamentals, reasonable valuations, and identifiable catalysts that are likely to outperform within their respective sectors.
| |
| * | Unlike mutual funds, index returns do not reflect any expenses, transaction costs, or cash flow effects. |
Top 10 Holdings as of October 31, 20061 (% of net assets)
| | | | | |
| First American Prime Obligations Fund, Class Z | | | 3.2 | % |
| Nautilus Group | | | 2.1 | |
| Pediatrix Medical Group | | | 2.0 | |
| Entegris | | | 1.9 | |
| BISYS Group | | | 1.8 | |
| Nutri/ System | | | 1.5 | |
| Affiliated Managers Group | | | 1.5 | |
| AMETEK | | | 1.5 | |
| Magellan Health Services | | | 1.4 | |
| Lennox International | | | 1.4 | |
Sector Allocation as of October 31, 20061 (% of net assets)
| | | | | |
| Information Technology | | | 19.6 | % |
| Financials | | | 18.7 | |
| Consumer Discretionary | | | 15.6 | |
| Industrials | | | 15.1 | |
| Healthcare | | | 13.9 | |
| Energy | | | 5.4 | |
| Consumer Staples | | | 3.5 | |
| Materials | | | 3.3 | |
| Telecommunication Services | | | 0.7 | |
| Utilities | | | 0.5 | |
| Short-Term Investment | | | 3.2 | |
Other Assets & Liabilities, Net2 | | | 0.5 | |
| | | | |
| | | | 100.0 | % |
| |
| 1 | Fund holdings and sector allocations are subject to change at any time and are not recommendations to buy or sell any security. |
| |
| 2 | Investments in securities typically comprise substantially all of the fund’s net assets. Other assets and liabilities include receivables for items such as income earned but not yet received and payables for items such as fund expenses incurred but not yet paid. |
First American Funds Annual Report 2006 11
Small Cap Select fund continued
Annual Performance1
| | | | | | | | | | | | | | | | | | | | | | | | | | | | | | | | | |
| | | October 31, 2006 | | | September 30, 2006* | |
| | | | | | | |
| | | | | Since Inception | | | | | Since Inception | |
| | | | | | | | | | | |
| | | 1 year | | | 5 years | | | 10 years | | | 9/24/2001 | | | 1 year | | | 5 years | | | 10 years | | | 9/24/2001 | |
| Average annual return with sales charge (POP) | | | | | | | | | | | | | | | | | | | | | | | | |
| Class A | | | 15.74% | | | | 13.63% | | | | 11.18% | | | | — | | | | 7.99% | | | | 14.70% | | | | 10.61% | | | | — | |
| |
| Class B | | | 16.85% | | | | 13.84% | | | | 11.02% | | | | — | | | | 9.05% | | | | 14.93% | | | | 10.45% | | | | — | |
| |
| Class C | | | 20.67% | | | | 14.09% | | | | — | | | | 16.18% | | | | 12.49% | | | | 15.17% | | | | — | | | | 15.61% | |
| Average annual return without sales charge (NAV) | | | | | | | | | | | | | | | | | | | | | | | | |
| Class A | | | 22.46% | | | | 14.92% | | | | 11.81% | | | | — | | | | 14.27% | | | | 16.01% | | | | 11.24% | | | | — | |
| |
| Class B | | | 21.59% | | | | 14.08% | | | | 11.02% | | | | — | | | | 13.48% | | | | 15.15% | | | | 10.45% | | | | — | |
| |
| Class C | | | 21.64% | | | | 14.09% | | | | — | | | | 16.18% | | | | 13.40% | | | | 15.17% | | | | — | | | | 15.61% | |
| |
| Class R | | | 22.23% | | | | 14.82% | | | | 11.79% | | | | — | | | | 13.99% | | | | 15.90% | | | | 11.21% | | | | — | |
| |
| Class Y | | | 22.81% | | | | 15.21% | | | | 12.13% | | | | — | | | | 14.58% | | | | 16.32% | | | | 11.55% | | | | — | |
| |
Russell 2000 Index 2 | | | 19.98% | | | | 13.76% | | | | 9.84% | | | | 15.38% | | | | 9.92% | | | | 13.78% | | | | 9.06% | | | | 14.38% | |
Value of $10,000 Investment1,3 as of October 31, 2006
The chart above illustrates the total value of an assumed $10,000 investment in the fund’s Class A and Class Y shares (from 11/30/1996 to 10/31/2006) as compared to the Russell 2000 Index2.
| |
| The performance data quoted on this page represents past performance and does not guarantee future results. The investment return and principal value of an investment will fluctuate so that an investor’s shares, when redeemed, may be worth more or less than their original cost. Current performance of the fund may be lower or higher than the performance data quoted. Performance data current to the most recent month-end may be obtained by calling 800.677.FUND. |
| |
| * | This table represents average annual total returns through the latest calendar quarter – rather than through the end of the fiscal period. |
| |
| 1 | Performance does not reflect the deduction of taxes that a shareholder would pay on fund distributions or redemption of fund shares. In certain years and/or for certain classes, performance reflects voluntary fee waivers in effect. In the absence of such fee waivers, total returns would be reduced. Index performance is for illustrative purposes only and does not reflect any expenses, transaction costs, or cash flow effects. Direct investment in the index is not available. |
| |
| Stocks of small-capitalization companies involve substantial risk. These stocks historically have experienced greater price volatility than stocks of larger companies, and they may be expected to do so in the future. |
| |
| Total returns at net asset value (“NAV”) reflect performance over the time period indicated without including the fund’s maximum sales charge and assume reinvestment of all distributions at NAV. |
| |
| Total returns at public offering price (“POP”) reflect performance over the time period indicated including maximum sales charges of 5.50% for Class A shares and the contingent deferred sales charge (“CDSC”) for Class B and Class C shares for the relevant period. Maximum CDSC is 5.00% for Class B shares in the first year, decreasing annually to 0% in the seventh year following purchase, and 1.00% for Class C shares. Total returns assume reinvestment of all distributions at NAV. |
| |
| On September 24, 2001, the First American Small Cap Select Fund became the successor by merger to the Firstar SmallCap Core Equity Fund, a series of Firstar Funds, Inc. Prior to the merger, the First American Fund had no assets or liabilities. Performance presented prior to September 24, 2001, represents that of the Firstar SmallCap Core Equity Fund. The Firstar SmallCap Core Equity Fund was organized on November 27, 2000, and prior to that, was a separate series of Mercantile Funds, Inc. |
| |
| 2 | An unmanaged small-cap index that measures the performance of the 2,000 smallest companies in the Russell 3000 Index. |
| |
| 3 | Performance for Class B, Class C, and Class R shares is not presented. Performance for these classes will vary due to the different expense structures. |
12 First American Funds Annual Report 2006
Small Cap Select fund continued
Expense Example
As a shareholder of the Small Cap Select Fund (the “fund”), you incur two types of costs: (1) transaction costs, including sales charges (loads) on purchase payments; and (2) ongoing costs, including investment advisory fees, distribution and/or service (12b-1) fees, and other fund expenses. This example is intended to help you understand your ongoing costs (in dollars) of investing in the fund and to compare these costs with the ongoing costs of investing in other mutual funds. The example is based on an investment of $1,000 invested at the beginning of the period and held for the entire period from May 1, 2006, to October 31, 2006.
Actual Expenses
For each class, the first line of the table below provides information about actual account values and actual expenses. You may use the information in this line, together with the amount you invested, to estimate the expenses that you paid over the period. Simply divide your account value by $1,000 (for example, an $8,600 account value divided by $1,000 = 8.6), then multiply the result by the number in the first line under the heading entitled “Expenses Paid During Period” to estimate the expenses you paid on your account during this period.
Hypothetical Example for Comparison Purposes
For each class, the second line of the table below provides information about hypothetical account values and hypothetical expenses based on the fund’s actual expense ratio and an assumed rate of return of 5% per year before expenses, which is not the fund’s actual return. The hypothetical account values and expenses may not be used to estimate the actual ending account balance or expenses you paid for the period. You may use this information to compare the ongoing costs of investing in the fund and other funds. To do so, compare this 5% hypothetical example with the 5% hypothetical examples that appear in the shareholder reports of the other funds.
Please note that the expenses shown in the table are meant to highlight your ongoing costs only and do not reflect any transactional costs, such as sales charges (loads). Therefore, the second line of the table for each class is useful in comparing ongoing costs only, and will not help you determine the relative total costs of owning different funds. In addition, if these transactional costs were included, your costs would have been higher.
Expense Examples
| | | | | | | | | | | | | |
| | | | | | | Expenses Paid During | |
| | | Beginning Account | | | Ending Account | | | Period1 (5/01/06 to | |
| | | Value (5/01/06) | | | Value (10/31/06) | | | 10/31/06) | |
Class A Actual2 | | $ | 1,000.00 | | | $ | 999.30 | | | $ | 6.25 | |
| |
| Class A Hypothetical (5% return before expenses) | | $ | 1,000.00 | | | $ | 1,018.95 | | | $ | 6.31 | |
| |
Class B Actual2 | | $ | 1,000.00 | | | $ | 996.10 | | | $ | 10.01 | |
| |
| Class B Hypothetical (5% return before expenses) | | $ | 1,000.00 | | | $ | 1,015.17 | | | $ | 10.11 | |
| |
Class C Actual2 | | $ | 1,000.00 | | | $ | 996.50 | | | $ | 10.01 | |
| |
| Class C Hypothetical (5% return before expenses) | | $ | 1,000.00 | | | $ | 1,015.17 | | | $ | 10.11 | |
| |
Class R Actual2 | | $ | 1,000.00 | | | $ | 998.70 | | | $ | 7.51 | |
| |
| Class R Hypothetical (5% return before expenses) | | $ | 1,000.00 | | | $ | 1,017.69 | | | $ | 7.58 | |
| |
Class Y Actual2 | | $ | 1,000.00 | | | $ | 1,001.20 | | | $ | 4.99 | |
| |
| Class Y Hypothetical (5% return before expenses) | | $ | 1,000.00 | | | $ | 1,020.21 | | | $ | 5.04 | |
| |
| 1 | Expenses are equal to the fund’s annualized expense ratio for the most recent six-month period of 1.24%, 1.99%, 1.99%, 1.49%, and 0.99% for Class A, Class B, Class C, Class R, and Class Y, respectively, multiplied by the average account value over the period, multiplied by the number of days in the most recent fiscal half-year/365 (to reflect the one-half year period). |
| |
| 2 | Based on the actual returns for the six-month period ended October 31, 2006 of -0.07%, -0.39%, -0.35%, -0.13%, and 0.12% for Class A, Class B, Class C, Class R, and Class Y, respectively. |
First American Funds Annual Report 2006 13
Small Cap Value fund
Investment Objective: capital appreciation
How did the Fund perform for the fiscal year ended October 31, 2006?
The First American Small Cap Value Fund (the “fund”), Class Y shares, returned 21.01% for the fiscal year ended October 31, 2006 (Class A shares returned 20.78% without taking the sales charge into account). By comparison, the fund’s benchmark, the Russell 2000 Value Index*, returned 22.90% for the same period.
What were the general economic and market conditions during the fiscal year?
Economic growth slowed from very strong levels through the first quarter of 2006 to below-potential levels by the end of October. Inflation pressures rose through much of this period in a lagging response to the very strong growth through the first portion of this year, but diminished considerably by October. The Federal Reserve (“Fed”) continued to tighten monetary policy through June as a result of the increase in inflation pressures, but has kept policy steady since that time as its forecast of slowing economic growth and dissipating inflation pressures has been realized. Corporate profit growth remained strong over this 12-month period with third-quarter 2006 earnings of S&P 500 companies advancing by roughly 20% on a year-over-year basis. The strength in corporate earnings, along with lessening inflation pressures and expectations that the Fed will begin easing monetary policy in 2007, has proved to be favorable for the equity markets through October 2006.
What worked for the fund and why?
Good stock selection was key to the fund’s performance during this fiscal year. The consumer area proved to be beneficial as good stock selection – with standouts including Interface (commercial carpet and tile products) and clothing retailers Aéropostale and Men’s Warehouse – helped relative performance results. The fund held five stocks of companies that were acquired at strong premiums during the fiscal year: CNS, Inc. (health and personal care products), Hughes Supply (wholesale materials distributor), PETCO (pet food supplier), LaQuinta (hotel chain), and Thomas Nelson, Inc. (book publisher). In addition, two strong performers in the technology sector contributed favorably to the fund’s results: Polycom, Inc. (videoconferencing and speakerphone systems) and Xyratex (storage device and hard disk drive manufacturer).
What did not work for the fund and why?
Holding a larger portion of lower-volatility stocks at a time when the market proved quite favorable for more volatile, momentum-driven stocks detracted from relative performance results. For example, highly leveraged telecommunications stocks which were not in the fund’s portfolio experienced strong price performance despite their unattractive valuations. On a one-off basis, the Bisys Group, Inc., a provider of business process outsourcing solutions and a top-10 holding, experienced a significant decline in stock price following a voluntary CEO change and a subsequent delay in releasing financial statements.
What strategic moves were made by the fund and why?
We maintained an overweight in healthcare, believing that demographics, specifically the increasing pool of retiring baby boomers and their attendant healthcare needs, and valuations in the sector provide opportunities. Within industrials, we reduced our exposure to residential building stocks given the rapidly cooling residential housing market, but we remained focused on office and infrastructure segments of the sector. We continue to be underweight in financials due to concerns regarding the impact of a flat-to-inverted bond yield curve on bottom line results and valuation opportunities. The fund team remains focused on free cash flow** metrics coupled with good risk/reward tradeoffs.
| |
| * | Unlike mutual funds, index returns do not reflect any expenses, transaction costs, or cash flow effects. |
| ** | Free cash flow is a measure of financial performance calculated as operating cash flow minus capital expenditures. |
Top 10 Holdings as of October 31, 20061 (% of net assets)
| | | | | |
| First American Prime Obligations Fund, Class Z | | | 4.4 | % |
| Interface, Class A | | | 1.5 | |
| Newcastle Investment | | | 1.4 | |
| Perrigo | | | 1.4 | |
| BISYS Group | | | 1.4 | |
| Texas Industries | | | 1.3 | |
| Aéropostale | | | 1.3 | |
| First Midwest Bancorp | | | 1.3 | |
| Varian | | | 1.3 | |
| El Paso Electric | | | 1.3 | |
Sector Allocation as of October 31, 20061 (% of net assets)
| | | | | |
| Financials | | | 32.2 | % |
| Consumer Discretionary | | | 13.8 | |
| Information Technology | | | 13.1 | |
| Industrials | | | 12.9 | |
| Healthcare | | | 7.1 | |
| Materials | | | 5.5 | |
| Energy | | | 4.9 | |
| Utilities | | | 4.5 | |
| Consumer Staples | | | 2.0 | |
| Telecommunication Services | | | 0.9 | |
| Short-Term Investment | | | 4.4 | |
Other Assets and Liabilities, Net2 | | | (1.3 | ) |
| | | | |
| | | | 100.0 | % |
| |
| 1 | Fund holdings and sector allocations are subject to change at any time and are not recommendations to buy or sell any security. |
| |
| 2 | Investments in securities typically comprise substantially all of the fund’s net assets. Other assets and liabilities include receivables for items such as income earned but not yet received and payables for items such as fund expenses incurred but not yet paid. |
14 First American Funds Annual Report 2006
Small Cap Value fund continued
Annual Performance1
| | | | | | | | | | | | | | | | | | | | | | | | | | | | | | | | | | | | | | | | | | | | | | | | | |
| | | October 31, 2006 | | | September 30, 2006* | |
| | | | | | | |
| | | | | Since Inception | | | | | Since Inception | |
| | | | | | | | | | | |
| | | 1 year | | | 5 years | | | 10 years | | | 11/24/1997 | | | 2/1/1999 | | | 9/24/2001 | | | 1 year | | | 5 years | | | 10 years | | | 11/24/1997 | | | 2/1/1999 | | | 9/24/2001 | |
| Average annual return with sales charge (POP) |
| Class A | | | 14.14% | | | | 13.96% | | | | 10.24% | | | | — | | | | — | | | | — | | | | 6.14% | | | | 13.55% | | | | 9.86% | | | | — | | | | — | | | | — | |
| |
| Class B | | | 15.29% | | | | 14.17% | | | | — | | | | 8.16% | | | | — | | | | — | | | | 7.20% | | | | 13.74% | | | | — | | | | 7.69% | | | | — | | | | — | |
| |
| Class C | | | 18.97% | | | | 14.40% | | | | — | | | | — | | | | 11.68% | | | | — | | | | 10.59% | | | | 13.98% | | | | — | | | | — | | | | 11.16% | | | | — | |
| Average annual return without sales charge (NAV) |
| Class A | | | 20.78% | | | | 15.25% | | | | 10.87% | | | | — | | | | — | | | | — | | | | 12.34% | | | | 14.84% | | | | 10.49% | | | | — | | | | — | | | | — | |
| |
| Class B | | | 19.88% | | | | 14.41% | | | | — | | | | 8.16% | | | | — | | | | — | | | | 11.46% | | | | 13.97% | | | | — | | | | 7.69% | | | | — | | | | — | |
| |
| Class C | | | 19.89% | | | | 14.40% | | | | — | | | | — | | | | 11.68% | | | | — | | | | 11.45% | | | | 13.98% | | | | — | | | | — | | | | 11.16% | | | | — | |
| |
| Class R | | | 20.44% | | | | 15.12% | | | | — | | | | — | | | | — | | | | 16.40% | | | | 12.05% | | | | 14.73% | | | | — | | | | — | | | | — | | | | 15.66% | |
| |
| Class Y | | | 21.01% | | | | 15.54% | | | | 11.13% | | | | — | | | | — | | | | — | | | | 12.64% | | | | 15.15% | | | | 10.76% | | | | — | | | | — | | | | — | |
| |
Russell 2000 Value Index2 | | | 22.90% | | | | 17.52% | | | | 13.81% | | | | 11.52% | | | | 14.20% | | | | 18.57% | | | | 14.01% | | | | 16.96% | | | | 13.38% | | | | 11.01% | | | | 13.63% | | | | 17.74% | |
Value of $10,000 Investment1,3 as of October 31, 2006
The chart above illustrates the total value of an assumed $10,000 investment in the fund’s Class A and Class Y shares (from 9/30/1996 to 10/31/2006) as compared to the Russell 2000 Value Index2.
| |
| The performance data quoted on this page represents past performance and does not guarantee future results. The investment return and principal value of an investment will fluctuate so that an investor’s shares, when redeemed, may be worth more or less than their original cost. Current performance of the fund may be lower or higher than the performance data quoted. Performance data current to the most recent month-end may be obtained by calling 800.677.FUND. |
| |
| * | This table represents average annual total returns through the latest calendar quarter – rather than through the end of the fiscal period. |
| |
| 1 | Performance does not reflect the deduction of taxes that a shareholder would pay on fund distributions or redemption of fund shares. In certain years and/or for certain classes, performance reflects voluntary fee waivers in effect. In the absence of such fee waivers, total returns would be reduced. Index performance is for illustrative purposes only and does not reflect any expenses, transaction costs, or cash flow effects. Direct investment in the index is not available. |
| |
| Stocks of small-capitalization companies involve substantial risk. These stocks historically have experienced greater price volatility than stocks of larger companies, and they may be expected to do so in the future. Total returns at net asset value (“NAV”) reflect performance over the time period indicated without including the fund’s maximum sales charge and assume reinvestment of all distributions at NAV. |
| |
| Total returns at public offering price (“POP”) reflect performance over the time period indicated including maximum sales charges of 5.50% for Class A shares and the contingent deferred sales charge (“CDSC”) for Class B and Class C shares for the relevant period. Maximum CDSC is 5.00% for Class B shares in the first year, decreasing annually to 0% in the seventh year following purchase, and 1.00% for Class C shares. Total returns assume reinvestment of all distributions at NAV. |
| |
| 2 | An unmanaged index that measures the performance of those companies in the Russell 2000 Index (a small-cap index) with lower price-to-book ratios and lower forecasted growth values. |
| |
| 3 | Performance for Class B, Class C, and Class R shares is not presented. Performance for these classes will vary due to the different expense structures. |
First American Funds Annual Report 2006 15
Small Cap Value fund continued
Expense Example
As a shareholder of the Small Cap Value Fund (the “fund”), you incur two types of costs: (1) transaction costs, including sales charges (loads) on purchase payments; and (2) ongoing costs, including investment advisory fees, distribution and/or service (12b-1) fees, and other fund expenses. This example is intended to help you understand your ongoing costs (in dollars) of investing in the fund and to compare these costs with the ongoing costs of investing in other mutual funds. The example is based on an investment of $1,000 invested at the beginning of the period and held for the entire period from May 1, 2006, to October 31, 2006.
Actual Expenses
For each class, the first line of the table below provides information about actual account values and actual expenses. You may use the information in this line, together with the amount you invested, to estimate the expenses that you paid over the period. Simply divide your account value by $1,000 (for example, an $8,600 account value divided by $1,000 = 8.6), then multiply the result by the number in the first line under the heading entitled “Expenses Paid During Period” to estimate the expenses you paid on your account during this period.
Hypothetical Example for Comparison Purposes
For each class, the second line of the table below provides information about hypothetical account values and hypothetical expenses based on the fund’s actual expense ratio and an assumed rate of return of 5% per year before expenses, which is not the fund’s actual return. The hypothetical account values and expenses may not be used to estimate the actual ending account balance or expenses you paid for the period. You may use this information to compare the ongoing costs of investing in the fund and other funds. To do so, compare this 5% hypothetical example with the 5% hypothetical examples that appear in the shareholder reports of the other funds.
Please note that the expenses shown in the table are meant to highlight your ongoing costs only and do not reflect any transactional costs, such as sales charges (loads). Therefore, the second line of the table for each class is useful in comparing ongoing costs only, and will not help you determine the relative total costs of owning different funds. In addition, if these transactional costs were included, your costs would have been higher.
Expense Examples
| | | | | | | | | | | | | |
| | | | | | | Expenses Paid During | |
| | | Beginning Account | | | Ending Account | | | Period1 (5/01/06 to | |
| | | Value (5/01/06) | | | Value (10/31/06) | | | 10/31/06) | |
Class A Actual2 | | $ | 1,000.00 | | | $ | 1,023.30 | | | $ | 6.48 | |
| |
| Class A Hypothetical (5% return before expenses) | | $ | 1,000.00 | | | $ | 1,018.80 | | | $ | 6.46 | |
| |
Class B Actual2 | | $ | 1,000.00 | | | $ | 1,019.80 | | | $ | 10.28 | |
| |
| Class B Hypothetical (5% return before expenses) | | $ | 1,000.00 | | | $ | 1,015.02 | | | $ | 10.26 | |
| |
Class C Actual2 | | $ | 1,000.00 | | | $ | 1,019.40 | | | $ | 10.28 | |
| |
| Class C Hypothetical (5% return before expenses) | | $ | 1,000.00 | | | $ | 1,015.02 | | | $ | 10.26 | |
| |
Class R Actual2 | | $ | 1,000.00 | | | $ | 1,022.10 | | | $ | 7.75 | |
| |
| Class R Hypothetical (5% return before expenses) | | $ | 1,000.00 | | | $ | 1,017.54 | | | $ | 7.73 | |
| |
Class Y Actual2 | | $ | 1,000.00 | | | $ | 1,024.10 | | | $ | 5.20 | |
| |
| Class Y Hypothetical (5% return before expenses) | | $ | 1,000.00 | | | $ | 1,020.06 | | | $ | 5.19 | |
| |
| 1 | Expenses are equal to the fund’s annualized expense ratio for the most recent six-month period of 1.27%, 2.02%, 2.02%, 1.52%, and 1.02% for Class A, Class B, Class C, Class R, and Class Y, respectively, multiplied by the average account value over the period, multiplied by the number of days in the most recent fiscal half-year/365 (to reflect the one-half year period). |
| |
| 2 | Based on the actual returns for the six-month period ended October 31, 2006 of 2.33%, 1.98%, 1.94%, 2.21%, and 2.41% for Class A, Class B, Class C, Class R, and Class Y, respectively. |
16 First American Funds Annual Report 2006
Small-Mid Cap Core fund
Investment Objective: long-term growth of capital
How did the fund perform for the fiscal year ended October 31, 2006?
The First American Small-Mid Cap Core Fund (the “fund”), Class Y shares, returned 19.30% for the fiscal year ended October 31, 2006 (Class A shares returned 19.18% without taking the sales charge into account). By comparison, the fund’s benchmark, the Russell 2500 Index*, returned 17.69% for the same period.
What were the general economic and market conditions during the fiscal year?
Economic growth slowed from very strong levels through the first quarter of 2006 to below-potential levels by the end of October. Inflation pressures rose through much of this period in a lagging response to the very strong growth through the first portion of this year, but diminished considerably by October. The Federal Reserve (“Fed”) continued to tighten monetary policy through June as a result of the increase in inflation pressures, but has kept policy steady since that time as its forecast of slowing economic growth and dissipating inflation pressures has been realized. Corporate profit growth remained strong over this 12-month period with third-quarter 2006 earnings of S&P 500 companies advancing by roughly 20% on a year-over-year basis. The strength in corporate earnings, along with lessening inflation pressures and expectations that the Fed will begin easing monetary policy in 2007, has proved to be favorable for the equity markets through October 2006.
What worked for the fund and why?
Good stock selection led the fund to outperform the benchmark. Our picks in the materials sector proved particularly successful, with Steel Dynamics and Century Aluminum benefiting from high demand and pricing power generated by robust commercial construction activity. In technology, Polycom (videoconferencing and speakerphone systems) and Amphenol (connectors) enjoyed continued strong performance, while Micromuse, Inc., a provider of service and business assurance software, was acquired at strong premiums by IBM during this fiscal period. An overweight in retail, coupled with good stock selection, also added value; a standout in this space was clothing retailer Christopher & Banks, which benefited from a well-executed turnaround strategy. In financials, SL Green Realty, a real estate investment trust specializing in downtown New York City office property, owed its positive performance to the very strong market, with higher rents and lower vacancy rates. Biotech company Immucor, Inc. posted outstanding results due to its blood diagnostic systems receiving FDA approval during the fiscal period. In the energy sector, Veritas DGC, Inc., provider of integrated geophysical services to the petroleum industry, was another standout.
What did not work for the fund and why?
The largest detractor from performance was WCI Communities, Inc., a Florida builder of master-planned communities, whose performance suffered as the market became oversaturated with inventory. The fund’s overweight in healthcare services, coupled with adverse stock selection, also had a negative impact on performance.
What strategic moves were made by the fund and why?
We reduced our exposure to smaller-capitalization stocks while increasing our positions in three stocks we feel confident about: Nutri/System, Inc., provider of weight-management programs; The PMI Group, Inc., a mortgage insurer; and Emulex Corp., maker of networking equipment. The fund’s sector allocations remained largely unchanged, though we slightly trimmed our holdings in retail and steel, the latter in response to the decline in the price of steel.
| |
| * | Unlike mutual funds, index returns do not reflect any expenses, transaction costs, or cash flow effects. |
Top 10 Holdings as of October 31, 20061 (% of net assets)
| | | | | |
| Emulex | | | 2.5 | % |
| Nutri/ System | | | 2.1 | |
| Pediatrix Medical Group | | | 1.9 | |
| Interface, Class A | | | 1.9 | |
| Labor Ready | | | 1.8 | |
| Immucor | | | 1.8 | |
| Toro | | | 1.8 | |
| Commercial Metals | | | 1.8 | |
| W.R. Berkley | | | 1.8 | |
| Newcastle Investment | | | 1.8 | |
Sector Allocation as of October 31, 20061 (% of net assets)
| | | | | |
| Financials | | | 21.1 | % |
| Consumer Discretionary | | | 16.9 | |
| Information Technology | | | 16.7 | |
| Industrials | | | 16.6 | |
| Healthcare | | | 10.4 | |
| Energy | | | 6.2 | |
| Materials | | | 5.7 | |
| Utilities | | | 3.0 | |
| Consumer Staples | | | 2.2 | |
| Telecommunication Services | | | 0.7 | |
| Short-Term Investment | | | 0.4 | |
Other Assets & Liabilities, Net2 | | | 0.1 | |
| | | | |
| | | | 100.0 | % |
| |
| 1 | Fund holdings and sector allocations are subject to change at any time and are not recommendations to buy or sell any security. |
| |
| 2 | Investments in securities typically comprise substantially all of the fund’s net assets. Other assets and liabilities include receivables for items such as income earned but not yet received and payables for items such as fund expenses incurred but not yet paid. |
First American Funds Annual Report 2006 17
Small-Mid Cap Core fund continued
Annual Performance1
| | | | | | | | | | | | | | | | | | | | | | | | | | | | | | | | | |
| | | October 31, 2006 | | | September 30, 2006* | |
| | | | | | | |
| | | | | Since Inception | | | | | Since Inception | |
| | | | | | | | | | | |
| | | 1 year | | | 5 years | | | 10 years | | | 2/1/2000 | | | 1 year | | | 5 years | | | 10 years | | | 2/1/2000 | |
| Average annual return with sales charge (POP) |
| Class A | | | 12.59% | | | | 3.39% | | | | 0.02% | | | | — | | | | 4.32% | | | | 6.38% | | | | (0.84)% | | | | — | |
| |
| Class B | | | 13.13% | | | | 3.43% | | | | (0.17)% | | | | — | | | | 4.44% | | | | 6.44% | | | | (1.02)% | | | | — | |
| |
| Class C | | | 17.21% | | | | 3.78% | | | | — | | | | (19.75)% | | | | 8.41% | | | | 6.79% | | | | — | | | | (20.48)% | |
| |
| Average annual return without sales charge (NAV) |
| Class A | | | 19.18% | | | | 4.58% | | | | 0.59% | | | | — | | | | 10.35% | | | | 7.59% | | | | (0.28)% | | | | — | |
| |
| Class B | | | 18.13% | | | | 3.77% | | | | (0.17)% | | | | — | | | | 9.44% | | | | 6.75% | | | | (1.02)% | | | | — | |
| |
| Class C | | | 18.21% | | | | 3.78% | | | | — | | | | (19.75)% | | | | 9.41% | | | | 6.79% | | | | — | | | | (20.48)% | |
| |
| Class Y | | | 19.30% | | | | 4.83% | | | | 0.86% | | | | — | | | | 10.54% | | | | 7.88% | | | | 0.00% | | | | — | |
| |
Russell 2500 Index 2 | | | 17.69% | | | | 14.36% | | | | 11.53% | | | | 9.27% | | | | 8.80% | | | | 14.44% | | | | 10.93% | | | | 8.63% | |
Value of $10,000 Investment1,3 as of October 31, 2006
The chart above illustrates the total value of an assumed $10,000 investment in the fund’s Class A and Class Y shares (from 9/30/1996 to 10/31/2006) as compared to the Russell 2500 Index2.
| |
| The performance data quoted on this page represents past performance and does not guarantee future results. The investment return and principal value of an investment will fluctuate so that an investor’s shares, when redeemed, may be worth more or less than their original cost. Current performance of the fund may be lower or higher than the performance data quoted. Performance data current to the most recent month-end may be obtained by calling 800.677.FUND. |
| |
| * | This table represents average annual total returns through the latest calendar quarter – rather than through the end of the fiscal period. |
| |
| 1 | Performance does not reflect the deduction of taxes that a shareholder would pay on fund distributions or redemption of fund shares. In certain years and/or for certain classes, performance reflects voluntary fee waivers in effect. In the absence of such fee waivers, total returns would be reduced. Index performance is for illustrative purposes only and does not reflect any expenses, transaction costs, or cash flow effects. Direct investment in the index is not available. |
Effective October 3, 2005, the investment strategy of the fund, formerly called the Technology Fund, changed from investing primarily in technology stocks to investing primarily in common stocks of small- and mid-capitalization companies. As a result, performance for the periods prior to October 3, 2005 reflect the performance of a materially different investment portfolio.
Stocks of small- and mid-capitalization companies involve substantial risk and may be subject to increased volatility and more price fluctuation than large-capitalization companies.
Total returns at net asset value (“NAV”) reflect performance over the time period indicated without including the fund’s maximum sales charge and assume reinvestment of all distributions at NAV.
Total returns at public offering price (“POP”) reflect performance over the time period indicated including maximum sales charges of 5.50% for Class A shares and the contingent deferred sales charge (“CDSC”) for Class B and Class C shares for the relevant period. Maximum CDSC is 5.00% for Class B shares in the first year, decreasing annually to 0% in the seventh year following purchase, and 1.00% for Class C shares. Total returns assume reinvestment of all distributions at NAV.
The Small-Mid Cap Core Fund’s 1999 returns were higher due in part to its strategy of investing in IPOs and technology-related stocks in a period favorable for IPO and technology stock investing. Of course, such favorable returns involve accepting the risk of volatility, and there is no assurance that the fund’s future investment in IPOs and technology stocks will have the same effect on performance as it did in 1999.
| |
| 2 | An unmanaged small- and mid-cap index that measures the performance of the 2,500 smallest companies in the Russell 3000 Index. |
| |
| 3 | Performance for Class B and Class C shares is not presented. Performance for these classes will vary due to the different expense structures. |
18 First American Funds Annual Report 2006
Small-Mid Cap Core fund continued
Expense Example
As a shareholder of the Small-Mid Cap Core Fund (the “fund”), you incur two types of costs: (1) transaction costs, including sales charges (loads) on purchase payments; and (2) ongoing costs, including investment advisory fees, distribution and/or service (12b-1) fees, and other fund expenses. This example is intended to help you understand your ongoing costs (in dollars) of investing in the fund and to compare these costs with the ongoing costs of investing in other mutual funds. The example is based on an investment of $1,000 invested at the beginning of the period and held for the entire period from May 1, 2006, to October 31, 2006.
Actual Expenses
For each class, the first line of the table below provides information about actual account values and actual expenses. You may use the information in this line, together with the amount you invested, to estimate the expenses that you paid over the period. Simply divide your account value by $1,000 (for example, an $8,600 account value divided by $1,000 = 8.6), then multiply the result by the number in the first line under the heading entitled “Expenses Paid During Period” to estimate the expenses you paid on your account during this period.
Hypothetical Example for Comparison Purposes
For each class, the second line of the table below provides information about hypothetical account values and hypothetical expenses based on the fund’s actual expense ratio and an assumed rate of return of 5% per year before expenses, which is not the fund’s actual return. The hypothetical account values and expenses may not be used to estimate the actual ending account balance or expenses you paid for the period. You may use this information to compare the ongoing costs of investing in the fund and other funds. To do so, compare this 5% hypothetical example with the 5% hypothetical examples that appear in the shareholder reports of the other funds.
Please note that the expenses shown in the table are meant to highlight your ongoing costs only and do not reflect any transactional costs, such as sales charges (loads). Therefore, the second line of the table for each class is useful in comparing ongoing costs only, and will not help you determine the relative total costs of owning different funds. In addition, if these transactional costs were included, your costs would have been higher.
Expense Examples
| | | | | | | | | | | | | |
| | | | | | | Expenses Paid During | |
| | | Beginning Account | | | Ending Account | | | Period1 (5/01/06 to | |
| | | Value (5/01/06) | | | Value (10/31/06) | | | 10/31/06) | |
Class A Actual2,3 | | $ | 1,000.00 | | | $ | 984.60 | | | $ | 6.85 | |
| |
Class A Hypothetical (5% return before expenses)3 | | $ | 1,000.00 | | | $ | 1,018.30 | | | $ | 6.97 | |
| |
Class B Actual2,3 | | $ | 1,000.00 | | | $ | 980.00 | | | $ | 10.58 | |
| |
Class B Hypothetical (5% return before expenses)3 | | $ | 1,000.00 | | | $ | 1,014.52 | | | $ | 10.76 | |
| |
Class C Actual2,3 | | $ | 1,000.00 | | | $ | 980.60 | | | $ | 10.58 | |
| |
Class C Hypothetical (5% return before expenses)3 | | $ | 1,000.00 | | | $ | 1,014.52 | | | $ | 10.76 | |
| |
Class Y Actual2,3 | | $ | 1,000.00 | | | $ | 985.10 | | | $ | 5.60 | |
| |
Class Y Hypothetical (5% return before expenses)3 | | $ | 1,000.00 | | | $ | 1,019.56 | | | $ | 5.70 | |
| |
| 1 | Expenses are equal to the fund’s annualized expense ratio for the most recent six-month period of 1.37%, 2.12%, 2.12%, and 1.12% for Class A, Class B, Class C, and Class Y, respectively, multiplied by the average account value over the period, multiplied by the number of days in the most recent fiscal half-year/365 (to reflect the one-half year period). |
| |
| 2 | Based on the actual returns for the six-month period ended October 31, 2006 of -1.54%, -2.00%, -1.94%, and -1.49% for Class A, Class B, Class C, and Class Y, respectively. |
| |
| 3 | Prior to July 1, 2006, total operating expenses were not subject to a contractual limitation. Effective July 1, 2006, annual expenses for Class A, Class B, Class C, and Class Y were contractually limited to 1.41%, 2.16%, 2.16%, and 1.16%, respectively. If this limitation had been in place during the entire period, actual and hypothetical ending account balances would have been approximately $984.40 and $1,018.10 for Class A, $979.80 and $1,014.32 for Class B, $980.40 and $1,014.32 for Class C, and $984.90 and $1,019.36 for Class Y. Actual and hypothetical expenses paid during the period would have been approximately $7.05 and $7.17 for Class A, $10.78 and $10.97 for Class B, $10.78 and $10.97 for Class C, and $5.80 and $5.90 for Class Y. |
First American Funds Annual Report 2006 19
Mid Cap Growth Opportunities fund
Investment Objective: capital appreciation
How did the Fund perform for the fiscal year ended October 31, 2006?
The First American Mid Cap Growth Opportunities Fund (the “fund”), Class Y shares, returned 12.98% for the fiscal year ended October 31, 2006 (Class A shares returned 12.69% without taking the sales charge into account). By comparison, the fund’s benchmark, the Russell Midcap Growth Index*, returned 14.51% for the same period.
What were the general economic and market conditions during the fiscal year?
Economic growth slowed from very strong levels through the first quarter of 2006 to below-potential levels by the end of October. Inflation pressures rose through much of this period in a lagging response to the very strong growth through the first portion of this year, but diminished considerably by October. The Federal Reserve (“Fed”) continued to tighten monetary policy through June as a result of the increase in inflation pressures, but has kept policy steady since that time as its forecast of slowing economic growth and dissipating inflation pressures has been realized. Corporate profit growth remained strong over this 12-month period with third-quarter 2006 earnings of S&P 500 companies advancing by roughly 20% on a year-over-year basis. The strength in corporate earnings, along with lessening inflation pressures and expectations that the Fed will begin easing monetary policy in 2007, has proved to be favorable for the equity markets through October 2006.
What worked for the fund and why?
Stock selection was mainly responsible for the strengths in the fund’s performance. In the technology sector, the semiconductor equipment manufacturer MEMC Electronic Materials enjoyed exceptional earnings growth, as its foray into the solar energy field, in addition to its semiconductor wafer business, gained investors’ appreciation. Other standouts included Amphenol, a connector maker, and Cognizant, an IT solutions provider. The fund’s significant underweight in the consumer discretionary sector proved beneficial during a time when the sector underperformed. Within the sector, one of the stronger performers we held was clothing retailer Coldwater Creek. In consumer staples, Corn Products International, Inc. added value, while in the energy sector we benefited from the strong performance by Weatherford, an oilfield services company. As the capital markets gained strength, the fund’s positions in brokerage and asset management firms, notably Bear Stearns and AllianceBernstein, made positive contributions.
What did not work for the fund and why?
Apart from the fund’s lacking any positions in the basic materials sector, which fared very well during the period, it was chiefly adverse stock selection that detracted from performance. In the consumer discretionary sector, disappointing earnings from Scientific Games Corp., a service and systems provider for lottery and wagering industries, and Station Casinos, a hotel and casino operator, held back performance. In media, XM Satellite Radio saw its stock drop by 59% as it continued its struggle toward profitability. Among our weaker performers in the technology sector were Autodesk (2D and 3D design, digital content creation, and project collaboration software tools), hurt by a lower price/earnings ratio**, and Citrix (designer of software platforms for on-demand access to information), which reported anemic earnings. Within the healthcare sector, an overweight in managed-care companies like Coventry Health Care, Inc., had a negative impact, as did our positions in health insurer Aetna and PerkinElmer, a provider of analytical tools for health and life sciences, which did not deliver on earnings targets throughout the fiscal year.
What strategic moves were made by the fund and why?
As the economy slowed, creating an uncertain outlook for many of the companies in the industrial sector, we reduced the fund’s overweight in industrials. Our sizable underweight in the consumer discretionary sector was lessened in anticipation of more robust consumer spending that should follow a decline in energy prices.
| |
| * | Unlike mutual funds, index returns do not reflect any expenses, transaction costs, or cash flow effects. |
| ** | Price/earnings ratio is calculated by dividing the current price of the stock by the company’s trailing 12 months of earnings per share. |
Top 10 Holdings as of October 31, 20061 (% of net assets)
| | | | | |
| Thermo Electron | | | 3.3% | |
| Dun & Bradstreet | | | 3.1 | |
| American Tower, Class A | | | 2.9 | |
| Amphenol, Class A | | | 2.5 | |
| Scientific Games, Class A | | | 2.4 | |
| Paychex | | | 2.0 | |
| Precision Castparts | | | 2.0 | |
| Bear Stearns | | | 1.9 | |
| Republic Services | | | 1.7 | |
| Smith International | | | 1.6 | |
Sector Allocation as of October 31, 20061 (% of net assets)
| | | | | |
| Information Technology | | | 24.1% | |
| Consumer Discretionary | | | 18.6 | |
| Healthcare | | | 15.1 | |
| Industrials | | | 14.6 | |
| Financials | | | 11.2 | |
| Energy | | | 9.0 | |
| Telecommunication Services | | | 4.3 | |
| Investment Companies | | | 1.6 | |
| Consumer Staples | | | 0.8 | |
| Short-Term Investment | | | 0.5 | |
Other Assets and Liabilities, Net2 | | | 0.2 | |
| | | | |
| | | | 100.0 | % |
| |
| 1 | Fund holdings and sector allocations are subject to change at any time and are not recommendations to buy or sell any security. |
| |
| 2 | Investments in securities typically comprise substantially all of the fund’s net assets. Other assets and liabilities include receivables for items such as income earned but not yet received and payables for items such as fund expenses incurred but not yet paid. |
20 First American Funds Annual Report 2006
Mid Cap Growth Opportunities fund continued
Annual Performance1
| | | | | | | | | | | | | | | | | | | | | | | | | | | | | | | | | | | | | | | | | | | | | | | | | |
| | | October 31, 2006 | | September 30, 2006* |
| | | | | | | |
| | | | | Since Inception | | | | Since Inception |
| | | | | | | | | | | |
| | | 1 year | | | 5 years | | | 10 years | | | 3/1/1999 | | | 12/11/2000 | | | 9/24/2001 | | | 1 year | | | 5 years | | | 10 years | | | 3/1/1999 | | | 12/11/2000 | | | 9/24/2001 | |
| Average annual return with sales charge (POP) |
| Class A | | | 6.49% | | | | 11.69% | | | | 9.66% | | | | — | | | | — | | | | — | | | | 1.30% | | | | 12.19% | | | | 8.87% | | | | — | | | | — | | | | — | |
| |
| Class B | | | 6.83% | | | | 11.86% | | | | — | | | | 10.62% | | | | — | | | | — | | | | 1.67% | | | | 12.36% | | | | — | | | | 10.31% | | | | — | | | | — | |
| |
| Class C | | | 10.84% | | | | 12.15% | | | | — | | | | — | | | | — | | | | 13.81% | | | | 5.48% | | | | 12.66% | | | | — | | | | — | | | | — | | | | 13.37% | |
| Average annual return without sales charge (NAV) |
| Class A | | | 12.69% | | | | 12.96% | | | | 10.28% | | | | — | | | | — | | | | — | | | | 7.21% | | | | 13.46% | | | | 9.49% | | | | — | | | | — | | | | — | |
| |
| Class B | | | 11.83% | | | | 12.12% | | | | — | | | | 10.62% | | | | — | | | | — | | | | 6.43% | | | | 12.61% | | | | — | | | | 10.31% | | | | — | | | | — | |
| |
| Class C | | | 11.84% | | | | 12.15% | | | | — | | | | — | | | | — | | | | 13.81% | | | | 6.43% | | | | 12.66% | | | | — | | | | — | | | | — | | | | 13.37% | |
| |
| Class R | | | 12.41% | | | | 12.86% | | | | — | | | | — | | | | 7.46% | | | | — | | | | 6.95% | | | | 13.36% | | | | — | | | | — | | | | 7.01% | | | | — | |
| |
| Class Y | | | 12.98% | | | | 13.25% | | | | 10.55% | | | | — | | | | — | | | | — | | | | 7.49% | | | | 13.76% | | | | 9.76% | | | | — | | | | — | | | | — | |
| |
Russell Midcap Growth Index2 | | | 14.51% | | | | 10.62% | | | | 8.73% | | | | 6.00% | | | | 0.08% | | | | 12.87% | | | | 7.03% | | | | 12.01% | | | | 8.20% | | | | 5.55% | | | | (0.57)% | | | | 12.26% | |
Value of $10,000 Investment1,3 as of October 31, 2006
The chart above illustrates the total value of an assumed $10,000 investment in the fund’s Class A and Class Y shares (from 10/31/1996 to 10/31/2006) as compared to the Russell Midcap Growth Index2.
| |
| | The performance data quoted on this page represents past performance and does not guarantee future results. The investment return and principal value of an investment will fluctuate so that an investor’s shares, when redeemed, may be worth more or less than their original cost. Current performance of the fund may be lower or higher than the performance data quoted. Performance data current to the most recent month-end may be obtained by calling 800.677.FUND. |
| |
| * | This table represents average annual total returns through the latest calendar quarter – rather than through the end of the fiscal period. |
| |
| 1 | Performance does not reflect the deduction of taxes that a shareholder would pay on fund distributions or redemption of fund shares. In certain years and/or for certain classes, performance reflects voluntary fee waivers in effect. In the absence of such fee waivers, total returns would be reduced. Index performance is for illustrative purposes only and does not reflect any expenses, transaction costs, or cash flow effects. Direct investment in the index is not available. |
| |
| | Stocks of mid-capitalization companies may be slightly less volatile than those of small-capitalization companies, but they still involve substantial risk and may be subject to increased volatility and more price fluctuation than large-capitalization companies. |
| |
| | Total returns at net asset value (“NAV”) reflect performance over the time period indicated without including the fund’s maximum sales charge and assume reinvestment of all distributions at NAV. |
| |
| | Total returns at public offering price (“POP”) reflect performance over the time period indicated including maximum sales charges of 5.50% for Class A shares and the contingent deferred sales charge (“CDSC”) for Class B and Class C shares for the relevant period. Maximum CDSC is 5.00% for Class B shares in the first year, decreasing annually to 0% in the seventh year following purchase, and 1.00% for Class C shares. Total returns assume reinvestment of all distributions at NAV. |
| |
| | On September 24, 2001, the First American Mid Cap Growth Opportunities Fund became the successor by merger to the Firstar MidCap Core Equity Fund, a series of Firstar Funds, Inc. Prior to the merger, the First American fund had no assets or liabilities. Performance presented prior to September 24, 2001 represents that of the Firstar MidCap Core Equity Fund. |
| |
| 2 | An unmanaged index that measures the performance of those Russell mid-cap companies with higher price-to-book ratios and higher forecasted growth values. |
| |
| 3 | Performance for Class B, Class C, and Class R shares is not presented. Performance for these classes will vary due to the different expense structures. |
First American Funds Annual Report 2006 21
Mid Cap Growth Opportunities fund continued
Expense Example
As a shareholder of the Mid Cap Growth Opportunities Fund (the “fund”), you incur two types of costs: (1) transaction costs, including sales charges (loads) on purchase payments; and (2) ongoing costs, including investment advisory fees, distribution and/or service (12b-1) fees, and other fund expenses. This example is intended to help you understand your ongoing costs (in dollars) of investing in the fund and to compare these costs with the ongoing costs of investing in other mutual funds. The example is based on an investment of $1,000 invested at the beginning of the period and held for the entire period from May 1, 2006, to October 31, 2006.
Actual Expenses
For each class, the first line of the table below provides information about actual account values and actual expenses. You may use the information in this line, together with the amount you invested, to estimate the expenses that you paid over the period. Simply divide your account value by $1,000 (for example, an $8,600 account value divided by $1,000 = 8.6), then multiply the result by the number in the first line under the heading entitled “Expenses Paid During Period” to estimate the expenses you paid on your account during this period.
Hypothetical Example for Comparison Purposes
For each class, the second line of the table below provides information about hypothetical account values and hypothetical expenses based on the fund’s actual expense ratio and an assumed rate of return of 5% per year before expenses, which is not the fund’s actual return. The hypothetical account values and expenses may not be used to estimate the actual ending account balance or expenses you paid for the period. You may use this information to compare the ongoing costs of investing in the fund and other funds. To do so, compare this 5% hypothetical example with the 5% hypothetical examples that appear in the shareholder reports of the other funds.
Please note that the expenses shown in the table are meant to highlight your ongoing costs only and do not reflect any transactional costs, such as sales charges (loads). Therefore, the second line of the table for each class is useful in comparing ongoing costs only, and will not help you determine the relative total costs of owning different funds. In addition, if these transactional costs were included, your costs would have been higher.
Expense Examples
| | | | | | | | | | | | | |
| | | | | | | Expenses Paid During |
| | | Beginning Account | | Ending Account | | Period1 (5/01/06 to |
| | | Value (5/01/06) | | Value (10/31/06) | | 10/31/06) |
Class A Actual2 | | $ | 1,000.00 | | | $ | 961.00 | | | $ | 6.08 | |
| |
| Class A Hypothetical (5% return before expenses) | | $ | 1,000.00 | | | $ | 1,019.00 | | | $ | 6.26 | |
| |
Class B Actual2 | | $ | 1,000.00 | | | $ | 957.30 | | | $ | 9.77 | |
| |
| Class B Hypothetical (5% return before expenses) | | $ | 1,000.00 | | | $ | 1,015.22 | | | $ | 10.06 | |
| |
Class C Actual2 | | $ | 1,000.00 | | | $ | 957.50 | | | $ | 9.77 | |
| |
| Class C Hypothetical (5% return before expenses) | | $ | 1,000.00 | | | $ | 1,015.22 | | | $ | 10.06 | |
| |
Class R Actual2 | | $ | 1,000.00 | | | $ | 959.90 | | | $ | 7.31 | |
| |
| Class R Hypothetical (5% return before expenses) | | $ | 1,000.00 | | | $ | 1,017.74 | | | $ | 7.53 | |
| |
Class Y Actual2 | | $ | 1,000.00 | | | $ | 962.30 | | | $ | 4.85 | |
| |
| Class Y Hypothetical (5% return before expenses) | | $ | 1,000.00 | | | $ | 1,020.27 | | | $ | 4.99 | |
| |
| 1 | Expenses are equal to the fund’s annualized expense ratio for the most recent six-month period of 1.23%, 1.98%, 1.98%, 1.48%, and 0.98% for Class A, Class B, Class C, Class R, and Class Y, respectively, multiplied by the average account value over the period, multiplied by the number of days in the most recent fiscal half-year/365 (to reflect the one-half year period). |
| |
| 2 | Based on the actual returns for the six-month period ended October 31, 2006 of -3.90%, -4.27%, -4.25%, -4.01%, and -3.77% for Class A, Class B, Class C, Class R, and Class Y, respectively. |
22 First American Funds Annual Report 2006
Mid Cap Value fund
Investment Objective: capital appreciation
How did the Fund perform for the fiscal year ended October 31, 2006?
The First American Mid Cap Value Fund (the “fund”), Class Y shares, returned 17.63% for the fiscal year ended October 31, 2006 (Class A shares returned 17.36% without taking the sales charge into account). By comparison, the fund’s benchmark, the Russell Midcap Value Index*, returned 20.51% for the same period.
What were the general economic and market conditions during the fiscal year?
Economic growth slowed from very strong levels through the first quarter of 2006 to below-potential levels by the end of October. Inflation pressures rose through much of this period in a lagging response to the very strong growth through the first portion of this year, but diminished considerably by October. The Federal Reserve (“Fed”) continued to tighten monetary policy through June as a result of the increase in inflation pressures, but has kept policy steady since that time as its forecast of slowing economic growth and dissipating inflation pressures has been realized. Corporate profit growth remained strong over this 12-month period with third-quarter 2006 earnings of S&P 500 companies advancing by roughly 20% on a year-over-year basis. The strength in corporate earnings, along with lessening inflation pressures and expectations that the Fed will begin easing monetary policy in 2007, has proved to be favorable for the equity markets through October 2006.
What worked for the fund and why?
Stock selection was quite successful in the consumer discretionary sector, where the retail area featured particularly strong performers, notably paint store chain Sherwin Williams, whose results were buoyed by robust construction activity throughout most of the fiscal period. Other standouts included JCPenney, Office Depot, and Darden Restaurants, Inc. An underweight in the media sector proved beneficial during a period when newspapers and radio stations were challenged by declining audiences and advertising revenues. In technology, Freescale Semiconductor added value to the portfolio due to its acquisition by a private equity firm.
What did not work for the fund and why?
In the healthcare sector, PerkinElmer, Inc., a provider of analytical tools for health and life sciences, did not deliver on earnings targets throughout the fiscal year, detracting from the fund’s performance. Adverse stock selection in the managed-care space (HealthNet, Inc.) and hospitals (Community Health Systems, Inc.) was also a drawback. An underweight in real estate investment trusts, the best-performing group in the financials sector, took its toll despite our good stock selection in that area. In an environment of growing credit risk, weak performance from thrifts and mortgage-related companies like MGIC Investment, PMI Group, and Astoria Financial Corp. also had a negative impact. In telecommunications, the fund had an underweight in Qwest, whose benchmark weight nearly doubled in the course of the fiscal year. Finally, given strong benchmark returns, the fund’s position in cash (approximately 2%) was a drawback.
What strategic moves were made by the fund and why?
In terms of strategic positioning, the fund ended the year with its largest overweight in the consumer discretionary and industrial sectors, as we continue to identify stocks in these sectors that exhibit compelling fundamentals with company-specific catalysts for change. We remain moderately overweight in the energy sector because we feel that continuing high commodity prices, coupled with favorable supply and demand characteristics, will positively impact both exploration and service companies. We maintained our underweight position in the financial and utility sectors in our belief that these sectors are enjoying both peak fundamentals and full valuations.
| |
| * | Unlike mutual funds, index returns do not reflect any expenses, transaction costs, or cash flow effects. |
Top 10 Holdings as of October 31, 20061 (% of net assets)
| | | | | |
| CIT Group | | | 2.2% | |
| Marshall & Ilsley | | | 2.1 | |
| Edison International | | | 2.1 | |
| PPL | | | 2.1 | |
| Constellation Energy | | | 2.0 | |
| CSX | | | 2.0 | |
| Eaton | | | 2.0 | |
| Mattel | | | 1.9 | |
| First American Prime Obligations Fund, Class Z | | | 1.8 | |
| Boston Properties | | | 1.8 | |
Sector Allocation as of October 31, 20061 (% of net assets)
| | | | | |
| Financials | | | 31.5% | |
| Consumer Discretionary | | | 17.9 | |
| Utilities | | | 12.3 | |
| Industrials | | | 10.5 | |
| Information Technology | | | 7.6 | |
| Materials | | | 5.6 | |
| Energy | | | 5.3 | |
| Consumer Staples | | | 4.7 | |
| Healthcare | | | 1.9 | |
| Telecommunication Services | | | 0.5 | |
| Short-Term Investment | | | 1.8 | |
Other Assets and Liabilities, Net2 | | | 0.4 | |
| | | | |
| | | | 100.0% | |
| |
| 1 | Fund holdings and sector allocations are subject to change at any time and are not recommendations to buy or sell any security. |
| |
| 2 | Investments in securities typically comprise substantially all of the fund’s net assets. Other assets and liabilities include receivables for items such as income earned but not yet received and payables for items such as fund expenses incurred but not yet paid. |
First American Funds Annual Report 2006 23
Mid Cap Value fund continued
Annual Performance1
| | | | | | | | | | | | | | | | | | | | | | | | | | | | | | | | | | | | | | | | | |
| | | October 31, 2006 | | | September 30, 2006* | |
| | | | | | | |
| | | | | Since Inception | | | | | Since Inception | |
| | | | | | | | | | | |
| | | 1 year | | | 5 years | | | 10 years | | | 2/1/1999 | | | 9/24/2001 | | | 1 year | | | 5 years | | | 10 years | | | 2/1/1999 | | | 9/24/2001 | |
| | | | | | | | | | | | | | | | | | | | | | | | | | | | | | | |
| Average annual return with sales charge (POP) |
| Class A | | | 10.90% | | | | 14.47% | | | | 8.66% | | | | — | | | | — | | | | 4.33% | | | | 14.14% | | | | 8.39% | | | | — | | | | — | |
| |
| Class B | | | 11.45% | | | | 14.69% | | | | 8.48% | | | | — | | | | — | | | | 4.60% | | | | 14.37% | | | | 8.21% | | | | — | | | | — | |
| |
| Class C | | | 15.47% | | | | 14.90% | | | | — | | | | 9.60% | | | | — | | | | 8.61% | | | | 14.59% | | | | — | | | | 9.34% | | | | — | |
| |
| Average annual return without sales charge (NAV) |
| Class A | | | 17.36% | | | | 15.77% | | | | 9.27% | | | | — | | | | — | | | | 10.42% | | | | 15.44% | | | | 9.01% | | | | — | | | | — | |
| |
| Class B | | | 16.45% | | | | 14.92% | | | | 8.48% | | | | — | | | | — | | | | 9.60% | | | | 14.60% | | | | 8.21% | | | | — | | | | — | |
| |
| Class C | | | 16.47% | | | | 14.90% | | | | — | | | | 9.60% | | | | — | | | | 9.61% | | | | 14.59% | | | | — | | | | 9.34% | | | | — | |
| |
| Class R | | | 17.06% | | | | 15.65% | | | | — | | | | — | | | | 16.32% | | | | 10.21% | | | | 15.33% | | | | — | | | | — | | | | 16.01% | |
| |
| Class Y | | | 17.63% | | | | 16.06% | | | | 9.55% | | | | — | | | | — | | | | 10.70% | | | | 15.74% | | | | 9.29% | | | | — | | | | — | |
| |
Russell Midcap Value Index2 | | | 20.51% | | | | 17.43% | | | | 13.82% | | | | 12.58% | | | | 17.98% | | | | 12.27% | | | | 16.63% | | | | 13.66% | | | | 12.14% | | | | 17.37% | |
Value of $10,000 Investment1, 3 as of October 31, 2006
The chart above illustrates the total value of an assumed $10,000 investment in the fund’s Class A and Class Y shares (from 9/30/1996 to 10/31/2006) as compared to the Russell Midcap Value Index2.
| |
| The performance data quoted on this page represents past performance and does not guarantee future results. The investment return and principal value of an investment will fluctuate so that an investor’s shares, when redeemed, may be worth more or less than their original cost. Current performance of the fund may be lower or higher than the performance data quoted. Performance data current to the most recent month-end may be obtained by calling 800.677.FUND. |
| |
| * | This table represents average annual total returns through the latest calendar quarter – rather than through the end of the fiscal period. |
| |
| 1 | Performance does not reflect the deduction of taxes that a shareholder would pay on fund distributions or redemption of fund shares. In certain years and/or for certain classes, performance reflects voluntary fee waivers in effect. In the absence of such fee waivers, total returns would be reduced. Index performance is for illustrative purposes only and does not reflect any expenses, transaction costs, or cash flow effects. Direct investment in the index is not available. |
| |
| Stocks of mid-capitalization companies may be slightly less volatile than those of small-capitalization companies, but they still involve substantial risk and may be subject to increased volatility and more price fluctuation than large-capitalization companies. |
| |
| Total returns at net asset value (“NAV”) reflect performance over the time period indicated without including the fund’s maximum sales charge and assume reinvestment of all distributions at NAV. |
| |
| Total returns at public offering price (“POP”) reflect performance over the time period indicated including maximum sales charges of 5.50% for Class A shares and the contingent deferred sales charge (“CDSC”) for Class B and Class C shares for the relevant period. Maximum CDSC is 5.00% for Class B shares in the first year, decreasing annually to 0% in the seventh year following purchase, and 1.00% for Class C shares. Total returns assume reinvestment of all distributions at NAV. |
| |
| 2 | An unmanaged index that measures the performance of those Russell mid-cap companies with lower price-to-book ratios and lower forecasted growth values. |
| |
| 3 | Performance for Class B, Class C, and Class R shares is not presented. Performance for these classes will vary due to the different expense structures. |
24 First American Funds Annual Report 2006
Mid Cap Value fund continued
Expense Example
As a shareholder of the Mid Cap Value Fund (the “fund”), you incur two types of costs: (1) transaction costs, including sales charges (loads) on purchase payments; and (2) ongoing costs, including investment advisory fees, distribution and/or service (12b-1) fees, and other fund expenses. This example is intended to help you understand your ongoing costs (in dollars) of investing in the fund and to compare these costs with the ongoing costs of investing in other mutual funds. The example is based on an investment of $1,000 invested at the beginning of the period and held for the entire period from May 1, 2006, to October 31, 2006.
Actual Expenses
For each class, the first line of the table below provides information about actual account values and actual expenses. You may use the information in this line, together with the amount you invested, to estimate the expenses that you paid over the period. Simply divide your account value by $1,000 (for example, an $8,600 account value divided by $1,000 = 8.6), then multiply the result by the number in the first line under the heading entitled “Expenses Paid During Period” to estimate the expenses you paid on your account during this period.
Hypothetical Example for Comparison Purposes
For each class, the second line of the table below provides information about hypothetical account values and hypothetical expenses based on the fund’s actual expense ratio and an assumed rate of return of 5% per year before expenses, which is not the fund’s actual return. The hypothetical account values and expenses may not be used to estimate the actual ending account balance or expenses you paid for the period. You may use this information to compare the ongoing costs of investing in the fund and other funds. To do so, compare this 5% hypothetical example with the 5% hypothetical examples that appear in the shareholder reports of the other funds.
Please note that the expenses shown in the table are meant to highlight your ongoing costs only and do not reflect any transactional costs, such as sales charges (loads). Therefore, the second line of the table for each class is useful in comparing ongoing costs only, and will not help you determine the relative total costs of owning different funds. In addition, if these transactional costs were included, your costs would have been higher.
Expense Examples
| | | | | | | | | | | | | |
| | | | | | | Expenses Paid During |
| | | Beginning Account | | Ending Account | | Period1 (5/01/06 to |
| | | Value (5/01/06) | | Value (10/31/06) | | 10/31/06) |
Class A Actual2 | | $ | 1,000.00 | | | $ | 1,029.20 | | | $ | 6.29 | |
| |
| Class A Hypothetical (5% return before expenses) | | $ | 1,000.00 | | | $ | 1,019.00 | | | $ | 6.26 | |
| |
Class B Actual2 | | $ | 1,000.00 | | | $ | 1,025.30 | | | $ | 10.11 | |
| |
| Class B Hypothetical (5% return before expenses) | | $ | 1,000.00 | | | $ | 1,015.22 | | | $ | 10.06 | |
| |
Class C Actual2 | | $ | 1,000.00 | | | $ | 1,025.20 | | | $ | 10.11 | |
| |
| Class C Hypothetical (5% return before expenses) | | $ | 1,000.00 | | | $ | 1,015.22 | | | $ | 10.06 | |
| |
Class R Actual2 | | $ | 1,000.00 | | | $ | 1,028.10 | | | $ | 7.57 | |
| |
| Class R Hypothetical (5% return before expenses) | | $ | 1,000.00 | | | $ | 1,017.74 | | | $ | 7.53 | |
Class Y Actual2 | | $ | 1,000.00 | | | $ | 1,030.30 | | | $ | 5.02 | |
| |
| Class Y Hypothetical (5% return before expenses) | | $ | 1,000.00 | | | $ | 1,020.27 | | | $ | 4.99 | |
| |
| 1 | Expenses are equal to the fund’s annualized expense ratio for the most recent six-month period of 1.23%, 1.98%, 1.98%, 1.48%, and 0.98% for Class A, Class B, Class C, Class R, and Class Y, respectively, multiplied by the average account value over the period, multiplied by the number of days in the most recent fiscal half-year/365 (to reflect the one-half year period). |
| |
| 2 | Based on the actual returns for the six-month period ended October 31, 2006 of 2.92%, 2.53%, 2.52%, 2.81%, and 3.03% for Class A, Class B, Class C, Class R, and Class Y, respectively. |
First American Funds Annual Report 2006 25
Large Cap Growth Opportunities fund
Investment Objective: long-term growth of capital
How did the Fund perform for the fiscal year ended October 31, 2006?
The First American Large Cap Growth Opportunities Fund (the “fund”), Class Y shares, returned 6.42% for the fiscal year ended October 31, 2006 (Class A shares returned 6.17% without taking the sales charge into account). By comparison, the fund’s benchmark, the Russell 1000 Growth Index*, returned 10.84% for the same period.
What were the general economic and market conditions during the fiscal year?
Economic growth slowed from very strong levels through the first quarter of 2006 to below-potential levels by the end of October. Inflation pressures rose through much of this period in a lagging response to the very strong growth through the first portion of this year, but diminished considerably by October. The Federal Reserve (“Fed”) continued to tighten monetary policy through June as a result of the increase in inflation pressures, but has kept policy steady since that time as its forecast of slowing economic growth and dissipating inflation pressures has been realized. Corporate profit growth remained strong over this 12-month period with third-quarter 2006 earnings of S&P 500 companies advancing by roughly 20% on a year-over-year basis. The strength in corporate earnings, along with lessening inflation pressures and expectations that the Fed will begin easing monetary policy in 2007, has proved to be favorable for the equity markets through October 2006.
What worked for the fund and why?
An overweight in financials, the best-performing sector in our portfolio during the fiscal period, was the most significant positive contributor to performance. Within the sector our stock selection was also quite successful. Driven by the increasing strength of capital markets, the performance of diversified financial companies and banks received a boost. Standouts in this category included Wells Fargo, Goldman Sachs, and Allstate. The fund’s holdings in the energy sector also added value. Although we were overweight in this sector, which generally underperformed, our stock selection produced positive results: the fund’s holdings in energy were up 23% over the fiscal year, well above the benchmark. The largest contributors in this area were Baker Hughes, Inc., an oilfield services provider, and oil giant Exxon Mobil.
What did not work for the fund and why?
The fund’s underperformance relative to the index was caused mainly by adverse stock selection. Within the healthcare sector, an overweight position in managed-care organizations proved detrimental. United Health Group particularly, though robust in recent years, underperformed during this fiscal period, in large part because of the investigation of stock options backdating by the company’s CEO. In healthcare equipment, a slowdown in the fundamentals in cardiac and orthopedic implantable devices industry hurt our holdings in St. Jude Medical and Medtronic, makers of such devices. In the consumer discretionary sector, the fund’s lack of holdings in media proved a drawback as this area outperformed the index. While consumer electronics generally performed well, the fund’s position in Circuit City, one of the weak performers in this space, held us back.
What strategic moves were made by the fund and why?
We reduced our exposure to healthcare, especially trimming down our holdings in managed-care organizations. We slightly increased our investment in lower-earning growth stocks but are still focusing on individual stock selection rather than particular groups. In our stock selection, we continue to focus on companies that demonstrate the potential for sustainable earnings growth.
| |
| * | Unlike mutual funds, index returns do not reflect any expenses, transaction costs, or cash flow effects. |
Top 10 Holdings as of October 31, 20061 (% of net assets)
| | | | | |
| General Electric | | | 4.3 | % |
| Kohl’s | | | 3.3 | |
| Microsoft | | | 3.1 | |
| Google | | | 3.1 | |
| Hewlett-Packard | | | 2.8 | |
| Texas Instruments | | | 2.5 | |
| Goldman Sachs Group | | | 2.2 | |
| Amphenol | | | 2.2 | |
| United Technologies | | | 2.1 | |
| Cisco Systems | | | 2.1 | |
Sector Allocation as of October 31, 20061 (% of net assets)
| | | | | |
| Information Technology | | | 30.9 | % |
| Industrials | | | 14.1 | |
| Healthcare | | | 13.2 | |
| Consumer Discretionary | | | 11.3 | |
| Consumer Staples | | | 9.9 | |
| Financials | | | 9.3 | |
| Energy | | | 5.6 | |
| Telecommunication Services | | | 2.8 | |
| Investment Companies | | | 1.8 | |
| Materials | | | 1.0 | |
| Short-Term Investment | | | 0.2 | |
Other Assets and Liabilities, Net2 | | | (0.1 | ) |
| | | | |
| | | | 100.0 | % |
| |
| 1 | Fund holdings and sector allocations are subject to change at any time and are not recommendations to buy or sell any security. |
| |
| 2 | Investments in securities typically comprise substantially all of the fund’s net assets. Other assets and liabilities include receivables for items such as income earned but not yet received and payables for items such as fund expenses incurred but not yet paid. |
26 First American Funds Annual Report 2006
Large Cap Growth Opportunities fund continued
Annual Performance1
| | | | | | | | | | | | | | | | | | | | | | | | | | | | | | | | | | | | | | | | | | | | | | | | | | |
| | | October 31, 2006 | | | September 30, 2006* | |
| | | | | | | |
| | | | | Since Inception | | | | | Since Inception | |
| | | | | | | | | | | |
| | | 1 year | | | 5 years | | | 10 years | | | 3/01/1999 | | | 11/27/2000 | | | 9/24/2001 | | | 1 year | | | 5 years | | | 10 years | | | 3/01/1999 | | | 11/27/2000 | | | 9/24/2001 | |
| Average annual return with sales charge (POP) |
| | Class A | | | 0.34% | | | | 2.36% | | | | 4.16% | | | | — | | | | — | | | | — | | | | (3.14)% | | | | 2.25% | | | | 3.79% | | | | — | | | | — | | | | — | |
| |
| | Class B | | | 0.38% | | | | 2.39% | | | | — | | | | (1.23)% | | | | — | | | | — | | | | (3.28)% | | | | 2.27% | | | | — | | | | (1.62)% | | | | — | | | | — | |
| |
| | Class C | | | 4.38% | | | | 2.75% | | | | — | | | | — | | | | — | | | | 3.76% | | | | 0.72% | | | | 2.64% | | | | — | | | | — | | | | — | | | | 3.23% | |
| |
| Average annual return without sales charge (NAV) |
| | Class A | | | 6.17% | | | | 3.53% | | | | 4.75% | | | | — | | | | — | | | | — | | | | 2.50% | | | | 3.41% | | | | 4.38% | | | | — | | | | — | | | | — | |
| |
| | Class B | | | 5.38% | | | | 2.75% | | | | — | | | | (1.23)% | | | | — | | | | — | | | | 1.72% | | | | 2.64% | | | | — | | | | (1.62)% | | | | — | | | | — | |
| |
| | Class C | | | 5.38% | | | | 2.75% | | | | — | | | | — | | | | — | | | | 3.76% | | | | 1.72% | | | | 2.64% | | | | — | | | | — | | | | — | | | | 3.23% | |
| |
| | Class R | | | 5.87% | | | | 3.40% | | | | — | | | | — | | | | (3.06)% | | | | — | | | | 2.22% | | | | 3.29% | | | | — | | | | — | | | | (3.58)% | | | | — | |
| |
| | Class Y | | | 6.42% | | | | 3.79% | | | | 5.01% | | | | — | | | | — | | | | — | | | | 2.74% | | | | 3.68% | | | | 4.64% | | | | — | | | | — | | | | — | |
| |
| | Russell 1000 Growth Index2 | | | 10.84% | | | | 4.07% | | | | 5.76% | | | | (1.25)% | | | | (3.58)% | | | | 5.64% | | | | 6.04% | | | | 4.42% | | | | 5.46% | | | | (1.71)% | | | | (4.20)% | | | | 5.01% | |
Value of $10,000 Investment1, 3 as of October 31, 2006
The chart above, illustrates the total value of an assumed $10,000 investment in the fund’s Class A and Class Y shares (from 10/31/1996 to 10/31/2006) as compared to the Russell 1000 Growth Index2.
| |
| The performance data quoted on this page represents past performance and does not guarantee future results. The investment return and principal value of an investment will fluctuate so that an investor’s shares, when redeemed, may be worth more or less than their original cost. Current performance of the fund may be lower or higher than the performance data quoted. Performance data current to the most recent month-end may be obtained by calling 800.677.FUND. |
| |
| * | This table represents average annual total returns through the latest calendar quarter – rather than through the end of the fiscal period. |
| |
| 1 | Performance does not reflect the deduction of taxes that a shareholder would pay on fund distributions or redemption of fund shares. In certain years and/or for certain classes, performance reflects voluntary fee waivers in effect. In the absence of such fee waivers, total returns would be reduced. Index performance is for illustrative purposes only and does not reflect any expenses, transaction costs, or cash flow effects. Direct investment in the index is not available. |
| |
| Growth stocks typically have more volatility than value stocks; whereas value stocks tend to have slower earnings growth rates. |
| |
| Total returns at net asset value (“NAV”) reflect performance over the time period indicated without including the fund’s maximum sales charge and assume reinvestment of all distributions at NAV. |
| |
| Total returns at public offering price (“POP”) reflect performance over the time period indicated including maximum sales charges of 5.50% for Class A shares and the contingent deferred sales charge (“CDSC”) for Class B and Class C shares for the relevant period. Maximum CDSC is 5.00% for Class B shares in the first year, decreasing annually to 0% in the seventh year following purchase, and 1.00% for Class C shares. Total returns assume reinvestment of all distributions at NAV. |
| |
| On September 24, 2001, the First American Large Cap Growth Opportunities Fund became the successor by merger to the Firstar Large Cap Core Equity Fund, a series of Firstar Funds, Inc. Prior to the merger, the First American fund had no assets or liabilities. Performance presented prior to September 24, 2001 represents that of the Firstar Large Cap Core Equity Fund. |
| |
| 2 | An unmanaged index that measures the performance of those companies in the Russell 1000 Index (large-cap index) with higher price-to-book ratios and higher forecasted growth values. |
| |
| 3 | Performance for Class B, Class C, and Class R shares is not presented. Performance for these classes will vary due to the different expense structures. |
First American Funds Annual Report 2006 27
Large Cap Growth Opportunities fund continued
Expense Example
As a shareholder of the Large Cap Growth Opportunities Fund (the “fund”), you incur two types of costs: (1) transaction costs, including sales charges (loads) on purchase payments; and (2) ongoing costs, including investment advisory fees, distribution and/or service (12b-1) fees, and other fund expenses. This example is intended to help you understand your ongoing costs (in dollars) of investing in the fund and to compare these costs with the ongoing costs of investing in other mutual funds. The example is based on an investment of $1,000 invested at the beginning of the period and held for the entire period from May 1, 2006, to October 31, 2006.
Actual Expenses
For each class, the first line of the table below provides information about actual account values and actual expenses. You may use the information in this line, together with the amount you invested, to estimate the expenses that you paid over the period. Simply divide your account value by $1,000 (for example, an $8,600 account value divided by $1,000 = 8.6), then multiply the result by the number in the first line under the heading entitled “Expenses Paid During Period” to estimate the expenses you paid on your account during this period.
Hypothetical Example for Comparison Purposes
For each class, the second line of the table below provides information about hypothetical account values and hypothetical expenses based on the fund’s actual expense ratio and an assumed rate of return of 5% per year before expenses, which is not the fund’s actual return. The hypothetical account values and expenses may not be used to estimate the actual ending account balance or expenses you paid for the period. You may use this information to compare the ongoing costs of investing in the fund and other funds. To do so, compare this 5% hypothetical example with the 5% hypothetical examples that appear in the shareholder reports of the other funds.
Please note that the expenses shown in the table are meant to highlight your ongoing costs only and do not reflect any transactional costs, such as sales charges (loads). Therefore, the second line of the table for each class is useful in comparing ongoing costs only, and will not help you determine the relative total costs of owning different funds. In addition, if these transactional costs were included, your costs would have been higher.
Expense Examples
| | | | | | | | | | | | | |
| | | | | | | Expenses Paid During | |
| | | Beginning Account | | | Ending Account | | | Period1 (5/01/06 to | |
| | | Value (5/01/06) | | | Value (10/31/06) | | | 10/31/06) | |
Class A Actual2 | | $ | 1,000.00 | | | $ | 999.30 | | | $ | $6.00 | |
| |
| Class A Hypothetical (5% return before expenses) | | $ | 1,000.00 | | | $ | 1,019.21 | | | $ | 6.06 | |
| |
Class B Actual2 | | $ | 1,000.00 | | | $ | 995.40 | | | $ | 9.76 | |
| |
| Class B Hypothetical (5% return before expenses) | | $ | 1,000.00 | | | $ | 1,015.43 | | | $ | 9.86 | |
| |
Class C Actual2 | | $ | 1,000.00 | | | $ | 995.50 | | | $ | 9.76 | |
| |
| Class C Hypothetical (5% return before expenses) | | $ | 1,000.00 | | | $ | 1,015.43 | | | $ | 9.86 | |
| |
Class R Actual2 | | $ | 1,000.00 | | | $ | 998.00 | | | $ | 7.25 | |
| |
| Class R Hypothetical (5% return before expenses) | | $ | 1,000.00 | | | $ | 1,017.95 | | | $ | 7.32 | |
| |
Class Y Actual2 | | $ | 1,000.00 | | | $ | 1,000.30 | | | $ | 4.74 | |
| |
| Class Y Hypothetical (5% return before expenses) | | $ | 1,000.00 | | | $ | 1,020.47 | | | $ | 4.79 | |
| |
| 1 | Expenses are equal to the fund’s annualized expense ratio for the most recent six-month period of 1.19%, 1.94%, 1.94%, 1.44%, and 0.94% for Class A, Class B, Class C, Class R, and Class Y, respectively, multiplied by the average account value over the period, multiplied by the number of days in the most recent fiscal half-year/365 (to reflect the one-half year period). |
| |
| 2 | Based on the actual returns for the six-month period ended October 31, 2006 of -0.07%, -0.46%, -0.45%, -0.20%, and 0.03% for Class A, Class B, Class C, Class R, and Class Y, respectively. |
28 First American Funds Annual Report 2006
Large Cap Select fund
Investment Objective: capital appreciation
How did the fund perform for the fiscal year ended October 31, 2006?
The First American Large Cap Select Fund (the “fund”), Class Y shares, returned 11.37% for the fiscal year ended October 31, 2006 (Class A shares returned 11.07% without taking the sales charge into account). By comparison, the fund’s benchmark, the Standard & Poor’s 500 Index* (“S&P 500 Index”), returned 16.34% for the same period.
What were the general economic and market conditions during the fiscal year?
Economic growth slowed from very strong levels through the first quarter of 2006 to below-potential levels by the end of October. Inflation pressures rose through much of this period in a lagging response to the very strong growth through the first portion of this year, but diminished considerably by October. The Federal Reserve (“Fed”) continued to tighten monetary policy through June as a result of the increase in inflation pressures, but has kept policy steady since that time as its forecast of slowing economic growth and dissipating inflation pressures has been realized. Corporate profit growth remained strong over this 12-month period with third-quarter 2006 earnings of S&P 500 companies advancing by roughly 20% on a year-over-year basis. The strength in corporate earnings, along with lessening inflation pressures and expectations that the Fed will begin easing monetary policy in 2007, has proved to be favorable for the equity markets through October 2006.
What worked for the fund and why?
Good sector allocation was a positive contributor to the fund’s performance. Our overweight position in the financial sector added value, as did our stock selection in that sector. Driven by the increasing strength of capital markets, the performance of investment banks received a boost. Standouts in this category included Goldman Sachs and Morgan Stanley.
What did not work for the fund and why?
The fund underperformed the benchmark due to adverse stock selection. The most significant detractors from performance were in the technology sector: Motorola, Intel, Qualcomm, and Apple Computer. Because their performance – and the performance of consumer electronics stocks in general – depends on positive consumer sentiment, during this fiscal year it was negatively affected by rising concerns about consumer-led recession. Our sizable positions in Dow Chemical and Wal-Mart also hurt performance. Since both are highly cyclical stocks – rising quickly when the economy grows and falling just as rapidly when it turns down – both were hurt by the slowing economy and by the growing concerns about potential recession. The fund was underweight in utilities, which performed better than expected, but this underweight had little impact on performance, since good stock selection in the sector compensated for it.
What strategic moves were made by the fund and why?
We maintained the fund’s overweight position in cyclical stocks, believing that’s where the fund’s source of real value lies, even though current prices of these stocks may not reflect it. Convinced that a recession is unlikely and that the Fed is positioned to lower interest rates in 2007, we expect these stocks to benefit in the coming fiscal year. We also maintained the fund’s overweight in energy because, although U.S. economic growth is slowing, the world growth is quite robust, putting continued demand pressures on oil and natural gas producers.
| |
| * | Unlike mutual funds, index returns do not reflect any expenses, transaction costs, or cash flow effects. |
Top 10 Holdings as of October 31, 20061 (% of net assets)
| | | | | |
| American International Group | | | 4.9 | % |
| Bank of America | | | 4.6 | |
| Exxon Mobil | | | 4.4 | |
| General Electric | | | 3.8 | |
| Wal-Mart Stores | | | 3.2 | |
| Morgan Stanley | | | 3.0 | |
| Gap | | | 2.9 | |
| Comcast, Class A | | | 2.6 | |
| Wyeth Pharmaceuticals | | | 2.5 | |
| Boeing | | | 2.4 | |
Sector Allocation as of October 31, 20061 (% of net assets)
| | | | | |
| Financials | | | 20.1 | % |
| Information Technology | | | 18.0 | |
| Energy | | | 14.2 | |
| Consumer Discretionary | | | 13.3 | |
| Healthcare | | | 11.3 | |
| Industrials | | | 10.4 | |
| Consumer Staples | | | 7.5 | |
| Telecommunication Services | | | 3.7 | |
| Materials | | | 1.1 | |
| Short-Term Investments | | | 0.3 | |
Other Assets and Liabilities, Net2 | | | 0.1 | |
| | | | |
| | | | 100.0 | % |
| |
| 1 | Fund holdings and sector allocations are subject to change at any time and are not recommendations to buy or sell any security. |
| |
| 2 | Investments in securities typically comprise substantially all of the fund’s net assets. Other assets and liabilities include receivables for items such as income earned but not yet received and payables for items such as fund expenses incurred but not yet paid. |
First American Funds Annual Report 2006 29
Large Cap Select fund continued
Annual Performance1
| | | | | | | | | | | | | | | | | |
| | | October 31, 2006 | | September 30, 2006* |
| | | | | |
| | | | | Since | | | | Since |
| | | | | Inception | | | | Inception |
| | | | | | | | | |
| | | 1 year | | 1/31/2003 | | 1 year | | 1/31/2003 |
| Average annual return with sales charge (POP) |
| Class A | | | 4.97% | | | | 12.54% | | | | 0.94% | | | | 12.00% | |
| |
| Class B | | | 5.32% | | | | 12.78% | | | | 1.02% | | | | 12.24% | |
| |
| Class C | | | 9.36% | | | | 13.38% | | | | 5.05% | | | | 12.87% | |
| |
| Average annual return without sales charge (NAV) |
| Class A | | | 11.07% | | | | 14.24% | | | | 6.80% | | | | 13.74% | |
| |
| Class B | | | 10.32% | | | | 13.35% | | | | 6.02% | | | | 12.84% | |
| |
| Class C | | | 10.36% | | | | 13.38% | | | | 6.05% | | | | 12.87% | |
| |
| Class R | | | 10.79% | | | | 13.99% | | | | 6.51% | | | | 13.48% | |
| |
| Class Y | | | 11.37% | | | | 14.53% | | | | 7.10% | | | | 14.02% | |
| |
S&P 500 Index2 | | | 16.34% | | | | 15.62% | | | | 10.79% | | | | 15.00% | |
Value of $10,000 Investment1,3 as of October 31, 2006
The chart above illustrates the total value of an assumed $10,000 investment in the fund’s Class A and Class Y shares (from 1/31/2003 to 10/31/2006) as compared to the S&P 500 Index2.
| |
| The performance data quoted on this page represents past performance and does not guarantee future results. The investment return and principal value of an investment will fluctuate so that an investor’s shares, when redeemed, may be worth more or less than their original cost. Current performance of the fund may be lower or higher than the performance data quoted. Performance data current to the most recent month-end may be obtained by calling 800.677.FUND. |
| |
| * | This table represents average annual total returns through the latest calendar quarter – rather than through the end of the fiscal period. |
| |
| 1 | Performance does not reflect the deduction of taxes that a shareholder would pay on fund distributions or redemption of fund shares. In certain years and/or for certain classes, performance reflects voluntary fee waivers in effect. In the absence of such fee waivers, total returns would be reduced. Index performance is for illustrative purposes only and does not reflect any expenses, transaction costs, or cash flow effects. Direct investment in the index is not available. |
| |
| Mutual fund investing involves risk; principal loss is possible. |
| |
| Total returns at net asset value (“NAV”) reflect performance over the time period indicated without including the fund’s maximum sales charge and assume reinvestment of all distributions at NAV. |
| |
| Total returns at public offering price (“POP”) reflect performance over the time period indicated including maximum sales charges of 5.50% for Class A shares and the contingent deferred sales charge (“CDSC”) for Class B and Class C shares for the relevant period. Maximum CDSC is 5.00% for Class B shares in the first year, decreasing annually to 0% in the seventh year following purchase, and 1.00% for Class C shares. Total returns assume reinvestment of all distributions at NAV. |
| |
| 2 | An unmanaged market capitalization-weighted index based on the average weighted performance of 500 widely held common stocks. |
| |
| 3 | Performance for Class B, Class C, and Class R shares is not presented. Performance for these classes will vary due to the different expense structures. |
30 First American Funds Annual Report 2006
Large Cap Select fund continued
Expense Example
As a shareholder of the Large Cap Select Fund (the “fund”), you incur two types of costs: (1) transaction costs, including sales charges (loads) on purchase payments; and (2) ongoing costs, including investment advisory fees, distribution and/or service (12b-1) fees, and other fund expenses. This example is intended to help you understand your ongoing costs (in dollars) of investing in the fund and to compare these costs with the ongoing costs of investing in other mutual funds. The example is based on an investment of $1,000 invested at the beginning of the period and held for the entire period from May 1, 2006, to October 31, 2006.
Actual Expenses
For each class, the first line of the table below provides information about actual account values and actual expenses. You may use the information in this line, together with the amount you invested, to estimate the expenses that you paid over the period. Simply divide your account value by $1,000 (for example, an $8,600 account value divided by $1,000 = 8.6), then multiply the result by the number in the first line under the heading entitled “Expenses Paid During Period” to estimate the expenses you paid on your account during this period.
Hypothetical Example for Comparison Purposes
For each class, the second line of the table below provides information about hypothetical account values and hypothetical expenses based on the fund’s actual expense ratio and an assumed rate of return of 5% per year before expenses, which is not the fund’s actual return. The hypothetical account values and expenses may not be used to estimate the actual ending account balance or expenses you paid for the period. You may use this information to compare the ongoing costs of investing in the fund and other funds. To do so, compare this 5% hypothetical example with the 5% hypothetical examples that appear in the shareholder reports of the other funds.
Please note that the expenses shown in the table are meant to highlight your ongoing costs only and do not reflect any transactional costs, such as sales charges (loads). Therefore, the second line of the table for each class is useful in comparing ongoing costs only, and will not help you determine the relative total costs of owning different funds. In addition, if these transactional costs were included, your costs would have been higher.
Expense Examples
| | | | | | | | | | | | | |
| | | | | | | Expenses Paid During | |
| | | Beginning Account | | | Ending Account | | | Period1 (5/01/06 to | |
| | | Value (5/01/06) | | | Value (10/31/06) | | | 10/31/06) | |
Class A Actual2 | | $ | 1,000.00 | | | $ | 1,023.70 | | | $ | 6.02 | |
| |
| Class A Hypothetical (5% return before expenses) | | $ | 1,000.00 | | | $ | 1,019.26 | | | $ | 6.01 | |
| |
Class B Actual2 | | $ | 1,000.00 | | | $ | 1,019.80 | | | $ | 9.83 | |
| |
| Class B Hypothetical (5% return before expenses) | | $ | 1,000.00 | | | $ | 1,015.48 | | | $ | 9.80 | |
| |
Class C Actual2 | | $ | 1,000.00 | | | $ | 1,020.50 | | | $ | 9.83 | |
| |
| Class C Hypothetical (5% return before expenses) | | $ | 1,000.00 | | | $ | 1,015.48 | | | $ | 9.80 | |
| |
Class R Actual2 | | $ | 1,000.00 | | | $ | 1,022.80 | | | $ | 7.34 | |
| |
| Class R Hypothetical (5% return before expenses) | | $ | 1,000.00 | | | $ | 1,017.95 | | | $ | 7.32 | |
| |
Class Y Actual2 | | $ | 1,000.00 | | | $ | 1,024.90 | | | $ | 4.75 | |
| |
| Class Y Hypothetical (5% return before expenses) | | $ | 1,000.00 | | | $ | 1,020.52 | | | $ | 4.74 | |
| |
| 1 | Expenses are equal to the fund’s annualized expense ratio for the most recent six-month period of 1.18%, 1.93%, 1.93%, 1.44%, and 0.93% for Class A, Class B, Class C, Class R, and Class Y, respectively, multiplied by the average account value over the period, multiplied by the number of days in the most recent fiscal half-year/365 (to reflect the one-half year period). |
| |
| 2 | Based on the actual returns for the six-month period ended October 31, 2006 of 2.37%, 1.98%, 2.05%, 2.28%, and 2.49% for Class A, Class B, Class C, Class R, and Class Y, respectively. |
First American Funds Annual Report 2006 31
Large Cap Value fund
Investment Objective: primary – capital appreciation; secondary – current income
How did the Fund perform for the fiscal year ended October 31, 2006?
The First American Large Cap Value Fund (the “fund”), Class Y shares, returned 18.23% for the fiscal year ended October 31, 2006 (Class A shares returned 17.93% without taking the sales charge into account). By comparison, the fund’s benchmark, the Russell 1000 Value Index*, returned 21.46% for the same period.
What were the general economic and market conditions during the fiscal year?
Economic growth slowed from very strong levels through the first quarter of 2006 to below-potential levels by the end of October. Inflation pressures rose through much of this period in a lagging response to the very strong growth through the first portion of this year, but diminished considerably by October. The Federal Reserve (“Fed”) continued to tighten monetary policy through June as a result of the increase in inflation pressures, but has kept policy steady since that time as its forecast of slowing economic growth and dissipating inflation pressures has been realized. Corporate profit growth remained strong over this 12-month period with third-quarter 2006 earnings of S&P 500 companies advancing by roughly 20% on a year-over-year basis. The strength in corporate earnings, along with lessening inflation pressures and expectations that the Fed will begin easing monetary policy in 2007, has proved to be favorable for the equity markets through October 2006.
What worked for the fund and why?
Good stock selection in the consumer discretionary, utilities, telecommunications services, and technology sectors made a positive contribution to the fund’s performance. An overweight in the consumer discretionary sector proved beneficial, and the retail area featured particularly strong performers, notably paint store chain Sherwin-Williams, whose results were buoyed by robust construction activity throughout most of the fiscal period, and the venerable JCPenney store chain, which also reported strong results. Standouts in the utilities sector included Exelon Corp. (a Chicago-based electric utility), and Edison International. In telecommunications, our position in Bell South added value following AT&T’s announcement of a bid for the company and the attendant boost to Bell South’s shares. Hewlett-Packard was our top performer in the technology sector; in the midst of a turnaround and under new, reliable management, the company enjoyed not only an improved top line but also better profit margins.
What did not work for the fund and why?
A weaker performance in the financials, energy, and basic materials sectors detracted from the overall performance of the fund. In financials, the fund’s lack of exposure to real estate investment trust stocks was a drawback, since this was the best-performing group in the sector. An underweight in diversified financials, which included investment banks J.P. Morgan, Goldman Sachs, and Lehman Brothers proved counterproductive at a time when these stocks benefited from robust capital markets. In response to rising credit risk, MGIC Investment, a provider of mortgage insurance, had to augment its reserves, which caused the stock to underperform. In the energy sector, the fund’s overweight position in oil service stocks, notably Global Santa Fe and Halliburton, brought disappointing results, as these stocks underperformed oil producer stocks. In materials, Dow Chemical posted weaker results, reflecting a deteriorating price environment for many of its chemical products.
What strategic moves were made by the fund and why?
In terms of strategic positioning, the fund ended the year with its largest overweight in the consumer cyclical and technology sectors as we continue to identify stocks in these sectors that exhibit compelling fundamentals with company-specific catalysts for change. We maintained our underweight position in the financial and utility sectors in our belief that these sectors are enjoying both peak fundamentals and full valuations.
| |
| * | Unlike mutual funds, index returns do not reflect any expenses, transaction costs, or cash flow effects. |
Top 10 Holdings as of October 31, 20061 (% of net assets)
| | | | | |
| Exxon Mobil | | | 5.1% | |
| Bank of America | | | 4.6 | |
| General Electric | | | 3.5 | |
| Wells Fargo | | | 3.0 | |
| J.P. Morgan Chase | | | 3.0 | |
| Morgan Stanley | | | 3.0 | |
| ChevronTexaco | | | 2.9 | |
| First American Prime Obligations Fund, Class Z | | | 2.5 | |
| American International Group | | | 2.3 | |
| Time Warner | | | 2.3 | |
Sector Allocation as of October 31, 20061 (% of net assets)
| | | | | |
| Financials | | | 32.0% | |
| Energy | | | 13.3 | |
| Consumer Discretionary | | | 12.5 | |
| Industrials | | | 8.3 | |
| Information Technology | | | 6.7 | |
| Healthcare | | | 6.4 | |
| Consumer Staples | | | 6.4 | |
| Telecommunication Services | | | 5.2 | |
| Utilities | | | 3.6 | |
| Materials | | | 3.0 | |
| Short-Term Investment | | | 2.5 | |
Other Assets and Liabilities, Net2 | | | 0.1 | |
| | | | |
| | | | 100.0% | |
| |
| 1 | Fund holdings and sector allocations are subject to change at any time and are not recommendations to buy or sell any security. |
| |
| 2 | Investments in securities typically comprise substantially all of the fund’s net assets. Other assets and liabilities include receivables for items such as income earned but not yet received and payables for items such as fund expenses incurred but not yet paid. |
32 First American Funds Annual Report 2006
Large Cap Value fund continued
Annual Performance1
| | | | | | | | | | | | | | | | | | | | | | | | | | | | | | | | | | | | | | | | | |
| | | October 31, 2006 | | September 30, 2006* |
| | | | | |
| | | | | Since Inception | | | | Since Inception |
| | | | | | | | | |
| | | 1 year | | 5 years | | 10 years | | 2/01/1999 | | 9/24/2001 | | 1 year | | 5 years | | 10 years | | 2/01/1999 | | 9/24/2001 |
| Average annual return with sales charge (POP) |
| Class A | | | 11.43% | | | | 7.07% | | | | 6.33% | | | | — | | | | — | | | | 5.56% | | | | 6.63% | | | | 6.37% | | | | — | | | | — | |
| |
| Class B | | | 12.04% | | | | 7.18% | | | | 6.14% | | | | — | | | | — | | | | 5.89% | | | | 6.74% | | | | 6.18% | | | | — | | | | — | |
| |
| Class C | | | 16.05% | | | | 7.47% | | | | — | | | | 3.03% | | | | — | | | | 9.85% | | | | 7.03% | | | | — | | | | 2.68% | | | | — | |
| Average annual return without sales charge (NAV) |
| Class A | | | 17.93% | | | | 8.29% | | | | 6.94% | | | | — | | | | — | | | | 11.72% | | | | 7.85% | | | | 6.97% | | | | — | | | | — | |
| |
| Class B | | | 17.04% | | | | 7.48% | | | | 6.14% | | | | — | | | | — | | | | 10.89% | | | | 7.05% | | | | 6.18% | | | | — | | | | — | |
| |
| Class C | | | 17.05% | | | | 7.47% | | | | — | | | | 3.03% | | | | — | | | | 10.85% | | | | 7.03% | | | | — | | | | 2.68% | | | | — | |
| |
| Class R | | | 17.63% | | | | 8.14% | | | | — | | | | — | | | | 9.07% | | | | 11.34% | | | | 7.73% | | | | — | | | | — | | | | 8.60% | |
| |
| Class Y | | | 18.23% | | | | 8.55% | | | | 7.21% | | | | — | | | | — | | | | 12.00% | | | | 8.13% | | | | 7.25% | | | | — | | | | — | |
| |
Russell 1000 Value Index2 | | | 21.46% | | | | 11.64% | | | | 11.14% | | | | 7.35% | | | | 12.14% | | | | 14.62% | | | | 10.73% | | | | 11.20% | | | | 6.98% | | | | 11.63% | |
Value of $10,000 Investment1, 3 as of October 31, 2006
The chart above illustrates the total value of an assumed $10,000 investment in the fund’s Class A and Class Y shares (from 9/30/1996 to 10/31/2006) as compared to the Russell 1000 Value Index2.
| |
| The performance data quoted on this page represents past performance and does not guarantee future results. The investment return and principal value of an investment will fluctuate so that an investor’s shares, when redeemed, may be worth more or less than their original cost. Current performance of the fund may be lower or higher than the performance data quoted. Performance data current to the most recent month-end may be obtained by calling 800.677.FUND. |
| |
| * | This table represents average annual total returns through the latest calendar quarter – rather than through the end of the fiscal period. |
| |
| 1 | Performance does not reflect the deduction of taxes that a shareholder would pay on fund distributions or redemption of fund shares. In certain years and/or for certain classes, performance reflects voluntary fee waivers in effect. In the absence of such fee waivers, total returns would be reduced. Index performance is for illustrative purposes only and does not reflect any expenses, transaction costs, or cash flow effects. Direct investment in the index is not available. |
| |
| Mutual fund investing involves risk; principal loss is possible. |
| |
| Total returns at net asset value (“NAV”) reflect performance over the time period indicated without including the fund’s maximum sales charge and assume reinvestment of all distributions at NAV. |
| |
| Total returns at public offering price (“POP”) reflect performance over the time period indicated including maximum sales charges of 5.50% for Class A shares and the contingent deferred sales charge (“CDSC”) for Class B and Class C shares for the relevant period. Maximum CDSC is 5.00% for Class B shares in the first year, decreasing annually to 0% in the seventh year following purchase, and 1.00% for Class C shares. Total returns assume reinvestment of all distributions at NAV. |
| |
| 2 | An unmanaged index that measures the performance of those companies in the Russell 1000 Index (large-cap index) with lower price-to-book ratios and lower forecasted growth values. |
| |
| 3 | Performance for Class B, Class C, and Class R shares is not presented. Performance for these classes will vary due to the different expense structures. |
First American Funds Annual Report 2006 33
Large Cap Value fund continued
Expense Example
As a shareholder of the Large Cap Value Fund (the “fund”), you incur two types of costs: (1) transaction costs, including sales charges (loads) on purchase payments; and (2) ongoing costs, including investment advisory fees, distribution and/or service (12b-1) fees, and other fund expenses. This example is intended to help you understand your ongoing costs (in dollars) of investing in the fund and to compare these costs with the ongoing costs of investing in other mutual funds. The example is based on an investment of $1,000 invested at the beginning of the period and held for the entire period from May 1, 2006, to October 31, 2006.
Actual Expenses
For each class, the first line of the table below provides information about actual account values and actual expenses. You may use the information in this line, together with the amount you invested, to estimate the expenses that you paid over the period. Simply divide your account value by $1,000 (for example, an $8,600 account value divided by $1,000 = 8.6), then multiply the result by the number in the first line under the heading entitled “Expenses Paid During Period” to estimate the expenses you paid on your account during this period.
Hypothetical Example for Comparison Purposes
For each class, the second line of the table below provides information about hypothetical account values and hypothetical expenses based on the fund’s actual expense ratio and an assumed rate of return of 5% per year before expenses, which is not the fund’s actual return. The hypothetical account values and expenses may not be used to estimate the actual ending account balance or expenses you paid for the period. You may use this information to compare the ongoing costs of investing in the fund and other funds. To do so, compare this 5% hypothetical example with the 5% hypothetical examples that appear in the shareholder reports of the other funds.
Please note that the expenses shown in the table are meant to highlight your ongoing costs only and do not reflect any transactional costs, such as sales charges (loads). Therefore, the second line of the table for each class is useful in comparing ongoing costs only, and will not help you determine the relative total costs of owning different funds. In addition, if these transactional costs were included, your costs would have been higher.
Expense Examples
| | | | | | | | | | | | | |
| | | | | | | Expenses Paid During | |
| | | Beginning Account | | | Ending Account | | | Period1 (5/01/06 to | |
| | | Value (5/01/06) | | | Value (10/31/06) | | | 10/31/06) | |
Class A Actual2 | | $ | 1,000.00 | | | $ | 1,053.40 | | | $ | 6.16 | |
| |
| Class A Hypothetical (5% return before expenses) | | $ | 1,000.00 | | | $ | 1,019.21 | | | $ | 6.06 | |
| |
Class B Actual2 | | $ | 1,000.00 | | | $ | 1,049.30 | | | $ | 10.02 | |
| |
| Class B Hypothetical (5% return before expenses) | | $ | 1,000.00 | | | $ | 1,015.43 | | | $ | 9.86 | |
| |
Class C Actual2 | | $ | 1,000.00 | | | $ | 1,049.60 | | | $ | 10.02 | |
| |
| Class C Hypothetical (5% return before expenses) | | $ | 1,000.00 | | | $ | 1,015.43 | | | $ | 9.86 | |
| |
Class R Actual2 | | $ | 1,000.00 | | | $ | 1,052.00 | | | $ | 7.45 | |
| |
| Class R Hypothetical (5% return before expenses) | | $ | 1,000.00 | | | $ | 1,017.95 | | | $ | 7.32 | |
| |
Class Y Actual2 | | $ | 1,000.00 | | | $ | 1,054.40 | | | $ | 4.87 | |
| |
| Class Y Hypothetical (5% return before expenses) | | $ | 1,000.00 | | | $ | 1,020.47 | | | $ | 4.79 | |
| |
| 1 | Expenses are equal to the fund’s annualized expense ratio for the most recent six-month period of 1.19%, 1.94%, 1.94%, 1.44%, and 0.94% for Class A, Class B, Class C, Class R, and Class Y, respectively, multiplied by the average account value over the period, multiplied by the number of days in the most recent fiscal half-year/365 (to reflect the one-half year period). |
| |
| 2 | Based on the actual returns for the six-month period ended October 31, 2006 of 5.34%, 4.93%, 4.96%, 5.20%, and 5.44% for Class A, Class B, Class C, Class R, and Class Y, respectively. |
34 First American Funds Annual Report 2006
Balanced fund
Investment Objective: maximize total return (capital appreciation plus income)
How did the fund perform for the fiscal year ended October 31, 2006?
The First American Balanced Fund (the “fund”), Class Y shares, returned 10.92% for the fiscal year ended October 31, 2006 (Class A shares returned 10.73% without taking the sales charge into account). By comparison, the fund’s benchmarks, the Russell 3000 Index* and the Lehman Aggregate Bond Index*, returned 16.37% and 5.19%, respectively, for the same period.
What were the general economic and market conditions during the fiscal year?
Economic growth slowed from very strong levels through the first quarter of 2006 to below-potential levels by the end of October. Inflation pressures rose through much of this period in a lagging response to the very strong growth through the first portion of this year, but diminished considerably by October. The Federal Reserve (“Fed”) continued to tighten monetary policy through June as a result of the increase in inflation pressures, but has kept policy steady since that time as its forecast of slowing economic growth and dissipating inflation pressures has been realized. In the fixed-income market, in response to sustained Fed tightening, the shape of the yield curve continued to flatten, becoming inverted in early 2006, with short-term bond yields rising above those of long-term bonds. Corporate profit growth remained strong over this 12-month period with third-quarter 2006 S&P 500 earnings advancing by roughly 20% on a year-over-year basis. The strength in corporate earnings, along with lessening inflation pressures and expectations that the Fed will begin easing monetary policy in 2007, has proved to be favorable for the equity markets through October 2006.
What worked for the fund and why?
In the stock portion of the fund, good sector allocation was a positive contributor to the fund’s performance. Our overweight position in the financial sector had a positive impact, as did our stock selection in that sector. Driven by the increasing strength of capital markets, the performance of investment banks received a boost. Standouts in this category included Goldman Sachs and Morgan Stanley. Our position in small-cap stocks helped performance, as these stocks fared remarkably well this fiscal year. With continued growth and reasonable valuations abroad, the fund’s exposure to international stocks also added value.
In the fixed-income portion, the fund’s defensive (shorter than index) duration posture, adopted to reduce risk as interest rates rose, proved beneficial. Our positions in high-yield bonds and emerging market bonds (issued by national governments) also provided positive contributions. An overweight in structured and mortgage-backed securities added value, as did good security selection in corporate bonds.
What did not work for the fund and why?
Adverse stock selection detracted from performance in the stock portion of the fund. The most significant detractors from performance were in the technology sector: Motorola, Intel, Qualcomm, and Apple Computer. Because the performance of consumer electronics stocks depends on positive consumer sentiment, during this fiscal year these stocks were negatively affected by rising concerns about consumer-led recession. Our sizable positions in Dow Chemical and Wal-Mart also hurt performance. Since both are highly cyclical stocks, rising quickly when the economy grows and falling just as rapidly when it turns down, both were hurt by the slowing economy and by the growing concerns about potential recession. The fund was underweight in utilities, which performed better than expected, but this underweight had little impact on performance, since good stock selection in the sector compensated for it. Continued inversion of the yield curve detracted modestly from the performance of the fund’s fixed-income portion.
What strategic moves were made by the fund and why?
We maintained the fund’s overweight position in cyclical stocks, believing that’s where the fund’s source of real value lies, even though current prices of these stocks may not reflect it. Convinced that a recession is unlikely and that the Fed is positioned to lower interest rates in 2007, we expect these stocks to benefit in the coming fiscal year. We also maintained the overweight in energy, because, although U.S. economic growth is slowing, the world growth is quite robust, putting continued demand pressures on oil and natural gas producers. To achieve greater diversification, the fund held a small position in small-cap stocks and maintained a modest international position in exchange traded index funds.
During the fiscal year, we moderated the fund’s yield-curve flattening bias, gradually adopting a neutral position in advance of an expected resteepening of the yield curve. In anticipation of a likely end to tightening by the Fed, the fixed-income portion’s interest-rate positioning was brought closer to neutral relative to the index in the latter part of the fiscal year.
| |
| * | Unlike mutual funds, index returns do not reflect any expenses, transaction costs, or cash flow effects. |
Top 10 Holdings as of October 31, 20061 (% of net assets)
| | | | | |
| iShares MSCI EAFE Index Fund | | | 3.1% | |
| American International Group | | | 2.8 | |
| Bank of America | | | 2.6 | |
| First American Prime Obligations Fund, Class Z | | | 2.5 | |
| Exxon Mobil | | | 2.5 | |
| General Electric | | | 2.1 | |
| Wal-Mart Stores | | | 1.8 | |
| Morgan Stanley | | | 1.7 | |
| Gap | | | 1.7 | |
| Comcast, Class A | | | 1.5 | |
Portfolio Allocation as of October 31, 20061 (% of net assets)
| | | | | |
| Stocks | | | 61.0% | |
| Bonds | | | 35.1 | |
| Investment Companies | | | 4.1 | |
| Short-Term Investments | | | 2.5 | |
Other Assets and Liabilities, Net2 | | | (2.7) | |
| | | | |
| | | | 100.0% | |
| |
| 1 | Fund holdings and sector allocations are subject to change at any time and are not recommendations to buy or sell any security. |
| |
| 2 | Investments in securities typically comprise substantially all of the fund’s net assets. Other assets and liabilities include receivables for items such as income earned but not yet received and payables for items such as fund expenses incurred but not yet paid. |
First American Funds Annual Report 2006 35
Balanced fund conti
Annual Performance1
| | | | | | | | | | | | | | | | | | | | | | | | | | | | | | | | | | | | | | | | | | | | | | | | | |
| | | October 31, 2006 | | | September 30, 2006* | |
| | | | | | | |
| | | | | Since Inception | | | | | Since Inception | |
| | | | | | | | | | | |
| | | 1 year | | | 5 years | | | 10 years | | | 3/1/1999 | | | 11/27/2000 | | | 9/24/2001 | | | 1 year | | | 5 years | | | 10 years | | | 3/1/1999 | | | 11/27/2000 | | | 9/24/2001 | |
| Average annual return with sales charge (POP) |
| Class A | | | 4.60% | | | | 5.26% | | | | 5.93% | | | | — | | | | — | | | | — | | | | 1.12% | | | | 5.41% | | | | 5.70% | | | | — | | | | — | | | | — | |
| |
| Class B | | | 4.93% | | | | 5.36% | | | | — | | | | 3.74% | | | | — | | | | — | | | | 1.24% | | | | 5.46% | | | | — | | | | 3.51% | | | | — | | | | — | |
| |
| Class C | | | 8.86% | | | | 5.66% | | | | — | | | | — | | | | — | | | | 6.49% | | | | 5.28% | | | | 5.77% | | | | — | | | | — | | | | — | | | | 6.20% | |
| |
| Average annual return without sales charge (NAV) |
| Class A | | | 10.73% | | | | 6.46% | | | | 6.53% | | | | — | | | | — | | | | — | | | | 7.04% | | | | 6.60% | | | | 6.29% | | | | — | | | | — | | | | — | |
| |
| Class B | | | 9.93% | | | | 5.68% | | | | — | | | | 3.74% | | | | — | | | | — | | | | 6.24% | | | | 5.78% | | | | — | | | | 3.51% | | | | — | | | | — | |
| |
| Class C | | | 9.86% | | | | 5.66% | | | | — | | | | — | | | | — | | | | 6.49% | | | | 6.28% | | | | 5.77% | | | | — | | | | — | | | | — | | | | 6.20% | |
| |
| Class R | | | 10.49% | | | | 6.34% | | | | — | | | | — | | | | 3.12% | | | | — | | | | 6.83% | | | | 6.47% | | | | — | | | | — | | | | 2.82% | | | | — | |
| |
| Class Y | | | 10.92% | | | | 6.73% | | | | 6.81% | | | | — | | | | — | | | | — | | | | 7.33% | | | | 6.85% | | | | 6.58% | | | | — | | | | — | | | | — | |
| |
Russell 3000 Index 2 | | | 16.37% | | | | 8.35% | | | | 8.89% | | | | 4.07% | | | | 3.02% | | | | 9.42% | | | | 10.22% | | | | 8.08% | | | | 8.70% | | | | 3.63% | | | | 2.45% | | | | 8.82% | |
| |
Lehman Aggregate Bond Index3 | | | 5.19% | | | | 4.51% | | | | 6.26% | | | | 5.88% | | | | 6.05% | | | | 4.98% | | | | 3.67% | | | | 4.81% | | | | 6.42% | | | | 5.86% | | | | 6.02% | | | | 4.93% | |
Value of $10,000 Investment1,4 as of October 31, 2006
The chart above illustrates the total value of an assumed $10,000 investment in the fund’s Class A and Class Y shares (from 10/31/1996 to 10/31/2006) as compared to the Russell 3000 Index2 and the Lehman Aggregate Bond Index3.
| |
| The performance data quoted on this page represents past performance and does not guarantee future results. The investment return and principal value of an investment will fluctuate so that an investor’s shares, when redeemed, may be worth more or less than their original cost. Current performance of the fund may be lower or higher than the performance data quoted. Performance data current to the most recent month-end may be obtained by calling 800.677.FUND. |
| |
| * | This table represents average annual total returns through the latest calendar quarter – rather than through the end of the fiscal period. |
| |
| 1 | Performance does not reflect the deduction of taxes that a shareholder would pay on fund distributions or redemption of fund shares. In certain years and/or for certain classes, performance reflects voluntary fee waivers in effect. In the absence of such fee waivers, total returns would be reduced. Index performance is for illustrative purposes only and does not reflect any expenses, transaction costs, or cash flow effects. Direct investment in the index is not available. |
| |
| Mutual fund investing involves risk; principal loss is possible. |
| |
| Total returns at net asset value (“NAV”) reflect performance over the time period indicated without including the fund’s maximum sales charge and assume reinvestment of all distributions at NAV. |
| |
| Total returns at public offering price (“POP”) reflect performance over the time period indicated including maximum sales charges of 5.50% for Class A shares and the contingent deferred sales charge (“CDSC”) for Class B and Class C shares for the relevant period. Maximum CDSC is 5.00% for Class B shares in the first year, decreasing annually to 0% in the seventh year following purchase, and 1.00% for Class C shares. Total returns assume reinvestment of all distributions at NAV. |
| |
| On September 24, 2001, the First American Balanced Fund combined with Firstar Balanced Growth Fund and Firstar Balanced Income Fund. Performance history prior to September 24, 2001, represents that of Firstar Balanced Growth Fund. |
| |
| 2 | An unmanaged index that measures the performance of the 3,000 largest U.S. companies (98% of the investable U.S. equity market) based on total market capitalization. |
| |
| 3 | An unmanaged fixed income index covering the U.S. investment-grade fixed-rate bond market. |
| |
| 4 | Performance for Class B, Class C, and Class R shares is not presented. Performance for these classes will vary due to the different expense structures. |
36 First American Funds Annual Report 2006
Balanced fund conti
Expense Example
As a shareholder of the Balanced Fund (the “fund”), you incur two types of costs: (1) transaction costs, including sales charges (loads) on purchase payments; and (2) ongoing costs, including investment advisory fees, distribution and/or service (12b-1) fees, and other fund expenses. This example is intended to help you understand your ongoing costs (in dollars) of investing in the fund and to compare these costs with the ongoing costs of investing in other mutual funds. The example is based on an investment of $1,000 invested at the beginning of the period and held for the entire period from May 1, 2006, to October 31, 2006.
Actual Expenses
For each class, the first line of the table below provides information about actual account values and actual expenses. You may use the information in this line, together with the amount you invested, to estimate the expenses that you paid over the period. Simply divide your account value by $1,000 (for example, an $8,600 account value divided by $1,000 = 8.6), then multiply the result by the number in the first line under the heading entitled “Expenses Paid During Period” to estimate the expenses you paid on your account during this period.
Hypothetical Example for Comparison Purposes
For each class, the second line of the table below provides information about hypothetical account values and hypothetical expenses based on the fund’s actual expense ratio and an assumed rate of return of 5% per year before expenses, which is not the fund’s actual return. The hypothetical account values and expenses may not be used to estimate the actual ending account balance or expenses you paid for the period. You may use this information to compare the ongoing costs of investing in the fund and other funds. To do so, compare this 5% hypothetical example with the 5% hypothetical examples that appear in the shareholder reports of the other funds.
Please note that the expenses shown in the table are meant to highlight your ongoing costs only and do not reflect any transactional costs, such as sales charges (loads). Therefore, the second line of the table for each class is useful in comparing ongoing costs only, and will not help you determine the relative total costs of owning different funds. In addition, if these transactional costs were included, your costs would have been higher.
Expense Examples
| | | | | | | | | | | | | |
| | | | | | | Expenses Paid During | |
| | | Beginning Account | | | Ending Account | | | Period1 (5/01/06 to | |
| | | Value (5/01/06) | | | Value (10/31/06) | | | 10/31/06) | |
Class A Actual2 | | $ | 1,000.00 | | | $ | 1,025.20 | | | $ | 5.62 | |
| |
| Class A Hypothetical (5% return before expenses) | | $ | 1,000.00 | | | $ | 1,019.66 | | | $ | 5.60 | |
| |
Class B Actual2 | | $ | 1,000.00 | | | $ | 1,021.30 | | | $ | 9.43 | |
| |
| Class B Hypothetical (5% return before expenses) | | $ | 1,000.00 | | | $ | 1,015.88 | | | $ | 9.40 | |
| |
Class C Actual2 | | $ | 1,000.00 | | | $ | 1,021.00 | | | $ | 9.42 | |
| |
| Class C Hypothetical (5% return before expenses) | | $ | 1,000.00 | | | $ | 1,015.88 | | | $ | 9.40 | |
| |
Class R Actual2 | | $ | 1,000.00 | | | $ | 1,023.60 | | | $ | 6.89 | |
| |
| Class R Hypothetical (5% return before expenses) | | $ | 1,000.00 | | | $ | 1,018.40 | | | $ | 6.87 | |
| |
Class Y Actual2 | | $ | 1,000.00 | | | $ | 1,025.60 | | | $ | 4.34 | |
| |
| Class Y Hypothetical (5% return before expenses) | | $ | 1,000.00 | | | $ | 1,020.92 | | | $ | 4.33 | |
| |
| 1 | Expenses are equal to the fund’s annualized expense ratio for the most recent six-month period of 1.10%, 1.85%, 1.85%, 1.35%, and 0.85% for Class A, Class B, Class C, Class R, and Class Y, respectively, multiplied by the average account value over the period, multiplied by the number of days in the most recent fiscal half-year/365 (to reflect the one-half year period). |
| |
| 2 | Based on the actual returns for the six-month period ended October 31, 2006 of 2.52%, 2.13%, 2.10%, 2.36%, and 2.56% for Class A, Class B, Class C, Class R, and Class Y, respectively. |
First American Funds Annual Report 2006 37
Equity Income fund
Investment Objective: long-term growth of capital and income
How did the fund perform for the fiscal year ended October 31, 2006?
The First American Equity Income Fund (the “fund”), Class Y shares, returned 18.89% for the fiscal year ended October 31, 2006 (Class A shares returned 18.66% without taking the sales charge into account). By comparison, the fund’s benchmark, the Standard and Poor’s 500 Index* (“S&P 500 Index”), returned 16.34% for the same period.
What were the general economic and market conditions during the fiscal year?
Economic growth slowed from very strong levels through the first quarter of 2006 to below-potential levels by the end of October. Inflation pressures rose through much of this period in a lagging response to the very strong growth through the first portion of this year, but diminished considerably by October. The Federal Reserve (“Fed”) continued to tighten monetary policy through June as a result of the increase in inflation pressures, but has kept policy steady since that time as its forecast of slowing economic growth and dissipating inflation pressures has been realized. Corporate profit growth remained strong over this 12-month period with third-quarter 2006 earnings of S&P 500 companies advancing by roughly 20% on a year-over-year basis. The strength in corporate earnings, along with lessening inflation pressures and expectations that the Fed will begin easing monetary policy in 2007, has proved to be favorable for the equity markets through October 2006.
What worked for the fund and why?
The fund benefited from both good sector allocation and security selection. We moved to an overweight in the telecommunications sector, where valuations were attractive and dividend yields compelling – an important consideration for a fund with income as one of its objectives. Overweight positions were held in AT&T, Verizon, and Bell South. A subsequent bid for Bell South from AT&T galvanized the entire sector, proving to be the catalyst we were anticipating. We maintained an underweight position in financials, which, in general, were mediocre performers during the year; however, a few individual stocks from this sector added value. AllianceBernstein performed especially well, reflecting investors’ renewed interest in asset management firms, which benefit from a strong stock market. Another important contributor to fund results was ICICI Bank Ltd, an Indian bank with very strong growth prospects in that country. Apartment Investment & Management, a real estate investment trust (REIT), was also a standout performer. We maintained an overweight in basic materials, where Engelhard, a materials science company, was a positive contributor following a buyout offer from chemical giant BASF. Finally, Alliant Energy was an outstanding performer in the utilities sector.
What did not work for the fund and why?
A few of our stock picks performed below expectations. Dropping energy prices had a negative effect on the stock price of British Petroleum. Dow Chemical also posted weaker results, reflecting a deteriorating price environment for many of its chemical products. In technology, Motorola turned in a disappointing performance.
What strategic moves were made by the fund and why?
As mentioned above, we moved to an overweight in telecommunications, which proved beneficial to the fund. We also trimmed our position in the energy sector from a modest overweight early in the fiscal year to an equal weight, taking profits in this sector, which has been a very strong performer over the last couple of years in an environment of rising energy prices. Our outlook is for energy prices to level off, making us less enthusiastic about the future earnings growth potential in this sector.
| |
| * | Unlike mutual funds, index returns do not reflect any expenses, transaction costs, or cash flow effects. |
Top 10 Holdings as of October 31, 20061 (% of net assets)
| | | | | |
| Exxon Mobil | | | 4.2% | |
| Bank of America | | | 3.5 | |
| General Electric | | | 3.4 | |
| American International Group | | | 2.9 | |
| Wyeth Pharmaceuticals | | | 2.9 | |
| Abbott Laboratories | | | 2.9 | |
| Verizon Communications | | | 2.8 | |
| Citigroup | | | 2.8 | |
| Hewlett Packard | | | 2.6 | |
| Johnson & Johnson | | | 2.2 | |
Sector Allocation as of October 31, 20061 (% of net assets)
| | | | | |
| Financials | | | 23.5% | |
| Energy | | | 12.0 | |
| Healthcare | | | 11.8 | |
| Industrials | | | 11.2 | |
| Information Technology | | | 9.3 | |
| Telecommunication Services | | | 8.8 | |
| Consumer Staples | | | 7.9 | |
| Consumer Discretionary | | | 7.3 | |
| Utilities | | | 3.5 | |
| Materials | | | 3.4 | |
| Convertible Corporate Bond | | | 0.4 | |
| Short-Term Investment | | | 1.2 | |
Other Assets and Liabilities, Net2 | | | (0.3) | |
| | | | |
| | | | 100.0% | |
| |
| 1 | Fund holdings and sector allocations are subject to change at any time and are not recommendations to buy or sell any security. |
| |
| 2 | Investments in securities typically comprise substantially all of the fund’s net assets. Other assets and liabilities include receivables for items such as income earned but not yet received and payables for items such as fund expenses incurred but not yet paid. |
38 First American Funds Annual Report 2006
Equity Income fund continued
Annual Performance1
| | | | | | | | | | | | | | | | | | | | | | | | | | | | | | | | | | | | | | | | | |
| | | October 31, 2006 | | September 30, 2006* |
| | | | | |
| | | | | Since Inception | | | | Since Inception |
| | | | | | | | | |
| | | 1 year | | 5 years | | 10 years | | 2/1/1999 | | 9/24/2001 | | 1 year | | 5 years | | 10 years | | 2/1/1999 | | 9/24/2001 |
| Average annual return with sales charge (POP) |
| Class A | | | 12.10% | | | | 6.33% | | | | 8.27% | | | | — | | | | — | | | | 7.12% | | | | 5.65% | | | | 8.17% | | | | — | | | | — | |
| |
| Class B | | | 12.76% | | | | 6.42% | | | | 8.11% | | | | — | | | | — | | | | 7.50% | | | | 5.73% | | | | 8.00% | | | | — | | | | — | |
| |
| Class C | | | 16.80% | | | | 6.71% | | | | — | | | | 4.53% | | | | — | | | | 11.54% | | | | 6.06% | | | | — | | | | 4.18% | | | | — | |
| |
| Average annual return without sales charge (NAV) |
| Class A | | | 18.66% | | | | 7.53% | | | | 8.89% | | | | — | | | | — | | | | 13.37% | | | | 6.85% | | | | 8.78% | | | | — | | | | — | |
| |
| Class B | | | 17.76% | | | | 6.73% | | | | 8.11% | | | | — | | | | — | | | | 12.50% | | | | 6.05% | | | | 8.00% | | | | — | | | | — | |
| |
| Class C | | | 17.80% | | | | 6.71% | | | | — | | | | 4.53% | | | | — | | | | 12.54% | | | | 6.06% | | | | — | | | | 4.18% | | | | — | |
| |
| Class R | | | 18.33% | | | | 7.38% | | | | — | | | | — | | | | 8.20% | | | | 13.05% | | | | 6.73% | | | | — | | | | — | | | | 7.70% | |
| |
| Class Y | | | 18.89% | | | | 7.79% | | | | 9.18% | | | | — | | | | — | | | | 13.61% | | | | 7.11% | | | | 9.08% | | | | — | | | | — | |
| |
S&P 500 Index2 | | | 16.34% | | | | 7.26% | | | | 8.64% | | | | 2.63% | | | | 8.29% | | | | 10.79% | | | | 6.97% | | | | 8.59% | | | | 2.23% | | | | 7.74% | |
| |
S&P 500 Dividend Only Stocks Index3 | | | 17.05% | | | | 7.71% | | | | 9.16% | | | | 4.07% | | | | 7.61% | | | | 11.61% | | | | 7.08% | | | | 9.14% | | | | 3.70% | | | | 7.08% | |
Value of $10,000 Investment1,4 as of October 31, 2006
The chart above illustrates the total value of an assumed $10,000 investment in the fund’s Class A and Class Y shares (from 9/30/1996 to 10/31/2006) as compared to the S&P 500 Index2 and the S&P 500 Dividend Only Stocks Index3.
| |
| The performance data quoted on this page represents past performance and does not guarantee future results. The investment return and principal value of an investment will fluctuate so that an investor’s shares, when redeemed, may be worth more or less than their original cost. Current performance of the fund may be lower or higher than the performance data quoted. Performance data current to the most recent month-end may be obtained by calling 800.677.FUND. |
| |
| * | This table represents average annual total returns through the latest calendar quarter – rather than through the end of the fiscal period. |
| |
| 1 | Performance does not reflect the deduction of taxes that a shareholder would pay on fund distributions or redemption of fund shares. In certain years and/or for certain classes, performance reflects voluntary fee waivers in effect. In the absence of such fee waivers, total returns would be reduced. Index performance is for illustrative purposes only and does not reflect any expenses, transaction costs, or cash flow effects. Direct investment in the index is not available. |
| |
| Mutual fund investing involves risk; principal loss is possible. |
| |
| Total returns at net asset value (“NAV”) reflect performance over the time period indicated without including the fund’s maximum sales charge and assume reinvestment of all distributions at NAV. |
| |
| Total returns at public offering price (“POP”) reflect performance over the time period indicated including maximum sales charges of 5.50% for Class A shares and the contingent deferred sales charge (“CDSC”) for Class B and Class C shares for the relevant period. Maximum CDSC is 5.00% for Class B shares in the first year, decreasing annually to 0% in the seventh year following purchase, and 1.00% for Class C shares. Total returns assume reinvestment of all distributions at NAV. |
| |
| 2 | An unmanaged market capitalization-weighted index based on the average weighted performance of 500 widely held common stocks. |
| |
| 3 | A custom benchmark that is composed of companies in the S&P 500 Index that have an indicated annual dividend. Since inception returns are calculated as of the beginning of the closest month. |
| |
| 4 | Performance for Class B, Class C, and Class R shares is not presented. Performance for these classes will vary due to different expense structures. |
First American Funds Annual Report 2006 39
Equity Income fund continued
Expense Example
As a shareholder of the Equity Income Fund (the “fund”), you incur two types of costs: (1) transaction costs, including sales charges (loads) on purchase payments; and (2) ongoing costs, including investment advisory fees, distribution and/or service (12b-1) fees, and other fund expenses. This example is intended to help you understand your ongoing costs (in dollars) of investing in the fund and to compare these costs with the ongoing costs of investing in other mutual funds. The example is based on an investment of $1,000 invested at the beginning of the period and held for the entire period from May 1, 2006, to October 31, 2006.
Actual Expenses
For each class, the first line of the table below provides information about actual account values and actual expenses. You may use the information in this line, together with the amount you invested, to estimate the expenses that you paid over the period. Simply divide your account value by $1,000 (for example, an $8,600 account value divided by $1,000 = 8.6), then multiply the result by the number in the first line under the heading entitled “Expenses Paid During Period” to estimate the expenses you paid on your account during this period.
Hypothetical Example for Comparison Purposes
For each class, the second line of the table below provides information about hypothetical account values and hypothetical expenses based on the fund’s actual expense ratio and an assumed rate of return of 5% per year before expenses, which is not the fund’s actual return. The hypothetical account values and expenses may not be used to estimate the actual ending account balance or expenses you paid for the period. You may use this information to compare the ongoing costs of investing in the fund and other funds. To do so, compare this 5% hypothetical example with the 5% hypothetical examples that appear in the shareholder reports of the other funds.
Please note that the expenses shown in the table are meant to highlight your ongoing costs only and do not reflect any transactional costs, such as sales charges (loads). Therefore, the second line of the table for each class is useful in comparing ongoing costs only, and will not help you determine the relative total costs of owning different funds. In addition, if these transactional costs were included, your costs would have been higher.
Expense Examples
| | | | | | | | | | | | | |
| | | | | | | Expenses Paid During | |
| | | Beginning Account | | | Ending Account | | | Period1 (5/01/06 to | |
| | | Value (5/01/06) | | | Value (10/31/06) | | | 10/31/06) | |
Class A Actual2 | | $ | 1,000.00 | | | $ | 1,076.50 | | | $ | 6.18 | |
| |
| Class A Hypothetical (5% return before expenses) | | $ | 1,000.00 | | | $ | 1,019.26 | | | $ | 6.01 | |
| |
Class B Actual2 | | $ | 1,000.00 | | | $ | 1,071.90 | | | $ | 10.08 | |
| |
| Class B Hypothetical (5% return before expenses) | | $ | 1,000.00 | | | $ | 1,015.48 | | | $ | 9.80 | |
| |
Class C Actual2 | | $ | 1,000.00 | | | $ | 1,072.50 | | | $ | 10.08 | |
| |
| Class C Hypothetical (5% return before expenses) | | $ | 1,000.00 | | | $ | 1,015.48 | | | $ | 9.80 | |
| |
Class R Actual2 | | $ | 1,000.00 | | | $ | 1,074.60 | | | $ | 7.48 | |
| |
| Class R Hypothetical (5% return before expenses) | | $ | 1,000.00 | | | $ | 1,018.00 | | | $ | 7.27 | |
| |
Class Y Actual2 | | $ | 1,000.00 | | | $ | 1,077.40 | | | $ | 4.87 | |
| |
| Class Y Hypothetical (5% return before expenses) | | $ | 1,000.00 | | | $ | 1,020.52 | | | $ | 4.74 | |
| |
| 1 | Expenses are equal to the fund’s annualized expense ratio for the most recent six-month period of 1.18%, 1.93%, 1.93%, 1.43%, and 0.93% for Class A, Class B, Class C, Class R, and Class Y, respectively, multiplied by the average account value over the period, multiplied by the number of days in the most recent fiscal half-year/365 (to reflect the one-half year period). |
| |
| 2 | Based on the actual returns for the six-month period ended October 31, 2006 of 7.65%, 7.19%, 7.25%, 7.46%, and 7.74% for Class A, Class B, Class C, Class R, and Class Y, respectively. |
40 First American Funds Annual Report 2006
Report of Independent Registered Public Accounting Firm
To the Shareholders and Board of Directors
First American Investment Funds, Inc.
We have audited the accompanying statements of assets and liabilities, including the schedules of investments, of the Real Estate Securities, International, Small Cap Growth Opportunities, Small Cap Select, Small Cap Value, Small-Mid Cap Core, Mid Cap Growth Opportunities, Mid Cap Value, Large Cap Growth Opportunities, Large Cap Select, Large Cap Value, Balanced, and Equity Income Funds (series of First American Investment Funds, Inc.) (collectively, the “funds”) as of October 31, 2006, and the related statements of operations, statements of changes in net assets and financial highlights for each of the periods indicated therein. These financial statements and the financial highlights are the responsibility of the funds’ management. Our responsibility is to express an opinion on these financial statements and financial highlights based on our audits.
We conducted our audits in accordance with the standards of the Public Company Accounting Oversight Board (United States). Those standards require that we plan and perform the audit to obtain reasonable assurance about whether the financial statements and financial highlights are free of material misstatement. We were not engaged to perform an audit of the funds’ internal control over financial reporting. Our audits included consideration of internal control over financial reporting as a basis for designing audit procedures that are appropriate in the circumstances, but not for the purpose of expressing an opinion on the effectiveness of the funds’ internal control over financial reporting. Accordingly, we express no such opinion. An audit also includes examining, on a test basis, evidence supporting the amounts and disclosures in the financial statements and financial highlights, assessing the accounting principles used and significant estimates made by management, and evaluating the overall financial statement presentation. Our procedures included verification by examination of securities held by the custodian as of October 31, 2006 and confirmation of the securities held by correspondence with brokers, or by other appropriate auditing procedures where replies from brokers were not received. We believe that our audits provide a reasonable basis for our opinion.
In our opinion, the financial statements and financial highlights referred to above present fairly, in all material respects, the financial position of the funds listed above of First American Investment Funds, Inc. at October 31, 2006, the results of their operations, the changes in their net assets, and their financial highlights for the periods indicated therein, in conformity with U.S. generally accepted accounting principles.
Minneapolis, Minnesota
December 19, 2006
First American Funds Annual Report 2006 41
Schedule of Investments October 31, 2006, all dollars are rounded to thousands (000)
| | | | | | | | | | |
| Real Estate Securities Fund |
| DESCRIPTION | | SHARES | | | VALUE | |
| |
| Real Estate Common Stock (a) – 98.2% |
| Apartments – 18.0% |
| American Campus Communities (b) (c) | | | 151,051 | | | $ | 4,022 | |
| Archstone-Smith Trust (b) (c) | | | 604,865 | | | | 36,419 | |
| Avalonbay Communities (b) (c) | | | 302,797 | | | | 39,685 | |
| BRE Properties (b) (c) | | | 147,894 | | | | 9,805 | |
| Camden Property Trust (b) (c) | | | 400,419 | | | | 32,322 | |
| Equity Residential Properties Trust (b) (c) | | | 701,265 | | | | 38,296 | |
| Essex Property Trust (b) (c) | | | 105,246 | | | | 14,027 | |
| Mid-America Apartment Communities (b) (c) | | | 71,011 | | | | 4,520 | |
| Post Properties (b) (c) | | | 68,355 | | | | 3,348 | |
| | | | | | | | | |
| | | | | | | | 182,444 | |
| | | | | | | | | |
| Community Centers – 10.8% |
| Agree Realty (b) | | | 30,584 | | | | 1,072 | |
| Developers Diversified Realty (b) (c) | | | 296,512 | | | | 18,058 | |
| Equity One (b) | | | 65,555 | | | | 1,647 | |
| Federal Realty Investment Trust (b) (c) | | | 235,456 | | | | 18,872 | |
| Kimco Realty (b) (c) | | | 600,119 | | | | 26,663 | |
| Kite Realty Group Trust (b) | | | 226,580 | | | | 4,155 | |
| Regency Centers (b) (c) | | | 473,693 | | | | 34,182 | |
| Saul Centers (b) (c) | | | 90,556 | | | | 4,401 | |
| | | | | | | | | |
| | | | | | | | 109,050 | |
| | | | | | | | | |
| Diversified – 5.5% |
| Colonial Properties Trust (b) (c) | | | 28,492 | | | | 1,436 | |
| Cousins Properties (b) (c) | | | 98,505 | | | | 3,523 | |
| Florida East Coast Industries (c) | | | 127,776 | | | | 7,635 | |
| Forest City Enterprises, Class A (c) | | | 81,972 | | | | 4,500 | |
| Vornado Realty Trust (b) (c) | | | 323,451 | | | | 38,572 | |
| | | | | | | | | |
| | | | | | | | 55,666 | |
| | | | | | | | | |
| Healthcare – 6.3% |
| Brookdale Senior Living (c) | | | 182,720 | | | | 8,792 | |
| Capital Senior Living (c) (d) | | | 513,128 | | | | 4,900 | |
| Health Care Property Investors (b) (c) | | | 521,715 | | | | 16,382 | |
| Health Care REIT (b) (c) | | | 107,121 | | | | 4,422 | |
| Sunrise Senior Living (c) (d) | | | 109,183 | | | | 3,408 | |
| Ventas (b) (c) | | | 659,334 | | | | 25,701 | |
| | | | | | | | | |
| | | | | | | | 63,605 | |
| | | | | | | | | |
| Hotels – 7.8% |
| Equity Inns (b) | | | 178,793 | | | | 3,000 | |
| Host Marriott (b) (c) | | | 1,480,881 | | | | 34,149 | |
| LaSalle Hotel Properties (b) (c) | | | 306,579 | | | | 12,953 | |
| Starwood Hotels & Resorts Worldwide | | | 209,179 | | | | 12,496 | |
| Sunstone Hotel Investors (b) (c) | | | 547,683 | | | | 16,135 | |
| | | | | | | | | |
| | | | | | | | 78,733 | |
| | | | | | | | | |
| Industrials – 9.6% |
| AMB Property (b) | | | 336,889 | | | | 19,678 | |
| EastGroup Properties (b) (c) | | | 172,290 | | | | 9,171 | |
| First Potomac Realty Trust (b) (c) | | | 170,502 | | | | 5,275 | |
| Prologis (b) | | | 918,217 | | | | 58,096 | |
| PS Business Parks (b) | | | 85,791 | | | | 5,649 | |
| | | | | | | | | |
| | | | | | | | 97,869 | |
| | | | | | | | | |
| Malls – 11.3% |
| General Growth Properties (b) (c) | | | 468,727 | | | | 24,327 | |
| Macerich (b) (c) | | | 345,066 | | | | 27,726 | |
| Simon Property Group (b) (c) | | | 642,042 | | | | 62,342 | |
| | | | | | | | | |
| | | | | | | | 114,395 | |
| | | | | | | | | |
| Manufactured Homes – 0.6% |
| Equity Lifestyle Properties (b) (c) | | | 117,058 | | | | 5,768 | |
| | | | | | | | | |
| Multifamily – 0.4% |
| Associated Estates Realty (b) | | | 262,665 | | | | 4,321 | |
| | | | | | | | | |
| Net Lease – 0.8% |
| National Retail Properties (b) (c) | | | 381,827 | | | | 8,580 | |
| | | | | | | | | |
| Office – 24.2% |
| Alexandria Real Estate Equities (b) (c) | | | 44,466 | | | | 4,433 | |
| BioMed Realty Trust (b) (c) | | | 437,718 | | | | 14,108 | |
| Boston Properties (b) (c) | | | 407,260 | | | | 43,508 | |
| Brookfield Asset Management (c) | | | 271,617 | | | | 12,098 | |
| Brookfield Properties (c) | | | 734,149 | | | | 27,817 | |
| Cogdell Spencer (b) (e) | | | 334,368 | | | | 7,383 | |
| Columbia Equity Trust (b) | | | 159,258 | | | | 2,733 | |
| Corporate Office Properties Trust (b) (c) | | | 94,509 | | | | 4,516 | |
| Douglas Emmett (b) (c) (d) | | | 488,218 | | | | 11,644 | |
| Duke Realty (b) (c) | | | 125,528 | | | | 5,029 | |
| Equity Office Properties Trust (b) (c) | | | 742,008 | | | | 31,535 | |
| Highwoods Properties (b) (c) | | | 569,076 | | | | 21,739 | |
| Kilroy Realty (b) | | | 193,584 | | | | 14,583 | |
| Liberty Property Trust (b) (c) | | | 280,335 | | | | 13,512 | |
| Maguire Properties (b) (c) | | | 94,259 | | | | 4,030 | |
| SL Green Realty (b) (c) | | | 224,686 | | | | 27,197 | |
| | | | | | | | | |
| | | | | | | | 245,865 | |
| | | | | | | | | |
| Real Estate Service Provider – 0.3% |
| FirstService (d) | | | 107,198 | | | | 2,566 | |
| | | | | | | | | |
| Self Storage – 2.6% |
| Public Storage (b) (c) | | | 294,524 | | | | 26,422 | |
| Sovran Self Storage (b) | | | 7,433 | | | | 438 | |
| | | | | | | | | |
| | | | | | | | 26,860 | |
| | | | | | | | | |
Total Real Estate Common Stock | | | | | | | | |
| | (Cost $729,776) | | | | | | | 995,722 | |
| Private Real Estate Companies – 0.0% |
| Beacon Capital (d) (f) (g) | | | 33,750 | | | | 34 | |
| Newcastle Investment Holdings (d) (f) (g) | | | 35,000 | | | | 211 | |
| | | | | | | | | |
Total Private Real Estate Companies | | | | | | | | |
| | (Cost $588) | | | | | | | 245 | |
| | | | | | | | | |
| Short-Term Investment – 3.6% |
First American Prime Obligations Fund, Class Z (h)
(Cost $36,578) | | | 36,578 | | | | 36,578 | |
| | | | | | | | | |
| Investments Purchased with Proceeds from Securities Lending (i) – 45.3% |
| | (Cost $459,273) | | | | | | | 459,273 | |
| | | | | | | | | |
| Total Investments – 147.1% | | | | | | | | |
| | (Cost $1,226,215) | | | | | | | 1,491,818 | |
| | | | | | | | | |
Other Assets and Liabilities, Net – (47.1)% | | | | | | | (477,772 | ) |
| | | | | | | | | |
Total Net Assets – 100.0% | | | | | | $ | 1,014,046 | |
| | | | | | | | | |
| |
| (a) | The fund is primarily invested in the Real Estate sector and therefore is subject to additional risks. See notes 1 and 6 in Notes to Financial Statements. |
| |
| (b) | Real Estate Investment Trust. As of October 31, 2006, the market value of these investments was $911,510, or 89.9% of total net assets. |
| |
| (c) | This security or a portion of this security is out on loan at October 31, 2006. Total loaned securities had a market value of $447,560 at October 31, 2006. See note 2 in Notes to Financial Statements. |
| |
| (d) | Non-income producing security. |
| |
| (e) | A company is considered to be an affiliate of the fund under the Investment Company Act of 1940 if the fund’s holdings of that company represent 5% or more of the outstanding voting securities of the company. Transactions with |
The accompanying notes are an integral part of the financial statements.
42 First American Funds Annual Report 2006
Real Estate Securities Fund (concluded)
| |
| companies that are or were affiliates during the year ended October 31, 2006 are as follows: |
| | | | | | | | | | | | | | | | | | | | | | | | | |
| | | Beginning | | | Purchase | | | Sales | | | Ending | | | Dividend | | | |
| Issuer | | Cost | | | Cost | | | Cost | | | Cost | | | Income | | | Value | |
| |
| Cogdell Spencer | | $ | 8,056 | | | $ | 3,046 | | | $ | 5,349 | | | $ | 5,753 | | | $ | 487 | | | $ | 7,383 | |
| |
| (f) | Security is considered illiquid or restricted. As of October 31, 2006, the value of these investments was $245 or 0.0% of total net assets. See note 2 in Notes to Financial Statements. |
| |
| (g) | Security is fair valued. As of October 31, 2006, the fair value of these investments was $245 or 0.0% of total net assets. See note 2 in Notes to Financial Statements. |
| |
| (h) | Investment in affiliated security. This money market fund is advised by FAF Advisors, Inc., which also serves as advisor to this fund. See note 3 in Notes to Financial Statements. |
| |
| (i) | The fund may loan securities in return for collateral in the form of cash, U.S. Government securities, or other high grade debt obligations. The cash collateral is invested in various money market funds and short-term, high quality debt obligations, such as repurchase agreements, commercial paper, and other corporated obligations. See note 2 in Notes to Financial Statements. |
First American Funds Annual Report 2006 43
Schedule of Investments October 31, 2006, all dollars are rounded to thousands (000)
| |
| Statement of Assets and Liabilities | October 31, 2006, all dollars and shares are rounded to thousands (000), except for per share data |
| | | | | | | |
| | | Real Estate | | | |
| | | Securities | | | |
| | | Fund | | | |
| |
| Investments in unaffiliated securities, at cost | | $ | 730,364 | | | |
| Investments in affiliated money market fund, at cost | | | 36,578 | | | |
| Investments purchased with proceeds from securities lending, at cost (note 2) | | | 459,273 | | | |
| |
ASSETS: | | | | | | |
| Investments in unaffiliated securities, at value* (note 2) | | $ | 995,967 | | | |
| Investments in affiliated money market fund, at value (note 2) | | | 36,578 | | | |
| Investments purchased with proceeds from securities lending, at value (note 2) | | | 459,273 | | | |
| Receivable for dividends and interest | | | 635 | | | |
| Receivable for investment securities sold | | | 21,752 | | | |
| Receivable for capital shares sold | | | 8,530 | | | |
| Prepaid expenses and other assets | | | 41 | | | |
| |
Total assets | | | 1,522,776 | | | |
| |
LIABILITIES: | | | | | | |
| Payable for investment securities purchased | | | 47,316 | | | |
| Payable upon return of securities loaned (note 2) | | | 459,273 | | | |
| Payable for capital shares redeemed | | | 1,267 | | | |
| Payable to affiliates (note 3) | | | 776 | | | |
| Payable for distribution and shareholder servicing fees | | | 66 | | | |
| Accrued expenses and other liabilities | | | 32 | | | |
| |
Total liabilities | | | 508,730 | | | |
| |
Net assets | | $ | 1,014,046 | | | |
| |
COMPOSITION OF NET ASSETS: | | | | | | |
| Portfolio capital | | $ | 659,425 | | | |
| Accumulated net realized gain on investments | | | 89,018 | | | |
| Net unrealized appreciation of investments | | | 265,603 | | | |
| |
Net assets | | $ | 1,014,046 | | | |
| |
| *Including securities loaned, at value | | $ | 447,560 | | | |
| |
Class A: | | | | | | |
| Net assets | | $ | 228,186 | | | |
| Shares issued and outstanding ($0.0001 par value – 2 billion authorized) | | | 8,615 | | | |
| Net asset value and redemption price per share | | $ | 26.49 | | | |
Maximum offering price per share (1) | | $ | 28.03 | | | |
Class B: | | | | | | |
| Net assets | | $ | 7,288 | | | |
| Shares issued and outstanding ($0.0001 par value – 2 billion authorized) | | | 279 | | | |
Net asset value, offering price and redemption price per share (2) | | $ | 26.08 | | | |
Class C: | | | | | | |
| Net assets | | $ | 12,281 | | | |
| Shares issued and outstanding ($0.0001 par value – 2 billion authorized) | | | 469 | | | |
Net asset value, offering price and redemption price per share (2) | | $ | 26.17 | | | |
Class R: | | | | | | |
| Net assets | | $ | 9,423 | | | |
| Shares issued and outstanding ($0.0001 par value – 2 billion authorized) | | | 353 | | | |
| Net asset value, offering price, and redemption price per share | | $ | 26.72 | | | |
Class Y: | | | | | | |
| Net assets | | $ | 756,868 | | | |
| Shares issued and outstanding ($0.0001 par value – 2 billion authorized) | | | 28,377 | | | |
| Net asset value, offering price, and redemption price per share | | $ | 26.67 | | | |
| |
| | |
| | (1) | The offering price is calculated by dividing the net asset value by 1 minus the maximum sales charge of 5.50% |
| |
| | (2) | Class B and C have a contingent deferred sales charge. For a description of this sales charge, see notes 1 and 3 in Notes to Financial Statements. |
The accompanying notes are an integral part of the financial statements.
44 First American Funds Annual Report 2006
Statement of Operations For the year ended October 31, 2006, all dollars are rounded to thousands (000)
| | | | | | | |
| | | Real Estate | | | |
| | | Securities | | | |
| | | Fund | | | |
| |
INVESTMENT INCOME: | | | | | | |
| Dividends from affiliated securities | | $ | 1,037 | | | |
| Dividends from unaffiliated securities | | | 24,331 | | | |
| Less: Foreign taxes withheld | | | (103 | ) | | |
| Securities lending income | | | 346 | | | |
| |
Total investment income | | | 25,611 | | | |
| |
EXPENSES (note 3): | | | | | | |
| Investment advisory fees | | | 5,443 | | | |
| Administration fees | | | 1,281 | | | |
| Transfer agent fees | | | 700 | | | |
| Custodian fees | | | 40 | | | |
| Professional fees | | | 37 | | | |
| Registration fees | | | 68 | | | |
| Postage and printing fees | | | 54 | | | |
| Directors’ fees | | | 23 | | | |
| Other expenses | | | 24 | | | |
| Distribution and shareholder servicing fees – Class A | | | 434 | | | |
| Distribution and shareholder servicing fees – Class B | | | 52 | | | |
| Distribution and shareholder servicing fees – Class C | | | 64 | | | |
| Distribution and shareholder servicing fees – Class R | | | 21 | | | |
| |
Total expenses | | | 8,241 | | | |
| |
| Less: Fee waivers (note 3) | | | (4 | ) | | |
| Less: Indirect payments from custodian (note 3) | | | (5 | ) | | |
| |
Total net expenses | | | 8,232 | | | |
| |
Investment income – net | | | 17,379 | | | |
| |
REALIZED AND UNREALIZED GAINS ON INVESTMENTS – NET (note 5): | | | | | | |
| Net realized gain on affiliated investments | | | 755 | | | |
| Net realized gain on unaffiliated investments | | | 98,123 | | | |
| Net change in unrealized appreciation or depreciation of investments | | | 169,252 | | | |
| |
Net gain on investments | | | 268,130 | | | |
| |
Net increase in net assets resulting from operations | | $ | 285,509 | | | |
| |
First American Funds Annual Report 2006 45
Statements of Changes in Net Assets all dollars are rounded to thousands (000)
| | | | | | | | | | | | | | | | |
| | | Real Estate | | | |
| | | Securities Fund | | | |
| |
| | | One-Month | | | |
| | | Fiscal Period | | | |
| | | Year Ended | | | Ended | | | Year Ended | | | |
| | | 10/31/06 | | | 10/31/05 | | | 9/30/05 | | | |
| |
| |
OPERATIONS: | | | | | | | | | | | | | | |
| Investment income – net | | $ | 17,379 | | | $ | 908 | | | $ | 22,036 | | | |
| Net realized gain on affiliated investments | | | 755 | | | | — | | | | — | | | |
| Net realized gain on unaffiliated investments | | | 98,123 | | | | 6,604 | | | | 85,317 | | | |
| Net change in unrealized appreciation or depreciation of investments | | | 169,252 | | | | (19,635 | ) | | | 47,167 | | | |
| |
| Net increase (decrease) in net assets resulting from operations | | | 285,509 | | | | (12,123 | ) | | | 154,520 | | | |
| |
| |
DISTRIBUTIONS TO SHAREHOLDERS FROM: | | | | | | | | | | | | | | |
| Investment income – net: | | | | | | | | | | | | | | |
| | Class A | | | (4,468 | ) | | | — | | | | (3,209 | ) | | |
| | Class B | | | (98 | ) | | | — | | | | (92 | ) | | |
| | Class C | | | (122 | ) | | | — | | | | (94 | ) | | |
| | Class R | | | (80 | ) | | | — | | | | (1 | ) | | |
| | Class Y | | | (16,193 | ) | | | — | | | | (14,545 | ) | | |
| Net realized gain on investments: | | | | | | | | | | | | | | |
| | Class A | | | (16,449 | ) | | | — | | | | (7,087 | ) | | |
| | Class B | | | (526 | ) | | | — | | | | (338 | ) | | |
| | Class C | | | (558 | ) | | | — | | | | (326 | ) | | |
| | Class R | | | (24 | ) | | | — | | | | — | | | |
| | Class Y | | | (59,801 | ) | | | — | | | | (32,911 | ) | | |
| |
| Total distributions | | | (98,319 | ) | | | — | | | | (58,603 | ) | | |
| |
| |
CAPITAL SHARE TRANSACTIONS (note 4): | | | | | | | | | | | | | | |
| Class A: | | | | | | | | | | | | | | |
| | Proceeds from sales | | | 96,251 | | | | 2,854 | | | | 45,709 | | | |
| | Reinvestment of distributions | | | 20,510 | | | | — | | | | 10,057 | | | |
| | Payments for redemptions | | | (64,650 | ) | | | (2,840 | ) | | | (24,578 | ) | | |
| |
| Increase in net assets from Class A transactions | | | 52,111 | | | | 14 | | | | 31,188 | | | |
| |
| Class B: | | | | | | | | | | | | | | |
| | Proceeds from sales | | | 2,324 | | | | 61 | | | | 1,148 | | | |
| | Reinvestment of distributions | | | 550 | | | | — | | | | 386 | | | |
| | Payments for redemptions (note 3) | | | (1,261 | ) | | | (253 | ) | | | (1,935 | ) | | |
| |
| Increase (decrease) in net assets from Class B transactions | | | 1,613 | | | | (192 | ) | | | (401 | ) | | |
| |
| Class C: | | | | | | | | | | | | | | |
| | Proceeds from sales | | | 6,990 | | | | 66 | | | | 1,485 | | | |
| | Reinvestment of distributions | | | 634 | | | | — | | | | 395 | | | |
| | Payments for redemptions (note 3) | | | (1,722 | ) | | | (257 | ) | | | (1,887 | ) | | |
| |
| Increase (decrease) in net assets from Class C transactions | | | 5,902 | | | | (191 | ) | | | (7 | ) | | |
| |
| Class R: | | | | | | | | | | | | | | |
| | Proceeds from sales | | | 9,837 | | | | 22 | | | | 56 | | | |
| | Reinvestment of distributions | | | 104 | | | | — | | | | — | | | |
| | Payments for redemptions | | | (1,736 | ) | | | (1 | ) | | | (23 | ) | | |
| |
| Increase in net assets from Class R transactions | | | 8,205 | | | | 21 | | | | 33 | | | |
| |
| Class Y: | | | | | | | | | | | | | | |
| | Proceeds from sales | | | 184,391 | | | | 5,951 | | | | 124,624 | | | |
| | Reinvestment of distributions | | | 40,096 | | | | – | | | | 21,477 | | | |
| | Payments for redemptions | | | (112,601 | ) | | | (16,972 | ) | | | (112,400 | ) | | |
| |
| Increase (decrease) in net assets from Class Y transactions | | | 111,886 | | | | (11,021 | ) | | | 33,701 | | | |
| |
| Increase (decrease) in net assets from capital share transactions | | | 179,717 | | | | (11,369 | ) | | | 64,514 | | | |
| |
| Total increase (decrease) in net assets | | | 366,907 | | | | (23,492 | ) | | | 160,431 | | | |
Net assets at beginning of period | | | 647,139 | | | | 670,631 | | | | 510,200 | | | |
| |
Net assets at end of period | | $ | 1,014,046 | | | $ | 647,139 | | | $ | 670,631 | | | |
| |
Undistributed net investment income at end of period | | $ | — | | | $ | 3,478 | | | $ | 2,805 | | | |
| |
The accompanying notes are an integral part of the financial statements.
46 First American Funds Annual Report 2006
(This page intentionally left blank.)
Financial Highlights For a share outstanding throughout the indicated periods.
| | | | | | | | | | | | | | | | | | | | | | | | | | | | | | | | | | | | | | |
| | | | | | | | | Realized and | | | | | | | | | | | | | | | |
| | | Net Asset | | | | | | | Unrealized | | | | Distributions | | | | Distributions | | | | Distributions | | | | Net Asset | | | |
| | | Value | | | | Net | | | | Gains | | | | from Net | | | | from Net | | | | from | | | | Value | | | |
| | | Beginning | | | | Investment | | | | (Losses) on | | | | Investment | | | | Realized | | | | Return of | | | | End of | | | |
| | | of Period | | | | Income | | | | Investments | | | | Income | | | | Gains | | | | Capital | | | | Period | | | |
| | | | | | | | | | | | | | | | | | | | | | | | | | | |
Real Estate Securities Fund (1) | | | | | | | | | | | | | | | | | | | | | | | | | | | | | | | | | | | | |
| Class A | | | | | | | | | | | | | | | | | | | | | | | | | | | | | | | | | | | | |
| | 2006 (2) | | $ | 21.42 | | | | $ | 0.47 | | | | $ | 7.77 | | | | $ | (0.58 | ) | | | $ | (2.59 | ) | | | $ | — | | | | $ | 26.49 | | | |
| | 2005 (3) | | | 21.81 | | | | | 0.03 | | | | | (0.42 | ) | | | | — | | | | | — | | | | | — | | | | | 21.42 | | | |
| | 2005 (4) | | | 18.62 | | | | | 0.69 | | | | | 4.47 | | | | | (0.55 | ) | | | | (1.42 | ) | | | | — | | | | | 21.81 | | | |
| | 2004 (4) | | | 16.00 | | | | | 0.63 | | | | | 3.21 | | | | | (0.62 | ) | | | | (0.60 | ) | | | | — | | | | | 18.62 | | | |
| | 2003 (4) | | | 13.68 | | | | | 0.69 | | | | | 2.65 | | | | | (0.69 | ) | | | | (0.33 | ) | | | | — | | | | | 16.00 | | | |
| | 2002 (4) | | | 13.12 | | | | | 0.71 | | | | | 0.61 | | | | | (0.69 | ) | | | | — | | | | | (0.07 | ) | | | | 13.68 | | | |
| Class B | | | | | | | | | | | | | | | | | | | | | | | | | | | | | | | | | | | | |
| | 2006 (2) | | $ | 21.14 | | | | $ | 0.29 | | | | $ | 7.66 | | | | $ | (0.42 | ) | | | $ | (2.59 | ) | | | $ | — | | | | $ | 26.08 | | | |
| | 2005 (3) | | | 21.53 | | | | | 0.01 | | | | | (0.40 | ) | | | | — | | | | | — | | | | | — | | | | | 21.14 | | | |
| | 2005 (4) | | | 18.41 | | | | | 0.54 | | | | | 4.40 | | | | | (0.40 | ) | | | | (1.42 | ) | | | | — | | | | | 21.53 | | | |
| | 2004 (4) | | | 15.85 | | | | | 0.50 | | | | | 3.17 | | | | | (0.51 | ) | | | | (0.60 | ) | | | | — | | | | | 18.41 | | | |
| | 2003 (4) | | | 13.55 | | | | | 0.57 | | | | | 2.64 | | | | | (0.58 | ) | | | | (0.33 | ) | | | | — | | | | | 15.85 | | | |
| | 2002 (4) | | | 13.02 | | | | | 0.59 | | | | | 0.61 | | | | | (0.60 | ) | | | | — | | | | | (0.07 | ) | | | | 13.55 | | | |
| Class C | | | | | | | | | | | | | | | | | | | | | | | | | | | | | | | | | | | | |
| | 2006 (2) | | $ | 21.21 | | | | $ | 0.28 | | | | $ | 7.70 | | | | $ | (0.43 | ) | | | $ | (2.59 | ) | | | $ | — | | | | $ | 26.17 | | | |
| | 2005 (3) | | | 21.61 | | | | | 0.01 | | | | | (0.41 | ) | | | | — | | | | | — | | | | | — | | | | | 21.21 | | | |
| | 2005 (4) | | | 18.47 | | | | | 0.54 | | | | | 4.42 | | | | | (0.40 | ) | | | | (1.42 | ) | | | | — | | | | | 21.61 | | | |
| | 2004 (4) | | | 15.89 | | | | | 0.50 | | | | | 3.19 | | | | | (0.51 | ) | | | | (0.60 | ) | | | | — | | | | | 18.47 | | | |
| | 2003 (4) | | | 13.62 | | | | | 0.59 | | | | | 2.62 | | | | | (0.61 | ) | | | | (0.33 | ) | | | | — | | | | | 15.89 | | | |
| | 2002 (4) | | | 13.08 | | | | | 0.62 | | | | | 0.59 | | | | | (0.60 | ) | | | | — | | | | | (0.07 | ) | | | | 13.62 | | | |
| Class R (5) | | | | | | | | | | | | | | | | | | | | | | | | | | | | | | | | | | | | |
| | 2006 (2) | | $ | 21.61 | | | | $ | 0.35 | | | | $ | 7.90 | | | | $ | (0.55 | ) | | | $ | (2.59 | ) | | | $ | — | | | | $ | 26.72 | | | |
| | 2005 (3) | | | 22.00 | | | | | 0.02 | | | | | (0.41 | ) | | | | — | | | | | — | | | | | — | | | | | 21.61 | | | |
| | 2005 (4) | | | 18.80 | | | | | 0.72 | | | | | 4.43 | | | | | (0.53 | ) | | | | (1.42 | ) | | | | — | | | | | 22.00 | | | |
| | 2004 (4) | | | 16.00 | | | | | 0.61 | | | | | 3.24 | | | | | (0.45 | ) | | | | (0.60 | ) | | | | — | | | | | 18.80 | | | |
| | 2003 (4) | | | 13.69 | | | | | 0.69 | | | | | 2.64 | | | | | (0.69 | ) | | | | (0.33 | ) | | | | — | | | | | 16.00 | | | |
| | 2002 (4) | | | 13.12 | | | | | 0.70 | | | | | 0.62 | | | | | (0.68 | ) | | | | — | | | | | (0.07 | ) | | | | 13.69 | | | |
| Class Y | | | | | | | | | | | | | | | | | | | | | | | | | | | | | | | | | | | | |
| | 2006 (2) | | $ | 21.54 | | | | $ | 0.53 | | | | $ | 7.82 | | | | $ | (0.63 | ) | | | $ | (2.59 | ) | | | $ | — | | | | $ | 26.67 | | | |
| | 2005 (3) | | | 21.92 | | | | | 0.03 | | | | | (0.41 | ) | | | | — | | | | | — | | | | | — | | | | | 21.54 | | | |
| | 2005 (4) | | | 18.71 | | | | | 0.74 | | | | | 4.49 | | | | | (0.60 | ) | | | | (1.42 | ) | | | | — | | | | | 21.92 | | | |
| | 2004 (4) | | | 16.06 | | | | | 0.69 | | | | | 3.22 | | | | | (0.66 | ) | | | | (0.60 | ) | | | | — | | | | | 18.71 | | | |
| | 2003 (4) | | | 13.73 | | | | | 0.73 | | | | | 2.66 | | | | | (0.73 | ) | | | | (0.33 | ) | | | | — | | | | | 16.06 | | | |
| | 2002 (4) | | | 13.15 | | | | | 0.73 | | | | | 0.63 | | | | | (0.71 | ) | | | | — | | | | | (0.07 | ) | | | | 13.73 | | | |
| | | | | | | | | | | | | | | | | | | | | | | | | | | | | | | | | |
| | |
| | (1) | Per share data calculated using average shares outstanding method. |
| |
| | (2) | For the period November 1 to October 31 in the year indicated. |
| |
| | (3) | For the period October 1, 2005 to October 31, 2005. Effective October 1, 2005, the fund’s fiscal year end was changed from September 30 to October 31. All ratios for the period have been annualized, except total return and portfolio turnover. |
| |
| | (4) | For the period October 1 to September 30 in the year indicated. |
| |
| | (5) | Prior to July 1, 2004, Class R shares were named Class S shares, which had lower fees and expenses. |
| |
| | (6) | Total return does not reflect sales charges. Total return would have been lower had certain expenses not been waived. |
The accompanying notes are an integral part of the financial statements.
48 First American Funds Annual Report 2006
| | | | | | | | | | | | | | | | | | | | | | | | | | | | | | | | | | | | | |
| | | | | | | | | | | | | | | | | | Ratio of Net | | | | | | |
| | | | | | | | | | | | | | | Ratio of | | | | Investment | | | | | | |
| | | | | | | | | | | | Ratio of Net | | | | Expenses to | | | | Income to | | | | | | |
| | | | | | | | | Ratio of | | | | Investment | | | | Average | | | | Average Net | | | | | | |
| | | | | | Net Assets | | | | Expenses to | | | | Income | | | | Net Assets | | | | Assets | | | | Portfolio | | | |
| | | Total | | | | End of | | | | Average | | | | to Average | | | | (Excluding | | | | (Excluding | | | | Turnover | | | |
| | | Return (6) | | | | Period (000) | | | | Net Assets | | | | Net Assets | | | | Waivers) | | | | Waivers) | | | | Rate | | | |
| | | | | | | | | | | | | | | | | | | | | | | | | | | |
| | | | | | | | | | | | | | | | | | | | | | | | | | | | | | | | | | | | | |
| | | | | | | | |
| | | | 43.25% | | | | $ | 228,186 | | | | | 1.23% | | | | | 2.06% | | | | | 1.23% | | | | | 2.06% | | | | | 161% | | | |
| | | | (1.79 | ) | | | | 133,339 | | | | | 1.23 | | | | | 1.48 | | | | | 1.23 | | | | | 1.48 | | | | | 11 | | | |
| | | | 28.99 | | | | | 135,745 | | | | | 1.23 | | | | | 3.43 | | | | | 1.25 | | | | | 3.41 | | | | | 118 | | | |
| | | | 24.98 | | | | | 86,996 | | | | | 1.23 | | | | | 3.63 | | | | | 1.26 | | | | | 3.60 | | | | | 127 | | | |
| | | | 25.92 | | | | | 35,754 | | | | | 1.23 | | | | | 4.82 | | | | | 1.28 | | | | | 4.77 | | | | | 69 | | | |
| | | | 10.07 | | | | | 15,422 | | | | | 1.23 | | | | | 5.06 | | | | | 1.32 | | | | | 4.97 | | | | | 99 | | | |
| | | | 42.17% | | | | $ | 7,288 | | | | | 1.98% | | | | | 1.30% | | | | | 1.98% | | | | | 1.30% | | | | | 161% | | | |
| | | | (1.81 | ) | | | | 4,419 | | | | | 1.98 | | | | | 0.74 | | | | | 1.98 | | | | | 0.74 | | | | | 11 | | | |
| | | | 27.98 | | | | | 4,700 | | | | | 1.98 | | | | | 2.69 | | | | | 2.00 | | | | | 2.67 | | | | | 118 | | | |
| | | | 24.06 | | | | | 4,412 | | | | | 1.98 | | | | | 2.91 | | | | | 2.01 | | | | | 2.88 | | | | | 127 | | | |
| | | | 25.03 | | | | | 3,559 | | | | | 1.98 | | | | | 4.10 | | | | | 2.03 | | | | | 4.05 | | | | | 69 | | | |
| | | | 9.21 | | | | | 2,577 | | | | | 1.98 | | | | | 4.27 | | | | | 2.07 | | | | | 4.18 | | | | | 99 | | | |
| | | | 42.16% | | | | $ | 12,281 | | | | | 1.98% | | | | | 1.25% | | | | | 1.98% | | | | | 1.25% | | | | | 161% | | | |
| | | | (1.85 | ) | | | | 4,669 | | | | | 1.98 | | | | | 0.75 | | | | | 1.98 | | | | | 0.75 | | | | | 11 | | | |
| | | | 28.00 | | | | | 4,954 | | | | | 1.98 | | | | | 2.68 | | | | | 2.00 | | | | | 2.66 | | | | | 118 | | | |
| | | | 24.12 | | | | | 4,247 | | | | | 1.98 | | | | | 2.92 | | | | | 2.01 | | | | | 2.89 | | | | | 127 | | | |
| | | | 24.88 | | | | | 3,229 | | | | | 1.98 | | | | | 4.12 | | | | | 2.03 | | | | | 4.07 | | | | | 69 | | | |
| | | | 9.27 | | | | | 986 | | | | | 1.98 | | | | | 4.43 | | | | | 2.07 | | | | | 4.34 | | | | | 99 | | | |
| | | | 42.87% | | | | $ | 9,423 | | | | | 1.48% | | | | | 1.50% | | | | | 1.60% | | | | | 1.38% | | | | | 161% | | | |
| | | | (1.77 | ) | | | | 57 | | | | | 1.48 | | | | | 1.23 | | | | | 1.63 | | | | | 1.08 | | | | | 11 | | | |
| | | | 28.60 | | | | | 36 | | | | | 1.48 | | | | | 3.37 | | | | | 1.65 | | | | | 3.20 | | | | | 118 | | | |
| | | | 24.94 | | | | | 1 | | | | | 1.23 | | | | | 3.57 | | | | | 1.26 | | | | | 3.54 | | | | | 127 | | | |
| | | | 25.80 | | | | | 2,524 | | | | | 1.23 | | | | | 4.87 | | | | | 1.28 | | | | | 4.82 | | | | | 69 | | | |
| | | | 10.13 | | | | | 1,224 | | | | | 1.23 | | | | | 5.00 | | | | | 1.32 | | | | | 4.91 | | | | | 99 | | | |
| | | | 43.58% | | | | $ | 756,868 | | | | | 0.98% | | | | | 2.31% | | | | | 0.98% | | | | | 2.31% | | | | | 161% | | | |
| | | | (1.73 | ) | | | | 504,655 | | | | | 0.98 | | | | | 1.74 | | | | | 0.98 | | | | | 1.74 | | | | | 11 | | | |
| | | | 29.25 | | | | | 525,196 | | | | | 0.98 | | | | | 3.66 | | | | | 1.00 | | | | | 3.64 | | | | | 118 | | | |
| | | | 25.33 | | | | | 414,544 | | | | | 0.98 | | | | | 3.95 | | | | | 1.01 | | | | | 3.92 | | | | | 127 | | | |
| | | | 26.19 | | | | | 194,933 | | | | | 0.98 | | | | | 5.13 | | | | | 1.03 | | | | | 5.08 | | | | | 69 | | | |
| | | | 10.40 | | | | | 120,091 | | | | | 0.98 | | | | | 5.27 | | | | | 1.07 | | | | | 5.18 | | | | | 99 | | | |
| | | | | | | | | | | | | | | | | | | | | | | | | | | | | | | | | |
First American Funds Annual Report 2006 49
Schedule of Investments October 31, 2006, all dollars rounded to thousands (000)
| | | | | | | | | | |
| International Fund | |
| DESCRIPTION | | SHARES | | | VALUE | |
| | |
| Common Stocks – 99.0% |
| Australia – 1.7% |
| | BHP Billiton (a) | | | 1,052,000 | | | $ | 22,392 | |
| | Zinifex (a) (b) | | | 630,300 | | | | 7,462 | |
| | | | | | | |
| | | | | | | | 29,854 | |
| | | | | | | |
| Belgium – 1.9% |
| | Dexia | | | 670,000 | | | | 18,073 | |
| | Fortis (a) | | | 370,600 | | | | 15,528 | |
| | | | | | | |
| | | | | | | | 33,601 | |
| | | | | | | |
| Brazil – 1.8% |
| | Companhia Vale do Rio Doce, ADR (a) | | | 731,062 | | | | 18,598 | |
| | Petroleo Brasileiro, ADR | | | 152,125 | | | | 13,503 | |
| | | | | | | |
| | | | | | | | 32,101 | |
| | | | | | | |
| Finland – 1.3% |
| | Nokia Oyj | | | 1,204,770 | | | | 23,947 | |
| | | | | | | |
| France – 13.4% |
| | Accor | | | 182,000 | | | | 12,625 | |
| | Axa (a) | | | 793,332 | | | | 30,181 | |
| | BNP Paribas (a) | | | 272,089 | | | | 29,883 | |
| | Compagnie de Saint-Gobain (a) | | | 385,000 | | | | 28,369 | |
| | Imerys (a) | | | 189,400 | | | | 16,368 | |
| | Lafarge (a) | | | 201,700 | | | | 27,039 | |
| | Sanofi-Aventis (a) | | | 304,700 | | | | 25,946 | |
| | Total (a) (b) | | | 1,062,260 | | | | 71,857 | |
| | | | | | | |
| | | | | | | | 242,268 | |
| | | | | | | |
| Germany – 4.3% |
| | BASF | | | 150,000 | | | | 13,195 | |
| | Bayerische Motoren Werke (BMW) (a) | | | 270,800 | | | | 15,575 | |
| | Deutsche Post | | | 600,000 | | | | 16,606 | |
| | Linde | | | 6,810 | | | | 675 | |
| | SAP (a) | | | 67,250 | | | | 13,356 | |
| | Siemens | | | 211,000 | | | | 18,956 | |
| | | | | | | |
| | | | | | | | 78,363 | |
| | | | | | | |
| Great Britain – 20.7% |
| | Barclays | | | 2,675,000 | | | | 36,042 | |
| | BG Group | | | 1,354,965 | | | | 17,981 | |
| | BHP Billiton | | | 274,000 | | | | 5,276 | |
| | British Land | | | 730,000 | | | | 20,817 | |
| | Centrica (b) | | | 2,130,542 | | | | 13,472 | |
| | GlaxoSmithKline | | | 1,625,000 | | | | 43,307 | |
| | Kingfisher | | | 3,560,521 | | | | 17,861 | |
| | Morrison Supermarket | | | 4,547,700 | | | | 22,334 | |
| | Royal Bank of Scotland | | | 562,600 | | | | 20,027 | |
| | Smith & Nephew | | | 1,781,163 | | | | 17,397 | |
| | Standard Chartered | | | 1,013,000 | | | | 28,498 | |
| | Tesco | | | 5,658,800 | | | | 42,454 | |
| | Vodafone (b) | | | 14,900,325 | | | | 38,394 | |
| | Wolseley | | | 1,250,000 | | | | 29,472 | |
| | WPP Group (b) | | | 1,585,503 | | | | 20,309 | |
| | | | | | | |
| | | | | | | | 373,641 | |
| | | | | | | |
| Hong Kong – 4.6% |
| | Esprit Holdings | | | 2,175,500 | | | | 21,048 | |
| | HSBC (a) | | | 3,290,400 | | | | 62,257 | |
| | | | | | | |
| | | | | | | | 83,305 | |
| | | | | | | |
| Ireland – 0.7% |
| | Bank of Ireland | | | 650,000 | | | | 13,015 | |
| | | | | | | |
| Italy – 5.6% |
| | Banca Intesa | | | 2,083,000 | | | | 14,229 | |
| | Eni (a) | | | 1,815,800 | | | | 54,928 | |
| | Mediaset (a) | | | 802,400 | | | | 8,994 | |
| | Unicredito Italiano (a) | | | 2,803,900 | | | | 23,236 | |
| | | | | | | |
| | | | | | | | 101,387 | |
| | | | | | | |
| Japan – 23.2% |
| | The Bank of Yokohama | | | 1,783,000 | | | | 13,738 | |
| | Canon | | | 460,400 | | | | 24,588 | |
| | Credit Saison (a) | | | 336,900 | | | | 12,182 | |
| | Daikin Industries (a) | | | 430,000 | | | | 12,123 | |
| | Hirose Electric (a) | | | 63,000 | | | | 8,395 | |
| | Honda Motor | | | 464,400 | | | | 16,391 | |
| | Hoya | | | 567,000 | | | | 21,908 | |
| | Mitsubishi UFJ Financial Group | | | 2,651 | | | | 33,626 | |
| | Mitsubishi | | | 979,800 | | | | 18,916 | |
| | Mitsui Fudosan | | | 824,000 | | | | 20,272 | |
| | Mizuho Financial Group | | | 2,622 | | | | 20,381 | |
| | Nidec Corporation (a) | | | 185,700 | | | | 14,204 | |
| | Nikko Cordial (a) | | | 900,000 | | | | 10,744 | |
| | Nippon Oil | | | 925 | | | | 7 | |
| | Nitto Denko (a) | | | 290,200 | | | | 16,513 | |
| | Secom | | | 175,000 | | | | 8,748 | |
| | Seven & I Holdings (a) (b) | | | 545,600 | | | | 17,504 | |
| | Shin-Etsu Chemical | | | 298,000 | | | | 19,535 | |
| | SMC | | | 110,400 | | | | 15,061 | |
| | Sony (a) | | | 389,300 | | | | 15,911 | |
| | Sumitomo Mitsui Financial Group (a) | | | 2,552 | | | | 27,889 | |
| | Sumitomo | | | 1,802,000 | | | | 23,678 | |
| | Toyota Motor | | | 366,400 | | | | 21,634 | |
| | Yamanouchi Pharmaceutical | | | 538,200 | | | | 24,240 | |
| | | | | | | |
| | | | | | | | 418,188 | |
| | | | | | | |
| Mexico – 0.3% |
| | Fomento Economico Mexicano, ADR | | | 63,400 | | | | 6,130 | |
| | | | | | | |
| Netherlands – 3.9% |
| | ING Groep | | | 474,900 | | | | 21,033 | |
| | Philips Electronics | | | 447,000 | | | | 15,570 | |
| | Reed Elsevier | | | 1,032,124 | | | | 17,624 | |
| | Wolters Kluwer | | | 589,700 | | | | 16,206 | |
| | | | | | | |
| | | | | | | | 70,433 | |
| | | | | | | |
| South Korea – 0.8% |
| | Samsung Electronics | | | 20,830 | | | | 13,488 | |
| Spain – 2.1% |
| | Altadis | | | 270,000 | | | | 12,913 | |
| | Banco Bilbano Vizcaya Argentaria (a) | | | 1,031,100 | | | | 24,886 | |
| | | | | | | |
| | | | | | | | 37,799 | |
| | | | | | | |
| Sweden – 1.4% |
| | Ericsson | | | 6,746,500 | | | | 25,501 | |
| | | | | | | |
| Switzerland – 11.3% |
| | Adecco (a) | | | 247,600 | | | | 15,269 | |
| | Holcim | | | 300,000 | | | | 25,833 | |
| | Nestle | | | 95,560 | | | | 32,654 | |
| | Novartis | | | 570,100 | | | | 34,606 | |
| | Roche | | | 183,600 | | | | 32,146 | |
| | UBS (b) | | | 741,400 | | | | 44,271 | |
| | Zurich Financial Services | | | 78,800 | | | | 19,468 | |
| | | | | | | |
| | | | | | | | 204,247 | |
| | | | | | | |
Total Common Stocks
(Cost $1,331,666) | | | | | | | 1,787,268 | |
| | | | | | | |
The accompanying notes are an integral part of the financial statements.
50 First American Funds Annual Report 2006
| | | | | | | | | |
| Short-Term Investment – 1.1% |
State Street GA Prime Fund
(Cost $20,232) | | | 20,232,436 | | | $ | 20,232 | |
| | | | | | | | | |
| Investments Purchased with Proceeds from Securities Lending (c) – 20.2% |
State Street Navigator Prime Fund (Cost $365,779) | | | 362,456,591 | | | | 365,779 | |
| | | | | | | | | |
Total Investments 120.3%
(Cost $1,717,677) | | | | | | | 2,173,279 | |
| | | | | | | | | |
Other Assets and Liabilities, Net – (20.3)% | | | | | | | (367,314 | ) |
| | | | | | | | | |
Total Net Assets – 100.0% | | | | | | $ | 1,805,965 | |
| | | | | | | | | |
| |
| (a) | This security or a portion of this security is out on loan at October 31, 2006. Total loaned securities had a market value of $362,457 at October 31, 2006. See note 2 in Notes to Financial Statements. |
| |
| (b) | Non-income producing security. |
| |
| (c) | The fund may loan securities in return for collateral in the form of cash, U.S. Government securities, or other high grade debt obligations. The cash collateral is invested as noted above. See note 2 in Notes to Financial Statements. |
ADR – American Depository Receipt
At October 31, 2006, sector diversification of the fund was as follows:
| | | | | | | | | |
| | | % of Net | | | |
| | | Assets | | | Value | |
| |
Foreign Common Stock | | | | | | | | |
| Financials* | | | 31.0 | % | | $ | 560,276 | |
| Industrials | | | 14.4 | | | | 259,055 | |
| Consumer Discretionary | | | 10.9 | | | | 196,943 | |
| Healthcare | | | 9.8 | | | | 177,642 | |
| Materials | | | 9.6 | | | | 172,886 | |
| Information Technology | | | 8.1 | | | | 145,387 | |
| Consumer Staples | | | 6.5 | | | | 116,485 | |
| Energy | | | 5.5 | | | | 99,891 | |
| Telecommunication Services | | | 2.1 | | | | 38,394 | |
| Utilities | | | 1.1 | | | | 20,309 | |
| | | | | | | | | |
Total Foreign Common Stock | | | 99.0 | | | | 1,787,268 | |
Total Short-Term Investment | | | 1.1 | | | | 20,232 | |
Total Investments Purchased with Proceeds from Securities Lending | | | 20.2 | | | | 365,779 | |
| | | | | | | | | |
Total Investments | | | 120.3 | | | | 2,173,279 | |
| | | | | | | | | |
Other Assets and Liabilities, Net | | | (20.3 | ) | | | (367,314 | ) |
| | | | | | | | | |
Net Assets | | | 100 | % | | $ | 1,805,965 | |
| | | | | | | | | |
| |
| * | The fund is significantly invested in this sector and therefore is subject to additional risks. See note 6 in Notes to Financial Statements. |
First American Funds Annual Report 2006 51
| |
| Statement of Assets and Liabilities | October 31, 2006, all dollars and shares are rounded to thousands (000), except for per share data |
| | | | | | | |
| | | International | | | |
| | | Fund | | | |
| |
| Investments in securities, at cost | | $ | 1,351,898 | | | |
| Investments purchased with proceeds from securities lending at cost (note 2) | | | 365,779 | | | |
| |
ASSETS: | | | | | | |
| Investments in securities, at value* (note 2) | | $ | 1,807,500 | | | |
| Investments purchased with proceeds from securities lending (note 2) | | | 365,779 | | | |
| Receivable for dividends and interest | | | 3,587 | | | |
| Receivable for investment securities sold | | | 1,119 | | | |
| Receivable for capital shares sold | | | 456 | | | |
| Receivable for foreign withholding tax reclaim | | | 121 | | | |
| Prepaid expenses and other assets | | | 39 | | | |
| |
Total assets | | | 2,178,601 | | | |
| |
LIABILITIES: | | | | | | |
| Bank overdraft | | | 908 | | | |
| Payable for capital shares redeemed | | | 3,991 | | | |
| Payable upon return of securities loaned (note 2) | | | 365,779 | | | |
| Payable to affiliates (note 3) | | | 1,866 | | | |
| Payable for distribution and shareholder servicing fees | | | 24 | | | |
| Accrued expenses and other liabilities | | | 68 | | | |
| |
Total liabilities | | | 372,636 | | | |
| |
Net assets | | $ | 1,805,965 | | | |
| |
COMPOSITION OF NET ASSETS: | | | | | | |
| Portfolio capital | | $ | 1,310,946 | | | |
| Undistributed net investment income | | | 17,166 | | | |
| Accumulated net realized gain on investments and foreign currency transactions | | | 22,211 | | | |
| Net unrealized appreciation of investments | | | 455,602 | | | |
| Net unrealized appreciation of foreign currency, and translation of other assets and liabilities in foreign currency | | | 40 | | | |
| |
Net assets | | $ | 1,805,965 | | | |
| |
| *Including securities loaned, at value | | $ | 362,457 | | | |
| |
Class A: | | | | | | |
| Net assets | | $ | 52,489 | | | |
| Shares issued and outstanding ($0.0001 par value – 2 billion authorized) | | | 3,547 | | | |
| Net asset value and redemption price per share | | $ | 14.80 | | | |
Maximum offering price per share (1) | | $ | 15.66 | | | |
Class B: | | | | | | |
| Net assets | | $ | 7,172 | | | |
| Shares issued and outstanding ($0.0001 par value – 2 billion authorized) | | | 525 | | | |
Net asset value, offering price and redemption price per share (2) | | $ | 13.65 | | | |
Class C: | | | | | | |
| Net assets | | $ | 8,049 | | | |
| Shares issued and outstanding ($0.0001 par value – 2 billion authorized) | | | 569 | | | |
Net asset value, offering price and redemption price per share (2) | | $ | 14.13 | | | |
Class R: | | | | | | |
| Net assets | | $ | 1 | | | |
| Shares issued and outstanding ($0.0001 par value – 2 billion authorized) | | | — | (3) | | |
| Net asset value, offering price, and redemption price per share | | $ | 14.81 | | | |
Class Y: | | | | | | |
| Net assets | | $ | 1,738,254 | | | |
| Shares issued and outstanding ($0.0001 par value – 2 billion authorized) | | | 115,980 | | | |
| Net asset value, offering price, and redemption price per share | | $ | 14.99 | | | |
| |
| | |
| | (1) | The offering price is calculated by dividing the net asset value by 1 minus the maximum sales charge of 5.50%. |
| |
| | (2) | Class B and C have a contingent deferred sales charge. For a description of this sales charge, see notes 1 and 3 in Notes to Financial Statements. |
| |
| | (3) | Due to the presentation of the financial statements in thousands, the number rounds to zero. |
The accompanying notes are an integral part of the financial statements.
52 First American Funds Annual Report 2006
Statement of Operations For the year ended October 31, 2006, all dollars are rounded to thousands (000)
| | | | | | | |
| | | International | | | |
| | | Fund | | | |
| |
INVESTMENT INCOME: | | | | | | |
| Interest | | $ | 701 | | | |
| Dividends | | | 43,388 | | | |
| Less: Foreign taxes withheld | | | (3,754 | ) | | |
| Securities lending income | | | 1,318 | | | |
| |
Total investment income | | | 41,653 | | | |
| |
EXPENSES (note 3): | | | | | | |
| Investment advisory fees | | | 17,224 | | | |
| Administration fees | | | 2,787 | | | |
| Transfer agent fees | | | 1,629 | | | |
| Custodian fees | | | 365 | | | |
| Professional fees | | | 41 | | | |
| Registration fees | | | 53 | | | |
| Postage and printing fees | | | 100 | | | |
| Directors’ fees | | | 35 | | | |
| Other expenses | | | 29 | | | |
| Distribution and shareholder servicing fees – Class A | | | 128 | | | |
| Distribution and shareholder servicing fees – Class B | | | 70 | | | |
| Distribution and shareholder servicing fees – Class C | | | 81 | | | |
| Distribution and shareholder servicing fees – Class R | | | — | (1) | | |
| |
Total expenses | | | 22,542 | | | |
| |
| Less: Fee waivers (note 3) | | | (9 | ) | | |
| Less: Indirect payments from custodian (note 3) | | | (553 | ) | | |
| |
Total net expenses | | | 21,980 | | | |
| |
Investment income – net | | | 19,673 | | | |
| |
REALIZED AND UNREALIZED GAINS (LOSSES) ON INVESTMENTS AND FOREIGN CURRENCY TRANSACTIONS – NET(note 5): | | | | | | |
| Net realized gain on investments | | | 90,776 | | | |
| Net realized loss on foreign currency transactions | | | (677 | ) | | |
| Net change in unrealized appreciation or depreciation of investments | | | 265,816 | | | |
| Net change in unrealized appreciation or depreciation of foreign currency, and translation of other assets and liabilities denominated in foreign currency | | | 103 | | | |
| |
Net gain on investments and foreign currency transactions | | | 356,018 | | | |
| |
Net increase in net assets resulting from operations | | $ | 375,691 | | | |
| |
| | |
| | (1) | Due to the presentation of the financial statements in thousands, the number rounds to zero. |
First American Funds Annual Report 2006 53
Statements of Changes in Net Assets all dollars are rounded to thousands (000)
| | | | | | | | | | | | | | | | |
| | | International | | | |
| | | Fund | | | |
| |
| | | One-Month | | | |
| | | Fiscal Period | | | |
| | | Year Ended | | | Ended | | | Year Ended | | | |
| | | 10/31/06 | | | 10/31/05 | | | 9/30/05 | | | |
| |
OPERATIONS: | | | | | | | | | | | | | | |
| Investment income – net | | $ | 19,673 | | | $ | 1,081 | | | $ | 14,779 | | | |
| Net realized gain on investments | | | 90,776 | | | | 4,244 | | | | 158,132 | | | |
| Net realized gain (loss) on foreign currency transactions | | | (677 | ) | | | (48 | ) | | | 1,417 | | | |
| Net change in unrealized appreciation or depreciation of investments | | | 265,816 | | | | (34,720 | ) | | | 89,806 | | | |
| Net change in unrealized appreciation or depreciation of foreign currency, and translation of other assets and liabilities denominated in foreign currency | | | 103 | | | | (8 | ) | | | (35 | ) | | |
| |
| Net increase (decrease) in net assets resulting from operations | | | 375,691 | | | | (29,451 | ) | | | 264,099 | | | |
| |
DISTRIBUTIONS TO SHAREHOLDERS FROM: | | | | | | | | | | | | | | |
| Investment income – net: | | | | | | | | | | | | | | |
| | Class A | | | (525 | ) | | | — | | | | (273 | ) | | |
| | Class B | | | (23 | ) | | | — | | | | — | | | |
| | Class C | | | (22 | ) | | | — | | | | — | | | |
| | Class R: | | | — | | | | — | | | | — | | | |
| | Class Y | | | (19,388 | ) | | | — | | | | (9,941 | ) | | |
| |
| Total distributions | | | (19,958 | ) | | | — | | | | (10,214 | ) | | |
| |
CAPITAL SHARE TRANSACTIONS (note 4): | | | | | | | | | | | | | | |
| Class A: | | | | | | | | | | | | | | |
| | Proceeds from sales | | | 12,874 | | | | 1,375 | | | | 10,293 | | | |
| | Reinvestment of distributions | | | 475 | | | | — | | | | 259 | | | |
| | Payments for redemptions | | | (19,829 | ) | | | (874 | ) | | | (15,029 | ) | | |
| |
| Increase (decrease) in net assets from Class A transactions | | | (6,480 | ) | | | 501 | | | | (4,477 | ) | | |
| |
| Class B: | | | | | | | | | | | | | | |
| | Proceeds from sales | | | 1,144 | | | | 142 | | | | 594 | | | |
| | Reinvestment of distributions | | | 23 | | | | — | | | | — | | | |
| | Payments for redemptions (note 3) | | | (2,076 | ) | | | (196 | ) | | | (2,481 | ) | | |
| |
| Decrease in net assets from Class B transactions | | | (909 | ) | | | (54 | ) | | | (1,887 | ) | | |
| |
| Class C: | | | | | | | | | | | | | | |
| | Proceeds from sales | | | 902 | | | | 28 | | | | 755 | | | |
| | Reinvestment of distributions | | | 21 | | | | — | | | | — | | | |
| | Payments for redemptions (note 3) | | | (2,057 | ) | | | (267 | ) | | | (2,929 | ) | | |
| |
| Decrease in net assets from Class C transactions | | | (1,134 | ) | | | (239 | ) | | | (2,174 | ) | | |
| |
| Class R: | | | | | | | | | | | | | | |
| | Proceeds from sales | | | 1 | | | | — | | | | 400 | | | |
| | Reinvestment of distributions | | | — | | | | — | | | | — | | | |
| | Payments for redemptions | | | (2 | ) | | | (161 | ) | | | (244 | ) | | |
| |
| Increase (decrease) in net assets from Class R transactions | | | (1 | ) | | | (161 | ) | | | 156 | | | |
| |
| Class Y: | | | | | | | | | | | | | | |
| | Proceeds from sales | | | 230,406 | | | | 34,804 | | | | 320,811 | | | |
| | Reinvestment of distributions | | | 11,130 | | | | — | | | | 6,151 | | | |
| | Payments for redemptions | | | (361,882 | ) | | | (13,103 | ) | | | (191,834 | ) | | |
| |
| Increase (decrease) in net assets from Class Y transactions | | | (120,346 | ) | | | 21,701 | | | | 135,128 | | | |
| |
| Increase (decrease) in net assets from capital share transactions | | | (128,870 | ) | | | 21,748 | | | | 126,746 | | | |
| |
| Total increase (decrease) in net assets | | | 226,863 | | | | (7,703 | ) | | | 380,631 | | | |
Net assets at beginning of period | | | 1,579,102 | | | | 1,586,805 | | | | 1,206,174 | | | |
| |
Net assets at end of period | | $ | 1,805,965 | | | $ | 1,579,102 | | | $ | 1,586,805 | | | |
| |
Undistributed net investment income at end of period | | $ | 17,166 | | | $ | 18,107 | | | $ | 17,074 | | | |
| |
The accompanying notes are an integral part of the financial statements.
54 First American Funds Annual Report 2006
(This page intentionally left blank.)
Financial Highlights For a share outstanding throughout the indicated periods.
| | | | | | | | | | | | | | | | | | | | | | | | | | | | | |
| | | | | | | | | Realized and | | | | | | | | | | |
| | | Net Asset | | | | | | | Unrealized | | | | Distributions | | | | Net Asset | | | | |
| | | Value | | | | Net | | | | Gains | | | | from Net | | | | Value | | | | |
| | | Beginning | | | | Investment | | | | (Losses) on | | | | Investment | | | | End of | | | | |
| | | of Period | | | | Income (Loss) | | | | Investments | | | | Income | | | | Period | | | | |
| | | | | | | | | | | | | | | | | | | | |
International Fund (1) | | | | | | | | | | | | | | | | | | | | | | | | | | | |
| Class A | | | | | | | | | | | | | | | | | | | | | | | | | | | |
| | 2006 (2) | | $ | 12.01 | | | | $ | 0.12 | | | | $ | 2.80 | | | | $ | (0.13 | ) | | | $ | 14.80 | | | | |
| | 2005 (3) | | | 12.24 | | | | | 0.01 | | | | | (0.24 | ) | | | | — | | | | | 12.01 | | | | |
| | 2005 (4) | | | 10.19 | | | | | 0.09 | | | | | 2.02 | | | | | (0.06 | ) | | | | 12.24 | | | | |
| | 2004 (4) | | | 8.99 | | | | | 0.03 | | | | | 1.22 | | | | | (0.05 | ) | | | | 10.19 | | | | |
| | 2003 (4) | | | 7.33 | | | | | 0.06 | | | | | 1.60 | | | | | — | | | | | 8.99 | | | | |
| | 2002 (4) | | | 8.96 | | | | | — | | | | | (1.63 | ) | | | | — | | | | | 7.33 | | | | |
| Class B | | | | | | | | | | | | | | | | | | | | | | | | | | | |
| | 2006 (2) | | $ | 11.09 | | | | $ | 0.02 | | | | $ | 2.58 | | | | $ | (0.04 | ) | | | $ | 13.65 | | | | |
| | 2005 (3) | | | 11.31 | | | | | — | | | | | (0.22 | ) | | | | — | | | | | 11.09 | | | | |
| | 2005 (4) | | | 9.43 | | | | | — | | | | | 1.88 | | | | | — | | | | | 11.31 | | | | |
| | 2004 (4) | | | 8.34 | | | | | (0.05 | ) | | | | 1.14 | | | | | — | | | | | 9.43 | | | | |
| | 2003 (4) | | | 6.85 | | | | | — | | | | | 1.49 | | | | | — | | | | | 8.34 | | | | |
| | 2002 (4) | | | 8.45 | | | | | (0.06 | ) | | | | (1.54 | ) | | | | — | | | | | 6.85 | | | | |
| Class C | | | | | | | | | | | | | | | | | | | | | | | | | | | |
| | 2006 (2) | | $ | 11.47 | | | | $ | 0.02 | | | | $ | 2.67 | | | | $ | (0.03 | ) | | | $ | 14.13 | | | | |
| | 2005 (3) | | | 11.70 | | | | | — | | | | | (0.23 | ) | | | | — | | | | | 11.47 | | | | |
| | 2005 (4) | | | 9.76 | | | | | — | | | | | 1.94 | | | | | — | | | | | 11.70 | | | | |
| | 2004 (4) | | | 8.63 | | | | | (0.05 | ) | | | | 1.18 | | | | | — | | | | | 9.76 | | | | |
| | 2003 (4) | | | 7.09 | | | | | — | | | | | 1.54 | | | | | — | | | | | 8.63 | | | | |
| | 2002 (4) | | | 8.75 | | | | | (0.06 | ) | | | | (1.60 | ) | | | | — | | | | | 7.09 | | | | |
| Class R (5) | | | | | | | | | | | | | | | | | | | | | | | | | | | |
| | 2006 (2) | | $ | 11.94 | | | | $ | 0.05 | | | | $ | 2.82 | | | | $ | — | | | | $ | 14.81 | | | | |
| | 2005 (3) | | | 12.17 | | | | | (0.02 | ) | | | | (0.21 | ) | | | | — | | | | | 11.94 | | | | |
| | 2005 (4) | | | 10.11 | | | | | 0.09 | | | | | 1.97 | | | | | — | | | | | 12.17 | | | | |
| | 2004 (4) | | | 8.98 | | | | | (0.01 | ) | | | | 1.19 | | | | | (0.05 | ) | | | | 10.11 | | | | |
| | 2003 (4) | | | 7.31 | | | | | 0.04 | | | | | 1.63 | | | | | — | | | | | 8.98 | | | | |
| | 2002 (4) | | | 8.96 | | | | | 0.01 | | | | | (1.66 | ) | | | | — | | | | | 7.31 | | | | |
| Class Y | | | | | | | | | | | | | | | | | | | | | | | | | | | |
| | 2006 (2) | | $ | 12.16 | | | | $ | 0.16 | | | | $ | 2.83 | | | | $ | (0.16 | ) | | | $ | 14.99 | | | | |
| | 2005 (3) | | | 12.39 | | | | | 0.01 | | | | | (0.24 | ) | | | | — | | | | | 12.16 | | | | |
| | 2005 (4) | | | 10.31 | | | | | 0.12 | | | | | 2.05 | | | | | (0.09 | ) | | | | 12.39 | | | | |
| | 2004 (4) | | | 9.10 | | | | | 0.06 | | | | | 1.23 | | | | | (0.08 | ) | | | | 10.31 | | | | |
| | 2003 (4) | | | 7.40 | | | | | 0.09 | | | | | 1.61 | | | | | — | | | | | 9.10 | | | | |
| | 2002 (4) | | | 9.03 | | | | | 0.03 | | | | | (1.66 | ) | | | | — | | | | | 7.40 | | | | |
| | | | | | | | | | | | | | | | | | | | | | | | |
| | |
| | (1) | Per share data calculated using average shares outstanding method. |
| |
| | (2) | For the period November 1, 2005 to October 31, 2006. |
| |
| | (3) | For the period October 1, 2005 to October 31, 2005. Effective October 1, 2005, the fund’s fiscal year end was changed from September 30 to October 31. All ratios for the period have been annualized, except total return and portfolio turnover. |
| |
| | (4) | For the period October 1 to September 30 in the year indicated. |
| |
| | (5) | Prior to July 1, 2004, Class R shares were named Class S shares, which had lower fees and expenses. |
| |
| | (6) | Total return does not reflect sales charges. Total return would have been lower had certain expenses not been waived. |
| |
| | (7) | In 2003, 0.14% of Class R share’s and 0.13% of Class Y share’s total return was a result of the reimbursement by the adviser related to foreign currency principal trades between the International Fund and U.S. Bank. Excluding the reimbursement, total return for Class R and Class Y shares would have been 22.71% and 22.84%, respectively. |
The accompanying notes are an integral part of the financial statements.
56 First American Funds Annual Report 2006
| | | | | | | | | | | | | | | | | | | | | | | | | | | | | | | | | | | | |
| | | | | | | | | | | | | | | | | | Ratio of Net | | | | | |
| | | | | | | | | | | | | | | Ratio of | | | | Investment | | | | | |
| | | | | | | | | | | | Ratio of Net | | | | Expenses to | | | | Income (Loss) | | | | | |
| | | | | | | | | Ratio of | | | | Investment | | | | Average | | | | to Average | | | | | |
| | | | | | Net Assets | | | | Expenses to | | | | Income (Loss) | | | | Net Assets | | | | Net Assets | | | Portfolio | | | |
| | | Total | | | | End of | | | | Average | | | | to Average | | | | (Excluding | | | | (Excluding | | | Turnover | | | |
| | | Return (6) | | | | Period (000) | | | | Net Assets | | | | Net Assets | | | | Waivers) | | | | Waivers) | | | Rate | | | |
| | | | | | | | | | | | | | | | | | | | | | | |
| | | | 24.50 | % | | | $ | 52,489 | | | | | 1.51 | % | | | | 0.89 | % | | | | 1.54 | % | | | | 0.86 | % | | | 17 | % | | |
| | | | (1.88 | ) | | | | 48,439 | | | | | 1.51 | | | | | 0.58 | | | | | 1.55 | | | | | 0.54 | | | | — | | | |
| | | | 20.80 | | | | | 48,851 | | | | | 1.56 | | | | | 0.77 | | | | | 1.61 | | | | | 0.72 | | | | 74 | | | |
| | | | 13.91 | | | | | 44,851 | | | | | 1.60 | | | | | 0.31 | | | | | 1.64 | | | | | 0.27 | | | | 77 | | | |
| | | | 22.65 | | | | | 39,251 | | | | | 1.60 | | | | | 0.77 | | | | | 1.65 | | | | | 0.72 | | | | 82 | | | |
| | | | (18.19 | ) | | | | 37,232 | | | | | 1.60 | | | | | 0.04 | | | | | 1.66 | | | | | (0.02 | ) | | | 72 | | | |
| | | | 23.50 | % | | | $ | 7,172 | | | | | 2.26 | % | | | | 0.15 | % | | | | 2.29 | % | | | | 0.12 | % | | | 17 | % | | |
| | | | (1.95 | ) | | | | 6,632 | | | | | 2.26 | | | | | (0.17 | ) | | | | 2.30 | | | | | (0.21 | ) | | | — | | | |
| | | | 19.94 | | | | | 6,819 | | | | | 2.31 | | | | | 0.00 | | | | | 2.36 | | | | | (0.05 | ) | | | 74 | | | |
| | | | 13.12 | | | | | 7,371 | | | | | 2.35 | | | | | (0.48 | ) | | | | 2.39 | | | | | (0.52 | ) | | | 77 | | | |
| | | | 21.75 | | | | | 7,936 | | | | | 2.35 | | | | | 0.02 | | | | | 2.40 | | | | | (0.03 | ) | | | 82 | | | |
| | | | (18.94 | ) | | | | 7,459 | | | | | 2.35 | | | | | (0.68 | ) | | | | 2.41 | | | | | (0.74 | ) | | | 72 | | | |
| | | | 23.53 | % | | | $ | 8,049 | | | | | 2.26 | % | | | | 0.16 | % | | | | 2.29 | % | | | | 0.13 | % | | | 17 | % | | |
| | | | (1.97 | ) | | | | 7,520 | | | | | 2.26 | | | | | (0.17 | ) | | | | 2.30 | | | | | (0.21 | ) | | | — | | | |
| | | | 19.88 | | | | | 7,915 | | | | | 2.31 | | | | | (0.01 | ) | | | | 2.36 | | | | | (0.06 | ) | | | 74 | | | |
| | | | 13.14 | | | | | 8,542 | | | | | 2.35 | | | | | (0.52 | ) | | | | 2.39 | | | | | (0.56 | ) | | | 77 | | | |
| | | | 21.72 | | | | | 10,439 | | | | | 2.35 | | | | | (0.01 | ) | | | | 2.40 | | | | | (0.06 | ) | | | 82 | | | |
| | | | (18.97 | ) | | | | 11,027 | | | | | 2.35 | | | | | (0.71 | ) | | | | 2.41 | | | | | (0.77 | ) | | | 72 | | | |
| | | | 24.04 | % | | | $ | 1 | | | | | 1.76 | % | | | | 0.39 | % | | | | 1.91 | % | | | | 0.24 | % | | | 17 | % | | |
| | | | (1.89 | ) | | | | 1 | | | | | 1.76 | | | | | 0.33 | | | | | 1.95 | | | | | 0.14 | | | | — | | | |
| | | | 20.38 | | | | | 163 | | | | | 1.81 | | | | | 0.77 | | | | | 2.01 | | | | | 0.57 | | | | 74 | | | |
| | | | 13.16 | | | | | 1 | | | | | 1.60 | | | | | (0.11 | ) | | | | 1.64 | | | | | (0.15 | ) | | | 77 | | | |
| | | | 22.85 | (7) | | | | 8,533 | | | | | 1.60 | | | | | 0.57 | | | | | 1.65 | | | | | 0.52 | | | | 82 | | | |
| | | | (18.42 | ) | | | | 10,817 | | | | | 1.60 | | | | | 0.16 | | | | | 1.66 | | | | | 0.10 | | | | 72 | | | |
| | | | 24.81 | % | | | $ | 1,738,254 | | | | | 1.26 | % | | | | 1.16 | % | | | | 1.29 | % | | | | 1.13 | % | | | 17 | % | | |
| | | | (1.86 | ) | | | | 1,516,510 | | | | | 1.26 | | | | | 0.83 | | | | | 1.30 | | | | | 0.79 | | | | — | | | |
| | | | 21.12 | | | | | 1,523,057 | | | | | 1.31 | | | | | 1.07 | | | | | 1.36 | | | | | 1.02 | | | | 74 | | | |
| | | | 14.13 | | | | | 1,145,409 | | | | | 1.35 | | | | | 0.59 | | | | | 1.39 | | | | | 0.55 | | | | 77 | | | |
| | | | 22.97 | (7) | | | | 991,027 | | | | | 1.35 | | | | | 1.08 | | | | | 1.40 | | | | | 1.03 | | | | 82 | | | |
| | | | (18.05 | ) | | | | 540,495 | | | | | 1.35 | | | | | 0.36 | | | | | 1.41 | | | | | 0.30 | | | | 72 | | | |
| | | | | | | | | | | | | | | | | | | | | | | | | | |
First American Funds Annual Report 2006 57
Schedule of Investments October 31, 2006, all dollars are rounded to thousands (000)
| | | | | | | | | | |
| Small Cap Growth Opportunities Fund | |
| DESCRIPTION | | SHARES | | | VALUE | |
| | |
| Common Stocks – 97.6% |
| Consumer Discretionary – 15.0% |
| Big 5 Sporting Goods (a) | | | 37,569 | | | $ | 903 | |
| Citi Trends (a) (b) | | | 97,997 | | | | 3,846 | |
| Conn’s (a) (b) | | | 251,199 | �� | | | 6,034 | |
| Cosi (a) (b) | | | 846,974 | | | | 3,684 | |
| Guitar Center (a) (b) | | | 68,367 | | | | 2,965 | |
| New York & Company (b) | | | 315,271 | | | | 4,099 | |
| Nutri/ System (a) (b) | | | 52,187 | | | | 3,219 | |
| Oxford Industries (a) | | | 62,870 | | | | 3,318 | |
| P.F. Chang’s China Bistro (a) (b) | | | 94,844 | | | | 3,966 | |
| Ruth’s Chris Steak House (b) | | | 263,047 | | | | 5,180 | |
| Scientific Games, Class A (a) (b) | | | 172,110 | | | | 4,824 | |
| Texas Roadhouse, Class A (a) (b) | | | 364,565 | | | | 5,268 | |
| WMS Industries (a) (b) | | | 65,670 | | | | 2,320 | |
| | | | | | | |
| | | | | | | | 49,626 | |
| | | | | | | |
| Energy – 7.7% |
| Arena Resources (a) (b) | | | 112,844 | | | | 4,031 | |
| Atwood Oceanics (a) (b) | | | 37,819 | | | | 1,747 | |
| Ember Resources (a) (b) | | | 1,462,022 | | | | 4,075 | |
| GMX Resources (a) (b) | | | 45,068 | | | | 1,771 | |
| Goodrich Petroleum (a) (b) | | | 53,542 | | | | 1,832 | |
| Lufkin Industries (a) | | | 44,110 | | | | 2,661 | |
| Oil States International (a) (b) | | | 72,785 | | | | 2,114 | |
| Parallel Petroleum (a) (b) | | | 234,095 | | | | 4,740 | |
| Superior Energy Services (b) | | | 79,420 | | | | 2,486 | |
| | | | | | | |
| | | | | | | | 25,457 | |
| | | | | | | |
| Financials – 10.7% |
| Boston Private Financial Holdings (a) | | | 172,335 | | | | 4,763 | |
| First Mercury Financial (a) (b) | | | 61,150 | | | | 1,266 | |
| First Potomac Realty Trust – REIT | | | 108,017 | | | | 3,342 | |
| Nelnet (b) | | | 138,549 | | | | 4,079 | |
| Prosperity Bancshares (a) | | | 94,930 | | | | 3,293 | |
| Sunstone Hotel Investors (a) | | | 113,102 | | | | 3,332 | |
| SVB Financial (a) (b) | | | 98,362 | | | | 4,527 | |
| Triad Guaranty (b) | | | 65,128 | | | | 3,355 | |
| United Community Banks (a) | | | 107,329 | | | | 3,374 | |
| Waddell & Reed Financial, Class A (a) | | | 169,077 | | | | 4,311 | |
| | | | | | | |
| | | | | | | | 35,642 | |
| | | | | | | |
| Healthcare – 18.9% |
| American Medical Systems (a) (b) | | | 246,203 | | | | 4,385 | |
| ArthroCare (a) (b) | | | 97,348 | | | | 3,934 | |
| BioMarin Pharmaceutical (b) | | | 105,806 | | | | 1,696 | |
| Durect (a) (b) | | | 563,107 | | | | 2,618 | |
| ev3 (a) (b) | | | 267,539 | | | | 4,586 | |
| Horizon Health (a) (b) | | | 149,514 | | | | 2,313 | |
| Human Genome Sciences (a) (b) | | | 327,934 | | | | 4,378 | |
| ICOS (a) (b) | | | 92,389 | | | | 2,931 | |
| Immucor (b) | | | 75,987 | | | | 2,092 | |
| Integra LifeSciences (a) (b) | | | 105,858 | | | | 3,909 | |
| Keryx Biopharmaceuticals (a) (b) | | | 222,047 | | | | 3,118 | |
| Kyphon (a) (b) | | | 83,404 | | | | 3,294 | |
| Myriad Genetics (a) (b) | | | 117,209 | | | | 3,152 | |
| Pediatrix Medical Group (b) | | | 123,415 | | | | 5,545 | |
| Salix Pharmaceuticals (a) (b) | | | 306,321 | | | | 4,083 | |
| Techne (b) | | | 80,712 | | | | 4,510 | |
| TriZetto Group (a) (b) | | | 245,111 | | | | 4,189 | |
| United Therapeutics (a) (b) | | | 32,918 | | | | 1,970 | |
| | | | | | | |
| | | | | | | | 62,703 | |
| | | | | | | |
| Industrials – 14.9% |
| Advisory Board (a) (b) | | | 63,546 | | | | 3,509 | |
| AMETEK (a) | | | 112,892 | | | | 5,270 | |
| DRS Technologies (a) | | | 105,182 | | | | 4,651 | |
| ESCO Technologies (a) (b) | | | 44,698 | | | | 1,941 | |
| Forward Air (a) | | | 103,516 | | | | 3,361 | |
| Labor Ready (b) | | | 201,492 | | | | 3,528 | |
| McGrath Rentcorp (a) | | | 90,788 | | | | 2,452 | |
| Mobile Mini (a) (b) | | | 96,425 | | | | 3,102 | |
| Mueller Water Products, Class A (a) (b) | | | 248,124 | | | | 3,963 | |
| Navigant Consulting (a) (b) | | | 178,671 | | | | 3,182 | |
| RBC Bearings (a) (b) | | | 176,353 | | | | 4,793 | |
| Resources Connection (b) | | | 167,699 | | | | 4,853 | |
| WESCO International (a) (b) | | | 76,868 | | | | 5,017 | |
| | | | | | | |
| | | | | | | | 49,622 | |
| | | | | | | |
| Information Technology (c) – 30.4% |
| aQuantive (a) (b) | | | 189,980 | | | | 5,164 | |
| ATMI (a) (b) | | | 84,916 | | | | 2,691 | |
| AudioCodes (a) (b) | | | 242,061 | | | | 2,682 | |
| Avocent (a) (b) | | | 140,842 | | | | 5,170 | |
| Cymer (a) (b) | | | 82,310 | | | | 3,813 | |
| Daktronics | | | 184,168 | | | | 4,367 | |
| Digitas (b) | | | 403,952 | | | | 4,266 | |
| Emulex (b) | | | 456,579 | | | | 8,584 | |
| Forrester Research (b) | | | 78,978 | | | | 2,482 | |
| Ixia (a) (b) | | | 598,172 | | | | 5,473 | |
| Kanbay International (a) (b) | | | 231,393 | | | | 6,572 | |
| Kronos (a) (b) | | | 69,030 | | | | 2,340 | |
| Lawson Software (b) | | | 713,239 | | | | 5,435 | |
| Micrel (b) | | | 395,359 | | | | 4,412 | |
| Microsemi (a) (b) | | | 237,797 | | | | 4,661 | |
| Orbotech (b) | | | 187,904 | | | | 4,538 | |
| PMC-Sierra (a) (b) | | | 851,972 | | | | 5,649 | |
| Quest Software (a) (b) | | | 239,142 | | | | 3,523 | |
| RADVision (b) | | | 203,985 | | | | 3,910 | |
| RightNow Technologies (a) (b) | | | 257,590 | | | | 4,255 | |
| Semtech (a) (b) | | | 324,909 | | | | 4,234 | |
| Silicon Motion Technology – ADR (a) (b) | | | 216,784 | | | | 3,332 | |
| Tridium, Class B, Escrow Shares (b) (d) (e) | | | 278,500 | | | | 71 | |
| Varian Semiconductor Equipment Associates (a) (b) | | | 87,566 | | | | 3,195 | |
| VideoPropulsion (b) (d) (e) | | | 784,710 | | | | — | |
| | | | | | | |
| | | | | | | | 100,819 | |
| | | | | | | |
Total Common Stocks | | | | | | | | |
| | (Cost $305,154) | | | | | | | 323,869 | |
| | | | | | | |
| Warrants – 0.1% |
| Hollis-Eden Pharmaceuticals Warrants (d) (e) | | | 70,545 | | | | 130 | |
| Kuhlman Company Warrants (d) (e) (f) | | | 281,680 | | | | — | |
| | | | | | | |
Total Warrants | | | | | | | | |
| | (Cost $434) | | | | | | | 130 | |
| | | | | | | |
| Short-Term Investment – 2.6% |
First American Prime Obligations Fund, Class Z (g)
(Cost $8,612) | | | 8,612,435 | | | | 8,612 | |
| | | | | | | |
| Investments Purchased with Proceeds from Securities Lending (h) – 46.1% |
| | (Cost $152,967) | | | | | | | 152,967 | |
| | | | | | | |
Total Investments – 146.4% | | | | | | | | |
| | (Cost $467,167) | | | | | | | 485,578 | |
| | | | | | | |
Other Assets and Liabilities, Net – (46.4)% | | | | | | | (153,836 | ) |
| | | | | | | |
Total Net Assets – 100.0% | | | | | | $ | 331,742 | |
| | | | | | | |
| |
| (a) | This security or a portion of this security is out on loan at October 31, 2006. Total loaned securities had a market value of $147,157 at October 31, 2006. See note 2 in Notes to Financial Statements. |
The accompanying notes are an integral part of the financial statements.
58 First American Funds Annual Report 2006
Small Cap Growth Opportunities Fund (concluded)
| |
| (b) | Non-income producing security. |
| |
| (c) | The fund is significantly invested in this sector and therefore is subject to additional risks. See note 6 in Notes to Financial Statements. |
| |
| (d) | Security considered illiquid or restricted. As of October 31, 2006, the market value of these investments was $201 or 0.1% of total net assets. See Note 2 in Notes to Financial Statements. |
| |
| (e) | Security is fair valued. As of October 31, 2006, the fair value of these investments was $201 or 0.1% of total net assets. See Note 2 in Notes to Financial Statements. |
| |
| (f) | A company is considered to be an affiliate of the fund under the Investment Company Act of 1940 if the fund’s holdings of that company represent 5% or more of the outstanding voting securities of the company. Transactions with companies that are or were affiliates during the fiscal year ended October 31, 2006 are as follows: |
| | | | | | | | | | | | | | | | | | | | | | | | | |
| | | Beginning | | | Purchase | | | Sales | | | Ending | | | Dividend | | | |
| Issuer | | Cost | | | Cost | | | Cost | | | Cost | | | Income | | | Value | |
| |
| Kuhlman Company | | $ | — | | | $ | 2,896 | | | $ | 2,896 | | | $ | — | | | $ | — | | | $ | — | |
| Kuhlman Company | | | — | | | | 112 | | | | 112 | | | | — | | | | — | | | | — | |
| Kuhlman Company Warrants | | | — | | | | 273 | | | | — | | | | 273 | | | | — | | | | — | |
| |
| (g) | Investment in affiliated security. This money market fund is advised by FAF Advisors, Inc., which also serves as advisor to this fund. See note 3 in Notes to Financial Statements. |
| |
| (h) | The fund may loan securities in return for collateral in the form of cash, U.S. Government securities, or other high grade debt obligations. The cash collateral is invested in various money market funds and short-term, high quality debt obligations, such as repurchase agreements, commercial paper, and other corporate obligations. See note 2 in Notes to Financial Statements. |
ADR – American Depository Receipt
REIT – Real Estate Investment Trust
First American Funds Annual Report 2006 59
Schedule of Investments October 31, 2006, all dollars rounded to thousands (000)
| | | | | | | | | |
| Small Cap Select Fund |
| DESCRIPTION | | SHARES | | | VALUE | |
| |
| Common Stocks – 96.3% |
| Consumer Discretionary – 15.6% |
| Cheesecake Factory (a) (b) | | | 141,328 | | | $ | 3,993 | |
| Children’s Place Retail Stores (a) (b) | | | 169,112 | | | | 11,870 | |
| Christopher & Banks | | | 317,582 | | | | 8,572 | |
| Cosi (a) (b) | | | 1,351,761 | | | | 5,880 | |
| GSI Commerce (a) (b) | | | 474,176 | | | | 8,549 | |
| Hibbett Sporting Goods (a) (b) | | | 274,948 | | | | 8,039 | |
| Interface, Class A (b) | | | 661,427 | | | | 9,624 | |
| McCormick & Schmick’s Seafood Restaurants (b) | | | 159,529 | | | | 4,194 | |
| Nautilus Group (a) | | | 1,447,222 | | | | 20,449 | |
| Nutri/ System (a) (b) | | | 246,150 | | | | 15,183 | |
| P.F. Chang’s China Bistro (a) (b) | | | 122,392 | | | | 5,118 | |
| RARE Hospitality International (a) (b) | | | 146,726 | | | | 4,623 | |
| Ruth’s Chris Steak House (b) | | | 349,752 | | | | 6,887 | |
| Scientific Games, Class A (a) (b) | | | 474,802 | | | | 13,309 | |
| Station Casinos (a) | | | 78,446 | | | | 4,730 | |
| Texas Roadhouse, Class A (b) | | | 404,062 | | | | 5,839 | |
| Tween Brands (a) (b) | | | 209,223 | | | | 8,750 | |
| WCI Communities (a) (b) | | | 307,890 | | | | 4,963 | |
| WMS Industries (a) (b) | | | 122,113 | | | | 4,314 | |
| | | | | | | | | |
| | | | | | | | 154,886 | |
| | | | | | | | | |
| Consumer Staples – 3.5% |
| Central Garden & Pet (a) (b) | | | 245,325 | | | | 12,259 | |
| Reddy Ice Holdings | | | 222,956 | | | | 5,351 | |
| Reliv International (a) | | | 533,350 | | | | 5,333 | |
| USANA Health Sciences (a) (b) | | | 260,742 | | | | 11,713 | |
| | | | | | | | | |
| | | | | | | | 34,656 | |
| | | | | | | | | |
| Energy – 5.4% |
| Arena Resources (a) (b) | | | 94,883 | | | | 3,389 | |
| Brigham Exploration (b) | | | 965,172 | | | | 7,519 | |
| Compton Petroleum (b) | | | 676,044 | | | | 7,176 | |
| Comstock Resources (a) (b) | | | 318,535 | | | | 8,887 | |
| Helix Energy Solutions Group (a) (b) | | | 317,735 | | | | 10,263 | |
| St. Mary Land & Exploration (a) | | | 183,843 | | | | 6,855 | |
| Western Refining (a) | | | 244,040 | | | | 5,750 | |
| W-H Energy Services (a) (b) | | | 81,374 | | | | 3,811 | |
| | | | | | | | | |
| | | | | | | | 53,650 | |
| | | | | | | | | |
| Financials – 18.7% |
| Affiliated Managers Group (a) (b) | | | 150,901 | | | | 15,111 | |
| BioMed Realty Trust – REIT (a) | | | 313,619 | | | | 10,108 | |
| CoBiz (a) | | | 128,038 | | | | 2,894 | |
| Columbia Banking System (a) | | | 164,994 | | | | 5,227 | |
| Cullen/ Frost Bankers | | | 252,983 | | | | 13,702 | |
| Dime Community Bancshares | | | 485,087 | | | | 6,767 | |
| East West Bancorp (a) | | | 321,535 | | | | 11,739 | |
| First Financial Bankshares (a) | | | 113,236 | | | | 4,537 | |
| First Marblehead (a) | | | 33,875 | | | | 2,285 | |
| First Potomac Realty Trust – REIT (a) | | | 343,930 | | | | 10,641 | |
| First Republic Bank – California (a) | | | 312,644 | | | | 12,174 | |
| Independent Bank (a) | | | 259,728 | | | | 8,698 | |
| Investors Financial Services (a) | | | 174,853 | | | | 6,875 | |
| Kite Realty Group Trust – REIT | | | 484,451 | | | | 8,885 | |
| LaSalle Hotel Properties – REIT (a) | | | 115,816 | | | | 4,893 | |
| Maguire Properties – REIT (a) | | | 98,911 | | | | 4,229 | |
| Newcastle Investment – REIT (a) | | | 231,731 | | | | 6,876 | |
| NorthStar Realty Finance – REIT | | | 364,528 | | | | 5,523 | |
| Platinum Underwriters Holdings | | | 399,068 | | | | 11,916 | |
| SL Green Realty – REIT (a) | | | 83,242 | | | | 10,076 | |
| The South Financial Group | | | 184,905 | | | | 4,906 | |
| Thomas Weisel Partners Group (a) (b) | | | 468,407 | | | | 7,499 | |
| Umpqua Holdings (a) | | | 264,473 | | | | 7,469 | |
| Winston Hotels – REIT | | | 182,933 | | | | 2,214 | |
| | | | | | | | | |
| | | | | | | | 185,244 | |
| | | | | | | | | |
| Healthcare – 13.9% |
| Caliper Life Sciences (b) | | | 328,861 | | | | 1,677 | |
| Curis (a) (b) | | | 1,267,090 | | | | 1,901 | |
| Dexcom (a) (b) | | | 218,108 | | | | 1,919 | |
| DJ Orthopedics (a) (b) | | | 246,048 | | | | 9,898 | |
| Healthways (a) (b) | | | 150,950 | | | | 6,393 | |
| Horizon Health (a) (b) | | | 334,874 | | | | 5,180 | |
| Human Genome Sciences (a) (b) | | | 413,533 | | | | 5,521 | |
| ICU Medical (a) (b) | | | 228,329 | | | | 9,647 | |
| Immucor (b) | | | 248,327 | | | | 6,836 | |
| ImmunoGen (a) (b) | | | 731,871 | | | | 2,920 | |
| K-V Pharmaceutical, Class A (b) | | | 242,050 | | | | 5,403 | |
| LCA-Vision (a) | | | 247,992 | | | | 8,712 | |
| Magellan Health Services (b) | | | 316,024 | | | | 13,791 | |
| Medarex (a) (b) | | | 377,387 | | | | 4,876 | |
| Merge Technologies (a) (b) | | | 426,203 | | | | 3,286 | |
| Neurocrine Biosciences (a) (b) | | | 75,744 | | | | 875 | |
| Pediatrix Medical Group (b) | | | 433,040 | | | | 19,456 | |
| Quidel (b) | | | 120,348 | | | | 1,868 | |
| Salix Pharmaceuticals (a) (b) | | | 558,733 | | | | 7,448 | |
| Senomyx (a) (b) | | | 316,793 | | | | 4,885 | |
| SonoSite (b) | | | 97,502 | | | | 2,779 | |
| SurModics (a) (b) | | | 168,761 | | | | 5,890 | |
| Vertex Pharmaceuticals (a) (b) | | | 156,185 | | | | 6,341 | |
| | | | | | | | | |
| | | | | | | | 137,502 | |
| | | | | | | | | |
| Industrials – 15.1% |
| Acuity Brands (a) | | | 102,410 | | | | 5,073 | |
| AirTran Holdings (a) (b) | | | 1,376,382 | | | | 13,723 | |
| AMETEK (a) | | | 320,981 | | | | 14,983 | |
| CLARCOR (a) | | | 111,763 | | | | 3,641 | |
| CRA International (a) (b) | | | 179,695 | | | | 9,134 | |
| Energy Conversion Devices (a) (b) | | | 84,569 | | | | 3,111 | |
| ESCO Technologies (a) (b) | | | 85,909 | | | | 3,730 | |
| Forward Air | | | 337,183 | | | | 10,948 | |
| Kennametal | | | 80,012 | | | | 4,938 | |
| KVH Industries (b) (c) | | | 76,901 | | | | 840 | |
| Labor Ready (b) | | | 698,993 | | | | 12,239 | |
| Lennox International (a) | | | 510,896 | | | | 13,774 | |
| Manitowoc | | | 151,073 | | | | 8,291 | |
| NCI Building Systems (a) (b) | | | 168,521 | | | | 10,086 | |
| Power-One (a) (b) | | | 1,305,853 | | | | 8,932 | |
| Steelcase, Class A (a) | | | 670,127 | | | | 11,104 | |
| Timken (a) | | | 182,444 | | | | 5,483 | |
| WESCO International (b) | | | 154,672 | | | | 10,095 | |
| | | | | | | | | |
| | | | | | | | 150,125 | |
| Information Technology – 19.6% |
| Advanced Analogic Technologies (a) (b) | | | 791,391 | | | | 4,923 | |
| Aeroflex (b) | | | 253,644 | | | | 2,739 | |
| BISYS Group (b) | | | 1,583,137 | | | | 17,478 | |
| Cogent (a) (b) | | | 467,671 | | | | 5,378 | |
| Digital River (a) (b) | | | 102,715 | | | | 5,942 | |
| Digitas (a) (b) | | | 1,066,594 | | | | 11,263 | |
| Entegris (a) (b) | | | 1,655,071 | | | | 18,553 | |
| F5 Networks (b) | | | 185,726 | | | | 12,293 | |
| Harmonic (a) (b) | | | 689,598 | | | | 5,593 | |
| Hutchinson Technology (a) (b) | | | 557,686 | | | | 12,910 | |
| Hyperion Solutions (b) | | | 346,970 | | | | 12,977 | |
| Plexus (b) | | | 177,644 | | | | 3,894 | |
| PMC-Sierra (a) (b) | | | 1,484,786 | | | | 9,844 | |
| Progress Software (b) | | | 270,942 | | | | 7,800 | |
| Rackable Systems (a) (b) | | | 188,664 | | | | 5,851 | |
The accompanying notes are an integral part of the financial statements.
60 First American Funds Annual Report 2006
| | | | | | | | | | |
| Small Cap Select Fund (concluded) |
| DESCRIPTION | | SHARES | | | VALUE | |
| |
| Silicon Image (b) | | | 831,702 | | | $ | 9,839 | |
| Stellent | | | 691,481 | | | | 7,724 | |
| Stratasys (a) (b) | | | 181,441 | | | | 5,059 | |
| Stratex Networks (a) (b) | | | 1,400,381 | | | | 6,540 | |
| Tessera Technologies (a) (b) | | | 263,940 | | | | 9,214 | |
| TIBCO Software (a) (b) | | | 874,061 | | | | 8,085 | |
| Trident Microsystems (a) (b) | | | 480,983 | | | | 10,168 | |
| | | | | | | | | |
| | | | | | | | 194,067 | |
| | | | | | | | | |
| Materials – 3.3% |
| Albemarle | | | 192,859 | | | | 12,541 | |
| Century Aluminum (a) (b) | | | 139,310 | | | | 5,422 | |
| Schnitzer Steel Industries, Class A (a) | | | 227,288 | | | | 7,946 | |
| Texas Industries (a) | | | 117,808 | | | | 7,316 | |
| | | | | | | | | |
| | | | | | | | 33,225 | |
| | | | | | | | | |
| Telecommunication Services – 0.7% |
| General Communication, Class A (b) | | | 523,630 | | | | 6,865 | |
| | | | | | | | | |
| Utilities – 0.5% |
| NSTAR (a) | | | 130,827 | | | | 4,552 | |
| | | | | | | | | |
Total Common Stocks | | | | | | | | |
| | (Cost $853,090) | | | | | | | 954,772 | |
| | | | | | | | | |
| Short-Term Investment – 3.2% |
| First American Prime Obligations Fund, Class Z (d) | | | | | | | | |
| | (Cost $31,319) | | | 31,319,327 | | | | 31,319 | |
| | | | | | | | | |
| Investments Purchased with Proceeds from Securities Lending (e) – 40.5% |
| | (Cost $401,159) | | | | | | | 401,159 | |
| | | | | | | | | |
| Total Investments – 140.0% | | | | | | | | |
| | (Cost $1,285,568) | | | | | | | 1,387,250 | |
| | | | | | | | | |
Other Assets and Liabilities, Net – (40.0)% | | | | | | | (396,137 | ) |
| | | | | | | | | |
Total Net Assets – 100.0% | | | | | | $ | 991,113 | |
| | | | | | | | | |
| |
| (a) | This security or a portion of this security is out on loan at October 31, 2006. Total loaned securities had a market value of $384,336 at October 31, 2006. See note 2 in Notes to Financial Statements. |
| |
| (b) | Non-income producing security. |
| |
| (c) | A company is considered to be an affiliate of the fund under the Investment Company Act of 1940 if the fund’s holdings of that company represent 5% or more of the outstanding voting securities of the company. Transactions with companies that are or were affiliates during the fiscal year ended October 31, 2006 are as follows: |
| | | | | | | | | | | | | | | | | | | | | | | | | |
| | | Beginning | | | Purchase | | | Sales | | | Ending | | | Dividend | | | |
| Issuer | | Cost | | | Cost | | | Cost | | | Cost | | | Income | | | Value | |
| |
| KVH Industries | | $ | 8,072 | | | $ | 264 | | | $ | 7,628 | | | $ | 708 | | | $ | — | | | $ | 840 | |
| |
| (d) | Investment in affiliated security. This money market fund is advised by FAF Advisors, Inc., which also serves as advisor to this fund. See note 3 in Notes to Financial Statements. |
| |
| (e) | The fund may loan securities in return for collateral in the form of cash, U.S. Government securities, or other high grade debt obligations. The cash collateral is invested in various money market funds and short-term, high quality debt obligations, such as repurchase agreements, commercial paper, and other corporate obligations. See note 2 in Notes to Financial Statements. |
REIT – Real Estate Investment Trust
First American Funds Annual Report 2006 61
Schedule of Investments October 31, 2006, all dollars rounded to thousands (000)
| | | | | | | | | |
| Small Cap Value Fund |
| | | SHARES | | | |
| DESCRIPTION | | | | VALUE | |
| |
| Common Stocks – 96.9% |
| Consumer Discretionary – 13.8% |
| Aeropostale (a) (b) | | | 191,995 | | | $ | 5,627 | |
| Ameristar Casinos (a) | | | 176,435 | | | | 4,342 | |
| Belo, Class A (a) | | | 231,446 | | | | 4,055 | |
| Callaway Golf (a) | | | 283,221 | | | | 3,804 | |
| Dominos Pizza (a) | | | 159,484 | | | | 4,335 | |
| Ethan Allen Interiors (a) | | | 115,652 | | | | 4,120 | |
| Interface, Class A (a) (b) | | | 441,911 | | | | 6,430 | |
| Men’s Wearhouse (a) | | | 127,653 | | | | 5,087 | |
| Nautilus Group (a) | | | 385,358 | | | | 5,445 | |
| P.F. Chang’s China Bistro (a) (b) | | | 58,738 | | | | 2,456 | |
| Polaris Industries (a) | | | 58,902 | | | | 2,522 | |
| Select Comfort (a) (b) | | | 249,440 | | | | 5,333 | |
| Wolverine World Wide (a) | | | 190,064 | | | | 5,390 | |
| | | | | | | | | |
| | | | | | | | 58,946 | |
| | | | | | | | | |
| Consumer Staples – 2.0% |
| Nu Skin Enterprises, Class A | | | 233,552 | | | | 4,466 | |
| Ralcorp Holdings (a) (b) | | | 81,566 | | | | 4,033 | |
| | | | | | | | | |
| | | | | | | | 8,499 | |
| | | | | | | | | |
| Energy – 4.9% |
| Brigham Exploration (b) | | | 503,537 | | | | 3,923 | |
| Cimarex Energy (a) | | | 113,613 | | | | 4,092 | |
| Global Industries (b) | | | 185,356 | | | | 3,077 | |
| Penn Virginia (a) | | | 36,906 | | | | 2,641 | |
| Swift Energy (a) (b) | | | 90,459 | | | | 4,226 | |
| Whiting Petroleum (a) (b) | | | 67,248 | | | | 3,000 | |
| | | | | | | | | |
| | | | | | | | 20,959 | |
| | | | | | | | | |
| Financials (c) – 32.2% |
| Alabama National BanCorporation (a) | | | 68,384 | | | | 4,640 | |
| BioMed Realty Trust – REIT (a) | | | 136,245 | | | | 4,391 | |
| Boston Private Financial Holdings (a) | | | 77,047 | | | | 2,130 | |
| Capitol Bancorp | | | 114,062 | | | | 5,352 | |
| CBL & Associates Properties – REIT (a) | | | 103,370 | | | | 4,520 | |
| Citizens Banking (a) | | | 176,374 | | | | 4,580 | |
| Delphi Financial Group, Class A (a) | | | 136,095 | | | | 5,342 | |
| First Midwest Bancorp (a) | | | 145,969 | | | | 5,551 | |
| First Niagara Financial Group (a) | | | 209,276 | | | | 2,997 | |
| First Potomac Realty Trust – REIT | | | 154,830 | | | | 4,790 | |
| First Republic Bank – California (a) | | | 102,447 | | | | 3,989 | |
| FPIC Insurance Group (a) (b) | | | 106,683 | | | | 3,813 | |
| Frontier Financial (a) | | | 187,098 | | | | 5,428 | |
| Home Bancshares (a) | | | 74,112 | | | | 1,635 | |
| Independent Bank (a) | | | 146,220 | | | | 4,897 | |
| Knight Capital Group, Class A (b) | | | 139,509 | | | | 2,602 | |
| LaSalle Hotel Properties – REIT | | | 47,586 | | | | 2,010 | |
| Mercantile Bank | | | 106,716 | | | | 4,233 | |
| Mid-America Apartment Communities – REIT (a) | | | 56,049 | | | | 3,567 | |
| Newcastle Investment – REIT | | | 206,986 | | | | 6,141 | |
| Ohio Casualty (a) | | | 154,354 | | | | 4,234 | |
| PFF Bancorp | | | 153,196 | | | | 4,751 | |
| Platinum Underwriters Holdings | | | 125,700 | | | | 3,753 | |
| Provident Bankshares (a) | | | 130,740 | | | | 4,725 | |
| PS Business Parks – REIT | | | 58,661 | | | | 3,863 | |
| Reckson Associates Realty – REIT | | | 72,320 | | | | 3,191 | |
| Redwood Trust – REIT (a) | | | 94,730 | | | | 5,207 | |
| Selective Insurance Group (a) | | | 94,149 | | | | 5,202 | |
| Sterling Bancshares | | | 179,724 | | | | 3,291 | |
| Strategic Hotels & Resorts – REIT (a) | | | 202,865 | | | | 4,315 | |
| Triad Guaranty (a) (b) | | | 71,068 | | | | 3,661 | |
| Waddell & Reed Financial, Class A (a) | | | 209,958 | | | | 5,354 | |
| Windrose Medical Properties Trust – REIT | | | 175,568 | | | | 3,276 | |
| | | | | | | | | |
| | | | | | | | 137,431 | |
| | | | | | | | | |
| Healthcare – 7.1% |
| CNS | | | 126,839 | | | | 4,700 | |
| Horizon Health (a) (b) | | | 134,244 | | | | 2,077 | |
| Perrigo (a) | | | 330,090 | | | | 5,905 | |
| Sciele Pharma (b) | | | 98,367 | | | | 2,145 | |
| Sierra Health Services (b) | | | 120,294 | | | | 4,119 | |
| STERIS | | | 191,590 | | | | 4,669 | |
| Tanox (a) (b) | | | 105,012 | | | | 1,410 | |
| Varian (b) | | | 116,740 | | | | 5,474 | |
| | | | | | | | | |
| | | | | | | | 30,499 | |
| | | | | | | | | |
| Industrials – 12.9% |
| Acuity Brands (a) | | | 94,110 | | | | 4,662 | |
| AMETEK | | | 105,541 | | | | 4,927 | |
| Arkansas Best (a) | | | 54,992 | | | | 2,253 | |
| Armor Holdings (a) (b) | | | 75,951 | | | | 3,908 | |
| Brady, Class A (a) | | | 101,350 | | | | 3,750 | |
| Crane | | | 105,351 | | | | 4,102 | |
| ESCO Technologies (a) (b) | | | 69,287 | | | | 3,008 | |
| Forward Air | | | 67,620 | | | | 2,196 | |
| Labor Ready (b) | | | 182,165 | | | | 3,190 | |
| Moog, Class A (b) | | | 127,627 | | | | 4,760 | |
| Nordson | | | 56,523 | | | | 2,603 | |
| Regal-Beloit (a) | | | 108,733 | | | | 5,377 | |
| Trinity Industries (a) | | | 74,145 | | | | 2,674 | |
| URS (b) | | | 100,240 | | | | 4,051 | |
| WESCO International (b) | | | 53,011 | | | | 3,460 | |
| | | | | | | | | |
| | | | | | | | 54,921 | |
| | | | | | | | | |
| Information Technology – 13.1% |
| Altiris (b) | | | 97,456 | | | | 2,194 | |
| AMIS Holdings (b) | | | 107,982 | | | | 1,036 | |
| BISYS Group (b) | | | 525,892 | | | | 5,806 | |
| Emulex (b) | | | 219,964 | | | | 4,135 | |
| Entegris (a) (b) | | | 299,546 | | | | 3,358 | |
| Hutchinson Technology (a) (b) | | | 229,466 | | | | 5,312 | |
| Hypercom (a) (b) | | | 341,489 | | | | 2,216 | |
| NETGEAR (a) (b) | | | 139,582 | | | | 3,741 | |
| Palm (a) (b) | | | 201,651 | | | | 3,095 | |
| Plantronics (a) | | | 113,663 | | | | 2,399 | |
| Polycom (a) (b) | | | 79,396 | | | | 2,176 | |
| Progress Software (b) | | | 117,197 | | | | 3,374 | |
| Rudolph Technologies (a) (b) | | | 120,894 | | | | 2,135 | |
| Silicon Image (b) | | | 413,531 | | | | 4,892 | |
| Skyworks Solutions (b) | | | 373,443 | | | | 2,476 | |
| TIBCO Software (b) | | | 303,485 | | | | 2,807 | |
| Transaction Systems Architects (b) | | | 58,369 | | | | 1,968 | |
| United Online (a) | | | 223,143 | | | | 3,017 | |
| | | | | | | | | |
| | | | | | | | 56,137 | |
| | | | | | | | | |
| Materials – 5.5% |
| Albemarle | | | 60,656 | | | | 3,945 | |
| Arch Chemicals (a) | | | 102,091 | | | | 3,416 | |
| Commercial Metals | | | 179,231 | | | | 4,769 | |
| Hercules (a) (b) | | | 121,890 | | | | 2,218 | |
| Steel Dynamics (a) | | | 60,195 | | | | 3,618 | |
| Texas Industries (a) | | | 91,476 | | | | 5,681 | |
| | | | | | | | | |
| | | | | | | | 23,647 | |
| Telecommunication Services – 0.9% |
| Cincinnati Bell (b) | | | 795,476 | | | | 3,731 | |
| | | | | | | | | |
The accompanying notes are an integral part of the financial statements.
62 First American Funds Annual Report 2006
| | | | | | | | | | |
| Small Cap Value Fund (concluded) |
| DESCRIPTION | | SHARES | | | VALUE | |
| |
| Utilities – 4.5% |
| Black Hills (a) | | | 146,615 | | | $ | 5,060 | |
| El Paso Electric (b) | | | 234,154 | | | | 5,470 | |
| Northwest Natural Gas | | | 56,625 | | | | 2,343 | |
| South Jersey Industries | | | 68,968 | | | | 2,133 | |
| Westar Energy (a) | | | 169,288 | | | | 4,286 | |
| | | | | | | | | |
| | | | | | | | 19,292 | |
| | | | | | | | | |
Total Common Stocks | | | | | | | | |
| | (Cost $353,960) | | | | | | | 414,062 | |
| | | | | | | | | |
| Short-Term Investment – 4.4% |
| First American Prime Obligations Fund, Class Z (d) | | | | | | | | |
| | (Cost $18,983) | | | 18,982,993 | | | | 18,983 | |
| | | | | | | | | |
| Investments Purchased with Proceeds from Securities Lending (e) – 35.8% |
| | (Cost $152,800) | | | | | | | 152,800 | |
| | | | | | | | | |
Total Investments – 137.1% | | | | | | | | |
| | (Cost $525,743) | | | | | | | 585,845 | |
| | | | | | | | | |
Other Assets and Liabilities, Net – (37.1)% | | | | | | | (158,666 | ) |
| | | | | | | | | |
Total Net Assets – 100.0% | | | | | | $ | 427,179 | |
| | | | | | | | | |
| |
| (a) | This security or a portion of this security is out on loan at October 31, 2006. Total loaned securities had a market value of $147,057 at October 31, 2006. See note 2 in Notes to Financial Statements. |
| |
| (b) | Non-income producing security. |
| |
| (c) | The fund is significantly invested in this sector and therefore is subject to additional risks. See note 6 in Notes to Financial Statements. |
| |
| (d) | Investment in affiliated security. This money market fund is advised by FAF Advisors, Inc., which also serves as advisor to this fund. See note 3 in Notes to Financial Statements. |
| |
| (e) | The fund may loan securities in return for collateral in the form of cash, U.S. Government securities, or other high grade debt obligations. The cash collateral is invested in various money market funds and short-term, high quality debt obligations, such as repurchase agreements, commercial paper, and other corporate obligations. See note 2 in Notes to Financial Statements. |
REIT – Real Estate Investment Trust
First American Funds Annual Report 2006 63
Schedule of Investments October 31, 2006, all dollars are rounded to thousands (000)
| | | | | | | | | | |
| Small-Mid Cap Core Fund | |
| DESCRIPTION | | SHARES | | | VALUE | |
| | |
| Common Stocks – 99.5% |
| Consumer Discretionary – 16.9% |
| Autoliv | | | 24,181 | | | $ | 1,375 | |
| BorgWarner (a) | | | 17,924 | | | | 1,031 | |
| Christopher & Banks | | | 42,225 | | | | 1,140 | |
| Circuit City Stores (a) | | | 29,544 | | | | 797 | |
| Coldwater Creek (a) (b) | | | 58,753 | | | | 1,791 | |
| Darden Restaurants | | | 26,569 | | | | 1,113 | |
| Dollar Tree Stores (a) (b) | | | 58,979 | | | | 1,834 | |
| Ethan Allen Interiors (a) | | | 29,353 | | | | 1,046 | |
| Interface, Class A (b) | | | 136,628 | | | | 1,988 | |
| Newell Rubbermaid | | | 17,434 | | | | 502 | |
| Nutri/ System (a) (b) | | | 35,900 | | | | 2,214 | |
| Polaris Industries (a) | | | 16,730 | | | | 716 | |
| Stanley Works | | | 20,115 | | | | 958 | |
| WMS Industries (b) | | | 44,654 | | | | 1,578 | |
| | | | | | | |
| | | | | | | | 18,083 | |
| | | | | | | |
| Consumer Staples – 2.2% |
| Corn Products International | | | 29,596 | | | | 1,071 | |
| USANA Health Sciences (b) | | | 28,889 | | | | 1,298 | |
| | | | | | | |
| | | | | | | | 2,369 | |
| | | | | | | |
| Energy – 6.2% |
| Brigham Exploration (b) | | | 72,977 | | | | 568 | |
| Cimarex Energy | | | 26,655 | | | | 960 | |
| Global Industries (a) (b) | | | 52,017 | | | | 863 | |
| Hydril (a) (b) | | | 18,430 | | | | 1,107 | |
| Lufkin Industries (a) | | | 14,626 | | | | 883 | |
| Newfield Exploration (b) | | | 35,200 | | | | 1,436 | |
| St. Mary Land & Exploration (a) | | | 23,641 | | | | 882 | |
| | | | | | | |
| | | | | | | | 6,699 | |
| | | | | | | |
| Financials – 21.1% |
| Ambac Financial Group | | | 6,670 | | | | 557 | |
| Astoria Financial (a) | | | 33,421 | | | | 970 | |
| CBL & Associates Properties – REIT (a) | | | 15,624 | | | | 683 | |
| CIT Group | | | 26,749 | | | | 1,392 | |
| Citizens Banking (a) | | | 23,772 | | | | 617 | |
| City National | | | 19,673 | | | | 1,310 | |
| Cullen/ Frost Bankers | | | 32,190 | | | | 1,743 | |
| Frontier Financial (a) | | | 19,815 | | | | 575 | |
| LaSalle Hotel Properties – REIT (a) | | | 32,297 | | | | 1,365 | |
| Maguire Properties – REIT | | | 16,005 | | | | 684 | |
| MGIC Investment (a) | | | 17,080 | | | | 1,004 | |
| Newcastle Investment – REIT | | | 64,080 | | | | 1,901 | |
| Ohio Casualty (a) | | | 40,431 | | | | 1,109 | |
| PMI Group (a) | | | 39,363 | | | | 1,679 | |
| Redwood Trust – REIT (a) | | | 27,052 | | | | 1,487 | |
| Selective Insurance Group (a) | | | 11,860 | | | | 655 | |
| SL Green Realty – REIT (a) | | | 7,453 | | | | 902 | |
| Triad Guaranty (b) | | | 24,080 | | | | 1,240 | |
| Umpqua Holdings | | | 30,534 | | | | 862 | |
| W.R. Berkley | | | 51,748 | | | | 1,908 | |
| | | | | | | |
| | | | | | | | 22,643 | |
| | | | | | | |
| Healthcare – 10.4% |
| Coventry Health Care (b) | | | 22,843 | | | | 1,072 | |
| Endo Pharmaceuticals (b) | | | 45,919 | | | | 1,310 | |
| Healthways (b) | | | 11,425 | | | | 484 | |
| ICU Medical (a) (b) | | | 19,956 | | | | 843 | |
| Immucor (b) | | | 70,615 | | | | 1,944 | |
| Kyphon (a) (b) | | | 41,513 | | | | 1,640 | |
| LCA-Vision (a) | | | 25,247 | | | | 887 | |
| Pediatrix Medical Group (b) | | | 44,279 | | | | 1,989 | |
| SurModics (a) (b) | | | 27,164 | | | | 948 | |
| | | | | | | |
| | | | | | | | 11,117 | |
| | | | | | | |
| Industrials – 16.6% |
| AMETEK | | | 37,008 | | | | 1,728 | |
| Armor Holdings (a) (b) | | | 28,372 | | | | 1,460 | |
| Dun & Bradstreet (a) (b) | | | 22,580 | | | | 1,744 | |
| ESCO Technologies (a) (b) | | | 20,390 | | | | 885 | |
| Joy Global | | | 28,540 | | | | 1,116 | |
| L-3 Communications Holdings | | | 13,739 | | | | 1,106 | |
| Labor Ready (b) | | | 111,426 | | | | 1,951 | |
| Lennox International | | | 23,738 | | | | 640 | |
| MSC Industrial Direct, Class A | | | 14,613 | | | | 598 | |
| Navigant Consulting (a) (b) | | | 49,580 | | | | 883 | |
| Republic Services | | | 43,596 | | | | 1,788 | |
| Steelcase, Class A (a) | | | 52,126 | | | | 864 | |
| Toro (a) | | | 45,040 | | | | 1,944 | |
| WESCO International (b) | | | 17,094 | | | | 1,116 | |
| | | | | | | |
| | | | | | | | 17,823 | |
| | | | | | | |
| Information Technology – 16.7% |
| Amphenol, Class A | | | 12,486 | | | | 848 | |
| Autodesk (b) | | | 25,077 | | | | 922 | |
| BISYS Group (b) | | | 60,966 | | | | 673 | |
| Digitas (b) | | | 119,223 | | | | 1,259 | |
| Emulex (b) | | | 144,905 | | | | 2,724 | |
| Entegris (a) (b) | | | 99,859 | | | | 1,119 | |
| Fairchild Semiconductor International (b) | | | 33,880 | | | | 546 | |
| Harris | | | 12,384 | | | | 528 | |
| Hyperion Solutions (b) | | | 33,495 | | | | 1,253 | |
| Ixia (b) | | | 53,280 | | | | 487 | |
| MEMC Electronic Materials (b) | | | 29,185 | | | | 1,036 | |
| Micrel (b) | | | 120,795 | | | | 1,348 | |
| National Semiconductor (a) | | | 26,916 | | | | 654 | |
| Polycom (a) (b) | | | 60,621 | | | | 1,661 | |
| Sybase (b) | | | 29,742 | | | | 724 | |
| TIBCO Software (b) | | | 101,496 | | | | 939 | |
| United Online | | | 88,012 | | | | 1,190 | |
| | | | | | | |
| | | | | | | | 17,911 | |
| | | | | | | |
| Materials – 5.7% |
| Albemarle | | | 26,675 | | | | 1,735 | |
| Commercial Metals | | | 72,901 | | | | 1,940 | |
| Packaging Corporation of America | | | 25,100 | | | | 576 | |
| Steel Dynamics (a) | | | 20,191 | | | | 1,214 | |
| Texas Industries (a) | | | 11,069 | | | | 687 | |
| | | | | | | |
| | | | | | | | 6,152 | |
| Telecommunication Services – 0.7% |
| CenturyTel (a) | | | 18,583 | | | | 748 | |
| | | | | | | |
| Utilities – 3.0% |
| NSTAR (a) | | | 25,286 | | | | 879 | |
| Westar Energy (a) | | | 47,900 | | | | 1,213 | |
| Wisconsin Energy | | | 25,425 | | | | 1,168 | |
| | | | | | | |
| | | | | | | | 3,260 | |
| | | | | | | |
Total Common Stocks | | | | | | | | |
| | (Cost $99,051) | | | | | | | 106,805 | |
| | | | | | | |
The accompanying notes are an integral part of the financial statements.
64 First American Funds Annual Report 2006
| | | | | | | | | | |
| Small-Mid Cap Core Fund (concluded) | |
| DESCRIPTION | | SHARES | | | VALUE | |
| | |
| Short-Term Investment – 0.4% |
| First American Prime Obligations Fund, Class Z (c) | | | | | | | | |
| | (Cost $405) | | | 404,972 | | | $ | 405 | |
| | | | | | | |
| Investments Purchased with Proceeds from Securities Lending (d) – 31.1% |
| | (Cost $33,398) | | | | | | | 33,398 | |
| | | | | | | |
Total Investments – 131.0% | | | | | | | | |
| | (Cost $132,854) | | | | | | | 140,608 | |
| | | | | | | |
Other Assets and Liabilities, Net – (31.0)% | | | | | | | (33,306 | ) |
| | | | | | | |
Total Net Assets – 100.0% | | | | | | $ | 107,302 | |
| | | | | | | |
| |
| (a) | This security or a portion of this security is out on loan at October 31, 2006. Total loaned securities had a market value of $32,240 at October 31, 2006. See note 2 in Notes to Financial Statements. |
| |
| (b) | Non-income producing security. |
| |
| (c) | Investment in affiliated security. This money market fund is advised by FAF Advisors, Inc., which also serves as advisor to this fund. See note 3 in Notes to Financial Statements. |
| |
| (d) | The fund may loan securities in return for collateral in the form of cash, U.S. Government securities, or other high grade debt obligations. The cash collateral is invested in various money market funds and short-term, high quality debt obligations, such as repurchase agreements, commercial paper, and other corporate obligations. See note 2 in Notes to Financial Statements. |
REIT – Real Estate Investment Trust
First American Funds Annual Report 2006 65
Statements of Assets and Liabilities October 31, 2006, all dollars and shares are rounded to thousands (000), except for per share data
| | | | | | | | | | | | | | | | | | | | | | |
| | | Small Cap | | | | | | | | | | | | |
| | | Growth | | | | | | | | | | | | |
| | | Opportunities | | | | Small Cap | | | | Small Cap | | | | Small-Mid Cap | | | |
| | | Fund | | | | Select Fund | | | | Value Fund | | | | Core Fund | | | |
| | | | | | | | | | | | | | | |
| Investments in unaffiliated securities, at cost | | $ | 305,588 | | | | $ | 853,090 | | | | $ | 353,960 | | | | $ | 99,051 | | | |
| Investments in affiliated money market fund, at cost | | | 8,612 | | | | | 31,319 | | | | | 18,983 | | | | | 405 | | | |
| Investments purchased with proceeds from securities lending, at cost (note 2) | | | 152,967 | | | | | 401,159 | | | | | 152,800 | | | | | 33,398 | | | |
| | | | | | | | | | | | | | | | | | |
ASSETS: | | | | | | | | | | | | | | | | | | | | | |
| Investments in unaffiliated securities, at value* (note 2) | | $ | 323,999 | | | | $ | 954,772 | | | | $ | 414,062 | | | | $ | 106,805 | | | |
| Investments in affiliated money market fund, at value (note 2) | | | 8,612 | | | | | 31,319 | | | | | 18,983 | | | | | 405 | | | |
| Investments purchased with proceeds from securities lending (note 2) | | | 152,967 | | | | | 401,159 | | | | | 152,800 | | | | | 33,398 | | | |
| Cash | | | — | | | | | — | | | | | — | | | | | 3 | | | |
| Receivable for dividends and interest | | | 156 | | | | | 578 | | | | | 345 | | | | | 47 | | | |
| Receivable for investment securities sold | | | 5,359 | | | | | 23,677 | | | | | — | | | | | 4,860 | | | |
| Receivable for capital shares sold | | | 408 | | | | | 1,759 | | | | | 312 | | | | | 124 | | | |
| Prepaid expenses and other assets | | | 40 | | | | | 40 | | | | | 38 | | | | | 29 | | | |
| | | | | | | | | | | | | | | | | | |
Total assets | | | 491,541 | | | | | 1,413,304 | | | | | 586,540 | | | | | 145,671 | | | |
| | | | | | | | | | | | | | | | | | |
LIABILITIES: | | | | | | | | | | | | | | | | | | | | | |
| Payable for capital shares redeemed | | | 538 | | | | | 2,053 | | | | | 431 | | | | | 136 | | | |
| Payable upon return of securities loaned (note 2) | | | 152,967 | | | | | 401,159 | | | | | 152,800 | | | | | 33,398 | | | |
| Payable for investment securities purchased | | | 5,915 | | | | | 18,101 | | | | | 5,724 | | | | | 4,715 | | | |
| Payable to affiliates (note 3) | | | 322 | | | | | 776 | | | | | 359 | | | | | 86 | | | |
| Payable for distribution and shareholder servicing fees | | | 37 | | | | | 67 | | | | | 23 | | | | | 17 | | | |
| Accrued expenses and other liabilities | | | 20 | | | | | 35 | | | | | 24 | | | | | 17 | | | |
| | | | | | | | | | | | | | | | | | |
Total liabilities | | | 159,799 | | | | | 422,191 | | | | | 159,361 | | | | | 38,369 | | | |
| | | | | | | | | | | | | | | | | | |
Net assets | | $ | 331,742 | | | | $ | 991,113 | | | | $ | 427,179 | | | | $ | 107,302 | | | |
| | | | | | | | | | | | | | | | | | |
COMPOSITION OF NET ASSETS: | | | | | | | | | | | | | | | | | | | | | |
| Portfolio capital | | $ | 299,150 | | | | $ | 790,790 | | | | $ | 304,509 | | | | $ | 550,482 | | | |
| Undistributed net investment income | | | — | | | | | — | | | | | — | | | | | 93 | | | |
| Accumulated net realized gain (loss) on investments | | | 14,181 | | | | | 98,641 | | | | | 62,568 | | | | | (451,027 | ) | | |
| Net unrealized appreciation of investments | | | 18,411 | | | | | 101,682 | | | | | 60,102 | | | | | 7,754 | | | |
| | | | | | | | | | | | | | | | | | |
Net assets | | $ | 331,742 | | | | $ | 991,113 | | | | $ | 427,179 | | | | $ | 107,302 | | | |
| | | | | | | | | | | | | | | | | | |
| * Including securities loaned, at value | | $ | 147,157 | | | | $ | 384,336 | | | | $ | 147,057 | | | | $ | 32,240 | | | |
| | | | | | | | | | | | | | | | | | |
Class A: | | | | | | | | | | | | | | | | | | | | | |
| Net assets | | $ | 138,786 | | | | $ | 222,293 | | | | $ | 57,922 | | | | $ | 26,190 | | | |
| Shares issued and outstanding ($0.0001 par value – 2 billion authorized) | | | 6,774 | | | | | 14,699 | | | | | 3,767 | | | | | 2,738 | | | |
| Net asset value and redemption price per share | | $ | 20.49 | | | | $ | 15.12 | | | | $ | 15.38 | | | | $ | 9.57 | | | |
Maximum offering price per share (1) | | $ | 21.68 | | | | $ | 16.00 | | | | $ | 16.28 | | | | $ | 10.13 | | | |
Class B: | | | | | | | | | | | | | | | | | | | | | |
| Net assets | | $ | 6,540 | | | | $ | 15,077 | | | | $ | 7,855 | | | | $ | 8,689 | | | |
| Shares issued and outstanding ($0.0001 par value – 2 billion authorized) | | | 349 | | | | | 1,171 | | | | | 564 | | | | | 1,042 | | | |
Net asset value, offering price, and redemption price per share (2) | | $ | 18.76 | | | | $ | 12.88 | | | | $ | 13.93 | | | | $ | 8.34 | | | |
Class C: | | | | | | | | | | | | | | | | | | | | | |
| Net assets | | $ | 2,664 | | | | $ | 18,794 | | | | $ | 4,405 | | | | $ | 4,986 | | | |
| Shares issued and outstanding ($0.0001 par value – 2 billion authorized) | | | 136 | | | | | 1,309 | | | | | 311 | | | | | 549 | | | |
Net asset value, offering price and redemption price per share (2) | | $ | 19.53 | | | | $ | 14.36 | | | | $ | 14.17 | | | | $ | 9.09 | | | |
Class R(3): | | | | | | | | | | | | | | | | | | | | | |
| Net assets | | $ | 1,323 | | | | $ | 2,697 | | | | $ | 1,849 | | | | $ | — | | | |
| Shares issued and outstanding ($0.0001 par value – 2 billion authorized) | | | 65 | | | | | 180 | | | | | 121 | | | | | — | | | |
| Net asset value, offering price, and redemption price per share | | $ | 20.39 | | | | $ | 14.98 | | | | $ | 15.24 | | | | $ | — | | | |
Class Y: | | | | | | | | | | | | | | | | | | | | | |
| Net assets | | $ | 182,429 | | | | $ | 732,252 | | | | $ | 355,148 | | | | $ | 67,437 | | | |
| Shares issued and outstanding ($0.0001 par value – 2 billion authorized) | | | 8,422 | | | | | 45,599 | | | | | 22,602 | | | | | 6,776 | | | |
| Net asset value, offering price, and redemption price per share | | $ | 21.66 | | | | $ | 16.06 | | | | $ | 15.71 | | | | $ | 9.95 | | | |
| | | | | | | | | | | | | | | | | | |
| | |
| | (1) | The offering price is calculated by dividing the net asset value by 1 minus the maximum sales charge of 5.50% |
| | (2) | Class B and C have a contingent deferred sales charge. For a description of this sales charge, see notes 1 and 3 in Notes to Financial Statements. |
| | (3) | Class R is not offered by the Small-Mid Cap Core Fund. |
The accompanying notes are an integral part of the financial statements.
66 First American Funds Annual Report 2006
Statements of Operations For the year ended October 31, 2006, all dollars are rounded to thousands (000)
| | | | | | | | | | | | | | | | | | | | | | | |
| | | Small Cap | | | | | | | | | | | | | |
| | | Growth | | | | | | | | | | | | | |
| | | Opportunities | | | | Small Cap | | | | Small Cap | | | | Small-Mid Cap | | | | |
| | | Fund | | | | Select Fund | | | | Value Fund | | | | Core Fund | | | | |
| | | | | | | | | | | | | | | | |
INVESTMENT INCOME: | | | | | | | | | | | | | | | | | | | | | | |
| Dividends from affiliated money market fund | | $ | 438 | | | | $ | 1,189 | | | | $ | 363 | | | | $ | 69 | | | | |
| Dividends from unaffiliated securities | | | 1,175 | | | | | 5,125 | | | | | 5,587 | | | | | 1,332 | | | | |
| Less: Foreign taxes withheld | | | — | | | | | (6 | ) | | | | — | | | | | — | | | | |
| Securities lending income | | | 265 | | | | | 1,053 | | | | | 223 | | | | | 49 | | | | |
| | | | | | | | | | | | | | | | | | | |
Total investment income | | | 1,878 | | | | | 7,361 | | | | | 6,173 | | | | | 1,450 | | | | |
| | | | | | | | | | | | | | | | | | | |
EXPENSES (note 3): | | | | | | | | | | | | | | | | | | | | | | |
| Investment advisory fees | | | 3,163 | | | | | 6,102 | | | | | 2,925 | | | | | 674 | | | | |
| Administration fees | | | 513 | | | | | 1,408 | | | | | 679 | | | | | 170 | | | | |
| Transfer agent fees | | | 350 | | | | | 884 | | | | | 441 | | | | | 184 | | | | |
| Custodian fees | | | 16 | | | | | 49 | | | | | 22 | | | | | 6 | | | | |
| Professional fees | | | 35 | | | | | 34 | | | | | 35 | | | | | 18 | | | | |
| Registration fees | | | 63 | | | | | 66 | | | | | 59 | | | | | 57 | | | | |
| Postage and printing fees | | | 26 | | | | | 57 | | | | | 28 | | | | | 25 | | | | |
| Directors’ fees | | | 17 | | | | | 23 | | | | | 18 | | | | | 14 | | | | |
| Other expenses | | | 22 | | | | | 24 | | | | | 23 | | | | | 20 | | | | |
| Distribution and shareholder servicing fees – Class A | | | 234 | | | | | 332 | | | | | 131 | | | | | 64 | | | | |
| Distribution and shareholder servicing fees – Class B | | | 78 | | | | | 144 | | | | | 85 | | | | | 94 | | | | |
| Distribution and shareholder servicing fees – Class C | | | 29 | | | | | 157 | | | | | 45 | | | | | 44 | | | | |
Distribution and shareholder servicing fees – Class R (1) | | | 2 | | | | | 9 | | | | | 5 | | | | | — | | | | |
| | | | | | | | | | | | | | | | | | | |
Total expenses | | | 4,548 | | | | | 9,289 | | | | | 4,496 | | | | | 1,370 | | | | |
| | | | | | | | | | | | | | | | | | | |
| Less: Fee waivers (note 3) | | | (332 | ) | | | | (2 | ) | | | | (1 | ) | | | | (68 | ) | | | |
| Less: Indirect payments from custodian (note 3) | | | (6 | ) | | | | (14 | ) | | | | (2 | ) | | | | (1 | ) | | | |
| | | | | | | | | | | | | | | | | | | |
Total net expenses | | | 4,210 | | | | | 9,273 | | | | | 4,493 | | | | | 1,301 | | | | |
| | | | | | | | | | | | | | | | | | | |
Investment income (loss) – net | | | (2,332 | ) | | | | (1,912 | ) | | | | 1,680 | | | | | 149 | | | | |
| | | | | | | | | | | | | | | | | | | |
REALIZED AND UNREALIZED GAINS (LOSSES) ON INVESTMENTS – NET (note 5): | | | | | | | | | | | | | | | | | | | | | | |
| Net realized gain (loss) on affiliated investments | | | (2,847 | ) | | | | 684 | | | | | — | | | | | — | | | | |
| Net realized gain on unaffiliated investments | | | 20,657 | | | | | 152,452 | | | | | 77,955 | | | | | 4,374 | | | | |
| Net realized loss on in-kind redemption (note 9) | | | (247 | ) | | | | — | | | | | — | | | | | — | | | | |
| Net change in unrealized appreciation or depreciation of investments | | | 16,707 | | | | | 23,065 | | | | | (534 | ) | | | | 10,366 | | | | |
| | | | | | | | | | | | | | | | | | | |
Net gain on investments | | | 34,270 | | | | | 176,201 | | | | | 77,421 | | | | | 14,740 | | | | |
| | | | | | | | | | | | | | | | | | | |
Net increase in net assets resulting from operations | | $ | 31,938 | | | | $ | 174,289 | | | | $ | 79,101 | | | | $ | 14,889 | | | | |
| | | | | | | | | | | | | | | | | | | |
| | |
| | (1) | Class R is not offered by the Small-Mid Cap Core Fund. |
First American Funds Annual Report 2006 67
Statements of Changes in Net Assets all dollars are rounded to thousands (000)
| | | | | | | | | | | | | | | | |
| | | Small Cap Growth | | | |
| | | Opportunities Fund | | | |
| |
| | | One-Month | | | |
| | | Fiscal | | | |
| | | Year Ended | | | Period Ended | | | Year Ended | | | |
| | | 10/31/06 | | | 10/31/05 | | | 9/30/05 | | | |
| |
| |
OPERATIONS: | | | | | | | | | | | | | | |
| Investment income (loss) – net | | $ | (2,332 | ) | | $ | (263 | ) | | $ | (4,004 | ) | | |
| Net realized gain (loss) on affiliated investments | | | (2,847 | ) | | | — | | | | — | | | |
| Net realized gain on unaffiliated investments | | | 20,657 | | | | 946 | | | | 70,779 | | | |
| Net realized loss on in-kind redemption | | | (247 | ) | | | — | | | | — | | | |
| Net change in unrealized appreciation or depreciation of investments | | | 16,707 | | | | (13,513 | ) | | | 3,567 | | | |
| |
| Net increase (decrease) in net assets resulting from operations | | | 31,938 | | | | (12,830 | ) | | | 70,342 | | | |
| |
| |
DISTRIBUTIONS TO SHAREHOLDERS FROM: | | | | | | | | | | | | | | |
| Investment income – net: | | | | | | | | | | | | | | |
| | Class A | | | — | | | | — | | | | — | | | |
| | Class B | | | — | | | | — | | | | — | | | |
| | Class C | | | — | | | | — | | | | — | | | |
| | Class R | | | — | | | | — | | | | — | | | |
| | Class Y | | | — | | | | — | | | | — | | | |
| Net realized gain on investments: | | | | | | | | | | | | | | |
| | Class A | | | (15,190 | ) | | | — | | | | (12,315 | ) | | |
| | Class B | | | (1,681 | ) | | | — | | | | (1,255 | ) | | |
| | Class C | | | (580 | ) | | | — | | | | (577 | ) | | |
| | Class R | | | (1 | ) | | | — | | | | — | | | |
| | Class Y | | | (38,069 | ) | | | — | | | | (25,220 | ) | | |
| |
| Total distributions | | | (55,521 | ) | | | — | | | | (39,367 | ) | | |
| |
| |
CAPITAL SHARE TRANSACTIONS (note 4): | | | | | | | | | | | | | | |
| Class A: | | | | | | | | | | | | | | |
| | Proceeds from sales | | | 80,056 | | | | 922 | | | | 17,883 | | | |
| | Reinvestment of distributions | | | 14,824 | | | | — | | | | 11,923 | | | |
| | Payments for redemptions | | | (32,674 | ) | | | (3,649 | ) | | | (54,396 | ) | | |
| |
| Increase (decrease) in net assets from Class A transactions | | | 62,206 | | | | (2,727 | ) | | | (24,590 | ) | | |
| |
| Class B: | | | | | | | | | | | | | | |
| | Proceeds from sales | | | 523 | | | | 11 | | | | 590 | | | |
| | Reinvestment of distributions | | | 1,555 | | | | — | | | | 1,157 | | | |
| | Payments for redemptions (note 3) | | | (2,849 | ) | | | (141 | ) | | | (2,716 | ) | | |
| |
| Increase (decrease) in net assets from Class B transactions | | | (771 | ) | | | (130 | ) | | | (969 | ) | | |
| |
| Class C: | | | | | | | | | | | | | | |
| | Proceeds from sales | | | 999 | | | | 25 | | | | 501 | | | |
| | Reinvestment of distributions | | | 576 | | | | — | | | | 561 | | | |
| | Payments for redemptions (note 3) | | | (1,520 | ) | | | (86 | ) | | | (2,841 | ) | | |
| |
| Increase (decrease) in net assets from Class C transactions | | | 55 | | | | (61 | ) | | | (1,779 | ) | | |
| |
Class R(1): | | | | | | | | | | | | | | |
| | Proceeds from sales | | | 1,386 | | | | — | | | | 17 | | | |
| | Reinvestment of distributions | | | 1 | | | | — | | | | — | | | |
| | Payments for redemptions | | | (76 | ) | | | — | | | | (15 | ) | | |
| |
| Increase in net assets from Class R transactions | | | 1,311 | | | | — | | | | 2 | | | |
| |
| Class Y: | | | | | | | | | | | | | | |
| | Proceeds from sales | | | 40,576 | | | | 3,340 | | | | 38,132 | | | |
| | Reinvestment of distributions | | | 29,517 | | | | — | | | | 18,850 | | | |
| | Payments for redemptions | | | (77,933 | ) | | | (4,484 | ) | | | (82,561 | ) | | |
| |
| Increase (decrease) in net assets from Class Y transactions | | | (7,840 | ) | | | (1,144 | ) | | | (25,579 | ) | | |
| |
| Increase (decrease) in net assets from capital share transactions | | | 54,961 | | | | (4,062 | ) | | | (52,915 | ) | | |
| |
| Total increase (decrease) in net assets | | | 31,378 | | | | (16,892 | ) | | | (21,940 | ) | | |
Net assets at beginning of period | | | 300,364 | | | | 317,256 | | | | 339,196 | | | |
| |
Net assets at end of period | | $ | 331,742 | | | $ | 300,364 | | | $ | 317,256 | | | |
| |
Undistributed (distributions in excess of) net investment income at end of period | | $ | — | | | $ | (1 | ) | | $ | (1 | ) | | |
| |
| | |
| | (1) | Class R is not offered by the Small-Mid Cap Core Fund. |
The accompanying notes are an integral part of the financial statements.
68 First American Funds Annual Report 2006
| | | | | | | | | | | | | | | | | | | | | | | | | | | | | | | | | | | | | | | | | |
| | | Small Cap | | | | Small Cap | | | | Small-Mid Cap | | | |
| | | Select Fund | | | | Value Fund | | | | Core Fund | | | |
| | | | | | | | | | | | |
| | | One-Month | | | | | | | | One-Month | | | | | | | | One-Month | | | | | |
| | | Fiscal Period | | | | | | | | Fiscal Period | | | | | | | | Fiscal Period | | | | | |
| | | Year Ended | | | Ended | | | Year Ended | | | | Year Ended | | | Ended | | | Year Ended | | | | Year Ended | | | Ended | | | Year Ended | | | |
| | | 10/31/06 | | | 10/31/05 | | | 9/30/05 | | | | 10/31/06 | | | 10/31/05 | | | 9/30/05 | | | | 10/31/06 | | | 10/31/05 | | | 9/30/05 | | | |
| | | | | | | | | | | |
| | | | | | | | | | | | | | | | | | | | | | | | | | | | | | | | | | | | | | | | | |
| | | | | | | | | | | | | | | | | | | | | | | | | | | | | | | | | | | | | | | | | |
| | | $ | (1,912 | ) | | $ | (506 | ) | | $ | (2,926 | ) | | | $ | 1,680 | | | $ | 335 | | | $ | 1,636 | | | | $ | 149 | | | $ | (52 | ) | | $ | (737 | ) | | |
| | | | 684 | | | | (305 | ) | | | — | | | | | — | | | | — | | | | — | | | | | — | | | | — | | | | — | | | |
| | | | 152,452 | | | | 10,689 | | | | 184,051 | | | | | 77,955 | | | | 7,871 | | | | 94,694 | | | | | 4,374 | | | | 3,985 | | | | 8,526 | | | |
| | | | — | | | | — | | | | — | | | | | — | | | | — | | | | — | | | | | — | | | | — | | | | — | | | |
| | | | 23,065 | | | | (36,382 | ) | | | (17,021 | ) | | | | (534 | ) | | | (19,471 | ) | | | (28,747 | ) | | | | 10,366 | | | | (6,380 | ) | | | 2,726 | | | |
| | | | | | | | | |
| | | | 174,289 | | | | (26,504 | ) | | | 164,104 | | | | | 79,101 | | | | (11,265 | ) | | | 67,583 | | | | | 14,889 | | | | (2,447 | ) | | | 10,515 | | | |
| | | | | | | | | |
| | | | |
| | | |
| | | | | | | | | | | | | | | | | | | | | | | | | | | | | | | | | | | | | |
| | | | — | | | | — | | | | — | | | | | (145 | ) | | | — | | | | (177 | ) | | | | — | | | | — | | | | — | | | |
| | | | — | | | | — | | | | — | | | | | — | | | | — | | | | (23 | ) | | | | — | | | | — | | | | — | | | |
| | | | — | | | | — | | | | — | | | | | — | | | | — | | | | (11 | ) | | | | — | | | | — | | | | — | | | |
| | | | — | | | | — | | | | — | | | | | (2 | ) | | | — | | | | — | | | | | — | | | | — | | | | — | | | |
| | | | — | | | | — | | | | — | | | | | (1,819 | ) | | | — | | | | (1,626 | ) | | | | — | | | | — | | | | — | | | |
| | | | (21,746 | ) | | | — | | | | (19,383 | ) | | | | (10,660 | ) | | | — | | | | (6,876 | ) | | | | — | | | | — | | | | — | | | |
| | | | (3,108 | ) | | | — | | | | (2,778 | ) | | | | (2,162 | ) | | | — | | | | (1,565 | ) | | | | — | | | | — | | | | — | | | |
| | | | (2,833 | ) | | | — | | | | (2,801 | ) | | | | (1,094 | ) | | | — | | | | (747 | ) | | | | — | | | | — | | | | — | | | |
| | | | (130,679 | ) | | | — | | | | (5 | ) | | | | (75,707 | ) | | | — | | | | — | | | | | — | | | | — | | | | — | | | |
| | | | (82 | ) | | | — | | | | (133,034 | ) | | | | (19 | ) | | | — | | | | (55,117 | ) | | | | — | | | | — | | | | — | | | |
| | | | | | | | | |
| | | | (158,448 | ) | | | — | | | | (158,001 | ) | | | | (91,608 | ) | | | — | | | | (66,142 | ) | | | | — | | | | — | | | | — | | | |
| | | | | | | | | |
| | | | |
| | | |
| | | | | | | | | | | | | | | | | | | | | | | | | | | | | | | | | | | | | |
| | | | 133,764 | | | | 2,296 | | | | 24,096 | | | | | 12,626 | | | | 547 | | | | 8,656 | | | | | 11,715 | | | | 784 | | | | 5,250 | | | |
| | | | 21,190 | | | | — | | | | 18,716 | | | | | 10,483 | | | | — | | | | 6,859 | | | | | — | | | | — | | | | — | | | |
| | | | (40,923 | ) | | | (1,656 | ) | | | (32,858 | ) | | | | (10,454 | ) | | | (928 | ) | | | (10,711 | ) | | | | (11,925 | ) | | | (676 | ) | | | (12,848 | ) | | |
| | | | | | | | | |
| | | | 114,031 | | | | 640 | | | | 9,954 | | | | | 12,655 | | | | (381 | ) | | | 4,804 | | | | | (210 | ) | | | 108 | | | | (7,598 | ) | | |
| | | | | | | | | |
| | | | |
| | | | 2,081 | | | | 32 | | | | 1,593 | | | | | 422 | | | | 31 | | | | 872 | | | | | 416 | | | | 22 | | | | 454 | | | |
| | | | 2,956 | | | | — | | | | 2,700 | | | | | 2,072 | | | | — | | | | 1,539 | | | | | — | | | | — | | | | — | | | |
| | | | (3,022 | ) | | | (202 | ) | | | (2,957 | ) | | | | (2,975 | ) | | | (193 | ) | | | (2,854 | ) | | | | (3,430 | ) | | | (290 | ) | | | (4,645 | ) | | |
| | | | | | | | | |
| | | | 2,015 | | | | (170 | ) | | | 1,336 | | | | | (481 | ) | | | (162 | ) | | | (443 | ) | | | | (3,014 | ) | | | (268 | ) | | | (4,191 | ) | | |
| | | | | | | | | |
| | | | | | | | | | | | | | | | | | | | | | | | | | | | | | | | | | | | | | | | | |
| | | | 7,783 | | | | 189 | | | | 3,374 | | | | | 825 | | | | 28 | | | | 942 | | | | | 2,029 | | | | 50 | | | | 405 | | | |
| | | | 2,746 | | | | — | | | | 2,745 | | | | | 1,069 | | | | — | | | | 745 | | | | | — | | | | — | | | | — | | | |
| | | | (5,254 | ) | | | (690 | ) | | | (5,249 | ) | | | | (1,809 | ) | | | (114 | ) | | | (1,441 | ) | | | | (2,015 | ) | | | (128 | ) | | | (2,541 | ) | | |
| | | | | | | | | |
| | | | 5,275 | | | | (501 | ) | | | 870 | | | | | 85 | | | | (86 | ) | | | 246 | | | | | 14 | | | | (78 | ) | | | (2,136 | ) | | |
| | | | | | | | | |
| | | | |
| | | | 2,537 | | | | 119 | | | | 337 | | | | | 1,900 | | | | — | | | | 3 | | | | | — | | | | — | | | | — | | | |
| | | | 82 | | | | — | | | | 5 | | | | | 22 | | | | — | | | | — | | | | | — | | | | — | | | | — | | | |
| | | | (352 | ) | | | (90 | ) | | | (57 | ) | | | | (196 | ) | | | — | | | | — | | | | | — | | | | — | | | | — | | | |
| | | | | | | | | |
| | | | 2,267 | | | | 29 | | | | 285 | | | | | 1,726 | | | | — | | | | 3 | | | | | — | | | | — | | | | — | | | |
| | | | | | | | | |
| | | | | | | | | | | | | | | | | | | | | | | | | | | | | | | | | | | | | | | | | |
| | | | 129,554 | | | | 3,703 | | | | 102,349 | | | | | 50,760 | | | | 2,852 | | | | 63,025 | | | | | 49,629 | | | | 1,168 | | | | 17,409 | | | |
| | | | 103,456 | | | | — | | | | 98,881 | | | | | 66,461 | | | | — | | | | 48,592 | | | | | — | | | | — | | | | — | | | |
| | | | (195,174 | ) | | | (14,868 | ) | | | (263,925 | ) | | | | (99,660 | ) | | | (8,344 | ) | | | (117,619 | ) | | | | (22,033 | ) | | | (2,179 | ) | | | (32,835 | ) | | |
| | | | | | | | | |
| | | | 37,836 | | | | (11,165 | ) | | | (62,695 | ) | | | | 17,561 | | | | (5,492 | ) | | | (6,002 | ) | | | | 27,596 | | | | (1,011 | ) | | | (15,426 | ) | | |
| | | | | | | | | |
| | | | 161,424 | | | | (11,167 | ) | | | (50,250 | ) | | | | 31,546 | | | | (6,121 | ) | | | (1,392 | ) | | | | 24,386 | | | | (1,249 | ) | | | (29,351 | ) | | |
| | | | | | | | | |
| | | | 177,265 | | | | (37,671 | ) | | | (44,147 | ) | | | | 19,039 | | | | (17,386 | ) | | | 49 | | | | | 39,275 | | | | (3,696 | ) | | | (18,836 | ) | | |
| | | | 813,848 | | | | 851,519 | | | | 895,666 | | | | | 408,140 | | | | 425,526 | | | | 425,477 | | | | | 68,027 | | | | 71,723 | | | | 90,559 | | | |
| | | | | | | | | |
| | | $ | 991,113 | | | $ | 813,848 | | | $ | 851,519 | | | | $ | 427,179 | | | $ | 408,140 | | | $ | 425,526 | | | | $ | 107,302 | | | $ | 68,027 | | | $ | 71,723 | | | |
| | | | | | | | | |
| | | $ | — | | | $ | (1 | ) | | $ | (1 | ) | | | $ | — | | | $ | 335 | | | $ | — | | | | $ | 93 | | | $ | — | | | $ | — | | | |
| | | | | | | | | |
First American Funds Annual Report 2006 69
Financial Highlights For a share outstanding throughout the indicated periods.
| | | | | | | | | | | | | | | | | | | | | | | | | | | | | | | | | | |
| | | | | | | | | Realized and | | | | | | | | | | | | | |
| | | Net Asset | | | | | | | Unrealized | | | | Distributions | | | | Distributions | | | | Net Asset | | | | |
| | | Value | | | | Net | | | | Gains | | | | from Net | | | | from | | | | Value | | | | |
| | | Beginning | | | | Investment | | | | (Losses) on | | | | Realized | | | | Return of | | | | End of | | | | |
| | | of Period | | | | Loss | | | | Investments | | | | Gains | | | | Capital | | | | Period | | | | |
| | | | | | | | | | | | | | | | | | | | | |
Small Cap Growth Opportunities Fund | | | | | | | | | | | | | | | | | | | | | | | | | | | | | | | | |
| Class A | | | | | | | | | | | | | | | | | | | | | | | | | | | | | | | | |
| | 2006 (1)(2) | | $ | 22.79 | | | | $ | (0.18 | ) | | | $ | 2.37 | | | | $ | (4.49 | ) | | | $ | — | | | | $ | 20.49 | | | | |
| | 2005 (2)(3) | | | 23.75 | | | | | (0.02 | ) | | | | (0.94 | ) | | | | — | | | | | — | | | | | 22.79 | | | | |
| | 2005 (2)(4) | | | 21.74 | | | | | (0.32 | ) | | | | 5.28 | | | | | (2.95 | ) | | | | — | | | | | 23.75 | | | | |
| | 2004 (2)(4) | | | 21.95 | | | | | (0.35 | ) | | | | 0.27 | | | | | (0.13 | ) | | | | — | | | | | 21.74 | | | | |
| | 2003 (2)(4) | | | 13.86 | | | | | (0.28 | ) | | | | 8.37 | | | | | — | | | | | — | | | | | 21.95 | | | | |
| | 2002 (4) | | | 16.89 | | | | | (0.26 | ) | | | | (2.74 | ) | | | | — | | | | | (0.03 | ) | | | | 13.86 | | | | |
| Class B | | | | | | | | | | | | | | | | | | | | | | | | | | | | | | | | |
| | 2006 (1)(2) | | $ | 21.36 | | | | $ | (0.31 | ) | | | $ | 2.20 | | | | $ | (4.49 | ) | | | $ | — | | | | $ | 18.76 | | | | |
| | 2005 (2)(3) | | | 22.27 | | | | | (0.03 | ) | | | | (0.88 | ) | | | | — | | | | | — | | | | | 21.36 | | | | |
| | 2005 (2)(4) | | | 20.69 | | | | | (0.45 | ) | | | | 4.98 | | | | | (2.95 | ) | | | | — | | | | | 22.27 | | | | |
| | 2004 (2)(4) | | | 21.05 | | | | | (0.50 | ) | | | | 0.27 | | | | | (0.13 | ) | | | | — | | | | | 20.69 | | | | |
| | 2003 (2)(4) | | | 13.39 | | | | | (0.40 | ) | | | | 8.06 | | | | | — | | | | | — | | | | | 21.05 | | | | |
| | 2002 (4) | | | 16.44 | | | | | (0.39 | ) | | | | (2.63 | ) | | | | — | | | | | (0.03 | ) | | | | 13.39 | | | | |
| Class C | | | | | | | | | | | | | | | | | | | | | | | | | | | | | | | | |
| | 2006 (1)(2) | | $ | 22.05 | | | | $ | (0.32 | ) | | | $ | 2.29 | | | | $ | (4.49 | ) | | | $ | — | | | | $ | 19.53 | | | | |
| | 2005 (2)(3) | | | 23.00 | | | | | (0.04 | ) | | | | (0.91 | ) | | | | — | | | | | — | | | | | 22.05 | | | | |
| | 2005 (2)(4) | | | 21.28 | | | | | (0.48 | ) | | | | 5.15 | | | | | (2.95 | ) | | | | — | | | | | 23.00 | | | | |
| | 2004 (2)(4) | | | 21.65 | | | | | (0.49 | ) | | | | 0.25 | | | | | (0.13 | ) | | | | — | | | | | 21.28 | | | | |
| | 2003 (2)(4) | | | 13.77 | | | | | (0.43 | ) | | | | 8.31 | | | | | — | | | | | — | | | | | 21.65 | | | | |
| | 2002 (4) | | | 16.90 | | | | | (0.19 | ) | | | | (2.91 | ) | | | | — | | | | | (0.03 | ) | | | | 13.77 | | | | |
| Class R (5) | | | | | | | | | | | | | | | | | | | | | | | | | | | | | | | | |
| | 2006 (1)(2) | | $ | 22.75 | | | | $ | (0.23 | ) | | | $ | 2.36 | | | | $ | (4.49 | ) | | | $ | — | | | | $ | 20.39 | | | | |
| | 2005 (2)(3) | | | 23.72 | | | | | (0.03 | ) | | | | (0.94 | ) | | | | — | | | | | — | | | | | 22.75 | | | | |
| | 2005 (2)(4) | | | 21.74 | | | | | (0.48 | ) | | | | 5.41 | | | | | (2.95 | ) | | | | — | | | | | 23.72 | | | | |
| | 2004 (2)(4) | | | 21.95 | | | | | (0.42 | ) | | | | 0.34 | | | | | (0.13 | ) | | | | — | | | | | 21.74 | | | | |
| | 2003 (2)(4) | | | 13.86 | | | | | (0.28 | ) | | | | 8.37 | | | | | — | | | | | — | | | | | 21.95 | | | | |
| | 2002 (4) | | | 16.89 | | | | | (0.26 | ) | | | | (2.74 | ) | | | | — | | | | | (0.03 | ) | | | | 13.86 | | | | |
| Class Y | | | | | | | | | | | | | | | | | | | | | | | | | | | | | | | | |
| | 2006 (1)(2) | | $ | 23.81 | | | | $ | (0.13 | ) | | | $ | 2.47 | | | | $ | (4.49 | ) | | | $ | — | | | | $ | 21.66 | | | | |
| | 2005 (2)(3) | | | 24.81 | | | | | (0.02 | ) | | | | (0.98 | ) | | | | — | | | | | — | | | | | 23.81 | | | | |
| | 2005 (2)(4) | | | 22.55 | | | | | (0.27 | ) | | | | 5.48 | | | | | (2.95 | ) | | | | — | | | | | 24.81 | | | | |
| | 2004 (2)(4) | | | 22.70 | | | | | (0.32 | ) | | | | 0.30 | | | | | (0.13 | ) | | | | — | | | | | 22.55 | | | | |
| | 2003 (2)(4) | | | 14.30 | | | | | (0.25 | ) | | | | 8.65 | | | | | — | | | | | — | | | | | 22.70 | | | | |
| | 2002 (4) | | | 17.38 | | | | | (0.25 | ) | | | | (2.80 | ) | | | | — | | | | | (0.03 | ) | | | | 14.30 | | | | |
| | | | | | | | | | | | | | | | | | | | | | | | | |
| | |
| | (1) | For the period November 1 to October 31 in the year indicated. |
| |
| | (2) | Per share data calculated using average shares outstanding method. |
| |
| | (3) | For the period October 1, 2005 to October 31, 2005. Effective October 1, 2005, the fund’s fiscal year end was changed from September 30 to October 31. All ratios for the period have been annualized, except total return and portfolio turnover. |
| |
| | (4) | For the period October 1 to September 30 in the year indicated. |
| |
| | (5) | Prior to July 1, 2004, Class R shares were named Class S shares, which had lower fees and expenses. |
| |
| | (6) | Total return does not reflect sales charges. Total return would have been lower had certain expenses not been waived. |
The accompanying notes are an integral part of the financial statements.
70 First American Funds Annual Report 2006
| | | | | | | | | | | | | | | | | | | | | | | | | | | | | | | | | | | | | |
| | | | | | | | | | | | | | | | | | Ratio of Net | | | | | | |
| | | | | | | | | | | | | | | Ratio of | | | | Investment | | | | | | |
| | | | | | | | | | | | Ratio of Net | | | | Expenses to | | | | Loss to | | | | | | |
| | | | | | | | | Ratio of | | | | Investment | | | | Average | | | | Average Net | | | | | | |
| | | | | | Net Assets | | | | Expenses to | | | | Loss | | | | Net Assets | | | | Assets | | | | Portfolio | | | |
| | | Total | | | | End of | | | | Average | | | | to Average | | | | (Excluding | | | | (Excluding | | | | Turnover | | | |
| | | Return (6) | | | | Period (000) | | | | Net Assets | | | | Net Assets | | | | Waivers) | | | | Waivers) | | | | Rate | | | |
| | | | | | | | | | | | | | | | | | | | | | | | | | | |
| | | | 9.91 | % | | | $ | 138,786 | | | | | 1.47 | % | | | | (0.88 | )% | | | | 1.58 | % | | | | (0.99 | )% | | | | 209 | % | | |
| | | | (4.04 | ) | | | | 78,357 | | | | | 1.47 | | | | | (1.17 | ) | | | | 1.56 | | | | | (1.26 | ) | | | | 14 | | | |
| | | | 24.21 | | | | | 84,567 | | | | | 1.82 | | | | | (1.42 | ) | | | | 1.87 | | | | | (1.47 | ) | | | | 190 | | | |
| | | | (0.39 | ) | | | | 101,031 | | | | | 1.93 | | | | | (1.42 | ) | | | | 1.96 | | | | | (1.45 | ) | | | | 178 | | | |
| | | | 58.37 | | | | | 81,999 | | | | | 1.93 | | | | | (1.63 | ) | | | | 1.97 | | | | | (1.67 | ) | | | | 137 | | | |
| | | | (17.84 | ) | | | | 44,834 | | | | | 1.93 | | | | | (1.53 | ) | | | | 1.97 | | | | | (1.57 | ) | | | | 123 | | | |
| | | | 9.03 | % | | | $ | 6,540 | | | | | 2.22 | % | | | | (1.62 | )% | | | | 2.33 | % | | | | (1.73 | )% | | | | 209 | % | | |
| | | | (4.09 | ) | | | | 8,271 | | | | | 2.22 | | | | | (1.93 | ) | | | | 2.31 | | | | | (2.02 | ) | | | | 14 | | | |
| | | | 23.27 | | | | | 8,760 | | | | | 2.57 | | | | | (2.16 | ) | | | | 2.62 | | | | | (2.21 | ) | | | | 190 | | | |
| | | | (1.13 | ) | | | | 9,063 | | | | | 2.68 | | | | | (2.16 | ) | | | | 2.71 | | | | | (2.19 | ) | | | | 178 | | | |
| | | | 57.21 | | | | | 6,441 | | | | | 2.68 | | | | | (2.38 | ) | | | | 2.72 | | | | | (2.42 | ) | | | | 137 | | | |
| | | | (18.45 | ) | | | | 3,779 | | | | | 2.68 | | | | | (2.28 | ) | | | | 2.72 | | | | | (2.32 | ) | | | | 123 | | | |
| | | | 9.11 | % | | | $ | 2,664 | | | | | 2.22 | % | | | | (1.63 | )% | | | | 2.33 | % | | | | (1.74 | )% | | | | 209 | % | | |
| | | | (4.13 | ) | | | | 2,962 | | | | | 2.22 | | | | | (1.93 | ) | | | | 2.31 | | | | | (2.02 | ) | | | | 14 | | | |
| | | | 23.28 | | | | | 3,152 | | | | | 2.57 | | | | | (2.20 | ) | | | | 2.62 | | | | | (2.25 | ) | | | | 190 | | | |
| | | | (1.14 | ) | | | | 4,669 | | | | | 2.68 | | | | | (2.07 | ) | | | | 2.71 | | | | | (2.10 | ) | | | | 178 | | | |
| | | | 57.23 | | | | | 1,529 | | | | | 2.68 | | | | | (2.38 | ) | | | | 2.72 | | | | | (2.42 | ) | | | | 137 | | | |
| | | | (18.42 | ) | | | | 260 | | | | | 2.68 | | | | | (2.31 | ) | | | | 2.72 | | | | | (2.35 | ) | | | | 123 | | | |
| | | | 9.62 | % | | | $ | 1,323 | | | | | 1.72 | % | | | | (1.16 | )% | | | | 1.95 | % | | | | (1.39 | )% | | | | 209 | % | | |
| | | | (4.09 | ) | | | | 5 | | | | | 1.72 | | | | | (1.43 | ) | | | | 1.96 | | | | | (1.67 | ) | | | | 14 | | | |
| | | | 24.06 | | | | | 5 | | | | | 2.07 | | | | | (2.14 | ) | | | | 2.27 | | | | | (2.34 | ) | | | | 190 | | | |
| | | | (0.39 | ) | | | | 1 | | | | | 1.93 | | | | | (1.67 | ) | | | | 1.96 | | | | | (1.70 | ) | | | | 178 | | | |
| | | | 58.37 | | | | | 3,694 | | | | | 1.93 | | | | | (1.62 | ) | | | | 1.97 | | | | | (1.66 | ) | | | | 137 | | | |
| | | | (17.84 | ) | | | | 2,027 | | | | | 1.93 | | | | | (1.53 | ) | | | | 1.97 | | | | | (1.57 | ) | | | | 123 | | | |
| | | | 10.16 | % | | | $ | 182,429 | | | | | 1.22 | % | | | | (0.63 | )% | | | | 1.33 | % | | | | (0.74 | )% | | | | 209 | % | | |
| | | | (4.03 | ) | | | | 210,769 | | | | | 1.22 | | | | | (0.92 | ) | | | | 1.31 | | | | | (1.01 | ) | | | | 14 | | | |
| | | | 24.47 | | | | | 220,772 | | | | | 1.57 | | | | | (1.15 | ) | | | | 1.62 | | | | | (1.20 | ) | | | | 190 | | | |
| | | | (0.11 | ) | | | | 224,432 | | | | | 1.68 | | | | | (1.25 | ) | | | | 1.71 | | | | | (1.28 | ) | | | | 178 | | | |
| | | | 58.74 | | | | | 382,389 | | | | | 1.68 | | | | | (1.38 | ) | | | | 1.72 | | | | | (1.42 | ) | | | | 137 | | | |
| | | | (17.62 | ) | | | | 208,439 | | | | | 1.68 | | | | | (1.28 | ) | | | | 1.72 | | | | | (1.32 | ) | | | | 123 | | | |
| | | | | | | | | | | | | | | | | | | | | | | | | | | | | | | | | |
First American Funds Annual Report 2006 71
Financial Highlights For a share outstanding throughout the indicated periods.
| | | | | | | | | | | | | | | | | | | | | | | | | | | | | |
| | | | | | | | | Realized and | | | | | | | | | | |
| | | Net Asset | | | | | | | Unrealized | | | | Distributions | | | | Net Asset | | | | |
| | | Value | | | | Net | | | | Gains | | | | from Net | | | | Value | | | | |
| | | Beginning | | | | Investment | | | | (Losses) on | | | | Realized | | | | End of | | | | |
| | | of Period | | | | Loss | | | | Investments | | | | Gains | | | | Period | | | | |
| | | | | | | | | | | | | | | | | | | | |
Small Cap Select Fund (1) | | | | | | | | | | | | | | | | | | | | | | | | | | | |
| Class A | | | | | | | | | | | | | | | | | | | | | | | | | | | |
| | 2006 (2) | | $ | 15.33 | | | | $ | (0.05 | ) | | | $ | 3.05 | | | | $ | (3.21 | ) | | | $ | 15.12 | | | | |
| | 2005 (3) | | | 15.82 | | | | | (0.01 | ) | | | | (0.48 | ) | | | | — | | | | | 15.33 | | | | |
| | 2005 (4) | | | 15.95 | | | | | (0.08 | ) | | | | 3.10 | | | | | (3.15 | ) | | | | 15.82 | | | | |
| | 2004 (4) | | | 14.52 | | | | | (0.12 | ) | | | | 2.60 | | | | | (1.05 | ) | | | | 15.95 | | | | |
| | 2003 (4) | | | 10.68 | | | | | (0.09 | ) | | | | 3.93 | | | | | — | | | | | 14.52 | | | | |
| | 2002 (4) | | | 11.97 | | | | | (0.10 | ) | | | | (0.30 | ) | | | | (0.89 | ) | | | | 10.68 | | | | |
| Class B | | | | | | | | | | | | | | | | | | | | | | | | | | | |
| | 2006 (2) | | $ | 13.58 | | | | $ | (0.13 | ) | | | $ | 2.64 | | | | $ | (3.21 | ) | | | $ | 12.88 | | | | |
| | 2005 (3) | | | 14.02 | | | | | (0.02 | ) | | | | (0.42 | ) | | | | — | | | | | 13.58 | | | | |
| | 2005 (4) | | | 14.56 | | | | | (0.17 | ) | | | | 2.78 | | | | | (3.15 | ) | | | | 14.02 | | | | |
| | 2004 (4) | | | 13.42 | | | | | (0.22 | ) | | | | 2.41 | | | | | (1.05 | ) | | | | 14.56 | | | | |
| | 2003 (4) | | | 9.95 | | | | | (0.17 | ) | | | | 3.64 | | | | | — | | | | | 13.42 | | | | |
| | 2002 (4) | | | 11.28 | | | | | (0.19 | ) | | | | (0.25 | ) | | | | (0.89 | ) | | | | 9.95 | | | | |
| Class C | | | | | | | | | | | | | | | | | | | | | | | | | | | |
| | 2006 (2) | | $ | 14.79 | | | | $ | (0.16 | ) | | | $ | 2.94 | | | | $ | (3.21 | ) | | | $ | 14.36 | | | | |
| | 2005 (3) | | | 15.28 | | | | | (0.02 | ) | | | | (0.47 | ) | | | | — | | | | | 14.79 | | | | |
| | 2005 (4) | | | 15.60 | | | | | (0.19 | ) | | | | 3.02 | | | | | (3.15 | ) | | | | 15.28 | | | | |
| | 2004 (4) | | | 14.32 | | | | | (0.24 | ) | | | | 2.57 | | | | | (1.05 | ) | | | | 15.60 | | | | |
| | 2003 (4) | | | 10.62 | | | | | (0.18 | ) | | | | 3.88 | | | | | — | | | | | 14.32 | | | | |
| | 2002 (4) | | | 11.97 | | | | | (0.20 | ) | | | | (0.26 | ) | | | | (0.89 | ) | | | | 10.62 | | | | |
| Class R (5) | | | | | | | | | | | | | | | | | | | | | | | | | | | |
| | 2006 (2) | | $ | 15.24 | | | | $ | (0.09 | ) | | | $ | 3.04 | | | | $ | (3.21 | ) | | | $ | 14.98 | | | | |
| | 2005 (3) | | | 15.73 | | | | | (0.01 | ) | | | | (0.48 | ) | | | | — | | | | | 15.24 | | | | |
| | 2005 (4) | | | 15.91 | | | | | (0.08 | ) | | | | 3.05 | | | | | (3.15 | ) | | | | 15.73 | | | | |
| | 2004 (4) | | | 14.49 | | | | | (0.13 | ) | | | | 2.60 | | | | | (1.05 | ) | | | | 15.91 | | | | |
| | 2003 (4) | | | 10.66 | | | | | (0.09 | ) | | | | 3.92 | | | | | — | | | | | 14.49 | | | | |
| | 2002 (4) | | | 11.94 | | | | | (0.10 | ) | | | | (0.29 | ) | | | | (0.89 | ) | | | | 10.66 | | | | |
| Class Y | | | | | | | | | | | | | | | | | | | | | | | | | | | |
| | 2006 (2) | | $ | 16.06 | | | | $ | (0.01 | ) | | | $ | 3.22 | | | | $ | (3.21 | ) | | | $ | 16.06 | | | | |
| | 2005 (3) | | | 16.57 | | | | | (0.01 | ) | | | | (0.50 | ) | | | | — | | | | | 16.06 | | | | |
| | 2005 (4) | | | 16.54 | | | | | (0.04 | ) | | | | 3.22 | | | | | (3.15 | ) | | | | 16.57 | | | | |
| | 2004 (4) | | | 14.98 | | | | | (0.09 | ) | | | | 2.70 | | | | | (1.05 | ) | | | | 16.54 | | | | |
| | 2003 (4) | | | 11.00 | | | | | (0.06 | ) | | | | 4.04 | | | | | — | | | | | 14.98 | | | | |
| | 2002 (4) | | | 12.26 | | | | | (0.07 | ) | | | | (0.30 | ) | | | | (0.89 | ) | | | | 11.00 | | | | |
| | | | | | | | | | | | | | | | | | | | | | | | |
| | |
| | (1) | Per share data calculated using average shares outstanding method. |
| |
| | (2) | For the period November 1 to October 31 in the year indicated. |
| |
| | (3) | For the period October 1, 2005 to October 31, 2005. Effective October 1, 2005, the fund’s fiscal year end was changed from September 30 to October 31. All ratios for the period have been annualized, except total return and portfolio turnover. |
| |
| | (4) | For the period October 1 to September 30 in the year indicated. |
| |
| | (5) | Prior to July 1, 2004, Class R shares were named Class S shares, which had lower fees and expenses. |
| |
| | (6) | Total return does not reflect sales charges. Total return would have been lower had certain expenses not been waived. |
The accompanying notes are an integral part of the financial statements.
72 First American Funds Annual Report 2006
| | | | | | | | | | | | | | | | | | | | | | | | | | | | | | | | | | | | | |
| | | | | | | | | | | | | | | | | | Ratio of Net | | | | | | |
| | | | | | | | | | | | | | | Ratio of | | | | Investment | | | | | | |
| | | | | | | | | | | | Ratio of Net | | | | Expenses to | | | | Loss | | | | | | |
| | | | | | | | | Ratio of | | | | Investment | | | | Average | | | | to Average | | | | | | |
| | | | | | Net Assets | | | | Expenses to | | | | Loss | | | | Net Assets | | | | Net Assets | | | | Portfolio | | | |
| | | Total | | | | End of | | | | Average | | | | to Average | | | | (Excluding | | | | (Excluding | | | | Turnover | | | |
| | | Return (6) | | | | Period (000) | | | | Net Assets | | | | Net Assets | | | | Waivers) | | | | Waivers) | | | | Rate | | | |
| | | | | | | | | | | | | | | | | | | | | | | | | | | |
| | | | 22.46 | % | | | $ | 222,293 | | | | | 1.24 | % | | | | (0.38 | )% | | | | 1.24 | % | | | | (0.38 | )% | | | | 111 | % | | |
| | | | (3.10 | ) | | | | 104,568 | | | | | 1.25 | | | | | (0.92 | ) | | | | 1.25 | | | | | (0.92 | ) | | | | 14 | | | |
| | | | 20.46 | | | | | 107,270 | | | | | 1.22 | | | | | (0.53 | ) | | | | 1.25 | | | | | (0.56 | ) | | | | 122 | | | |
| | | | 17.64 | | | | | 97,775 | | | | | 1.21 | | | | | (0.76 | ) | | | | 1.24 | | | | | (0.79 | ) | | | | 116 | | | |
| | | | 35.96 | | | | | 73,445 | | | | | 1.21 | | | | | (0.73 | ) | | | | 1.25 | | | | | (0.77 | ) | | | | 145 | | | |
| | | | (4.56 | ) | | | | 33,586 | | | | | 1.21 | | | | | (0.81 | ) | | | | 1.25 | | | | | (0.85 | ) | | | | 171 | | | |
| | | | 21.59 | % | | | $ | 15,077 | | | | | 1.99 | % | | | | (1.14 | )% | | | | 1.99 | % | | | | (1.14 | )% | | | | 111 | % | | |
| | | | (3.14 | ) | | | | 13,406 | | | | | 2.00 | | | | | (1.67 | ) | | | | 2.00 | | | | | (1.67 | ) | | | | 14 | | | |
| | | | 19.45 | | | | | 14,023 | | | | | 1.97 | | | | | (1.28 | ) | | | | 2.00 | | | | | (1.31 | ) | | | | 122 | | | |
| | | | 16.88 | | | | | 13,050 | | | | | 1.96 | | | | | (1.51 | ) | | | | 1.99 | | | | | (1.54 | ) | | | | 116 | | | |
| | | | 34.88 | | | | | 11,541 | | | | | 1.96 | | | | | (1.48 | ) | | | | 2.00 | | | | | (1.52 | ) | | | | 145 | | | |
| | | | (5.23 | ) | | | | 4,613 | | | | | 1.96 | | | | | (1.56 | ) | | | | 2.00 | | | | | (1.60 | ) | | | | 171 | | | |
| | | | 21.64 | % | | | $ | 18,794 | | | | | 1.99 | % | | | | (1.14 | )% | | | | 1.99 | % | | | | (1.14 | )% | | | | 111 | % | | |
| | | | (3.21 | ) | | | | 13,453 | | | | | 2.00 | | | | | (1.67 | ) | | | | 2.00 | | | | | (1.67 | ) | | | | 14 | | | |
| | | | 19.58 | | | | | 14,418 | | | | | 1.97 | | | | | (1.28 | ) | | | | 2.00 | | | | | (1.31 | ) | | | | 122 | | | |
| | | | 16.79 | | | | | 13,841 | | | | | 1.96 | | | | | (1.50 | ) | | | | 1.99 | | | | | (1.53 | ) | | | | 116 | | | |
| | | | 34.84 | | | | | 11,128 | | | | | 1.96 | | | | | (1.47 | ) | | | | 2.00 | | | | | (1.51 | ) | | | | 145 | | | |
| | | | (5.09 | ) | | | | 3,096 | | | | | 1.96 | | | | | (1.61 | ) | | | | 2.02 | | | | | (1.67 | ) | | | | 171 | | | |
| | | | 22.23 | % | | | $ | 2,697 | | | | | 1.49 | % | | | | (0.59 | )% | | | | 1.62 | % | | | | (0.72 | )% | | | | 111 | % | | |
| | | | (3.11 | ) | | | | 333 | | | | | 1.50 | | | | | (1.14 | ) | | | | 1.65 | | | | | (1.29 | ) | | | | 14 | | | |
| | | | 20.16 | | | | | 312 | | | | | 1.47 | | | | | (0.53 | ) | | | | 1.65 | | | | | (0.71 | ) | | | | 122 | | | |
| | | | 17.60 | | | | | 19 | | | | | 1.21 | | | | | (0.81 | ) | | | | 1.24 | | | | | (0.84 | ) | | | | 116 | | | |
| | | | 35.93 | | | | | 11,627 | | | | | 1.21 | | | | | (0.75 | ) | | | | 1.25 | | | | | (0.79 | ) | | | | 145 | | | |
| | | | (4.48 | ) | | | | 7,640 | | | | | 1.21 | | | | | (0.80 | ) | | | | 1.25 | | | | | (0.84 | ) | | | | 171 | | | |
| | | | 22.81 | % | | | $ | 732,252 | | | | | 0.99 | % | | | | (0.15 | )% | | | | 0.99 | % | | | | (0.15 | )% | | | | 111 | % | | |
| | | | (3.08 | ) | | | | 682,088 | | | | | 1.00 | | | | | (0.67 | ) | | | | 1.00 | | | | | (0.67 | ) | | | | 14 | | | |
| | | | 20.73 | | | | | 715,496 | | | | | 0.97 | | | | | (0.28 | ) | | | | 1.00 | | | | | (0.31 | ) | | | | 122 | | | |
| | | | 17.98 | | | | | 770,981 | | | | | 0.96 | | | | | (0.52 | ) | | | | 0.99 | | | | | (0.55 | ) | | | | 116 | | | |
| | | | 36.18 | | | | | 1,024,146 | | | | | 0.96 | | | | | (0.48 | ) | | | | 1.00 | | | | | (0.52 | ) | | | | 145 | | | |
| | | | (4.19 | ) | | | | 403,027 | | | | | 0.96 | | | | | (0.55 | ) | | | | 1.00 | | | | | (0.59 | ) | | | | 171 | | | |
| | | | | | | | | | | | | | | | | | | | | | | | | | | | | | | | | |
First American Funds Annual Report 2006 73
Financial Highlights For a share outstanding throughout the indicated periods.
| | | | | | | | | | | | | | | | | | | | | | | | | | | | | | | | | | |
| | | | | | | | | Realized and | | | | | | | | | | | | | |
| | | Net Asset | | | | | | | Unrealized | | | | Distributions | | | | Distributions | | | | Net Asset | | | | |
| | | Value | | | | Net | | | | Gains | | | | from Net | | | | from Net | | | | Value | | | | |
| | | Beginning | | | | Investment | | | | (Losses) on | | | | Investment | | | | Realized | | | | End of | | | | |
| | | of Period | | | | Income (Loss) | | | | Investments | | | | Income | | | | Gains | | | | Period | | | | |
| | | | | | | | | | | | | | | | | | | | | |
Small Cap Value Fund (1) | | | | | | | | | | | | | | | | | | | | | | | | | | | | | | | | |
| Class A | | | | | | | | | | | | | | | | | | | | | | | | | | | | | | | | |
| | 2006 (2) | | $ | 16.34 | | | | $ | 0.03 | | | | $ | 2.86 | | | | $ | (0.04 | ) | | | $ | (3.81 | ) | | | $ | 15.38 | | | | |
| | 2005 (3) | | | 16.78 | | | | | 0.01 | | | | | (0.45 | ) | | | | — | | | | | — | | | | | 16.34 | | | | |
| | 2005 (4) | | | 16.84 | | | | | 0.03 | | | | | 2.63 | | | | | (0.06 | ) | | | | (2.66 | ) | | | | 16.78 | | | | |
| | 2004 (4) | | | 14.28 | | | | | 0.03 | | | | | 3.13 | | | | | (0.04 | ) | | | | (0.56 | ) | | | | 16.84 | | | | |
| | 2003 (4) | | | 11.26 | | | | | — | | | | | 3.02 | | | | | — | | | | | — | | | | | 14.28 | | | | |
| | 2002 (4) | | | 13.40 | | | | | (0.02 | ) | | | | (0.13 | ) | | | | — | | | | | (1.99 | ) | | | | 11.26 | | | | |
| Class B | | | | | | | | | | | | | | | | | | | | | | | | | | | | | | | | |
| | 2006 (2) | | $ | 15.19 | | | | $ | (0.07 | ) | | | $ | 2.62 | | | | $ | — | | | | $ | (3.81 | ) | | | $ | 13.93 | | | | |
| | 2005 (3) | | | 15.61 | | | | | — | | | | | (0.42 | ) | | | | — | | | | | — | | | | | 15.19 | | | | |
| | 2005 (4) | | | 15.92 | | | | | (0.09 | ) | | | | 2.47 | | | | | (0.03 | ) | | | | (2.66 | ) | | | | 15.61 | | | | |
| | 2004 (4) | | | 13.60 | | | | | (0.08 | ) | | | | 2.96 | | | | | — | | | | | (0.56 | ) | | | | 15.92 | | | | |
| | 2003 (4) | | | 10.80 | | | | | (0.08 | ) | | | | 2.88 | | | | | — | | | | | — | | | | | 13.60 | | | | |
| | 2002 (4) | | | 13.01 | | | | | (0.11 | ) | | | | (0.11 | ) | | | | — | | | | | (1.99 | ) | | | | 10.80 | | | | |
| Class C | | | | | | | | | | | | | | | | | | | | | | | | | | | | | | | | |
| | 2006 (2) | | $ | 15.39 | | | | $ | (0.07 | ) | | | $ | 2.66 | | | | $ | — | | | | $ | (3.81 | ) | | | $ | 14.17 | | | | |
| | 2005 (3) | | | 15.82 | | | | | — | | | | | (0.43 | ) | | | | — | | | | | — | | | | | 15.39 | | | | |
| | 2005 (4) | | | 16.10 | | | | | (0.09 | ) | | | | 2.50 | | | | | (0.03 | ) | | | | (2.66 | ) | | | | 15.82 | | | | |
| | 2004 (4) | | | 13.74 | | | | | (0.08 | ) | | | | 3.00 | | | | | — | | | | | (0.56 | ) | | | | 16.10 | | | | |
| | 2003 (4) | | | 10.91 | | | | | (0.09 | ) | | | | 2.92 | | | | | — | | | | | — | | | | | 13.74 | | | | |
| | 2002 (4) | | | 13.13 | | | | | (0.11 | ) | | | | (0.12 | ) | | | | — | | | | | (1.99 | ) | | | | 10.91 | | | | |
| Class R (5) | | | | | | | | | | | | | | | | | | | | | | | | | | | | | | | | |
| | 2006 (2) | | $ | 16.29 | | | | $ | (0.01 | ) | | | $ | 2.84 | | | | $ | (0.07 | ) | | | $ | (3.81 | ) | | | $ | 15.24 | | | | |
| | 2005 (3) | | | 16.74 | | | | | 0.01 | | | | | (0.46 | ) | | | | — | | | | | — | | | | | 16.29 | | | | |
| | 2005 (4) | | | 16.83 | | | | | (0.01 | ) | | | | 2.64 | | | | | (0.06 | ) | | | | (2.66 | ) | | | | 16.74 | | | | |
| | 2004 (4) | | | 14.27 | | | | | 0.03 | | | | | 3.12 | | | | | (0.03 | ) | | | | (0.56 | ) | | | | 16.83 | | | | |
| | 2003 (4) | | | 11.26 | | | | | 0.01 | | | | | 3.01 | | | | | (0.01 | ) | | | | — | | | | | 14.27 | | | | |
| | 2002 (4) | | | 13.40 | | | | | (0.01 | ) | | | | (0.14 | ) | | | | — | | | | | (1.99 | ) | | | | 11.26 | | | | |
| Class Y | | | | | | | | | | | | | | | | | | | | | | | | | | | | | | | | |
| | 2006 (2) | | $ | 16.62 | | | | $ | 0.07 | | | | $ | 2.90 | | | | $ | (0.07 | ) | | | $ | (3.81 | ) | | | $ | 15.71 | | | | |
| | 2005 (3) | | | 17.06 | | | | | 0.01 | | | | | (0.45 | ) | | | | — | | | | | — | | | | | 16.62 | | | | |
| | 2005 (4) | | | 17.05 | | | | | 0.07 | | | | | 2.67 | | | | | (0.07 | ) | | | | (2.66 | ) | | | | 17.06 | | | | |
| | 2004 (4) | | | 14.44 | | | | | 0.08 | | | | | 3.16 | | | | | (0.07 | ) | | | | (0.56 | ) | | | | 17.05 | | | | |
| | 2003 (4) | | | 11.38 | | | | | 0.03 | | | | | 3.05 | | | | | (0.02 | ) | | | | — | | | | | 14.44 | | | | |
| | 2002 (4) | | | 13.48 | | | | | 0.02 | | | | | (0.12 | ) | | | | (0.01 | ) | | | | (1.99 | ) | | | | 11.38 | | | | |
| | | | | | | | | | | | | | | | | | | | | | | | | |
| | |
| | (1) | Per share data calculated using average shares outstanding method. |
| |
| | (2) | For the period November 1 to October 31 in the year indicated. |
| |
| | (3) | For the period October 1, 2005 to October 31, 2005. Effective October 1, 2005, the fund’s fiscal year end was changed from September 30 to October 31. All ratios for the period have been annualized, except total return and portfolio turnover. |
| |
| | (4) | For the period October 1 to September 30 in the year indicated. |
| |
| | (5) | Prior to July 1, 2004, Class R shares were named Class S shares, which had lower fees and expenses. |
| |
| | (6) | Total return does not reflect sales charges. Total return would have been lower had certain expenses not been waived. |
The accompanying notes are an integral part of the financial statements.
74 First American Funds Annual Report 2006
| | | | | | | | | | | | | | | | | | | | | | | | | | | | | | | | | | | | | |
| | | | | | | | | | | | | | | | | | Ratio of Net | | | | | | |
| | | | | | | | | | | | | | | Ratio of | | | | Investment | | | | | | |
| | | | | | | | | | | | Ratio of Net | | | | Expenses to | | | | Income (Loss) | | | | | | |
| | | | | | | | | Ratio of | | | | Investment | | | | Average | | | | to Average | | | | | | |
| | | | | | Net Assets | | | | Expenses to | | | | Income (Loss) | | | | Net Assets | | | | Net Assets | | | | Portfolio | | | |
| | | Total | | | | End of | | | | Average | | | | to Average | | | | (Excluding | | | | (Excluding | | | | Turnover | | | |
| | | Return (6) | | | | Period (000) | | | | Net Assets | | | | Net Assets | | | | Waivers) | | | | Waivers) | | | | Rate | | | |
| | | | | | | | | | | | | | | | | | | | | | | | | | | |
| | | | 20.78 | % | | | $ | 57,922 | | | | | 1.26 | % | | | | 0.21 | % | | | | 1.26 | % | | | | 0.21 | % | | | | 96 | % | | |
| | | | (2.62 | ) | | | | 46,467 | | | | | 1.25 | | | | | 0.78 | | | | | 1.25 | | | | | 0.78 | | | | | 15 | | | |
| | | | 16.78 | | | | | 48,128 | | | | | 1.24 | | | | | 0.19 | | | | | 1.26 | | | | | 0.17 | | | | | 72 | | | |
| | | | 22.70 | | | | | 43,192 | | | | | 1.23 | | | | | 0.21 | | | | | 1.25 | | | | | 0.19 | | | | | 34 | | | |
| | | | 26.86 | | | | | 32,416 | | | | | 1.23 | | | | | 0.02 | | | | | 1.25 | | | | | 0.00 | | | | | 49 | | | |
| | | | (2.19 | ) | | | | 27,205 | | | | | 1.23 | | | | | (0.12 | ) | | | | 1.26 | | | | | (0.15 | ) | | | | 37 | | | |
| | | | 19.88 | % | | | $ | 7,855 | | | | | 2.01 | % | | | | (0.53 | )% | | | | 2.01 | % | | | | (0.53 | )% | | | | 96 | % | | |
| | | | (2.69 | ) | | | | 8,913 | | | | | 2.00 | | | | | 0.03 | | | | | 2.00 | | | | | 0.03 | | | | | 15 | | | |
| | | | 15.90 | | | | | 9,325 | | | | | 1.99 | | | | | (0.56 | ) | | | | 2.01 | | | | | (0.58 | ) | | | | 72 | | | |
| | | | 21.76 | | | | | 9,901 | | | | | 1.98 | | | | | (0.51 | ) | | | | 2.00 | | | | | (0.53 | ) | | | | 34 | | | |
| | | | 25.93 | | | | | 12,560 | | | | | 1.98 | | | | | (0.73 | ) | | | | 2.00 | | | | | (0.75 | ) | | | | 49 | | | |
| | | | (2.91 | ) | | | | 12,008 | | | | | 1.98 | | | | | (0.87 | ) | | | | 2.01 | | | | | (0.90 | ) | | | | 37 | | | |
| | | | 19.89 | % | | | $ | 4,405 | | | | | 2.01 | % | | | | (0.53 | )% | | | | 2.01 | % | | | | (0.53 | )% | | | | 96 | % | | |
| | | | (2.72 | ) | | | | 4,590 | | | | | 2.00 | | | | | 0.03 | | | | | 2.00 | | | | | 0.03 | | | | | 15 | | | |
| | | | 15.92 | | | | | 4,808 | | | | | 1.99 | | | | | (0.56 | ) | | | | 2.01 | | | | | (0.58 | ) | | | | 72 | | | |
| | | | 21.83 | | | | | 4,609 | | | | | 1.98 | | | | | (0.52 | ) | | | | 2.00 | | | | | (0.54 | ) | | | | 34 | | | |
| | | | 25.94 | | | | | 4,354 | | | | | 1.98 | | | | | (0.74 | ) | | | | 2.00 | | | | | (0.76 | ) | | | | 49 | | | |
| | | | (2.96 | ) | | | | 4,873 | | | | | 1.98 | | | | | (0.87 | ) | | | | 2.01 | | | | | (0.90 | ) | | | | 37 | | | |
| | | | 20.44 | % | | | $ | 1,849 | | | | | 1.51 | % | | | | (0.09 | )% | | | | 1.63 | % | | | | (0.21 | )% | | | | 96 | % | | |
| | | | (2.69 | ) | | | | 4 | | | | | 1.50 | | | | | 0.59 | | | | | 1.65 | | | | | 0.44 | | | | | 15 | | | |
| | | | 16.60 | | | | | 4 | | | | | 1.49 | | | | | (0.04 | ) | | | | 1.66 | | | | | (0.21 | ) | | | | 72 | | | |
| | | | 22.69 | | | | | 1 | | | | | 1.23 | | | | | 0.22 | | | | | 1.25 | | | | | 0.20 | | | | | 34 | | | |
| | | | 26.79 | | | | | 1,351 | | | | | 1.23 | | | | | 0.04 | | | | | 1.25 | | | | | 0.02 | | | | | 49 | | | |
| | | | (2.19 | ) | | | | 424 | | | | | 1.24 | | | | | (0.11 | ) | | | | 1.27 | | | | | (0.14 | ) | | | | 37 | | | |
| | | | 21.01 | % | | | $ | 355,148 | | | | | 1.01 | % | | | | 0.47 | % | | | | 1.01 | % | | | | 0.47 | % | | | | 96 | % | | |
| | | | (2.58 | ) | | | | 348,166 | | | | | 1.00 | | | | | 1.03 | | | | | 1.00 | | | | | 1.03 | | | | | 15 | | | |
| | | | 17.08 | | | | | 363,261 | | | | | 0.99 | | | | | 0.44 | | | | | 1.01 | | | | | 0.42 | | | | | 72 | | | |
| | | | 23.02 | | | | | 367,774 | | | | | 0.98 | | | | | 0.50 | | | | | 1.00 | | | | | 0.48 | | | | | 34 | | | |
| | | | 27.10 | | | | | 428,846 | | | | | 0.98 | | | | | 0.27 | | | | | 1.00 | | | | | 0.25 | | | | | 49 | | | |
| | | | (1.83 | ) | | | | 368,092 | | | | | 0.98 | | | | | 0.13 | | | | | 1.01 | | | | | 0.10 | | | | | 37 | | | |
| | | | | | | | | | | | | | | | | | | | | | | | | | | | | | | | | |
First American Funds Annual Report 2006 75
Financial Highlights For a share outstanding throughout the indicated periods.
| | | | | | | | | | | | | | | | | | | | | | | | |
| | | | | | | | | Realized and | | | | | | | |
| | | Net Asset | | | | | | | Unrealized | | | | Net Asset | | | | |
| | | Value | | | | Net | | | | Gains | | | | Value | | | | |
| | | Beginning | | | | Investment | | | | (Losses) on | | | | End of | | | | |
| | | of Period | | | | Income (Loss) | | | | Investments | | | | Period | | | | |
| | | | | | | | | | | | | |
Small-Mid Cap Core Fund (1)(2) | | | | | | | | | | | | | | | | | | | | | | |
| Class A | | | | | | | | | | | | | | | | | | | | | | |
| | 2006 (3) | | $ | 8.03 | | | | $ | 0.01 | | | | $ | 1.53 | | | | $ | 9.57 | | | | |
| | 2005 (4) | | | 8.31 | | | | | (0.01 | ) | | | | (0.27 | ) | | | | 8.03 | | | | |
| | 2005 (5) | | | 7.40 | | | | | (0.07 | ) | | | | 0.98 | | | | | 8.31 | | | | |
| | 2004 (5) | | | 7.05 | | | | | (0.07 | ) | | | | 0.42 | | | | | 7.40 | | | | |
| | 2003 (5) | | | 4.29 | | | | | (0.03 | ) | | | | 2.79 | | | | | 7.05 | | | | |
| | 2002 (5) | | | 6.36 | | | | | (0.07 | ) | | | | (2.00 | ) | | | | 4.29 | | | | |
| Class B | | | | | | | | | | | | | | | | | | | | | | |
| | 2006 (3) | | $ | 7.06 | | | | $ | (0.04 | ) | | | $ | 1.32 | | | | $ | 8.34 | | | | |
| | 2005 (4) | | | 7.31 | | | | | (0.01 | ) | | | | (0.24 | ) | | | | 7.06 | | | | |
| | 2005 (5) | | | 6.55 | | | | | (0.11 | ) | | | | 0.87 | | | | | 7.31 | | | | |
| | 2004 (5) | | | 6.29 | | | | | (0.11 | ) | | | | 0.37 | | | | | 6.55 | | | | |
| | 2003 (5) | | | 3.86 | | | | | (0.07 | ) | | | | 2.50 | | | | | 6.29 | | | | |
| | 2002 (5) | | | 5.77 | | | | | (0.11 | ) | | | | (1.80 | ) | | | | 3.86 | | | | |
| Class C | | | | | | | | | | | | | | | | | | | | | | |
| | 2006 (3) | | $ | 7.69 | | | | $ | (0.05 | ) | | | $ | 1.45 | | | | $ | 9.09 | | | | |
| | 2005 (4) | | | 7.97 | | | | | (0.01 | ) | | | | (0.27 | ) | | | | 7.69 | | | | |
| | 2005 (5) | | | 7.14 | | | | | (0.12 | ) | | | | 0.95 | | | | | 7.97 | | | | |
| | 2004 (5) | | | 6.86 | | | | | (0.12 | ) | | | | 0.40 | | | | | 7.14 | | | | |
| | 2003 (5) | | | 4.20 | | | | | (0.07 | ) | | | | 2.73 | | | | | 6.86 | | | | |
| | 2002 (5) | | | 6.28 | | | | | (0.12 | ) | | | | (1.96 | ) | | | | 4.20 | | | | |
| Class Y | | | | | | | | | | | | | | | | | | | | | | |
| | 2006 (3) | | $ | 8.34 | | | | $ | 0.04 | | | | $ | 1.57 | | | | $ | 9.95 | | | | |
| | 2005 (4) | | | 8.63 | | | | | — | | | | | (0.29 | ) | | | | 8.34 | | | | |
| | 2005 (5) | | | 7.66 | | | | | (0.05 | ) | | | | 1.02 | | | | | 8.63 | | | | |
| | 2004 (5) | | | 7.28 | | | | | (0.05 | ) | | | | 0.43 | | | | | 7.66 | | | | |
| | 2003 (5) | | | 4.42 | | | | | (0.01 | ) | | | | 2.87 | | | | | 7.28 | | | | |
| | 2002 (5) | | | 6.53 | | | | | (0.05 | ) | | | | (2.06 | ) | | | | 4.42 | | | | |
| | | | | | | | | | | | | | | |
| | |
| | (1) | Per share data calculated using average shares outstanding method. |
| |
| | (2) | The financial highlights for Small-Mid Cap Core Fund as set forth herein include the historical financial highlights of the First American Technology Fund. Effective October 3, 2005, the fund’s name and strategy changed. |
| |
| | (3) | For the period November 1 to October 31 in the year indicated. |
| |
| | (4) | For the period October 1, 2005 to October 31, 2005. Effective October 1, 2005, the fund’s fiscal year end was changed from September 30 to October 31. All ratios for the period have been annualized, except total return and portfolio turnover. |
| |
| | (5) | For the period October 1 to September 30 in the year indicated. |
| |
| | (6) | Total return does not reflect sales charges. Total return would have been lower had certain expenses not been waived. |
The accompanying notes are an integral part of the financial statements.
76 First American Funds Annual Report 2006
| | | | | | | | | | | | | | | | | | | | | | | | | | | | | | | | | | | | | |
| | | | | | | | | | | | | | | | | | Ratio of Net | | | | | | |
| | | | | | | | | | | | | | | Ratio of | | | | Investment | | | | | | |
| | | | | | | | | | | | Ratio of Net | | | | Expenses to | | | | Income (Loss) | | | | | | |
| | | | | | | | | Ratio of | | | | Investment | | | | Average | | | | to Average | | | | | | |
| | | | | | Net Assets | | | | Expenses to | | | | Income (Loss) | | | | Net Assets | | | | Net Assets | | | | Portfolio | | | |
| | | Total | | | | End of | | | | Average | | | | to Average | | | | (Excluding | | | | (Excluding | | | | Turnover | | | |
| | | Return (6) | | | | Period (000) | | | | Net Assets | | | | Net Assets | | | | Waivers) | | | | Waivers) | | | | Rate | | | |
| | | | | | | | | | | | | | | | | | | | | | | | | | | |
| | | | 19.18 | % | | | $ | 26,190 | | | | | 1.39 | % | | | | 0.12 | % | | | | 1.46 | % | | | | 0.05 | % | | | | 110 | % | | |
| | | | (3.37 | ) | | | | 22,339 | | | | | 1.34 | | | | | (0.86 | ) | | | | 1.34 | | | | | (0.86 | ) | | | | 80 | | | |
| | | | 12.30 | | | | | 23,016 | | | | | 1.42 | | | | | (0.83 | ) | | | | 1.50 | | | | | (0.91 | ) | | | | 197 | | | |
| | | | 4.96 | | | | | 27,356 | | | | | 1.23 | | | | | (0.86 | ) | | | | 1.28 | | | | | (0.91 | ) | | | | 51 | | | |
| | | | 64.34 | | | | | 27,936 | | | | | 1.23 | | | | | (0.52 | ) | | | | 1.29 | | | | | (0.58 | ) | | | | 110 | | | |
| | | | (32.55 | ) | | | | 18,267 | | | | | 1.23 | | | | | (0.89 | ) | | | | 1.70 | | | | | (1.36 | ) | | | | 288 | | | |
| | | | 18.13 | % | | | $ | 8,689 | | | | | 2.14 | % | | | | (0.58 | )% | | | | 2.21 | % | | | | (0.65 | )% | | | | 110 | % | | |
| | | | (3.42 | ) | | | | 10,054 | | | | | 2.09 | | | | | (1.61 | ) | | | | 2.09 | | | | | (1.61 | ) | | | | 80 | | | |
| | | | 11.60 | | | | | 10,685 | | | | | 2.17 | | | | | (1.59 | ) | | | | 2.25 | | | | | (1.67 | ) | | | | 197 | | | |
| | | | 4.13 | | | | | 13,445 | | | | | 1.98 | | | | | (1.60 | ) | | | | 2.03 | | | | | (1.65 | ) | | | | 51 | | | |
| | | | 62.95 | | | | | 16,016 | | | | | 1.98 | | | | | (1.26 | ) | | | | 2.04 | | | | | (1.32 | ) | | | | 110 | | | |
| | | | (33.10 | ) | | | | 11,190 | | | | | 1.98 | | | | | (1.64 | ) | | | | 2.45 | | | | | (2.11 | ) | | | | 288 | | | |
| | | | 18.21 | % | | | $ | 4,986 | | | | | 2.14 | % | | | | (0.64 | )% | | | | 2.21 | % | | | | (0.71 | )% | | | | 110 | % | | |
| | | | (3.51 | ) | | | | 4,253 | | | | | 2.09 | | | | | (1.61 | ) | | | | 2.09 | | | | | (1.61 | ) | | | | 80 | | | |
| | | | 11.62 | | | | | 4,485 | | | | | 2.17 | | | | | (1.59 | ) | | | | 2.25 | | | | | (1.67 | ) | | | | 197 | | | |
| | | | 4.08 | | | | | 6,000 | | | | | 1.98 | | | | | (1.60 | ) | | | | 2.03 | | | | | (1.65 | ) | | | | 51 | | | |
| | | | 63.33 | | | | | 7,056 | | | | | 1.98 | | | | | (1.25 | ) | | | | 2.04 | | | | | (1.31 | ) | | | | 110 | | | |
| | | | (33.12 | ) | | | | 5,064 | | | | | 1.98 | | | | | (1.64 | ) | | | | 2.45 | | | | | (2.11 | ) | | | | 288 | | | |
| | | | 19.30 | % | | | $ | 67,437 | | | | | 1.14 | % | | | | 0.35 | % | | | | 1.21 | % | | | | 0.28 | % | | | | 110 | % | | |
| | | | (3.36 | ) | | | | 31,381 | | | | | 1.09 | | | | | (0.61 | ) | | | | 1.09 | | | | | (0.61 | ) | | | | 80 | | | |
| | | | 12.66 | | | | | 33,537 | | | | | 1.17 | | | | | (0.58 | ) | | | | 1.25 | | | | | (0.66 | ) | | | | 197 | | | |
| | | | 5.22 | | | | | 43,758 | | | | | 0.98 | | | | | (0.60 | ) | | | | 1.03 | | | | | (0.65 | ) | | | | 51 | | | |
| | | | 64.71 | | | | | 59,817 | | | | | 0.98 | | | | | (0.24 | ) | | | | 1.04 | | | | | (0.30 | ) | | | | 110 | | | |
| | | | (32.31 | ) | | | | 44,134 | | | | | 0.98 | | | | | (0.64 | ) | | | | 1.45 | | | | | (1.11 | ) | | | | 288 | | | |
| | | | | | | | | | | | | | | | | | | | | | | | | | | | | | | | | |
First American Funds Annual Report 2006 77
Schedule of Investments October 31, 2006, all dollars rounded to thousands (000)
| | | | | | | | | | |
| Mid Cap Growth Opportunities Fund | |
| DESCRIPTION | | SHARES | | | VALUE | |
| | |
| Common Stocks – 97.7% |
| Consumer Discretionary – 18.6% |
| Abercrombie & Fitch, Class A (a) | | | 170,732 | | | $ | 13,087 | |
| Circuit City Stores (a) | | | 475,257 | | | | 12,822 | |
| Coldwater Creek (a) (b) | | | 678,898 | | | | 20,700 | |
| Harman International Industries (a) | | | 208,821 | | | | 21,373 | |
| International Game Technology | | | 293,358 | | | | 12,471 | |
| J.C. Penney (a) | | | 190,431 | | | | 14,326 | |
| Newell Rubbermaid (a) | | | 568,635 | | | | 16,365 | |
| Nordstrom (a) | | | 168,916 | | | | 7,998 | |
| Office Depot (a) (b) | | | 505,725 | | | | 21,235 | |
| Omnicom Group (a) | | | 214,594 | | | | 21,770 | |
| Panera Bread, Class A (a) (b) | | | 201,826 | | | | 12,473 | |
| Polo Ralph Lauren (a) | | | 337,851 | | | | 23,987 | |
| Scientific Games, Class A (a) (b) | | | 1,367,136 | | | | 38,321 | |
| Texas Roadhouse, Class A (a) (b) | | | 1,194,436 | | | | 17,260 | |
| TJX (a) | | | 855,218 | | | | 24,758 | |
| Williams-Sonoma (a) | | | 358,121 | | | | 12,180 | |
| Yum! Brands | | | 175,726 | | | | 10,449 | |
| | | | | | | |
| | | | | | | | 301,575 | |
| | | | | | | |
| Consumer Staples – 0.8% |
| Corn Products International (a) | | | 340,764 | | | | 12,332 | |
| | | | | | | |
| Energy – 9.0% |
| Cameron International (a) (b) | | | 475,241 | | | | 23,810 | |
| Chesapeake Energy (a) | | | 627,950 | | | | 20,371 | |
| Hess (a) | | | 492,869 | | | | 20,898 | |
| Newfield Exploration (a) (b) | | | 345,269 | | | | 14,083 | |
| Smith International (a) | | | 674,092 | | | | 26,613 | |
| Valero Energy | | | 97,513 | | | | 5,103 | |
| Weatherford International (b) | | | 289,323 | | | | 11,885 | |
| XTO Energy (a) | | | 501,328 | | | | 23,392 | |
| | | | | | | |
| | | | | | | | 146,155 | |
| | | | | | | |
| Financials – 11.2% |
| Affiliated Managers Group (a) (b) | | | 130,017 | | | | 13,020 | |
| AllianceBernstein Holding | | | 215,152 | | | | 16,717 | |
| Ambac Financial Group | | | 193,454 | | | | 16,152 | |
| Bear Stearns (a) | | | 201,143 | | | | 30,443 | |
| Chicago Mercantile Exchange (a) | | | 19,027 | | | | 9,533 | |
| CIT Group | | | 363,340 | | | | 18,912 | |
| ICICI Bank – ADR | | | 409,760 | | | | 14,403 | |
| Northern Trust (a) | | | 416,779 | | | | 24,473 | |
| PMI Group (a) | | | 449,477 | | | | 19,170 | |
| W.R. Berkley | | | 514,308 | | | | 18,957 | |
| | | | | | | |
| | | | | | | | 181,780 | |
| | | | | | | |
| Healthcare – 15.1% |
| Caremark Rx (a) | | | 353,748 | | | | 17,415 | |
| Coventry Health Care (b) | | | 337,684 | | | | 15,854 | |
| DENTSPLY International (a) | | | 777,906 | | | | 24,333 | |
| Endo Pharmaceuticals (b) | | | 289,853 | | | | 8,272 | |
| Fisher Scientific International (b) | | | 216,710 | | | | 18,555 | |
| Health Net (b) | | | 338,695 | | | | 14,059 | |
| Healthways (a) (b) | | | 506,228 | | | | 21,439 | |
| Henry Schein (a) (b) | | | 303,950 | | | | 15,103 | |
| Humana (a) (b) | | | 177,826 | | | | 10,670 | |
| Immucor (b) | | | 333,816 | | | | 9,190 | |
| Pediatrix Medical Group (a) (b) | | | 219,022 | | | | 9,841 | |
| Quest Diagnostics (a) | | | 520,374 | | | | 25,883 | |
| Thermo Electron (a) (b) | | | 1,255,870 | | | | 53,839 | |
| | | | | | | |
| | | | | | | | 244,453 | |
| | | | | | | |
| Industrials – 14.6% |
| Dun & Bradstreet (a) (b) | | | 645,170 | | | | 49,833 | |
| Joy Global | | | 161,391 | | | | 6,312 | |
| L-3 Communications Holdings | | | 145,144 | | | | 11,687 | |
| Monster Worldwide (a) (b) | | | 492,422 | | | | 19,948 | |
| MSC Industrial Direct, Class A | | | 277,616 | | | | 11,360 | |
| Precision Castparts (a) | | | 480,620 | | | | 32,711 | |
| Republic Services | | | 678,015 | | | | 27,805 | |
| Rockwell Automation | | | 369,987 | | | | 22,939 | |
| Rockwell Collins | | | 318,205 | | | | 18,481 | |
| Roper Industries (a) | | | 410,859 | | | | 19,660 | |
| Toro (a) | | | 179,630 | | | | 7,753 | |
| UTi Worldwide (a) | | | 301,571 | | | | 7,796 | |
| | | | | | | |
| | | | | | | | 236,285 | |
| | | | | | | |
| Information Technology – 24.1% |
| Amphenol, Class A (a) | | | 602,640 | | | | 40,919 | |
| Autodesk (a) (b) | | | 501,553 | | | | 18,432 | |
| BEA Systems (a) (b) | | | 1,048,664 | | | | 17,062 | |
| Citrix Systems (a) (b) | | | 659,805 | | | | 19,484 | |
| Cognizant Technology Solutions (a) (b) | | | 281,904 | | | | 21,222 | |
| Cognos (b) | | | 460,117 | | | | 16,785 | |
| Entegris (a) (b) | | | 695,965 | | | | 7,802 | |
| F5 Networks (b) | | | 297,292 | | | | 19,678 | |
| Freescale Semiconductor, Class A (a) (b) | | | 254,565 | | | | 10,022 | |
| Freescale Semiconductor, Class B (a) (b) | | | 374,311 | | | | 14,722 | |
| Hyperion Solutions (a) (b) | | | 530,365 | | | | 19,836 | |
| Intersil, Class A | | | 484,431 | | | | 11,360 | |
| Lam Research (a) (b) | | | 288,714 | | | | 14,277 | |
| MEMC Electronic Materials (a) (b) | | | 567,260 | | | | 20,138 | |
| Microchip Technology (a) | | | 753,580 | | | | 24,815 | |
| Molex | | | 362,564 | | | | 12,653 | |
| National Semiconductor (a) | | | 716,401 | | | | 17,401 | |
| Network Appliance (a) (b) | | | 318,291 | | | | 11,617 | |
| NVIDIA (a) (b) | | | 736,645 | | | | 25,687 | |
| Paychex (a) | | | 837,277 | | | | 33,056 | |
| Trident Microsystems (a) (b) | | | 609,990 | | | | 12,895 | |
| | | | | | | |
| | | | | | | | 389,863 | |
| | | | | | | |
| Telecommunication Services – 4.3% |
| American Tower, Class A (a) (b) | | | 1,315,745 | | | | 47,393 | |
| NII Holdings, Class B (a) (b) | | | 335,195 | | | | 21,798 | |
| | | | | | | |
| | | | | | | | 69,191 | |
| | | | | | | |
Total Common Stocks | | | | | | | | |
| | (Cost $1,294,418) | | | | | | | 1,581,634 | |
| | | | | | | |
| Investment Companies – 1.6% |
| iShares Nasdaq Biotechnology Index Fund (a) (b) | | | | | | | | |
| | (Cost $23,570) | | | 321,388 | | | | 25,615 | |
| | | | | | | |
| Short Term Investment – 0.5% |
First American Prime Obligations Fund, Class Z (c) (Cost $8,127) | | | 8,126,920 | | | | 8,127 | |
| | | | | | | |
| Investments Purchased with Proceeds from Securities Lending (d) – 36.6% |
| | (Cost $593,672) | | | | | | | 593,672 | |
| | | | | | | |
Total Investments – 136.4% | | | | | | | | |
| | (Cost $1,919,787) | | | | | | | 2,209,048 | |
| | | | | | | |
Other Assets and Liabilities, Net – (36.4)% | | | | | | | (589,889 | ) |
| | | | | | | |
Total Net Assets – 100.0% | | | | | | $ | 1,619,159 | |
| | | | | | | |
The accompanying notes are an integral part of the financial statements.
78 First American Funds Annual Report 2006
Mid Cap Growth Opportunities Fund (concluded)
| |
| (a) | This security or a portion of this security is out on loan at October 31, 2006. Total loaned securities had a market value of $572,011 at October 31, 2006. See note 2 in Notes to Financial Statements. |
| |
| (b) | Non-income producing security. |
| |
| (c) | Investment in affiliated security. This money market fund is advised by FAF Advisors, Inc., which also serves as advisor to this fund. See note 3 in Notes to Financial Statements. |
| |
| (d) | The fund may loan securities in return for collateral in the form of cash, U.S. Government securities, or other high grade debt obligations. The cash collateral is invested in various money market funds and short-term, high quality debt obligations, such as repurchase agreements, commercial paper, and other corporate obligations. See note 2 in Notes to Financial Statements. |
ADR – American Depository Receipt
First American Funds Annual Report 2006 79
Schedule of Investments October 31, 2006, all dollars rounded to thousands (000)
| | | | | | | | | | |
| Mid Cap Value Fund | |
| DESCRIPTION | | SHARES | | | VALUE | |
| | |
| Common Stocks – 97.8% |
| Consumer Discretionary – 17.9% |
| Autoliv | | | 218,383 | | | $ | 12,419 | |
| BorgWarner (a) | | | 122,547 | | | | 7,046 | |
| Darden Restaurants (a) | | | 248,911 | | | | 10,429 | |
| Dollar Tree Stores (a) (b) | | | 362,175 | | | | 11,260 | |
| Ford Motor (a) | | | 1,161,713 | | | | 9,619 | |
| Fortune Brands (a) | | | 208,330 | | | | 16,031 | |
| Gannett | | | 162,945 | | | | 9,637 | |
| Gap | | | 612,428 | | | | 12,873 | |
| Harrah’s Entertainment | | | 148,027 | | | | 11,003 | |
| Mattel | | | 775,771 | | | | 17,556 | |
| Newell Rubbermaid (a) | | | 397,139 | | | | 11,430 | |
| Office Depot (a) (b) | | | 164,627 | | | | 6,913 | |
| Pulte Homes (a) | | | 404,428 | | | | 12,533 | |
| Sherwin-Williams (a) | | | 107,394 | | | | 6,361 | |
| Stanley Works (a) | | | 233,236 | | | | 11,114 | |
| | | | | | | |
| | | | | | | | 166,224 | |
| | | | | | | |
| Consumer Staples – 4.7% |
| ConAgra Foods (a) | | | 333,652 | | | | 8,725 | |
| Corn Products International | | | 261,929 | | | | 9,479 | |
| Kroger (a) | | | 660,609 | | | | 14,857 | |
| Pepsi Bottling (a) | | | 329,723 | | | | 10,426 | |
| | | | | | | |
| | | | | | | | 43,487 | |
| | | | | | | |
| Energy – 5.3% |
| GlobalSantaFe | | | 237,263 | | | | 12,314 | |
| Hess (a) | | | 100,363 | | | | 4,255 | |
| Newfield Exploration (a) (b) | | | 190,782 | | | | 7,782 | |
| Noble Energy (a) | | | 254,811 | | | | 12,391 | |
| Peabody Energy | | | 128,170 | | | | 5,379 | |
| Sunoco (a) | | | 102,323 | | | | 6,767 | |
| | | | | | | |
| | | | | | | | 48,888 | |
| | | | | | | |
| Financials (c) – 31.5% |
| ACE | | | 188,516 | | | | 10,793 | |
| Ambac Financial Group | | | 194,911 | | | | 16,273 | |
| AON (a) | | | 450,107 | | | | 15,659 | |
| Astoria Financial (a) | | | 376,046 | | | | 10,909 | |
| Bear Stearns (a) | | | 89,430 | | | | 13,535 | |
| Boston Properties – REIT (a) | | | 154,678 | | | | 16,524 | |
| Brookfield Properties (a) | | | 233,353 | | | | 8,842 | |
| Camden Property Trust – REIT (a) | | | 107,339 | | | | 8,665 | |
| CIT Group | | | 393,912 | | | | 20,503 | |
| City National (a) | | | 150,762 | | | | 10,035 | |
| Comerica | | | 104,143 | | | | 6,060 | |
| Cullen/ Frost Bankers (a) | | | 222,158 | | | | 12,032 | |
| Developers Diversified Realty – REIT (a) | | | 233,050 | | | | 14,193 | |
| Genworth Financial, Class A | | | 270,305 | | | | 9,039 | |
| KeyCorp | | | 433,880 | | | | 16,114 | |
| Marshall & Ilsley (a) | | | 406,679 | | | | 19,496 | |
| MGIC Investment (a) | | | 164,664 | | | | 9,676 | |
| Northern Trust | | | 265,107 | | | | 15,567 | |
| PMI Group (a) | | | 230,786 | | | | 9,843 | |
| Prologis – REIT (a) | | | 137,100 | | | | 8,674 | |
| StanCorp Financial Group | | | 131,566 | | | | 6,011 | |
| TD Ameritrade (a) | | | 358,442 | | | | 5,904 | |
| Vornado Realty Trust – REIT (a) | | | 110,526 | | | | 13,180 | |
| W.R. Berkley | | | 423,122 | | | | 15,596 | |
| | | | | | | |
| | | | | | | | 293,123 | |
| | | | | | | |
| Healthcare – 1.9% |
| CIGNA | | | 82,008 | | | | 9,593 | |
| Community Health Systems (b) | | | 262,025 | | | | 8,503 | |
| | | | | | | |
| | | | | | | | 18,096 | |
| | | | | | | |
| Industrials – 10.5% |
| American Standard (a) | | | 367,123 | | | | 16,260 | |
| Armor Holdings (a) (b) | | | 238,646 | | | | 12,281 | |
| Crane | | | 262,292 | | | | 10,214 | |
| CSX | | | 517,868 | | | | 18,472 | |
| Eaton | | | 252,228 | | | | 18,269 | |
| Joy Global | | | 154,220 | | | | 6,031 | |
| Republic Services | | | 383,835 | | | | 15,741 | |
| | | | | | | |
| | | | | | | | 97,268 | |
| | | | | | | |
| Information Technology – 7.6% |
| Amphenol, Class A (a) | | | 188,076 | | | | 12,770 | |
| Electronic Data Systems | | | 573,881 | | | | 14,537 | |
| Freescale Semiconductor, Class B (b) | | | 236,717 | | | | 9,310 | |
| Harris (a) | | | 350,523 | | | | 14,932 | |
| Sybase (a) (b) | | | 398,776 | | | | 9,710 | |
| Xerox (b) | | | 535,216 | | | | 9,099 | |
| | | | | | | |
| | | | | | | | 70,358 | |
| | | | | | | |
| Materials – 5.6% |
| International Flavors & Fragrances | | | 175,827 | | | | 7,469 | |
| Packaging Corporation of America | | | 458,123 | | | | 10,523 | |
| PPG Industries | | | 126,395 | | | | 8,646 | |
| Rohm & Haas (a) | | | 304,334 | | | | 15,771 | |
| Sonoco Products | | | 268,658 | | | | 9,532 | |
| | | | | | | |
| | | | | | | | 51,941 | |
| | | | | | | |
| Telecommunication Service – 0.5% |
| Qwest Communications International (a) (b) | | | 563,090 | | | | 4,859 | |
| | | | | | | |
| Utilities – 12.3% |
| Atmos Energy (a) | | | 344,673 | | | | 10,592 | |
| Constellation Energy | | | 302,681 | | | | 18,887 | |
| Edison International | | | 436,217 | | | | 19,386 | |
| Entergy | | | 131,734 | | | | 11,307 | |
| PG&E (a) | | | 220,900 | | | | 9,530 | |
| PPL (a) | | | 558,638 | | | | 19,284 | |
| Sempra Energy | | | 206,752 | | | | 10,966 | |
| Wisconsin Energy | | | 310,759 | | | | 14,276 | |
| | | | | | | |
| | | | | | | | 114,228 | |
| | | | | | | |
Total Common Stocks | | | | | | | | |
| | (Cost $768,469) | | | | | | | 908,472 | |
| | | | | | | |
| Short-Term Investment – 1.8% |
| First American Prime Obligations Fund, Class Z (d) | | | | | | | | |
| | (Cost $17,175) | | | 17,175,211 | | | | 17,175 | |
| | | | | | | |
Investments Purchased with Proceeds
from Securities Lending (e) – 28.7% |
| | (Cost $266,737) | | | | | | | 266,737 | |
| | | | | | | |
Total Investments – 128.3% | | | | | | | | |
| | (Cost $1,052,381) | | | | | | | 1,192,384 | |
| | | | | | | |
Other Assets and Liabilities, Net – (28.3)% | | | | | | | (263,318 | ) |
| | | | | | | |
Total Net Assets – 100.0% | | | | | | $ | 929,066 | |
| | | | | | | |
The accompanying notes are an integral part of the financial statements.
80 First American Funds Annual Report 2006
Mid Cap Value Fund (concluded)
| |
| (a) | This security or a portion of this security is out on loan at October 31, 2006. Total loaned securities had a market value of $257,903 at October 31, 2006. See note 2 in Notes to Financial Statements. |
| |
| (b) | Non-income producing security. |
| |
| (c) | This fund is significantly invested in this industry and therefore is subject to additional risks. See note 6 in Notes to Financial Statements. |
| |
| (d) | Investment in affiliated security. This money market fund is advised by FAF Advisors, Inc., which also serves as advisor to this fund. See note 3 in Notes to Financial Statements. |
| |
| (e) | The fund may loan securities in return for collateral in the form of cash, U.S. government securities, or other high grade debt obligations. The cash collateral is invested in various money market funds and short-term, high quality debt obligations, such as repurchase agreements, commercial paper, and other corporate obligations. See note 2 in Notes to Financial Statements. |
REIT – Real Estate Investment Trust
First American Funds Annual Report 2006 81
Statements of Assets and Liabilities October 31, 2006, all dollars and shares are rounded to thousands (000), except for per share data
| | | | | | | | | | | | | |
| | | Mid Cap Growth | | | | Mid Cap | | | | |
| | | Opportunities Fund | | | | Value Fund | | | | |
| | | | | | | | |
| Investments in unaffiliated securities, at cost | | $ | 1,317,988 | | | | $ | 768,469 | | | | |
| Investments in affiliated money market fund, at cost | | | 8,127 | | | | | 17,175 | | | | |
| Investments purchased with proceeds from securities lending, at cost (note 2) | | | 593,672 | | | | | 266,737 | | | | |
| | | | | | | | | |
ASSETS: | | | | | | | | | | | | |
| Investments in unaffiliated securities, at value* (note 2) | | $ | 1,607,249 | | | | $ | 908,472 | | | | |
| Investments in affiliated money market fund, at value (note 2) | | | 8,127 | | | | | 17,175 | | | | |
| Investments purchased with proceeds from securities lending (note 2) | | | 593,672 | | | | | 266,737 | | | | |
| Cash | | | 24 | | | | | — | | | | |
| Receivable for dividends | | | 501 | | | | | 411 | | | | |
| Receivable for investment securities sold | | | 22,931 | | | | | 5,733 | | | | |
| Receivable for capital shares sold | | | 916 | | | | | 1,483 | | | | |
| Prepaid expenses and other assets | | | 42 | | | | | 45 | | | | |
| | | | | | | | | |
Total assets | | | 2,233,462 | | | | | 1,200,056 | | | | |
| | | | | | | | | |
LIABILITIES: | | | | | | | | | | | | |
| Bank overdraft | | | — | | | | | 4 | | | | |
| Payable for investment securities purchased | | | 10,597 | | | | | 2,792 | | | | |
| Payable upon return of securities loaned (note 2) | | | 593,672 | | | | | 266,737 | | | | |
| Payable for capital shares redeemed | | | 8,556 | | | | | 610 | | | | |
| Payable to affiliates (note 3) | | | 1,328 | | | | | 749 | | | | |
| Payable for distribution and shareholder servicing fees | | | 105 | | | | | 60 | | | | |
| Accrued expenses and other liabilities | | | 45 | | | | | 38 | | | | |
| | | | | | | | | |
Total liabilities | | | 614,303 | | | | | 270,990 | | | | |
| | | | | | | | | |
Net assets | | $ | 1,619,159 | | | | $ | 929,066 | | | | |
| | | | | | | | | |
COMPOSITION OF NET ASSETS: | | | | | | | | | | | | |
| Portfolio capital | | | 1,220,986 | | | | | 731,751 | | | | |
| Accumulated net realized gain on investments | | | 108,912 | | | | | 57,312 | | | | |
| Net unrealized appreciation of investments | | | 289,261 | | | | | 140,003 | | | | |
| | | | | | | | | |
Net assets | | $ | 1,619,159 | | | | $ | 929,066 | | | | |
| | | | | | | | | |
| *Including securities loaned, at value | | $ | 572,011 | | | | $ | 257,903 | | | | |
| | | | | | | | | |
Class A: | | | | | | | | | | | | |
| Net assets | | $ | 322,385 | | | | $ | 156,576 | | | | |
| Shares issued and outstanding ($0.0001 par value – 2 billion authorized) | | | 7,782 | | | | | 5,875 | | | | |
| Net asset value and redemption price per share | | $ | 41.43 | | | | $ | 26.65 | | | | |
Maximum offering price per share (1) | | $ | 43.84 | | | | $ | 28.20 | | | | |
Class B: | | | | | | | | | | | | |
| Net assets | | $ | 15,605 | | | | $ | 8,590 | | | | |
| Shares issued and outstanding ($0.0001 par value – 2 billion authorized) | | | 409 | | | | | 337 | | | | |
Net asset value, offering price and redemption price per share (2) | | $ | 38.15 | | | | $ | 25.50 | | | | |
Class C: | | | | | | | | | | | | |
| Net assets | | $ | 19,540 | | | | $ | 18,162 | | | | |
| Shares issued and outstanding ($0.0001 par value – 2 billion authorized) | | | 493 | | | | | 698 | | | | |
Net asset value, offering price and redemption price per share (2) | | $ | 39.65 | | | | $ | 26.02 | | | | |
Class R: | | | | | | | | | | | | |
| Net assets | | $ | 17,853 | | | | $ | 17,724 | | | | |
| Shares issued and outstanding ($0.0001 par value – 2 billion authorized) | | | 434 | | | | | 667 | | | | |
| Net asset value, offering price, and redemption price per share | | $ | 41.15 | | | | $ | 26.56 | | | | |
Class Y: | | | | | | | | | | | | |
| Net assets | | $ | 1,243,776 | | | | $ | 728,014 | | | | |
| Shares issued and outstanding ($0.0001 par value – 2 billion authorized) | | | 28,512 | | | | | 27,192 | | | | |
| Net asset value, offering price, and redemption price per share | | $ | 43.62 | | | | $ | 26.77 | | | | |
| | | | | | | | | |
| | |
| | (1) | The offering price is calculated by dividing the net asset value by 1 minus the maximum sales charge of 5.50% |
| |
| | (2) | Class B and C have a contingent deferred sales charge. For a description of this sales charge, see notes 1 and 3 in Notes to Financial Statements. |
The accompanying notes are an integral part of the financial statements.
82 First American Funds Annual Report 2006
Statements of Operations For the year ended October 31, 2006, all dollars are rounded to thousands (000)
| | | | | | | | | | | | | |
| | | Mid Cap Growth | | | | Mid Cap | | | | |
| | | Opportunities Fund | | | | Value Fund | | | | |
| | | | | | | | |
INVESTMENT INCOME: | | | | | | | | | | | | |
| Dividends from affiliated money market fund | | $ | 1,255 | | | | $ | 1,080 | | | | |
| Dividends from unaffiliated securities | | | 14,070 | | | | | 13,052 | | | | |
| Less: Foreign taxes withheld | | | — | | | | | (17 | ) | | | |
| Securities lending income | | | 561 | | | | | 234 | | | | |
| | | | | | | | | |
Total investment income | | | 15,886 | | | | | 14,349 | | | | |
| | | | | | | | | |
EXPENSES (note 3): | | | | | | | | | | | | |
| Investment advisory fees | | | 11,564 | | | | | 5,598 | | | | |
| Administration fees | | | 2,620 | | | | | 1,309 | | | | |
| Transfer agent fees | | | 1,676 | | | | | 782 | | | | |
| Custodian fees | | | 83 | | | | | 40 | | | | |
| Professional fees | | | 40 | | | | | 39 | | | | |
| Registration fees | | | 69 | | | | | 65 | | | | |
| Postage and printing fees | | | 118 | | | | | 53 | | | | |
| Directors’ fees | | | 34 | | | | | 24 | | | | |
| Other expenses | | | 28 | | | | | 24 | | | | |
| Distribution and shareholder servicing fees – Class A | | | 792 | | | | | 253 | | | | |
| Distribution and shareholder servicing fees – Class B | | | 158 | | | | | 88 | | | | |
| Distribution and shareholder servicing fees – Class C | | | 182 | | | | | 124 | | | | |
| Distribution and shareholder servicing fees – Class R | | | 86 | | | | | 39 | | | | |
| | | | | | | | | |
Total expenses | | | 17,450 | | | | | 8,438 | | | | |
| | | | | | | | | |
| Less: Fee waivers (note 3) | | | (19 | ) | | | | (8 | ) | | | |
| Less: Indirect payments made from custodian (note 3) | | | (10 | ) | | | | (10 | ) | | | |
| | | | | | | | | |
Total net expenses | | | 17,421 | | | | | 8,420 | | | | |
| | | | | | | | | |
Investment income (loss) – net | | | (1,535 | ) | | | | 5,929 | | | | |
| | | | | | | | | |
REALIZED AND UNREALIZED GAINS ON INVESTMENTS – NET (Note 5) | | | | | | | | | | | | |
| Net realized gain on investments | | | 161,244 | | | | | 62,972 | | | | |
| Net change in unrealized appreciation or depreciation of investments | | | 34,383 | | | | | 56,622 | | | | |
| | | | | | | | | |
Net gain on investments | | | 195,627 | | | | | 119,594 | | | | |
| | | | | | | | | |
Net increase in net assets resulting from operations | | $ | 194,092 | | | | $ | 125,523 | | | | |
| | | | | | | | | |
First American Funds Annual Report 2006 83
Statements of Changes in Net Assets all dollars are rounded to thousands (000)
| | | | | | | | | | | | | | | | | | | | | | | | | | | | |
| | | Mid Cap Growth | | | Mid Cap | | | |
| | | Opportunities Fund | | | Value Fund | | | |
| | | | | | | |
| | | One-Month | | | | | | | One-Month | | | | | |
| | | Fiscal Period | | | | | | | Fiscal Period | | | | | |
| | | Year Ended | | | Ended | | | Year Ended | | | Year Ended | | | Ended | | | Year Ended | | | |
| | | 10/31/06 | | | 10/31/05 | | | 9/30/05 | | | 10/31/06 | | | 10/31/05 | | | 9/30/05 | | | |
| | | | | | |
| | | |
OPERATIONS: | | | | | | | | | | | | | | | | | | | | | | | | | | |
| Investment income (loss) – net | | $ | (1,535 | ) | | $ | (729 | ) | | $ | (6,568 | ) | | $ | 5,929 | | | $ | (161 | ) | | $ | 4,429 | | | |
| Net realized gain on investments | | | 161,244 | | | | 33,519 | | | | 180,742 | | | | 62,972 | | | | 4,915 | | | | 88,747 | | | |
| Net change in unrealized appreciation or depreciation of investments | | | 34,383 | | | | (63,233 | ) | | | 166,265 | | | | 56,622 | | | | (27,884 | ) | | | 30,399 | | | |
| | | | | |
| Net increase (decrease) in net assets resulting from operations | | | 194,092 | | | | (30,443 | ) | | | 340,439 | | | | 125,523 | | | | (23,130 | ) | | | 123,575 | | | |
| | | | | |
| | | |
DISTRIBUTIONS TO SHAREHOLDERS FROM: | | | | | | | | | | | | | | | | | | | | | | | | | | |
| Investment income – net: | | | | | | | | | | | | | | | | | | | | | | | | | | |
| | Class A | | | — | | | | — | | | | — | | | | (693 | ) | | | — | | | | (164 | ) | | |
| | Class B | | | — | | | | — | | | | — | | | | (14 | ) | | | — | | | | (1 | ) | | |
| | Class C | | | — | | | | — | | | | — | | | | (21 | ) | | | — | | | | — | | | |
| | Class R | | | — | | | | — | | | | — | | | | (33 | ) | | | — | | | | — | | | |
| | Class Y | | | — | | | | — | | | | — | | | | (5,752 | ) | | | — | | | | (3,591 | ) | | |
| Net realized gain on investments: | | | | | | | | | | | | | | | | | | | | | | | | | | |
| | Class A | | | (31,106 | ) | | | — | | | | (26,799 | ) | | | (3,267 | ) | | | — | | | | — | | | |
| | Class B | | | (1,639 | ) | | | — | | | | (1,832 | ) | | | (485 | ) | | | — | | | | — | | | |
| | Class C | | | (1,741 | ) | | | — | | | | (1,996 | ) | | | (427 | ) | | | — | | | | — | | | |
| | Class R | | | (1,068 | ) | | | — | | | | (2 | ) | | | (81 | ) | | | — | | | | — | | | |
| | Class Y | | | (121,918 | ) | | | — | | | | (164,469 | ) | | | (31,352 | ) | | | — | | | | — | | | |
| | | | | |
| Total distributions | | | (157,472 | ) | | | — | | | | (195,098 | ) | | | (42,125 | ) | | | — | | | | (3,756 | ) | | |
| | | | | |
| | | |
CAPITAL SHARE TRANSACTIONS (note 4): | | | | | | | | | | | | | | | | | | | | | | | | | | |
| Class A: | | | | | | | | | | | | | | | | | | | | | | | | | | |
| | Proceeds from sales | | | 138,564 | | | | 7,177 | | | | 141,968 | | | | 109,279 | | | | 4,466 | | | | 29,979 | | | |
| | Reinvestment of distributions | | | 30,411 | | | | — | | | | 25,770 | | | | 3,794 | | | | — | | | | 156 | | | |
| | Payments for redemptions | | | (166,778 | ) | | | (4,287 | ) | | | (44,583 | ) | | | (23,533 | ) | | | (866 | ) | | | (11,836 | ) | | |
| | | | | |
| Increase in net assets from Class A transactions | | | 2,197 | | | | 2,890 | | | | 123,155 | | | | 89,540 | | | | 3,600 | | | | 18,299 | | | |
| | | | | |
| Class B: | | | | | | | | | | | | | | | | | | | | | | | | | | |
| | Proceeds from sales | | | 2,403 | | | | 139 | | | | 3,307 | | | | 1,757 | | | | 84 | | | | 2,023 | | | |
| | Reinvestment of distributions | | | 1,544 | | | | — | | | | 1,767 | | | | 483 | | | | — | | | | 1 | | | |
| | Payments for redemptions (note 3) | | | (2,973 | ) | | | (186 | ) | | | (2,148 | ) | | | (3,785 | ) | | | (662 | ) | | | (3,940 | ) | | |
| | | | | |
| Increase (decrease) in net assets from Class B transactions | | | 974 | | | | (47 | ) | | | 2,926 | | | | (1,545 | ) | | | (578 | ) | | | (1,916 | ) | | |
| | | | | |
| Class C: | | | | | | | | | | | | | | | | | | | | | | | | | | |
| | Proceeds from sales | | | 9,430 | | | | 445 | | | | 6,924 | | | | 11,403 | | | | 427 | | | | 4,164 | | | |
| | Reinvestment of distributions | | | 1,697 | | | | — | | | | 1,992 | | | | 424 | | | | — | | | | — | | | |
| | Payments for redemptions (note 3) | | | (7,181 | ) | | | (1,748 | ) | | | (5,357 | ) | | | (2,366 | ) | | | (165 | ) | | | (994 | ) | | |
| | | | | |
| Increase (decrease) in net assets from Class C transactions | | | 3,946 | | | | (1,303 | ) | | | 3,559 | | | | 9,461 | | | | 262 | | | | 3,170 | | | |
| | | | | |
| Class R: | | | | | | | | | | | | | | | | | | | | | | | | | | |
| | Proceeds from sales | | | 13,794 | | | | 198 | | | | 5,771 | | | | 17,551 | | | | 421 | | | | 366 | | | |
| | Reinvestment of distributions | | | 1,068 | | | | — | | | | 2 | | | | 108 | | | | — | | | | — | | | |
| | Payments for redemptions | | | (2,657 | ) | | | (94 | ) | | | (481 | ) | | | (1,395 | ) | | | (5 | ) | | | (5 | ) | | |
| | | | | |
| Increase in net assets from Class R transactions | | | 12,205 | | | | 104 | | | | 5,292 | | | | 16,264 | | | | 416 | | | | 361 | | | |
| | | | | |
| Class Y: | | | | | | | | | | | | | | | | | | | | | | | | | | |
| | Proceeds from sales | | | 175,964 | | | | 9,636 | | | | 217,915 | | | | 123,981 | | | | 6,506 | | | | 155,251 | | | |
| | Reinvestment of distributions | | | 98,347 | | | | — | | | | 131,612 | | | | 27,701 | | | | — | | | | 2,282 | | | |
| | Payments for redemptions | | | (300,042 | ) | | | (20,617 | ) | | | (366,059 | ) | | | (91,763 | ) | | | (8,542 | ) | | | (79,482 | ) | | |
| | | | | |
| Increase (decrease) in net assets from Class Y transactions | | | (25,731 | ) | | | (10,981 | ) | | | (16,532 | ) | | | 59,919 | | | | (2,036 | ) | | | 78,051 | | | |
| | | | | |
| Increase (decrease) in net assets from capital share transactions | | | (6,409 | ) | | | (9,337 | ) | | | 118,400 | | | | 173,639 | | | | 1,664 | | | | 97,965 | | | |
| | | | | |
| Total increase (decrease) in net assets | | | 30,211 | | | | (39,780 | ) | | | 263,741 | | | | 257,037 | | | | (21,466 | ) | | | 217,784 | | | |
Net assets at beginning of period | | | 1,588,948 | | | | 1,628,728 | | | | 1,364,987 | | | | 672,029 | | | | 693,495 | | | | 475,711 | | | |
| | | | | |
Net assets at end of period | | $ | 1,619,159 | | | $ | 1,588,948 | | | $ | 1,628,728 | | | $ | 929,066 | | | $ | 672,029 | | | $ | 693,495 | | | |
| | | | | |
Undistributed (distributions in excess of) net investment income at end of period | | $ | — | | | $ | (1 | ) | | $ | (1 | ) | | $ | — | | | $ | 186 | | | $ | 186 | | | |
| | | | | |
The accompanying notes are an integral part of the financial statements.
84 First American Funds Annual Report 2006
(This page intentionally left blank.)
Financial Highlights For a share outstanding throughout the indicated period.
| | | | | | | | | | | | | | | | | | | | | | | | | | | | | |
| | | | | | | | | Realized and | | | | | | | | | | |
| | | Net Asset | | | | | | | Unrealized | | | | Distributions | | | | Net Asset | | | | |
| | | Value | | | | Net | | | | Gains | | | | from Net | | | | Value | | | | |
| | | Beginning | | | | Investment | | | | (Losses) on | | | | Realized | | | | End of | | | | |
| | | of Period | | | | Loss | | | | Investments | | | | Gains | | | | Period | | | | |
| | | | | | | | | | | | | | | | | | | | |
Mid Cap Growth Opportunities | | | | | | | | | | | | | | | | | | | | | | | | | | | |
| Class A | | | | | | | | | | | | | | | | | | | | | | | | | | | |
| | 2006 (1)(2) | | $ | 40.77 | | | | $ | (0.11 | ) | | | $ | 5.04 | | | | $ | (4.27 | ) | | | $ | 41.43 | | | | |
| | 2005 (2)(3) | | | 41.55 | | | | | (0.02 | ) | | | | (0.76 | ) | | | | — | | | | | 40.77 | | | | |
| | 2005 (2)(4) | | | 38.19 | | | | | (0.24 | ) | | | | 9.65 | | | | | (6.05 | ) | | | | 41.55 | | | | |
| | 2004 (2)(4) | | | 33.68 | | | | | (0.30 | ) | | | | 5.88 | | | | | (1.07 | ) | | | | 38.19 | | | | |
| | 2003 (2)(4) | | | 26.45 | | | | | (0.18 | ) | | | | 7.41 | | | | | — | | | | | 33.68 | | | | |
| | 2002 (4) | | | 28.33 | | | | | (0.11 | ) | | | | (1.77 | ) | | | | — | | | | | 26.45 | | | | |
| Class B | | | | | | | | | | | | | | | | | | | | | | | | | | | |
| | 2006 (1)(2) | | $ | 38.12 | | | | $ | (0.38 | ) | | | $ | 4.68 | | | | $ | (4.27 | ) | | | $ | 38.15 | | | | |
| | 2005 (2)(3) | | | 38.87 | | | | | (0.05 | ) | | | | (0.70 | ) | | | | — | | | | | 38.12 | | | | |
| | 2005 (2)(4) | | | 36.31 | | | | | (0.51 | ) | | | | 9.12 | | | | | (6.05 | ) | | | | 38.87 | | | | |
| | 2004 (2)(4) | | | 32.30 | | | | | (0.55 | ) | | | | 5.63 | | | | | (1.07 | ) | | | | 36.31 | | | | |
| | 2003 (2)(4) | | | 25.56 | | | | | (0.39 | ) | | | | 7.13 | | | | | — | | | | | 32.30 | | | | |
| | 2002 (4) | | | 27.59 | | | | | (0.18 | ) | | | | (1.85 | ) | | | | — | | | | | 25.56 | | | | |
| Class C | | | | | | | | | | | | | | | | | | | | | | | | | | | |
| | 2006 (1)(2) | | $ | 39.46 | | | | $ | (0.40 | ) | | | $ | 4.86 | | | | $ | (4.27 | ) | | | $ | 39.65 | | | | |
| | 2005 (2)(3) | | | 40.23 | | | | | (0.05 | ) | | | | (0.72 | ) | | | | — | | | | | 39.46 | | | | |
| | 2005 (2)(4) | | | 37.40 | | | | | (0.53 | ) | | | | 9.41 | | | | | (6.05 | ) | | | | 40.23 | | | | |
| | 2004 (2)(4) | | | 33.24 | | | | | (0.57 | ) | | | | 5.80 | | | | | (1.07 | ) | | | | 37.40 | | | | |
| | 2003 (2)(4) | | | 26.29 | | | | | (0.40 | ) | | | | 7.35 | | | | | — | | | | | 33.24 | | | | |
| | 2002 (4) | | | 28.33 | | | | | (0.10 | ) | | | | (1.94 | ) | | | | — | | | | | 26.29 | | | | |
| Class R (5) | | | | | | | | | | | | | | | | | | | | | | | | | | | |
| | 2006 (1)(2) | | $ | 40.61 | | | | $ | (0.23 | ) | | | $ | 5.04 | | | | $ | (4.27 | ) | | | $ | 41.15 | | | | |
| | 2005 (2)(3) | | | 41.40 | | | | | (0.03 | ) | | | | (0.76 | ) | | | | — | | | | | 40.61 | | | | |
| | 2005 (2)(4) | | | 38.15 | | | | | (0.31 | ) | | | | 9.61 | | | | | (6.05 | ) | | | | 41.40 | | | | |
| | 2004 (2)(4) | | | 33.66 | | | | | (0.30 | ) | | | | 5.86 | | | | | (1.07 | ) | | | | 38.15 | | | | |
| | 2003 (2)(4) | | | 26.43 | | | | | (0.17 | ) | | | | 7.40 | | | | | — | | | | | 33.66 | | | | |
| | 2002 (4) | | | 28.29 | | | | | (0.07 | ) | | | | (1.79 | ) | | | | — | | | | | 26.43 | | | | |
| Class Y | | | | | | | | | | | | | | | | | | | | | | | | | | | |
| | 2006 (1)(2) | | $ | 42.61 | | | | $ | (0.01 | ) | | | $ | 5.29 | | | | $ | (4.27 | ) | | | $ | 43.62 | | | | |
| | 2005 (2)(3) | | | 43.42 | | | | | (0.02 | ) | | | | (0.79 | ) | | | | — | | | | | 42.61 | | | | |
| | 2005 (2)(4) | | | 39.58 | | | | | (0.16 | ) | | | | 10.05 | | | | | (6.05 | ) | | | | 43.42 | | | | |
| | 2004 (2)(4) | | | 34.78 | | | | | (0.21 | ) | | | | 6.08 | | | | | (1.07 | ) | | | | 39.58 | | | | |
| | 2003 (2)(4) | | | 27.25 | | | | | (0.09 | ) | | | | 7.62 | | | | | — | | | | | 34.78 | | | | |
| | 2002 (4) | | | 29.11 | | | | | (0.05 | ) | | | | (1.81 | ) | | | | — | | | | | 27.25 | | | | |
| | | | | | | | | | | | | | | | | | | | | | | | |
| | |
| | (1) | For the period November 1 to October 31 in the year indicated. |
| |
| | (2) | Per share data calculated using average shares outstanding method. |
| |
| | (3) | For the period October 1, 2005 to October 31, 2005. Effective October 1, 2005, the fund’s fiscal year end was changed from September 30 to October 31. All ratios for the period have been annualized, except total return and portfolio turnover. |
| |
| | (4) | For the period October 1 to September 30 in the year indicated. |
| |
| | (5) | Prior to July 1, 2004, Class R shares were named Class S shares, which had lower fees and expenses. |
| |
| | (6) | Total return does not include sales charges. Total return would have been lower had certain expenses not been waived. |
The accompanying notes are an integral part of the financial statements.
86 First American Funds Annual Report 2006
| | | | | | | | | | | | | | | | | | | | | | | | | | | | | | | | | | | | | |
| | | | | | | | | | | | | | | | | | Ratio of Net | | | | | | |
| | | | | | | | | | | | | | | Ratio of | | | | Investment | | | | | | |
| | | | | | | | | | | | Ratio of Net | | | | Expenses to | | | | Loss | | | | | | |
| | | | | | | | | Ratio of | | | | Investment | | | | Average | | | | to Average Net | | | | | | |
| | | | | | Net Assets | | | | Expenses to | | | | Loss | | | | Net Assets | | | | Assets | | | | Portfolio | | | |
| | | Total | | | | End of | | | | Average | | | | to Average | | | | (Excluding | | | | (Excluding | | | | Turnover | | | |
| | | Return (6) | | | | Period (000) | | | | Net Assets | | | | Net Assets | | | | Waivers) | | | | Waivers) | | | | Rate | | | |
| | | | | | | | | | | | | | | | | | | | | | | | | | | |
| | | | 12.69 | % | | | $ | 322,385 | | | | | 1.23 | % | | | | (0.26 | )% | | | | 1.23 | % | | | | (0.26 | )% | | | | 75 | % | | |
| | | | (1.88 | ) | | | | 314,830 | | | | | 1.23 | | | | | (0.72 | ) | | | | 1.23 | | | | | (0.72 | ) | | | | 9 | | | |
| | | | 26.25 | | | | | 317,906 | | | | | 1.21 | | | | | (0.62 | ) | | | | 1.24 | | | | | (0.65 | ) | | | | 107 | | | |
| | | | 16.88 | | | | | 173,436 | | | | | 1.20 | | | | | (0.79 | ) | | | | 1.24 | | | | | (0.83 | ) | | | | 135 | | | |
| | | | 27.33 | | | | | 154,499 | | | | | 1.20 | | | | | (0.58 | ) | | | | 1.25 | | | | | (0.63 | ) | | | | 145 | | | |
| | | | (6.64 | ) | | | | 75,002 | | | | | 1.20 | | | | | (0.34 | ) | | | | 1.26 | | | | | (0.40 | ) | | | | 162 | | | |
| | | | 11.83 | % | | | $ | 15,605 | | | | | 1.98 | % | | | | (1.02 | )% | | | | 1.98 | % | | | | (1.02 | )% | | | | 75 | % | | |
| | | | (1.93 | ) | | | | 14,586 | | | | | 1.98 | | | | | (1.47 | ) | | | | 1.98 | | | | | (1.47 | ) | | | | 9 | | | |
| | | | 25.29 | | | | | 14,922 | | | | | 1.96 | | | | | (1.40 | ) | | | | 1.99 | | | | | (1.43 | ) | | | | 107 | | | |
| | | | 16.03 | | | | | 10,974 | | | | | 1.95 | | | | | (1.54 | ) | | | | 1.99 | | | | | (1.58 | ) | | | | 135 | | | |
| | | | 26.37 | | | | | 9,055 | | | | | 1.95 | | | | | (1.33 | ) | | | | 2.00 | | | | | (1.38 | ) | | | | 145 | | | |
| | | | (7.36 | ) | | | | 4,227 | | | | | 1.95 | | | | | (1.08 | ) | | | | 2.01 | | | | | (1.14 | ) | | | | 162 | | | |
| | | | 11.84 | % | | | $ | 19,540 | | | | | 1.98 | % | | | | (1.02 | )% | | | | 1.98 | % | | | | (1.02 | )% | | | | 75 | % | | |
| | | | (1.91 | ) | | | | 15,435 | | | | | 1.98 | | | | | (1.47 | ) | | | | 1.98 | | | | | (1.47 | ) | | | | 9 | | | |
| | | | 25.27 | | | | | 17,079 | | | | | 1.96 | | | | | (1.40 | ) | | | | 1.99 | | | | | (1.43 | ) | | | | 107 | | | |
| | | | 16.03 | | | | | 12,356 | | | | | 1.95 | | | | | (1.54 | ) | | | | 1.99 | | | | | (1.58 | ) | | | | 135 | | | |
| | | | 26.43 | | | | | 12,649 | | | | | 1.95 | | | | | (1.33 | ) | | | | 2.00 | | | | | (1.38 | ) | | | | 145 | | | |
| | | | (7.20 | ) | | | | 1,136 | | | | | 1.95 | | | | | (1.07 | ) | | | | 2.01 | | | | | (1.13 | ) | | | | 162 | | | |
| | | | 12.41 | % | | | $ | 17,853 | | | | | 1.48 | % | | | | (0.57 | )% | | | | 1.61 | % | | | | (0.70 | )% | | | | 75 | % | | |
| | | | (1.91 | ) | | | | 5,502 | | | | | 1.48 | | | | | (0.97 | ) | | | | 1.63 | | | | | (1.12 | ) | | | | 9 | | | |
| | | | 25.95 | | | | | 5,501 | | | | | 1.46 | | | | | (0.77 | ) | | | | 1.64 | | | | | (0.95 | ) | | | | 107 | | | |
| | | | 16.83 | | | | | 1 | | | | | 1.20 | | | | | (0.81 | ) | | | | 1.24 | | | | | (0.85 | ) | | | | 135 | | | |
| | | | 27.36 | | | | | 10,284 | | | | | 1.20 | | | | | (0.56 | ) | | | | 1.25 | | | | | (0.61 | ) | | | | 145 | | | |
| | | | (6.58 | ) | | | | 5,869 | | | | | 1.20 | | | | | (0.33 | ) | | | | 1.26 | | | | | (0.39 | ) | | | | 162 | | | |
| | | | 12.98 | % | | | $ | 1,243,776 | | | | | 0.98 | % | | | | (0.02 | )% | | | | 0.98 | % | | | | (0.02 | )% | | | | 75 | % | | |
| | | | (1.86 | ) | | | | 1,238,595 | | | | | 0.98 | | | | | (0.47 | ) | | | | 0.98 | | | | | (0.47 | ) | | | | 9 | | | |
| | | | 26.57 | | | | | 1,273,320 | | | | | 0.96 | | | | | (0.40 | ) | | | | 0.99 | | | | | (0.43 | ) | | | | 107 | | | |
| | | | 17.18 | | | | | 1,168,220 | | | | | 0.95 | | | | | (0.54 | ) | | | | 0.99 | | | | | (0.58 | ) | | | | 135 | | | |
| | | | 27.68 | | | | | 1,153,657 | | | | | 0.95 | | | | | (0.30 | ) | | | | 1.00 | | | | | (0.35 | ) | | | | 145 | | | |
| | | | (6.39 | ) | | | | 477,210 | | | | | 0.95 | | | | | (0.08 | ) | | | | 1.01 | | | | | (0.14 | ) | | | | 162 | | | |
| | | | | | | | | | | | | | | | | | | | | | | | | | | | | | | | | |
First American Funds Annual Report 2006 87
Financial Highlights For a share outstanding throughout the indicated periods.
| | | | | | | | | | | | | | | | | | | | | | | | | | | | | | | | | | | | | | |
| | | | | | | | | Realized and | | | | | | | | | | | | | | | |
| | | Net Asset | | | | | | | Unrealized | | | | Distributions | | | | Distributions | | | | | | | Net Asset | | | |
| | | Value | | | | Net | | | | Gains | | | | from Net | | | | from Net | | | | Distributions | | | | Value | | | |
| | | Beginning | | | | Investment | | | | (Losses) on | | | | Investment | | | | Realized | | | | from Return | | | | End of | | | |
| | | of Period | | | | Income (Loss) | | | | Investments | | | | Income | | | | Gains | | | | of Capital | | | | Period | | | |
| | | | | | | | | | | | | | | | | | | | | | | | | | | |
Mid Cap Value Fund (1) | | | | | | | | | | | | | | | | | | | | | | | | | | | | | | | | | | | | |
| Class A | | | | | | | | | | | | | | | | | | | | | | | | | | | | | | | | | | | | |
| | 2006 (2) | | $ | 24.04 | | | | $ | 0.14 | | | | $ | 3.89 | | | | $ | (0.16 | ) | | | $ | (1.26 | ) | | | $ | — | | | | $ | 26.65 | | | |
| | 2005 (3) | | | 24.88 | | | | | (0.01 | ) | | | | (0.83 | ) | | | | — | | | | | — | | | | | — | | | | | 24.04 | | | |
| | 2005 (4) | | | 20.09 | | | | | 0.13 | | | | | 4.76 | | | | | (0.10 | ) | | | | — | | | | | — | | | | | 24.88 | | | |
| | 2004 (4) | | | 16.30 | | | | | 0.08 | | | | | 3.77 | | | | | (0.06 | ) | | | | — | | | | | — | (6) | | | | 20.09 | | | |
| | 2003 (4) | | | 13.29 | | | | | 0.18 | | | | | 2.96 | | | | | (0.12 | ) | | | | — | | | | | (0.01 | ) | | | | 16.30 | | | |
| | 2002 (4) | | | 13.74 | | | | | 0.13 | | | | | (0.44 | ) | | | | (0.10 | ) | | | | — | | | | | (0.04 | ) | | | | 13.29 | | | |
| Class B | | | | | | | | | | | | | | | | | | | | | | | | | | | | | | | | | | | | |
| | 2006 (2) | | $ | 23.12 | | | | $ | (0.03 | ) | | | $ | 3.71 | | | | $ | (0.04 | ) | | | $ | (1.26 | ) | | | $ | — | | | | $ | 25.50 | | | |
| | 2005 (3) | | | 23.94 | | | | | (0.02 | ) | | | | (0.80 | ) | | | | — | | | | | — | | | | | — | | | | | 23.12 | | | |
| | 2005 (4) | | | 19.39 | | | | | (0.05 | ) | | | | 4.60 | | | | | — | | | | | — | | | | | — | | | | | 23.94 | | | |
| | 2004 (4) | | | 15.81 | | | | | (0.06 | ) | | | | 3.65 | | | | | (0.01 | ) | | | | — | | | | | — | (6) | | | | 19.39 | | | |
| | 2003 (4) | | | 12.92 | | | | | 0.07 | | | | | 2.87 | | | | | (0.04 | ) | | | | — | | | | | (0.01 | ) | | | | 15.81 | | | |
| | 2002 (4) | | | 13.37 | | | | | 0.01 | | | | | (0.41 | ) | | | | (0.01 | ) | | | | — | | | | | (0.04 | ) | | | | 12.92 | | | |
| Class C | | | | | | | | | | | | | | | | | | | | | | | | | | | | | | | | | | | | |
| | 2006 (2) | | $ | 23.57 | | | | $ | (0.04 | ) | | | $ | 3.80 | | | | $ | (0.05 | ) | | | $ | (1.26 | ) | | | $ | — | | | | $ | 26.02 | | | |
| | 2005 (3) | | | 24.40 | | | | | (0.02 | ) | | | | (0.81 | ) | | | | — | | | | | — | | | | | — | | | | | 23.57 | | | |
| | 2005 (4) | | | 19.77 | | | | | (0.03 | ) | | | | 4.66 | | | | | — | | | | | — | | | | | — | | | | | 24.40 | | | |
| | 2004 (4) | | | 16.12 | | | | | (0.06 | ) | | | | 3.72 | | | | | (0.01 | ) | | | | — | | | | | — | (6) | | | | 19.77 | | | |
| | 2003 (4) | | | 13.17 | | | | | 0.07 | | | | | 2.93 | | | | | (0.04 | ) | | | | — | | | | | (0.01 | ) | | | | 16.12 | | | |
| | 2002 (4) | | | 13.63 | | | | | 0.01 | | | | | (0.43 | ) | | | | — | | | | | — | | | | | (0.04 | ) | | | | 13.17 | | | |
| Class R (5) | | | | | | | | | | | | | | | | | | | | | | | | | | | | | | | | | | | | |
| | 2006 (2) | | $ | 24.00 | | | | $ | 0.05 | | | | $ | 3.91 | | | | $ | (0.14 | ) | | | $ | (1.26 | ) | | | $ | — | | | | $ | 26.56 | | | |
| | 2005 (3) | | | 24.83 | | | | | (0.01 | ) | | | | (0.82 | ) | | | | — | | | | | — | | | | | — | | | | | 24.00 | | | |
| | 2005 (4) | | | 20.09 | | | | | 0.12 | | | | | 4.70 | | | | | (0.08 | ) | | | | — | | | | | — | | | | | 24.83 | | | |
| | 2004 (4) | | | 16.31 | | | | | 0.07 | | | | | 3.76 | | | | | (0.05 | ) | | | | — | | | | | — | (6) | | | | 20.09 | | | |
| | 2003 (4) | | | 13.29 | | | | | 0.16 | | | | | 2.99 | | | | | (0.12 | ) | | | | — | | | | | (0.01 | ) | | | | 16.31 | | | |
| | 2002 (4) | | | 13.74 | | | | | 0.13 | | | | | (0.44 | ) | | | | (0.10 | ) | | | | — | | | | | (0.04 | ) | | | | 13.29 | | | |
| Class Y | | | | | | | | | | | | | | | | | | | | | | | | | | | | | | | | | | | | |
| | 2006 (2) | | $ | 24.14 | | | | $ | 0.22 | | | | $ | 3.89 | | | | $ | (0.22 | ) | | | $ | (1.26 | ) | | | $ | — | | | | $ | 26.77 | | | |
| | 2005 (3) | | | 24.98 | | | | | — | | | | | (0.84 | ) | | | | — | | | | | — | | | | | — | | | | | 24.14 | | | |
| | 2005 (4) | | | 20.17 | | | | | 0.18 | | | | | 4.78 | | | | | (0.15 | ) | | | | — | | | | | — | | | | | 24.98 | | | |
| | 2004 (4) | | | 16.36 | | | | | 0.12 | | | | | 3.79 | | | | | (0.10 | ) | | | | — | | | | | — | (6) | | | | 20.17 | | | |
| | 2003 (4) | | | 13.33 | | | | | 0.21 | | | | | 2.98 | | | | | (0.15 | ) | | | | — | | | | | (0.01 | ) | | | | 16.36 | | | |
| | 2002 (4) | | | 13.77 | | | | | 0.17 | | | | | (0.44 | ) | | | | (0.13 | ) | | | | — | | | | | (0.04 | ) | | | | 13.33 | | | |
| | | | | | | | | | | | | | | | | | | | | | | | | | | | | | | | | |
| | |
| | (1) | Per share data calculated using average shares outstanding method. |
| |
| | (2) | For the period November 1 to October 31 in the year indicated. |
| |
| | (3) | For the period October 1, 2005 to October 31, 2005. Effective October 1, 2005, the fund’s fiscal year end was changed from September 30 to October 31. All ratios for the period have been annualized, except total return and portfolio turnover. |
| |
| | (4) | For the period October 1 to September 30 in the year indicated. |
| |
| | (5) | Prior to July 1, 2004, Class R shares were named Class S shares, which had lower fees and expenses. |
| |
| | (6) | Includes a tax return of capital less than $0.01. |
| |
| | (7) | Total return does not include sales charges. Total return would have been lower had certain expenses not been waived. |
The accompanying notes are an integral part of the financial statements.
88 First American Funds Annual Report 2006
| | | | | | | | | | | | | | | | | | | | | | | | | | | | | | | | | | | | | | |
| | | | | | | | | | | | | | | | | | Ratio of Net | | | | | | | |
| | | | | | | | | | | | | | | Ratio of | | | | Investment | | | | | | | |
| | | | | | | | | | | | Ratio of Net | | | | Expenses to | | | | Income (Loss) | | | | | | | |
| | | | | | | | | Ratio of | | | | Investment | | | | Average | | | | to Average | | | | | | | |
| | | | | | Net Assets | | | | Expenses to | | | | Income (Loss) | | | | Net Assets | | | | Net Assets | | | | Portfolio | | | | |
| | | Total | | | | End of | | | | Average | | | | to Average | | | | (Excluding | | | | (Excluding | | | | Turnover | | | | |
| | | Return (7) | | | | Period (000) | | | | Net Assets | | | | Net Assets | | | | Waivers) | | | | Waivers) | | | | Rate | | | | |
| | | | | | | | | | | | | | | | | | | | | | | | | |
| | | | 17.36 | % | | | $ | 156,576 | | | | | 1.24% | | | | | 0.50 | % | | | | 1.24 | % | | | | 0.50 | % | | | | 70 | % | | | |
| | | | (3.38 | ) | | | | 56,125 | | | | | 1.23 | | | | | (0.48 | ) | | | | 1.23 | | | | | (0.48 | ) | | | | 10 | | | | |
| | | | 24.38 | | | | | 54,360 | | | | | 1.21 | | | | | 0.59 | | | | | 1.25 | | | | | 0.55 | | | | | 101 | | | | |
| | | | 23.65 | | | | | 28,561 | | | | | 1.20 | | | | | 0.41 | | | | | 1.25 | | | | | 0.36 | | | | | 83 | | | | |
| | | | 23.71 | | | | | 16,598 | | | | | 1.20 | | | | | 1.21 | | | | | 1.25 | | | | | 1.16 | | | | | 102 | | | | |
| | | | (2.41 | ) | | | | 13,083 | | | | | 1.20 | | | | | 0.83 | | | | | 1.26 | | | | | 0.77 | | | | | 90 | | | | |
| | | | 16.45 | % | | | $ | 8,590 | | | | | 1.99% | | | | | (0.17 | )% | | | | 1.99 | % | | | | (0.17 | )% | | | | 70 | % | | | |
| | | | (3.43 | ) | | | | 9,252 | | | | | 1.98 | | | | | (1.25 | ) | | | | 1.98 | | | | | (1.25 | ) | | | | 10 | | | | |
| | | | 23.47 | | | | | 10,157 | | | | | 1.96 | | | | | (0.21 | ) | | | | 2.00 | | | | | (0.25 | ) | | | | 101 | | | | |
| | | | 22.69 | | | | | 9,928 | | | | | 1.95 | | | | | (0.35 | ) | | | | 2.00 | | | | | (0.40 | ) | | | | 83 | | | | |
| | | | 22.84 | | | | | 10,154 | | | | | 1.95 | | | | | 0.50 | | | | | 2.00 | | | | | 0.45 | | | | | 102 | | | | |
| | | | (3.07 | ) | | | | 10,410 | | | | | 1.95 | | | | | 0.08 | | | | | 2.01 | | | | | 0.02 | | | | | 90 | | | | |
| | | | 16.47 | % | | | $ | 18,162 | | | | | 1.99% | | | | | (0.24 | )% | | | | 1.99 | % | | | | (0.24 | )% | | | | 70 | % | | | |
| | | | (3.40 | ) | | | | 7,439 | | | | | 1.98 | | | | | (1.24 | ) | | | | 1.98 | | | | | (1.24 | ) | | | | 10 | | | | |
| | | | 23.43 | | | | | 7,426 | | | | | 1.96 | | | | | (0.15 | ) | | | | 2.00 | | | | | (0.19 | ) | | | | 101 | | | | |
| | | | 22.69 | | | | | 3,342 | | | | | 1.95 | | | | | (0.33 | ) | | | | 2.00 | | | | | (0.38 | ) | | | | 83 | | | | |
| | | | 22.84 | | | | | 2,916 | | | | | 1.95 | | | | | 0.51 | | | | | 2.00 | | | | | 0.46 | | | | | 102 | | | | |
| | | | (3.09 | ) | | | | 3,207 | | | | | 1.95 | | | | | 0.08 | | | | | 2.01 | | | | | 0.02 | | | | | 90 | | | | |
| | | | 17.06 | % | | | $ | 17,724 | | | | | 1.49% | | | | | 0.15 | % | | | | 1.61 | % | | | | 0.03 | % | | | | 70 | % | | | |
| | | | (3.34 | ) | | | | 785 | | | | | 1.47 | | | | | (0.69 | ) | | | | 1.62 | | | | | (0.84 | ) | | | | 10 | | | | |
| | | | 24.04 | | | | | 380 | | | | | 1.46 | | | | | 0.52 | | | | | 1.65 | | | | | 0.33 | | | | | 101 | | | | |
| | | | 23.51 | | | | | 1 | | | | | 1.20 | | | | | 0.37 | | | | | 1.25 | | | | | 0.32 | | | | | 83 | | | | |
| | | | 23.80 | | | | | 966 | | | | | 1.20 | | | | | 1.07 | | | | | 1.25 | | | | | 1.02 | | | | | 102 | | | | |
| | | | (2.40 | ) | | | | 158 | | | | | 1.20 | | | | | 0.87 | | | | | 1.26 | | | | | 0.81 | | | | | 90 | | | | |
| | | | 17.63 | % | | | $ | 728,014 | | | | | 0.99% | | | | | 0.81 | % | | | | 0.99 | % | | | | 0.81 | % | | | | 70 | % | | | |
| | | | (3.36 | ) | | | | 598,428 | | | | | 0.98 | | | | | (0.24 | ) | | | | 0.98 | | | | | (0.24 | ) | | | | 10 | | | | |
| | | | 24.68 | | | | | 621,172 | | | | | 0.96 | | | | | 0.80 | | | | | 1.00 | | | | | 0.76 | | | | | 101 | | | | |
| | | | 23.95 | | | | | 433,879 | | | | | 0.95 | | | | | 0.66 | | | | | 1.00 | | | | | 0.61 | | | | | 83 | | | | |
| | | | 24.06 | | | | | 332,243 | | | | | 0.95 | | | | | 1.45 | | | | | 1.00 | | | | | 1.40 | | | | | 102 | | | | |
| | | | (2.12 | ) | | | | 259,990 | | | | | 0.95 | | | | | 1.08 | | | | | 1.01 | | | | | 1.02 | | | | | 90 | | | | |
| | | | | | | | | | | | | | | | | | | | | | | | | | | | | | |
First American Funds Annual Report 2006 89
Schedule of Investments October 31, 2006, all dollars are rounded to thousands (000)
| | | | | | | | | |
| Large Cap Growth Opportunities Fund | |
| DESCRIPTION | | SHARES | | | VALUE | |
| | |
| Common Stocks – 98.1% |
| Consumer Discretionary – 11.3% |
| J.C. Penney (a) | | | 112,485 | | | $ | 8,462 | |
| Kohl’s (b) | | | 103,104 | | | | 7,279 | |
| Lowe’s (a) | | | 993,008 | | | | 29,929 | |
| Nordstrom (a) | | | 101,807 | | | | 4,821 | |
| Omnicom Group (a) | | | 96,821 | | | | 9,823 | |
| Polo Ralph Lauren | | | 58,683 | | | | 4,167 | |
| Starbucks (a) (b) | | | 163,297 | | | | 6,164 | |
| Target (a) | | | 249,674 | | | | 14,776 | |
| Williams-Sonoma | | | 164,808 | | | | 5,605 | |
| Yum! Brands | | | 188,635 | | | | 11,216 | |
| | | | | | | |
| | | | | | | | 102,242 | |
| | | | | | | |
| Consumer Staples – 9.9% |
| Altria Group | | | 108,809 | | | | 8,849 | |
| Coca-Cola | | | 144,349 | | | | 6,744 | |
| CVS | | | 258,999 | | | | 8,127 | |
| PepsiCo (a) | | | 291,101 | | | | 18,467 | |
| Procter & Gamble | | | 296,066 | | | | 18,768 | |
| Walgreen (a) | | | 278,360 | | | | 12,159 | |
| Wal-Mart Stores | | | 339,443 | | | | 16,728 | |
| | | | | | | |
| | | | | | | | 89,842 | |
| | | | | | | |
| Energy – 5.6% |
| Apache (a) | | | 91,028 | | | | 5,946 | |
| EOG Resources (a) | | | 90,024 | | | | 5,989 | |
| Exxon Mobil (a) | | | 203,292 | | | | 14,519 | |
| Schlumberger (a) | | | 220,021 | | | | 13,879 | |
| XTO Energy | | | 212,386 | | | | 9,910 | |
| | | | | | | |
| | | | | | | | 50,243 | |
| | | | | | | |
| Financials – 9.3% |
| Ambac Financial Group | | | 92,550 | | | | 7,727 | |
| American Express | | | 261,687 | | | | 15,128 | |
| American International Group | | | 142,343 | | | | 9,561 | |
| CIT Group | | | 99,431 | | | | 5,175 | |
| Goldman Sachs Group (a) | | | 103,464 | | | | 19,637 | |
| ICICI Bank, ADR | | | 219,334 | | | | 7,710 | |
| Morgan Stanley | | | 60,410 | | | | 4,617 | |
| PMI Group (a) | | | 160,998 | | | | 6,867 | |
| SLM | | | 166,689 | | | | 8,114 | |
| | | | | | | |
| | | | | | | | 84,536 | |
| | | | | | | |
| Healthcare – 13.2% |
| Alcon (a) (b) | | | 72,309 | | | | 7,671 | |
| Amgen (b) | | | 155,074 | | | | 11,772 | |
| Baxter International | | | 238,118 | | | | 10,946 | |
| Caremark Rx (a) | | | 315,170 | | | | 15,516 | |
| Genentech (a) (b) | | | 74,338 | | | | 6,192 | |
| Henry Schein (a) (b) | | | 87,769 | | | | 4,361 | |
| Johnson & Johnson | | | 138,469 | | | | 9,333 | |
| Medtronic (a) | | | 260,133 | | | | 12,663 | |
| Novartis AG, ADR | | | 181,372 | | | | 11,015 | |
| UnitedHealth Group | | | 330,785 | | | | 16,136 | |
| Wellpoint (b) | | | 185,785 | | | | 14,179 | |
| | | | | | | |
| | | | | | | | 119,784 | |
| | | | | | | |
| Industrials – 14.1% |
| Boeing (a) | | | 100,796 | | | | 8,050 | |
| Burlington Northern Santa Fe | | | 191,430 | | | | 14,842 | |
| Danaher (a) | | | 150,374 | | | | 10,792 | |
| Dun & Bradstreet (a) (b) | | | 133,500 | | | | 10,312 | |
| Fastenal (a) | | | 94,287 | | | | 3,794 | |
| General Electric | | | 1,109,201 | | | | 38,944 | |
| Precision Castparts (a) | | | 139,839 | | | | 9,517 | |
| Rockwell Automation | | | 96,079 | | | | 5,957 | |
| Rockwell Collins | | | 108,012 | | | | 6,273 | |
| United Technologies (a) | | | 295,423 | | | | 19,415 | |
| | | | | | | |
| | | | | | | | 127,896 | |
| | | | | | | |
| | | | | | | | | | |
| Large Cap Growth Opportunities Fund (concluded) |
| DESCRIPTION | | SHARES | | | VALUE | |
| |
| Information Technology (c) – 30.9% |
| Amphenol, Class A (a) | | | 288,580 | | | $ | 19,595 | |
| Apple Computer (b) | | | 211,756 | | | | 17,169 | |
| Autodesk (b) | | | 344,974 | | | | 12,678 | |
| Cisco Systems (b) | | | 778,173 | | | | 18,777 | |
| Citrix Systems (a) (b) | | | 156,091 | | | | 4,609 | |
| Corning (b) | | | 475,532 | | | | 9,715 | |
| EMC (b) | | | 656,921 | | | | 8,047 | |
| Google, Class A (a) (b) | | | 58,150 | | | | 27,702 | |
| Hewlett-Packard | | | 647,271 | | | | 25,075 | |
| Microchip Technology | | | 426,809 | | | | 14,055 | |
| Microsoft | | | 994,761 | | | | 28,560 | |
| Molex (a) | | | 155,268 | | | | 5,419 | |
| Motorola | | | 606,658 | | | | 13,989 | |
| NVIDIA (a) (b) | | | 279,090 | | | | 9,732 | |
| Oracle (b) | | | 735,619 | | | | 13,587 | |
| Paychex (a) | | | 337,735 | | | | 13,334 | |
| QUALCOMM (a) | | | 427,087 | | | | 15,542 | |
| Texas Instruments (a) | | | 754,334 | | | | 22,766 | |
| | | | | | | | | |
| | | | | | | | 280,351 | |
| | | | | | | | | |
| Materials – 1.0% |
| Rio Tinto PLC, ADR (a) | | | 41,543 | | | | 9,197 | |
| | | | | | | | | |
| Telecommunication Services – 2.8% |
| America Movil, Series L, ADR (a) | | | 241,071 | | | | 10,335 | |
| American Tower, Class A (a) (b) | | | 422,577 | | | | 15,221 | |
| | | | | | | | | |
| | | | | | | | 25,556 | |
| | | | | | | | | |
Total Common Stocks | | | | | | | | |
| | (Cost $782,934) | | | | | | | 889,647 | |
| | | | | | | | | |
| Investment Companies – 1.8% |
| iShares Nasdaq Biotechnology Index Fund (a) (b) | | | | | | | | |
| | (Cost $14,706) | | | 203,419 | | | | 16,212 | |
| | | | | | | | | |
| Short-Term Investment – 0.2% |
| First American Prime Obligations Fund, Class Z (d) | | | | | | | | |
| | (Cost $2,485) | | | 2,485,338 | | | | 2,485 | |
| | | | | | | | | |
| Investments Purchased with Proceeds from Securities Lending (e) – 20.9% |
| | (Cost $189,453) | | | | | | | 189,453 | |
| | | | | | | | | |
Total Investments – 121.0% | | | | | | | | |
| | (Cost $989,578) | | | | | | | 1,097,797 | |
| | | | | | | | | |
Other Assets and Liabilities, Net – (21.0)% | | | | | | | (190,687 | ) |
| | | | | | | | | |
Total Net Assets – 100.0% | | | | | | $ | 907,110 | |
| | | | | | | | | |
| |
| (a) | This security or a portion of this security is out on loan at October 31, 2006. Total loaned securities had a market value of $184,882 at October 31, 2006. See note 2 in Notes to Financial Statements. |
| |
| (b) | Non-income producing security. |
| |
| (c) | The fund is significantly invested in this sector and therefore is subject to additional risks. See note 6 in Notes to Financial Statements. |
| |
| (d) | Investment in affiliated security. This money market fund is advised by FAF Advisors, Inc., which also serves as advisor to this fund. See note 3 in Notes to Financial Statements. |
| |
| (e) | The fund may loan securities in return for collateral in the form of cash, U.S. Government securities, or other high grade debt obligations. The cash collateral is invested in various money market funds and short-term, high quality debt obligations, such as repurchase agreements, commercial paper, and other corporate obligations. See note 2 in Notes to Financial Statements. |
ADR – American Depository Receipt
The accompanying notes are an integral part of the financial statements.
90 First American Funds Annual Report 2006
Schedule of Investments October 31, 2006, all dollars are rounded to thousands (000)
| | | | | | | | | |
| Large Cap Select Fund | |
| DESCRIPTION | | SHARES | | | VALUE | |
| | |
| Common Stocks – 99.6% |
| Consumer Discretionary – 13.3% |
| Circuit City Stores | | | 210,078 | | | $ | 5,668 | |
| Comcast, Class A (a) (b) | | | 314,606 | | | | 12,795 | |
| Gap | | | 678,111 | | | | 14,254 | |
| J.C. Penney (b) | | | 75,234 | | | | 5,660 | |
| Lowe’s | | | 196,600 | | | | 5,925 | |
| Mattel | | | 237,151 | | | | 5,367 | |
| Newell Rubbermaid (b) | | | 278,932 | | | | 8,028 | |
| Omnicom Group (b) | | | 68,392 | | | | 6,938 | |
| | | | | | | |
| | | | | | | | 64,635 | |
| | | | | | | |
| Consumer Staples – 7.5% |
| Altria Group | | | 111,741 | | | | 9,088 | |
| Avon Products (b) | | | 149,479 | | | | 4,545 | |
| PepsiCo | | | 111,980 | | | | 7,104 | |
| Wal-Mart Stores | | | 314,041 | | | | 15,476 | |
| | | | | | | |
| | | | | | | | 36,213 | |
| | | | | | | |
| Energy – 14.2% |
| Apache | | | 162,084 | | | | 10,587 | |
| Cameron International (a) (b) | | | 55,829 | | | | 2,797 | |
| ConocoPhillips | | | 154,570 | | | | 9,311 | |
| Exxon Mobil (b) | | | 300,401 | | | | 21,455 | |
| Halliburton | | | 186,009 | | | | 6,018 | |
| Hess (b) | | | 119,511 | | | | 5,067 | |
| Williams | | | 328,291 | | | | 8,020 | |
| XTO Energy | | | 114,130 | | | | 5,325 | |
| | | | | | | |
| | | | | | | | 68,580 | |
| | | | | | | |
| Financials – 20.1% |
| ACE | | | 174,331 | | | | 9,981 | |
| AllianceBernstein Holding | | | 63,386 | | | | 4,925 | |
| Ambac Financial Group | | | 68,334 | | | | 5,705 | |
| American International Group | | | 354,496 | | | | 23,812 | |
| Bank of America (b) | | | 412,018 | | | | 22,196 | |
| Goldman Sachs Group (b) | | | 40,093 | | | | 7,609 | |
| ICICI Bank, ADR | | | 121,514 | | | | 4,271 | |
| Morgan Stanley | | | 188,710 | | | | 14,423 | |
| PMI Group (b) | | | 106,175 | | | | 4,528 | |
| | | | | | | |
| | | | | | | | 97,450 | |
| | | | | | | |
| Healthcare – 11.3% |
| Alcon (b) | | | 47,775 | | | | 5,068 | |
| Amgen (a) (b) | | | 111,247 | | | | 8,445 | |
| Celgene (a) (b) | | | 54,347 | | | | 2,904 | |
| Coventry Health Care (a) | | | 104,612 | | | | 4,912 | |
| Genzyme (a) (b) | | | 34,721 | | | | 2,344 | |
| Laboratory Corporation of America (a) | | | 53,167 | | | | 3,641 | |
| Novartis AG, ADR | | | 129,607 | | | | 7,871 | |
| UnitedHealth Group | | | 150,430 | | | | 7,338 | |
| Wyeth Pharmaceuticals | | | 236,594 | | | | 12,073 | |
| | | | | | | |
| | | | | | | | 54,596 | |
| | | | | | | |
| Industrials – 10.4% |
| Boeing | | | 146,841 | | | | 11,727 | |
| Eaton (b) | | | 75,946 | | | | 5,501 | |
| General Electric | | | 521,167 | | | | 18,298 | |
| L-3 Communications Holdings | | | 113,919 | | | | 9,173 | |
| Parker Hannifin | | | 66,953 | | | | 5,599 | |
| | | | | | | |
| | | | | | | | 50,298 | |
| | | | | | | |
| Information Technology – 18.0% |
| Apple Computer (a) | | | 62,649 | | | | 5,080 | |
| Corning (a) | | | 270,114 | | | | 5,518 | |
| EMC (a) | | | 512,940 | | | | 6,284 | |
| Fiserv (a) | | | 166,821 | | | | 8,241 | |
| | | | | | | | | | |
| Large Cap Select Fund (concluded) |
| DESCRIPTION | | SHARES | | | VALUE | |
| |
| Hewlett-Packard | | | 295,583 | | | $ | 11,451 | |
| Intel (b) | | | 248,039 | | | | 5,293 | |
| Motorola | | | 408,271 | | | | 9,415 | |
| NVIDIA (a) | | | 255,242 | | | | 8,900 | |
| Oracle (a) (b) | | | 628,706 | | | | 11,612 | |
| QUALCOMM | | | 186,300 | | | | 6,779 | |
| Texas Instruments (b) | | | 277,850 | | | | 8,386 | |
| | | | | | | | | |
| | | | | | | | 86,959 | |
| | | | | | | | | |
| Materials – 1.1% |
| International Paper (b) | | | 166,317 | | | | 5,547 | |
| | | | | | | | | |
| Telecommunication Services – 3.7% |
| ALLTEL (b) | | | 143,919 | | | | 7,672 | |
| Verizon Communications | | | 200,900 | | | | 7,433 | |
| Windstream (b) | | | 212,723 | | | | 2,919 | |
| | | | | | | | | |
| | | | | | | | 18,024 | |
| | | | | | | | | |
Total Common Stocks | | | | | | | | |
| | (Cost $429,358) | | | | | | | 482,302 | |
| | | | | | | | | |
| Short-Term Investment – 0.3% |
| First American Prime Obligations Fund, Class Z (c) | | | | | | | | |
| | (Cost $1,569) | | | 1,569,449 | | | | 1,569 | |
| | | | | | | | | |
| Investments Purchased with Proceeds from Securities Lending (d) – 21.1% |
| | (Cost $101,948) | | | | | | | 101,948 | |
| | | | | | | | | |
Total Investments – 121.0% | | | | | | | | |
| | (Cost $532,875) | | | | | | | 585,819 | |
| | | | | | | | | |
Other Assets and Liabilities, Net – (21.0)% | | | | | | | (101,504 | ) |
| | | | | | | | | |
Total Net Assets – 100.0% | | | | | | $ | 484,315 | |
| | | | | | | | | |
| |
| (a) | Non-income producing security. |
| |
| (b) | This security or a portion of this security is out on loan at October 31, 2006. Total loaned securities had a market value of $99,134 at October 31, 2006. See note 2 in Notes to Financial Statements. |
| |
| (c) | Investment in affiliated security. This money market fund is advised by FAF Advisors, Inc., which also serves as advisor to this fund. See note 3 in Notes to Financial Statements. |
| |
| (d) | The fund may loan securities in return for collateral in the form of cash, U.S. government securities, or other high grade debt obligations. The cash collateral is invested in various money market funds and short-term, high quality debt obligations, such as repurchase agreements, commercial paper, and other corporate obligations. See note 2 in Notes to Financial Statements. |
ADR – American Depository Receipt
First American Funds Annual Report 2006 91
Schedule of Investments October 31, 2006, all dollars are rounded to thousands (000)
| | | | | | | | | |
| Large Cap Value Fund | |
| DESCRIPTION | | SHARES | | | VALUE | |
| | |
| Common Stocks – 97.4% |
| Consumer Discretionary – 12.5% |
| Comcast, Class A (a) (b) | | | 375,038 | | | $ | 15,253 | |
| Darden Restaurants | | | 220,976 | | | | 9,259 | |
| Ford Motor (b) | | | 1,166,518 | | | | 9,659 | |
| Fortune Brands (b) | | | 185,973 | | | | 14,311 | |
| Gap | | | 617,431 | | | | 12,978 | |
| Harrah’s Entertainment (b) | | | 141,898 | | | | 10,547 | |
| J.C. Penney (b) | | | 99,390 | | | | 7,477 | |
| Nike, Class B | | | 117,965 | | | | 10,839 | |
| Sherwin-Williams (b) | | | 126,632 | | | | 7,500 | |
| Time Warner (b) | | | 1,079,405 | | | | 21,599 | |
| | | | | | | |
| | | | | | | | 119,422 | |
| | | | | | | |
| Consumer Staples – 6.4% |
| Altria Group | | | 231,028 | | | | 18,789 | |
| General Mills (b) | | | 214,392 | | | | 12,182 | |
| Kroger | | | 467,460 | | | | 10,513 | |
| Procter & Gamble | | | 306,926 | | | | 19,456 | |
| | | | | | | |
| | | | | | | | 60,940 | |
| | | | | | | |
| Energy – 13.3% |
| Apache (b) | | | 153,575 | | | | 10,031 | |
| BP, ADR (b) | | | 91,531 | | | | 6,142 | |
| ChevronTexaco | | | 416,615 | | | | 27,997 | |
| Exxon Mobil (b) | | | 676,673 | | | | 48,328 | |
| GlobalSantaFe (b) | | | 154,657 | | | | 8,027 | |
| Halliburton | | | 130,184 | | | | 4,211 | |
| Marathon Oil | | | 144,122 | | | | 12,452 | |
| Occidental Petroleum | | | 212,772 | | | | 9,987 | |
| | | | | | | |
| | | | | | | | 127,175 | |
| | | | | | | |
| Financials (c) – 32.0% |
| ACE | | | 349,231 | | | | 19,993 | |
| Allstate (b) | | | 244,167 | | | | 14,982 | |
| Ambac Financial Group (b) | | | 143,304 | | | | 11,964 | |
| American International Group | | | 329,261 | | | | 22,116 | |
| Bank of America (b) | | | 824,758 | | | | 44,430 | |
| CIT Group | | | 221,087 | | | | 11,508 | |
| Citigroup | | | 370,440 | | | | 18,581 | |
| Genworth Financial, Class A | | | 419,468 | | | | 14,027 | |
| Goldman Sachs Group (b) | | | 66,079 | | | | 12,541 | |
| J.P. Morgan Chase (b) | | | 607,725 | | | | 28,830 | |
| Lehman Brothers Holdings (b) | | | 187,892 | | | | 14,626 | |
| Marshall & Ilsley (b) | | | 274,955 | | | | 13,181 | |
| MGIC Investment (b) | | | 115,819 | | | | 6,806 | |
| Morgan Stanley | | | 376,796 | | | | 28,799 | |
| Northern Trust (b) | | | 247,591 | | | | 14,539 | |
| Wells Fargo | | | 799,906 | | | | 29,029 | |
| | | | | | | |
| | | | | | | | 305,952 | |
| | | | | | | |
| Healthcare – 6.4% |
| CIGNA | | | 80,568 | | | | 9,425 | |
| Merck (b) | | | 298,796 | | | | 13,571 | |
| Pfizer (b) | | | 669,739 | | | | 17,849 | |
| Wyeth Pharmaceuticals (b) | | | 400,370 | | | | 20,431 | |
| | | | | | | |
| | | | | | | | 61,276 | |
| | | | | | | |
| Industrials – 8.3% |
| CSX | | | 372,598 | | | | 13,291 | |
| Eaton (b) | | | 189,166 | | | | 13,701 | |
| Emerson Electric | | | 110,540 | | | | 9,330 | |
| | | | | | | | | | |
| Large Cap Value Fund (concluded) |
| DESCRIPTION | | SHARES | | | VALUE | |
| |
| General Electric | | | 957,006 | | | $ | 33,600 | |
| Illinois Tool Works | | | 203,004 | | | | 9,730 | |
| | | | | | | | | |
| | | | | | | | 79,652 | |
| | | | | | | | | |
| Information Technology – 6.7% |
| Electronic Data Systems | | | 596,488 | | | | 15,109 | |
| Hewlett-Packard | | | 479,735 | | | | 18,585 | |
| Intel (b) | | | 474,183 | | | | 10,119 | |
| Motorola (b) | | | 491,373 | | | | 11,331 | |
| Texas Instruments (b) | | | 300,118 | | | | 9,058 | |
| | | | | | | | | |
| | | | | | | | 64,202 | |
| | | | | | | | | |
| Materials – 3.0% |
| International Paper (b) | | | 228,945 | | | | 7,635 | |
| PPG Industries (b) | | | 124,988 | | | | 8,549 | |
| Rohm & Haas (b) | | | 246,363 | | | | 12,767 | |
| | | | | | | | | |
| | | | | | | | 28,951 | |
| | | | | | | | | |
| Telecommunication Services – 5.2% |
| AT&T (b) | | | 313,250 | | | | 10,729 | |
| BellSouth | | | 438,221 | | | | 19,764 | |
| Verizon Communications (b) | | | 510,507 | | | | 18,888 | |
| | | | | | | | | |
| | | | | | | | 49,381 | |
| | | | | | | | | |
| Utilities – 3.6% |
| Edison International | | | 334,142 | | | | 14,849 | |
| Exelon (b) | | | 322,170 | | | | 19,968 | |
| | | | | | | | | |
| | | | | | | | 34,817 | |
| | | | | | | | | |
Total Common Stocks | | | | | | | | |
| | (Cost $756,013) | | | | | | | 931,768 | |
| | | | | | | | | |
| Short-Term Investment – 2.5% |
| First American Prime Obligations Fund, Class Z (d) | | | | | | | | |
| | (Cost $23,672) | | | 23,671,953 | | | | 23,672 | |
| | | | | | | | | |
| Investments Purchased with Proceeds from Securities Lending (e) – 23.5% |
| | (Cost $224,921) | | | | | | | 224,921 | |
| | | | | | | | | |
Total Investments – 123.4% | | | | | | | | |
| | (Cost $1,004,606) | | | | | | | 1,180,361 | |
| | | | | | | | | |
Other Assets and Liabilities, Net – (23.4)% | | | | | | | (224,137 | ) |
| | | | | | | | | |
Total Net Assets – 100.0% | | | | | | $ | 956,224 | |
| | | | | | | | | |
| |
| (a) | Non-income producing security. |
| |
| (b) | This security or a portion of this security is out on loan at October 31, 2006. Total loaned securities had a market value of $218,077 at October 31, 2006. See note 2 in Notes to Financial Statements. |
| |
| (c) | The fund is significantly invested in this sector and therefore is subject to additional risks. See note 6 in Notes to Financial Statements. |
| |
| (d) | Investment in affiliated security. This money market fund is advised by FAF Advisors, Inc., which also serves as advisor to this fund. See note 3 in Notes to Financial Statements. |
| |
| (e) | The fund may loan securities in return for collateral in the form of cash, U.S. Government securities, or other high grade debt obligations. The cash collateral is invested in various money market funds and short-term, high quality debt obligations, such as repurchase agreements, commercial paper, and other corporate obligations. See note 2 in Notes to Financial Statements. |
ADR – American Depository Receipt
The accompanying notes are an integral part of the financial statements.
92 First American Funds Annual Report 2006
Statements of Assets and Liabilities October 31, 2006, all dollars and shares are rounded to thousands (000), except for per share data
| | | | | | | | | | | | | | | | |
| | | Large Cap Growth | | | | Large Cap | | | Large Cap | | | |
| | | Opportunities Fund | | | | Select Fund | | | Value Fund | | | |
| | | | | | | |
| Investments in unaffiliated securities, at cost | | $ | 797,640 | | | | $ | 429,358 | | | $ | 756,013 | | | |
| Investments in affiliated money market fund, at cost | | | 2,485 | | | | | 1,569 | | | | 23,672 | | | |
| Investments purchased with proceeds from securities lending, at cost (note 2) | | | 189,453 | | | | | 101,948 | | | | 224,921 | | | |
| | | | | | | | |
ASSETS: | | | | | | | | | | | | | | | |
| Investments in unaffiliated securities, at value* (note 2) | | $ | 905,859 | | | | $ | 482,302 | | | $ | 931,768 | | | |
| Investments in affiliated money market fund, at value (note 2) | | | 2,485 | | | | | 1,569 | | | | 23,672 | | | |
| Investments purchased with proceeds from securities lending, at value (note 2) | | | 189,453 | | | | | 101,948 | | | | 224,921 | | | |
| Receivable for dividends | | | 500 | | | | | 231 | | | | 781 | | | |
| Receivable for investment securities sold | | | 6,205 | | | | | 330 | | | | 6,844 | | | |
| Receivable for capital shares sold | | | 413 | | | | | 411 | | | | 287 | | | |
| Prepaid expenses and other assets | | | 33 | | | | | 31 | | | | 42 | | | |
| | | | | | | | |
Total assets | | | 1,104,948 | | | | | 586,822 | | | | 1,188,315 | | | |
| | | | | | | | |
LIABILITIES: | | | | | | | | | | | | | | | |
| Payable for investment securities purchased | | | 2,245 | | | | | — | | | | 5,400 | | | |
| Payable upon return of securities loaned (note 2) | | | 189,453 | | | | | 101,948 | | | | 224,921 | | | |
| Payable for capital shares redeemed | | | 5,336 | | | | | 148 | | | | 954 | | | |
| Payable to affiliates (note 3) | | | 726 | | | | | 383 | | | | 741 | | | |
| Payable for distribution and shareholder servicing fees | | | 39 | | | | | 2 | | | | 37 | | | |
| Accrued expenses and other liabilities | | | 39 | | | | | 26 | | | | 38 | | | |
| | | | | | | | |
Total liabilities | | | 197,838 | | | | | 102,507 | | | | 232,091 | | | |
| | | | | | | | |
Net assets | | $ | 907,110 | | | | $ | 484,315 | | | $ | 956,224 | | | |
| | | | | | | | |
COMPOSITION OF NET ASSETS: | | | | | | | | | | | | | | | |
| Portfolio capital | | $ | 860,758 | | | | $ | 424,282 | | | $ | 708,841 | | | |
| Undistributed net investment income | | | 1,285 | | | | | 78 | | | | — | | | |
| Accumulated net realized gain (loss) on investments | | | (63,152 | ) | | | | 7,011 | | | | 71,628 | | | |
| Net unrealized appreciation of investments | | | 108,219 | | | | | 52,944 | | | | 175,755 | | | |
| | | | | | | | |
Net assets | | $ | 907,110 | | | | $ | 484,315 | | | $ | 956,224 | | | |
| | | | | | | | |
| *Including securities loaned, at value | | $ | 184,882 | | | | $ | 99,134 | | | $ | 218,077 | | | |
| | | | | | | | |
Class A: | | | | | | | | | | | | | | | |
| Net assets | | $ | 90,285 | | | | $ | 7,152 | | | $ | 115,438 | | | |
| Shares issued and outstanding ($0.0001 par value – 2 billion authorized) | | | 3,052 | | | | | 471 | | | | 5,218 | | | |
| Net asset value and redemption price per share | | $ | 29.58 | | | | $ | 15.18 | | | $ | 22.12 | | | |
Maximum offering price per share (1) | | $ | 31.30 | | | | $ | 16.06 | | | $ | 23.41 | | | |
Class B: | | | | | | | | | | | | | | | |
| Net assets | | $ | 13,990 | | | | $ | 643 | | | $ | 9,815 | | | |
| Shares issued and outstanding ($0.0001 par value – 2 billion authorized) | | | 499 | | | | | 43 | | | | 456 | | | |
Net asset value, offering price and redemption price per share (2) | | $ | 28.01 | | | | $ | 14.94 | | | $ | 21.54 | | | |
Class C: | | | | | | | | | | | | | | | |
| Net assets | | $ | 8,424 | | | | $ | 248 | | | $ | 5,174 | | | |
| Shares issued and outstanding ($0.0001 par value – 2 billion authorized) | | | 295 | | | | | 17 | | | | 237 | | | |
Net asset value, offering price and redemption price per share (2) | | $ | 28.58 | | | | $ | 14.95 | | | $ | 21.81 | | | |
Class R: | | | | | | | | | | | | | | | |
| Net assets | | $ | 558 | | | | $ | 118 | | | $ | 164 | | | |
| Shares issued and outstanding ($0.0001 par value – 2 billion authorized) | | | 19 | | | | | 8 | | | | 7 | | | |
| Net asset value, offering price, and redemption price per share | | $ | 29.41 | | | | $ | 15.12 | | | $ | 22.10 | | | |
Class Y: | | | | | | | | | | | | | | | |
| Net assets | | $ | 793,853 | | | | $ | 476,154 | | | $ | 825,633 | | | |
| Shares issued and outstanding ($0.0001 par value – 2 billion authorized) | | | 26,044 | | | | | 31,280 | | | | 37,207 | | | |
| Net asset value, offering price, and redemption price per share | | $ | 30.48 | | | | $ | 15.22 | | | $ | 22.19 | | | |
| | | | | | | | |
| | |
| | (1) | The offering price is calculated by dividing the net asset value by 1 minus the maximum sales charge of 5.50% |
| |
| | (2) | Class B and C have a contingent deferred sales charge. For a description of this sales charge, see notes 1 and 3 in Notes to Financial Statements. |
First American Funds Annual Report 2006 93
Statements of Operations For the year ended October 31, 2006, all dollars are rounded to thousands (000)
| | | | | | | | | | | | | | | | |
| | | Large Cap Growth | | | | Large Cap | | | Large Cap | | | |
| | | Opportunities Fund | | | | Select Fund | | | Value Fund | | | |
| | | | | | | |
INVESTMENT INCOME: | | | | | | | | | | | | | | | |
| Dividends from affiliated money market fund | | $ | 781 | | | | $ | 371 | | | $ | 557 | | | |
| Dividends from unaffiliated securities | | | 10,011 | | | | | 6,517 | | | | 19,372 | | | |
| Less: Foreign taxes withheld | | | (36 | ) | | | | (19 | ) | | | — | | | |
| Securities lending income | | | 251 | | | | | 84 | | | | 199 | | | |
| | | | | | | | |
Total investment income | | | 11,007 | | | | | 6,953 | | | | 20,128 | | | |
| | | | | | | | |
EXPENSES (note 3): | | | | | | | | | | | | | | | |
| Investment advisory fees | | | 6,377 | | | | | 2,801 | | | | 5,886 | | | |
| Administration fees | | | 1,553 | | | | | 713 | | | | 1,460 | | | |
| Transfer agent fees | | | 1,027 | | | | | 417 | | | | 895 | | | |
| Custodian fees | | | 52 | | | | | 22 | | | | 45 | | | |
| Professional fees | | | 30 | | | | | 37 | | | | 31 | | | |
| Registration fees | | | 60 | | | | | 57 | | | | 51 | | | |
| Postage and printing fees | | | 65 | | | | | 21 | | | | 59 | | | |
| Directors’ fees | | | 23 | | | | | 19 | | | | 22 | | | |
| Other expenses | | | 24 | | | | | 22 | | | | 24 | | | |
| Distribution and shareholder servicing fees – Class A | | | 246 | | | | | 16 | | | | 291 | | | |
| Distribution and shareholder servicing fees – Class B | | | 166 | | | | | 6 | | | | 113 | | | |
| Distribution and shareholder servicing fees – Class C | | | 98 | | | | | 2 | | | | 52 | | | |
| Distribution and shareholder servicing fees – Class R | | | 3 | | | | | — | (1) | | | — | (1) | | |
| | | | | | | | |
Total expenses | | | 9,724 | | | | | 4,133 | | | | 8,929 | | | |
| | | | | | | | |
| Less: Fee waivers | | | (1 | ) | | | | — | (1) | | | — | (1) | | |
| Less: Indirect payments from custodian (note 3) | | | (2 | ) | | | | (3 | ) | | | (1 | ) | | |
| | | | | | | | |
Total net expenses | | | 9,721 | | | | | 4,130 | | | | 8,928 | | | |
| | | | | | | | |
Investment income – net | | | 1,286 | | | | | 2,823 | | | | 11,200 | | | |
| | | | | | | | |
REALIZED AND UNREALIZED GAINS ON INVESTMENTS – NET (note 5): | | | | | | | | | | | | | | | |
| Net realized gain on investments | | | 49,878 | | | | | 8,397 | | | | 79,006 | | | |
| Net change in unrealized appreciation or depreciation of investments | | | 5,492 | | | | | 34,939 | | | | 61,680 | | | |
| | | | | | | | |
Net gain on investments | | | 55,370 | | | | | 43,336 | | | | 140,686 | | | |
| | | | | | | | |
Net increase in net assets resulting from operations | | $ | 56,656 | | | | $ | 46,159 | | | $ | 151,886 | | | |
| | | | | | | | |
| | |
| | (1) | Due to the presentation of the financial statements in thousands, the numbers round to zero. |
The accompanying notes are an integral part of the financial statements.
94 First American Funds Annual Report 2006
(This page intentionally left blank.)
Statements of Changes in Net Assets all dollars are rounded to thousands (000)
| | | | | | | | | | | | | | | | |
| | | Large Cap Growth | | | |
| | | Opportunities Fund | | | |
| |
| | | One-Month | | | |
| | | Year | | | Fiscal Period | | | Year | | | |
| | | Ended | | | Ended | | | Ended | | | |
| | | 10/31/06 | | | 10/31/05 | | | 9/30/05 | | | |
| |
OPERATIONS: | | | | | | | | | | | | | | |
| Investment income (loss) – net | | $ | 1,286 | | | $ | (226 | ) | | $ | 2,288 | | | |
| Net realized gain (loss) on investments | | | 49,878 | | | | (3,309 | ) | | | 54,623 | | | |
| Net realized gain on in-kind distributions | | | — | | | | — | | | | 76,740 | | | |
| Net realized loss on futures | | | — | | | | — | | | | — | | | |
| Net change in unrealized appreciation or depreciation of investments | | | 5,492 | | | | (1,715 | ) | | | 8,655 | | | |
| Net change in unrealized appreciation or depreciation of futures contracts | | | — | | | | — | | | | — | | | |
| |
| Net increase (decrease) in net assets resulting from operations | | | 56,656 | | | | (5,250 | ) | | | 142,306 | | | |
| |
| |
DISTRIBUTIONS TO SHAREHOLDERS FROM: | | | | | | | | | | | | | | |
| Investment income – net: | | | | | | | | | | | | | | |
| | Class A | | | — | | | | — | | | | (169 | ) | | |
| | Class B | | | — | | | | — | | | | (19 | ) | | |
| | Class C | | | — | | | | — | | | | (9 | ) | | |
| | Class R | | | — | | | | — | | | | — | | | |
| | Class Y | | | — | | | | — | | | | (2,091 | ) | | |
| Net realized gain on investments: | | | | | | | | | | | | | | |
| | Class A | | | — | | | | — | | | | — | | | |
| | Class B | | | — | | | | — | | | | — | | | |
| | Class C | | | — | | | | — | | | | — | | | |
| | Class R | | | — | | | | — | | | | — | | | |
| | Class Y | | | — | | | | — | | | | — | | | |
| Return of capital: | | | | | | | | | | | | | | |
| | Class A | | | — | | | | — | | | | (56 | ) | | |
| | Class B | | | — | | | | — | | | | (6 | ) | | |
| | Class C | | | — | | | | — | | | | (3 | ) | | |
| | Class R | | | — | | | | — | | | | — | (1) | | |
| | Class Y | | | — | | | | — | | | | (692 | ) | | |
| |
| Total distributions | | | — | | | | — | | | | (3,045 | ) | | |
| |
| |
CAPITAL SHARE TRANSACTIONS (note 4): | | | | | | | | | | | | | | |
| Class A: | | | | | | | | | | | | | | |
| | Proceeds from sales | | | 13,213 | | | | 945 | | | | 15,121 | | | |
| | Reinvestment of distributions | | | — | | | | — | | | | 217 | | | |
| | Payments for redemptions | | | (33,886 | ) | | | (2,433 | ) | | | (33,271 | ) | | |
| |
| Increase (decrease) in net assets from Class A transactions | | | (20,673 | ) | | | (1,488 | ) | | | (17,933 | ) | | |
| |
| Class B: | | | | | | | | | | | | | | |
| | Proceeds from sales | | | 736 | | | | 48 | | | | 1,151 | | | |
| | Reinvestment of distributions | | | — | | | | — | | | | 25 | | | |
| | Payments for redemptions (note 3) | | | (7,250 | ) | | | (557 | ) | | | (9,138 | ) | | |
| |
| Increase (decrease) in net assets from Class B transactions | | | (6,514 | ) | | | (509 | ) | | | (7,962 | ) | | |
| |
| Class C: | | | | | | | | | | | | | | |
| | Proceeds from sales | | | 538 | | | | 57 | | | | 1,190 | | | |
| | Reinvestment of distributions | | | — | | | | — | | | | 12 | | | |
| | Payments for redemptions (note 3) | | | (3,347 | ) | | | (392 | ) | | | (4,197 | ) | | |
| |
| Increase (decrease) in net assets from Class C transactions | | | (2,809 | ) | | | (335 | ) | | | (2,995 | ) | | |
| |
| Class R: | | | | | | | | | | | | | | |
| | Proceeds from sales | | | 261 | | | | 2 | | | | 286 | | | |
| | Reinvestment of distributions | | | — | | | | — | | | | — | | | |
| | Payments for redemptions | | | (14 | ) | | | — | | | | — | | | |
| |
| Increase in net assets from Class R transactions | | | 247 | | | | 2 | | | | 286 | | | |
| |
| Class Y: | | | | | | | | | | | | | | |
| | Proceeds from sales | | | 132,441 | | | | 14,066 | | | | 165,303 | | | |
| | Reinvestment of distributions | | | — | | | | — | | | | 1,595 | | | |
| | Payments for redemptions | | | (237,022 | ) | | | (9,839 | ) | | | (628,503 | ) | | |
| |
| Increase (decrease) in net assets from Class Y transactions | | | (104,581 | ) | | | 4,227 | | | | (461,605 | ) | | |
| |
| Increase (decrease) in net assets from capital share transactions | | | (134,330 | ) | | | 1,897 | | | | (490,209 | ) | | |
| |
| Total increase (decrease) in net assets | | | (77,674 | ) | | | (3,353 | ) | | | (350,948 | ) | | |
Net assets at beginning of period | | | 984,784 | | | | 988,137 | | | | 1,339,085 | | | |
| |
Net assets at end of period | | $ | 907,110 | | | $ | 984,784 | | | $ | 988,137 | | | |
| |
Undistributed (distributions in excess of) net investment income at end of period | | $ | 1,285 | | | $ | (1 | ) | | $ | (1 | ) | | |
| |
| | |
| | (1) | Due to the presentation of the financial statements in thousands, the numbers round to zero. |
The accompanying notes are an integral part of the financial statements.
96 First American Funds Annual Report 2006
| | | | | | | | | | | | | | | | | | | | | | | | | | | | |
| | | Large Cap | | | | Large Cap | | | |
| | | Select Fund | | | | Value Fund | | | |
| | | | | | | | |
| | | One-Month | | | | | | | | One-Month | | | | | |
| | | Year | | | Fiscal Period | | | Year | | | | Year | | | Fiscal Period | | | Year | | | |
| | | Ended | | | Ended | | | Ended | | | | Ended | | | Ended | | | Ended | | | |
| | | 10/31/06 | | | 10/31/05 | | | 9/30/05 | | | | 10/31/06 | | | 10/31/05 | | | 9/30/05 | | | |
| | | | | | | |
| | | |
| | | $ | 2,823 | | | $ | 14 | | | $ | 1,942 | | | | $ | 11,200 | | | $ | 20 | | | $ | 11,497 | | | |
| | | | 8,397 | | | | (731 | ) | | | 16,321 | | | | | 79,006 | | | | 4,760 | | | | 84,365 | | | |
| | | | — | | | | — | | | | 24,162 | | | | | — | | | | — | | | | 70,893 | | | |
| | | | — | | | | — | | | | (201 | ) | | | | — | | | | — | | | | — | | | |
| | | | 34,939 | | | | (2,844 | ) | | | 8,570 | | | | | 61,680 | | | | (27,139 | ) | | | 17,537 | | | |
| | | | — | | | | — | | | | 165 | | | | | — | | | | — | | | | — | | | |
| | | | | | |
| | | | 46,159 | | | | (3,561 | ) | | | 50,959 | | | | | 151,886 | | | | (22,359 | ) | | | 184,292 | | | |
| | | | | | |
| | | |
| | | | (29 | ) | | | — | | | | (10 | ) | | | | (1,231 | ) | | | (13 | ) | | | (1,072 | ) | | |
| | | | — | (1) | | | — | | | | — | | | | | (77 | ) | | | — | | | | (62 | ) | | |
| | | | — | (1) | | | — | | | | — | | | | | (32 | ) | | | — | | | | (21 | ) | | |
| | | | — | (1) | | | — | | | | — | | | | | — | (1) | | | — | | | | — | | | |
| | | | (2,872 | ) | | | — | | | | (1,808 | ) | | | | (9,972 | ) | | | (148 | ) | | | (10,036 | ) | | |
| | | | (250 | ) | | | — | | | | (17 | ) | | | | (3,787 | ) | | | — | | | | — | | | |
| | | | (26 | ) | | | — | | | | (4 | ) | | | | (419 | ) | | | — | | | | — | | | |
| | | | (8 | ) | | | — | | | | (1 | ) | | | | (170 | ) | | | — | | | | — | | | |
| | | | (1 | ) | | | — | | | | — | | | | | — | (1) | | | — | | | | — | | | |
| | | | (14,936 | ) | | | — | | | | (4,604 | ) | | | | (23,452 | ) | | | — | | | | — | | | |
| | | | — | | | | — | | | | — | | | | | — | | | | — | | | | — | | | |
| | | | — | | | | — | | | | — | | | | | — | | | | — | | | | — | | | |
| | | | — | | | | — | | | | — | | | | | — | | | | — | | | | — | | | |
| | | | — | | | | — | | | | — | | | | | — | | | | — | | | | — | | | |
| | | | — | | | | — | | | | — | | | | | — | | | | — | | | | — | | | |
| | | | | | |
| | | | (18,122 | ) | | | — | | | | (6,444 | ) | | | | (39,140 | ) | | | (161 | ) | | | (11,191 | ) | | |
| | | | | | |
| | | |
| | | | 4,957 | | | | 488 | | | | 4,711 | | | | | 10,688 | | | | 1,048 | | | | 17,717 | | | |
| | | | 143 | | | | — | | | | 18 | | | | | 4,696 | | | | 12 | | | | 1,012 | | | |
| | | | (4,049 | ) | | | (49 | ) | | | (362 | ) | | | | (32,648 | ) | | | (1,369 | ) | | | (28,635 | ) | | |
| | | | | | |
| | | | 1,051 | | | | 439 | | | | 4,367 | | | | | (17,264 | ) | | | (309 | ) | | | (9,906 | ) | | |
| | | | | | |
| | | | 193 | | | | 16 | | | | 341 | | | | | 627 | | | | 20 | | | | 698 | | | |
| | | | 23 | | | | — | | | | 5 | | | | | 486 | | | | — | | | | 61 | | | |
| | | | (180 | ) | | | (3 | ) | | | (98 | ) | | | | (6,446 | ) | | | (705 | ) | | | (10,604 | ) | | |
| | | | | | |
| | | | 36 | | | | 13 | | | | 248 | | | | | (5,333 | ) | | | (685 | ) | | | (9,845 | ) | | |
| | | | | | |
| | | | 73 | | | | — | | | | 144 | | | | | 540 | | | | 60 | | | | 666 | | | |
| | | | 8 | | | | — | | | | 1 | | | | | 198 | | | | — | | | | 20 | | | |
| | | | (28 | ) | | | — | | | | (31 | ) | | | | (1,582 | ) | | | (226 | ) | | | (2,263 | ) | | |
| | | | | | |
| | | | 53 | | | | — | | | | 114 | | | | | (844 | ) | | | (166 | ) | | | (1,577 | ) | | |
| | | | | | |
| | | | 133 | | | | — | | | | — | | | | | 146 | | | | — | | | | 5 | | | |
| | | | 1 | | | | — | | | | — | | | | | 1 | | | | — | | | | — | | | |
| | | | (30 | ) | | | — | | | | — | | | | | (2 | ) | | | — | | | | — | | | |
| | | | | | |
| | | | 104 | | | | — | | | | — | | | | | 145 | | | | — | | | | 5 | | | |
| | | | | | |
| | | | 173,185 | | | | 17,143 | | | | 229,583 | | | | | 95,353 | | | | 4,449 | | | | 88,145 | | | |
| | | | 7,404 | | | | — | | | | 4,810 | | | | | 21,057 | | | | 85 | | | | 6,324 | | | |
| | | | (73,053 | ) | | | (2,242 | ) | | | (240,782 | ) | | | | (127,822 | ) | | | (9,749 | ) | | | (502,220 | ) | | |
| | | | | | |
| | | | 107,536 | | | | 14,901 | | | | (6,389 | ) | | | | (11,412 | ) | | | (5,215 | ) | | | (407,751 | ) | | |
| | | | | | |
| | | | 108,780 | | | | 15,353 | | | | (1,660 | ) | | | | (34,708 | ) | | | (6,375 | ) | | | (429,074 | ) | | |
| | | | | | |
| | | | 136,817 | | | | 11,792 | | | | 42,855 | | | | | 78,038 | | | | (28,895 | ) | | | (255,973 | ) | | |
| | | | 347,498 | | | | 335,706 | | | | 292,851 | | | | | 878,186 | | | | 907,081 | | | | 1,163,054 | | | |
| | | | | | |
| | | $ | 484,315 | | | $ | 347,498 | | | $ | 335,706 | | | | $ | 956,224 | | | $ | 878,186 | | | $ | 907,081 | | | |
| | | | | | |
| | | $ | 78 | | | $ | 156 | | | $ | 142 | | | | $ | — | | | $ | — | | | $ | 137 | | | |
| | | | | | |
First American Funds Annual Report 2006 97
Financial Highlights For a share outstanding throughout the indicated periods.
| | | | | | | | | | | | | | | | | | | | | | | | | | | | | | | | | | |
| | | | | | | | | Realized and | | | | | | | | | | | | | |
| | | Net Asset | | | | | | | Unrealized | | | | Distributions | | | | | | | Net Asset | | | | |
| | | Value | | | | Net | | | | Gains | | | | from Net | | | | Distributions | | | | Value | | | | |
| | | Beginning | | | | Investment | | | | (Losses) on | | | | Investment | | | | from Return | | | | End of | | | | |
| | | of Period | | | | Income (Loss) | | | | Investments | | | | Income | | | | of Capital | | | | Period | | | | |
| | | | | | | | | | | | | | | | | | | | | |
Large Cap Growth Opportunities (1) | | | | | | | | | | | | | | | | | | | | | | | | | | | | | | | | |
| Class A | | | | | | | | | | | | | | | | | | | | | | | | | | | | | | | | |
| | 2006 (2) | | $ | 27.86 | | | | $ | (0.02 | ) | | | $ | 1.74 | | | | $ | — | | | | $ | — | | | | $ | 29.58 | | | | |
| | 2005 (3) | | | 28.02 | | | | | (0.01 | ) | | | | (0.15 | ) | | | | — | | | | | — | | | | | 27.86 | | | | |
| | 2005 (4) | | | 25.00 | | | | | (0.01 | ) | | | | 3.08 | | | | | (0.04 | ) | | | | (0.01 | ) | | | | 28.02 | | | | |
| | 2004 (4) | | | 22.84 | | | | | (0.03 | ) | | | | 2.20 | | | | | (0.01 | ) | | | | — | (6) | | | | 25.00 | | | | |
| | 2003 (4) | | | 19.16 | | | | | — | | | | | 3.73 | | | | | (0.05 | ) | | | | — | | | | | 22.84 | | | | |
| | 2002 (4) | | | 24.44 | | | | | — | | | | | (5.23 | ) | | | | (0.05 | ) | | | | — | | | | | 19.16 | | | | |
| Class B | | | | | | | | | | | | | | | | | | | | | | | | | | | | | | | | |
| | 2006 (2) | | $ | 26.58 | | | | $ | (0.22 | ) | | | $ | 1.65 | | | | $ | — | | | | $ | — | | | | $ | 28.01 | | | | |
| | 2005 (3) | | | 26.75 | | | | | (0.03 | ) | | | | (0.14 | ) | | | | — | | | | | — | | | | | 26.58 | | | | |
| | 2005 (4) | | | 24.02 | | | | | (0.20 | ) | | | | 2.96 | | | | | (0.02 | ) | | | | (0.01 | ) | | | | 26.75 | | | | |
| | 2004 (4) | | | 22.10 | | | | | (0.21 | ) | | | | 2.13 | | | | | — | | | | | — | (6) | | | | 24.02 | | | | |
| | 2003 (4) | | | 18.64 | | | | | (0.18 | ) | | | | 3.64 | | | | | — | | | | | — | | | | | 22.10 | | | | |
| | 2002 (4) | | | 23.94 | | | | | (0.18 | ) | | | | (5.09 | ) | | | | (0.03 | ) | | | | — | | | | | 18.64 | | | | |
| Class C | | | | | | | | | | | | | | | | | | | | | | | | | | | | | | | | |
| | 2006 (2) | | $ | 27.12 | | | | $ | (0.23 | ) | | | $ | 1.69 | | | | $ | — | | | | $ | — | | | | $ | 28.58 | | | | |
| | 2005 (3) | | | 27.29 | | | | | (0.03 | ) | | | $ | (0.14 | ) | | | | — | | | | | — | | | | | 27.12 | | | | |
| | 2005 (4) | | | 24.51 | | | | | (0.20 | ) | | | | 3.00 | | | | | (0.01 | ) | | | | (0.01 | ) | | | | 27.29 | | | | |
| | 2004 (4) | | | 22.55 | | | | | (0.21 | ) | | | | 2.17 | | | | | — | | | | | — | (6) | | | | 24.51 | | | | |
| | 2003 (4) | | | 19.03 | | | | | (0.18 | ) | | | | 3.72 | | | | | (0.02 | ) | | | | — | | | | | 22.55 | | | | |
| | 2002 (4) | | | 24.44 | | | | | (0.18 | ) | | | | (5.19 | ) | | | | (0.04 | ) | | | | — | | | | | 19.03 | | | | |
| Class R (5) | | | | | | | | | | | | | | | | | | | | | | | | | | | | | | | | |
| | 2006 (2) | | $ | 27.78 | | | | $ | (0.09 | ) | | | $ | 1.72 | | | | $ | — | | | | $ | — | | | | $ | 29.41 | | | | |
| | 2005 (3) | | | 27.94 | | | | | (0.02 | ) | | | | (0.14 | ) | | | | — | | | | | — | | | | | 27.78 | | | | |
| | 2005 (4) | | | 24.98 | | | | | (0.16 | ) | | | | 3.17 | | | | | (0.05 | ) | | | | — | (6) | | | | 27.94 | | | | |
| | 2004 (4) | | | 22.85 | | | | | (0.02 | ) | | | | 2.16 | | | | | (0.01 | ) | | | | — | (6) | | | | 24.98 | | | | |
| | 2003 (4) | | | 19.17 | | | | | — | | | | | 3.73 | | | | | (0.05 | ) | | | | — | | | | | 22.85 | | | | |
| | 2002 (4) | | | 24.45 | | | | | — | | | | | (5.23 | ) | | | | (0.05 | ) | | | | — | | | | | 19.17 | | | | |
| Class Y | | | | | | | | | | | | | | | | | | | | | | | | | | | | | | | | |
| | 2006 (2) | | $ | 28.64 | | | | $ | 0.05 | | | | $ | 1.79 | | | | $ | — | | | | $ | — | | | | $ | 30.48 | | | | |
| | 2005 (3) | | | 28.79 | | | | | (0.01 | ) | | | | (0.14 | ) | | | | — | | | | | — | | | | | 28.64 | | | | |
| | 2005 (4) | | | 25.63 | | | | | 0.07 | | | | | 3.15 | | | | | (0.04 | ) | | | | (0.02 | ) | | | | 28.79 | | | | |
| | 2004 (4) | | | 23.38 | | | | | 0.03 | | | | | 2.25 | | | | | (0.02 | ) | | | | (0.01 | ) | | | | 25.63 | | | | |
| | 2003 (4) | | | 19.59 | | | | | 0.07 | | | | | 3.80 | | | | | (0.08 | ) | | | | — | | | | | 23.38 | | | | |
| | 2002 (4) | | | 24.93 | | | | | 0.06 | | | | | (5.33 | ) | | | | (0.07 | ) | | | | — | | | | | 19.59 | | | | |
| | | | | | | | | | | | | | | | | | | | | | | | | |
| | |
| | (1) | Per share data calculated using average shares outstanding method. |
| |
| | (2) | For the period November 1 to October 31 in the year indicated. |
| |
| | (3) | For the period October 1, 2005 to October 31, 2005. Effective in 2005, the fund’s fiscal year-end was changed from September 30 to October 31. All ratios for the period have been annualized, except total return and portfolio turnover. |
| |
| | (4) | For the period October 1 to September 30 in the year indicated. |
| |
| | (5) | Prior to July 1, 2004, Class R shares were named Class S shares, which had lower fees and expenses. |
| |
| | (6) | Includes a tax return of capital of less than $0.01. |
| |
| | (7) | Total return does not reflect sales charges. Total return would have been lower had certain expenses not been waived. |
The accompanying notes are an integral part of the financial statements.
98 First American Funds Annual Report 2006
| | | | | | | | | | | | | | | | | | | | | | | | | | | | | | | | | | | | | |
| | | | | | | | | | | | | | | | | | Ratio of Net | | | | | | |
| | | | | | | | | | | | | | | Ratio of | | | | Investment | | | | | | |
| | | | | | | | | | | | Ratio of Net | | | | Expenses to | | | | Income (Loss) | | | | | | |
| | | | | | | | | Ratio of | | | | Investment | | | | Average | | | | to Average | | | | | | |
| | | | | | Net Assets | | | | Expenses to | | | | Income (Loss) | | | | Net Assets | | | | Net Assets | | | | Portfolio | | | |
| | | Total | | | | End of | | | | Average | | | | to Average | | | | (Excluding | | | | (Excluding | | | | Turnover | | | |
| | | Return (7) | | | | Period (000) | | | | Net Assets | | | | Net Assets | | | | Waivers) | | | | Waivers) | | | | Rate | | | |
| | | | | | | | | | | | | | | | | | | | | | | | | | | |
| | | | | | | | | | | | | | | | | | | | | | | | | | | | | | | | | | | | | |
| | | | | | | | |
| | | | 6.17 | % | | | $ | 90,285 | | | | | 1.19 | % | | | | (0.07 | )% | | | | 1.19 | % | | | | (0.07 | )% | | | | 94 | % | | |
| | | | (0.57 | ) | | | | 104,960 | | | | | 1.21 | | | | | (0.47 | ) | | | | 1.21 | | | | | (0.47 | ) | | | | 6 | | | |
| | | | 12.30 | | | | | 107,079 | | | | | 1.17 | | | | | (0.03 | ) | | | | 1.20 | | | | | (0.06 | ) | | | | 103 | | | |
| | | | 9.52 | | | | | 112,379 | | | | | 1.15 | | | | | (0.13 | ) | | | | 1.19 | | | | | (0.17 | ) | | | | 113 | | | |
| | | | 19.50 | | | | | 93,331 | | | | | 1.15 | | | | | (0.02 | ) | | | | 1.19 | | | | | (0.06 | ) | | | | 83 | | | |
| | | | (21.46 | ) | | | | 24,647 | | | | | 1.15 | | | | | (0.02 | ) | | | | 1.22 | | | | | (0.09 | ) | | | | 43 | | | |
| | | | | | | | | | | | | | | | | | | | | | | | | | | | | | | | | | | | | |
| | | | 5.38 | % | | | $ | 13,990 | | | | | 1.94 | % | | | | (0.82 | )% | | | | 1.94 | % | | | | (0.82 | )% | | | | 94 | % | | |
| | | | (0.64 | ) | | | | 19,601 | | | | | 1.96 | | | | | (1.22 | ) | | | | 1.96 | | | | | (1.22 | ) | | | | 6 | | | |
| | | | 11.47 | | | | | 20,239 | | | | | 1.92 | | | | | (0.77 | ) | | | | 1.95 | | | | | (0.80 | ) | | | | 103 | | | |
| | | | 8.69 | | | | | 25,633 | | | | | 1.90 | | | | | (0.87 | ) | | | | 1.94 | | | | | (0.91 | ) | | | | 113 | | | |
| | | | 18.58 | | | | | 37,853 | | | | | 1.90 | | | | | (0.84 | ) | | | | 1.94 | | | | | (0.88 | ) | | | | 83 | | | |
| | | | (22.06 | ) | | | | 2,928 | | | | | 1.90 | | | | | (0.75 | ) | | | | 1.97 | | | | | (0.82 | ) | | | | 43 | | | |
| | | | | | | | |
| | | | 5.38 | % | | | $ | 8,424 | | | | | 1.94 | % | | | | (0.82 | )% | | | | 1.94 | % | | | | (0.82 | )% | | | | 94 | % | | |
| | | | (0.62 | ) | | | | 10,739 | | | | | 1.96 | | | | | (1.22 | ) | | | | 1.96 | | | | | (1.22 | ) | | | | 6 | | | |
| | | | 11.44 | | | | | 11,147 | | | | | 1.92 | | | | | (0.78 | ) | | | | 1.95 | | | | | (0.81 | ) | | | | 103 | | | |
| | | | 8.69 | | | | | 12,811 | | | | | 1.90 | | | | | (0.87 | ) | | | | 1.94 | | | | | (0.91 | ) | | | | 113 | | | |
| | | | 18.60 | | | | | 15,365 | | | | | 1.90 | | | | | (0.81 | ) | | | | 1.94 | | | | | (0.85 | ) | | | | 83 | | | |
| | | | (22.03 | ) | | | | 476 | | | | | 1.90 | | | | | (0.73 | ) | | | | 1.97 | | | | | (0.80 | ) | | | | 43 | | | |
| | | | | | | | | | | | | | | | | | | | | | | | | | | | | | | | | | | | | |
| | | | 5.87 | % | | | $ | 558 | | | | | 1.44 | % | | | | (0.32 | )% | | | | 1.57 | % | | | | (0.45 | )% | | | | 94 | % | | |
| | | | (0.57 | ) | | | | 290 | | | | | 1.46 | | | | | (0.72 | ) | | | | 1.61 | | | | | (0.87 | ) | | | | 6 | | | |
| | | | 12.04 | | | | | 290 | | | | | 1.42 | | | | | (0.57 | ) | | | | 1.60 | | | | | (0.75 | ) | | | | 103 | | | |
| | | | 9.38 | | | | | 1 | | | | | 1.15 | | | | | (0.08 | ) | | | | 1.19 | | | | | (0.12 | ) | | | | 113 | | | |
| | | | 19.51 | | | | | 15,890 | | | | | 1.15 | | | | | (0.01 | ) | | | | 1.19 | | | | | (0.05 | ) | | | | 83 | | | |
| | | | (21.45 | ) | | | | 2,376 | | | | | 1.15 | | | | | 0.00 | | | | | 1.22 | | | | | (0.07 | ) | | | | 43 | | | |
| | | | | | | | |
| | | | 6.42 | % | | | $ | 793,853 | | | | | 0.94 | % | | | | 0.18 | % | | | | 0.94 | % | | | | 0.18 | % | | | | 94 | % | | |
| | | | (0.52 | ) | | | | 849,194 | | | | | 0.96 | | | | | (0.22 | ) | | | | 0.96 | | | | | (0.22 | ) | | | | 6 | | | |
| | | | 12.58 | | | | | 849,382 | | | | | 0.92 | | | | | 0.26 | | | | | 0.95 | | | | | 0.23 | | | | | 103 | | | |
| | | | 9.76 | | | | | 1,188,261 | | | | | 0.90 | | | | | 0.13 | | | | | 0.94 | | | | | 0.09 | | | | | 113 | | | |
| | | | 19.78 | | | | | 1,072,174 | | | | | 0.90 | | | | | 0.31 | | | | | 0.94 | | | | | 0.27 | | | | | 83 | | | |
| | | | (21.23 | ) | | | | 255,311 | | | | | 0.90 | | | | | 0.24 | | | | | 0.97 | | | | | 0.17 | | | | | 43 | | | |
| | | | | | | | | | | | | | | | | | | | | | | | | | | | | | | | | |
First American Funds Annual Report 2006 99
Financial Highlights For a share outstanding throughout the indicated periods.
| | | | | | | | | | | | | | | | | | | | | | | | | | | | | | | | | | |
| | | | | | | | | Realized and | | | | | | | | | | | | | |
| | | Net Asset | | | | | | | Unrealized | | | | Distributions | | | | Distributions | | | | Net Asset | | | | |
| | | Value | | | | Net | | | | Gains | | | | from Net | | | | from Net | | | | Value | | | | |
| | | Beginning | | | | Investment | | | | (Losses) on | | | | Investment | | | | Realized | | | | End of | | | | |
| | | of Period | | | | Income (Loss) | | | | Investments | | | | Income | | | | Gains | | | | Period | | | | |
| | | | | | | | | | | | | | | | | | | | | |
Large Cap Select Fund (1) | | | | | | | | | | | | | | | | | | | | | | | | | | | | | | | | |
| Class A | | | | | | | | | | | | | | | | | | | | | | | | | | | | | | | | |
| | 2006 (2) | | $ | 14.30 | | | | $ | 0.06 | | | | | 1.48 | | | | $ | (0.06 | ) | | | $ | (0.60 | ) | | | $ | 15.18 | | | | |
| | 2005 (3) | | | 14.47 | | | | | — | | | | | (0.17 | ) | | | | — | | | | | — | | | | | 14.30 | | | | |
| | 2005 (4) | | | 12.52 | | | | | 0.06 | | | | | 2.15 | | | | | (0.06 | ) | | | | (0.20 | ) | | | | 14.47 | | | | |
| | 2004 (4) | | | 11.45 | | | | | 0.04 | | | | | 1.19 | | | | | (0.05 | ) | | | | (0.11 | ) | | | | 12.52 | | | | |
| | 2003 (6) | | | 10.00 | | | | | 0.03 | | | | | 1.46 | | | | | (0.04 | ) | | | | — | | | | | 11.45 | | | | |
| Class B | | | | | | | | | | | | | | | | | | | | | | | | | | | | | | | | |
| | 2006 (2) | | $ | 14.12 | | | | $ | (0.05 | ) | | | $ | 1.48 | | | | $ | (0.01 | ) | | | $ | (0.60 | ) | | | $ | 14.94 | | | | |
| | 2005 (3) | | | 14.30 | | | | | (0.01 | ) | | | | (0.17 | ) | | | | — | | | | | — | | | | | 14.12 | | | | |
| | 2005 (4) | | | 12.41 | | | | | (0.05 | ) | | | | 2.15 | | | | | (0.01 | ) | | | | (0.20 | ) | | | | 14.30 | | | | |
| | 2004 (4) | | | 11.41 | | | | | (0.06 | ) | | | | 1.18 | | | | | (0.01 | ) | | | | (0.11 | ) | | | | 12.41 | | | | |
| | 2003 (6) | | | 10.00 | | | | | (0.03 | ) | | | | 1.45 | | | | | (0.01 | ) | | | | — | | | | | 11.41 | | | | |
| Class C | | | | | | | | | | | | | | | | | | | | | | | | | | | | | | | | |
| | 2006 (2) | | $ | 14.13 | | | | $ | (0.05 | ) | | | $ | 1.48 | | | | $ | (0.01 | ) | | | $ | (0.60 | ) | | | $ | 14.95 | | | | |
| | 2005 (3) | | | 14.31 | | | | | (0.01 | ) | | | | (0.17 | ) | | | | — | | | | | — | | | | | 14.13 | | | | |
| | 2005 (4) | | | 12.43 | | | | | (0.05 | ) | | | | 2.14 | | | | | (0.01 | ) | | | | (0.20 | ) | | | | 14.31 | | | | |
| | 2004 (4) | | | 11.42 | | | | | (0.06 | ) | | | | 1.19 | | | | | (0.01 | ) | | | | (0.11 | ) | | | | 12.43 | | | | |
| | 2003 (6) | | | 10.00 | | | | | (0.02 | ) | | | | 1.45 | | | | | (0.01 | ) | | | | — | | | | | 11.42 | | | | |
| Class R (5) | | | | | | | | | | | | | | | | | | | | | | | | | | | | | | | | |
| | 2006 (2) | | $ | 14.26 | | | | $ | 0.01 | | | | $ | 1.49 | | | | $ | (0.04 | ) | | | $ | (0.60 | ) | | | $ | 15.12 | | | | |
| | 2005 (3) | | | 14.43 | | | | | (0.01 | ) | | | | (0.16 | ) | | | | — | | | | | — | | | | | 14.26 | | | | |
| | 2005 (4) | | | 12.49 | | | | | 0.02 | | | | | 2.15 | | | | | (0.03 | ) | | | | (0.20 | ) | | | | 14.43 | | | | |
| | 2004 (4) | | | 11.44 | | | | | 0.02 | | | | | 1.18 | | | | | (0.04 | ) | | | | (0.11 | ) | | | | 12.49 | | | | |
| | 2003 (6) | | | 10.00 | | | | | 0.03 | | | | | 1.44 | | | | | (0.03 | ) | | | | — | | | | | 11.44 | | | | |
| Class Y | | | | | | | | | | | | | | | | | | | | | | | | | | | | | | | | |
| | 2006 (2) | | $ | 14.33 | | | | $ | 0.10 | | | | $ | 1.49 | | | | $ | (0.10 | ) | | | $ | (0.60 | ) | | | $ | 15.22 | | | | |
| | 2005 (3) | | | 14.49 | | | | | — | | | | | (0.16 | ) | | | | — | | | | | — | | | | | 14.33 | | | | |
| | 2005 (4) | | | 12.53 | | | | | 0.09 | | | | | 2.16 | | | | | (0.09 | ) | | | | (0.20 | ) | | | | 14.49 | | | | |
| | 2004 (4) | | | 11.45 | | | | | 0.07 | | | | | 1.19 | | | | | (0.07 | ) | | | | (0.11 | ) | | | | 12.53 | | | | |
| | 2003 (6) | | | 10.00 | | | | | 0.05 | | | | | 1.45 | | | | | (0.05 | ) | | | | — | | | | | 11.45 | | | | |
| | | | | | | | | | | | | | | | | | | | | | | | | |
| | |
| | (1) | Per share data calculated using average shares outstanding method. |
| |
| | (2) | For the period November 1 to October 31 in the year indicated. |
| |
| | (3) | For the period October 1, 2005 to October 31, 2005. Effective in 2005, the fund’s fiscal year-end was changed from September 30 to October 31. All ratios for the period have been annualized, except total return and portfolio turnover. |
| |
| | (4) | For the period October 1 to September 30 in the year indicated. |
| |
| | (5) | Prior to July 1, 2004, Class R shares were named Class S shares, which had lower fees and expenses. |
| |
| | (6) | For the period from January 31, 2003, when the class of shares was first offered, to September 30, 2003. All ratios for the period have been annualized, except total return and portfolio turnover. |
| |
| | (7) | Total return does not reflect sales charges. Total return would have been lower had certain expenses not been waived. |
The accompanying notes are an integral part of the financial statements.
100 First American Funds Annual Report 2006
| | | | | | | | | | | | | | | | | | | | | | | | | | | | | | | | | | | | | |
| | | | | | | | | | | | | | | | | | Ratio of Net | | | | | | |
| | | | | | | | | | | | | | | Ratio of | | | | Investment | | | | | | |
| | | | | | | | | | | | Ratio of Net | | | | Expenses to | | | | Income (Loss) | | | | | | |
| | | | | | | | | Ratio of | | | | Investment | | | | Average | | | | to Average Net | | | | | | |
| | | | | | Net Assets | | | | Expenses to | | | | Income (Loss) | | | | Net Assets | | | | Assets | | | | Portfolio | | | |
| | | Total | | | | End of | | | | Average | | | | to Average | | | | (Excluding | | | | (Excluding | | | | Turnover | | | |
| | | Return (7) | | | | Period (000) | | | | Net Assets | | | | Net Assets | | | | Waivers) | | | | Waivers) | | | | Rate | | | |
| | | | | | | | | | | | | | | | | | | | | | | | | | | |
| | | | 11.07 | % | | | $ | 7,152 | | | | | 1.20 | % | | | | 0.41 | % | | | | 1.20 | % | | | | 0.41 | % | | | | 112 | % | | |
| | | | (1.17 | ) | | | | 5,682 | | | | | 1.19 | | | | | (0.20 | ) | | | | 1.19 | | | | | (0.20 | ) | | | | 8 | | | |
| | | | 17.83 | | | | | 5,299 | | | | | 1.17 | | | | | 0.41 | | | | | 1.22 | | | | | 0.36 | | | | | 176 | | | |
| | | | 10.82 | | | | | 714 | | | | | 1.15 | | | | | 0.30 | | | | | 1.21 | | | | | 0.24 | | | | | 67 | | | |
| | | | 14.91 | | | | | 215 | | | | | 1.15 | | | | | 0.42 | | | | | 1.24 | | | | | 0.33 | | | | | 65 | | | |
| | | | 10.32 | % | | | $ | 643 | | | | | 1.95 | % | | | | (0.34 | )% | | | | 1.95 | % | | | | (0.34 | )% | | | | 112 | % | | |
| | | | (1.26 | ) | | | | 573 | | | | | 1.94 | | | | | (0.95 | ) | | | | 1.94 | | | | | (0.95 | ) | | | | 8 | | | |
| | | | 17.02 | | | | | 567 | | | | | 1.92 | | | | | (0.36 | ) | | | | 1.97 | | | | | (0.41 | ) | | | | 176 | | | |
| | | | 9.89 | | | | | 270 | | | | | 1.90 | | | | | (0.44 | ) | | | | 1.96 | | | | | (0.50 | ) | | | | 67 | | | |
| | | | 14.18 | | | | | 113 | | | | | 1.90 | | | | | (0.35 | ) | | | | 1.99 | | | | | (0.44 | ) | | | | 65 | | | |
| | | | 10.36 | % | | | $ | 248 | | | | | 1.95 | % | | | | (0.35 | )% | | | | 1.95 | % | | | | (0.35 | )% | | | | 112 | % | | |
| | | | (1.26 | ) | | | | 180 | | | | | 1.94 | | | | | (0.95 | ) | | | | 1.94 | | | | | (0.95 | ) | | | | 8 | | | |
| | | | 16.91 | | | | | 182 | | | | | 1.92 | | | | | (0.35 | ) | | | | 1.97 | | | | | (0.40 | ) | | | | 176 | | | |
| | | | 9.98 | | | | | 59 | | | | | 1.90 | | | | | (0.45 | ) | | | | 1.96 | | | | | (0.51 | ) | | | | 67 | | | |
| | | | 14.27 | | | | | 26 | | | | | 1.90 | | | | | (0.32 | ) | | | | 1.99 | | | | | (0.41 | ) | | | | 65 | | | |
| | | | 10.79 | % | | | $ | 118 | | | | | 1.45 | % | | | | 0.08 | % | | | | 1.57 | % | | | | (0.04 | )% | | | | 112 | % | | |
| | | | (1.18 | ) | | | | 2 | | | | | 1.44 | | | | | (0.45 | ) | | | | 1.59 | | | | | (0.60 | ) | | | | 8 | | | |
| | | | 17.54 | | | | | 2 | | | | | 1.42 | | | | | 0.14 | | | | | 1.62 | | | | | (0.06 | ) | | | | 176 | | | |
| | | | 10.60 | | | | | 1 | | | | | 1.32 | | | | | 0.18 | | | | | 1.38 | | | | | 0.12 | | | | | 67 | | | |
| | | | 14.76 | | | | | 1 | | | | | 1.15 | | | | | 0.39 | | | | | 1.24 | | | | | 0.30 | | | | | 65 | | | |
| | | | 11.37 | % | | | $ | 476,154 | | | | | 0.95 | % | | | | 0.66 | % | | | | 0.95 | % | | | | 0.66 | % | | | | 112 | % | | |
| | | | (1.10 | ) | | | | 341,061 | | | | | 0.94 | | | | | 0.05 | | | | | 0.94 | | | | | 0.05 | | | | | 8 | | | |
| | | | 18.14 | | | | | 329,656 | | | | | 0.92 | | | | | 0.67 | | | | | 0.97 | | | | | 0.62 | | | | | 176 | | | |
| | | | 11.10 | | | | | 291,807 | | | | | 0.90 | | | | | 0.57 | | | | | 0.96 | | | | | 0.51 | | | | | 67 | | | |
| | | | 15.02 | | | | | 126,391 | | | | | 0.90 | | | | | 0.71 | | | | | 0.99 | | | | | 0.62 | | | | | 65 | | | |
| | | | | | | | | | | | | | | | | | | | | | | | | | | | | | | | | |
First American Funds Annual Report 2006 101
Financial Highlights For a share outstanding throughout the indicated periods.
| | | | | | | | | | | | | | | | | | | | | | | | | | | | | | | | | | |
| | | | | | | | | Realized and | | | | | | | | | | | | | |
| | | Net Asset | | | | | | | Unrealized | | | | Distributions | | | | Distributions | | | | Net Asset | | | | |
| | | Value | | | | Net | | | | Gains | | | | from Net | | | | from Net | | | | Value | | | | |
| | | Beginning | | | | Investment | | | | (Losses) on | | | | Investment | | | | Realized | | | | End of | | | | |
| | | of Period | | | | Income (Loss) | | | | Investments | | | | Income | | | | Gains | | | | Period | | | | |
| | | | | | | | | | | | | | | | | | | | | |
Large Cap Value Fund (1) | | | | | | | | | | | | | | | | | | | | | | | | | | | | | | | | |
| Class A | | | | | | | | | | | | | | | | | | | | | | | | | | | | | | | | |
| | 2006 (2) | | $ | 19.56 | | | | $ | 0.21 | | | | $ | 3.19 | | | | $ | (0.21 | ) | | | $ | (0.63 | ) | | | $ | 22.12 | | | | |
| | 2005 (3) | | | 20.06 | | | | | — | | | | | (0.50 | ) | | | | — | | | | | — | | | | | 19.56 | | | | |
| | 2005 (4) | | | 17.21 | | | | | 0.17 | | | | | 2.85 | | | | | (0.17 | ) | | | | — | | | | | 20.06 | | | | |
| | 2004 (4) | | | 14.97 | | | | | 0.15 | | | | | 2.24 | | | | | (0.15 | ) | | | | — | | | | | 17.21 | | | | |
| | 2003 (4) | | | 12.77 | | | | | 0.18 | | | | | 2.20 | | | | | (0.18 | ) | | | | — | | | | | 14.97 | | | | |
| | 2002 (4) | | | 15.98 | | | | | 0.14 | | | | | (3.21 | ) | | | | (0.14 | ) | | | | — | | | | | 12.77 | | | | |
| Class B | | | | | | | | | | | | | | | | | | | | | | | | | | | | | | | | |
| | 2006 (2) | | $ | 19.12 | | | | $ | 0.06 | | | | $ | 3.11 | | | | $ | (0.12 | ) | | | $ | (0.63 | ) | | | $ | 21.54 | | | | |
| | 2005 (3) | | | 19.62 | | | | | (0.01 | ) | | | | (0.49 | ) | | | | — | | | | | — | | | | | 19.12 | | | | |
| | 2005 (4) | | | 16.87 | | | | | 0.03 | | | | | 2.78 | | | | | (0.06 | ) | | | | — | | | | | 19.62 | | | | |
| | 2004 (4) | | | 14.70 | | | | | 0.03 | | | | | 2.20 | | | | | (0.06 | ) | | | | — | | | | | 16.87 | | | | |
| | 2003 (4) | | | 12.55 | | | | | 0.08 | | | | | 2.15 | | | | | (0.08 | ) | | | | — | | | | | 14.70 | | | | |
| | 2002 (4) | | | 15.71 | | | | | 0.02 | | | | | (3.15 | ) | | | | (0.03 | ) | | | | — | | | | | 12.55 | | | | |
| Class C | | | | | | | | | | | | | | | | | | | | | | | | | | | | | | | | |
| | 2006 (2) | | $ | 19.35 | | | | $ | 0.06 | | | | $ | 3.15 | | | | $ | (0.12 | ) | | | $ | (0.63 | ) | | | $ | 21.81 | | | | |
| | 2005 (3) | | | 19.85 | | | | | (0.01 | ) | | | | (0.49 | ) | | | | — | | | | | — | | | | | 19.35 | | | | |
| | 2005 (4) | | | 17.07 | | | | | 0.03 | | | | | 2.81 | | | | | (0.06 | ) | | | | — | | | | | 19.85 | | | | |
| | 2004 (4) | | | 14.87 | | | | | 0.03 | | | | | 2.23 | | | | | (0.06 | ) | | | | — | | | | | 17.07 | | | | |
| | 2003 (4) | | | 12.70 | | | | | 0.08 | | | | | 2.17 | | | | | (0.08 | ) | | | | — | | | | | 14.87 | | | | |
| | 2002 (4) | | | 15.90 | | | | | 0.02 | | | | | (3.19 | ) | | | | (0.03 | ) | | | | — | | | | | 12.70 | | | | |
| Class R (5) | | | | | | | | | | | | | | | | | | | | | | | | | | | | | | | | |
| | 2006 (2) | | $ | 19.55 | | | | $ | 0.12 | | | | $ | 3.23 | | | | $ | (0.17 | ) | | | $ | (0.63 | ) | | | $ | 22.10 | | | | |
| | 2005 (3) | | | 20.06 | | | | | (0.01 | ) | | | | (0.50 | ) | | | | — | | | | | — | | | | | 19.55 | | | | |
| | 2005 (4) | | | 17.22 | | | | | 0.12 | | | | | 2.85 | | | | | (0.13 | ) | | | | — | | | | | 20.06 | | | | |
| | 2004 (4) | | | 14.96 | | | | | 0.17 | | | | | 2.23 | | | | | (0.14 | ) | | | | — | | | | | 17.22 | | | | |
| | 2003 (4) | | | 12.77 | | | | | 0.18 | | | | | 2.19 | | | | | (0.18 | ) | | | | — | | | | | 14.96 | | | | |
| | 2002 (4) | | | 15.97 | | | | | 0.13 | | | | | (3.18 | ) | | | | (0.15 | ) | | | | — | | | | | 12.77 | | | | |
| Class Y | | | | | | | | | | | | | | | | | | | | | | | | | | | | | | | | |
| | 2006 (2) | | $ | 19.62 | | | | $ | 0.26 | | | | $ | 3.21 | | | | $ | (0.27 | ) | | | $ | (0.63 | ) | | | $ | 22.19 | | | | |
| | 2005 (3) | | | 20.12 | | | | | — | | | | | (0.50 | ) | | | | — | | | | | — | | | | | 19.62 | | | | |
| | 2005 (4) | | | 17.26 | | | | | 0.22 | | | | | 2.86 | | | | | (0.22 | ) | | | | — | | | | | 20.12 | | | | |
| | 2004 (4) | | | 15.01 | | | | | 0.20 | | | | | 2.24 | | | | | (0.19 | ) | | | | — | | | | | 17.26 | | | | |
| | 2003 (4) | | | 12.80 | | | | | 0.22 | | | | | 2.20 | | | | | (0.21 | ) | | | | — | | | | | 15.01 | | | | |
| | 2002 (4) | | | 16.02 | | | | | 0.18 | | | | | (3.22 | ) | | | | (0.18 | ) | | | | — | | | | | 12.80 | | | | |
| | | | | | | | | | | | | | | | | | | | | | | | | |
| | |
| | (1) | Per share data calculated using average shares outstanding method. |
| |
| | (2) | For the period November 1 to October 31 in the year indicated. |
| |
| | (3) | For the period October 1, 2005 to October 31, 2005. Effective in 2005, the fund’s fiscal year-end was changed from September 30 to October 31. All ratios for the period have been annualized, except total return and portfolio turnover. |
| |
| | (4) | For the period October 1 to September 30 in the year indicated. |
| |
| | (5) | Prior to July 1, 2004, Class R shares were named Class S shares, which had lower fees and expenses. |
| |
| | (6) | Total return does not reflect sales charges. Total return would have been lower had certain expenses not been waived. |
The accompanying notes are an integral part of the financial statements.
102 First American Funds Annual Report 2006
| | | | | | | | | | | | | | | | | | | | | | | | | | | | | | | | | | | | | |
| | | | | | | | | | | | | | | | | | Ratio of Net | | | | | | |
| | | | | | | | | | | | | | | Ratio of | | | | Investment | | | | | | |
| | | | | | | | | | | | Ratio of Net | | | | Expenses to | | | | Income (Loss) | | | | | | |
| | | | | | | | | Ratio of | | | | Investment | | | | Average | | | | to Average | | | | | | |
| | | | | | Net Assets | | | | Expenses to | | | | Income (Loss) | | | | Net Assets | | | | Net Assets | | | | Portfolio | | | |
| | | Total | | | | End of | | | | Average | | | | to Average | | | | (Excluding | | | | (Excluding | | | | Turnover | | | |
| | | Return (6) | | | | Period (000) | | | | Net Assets | | | | Net Assets | | | | Waivers) | | | | Waivers) | | | | Rate | | | |
| | | | | | | | | | | | | | | | | | | | | | | | | | | |
| | | | | | | | | | | | | | | | | | | | | | | | | | | | | | | | | | | | | |
| | | | 17.93 | % | | | $ | 115,438 | | | | | 1.19 | % | | | | 1.05 | % | | | | 1.19 | % | | | | 1.05 | % | | | | 55 | % | | |
| | | | (2.48 | ) | | | | 118,443 | | | | | 1.21 | | | | | (0.17 | ) | | | | 1.21 | | | | | (0.17 | ) | | | | 2 | | | |
| | | | 17.62 | | | | | 121,809 | | | | | 1.17 | | | | | 0.90 | | | | | 1.20 | | | | | 0.87 | | | | | 61 | | | |
| | | | 16.01 | | | | | 113,683 | | | | | 1.15 | | | | | 0.91 | | | | | 1.19 | | | | | 0.87 | | | | | 104 | | | |
| | | | 18.71 | | | | | 88,024 | | | | | 1.15 | | | | | 1.30 | | | | | 1.20 | | | | | 1.25 | | | | | 94 | | | |
| | | | (19.37 | ) | | | | 85,182 | | | | | 1.15 | | | | | 0.86 | | | | | 1.20 | | | | | 0.81 | | | | | 82 | | | |
| | | | | | | | | | | | | | | | | | | | | | | | | | | | | | | | | | | | | |
| | | | 17.04 | % | | | $ | 9,815 | | | | | 1.94 | % | | | | 0.32 | % | | | | 1.94 | % | | | | 0.32 | % | | | | 55 | % | | |
| | | | (2.55 | ) | | | | 13,826 | | | | | 1.96 | | | | | (0.92 | ) | | | | 1.96 | | | | | (0.92 | ) | | | | 2 | | | |
| | | | 16.70 | | | | | 14,876 | | | | | 1.92 | | | | | 0.15 | | | | | 1.95 | | | | | 0.12 | | | | | 61 | | | |
| | | | 15.19 | | | | | 21,829 | | | | | 1.90 | | | | | 0.19 | | | | | 1.94 | | | | | 0.15 | | | | | 104 | | | |
| | | | 17.83 | | | | | 30,987 | | | | | 1.90 | | | | | 0.56 | | | | | 1.95 | | | | | 0.51 | | | | | 94 | | | |
| | | | (19.96 | ) | | | | 33,720 | | | | | 1.90 | | | | | 0.11 | | | | | 1.95 | | | | | 0.06 | | | | | 82 | | | |
| | | | 17.05 | % | | | $ | 5,174 | | | | | 1.94 | % | | | | 0.30 | % | | | | 1.94 | % | | | | 0.30 | % | | | | 55 | % | | |
| | | | (2.52 | ) | | | | 5,399 | | | | | 1.96 | | | | | (0.92 | ) | | | | 1.96 | | | | | (0.92 | ) | | | | 2 | | | |
| | | | 16.75 | | | | | 5,710 | | | | | 1.92 | | | | | 0.15 | | | | | 1.95 | | | | | 0.12 | | | | | 61 | | | |
| | | | 15.21 | | | | | 6,344 | | | | | 1.90 | | | | | 0.18 | | | | | 1.94 | | | | | 0.14 | | | | | 104 | | | |
| | | | 17.76 | | | | | 6,844 | | | | | 1.90 | | | | | 0.56 | | | | | 1.95 | | | | | 0.51 | | | | | 94 | | | |
| | | | (19.97 | ) | | | | 7,524 | | | | | 1.90 | | | | | 0.11 | | | | | 1.95 | | | | | 0.06 | | | | | 82 | | | |
| | | | | | | | | | | | | | | | | | | | | | | | | | | | | | | | | | | | | |
| | | | 17.63 | % | | | $ | 164 | | | | | 1.44 | % | | | | 0.58 | % | | | | 1.55 | % | | | | 0.47 | % | | | | 55 | % | | |
| | | | (2.54 | ) | | | | 7 | | | | | 1.46 | | | | | (0.42 | ) | | | | 1.61 | | | | | (0.57 | ) | | | | 2 | | | |
| | | | 17.34 | | | | | 7 | | | | | 1.42 | | | | | 0.61 | | | | | 1.60 | | | | | 0.43 | | | | | 61 | | | |
| | | | 16.05 | | | | | 1 | | | | | 1.15 | | | | | 1.00 | | | | | 1.19 | | | | | 0.96 | | | | | 104 | | | |
| | | | 18.63 | | | | | 23,845 | | | | | 1.15 | | | | | 1.30 | | | | | 1.20 | | | | | 1.25 | | | | | 94 | | | |
| | | | (19.36 | ) | | | | 24,129 | | | | | 1.15 | | | | | 0.90 | | | | | 1.20 | | | | | 0.85 | | | | | 82 | | | |
| | | | 18.23 | % | | | $ | 825,633 | | | | | 0.94 | % | | | | 1.29 | % | | | | 0.94 | % | | | | 1.29 | % | | | | 55 | % | | |
| | | | (2.47 | ) | | | | 740,511 | | | | | 0.96 | | | | | 0.08 | | | | | 0.96 | | | | | 0.08 | | | | | 2 | | | |
| | | | 17.92 | | | | | 764,679 | | | | | 0.92 | | | | | 1.17 | | | | | 0.95 | | | | | 1.14 | | | | | 61 | | | |
| | | | 16.31 | | | | | 1,021,197 | | | | | 0.90 | | | | | 1.17 | | | | | 0.94 | | | | | 1.13 | | | | | 104 | | | |
| | | | 19.04 | | | | | 874,267 | | | | | 0.90 | | | | | 1.55 | | | | | 0.95 | | | | | 1.50 | | | | | 94 | | | |
| | | | (19.22 | ) | | | | 825,179 | | | | | 0.90 | | | | | 1.11 | | | | | 0.95 | | | | | 1.06 | | | | | 82 | | | |
| | | | | | | | | | | | | | | | | | | | | | | | | | | | | | | | | |
First American Funds Annual Report 2006 103
Schedule of Investments October 31, 2006, all dollars are rounded to thousands (000)
| | | | | | | | | |
| Balanced Fund | |
| DESCRIPTION | | SHARES | | | VALUE | |
| | |
| Common Stocks – 61.0% |
| Consumer Discretionary – 8.3% |
| Cheesecake Factory (a) (b) | | | 2,899 | | | $ | 82 | |
| Children’s Place Retail Stores (a) (b) | | | 3,529 | | | | 248 | |
| Christopher & Banks | | | 6,186 | | | | 167 | |
| Circuit City Stores (a) | | | 90,404 | | | | 2,439 | |
| Comcast, Class A (a) (b) | | | 135,386 | | | | 5,506 | |
| Cosi (a) (b) | | | 26,331 | | | | 114 | |
| Gap | | | 291,816 | | | | 6,134 | |
| GSI Commerce (a) (b) | | | 10,010 | | | | 180 | |
| Hibbett Sporting Goods (b) | | | 5,478 | | | | 160 | |
| Interface, Class A (b) | | | 3,001 | | | | 44 | |
| J.C. Penney (a) | | | 32,376 | | | | 2,436 | |
| Lowe’s | | | 84,604 | | | | 2,550 | |
| Mattel | | | 102,055 | | | | 2,309 | |
| McCormick & Schmick’s Seafood Restaurant (b) | | | 3,107 | | | | 82 | |
| Nautilus Group (a) | | | 28,843 | | | | 408 | |
| Newell Rubbermaid (a) | | | 120,035 | | | | 3,455 | |
| Nutri/ System (a) (b) | | | 4,794 | | | | 296 | |
| Omnicom Group (a) | | | 29,432 | | | | 2,986 | |
| P.F. Chang’s China Bistro (a) (b) | | | 2,428 | | | | 101 | |
| RARE Hospitality International (b) | | | 3,012 | | | | 95 | |
| Ruth’s Chris Steak House (b) | | | 6,864 | | | | 135 | |
| Scientific Games, Class A (b) | | | 8,773 | | | | 246 | |
| Station Casinos (a) | | | 1,632 | | | | 98 | |
| Texas Roadhouse, Class A (a) (b) | | | 7,964 | | | | 115 | |
| Tween Brands (a) (b) | | | 4,169 | | | | 174 | |
| WCI Communities (b) | | | 5,999 | | | | 97 | |
| WMS Industries (a) (b) | | | 1,754 | | | | 62 | |
| | | | | | | |
| | | | | | | | 30,719 | |
| | | | | | | |
| Consumer Staples – 4.4% |
| Altria Group | | | 48,086 | | | | 3,911 | |
| Avon Products | | | 64,326 | | | | 1,956 | |
| Central Garden & Pet (a) (b) | | | 4,897 | | | | 245 | |
| PepsiCo | | | 48,189 | | | | 3,057 | |
| Reddy Ice Holdings | | | 4,398 | | | | 106 | |
| Reliv International | | | 10,884 | | | | 109 | |
| Usana Health Sciences (a) (b) | | | 5,175 | | | | 232 | |
| Wal-Mart Stores | | | 135,143 | | | | 6,660 | |
| | | | | | | |
| | | | | | | | 16,276 | |
| | | | | | | |
| Energy – 8.2% |
| Apache | | | 69,751 | | | | 4,556 | |
| Arena Resources (a) (b) | | | 1,880 | | | | 67 | |
| Brigham Exploration (b) | | | 19,119 | | | | 149 | |
| Cameron International (a) (b) | | | 24,025 | | | | 1,204 | |
| Compton Petroleum (b) | | | 13,575 | | | | 144 | |
| Comstock Resources (a) (b) | | | 6,363 | | | | 177 | |
| ConocoPhillips | | | 66,517 | | | | 4,007 | |
| Exxon Mobil | | | 129,273 | | | | 9,233 | |
| Halliburton | | | 80,046 | | | | 2,589 | |
| Helix Energy Solutions Group (a) (b) | | | 5,508 | | | | 178 | |
| Hess (a) | | | 51,430 | | | | 2,181 | |
| St. Mary Land & Exploration | | | 3,665 | | | | 137 | |
| Western Refining (a) | | | 3,755 | | | | 88 | |
| W-H Energy Services (a) (b) | | | 1,445 | | | | 68 | |
| Williams | | | 141,276 | | | | 3,451 | |
| XTO Energy | | | 49,114 | | | | 2,292 | |
| | | | | | | |
| | | | | | | | 30,521 | |
| | | | | | | |
| Financials – 12.3% |
| ACE | | | 75,021 | | | | 4,295 | |
| Affiliated Managers Group (a) (b) | | | 3,026 | | | | 303 | |
| AllianceBernstein Holding | | | 27,277 | | | | 2,119 | |
| Ambac Financial Group | | | 29,407 | | | | 2,455 | |
| American International Group | | | 152,553 | | | | 10,247 | |
| Bank of America (a) | | | 177,306 | | | | 9,551 | |
| BioMed Realty Trust – REIT (a) | | | 4,898 | | | | 158 | |
| CoBiz | | | 2,549 | | | | 58 | |
| Columbia Banking System | | | 3,263 | | | | 103 | |
| Cullen/ Frost Bankers | | | 5,105 | | | | 276 | |
| Dime Community Bancshares | | | 9,788 | | | | 137 | |
| East West Bancorp | | | 6,026 | | | | 220 | |
| First Financial Bankshares (a) | | | 2,190 | | | | 88 | |
| First Marblehead (a) | | | 672 | | | | 45 | |
| First Potomac Realty Trust – REIT | | | 6,938 | | | | 215 | |
| First Republic Bank (a) | | | 6,307 | | | | 246 | |
| Goldman Sachs Group | | | 17,253 | | | | 3,274 | |
| ICICI Bank, ADR | | | 52,292 | | | | 1,838 | |
| Independent Bank | | | 5,231 | | | | 175 | |
| Investors Financial Services | | | 3,464 | | | | 136 | |
| Kite Realty Group Trust – REIT | | | 9,696 | | | | 178 | |
| LaSalle Hotel Properties – REIT | | | 2,242 | | | | 95 | |
| Maguire Properties – REIT (a) | | | 1,959 | | | | 84 | |
| Morgan Stanley | | | 81,209 | | | | 6,207 | |
| Newcastle Investment – REIT | | | 4,595 | | | | 136 | |
| NorthStar Realty Finance – REIT | | | 7,346 | | | | 111 | |
| Platinum Underwriters Holdings | | | 8,061 | | | | 241 | |
| PMI Group (a) | | | 45,691 | | | | 1,949 | |
| SL Green Realty – REIT (a) | | | 1,644 | | | | 199 | |
| South Financial Group | | | 3,631 | | | | 96 | |
| Thomas Weisel Partners Group (a) (b) | | | 8,689 | | | | 139 | |
| Umpqua Holdings (a) | | | 5,203 | | | | 147 | |
| Winston Hotels – REIT | | | 3,698 | | | | 45 | |
| | | | | | | |
| | | | | | | | 45,566 | |
| | | | | | | |
| Healthcare – 7.1% |
| Alcon (a) | | | 20,559 | | | | 2,181 | |
| Amgen (b) | | | 47,874 | | | | 3,634 | |
| Caliper Life Sciences (b) | | | 7,002 | | | | 36 | |
| Celgene (a) (b) | | | 23,387 | | | | 1,250 | |
| Coventry Health Care (b) | | | 45,018 | | | | 2,114 | |
| Curis (b) | | | 24,949 | | | | 37 | |
| Dexcom (a) (b) | | | 3,601 | | | | 32 | |
| DJ Orthopedics (a) (b) | | | 5,602 | | | | 225 | |
| Genzyme (a) (b) | | | 14,942 | | | | 1,009 | |
| Healthways (a) (b) | | | 3,022 | | | | 128 | |
| Horizon Health (a) (b) | | | 5,433 | | | | 84 | |
| Human Genome Sciences (a) (b) | | | 8,129 | | | | 108 | |
| ICU Medical (a) (b) | | | 4,590 | | | | 194 | |
| Immucor (b) | | | 5,131 | | | | 141 | |
| ImmunoGen (a) (b) | | | 14,698 | | | | 59 | |
| K-V Pharmaceutical, Class A (b) | | | 4,713 | | | | 105 | |
| Laboratory Corporation of America (b) | | | 22,880 | | | | 1,567 | |
| LCA-Vision (a) | | | 4,918 | | | | 173 | |
| Magellan Health Services (b) | | | 5,500 | | | | 240 | |
| Medarex (a) (b) | | | 7,602 | | | | 98 | |
| Merge Technologies (a) (b) | | | 6,082 | | | | 47 | |
| Neurocrine Biosciences (a) (b) | | | 1,470 | | | | 17 | |
| Novartis AG, ADR | | | 55,775 | | | | 3,387 | |
| Pediatrix Medical Group (b) | | | 8,367 | | | | 376 | |
| Quidel (b) | | | 2,389 | | | | 37 | |
| Salix Pharmaceuticals (a) (b) | | | 11,090 | | | | 148 | |
| Senomyx (a) (b) | | | 6,363 | | | | 98 | |
| SonoSite (b) | | | 1,899 | | | | 54 | |
| SurModics (a) (b) | | | 3,365 | | | | 117 | |
| UnitedHealth Group | | | 64,736 | | | | 3,158 | |
| Vertex Pharmaceuticals (a) (b) | | | 3,120 | | | | 127 | |
| Wyeth Pharmaceuticals | | | 101,815 | | | | 5,196 | |
| | | | | | | |
| | | | | | | | 26,177 | |
| | | | | | | |
The accompanying notes are an integral part of the financial statements.
104 First American Funds Annual Report 2006
| | | | | | | | | |
| Balanced Fund (continued) | |
| DESCRIPTION | | SHARES | | | VALUE | |
| | |
| Industrials – 6.7% |
| Acuity Brands (a) | | | 2,157 | | | $ | 107 | |
| AirTran Holdings (a) (b) | | | 27,750 | | | | 277 | |
| AMETEK (a) | | | 6,451 | | | | 301 | |
| Boeing | | | 63,191 | | | | 5,046 | |
| CLARCOR | | | 2,192 | | | | 71 | |
| CRA International (a) (b) | | | 3,547 | | | | 180 | |
| Eaton | | | 32,682 | | | | 2,367 | |
| Energy Conversion Devices (a) (b) | | | 1,664 | | | | 61 | |
| ESCO Technologies (a) (b) | | | 1,730 | | | | 75 | |
| Forward Air (a) | | | 6,731 | | | | 219 | |
| General Electric | | | 224,277 | | | | 7,874 | |
| Kennametal | | | 1,679 | | | | 104 | |
| KVH Industries (b) | | | 1,630 | | | | 18 | |
| L-3 Communications Holdings | | | 49,023 | | | | 3,947 | |
| Labor Ready (b) | | | 10,834 | | | | 190 | |
| Lennox International (a) | | | 10,199 | | | | 275 | |
| Manitowoc | | | 2,989 | | | | 164 | |
| NCI Building Systems (a) (b) | | | 3,334 | | | | 200 | |
| Parker Hannifin | | | 28,812 | | | | 2,410 | |
| Power-One (a) (b) | | | 27,576 | | | | 189 | |
| Steelcase, Class A | | | 13,387 | | | | 222 | |
| Timken (a) | | | 3,577 | | | | 107 | |
| WESCO International (a) (b) | | | 3,094 | | | | 202 | |
| | | | | | | |
| | | | | | | | 24,606 | |
| | | | | | | |
| Information Technology – 11.1% |
| Advanced Analogic Technologies (a) (b) | | | 15,525 | | | | 97 | |
| Aeroflex (b) | | | 5,267 | | | | 57 | |
| Apple Computer (b) | | | 26,960 | | | | 2,186 | |
| BISYS Group (b) | | | 31,950 | | | | 353 | |
| Cogent (a) (b) | | | 9,298 | | | | 107 | |
| Corning (b) | | | 116,240 | | | | 2,375 | |
| Digital River (a) (b) | | | 2,083 | | | | 120 | |
| Digitas (a) (b) | | | 21,507 | | | | 227 | |
| EMC (b) | | | 220,737 | | | | 2,704 | |
| Entegris (a) (b) | | | 34,145 | | | | 383 | |
| F5 Networks (b) | | | 3,679 | | | | 243 | |
| Fiserv (b) | | | 71,789 | | | | 3,546 | |
| Harmonic (b) | | | 13,918 | | | | 113 | |
| Hewlett-Packard | | | 127,200 | | | | 4,928 | |
| Hutchinson Technology (a) (b) | | | 11,527 | | | | 267 | |
| Hyperion Solutions (a) (b) | | | 7,212 | | | | 270 | |
| Intel | | | 106,740 | | | | 2,278 | |
| Motorola | | | 175,694 | | | | 4,051 | |
| NVIDIA (b) | | | 109,840 | | | | 3,830 | |
| Oracle (b) | | | 270,555 | | | | 4,997 | |
| Plexus (b) | | | 2,060 | | | | 45 | |
| PMC-Sierra (a) (b) | | | 29,158 | | | | 193 | |
| Progress Software (b) | | | 5,347 | | | | 154 | |
| QUALCOMM | | | 80,172 | | | | 2,917 | |
| Rackable Systems (a) (b) | | | 3,761 | | | | 117 | |
| Silicon Image (b) | | | 15,595 | | | | 184 | |
| Stellent | | | 13,972 | | | | 156 | |
| Stratasys (a) (b) | | | 3,325 | | | | 93 | |
| Stratex Networks (a) (b) | | | 27,995 | | | | 131 | |
| Tessera Technologies (b) | | | 5,329 | | | | 186 | |
| Texas Instruments | | | 119,569 | | | | 3,609 | |
| TIBCO Software (a) (b) | | | 17,660 | | | | 163 | |
| Trident Microsystems (a) (b) | | | 8,710 | | | | 184 | |
| | | | | | | |
| | | | | | | | 41,264 | |
| | | | | | | |
| Materials – 0.8% |
| Albemarle | | | 3,770 | | | | 245 | |
| Century Aluminum (a) (b) | | | 2,809 | | | | 110 | |
| International Paper (a) | | | 71,572 | | | | 2,387 | |
| | | | | | | | | | |
| Balanced Fund (continued) |
| DESCRIPTION | | SHARES/PAR | | | VALUE | |
| |
| Schnitzer Steel Industries, Class A | | | 4,551 | | | $ | 159 | |
| Texas Industries | | | 2,338 | | | | 145 | |
| | | | | | | | | |
| | | | | | | | 3,046 | |
| | | | | | | | | |
| Telecommunication Services – 2.1% |
| ALLTEL (a) | | | 61,934 | | | | 3,302 | |
| General Communication (b) | | | 10,503 | | | | 137 | |
| Verizon Communications | | | 86,455 | | | | 3,199 | |
| Windstream (a) | | | 91,542 | | | | 1,256 | |
| | | | | | | | | |
| | | | | | | | 7,894 | |
| | | | | | | | | |
| Utilities – 0.0% |
| NSTAR (a) | | | 2,527 | | | | 88 | |
| | | | | | | | | |
Total Common Stocks | | | | | | | | |
| | (Cost $195,101) | | | | | | | 226,157 | |
| | | | | | | | | |
| Investment Companies – 4.1% |
| iShares MSCI EAFE Index Fund (a) | | | 162,100 | | | | 11,394 | |
| iShares MSCI Emerging Markets Index Fund (a) | | | 10,500 | | | | 1,088 | |
| iShares MSCI EMU Index Fund (a) | | | 6,800 | | | | 662 | |
| iShares MSCI Japan Index Fund (a) | | | 74,500 | | | | 1,029 | |
| iShares MSCI Pacific ex-Japan Index Fund (a) | | | 3,300 | | | | 394 | |
| iShares S&P Europe 350 Index Fund (a) | | | 6,100 | | | | 611 | |
| | | | | | | | | |
Total Investment Companies | | | | | | | | |
| | (Cost $11,146) | | | | | | | 15,178 | |
| | | | | | | | | |
| U.S. Government Agency Mortgage-Backed Securities – 11.7% |
| Adjustable Rate (c) – 1.3% |
| Federal Home Loan Mortgage Corporation Pool | | | | | | | | |
| | 7.168%, 01/01/2028, #786281 | | $ | 205 | | | | 208 | |
| | 5.790%, 07/01/2036, #1K1238 (a) | | | 1,084 | | | | 1,091 | |
| Federal National Mortgage Association Pool | | | | | | | | |
| | 6.164%, 04/01/2018, #070009 | | | 47 | | | | 47 | |
| | 6.379%, 09/01/2033, #725553 (a) | | | 747 | | | | 753 | |
| | 5.280%, 11/01/2034, #735054 | | | 843 | | | | 823 | |
| | 4.864%, 09/01/2035, #745168 (a) | | | 832 | | | | 819 | |
| | 5.731%, 09/01/2036, #884778 | | | 1,070 | | | | 1,075 | |
| | | | | | | | | |
| | | | | | | | 4,816 | |
| | | | | | | | | |
| Fixed Rate – 10.4% |
| Federal Home Loan Mortgage Corporation Pool | | | | | | | | |
| | 4.000%, 04/01/2008, #M90808 (a) | | | 583 | | | | 575 | |
| | 6.500%, 04/01/2008, #E00225 | | | 8 | | | | 8 | |
| | 7.000%, 04/01/2008, #E46044 | | | 4 | | | | 4 | |
| | 4.000%, 10/01/2010, #M80855 | | | 849 | | | | 821 | |
| | 5.500%, 03/01/2013, #E00546 | | | 117 | | | | 118 | |
| | 4.500%, 05/01/2018, #P10032 (a) | | | 423 | | | | 416 | |
| | 6.500%, 11/01/2028, #C00676 | | | 506 | | | | 520 | |
| | 7.000%, 12/01/2029, #G01091 | | | 94 | | | | 97 | |
| | 6.500%, 07/01/2031, #A17212 (a) | | | 345 | | | | 354 | |
| | 6.000%, 05/01/2032, #C01361 | | | 117 | | | | 118 | |
| Federal National Mortgage Association Pool | | | | | | | | |
| | 3.790%, 07/01/2013, #386314 (a) | | | 1,334 | | | | 1,243 | |
| | 6.000%, 09/01/2017, #653368 | | | 271 | | | | 276 | |
| | 5.000%, 07/01/2018, #555621 | | | 1,183 | | | | 1,168 | |
| | 5.000%, 12/01/2018, #725012 | | | 984 | | | | 971 | |
| | 4.500%, 06/01/2019, #045181 | | | 350 | | | | 339 | |
| | 5.000%, 11/01/2019, #725934 | | | 286 | | | | 282 | |
| | 5.500%, 01/01/2020, #735386 (a) | | | 541 | | | | 543 | |
| | 5.500%, 06/01/2020, #735792 | | | 462 | | | | 464 | |
| | 5.000%, 02/01/2021, #745279 (a) | | | 1,549 | | | | 1,526 | |
| | 6.000%, 10/01/2022, #254513 (a) | | | 464 | | | | 471 | |
| | 5.500%, 10/01/2024, #255456 (a) | | | 956 | | | | 953 | |
| | 5.500%, 12/01/2024, #357662 | | | 811 | | | | 808 | |
| | 5.500%, 02/01/2025, #255628 (a) | | | 951 | | | | 949 | |
First American Funds Annual Report 2006 105
Schedule of Investments October 31, 2006, all dollars are rounded to thousands (000)
| | | | | | | | | | | |
| Balanced Fund (continued) |
| DESCRIPTION | | PAR | | | VALUE | |
| |
| | | 7.000%, 04/01/2029, #323681 | | $ | 109 | | | $ | 113 | |
| | | 6.500%, 12/01/2031, #254169 (a) | | | 435 | | | | 443 | |
| | | 6.000%, 04/01/2032, #745101 (a) | | | 951 | | | | 969 | |
| | | 6.500%, 05/01/2032, #640032 | | | 774 | | | | 793 | |
| | | 7.000%, 07/01/2032, #545815 (a) | | | 197 | | | | 204 | |
| | | 6.000%, 09/01/2032, #254447 (a) | | | 378 | | | | 381 | |
| | | 6.000%, 01/01/2033, #676647 | | | 657 | | | | 662 | |
| | | 5.500%, 04/01/2033, #694605 | | | 1,045 | | | | 1,035 | |
| | | 5.500%, 06/01/2033, #843435 (a) | | | 467 | | | | 463 | |
| | | 5.500%, 07/01/2033, #728667 (a) | | | 550 | | | | 545 | |
| | | 5.500%, 08/01/2033, #733380 (a) | | | 1,177 | | | | 1,167 | |
| | | 5.000%, 10/01/2033, #741897 | | | 819 | | | | 793 | |
| | | 5.500%, 10/01/2033, #555800 (a) | | | 1,214 | | | | 1,203 | |
| | | 5.500%, 11/01/2033 (d) | | | 3,965 | | | | 3,918 | |
| | | 6.000%, 11/01/2033, #772130 | | | 220 | | | | 222 | |
| | | 6.000%, 11/01/2033, #772256 | | | 211 | | | | 213 | |
| | | 5.500%, 12/01/2033, #756202 | | | 722 | | | | 716 | |
| | | 5.000%, 03/01/2034, #725205 (a) | | | 917 | | | | 888 | |
| | | 5.000%, 03/01/2034, #725250 (a) | | | 817 | | | | 791 | |
| | | 5.500%, 04/01/2034, #725424 (a) | | | 440 | | | | 436 | |
| | | 5.500%, 05/01/2034, #357571 (a) | | | 797 | | | | 789 | |
| | | 5.000%, 06/01/2034, #782909 (a) | | | 395 | | | | 382 | |
| | | 6.500%, 06/01/2034, #735273 | | | 820 | | | | 840 | |
| | | 6.000%, 11/14/2035 (d) | | | 1,170 | | | | 1,177 | |
| | | 5.500%, 03/01/2036, #865972 (a) | | | 1,219 | | | | 1,205 | |
| | | 5.500%, 03/01/2036, #870157 (a) | | | 1,177 | | | | 1,163 | |
| | | 6.500%, 04/01/2036, #852909 (a) | | | 757 | | | | 771 | |
| | | 6.500%, 07/01/2036, #831683 | | | 655 | | | | 668 | |
| | | 6.000%, 08/01/2036, #885536 | | | 1,584 | | | | 1,594 | |
| | | 6.500%, 08/01/2036, #893318 | | | 604 | | | | 615 | |
| Government National Mortgage Association Pool | | | | | | | | |
| | | 6.500%, 10/20/2010, #002108 | | | 15 | | | | 16 | |
| | | 7.500%, 06/15/2027, #447728 | | | 9 | | | | 9 | |
| | | 7.500%, 09/15/2027, #455516 | | | 12 | | | | 13 | |
| | | 7.000%, 04/15/2029, #506639 | | | 166 | | | | 172 | |
| | | | | | | | | |
| | | | | | | | 38,393 | |
| | | | | | | | | |
Total U.S. Government Agency Mortgage-Backed Securities | | | | | | | | |
| | | (Cost $43,559) | | | | | | | 43,209 | |
| | | | | | | | | |
| Asset-Backed Securities – 6.6% |
| Automotive – 0.9% |
| Harley-Davidson Motorcycle Trust | | | | | | | | |
| | Series 2005-4, Class A2 | | | | | | | | |
| | | 4.850%, 06/15/2012 | | | 470 | | | | 468 | |
| Hertz Vehicle Financing | | | | | | | | |
| | Series 2005-2A, Class A6 | | | | | | | | |
| | | 5.080%, 11/25/2011 (e) | | | 935 | | | | 931 | |
| Triad Auto Receivables Owner Trust | | | | | | | | |
| | Series 2006-A, Class A3 | | | | | | | | |
| | | 4.770%, 01/12/2011 | | | 720 | | | | 717 | |
| Volkswagen Auto Loan Enhanced Trust | | | | | | | | |
| | Series 2005-1, Class A4 | | | | | | | | |
| | | 4.860%, 04/20/2012 | | | 1,170 | | | | 1,165 | |
| | | | | | | | | |
| | | | | | | | 3,281 | |
| | | | | | | | | |
| Commercial – 4.4% |
| Bank of America Commercial Mortgage | | | | | | | | |
| | Series 2004-5, Class A3 | | | | | | | | |
| | | 4.561%, 11/10/2041 | | | 710 | | | | 691 | |
| | Series 2006-2, Class A4 | | | | | | | | |
| | | 5.741%, 05/10/2045 | | | 340 | | | | 353 | |
| Bear Stearns Commercial Mortgage Securities | | | | | | | | |
| | Series 2005-PW10, Class A4 | | | | | | | | |
| | | 5.405%, 12/11/2040 (a) | | | 635 | | | | 640 | |
| Commercial Mortgage Pass-Through Certificates | | | | | | | | |
| | Series 2006-CN2A, Class A2FX | | | | | | | | |
| | | 5.449%, 02/05/2019 (e) | | $ | 585 | | | $ | 591 | |
| | Series 2005-LP5, Class A2 | | | | | | | | |
| | | 4.630%, 05/10/2043 | | | 925 | | | | 912 | |
| Deutsche Mortgage and Asset Receiving | | | | | | | | |
| | Series 1998-C1, Class A2 | | | | | | | | |
| | | 6.538%, 06/15/2031 | | | 346 | | | | 349 | |
| GE Capital Commercial Mortgage Corporation | | | | | | | | |
| | Series 2005-C3, Class A2 | | | | | | | | |
| | | 4.853%, 07/10/2045 | | | 725 | | | | 719 | |
| GMAC Commercial Mortgage Securities | | | | | | | | |
| | Series 2004-C2, Class A1 | | | | | | | | |
| | | 3.896%, 08/10/2038 | | | 540 | | | | 530 | |
| | Series 2005-C1, Class A2 | | | | | | | | |
| | | 4.471%, 05/10/2043 | | | 1,195 | | | | 1,173 | |
| Greenwich Capital Commercial Funding | | | | | | | | |
| | Series 2003-C1, Class A2 | | | | | | | | |
| | | 3.285%, 07/05/2035 | | | 1,761 | | | | 1,687 | |
| | Series 2005-GG5, Class A2 | | | | | | | | |
| | | 5.117%, 04/10/2037 | | | 1,600 | | | | 1,600 | |
| | Series 2005-GG5, Class A5 | | | | | | | | |
| | | 5.224%, 04/10/2037 | | | 750 | | | | 747 | |
| GS Mortgage Securities II | | | | | | | | |
| | Series 2006-GG8, Class A4 | | | | | | | | |
| | | 5.560%, 11/10/2039 | | | 1,965 | | | | 2,002 | |
| | Series 2006-RR2, Class A1 | | | | | | | | |
| | | 5.689%, 06/23/2046 (c) (e) | | | 985 | | | | 998 | |
| J.P. Morgan Chase Commercial Mortgage Securities | | | | | | | | |
| | Series 2005-LDP5, Class A4 | | | | | | | | |
| | | 5.179%, 12/15/2044 (c) | | | 540 | | | | 540 | |
| LB-UBS Commercial Mortgage Trust | | | | | | | | |
| | Series 2003-C3, Class A2 | | | | | | | | |
| | | 3.086%, 05/15/2027 | | | 1,280 | | | | 1,241 | |
| | Series 2005-C7, Class A2 | | | | | | | | |
| | | 5.103%, 11/15/2030 | | | 800 | | | | 799 | |
| Nomura Asset Securities | | | | | | | | |
| | Series 1998-D6, Class A1B | | | | | | | | |
| | | 6.590%, 03/15/2030 | | | 749 | | | | 760 | |
| | | | | | | | | |
| | | | | | | | 16,332 | |
| | | | | | | | | |
| Credit Cards – 0.5% |
| Citibank Credit Card Issuance Trust | | | | | | | | |
| | Series 2006-A4, Class A4 | | | | | | | | |
| | | 5.450%, 05/10/2013 | | | 805 | | | | 819 | |
| MBNA Credit Card Master Note Trust | | | | | | | | |
| | Series 2005-A1, Class A1 | | | | | | | | |
| | | 4.200%, 09/15/2010 | | | 1,130 | | | | 1,116 | |
| | | | | | | | | |
| | | | | | | | 1,935 | |
| | | | | | | | | |
| Home Equity – 0.0% |
| Saxon Asset Securities Trust | | | | | | | | |
| | Series 2004-1, Class A | | | | | | | | |
| | | 5.590%, 03/25/2035 (c) | | | 16 | | | | 16 | |
| | | | | | | | | |
| Other – 0.8% |
| Global Signal Trust | | | | | | | | |
| | Series 2004-2A, Class A | | | | | | | | |
| | | 4.232%, 12/15/2014 (e) | | | 750 | | | | 732 | |
| GRP/ AG Real Estate Asset Trust | | | | | | | | |
| | Series 2005-1, Class A | | | | | | | | |
| | | 4.850%, 01/25/2035 (e) | | | 74 | | | | 73 | |
The accompanying notes are an integral part of the financial statements.
106 First American Funds Annual Report 2006
| | | | | | | | | | | |
| Balanced Fund (continued) |
| DESCRIPTION | | PAR | | | VALUE | |
| |
| Small Business Administration | | | | | | | | |
| | Series 2006-P10A, Class 1 | | | | | | | | |
| | | 5.408%, 02/10/2016 | | $ | 1,079 | | | $ | 1,086 | |
| | Series 2006-P10B, Class 1 | | | | | | | | |
| | | 5.681%, 08/10/2016 | | | 1,145 | | | | 1,163 | |
| | | | | | | | | |
| | | | | | | | 3,054 | |
| | | | | | | | | |
Total Asset-Backed Securities | | | | | | | | |
| | | (Cost $24,619) | | | | | | | 24,618 | |
| | | | | | | | | |
| Corporate Bonds – 5.5% |
| Banking – 0.1% |
| J.P. Morgan Chase | | | | | | | | |
| | | 5.150%, 10/01/2015 | | | 160 | | | | 157 | |
| J.P. Morgan Chase Capital XX | | | | | | | | |
| | Series T | | | | | | | | |
| | | 6.550%, 09/29/2036 | | | 235 | | | | 243 | |
| | | | | | | | | |
| | | | | | | | 400 | |
| | | | | | | | | |
| Basic Industry – 0.8% |
| Celulosa Arauco y Constitucion | | | | | | | | |
| | | 5.625%, 04/20/2015 | | | 230 | | | | 226 | |
| Falconbridge | | | | | | | | |
| | | 7.350%, 06/05/2012 | | | 320 | | | | 345 | |
| FMG Finance | | | | | | | | |
| | | 10.000%, 09/01/2013 (a) (e) | | | 195 | | | | 189 | |
| Ineos Group Holdings | | | | | | | | |
| | | 8.500%, 02/15/2016 (a) (e) | | | 410 | | | | 395 | |
| LPG International | | | | | | | | |
| | | 7.250%, 12/20/2015 | | | 290 | | | | 288 | |
| Noble Group | | | | | | | | |
| | | 6.625%, 03/17/2015 (e) | | | 255 | | | | 230 | |
| Sino Forest | | | | | | | | |
| | | 9.125%, 08/17/2011 (e) | | | 195 | | | | 206 | |
| Southern Copper | | | | | | | | |
| | | 7.500%, 07/27/2035 (a) | | | 390 | | | | 417 | |
| Teck Cominco Limited | | | | | | | | |
| | | 6.125%, 10/01/2035 | | | 190 | | | | 185 | |
| Vale Overseas | | | | | | | | |
| | | 6.250%, 01/11/2016 | | | 175 | | | | 176 | |
| Vedanta Resources | | | | | | | | |
| | | 6.625%, 02/22/2010 (e) | | | 180 | | | | 177 | |
| | | | | | | | | |
| | | | | | | | 2,834 | |
| | | | | | | | | |
| Brokerage – 0.2% |
| Merrill Lynch | | | | | | | | |
| | | 6.050%, 05/16/2016 (a) | | | 465 | | | | 483 | |
| Morgan Stanley | | | | | | | | |
| | | 5.375%, 10/15/2015 (a) | | | 440 | | | | 437 | |
| | | | | | | | | |
| | | | | | | | 920 | |
| | | | | | | | | |
| Capital Goods – 0.3% |
| Chart Industries | | | | | | | | |
| | | 9.125%, 10/15/2015 (e) | | | 195 | | | | 204 | |
| Hutchison Whampoa International | | | | | | | | |
| | | 7.450%, 11/24/2033 (e) | | | 210 | | | | 242 | |
| Owens-Illinois | | | | | | | | |
| | | 8.100%, 05/15/2007 (a) | | | 325 | | | | 327 | |
| Siemens Financiering | | | | | | | | |
| | | 6.125%, 08/17/2026 (a) (e) | | | 225 | | | | 234 | |
| | | | | | | | | |
| | | | | | | | 1,007 | |
| | | | | | | | | |
| Communications – 0.8% |
| C & M Finance | | | | | | | | |
| | | 8.100%, 02/01/2016 (a) (e) | | | 180 | | | | 180 | |
| Comcast | | | | | | | | |
| | | 7.050%, 03/15/2033 (a) | | | 430 | | | | 466 | |
| Dex Media West | | | | | | | | |
| | | 9.875%, 08/15/2013 | | $ | 221 | | | $ | 240 | |
| Echostar DBS | | | | | | | | |
| | | 7.000%, 10/01/2013 (e) | | | 160 | | | | 159 | |
| Embarq | | | | | | | | |
| | | 7.995%, 06/01/2036 | | | 245 | | | | 260 | |
| Sprint Capital | | | | | | | | |
| | | 6.900%, 05/01/2019 | | | 400 | | | | 420 | |
| Telecom Italia Capital | | | | | | | | |
| | | 7.200%, 07/18/2036 | | | 235 | | | | 247 | |
| Time Warner Entertainment | | | | | | | | |
| | | 8.375%, 07/15/2033 | | | 435 | | | | 530 | |
| Verizon Global Funding | | | | | | | | |
| | | 7.750%, 12/01/2030 | | | 200 | | | | 234 | |
| Vimpelcom | | | | | | | | |
| | | 8.250%, 05/23/2016 (e) | | | 230 | | | | 238 | |
| | | | | | | | | |
| | | | | | | | 2,974 | |
| | | | | | | | | |
| Consumer Cyclical – 0.5% |
| Autonation | | | | | | | | |
| | | 7.000%, 04/15/2014 | | | 290 | | | | 289 | |
| DaimlerChrysler | | | | | | | | |
| | | 4.875%, 06/15/2010 | | | 130 | | | | 127 | |
| Duty Free International | | | | | | | | |
| | | 7.000%, 01/15/2004 (f) (g) | | | 588 | | | | 118 | |
| Ford Motor | | | | | | | | |
| | | 7.450%, 07/16/2031 (a) | | | 635 | | | | 498 | |
| Galaxy Entertainment | | | | | | | | |
| | | 9.875%, 12/15/2012 (e) | | | 175 | | | | 185 | |
| General Motors | | | | | | | | |
| | | 8.250%, 07/15/2023 | | | 230 | | | | 204 | |
| Lippo Karwaci Finance | | | | | | | | |
| | | 8.875%, 03/09/2011 | | | 175 | | | | 167 | |
| MGM Mirage | | | | | | | | |
| | | 6.625%, 07/15/2015 | | | 290 | | | | 274 | |
| | | | | | | | | |
| | | | | | | | 1,862 | |
| | | | | | | | | |
| Consumer Non Cyclical – 0.2% |
| Fisher Scientific International | | | | | | | | |
| | | 6.750%, 08/15/2014 | | | 220 | | | | 224 | |
| Kroger | | | | | | | | |
| | | 6.750%, 04/15/2012 | | | 350 | | | | 368 | |
| | | | | | | | | |
| | | | | | | | 592 | |
| | | | | | | | | |
| Electric – 0.6% |
| Edison Mission Energy | | | | | | | | |
| | | 7.500%, 06/15/2013 (e) | | | 175 | | | | 180 | |
| Florida Power & Light | | | | | | | | |
| | | 5.650%, 02/01/2037 (a) | | | 270 | | | | 270 | |
| National Grid | | | | | | | | |
| | | 6.300%, 08/01/2016 (a) | | | 230 | | | | 240 | |
| NRG Energy | | | | | | | | |
| | | 7.250%, 02/01/2014 | | | 310 | | | | 313 | |
| Ohio Power, Series K | | | | | | | | |
| | | 6.000%, 06/01/2016 (a) | | | 275 | | | | 284 | |
| Oncor Electric Delivery | | | | | | | | |
| | | 7.000%, 05/01/2032 | | | 225 | | | | 250 | |
| Pacific Gas & Electric | | | | | | | | |
| | | 6.050%, 03/01/2034 (a) | | | 230 | | | | 235 | |
| Taqa Abu Dhabi National | | | | | | | | |
| | | 6.500%, 10/27/2036 (a) (e) | | | 355 | | | | 371 | |
| | | | | | | | | |
| | | | | | | | 2,143 | |
| | | | | | | | | |
First American Funds Annual Report 2006 107
Schedule of Investments October 31, 2006, all dollars are rounded to thousands (000)
| | | | | | | | | | | |
| Balanced Fund (continued) |
| DESCRIPTION | | PAR | | | VALUE | |
| |
| Energy – 0.5% |
| Bluewater Finance | | | | | | | | |
| | | 10.250%, 02/15/2012 | | $ | 300 | | | $ | 306 | |
| Gazprom International | | | | | | | | |
| | | 7.201%, 02/01/2020 (e) | | | 225 | | | | 237 | |
| Nexen | | | | | | | | |
| | | 5.875%, 03/10/2035 | | | 270 | | | | 258 | |
| Petro-Canada | | | | | | | | |
| | | 5.350%, 07/15/2033 | | | 190 | | | | 169 | |
| Tengizcheveroil Finance | | | | | | | | |
| | | 6.124%, 11/15/2014 (e) | | | 370 | | | | 368 | |
| Tesoro | | | | | | | | |
| | | 6.625%, 11/01/2015 (e) | | | 375 | | | | 365 | |
| XTO Energy | | | | | | | | |
| | | 6.100%, 04/01/2036 (a) | | | 345 | | | | 345 | |
| | | | | | | | | |
| | | | | | | | 2,048 | |
| | | | | | | | | |
| Finance Companies – 0.1% |
| Capital One Financial | | | | | | | | |
| | | 6.150%, 09/01/2016 | | | 240 | | | | 247 | |
| Gazprombank | | | | | | | | |
| | | 6.500%, 09/23/2015 | | | 240 | | | | 237 | |
| | | | | | | | | |
| | | | | | | | 484 | |
| | | | | | | | | |
| Insurance – 0.5% |
| Liberty Mutual Group | | | | | | | | |
| | | 6.500%, 03/15/2035 (e) | | | 275 | | | | 272 | |
| Marsh & McLennan | | | | | | | | |
| | | 5.750%, 09/15/2015 | | | 605 | | | | 583 | |
| Unumprovident | | | | | | | | |
| | | 5.997%, 05/15/2008 | | | 335 | | | | 337 | |
| ZFS Finance USA Trust II | | | | | | | | |
| | | 6.450%, 12/15/2065 (c) (e) | | | 520 | | | | 519 | |
| | | | | | | | | |
| | | | | | | | 1,711 | |
| | | | | | | | | |
| Natural Gas – 0.1% |
| Enterprise Products | | | | | | | | |
| | | 8.375%, 08/01/2066 | | | 180 | | | | 193 | |
| Southern Union | | | | | | | | |
| | | 7.200%, 11/01/2066 (c) | | | 155 | | | | 157 | |
| | | | | | | | | |
| | | | | | | | 350 | |
| | | | | | | | | |
| Real Estate Investment Trust – 0.2% |
| Health Care Properties, Series MTN | | | | | | | | |
| | | 6.300%, 09/15/2016 | | | 380 | | | | 387 | |
| Prologis 2006 | | | | | | | | |
| | | 5.750%, 04/01/2016 (a) | | | 445 | | | | 446 | |
| | | | | | | | | |
| | | | | | | | 833 | |
| | | | | | | | | |
| Sovereigns – 0.2% |
| Russian Federation | | | | | | | | |
| | | 5.000% through 03/31/2007 thereafter | | | | | | | | |
| | | 7.500% 03/31/2030 (e) | | | 330 | | | | 369 | |
| United Mexican States | | | | | | | | |
| | | 5.625%, 01/15/2017 (a) | | | 305 | | | | 305 | |
| | | | | | | | | |
| | | | | | | | 674 | |
| | | | | | | | | |
| Technology – 0.4% |
| Avnet | | | | | | | | |
| | | 6.000%, 09/01/2015 | | | 350 | | | | 342 | |
| Chartered Semiconductor | | | | | | | | |
| | | 6.375%, 08/03/2015 | | | 250 | | | | 249 | |
| Ciena | | | | | | | | |
| | | 3.750%, 02/01/2008 | | | 120 | | | | 116 | |
| LG Electronics | | | | | | | | |
| | | 5.000%, 06/17/2010 (e) | | | 340 | | | | 332 | |
| NXP BV/ NXP Funding | | | | | | | | |
| | | 7.875%, 10/15/2014 (e) | | $ | 160 | | | $ | 162 | |
| Seagate Technology | | | | | | | | |
| | | 6.375%, 10/01/2011 | | | 335 | | | | 331 | |
| | | | | | | | | |
| | | | | | | | 1,532 | |
| | | | | | | | | |
| Transportation – 0.0% |
| Hertz | | | | | | | | |
| | | 8.875%, 01/01/2014 (e) | | | 175 | | | | 183 | |
| | | | | | | | | |
Total Corporate Bonds | | | | | | | | |
| | | (Cost $20,815) | | | | | | | 20,547 | |
| | | | | | | | | |
| Collateralized Mortgage Obligation – Private Mortgage-Backed Securities – 5.3% |
| Adjustable Rate (c) – 2.8% |
| Bank of America Mortgage Securities | | | | | | | | |
| | Series 2004-G, Class 2A3 | | | | | | | | |
| | | 4.232%, 08/25/2034 | | | 165 | | | | 165 | |
| Citigroup Mortgage Loan Trust | | | | | | | | |
| | Series 2005-7, Class 2A1A | | | | | | | | |
| | | 4.861%, 09/25/2035 | | | 770 | | | | 760 | |
| GMAC Mortgage Corporation Loan Trust | | | | | | | | |
| | Series 2003-AR2, Class 4A1 | | | | | | | | |
| | | 4.732%, 12/19/2033 | | | 806 | | | | 779 | |
| IMPAC CMB Trust | | | | | | | | |
| | Series 2003-12, Class A1 | | | | | | | | |
| | | 6.090%, 12/25/2033 | | | 193 | | | | 193 | |
| J.P. Morgan Trust | | | | | | | | |
| | Series 2004-A1, Class 3A1 | | | | | | | | |
| | | 4.974%, 02/25/2034 | | | 1,331 | | | | 1,303 | |
| Residential Funding Mortgage Securities I | | | | | | | | |
| | Series 2006-SA2, Class 4A1 | | | | | | | | |
| | | 5.881%, 08/25/2036 | | | 1,045 | | | | 1,040 | |
| Structured Mortgage Loan Trust | | | | | | | | |
| | Series 2004-11, Class A | | | | | | | | |
| | | 7.195%, 08/25/2034 | | | 91 | | | | 92 | |
| Wachovia Mortgage Loan Trust | | | | | | | | |
| | Series 2005-B, Class 1A1 | | | | | | | | |
| | | 4.957%, 10/20/2035 | | | 612 | | | | 612 | |
| Washington Mutual | | | | | | | | |
| | Series 2004-AR7, Class A6 | | | | | | | | |
| | | 3.941%, 07/25/2034 | | | 775 | | | | 753 | |
| Wells Fargo Mortgage Backed Securities Trust | | | | | | | | |
| | Series 2003-D, Class A1 | | | | | | | | |
| | | 4.798%, 02/25/2033 | | | 388 | | | | 386 | |
| | Series 2003-O, Class 5A1 | | | | | | | | |
| | | 4.803%, 01/25/2034 | | | 887 | | | | 867 | |
| | Series 2004-C, Class A1 | | | | | | | | |
| | | 4.938%, 04/25/2034 | | | 1,420 | | | | 1,379 | |
| | Series 2004-N, Class A3 | | | | | | | | |
| | | 4.101%, 08/25/2034 | | | 995 | | | | 985 | |
| | Series 2006-AR1, Class 2A2 | | | | | | | | |
| | | 5.563%, 03/25/2036 | | | 1,095 | | | | 1,085 | |
| | | | | | | | | |
| | | | | | | | 10,399 | |
| | | | | | | | | |
| Fixed Rate – 2.5% |
| ABN AMRO Mortgage | | | | | | | | |
| | Series 2003-7, Class A1 | | | | | | | | |
| | | 4.750%, 07/25/2018 | | | 841 | | | | 810 | |
| Bank of America Mortgage Securities | | | | | | | | |
| | Series 2003-6, Class 1A30 | | | | | | | | |
| | | 4.750%, 08/25/2033 | | | 585 | | | | 576 | |
The accompanying notes are an integral part of the financial statements.
108 First American Funds Annual Report 2006
| | | | | | | | | | | |
| Balanced Fund (continued) |
| DESCRIPTION | | PAR | | | VALUE | |
| |
| Countrywide Alternative Loan Trust | | | | | | | | |
| | Series 2004-12CB, Class 1A1 | | | | | | | | |
| | | 5.000%, 07/25/2019 | | $ | 491 | | | $ | 482 | |
| | Series 2004-2CB, Class 1A1 | | | | | | | | |
| | | 4.250%, 03/25/2034 | | | 406 | | | | 398 | |
| | Series 2004-24CB, Class 1A1 | | | | | | | | |
| | | 6.000%, 11/25/2034 | | | 387 | | | | 387 | |
| GMAC Mortgage Corporation Loan Trust | | | | | | | | |
| | Series 2004-J5, Class A7 | | | | | | | | |
| | | 6.500%, 01/25/2035 | | | 564 | | | | 571 | |
| GSR Mortgage Loan Trust | | | | | | | | |
| | Series 2004-10F, Class 3A1 | | | | | | | | |
| | | 5.500%, 08/25/2019 | | | 453 | | | | 453 | |
| Master Alternative Loans Trust | | | | | | | | |
| | Series 2005-2, Class 1A3 | | | | | | | | |
| | | 6.500%, 03/25/2035 | | | 346 | | | | 349 | |
| Master Asset Securitization Trust | | | | | | | | |
| | Series 2003-6, Class 3A1 | | | | | | | | |
| | | 5.000%, 07/25/2018 | | | 736 | | | | 728 | |
| Morgan Stanley Mortgage Loan Trust | | | | | | | | |
| | Series 2004-9, Class 1A | | | | | | | | |
| | | 6.206%, 11/25/2034 | | | 425 | | | | 428 | |
| Residential Asset Mortgage Products | | | | | | | | |
| | Series 2004-SL4, Class A3 | | | | | | | | |
| | | 6.500%, 07/25/2032 | | | 325 | | | | 331 | |
| Residential Funding Mortgage Securities I | | | | | | | | |
| | Series 2004-S9, Class 2A1 | | | | | | | | |
| | | 4.750%, 12/25/2019 | | | 908 | | | | 886 | |
| Washington Mutual | | | | | | | | |
| | Series 2004-CB1, Class 1A | | | | | | | | |
| | | 5.250%, 06/25/2019 | | | 723 | | | | 718 | |
| Wells Fargo Mortgage Backed Securities Trust | | | | | | | | |
| | Series 2003-14, Class A1 | | | | | | | | |
| | | 4.750%, 12/25/2018 | | | 592 | | | | 575 | |
| | Series 2004-7, Class 2A2 | | | | | | | | |
| | | 5.000%, 07/25/2019 | | | 1,559 | | | | 1,528 | |
| Westam Mortgage Financial | | | | | | | | |
| | Series 11, Class A | | | | | | | | |
| | | 6.360%, 08/26/2020 | | | 1 | | | | 1 | |
| | | | | | | | | |
| | | | | | | | 9,221 | |
| | | | | | | | | |
Total Collateralized Mortgage Obligation – Private Mortgage-Backed Securities | | | | | | | | |
| | | (Cost $19,739) | | | | | | | 19,620 | |
| | | | | | | | | |
| U.S. Government & Agency Securities – 4.9% |
| U.S. Agency Debentures – 0.6% |
| Federal National Mortgage Association | | | | | | | | |
| | | 6.125%, 03/15/2012 (a) | | | 280 | | | | 296 | |
| | | 5.250%, 08/01/2012 (a) | | | 1,745 | | | | 1,758 | |
| | | | | | | | | |
| | | | | | | | 2,054 | |
| | | | | | | | | |
| U.S. Treasuries – 4.3% |
| U.S. Treasury Bonds |
| | | 9.000%, 11/15/2018 (a) | | | 500 | | | | 695 | |
| | | 8.125%, 08/15/2021 (a) | | | 200 | | | | 270 | |
| | | 7.625%, 02/15/2025 (a) | | | 400 | | | | 535 | |
| | | 6.875%, 08/15/2025 (a) | | | 1,600 | | | | 2,004 | |
| | | 4.500%, 02/15/2036 (a) | | | 1,130 | | | | 1,091 | |
| U.S. Treasury Notes |
| | | 2.250%, 02/15/2007 (a) | | | 2,420 | | | | 2,400 | |
| | | 4.875%, 08/31/2008 (a) | | | 2,055 | | | | 2,060 | |
| | | | | | | | | | | |
| Balanced Fund (continued) |
| DESCRIPTION | | SHARES/PAR | | | VALUE | |
| |
| | | 4.625%, 08/31/2011 (a) | | | 4,105 | | | $ | 4,113 | |
| | | 2.500%, 07/15/2016 (a) | | | 2,877 | | | | 2,919 | |
| | | | | | | | | |
| | | | | | | | 16,087 | |
| | | | | | | | | |
Total U.S. Government & Agency Securities | | | | | | | | |
| | | (Cost $18,082) | | | | | | | 18,141 | |
| | | | | | | | | |
| Collateralized Mortgage Obligation – U.S. Government Agency Mortgage-Backed Securities – 1.1% |
| Fixed Rate – 1.1% |
| Federal Home Loan Mortgage Corporation | | | | | | | | |
| | Series 2763, Class TA | | | | | | | | |
| | | 4.000%, 03/15/2011 | | | 616 | | | | 603 | |
| | Series 85, Class C | | | | | | | | |
| | | 8.600%, 01/15/2021 | | | 88 | | | | 92 | |
| | Series 1136, Class H | | | | | | | | |
| | | 6.000%, 09/15/2021 | | | 66 | | | | 66 | |
| Federal National Mortgage Association | | | | | | | | |
| | Series 1996-21, Class PK | | | | | | | | |
| | | 6.000%, 02/25/2011 | | | 98 | | | | 98 | |
| | Series 1989-2, Class D | | | | | | | | |
| | | 8.800%, 01/25/2019 | | | 6 | | | | 6 | |
| | Series 1989-37, Class G | | | | | | | | |
| | | 8.000%, 07/25/2019 | | | 85 | | | | 91 | |
| | Series 1990-30, Class E | | | | | | | | |
| | | 6.500%, 03/25/2020 | | | 38 | | | | 39 | |
| | Series 1990-63, Class H | | | | | | | | |
| | | 9.500%, 06/25/2020 | | | 20 | | | | 22 | |
| | Series 1990-89, Class K | | | | | | | | |
| | | 6.500%, 07/25/2020 | | | 4 | | | | 4 | |
| | Series 1990-105, Class J | | | | | | | | |
| | | 6.500%, 09/25/2020 | | | 59 | | | | 61 | |
| | Series 2005-44, Class PC | | | | | | | | |
| | | 5.000%, 11/25/2027 (a) | | | 1,139 | | | | 1,126 | |
| | Series 2003-81, Class MB | | | | | | | | |
| | | 5.000%, 05/25/2029 (a) | | | 960 | | | | 950 | |
| | Series 2005-62, Class JE | | | | | | | | |
| | | 5.000%, 06/25/2035 (a) | | | 882 | | | | 871 | |
| Government National Mortgage Association | | | | | | | | |
| | Series 3, Class F | | | | | | | | |
| | | 6.500%, 06/17/2020 | | | 8 | | | | 8 | |
| | | | | | | | | |
Total Collateralized Mortgage Obligation – U.S. Government Agency Mortgage-Backed Securities | | | | | | | | |
| | | (Cost $4,046) | | | | | | | 4,037 | |
| | | | | | | | | |
| Short-Term Investments – 2.5% |
| Money Market Fund – 2.5% |
| First American Prime Obligations Fund, Class Z (h) | | | 9,329,815 | | | | 9,330 | |
| | | | | | | | | |
| U.S. Treasury Obligations – 0.0% |
| U.S. Treasury Bills | | | | | | | | |
| | | 4.810%, 12/07/2006 (i) | | | 30 | | | | 30 | |
| | | 4.940%, 03/01/2007 (i) | | | 100 | | | | 98 | |
| | | | | | | | | |
| | | | | | | | 128 | |
| | | | | | | | | |
Total Short-Term Investments | | | | | | | | |
| | | (Cost $9,458) | | | | | | | 9,458 | |
| | | | | | | | | |
First American Funds Annual Report 2006 109
Schedule of Investments October 31, 2006, all dollars are rounded to thousands (000)
| | | | | | | | | | |
| Balanced Fund (continued) |
| DESCRIPTION | | | | VALUE | |
| |
| Investments Purchased with Proceeds from Securities Lending (j) – 24.3% |
| | (Cost $90,141) | | | | | | $ | 90,141 | |
| | | | | | | | | |
Total Investments – 127.0% | | | | | | | | |
| | (Cost $436,706) | | | | | | | 471,106 | |
| | | | | | | | | |
Other Assets and Liabilities, Net – (27.0)% | | | | | | | (100,314 | ) |
| | | | | | | | | |
Total Net Assets – 100.0% | | | | | | $ | 370,792 | |
| | | | | | | | | |
| |
| (a) | This security or a portion of this security is out on loan at October 31, 2006. Total loaned securities had a market value of $87,912 at October 31, 2006. See note 2 in Notes to Financial Statements. |
| |
| (b) | Non-income producing security. |
| |
| (c) | Variable rate security – The rate shown is the rate in effect as of October 31, 2006. |
| |
| (d) | Security purchased on a when-issued basis. On October 31, 2006, the total cost of investments purchased on a when-issued basis was $5,067. See note 2 in Notes to Financial Statements. |
| |
| (e) | Security purchased within the terms of a private placement memorandum, exempt from registration under Rule 144A of the Securities Act of 1933, as amended, and may be sold only to dealers in that program or other “qualified institutional buyers.” These securities have been determined to be liquid under the guidelines established by the fund’s board of directors. As of October 31, 2006, the value of these investments was $9,322 or 2.5% of total net assets. See note 2 in Notes to Financial Statements. |
| |
| (f) | Security is fair valued and illiquid. As of October 31, 2006, the value of this investment was $118 or 0.0% of total net assets. See note 2 in Notes to Financial Statements. |
| |
| (g) | Security is in default at October 31, 2006. |
| |
| (h) | Investment in affiliated security. This money market fund is advised by FAF Advisors Inc., which also serves as advisor to this fund. See note 3 in Notes to Financial Statements. |
| |
| (i) | Security has been deposited as initial margin on open futures contracts. Yield shown is effective yield as of October 31, 2006. See note 2 in Notes to Financial Statements. |
| |
| (j) | The fund may loan securities in return for collateral in the form of cash, U.S. government securities, or other high grade debt obligations. The cash collateral is invested in money market funds and various short term, high quality debt obligations, such as repurchase agreements, commercial paper, and other corporate obligations. See note 2 in Notes to Financial Statements. |
ADR – American Depository Receipt
REIT – Real Estate Investment Trust
Schedule of Open Futures Contracts
| | | | | | | | | | | | | | | | | |
| | | Number of | | | | | | | |
| | | Contracts | | | Notional | | | | | Unrealized | |
| | | Purchased | | | Contract | | | Settlement | | | Appreciation/ | |
| Description | | (Sold) | | | Value | | | Month | | | (Depreciation) | |
| |
| U.S. Treasury 2 Year Note Futures | | | 108 | | | $ | 22,076 | | | | December 2006 | | | $ | 75 | |
| U.S. Treasury 5 Year Note Futures | | | 15 | | | | 1,583 | | | | December 2006 | | | | 9 | |
| U.S. Treasury 10 Year Note Futures | | | (77 | ) | | | (8,333 | ) | | | December 2006 | | | | (98 | ) |
| U.S. Treasury Long Bond Futures | | | 23 | | | | 2,591 | | | | December 2006 | | | | 6 | |
| S&P 500 Index Futures | | | 5 | | | | 1,729 | | | | December 2006 | | | | 73 | |
| | | | | | | | | | | | | | | | | |
| | | | | | | | | | | | | | | $ | 65 | |
| | | | | | | | | | | | | | | | | |
Interest Rate Swap Agreements
| | | | | | | | | | | | | | | | | | | | | | | |
| | | | | Pay/ | | | | | | | | | |
| | | Floating | | Receive | | | | | | | | | Unrealized | |
| | | Rate | | Floating | | | | | Expiration | | | Notional | | | Appreciation/ | |
| Counterparty | | Index | | Rate | | | Fixed Rate | | | Date | | | Amount | | | (Depreciation) | |
| |
| Citigroup | | 3-Month LIBOR | | | Receive | | | | 5.303% | | | | 10/26/2008 | | | $ | 17,000 | | | $ | (69 | ) |
| Citigroup | | 3-Month LIBOR | | | Pay | | | | 5.360% | | | | 10/26/2016 | | | | 4,000 | | | | 70 | |
| UBS | | 3-Month LIBOR | | | Receive | | | | 5.050% | | | | 09/27/2008 | | | | 3,000 | | | | 3 | |
| | | | | | | | | | | | | | | | | | | | | | | |
| | | | | | | | | | | | | | | | | | | | | $ | 4 | |
| | | | | | | | | | | | | | | | | | | | | | | |
The accompanying notes are an integral part of the financial statements.
110 First American Funds Annual Report 2006
Schedule of Investments October 31, 2006, all dollars are rounded to thousands (000)
| | | | | | | | | |
| Equity Income Fund | |
| DESCRIPTION | | SHARES | | | VALUE | |
| | |
| Common Stocks – 98.7% |
| Consumer Discretionary – 7.3% |
| Domino’s Pizza (a) | | | 252,169 | | | $ | 6,854 | |
| Gap | | | 743,214 | | | | 15,622 | |
| Harrah’s Entertainment | | | 311,080 | | | | 23,122 | |
| Mattel | | | 615,110 | | | | 13,920 | |
| McDonald’s | | | 525,325 | | | | 22,022 | |
| Time Warner (a) | | | 786,059 | | | | 15,729 | |
| | | | | | | |
| | | | | | | | 97,269 | |
| | | | | | | |
| Consumer Staples – 7.9% |
| Altria Group | | | 336,922 | | | | 27,402 | |
| Avon Products (a) | | | 222,726 | | | | 6,773 | |
| Coca-Cola | | | 287,969 | | | | 13,454 | |
| General Mills (a) | | | 300,087 | | | | 17,051 | |
| PepsiCo | | | 208,125 | | | | 13,203 | |
| Wal-Mart Stores | | | 567,136 | | | | 27,949 | |
| | | | | | | |
| | | | | | | | 105,832 | |
| | | | | | | |
| Energy – 12.0% |
| BP, ADR | | | 388,218 | | | | 26,049 | |
| ChevronTexaco | | | 357,297 | | | | 24,010 | |
| ConocoPhillips | | | 455,915 | | | | 27,464 | |
| Exxon Mobil | | | 775,808 | | | | 55,408 | |
| Halliburton | | | 407,193 | | | | 13,173 | |
| Williams | | | 564,572 | | | | 13,793 | |
| | | | | | | |
| | | | | | | | 159,897 | |
| | | | | | | |
| Financials – 23.5% |
| AllianceBernstein Holding | | | 379,959 | | | | 29,523 | |
| American International Group | | | 580,286 | | | | 38,978 | |
| AON | | | 472,463 | | | | 16,437 | |
| Apartment Investment & Management – REIT (a) | | | 313,525 | | | | 17,971 | |
| Bank of America (a) | | | 867,969 | | | | 46,757 | |
| Citigroup | | | 732,432 | | | | 36,739 | |
| Duke Realty – REIT | | | 176,842 | | | | 7,084 | |
| Goldman Sachs Group (a) | | | 82,795 | | | | 15,714 | |
| ICICI Bank, ADR | | | 520,270 | | | | 18,288 | |
| Merrill Lynch | | | 201,121 | | | | 17,582 | |
| Northern Trust | | | 156,946 | | | | 9,216 | |
| SLM | | | 282,871 | | | | 13,770 | |
| Wachovia | | | 525,106 | | | | 29,143 | |
| Wells Fargo | | | 436,149 | | | | 15,828 | |
| | | | | | | |
| | | | | | | | 313,030 | |
| | | | | | | |
| Healthcare – 11.8% |
| Abbott Laboratories (a) | | | 806,682 | | | | 38,325 | |
| Baxter International | | | 473,746 | | | | 21,778 | |
| Johnson & Johnson | | | 443,382 | | | | 29,884 | |
| Pfizer | | | 1,063,735 | | | | 28,349 | |
| Wyeth Pharmaceuticals | | | 759,702 | | | | 38,768 | |
| | | | | | | |
| | | | | | | | 157,104 | |
| | | | | | | |
| Industrials – 11.2% |
| 3M | | | 253,362 | | | | 19,975 | |
| Avery Dennison | | | 150,912 | | | | 9,528 | |
| Emerson Electric | | | 233,156 | | | | 19,678 | |
| General Dynamics | | | 192,346 | | | | 13,676 | |
| General Electric | | | 1,286,917 | | | | 45,184 | |
| Honeywell International (a) | | | 514,110 | | | | 21,654 | |
| United Parcel Service, Class B | | | 265,637 | | | | 20,016 | |
| | | | | | | |
| | | | | | | | 149,711 | |
| | | | | | | |
| Information Technology – 9.3% |
| Hewlett-Packard | | | 878,057 | | | | 34,016 | |
| Intel | | | 1,294,924 | | | | 27,634 | |
| Microsoft | | | 783,334 | | | | 22,489 | |
| Motorola (a) | | | 768,401 | | | | 17,719 | |
| | | | | | | | | | |
| Equity Income Fund (concluded) |
| DESCRIPTION | | SHARES/PAR | | | VALUE | |
| |
| QUALCOMM (a) | | | 331,326 | | | $ | 12,057 | |
| Texas Instruments | | | 329,845 | | | | 9,955 | |
| | | | | | | | | |
| | | | | | | | 123,870 | |
| | | | | | | | | |
| Materials – 3.4% |
| Dow Chemical | | | 208,450 | | | | 8,503 | |
| E.I. Du Pont de Nemours (a) | | | 466,652 | | | | 21,372 | |
| Praxair | | | 260,064 | | | | 15,669 | |
| | | | | | | | | |
| | | | | | | | 45,544 | |
| | | | | | | | | |
| Telecommunication Services – 8.8% |
| ALLTEL (a) | | | 192,991 | | | | 10,288 | |
| AT&T (a) | | | 850,232 | | | | 29,121 | |
| BellSouth | | | 503,634 | | | | 22,714 | |
| Verizon Communications (a) | | | 1,020,299 | | | | 37,751 | |
| Vodafone Group, ADR (a) | | | 499,120 | | | | 12,902 | |
| Windstream (a) | | | 361,216 | | | | 4,956 | |
| | | | | | | | | |
| | | | | | | | 117,732 | |
| | | | | | | | | |
| Utilities – 3.5% |
| Atmos Energy | | | 183,924 | | | | 5,652 | |
| Duke Energy | | | 531,490 | | | | 16,816 | |
| ITC Holdings | | | 23,490 | | | | 835 | |
| Xcel Energy (a) | | | 1,043,586 | | | | 23,032 | |
| | | | | | | | | |
| | | | | | | | 46,335 | |
| | | | | | | | | |
Total Common Stocks | | | | | | | | |
| | (Cost $959,482) | | | | | | | 1,316,324 | |
| | | | | | | | | |
| Convertible Corporate Bond – 0.4% |
Medarex
2.250%, 05/15/2011 | | | | | | | | |
| | (Cost $3,467) | | $ | 3,934 | | | | 4,623 | |
| | | | | | | | | |
| Short-Term Investment – 1.2% |
| First American Prime Obligations Fund, Class Z (b) | | | | | | | | |
| | (Cost $16,548) | | | 16,547,741 | | | | 16,548 | |
| | | | | | | | | |
| Investments Purchased with Proceeds from Securities Lending (c) – 5.9% |
| | (Cost $78,913) | | | | | | | 78,913 | |
| | | | | | | | | |
Total Investments – 106.2% | | | | | | | | |
| | (Cost $1,058,410) | | | | | | | 1,416,408 | |
| | | | | | | | | |
Other Assets and Liabilities, Net – (6.2)% | | | | | | | (83,042 | ) |
| | | | | | | | | |
Total Net Assets – 100.0% | | | | | | $ | 1,333,366 | |
| | | | | | | | | |
| |
| (a) | This security or a portion of this security is out on loan at October 31, 2006. Total loaned securities had a value of $76,371 at October 31, 2006. See note 2 in Notes to Financial Statements. |
| |
| (b) | Investment in affiliated security. This money market fund is advised by FAF Advisors, Inc., which also serves as advisor for this fund. See note 3 in Notes to Financial Statements. |
| |
| (c) | The fund may loan securities in return for collateral in the form of cash, U.S. Government securities, or other high grade debt obligations. The cash collateral is invested in various money market funds and short-term, high quality debt obligations, such as repurchase agreements, commercial paper, and other corporate obligations. See note 2 in Notes to Financial Statements. |
ADR – American Depository Receipt
REIT – Real Estate Investment Trust
First American Funds Annual Report 2006 111
Statements of Assets and Liabilities October 31, 2006, all dollars and shares are rounded to thousands (000), except per share data
| | | | | | | | | | | |
| | | Balanced | | | Equity | | | |
| | | Fund | | | Income Fund | | | |
| | | |
| Investments in unaffiliated securities, at cost | | $ | 337,235 | | | $ | 962,949 | | | |
| Investments in affiliated money market fund, at cost | | | 9,330 | | | | 16,548 | | | |
| Investments purchased with proceeds from securities lending, at cost (note 2) | | | 90,141 | | | | 78,913 | | | |
| | | |
ASSETS: | | | | | | | | | | |
| Investments in unaffiliated securities, at value* (note 2) | | $ | 371,635 | | | $ | 1,320,947 | | | |
| Investments in affiliated money market fund, at value (note 2) | | | 9,330 | | | | 16,548 | | | |
| Investments purchased with proceeds from securities lending, at value (note 2) | | | 90,141 | | | | 78,913 | | | |
| Receivable for dividends and interest | | | 1,114 | | | | 1,691 | | | |
| Receivable for investment securities sold | | | 4,810 | | | | — | | | |
| Receivable for capital shares sold | | | 198 | | | | 325 | | | |
| Receivable for variation margin | | | 9 | | | | — | | | |
| Receivable for swap agreements | | | 5 | | | | — | | | |
| Prepaid expenses and other assets | | | 41 | | | | 40 | | | |
| | | |
Total assets | | | 477,283 | | | | 1,418,464 | | | |
| | | |
LIABILITIES: | | | | | | | | | | |
| Bank overdraft | | | 313 | | | | — | | | |
| Payable for investment securities purchased | | | 5,845 | | | | 2,695 | | | |
| Payable for investment securities purchased on a when-issued basis | | | 5,067 | | | | — | | | |
| Payable upon return of securities loaned (note 2) | | | 90,141 | | | | 78,913 | | | |
| Payable for capital shares redeemed | | | 4,808 | | | | 2,357 | | | |
| Payable to affiliates (note 3) | | | 256 | | | | 1,026 | | | |
| Payable for distribution and shareholder servicing fees | | | 37 | | | | 63 | | | |
| Accrued expenses and other liabilities | | | 24 | | | | 44 | | | |
| | | |
Total liabilities | | | 106,491 | | | | 85,098 | | | |
| | | |
Net assets | | $ | 370,792 | | | $ | 1,333,366 | | | |
| | | |
COMPOSITION OF NET ASSETS: | | | | | | | | | | |
| Portfolio capital | | $ | 310,200 | | | $ | 859,120 | | | |
| Undistributed net investment income | | | 680 | | | | — | | | |
| Accumulated net realized gain on investments, futures contracts, and swap agreements | | | 25,443 | | | | 116,248 | | | |
| Net unrealized appreciation of investments | | | 34,400 | | | | 357,998 | | | |
| Net unrealized appreciation of futures contracts | | | 65 | | | | — | | | |
| Net unrealized appreciation of swap agreements | | | 4 | | | | — | | | |
| | | |
Net assets | | $ | 370,792 | | | $ | 1,333,366 | | | |
| | | |
| *Including securities loaned, at value | | $ | 87,912 | | | $ | 76,371 | | | |
| | | |
Class A: | | | | | | | | | | |
| Net assets | | $ | 106,565 | | | $ | 171,814 | | | |
| Shares issued and outstanding ($0.0001 par value – 2 billion authorized) | | | 8,684 | | | | 10,808 | | | |
| Net asset value and redemption price per share | | $ | 12.27 | | | $ | 15.90 | | | |
Maximum offering price per share (1) | | $ | 12.98 | | | $ | 16.83 | | | |
Class B: | | | | | | | | | | |
| Net assets | | $ | 13,809 | | | $ | 19,845 | | | |
| Shares issued and outstanding ($0.0001 par value – 2 billion authorized) | | | 1,134 | | | | 1,260 | | | |
Net asset value, offering price, and redemption price per share (2) | | $ | 12.18 | | | $ | 15.75 | | | |
Class C: | | | | | | | | | | |
| Net assets | | $ | 3,030 | | | $ | 11,225 | | | |
| Shares issued and outstanding ($0.0001 par value – 2 billion authorized) | | | 247 | | | | 711 | | | |
Net asset value, offering price and redemption price per share (2) | | $ | 12.25 | | | $ | 15.78 | | | |
Class R: | | | | | | | | | | |
| Net assets | | $ | 23 | | | $ | 511 | | | |
| Shares issued and outstanding ($0.0001 par value – 2 billion authorized) | | | 2 | | | | 32 | | | |
| Net asset value, offering price, and redemption price per share | | $ | 12.35 | | | $ | 15.88 | | | |
Class Y: | | | | | | | | | | |
| Net assets | | $ | 247,365 | | | $ | 1,129,971 | | | |
| Shares issued and outstanding ($0.0001 par value – 2 billion authorized) | | | 20,104 | | | | 70,603 | | | |
| Net asset value, offering price, and redemption price per share | | $ | 12.30 | | | $ | 16.00 | | | |
| | | |
| | |
| | (1) | The offering price is calculated by dividing the net asset value by 1 minus the maximum sales charge of 5.50% |
| |
| | (2) | Class B and C have a contingent deferred sales charge. For a description of this sales charge, see notes 1 and 3 in Notes to Financial Statements. |
The accompanying notes are an integral part of the financial statements.
112 First American Funds Annual Report 2006
Statements of Operations For the year ended October 31, 2006, all dollars are rounded to thousands (000)
| | | | | | | | | | | | | |
| | | Balanced | | | | Equity | | | | |
| | | Fund | | | | Income Fund | | | | |
| | | | | |
INVESTMENT INCOME: | | | | | | | | | | | | |
| Interest from unaffiliated securities | | $ | 6,057 | | | | $ | 177 | | | | |
| Dividends from affiliated money market fund | | | 410 | | | | | 529 | | | | |
| Dividends from unaffiliated securities | | | 3,890 | | | | | 33,715 | | | | |
| Less: Foreign taxes withheld | | | (8 | ) | | | | (15 | ) | | | |
| Securities lending income | | | 199 | | | | | 208 | | | | |
| | | | | |
Total investment income | | | 10,548 | | | | | 34,614 | | | | |
| | | | | |
EXPENSES (note 3): | | | | | | | | | | | | |
| Investment advisory fees | | | 2,475 | | | | | 8,714 | | | | |
| Administration fees | | | 645 | | | | | 2,131 | | | | |
| Transfer agent fees | | | 425 | | | | | 1,311 | | | | |
| Custodian fees | | | 20 | | | | | 69 | | | | |
| Professional fees | | | 38 | | | | | 29 | | | | |
| Registration fees | | | 51 | | | | | 50 | | | | |
| Postage and printing fees | | | 33 | | | | | 89 | | | | |
| Directors’ fees | | | 17 | | | | | 27 | | | | |
| Other expenses | | | 22 | | | | | 26 | | | | |
| Distribution and shareholder servicing fees – Class A | | | 276 | | | | | 426 | | | | |
| Distribution and shareholder servicing fees – Class B | | | 163 | | | | | 203 | | | | |
| Distribution and shareholder servicing fees – Class C | | | 41 | | | | | 132 | | | | |
| Distribution and shareholder servicing fees – Class R | | | — | (1) | | | | 3 | | | | |
| | | | | |
Total expenses | | | 4,206 | | | | | 13,210 | | | | |
| | | | | |
| Less: Fee waivers (note 3) | | | (478 | ) | | | | (1 | ) | | | |
| Less: Indirect payments from custodian (note 3) | | | (6 | ) | | | | (2 | ) | | | |
| | | | | |
Total net expenses | | | 3,722 | | | | | 13,207 | | | | |
| | | | | |
Investment income – net | | | 6,826 | | | | | 21,407 | | | | |
| | | | | |
REALIZED AND UNREALIZED GAINS (LOSSES) ON INVESTMENTS,FUTURES CONTRACTS, AND SWAP AGREEMENTS – NET (note 5): | | | | | | | | | | | | |
| Net realized gain on investments | | | 26,905 | | | | | 141,083 | | | | |
| Net realized gain on futures contracts | | | 115 | | | | | — | | | | |
| Net realized gain on swap agreements | | | 128 | | | | | — | | | | |
| Net change in unrealized appreciation or depreciation of investments | | | 5,427 | | | | | 68,753 | | | | |
| Net change in unrealized appreciation or depreciation of futures contracts | | | (32 | ) | | | | — | | | | |
| Net change in unrealized appreciation or depreciation of swap agreements | | | 43 | | | | | — | | | | |
| | | | | |
Net gain on investments, futures contracts, and swap agreements | | | 32,586 | | | | | 209,836 | | | | |
| | | | | |
Net increase in net assets resulting from operations | | $ | 39,412 | | | | $ | 231,243 | | | | |
| | | | | |
| | |
| | (1) | Due to the presentation of the financial statements in thousands, the numbers round to zero. |
First American Funds Annual Report 2006 113
Statements of Changes in Net Assets all dollars are rounded to thousands (000)
| | | | | | | | | | | | | | | | | | | | | | | | | | | | | |
| | | Balanced | | | | Equity | | | |
| | | Fund | | | | Income Fund | | | |
| | | | | | | | |
| | | One-Month | | | | | | | | One-Month | | | | | |
| | | Fiscal Period | | | | | | | | Fiscal Period | | | | | |
| | | Year Ended | | | Ended | | | Year Ended | | | | Year Ended | | | Ended | | | Year Ended | | | |
| | | 10/31/06 | | | 10/31/05 | | | 9/30/05 | | | | 10/31/06 | | | 10/31/05 | | | 9/30/05 | | | |
| | | | | | | |
| | | |
OPERATIONS: | | | | | | | | | | | | | | | | | | | | | | | | | | | |
| Investment income – net | | $ | 6,826 | | | $ | 340 | | | $ | 6,143 | | | | $ | 21,407 | | | $ | 1,043 | | | $ | 27,470 | | | |
| Net realized gain (loss) on investments | | | 26,905 | | | | (634 | ) | | | 44,140 | | | | | 141,083 | | | | (1,938 | ) | | | 43,644 | | | |
| Net realized gain on in-kind distribution | | | — | | | | — | | | | — | | | | | — | | | | — | | | | 45,141 | | | |
| Net realized gain (loss) on futures contracts | | | 115 | | | | 2 | | | | (21 | ) | | | | — | | | | — | | | | — | | | |
| Net realized gain on swap agreements | | | 128 | | | | — | | | | 47 | | | | | — | | | | — | | | | — | | | |
| Net realized gain on written options | | | — | | | | — | | | | 132 | | | | | — | | | | — | | | | — | | | |
| Net change in unrealized appreciation or depreciation of investments | | | 5,427 | | | | (5,144 | ) | | | 7,744 | | | | | 68,753 | | | | (20,424 | ) | | | 50,906 | | | |
| Net change in unrealized appreciation or depreciation of futures contracts | | | (32 | ) | | | 51 | | | | 158 | | | | | — | | | | — | | | | — | | | |
| Net change in unrealized appreciation or depreciation of swap agreements | | | 43 | | | | (37 | ) | | | (2 | ) | | | | — | | | | — | | | | — | | | |
| | | | | | |
| Net increase (decrease) in net assets resulting from operations | | | 39,412 | | | | (5,422 | ) | | | 58,341 | | | | | 231,243 | | | | (21,319 | ) | | | 167,161 | | | |
| | | | | | |
DISTRIBUTIONS TO SHAREHOLDERS FROM: | | | | | | | | | | | | | | | | | | | | | | | | | | | |
| Investment income – net: | | | | | | | | | | | | | | | | | | | | | | | | | | | |
| | Class A | | | (1,852 | ) | | | — | | | | (1,628 | ) | | | | (2,470 | ) | | | (89 | ) | | | (3,048 | ) | | |
| | Class B | | | (146 | ) | | | — | | | | (148 | ) | | | | (183 | ) | | | — | | | | (222 | ) | | |
| | Class C | | | (23 | ) | | | — | | | | (37 | ) | | | | (119 | ) | | | — | | | | (176 | ) | | |
| | Class R | | | — | (1) | | | — | | | | — | | | | | (6 | ) | | | — | | | | (2 | ) | | |
| | Class Y | | | (4,891 | ) | | | — | | | | (4,412 | ) | | | | (19,051 | ) | | | (829 | ) | | | (25,969 | ) | | |
| Net realized gain on investments: | | | | | | | | | | | | | | | | | | | | | | | | | | | |
| | Class A | | | — | | | | — | | | | — | | | | | (975 | ) | | | — | | | | (160 | ) | | |
| | Class B | | | — | | | | — | | | | — | | | | | (119 | ) | | | — | | | | (21 | ) | | |
| | Class C | | | — | | | | — | | | | — | | | | | (83 | ) | | | — | | | | (17 | ) | | |
| | Class R | | | — | | | | — | | | | — | | | | | (2 | ) | | | — | | | | — | | | |
| | Class Y | | | — | | | | — | | | | — | | | | | (6,504 | ) | | | — | | | | (1,245 | ) | | |
| | | | | | |
| Total distributions | | | (6,912 | ) | | | — | | | | (6,225 | ) | | | | (29,512 | ) | | | (918 | ) | | | (30,860 | ) | | |
| | | | | | |
CAPITAL SHARE TRANSACTIONS (note 4): | | | | | | | | | | | | | | | | | | | | | | | | | | | |
| Class A: | | | | | | | | | | | | | | | | | | | | | | | | | | | |
| | Proceeds from sales | | | 10,315 | | | | 1,355 | | | | 13,247 | | | | | 12,754 | | | | 862 | | | | 21,141 | | | |
| | Reinvestment of distributions | | | 1,798 | | | | — | | | | 1,585 | | | | | 3,190 | | | | 82 | | | | 2,988 | | | |
| | Payments for redemptions | | | (27,468 | ) | | | (1,628 | ) | | | (34,236 | ) | | | | (41,866 | ) | | | (3,060 | ) | | | (47,176 | ) | | |
| | | | | | |
| Decrease in net assets from Class A transactions | | | (15,355 | ) | | | (273 | ) | | | (19,404 | ) | | | | (25,922 | ) | | | (2,116 | ) | | | (23,047 | ) | | |
| | | | | | |
| Class B: | | | | | | | | | | | | | | | | | | | | | | | | | | | |
| | Proceeds from sales | | | 406 | | | | 40 | | | | 1,081 | | | | | 971 | | | | 70 | | | | 1,913 | | | |
| | Reinvestment of distributions | | | 138 | | | | — | | | | 142 | | | | | 285 | | | | — | | | | 229 | | | |
| | Payments for redemptions (note 3) | | | (7,579 | ) | | | (1,003 | ) | | | (11,765 | ) | | | | (5,425 | ) | | | (367 | ) | | | (6,332 | ) | | |
| | | | | | |
| Decrease in net assets from Class B transactions | | | (7,035 | ) | | | (963 | ) | | | (10,542 | ) | | | | (4,169 | ) | | | (297 | ) | | | (4,190 | ) | | |
| | | | | | |
| Class C: | | | | | | | | | | | | | | | | | | | | | | | | | | | |
| | Proceeds from sales | | | 518 | | | | 29 | | | | 860 | | | | | 918 | | | | 107 | | | | 1,226 | | | |
| | Reinvestment of distributions | | | 23 | | | | — | | | | 36 | | | | | 199 | | | | — | | | | 192 | | | |
| | Payments for redemptions (note 3) | | | (2,678 | ) | | | (685 | ) | | | (1,977 | ) | | | | (7,112 | ) | | | (663 | ) | | | (6,129 | ) | | |
| | | | | | |
| Decrease in net assets from Class C transactions | | | (2,137 | ) | | | (656 | ) | | | (1,081 | ) | | | | (5,995 | ) | | | (556 | ) | | | (4,711 | ) | | |
| | | | | | |
| Class R: | | | | | | | | | | | | | | | | | | | | | | | | | | | |
| | Proceeds from sales | | | 31 | | | | — | | | | — | | | | | 113 | | | | 9 | | | | 422 | | | |
| | Reinvestment of distributions | | | — | (1) | | | — | | | | — | | | | | 8 | | | | — | | | | 2 | | | |
| | Payments for redemptions | | | (11 | ) | | | — | | | | — | | | | | (100 | ) | | | (1 | ) | | | (25 | ) | | |
| | | | | | |
| Increase in net assets from Class R transactions | | | 20 | | | | — | | | | — | | | | | 21 | | | | 8 | | | | 399 | | | |
| | | | | | |
| Class Y: | | | | | | | | | | | | | | | | | | | | | | | | | | | |
| | Proceeds from sales | | | 39,369 | | | | 2,780 | | | | 38,526 | | | | | 79,417 | | | | 4,504 | | | | 172,670 | | | |
| | Reinvestment of distributions | | | 4,616 | | | | — | | | | 4,180 | | | | | 9,238 | | | | 233 | | | | 9,228 | | | |
| | Payments for redemptions | | | (72,474 | ) | | | (7,309 | ) | | | (96,953 | ) | | | | (298,954 | ) | | | (23,083 | ) | | | (497,089 | ) | | |
| | | | | | |
| Decrease in net assets from Class Y transactions | | | (28,489 | ) | | | (4,529 | ) | | | (54,247 | ) | | | | (210,299 | ) | | | (18,346 | ) | | | (315,191 | ) | | |
| | | | | | |
| Decrease in net assets from capital share transactions | | | (52,996 | ) | | | (6,421 | ) | | | (85,274 | ) | | | | (246,364 | ) | | | (21,307 | ) | | | (346,740 | ) | | |
| | | | | | |
| Total decrease in net assets | | | (20,496 | ) | | | (11,843 | ) | | | (33,158 | ) | | | | (44,633 | ) | | | (43,544 | ) | | | (210,439 | ) | | |
Net assets at beginning of period | | | 391,288 | | | | 403,131 | | | | 436,289 | | | | | 1,377,999 | | | | 1,421,543 | | | | 1,631,982 | | | |
| | | | | | |
Net assets at end of period | | $ | 370,792 | | | $ | 391,288 | | | $ | 403,131 | | | | $ | 1,333,366 | | | $ | 1,377,999 | | | $ | 1,421,543 | | | |
| | | | | | |
Undistributed (distributions in excess of) net investment income at end of period | | $ | 680 | | | $ | 634 | | | $ | 270 | | | | $ | — | | | $ | 124 | | | $ | (1 | ) | | |
| | | | | | |
| | |
| | (1) | Due to the presentation of the financial statements in thousands, the number rounds to zero. |
The accompanying notes are an integral part of the financial statements.
114 First American Funds Annual Report 2006
(This page intentionally left blank.)
Financial Highlights For a share outstanding throughout the indicated periods.
| | | | | | | | | | | | | | | | | | | | | | | | | | | | | |
| | | | | | | | | Realized and | | | | | | | | | | |
| | | Net Asset | | | | | | | Unrealized | | | | Distributions | | | | Net Asset | | | | |
| | | Value | | | | Net | | | | Gains | | | | from Net | | | | Value | | | | |
| | | Beginning | | | | Investment | | | | (Losses) on | | | | Investment | | | | End of | | | | |
| | | of Period | | | | Income | | | | Investments | | | | Income | | | | Period | | | | |
| | | | | | | | | | | | | | | | | | | | |
Balanced Fund | | | | | | | | | | | | | | | | | | | | | | | | | | | |
| Class A | | | | | | | | | | | | | | | | | | | | | | | | | | | |
| | 2006 (1)(2) | | $ | 11.27 | | | | $ | 0.20 | | | | $ | 1.00 | | | | $ | (0.20 | ) | | | $ | 12.27 | | | | |
| | 2005 (2)(3) | | | 11.43 | | | | | 0.01 | | | | | (0.17 | ) | | | | — | | | | | 11.27 | | | | |
| | 2005 (2)(4) | | | 10.12 | | | | | 0.15 | | | | | 1.31 | | | | | (0.15 | ) | | | | 11.43 | | | | |
| | 2004 (2)(4) | | | 9.47 | | | | | 0.13 | | | | | 0.66 | | | | | (0.14 | ) | | | | 10.12 | | | | |
| | 2003 (4) | | | 8.38 | | | | | 0.17 | | | | | 1.08 | | | | | (0.16 | ) | | | | 9.47 | | | | |
| | 2002 (2)(4) | | | 9.50 | | | | | 0.20 | | | | | (1.12 | ) | | | | (0.20 | ) | | | | 8.38 | | | | |
| Class B | | | | | | | | | | | | | | | | | | | | | | | | | | | |
| | 2006 (1)(2) | | $ | 11.18 | | | | $ | 0.11 | | | | $ | 1.00 | | | | $ | (0.11 | ) | | | $ | 12.18 | | | | |
| | 2005 (2)(3) | | | 11.34 | | | | | — | | | | | (0.16 | ) | | | | — | | | | | 11.18 | | | | |
| | 2005 (2)(4) | | | 10.04 | | | | | 0.07 | | | | | 1.30 | | | | | (0.07 | ) | | | | 11.34 | | | | |
| | 2004 (2)(4) | | | 9.41 | | | | | 0.05 | | | | | 0.65 | | | | | (0.07 | ) | | | | 10.04 | | | | |
| | 2003 (4) | | | 8.32 | | | | | 0.10 | | | | | 1.08 | | | | | (0.09 | ) | | | | 9.41 | | | | |
| | 2002 (2)(4) | | | 9.44 | | | | | 0.13 | | | | | (1.12 | ) | | | | (0.13 | ) | | | | 8.32 | | | | |
| Class C | | | | | | | | | | | | | | | | | | | | | | | | | | | |
| | 2006 (1)(2) | | $ | 11.22 | | | | $ | 0.11 | | | | $ | 0.99 | | | | $ | (0.07 | ) | | | $ | 12.25 | | | | |
| | 2005 (2)(3) | | | 11.38 | | | | | — | | | | | (0.16 | ) | | | | — | | | | | 11.22 | | | | |
| | 2005 (2)(4) | | | 10.08 | | | | | 0.07 | | | | | 1.30 | | | | | (0.07 | ) | | | | 11.38 | | | | |
| | 2004 (2)(4) | | | 9.44 | | | | | 0.05 | | | | | 0.66 | | | | | (0.07 | ) | | | | 10.08 | | | | |
| | 2003 (4) | | | 8.35 | | | | | 0.09 | | | | | 1.10 | | | | | (0.10 | ) | | | | 9.44 | | | | |
| | 2002 (2)(4) | | | 9.49 | | | | | 0.13 | | | | | (1.14 | ) | | | | (0.13 | ) | | | | 8.35 | | | | |
| Class R (5) | | | | | | | | | | | | | | | | | | | | | | | | | | | |
| | 2006 (1)(2) | | $ | 11.29 | | | | $ | 0.17 | | | | $ | 1.01 | | | | $ | (0.12 | ) | | | $ | 12.35 | | | | |
| | 2005 (2)(3) | | | 11.45 | | | | | 0.01 | | | | | (0.17 | ) | | | | — | | | | | 11.29 | | | | |
| | 2005 (2)(4) | | | 10.14 | | | | | 0.11 | | | | | 1.32 | | | | | (0.12 | ) | | | | 11.45 | | | | |
| | 2004 (2)(4) | | | 9.49 | | | | | 0.14 | | | | | 0.64 | | | | | (0.13 | ) | | | | 10.14 | | | | |
| | 2003 (4) | | | 8.39 | | | | | 0.15 | | | | | 1.10 | | | | | (0.15 | ) | | | | 9.49 | | | | |
| | 2002 (2)(4) | | | 9.50 | | | | | 0.20 | | | | | (1.12 | ) | | | | (0.19 | ) | | | | 8.39 | | | | |
| Class Y | | | | | | | | | | | | | | | | | | | | | | | | | | | |
| | 2006 (1)(2) | | $ | 11.31 | | | | $ | 0.23 | | | | $ | 0.99 | | | | $ | (0.23 | ) | | | $ | 12.30 | | | | |
| | 2005 (2)(3) | | | 11.46 | | | | | 0.01 | | | | | (0.16 | ) | | | | — | | | | | 11.31 | | | | |
| | 2005 (2)(4) | | | 10.15 | | | | | 0.17 | | | | | 1.32 | | | | | (0.18 | ) | | | | 11.46 | | | | |
| | 2004 (2)(4) | | | 9.50 | | | | | 0.16 | | | | | 0.66 | | | | | (0.17 | ) | | | | 10.15 | | | | |
| | 2003 (4) | | | 8.40 | | | | | 0.19 | | | | | 1.09 | | | | | (0.18 | ) | | | | 9.50 | | | | |
| | 2002 (2)(4) | | | 9.53 | | | | | 0.23 | | | | | (1.13 | ) | | | | (0.23 | ) | | | | 8.40 | | | | |
| | | | | | | | | | | | | | | | | | | | | | | | |
| | |
| | (1) | For the period November 1 to October 31 in the year indicated. |
| |
| | (2) | Per share data calculated using average shares outstanding method. |
| |
| | (3) | For the period October 1, 2005 to October 31, 2005. Effective October 1, 2005, the fund’s fiscal year end was changed from September 30 to October 31. All ratios for the period have been annualized, except total return and portfolio turnover. |
| |
| | (4) | For the period October 1 to September 30 in year indicated. |
| |
| | (5) | Prior to July 1, 2004, Class R shares were named Class S shares, which had lower fees and expenses. |
| |
| | (6) | Total return does not include sales charges. Total return would have been lower had certain expenses not been waived. |
The accompanying notes are an integral part of the financial statements.
116 First American Funds Annual Report 2006
| | | | | | | | | | | | | | | | | | | | | | | | | | | | | | | | | | | | | |
| | | | | | | | | | | | | | | | | | Ratio of Net | | | | | | |
| | | | | | | | | | | | | | | Ratio of | | | | Investment | | | | | | |
| | | | | | | | | | | | Ratio of Net | | | | Expenses to | | | | Income to | | | | | | |
| | | | | | | | | Ratio of | | | | Investment | | | | Average | | | | Average | | | | | | |
| | | | | | Net Assets | | | | Expenses to | | | | Income | | | | Net Assets | | | | Net Assets | | | | Portfolio | | | |
| | | Total | | | | End of | | | | Average | | | | to Average | | | | (Excluding | | | | (Excluding | | | | Turnover | | | |
| | | Return (6) | | | | Period (000) | | | | Net Assets | | | | Net Assets | | | | Waivers) | | | | Waivers) | | | | Rate | | | |
| | | | | | | | | | | | | | | | | | | | | | | | | | | |
| | | | 10.73 | % | | | $ | 106,565 | | | | | 1.10 | % | | | | 1.67 | % | | | | 1.23 | % | | | | 1.54 | % | | | | 143 | % | | |
| | | | (1.40 | ) | | | | 112,557 | | | | | 1.10 | | | | | 0.90 | | | | | 1.21 | | | | | 0.79 | | | | | 12 | | | |
| | | | 14.51 | | | | | 114,388 | | | | | 1.06 | | | | | 1.35 | | | | | 1.21 | | | | | 1.20 | | | | | 147 | | | |
| | | | 8.39 | | | | | 119,292 | | | | | 1.05 | | | | | 1.27 | | | | | 1.19 | | | | | 1.13 | | | | | 110 | | | |
| | | | 14.98 | | | | | 98,016 | | | | | 1.05 | | | | | 1.75 | | | | | 1.23 | | | | | 1.57 | | | | | 156 | | | |
| | | | (9.90 | ) | | | | 98,557 | | | | | 1.05 | | | | | 2.07 | | | | | 1.23 | | | | | 1.89 | | | | | 79 | | | |
| | | | 9.93 | % | | | $ | 13,809 | | | | | 1.85 | % | | | | 0.92 | % | | | | 1.98 | % | | | | 0.79 | % | | | | 143 | % | | |
| | | | (1.41 | ) | | | | 19,409 | | | | | 1.85 | | | | | 0.15 | | | | | 1.96 | | | | | 0.04 | | | | | 12 | | | |
| | | | 13.64 | | | | | 20,657 | | | | | 1.81 | | | | | 0.60 | | | | | 1.96 | | | | | 0.45 | | | | | 147 | | | |
| | | | 7.46 | | | | | 28,101 | | | | | 1.80 | | | | | 0.54 | | | | | 1.94 | | | | | 0.40 | | | | | 110 | | | |
| | | | 14.25 | | | | | 33,015 | | | | | 1.80 | | | | | 1.00 | | | | | 1.98 | | | | | 0.82 | | | | | 156 | | | |
| | | | (10.64 | ) | | | | 35,641 | | | | | 1.80 | | | | | 1.32 | | | | | 1.98 | | | | | 1.14 | | | | | 79 | | | |
| | | | 9.86 | % | | | $ | 3,030 | | | | | 1.85 | % | | | | 0.92 | % | | | | 1.98 | % | | | | 0.79 | % | | | | 143 | % | | |
| | | | (1.41 | ) | | | | 4,787 | | | | | 1.85 | | | | | 0.15 | | | | | 1.96 | | | | | 0.04 | | | | | 12 | | | |
| | | | 13.61 | | | | | 5,528 | | | | | 1.81 | | | | | 0.60 | | | | | 1.96 | | | | | 0.45 | | | | | 147 | | | |
| | | | 7.53 | | | | | 5,890 | | | | | 1.80 | | | | | 0.55 | | | | | 1.94 | | | | | 0.41 | | | | | 110 | | | |
| | | | 14.24 | | | | | 7,089 | | | | | 1.80 | | | | | 0.99 | | | | | 1.98 | | | | | 0.81 | | | | | 156 | | | |
| | | | (10.77 | ) | | | | 2,233 | | | | | 1.80 | | | | | 1.32 | | | | | 1.98 | | | | | 1.14 | | | | | 79 | | | |
| | | | 10.49 | % | | | $ | 23 | | | | | 1.35 | % | | | | 1.38 | % | | | | 1.61 | % | | | | 1.12 | % | | | | 143 | % | | |
| | | | (1.40 | ) | | | | 1 | | | | | 1.35 | | | | | 0.65 | | | | | 1.61 | | | | | 0.39 | | | | | 12 | | | |
| | | | 14.16 | | | | | 1 | | | | | 1.31 | | | | | 1.06 | | | | | 1.61 | | | | | 0.76 | | | | | 147 | | | |
| | | | 8.22 | | | | | 1 | | | | | 1.05 | | | | | 1.39 | | | | | 1.19 | | | | | 1.25 | | | | | 110 | | | |
| | | | 15.08 | | | | | 23,844 | | | | | 1.05 | | | | | 1.76 | | | | | 1.23 | | | | | 1.58 | | | | | 156 | | | |
| | | | (9.90 | ) | | | | 36,194 | | | | | 1.05 | | | | | 2.07 | | | | | 1.23 | | | | | 1.89 | | | | | 79 | | | |
| | | | 10.92 | % | | | $ | 247,365 | | | | | 0.85 | % | | | �� | 1.92 | % | | | | 0.98 | % | | | | 1.79 | % | | | | 143 | % | | |
| | | | (1.31 | ) | | | | 254,534 | | | | | 0.85 | | | | | 1.15 | | | | | 0.96 | | | | | 1.04 | | | | | 12 | | | |
| | | | 14.76 | | | | | 262,557 | | | | | 0.81 | | | | | 1.60 | | | | | 0.96 | | | | | 1.45 | | | | | 147 | | | |
| | | | 8.62 | | | | | 283,005 | | | | | 0.80 | | | | | 1.55 | | | | | 0.94 | | | | | 1.41 | | | | | 110 | | | |
| | | | 15.35 | | | | | 363,157 | | | | | 0.80 | | | | | 2.00 | | | | | 0.98 | | | | | 1.82 | | | | | 156 | | | |
| | | | (9.74 | ) | | | | 290,288 | | | | | 0.80 | | | | | 2.32 | | | | | 0.98 | | | | | 2.14 | | | | | 79 | | | |
| | | | | | | | | | | | | | | | | | | | | | | | | | | | | | | | | |
First American Funds Annual Report 2006 117
Financial Highlights For a share outstanding throughout the indicated periods
| | | | | | | | | | | | | | | | | | | | | | | | | | | | | | | | | | |
| | | | | | | | | Realized and | | | | | | | | | | | | | |
| | | Net Asset | | | | | | | Unrealized | | | | Distributions | | | | Distributions | | | | Net Asset | | | | |
| | | Value | | | | Net | | | | Gains | | | | from Net | | | | from Net | | | | Value | | | | |
| | | Beginning | | | | Investment | | | | (Losses) on | | | | Investment | | | | Realized | | | | End of | | | | |
| | | of Period | | | | Income | | | | Investments | | | | Income | | | | Gains | | | | Period | | | | |
| | | | | | | | | | | | | | | | | | | | | |
Equity Income Fund (1) | | | | | | | | | | | | | | | | | | | | | | | | | | | | | | | | |
| Class A | | | | | | | | | | | | | | | | | | | | | | | | | | | | | | | | |
| | 2006 (2) | | $ | 13.67 | | | | $ | 0.20 | | | | $ | 2.32 | | | | $ | (0.21 | ) | | | $ | (0.08 | ) | | | $ | 15.90 | | | | |
| | 2005 (3) | | | 13.89 | | | | | 0.01 | | | | | (0.22 | ) | | | | (0.01 | ) | | | | — | | | | | 13.67 | | | | |
| | 2005 (4) | | | 12.77 | | | | | 0.20 | | | | | 1.15 | | | | | (0.22 | ) | | | | (0.01 | ) | | | | 13.89 | | | | |
| | 2004 (4) | | | 11.56 | | | | | 0.18 | | | | | 1.23 | | | | | (0.20 | ) | | | | — | | | | | 12.77 | | | | |
| | 2003 (4) | | | 9.58 | | | | | 0.18 | | | | | 1.99 | | | | | (0.19 | ) | | | | — | | | | | 11.56 | | | | |
| | 2002 (4) | | | 12.13 | | | | | 0.16 | | | | | (2.48 | ) | | | | (0.19 | ) | | | | (0.04 | ) | | | | 9.58 | | | | |
| Class B | | | | | | | | | | | | | | | | | | | | | | | | | | | | | | | | |
| | 2006 (2) | | $ | 13.57 | | | | $ | 0.09 | | | | $ | 2.30 | | | | $ | (0.13 | ) | | | $ | (0.08 | ) | | | $ | 15.75 | | | | |
| | 2005 (3) | | | 13.79 | | | | | — | | | | | (0.22 | ) | | | | — | | | | | — | | | | | 13.57 | | | | |
| | 2005 (4) | | | 12.68 | | | | | 0.10 | | | | | 1.14 | | | | | (0.12 | ) | | | | (0.01 | ) | | | | 13.79 | | | | |
| | 2004 (4) | | | 11.49 | | | | | 0.08 | | | | | 1.22 | | | | | (0.11 | ) | | | | — | | | | | 12.68 | | | | |
| | 2003 (4) | | | 9.52 | | | | | 0.10 | | | | | 1.98 | | | | | (0.11 | ) | | | | — | | | | | 11.49 | | | | |
| | 2002 (4) | | | 12.07 | | | | | 0.09 | | | | | (2.49 | ) | | | | (0.11 | ) | | | | (0.04 | ) | | | | 9.52 | | | | |
| Class C | | | | | | | | | | | | | | | | | | | | | | | | | | | | | | | | |
| | 2006 (2) | | $ | 13.59 | | | | $ | 0.10 | | | | $ | 2.30 | | | | $ | (0.13 | ) | | | $ | (0.08 | ) | | | $ | 15.78 | | | | |
| | 2005 (3) | | | 13.81 | | | | | — | | | | | (0.22 | ) | | | | — | | | | | — | | | | | 13.59 | | | | |
| | 2005 (4) | | | 12.70 | | | | | 0.11 | | | | | 1.13 | | | | | (0.12 | ) | | | | (0.01 | ) | | | | 13.81 | | | | |
| | 2004 (4) | | | 11.51 | | | | | 0.08 | | | | | 1.22 | | | | | (0.11 | ) | | | | — | | | | | 12.70 | | | | |
| | 2003 (4) | | | 9.54 | | | | | 0.10 | | | | | 1.98 | | | | | (0.11 | ) | | | | — | | | | | 11.51 | | | | |
| | 2002 (4) | | | 12.09 | | | | | 0.10 | | | | | (2.50 | ) | | | | (0.11 | ) | | | | (0.04 | ) | | | | 9.54 | | | | |
| Class R (5) | | | | | | | | | | | | | | | | | | | | | | | | | | | | | | | | |
| | 2006 (2) | | $ | 13.66 | | | | $ | 0.17 | | | | $ | 2.31 | | | | $ | (0.18 | ) | | | $ | (0.08 | ) | | | $ | 15.88 | | | | |
| | 2005 (3) | | | 13.88 | | | | | 0.01 | | | | | (0.23 | ) | | | | — | | | | | — | | | | | 13.66 | | | | |
| | 2005 (4) | | | 12.78 | | | | | 0.11 | | | | | 1.20 | | | | | (0.20 | ) | | | | (0.01 | ) | | | | 13.88 | | | | |
| | 2004 (4) | | | 11.56 | | | | | 0.19 | | | | | 1.22 | | | | | (0.19 | ) | | | | — | | | | | 12.78 | | | | |
| | 2003 (4) | | | 9.57 | | | | | 0.19 | | | | | 1.99 | | | | | (0.19 | ) | | | | — | | | | | 11.56 | | | | |
| | 2002 (4) | | | 12.12 | | | | | 0.15 | | | | | (2.47 | ) | | | | (0.19 | ) | | | | (0.04 | ) | | | | 9.57 | | | | |
| Class Y | | | | | | | | | | | | | | | | | | | | | | | | | | | | | | | | |
| | 2006 (2) | | $ | 13.76 | | | | $ | 0.24 | | | | $ | 2.33 | | | | $ | (0.25 | ) | | | $ | (0.08 | ) | | | $ | 16.00 | | | | |
| | 2005 (3) | | | 13.98 | | | | | 0.01 | | | | | (0.21 | ) | | | | (0.01 | ) | | | | (0.01 | ) | | | | 13.76 | | | | |
| | 2005 (4) | | | 12.85 | | | | | 0.24 | | | | | 1.15 | | | | | (0.25 | ) | | | | (0.01 | ) | | | | 13.98 | | | | |
| | 2004 (4) | | | 11.63 | | | | | 0.21 | | | | | 1.24 | | | | | (0.23 | ) | | | | — | | | | | 12.85 | | | | |
| | 2003 (4) | | | 9.63 | | | | | 0.21 | | | | | 2.00 | | | | | (0.21 | ) | | | | — | | | | | 11.63 | | | | |
| | 2002 (4) | | | 12.20 | | | | | 0.21 | | | | | (2.52 | ) | | | | (0.22 | ) | | | | (0.04 | ) | | | | 9.63 | | | | |
| | | | | | | | | | | | | | | | | | | | | | | | | |
| | |
| | (1) | Per share data calculated using average shares outstanding method. |
| |
| | (2) | For the period November 1 to October 31 in the year indicated. |
| |
| | (3) | For the period October 1, 2005 to October 31, 2005. Effective October 1, 2005, the fund’s fiscal year end was changed from September 30 to October 31. All ratios for the period have been annualized, except total return and portfolio turnover. |
| |
| | (4) | For the period October 1 to September 30 in the year indicated. |
| |
| | (5) | Prior to July 1, 2004, Class R shares were named Class S shares, which had lower fees and expenses. |
| |
| | (6) | Total return does not include sales charges. Total return would have been lower had certain expenses not been waived. |
The accompanying notes are an integral part of the financial statements.
118 First American Funds Annual Report 2006
| | | | | | | | | | | | | | | | | | | | | | | | | | | | | | | | | | | | | |
| | | | | | | | | | | | | | | | | | Ratio of Net | | | | | | |
| | | | | | | | | | | | | | | Ratio of | | | | Investment | | | | | | |
| | | | | | | | | | | | Ratio of Net | | | | Expenses to | | | | Income (Loss) | | | | | | |
| | | | | | | | | Ratio of | | | | Investment | | | | Average | | | | to Average | | | | | | |
| | | | | | Net Assets | | | | Expenses to | | | | Income (Loss) | | | | Net Assets | | | | Net Assets | | | | Portfolio | | | |
| | | Total | | | | End of | | | | Average | | | | to Average | | | | (Excluding | | | | (Excluding | | | | Turnover | | | |
| | | Return (6) | | | | Period (000) | | | | Net Assets | | | | Net Assets | | | | Waivers) | | | | Waivers) | | | | Rate | | | |
| | | | | | | | | | | | | | | | | | | | | | | | | | | |
| | | | 18.66 | % | | | $ | 171,814 | | | | | 1.18 | % | | | | 1.40 | % | | | | 1.18 | % | | | | 1.40 | % | | | | 23 | % | | |
| | | | (1.53 | ) | | | | 171,998 | | | | | 1.20 | | | | | 0.70 | | | | | 1.20 | | | | | 0.70 | | | | | — | | | |
| | | | 10.65 | | | | | 176,878 | | | | | 1.16 | | | | | 1.51 | | | | | 1.19 | | | | | 1.48 | | | | | 27 | | | |
| | | | 12.26 | | | | | 184,381 | | | | | 1.15 | | | | | 1.39 | | | | | 1.19 | | | | | 1.35 | | | | | 12 | | | |
| | | | 22.81 | | | | | 144,282 | | | | | 1.15 | | | | | 1.70 | | | | | 1.20 | | | | | 1.65 | | | | | 43 | | | |
| | | | (19.51 | ) | | | | 128,142 | | | | | 1.15 | | | | | 1.43 | | | | | 1.20 | | | | | 1.38 | | | | | 38 | | | |
| | | | 17.76 | % | | | $ | 19,845 | | | | | 1.93 | % | | | | 0.65 | % | | | | 1.93 | % | | | | 0.65 | % | | | | 23 | % | | |
| | | | (1.60 | ) | | | | 21,003 | | | | | 1.95 | | | | | (0.05 | ) | | | | 1.95 | | | | | (0.05 | ) | | | | — | | | |
| | | | 9.86 | | | | | 21,639 | | | | | 1.91 | | | | | 0.78 | | | | | 1.94 | | | | | 0.75 | | | | | 27 | | | |
| | | | 11.37 | | | | | 23,869 | | | | | 1.90 | | | | | 0.65 | | | | | 1.94 | | | | | 0.61 | | | | | 12 | | | |
| | | | 21.97 | | | | | 22,156 | | | | | 1.90 | | | | | 0.95 | | | | | 1.95 | | | | | 0.90 | | | | | 43 | | | |
| | | | (20.10 | ) | | | | 18,699 | | | | | 1.90 | | | | | 0.80 | | | | | 1.95 | | | | | 0.75 | | | | | 38 | | | |
| | | | 17.80 | % | | | $ | 11,225 | | | | | 1.93 | % | | | | 0.68 | % | | | | 1.93 | % | | | | 0.68 | % | | | | 23 | % | | |
| | | | (1.59 | ) | | | | 15,313 | | | | | 1.95 | | | | | (0.05 | ) | | | | 1.95 | | | | | (0.05 | ) | | | | — | | | |
| | | | 9.84 | | | | | 16,128 | | | | | 1.91 | | | | | 0.79 | | | | | 1.94 | | | | | 0.76 | | | | | 27 | | | |
| | | | 11.34 | | | | | 19,300 | | | | | 1.90 | | | | | 0.66 | | | | | 1.94 | | | | | 0.62 | | | | | 12 | | | |
| | | | 21.95 | | | | | 19,386 | | | | | 1.90 | | | | | 0.95 | | | | | 1.95 | | | | | 0.90 | | | | | 43 | | | |
| | | | (20.08 | ) | | | | 11,171 | | | | | 1.90 | | | | | 0.86 | | | | | 1.95 | | | | | 0.81 | | | | | 38 | | | |
| | | | 18.33 | % | | | $ | 511 | | | | | 1.43 | % | | | | 1.14 | % | | | | 1.57 | % | | | | 1.00 | % | | | | 23 | % | | |
| | | | (1.55 | ) | | | | 418 | | | | | 1.45 | | | | | 0.45 | | | | | 1.60 | | | | | 0.30 | | | | | — | | | |
| | | | 10.33 | | | | | 415 | | | | | 1.41 | | | | | 0.83 | | | | | 1.59 | | | | | 0.65 | | | | | 27 | | | |
| | | | 12.18 | | | | | 1 | | | | | 1.15 | | | | | 1.52 | | | | | 1.19 | | | | | 1.48 | | | | | 12 | | | |
| | | | 22.91 | | | | | 17,170 | | | | | 1.15 | | | | | 1.80 | | | | | 1.20 | | | | | 1.75 | | | | | 43 | | | |
| | | | (19.47 | ) | | | | 36,522 | | | | | 1.15 | | | | | 1.34 | | | | | 1.20 | | | | | 1.29 | | | | | 38 | | | |
| | | | 18.89 | % | | | $ | 1,129,971 | | | | | 0.93 | % | | | | 1.65 | % | | | | 0.93 | % | | | | 1.65 | % | | | | 23 | % | | |
| | | | (1.50 | ) | | | | 1,169,267 | | | | | 0.95 | | | | | 0.95 | | | | | 0.95 | | | | | 0.95 | | | | | — | | | |
| | | | 10.94 | | | | | 1,206,483 | | | | | 0.91 | | | | | 1.80 | | | | | 0.94 | | | | | 1.77 | | | | | 27 | | | |
| | | | 12.54 | | | | | 1,404,431 | | | | | 0.90 | | | | | 1.65 | | | | | 0.94 | | | | | 1.61 | | | | | 12 | | | |
| | | | 23.20 | | | | | 1,278,470 | | | | | 0.90 | | | | | 1.95 | | | | | 0.95 | | | | | 1.90 | | | | | 43 | | | |
| | | | (19.30 | ) | | | | 678,352 | | | | | 0.90 | | | | | 1.80 | | | | | 0.95 | | | | | 1.75 | | | | | 38 | | | |
| | | | | | | | | | | | | | | | | | | | | | | | | | | | | | | | | |
First American Funds Annual Report 2006 119
Notes to Financial Statements October 31, 2006, all dollars and shares are rounded to thousands (000)
| |
| | The Real Estate Securities Fund, International Fund, Small Cap Growth Opportunities Fund, Small Cap Select Fund, Small Cap Value Fund, Small-Mid Cap Core Fund, Mid Cap Growth Opportunities Fund, Mid Cap Value Fund, Large Cap Growth Opportunities Fund, Large Cap Select Fund, Large Cap Value Fund, Balanced Fund, and Equity Income Fund (each a “fund” and collectively, the “funds”) are mutual funds offered by First American Investment Funds, Inc. (“FAIF”), which is a member of the First American Family of Funds. As of October 31, 2006, FAIF offered 38 funds, including the funds listed above. FAIF is registered under the Investment Company Act of 1940, as amended, as an open-end management investment company. FAIF’s articles of incorporation permit the funds’ board of directors to create additional funds in the future. Each fund other than Real Estate Securities Fund is a diversified open-end management investment company. The Real Estate Securities Fund is a non-diversified, open-end management investment company. Prior to October 3, 2005, Small-Mid Cap Core Fund had different investment strategies, was named Technology Fund, and also was non-diversified. Non-diversified funds may invest a large component of their net assets in securities of relatively few issuers. |
| |
| | FAIF offers Class A, Class B, Class C, Class R, and Class Y shares. Class A shares are sold with a front-end sales charge. Class B shares are subject to a contingent deferred sales charge for six years and automatically convert to Class A shares after eight years. Class C shares may be subject to a contingent deferred sales charge for 12 months, and will not convert to Class A shares. Class R shares have no sales charge and are offered only through certain tax-deferred retirement plans. Class Y shares have no sales charge and are offered only to qualifying institutional investors and certain other qualifying accounts. Class R shares are not offered by the Small-Mid Cap Core Fund. |
| |
| | The funds’ prospectuses provide descriptions of each fund’s investment objective, principal investment strategies, and principal risks. All classes of shares of a fund have identical voting, dividend, liquidation, and other rights, and the same terms and conditions, except that certain fees and expenses, including distribution and shareholder servicing fees, may differ among classes. Each class has exclusive voting rights on any matters relating to that class’ servicing or distribution arrangements. |
| |
| 2 > | Summary of Significant Accounting Policies |
| |
| | The significant accounting policies followed by the funds are as follows: |
| |
| | SECURITY VALUATIONS – Security valuations for the funds’ investments are furnished by an independent pricing service that has been approved by the funds’ board of directors. Investments in equity securities that are traded on a national securities exchange (or reported on the Nasdaq national market system) are stated at the last quoted sales price if readily available for such securities on each business day. For securities traded on the Nasdaq national market system, the funds utilize the Nasdaq Official Closing Price which compares the last trade to the bid/ask range of a security. If the last trade falls within the bid/ask range, then that price will be the closing price. If the last trade is outside the bid/ask range, and falls above the ask, the ask will be the closing price. If the last trade is below the bid, the bid will be the closing price. Other equity securities traded in the over-the-counter market and listed equity securities for which no sale was reported on that date are stated at the last quoted bid price. Debt obligations exceeding 60 days to maturity are valued by an independent pricing service. The pricing service may employ methodologies that utilize actual market transactions, broker-dealer supplied valuations, or other formula-driven valuation techniques. These techniques generally consider such factors as yields or prices of bonds of comparable quality, type of issue, coupon, maturity, ratings, and general market conditions. Securities for which prices are not available from an independent pricing service but where an active market exists are valued using market quotations obtained from one or more dealers that make markets in the securities or from a widely-used quotation system. When market quotations are not readily available, securities are valued at fair value as determined in good faith by procedures established and approved by the funds’ board of directors. Some of the factors which may be considered in determining fair value are fundamental analytical data relating to the investment; the nature and duration of any restrictions on disposition (trading in similar securities of the same issuer or comparable companies); information from broker-dealers; and an evaluation of the forces that influence the market in which the securities are purchased and sold. If events occur that materially affect the value of securities (including non-U.S. securities) between the close of trading in those securities and the close of regular trading on the New York Stock Exchange, the securities will be valued at fair value. As of October 31, 2006, Real Estate Securities Fund, Small Cap Growth Opportunities Fund, and Balanced Fund held fair valued securities with a total value of $245, $201, and $118, respectively, or 0.0%, 0.1%, and 0.0% of total net assets, respectively. The fair values of securities held by International Fund are determined on each business day by an independent third party based on factors such as price changes for futures contracts, sector indices, American Depository Receipts, and currency exchange rates that occur between the close of the local market and the close of the New York Stock Exchange. The use of daily fair value pricing by the International Fund may cause the net asset value of its shares to differ significantly from the net asset value that would be determined without fair value pricing. Debt obligations with 60 days or less remaining until maturity may be valued at their amortized cost, which approximates market value. Foreign securities |
120 First American Funds Annual Report 2006
| |
| | are valued at the closing prices on the principal exchange on which they trade unless they are fair valued as described above. The prices for foreign securities are reported in local currency and converted to U.S. dollars using currency exchange rates. Exchange rates are provided daily by recognized independent pricing agents. Investments in open-end mutual funds are valued at their respective net asset values on the valuation date. |
| |
| | SECURITY TRANSACTIONS AND INVESTMENT INCOME – For financial statement purposes, the funds record security transactions on the trade date of the security purchase or sale. Dividend income is recorded on the ex-dividend date. Interest income, including amortization of bond premium and discount, is recorded on an accrual basis. Security gains and losses are determined on the basis of identified cost, which is the same basis used for federal income-tax purposes. |
| |
| | DISTRIBUTIONS TO SHAREHOLDERS – The Equity Income Fund and Large Cap Value Fund declare and pay income dividends monthly. The Balanced Fund, Large Cap Select Fund, Mid Cap Value Fund and Real Estate Securities Fund declare and pay income dividends quarterly. The Large Cap Growth Opportunities Fund, Mid Cap Growth Opportunities Fund, Small Cap Growth Opportunities Fund, Small Cap Select Fund, Small Cap Value Fund, Small-Mid Cap Core Fund, and International Fund declare and pay income dividends annually. Distributions are payable in cash or reinvested in additional shares of the funds. Any net realized capital gains on sales of a fund’s securities are distributed to shareholders at least annually. |
| |
| | The Real Estate Securities Fund receives substantial distributions from holdings in real estate investment trusts (“REITs”). Distributions from REITs may be characterized as ordinary income, net capital gain, or a return of capital to the REIT shareholder. The proper characterization of REIT distributions is generally not known until after the end of each calendar year. As such, Real Estate Securities Fund must use estimates in reporting the character of its income and distributions for financial statement purposes. The actual character of distributions to fund shareholders will be reflected on the Form 1099 received by shareholders after the end of the calendar year. Due to the nature of REIT investments, a portion of the distributions received by a fund shareholder may represent a return of capital. |
| |
| | FEDERAL TAXES – Each fund is treated as a separate taxable entity. Each fund intends to continue to qualify as a regulated investment company as provided in Subchapter M of the Internal Revenue Code, as amended, and to distribute all taxable income, if any, to its shareholders. Accordingly, no provision for federal income taxes is required. |
| |
| | Net investment income and net realized gains (losses) may differ for financial statement and tax purposes because of temporary or permanent book/tax differences. These differences are primarily due to deferred wash sale and straddle losses, foreign currency gains and losses, investments in limited partnerships and REITs, and the “mark-to-market” of certain passive foreign investment companies (“PFICs”) for tax purposes. To the extent these differences are permanent, reclassifications are made to the appropriate equity accounts in the fiscal period that the differences arise. |
| |
| | On the Statement of Assets and Liabilities, the following reclassifications were made: |
| | | | | | | | | | | | | |
| | | Accumulated | | | Undistributed | | | |
| | | Net Realized | | | Net Investment | | | Portfolio | |
| Fund | | Gain (Loss) | | | Income | | | Capital | |
| |
| Real Estate Securities Fund | | $ | (11,199 | ) | | $ | 3,493 | | | $ | 7,706 | |
| International Fund | | | 656 | | | | (656 | ) | | | — | |
| Small Cap Growth Opportunities Fund | | | (2,086 | ) | | | 2,333 | | | | (247 | ) |
| Small Cap Select Fund | | | (13,959 | ) | | | 1,913 | | | | 12,046 | |
| Small Cap Value Fund | | | (12,403 | ) | | | (49 | ) | | | 12,452 | |
| Small-Mid Cap Core Fund | | | 56 | | | | (56 | ) | | | — | |
| Mid Cap Growth Opportunities Fund | | | (11,108 | ) | | | 1,536 | | | | 9,572 | |
| Mid Cap Value Fund | | | (4,796 | ) | | | 398 | | | | 4,398 | |
| Large Cap Value Fund | | | (6,078 | ) | | | 112 | | | | 5,966 | |
| Balanced Fund | | | (132 | ) | | | 132 | | | | — | |
| Equity Income Fund | | | (22,513 | ) | | | 298 | | | | 22,215 | |
| |
First American Funds Annual Report 2006 121
Notes to Financial Statements continued
| |
| | The character of distributions made during the year from net investment income or net realized gains may differ from its ultimate characterization for federal income tax purposes. In addition, due to the timing of dividend distributions, the fiscal period in which the amounts are distributed may differ from the period or year that the income or realized gains (losses) were recorded by the fund. The tax character of distributions paid during the year ended October 31, 2006, the one-month fiscal period ended October 31, 2005, and the year ended September 30, 2005, were as follows: |
| | | | | | | | | | | | | | | | | |
| | | October 31, 2006 |
| |
| | | Ordinary | | | Long Term | | | Return | | | |
| Fund | | Income | | | Gain | | | of Capital | | | Total | |
| |
| Real Estate Securities Fund | | $ | 46,095 | | | $ | 52,224 | | | $ | — | | | $ | 98,319 | |
| International Fund | | | 19,958 | | | | — | | | | — | | | | 19,958 | |
| Small Cap Growth Opportunities Fund | | | 47,284 | | | | 8,237 | | | | — | | | | 55,521 | |
| Small Cap Select Fund | | | 50,757 | | | | 107,691 | | | | — | | | | 158,448 | |
| Small Cap Value Fund | | | 11,597 | | | | 80,011 | | | | — | | | | 91,608 | |
| Mid Cap Growth Opportunities Fund | | | 52,862 | | | | 104,610 | | | | — | | | | 157,472 | |
| Mid Cap Value Fund | | | 6,572 | | | | 35,553 | | | | — | | | | 42,125 | |
| Large Cap Select Fund | | | 10,875 | | | | 7,247 | | | | — | | | | 18,122 | |
| Large Cap Value Fund | | | 12,164 | | | | 26,976 | | | | — | | | | 39,140 | |
| Balanced Fund | | | 6,912 | | | | — | | | | — | | | | 6,912 | |
| Equity Income Fund | | | 21,829 | | | | 7,683 | | | | — | | | | 29,512 | |
| |
| | | | | | | | | | | | | | | | | |
| | | | | October 31, 2005 | | |
| |
| | | Ordinary | | | Long Term | | | Return | | | |
| Fund | | Income | | | Gain | | | of Capital | | | Total | |
| |
| Large Cap Value Fund | | | $161 | | | | $— | | | | $— | | | | $161 | |
| Equity Income Fund | | | 918 | | | | — | | | | — | | | | 918 | |
| |
| | | | | | | | | | | | | | | | | |
| | | | | September 30, 2005 | | |
| |
| | | Ordinary | | | Long Term | | | Return | | | |
| Fund | | Income | | | Gain | | | of Capital | | | Total | |
| |
| Real Estate Securities Fund | | $ | 17,941 | | | $ | 40,662 | | | $ | — | | | $ | 58,603 | |
| International Fund | | | 10,214 | | | | — | | | | — | | | | 10,214 | |
| Small Cap Growth Opportunities Fund | | | 12,908 | | | | 26,459 | | | | — | | | | 39,367 | |
| Small Cap Select Fund | | | 62,270 | | | | 95,731 | | | | — | | | | 158,001 | |
| Small Cap Value Fund | | | 9,040 | | | | 57,102 | | | | — | | | | 66,142 | |
| Mid Cap Growth Opportunities Fund | | | 79,521 | | | | 115,577 | | | | — | | | | 195,098 | |
| Mid Cap Value Fund | | | 3,756 | | | | — | | | | — | | | | 3,756 | |
| Large Cap Growth Opportunities Fund | | | 2,288 | | | | — | | | | 757 | | | | 3,045 | |
| Large Cap Select Fund | | | 4,919 | | | | 1,525 | | | | — | | | | 6,444 | |
| Large Cap Value Fund | | | 11,191 | | | | — | | | | — | | | | 11,191 | |
| Balanced Fund | | | 6,225 | | | | — | | | | — | | | | 6,225 | |
| Equity Income Fund | | | 22,731 | | | | 8,129 | | | | — | | | | 30,860 | |
| |
| |
| | As of October 31, 2006, components of accumulated earnings (deficit) on a tax-basis were as follows: |
| | | | | | | | | | | | | | | | | | | | | | | | | |
| | | | | | | Accumulated | | | | | | | Total | |
| | | Undistributed | | | Undistributed | | | Capital and | | | Unrealized | | | Other | | | Accumulated | |
| | | Ordinary | | | Long Term | | | Post-October | | | Appreciation | | | Accumulated | | | Earnings | |
| Fund | | Income | | | Capital Gains | | | Losses | | | (Depreciation) | | | Losses | | | (Deficit) | |
| |
| Real Estate Securities Fund | | $ | 58,865 | | | $ | 31,220 | | | $ | — | | | $ | 264,536 | | | $ | — | | | $ | 354,621 | |
| International Fund | | | 17,437 | | | | 31,015 | | | | (6,331 | ) | | | 452,898 | | | | — | | | | 495,019 | |
| Small Cap Growth Opportunities Fund | | | 17,478 | | | | 2,440 | | | | — | | | | 12,757 | | | | (83 | ) | | | 32,592 | |
| Small Cap Select Fund | | | 58,724 | | | | 75,288 | | | | (29,163 | ) | | | 95,718 | | | | (244 | ) | | | 200,323 | |
| Small Cap Value Fund | | | 20,581 | | | | 43,594 | | | | — | | | | 58,495 | | | | — | | | | 122,670 | |
| Small-Mid Cap Core Fund | | | 93 | | | | — | | | | (451,025 | ) | | | 7,752 | | | | — | | | | (443,180 | ) |
| Mid Cap Growth Opportunities Fund | | | — | | | | 142,003 | | | | (30,252 | ) | | | 286,422 | | | | — | | | | 398,173 | |
| Mid Cap Value Fund | | | 20,199 | | | | 38,335 | | | | — | | | | 139,018 | | | | (237 | ) | | | 197,315 | |
| Large Cap Growth Opportunities Fund | | | 1,285 | | | | 9,668 | | | | (70,958 | ) | | | 106,357 | | | | — | | | | 46,352 | |
| Large Cap Select Fund | | | 78 | | | | 7,702 | | | | — | | | | 52,253 | | | | — | | | | 60,033 | |
| Large Cap Value Fund | | | 18,830 | | | | 53,409 | | | | — | | | | 175,144 | | | | — | | | | 247,383 | |
| Balanced Fund | | | 2,871 | | | | 23,715 | | | | — | | | | 34,091 | | | | (85 | ) | | | 60,592 | |
| Equity Income Fund | | | 3,900 | | | | 113,225 | | | | — | | | | 357,121 | | | | — | | | | 474,246 | |
| |
122 First American Funds Annual Report 2006
| |
| | The differences between book-basis and tax-basis unrealized appreciation (depreciation) are primarily due to the tax deferral of losses on wash sales and investments in limited partnerships, the amount of gain (loss) recognized for tax purposes due to mark-to-market adjustments on open futures contracts, and the mark-to-market for certain PFICs for tax purposes. |
| |
| | As of October 31, 2006, the following funds had capital loss carryforwards which, if not offset by subsequent capital gains, will expire on the funds’ fiscal year-ends as follows: |
| | | | | | | | | | | | | | | | | | | | | | | | | | | | | | | | | |
| | | Expiration Year |
| |
| Fund | | 2007 | | | 2008 | | | 2009 | | | 2010 | | | 2011 | | | 2012 | | | 2013 | | | Total | |
| |
| International Fund | | $ | 1,762 | | | $ | — | | | $ | 4,569 | | | $ | — | | | $ | — | | | $ | — | | | $ | — | | | $ | 6,331 | |
| Small Cap Select Fund | | | — | | | | — | | | | 29,163 | | | | — | | | | — | | | | — | | | | — | | | | 29,163 | |
| Small-Mid Cap Core Fund | | | — | | | | 5,595 | | | | 339,005 | | | | 102,106 | | | | 4,320 | | | | — | | | | — | | | | 451,025 | |
| Mid Cap Growth Opportunities Fund | | | — | | | | — | | | | 30,252 | | | | — | | | | — | | | | — | | | | — | | | | 30,252 | |
| Large Cap Growth Opportunities Fund | | | — | | | | — | | | | 70,958 | | | | — | | | | — | | | | — | | | | — | | | | 70,958 | |
| |
| |
| | In accordance with Section 382 of the Internal Revenue Code, utilization of all or a portion of the above capital loss carryovers is limited on an annual basis for International Fund, Small Cap Select Fund, Small-Mid Cap Core Fund, Mid Cap Growth Opportunities Fund, and Large Cap Growth Opportunities Fund to $4,046, $9,721, $1,524, $10,084, and $23,652, respectively. |
| |
| | FUTURES TRANSACTIONS – In order to gain exposure to or protect against changes in the market and to maintain sufficient liquidity to meet redemption requests, certain funds may enter into S&P stock index futures contracts and other stock index futures contracts. The Balanced Fund may also enter into interest rate index futures contracts. |
| |
| | Upon entering into a futures contract, the fund is required to deposit cash or pledge U.S. Government securities in an amount equal to five percent of the purchase price indicated in the futures contract (initial margin). Subsequent payments, which are dependent on the daily fluctuations in the value of the underlying security or securities, are made or received by the fund each day (daily variation margin) and are recorded as unrealized gains (losses) until the contract is closed. When the contract is closed, the fund records a realized gain (loss) equal to the difference between the proceeds from (or cost of) the closing transaction and the fund’s basis in the contract. |
| |
| | Risks of entering into futures contracts, in general, include the possibility that there will not be a perfect price correlation between the futures contracts and the underlying securities. Second, it is possible that a lack of liquidity for futures contracts could exist, resulting in an inability to close a futures position prior to its maturity date. Third, the purchase of a futures contract involves the risk that a fund could lose more than the original margin deposit required to initiate a futures transaction. These contracts involve market risk in excess of the amount reflected in the fund’s Statement of Assets and Liabilities. Unrealized gains (losses) on outstanding positions in futures contracts held at the close of the year will be recognized as capital gains (losses) for federal income tax purposes. |
| |
| | At October 31, 2006, Balanced Fund had outstanding futures contracts as disclosed in its Schedule of Investments. |
| |
| | OPTIONS TRANSACTIONS – The funds may utilize options in an attempt to manage market or business risk or enhance returns. When a call or put option is written, an amount equal to the premium received is recorded as a liability. The liability is marked-to-market daily to reflect the current market value of the option written. When a written option expires, a gain is realized in the amount of the premium originally received. If a closing purchase contract is entered into, a gain or loss is realized in the amount of the original premium less the cost of the closing transaction. If a written call option is exercised, a gain or loss is realized from the sale of the underlying security, and the proceeds from such sale are increased by the premium originally received. If a written put option is exercised, the amount of the premium originally received reduces the cost of the security which is purchased upon exercise of the option. As of and for the year ended October 31, 2006, the funds held no written options. |
| |
| | Purchased options are recorded as investments and marked-to-market daily to reflect the current market value of the option contract. If a purchased option expires, a loss is realized in the amount of the cost of the option. If a closing transaction is entered into, a gain or loss is realized to the extent that the proceeds from the sale are greater or less than the cost of the option. If a put option is exercised, a gain or loss is realized from the sale of the underlying security by adjusting the proceeds from such sale by the amount of the premium originally paid. If a call option is exercised, the cost of the security purchased upon exercise is increased by the premium originally paid. As of October 31, 2006, the funds held no purchased options. |
First American Funds Annual Report 2006 123
Notes to Financial Statements continued
| |
| | FOREIGN CURRENCY TRANSLATION – The books and records of International Fund relating to the fund’s non-U.S. dollar denominated investments are maintained in U.S. dollars on the following basis: |
| | |
| | • | market value of investment securities, assets, and liabilities are translated at the current rate of exchange; and |
| |
| | • | purchases and sales of investment securities, income, and expenses are translated at the relevant rates of exchange prevailing on the respective dates of such transactions. |
| |
| | The International Fund does not isolate the portion of gains and losses on investments in equity securities that is due to changes in the foreign exchange rates from that which is due to changes in market prices of equity securities. |
| |
| | The International Fund reports certain foreign currency-related transactions as components of realized gains for financial reporting purposes, whereas such components are treated as ordinary income for federal income tax purposes. At October 31, 2006, International Fund had no foreign currency holdings. |
| |
| | FORWARD FOREIGN CURRENCY CONTRACTS – The International Fund may enter into forward foreign currency contracts as hedges against either specific transactions or fund positions. The aggregate principal amount of the contracts are not recorded because the International Fund intends to settle the contracts prior to delivery. All commitments are “marked-to-market” daily at the applicable foreign exchange rate, and any resulting unrealized gains or losses are recorded currently. The International Fund realizes gains or losses at the time the forward contracts are extinguished. Unrealized gains or losses on outstanding positions in forward foreign currency contracts held at the close of the period are recognized as ordinary income or loss for federal income tax purposes. |
| |
| | The use of forward foreign currency contracts does not eliminate fluctuations in the underlying prices of the securities, but it does establish a rate of exchange that can be achieved in the future. Although forward foreign currency contracts limit the risk of loss due to a decline in the value of the hedged currency, they also limit a potential gain that might result should the value of the currency increase. These contracts involve market risk in excess of the amount reflected in the fund’s Statement of Assets and Liabilities. The face or contract amount in U.S. dollars reflects the total exposure the fund has in that particular currency contract. In addition, there could be exposure to risks (limited to the amount of unrealized gains) if the counterparties to the contracts are unable to meet the terms of their contracts. At October 31, 2006, International Fund had no outstanding forward currency contracts. |
| |
| | SECURITIES PURCHASED ON A WHEN-ISSUED BASIS – Delivery and payment for securities that have been purchased by a fund on a when-issued or forward-commitment basis can take place up to a month or more after the transaction. Such securities do not earn interest, are subject to market fluctuations, and may increase or decrease in value prior to their delivery. Each fund segregates assets with a market value equal to or greater than the amount of its purchase commitments. The purchase of securities on a when-issued or forward-commitment basis may increase the volatility of the fund’s net asset value if the fund makes such purchases while remaining substantially fully invested. At October 31, 2006, Balanced Fund had when-issued or forward-commitment securities outstanding with a total cost of $5,067. |
| |
| | In connection with the ability to purchase securities on a when-issued basis, each fund may also enter into dollar rolls in which the fund sells securities purchased on a forward-commitment basis and simultaneously contracts with a counterparty to repurchase similar (same type, coupon, and maturity), but not identical securities on a specified future date. As an inducement for the fund to “roll over” its purchase commitments, the fund receives negotiated amounts in the form of reductions of the purchase price of the commitment. Dollar rolls are considered a form of leverage. As of and for the year ended October 31, 2006, the funds had no dollar rolls. |
| |
| | ILLIQUID OR RESTRICTED SECURITIES – A security may be considered illiquid if it lacks a readily available market. Securities are generally considered liquid if they can be sold or disposed of in the ordinary course of business within seven days at approximately the price at which the security is valued by the fund. Illiquid securities may be valued under methods approved by the funds’ board of directors as reflecting fair value. Each fund intends to invest no more than 15% of its net assets (determined at the time of purchase and reviewed periodically) in illiquid securities. Certain restricted securities may be considered illiquid. Restricted securities are often purchased in private placement transactions, are not registered under the Securities Act of 1933, and may have contractual restrictions on resale. Certain restricted securities eligible for resale to qualified institutional investors, including Rule 144A securities, are not subject to the limitation on a fund’s investment in illiquid securities if they are determined to be liquid in accordance with procedures adopted by the funds’ board of directors. At October 31, 2006, Real Estate Securities Fund, Small Cap Growth Opportunities Fund, and Balanced Fund had investments in illiquid securities with a total value of $245, $201, and $118, respectively, or 0.0%, 0.1%, and 0.0%, respectively, of total net assets. |
124 First American Funds Annual Report 2006
| |
| | Information concerning illiquid securities, including restricted securities considered to be illiquid, is as follows: |
| | | | | | | | | | | | | |
| Real Estate Securities Fund | | Shares | | | Dates Acquired | | | Cost Basis | |
| |
| Beacon Capital | | | 34 | | | | 3/98 | | | $ | 435 | |
| Newcastle Investment Holdings | | | 35 | | | | 6/98 | | | | 153 | |
| |
| | | | | | | | | | | | | |
| Small Cap Growth Opportunities Fund | | Shares | | | Dates Acquired | | | Cost Basis | |
| |
| Kuhlman Company Warrants | | | 282 | | | | 1/06 | | | $ | 273 | |
| Tridium, Class B | | | 279 | | | | 4/99-8/99 | | | | 1,524 | |
| VideoPropulsion | | | 785 | | | | 12/99 | | | | —* | |
| |
| | | | | | | | | | | | | |
| Balanced Fund | | Par | | | Dates Acquired | | | Cost Basis | |
| |
| Duty Free International | | $ | 588 | | | | 1/99-11/02 | | | $ | 588 | |
| |
| |
| | SECURITIES LENDING – In order to generate additional income, a fund may lend securities representing up to one-third of the value of its total assets (which includes collateral for securities on loan) to broker-dealers, banks, or other institutional borrowers of securities. Each fund’s policy is to maintain collateral in the form of cash, U.S. Government securities, or other high-grade debt obligations equal to at least 100% of the value of securities loaned. The collateral is then “marked-to-market” daily until the securities are returned. As with other extensions of credit, there may be risks of delay in recovery of the securities or even loss of rights in the collateral should the borrower of the security fail financially. Cash collateral is invested in short-term, high-quality U.S. dollar denominated securities that would be eligible for investment by a money market fund under Investment Company Act Rule 2a-7. |
| |
| | As of October 31, 2006, cash collateral invested was as follows: |
| | | | | | | | | | | | | | | | | | | | | | | | | |
| | | | | | | | | | | Other | | | |
| | | Commercial | | | Corporate | | | Repurchase | | | Money | | | Short-Term | | | |
| | | Paper | | | Obligations | | | Agreements | | | Market Fund | | | Securities | | | Total | |
| |
| Real Estate Securities Fund | | $ | 116,567 | | | $ | 137,173 | | | $ | 185,488 | | | $ | 11,152 | | | $ | 8,893 | | | $ | 459,273 | |
| International Fund | | | — | | | | — | | | | — | | | | 365,779 | | | | — | | | | 365,779 | |
| Small Cap Growth Opportunities Fund | | | 38,824 | | | | 45,687 | | | | 61,779 | | | | 3,715 | | | | 2,962 | | | | 152,967 | |
| Small Cap Select Fund | | | 101,818 | | | | 119,816 | | | | 162,017 | | | | 9,741 | | | | 7,767 | | | | 401,159 | |
| Small Cap Value Fund | | | 38,782 | | | | 45,637 | | | | 61,712 | | | | 3,710 | | | | 2,959 | | | | 152,800 | |
| Small-Mid Cap Core Fund | | | 8,477 | | | | 9,975 | | | | 13,489 | | | | 811 | | | | 646 | | | | 33,398 | |
| Mid Cap Growth Opportunities Fund | | | 150,679 | | | | 177,314 | | | | 239,768 | | | | 14,416 | | | | 11,495 | | | | 593,672 | |
| Mid Cap Value Fund | | | 67,700 | | | | 79,667 | | | | 107,728 | | | | 6,477 | | | | 5,165 | | | | 266,737 | |
| Large Cap Growth Opportunities Fund | | | 48,085 | | | | 56,584 | | | | 76,515 | | | | 4,601 | | | | 3,668 | | | | 189,453 | |
| Large Cap Select Fund | | | 25,875 | | | | 30,449 | | | | 41,174 | | | | 2,476 | | | | 1,974 | | | | 101,948 | |
| Large Cap Value Fund | | | 57,087 | | | | 67,178 | | | | 90,839 | | | | 5,462 | | | | 4,355 | | | | 224,921 | |
| Balanced Fund | | | 22,879 | | | | 26,923 | | | | 36,405 | | | | 2,189 | | | | 1,745 | | | | 90,141 | |
| Equity Income Fund | | | 20,029 | | | | 23,569 | | | | 31,871 | | | | 1,916 | | | | 1,528 | | | | 78,913 | |
| |
| |
| | FAF Advisors, Inc. (“FAF Advisors”), formerly U.S. Bancorp Asset Management, Inc., serves as the securities lending agent for the funds in transactions involving the lending of portfolio securities on behalf of the funds. FAF Advisors acts as the securities lending agent pursuant to, and subject to compliance with conditions contained in, an exemptive order issued by the Securities and Exchange Commission (“SEC”). Effective January 1, 2006, FAF Advisors receives fees equal to 32% of each fund’s income from securities lending transactions. Prior to January 1, 2006, such fees were 35% of each fund’s income from securities lending transactions. With respect to International Fund, a portion of this amount was paid to State Street Bank and Trust for acting as sub-lending agent. Effective January 1, 2007, FAF Advisors will receive fees of up to 25% of each fund’s net income from securities lending transactions. In addition, beginning February 1, 2007, for each fund other than International Fund, collateral for securities on loan will be invested in a money market fund administered by FAF Advisors and FAF Advisors will receive an administration fee equal to 0.02% of such fund’s average daily net assets. |
First American Funds Annual Report 2006 125
Notes to Financial Statements continued
| |
| | For International Fund, State Street Bank and Trust will continue to act as sub-lending agent and will receive a portion of FAF Advisors’ fee. Fees paid to FAF Advisors by the funds for the fiscal year ended October 31, 2006, were as follows: |
| | | | | | | | | |
| Fund | | | | |
| |
| Real Estate Securities Fund | | | | | | | $157 | |
| International Fund | | | | | | | 454 | |
| Small Cap Growth Opportunities Fund | | | | | | | 119 | |
| Small Cap Select Fund | | | | | | | 493 | |
| Small Cap Value Fund | | | | | | | 104 | |
| Small-Mid Cap Core Fund | | | | | | | 23 | |
| Mid Cap Growth Opportunities Fund | | | | | | | 255 | |
| Mid Cap Value Fund | | | | | | | 106 | |
| Large Cap Growth Opportunities Fund | | | | | | | 113 | |
| Large Cap Select Fund | | | | | | | 38 | |
| Large Cap Value Fund | | | | | | | 88 | |
| Balanced Fund | | | | | | | 85 | |
| Equity Income Fund | | | | | | | 89 | |
| |
| |
| | Income from securities lending is recorded on the Statement of Operations as securities lending income net of fees paid to FAF Advisors. |
| |
| | SWAP AGREEMENTS – The Balanced Fund may invest in swap agreements. A swap is an agreement to exchange the return generated by one instrument for the return generated by another instrument. The fund may enter into interest rate and credit default swap agreements to manage its exposure to interest rates and credit risk. |
| |
| | Interest rate swap agreements involve the exchange by the fund with another party of their respective commitments to pay or receive interest (e.g., an exchange of floating rate payments for fixed rate payments with respect to the notional amount of principal). As of October 31, 2006, Balanced Fund had outstanding interest rate swaps as disclosed in its Schedule of Investments. |
| |
| | In a credit default swap, one party makes a stream of payments to another party in exchange for the right to receive a specified return in the event of a default by a specified issuer on its obligation (typically a corporate issue or sovereign issue of an emerging country). The fund may use credit default swaps to provide a measure of protection against defaults of sovereign issuers (i.e., to reduce risk where the fund owns an issuance of or otherwise has exposure to the sovereign issuer) or to take an active long or short position with respect to the likelihood of a particular issuer’s default. As of October 31, 2006, Balanced Fund had no outstanding credit default swaps. |
| |
| | Swaps are marked-to-market daily based upon quotations from market makers and the change in value, if any, is recorded as unrealized gain or loss on the Statement of Operations. Payments received or made at the beginning of the measurement period are reflected on the Statement of Assets and Liabilities. A liquidation payment received or made at the termination of the swap agreement is recorded as realized gain or loss on the Statement of Operations. Net periodic payments received by the fund are included as part of miscellaneous income on the Statement of Operations. Entering into these agreements involves, to varying degrees, elements of credit, market and documentation risk in excess of the amounts recognized on the Statement of Assets and Liabilities. Such risks involve the possibility that there will be no liquid market for these agreements, that the counterparty to an agreement may default on its obligation to perform or disagree as to the meaning of contractual terms in the agreement, and that there may be unfavorable changes in interest rates. |
| |
| | SECURITY LITIGATION SETTLEMENTS – Income from settlement proceeds related to portfolio securities is recorded as an adjustment to realized or unrealized gains or losses. For the year ended October 31, 2006, International Fund, Small Cap Growth Opportunities Fund, Small Cap Select Fund, Small Cap Value Fund, Small-Mid Cap Core Fund, Mid Cap Growth Opportunities Fund, Mid Cap Value Fund, Large Cap Growth Opportunities Fund, Large Cap Value Fund, Balanced Fund, and Equity Income Fund received settlement proceeds of $205, $270, $367, $189, $158, $559, $3, $317, $817, $220, and $249, respectively, as an adjustment to realized gains or losses for settlement proceeds related to securities no longer included in the portfolio. |
| |
| | EXPENSES – Expenses that are directly related to one of the funds are charged directly to that fund. Other operating expenses are allocated to the funds on several bases, including evenly across all funds, allocated based on relative net assets of all funds within the First American Family of Funds, or a combination of both methods. Class specific expenses, such as distribution fees and shareholder servicing fees, are borne by that class. Income, other expenses, and realized and unrealized gains and losses of a fund are allocated to each respective class in proportion to the relative net assets of each class. |
126 First American Funds Annual Report 2006
| |
| | INTERFUND LENDING PROGRAM – Pursuant to an exemptive order issued by the SEC, the funds, along with other registered investment companies in the First American Family of Funds, may participate in an interfund lending program. This program provides an alternative credit facility allowing the funds to borrow from, or lend money to, other participating funds. The funds did not have any interfund lending transactions during the fiscal year ended October 31, 2006. |
| |
| | DEFERRED COMPENSATION PLAN – Under a Deferred Compensation Plan (the “Plan”), non-interested directors of the First American Family of Funds may participate and elect to defer receipt of part or all of their annual compensation. Deferred amounts are treated as though equivalent dollar amounts had been invested in shares of selected open-end First American Funds as designated by the board of directors. All amounts in the Plan are 100% vested, and accounts under the Plan are obligations of the funds. Deferred amounts remain in the funds until distributed in accordance with the Plan. |
| |
| | USE OF ESTIMATES IN PREPARATION OF FINANCIAL STATEMENTS – The preparation of financial statements, in conformity with U.S. generally accepted accounting principles, requires management to make estimates and assumptions that affect the reported amount of net assets and liabilities and disclosure of contingent assets and liabilities at the date of the financial statements and the reported results of operations during the reporting period. Actual results could differ from those estimates. |
| |
| | RECLASSIFICATIONS – Certain amounts in the October 31, 2005 financial statements have been reclassified to conform to the October 31, 2006 presentation. |
| |
| | INVESTMENT ADVISORY FEES – Pursuant to an investment advisory agreement (the “Agreement”), FAF Advisors manages each fund’s assets and furnishes related office facilities, equipment, research, and personnel. The Agreement requires each fund to pay FAF Advisors a monthly fee based upon average daily net assets. The annual fee for each fund is as follows: |
| | | | | |
| | | Advisory Fee | |
| | | as a % of Average | |
| Fund | | Daily Net Assets | |
| |
| Real Estate Securities Fund | | | 0.70 | % |
| International Fund | | | 1.00 | |
| Small Cap Growth Opportunities Fund | | | 1.00 | |
| Small Cap Select Fund | | | 0.70 | |
| Small Cap Value Fund | | | 0.70 | |
| Small-Mid Cap Core Fund | | | 0.70 | |
| Mid Cap Growth Opportunities Fund | | | 0.70 | |
| Mid Cap Value Fund | | | 0.70 | |
| Large Cap Growth Opportunities Fund* | | | 0.65 | |
| Large Cap Select Fund* | | | 0.65 | |
| Large Cap Value Fund* | | | 0.65 | |
| Balanced Fund* | | | 0.65 | |
| Equity Income Fund* | | | 0.65 | |
| |
| | |
| | * | The advisory fees for Large Cap Growth Opportunities Fund, Large Cap Select Fund, Large Cap Value Fund, Balanced Fund, and Equity Income Fund are equal to an annual rate of 0.65% of the average daily net assets up to $3 billion, 0.625% of the average daily net assets on the next $2 billion, and 0.60% of the average daily net assets in excess of $5 billion. |
| |
| | FAF Advisors has agreed to waive fees and reimburse other fund expenses for certain funds at least through June 30, 2007, so that total fund operating expenses, as a percentage of average daily net assets, do not exceed the following amounts: |
| | | | | | | | | | | | | | | | | | | | | |
| | | Share Class |
| |
| Fund | | A | | | B | | | C | | | R | | | Y | |
| |
International Fund(1) | | | 1.49 | % | | | 2.24 | % | | | 2.24 | % | | | 1.74 | % | | | 1.24 | % |
| Small Cap Growth Opportunities Fund | | | 1.47 | | | | 2.22 | | | | 2.22 | | | | 1.72 | | | | 1.22 | |
Small-Mid Cap Core Fund(2) | | | 1.41 | | | | 2.16 | | | | 2.16 | | | | n/a | | | | 1.16 | |
| Balanced Fund | | | 1.10 | | | | 1.85 | | | | 1.85 | | | | 1.35 | | | | 0.85 | |
| |
| | |
| | (1) | Effective July 1, 2006. Prior to July 1, 2006, total operating expenses for International Fund were capped at 1.52%, 2.27%, 2.27%, 1.77%, and 1.27% for Class A, Class B, Class C, Class R, and Class Y, respectively. |
| |
| | (2) | Effective July 1, 2006. Prior to July 1, 2006, total operating expenses for Small-Mid Cap Core Fund were not capped. |
| |
| | The funds may invest in related money market funds that are series of First American Funds, Inc., subject to certain limitations. In order to avoid the payment of duplicative investment advisory fees to FAF Advisors, which acts as the investment advisor to both the investing funds and the related money market funds, FAF Advisors will reimburse each investing fund an amount equal to that portion of FAF Advisor’s investment advisory fee received from the related money |
First American Funds Annual Report 2006 127
Notes to Financial Statements continued
| |
| | market funds that is attributable to the assets of the investing fund. For financial statement purposes, these reimbursements are recorded as investment income. |
| |
| | ADMINISTRATION FEES – FAF Advisors serves as the funds’ administrator pursuant to an administration agreement between FAF Advisors and the funds. U.S. Bancorp Fund Services, LLC (“USBFS”) serves as sub-administrator pursuant to a sub-administration agreement between USBFS and FAF Advisors. FAF Advisors is a subsidiary of U.S. Bank National Association (“U.S. Bank”). Both U.S. Bank and USBFS are direct subsidiaries of U.S. Bancorp. Under the administration agreement, FAF Advisors provides, or engages other entities to provide, services to the funds. These services include various legal, oversight, and administrative services and accounting services. During the fiscal year, the funds paid FAF Advisors administration fees which were calculated daily and paid monthly. Prior to July 1, 2006, such fees were equal to each fund’s pro rata share of an amount equal, on an annual basis, to 0.15% of the aggregate average daily net assets of all open-end mutual funds in the First American Family of Funds up to $8 billion, 0.135% on the next $17 billion of the aggregate average daily net assets, 0.12% on the next $25 billion of the aggregate average daily net assets, and 0.10% of the aggregate average daily net assets in excess of $50 billion. |
| |
| | Effective July 1, 2006, the administration fee was increased to an amount equal, on an annualized basis, to 0.25% of the aggregate average daily net assets of all open-end mutual funds in the First American Family of Funds up to $8 billion, 0.235% on the next $17 billion of the aggregate average daily net assets, 0.22% on the next $25 billion of the aggregate average daily net assets, and 0.20% of the aggregate average daily net assets in excess of $50 billion. This increase was a result of incorporating into the administration fee a fee equal to 0.10% of the funds’ average daily net assets that had previously been paid to USBFS as part of the transfer agent fee for providing certain shareholder services and to reimburse USBFS for its payments to financial institutions that establish and maintain omnibus accounts and provide customary services for such accounts. |
| |
| | All fees paid to the sub-administrator are paid from the administration fee. In addition to these fees, the funds may reimburse FAF Advisors and USBFS for any out-of-pocket expenses incurred in providing administration services. |
| |
| | For the fiscal year ended October 31, 2006, administration fees paid to FAF Advisors by the funds included in this report were as follows: |
| | | | | |
| Fund | | |
| |
| Real Estate Securities Fund | | $ | 1,244 | |
| International Fund | | | 2,688 | |
| Small Cap Growth Opportunities Fund | | | 489 | |
| Small Cap Select Fund | | | 1,361 | |
| Small Cap Value Fund | | | 649 | |
| Small-Mid Cap Core Fund | | | 152 | |
| Mid Cap Growth Opportunities Fund | | | 2,552 | |
| Mid Cap Value Fund | | | 1,264 | |
| Large Cap Growth Opportunities Fund | | | 1,507 | |
| Large Cap Select Fund | | | 682 | |
| Large Cap Value Fund | | | 1,415 | |
| Balanced Fund | | | 589 | |
| Equity Income Fund | | | 2,074 | |
| |
| |
| | SUB-ADVISORY FEES – J.P. Morgan Investment Management Inc. (“JPMorgan”) serves as investment sub-advisor to the International Fund pursuant to a sub-advisory agreement with FAF Advisors. For its services under the sub-advisory agreement with FAF Advisors, JPMorgan is paid a monthly fee by FAF Advisors equal, on an annual basis, to 0.34% of the first $100 million of the fund’s average daily net assets, 0.30% of the next $250 million of the fund’s average daily net assets, 0.24% of the next $1.25 billion of the fund’s average daily net assets and 0.22% of the fund’s average daily net assets in excess of $1.60 billion. |
| |
| | TRANSFER AGENT FEES – USBFS serves as the funds’ transfer agent pursuant to a transfer agent agreement with FAIF. Prior to July 1, 2006, the funds paid transfer agent fees of $18,500 per share class and additional per account fees for transfer agent services. These fees are allocated to each fund based upon the fund’s pro rata share of the aggregate average daily net assets of the funds that comprise FAIF. Under the transfer agent agreement, the funds also paid USBFS a fee equal to, on an annual basis, 0.10% of each fund’s average daily net assets. This fee was intended to compensate USBFS for its payments to financial institutions that establish and maintain omnibus accounts and provide customary services for such accounts. In addition to these fees, the funds reimbursed USBFS for out-of-pocket expenses incurred in providing transfer agent services. |
| |
| | Effective July 1, 2006, the funds are charged transfer agent fees based on a per shareholder account basis, subject to a minimum fee per share class. These fees are charged to each fund based on the number of accounts within that fund. The |
128 First American Funds Annual Report 2006
| |
| | $18,500 fee per share class that was charged in addition to per account fees was eliminated. As noted above, effective July 1, 2006, the 0.10% fee for shareholder services and payments to financial institutions was incorporated into the administration fee. The funds continue to reimburse USBFS for out-of-pocket expenses incurred in providing transfer agent services. |
| |
| | For the fiscal year ended October 31, 2006, transfer agent fees paid to USBFS by the funds included in this report were as follows: |
| | | | | |
| Fund | | |
| |
| Real Estate Securities Fund | | $ | 693 | |
| International Fund | | | 1,611 | |
| Small Cap Growth Opportunities Fund | | | 344 | |
| Small Cap Select Fund | | | 883 | |
| Small Cap Value Fund | | | 437 | |
| Small-Mid Cap Core Fund | | | 181 | |
| Mid Cap Growth Opportunities Fund | | | 1,661 | |
| Mid Cap Value Fund | | | 769 | |
| Large Cap Growth Opportunities Fund | | | 1,039 | |
| Large Cap Select Fund | | | 407 | |
| Large Cap Value Fund | | | 904 | |
| Balanced Fund | | | 423 | |
| Equity Income Fund | | | 1,326 | |
| |
| |
| | CUSTODIAN FEES – U.S. Bank serves as the custodian for each fund other than International Fund pursuant to a custodian agreement with FAIF. The fee for each fund (except International Fund) is equal to an annual rate of 0.005% of average daily net assets. State Street Bank (“SSB”) serves as International Fund’s custodian pursuant to a custodian agreement with FAIF. The International Fund pays SSB various asset-based fees and transaction charges based on the issuer’s country. All fees are computed daily and paid monthly. |
| |
| | Under the custodian agreements, interest earned on uninvested cash balances is used to reduce a portion of each fund’s custodian expenses. The International Fund has also entered into an agreement with SSB to receive certain credits to reduce the amount of custody fees incurred. These credits, if any, are disclosed as “Indirect payments from custodian” in the Statement of Operations. Conversely, the custodian charges a fee for any cash overdrafts incurred, which increases the fund’s custodian expenses. |
| |
| | For the fiscal year ended October 31, 2006, custodian fees were increased as a result of overdrafts, and decreased as a result of interest earned (and, for International Fund, as a result of other custodian credits) as follows: |
| | | | | | | | | |
| Fund | | Increased | | | Decreased | |
| |
| Real Estate Securities Fund | | $ | 1 | | | $ | 5 | |
| International Fund | | | 1 | | | | 553 | |
| Small Cap Growth Opportunities Fund | | | — | (1) | | | 6 | |
| Small Cap Select Fund | | | 6 | | | | 14 | |
| Small Cap Value Fund | | | 1 | | | | 2 | |
| Small-Mid Cap Core Fund | | | 1 | | | | 1 | |
| Mid Cap Growth Opportunities Fund | | | — | | | | 10 | |
| Mid Cap Value Fund | | | — | | | | 10 | |
| Large Cap Growth Opportunities Fund | | | 3 | | | | 2 | |
| Large Cap Select Fund | | | — | | | | 3 | |
| Large Cap Value Fund | | | — | | | | 1 | |
| Balanced Fund | | | 1 | | | | 6 | |
| Equity Income Fund | | | 2 | | | | 2 | |
| |
| | |
| | (1) | Due to the presentation of the financial statements in thousands, the number rounds to zero. |
| |
| | DISTRIBUTION AND SHAREHOLDER SERVICING FEES – Quasar Distributors, LLC (“Quasar”), a subsidiary of U.S. Bancorp, serves as the distributor of the funds pursuant to a distribution agreement with FAIF. Under the distribution agreement, and pursuant to a plan adopted by each fund under rule 12b-1 of the Investment Company Act, each fund pays Quasar a monthly distribution and/or shareholder servicing fee equal to an annual rate of 0.25%, 1.00%, 1.00%, and 0.50% of each fund’s average daily net assets attributable to Class A shares, Class B shares, Class C shares, and Class R shares, respectively. No distribution or shareholder servicing fees are paid by Class Y shares. These fees may be used by Quasar to provide compensation for sales support, distribution activities, and/or shareholder servicing activities. |
First American Funds Annual Report 2006 129
Notes to Financial Statements continued
| |
| | During the period, FAF Advisors also provided shareholder services pursuant to a shareholder servicing plan and agreement with FAIF with respect to the funds’ Class R shares. Under the shareholder servicing plan and agreement, each fund, except Small-Mid Cap Core Fund (which does not issue Class R shares), was required to pay FAF Advisors a monthly shareholder servicing fee equal to an annual rate of 0.15% of each fund’s average daily net assets of the Class R shares. FAF Advisors waived all fees under this plan and agreement. This agreement was terminated in September 2006. |
| |
| | Under these distribution and shareholder servicing agreements, the following amounts were retained by affiliates of FAF Advisors for the fiscal year ended October 31, 2006: |
| | | | | |
| Fund | | |
| |
| Real Estate Securities Fund | | $ | 342 | |
| International Fund | | | 96 | |
| Small Cap Growth Opportunities Fund | | | 143 | |
| Small Cap Select Fund | | | 295 | |
| Small Cap Value Fund | | | 110 | |
| Small-Mid Cap Core Fund | | | 60 | |
| Mid Cap Growth Opportunities Fund | | | 564 | |
| Mid Cap Value Fund | | | 266 | |
| Large Cap Growth Opportunities Fund | | | 235 | |
| Large Cap Select Fund | | | 16 | |
| Large Cap Value Fund | | | 222 | |
| Balanced Fund | | | 294 | |
| Equity Income Fund | | | 463 | |
| |
| |
| | OTHER FEES AND EXPENSES – In addition to the investment advisory fees, custodian fees, distribution and shareholder servicing fees, transfer agent fees, and administration fees, each fund is responsible for paying other operating expenses, including: legal, auditing, registration fees, postage and printing of shareholder reports, fees and expenses of independent directors, insurance, and other miscellaneous expenses. For the fiscal year ended October 31, 2006, legal fees and expenses of $74 were paid to a law firm of which an Assistant Secretary of the funds is a partner. |
| |
| | CONTINGENT DEFERRED SALES CHARGES – A contingent deferred sales charge (“CDSC”) is imposed on redemptions made in the Class B shares. The CDSC varies depending on the number of years from time of payment for the purchase of Class B shares until the redemption of such shares. Class B shares automatically convert to Class A shares after eight years. |
| | | | | |
| | | CDSC as a Percentage | |
| | | of Dollar Amount | |
| Year Since Purchase | | Subject to Charge | |
| |
| First | | | 5.00 | % |
| Second | | | 5.00 | |
| Third | | | 4.00 | |
| Fourth | | | 3.00 | |
| Fifth | | | 2.00 | |
| Sixth | | | 1.00 | |
| Seventh | | | — | |
| Eighth | | | — | |
| |
| |
| | A CDSC of 1.00% is imposed on redemptions made in Class C shares for the first 12 months. |
| |
| | The CDSC for Class B shares and Class C shares is imposed on the value of the purchased shares or the value at the time of redemption, whichever is less. |
130 First American Funds Annual Report 2006
| |
| | For the fiscal year ended October 31, 2006, total front-end sales charges and CDSCs retained by affiliates of FAF Advisors for distributing the funds’ shares were as follows: |
| | | | | |
| Fund | | |
| |
| Real Estate Securities Fund | | $ | 193 | |
| International Fund | | | 98 | |
| Small Cap Growth Opportunities Fund | | | 92 | |
| Small Cap Select Fund | | | 188 | |
| Small Cap Value Fund | | | 88 | |
| Small-Mid Cap Core Fund | | | 48 | |
| Mid Cap Growth Opportunities Fund | | | 310 | |
| Mid Cap Value Fund | | | 163 | |
| Large Cap Growth Opportunities Fund | | | 119 | |
| Large Cap Select Fund | | | 56 | |
| Large Cap Value Fund | | | 84 | |
| Balanced Fund | | | 99 | |
| Equity Income Fund | | | 176 | |
| |
| |
| 4 > | Capital Share Transactions |
| |
| | FAIF has 324 billion shares of $0.0001 par value capital stock authorized. Capital share transactions for the funds were as follows: |
| | | | | | | | | | | | | | | | | | | | | | | | | | | | | | | | | | | | | | | | | | |
| | | Real Estate | | | | International | | | | Small Cap Growth | | | |
| | | Securities Fund | | | | Fund | | | | Opportunities Fund | | | |
| | | | | | | | | | | |
| | | One-Month | | | | | | | | One-Month | | | | | | | | One-Month | | | | | |
| | | Fiscal | | | | | | | | Fiscal | | | | | | | | Fiscal | | | | | |
| | | Period | | | | | | | | Period | | | | | | | | Period | | | | | |
| | | Year Ended | | | Ended | | | Year Ended | | | | Year Ended | | | Ended | | | Year Ended | | | | Year Ended | | | Ended | | | Year Ended | | | |
| | | 10/31/06 | | | 10/31/05 | | | 9/30/05 | | | | 10/31/06 | | | 10/31/05 | | | 9/30/05 | | | | 10/31/06 | | | 10/31/05 | | | 9/30/05 | | | |
| | | | | | | | | | | |
| Class A: | | | | | | | | | | | | | | | | | | | | | | | | | | | | | | | | | | | | | | | | |
| | Shares issued | | | 4,130 | | | | 136 | | | | 2,268 | | | | | 944 | | | | 116 | | | | 900 | | | | | 4,199 | | | | 41 | | | | 805 | | | |
| | Shares issued in lieu of cash distributions | | | 997 | | | | — | | | | 504 | | | | | 37 | | | | — | | | | 23 | | | | | 735 | | | | — | | | | 553 | | | |
| | Shares redeemed | | | (2,737 | ) | | | (136 | ) | | | (1,219 | ) | | | | (1,467 | ) | | | (73 | ) | | | (1,335 | ) | | | | (1,598 | ) | | | (163 | ) | | | (2,445 | ) | | |
| | | | | | | | | |
Total Class A transactions | | | 2,390 | | | | — | | | | 1,553 | | | | | (486 | ) | | | 43 | | | | (412 | ) | | | | 3,336 | | | | (122 | ) | | | (1,087 | ) | | |
| | | | | | | | | |
| Class B: | | | | | | | | | | | | | | | | | | | | | | | | | | | | | | | | | | | | | | | | |
| | Shares issued | | | 100 | | | | 3 | | | | 57 | | | | | 90 | | | | 13 | | | | 56 | | | | | 27 | | | | 1 | | | | 28 | | | |
| | Shares issued in lieu of cash distributions | | | 27 | | | | — | | | | 19 | | | | | 2 | | | | — | | | | — | | | | | 84 | | | | — | | | | 57 | | | |
| | Shares redeemed | | | (57 | ) | | | (12 | ) | | | (98 | ) | | | | (165 | ) | | | (18 | ) | | | (235 | ) | | | | (149 | ) | | | (7 | ) | | | (130 | ) | | |
| | | | | | | | | |
Total Class B transactions | | | 70 | | | | (9 | ) | | | (22 | ) | | | | (73 | ) | | | (5 | ) | | | (179 | ) | | | | (38 | ) | | | (6 | ) | | | (45 | ) | | |
| | | | | | | | | |
| Class C: | | | | | | | | | | | | | | | | | | | | | | | | | | | | | | | | | | | | | | | | |
| | Shares issued | | | 295 | | | | 3 | | | | 75 | | | | | 69 | | | | 2 | | | | 70 | | | | | 50 | | | | 1 | | | | 23 | | | |
| | Shares issued in lieu of cash distributions | | | 31 | | | | — | | | | 20 | | | | | 2 | | | | — | | | | — | | | | | 30 | | | | — | | | | 27 | | | |
| | Shares redeemed | | | (77 | ) | | | (12 | ) | | | (96 | ) | | | | (157 | ) | | | (23 | ) | | | (269 | ) | | | | (78 | ) | | | (4 | ) | | | (132 | ) | | |
| | | | | | | | | |
Total Class C transactions | | | 249 | | | | (9 | ) | | | (1 | ) | | | | (86 | ) | | | (21 | ) | | | (199 | ) | | | | 2 | | | | (3 | ) | | | (82 | ) | | |
| | | | | | | | | |
| Class R: | | | | | | | | | | | | | | | | | | | | | | | | | | | | | | | | | | | | | | | | |
| | Shares issued | | | 421 | | | | 1 | | | | 3 | | | | | — | | | | — | | | | 35 | | | | | 68 | | | | — | | | | 1 | | | |
| | Shares issued in lieu of cash distributions | | | 5 | | | | — | | | | — | | | | | — | | | | — | | | | — | | | | | — | | | | — | | | | — | | | |
| | Shares redeemed | | | (76 | ) | | | — | | | | (1 | ) | | | | — | | | | (13 | ) | | | (22 | ) | | | | (3 | ) | | | — | | | | (1 | ) | | |
| | | | | | | | | |
Total Class R transactions | | | 350 | | | | 1 | | | | 2 | | | | | — | | | | (13 | ) | | | 13 | | | | | 65 | | | | — | | | | — | | | |
| | | | | | | | | |
| Class Y: | | | | | | | | | | | | | | | | | | | | | | | | | | | | | | | | | | | | | | | | |
| | Shares issued | | | 7,940 | | | | 283 | | | | 6,209 | | | | | 16,815 | | | | 2,883 | | | | 28,181 | | | | | 1,850 | | | | 143 | | | | 1,632 | | | |
| | Shares issued in lieu of cash distributions | | | 1,946 | | | | — | | | | 1,073 | | | | | 865 | | | | — | | | | 542 | | | | | 1,388 | | | | — | | | | 839 | | | |
| | Shares redeemed | | | (4,939 | ) | | | (811 | ) | | | (5,485 | ) | | | | (26,402 | ) | | | (1,081 | ) | | | (16,895 | ) | | | | (3,669 | ) | | | (190 | ) | | | (3,522 | ) | | |
| | | | | | | | | |
Total Class Y transactions | | | 4,947 | | | | (528 | ) | | | 1,797 | | | | | (8,722 | ) | | | 1,802 | | | | 11,828 | | | | | (431 | ) | | | (47 | ) | | | (1,051 | ) | | |
| | | | | | | | | |
Net increase (decrease) in capital shares | | | 8,006 | | | | (545 | ) | | | 3,329 | | | | | (9,367 | ) | | | 1,806 | | | | 11,051 | | | | | 2,934 | | | | (178 | ) | | | (2,265 | ) | | |
| | | | | | | | | |
First American Funds Annual Report 2006 131
Notes to Financial Statements continued
| | | | | | | | | | | | | | | | | | | | | | | | | | | | | | | | | | | | | | | | | | |
| | | Small Cap | | | | Small Cap | | | | Small-Mid Cap | | | |
| | | Select Fund | | | | Value Fund | | | | Core Fund | | | |
| | | | | | | | | | | |
| | | One-Month | | | | | | | | One-Month | | | | | | | | One-Month | | | | | |
| | | Fiscal | | | | | | | | Fiscal | | | | | | | | Fiscal | | | | | |
| | | Period | | | | | | | | Period | | | | | | | | Period | | | | | |
| | | Year Ended | | | Ended | | | Year Ended | | | | Year Ended | | | Ended | | | Year Ended | | | | Year Ended | | | Ended | | | Year Ended | | | |
| | | 10/31/06 | | | 10/31/05 | | | 9/30/05 | | | | 10/31/06 | | | 10/31/05 | | | 9/30/05 | | | | 10/31/06 | | | 10/31/05 | | | 9/30/05 | | | |
| | | | | | | | | | | |
| Class A: | | | | | | | | | | | | | | | | | | | | | | | | | | | | | | | | | | | | | | | | |
| | Shares issued | | | 9,110 | | | | 151 | | | | 1,586 | | | | | 865 | | | | 34 | | | | 526 | | | | | 1,273 | | | | 97 | | | | 653 | | | |
| | Shares issued in lieu of cash distributions | | | 1,595 | | | | — | | | | 1,274 | | | | | 769 | | | | — | | | | 432 | | | | | — | | | | — | | | | — | | | |
| | Shares redeemed | | | (2,829 | ) | | | (109 | ) | | | (2,207 | ) | | | | (711 | ) | | | (57 | ) | | | (656 | ) | | | | (1,315 | ) | | | (85 | ) | | | (1,583 | ) | | |
| | | | | | | | | |
Total Class A transactions | | | 7,876 | | | | 42 | | | | 653 | | | | | 923 | | | | (23 | ) | | | 302 | | | | | (42 | ) | | | 12 | | | | (930 | ) | | |
| | | | | | | | | |
| Class B: | | | | | | | | | | | | | | | | | | | | | | | | | | | | | | | | | | | | | | | | |
| | Shares issued | | | 169 | | | | 2 | | | | 118 | | | | | 32 | | | | 2 | | | | 57 | | | | | 52 | | | | 3 | | | | 64 | | | |
| | Shares issued in lieu of cash distributions | | | 260 | | | | — | | | | 206 | | | | | 167 | | | | — | | | | 104 | | | | | — | | | | — | | | | — | | | |
| | Shares redeemed | | | (245 | ) | | | (15 | ) | | | (221 | ) | | | | (222 | ) | | | (13 | ) | | | (185 | ) | | | | (435 | ) | | | (40 | ) | | | (655 | ) | | |
| | | | | | | | | |
Total Class B transactions | | | 184 | | | | (13 | ) | | | 103 | | | | | (23 | ) | | | (11 | ) | | | (24 | ) | | | | (383 | ) | | | (37 | ) | | | (591 | ) | | |
| | | | | | | | | |
| Class C: | | | | | | | | | | | | | | | | | | | | | | | | | | | | | | | | | | | | | | | | |
| | Shares issued | | | 568 | | | | 12 | | | | 229 | | | | | 61 | | | | 2 | | | | 60 | | | | | 231 | | | | 7 | | | | 52 | | | |
| | Shares issued in lieu of cash distributions | | | 217 | | | | — | | | | 192 | | | | | 85 | | | | — | | | | 50 | | | | | — | | | | — | | | | — | | | |
| | Shares redeemed | | | (385 | ) | | | (47 | ) | | | (364 | ) | | | | (133 | ) | | | (8 | ) | | | (93 | ) | | | | (235 | ) | | | (17 | ) | | | (329 | ) | | |
| | | | | | | | | |
Total Class C transactions | | | 400 | | | | (35 | ) | | | 57 | | | | | 13 | | | | (6 | ) | | | 17 | | | | | (4 | ) | | | (10 | ) | | | (277 | ) | | |
| | | | | | | | | |
Class R:(1) | | | | | | | | | | | | | | | | | | | | | | | | | | | | | | | | | | | | | | | | |
| | Shares issued | | | 176 | | | | 8 | | | | 22 | | | | | 133 | | | | — | | | | — | | | | | — | | | | — | | | | — | | | |
| | Shares issued in lieu of cash distributions | | | 6 | | | | — | | | | 1 | | | | | 1 | | | | — | | | | — | | | | | — | | | | — | | | | — | | | |
| | Shares redeemed | | | (24 | ) | | | (6 | ) | | | (4 | ) | | | | (13 | ) | | | — | | | | — | | | | | — | | | | — | | | | — | | | |
| | | | | | | | | |
Total Class R transactions | | | 158 | | | | 2 | | | | 19 | | | | | 121 | | | | — | | | | — | | | | | — | | | | — | | | | — | | | |
| | | | | | | | | |
| Class Y: | | | | | | | | | | | | | | | | | | | | | | | | | | | | | | | | | | | | | | | | |
| | Shares issued | | | 8,486 | | | | 233 | | | | 6,525 | | | | | 3,416 | | | | 175 | | | | 3,781 | | | | | 5,352 | | | | 140 | | | | 2,087 | | | |
| | Shares issued in lieu of cash distributions | | | 7,353 | | | | — | | | | 6,437 | | | | | 4,769 | | | | — | | | | 3,016 | | | | | — | | | | — | | | | — | | | |
| | Shares redeemed | | | (12,717 | ) | | | (934 | ) | | | (16,385 | ) | | | | (6,538 | ) | | | (509 | ) | | | (7,079 | ) | | | | (2,340 | ) | | | (264 | ) | | | (3,915 | ) | | |
| | | | | | | | | |
Total Class Y transactions | | | 3,122 | | | | (701 | ) | | | (3,423 | ) | | | | 1,647 | | | | (334 | ) | | | (282 | ) | | | | 3,012 | | | | (124 | ) | | | (1,828 | ) | | |
| | | | | | | | | |
Net increase (decrease) in capital shares | | | 11,740 | | | | (705 | ) | | | (2,591 | ) | | | | 2,681 | | | | (374 | ) | | | 13 | | | | | 2,583 | | | | (159 | ) | | | (3,626 | ) | | |
| | | | | | | | | |
| |
| (1) | Class R is not offered by the Small-Mid Cap Core Fund. |
| | | | | | | | | | | | | | | | | | | | | | | | | | | | | | | | | | | | | | | | | | |
| | | Mid Cap Growth | | | | Mid Cap | | | | Large Cap Growth | | | |
| | | Opportunities Fund | | | | Value Fund | | | | Opportunities Fund | | | |
| | | | | | | | | | | |
| | | One-Month | | | | | | | | One-Month | | | | | | | | One-Month | | | | | |
| | | Fiscal | | | | | | | | Fiscal | | | | | | | | Fiscal | | | | | |
| | | Period | | | | | | | | Period | | | | | | | | Period | | | | | |
| | | Year Ended | | | Ended | | | Year Ended | | | | Year Ended | | | Ended | | | Year Ended | | | | Year Ended | | | Ended | | | Year Ended | | | |
| | | 10/31/06 | | | 10/31/05 | | | 9/30/05 | | | | 10/31/06 | | | 10/31/05 | | | 9/30/05 | | | | 10/31/06 | | | 10/31/05 | | | 9/30/05 | | | |
| | | | | | | | | | | |
| Class A: | | | | | | | | | | | | | | | | | | | | | | | | | | | | | | | | | | | | | | | | |
| | Shares issued | | | 3,381 | | | | 176 | | | | 3,556 | | | | | 4,315 | | | | 186 | | | | 1,266 | | | | | 459 | | | | 34 | | | | 565 | | | |
| | Shares issued in lieu of cash distributions | | | 775 | | | | — | | | | 683 | | | | | 155 | | | | — | | | | 7 | | | | | — | | | | — | | | | 8 | | | |
| | Shares redeemed | | | (4,096 | ) | | | (106 | ) | | | (1,128 | ) | | | | (929 | ) | | | (37 | ) | | | (510 | ) | | | | (1,174 | ) | | | (89 | ) | | | (1,246 | ) | | |
| | | | | | | | | |
Total Class A transactions | | | 60 | | | | 70 | | | | 3,111 | | | | | 3,541 | | | | 149 | | | | 763 | | | | | (715 | ) | | | (55 | ) | | | (673 | ) | | |
| | | | | | | | | |
| Class B: | | | | | | | | | | | | | | | | | | | | | | | | | | | | | | | | | | | | | | | | |
| | Shares issued | | | 63 | | | | 3 | | | | 90 | | | | | 73 | | | | 4 | | | | 91 | | | | | 27 | | | | 2 | | | | 45 | | | |
| | Shares issued in lieu of cash distributions | | | 42 | | | | — | | | | 49 | | | | | 21 | | | | — | | | | — | | | | | — | | | | — | | | | 1 | | | |
| | Shares redeemed | | | (79 | ) | | | (4 | ) | | | (58 | ) | | | | (157 | ) | | | (28 | ) | | | (179 | ) | | | | (265 | ) | | | (22 | ) | | | (356 | ) | | |
| | | | | | | | | |
Total Class B transactions | | | 26 | | | | (1 | ) | | | 81 | | | | | (63 | ) | | | (24 | ) | | | (88 | ) | | | | (238 | ) | | | (20 | ) | | | (310 | ) | | |
| | | | | | | | | |
| Class C: | | | | | | | | | | | | | | | | | | | | | | | | | | | | | | | | | | | | | | | | |
| | Shares issued | | | 240 | | | | 11 | | | | 182 | | | | | 460 | | | | 19 | | | | 179 | | | | | 19 | | | | 2 | | | | 45 | | | |
| | Shares issued in lieu of cash distributions | | | 45 | | | | — | | | | 54 | | | | | 17 | | | | — | | | | — | | | | | — | | | | — | | | | — | | | |
| | Shares redeemed | | | (183 | ) | | | (44 | ) | | | (142 | ) | | | | (95 | ) | | | (7 | ) | | | (44 | ) | | | | (120 | ) | | | (14 | ) | | | (160 | ) | | |
| | | | | | | | | |
Total Class C transactions | | | 102 | | | | (33 | ) | | | 94 | | | | | 382 | | | | 12 | | | | 135 | | | | | (101 | ) | | | (12 | ) | | | (115 | ) | | |
| | | | | | | | | |
| Class R: | | | | | | | | | | | | | | | | | | | | | | | | | | | | | | | | | | | | | | | | |
| | Shares issued | | | 338 | | | | 4 | | | | 145 | | | | | 685 | | | | 18 | | | | 15 | | | | | 9 | | | | 1 | | | | 10 | | | |
| | Shares issued in lieu of cash distributions | | | 27 | | | | — | | | | — | | | | | 4 | | | | — | | | | — | | | | | — | | | | — | | | | — | | | |
| | Shares redeemed | | | (66 | ) | | | (2 | ) | | | (12 | ) | | | | (55 | ) | | | — | | | | — | | | | | (1 | ) | | | — | | | | — | | | |
| | | | �� | | | | | |
Total Class R transactions | | | 299 | | | | 2 | | | | 133 | | | | | 634 | | | | 18 | | | | 15 | | | | | 8 | | | | 1 | | | | 10 | | | |
| | | | | | | | | |
| Class Y: | | | | | | | | | | | | | | | | | | | | | | | | | | | | | | | | | | | | | | | | |
| | Shares issued | | | 4,107 | | | | 228 | | | | 5,339 | | | | | 4,891 | | | | 271 | | | | 6,771 | | | | | 4,473 | | | | 501 | | | | 6,018 | | | |
| | Shares issued in lieu of cash distributions | | | 2,385 | | | | — | | | | 3,346 | | | | | 1,130 | | | | — | | | | 99 | | | | | — | | | | — | | | | 59 | | | |
| | Shares redeemed | | | (7,045 | ) | | | (489 | ) | | | (8,873 | ) | | | | (3,614 | ) | | | (357 | ) | | | (3,514 | ) | | | | (8,081 | ) | | | (350 | ) | | | (22,930 | ) | | |
| | | | | | | | | |
Total Class Y transactions | | | (553 | ) | | | (261 | ) | | | (188 | ) | | | | 2,407 | | | | (86 | ) | | | 3,356 | | | | | (3,608 | ) | | | 151 | | | | (16,853 | ) | | |
| | | | | | | | | |
Net increase (decrease) in capital shares | | | (66 | ) | | | (223 | ) | | | 3,231 | | | | | 6,901 | | | | 69 | | | | 4,181 | | | | | (4,654 | ) | | | 65 | | | | (17,941 | ) | | |
| | | | | | | | | |
132 First American Funds Annual Report 2006
| | | | | | | | | | | | | | | | | | | | | | | | | | | | | | | | | | | | | | | | | | |
| | | Large Cap | | | | Large Cap | | | | Balanced | | | |
| | | Select Fund | | | | Value Fund | | | | Fund | | | |
| | | | | | | | | | | |
| | | One-Month | | | | | | | | One-Month | | | | | | | | One-Month | | | | | |
| | | Fiscal | | | | | | | | Fiscal | | | | | | | | Fiscal | | | | | |
| | | Period | | | | | | | | Period | | | | | | | | Period | | | | | |
| | | Year Ended | | | Ended | | | Year Ended | | | | Year Ended | | | Ended | | | Year Ended | | | | Year Ended | | | Ended | | | Year Ended | | | |
| | | 10/31/06 | | | 10/31/05 | | | 9/30/05 | | | | 10/31/06 | | | 10/31/05 | | | 9/30/05 | | | | 10/31/06 | | | 10/31/05 | | | 9/30/05 | | | |
| | | | | | | | | | | |
| Class A: | | | | | | | | | | | | | | | | | | | | | | | | | | | | | | | | | | | | | | | | |
| | Shares issued | | | 345 | | | | 35 | | | | 334 | | | | | 522 | | | | 53 | | | | 935 | | | | | 877 | | | | 120 | | | | 1,220 | | | |
| | Shares issued in lieu of cash distributions | | | 10 | | | | — | | | | 1 | | | | | 237 | | | | — | | | | 54 | | | | | 154 | | | | — | | | | 145 | | | |
| | Shares redeemed | | | (281 | ) | | | (4 | ) | | | (26 | ) | | | | (1,595 | ) | | | (71 | ) | | | (1,521 | ) | | | | (2,330 | ) | | | (146 | ) | | | (3,146 | ) | | |
| | | | | | | | | |
Total Class A transactions | | | 74 | | | | 31 | | | | 309 | | | | | (836 | ) | | | (18 | ) | | | (532 | ) | | | | (1,299 | ) | | | (26 | ) | | | (1,781 | ) | | |
| | | | | | | | | |
| Class B: | | | | | | | | | | | | | | | | | | | | | | | | | | | | | | | | | | | | | | | | |
| | Shares issued | | | 14 | | | | 1 | | | | 25 | | | | | 31 | | | | 1 | | | | 38 | | | | | 34 | | | | 4 | | | | 100 | | | |
| | Shares issued in lieu of cash distributions | | | 1 | | | | — | | | | — | | | | | 25 | | | | — | | | | 3 | | | | | 12 | | | | — | | | | 13 | | | |
| | Shares redeemed | | | (13 | ) | | | — | | | | (7 | ) | | | | (323 | ) | | | (36 | ) | | | (577 | ) | | | | (648 | ) | | | (89 | ) | | | (1,091 | ) | | |
| | | | | | | | | |
Total Class B transactions | | | 2 | | | | 1 | | | | 18 | | | | | (267 | ) | | | (35 | ) | | | (536 | ) | | | | (602 | ) | | | (85 | ) | | | (978 | ) | | |
| | | | | | | | | |
| Class C: | | | | | | | | | | | | | | | | | | | | | | | | | | | | | | | | | | | | | | | | |
| | Shares issued | | | 5 | | | | — | | | | 10 | | | | | 26 | | | | 3 | | | | 36 | | | | | 44 | | | | 3 | | | | 79 | | | |
| | Shares issued in lieu of cash distributions | | | 1 | | | | — | | | | — | | | | | 10 | | | | — | | | | 1 | | | | | 2 | | | | — | | | | 4 | | | |
| | Shares redeemed | | | (2 | ) | | | — | | | | (2 | ) | | | | (78 | ) | | | (12 | ) | | | (121 | ) | | | | (226 | ) | | | (62 | ) | | | (181 | ) | | |
| | | | | | | | | |
Total Class C transactions | | | 4 | | | | — | | | | 8 | | | | | (42 | ) | | | (9 | ) | | | (84 | ) | | | | (180 | ) | | | (59 | ) | | | (98 | ) | | |
| | | | | | | | | |
| Class R: | | | | | | | | | | | | | | | | | | | | | | | | | | | | | | | | | | | | | | | | |
| | Shares issued | | | 10 | | | | — | | | | — | | | | | 7 | | | | — | | | | — | | | | | 3 | | | | — | | | | — | | | |
| | Shares issued in lieu of cash distributions | | | — | | | | — | | | | — | | | | | — | | | | — | | | | — | | | | | — | | | | — | | | | — | | | |
| | Shares redeemed | | | (2 | ) | | | — | | | | — | | | | | — | | | | — | | | | — | | | | | (1 | ) | | | — | | | | — | | | |
| | | | | | | | | |
Total Class R transactions | | | 8 | | | | — | | | | — | | | | | 7 | | | | — | | | | — | | | | | 2 | | | | — | | | | — | | | |
| | | | | | | | | |
| Class Y: | | | | | | | | | | | | | | | | | | | | | | | | | | | | | | | | | | | | | | | | |
| | Shares issued | | | 12,008 | | | | 1,217 | | | | 16,640 | | | | | 4,621 | | | | 230 | | | | 4,666 | | | | | 3,312 | | | | 248 | | | | 3,524 | | | |
| | Shares issued in lieu of cash distributions | | | 515 | | | | — | | | | 358 | | | | | 1,056 | | | | 5 | | | | 335 | | | | | 393 | | | | — | | | | 382 | | | |
| | Shares redeemed | | | (5,046 | ) | | | (160 | ) | | | (17,545 | ) | | | | (6,211 | ) | | | (502 | ) | | | (26,155 | ) | | | | (6,111 | ) | | | (650 | ) | | | (8,890 | ) | | |
| | | | | | | | | |
Total Class Y transactions | | | 7,477 | | | | 1,057 | | | | (547 | ) | | | | (534 | ) | | | (267 | ) | | | (21,154 | ) | | | | (2,406 | ) | | | (402 | ) | | | (4,984 | ) | | |
| | | | | | | | | |
Net increase (decrease) in capital shares | | | 7,565 | | | | 1,089 | | | | (212 | ) | | | | (1,672 | ) | | | (329 | ) | | | (22,306 | ) | | | | (4,485 | ) | | | (572 | ) | | | (7,841 | ) | | |
| | | | | | | | | |
| | | | | | | | | | | | | | | | |
| | | Equity | | | |
| | | Income Fund | | | |
| |
| | | One-Month | | | |
| | | Fiscal | | | |
| | | Period | | | |
| | | Year Ended | | | Ended | | | Year Ended | | | |
| | | 10/31/06 | | | 10/31/05 | | | 9/30/05 | | | |
| |
| Class A: | | | | | | | | | | | | | | |
| | Shares issued | | | 876 | | | | 64 | | | | 1,568 | | | |
| | Shares issued in lieu of cash distributions | | | 220 | | | | 6 | | | | 222 | | | |
| | Shares redeemed | | | (2,869 | ) | | | (226 | ) | | | (3,494 | ) | | |
| |
Total Class A transactions | | | (1,773 | ) | | | (156 | ) | | | (1,704 | ) | | |
| |
| Class B: | | | | | | | | | | | | | | |
| | Shares issued | | | 67 | | | | 5 | | | | 144 | | | |
| | Shares issued in lieu of cash distributions | | | 20 | | | | — | | | | 17 | | | |
| | Shares redeemed | | | (375 | ) | | | (27 | ) | | | (473 | ) | | |
| |
Total Class B transactions | | | (288 | ) | | | (22 | ) | | | (312 | ) | | |
| |
| Class C: | | | | | | | | | | | | | | |
| | Shares issued | | | 63 | | | | 8 | | | | 92 | | | |
| | Shares issued in lieu of cash distributions | | | 14 | | | | — | | | | 14 | | | |
| | Shares redeemed | | | (492 | ) | | | (50 | ) | | | (457 | ) | | |
| |
Total Class C transactions | | | (415 | ) | | | (42 | ) | | | (351 | ) | | |
| |
| Class R: | | | | | | | | | | | | | | |
| | Shares issued | | | 8 | | | | 1 | | | | 32 | | | |
| | Shares issued in lieu of cash distributions | | | — | | | | — | | | | — | | | |
| | Shares redeemed | | | (7 | ) | | | — | | | | (2 | ) | | |
| |
Total Class R transactions | | | 1 | | | | 1 | | | | 30 | | | |
| |
| Class Y: | | | | | | | | | | | | | | |
| | Shares issued | | | 5,379 | | | | 333 | | | | 12,906 | | | |
| | Shares issued in lieu of cash distributions | | | 637 | | | | 17 | | | | 681 | | | |
| | Shares redeemed | | | (20,386 | ) | | | (1,701 | ) | | | (36,568 | ) | | |
| |
Total Class Y transactions | | | (14,370 | ) | | | (1,351 | ) | | | (22,981 | ) | | |
| |
Net decrease in capital shares | | | (16,845 | ) | | | (1,570 | ) | | | (25,318 | ) | | |
| |
First American Funds Annual Report 2006 133
Notes to Financial Statements continued
| |
| | Class B shares converted to Class A shares (reflected above as Class A shares issued and Class B shares redeemed) during the fiscal year ended October 31, 2006, the one-month fiscal period ended October 31, 2005, and the fiscal year ended September 30, 2005, were as follows: |
| | | | | | | | | | | | | |
| | | | | One-Month | | | |
| | | | | Fiscal | | | |
| | | Year Ended | | | Period Ended | | | Year Ended | |
| Fund | | 10/31/06 | | | 10/31/05 | | | 9/30/05 | |
| |
| Real Estate Securities Fund | | | 13 | | | | 4 | | | | 23 | |
| International Fund | | | 41 | | | | 3 | | | | 40 | |
| Small Cap Growth Opportunities Fund | | | 43 | | | | 1 | | | | 10 | |
| Small Cap Select Fund | | | 66 | | | | 2 | | | | 38 | |
| Small Cap Value Fund | | | 88 | | | | 6 | | | | 77 | |
| Small-Mid Cap Core Fund | | | 143 | | | | 15 | | | | 138 | |
| Mid Cap Growth Opportunities Fund | | | 19 | | | | — | (1) | | | 8 | |
| Mid Cap Value Fund | | | 78 | | | | 16 | | | | 91 | |
| Large Cap Growth Opportunities Fund | | | 125 | | | | 10 | | | | 176 | |
| Large Cap Select Fund | | | 1 | | | | — | | | | — | (1) |
| Large Cap Value Fund | | | 185 | | | | 27 | | | | 326 | |
| Balanced Fund | | | 331 | | | | 48 | | | | 469 | |
| Equity Income Fund | | | 110 | | | | 7 | | | | 175 | |
| |
| | |
| | (1) | Due to the presentation of the financial statements in thousands, the number rounds to zero. |
| |
| 5 > | Investment Security Transactions |
| |
| | During the fiscal year ended October 31, 2006, purchases of securities and proceeds from sales of securities, other than temporary investments in short-term securities, were as follows: |
| | | | | | | | | | | | | | | | | |
| | | U.S. Government | | Other Investment |
| | | Securities | | Securities |
| | | | | | | |
| Fund | | Purchases | | | Sales | | | Purchases | | | Sales | |
| |
| Real Estate Securities Fund | | $ | — | | | $ | — | | | $ | 1,338,017 | | | $ | 1,241,185 | |
| International Fund | | | — | | | | — | | | | 292,438 | | | | 361,065 | |
| Small Cap Growth Opportunities Fund | | | — | | | | — | | | | 644,340 | | | | 649,797 | |
| Small Cap Select Fund | | | — | | | | — | | | | 947,186 | | | | 953,718 | |
| Small Cap Value Fund | | | — | | | | — | | | | 392,886 | | | | 458,255 | |
| Small-Mid Cap Core Fund | | | — | | | | — | | | | 128,744 | | | | 103,948 | |
| Mid Cap Growth Opportunities Fund | | | — | | | | — | | | | 1,213,295 | | | | 1,349,590 | |
| Mid Cap Value Fund | | | — | | | | — | | | | 676,841 | | | | 543,322 | |
| Large Cap Growth Opportunities Fund | | | — | | | | — | | | | 901,521 | | | | 1,025,156 | |
| Large Cap Select Fund | | | — | | | | — | | | | 570,391 | | | | 468,703 | |
| Large Cap Value Fund | | | — | | | | — | | | | 490,314 | | | | 560,437 | |
| Balanced Fund | | | 205,550 | | | | 206,192 | | | | 330,362 | | | | 363,838 | |
| Equity Income Fund | | | — | | | | — | | | | 301,243 | | | | 557,071 | |
| |
| |
| | The aggregate gross unrealized appreciation and depreciation of securities held by the funds and the total cost of securities (including cost of securities purchased with proceeds from securities lending) for federal tax purposes at October 31, 2006, were as follows: |
| | | | | | | | | | | | | | | | | |
| | | Aggregate | | | Aggregate | | | | | Federal | |
| | | Gross | | | Gross | | | | | Income | |
| Fund | | Appreciation | | | Depreciation | | | Net | | | Tax Cost | |
| |
| Real Estate Securities Fund | | $ | 269,903 | | | $ | (5,367 | ) | | $ | 264,536 | | | $ | 1,227,282 | |
| International Fund | | | 471,649 | | | | (18,792 | ) | | | 452,857 | | | | 1,720,422 | |
| Small Cap Growth Opportunities Fund | | | 32,469 | | | | (19,712 | ) | | | 12,757 | | | | 472,821 | |
| Small Cap Select Fund | | | 140,031 | | | | (44,313 | ) | | | 95,718 | | | | 1,291,532 | |
| Small Cap Value Fund | | | 68,630 | | | | (10,135 | ) | | | 58,495 | | | | 527,350 | |
| Small-Mid Cap Core Fund | | | 10,706 | | | | (2,954 | ) | | | 7,752 | | | | 132,856 | |
| Mid Cap Growth Opportunities Fund | | | 318,440 | | | | (32,018 | ) | | | 286,422 | | | | 1,922,626 | |
| Mid Cap Value Fund | | | 148,946 | | | | (9,928 | ) | | | 139,018 | | | | 1,053,366 | |
| Large Cap Growth Opportunities Fund | | | 120,326 | | | | (13,969 | ) | | | 106,357 | | | | 991,440 | |
| Large Cap Select Fund | | | 57,296 | | | | (5,043 | ) | | | 52,253 | | | | 533,566 | |
| Large Cap Value Fund | | | 182,792 | | | | (7,648 | ) | | | 175,144 | | | | 1,005,217 | |
| Balanced Fund | | | 38,077 | | | | (3,986 | ) | | | 34,091 | | | | 437,015 | |
| Equity Income Fund | | | 360,476 | | | | (3,355 | ) | | | 357,121 | | | | 1,059,287 | |
| |
134 First American Funds Annual Report 2006
| |
| | The difference between cost for financial statement purposes and federal tax purposes is primarily due to losses deferred from wash sales, investments in limited partnerships and REITs, the amount of gain (loss) recognized for tax purposes due to mark-to-market adjustments on open futures contracts and the mark-to-market of certain PFICs for tax purposes. |
| |
| 6 > | Concentration of Risks |
| |
| | Portfolios that primarily invest in a particular sector may experience greater volatility than portfolios investing in a broad range of industry sectors. Real Estate Securities Fund primarily invests in income-producing common stocks of publicly traded companies engaged in the real estate industry. The real estate industry has been subject to substantial fluctuations and declines on a local, regional, and national basis in the past and that may continue in the future. As of October 31, 2006, Small Cap Growth Opportunities Fund and Large Cap Growth Opportunities Fund each had a significant portion of their assets invested in the information technology sector, which could be more sensitive to short product cycles and aggressive pricing than the technology industry as a whole. As of the same date, International Fund, Small Cap Value Fund, Mid Cap Value Fund, and Large Cap Value Fund had significant portions of their assets invested in the financials sector. The financials sector may be more greatly impacted by the performance of the overall economy, interest rates, competition, and consumer confidence and spending. |
| |
| | The funds enter into contracts that contain a variety of indemnifications. The funds’ maximum exposure under these arrangements is unknown. However, the funds have not had prior claims of losses pursuant to these contracts and expect the risk of loss to be remote. |
| |
| 8 > | Additional Information Related to Small Cap Growth Opportunities Fund |
| |
| | As a result of an internal review, FAF Advisors uncovered potentially improper trading of a portfolio security held in Small Cap Growth Opportunities Fund, which occurred in April 2002. FAF Advisors reported this matter to the fund’s board of directors and to the SEC. The SEC commenced an investigation of the matter and the Staff of the SEC has advised the fund that it intends to recommend that the SEC seek disgorgement from the fund of any economic benefit the fund received (plus prejudgment interest) as a result of the alleged improper trading. If the fund is required to make any such payments, FAF Advisors has agreed to hold the fund harmless and make the payments itself. Accordingly, this matter is not expected to have any impact on the fund’s NAV. |
| |
| 9 > | Redemption-in-Kind Transaction |
| |
| | In July 2006, $8,753 was redeemed from Small Cap Growth Opportunities Fund as a redemption-in-kind transaction. In this transaction the fund paid redemption proceeds by distributing a proportionate amount of securities in the fund’s portfolio. Remaining shareholders in the fund did not recognize any additional capital gains from the transaction. |
| |
| 10 > | New Accounting Pronouncements |
| |
| | On July 13, 2006, the Financial Accounting Standards Board (FASB) released FASB Interpretation No. 48 “Accounting for Uncertainty in Income Taxes” (FIN 48). FIN 48 provides guidance for how uncertain tax positions should be recognized, measured, presented, and disclosed in the financial statements. FIN 48 requires the evaluation of tax positions taken or expected to be taken in the course of preparing the funds’ tax returns to determine whether the tax positions are “more-likely-than-not” of being sustained by the applicable tax authority. Tax positions not deemed to meet the more-likely-than-not threshold would be recorded as a tax benefit or expense in the current year. Adoption of FIN 48 is required for fiscal years beginning after December 15, 2006 and is to be applied to all open tax years as of the effective date. At this time, management is evaluating the implications of FIN 48 and its impact in the financial statements has not yet been determined. |
| |
| | In September 2006, the FASB issued Statement on Financial Accounting Standards No. 157, “Fair Value Measurements” (FAS 157). FAS 157 clarifies the definition of fair value for financial reporting, establishes a framework for measuring fair value, and requires additional disclosures about the use of fair value measurements. FAS 157 is effective for financial statements issued for fiscal years beginning after November 15, 2007 and interim periods within those fiscal years. As of October 31, 2006, the funds do not believe the adoption of FAS 157 will impact the amounts reported in the financial statements; however, additional disclosures will be required about the inputs used to develop the measurements of fair value and the effect of certain of the measurements reported in the Statement of Operations for a fiscal period. |
First American Funds Annual Report 2006 135
NOTICE TO SHAREHOLDERS October 31, 2006 (unaudited)
TAX INFORMATION
| |
| | The information set forth below is for each fund’s fiscal year as required by federal laws. Most shareholders, however, must report distributions on a calendar year basis for income tax purposes, which may include distributions for portions of two fiscal years of a fund. Accordingly, the information needed for income tax purposes will be sent in early 2007 on Form 1099. Please consult your tax advisor for proper treatment of this information. |
| |
| | For the fiscal year ended October 31, 2006, each fund has designated long-term capital gains, ordinary income, dividends qualifying for the corporate received deduction, and qualified dividend income with regard to distributions paid during the year as follows: |
| | | | | | | | | | | | | | | | | | | | | |
| | | Long Term | | | Ordinary | | | | | Corporate | | | |
| | | Capital Gains | | | Income | | | Total | | | Dividends | | | Qualified | |
| | | Distributions | | | Distributions | | | Distributions | | | Received | | | Dividend | |
| Fund | | (Tax Basis) (a) | | | (Tax Basis) (a) | | | (Tax Basis) | | | Deduction (b) | | | Income (b)(c) | |
| | |
| Real Estate Securities Fund | | | 53 | % | | | 47 | % | | | 100 | % | | | 0.89 | % | | | 1.31 | % |
| International Fund(d) | | | 0 | | | | 100 | | | | 100 | | | | 0.00 | | | | 100.00 | |
| Small Cap Growth Opportunities Fund | | | 15 | | | | 85 | | | | 100 | | | | 1.20 | | | | 1.31 | |
| Small Cap Select Fund | | | 68 | | | | 32 | | | | 100 | | | | 6.30 | | | | 6.54 | |
| Small Cap Value Fund | | | 87 | | | | 13 | | | | 100 | | | | 36.20 | | | | 37.11 | |
| Small-Mid Cap Core Fund | | | 0 | | | | 0 | | | | 0 | | | | 0.00 | | | | 0.00 | |
| Mid Cap Growth Opportunities Fund | | | 66 | | | | 34 | | | | 100 | | | | 9.80 | | | | 10.46 | |
| Mid Cap Value Fund | | | 84 | | | | 16 | | | | 100 | | | | 44.90 | | | | 46.36 | |
| Large Cap Growth Opportunities Fund | | | 0 | | | | 0 | | | | 0 | | | | 0.00 | | | | 0.00 | |
| Large Cap Select Fund | | | 40 | | | | 60 | | | | 100 | | | | 53.10 | | | | 54.35 | |
| Large Cap Value Fund | | | 69 | | | | 31 | | | | 100 | | | | 63.70 | | | | 66.72 | |
| Balanced Fund | | | 0 | | | | 100 | | | | 100 | | | | 36.30 | | | | 38.43 | |
| Equity Income Fund | | | 26 | | | | 74 | | | | 100 | | | | 100.00 | | | | 100.00 | |
| |
| | |
| | (a) | Based on a percentage of the fund’s total distributions. |
| | |
| | (b) | Based on a percentage of ordinary income distributions of the fund. |
| | |
| | (c) | For the fiscal year ended October 31, 2006, certain dividends paid by the funds may be subject to a maximum tax rate of 15%, as provided by the Internal Revenue Code 1(h). The funds intend to designate the maximum amounts as taxed at a maximum rate of 15%. Complete information was computed and reported in conjunction with your 2005 Form 1099-DIV. As of October 31, 2006, for the calendar year to date, qualified dividend income as a percentage of ordinary income distributions for each fund was as follows: Real Estate Securities, International, Small Cap Growth Opportunities, Small Cap Select, Small Cap Value, Small-Mid Cap Core, Mid Cap Growth Opportunities, Mid Cap Value, Large Cap Growth Opportunities, Large Cap Select, Large Cap Value, Balanced, and Equity Income funds were 0%, 0%, 0%, 0%, 0%, 0%, 0%, 100%, 0%, 100%, 100%, 44.18%, and 100%, respectively. |
| | |
| | (d) | The International Fund has elected to pass through to shareholders foreign taxes under Section 853 of the Internal Revenue Code. Foreign taxes paid and foreign source income for the fund were $3,754,130 and $43,063,968, respectively. |
Additional Information Applicable to Foreign Shareholders Only:
| |
| | The percentage of ordinary income distributions that are designated as interest-related dividends under Internal Revenue Code Section 871(k)(1)(C) for each fund were as follows: |
| | | | | |
| Fund | | |
| | |
| Real Estate Securities Fund | | | 0.34 | % |
| International Fund | | | 3.93 | |
| Small Cap Growth Opportunities Fund | | | 1.50 | |
| Small Cap Select Fund | | | 0.00 | |
| Small Cap Value Fund | | | 0.91 | |
| Small-Mid Cap Core Fund | | | 0.00 | |
| Mid Cap Growth Opportunities Fund | | | 1.99 | |
| Mid Cap Value Fund | | | 3.20 | |
| Large Cap Growth Opportunities Fund | | | 0.00 | |
| Large Cap Select Fund | | | 7.42 | |
| Large Cap Value Fund | | | 1.45 | |
| Balanced Fund | | | 43.45 | |
| Equity Income Fund | | | 1.80 | |
| |
136 First American Funds Annual Report 2006
| |
| | The percentage of ordinary income distributions that are designated as short-term capital gain distributions under Internal Revenue Code Section 871(k)(2)(C) for each fund were as follows: |
| | | | | |
| Fund | | |
| | |
| Real Estate Securities Fund | | | 80.49 | % |
| International Fund | | | 0.00 | |
| Small Cap Growth Opportunities Fund | | | 100.00 | |
| Small Cap Select Fund | | | 100.00 | |
| Small Cap Value Fund | | | 86.55 | |
| Small-Mid Cap Core Fund | | | 0.00 | |
| Mid Cap Growth Opportunities Fund | | | 100.00 | |
| Mid Cap Value Fund | | | 22.25 | |
| Large Cap Growth Opportunities Fund | | | 0.00 | |
| Large Cap Select Fund | | | 73.31 | |
| Large Cap Value Fund | | | 7.92 | |
| Balanced Fund | | | 0.00 | |
| Equity Income Fund | | | 5.79 | |
| |
HOW TO OBTAIN A COPY OF THE FUNDS’ PROXY VOTING POLICIES AND PROXY VOTING RECORD
| |
| | A description of the policies and procedures that the funds use to determine how to vote proxies relating to portfolio securities, as well as information regarding how the funds voted proxies relating to portfolio securities during the most recent 12-month period ended June 30, is available (1) without charge upon request by calling 800.677.FUND; (2) at www.firstamericanfunds.com; and (3) on the U.S. Securities and Exchange Commission’s website at www.sec.gov. |
FORM N-Q HOLDINGS INFORMATION
| |
| | Each fund is required to file its complete schedule of portfolio holdings for the first and third quarters of each fiscal year with the Securities and Exchange Commission on Form N-Q. The funds’ Forms N-Q are available (1) without charge upon request by calling 800.677.FUND and (2) on the Securities and Exchange Commission’s website at www.sec.gov. In addition, you may review and copy the funds’ Forms N-Q at the Commission’s Public Reference Room in Washington, D.C. You may obtain information on the operation of the Public Reference Room by calling 1-800-SEC-0330. |
QUARTERLY PORTFOLIO HOLDINGS
| |
| | Each fund will make portfolio holdings information publicly available by posting the information at www.firstamericanfunds.com on a quarterly basis. The funds will attempt to post such information within 10 days of the calendar quarter-end. |
APPROVAL OF THE FUNDS’ INVESTMENT ADVISORY AND SUB-ADVISORY AGREEMENTS
| |
| | The Board of Directors of the funds (the “Board”), which is comprised entirely of independent directors, oversees the management of each fund and, as required by law, determines annually whether to renew the funds’ advisory agreement with FAF Advisors, Inc. (“FAF Advisors”). In addition to determining whether to renew the Agreement with FAF Advisors, the Board also is responsible for determining whether to approve sub-advisory agreements for the funds. |
| |
| | At a meeting on May 1-3, 2006, the Board considered information relating to the funds’ investment advisory agreement with FAF Advisors (the “Agreement”) and, with respect to the International Fund, information relating to the sub-advisory agreement between FAF Advisors and J.P. Morgan Investment Management Inc. (“JP Morgan”) (the “Sub-Advisory Agreement”). In advance of the meeting, the Board received materials relating to the Agreement and the Sub-Advisory Agreement, and had the opportunity to ask questions and request further information in connection with their consideration. At a subsequent meeting on June 19-21, 2006, the Board concluded its consideration of and approved the Agreement and the Sub-Advisory Agreement through June 30, 2007. |
| |
| | Although the Agreement, which is with First American Investment Funds, Inc., relates to all of the funds, the Board separately considered and approved the Agreement with respect to each fund. In considering the Agreement, the Board, advised by independent legal counsel, reviewed and considered the factors it deemed relevant, including: (1) the nature, quality and extent of FAF Advisors’ services to the fund, (2) the investment performance of the fund, (3) the profitability of FAF Advisors related to the fund, including an analysis of FAF Advisors’ cost of providing services and comparative expense information, (4) whether economies of scale may be realized as the fund grows and whether fee levels are adjusted to enable fund investors to share in these potential economies of scale, and (5) other benefits that accrue to FAF Advisors |
First American Funds Annual Report 2006 137
NOTICE TO SHAREHOLDERS continued
| |
| | through its relationship with the funds. In its deliberations, the Board did not identify any single factor which alone was responsible for the Board’s decision to approve the Agreement. |
| |
| | Before approving the Agreement and the Sub-Advisory Agreement, the Board met in executive session with its independent counsel on numerous occasions to consider the materials provided by FAF Advisors and the terms of the Agreement and the Sub-Advisory Agreement. Based on its evaluation of those materials, the Board concluded that the Agreement is fair and in the interests of the shareholders of each fund and that the Sub-Advisory Agreement is fair and in the interests of the shareholders of the International Fund. In reaching its conclusions, the Board considered the following: |
Nature, Quality and Extent of Investment Advisory Services
| |
| | The Board examined the nature, quality and extent of the services provided by FAF Advisors to each fund, and the nature, quality and extent of the services provided by JP Morgan to the International Fund. |
| |
| | For each fund other than the International Fund which is sub-advised by JP Morgan, the Board reviewed FAF Advisors’ key personnel who provide investment management services to the fund as well as the fact that, under the Agreement, FAF Advisors has the authority and responsibility to make and execute investment decisions for the fund within the framework of the fund’s investment policies and restrictions, subject to review by the Board. The Board further considered that FAF Advisors’ duties with respect to each fund include (i) investment research and security selection, (ii) adherence to (and monitoring compliance with) the fund’s investment policies and restrictions and the Investment Company Act of 1940, and (iii) monitoring the performance of the various organizations providing services to the fund, including the fund’s distributor, sub-administrator, transfer agent and custodian. Finally, the Board considered FAF Advisors’ representation that the services provided by FAF Advisors under the Agreement are the type of services customarily provided by investment advisors in the fund industry. |
| |
| | With respect to the International Fund, the Board examined the nature, quality and extent of the services provided by JP Morgan and reviewed JP Morgan’s key personnel who provide investment management services to the fund. The Board noted that, under the Sub-Advisory Agreement, JP Morgan has the authority and responsibility to make and execute investment decisions for the fund within the framework of the fund’s investment policies and restrictions, subject to the supervision of FAF Advisors and review by the Board. The Board further considered that JP Morgan’s duties with respect to the International Fund include investment research and stock selection and adherence to the fund’s investment policies and restrictions. The Board noted that, under the Agreement, FAF Advisors is responsible for monitoring the performance of JP Morgan as well as various organizations providing services to the International Fund, including the fund’s distributor, sub-administrator, transfer agent and custodian. Finally, the Board considered FAF Advisors’ representation that the services provided by JP Morgan under the Sub-Advisory Agreement are the type of services customarily provided by investment advisors in the fund industry. |
| |
| | The Board considered compliance reports about FAF Advisors and JP Morgan from the fund’s Chief Compliance Officer (CCO). |
| |
| | Based on the foregoing, the Board concluded that (i) each fund is likely to benefit from the nature, extent and quality of the services provided by FAF Advisors under the Agreement and (ii) the International Fund is likely to benefit from the nature, extent and quality of the services provided by JP Morgan under the Sub-Advisory Agreement. |
Investment Performance of the Funds
| |
| | The Board considered the performance of each fund, including how the fund performed versus the median performance of a group of comparable funds selected by an independent data service (the “performance universe”) and how the fund performed versus its benchmark index. The performance periods considered by the Board ended on January 31, 2006. |
| |
| | Balanced Fund. The Board considered that the fund significantly outperformed both its benchmark index and its performance universe for the one- and three-year periods. Though the fund underperformed for the five- and ten-year periods, the Board noted that the fund’s current management team has been in place only since 2004. Thus, the underperformance for these longer time periods is attributable to a former management team. The Board concluded that, in light of the fund’s good relative performance over the one-and three-year periods, it would be in the interest of the fund and its shareholders to renew the Agreement. |
| |
| | Equity Income Fund. The Board considered that the fund’s performance was comparable to or exceeded that of its benchmark index for the one-, five- and ten-year periods, though it underperformed the benchmark for the three-year period. The fund’s performance, although slightly above the median of its performance universe for the ten-year period, was below the performance universe median for the one-, three-, and five-year periods. The Board, however, considered FAF Advisors’ assertion that the performance universe included a number of funds with different investment restrictions and |
138 First American Funds Annual Report 2006
| |
| | styles than those of the fund. In light of this, the Board also considered the fund’s performance to the performance of a custom performance universe, which FAF Advisors represented provided a more meaningful comparison. The Board noted that the fund’s performance compared favorably to this custom performance universe for the one- three- and ten-year periods. The Board concluded that, in light of the fund’s positive performance vis-à-vis the custom performance universe and its generally competitive performance vis-à-vis its benchmark index, it would be in the interest of the fund and its shareholders to renew the Agreement. |
| |
| | International Fund. The Board noted that the fund has underperformed both its benchmark and its performance universe for the one-, three-, five- and ten-year periods. The Board considered, however, that the fund’s sub-adviser, JP Morgan, did not begin managing the fund until December 2004 and that JP Morgan, therefore, is not responsible for most of the performance record reviewed by the Board. The Board concluded that, in light of JP Morgan’s limited tenure managing the fund, it would be in the interest of the fund and its shareholders to renew the Agreement and the Sub-Advisory Agreement and to closely monitor the performance record that JP Morgan continues to develop as sub-adviser to the fund. |
| |
| | Large Cap Growth Opportunities Fund. The Board considered that the fund’s performance was comparable to or better than its benchmark for the one-, three-and five-year periods, and comparable to or better than its performance universe for the three- and five-year periods (although the fund underperformed its performance universe for the one-year period). While the fund underperformed both its performance universe and its benchmark for the ten-year period, the Board noted that the underperformance was attributable primarily to a former management team. The Board concluded that, in light of the fund’s competitive long-term performance under the current portfolio management team, it would be in the interest of the fund and its shareholders to renew the Agreement. |
| |
| | Large Cap Select Fund. The Board considered that the fund outperformed its performance universe for the one-and three-year periods. The Board also noted that the fund outperformed its benchmark for the one-year period, though it slightly underperformed the benchmark for the three-year period. The Board concluded that, in light of the fund’s outperformance of the performance universe and one-year outperformance of its benchmark, it would be in the interest of the fund and its shareholders to renew the Agreement. |
| |
| | Large Cap Value Fund. The Board noted that the fund outperformed its performance universe for the one- and three-year periods, although it underperformed its benchmark for those periods. The Board also noted that the fund’s performance was below that of its performance universe and its benchmark for the five- and ten-year periods. The Board, however, considered the management transitions that have occurred during the past two years. The Board concluded that, in light of these transitions and the fund’s recent strong performance compared to that of its performance universe, it would be in the interest of the fund and its shareholders to renew the Agreement. |
| |
| | Mid Cap Growth Opportunities Fund. The Board considered that the fund outperformed its performance universe for the one-, three-, five- and ten-year periods. The Board also noted that the fund outperformed or performed competitively versus its benchmark for the same periods. The Board concluded that, in light of the fund’s strong performance, it would be in the interest of the fund and its shareholders to renew the Agreement. |
| |
| | Mid Cap Value Fund. The Board considered that the fund outperformed its performance universe for the one-, three-, and five-year periods, though it underperformed its benchmark for those periods. While the fund underperformed both its benchmark index and its performance universe for the ten-year period, the Board noted that this underperformance could be attributed primarily to a former management team. The Board concluded that, in light of the fund’s strong performance relative to its performance universe, it would be in the interest of the fund and its shareholders to renew the Agreement. |
| |
| | Real Estate Securities Fund. The Board considered that the fund outperformed its benchmark index and its performance universe for the one-, three-, five-, and ten-year periods. The Board concluded that, in light of this performance, it would be in the interest of the fund and its shareholders to renew the Agreement. |
| |
| | Small Cap Growth Opportunities Fund. The Board noted that the fund outperformed or performed competitively versus its benchmark and performance universe for the one-, three- and ten-year periods. The Board also considered that the fund outperformed its benchmark for the five-year period, though it underperformed the performance universe for that period. At the request of FAF Advisors, the Board also considered the fund’s performance in relation to a universe of small-cap growth funds, rather than the universe of small-cap core funds provided by the independent data service. FAF Advisors represented to the Board that the small-cap growth universe is a more meaningful source of comparative performance data, given that the current portfolio management team pursues a growth style. When compared to this small-cap growth universe, the fund outperformed for all periods. The Board concluded that, in light of the fund’s competitive performance versus that of its benchmark and the small-cap growth universe, it would be in the interest of the fund and its shareholders to renew the Agreement. |
First American Funds Annual Report 2006 139
NOTICE TO SHAREHOLDERS continued
| |
| | Small Cap Select Fund. The Board noted that the fund outperformed or performed competitively in relation to its benchmark and performance universe for the one-, three-, five- and ten-year periods. The Board concluded that, in light of the fund’s strong performance, it would be in the interest of the fund and its shareholders to renew the Agreement. |
| |
| | Small Cap Value Fund. The Board noted that the fund outperformed or performed competitively in relation to its performance universe for the one-, three-, five-, and ten-year periods. The Board also noted that the fund performed competitively against its benchmark for the one-year period, though it underperformed the benchmark for the other periods. At the request of FAF Advisors, the Board also considered the fund’s performance in relation to a universe of small-cap value funds, rather than the universe of small-cap core funds provided by the independent data service. FAF Advisors represented that the current portfolio management team pursues a value rather than a core style in managing the fund. When compared to the small-cap value universe the fund outperformed that universe for the one- and three- year periods (though it underperformed for the five- and ten-year periods). The Board concluded that, in light of the fund’s competitive recent performance versus that of the benchmark, the performance universe and the custom universe, it would be in the interest of the Fund and its shareholders to renew the Agreement. |
| |
| | Small-Mid Cap Core Fund. The Board noted that the fund underperformed its benchmark and its performance universe for the one-, three-, five- and ten-year periods. The Board considered, however, that the fund was recently converted from a technology fund to a small-mid cap core fund, with a different management team and different investment objectives and policies. The Board also considered that, as a result, the fund was operated as a small-mid cap core fund for only the last four months of each period. The fund’s total return for the period from September 30, 2005 to January 31, 2006, was 11.67% for the Class A shares and 11.59% for the Class Y shares. This compares to returns of 9.01% for the fund’s benchmark and 9.16% for its performance universe for the same period. In light of the fund’s very short history of operating as a small-mid cap core fund and its strong performance during this time period, the Board concluded it would be in the interest of the fund and its shareholders to renew the Agreement and to continue to monitor the performance record developed by the fund in its new form. |
Costs of Services and Profits Realized by FAF Advisors
| |
| | The Board reviewed FAF Advisors’ estimated costs in serving as the funds’ investment manager, including the costs associated with the personnel and systems necessary to manage each fund. The Board also considered the reported profitability of FAF Advisors and its affiliates resulting from their relationship with each fund. For each fund, the Board reviewed fee and expense information as compared to that of other funds and accounts managed by FAF Advisors and of comparable funds managed by other advisers. The Board found that while the management fees for FAF Advisors’ institutional separate accounts are lower than the funds’ management fees, the funds receive additional services from FAF Advisors that separate accounts do not receive. |
| |
| | Using information provided by an independent data service, the Board also evaluated each fund’s advisory fee compared to the median advisory fee for other mutual funds similar in size, character and investment strategy, and each fund’s expense ratio after waivers compared to the median expense ratio, after waivers, of comparable funds. In connection with its review of fund fees and expenses, the Board asked FAF Advisors to articulate its pricing philosophy. FAF Advisors responded that it attempts generally to maintain each fund’s total operating expenses at a level that approximates its peer group median expense ratio. In addition, FAF Advisors noted that it intends to waive its investment advisory fees to the extent necessary to maintain the funds’ total expense ratios at levels generally in line with their respective peer groups. Consistent with this pricing philosophy, and after discussions with the Board, FAF Advisors proposed certain changes to the expense caps of the International and Small-Mid Cap Core Funds, as discussed in more detail below, and agreed to maintain the other expense caps at their current levels through June 30, 2007. |
| |
| | Further detail considered by the Board regarding the advisory fees and expense ratios of each fund is set forth below: |
| |
| | Balanced Fund. The Board considered that, after waivers, the fund’s advisory fee and expense ratio are lower than the peer group median. The Board concluded that the fund’s advisory fee and expense ratio are reasonable in light of the services provided. |
| |
| | Equity Income Fund. The Board considered that the fund’s advisory fee is close to, though slightly higher than, the peer group median. The Board also noted that the fund’s expense ratio, after annualizing the effect of a July 1, 2005 elimination of the fee waiver, is consistent with FAF Advisors’ pricing philosophy. The Board concluded that the advisory fee and expense ratio are reasonable in light of the services provided. |
| |
| | International Fund. The Board noted that the fund’s advisory fee and expense ratio, after waivers, are higher than those of its peer group median. To bring the fund’s total expense ratio more closely in line with that of its peer group median, the Board |
140 First American Funds Annual Report 2006
| |
| | and FAF Advisors agreed to cap total fund expenses at 1.49% for Class A shares. The Board noted that, although the fund’s advisory fee will continue to be higher than its peer group median, the expense cap change would bring the fund to within 10 basis points of the peer group median expense ratio of 1.39%. The Board concluded that the fund’s advisory fee and expense ratio, after taking into account the expense cap change, are reasonable in light of the services provided. |
| |
| | Large Cap Growth Opportunities Fund. The Board considered that the fund’s advisory fee is lower than the peer group median. The Board also noted that the fund’s expense ratio, after annualizing the effect of a July 1, 2005 elimination of the fee waiver, remains below the peer group median and is consistent with FAF Advisors’ pricing philosophy. The Board concluded that the fund’s advisory fee and expense ratio are reasonable in light of the services provided. |
| |
| | Large Cap Select Fund. The Board considered that the fund’s advisory fee is lower than the peer group median. The Board also noted that the fund’s expense ratio, after annualizing the effect of a July 1, 2005 elimination of the fee waiver, remains below the peer group median and is consistent with FAF Advisors’ pricing philosophy. The Board concluded that the fund’s advisory fee and expense ratio are reasonable in light of the services provided. |
| |
| | Large Cap Value Fund. The Board considered that the fund’s advisory fee is close to, though slightly higher than, the peer group median. The Board also noted that the fund’s expense ratio, after annualizing the effect of a July 1, 2005 elimination of the fee waiver, is consistent with FAF Advisors’ pricing philosophy. The Board concluded that the advisory fee and expense ratio are reasonable in light of the services provided. |
| |
| | Mid Cap Growth Opportunities Fund. The Board considered that the fund’s advisory fee is close to, though slightly higher than, the peer group median. The Board also noted that the fund’s expense ratio, after annualizing the effect of a July 1, 2005 elimination of the fee waiver, remains below the peer group median and is consistent with FAF Advisors’ pricing philosophy. The Board concluded that the fund’s advisory fee and expense ratio are reasonable in light of the services provided. |
| |
| | Mid Cap Value Fund. The Board considered that the fund’s advisory fee is lower than the peer group median. The Board also noted that the fund’s expense ratio, after annualizing the effect of a July 1, 2005 elimination of the fee waiver, remains below the peer group median and is consistent with FAF Advisors’ pricing philosophy. The Board concluded that the fund’s advisory fee and expense ratio are reasonable in light of the services provided. |
| |
| | Real Estate Securities Fund. The Board considered that the fund’s advisory fee is lower than the peer group median. The Board also noted that the fund’s expense ratio, after annualizing the effect of a July 1, 2005 elimination of the fee waiver, remains below the peer group median and is consistent with FAF Advisors’ pricing philosophy. The Board concluded that the fund’s advisory fee and expense ratio are reasonable in light of the services provided. |
| |
| | Small Cap Growth Opportunities Fund. The Board considered that although the fund’s advisory fee, after waivers, is higher than the peer group median, the fund’s expense ratio, after annualizing the effect of a 1.47% expense cap that went into effect July 1, 2005, is lower than the peer group median and is consistent with FAF Advisors’ pricing philosophy. The Board concluded that the fund’s advisory fee and expense ratio, after taking into account the expense cap, are reasonable in light of the services provided. |
| |
| | Small Cap Select Fund. The Board considered that the fund’s advisory fee is lower than the peer group median. The Board also noted that the fund’s expense ratio, after annualizing the effect of a July 1, 2005 elimination of the fee waiver, remains below the peer group median and is consistent with FAF Advisors’ pricing philosophy. The Board concluded that the fund’s advisory fee and expense ratio are reasonable in light of the services provided. |
| |
| | Small Cap Value Fund. The Board considered that the fund’s advisory fee is lower than the peer group median. The Board also noted that the fund’s expense ratio, after annualizing the effect of a July 1, 2005 elimination of the fee waiver, remains below the peer group median and is consistent with FAF Advisors’ pricing philosophy. The Board concluded that the fund’s advisory fee and expense ratio are reasonable in light of the services provided. |
| |
| | Small-Mid Cap Core Fund. The Board considered that the fund’s advisory fee and expense ratio, after waivers, are lower than the peer group medians. The Board also considered FAF Advisors’ commitment to cap the expense ratio at 1.48% (less than 1 basis point above the peer group median) for the fund’s Class A shares (and parallel caps for the fund’s other share classes) should the fund’s expenses exceed that level at any time through June 30, 2007. The Board concluded that the fund’s advisory fee and expense ratio, after taking into account waivers, are reasonable in light of the services provided. |
Economies of Scale in Providing Investment Advisory Services
| |
| | The Board considered whether each fund’s investment advisory fee reflects the potential for economies of scale for the benefit of fund shareholders. Based on information provided by FAF Advisors, the Board noted that profitability will likely |
First American Funds Annual Report 2006 141
NOTICE TO SHAREHOLDERS continued
| |
| | increase somewhat as assets grow over time. The Board considered that, although most funds do not have advisory fee breakpoints in place, FAF Advisors has committed to waive advisory fees to the extent necessary to keep each fund’s total expenses generally in line with the median total expenses of a peer group of funds as selected by an independent data service. The median total expense ratio of a fund’s peer group will reflect the effect of any breakpoints in the advisory fee schedules of the funds in that group. Therefore, by capping a fund’s total expense ratio at a level close to the median, fund shareholders should receive the benefit of any breakpoints in the comparable funds’ advisory fee schedules. In light of FAF Advisors’ commitment to keep total fund expenses competitive, the Board concluded that it would be reasonable and in the best interest of each fund and its shareholders to renew the Agreement. |
Other Benefits to FAF Advisors
| |
| | In evaluating the benefits that accrue to FAF Advisors through its relationship with the funds, the Board noted that FAF Advisors and certain of its affiliates serve the funds in various capacities, including as advisor, administrator, transfer agent, distributor, custodian and securities lending agent, and receive compensation from the funds in connection with providing services to the funds. The Board considered that each service provided to the funds by FAF Advisors or one of its affiliates is pursuant to a written agreement, which the Board evaluates periodically as required by law. |
| |
| | The Board also considered FAF Advisors’ use of the funds’ portfolio brokerage transactions to obtain research. The Board concluded, based on its own review and on representations of FAF Advisors and the CCO, that FAF Advisors’ use of “soft” commission dollars was consistent with regulatory requirements. |
| |
| | After full consideration of these and other factors, the Board concluded that approval of the Agreement was in the best interest of each fund and its shareholders. |
142 First American Funds Annual Report 2006
Directors and Officers of the Funds
| | | | | | | | | | | | | | | |
| Independent Directors | |
| | |
| | | Number of | | Other | |
| | | Position(s) | | | Term of Office | | Principal | | Portfolios in Fund | | Directorships | |
| Name, Address, and | | Held | | | and Length of | | Occupation(s) | | Complex Overseen by | | Held by | |
| Year of Birth | | with Fund | | | Time Served | | During Past 5 Years | | Director | | Director † | |
| | |
Benjamin R. Field III
P.O. Box 1329
Minneapolis, MN
55440-1329
(1938) | | | Director | | | Term expiring earlier of death, resignation, removal, disqualification, or successor duly elected and qualified. Director of FAIF since September 2003 | | Retired; Senior Financial Advisor, Bemis Company, Inc. from May 2002 through June 2004; Senior Vice President, Chief Financial Officer & Treasurer, Bemis Company, Inc., through April 2002 | | First American Funds Complex: twelve registered investment companies, including fifty-eight portfolios | | | None | |
| |
Roger A. Gibson
P.O. Box 1329
Minneapolis, MN
55440-1329
(1946) | | | Director | | | Term expiring earlier of death, resignation, removal, disqualification, or successor duly elected and qualified. Director of FAIF since October 1997 | | Director, Charterhouse Group, Inc., a private equity firm, since October 2005; Vice President and Chief Operating Officer, Cargo-United Airlines, from July 2001 through July 2004 | | First American Funds Complex: twelve registered investment companies, including fifty-eight portfolios | | | None | |
| |
Victoria J. Herget
P.O. Box 1329
Minneapolis, MN 55440-1329
(1951) | | | Director | | | Term expiring earlier of death, resignation, removal, disqualification, or successor duly elected and qualified. Director of FAIF since September 2003 | | Investment consultant and non-profit board member since 2001; Managing Director of Zurich Scudder Investments through 2001 | | First American Funds Complex: twelve registered investment companies, including fifty-eight portfolios | | | None | |
| |
John P. Kayser
P.O. Box 1329
Minneapolis, MN
55440-1329
(1949) | | | Director | | | Term expiring earlier of death, resignation, removal, disqualification, or successor duly elected and qualified. Director of FAIF since October 2006 | | Retired; Principal from 1983 to 2004 and Chief Financial Officer and Chief Administrative Officer from 1988 to 2002, William Blair & Company, LLC | | First American Funds Complex: twelve registered investment companies, including fifty-eight portfolios | | | None | |
| |
Leonard W. Kedrowski
P.O. Box 1329
Minneapolis, MN 55440-1329
(1941) | | | Director | | | Term expiring earlier of death, resignation, removal, disqualification, or successor duly elected and qualified. Director of FAIF since November 1993 | | Owner and President, Executive and Management Consulting, Inc., a management consulting firm; Board member, GC McGuiggan Corporation (dba Smyth Companies), a label printer; former Chief Executive Officer, Creative Promotions International, LLC, a promotional award programs and products company, through October 2003; Advisory Board member, Designer Doors, a manufacturer of designer doors, through 2002 | | First American Funds Complex: twelve registered investment companies, including fifty-eight portfolios | | | None | |
| |
Richard K. Riederer
P.O. Box 1329
Minneapolis, MN 55440-1329
(1944) | | | Director | | | Term expiring earlier of death, resignation, removal, disqualification, or successor duly elected and qualified. Director of FAIF since August 2001 | | Owner and CEO, RKR Consultants, Inc. and non-profit board member since 2005; Director, President and Chief Executive Officer, Weirton Steel Corporation through 2001 | | First American Funds Complex: twelve registered investment companies, including fifty-eight portfolios | | Cleveland Cliffs Inc. (a producer of iron ore pellets) |
| |
Joseph D. Strauss P.O. Box 1329 Minneapolis, MN 55440-1329
(1940) | | | Director | | | Term expiring earlier of death, resignation, removal, disqualification, or successor duly elected and qualified. Director of FAIF since September 1991 | | Attorney at law; Owner, and President, Strauss Management Company, a Minnesota holding company for various organizational management business ventures; Owner, Chairman, and Chief Executive Officer, Community Resource Partnerships, Inc., a strategic planning, operations management, government relations, transportation planning, and public relations organization; Owner, Chairman, and Chief Executive Officer, Excensustm, LLC, a strategic demographic planning and application development firm since 2001 | | First American Funds Complex: twelve registered investment companies, including fifty-eight portfolios | | | None | |
| |
First American Funds Annual Report 2006 143
NOTICE TO SHAREHOLDERS continued
| | | | | | | | | | | | | | | |
| Independent Directors | |
| | |
| | | Number of | | Other | |
| | | Position(s) | | | Term of Office | | Principal | | Portfolios in Fund | | Directorships | |
| Name, Address, and | | Held | | | and Length of | | Occupation(s) | | Complex Overseen by | | Held by | |
| Year of Birth | | with Fund | | | Time Served | | During Past 5 Years | | Director | | Director † | |
| | |
Virginia L. Stringer
P.O. Box 1329
Minneapolis, MN 55440-1329
(1944) | | Chair; Director | | Chair Term three years. Directors Term expiring earlier of death, resignation, removal, disqualification, or successor duly elected and qualified. Chair of FAIF’s Board since September 1997; Director of FAIF since September 1987 | | Governance consultant and non-profit board member; former Owner and President, Strategic Management Resources, Inc., a management consulting firm; Executive Consultant to State Farm Insurance Company through 2003 | | First American Funds Complex: twelve registered investment companies, including fifty-eight portfolios | | | None | |
| |
James M. Wade
P.O. Box 1329
Minneapolis, MN 55440-1329
(1943) | | | Director | | | Term expiring earlier of death, resignation, removal, disqualification, or successor duly elected and qualified. Director of FAIF since August 2001 | | Owner and President, Jim Wade Homes, a homebuilding company | | First American Funds Complex: twelve registered investment companies, including fifty-eight portfolios | | | None | |
| |
| |
| † | Includes only directorships in a company with a class of securities registered pursuant to Section 12 of the Securities Exchange Act or subject to the requirements of Section 15(d) of the Securities Exchange Act, or any company registered as an investment company under the Investment Company Act. |
The Statement of Additional Information (SAI) includes additional information about fund directors and is available upon request without charge by calling 800-677-FUND or writing to First American Funds, P.O. Box 1330, Minneapolis, Minnesota, 55440-1330.
144 First American Funds Annual Report 2006
| | | | | | | |
| Officers |
| |
| | | Position(s) | | Term of Office | | |
| Name, Address, and | | Held | | and Length of | | |
| Year of Birth | | with Funds | | Time Served | | Principal Occupation(s) During Past 5 Years |
| |
Thomas S. Schreier, Jr.
FAF Advisors, Inc.
800 Nicollet Mall
Minneapolis, MN 55402
(1962)* | | President | | Re-elected by the Board annually; President of FAIF since February 2001 | | Chief Executive Officer of FAF Advisors, Inc. |
| |
Mark S. Jordahl
FAF Advisors, Inc.
800 Nicollet Mall
Minneapolis, MN 55402
(1960)* | | Vice President – Investments | | Re-elected by the Board annually; Vice President – Investments of FAIF since September 2001 | | Chief Investment Officer of FAF Advisors, Inc. |
| |
Jeffery M. Wilson
FAF Advisors, Inc.
800 Nicollet Mall
Minneapolis, MN 55402
(1956)* | | Vice President – Administration | | Re-elected by the Board annually; Vice President – Administration of FAIF since March 2000 | | Senior Vice President of FAF Advisors, Inc. |
| |
Charles D. Gariboldi, Jr.
FAF Advisors, Inc.
800 Nicollet Mall
Minneapolis, MN 55402
(1959)* | | Treasurer | | Re-elected by the Board annually; Treasurer of FAIF since October 2004 | | Treasurer, FAF Advisors, Inc., since October 2004; prior thereto, Vice President of Investment Accounting and Fund Treasurer for Thrivent Financial for Lutherans |
| |
Jill M. Stevenson
FAF Advisors, Inc.
800 Nicollet Mall
Minneapolis, MN 55402
(1965)* | | Assistant Treasurer | | Re-elected by the Board annually; Assistant Treasurer of FAIF since September 2005 | | Assistant Treasurer, FAF Advisors, Inc., since September 2005; prior thereto, Director, Senior Project Manager, FAF Advisors, Inc. from May 2003 to September 2005; prior to that, Vice President, Director of Operations, Paladin Investment Associates, LLC |
| |
David H. Lui
FAF Advisors, Inc.
800 Nicollet Mall
Minneapolis, MN 55402
(1960)* | | Chief Compliance Officer | | Re-elected by the Board annually; Chief Compliance Officer of FAIF since March 2005 | | Chief Compliance Officer for First American Funds and FAF Advisors, Inc., since March 2005; prior thereto, Chief Compliance Officer, Franklin Advisors, Inc. and Chief Compliance Counsel, Franklin Templeton Investments from March 2004 to March 2005; prior to that Vice President, Charles Schwab & Co,. Inc. |
| |
Jason K. Mitchell
FAF Advisors, Inc.
800 Nicollet Mall
Minneapolis, MN 55402
(1976)* | | Anti-Money Laundering Officer | | Re-elected by the Board annually; Anti-Money Laundering Officer of FAIF since September 2006 | | Compliance Manager, FAF Advisors, Inc., since June 2006; prior to that, Compliance Analyst, FAF Advisors, Inc. from October 2004 to June 2006; prior to that, Senior Systems Helpdesk Analyst, Wachovia Retirement Services from November 2002 to October 2004; prior to that, Senior Retirement Plan Specialist, PFPC, Inc. |
| |
Kathleen L. Prudhomme
FAF Advisors, Inc.
800 Nicollet Mall
Minneapolis, MN 55402
(1953)* | | Secretary | | Re-elected by the Board annually; Secretary of FAIF since December 2004; prior thereto, Assistant Secretary of FAIF since September 1998 through December 2004 | | Deputy General Counsel, FAF Advisors, Inc., since November 2004; prior thereto, Partner, Dorsey & Whitney LLP, a Minneapolis-based law firm |
| |
Brett L. Agnew
FAF Advisors, Inc.
800 Nicollet Mall
Minneapolis, MN 55402
(1971)* | | Assistant Secretary | | Re-elected by the Board annually; Assistant Secretary of FAIF since December 2004 | | Counsel, FAF Advisors, Inc., since August 2004; prior thereto, Senior Counsel, Thrivent Financial for Lutherans |
| |
James D. Alt
Dorsey & Whitney LLP
50 South Sixth Street
Suite 1500
Minneapolis, MN 55402
(1951)* | | Assistant Secretary | | Re-elected by the Board annually; Assistant Secretary of FAIF since December 2004; prior thereto, Secretary of FAIF since June 2002; Assistant Secretary of FAIF from September 1998 through June 2002 | | Partner, Dorsey & Whitney LLP, a Minneapolis-based law firm |
| |
James R. Arnold
U.S. Bancorp Fund Services, LLC
615 E. Michigan Street
Milwaukee, WI 53202
(1957)* | | Assistant Secretary | | Re-elected by the Board annually; Assistant Secretary of FAIF since June 2003 | | Vice President, U.S. Bancorp Fund Services, LLC, since March 2002; prior thereto, Senior Administration Services Manager, UMB Fund Services, Inc. |
| |
First American Funds Annual Report 2006 145
NOTICE TO SHAREHOLDERS continued
| | | | | | | |
| Officers |
| |
| | | Position(s) | | Term of Office | | |
| Name, Address, and | | Held | | and Length of | | |
| Year of Birth | | with Funds | | Time Served | | Principal Occupation(s) During Past 5 Years |
| |
Richard J. Ertel
FAF Advisors, Inc.
800 Nicollet Mall
Minneapolis, MN 55402
(1967)* | | Assistant Secretary | | Re-elected by the Board annually; Assistant Secretary of FAIF since June 2006 and from June 2003 through August 2004 | | Counsel, FAF Advisors, Inc., since May 2006; prior thereto, Counsel, Ameriprise Financial Services, Inc. from September 2004 to May 2006; prior to that, Counsel, FAF Advisors, Inc. from May 2003 to August 2004; prior to May 2003, Associate Counsel, Hartford Life and Accident Insurance Company |
| |
Douglas G. Hess
U.S. Bancorp Fund Services, LLC
615 E. Michigan Street
Milwaukee, WI 53202
(1967)* | | Assistant Secretary | | Re-elected by the Board annually; Assistant Secretary of FAIF since September 2001 | | Vice President, U.S. Bancorp Fund Services, LLC since November 2002; prior thereto, Assistant Vice President, Fund Compliance Administrator, U.S. Bancorp Fund Services, LLC |
| |
| |
| * | Messrs. Schreier, Jordahl, Wilson, Gariboldi, Lui, Mitchell, Agnew and Ertel, Ms. Stevenson, and Ms. Prudhomme are each officers and/or employees of FAF Advisors, Inc., which serves as investment adviser and administrator for FAF. Messrs. Hess and Arnold are officers of U.S. Bancorp Fund Services, LLC, which is a subsidiary of U.S. Bancorp and which serves as Transfer Agent for FAIF. |
146 First American Funds Annual Report 2006
(This page intentionally left blank.)
(This page intentionally left blank.)
Board of Directors First American Investment Funds, Inc.
| |
| | Virginia Stringer |
| |
| | Chairperson of First American Investment Funds, Inc. |
| | Governance Consultant; former Owner and President of Strategic Management Resources, Inc. |
| |
| | Benjamin Field III |
| |
| | Director of First American Investment Funds, Inc. |
| | Retired; former Senior Financial Advisor, Senior Vice President, Chief Financial Officer,
and Treasurer of Bemis Company, Inc. |
| |
| | Roger Gibson |
| |
| | Director of First American Investment Funds, Inc. |
| | Director of Charterhouse Group, Inc. |
| |
| | Victoria Herget |
| |
| | Director of First American Investment Funds, Inc. |
| | Investment Consultant; former Managing Director of Zurich Scudder Investments |
| |
| | John Kayser |
| | Director of First American Investment Funds, Inc. |
| | Retired; former Principal, Chief Financial Officer, and Chief Administrative
Officer of William Blair & Company, LLC. |
| |
| | Leonard Kedrowski |
| |
| | Director of First American Investment Funds, Inc. |
| | Owner and President of Executive and Management Consulting, Inc. |
| |
| | Richard Riederer |
| |
| | Director of First American Investment Funds, Inc. |
| | Owner and CEO of RKR Consultants, Inc. |
| |
| | Joseph Strauss |
| |
| | Director of First American Investment Funds, Inc. |
| | Owner and President of Strauss Management Company |
| |
| | James Wade |
| |
| | Director of First American Investment Funds, Inc. |
| | Owner and President of Jim Wade Homes |
| |
| | First American Investment Funds’ Board of Directors is comprised entirely of
independent directors. |

Direct fund correspondence to:
First American Funds
P.O. Box 1330
Minneapolis, MN 55440-1330
| |
| This report and the financial statements contained herein are not intended to be a forecast of future events, a guarantee of future results, or investment advice. Further, there is no assurance that certain securities will remain in or out of each fund’s portfolio. The views expressed in this report reflect those of the portfolio managers only through the year ended October 31, 2006. The portfolio managers’ views are subject to change at any time based upon market or other conditions. | |
| |
| This report is for the information of shareholders of the First American Investment Funds, Inc. It may also be used as sales literature when preceded or accompanied by a current prospectus, which contains information concerning investment objectives, risks, and charges and expenses of the funds. Read the prospectus carefully before investing. | |
| |
| The figures in this report represent past performance and do not guarantee future results. The principal value of an investment and investment return will fluctuate so that an investor’s shares, when redeemed, may be worth more or less than their original cost. | |
INVESTMENT ADVISOR
| | |
| | FAF Advisors, Inc. | |
| | 800 Nicollet Mall | |
| | Minneapolis, Minnesota 55402 | |
ADMINISTRATOR
| | |
| | FAF Advisors, Inc. | |
| | 800 Nicollet Mall | |
| | Minneapolis, Minnesota 55402 | |
TRANSFER AGENT
| | |
| | U.S. Bancorp Fund Services, LLC | |
| | 615 East Michigan Street | |
| | Milwaukee, Wisconsin 53202 | |
CUSTODIAN
| | |
| | U.S. Bank National Association | |
| | 60 Livingston Avenue | |
| | St. Paul, Minnesota 55101 | |
DISTRIBUTOR
| | |
| | Quasar Distributors, LLC | |
| | 615 East Michigan Street | |
| | Milwaukee, Wisconsin 53202 | |
INDEPENDENT REGISTERED
PUBLIC ACCOUNTING FIRM
| | |
| | Ernst & Young LLP | |
| | 220 South Sixth Street | |
| | Suite 1400 | �� |
| | Minneapolis, Minnesota 55402 | |
COUNSEL
| | |
| | Dorsey & Whitney LLP | |
| | 50 South Sixth Street | |
| | Suite 1500 | |
| | Minneapolis, Minnesota 55402 | |
First American Funds
P.O. Box 1330
Minneapolis, MN 55440-1330
In an attempt to reduce shareholder costs and help eliminate duplication, First American Funds will try to limit their mailing to one report for each address that lists one or more shareholders with the same last name. If you would like additional copies, please call First American Investor Services at 800.677.FUND or visit firstamericanfunds.com.
0309-06 12/2006 AR-EQUITY
Item 2—Code of Ethics
(a) The registrant has adopted a code of ethics that applies to its Principal Executive Officer and Principal Financial Officer.
(b) During the period covered by this report, there were no amendments to the provisions of the registrant’s code of ethics that apply to the registrant’s Principal Executive Officer and Principal Financial Officer and that relate to any element of the code of ethics definition enumerated in this Item.
(c) During the period covered by this report, the registrant did not grant any waivers, including implicit waivers, from any provisions of its code of ethics.
(d) The registrant undertakes to furnish a copy of its code of ethics to any person upon request, without charge, by calling 1-800-677-3863.
Item 3—Audit Committee Financial Expert
The registrant’s Board of Directors has determined that Leonard W. Kedrowski, Benjamin R. Field III, John P. Kayser, and Richard K. Riederer, members of the registrant’s Audit Committee, are each an “audit committee financial expert” and are “independent,” as these terms are defined in this Item.
Item 4—Principal Accountant Fees and Services
(a) Audit Fees — Ernst & Young LLP (“E&Y”) billed the registrant audit fees totaling $1,066,262 in the fiscal year ended October 31, 2006, $74,027 in the fiscal period ended October 31, 2005, and $608,819 in the fiscal year ended September 30, 2005, including fees associated with the annual audit, SEC Rule 17f-2 security count filings and filings of the registrant’s Form N-CSR.
(b) Audit-Related Fees — E&Y billed the registrant audit-related fees totaling $3,288 in the fiscal year ended October 31, 2006, $184 in the fiscal period ended October 31, 2005, and $13,759 in the fiscal year ended September 30, 2005, including fees associated with the semi-annual review of fund disclosures.
(c) Tax Fees — E&Y billed the registrant fees of $160,419 in the fiscal year ended October 31, 2006, $10,628 in the fiscal period ended October 31, 2005, and $105,382 in the fiscal year ended September 30, 2005, for tax services, including tax compliance, tax advice and tax planning. Tax compliance, tax advice and tax planning services primarily related to preparation of original and amended tax returns, timely RIC qualification reviews, and tax distribution analysis and planning.
(d) All Other Fees — There were no fees billed by E&Y for other services to the registrant during the fiscal year ended October 31, 2006, the fiscal period ended October 31, 2005, and the fiscal year ended September 30, 2005.
(e)(1) The audit committee’s pre-approval policies and procedures pursuant to paragraph (c)(7) of Rule 2-01 of Regulation S-X are set forth below:
Audit Committee policy regarding pre-approval of services provided by the Independent Auditor
The Audit Committee of the First American Funds (“Committee”) has responsibility for ensuring that all services performed by the independent audit firm for the funds do not impair the firm’s independence. This review is intended to provide reasonable oversight
without removing management from its responsibility for day-to-day operations. In this regard, the Committee should:
· Understand the nature of the professional services expected to be provided and their impact on auditor independence and audit quality
· Examine and evaluate the safeguards put into place by the Company and the auditor to safeguard independence
· Meet quarterly with the partner of the independent audit firm
· Consider approving categories of service that are not deemed to impair independence for a one-year period.
It is important that a qualitative rather than a mere quantitative evaluation be performed by the Committee in discharging its responsibilities.
Policy for Audit and Non-Audit Services Provided to the Funds
On an annual basis, the Committee will review and consider whether to pre-approve the financial plan for audit fees as well as categories of audit-related and non-audit services that may be performed by the funds’ independent audit firm directly for the funds. At least annually, the Committee will receive a report from the independent audit firm of all audit and non-audit services, which were approved during the year.
The engagement of the independent audit firm for any non-audit service requires the written pre-approval of the Treasurer of the funds and all non-audit services performed by the independent audit firm will be disclosed in the required SEC periodic filings.
In connection with the Committee review and pre-approval responsibilities, the review by the Committee will consist of the following:
Audit Services
The categories of audit services and related fees to be reviewed and considered for pre-approval annually by the Committee or its delegate include the following:
· Annual fund financial statement audits
· Seed audits (related to new product filings, as required)
· SEC and regulatory filings and consents
Audit-related Services
In addition, the following categories of audit-related services are deemed to be consistent with the role of the independent audit firm and, as such, will be considered for pre-approval by the Committee or its delegate, on an annual basis.
· Accounting consultations
· Fund merger support services
· Other accounting related matters
· Agreed Upon Procedure Reports
· Attestation Reports
· Other Internal Control Reports
Notwithstanding any annual pre-approval of these categories of services, individual projects with an estimated fee in excess of $25,000 are subject to pre-approval by the Committee Chair or its delegate on a case-by-case basis. Individual projects with an
estimated fee in excess of $50,000 are subject to pre-approval by the Committee or its delegate on a case-by-case basis.
Tax Services
The following categories of tax services are deemed to be consistent with the role of the independent audit firm and, as such, will be considered for pre-approval by the Committee or its delegate, on an annual basis.
· Tax compliance services related to the filing or amendment of the following:
· Federal, state and local income tax compliance, and
· Sales and use tax compliance
· Timely RIC qualification reviews
· Tax distribution analysis and planning
· Tax authority examination services
· Tax appeals support services
· Accounting methods studies
· Fund merger support services
· Tax consulting services and related projects
Notwithstanding any annual pre-approval of these categories of services, individual projects with an estimated fee in excess of $25,000 are subject to pre-approval by the Committee Chair or its delegate on a case-by-case basis. Individual projects with an estimated fee in excess of $50,000 are subject to pre-approval by the Committee or its delegate on a case-by-case basis.
Other Non-audit Services
The SEC auditor independence rules adopted in response to the Sarbanes-Oxley Act specifically allow certain non-audit services. Because of the nature of these services, none of these services may be commenced by the independent audit firm without the prior approval of the Committee. The Committee may delegate this responsibility to one or more of the Committee members, with the decisions presented to the full Committee at the next scheduled meeting.
Proscribed Services
In accordance with SEC rules on independence, the independent audit firm is prohibited from performing services in the following categories of non-audit services:
· Management functions
· Accounting and bookkeeping services
· Internal audit services
· Financial information systems design and implementation
· Valuation services supporting the financial statements
· Actuarial services supporting the financial statements
· Executive recruitment
· Expert services (e.g., litigation support)
· Investment banking
Policy for Pre-approval of Non-Audit Services Provided to Other Entities within the Investment Company Complex
The Committee is also responsible for pre-approving certain non-audit services provided to FAF Advisors, Inc., U.S. Bank N.A., Quasar Distributors, U.S. Bancorp Fund Services, LLC and any other entity under common control with FAF Advisors, Inc., that provides ongoing services to the funds. The only non-audit services provided to these entities which require pre-approval are those services that relate directly to the operations and financial reporting of the funds.
Although the Committee is not required to pre-approve all services provided to FAF Advisors, Inc. and other affiliated service providers, the Committee will annually receive a report from the independent audit firm on the aggregate fees for all services provided to U.S. Bancorp and affiliates.
(e)(2) All of the services described in paragraphs (b) through (d) of this Item 4 were pre-approved by the audit committee.
(f) All services performed on the engagement to audit the registrant’s financial statements for the most recent fiscal year-end were performed by the principal accountant’s full-time, permanent employees.
(g) The aggregate non-audit fees billed by E&Y to the registrant, the registrant’s investment adviser, and any entity controlling, controlled by, or under common control with the adviser that provides ongoing services to the registrant, totaled $163,707 in the fiscal year ended October 31, 2006, $10,812 in the fiscal period ended October 31, 2005, and $144,841 in the fiscal year ended September 30, 2005.
(h) The registrant’s audit committee has determined that the provision of non-audit services to the registrant’s investment adviser, and any entity controlling, controlled by, or under common control with the investment adviser that provides ongoing services to the registrant, that were not pre-approved is compatible with maintaining E&Y’s independence.
Item 5—Audit Committee of Listed Registrants
Not applicable.
Item 6—Schedule of Investments
The schedule is included as part of the report to shareholders filed under Item 1 of this Form.
Item 7—Disclosure of Proxy Voting Policies and Procedures for Closed-End Management Investment Companies
Not applicable.
Item 8—Portfolio Managers of Closed-End Management Investment Companies
Not applicable.
Item 9—Purchases of Equity Securities by Closed-End Management Investment Company and Affiliated Purchasers
Not applicable.
Item 10—Submission of Matters to a Vote of Security Holders
There have been no material changes to the procedures by which shareholders may recommend nominees to the registrant’s board of directors, where those changes were implemented after the registrant last provided disclosure in response to the requirements of Item 7(d)(2)(ii)(G) of Schedule 14A (17 CFR 240.14a-101), or this item.
Item 11—Controls and Procedures
(a) The registrant’s Principal Executive Officer and Principal Financial Officer have evaluated the registrant’s disclosure controls and procedures within 90 days of the date of this filing and have concluded that the registrant’s disclosure controls and procedures
were effective, as of that date, in ensuring that information required to be disclosed by the registrant in this Form N-CSR was recorded, processed, summarized and reported timely.
(b) There were no changes in the registrant’s internal control over financial reporting that occurred during the period covered by this report that have materially affected, or are reasonably likely to materially affect, the registrant’s internal control over financial
reporting.
Item 12—Exhibits
(a)(1) Not applicable. Registrant’s code of ethics is provided to any person upon request without charge.
(a)(2) Certifications of the Principal Executive Officer and Principal Financial Officer of the registrant as required by Rule 30a-2(a) under the Investment Company Act are filed as exhibits hereto.
(a)(3) Not applicable.
(b) Certifications of the Principal Executive Officer and Principal Financial Officer of the registrant as required by Rule 30a-2(b) under the Investment Company Act are filed as exhibits hereto.
Signatures
Pursuant to the requirements of the Securities Exchange Act of 1934 and the Investment Company Act of 1940, the registrant has duly caused this report to be signed on its behalf by the undersigned, thereunto duly authorized.
First American Investment Funds, Inc.
| | | | | |
| By: | | /s/ Thomas S. Schreier, Jr. | | |
| | | | | |
| | | Thomas S. Schreier, Jr. | | |
| | | President | | |
Date: January 8, 2007
Pursuant to the requirements of the Securities Exchange Act of 1934 and the Investment Company Act of 1940, this report has been signed below by the following persons on behalf of the registrant and in the capacities and on the dates indicated.
| | | | | |
| By: | | /s/ Thomas S. Schreier, Jr. | | |
| | | | | |
| | | Thomas S. Schreier, Jr. | | |
| | | President | | |
| | | | | |
| Date: January 8, 2007 | | |
| | | | | |
| By: | | /s/ Charles D. Gariboldi, Jr. | | |
| | | | | |
| | | Charles D. Gariboldi, Jr. | | |
| | | Treasurer | | |
| | | | | |
| Date: January 8, 2007 | | |