UNITED STATES
SECURITIES AND EXCHANGE COMMISSION
Washington, D.C. 20549
FORM N-CSR
CERTIFIED SHAREHOLDER REPORT OF REGISTERED MANAGEMENT
INVESTMENT COMPANIES
Investment Company Act file number 811-05309
Nuveen Investment Funds, Inc.
(Exact name of registrant as specified in charter)
Nuveen Investments
333 West Wacker Drive, Chicago, IL 60606
(Address of principal executive offices) (Zip code)
Kevin J. McCarthy
Nuveen Investments
333 West Wacker Drive
Chicago, IL 60606
(Name and address of agent for service)
Registrant’s telephone number, including area code: (312) 917-7700
Date of fiscal year end: June 30
Date of reporting period: June 30, 2015
Form N-CSR is to be used by management investment companies to file reports with the Commission not later than 10 days after the transmission to stockholders of any report that is required to be transmitted to stockholders under Rule 30e-1 under the Investment Company Act of 1940 (17 CFR 270.30e-1). The Commission may use the information provided on Form N-CSR in its regulatory, disclosure review, inspection, and policy making roles.
A registrant is required to disclose the information specified by Form N-CSR, and the Commission will make this information public. A registrant is not required to respond to the collection of information contained in Form N-CSR unless the Form displays a currently valid Office of Management and Budget (“OMB”) control number. Please direct comments concerning the accuracy of the information collection burden estimate and any suggestions for reducing the burden to Secretary, Securities and Exchange Commission, 450 Fifth Street, NW, Washington, DC 20549-0609. The OMB has reviewed this collection of information under the clearance requirements of 44 U.S.C. ss.3507.
ITEM 1. REPORTS TO STOCKHOLDERS.
| | |
| | |  |
| Mutual Funds | |
| | | | | | |
| | | | | | | Annual Report June 30, 2015 |
| | | | | | | | | | | | | | | | |
| | | | | | | Share Class / Ticker Symbol | | |
| | | Fund Name | | | | Class A | | Class C | | Class R3 | | Class R6 | | Class I | | |
|
| | Nuveen Core Bond Fund | | | | FAIIX | | NTIBX | | — | | NTIFX | | FINIX | | |
| | Nuveen Core Plus Bond Fund | | | | FAFIX | | FFAIX | | FFISX | | FPCFX | | FFIIX | | |
| | Nuveen Inflation Protected Securities Fund | | | | FAIPX | | FCIPX | | FRIPX | | FISFX | | FYIPX | | |
| | Nuveen Intermediate Government Bond Fund | | | | FIGAX | | FYGCX | | FYGRX | | — | | FYGYX | | |
| | Nuveen Short Term Bond Fund | | | | FALTX | | FBSCX | | NSSRX | | NSSFX | | FLTIX | | |
| | | | | | | | | | | | |
| | | | | | |
| | | | |
| | | | | | | | |
| | |
| | Life is Complex. | | |
| | |
| | Nuveen makes things e-simple. | | |
| | |
| | It only takes a minute to sign up for e-Reports. Once enrolled, you’ll receive an e-mail as soon as your Nuveen Fund information is ready. No more waiting for delivery by regular mail. Just click on the link within the e-mail to see the report and save it on your computer if you wish. | | |
| | | | |
| | | | | | Free e-Reports right to your e-mail! | | |
| | | |
| | | | | | www.investordelivery.com If you receive your Nuveen Fund distributions and statements from your
financial advisor or brokerage account. |
| | | | |
| | | | or | | www.nuveen.com/accountaccess If you receive your Nuveen Fund distributions and statements directly from Nuveen. Must be preceded by or accompanied by a prospectus. NOT FDIC INSURED MAY LOSE VALUE
NO BANK GUARANTEE | | |
| | | | | | | | | | |
| | | | | | | | | | | | | |

Table
of Contents
Chairman’s Letter
to Shareholders

Dear Shareholders,
For better or for worse, the financial markets have spent the past year waiting for the U.S. Federal Reserve (Fed) to end its ultra-loose monetary policy. The policy has propped up stock and bond markets since the Great Recession, but the question remains: how will markets behave without its influence? This uncertainty has been a considerable source of volatility for stock and bond prices lately, despite the Fed carefully conveying its intention to raise rates slowly and only when the economy shows evidence of readiness.
A large consensus expects at least one rate hike before the end of 2015. After all, the U.S. has reached “full employment” by the Fed’s standards and growth has resumed – albeit unevenly. But the picture is somewhat muddled. Inflation has remained stubbornly low, most recently weighed down by an unexpectedly sharp decline in commodity prices since mid-2014. With the Fed poised to tighten and foreign central banks easing, the U.S. dollar has surged against other currencies, which has weighed on corporate earnings and further contributed to commodity price weakness. U.S. consumers have benefited from an improved labor market and lower prices at the gas pump, but the overall pace of economic expansion has been lackluster.
Nevertheless, the global recovery continues to be led by the U.S. Policy makers around the world are deploying their available tools to try to bolster Europe and Japan’s fragile growth, and manage China’s slowdown. Contagion fears ebb and flow with the headlines about Greece and China. Greece reluctantly agreed to a third bailout package from the European Union in July and China’s central bank and government intervened aggressively to try to stem the sell-off in stock prices. But persistent structural problems in these economies will continue to garner market attention.
Wall Street is fond of saying “markets don’t like uncertainty,” and asset prices are likely to continue to churn in the current macro environment. In times like these, you can look to a professional investment manager with the experience and discipline to maintain the proper perspective on short-term events. And if the daily headlines do concern you, I encourage you to reach out to your financial advisor. Your financial advisor can help you evaluate your investment strategies in light of current events, your time horizon and risk tolerance. On behalf of the other members of the Nuveen Fund Board, we look forward to continuing to earn your trust in the months and years ahead.
Sincerely,

William J. Schneider
Chairman of the Board
August 24, 2015
Portfolio Managers’
Comments
Nuveen Core Bond Fund
Nuveen Core Plus Bond Fund
Nuveen Inflation Protected Securities Fund
Nuveen Intermediate Government Bond Fund
Nuveen Short Term Bond Fund
These Funds feature portfolio management by Nuveen Asset Management, LLC, an affiliate of Nuveen Investments, Inc. In this report, the various portfolio management teams for the Funds discuss economic and fixed income market conditions, key investment strategies and the Funds’ performance for the twelve-month reporting period ended June 30, 2015. These management teams include:
Nuveen Core Bond Fund
Wan-Chong Kung, CFA, has managed the Fund since 2002 and Jeffrey J. Ebert since 2000. Chris J. Neuharth joined the Fund as a co-portfolio manager in 2012.
Nuveen Core Plus Bond Fund
Chris J. Neuharth has managed the Fund since 2006. Timothy A. Palmer, CFA, Wan-Chong Kung, CFA, and Jeffrey J. Ebert have been part of the management team for the Fund since 2003, 2001, and 2005, respectively.
Nuveen Inflation Protected Securities Fund
Wan-Chong Kung, CFA, has managed the Fund since its inception in 2004 and Chad W. Kemper joined the Fund as a co-portfolio manager in 2010.
Nuveen Intermediate Government Bond Fund
Wan-Chong Kung, CFA, has managed the Fund since 2002. Chris J. Neuharth and Jason J. O’Brien, CFA, have been on the Fund’s management team since 2009.
Nuveen Short Term Bond Fund
Chris J. Neuharth has been a co-portfolio manager of the Fund since 2004. Peter L. Agrimson, CFA, joined the Fund as a co-portfolio manager in 2011.
What factors affected the U.S. economy and domestic and global markets during the twelve-month reporting period ended June 30, 2015?
During this reporting period, the U.S. economy continued to expand at a moderate pace. The Federal Reserve (Fed) maintained efforts to bolster growth and promote progress toward its mandates of maximum employment and price stability by holding the
Certain statements in this report are forward-looking statements. Discussions of specific investments are for illustration only and are not intended as recommendations of individual investments. The forward-looking statements and other views expressed herein are those of the portfolio managers as of the date of this report. Actual future results or occurrences may differ significantly from those anticipated in any forward-looking statements and the views expressed herein are subject to change at any time, due to numerous market and other factors. The Funds disclaim any obligation to update publicly or revise any forward-looking statements or views expressed herein.
Ratings shown are the highest rating given by one of the following national rating agencies: Standard & Poor’s (S&P), Moody’s Investors Service, Inc. (Moody’s) or Fitch, Inc. (Fitch). Credit ratings are subject to change. AAA, AA, A and BBB are investment grade ratings; BB, B, CCC, CC, C and D are below investment grade ratings. Certain bonds backed by U.S. Government or agency securities are regarded as having an implied rating equal to the rating of such securities. Holdings designated N/R are not rated by these national rating agencies.
Refer to the Glossary of Terms Used in this Report for further definition of the terms used within this section.
Portfolio Managers’ Comments (continued)
benchmark fed funds rate at the record low level of zero to 0.25% that it established in December 2008. At its October 2014 meeting, the Fed announced that it would end its bond buying stimulus program as of November 1, 2014, after tapering its monthly asset purchases of mortgage-backed and longer-term Treasury securities from the original $85 billion per month to $15 billion per month over the course of seven consecutive meetings (December 2013 through September 2014). In making the announcement, the Fed cited substantial improvement in the outlook for the labor market since the inception of the current asset purchase program as well as sufficient underlying strength in the broader economy to support ongoing progress toward maximum employment in a context of price stability. The Fed also reiterated that it would continue to look at a wide range of factors, including labor market conditions, indicators of inflationary pressures and readings on financial developments, in determining future actions. Additionally, the Fed stated that it would likely maintain the current target range for the fed funds rate for a considerable time after the end of the asset purchase program, especially if projected inflation continues to run below the Fed’s 2% longer run goal. However, if economic data shows faster progress, the Fed indicated that it could raise the fed funds rate sooner than expected.
The Fed changed its language slightly in December, indicating it would be “patient” in normalizing monetary policy. This shift helped ease investors’ worries that the Fed might raise rates too soon. However, as employment data released early in the year continued to look strong, anticipation began building that the Fed could raise its main policy rate as soon as June. As widely expected, after its March meeting, the Fed eliminated “patient” from its statement but also highlighted the policy makers’ less optimistic view of the economy’s overall health as well as downgraded their inflation projections. The Fed’s April meeting seemed to further signal that a June rate hike was off the table. While the Fed attributed the first quarter’s economic weakness to temporary factors, the meeting minutes from April revealed that many Committee members believed the economic data available in June would be insufficient to meet the Fed’s criteria for initiating a rate increase. The June meeting bore out that presumption, and the Fed decided to keep the target rate near zero. But the Committee also continued to telegraph the likelihood of at least one rate increase in 2015, which many analysts forecasted for September.
According to the government’s advanced estimate, the U.S. economy increased at a 2.3% annualized rate in the second quarter of 2015, as measured by GDP, compared with a decrease of 0.6% in the first quarter of 2015 and increases of 5.0% in the third quarter 2014 and 2.2% in the fourth quarter 2014. The increase in real GDP growth rate from the first quarter of 2015 to the second quarter of 2015 primarily reflects positive contributions from personal consumption expenditures (PCE), exports, state and local government spending, and residential fixed investment that were partly offset by negative contributions from federal government spending, private inventory investment and non-residential fixed investment. The Consumer Price Index (CPI), rose 0.1% year-over-year as of June 2015. The core CPI (which excludes food and energy) increased 1.8% during the same period, below the Fed’s unofficial longer term inflation objective of 2.0%. As of June 2015, the U.S. unemployment rate was 5.3%, a level not seen since mid-2008. This figure is also considered “full employment” by some Fed officials. The housing market continued to post consistent gains as of its most recent reading in May 2015. The average home price in the S&P/Case-Shiller Index of 20 major metropolitan areas rose 4.9% for the twelve months ended May 2015 (most recent data available at the time this report was prepared).
A number of challenges weighed on global economies and financial markets during the reporting period, as oil price moves drove large swings in market sentiment. Additionally concerns around the pace of domestic and global economic growth, continued signs of weakness out of China, Greece’s continuing debt crisis, a strengthening dollar and geopolitical concerns emanating from the Middle East appeared to further provoke economic and market uncertainty. Central banks around the globe began to loosen their monetary policies in an effort to pump additional liquidity into their economies, while at the same time the U.S. Fed began to taper. For the reporting period, U.S. equity markets posted generally positive returns as investor appetite for risk returned to the market and risk aversion appeared to subside. However, while broad market performance was admirable for the reporting period, it came with fairly significant volatility.
Likewise, U.S. interest rates were volatile in response to changes in monetary policy and global capital flows, with yields on the benchmark 10-year Treasury fluctuating in a broad range during the year with no sustained trend. Yields moved higher in mid-2014, then declined significantly as concerns about global economic weakness captured the spotlight. Yields hit a low point in early February before rising again, then settling into a trading range by the end of June. The U.S. Treasury yield curve flattened significantly as yields on long Treasuries dropped, while yields in the short to intermediate section of the curve rose modestly as investors anticipated a Fed tightening in mid-2015. However, disappointing U.S. economic data in early 2015 pushed out expectations for a lift-off in the fed funds rate and the yield curve steepened again somewhat.
The environment over much of the reporting period proved to be challenging for the riskier areas of the bond market with corporate bonds, particularly in the high-yield area, falling short of Treasuries and the broader bond market. High yield bonds from energy and commodity-related issuers exhibited significant volatility, particularly in the final months of 2014, as the sharp drop in oil prices and uncertainty about base commodity prices affected these sectors. Bonds from these issuers partially recovered later in the reporting period as prices for oil and other commodities gained back some of their lost ground. Generally speaking, higher yielding bonds outperformed in the reporting period’s latter months because they were better able to absorb the impact of rising rates versus sectors with less income.
How did the Funds perform during the twelve-month reporting period ended June 30, 2015?
The tables in the Fund Performance and Expense Ratios section of this report provide total returns for the Funds for the one-year, five-year, ten-year and/or since inception periods ended June 30, 2015. Each Funds’ Class A Share total returns at net asset value (NAV) are compared with the performance of the appropriate Barclays Index and Lipper classification average.
A more detailed account of each Fund’s performance is provided later in this report.
What strategies were used to manage the Funds during the twelve-month reporting period and how did these strategies influence performance?
All of the Funds continued to employ the same fundamental investment strategies and tactics used previously, although implementation of those strategies depended on the individual characteristics of the portfolios, as well as market conditions. The Funds’ management teams use a highly collaborative, research-driven approach that we believe offers the best opportunity to achieve consistent, superior long-term performance on a risk-adjusted basis across the full range of market environments. During the reporting period, the Funds were generally positioned for an environment of continued moderate economic growth and improving financial conditions. Nonetheless, during the reporting period we made smaller scaled shifts on an ongoing basis that were geared toward improving each Fund’s profile in response to changing conditions and valuations. These strategic moves are discussed in more detail within each Fund’s section of this report.
Nuveen Core Bond Fund
The Fund’s Class A Shares at NAV underperformed the Barclays U.S. Aggregate Bond Index and the Lipper Core Bond Classification Average for the twelve-month reporting period. Global economies struggled to deal with a number of challenges in the first half of the reporting period, including disappointing economic growth levels, a dramatic drop in commodity prices and ongoing geopolitical unrest. While the Fed was in the process of tapering its quantitative easing program in the U.S. in late 2014, central banks outside of the U.S. began to incorporate more accommodative policies in an effort to pump additional liquidity into their economies. U.S. bond yields changed little over the reporting period, but at times were quite volatile in response to changes in monetary policy and global capital flows. The shape of the U.S. Treasury curve was also volatile with the yield curve flattening dramatically in late 2014 as yields on long Treasuries plunged, while yields on short to intermediate maturities rose modestly in response to investors pulling forward the timing of Fed tightening into mid-2015. Subsequently, weak U.S. economic data in early 2015 caused the market to view a mid-year tightening as unlikely and the yield curve flattening that occurred in late 2014 partially reversed course.
For virtually all of the reporting period, investors favored higher quality sectors of the market, causing government securities to outpace corporate bonds by a wide margin. Global growth concerns, commodity weakness, heightened geopolitical risk and a heavy new issue calendar caused general weakness in the corporate bond market and credit spreads reached their widest level in several years. The market showed little tolerance for negative news or downgrades of credit issuers. Energy and metals/mining related issuers were hardest hit during the reporting period, a reflection of the dramatic drop in commodity prices that occurred in the second half of 2014 and early 2015. Although spreads leveled off early in 2015, they began to widen again due to a large amount of new issue supply and increasing investor worries about a disorderly Greek exit from the European Monetary Union. As oil prices recovered some lost ground, energy issues stabilized, but still proved to be a major detractor during the reporting period. Financial names held up better than industrials as positive fundamental credit trends remained intact and the financial sector traded with better liquidity and lower volatility than the broader credit market.
Portfolio Managers’ Comments (continued)
Among the securitized sectors of the bond market, mortgage-backed securities (MBS) issued by government agencies such as Fannie Mae (FNMA), Ginnie Mae (GNMA) and Freddie Mac (FHLMC) struggled to keep pace with Treasuries for much of the reporting period due to higher volatility and concerns about the Fed normalizing policy. In early 2015, investors became concerned about prepayment risk due to lower rates and a reduction in mortgage insurance costs for Federal Housing Administration (FHA) loans, which comprise the bulk of GNMA securities. The lower insurance costs created an incentive for FHA borrowers to refinance, resulting in dramatic underperformance among GNMA pass-through securities and creating broader concerns about policy risk for the MBS market. For much of the reporting period, commercial mortgage-backed securities (CMBS) benefited from improving commercial real estate fundamentals and relative immunity to energy-related spread volatility. However, late in the reporting period, CMBS spreads widened due to increased supply, ongoing concerns about loan origination quality and wider corporate spreads.
The Fund lagged its comparative indexes during the period. Its overweight exposure to investment grade corporate bonds and a bias toward lower rated corporate bonds worked against the Fund due to the systemic weakness in the credit sectors. While the Fund benefited from an overweight position to financial issuers, our exposure to the industrial sector struggled, particularly as we focused on BBB rated bonds. While the Fund’s weighting in the energy sector was modest, it detracted from relative performance as the energy sector was challenged due to the sharp decline in oil prices. The Fund’s exposures to the securitized sectors were a non-factor as its MBS exposure was in line with the benchmark and its CMBS holdings performed in line with Treasuries.
Our duration and yield curve strategies were positive factors during the reporting period. We tactically traded the Fund’s duration in varying degrees short to benchmark, which was a slight benefit to returns. At the same time, the Fund’s yield curve exposure was aggressively positioned to benefit from a flatter curve during the first nine months of the reporting period, which added significantly to returns in late 2014. In the second half of the reporting period, a steeper yield curve worked against the Fund’s positioning in longer dated securities, but our short duration bias added value as rate rose.
As the reporting period came to an end, we adjusted the Fund’s exposures slightly in response to changes in our macroeconomic outlook and current valuations in the bond market. However, we continued to favor strategies oriented toward income generation. We were comfortable with credit fundamentals and maintained a significant overweight to credit during the period with emphases on financial issuers and BBB rated industrials. The financial sector performed well throughout the reporting period, as bonds in this segment continue to offer attractive valuations and strong liquidity, leverage and capital positions. We also selectively invested in some new issues that came with a spread concession due to heavy supply.
We moved toward a relatively neutral weighting in agency MBS versus the benchmark as we saw limited opportunities for meaningful outperformance of the sector. In structured sectors, we continued to modestly overweight CMBS and asset-backed securities (ABS). We were able to add some new issue CMBS at attractive levels as the period came to a close.
Duration positioning remains slightly defensive versus the benchmark as the risk of rising interest rates is still a concern. But the Fund’s portfolio is less than fully defensive, given that inflation risks remain muted globally and the expectation is for continued high levels of global liquidity and economic slack. These factors will likely keep any upturn in interest rates modest. In early 2015, we tempered the Fund’s yield curve flattening stance as we pushed back the timing of Fed tightening to late this year. We will look to re-engage in a curve flattening position as we move closer to the fed funds rate lift-off. We maintained a significant underweight in Treasuries and agencies, at less than one-third of the benchmark weight, because of our emphasis on income generation and finding more value in other sectors.
In addition, we continued to utilize various derivative instruments in the Fund during the reporting period. We used Treasury note and bond futures to manage the Fund’s duration and yield curve exposure. To decrease the duration of the Fund’s portfolio, we established short Treasury bond or Treasury note futures positions. These derivative positions slightly detracted from performance during the period. We also used interest rate swaps as part of our portfolio construction strategy to manage the Fund’s duration and overall portfolio yield curve exposure. The interest rate swap positions also slightly detracted from performance during the reporting period.
Nuveen Core Plus Bond Fund
The Fund’s Class A Shares at NAV underperformed both the Barclays U.S. Aggregate Bond Index and the Lipper Core Bond Plus Classification Average for the twelve-month reporting period. Global economies struggled to deal with a number of challenges in the
first half of the period, including disappointing economic growth levels, a dramatic drop in commodity prices and ongoing geopolitical unrest. While the Fed was in the process of tapering its quantitative easing program in the U.S. in late 2014, central banks outside of the U.S. began to incorporate more accommodative policies in an effort to pump additional liquidity into their economies. U.S. bond yields changed little over the reporting period, but at times were quite volatile in response to changes in monetary policy and global capital flows. The shape of the U.S. Treasury curve was also volatile with the yield curve flattening dramatically in late 2014 as yields on long Treasuries plunged, while yields on short to intermediate maturities rose modestly in response to investors pulling forward the timing of Fed tightening into mid-2015. Subsequently, weak U.S. economic data in early 2015 caused the market to view a mid-year tightening as unlikely and the yield curve flattening that occurred in late 2014 partially reversed course.
For virtually all of the reporting period, investors favored higher quality sectors of the market, while corporate bonds, particularly in the high yield area, underperformed the broader bond market. Energy and commodity-related issuers sustained significant volatility in the high yield market as uncertainty about base commodity prices affected these sectors. The sharpest drops occurred in the closing months of 2014 as oil prices declined dramatically. Energy and commodity issuers performed better in the final months of the period when commodity prices recovered some of the ground lost in 2014. As concerns about risks to the global economy rose, investors appeared to move away from the riskier parts of the bond market. Within investment grade credit, BBB rated bonds suffered versus higher rated peers. In the high yield bond segment, BB bonds outperformed lower quality B and CCC rated bonds for much of the reporting period. However, as interest rates began to increase, high yield bonds were better positioned to absorb the impact of rising rates than sectors with less income. In the final months of the reporting period, investors’ risk appetite appeared to improve. High yield bonds subsequently outperformed investment grade corporates and Treasury bonds, while the lower quality sectors of the high yield market also performed better.
Investment grade bonds generally fared better than high yield bonds for much of the reporting period, although their returns continued to lag those of Treasury bonds. The corporate market weakened in late 2014 due to a heavy new issue calendar and growing risk aversion by investors. Spreads between corporate bonds and Treasuries reached their widest points near the end of 2014. Spreads narrowed a bit early in 2015 before widening again in the closing months of the period. Increasing investor worries about Greece’s ongoing debt crisis and the risk of a disorderly Greek exit from the European Monetary Union fueled investor worries. Investment grade corporates ended the twelve-month period with a very weak performance in the second quarter.
Among the securitized sectors of the bond market, mortgage-backed securities (MBS) issued by government agencies such as Fannie Mae (FNMA), Ginnie Mae (GNMA) and Freddie Mac (FHLMC) struggled to keep pace with Treasuries for much of the reporting period due to higher volatility and concerns about the Fed normalizing policy. In early 2015, investors became concerned about prepayment risk due to lower rates and a reduction in mortgage insurance costs for Federal Housing Administration (FHA) loans, which comprise the bulk of GNMA securities. The lower insurance costs created an incentive for FHA borrowers to refinance, resulting in dramatic underperformance among GNMA pass-through securities and creating broader concerns about policy risk for the MBS market. For much of the reporting period, commercial mortgage-backed securities (CMBS) benefited from improving commercial real estate fundamentals and relative immunity to energy-related spread volatility. However, late in the period, CMBS spreads widened due to increased supply, ongoing concerns about loan origination quality and wider corporate spreads.
Global interest rates fell sharply through most of 2014 and in the early months of 2015 as economies struggled, inflation declined and monetary policy eased in many developed markets. In an effort to spur faster economic growth, the European Central Bank launched its large-scale quantitative easing (QE) program in January. Other central banks announced widespread policy accommodations as well. However, market fears appeared to send global rates down too far, and in the second quarter, global interest rates shot higher. Yields on German’s Bund spiked to 1% even with the uncertainty surrounding Greece’s debt issues. Yield spreads steepened by 10 to 100 basis points in major markets based on a reassessment of inflation and long-end liquidations.
Emerging market (EM) debt weakened significantly through the end of 2014 and into January 2015. Lower commodity prices, growth concerns and fears of looming Fed rate action contributed to the decline, along with ongoing geopolitical risk and investor outflows. EM bonds began to rebound in February, as commodity prices improved and growth in many countries appeared to stabilize. China continued its policy easing including interest rate cuts. Russia’s debt recovered, driving solid returns in European EM debt. A scandal surrounding oil giant Petrobras took a toll on Brazilian debt early in 2015, but as news improved on that front, Brazilian debt rallied late in the reporting period. EM debt ended the period with solid performance in the second quarter.
Portfolio Managers’ Comments (continued)
Currency movements were significant during the reporting period. Through most of 2014 and into the early part of 2015, the U.S. dollar rallied significantly against most major currencies. The tide turned modestly after that with the dollar giving back some ground against major currencies, although it held its own against a number of EM currencies. Stabilization in Russian markets helped Eastern European currencies gain versus the dollar and, as the Petrobras scandal subsided, Brazil’s currency fared better as well.
Most of the Fund’s underperformance compared to its benchmark indexes occurred in the first half of the reporting period. The largest contributing factor was the Fund’s significant overweight to the high yield corporate bond sector, followed by an overweight position to investment grade corporates. Corporate spreads widened during the period, while issue selection and quality effects within the investment grade sector also played a role in underperformance. For example, our industrial positioning was focused on BBB rated securities within investment grade, which performed poorly during the period due to their inherently higher leverage and tendency for issuers in this ratings category to be more cyclical in nature. Another critical factor was the Fund’s overweight position in the struggling energy sector within the investment grade market, as well as holdings in the metals and mining sector. Positions in foreign bonds also hindered results for much of the reporting period, primarily due to the strong dollar.
In 2015, as risk-oriented assets began to gain more favor with investors, our overweight position in high yield corporate bonds contributed favorably as relative performance improved during the second half of the period. An overweight position to investment grade corporates worked well during the opening months of 2015, but proved to be a drag on performance again late in the period. Throughout the reporting period, our holdings in the solidly-performing financial sector worked well. In the closing months, dollar denominated EM bonds added to the Fund’s returns as their performance improved. Our defensive duration positioning benefited returns late in the reporting period when interest rates began moving higher, but that strategy had detracted from relative performance prior to that time. In contrast, our emphasis on positioning for a flatter yield curve benefited the Fund earlier in the reporting period, but detracted from performance in the final months.
The Fund’s key sector themes continued to focus on positioning in favor of credit sectors with corresponding underweights to mortgage and government securities. While markets may remain volatile and concerns persist about the sustainability of more vibrant economic growth, we believe credit sectors are well positioned from a fundamental perspective with the ability to compensate for both credit risk and near-term volatility. We made shifts in the Fund’s portfolio as appropriate based on market opportunities and research ideas. Market volatility also created opportunities to add marginally to our high yield positions. From a sector perspective, financial issues remained attractive given their compelling valuations and strong liquidity, leverage and capital positions. In line with our enthusiasm for the financial sector, we also increased the Fund’s weighting in preferred securities. We continued to closely monitor developments in the energy sector to assess the credit impact of changes to oil prices and underlying industry fundamentals.
Our currency positioning remains roughly net neutral to the U.S. dollar. We are also maintaining a defensive duration position versus the benchmark index given our concerns about the risk of rising interest rates in today’s low yield environment. However, our position is not fully defensive as we recognize that inflation risks appear to be muted globally and the outlook remains positive for persistently high levels of global liquidity and economic slack. These factors will likely keep any upturn in interest rates modest. While the Fund was positioned for a flatter yield curve for most of the year, we tempered this positioning toward the end of the period. We will look to re-engage in a curve flattening position as we move closer to the fed funds lift-off.
During the reporting period, we also continued to utilize various derivative instruments. We used Treasury note and bond futures as part of an overall construction strategy to manage the Fund’s duration and yield curve exposure and used selected foreign bond futures to actively manage exposure to those markets. The effect of these activities slightly detracted from performance during the reporting period. We also utilized interest rate swaps to manage portfolio duration and yield curve exposure, and these positions also slightly detracted from performance.
We utilized foreign exchange forwards to manage the Fund’s foreign currency exposure. For example, the Fund may reduce unwanted currency exposure from the Fund’s portfolio, or may take long forward positions in select currencies in an attempt to benefit from the potential price appreciation. These positions had a positive impact on performance during the reporting period.
We began the period utilizing credit default swaps (CDX) to partially hedge its exposure to the High Yield market, however this position was removed shortly after the beginning of the period. The impact of this position was negligible on the performance of the Fund during the reporting period.
Nuveen Inflation Protected Securities Fund
The Fund’s Class A Shares at NAV underperformed the Barclays U.S. TIPS Index and outperformed the Lipper Inflation-Protected Bond Funds Classification Average for the twelve-month reporting period. Global economies struggled to deal with a number of challenges in the first half of the period, including disappointing economic growth levels, a dramatic drop in commodity prices and ongoing geopolitical unrest. While the Fed was in the process of tapering its quantitative easing program in the U.S. in late 2014, central banks outside of the U.S. began to incorporate more accommodative policies in an effort to pump additional liquidity into their economies. U.S. bond yields changed little over the reporting period, but at times were quite volatile in response to changes in monetary policy and global capital flows. The shape of the U.S. Treasury curve was also volatile with the yield curve flattening dramatically in late 2014 as yields on long Treasuries plunged, while yields on short to intermediate maturities rose modestly in response to investors pulling forward the timing of Fed tightening into mid-2015. Subsequently, weak U.S. economic data in early 2015 caused the market to view a mid-year tightening as unlikely and the yield curve flattening that occurred in late 2014 partially reversed course.
For virtually all of the reporting period, investors favored higher quality sectors of the market, while corporate bonds, particularly in the high yield area, underperformed the broader bond market. Energy and commodity related issuers sustained significant volatility in the high yield market as uncertainty about base commodity prices affected these sectors.
In securitized sectors, early on, investor demand for commercial mortgage-backed securities (CMBS) was strong as commercial real estate fundamentals were firm and the sector proved to be relatively immune to weakness in the energy related sector. However, late in the reporting period, CMBS spreads widened due to increased supply, ongoing concerns about loan origination quality and wider corporate spreads.
In the first half of the reporting period, changes in the Consumer Price Index (CPI), the primary measure of inflation, were very modest due in large part to the decline in energy prices. Speculation about the Fed tightening its monetary policy also tempered inflation expectations, while signs of disinflation and deflation occurred in many countries outside of the United States. As a result, demand for Treasury inflation protected securities (TIPS) declined during that period and investor dollars flowed out of this sector of the market. However, in the early months of 2015, inflation concerns were revived as energy prices rebounded. In February, CPI rose for the first time in four months, restoring a positive outlook for the TIPS market. Retail investor flows into the TIPS market turned positive again. With the return of positive inflation prints and fund flows into the segment, along with the Fed seemingly backing off its fed funds rate lift-off, the TIPS “breakeven rate” (the difference between the yields of nominal Treasuries versus TIPS with the same maturity) widened across the TIPS yield curve. This widening indicates investor expectations of increased inflation risk. Despite the stronger outlook for TIPS later in the reporting period, the segment still produced negative returns for the overall reporting period, significantly underperforming nominal Treasuries.
Throughout the reporting period, we maintained an underweight position to the TIPS sector versus the Barclays U.S. TIPS Index, which benefited the Fund’s relative performance as TIPS underperformed Treasuries over much of the period. Slightly less than 20% of the Fund was invested outside of the TIPS market, including positions in CMBS, which produced mixed returns during the reporting period and had a minimal impact on performance. Our out-of-index exposure to high yield securities detracted from performance, particularly in the latter months of 2014 and the second quarter of 2015 when this segment of the market suffered due to severe weakness among energy issuers.
Anticipating that interest rates would move up from historically low levels, we maintained a shorter duration in the Fund, which reduces its sensitivity to changing interest rates. When looking at the reporting period as a whole, this strategy benefited the Fund’s performance. For three-fourths of the period, we also positioned the Fund to benefit from a flatter yield curve by underweighting shorter term securities and adding to longer maturity holdings; however, in the final months, we switched to positioning for a steeper yield curve. Over the full reporting period, yield curve positioning was not a significant performance driver as the impacts largely offset one another.
While the outlook for modest growth and slowly rising inflation bodes well for TIPS, the Fed is increasingly looking to normalize policy and increase interest rates, which will likely have a negative impact on the TIPS market. Although investor inflows continue, TIPS struggle to perform on a sustained basis as sellers lurk. However, valuations remain favorable as breakeven spread levels are attractive and do not reflect the full inflation risk premium expected from an accommodative Fed.
Portfolio Managers’ Comments (continued)
This outlook is leading us to maintain the Fund’s strategically short duration versus its benchmark, while looking to re-engage in a curve flattening position as we move closer to the fed funds rate lift-off. We continue to emphasize our key themes of underweighting TIPS and maintaining out-of-index exposures to CMBS and high yield bonds; however, we are looking on a bottom-up basis for opportunistic trades to improve the profile of these exposures. We are making other marginal changes to the Fund’s TIPS positioning in light of modestly rising inflation expectations and valuations.
We also used Treasury note and bond futures as part of an overall portfolio construction strategy to manage the Fund’s duration and yield curve exposure. To decrease the duration of the Fund’s portfolio, we acquired short Treasury bond or Treasury note futures positions. The overall effect on performance during the reporting period was positive. We also used interest rate swaps to manage portfolio duration and yield curve exposure and these positions slightly detracted from performance.
Nuveen Intermediate Government Bond Fund
The Fund’s Class A Shares at NAV underperformed both the Barclays Intermediate Government Bond Index and the Lipper Intermediate U.S. Government Funds Classification Average for the twelve-month reporting period. The year began with an unsettled environment as global growth lagged, geopolitical unrest persisted and commodity prices dropped dramatically. While the Fed was in the process of tapering its quantitative easing program in the U.S. in late 2014, central banks outside of the U.S. began to incorporate more accommodative policies in an effort to pump additional liquidity into their economies. U.S. bond yields changed little over the reporting period, but at times were quite volatile in response to changes in monetary policy and global capital flows. The shape of the U.S. Treasury curve was also volatile with the yield curve flattening dramatically in late 2014 as yields on long Treasuries plunged, while yields on short to intermediate maturities rose modestly in response to investors pulling forward the timing of Fed tightening into mid-2015. Subsequently, weak U.S. economic data in early 2015 caused the market to view a mid-year tightening as unlikely and the yield curve flattening that occurred in late 2014 partially reversed course.
For virtually all of the reporting period, investors favored higher quality sectors of the market, causing government securities to outpace most spread assets. Among the securitized sectors of the bond market, mortgage backed securities (MBS) issued by government agencies such as Fannie Mae (FNMA), Ginnie Mae (GNMA) and Freddie Mac (FHLMC) struggled to keep pace with Treasuries for much of the year due to higher volatility and concerns about the Fed normalizing policy. In early 2015, investors became concerned about prepayment risk due to lower rates and a reduction in mortgage insurance costs for Federal Housing Administration (FHA) loans, which comprise the bulk of GNMA securities. The lower insurance costs created an incentive for FHA borrowers to refinance, resulting in dramatic underperformance among GNMA pass-through securities and creating broader concerns about policy risk for the MBS market. For much of the reporting period, commercial mortgage-backed securities (CMBS) benefited from improving commercial real estate fundamentals and relative immunity to energy-related spread volatility. However, late in the period, non-agency CMBS spreads widened due to increased supply, ongoing concerns about loan origination quality and wider corporate spreads. Agency CMBS spreads widened during the reporting period and underperformed Treasuries as buyers stepped away during the flight to quality trade. The majority of the widening took place in the latter half the reporting period. Short, high quality asset-backed securities (ABS) traded with lower volatility than other spread sectors and benefited from investors looking for shorter maturity, high quality securities. This resulted in the ABS sector outperforming Treasuries for the reporting period.
Results from our interest rate strategy were modestly positive over the course of the reporting period. We entered the reporting period with the Fund positioned for the likelihood that short-term interest rates would rise more than long rates and that the yield curve would flatten as the Fed continued to normalize its policy. Therefore, throughout the reporting period, the Fund was positioned defensively in terms of duration (interest rate sensitivity), which worked to its benefit relative to the index. We also maintained an underweight position in securities on the short end of the yield curve (out to five years) and added a corresponding overweight to ten- and twenty-year maturities. This contributed favorably to the Fund’s performance in the first half of the reporting, but detracted modestly from relative performance in the second half of the reporting period as the shape of the yield curve changed.
Throughout the reporting period, the Fund’s sector strategies detracted from performance. Our overweight positions in several securitized sectors of the market and corresponding underweight to U.S. Treasuries proved detrimental to the Fund’s returns. In particular, the Fund’s overweight exposure to MBS had a significantly negative impact on its results for the reporting period, while our positions in agency and non-agency CMBS securities also detracted from relative returns. As noted above, these segments of the market did not produce returns in excess of similar duration Treasuries during the reporting period. The Fund’s relatively small exposure to the ABS sector was also a modest detractor due to security selection.
In addition, we used Treasury note and bond futures as part of an overall portfolio construction strategy to manage the Fund’s portfolio duration and yield curve exposure. To decrease the duration of the Fund’s portfolio, we acquired short Treasury bond or Treasury note futures positions. The overall effect on performance during the reporting period was slightly negative. We also used interest rate swaps as part of our portfolio construction strategy to manage the Fund’s duration and overall portfolio yield curve exposure. The interest rate swap positions also slightly detracted from performance during the reporting period.
Nuveen Short Term Bond Fund
The Fund’s Class A Shares at NAV underperformed both the Barclays 1-3 Year Government/Credit Bond Index and the Lipper Short Investment Grade Debt Funds Classification Average for the twelve-month reporting period. The macro backdrop over the reporting period has been quite unsettled, with global growth weakening, persistent geopolitical risk and commodity prices dropping dramatically. Nonetheless the U.S. economy, despite another weak first quarter, continued to expand at a moderate pace and the Fed continued to move down the path of policy normalization by tapering its quantitative easing program in late 2014 and guiding the market to expect a hike in the fed funds rate in 2015, absent a significant deterioration in the outlooks for growth and inflation. At the same time, central banks outside of the U.S. began to incorporate more accommodative policies in an effort to pump additional liquidity into their economies. In response to changes in monetary policy and global capital flows, short to intermediate U.S. rates were volatile over the reporting period, but overall were little changed. Yields on two-year Treasuries rose by about 20 basis points, while five-year Treasury rates were virtually unchanged. When it was all said and done, the modest increase in short-term rates overall during the reporting period resulted in fairly limited returns for short-term bond benchmarks.
Generic spreads on shorter duration high grade corporate bonds widened over the reporting period as investors became nervous about the impact of weaker global growth on credit fundamentals and technicals deteriorated due to massive amounts of corporate bond issuance. Energy and metals/mining issuers suffered given the dramatic drop in commodity prices. Financial names held up better than industrials as fundamental credit trends remained intact and the financial sector traded with better liquidity and lower volatility than the broad credit market. During this reporting period, many non-investment grade issuers outperformed their higher quality counterparts as their higher levels of income enabled them to weather the period of rising rates better than high grade securities, as the income advantage they earned helped overcome the principal loss that occurs when rates rise.
Securitized sectors performed reasonably well through most of the reporting period and appeared to be immune from the downdraft that affected the energy sector. For much of the period, commercial mortgage-backed securities (CMBS) benefited from improving commercial real estate fundamentals and relative immunity to energy-related spread volatility. However, late in the period, CMBS spreads widened due to increased supply, ongoing concerns about loan origination quality and wider corporate spreads. The asset-backed securities (ABS) sector closed the fiscal period on a stronger note, benefiting from strong technicals and relatively stable credit fundamentals. Steady housing fundamentals and lack of new supply enabled non-agency mortgage-backed securities (MBS) to continue to perform well during the period.
The Fund’s performance was driven by our sector decisions and yield curve strategies. The Fund was overweight in the investment grade credit sector and in non-investment grade corporates. Given the weak performance of the broad credit sectors, these allocations were a drag on the Fund’s performance, particularly in the early months of the reporting period. Security selection also had a detrimental impact on the Fund’s returns. Specifically, our exposure to the struggling areas of energy and metals/mining, while very minimal, suffered relative to the index. These holdings performed poorly despite being rated primarily investment grade and focused on the relatively stable midstream and refining segments of the energy sector. At the same time, solid performance by the securitized sectors benefited performance as more than 40% of the Fund’s portfolio was allocated to these securities. Also, about half of our securitized holdings were in adjustable rate and floating rate product, which exhibited low volatility even as interest rates rose. Our defensive interest rate posture, maintaining a lower duration to limit the Fund’s sensitivity to rising interest rates, ultimately proved to be a helpful stance as rates rose in the closing months of the reporting period.
As we ended the Fund’s reporting period, we believed the market, as demonstrated by yields at the short-end of the yield curve, was underestimating the probability of Fed tightening in September and the impact it could have on the current low interest rate environment. In light of that, we managed the Fund’s duration between 1.20 and 1.25 years, far more defensive from an interest rate sensitivity standpoint than the 1.90 duration for the benchmark index. Sector allocations have remained fairly consistent with overweight allocations to the credit sectors holding steady. Our securitized strategy is mostly bottom-up in nature, focused on opportunities in the
Portfolio Managers’ Comments (continued)
non-government segments of the market. We added about 2% to non-agency MBS paper as the reporting period came to a close. Our focus is on maintaining a strong liquidity profile for the Fund, both by holding significant weights in high quality ABS, which have demonstrated better liquidity than corporate bonds, and by investing in securities that generate significant levels of near-term cash flow.
During the reporting period, we also continued to utilize various derivative instruments. For example, we utilized Treasury note futures as part of an overall portfolio construction strategy to manage the Fund’s duration and yield curve exposure. To decrease the duration of the Fund’s portfolio, we established short Treasury bond or Treasury note futures positions. The overall effect on the Fund’s performance during the reporting period was slightly negative. We also used interest rate swaps to manage Fund duration and yield curve exposure; these positions also slightly detracted from performance during the reporting period.
Risk Considerations
and Dividend Information
Risk Considerations
Nuveen Core Bond Fund
Mutual fund investing involves risk; principal loss is possible. Debt or fixed income securities such as those held by the Fund, are subject to market risk, credit risk, interest rate risk, call risk, derivatives risk, dollar roll transaction risk, and income risk. As interest rates rise, bond prices fall. Foreign investments involve additional risks, including currency fluctuation, political and economic instability, lack of liquidity, and differing legal and accounting standards. Asset-backed and mortgage-backed securities are subject to additional risks such as prepayment risk, liquidity risk, default risk and adverse economic developments.
Nuveen Core Plus Bond Fund
Mutual fund investing involves risk; principal loss is possible. Debt or fixed income securities such as those held by the Fund, are subject to market risk, credit risk, interest rate risk, call risk, derivatives risk, dollar roll transaction risk, and income risk. As interest rates rise, bond prices fall. Below investment grade or high yield debt securities are subject to liquidity risk and heightened credit risk. Foreign investments involve additional risks, including currency fluctuation, political and economic instability, lack of liquidity and differing legal and accounting standards. Asset-backed and mortgage-backed securities are subject to additional risks such as prepayment risk, liquidity risk, default risk and adverse economic developments.
Nuveen Inflation Protected Securities Fund
Mutual fund investing involves risk; principal loss is possible. Debt or fixed income securities such as those held by the Fund, are subject to market risk, credit risk, interest rate risk, call risk, derivatives risk, income risk, and index methodology risk. As interest rates rise, bond prices fall. Below investment grade or high yield debt securities are subject to liquidity risk and heightened credit risk. The guarantee provided by the U.S. government to treasury inflation protected securities (TIPS) relates only to the prompt payment of principal and interest and does not remove the market risks of investing in the Fund shares. Foreign investments involve additional risks, including currency fluctuation, political and economic instability, lack of liquidity and differing legal and accounting standards. Asset-backed and mortgage-backed securities are subject to additional risks such as prepayment risk, liquidity risk, default risk, and adverse economic developments. The Fund’s investment in inflation protected securities has tax consequences that may result in income distributions to shareholders.
Nuveen Intermediate Government Bond Fund
Mutual fund investing involves risk; principal loss is possible. Debt or fixed income securities such as those held by the Fund, are subject to market risk, credit risk, interest rate risk, call risk, derivatives risk, dollar roll transaction risk, and income risk. As interest rates rise, bond prices fall. Asset-backed and mortgage-backed securities are subject to additional risks such as prepayment risk, liquidity risk, default risk and adverse economic developments.
Nuveen Short Term Bond Fund
Mutual fund investing involves risk; principal loss is possible. Debt or fixed income securities such as those held by the Fund, are subject to market risk, credit risk, interest rate risk, call risk, derivatives risk, and income risk. As interest rates rise, bond prices fall. Below investment grade or high yield debt securities are subject to liquidity risk and heightened credit risk. Foreign investments involve additional risks, including currency fluctuation, political and economic instability, lack of liquidity and differing legal and accounting standards. Asset-backed and mortgage-backed securities are subject to additional risks such as prepayment risk, liquidity risk, default risk and adverse economic developments.
Risk Considerations and Dividend Information (continued)
Dividend Information
Each Fund seeks to pay regular monthly dividends out of its net investment income at a rate that reflects its past and projected net income performance. To permit each Fund to maintain a more stable monthly dividend, the Fund may pay dividends at a rate that may be more or less than the amount of net income actually earned by the Fund during the period. If a Fund has cumulatively earned more than it has paid in dividends, it will hold the excess in reserve as undistributed net investment income (UNII) as part of the Fund’s net asset value. Conversely, if a Fund has cumulatively paid in dividends more than it has earned, the excess will constitute a negative UNII that will likewise be reflected in the Fund’s net asset value. Each Fund will, over time, pay all its net investment income as dividends to shareholders.
As of June 30, 2015, Nuveen Inflation Protected Securities Fund had a zero UNII balance while the other Funds had positive UNII balances for tax purposes. Nuveen Core Plus Bond Fund had a positive UNII balance, while the other Funds had negative UNII balances for financial reporting purposes.
All monthly dividends paid by the Funds during the current reporting period were paid from net investment income. If a portion of the Fund’s monthly distributions was sourced from or comprised of elements other than net investment income, including capital gains and/or a return of capital, shareholders would have received a notice to that effect. For financial reporting purposes, the composition and per share amounts of each Fund’s dividends for the reporting period are presented in this report’s Statement of Changes in Net Assets and Financial Highlights, respectively. For income tax purposes, distribution information for each Fund as of its most recent tax year end is presented in Note 6 – Income Tax Information within the Notes to Financial Statements of this report.
Fund Performance
and Expense Ratios
The Fund Performance and Expense Ratios for each Fund are shown within this section of the report.
Returns quoted represent past performance, which is no guarantee of future results. Current performance may be higher or lower than the performance shown. Investment returns and principal value will fluctuate so that when shares are redeemed, they may be worth more or less than their original cost. Returns without sales charges would be lower if the sales charge were included. Returns do not reflect the deduction of taxes that a shareholder would pay on Fund distributions or the redemption of Fund shares.
Returns may reflect an agreement by the investment adviser to waive certain fees and/or reimburse expenses during the periods presented. If any such waivers and/or reimbursements had not been in place, returns would have been reduced. See Notes to Financial Statements, Note 7—Management Fees and Other Transactions with Affiliates for more information. For the most recent month-end performance visit www.nuveen.com or call (800) 257-8787.
Returns reflect differences in sales charges and expenses, which are primarily differences in distribution and service fees, and assume reinvestment of dividends and capital gains.
Comparative index and Lipper return information is provided for Class A Shares at net asset value (NAV) only.
The expense ratios shown reflect total operating expenses (before fee waivers and/or expense reimbursements, if any) as shown in the most recent prospectus. The expense ratios include management fees and other fees and expenses.
Fund Performance and Expense Ratios (continued)
Nuveen Core Bond Fund
Refer to the first page of this Fund Performance and Expense Ratios section for further explanation of the information included within this section. Refer to the Glossary of Terms Used in this Report for definitions of terms used within this section.
Fund Performance
Average Annual Total Returns as of June 30, 2015
| | | | | | | | | | | | |
| | | Average Annual | |
| | | 1-Year | | | 5-Year | | | 10-Year | |
Class A Shares at NAV | | | 0.52% | | | | 3.11% | | | | 4.03% | |
Class A Shares at maximum Offering Price | | | (2.49)% | | | | 2.48% | | | | 3.71% | |
Barclays U.S. Aggregate Bond Index | | | 1.86% | | | | 3.35% | | | | 4.44% | |
Lipper Core Bond Classification Average | | | 1.11% | | | | 3.54% | | | | 4.03% | |
| | | |
Class I Shares | | | 0.78% | | | | 3.32% | | | | 4.21% | |
| | | | | | | | |
| | | Average Annual | |
| | | 1-Year | | | Since
Inception | |
Class C Shares | | | (0.20)% | | | | 2.13% | |
| | | | |
| | | Cumulative | |
| | | Since
Inception | |
Class R6 Shares | | | (1.46)% | |
Since inception return for Class C Shares is from 1/18/11. Since inception return for Class R6 Shares is from 1/20/15. Indexes and Lipper averages are not available for direct investment.
Class A Shares have a maximum 3.00% sales charge (Offering Price). Class A Share purchases of $1 million or more are sold at net asset value without an up-front sales charge but may be subject to a contingent deferred sales charge (CDSC), also known as a back-end sales charge, if redeemed within eighteen months of purchase. Class C Shares have a 1% CDSC for redemptions within less than twelve months, which is not reflected in the one-year total return. Class R6 Shares have no sales charge and are available only to certain limited categories as described in the prospectus. Class I Shares have no sales charge and may be purchased under limited circumstances or by specified classes of investors.
Expense Ratios as of Most Recent Prospectus
| | | | | | | | | | | | | | | | |
| | | Share Class | |
| | | Class A | | | Class C | | | Class R6 | | | Class I | |
Gross Expense Ratios | | | 0.81% | | | | 1.56% | | | | 0.51% | | | | 0.56% | |
Net Expense Ratios | | | 0.78% | | | | 1.53% | | | | 0.48% | | | | 0.53% | |
The Fund’s investment adviser has contractually agreed to waive fees and/or reimburse other Fund expenses through October 31, 2016 so that total annual fund operating expenses (excluding 12b-1 distribution and/or service fees, interest expenses, taxes, acquired fund fees and expenses, fees incurred in acquiring and disposing of portfolio securities and extraordinary expenses) do not exceed 0.53% of the average daily net assets of any class of Fund shares. However, because Class R6 Shares are not subject to sub-transfer agent and similar fees, the total annual fund operating expenses for the Class R6 Shares will be less than the expense limitation. Fee waivers and/or expense reimbursements will not be terminated prior to that time without the approval of the Fund’s Board of Directors.
Growth of an Assumed $10,000 Investment as of June 30, 2015 – Class A Shares
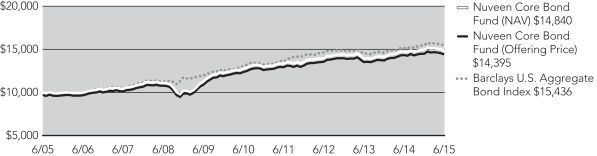
The graphs do not reflect the deduction of taxes that a shareholder may pay on Fund distributions or the redemption of Fund shares.
Fund Performance and Expense Ratios (continued)
Nuveen Core Plus Bond Fund
Refer to the first page of this Fund Performance and Expense Ratios section for further explanation of the information included within this section. Refer to the Glossary of Terms Used in this Report for definitions of terms used within this section.
Fund Performance
Average Annual Total Returns as of June 30, 2015
| | | | | | | | | | | | |
| | | Average Annual | |
| | | 1-Year | | | 5-Year | | | 10-Year | |
Class A Shares at NAV | | | (0.41)% | | | | 4.25% | | | | 4.55% | |
Class A Shares at maximum Offering Price | | | (4.63)% | | | | 3.35% | | | | 4.10% | |
Barclays U.S. Aggregate Bond Index | | | 1.86% | | | | 3.35% | | | | 4.44% | |
Lipper Core Bond Plus Classification Average | | | 0.89% | | | | 4.21% | | | | 4.68% | |
| | | |
Class C Shares | | | (1.10)% | | | | 3.47% | | | | 3.77% | |
Class R3 Shares | | | (0.70)% | | | | 4.00% | | | | 4.31% | |
Class I Shares | | | (0.15)% | | | | 4.53% | | | | 4.81% | |
| | | | |
| | | Cumulative | |
| | | Since
Inception | |
Class R6 Shares | | | (0.29)% | |
Since inception return for Class R6 Shares is from 1/20/15. Indexes and Lipper averages are not available for direct investment.
Class A Shares have a maximum 4.25% sales charge (Offering Price). Class A Share purchases of $1 million or more are sold at net asset value without an up-front sales charge but may be subject to a contingent deferred sales charge (CDSC), also known as a back-end sales charge, if redeemed within eighteen months of purchase. Class C Shares have a 1% CDSC for redemptions within less than twelve months, which is not reflected in the one-year total return. Class R3 Shares have no sales charge and are only available for purchase by eligible retirement plans. Class R6 Shares have no sales charge and are available only to certain limited categories as described in the prospectus. Class I Shares have no sales charge and may be purchased under limited circumstances or by specified classes of investors.
Expense Ratios as of Most Recent Prospectus
| | | | | | | | | | | | | | | | | | | | |
| | | Share Class | |
| | | Class A | | | Class C | | | Class R3 | | | Class R6 | | | Class I | |
Gross Expense Ratios | | | 0.84% | | | | 1.59% | | | | 1.10% | | | | 0.55% | | | | 0.60% | |
Net Expense Ratios | | | 0.77% | | | | 1.52% | | | | 1.02% | | | | 0.47% | | | | 0.52% | |
The Fund’s investment adviser has contractually agreed to waive fees and/or reimburse other Fund expenses through October 31, 2016 so that total annual fund operating expenses (excluding 12b-1 distribution and/or service fees, interest expenses, taxes, acquired fund fees and expenses, fees incurred in acquiring and disposing of portfolio securities and extraordinary expenses) do not exceed 0.52% of the average daily net assets of any class of Fund shares. However, because Class R6 Shares are not subject to sub-transfer agent and similar fees, the total annual fund operating expenses for the Class R6 Shares will be less than the expense limitation. Fee waivers and/or expense reimbursements will not be terminated prior to that time without the approval of the Fund’s Board of Directors.
Growth of an Assumed $10,000 Investment as of June 30, 2015 – Class A Shares
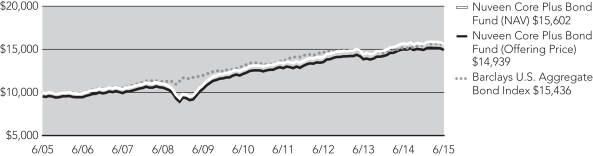
The graphs do not reflect the deduction of taxes that a shareholder may pay on Fund distributions or the redemption of Fund shares.
Fund Performance and Expense Ratios (continued)
Nuveen Inflation Protected Securities Fund
Refer to the first page of this Fund Performance and Expense Ratios section for further explanation of the information included within this section. Refer to the Glossary of Terms Used in this Report for definitions of terms used within this section.
Fund Performance
Average Annual Total Returns as of June 30, 2015
| | | | | | | | | | | | |
| | | Average Annual | |
| | | 1-Year | | | 5-Year | | | 10-Year | |
Class A Shares at NAV | | | (2.04)% | | | | 3.02% | | | | 3.70% | |
Class A Shares at maximum Offering Price | | | (6.20)% | | | | 2.13% | | | | 3.25% | |
Barclays U.S. TIPS Index | | | (1.73)% | | | | 3.29% | | | | 4.13% | |
Lipper Inflation-Protected Bond Funds Classification Average | | | (2.92)% | | | | 2.45% | | | | 3.23% | |
| | | |
Class C Shares | | | (2.75)% | | | | 2.40% | | | | 2.99% | |
Class R3 Shares | | | (2.38)% | | | | 2.63% | | | | 3.39% | |
Class I Shares | | | (1.78)% | | | | 3.39% | | | | 4.01% | |
| | | | |
| | | Cumulative | |
| | | Since
Inception | |
Class R6 Shares | | | (1.39)% | |
Since inception return for Class R6 Shares is from 1/20/15. Indexes and Lipper averages are not available for direct investment.
Class A Shares have a maximum 4.25% sales charge (Offering Price). Class A Share purchases of $1 million or more are sold at net asset value without an up-front sales charge but may be subject to a contingent deferred sales charge (CDSC), also known as a back-end sales charge, if redeemed within eighteen months of purchase. Class C Shares have a 1% CDSC for redemptions within less than twelve months, which is not reflected in the one-year total return. Class R3 Shares have no sales charge and are only available for purchase by eligible retirement plans. Class R6 Shares have no sales charge and are available only to certain limited categories as described in the prospectus. Class I Shares have no sales charge and may be purchased under limited circumstances or by specified classes of investors.
Expense Ratios as of Most Recent Prospectus
| | | | | | | | | | | | | | | | | | | | |
| | | Share Class | |
| | | Class A | | | Class C | | | Class R3 | | | Class R6 | | | Class I | |
Gross Expense Ratios | | | 0.86% | | | | 1.61% | | | | 1.13% | | | | 0.50% | | | | 0.61% | |
Net Expense Ratios | | | 0.83% | | | | 1.58% | | | | 1.08% | | | | 0.47% | | | | 0.58% | |
The Fund’s investment adviser has contractually agreed to waive fees and/or reimburse other Fund expenses through October 31, 2016 so that total annual fund operating expenses (excluding 12b-1 distribution and/or service fees, interest expenses, taxes, acquired fund fees and expenses, fees incurred in acquiring and disposing of portfolio securities and extraordinary expenses) do not exceed 0.60% of the average daily net assets of any class of Fund shares. However, because Class R6 Shares are not subject to sub-transfer agent and similar fees, the total annual fund operating expenses for the Class R6 Shares will be less than the expense limitation. Fee waivers and/or expense reimbursements will not be terminated prior to that time without the approval of the Fund’s Board of Directors.
Growth of an Assumed $10,000 Investment as of June 30, 2015 – Class A Shares
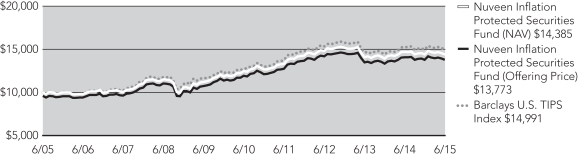
The graphs do not reflect the deduction of taxes that a shareholder may pay on Fund distributions or the redemption of Fund shares.
Fund Performance and Expense Ratios (continued)
Nuveen Intermediate Government Bond Fund
Refer to the first page of this Fund Performance and Expense Ratios section for further explanation of the information included within this section. Refer to the Glossary of Terms Used in this Report for definitions of terms used within this section.
Fund Performance
Average Annual Total Returns as of June 30, 2015
| | | | | | | | | | | | |
| | | Average Annual | |
| | | 1-Year | | | 5-Year | | | 10-Year | |
Class A Shares at NAV | | | 0.93% | | | | 1.82% | | | | 3.27% | |
Class A Shares at maximum Offering Price | | | (2.07)% | | | | 1.21% | | | | 2.96% | |
Barclays Intermediate Government Bond Index | | | 1.79% | | | | 2.06% | | | | 3.67% | |
Lipper Intermediate U.S. Government Funds Classification Average | | | 1.32% | | | | 1.98% | | | | 3.46% | |
| | | |
Class I Shares | | | 1.20% | | | | 2.05% | | | | 3.47% | |
| | | | | | | | | | | | |
| | | Average Annual | |
| | | 1-Year | | | 5-Year | | | Since
Inception | |
Class C Shares | | | 0.18% | | | | 1.05% | | | | 1.45% | |
Class R3 Shares | | | 0.66% | | | | 1.52% | | | | 1.93% | |
Since inception returns for Class C and Class R3 Shares are from 10/28/09. Indexes and Lipper averages are not available for direct investment.
Class A Shares have a maximum 3.00% sales charge (Offering Price). Class A Share purchases of $1 million or more are sold at net asset value without an up-front sales charge but may be subject to a contingent deferred sales charge (CDSC), also known as a back-end sales charge, if redeemed within eighteen months of purchase. Class C Shares have a 1% CDSC for redemptions within less than twelve months, which is not reflected in the one-year total return. Class R3 Shares have no sales charge and are only available for purchase by eligible retirement plans. Class I Shares have no sales charge and may be purchased under limited circumstances or by specified classes of investors.
Expense Ratios as of Most Recent Prospectus
| | | | | | | | | | | | | | | | |
| | | Share Class | |
| | | Class A | | | Class C | | | Class R3 | | | Class I | |
Gross Expense Ratios | | | 1.01% | | | | 1.76% | | | | 1.26% | | | | 0.76% | |
Net Expense Ratios | | | 0.85% | | | | 1.60% | | | | 1.10% | | | | 0.60% | |
The Fund’s investment adviser has contractually agreed to waive fees and/or reimburse other Fund expenses through October 31, 2016, so that total annual Fund operating expenses, after fee waivers and/or expense reimbursements and excluding acquired fund fees and expenses, do not exceed 0.85%, 1.60%, 1.10% and 0.60% for Class A, Class C, Class R3 and Class I Shares, respectively. Fee waivers and/or expense reimbursements will not be terminated prior to that time without the approval of the Fund’s Board of Directors.
Growth of an Assumed $10,000 Investment as of June 30, 2015 – Class A Shares
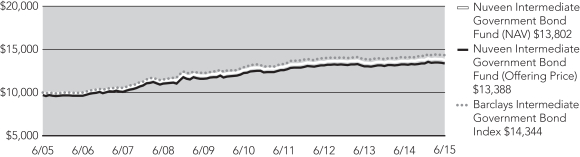
The graphs do not reflect the deduction of taxes that a shareholder may pay on Fund distributions or the redemption of Fund shares.
Fund Performance and Expense Ratios (continued)
Nuveen Short Term Bond Fund
Refer to the first page of this Fund Performance and Expense Ratios section for further explanation of the information included within this section. Refer to the Glossary of Terms Used in this Report for definitions of terms used within this section.
Fund Performance
Average Annual Total Returns as of June 30, 2015
| | | | | | | | | | | | |
| | | Average Annual | |
| | | 1-Year | | | 5-Year | | | 10-Year | |
Class A Shares at NAV | | | 0.32% | | | | 1.94% | | | | 2.95% | |
Class A Shares at maximum Offering Price | | | (1.92)% | | | | 1.48% | | | | 2.72% | |
Barclays 1-3 Year Government/Credit Bond Index | | | 0.93% | | | | 1.17% | | | | 2.83% | |
Lipper Short Investment Grade Debt Funds Classification Average | | | 0.45% | | | | 1.74% | | | | 2.66% | |
| | | |
Class I Shares | | | 0.57% | | | | 2.16% | | | | 3.14% | |
| | | | | | | | | | | | |
| | | Average Annual | |
| | | 1-Year | | | 5-Year | | | Since
Inception | |
Class C Shares | | | (0.36)% | | | | 1.17% | | | | 1.36% | |
Class R3 Shares | | | 0.02% | | | | N/A | | | | 1.96% | |
| | | | | | | | |
| | | Cumulative | |
| | | Since
Inception | |
Class R6 Shares | | | 0.96% | |
Since inception return for Class C Shares, Class R3 Shares and Class R6 Shares are from 10/28/09, 9/23/11 and 1/20/15, respectively. Indexes and Lipper averages are not available for direct investment.
Class A Shares have a maximum 2.25% sales charge (Offering Price). Class A Share purchases of $250,000 or more are sold at net asset value without an up-front sales charge but may be subject to a contingent deferred sales charge (CDSC), also known as a back-end sales charge, if redeemed within eighteen months of purchase. Class C Shares have a 1% CDSC for redemptions within less than twelve months, which is not reflected in the one-year total return. Class R3 Shares have no sales charge and are only available for purchase by eligible retirement plans. Class R6 Shares have no sales charge and are available only to certain limited categories as described in the prospectus. Class I Shares have no sales charge and may be purchased under limited circumstances or by specified classes of investors.
Expense Ratios as of Most Recent Prospectus
| | | | | | | | | | | | | | | | | | | | |
| | | Share Class | |
| | | Class A | | | Class C | | | Class R3 | | | Class R6 | | | Class I | |
Gross Expense Ratios | | | 0.73% | | | | 1.48% | | | | 0.98% | | | | 0.45% | | | | 0.48% | |
Net Expense Ratios | | | 0.71% | | | | 1.46% | | | | 0.96% | | | | 0.43% | | | | 0.46% | |
The Fund’s investment adviser has contractually agreed to waive fees and/or reimburse other Fund expenses through October 31, 2016 so that total annual fund operating expenses (excluding 12b-1 distribution and/or service fees, interest expenses, taxes, acquired fund fees and expenses, fees incurred in acquiring and disposing of portfolio securities and extraordinary expenses) do not exceed 0.47% of the average daily net assets of any class of Fund shares. However, because Class R6 Shares are not subject to sub-transfer agent and similar fees, the total annual fund operating expenses for the Class R6 Shares will be less than the expense limitation. Fee waivers and/or expense reimbursements will not be terminated prior to that time without the approval of the Fund’s Board of Directors.
Growth of an Assumed $10,000 Investment as of June 30, 2015 – Class A Shares
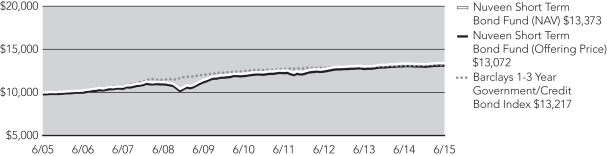
The graphs do not reflect the deduction of taxes that a shareholder may pay on Fund distributions or the redemption of Fund shares.
Yields as of June 30, 2015
Dividend Yield is the most recent dividend per share (annualized) divided by the offering price per share.
The SEC 30-Day Yield is a standardized measure of a fund’s yield that accounts for the future amortization of premiums or discounts of bonds held in the Fund’s portfolio. The SEC 30-Day Yield is computed under an SEC standardized formula and is based on the maximum offer price per share. Subsidized yields reflect fee waivers and/or expense reimbursements from the investment adviser during the period. If any such waivers and/or reimbursements had not been in place, yields would have been reduced. Unsubsidized yields do not reflect waivers and/or reimbursements from the investment adviser during the period. Refer to the Fund Performance and Expense Ratios page for further details on the investment adviser’s most recent agreement with the Fund to waive fees and/or reimburse expenses, where applicable. Dividend Yield may differ from the SEC 30-Day Yield because the fund may be paying out more or less than it is earning and it may not include the effect of amortization of bond premium.
Nuveen Core Bond Fund
| | | | | | | | | | | | | | | | |
| | | Share Class | |
| | | Class A1 | | | Class C | | | Class R6 | | | Class I | |
Dividend Yield | | | 2.68% | | | | 1.99% | | | | 3.02% | | | | 3.02% | |
SEC 30-Day Yield-Subsidized | | | 2.30% | | | | 1.63% | | | | 2.68% | | | | 2.60% | |
SEC 30-Day Yield-Unsubsidized | | | 2.55% | | | | 1.57% | | | | 2.62% | | | | 2.57% | |
Nuveen Core Plus Bond Fund
| | | | | | | | | | | | | | | | | | | | |
| | | Share Class | |
| | | Class A1 | | | Class C | | | Class R3 | | | Class R6 | | | Class I | |
Dividend Yield | | | 3.73% | | | | 3.11% | | | | 3.67% | | | | 4.16% | | | | 4.16% | |
SEC 30-Day Yield-Subsidized | | | 3.75% | | | | 3.18% | | | | 3.68% | | | | 4.22% | | | | 4.17% | |
SEC 30-Day Yield-Unsubsidized | | | 3.67% | | | | 3.08% | | | | 3.59% | | | | 4.15% | | | | 4.09% | |
Nuveen Inflation Protected Securities Fund
| | | | | | | | | | | | | | | | | | | | |
| | | Share Class | |
| | | Class A1 | | | Class C | | | Class R3 | | | Class R6 | | | Class I | |
Dividend Yield | | | 0.98% | | | | 0.58% | | | | 0.87% | | | | 0.04% | | | | 1.18% | |
SEC 30-Day Yield-Subsidized | | | 4.08% | | | | 3.51% | | | | 3.88% | | | | 4.60% | | | | 4.49% | |
SEC 30-Day Yield-Unsubsidized | | | 3.96% | | | | 3.41% | | | | 3.81% | | | | 4.52% | | | | 4.38% | |
Nuveen Intermediate Government Bond Fund
| | | | | | | | | | | | | | | | |
| | | Share Class | |
| | | Class A1 | | | Class C | | | Class R3 | | | Class I | |
Dividend Yield | | | 0.99% | | | | 0.27% | | | | 0.75% | | | | 1.29% | |
SEC 30-Day Yield-Subsidized | | | 1.24% | | | | 0.54% | | | | 1.03% | | | | 1.53% | |
SEC 30-Day Yield-Unsubsidized | | | 1.09% | | | | 0.39% | | | | 0.88% | | | | 1.37% | |
Nuveen Short Term Bond Fund
| | | | | | | | | | | | | | | | | | | | |
| | | Share Class | |
| | | Class A1 | | | Class C | | | Class R3 | | | Class R6 | | | Class I | |
Dividend Yield | | | 1.42% | | | | 0.66% | | | | 1.15% | | | | 1.69% | | | | 1.69% | |
SEC 30-Day Yield-Subsidized | | | 1.50% | | | | 0.79% | | | | 1.25% | | | | 1.80% | | | | 1.77% | |
SEC 30-Day Yield-Unsubsidized | | | 1.47% | | | | 0.76% | | | | 1.20% | | | | 1.78% | | | | 1.74% | |
| 1 | The SEC Yield for Class A Shares quoted in the table reflects the maximum sales load. Investors paying a reduced load because of volume discounts, investors paying no load because they qualify for one of the several exclusions from the load, and existing shareholders who previously paid a load but would like to know the SEC Yield applicable to their shares on a going-forward basis, should understand that the SEC Yield effectively applicable to them would be higher than the figure quoted in the table. |
Holding
Summaries as of June 30, 2015
This data relates to the securities held in each Fund’s portfolio of investments as of the end of this reporting period. It should not be construed as a measure of performance for the Fund itself. Holdings are subject to change
Ratings shown are the highest rating given by one of the following national rating agencies: Standard & Poor’s, Moody’s Investors Service, Inc. or Fitch, Inc. Credit ratings are subject to change. AAA, AA, A and BBB are investment grade ratings; BB, B, CCC, CC, C and D are below investment grade ratings. Certain bonds backed by U.S. Government or agency securities are regarded as having an implied rating equal to the rating of such securities. Holdings designated N/R are not rated by these national rating agencies.
Refer to the Glossary of Terms Used in this Report for further definition of the terms used within this section.
Nuveen Core Bond Fund
Fund Allocation
(% of net assets)
| | | | |
Corporate Bonds | | | 43.4% | |
$1,000 Par (or similar) Institutional Preferred | | | 0.6% | |
U.S. Government and Agency Obligations | | | 12.0% | |
Asset-Backed and Mortgage-Backed Securities | | | 40.4% | |
Sovereign Debt | | | 0.6% | |
Investments Purchased with Collateral from Securities Lending | | | 5.8% | |
Money Market Funds | | | 2.7% | |
Other Assets Less Liabilities | | | (5.5)% | |
Net Assets | | | 100% | |
Corporate Debt: Industries
(% of total corporate bond holdings)
| | | | |
Banks | | | 15.1% | |
Capital Markets | | | 10.8% | |
Media | | | 8.6% | |
Oil, Gas & Consumable Fuels | | | 8.0% | |
Health Care Providers & Services | | | 7.0% | |
Metals & Mining | | | 6.2% | |
Diversified Telecommunication Services | | | 5.5% | |
Real Estate Investment Trust | | | 5.1% | |
Energy Equipment & Services | | | 4.7% | |
Insurance | | | 3.2% | |
Specialty Retail | | | 2.7% | |
Health Care Equipment & Supplies | | | 2.0% | |
Pharmaceuticals | | | 1.9% | |
Other | | | 19.2% | |
Total | | | 100% | |
Portfolio Credit Quality
(% of total long-term
investments)1
| | | | |
AAA/U.S. Guaranteed | | | 50.9% | |
AA | | | 5.3% | |
A | | | 22.0% | |
BBB | | | 21.7% | |
N/R (not rated) | | | 0.1% | |
Total | | | 100% | |
| 1 | Excluding investments in derivatives. |
Holding Summaries as of June 30, 2015 (continued)
Nuveen Core Plus Bond Fund
Fund Allocation
(% of net assets)
| | | | |
$25 Par (or similar) Retail Preferred | | | 2.5% | |
Corporate Bonds | | | 62.3% | |
$1,000 Par (or similar) Institutional Preferred | | | 6.5% | |
Municipal Bonds | | | 1.1% | |
Asset-Backed and Mortgage-Backed Securities | | | 21.5% | |
Sovereign Debt | | | 5.0% | |
Investments Purchased with Collateral from Securities Lending | | | 12.3% | |
Money Market Funds | | | 3.0% | |
Other Assets Less Liabilities | | | (14.2)% | |
Net Assets | | | 100% | |
Corporate Debt: Industries
(% of total corporate bonds
holdings)
| | | | |
Banks | | | 16.3% | |
Oil, Gas & Consumable Fuels | | | 13.5% | |
Metals & Mining | | | 8.4% | |
Media | | | 7.9% | |
Real Estate Investment Trust | | | 4.9% | |
Insurance | | | 4.4% | |
Chemicals | | | 4.1% | |
Diversified Telecommunication Services | | | 4.1% | |
Energy Equipment & Services | | | 3.7% | |
Capital Markets | | | 3.5% | |
Wireless Telecommunication Services | | | 2.6% | |
Consumer Finance | | | 2.5% | |
Electric Utilities | | | 2.4% | |
Diversified Financial Services | | | 2.1% | |
Other | | | 19.6% | |
Total | | | 100% | |
Portfolio Credit Quality
(% of total long-term investments)1
| | | | |
AAA/U.S. Guaranteed | | | 15.9% | |
AA | | | 2.8% | |
A | | | 22.8% | |
BBB | | | 42.6% | |
BB or Lower | | | 15.6% | |
N/R (not rated) | | | 0.3% | |
Total | | | 100% | |
| 1 | Excluding investments in derivatives. |
Nuveen Inflation Protected Securities Fund
Fund Allocation
(% of net assets)
| | | | |
Convertible Preferred Securities | | | 0.1% | |
$25 Par (or similar) Retail Preferred | | | 0.1% | |
Corporate Bonds | | | 9.9% | |
$1,000 Par (or similar) Institutional Preferred | | | 0.1% | |
Municipal Bonds | | | 0.5% | |
U.S. Government and Agency Obligations | | | 81.0% | |
Asset-Backed and Mortgage-Backed Securities | | | 3.8% | |
Investment Companies | | | 0.2% | |
Sovereign Debt | | | 0.6% | |
Investments Purchased with Collateral from Securities Lending | | | 1.4% | |
Money Market Funds | | | 3.0% | |
Other Assets Less Liabilities | | | (0.7)% | |
Net Assets | | | 100% | |
Corporate Debt: Industries
(% of total corporate bonds holdings)
| | | | |
Health Care Providers & Services | | | 10.4% | |
Diversified Telecommunication Services | | | 9.8% | |
Oil, Gas & Consumable Fuels | | | 9.7% | |
Media | | | 9.3% | |
Wireless Telecommunication Services | | | 6.2% | |
Household Durables | | | 3.8% | |
Metals & Mining | | | 3.7% | |
Commercial Services & Supplies | | | 3.6% | |
Auto Components | | | 3.4% | |
Chemicals | | | 3.1% | |
Specialty Retail | | | 2.7% | |
Airlines | | | 2.6% | |
Independent Power & Renewable Electricity Producers | | | 2.6% | |
Construction Materials | | | 2.5% | |
Electric Utilities | | | 2.1% | |
Banks | | | 2.0% | |
Technology Hardware, Storage & Peripherals | | | 2.0% | |
Diversified Financial Services | | | 1.9% | |
Other | | | 18.6% | |
Total | | | 100% | |
Portfolio Credit Quality
(% of total long-term
investments)1
| | | | |
AAA/U.S. Guaranteed | | | 88.5% | |
AA | | | 1.2% | |
A | | | 0.7% | |
BBB | | | 2.3% | |
BB or Lower | | | 7.3% | |
Total | | | 100% | |
| 1 | Excluding investment companies and investments in derivatives. |
Holding Summaries as of June 30, 2015 (continued)
Nuveen Intermediate Government Bond Fund
Fund Allocation
(% of net assets)
| | | | |
Corporate Bonds | | | 0.5% | |
Municipal Bonds | | | 3.7% | |
U.S. Government and Agency Obligations | | | 48.1% | |
Asset-Backed and Mortgage-Backed Securities | | | 46.6% | |
Investments Purchased with Collateral from Securities Lending | | | 3.3% | |
Money Market Funds | | | 0.6% | |
Other Assets Less Liabilities | | | (2.8)% | |
Net Assets | | | 100% | |
Portfolio Credit Quality
(% of total long-term investments)1
| | | | |
AAA/U.S. Guaranteed | | | 96.2% | |
AA | | | 2.1% | |
A | | | 1.7% | |
Total | | | 100% | |
| 1 | Excluding investments in derivatives. |
Nuveen Short Term Bond Fund
Fund Allocation
(% of net assets)
| | | | |
Corporate Bonds | | | 46.8% | |
$1,000 Par (or similar) Institutional Preferred | | | 0.5% | |
Municipal Bonds | | | 2.3% | |
U.S. Government and Agency Obligations | | | 2.2% | |
Asset-Backed and Mortgage-Backed Securities | | | 46.0% | |
Sovereign Debt | | | 0.5% | |
Investments Purchased with Collateral from Securities Lending | | | 4.7% | |
Money Market Funds | | | 1.2% | |
Other Assets Less Liabilities | | | (4.2)% | |
Net Assets | | | 100% | |
Corporate Debt: Industries
(% of total corporate bonds holdings)
| | | | |
Banks | | | 19.7% | |
Oil, Gas & Consumable Fuels | | | 9.2% | |
Capital Markets | | | 7.2% | |
Media | | | 5.4% | |
Real Estate Investment Trust | | | 3.8% | |
Health Care Providers & Services | | | 3.8% | |
Metals & Mining | | | 3.6% | |
Chemicals | | | 3.5% | |
Consumer Finance | | | 3.4% | |
Diversified Telecommunication Services | | | 3.3% | |
Insurance | | | 3.0% | |
Airlines | | | 2.8% | |
Software | | | 2.7% | |
Food Products | | | 2.5% | |
Energy Equipment & Service | | | 2.3% | |
Diversified Financial Services | | | 2.2% | |
Technology Hardware, Storage & Peripherals | | | 2.1% | |
Other | | | 19.5% | |
Total | | | 100% | |
Portfolio Credit Quality
(% of total long-term investments)1
| | | | |
AAA/U.S. Guaranteed | | | 29.3% | |
AA | | | 11.7% | |
A | | | 23.4% | |
BBB | | | 23.0% | |
BB or Lower | | | 9.3% | |
N/R (not rated) | | | 3.3% | |
Total | | | 100% | |
| 1 | Excluding investments in derivatives. |
Expense
Examples
As a shareholder of one or more of the Funds, you incur two types of costs: (1) transaction costs, including up-front and back-end sales charges (loads) or redemption fees, where applicable; and (2) ongoing costs, including management fees; distribution and service (12b-1) fees, where applicable; and other Fund expenses. The Examples below are intended to help you understand your ongoing costs (in dollars) of investing in the Funds and to compare these costs with the ongoing costs of investing in other mutual funds.
The Examples below are based on an investment of $1,000 invested at the beginning of the period and held through the period ended June 30, 2015.
The beginning of the period is January 1, 2015.
The information under “Actual Performance,” together with the amount you invested, allows you to estimate actual expenses incurred over the reporting period. Simply divide your account value by $1,000 (for example, an $8,600 account value divided by $1,000 = 8.60) and multiply the result by the cost shown for your share class, in the row entitled “Expenses Incurred During Period” to estimate the expenses incurred on your account during this period.
The information under “Hypothetical Performance,” provides information about hypothetical account values and hypothetical expenses based on the respective Fund’s actual expense ratio and an assumed rate of return of 5% per year before expenses, which is not the Fund’s actual return. The hypothetical account values and expenses may not be used to estimate the actual ending account balance or expense you incurred for the period. You may use this information to compare the ongoing costs of investing in the Fund and other funds. To do so, compare this 5% hypothetical example with the 5% hypothetical examples that appear in the shareholder reports of the other funds.
Please note that the expenses shown in the table are meant to highlight your ongoing costs only and do not reflect any transaction costs. Therefore, the hypothetical information is useful in comparing ongoing costs only, and will not help you determine the relative total costs of owning different funds or share classes. In addition, if these transaction costs were included, your costs would have been higher.
Nuveen Core Bond Fund
| | | | | | | | | | | | | | | | |
| | | Share Class | |
| | | Class A | | | Class C | | | Class R6 | | | Class I | |
Actual Performance | | | | | | | | | | | | | | | | |
Beginning Account Value | | $ | 1,000.00 | | | $ | 1,000.00 | | | $ | 1,000.00 | | | $ | 1,000.00 | |
Ending Account Value | | $ | 992.50 | | | $ | 989.70 | | | $ | 985.40 | | | $ | 993.70 | |
Expenses Incurred During Period | | $ | 3.85 | | | $ | 7.55 | | | $ | 2.11 | | | $ | 2.62 | |
Hypothetical Performance (5% annualized return before expenses) | | | | | | | | | | | | | | | | |
Beginning Account Value | | $ | 1,000.00 | | | $ | 1,000.00 | | | $ | 1,000.00 | | | $ | 1,000.00 | |
Ending Account Value | | $ | 1,020.93 | | | $ | 1,017.21 | | | $ | 1,020.06 | | | $ | 1,022.17 | |
Expenses Incurred During Period | | $ | 3.91 | | | $ | 7.65 | | | $ | 2.15 | | | $ | 2.66 | |
For each class of the Fund, expenses are equal to the Fund’s annualized net expense ratio of 0.78%, 1.53% and 0.53% for Classes A, C and I, respectively, multiplied by the average account value over the period, multiplied by 181/365 (to reflect the one-half year period). For Class R6, expenses are equal to the Fund’s annualized net expense ratio of 0.48% multiplied by the average account value over the period, multiplied by 162/365 (to reflect the 162 days in the period since class commencement of operations).
Nuveen Core Plus Bond Fund
| | | | | | | | | | | | | | | | | | | | |
| | | Share Class | |
| | | Class A | | | Class C | | | Class R3 | | | Class R6 | | | Class I | |
Actual Performance | | | | | | | | | | | | | | | | | | | | |
Beginning Account Value | | $ | 1,000.00 | | | $ | 1,000.00 | | | $ | 1,000.00 | | | $ | 1,000.00 | | | $ | 1,000.00 | |
Ending Account Value | | $ | 998.80 | | | $ | 995.80 | | | $ | 997.80 | | | $ | 997.10 | | | $ | 1,001.00 | |
Expenses Incurred During Period | | $ | 3.82 | | | $ | 7.52 | | | $ | 5.05 | | | $ | 2.04 | | | $ | 2.58 | |
Hypothetical Performance (5% annualized return before expenses) | | | | | | | | | | | | | | | | | | | | |
Beginning Account Value | | $ | 1,000.00 | | | $ | 1,000.00 | | | $ | 1,000.00 | | | $ | 1,000.00 | | | $ | 1,000.00 | |
Ending Account Value | | $ | 1,020.98 | | | $ | 1,017.26 | | | $ | 1,019.74 | | | $ | 1,020.15 | | | $ | 1,022.22 | |
Expenses Incurred During Period | | $ | 3.86 | | | $ | 7.60 | | | $ | 5.11 | | | $ | 2.06 | | | $ | 2.61 | |
For each class of the Fund, expenses are equal to the Fund’s annualized net expense ratio of 0.77%, 1.52%, 1.02% and 0.52% for Classes A, C, R3 and I, respectively, multiplied by the average account value over the period, multiplied by 181/365 (to reflect the one-half year period). For Class R6, expenses are equal to the Fund’s annualized net expense ratio of 0.46% multiplied by the average account value over the period, multiplied by 162/365 (to reflect the 162 days in the period since class commencement of operations).
Nuveen Inflation Protected Securities Fund
| | | | | | | | | | | | | | | | | | | | |
| | | Share Class | |
| | | Class A | | | Class C | | | Class R3 | | | Class R6 | | | Class I | |
Actual Performance | | | | | | | | | | | | | | | | | | | | |
Beginning Account Value | | $ | 1,000.00 | | | $ | 1,000.00 | | | $ | 1,000.00 | | | $ | 1,000.00 | | | $ | 1,000.00 | |
Ending Account Value | | $ | 1,000.00 | | | $ | 996.60 | | | $ | 997.90 | | | $ | 986.10 | | | $ | 1,002.00 | |
Expenses Incurred During Period | | $ | 4.12 | | | $ | 7.82 | | | $ | 5.35 | | | $ | 1.81 | | | $ | 2.88 | |
Hypothetical Performance (5% annualized return before expenses) | | | | | | | | | | | | | | | | | | | | |
Beginning Account Value | | $ | 1,000.00 | | | $ | 1,000.00 | | | $ | 1,000.00 | | | $ | 1,000.00 | | | $ | 1,000.00 | |
Ending Account Value | | $ | 1,020.68 | | | $ | 1,016.96 | | | $ | 1,019.44 | | | $ | 1,020.37 | | | $ | 1,021.92 | |
Expenses Incurred During Period | | $ | 4.16 | | | $ | 7.90 | | | $ | 5.41 | | | $ | 1.84 | | | $ | 2.91 | |
For each class of the Fund, expenses are equal to the Fund’s annualized net expense ratio of 0.83%, 1.58%, 1.08% and 0.58% for Classes A, C, R3 and I, respectively, multiplied by the average account value over the period, multiplied by 181/365 (to reflect the one-half year period). For Class R6, expenses are equal to the Fund’s annualized net expense ratio of 0.41% multiplied by the average account value over the period, multiplied by 162/365 (to reflect the 162 days in the period since class commencement of operations).
Expense Examples (continued)
Nuveen Intermediate Government Bond Fund
| | | | | | | | | | | | | | | | |
| | | Share Class | |
| | | Class A | | | Class C | | | Class R3 | | | Class I | |
Actual Performance | | | | | | | | | | | | | | | | |
Beginning Account Value | | $ | 1,000.00 | | | $ | 1,000.00 | | | $ | 1,000.00 | | | $ | 1,000.00 | |
Ending Account Value | | $ | 1,000.50 | | | $ | 996.80 | | | $ | 999.20 | | | $ | 1,001.90 | |
Expenses Incurred During Period | | $ | 4.22 | | | $ | 7.92 | | | $ | 5.45 | | | $ | 2.98 | |
Hypothetical Performance (5% annualized return before expenses) | | | | | | | | | | | | | | | | |
Beginning Account Value | | $ | 1,000.00 | | | $ | 1,000.00 | | | $ | 1,000.00 | | | $ | 1,000.00 | |
Ending Account Value | | $ | 1,020.58 | | | $ | 1,016.86 | | | $ | 1,019.34 | | | $ | 1,021.82 | |
Expenses Incurred During Period | | $ | 4.26 | | | $ | 8.00 | | | $ | 5.51 | | | $ | 3.01 | |
For each class of the Fund, expenses are equal to the Fund’s annualized net expense ratio of 0.85%, 1.60%, 1.10% and 0.60% for Classes A, C, R3 and I, respectively, multiplied by the average account value over the period, multiplied by 181/365 (to reflect the one-half year period).
Nuveen Short Term Bond Fund
| | | | | | | | | | | | | | | | | | | | |
| | | Share Class | |
| | | Class A | | | Class C | | | Class R3 | | | Class R6 | | | Class I | |
Actual Performance | | | | | | | | | | | | | | | | | | | | |
Beginning Account Value | | $ | 1,000.00 | | | $ | 1,000.00 | | | $ | 1,000.00 | | | $ | 1,000.00 | | | $ | 1,000.00 | |
Ending Account Value | | $ | 1,008.30 | | | $ | 1,005.30 | | | $ | 1,006.70 | | | $ | 1,009.60 | | | $ | 1,009.50 | |
Expenses Incurred During Period | | $ | 3.54 | | | $ | 7.26 | | | $ | 4.78 | | | $ | 1.92 | | | $ | 2.29 | |
Hypothetical Performance (5% annualized return before expenses) | | | | | | | | | | | | | | | | | | | | |
Beginning Account Value | | $ | 1,000.00 | | | $ | 1,000.00 | | | $ | 1,000.00 | | | $ | 1,000.00 | | | $ | 1,000.00 | |
Ending Account Value | | $ | 1,021.27 | | | $ | 1,017.55 | | | $ | 1,020.03 | | | $ | 1,020.28 | | | $ | 1,022.51 | |
Expenses Incurred During Period | | $ | 3.56 | | | $ | 7.30 | | | $ | 4.81 | | | $ | 1.93 | | | $ | 2.31 | |
For each class of the Fund, expenses are equal to the Fund’s annualized net expense ratio of 0.71%, 1.46%, 0.96% and 0.46% for Classes A, C, R3 and I, respectively, multiplied by the average account value over the period, multiplied by 181/365 (to reflect the one-half year period). For Class R6, expenses are equal to the Fund’s annualized net expense ratio of 0.43% multiplied by the average account value over the period, multiplied by 162/365 (to reflect the 162 days in the period since class commencement of operations).
Report of
Independent Registered Public Accounting Firm
To the Board of Directors and Shareholders of
Nuveen Investment Funds, Inc.:
In our opinion, the accompanying statements of assets and liabilities, including the portfolios of investments, and the related statements of operations and of changes in net assets and the financial highlights present fairly, in all material respects, the financial position of Nuveen Core Bond Fund, Nuveen Core Plus Bond Fund, Nuveen Inflation Protected Securities Fund, Nuveen Intermediate Government Bond Fund and Nuveen Short Term Bond Fund (each a series of Nuveen Investment Funds, Inc., hereinafter referred to as the “Funds”) at June 30, 2015, the results of each of their operations for the year then ended, the changes in each of their net assets for each of the two years in the period then ended and the financial highlights for each of the four years in the period then ended, in conformity with accounting principles generally accepted in the United States of America. These financial statements and financial highlights (hereafter referred to as “financial statements”) are the responsibility of the Funds’ management. Our responsibility is to express an opinion on these financial statements based on our audits. We conducted our audits of these financial statements in accordance with the standards of the Public Company Accounting Oversight Board (United States). Those standards require that we plan and perform the audit to obtain reasonable assurance about whether the financial statements are free of material misstatement. An audit includes examining, on a test basis, evidence supporting the amounts and disclosures in the financial statements, assessing the accounting principles used and significant estimates made by management, and evaluating the overall financial statement presentation. We believe that our audits, which included confirmation of securities at June 30, 2015 by correspondence with the custodian and brokers, provide a reasonable basis for our opinion. The financial statements of Nuveen Core Bond Fund, Nuveen Core Plus Bond Fund, Nuveen Inflation Protected Securities Fund, Nuveen Intermediate Government Bond Fund and Nuveen Short Term Bond Fund for the periods ended June 30, 2011 and prior were audited by other independent auditors whose report dated August 26, 2011 expressed an unqualified opinion on those statements.
PricewaterhouseCoopers LLP
Chicago, IL
August 27, 2015
Nuveen Core Bond Fund
| | |
| Portfolio of Investments | | June 30, 2015 |
| | | | | | | | | | | | | | | | | | | | |
Principal
Amount (000) | | | Description (1) | | Coupon | | | Maturity | | | Ratings (2) | | | Value | |
| | | | | |
| | | | LONG-TERM INVESTMENTS – 97.0% | | | | | | | | | | | | | | | | |
| | | | | |
| | | | CORPORATE BONDS – 43.4% | | | | | | | | | | | | | | | | |
| | | | | |
| | | | Banks – 6.6% | | | | | | | | | | | | |
| | | | | |
| $ | 1,275 | | | Abbey National Treasury Services PLC of London | | | 3.050% | | | | 8/23/18 | | | | A | | | $ | 1,319,109 | |
| | | | | |
| | 655 | | | Bancolombia SA | | | 5.950% | | | | 6/03/21 | | | | Baa2 | | | | 718,208 | |
| | | | | |
| | 1,240 | | | Bank of America Corporation | | | 5.750% | | | | 12/01/17 | | | | A | | | | 1,350,830 | |
| | | | | |
| | 2,565 | | | Bank of America Corporation, (3) | | | 4.000% | | | | 4/01/24 | | | | A | | | | 2,610,080 | |
| | | | | |
| | 2,000 | | | Citigroup Inc. | | | 4.500% | | | | 1/14/22 | | | | A | | | | 2,154,316 | |
| | | | | |
| | 807 | | | Fifth Third Bancorp. | | | 3.500% | | | | 3/15/22 | | | | A | | | | 820,793 | |
| | | | | |
| | 1,110 | | | General Electric Capital Corporation | | | 6.875% | | | | 1/10/39 | | | | AA+ | | | | 1,490,368 | |
| | | | | |
| | 900 | | | JPMorgan Chase & Company | | | 4.500% | | | | 1/24/22 | | | | A+ | | | | 964,506 | |
| | | | | |
| | 1,745 | | | JPMorgan Chase & Company | | | 3.200% | | | | 1/25/23 | | | | A+ | | | | 1,711,466 | |
| | | | | |
| | 1,240 | | | JPMorgan Chase & Company | | | 3.375% | | | | 5/01/23 | | | | A | | | | 1,204,064 | |
| | | | | |
| | 1,000 | | | JPMorgan Chase & Company, (3) | | | 6.400% | | | | 5/15/38 | | | | A+ | | | | 1,239,239 | |
| | 14,537 | | | Total Banks | | | | | | | | | | | | | | | 15,582,979 | |
| | | | | |
| | | | Beverages – 0.7% | | | | | | | | | | | | |
| | | | | |
| | 580 | | | Anheuser Busch InBev Finance Inc., (3) | | | 3.700% | | | | 2/01/24 | | | | A | | | | 593,635 | |
| | | | | |
| | 1,070 | | | Anheuser Busch InBev | | | 2.500% | | | | 7/15/22 | | | | A | | | | 1,028,994 | |
| | 1,650 | | | Total Beverages | | | | | | | | | | | | | | | 1,622,629 | |
| | | | | |
| | | | Capital Markets – 4.7% | | | | | | | | | | | | |
| | | | | |
| | 665 | | | Charles Schwab Corporation | | | 3.000% | | | | 3/10/25 | | | | A | | | | 652,277 | |
| | | | | |
| | 1,250 | | | Deutsche Bank AG London | | | 2.500% | | | | 2/13/19 | | | | A | | | | 1,256,356 | |
| | | | | |
| | 3,500 | | | Goldman Sachs Group, Inc. | | | 5.750% | | | | 1/24/22 | | | | A | | | | 3,981,142 | |
| | | | | |
| | 1,090 | | | Goldman Sachs Group, Inc. | | | 6.750% | | | | 10/01/37 | | | | A– | | | | 1,278,513 | |
| | | | | |
| | 1,200 | | | Morgan Stanley | | | 6.625% | | | | 4/01/18 | | | | A | | | | 1,346,467 | |
| | | | | |
| | 335 | | | Morgan Stanley | | | 3.750% | | | | 2/25/23 | | | | A | | | | 338,732 | |
| | | | | |
| | 1,165 | | | Morgan Stanley, (3) | | | 4.350% | | | | 9/08/26 | | | | A– | | | | 1,141,560 | |
| | | | | |
| | 1,105 | | | State Street Corporation | | | 3.300% | | | | 12/16/24 | | | | AA– | | | | 1,103,076 | |
| | 10,310 | | | Total Capital Markets | | | | | | | | | | | | | | | 11,098,123 | |
| | | | | |
| | | | Communications Equipment – 0.8% | | | | | | | | | | | | |
| | | | | |
| | 1,915 | | | Qualcomm, Inc. | | | 3.450% | | | | 5/20/25 | | | | A+ | | | | 1,866,133 | |
| | | | | |
| | | | Containers & Packaging – 0.4% | | | | | | | | | | | | |
| | | | | |
| | 905 | | | Packaging Corporation of America | | | 3.650% | | | | 9/15/24 | | | | BBB | | | | 886,839 | |
| | | | | |
| | | | Diversified Financial Services – 0.6% | | | | | | | | | | | | |
| | | | | |
| | 1,515 | | | Rabobank Nederland | | | 3.875% | | | | 2/08/22 | | | | Aa2 | | | | 1,576,065 | |
| | | | | | | | | | | | | | | | | | | | |
Principal
Amount (000) | | | Description (1) | | Coupon | | | Maturity | | | Ratings (2) | | | Value | |
| | | | | |
| | | | Diversified Telecommunication Services – 2.4% | | | | | | | | | | | | |
| | | | | |
| $ | 1,250 | | | AT&T, Inc., (3) | | | 5.550% | | | | 8/15/41 | | | | A– | | | $ | 1,280,713 | |
| | | | | |
| | 2,020 | | | SBA Tower Trust, 144A | | | 3.598% | | | | 4/15/43 | | | | BBB | | | | 2,013,639 | |
| | | | | |
| | 2,170 | | | Verizon Communications | | | 5.150% | | | | 9/15/23 | | | | A– | | | | 2,375,805 | |
| | 5,440 | | | Total Diversified Telecommunication Services | | | | | | | | | | | | | | | 5,670,157 | |
| | | | | |
| | | | Electric Utilities – 0.7% | | | | | | | | | | | | |
| | | | | |
| | 1,615 | | | Exelon Generation Co. LLC | | | 4.250% | | | | 6/15/22 | | | | BBB | | | | 1,653,108 | |
| | | | | |
| | | | Energy Equipment & Services – 2.0% | | | | | | | | | | | | |
| | | | | |
| | 1,000 | | | Diamond Offshore Drilling Inc., (3) | | | 5.700% | | | | 10/15/39 | | | | A3 | | | | 875,331 | |
| | | | | |
| | 1,110 | | | Ensco PLC, (3) | | | 4.700% | | | | 3/15/21 | | | | BBB+ | | | | 1,130,646 | |
| | | | | |
| | 1,500 | | | Nabors Industries Inc., (3) | | | 4.625% | | | | 9/15/21 | | | | BBB | | | | 1,490,207 | |
| | | | | |
| | 1,350 | | | Origin Energy Finance Limited, 144A | | | 3.500% | | | | 10/09/18 | | | | Baa2 | | | | 1,384,880 | |
| | 4,960 | | | Total Energy Equipment & Services | | | | | | | | | | | | | | | 4,881,064 | |
| | | | | |
| | | | Food & Staples Retailing – 0.6% | | | | | | | | | | | | |
| | | | | |
| | 1,380 | | | Walgreen Company | | | 3.100% | | | | 9/15/22 | | | | BBB | | | | 1,340,292 | |
| | | | | |
| | | | Food Products – 0.5% | | | | | | | | | | | | |
| | | | | |
| | 1,130 | | | Mondelez International Inc. | | | 2.250% | | | | 2/01/19 | | | | Baa1 | | | | 1,131,823 | |
| | | | | |
| | | | Health Care Equipment & Supplies – 0.9% | | | | | | | | | | | | |
| | | | | |
| | 680 | | | Becton Dickinson & Company | | | 3.734% | | | | 12/15/24 | | | | BBB+ | | | | 677,712 | |
| | | | | |
| | 1,355 | | | Ochsner Clinic Foundation | | | 5.897% | | | | 5/15/45 | | | | Baa1 | | | | 1,392,229 | |
| | 2,035 | | | Total Health Care Equipment & Supplies | | | | | | | | | | | | | | | 2,069,941 | |
| | | | | |
| | | | Health Care Providers & Services – 3.0% | | | | | | | | | | | | |
| | | | | |
| | 2,965 | | | Mayo Clinic Rochester | | | 3.774% | | | | 11/15/43 | | | | AA | | | | 2,729,131 | |
| | | | | |
| | 970 | | | NYU Hospitals Center | | | 4.784% | | | | 7/01/44 | | | | A– | | | | 956,605 | |
| | | | | |
| | 1,215 | | | UnitedHealth Group Incorporated | | | 2.875% | | | | 3/15/22 | | | | A+ | | | | 1,179,810 | |
| | | | | |
| | 1,315 | | | Wellpoint Inc. | | | 3.125% | | | | 5/15/22 | | | | A | | | | 1,277,967 | |
| | | | | |
| | 1,065 | | | Zoetis Incorporated | | | 3.250% | | | | 2/01/23 | | | | Baa2 | | | | 1,031,779 | |
| | 7,530 | | | Total Health Care Providers & Services | | | | | | | | | | | | | | | 7,175,292 | |
| | | | | |
| | | | Household Products – 0.4% | | | | | | | | | | | | |
| | | | | |
| | 945 | | | Macys Retail Holdings Inc. | | | 4.375% | | | | 9/01/23 | | | | BBB+ | | | | 996,547 | |
| | | | | |
| | | | Insurance – 1.4% | | | | | | | | | | | | |
| | | | | |
| | 1,000 | | | AFLAC Insurance | | | 6.450% | | | | 8/15/40 | | | | A | | | | 1,215,274 | |
| | | | | |
| | 555 | | | Hartford Financial Services Group Inc. | | | 6.000% | | | | 1/15/19 | | | | BBB+ | | | | 620,163 | |
| | | | | |
| | 1,370 | | | Lincoln National Corporation | | | 4.200% | | | | 3/15/22 | | | | A– | | | | 1,437,596 | |
| | 2,925 | | | Total Insurance | | | | | | | | | | | | | | | 3,273,033 | |
| | | | | |
| | | | Internet & Catalog Retail – 0.4% | | | | | | | | | | | | |
| | | | | |
| | 980 | | | Amazon.com Incorporated | | | 3.800% | | | | 12/05/24 | | | | AA– | | | | 983,666 | |
Nuveen Core Bond Fund (continued)
| | |
| Portfolio of Investments | | June 30, 2015 |
| | | | | | | | | | | | | | | | | | | | |
Principal
Amount (000) | | | Description (1) | | Coupon | | | Maturity | | | Ratings (2) | | | Value | |
| | | | | |
| | | | Leisure Products – 0.6% | | | | | | | | | | | | |
| | | | | |
| $ | 1,525 | | | Hyatt Hotels Corporation | | | 3.375% | | | | 7/15/23 | | | | BBB | | | $ | 1,485,005 | |
| | | | | |
| | | | Media – 3.7% | | | | | | | | | | | | |
| | | | | |
| | 1,000 | | | 21st Century Fox America Inc. | | | 4.000% | | | | 10/01/23 | | | | BBB+ | | | | 1,030,301 | |
| | | | | |
| | 680 | | | 21st Century Fox America Inc. | | | 6.650% | | | | 11/15/37 | | | | BBB+ | | | | 827,512 | |
| | | | | |
| | 785 | | | British Sky Broadcasting Group PLC, 144A | | | 6.100% | | | | 2/15/18 | | | | BBB | | | | 862,258 | |
| | | | | |
| | 835 | | | CBS Corporation | | | 7.875% | | | | 7/30/30 | | | | BBB | | | | 1,085,737 | |
| | | | | |
| | 1,640 | | | DIRECTV Holdings LLC | | | 3.800% | | | | 3/15/22 | | | | BBB | | | | 1,649,433 | |
| | | | | |
| | 1,460 | | | Discovery Communications Inc. | | | 5.050% | | | | 6/01/20 | | | | BBB | | | | 1,598,847 | |
| | | | | |
| | 1,460 | | | NBC Universal Media LLC | | | 6.400% | | | | 4/30/40 | | | | A– | | | | 1,812,939 | |
| | 7,860 | | | Total Media | | | | | | | | | | | | | | | 8,867,027 | |
| | | | | |
| | | | Metals & Mining – 2.7% | | | | | | | | | | | | |
| | | | | |
| | 715 | | | Anglogold Holdings PLC | | | 6.500% | | | | 4/15/40 | | | | Baa3 | | | | 651,060 | |
| | | | | |
| | 1,230 | | | Freeport McMoRan, Inc., (3) | | | 3.550% | | | | 3/01/22 | | | | BBB | | | | 1,138,522 | |
| | | | | |
| | 945 | | | Newmont Mining Corporation, (3) | | | 3.500% | | | | 3/15/22 | | | | BBB | | | | 901,852 | |
| | | | | |
| | 1,490 | | | Nucor Corporation | | | 4.000% | | | | 8/01/23 | | | | A | | | | 1,511,884 | |
| | | | | |
| | 1,240 | | | Rio Tinto Finance USA PLC, (3) | | | 2.875% | | | | 8/21/22 | | | | A– | | | | 1,200,502 | |
| | | | | |
| | 1,250 | | | Teck Resources Limited | | | 6.250% | | | | 7/15/41 | | | | BBB– | | | | 1,005,913 | |
| | 6,870 | | | Total Metals & Mining | | | | | | | | | | | | | | | 6,409,733 | |
| | | | | |
| | | | Oil, Gas & Consumable Fuels – 3.5% | | | | | | | | | | | | |
| | | | | |
| | 1,100 | | | Apache Corporation, (3) | | | 4.250% | | | | 1/15/44 | | | | BBB+ | | | | 955,277 | |
| | | | | |
| | 1,055 | | | Cenovus Energy Inc. | | | 4.450% | | | | 9/15/42 | | | | BBB+ | | | | 920,582 | |
| | | | | |
| | 1,110 | | | EOG Resources Inc. | | | 4.100% | | | | 2/01/21 | | | | A– | | | | 1,192,749 | |
| | | | | |
| | 960 | | | Marathon Petroleum Corporation | | | 6.500% | | | | 3/01/41 | | | | BBB | | | | 1,090,571 | |
| | | | | |
| | 1,120 | | | Rowan Companies Inc. | | | 4.875% | | | | 6/01/22 | | | | BBB– | | | | 1,112,410 | |
| | | | | |
| | 860 | | | Southwestern Energy Company, (3) | | | 4.100% | | | | 3/15/22 | | | | BBB– | | | | 843,602 | |
| | | | | |
| | 1,280 | | | Spectra Energy Partners LP | | | 4.750% | | | | 3/15/24 | | | | BBB | | | | 1,352,748 | |
| | | | | |
| | 775 | | | Valero Energy Corporation | | | 3.650% | | | | 3/15/25 | | | | BBB | | | | 753,564 | |
| | 8,260 | | | Total Oil, Gas & Consumable Fuels | | | | | | | | | | | | | | | 8,221,503 | |
| | | | | |
| | | | Pharmaceuticals – 0.8% | | | | | | | | | | | | |
| | | | | |
| | 995 | | | Merck & Company Inc. | | | 2.750% | | | | 2/10/25 | | | | AA | | | | 954,140 | |
| | | | | |
| | 975 | | | Perrigo Company Limited, (3) | | | 4.000% | | | | 11/15/23 | | | | BBB | | | | 988,077 | |
| | 1,970 | | | Total Pharmaceuticals | | | | | | | | | | | | | | | 1,942,217 | |
| | | | | |
| | | | Real Estate Investment Trust – 2.2% | | | | | | | | | | | | |
| | | | | |
| | 1,405 | | | American Tower Company | | | 5.000% | | | | 2/15/24 | | | | BBB | | | | 1,485,283 | |
| | | | | |
| | 1,385 | | | Digital Realty Trust Inc. | | | 3.625% | | | | 10/01/22 | | | | BBB | | | | 1,350,759 | |
| | | | | |
| | 1,170 | | | Piedmont Operating Partnership LP | | | 4.450% | | | | 3/15/24 | | | | BBB | | | | 1,175,590 | |
| | | | | |
| | 1,255 | | | WP Carey Inc. | | | 4.600% | | | | 4/01/24 | | | | Baa2 | | | | 1,260,100 | |
| | 5,215 | | | Total Real Estate Investment Trust | | | | | | | | | | | | | | | 5,271,732 | |
| | | | | | | | | | | | | | | | | | | | |
Principal
Amount (000) | | | Description (1) | | Coupon | | | Maturity | | | Ratings (2) | | | Value | |
| | | | | |
| | | | Road & Rail – 0.4% | | | | | | | | | | | | |
| | | | | |
| $ | 895 | | | Burlington Northern Santa Fe, LLC | | | 3.400% | | | | 9/01/24 | | | | A3 | | | $ | 888,606 | |
| | | | | |
| | | | Semiconductors & Semiconductor Equipment – 0.5% | | | | | | | | | | | | |
| | | | | |
| | 1,040 | | | Applied Materials Inc. | | | 4.300% | | | | 6/15/21 | | | | A– | | | | 1,112,674 | |
| | | | | |
| | | | Software – 0.4% | | | | | | | | | | | | |
| | | | | |
| | 965 | | | Computer Sciences Corporation | | | 4.450% | | | | 9/15/22 | | | | BBB+ | | | | 990,554 | |
| | | | | |
| | | | Specialty Retail – 1.2% | | | | | | | | | | | | |
| | | | | |
| | 1,000 | | | AutoZone Inc. | | | 3.700% | | | | 4/15/22 | | | | Baa1 | | | | 1,025,311 | |
| | | | | |
| | 795 | | | Home Depot, Inc. | | | 2.625% | | | | 6/01/22 | | | | A | | | | 781,894 | |
| | | | | |
| | 1,000 | | | Swiss Re Treasury US Corporation, 144A | | | 4.250% | | | | 12/06/42 | | | | AA– | | | | 964,876 | |
| | 2,795 | | | Total Specialty Retail | | | | | | | | | | | | | | | 2,772,081 | |
| | | | | |
| | | | Technology Hardware, Storage & Peripherals – 0.4% | | | | | | | | | | | | |
| | | | | |
| | 905 | | | Hewlett Packard Company | | | 4.650% | | | | 12/09/21 | | | | A– | | | | 960,584 | |
| | | | | |
| | | | Tobacco – 0.5% | | | | | | | | | | | | |
| | | | | |
| | 1,215 | | | Reynolds American Inc. | | | 3.250% | | | | 11/01/22 | | | | BBB– | | | | 1,170,235 | |
| | | | | |
| | | | Transportation Infrastructure – 0.4% | | | | | | | | | | | | |
| | | | | |
| | 1,000 | | | Sydney Airport Finance Company Party Limited, 144A | | | 3.900% | | | | 3/22/23 | | | | BBB | | | | 1,016,530 | |
| $ | 100,287 | | | Total Corporate Bonds (cost $102,996,951) | | | | | | | | | | | | | | | 102,916,172 | |
| | | | | |
Principal
Amount (000) | | | Description (1) | | Coupon | | | Maturity | | | Ratings (2) | | | Value | |
| | | | | |
| | | | $1,000 PAR (OR SIMILAR) INSTITUTIONAL PREFERRED – 0.6% | | | | | | | | | | | | | | | | |
| | | | | |
| | | | Banks – 0.3% | | | | | | | | | | | | |
| | | | | |
| $ | 700 | | | Wachovia Capital Trust III | | | 5.570% | | | | N/A (4) | | | | BBB | | | $ | 692,125 | |
| | | | | |
| | | | Insurance – 0.3% | | | | | | | | | | | | | | | | |
| | | | | |
| | 780 | | | ZFS Finance USA Trust V, 144A | | | 6.500% | | | | 5/09/37 | | | | A | | | | 811,200 | |
| $ | 1,480 | | | Total $1,000 Par (or similar) Institutional Preferred (cost $1,341,607) | | | | | | | | | | | | | | | 1,503,325 | |
| | | | | |
Principal
Amount (000) | | | Description (1) | | Coupon | | | Maturity | | | Ratings (2) | | | Value | |
| | | | |
| | | | U.S. GOVERNMENT AND AGENCY OBLIGATIONS – 12.0% | | | | | | | | | | |
| | | | | |
| $ | 2,825 | | | Fannie Mae Notes | | | 1.500% | | | | 6/22/20 | | | | Aaa | | | $ | 2,791,498 | |
| | | | | |
| | 2,595 | | | Federal National Mortgage Association | | | 2.375% | | | | 7/28/15 | | | | Aaa | | | | 2,599,235 | |
| | | | | |
| | 2,055 | | | Freddie Mac Reference Notes | | | 5.000% | | | | 12/14/18 | | | | Aa2 | | | | 2,305,948 | |
| | | | | |
| | 60 | | | Freddie Mac Reference Notes | | | 1.750% | | | | 5/30/19 | | | | Aaa | | | | 60,653 | |
| | | | | |
| | 250 | | | U.S. Treasury Bonds | | | 2.750% | | | | 11/15/42 | | | | Aaa | | | | 232,578 | |
| | | | | |
| | 1,470 | | | U.S. Treasury Bonds, (3) | | | 3.625% | | | | 2/15/44 | | | | Aaa | | | | 1,616,196 | |
| | | | | |
| | 2,830 | | | U.S. Treasury Notes | | | 2.625% | | | | 8/15/20 | | | | Aaa | | | | 2,959,339 | |
| | | | | |
| | 2,550 | | | U.S. Treasury Notes | | | 0.375% | | | | 2/15/16 | | | | Aaa | | | | 2,553,188 | |
Nuveen Core Bond Fund (continued)
| | |
| Portfolio of Investments | | June 30, 2015 |
| | | | | | | | | | | | | | | | | | | | |
Principal
Amount (000) | | | Description (1) | | Coupon | | | Maturity | | | Ratings (2) | | | Value | |
| | | | |
| | | | U.S. GOVERNMENT AND AGENCY OBLIGATIONS (continued) | | | | | | | | | | |
| | | | | |
| $ | 4,775 | | | U.S. Treasury Notes | | | 0.875% | | | | 1/31/18 | | | | Aaa | | | $ | 4,775,745 | |
| | | | | |
| | 4,910 | | | U.S. Treasury Notes | | | 2.500% | | | | 5/15/24 | | | | Aaa | | | | 4,994,005 | |
| | | | | |
| | 830 | | | U.S. Treasury Notes | | | 2.375% | | | | 8/15/24 | | | | Aaa | | | | 834,475 | |
| | | | | |
| | 2,695 | | | U.S. Treasury Notes | | | 2.000% | | | | 2/15/25 | | | | Aaa | | | | 2,618,360 | |
| $ | 27,845 | | | Total U.S. Government and Agency Obligations (cost $28,251,021) | | | | | | | | | | | | | | | 28,341,220 | |
| | | | | |
Principal
Amount (000) | | | Description (1) | | Coupon | | | Maturity | | | Ratings (2) | | | Value | |
| | | | |
| | | | ASSET-BACKED AND MORTGAGE-BACKED SECURITIES – 40.4% | | | | | | | | | | |
| | | | | |
| $ | 1,358 | | | 321 Henderson Receivables LLC, Series 2010-3A | | | 3.820% | | | | 12/15/48 | | | | Aaa | | | $ | 1,427,336 | |
| | | | | |
| | 905 | | | American Homes 4 Rent, Series 2014-SFR2 | | | 3.786% | | | | 10/17/36 | | | | Aaa | | | | 931,380 | |
| | | | | |
| | — | (5) | | Amresco Residential Securities Corporation, Mortgage Loan Pass-Through Certificates, Series 1997-3 | | | 6.960% | | | | 3/25/27 | | | | Baa2 | | | | — | |
| | | | | |
| | 2,340 | | | Cabela’s Master Credit Card Trust, Series 2010-2A | | | 2.290% | | | | 9/17/18 | | | | AAA | | | | 2,348,487 | |
| | | | | |
| | 2,000 | | | Citigroup Commercial Mortgage Trust Series 2012-GC8 | | | 3.024% | | | | 9/10/45 | | | | Aaa | | | | 2,021,240 | |
| | | | | |
| | 1,882 | | | Colony Anerican Homes Trust 2014-1A | | | 1.400% | | | | 5/17/31 | | | | Aaa | | | | 1,871,481 | |
| | | | | |
| | — | (5) | | ContiMortgage Home Equity Loan Trust, Series 1997-2 | | | 7.090% | | | | 4/15/28 | | | | AAA | | | | 363 | |
| | | | | |
| | 438 | | | Fannie Mae Mortgage Pool 725111 | | | 2.355% | | | | 9/01/33 | | | | Aaa | | | | 468,516 | |
| | | | | |
| | 1,034 | | | Fannie Mae Mortgage Pool 725205 | | | 5.000% | | | | 3/01/34 | | | | Aaa | | | | 1,146,603 | |
| | | | | |
| | 358 | | | Fannie Mae Mortgage Pool 848390 | | | 1.978% | | | | 12/01/35 | | | | Aaa | | | | 376,276 | |
| | | | | |
| | 1,664 | | | Fannie Mae Mortgage Pool 879906 | | | 2.433% | | | | 10/01/33 | | | | Aaa | | | | 1,772,939 | |
| | | | | |
| | 724 | | | Fannie Mae Mortgage Pool 886034 | | | 2.702% | | | | 7/01/36 | | | | Aaa | | | | 777,150 | |
| | | | | |
| | 2,014 | | | Fannie Mae Mortgage Pool 890310 | | | 4.500% | | | | 12/01/40 | | | | Aaa | | | | 2,181,668 | |
| | | | | |
| | 1,591 | | | Fannie Mae Mortgage Pool 960605 | | | 5.000% | | | | 8/01/37 | | | | Aaa | | | | 1,759,223 | |
| | | | | |
| | 564 | | | Fannie Mae Mortgage Pool 995949 | | | 2.459% | | | | 9/01/36 | | | | Aaa | | | | 600,616 | |
| | | | | |
| | 2,971 | | | Fannie Mae Mortgage Pool AB2085 | | | 4.000% | | | | 1/01/41 | | | | Aaa | | | | 3,164,932 | |
| | | | | |
| | 3,378 | | | Fannie Mae Mortgage Pool AB9659 | | | 3.000% | | | | 6/01/43 | | | | Aaa | | | | 3,380,966 | |
| | | | | |
| | 2,234 | | | Fannie Mae Mortgage Pool AD1593 | | | 4.500% | | | | 2/01/40 | | | | Aaa | | | | 2,420,742 | |
| | | | | |
| | 1,509 | | | Fannie Mae Mortgage Pool AE0058 | | | 2.418% | | | | 7/01/36 | | | | Aaa | | | | 1,608,940 | |
| | | | | |
| | 2,783 | | | Fannie Mae Mortgage Pool AE0217 | | | 4.500% | | | | 8/01/40 | | | | Aaa | | | | 3,015,339 | |
| | | | | |
| | 2,202 | | | Fannie Mae Mortgage Pool AE0981 | | | 3.500% | | | | 3/01/41 | | | | Aaa | | | | 2,274,931 | |
| | | | | |
| | 1,080 | | | Fannie Mae Mortgage Pool AH3804 | | | 4.000% | | | | 2/01/41 | | | | Aaa | | | | 1,150,206 | |
| | | | | |
| | 3,011 | | | Fannie Mae Mortgage Pool AH5575 | | | 4.000% | | | | 2/01/41 | | | | Aaa | | | | 3,207,217 | |
| | | | | |
| | 1,255 | | | Fannie Mae Mortgage Pool AH5583 | | | 4.500% | | | | 2/01/41 | | | | Aaa | | | | 1,360,111 | |
| | | | | |
| | 3,155 | | | Fannie Mae Mortgage Pool AH8954 | | | 4.000% | | | | 4/01/41 | | | | Aaa | | | | 3,360,010 | |
| | | | | |
| | 1,500 | | | Fannie Mae Mortgage Pool AL0160 | | | 4.500% | | | | 5/01/41 | | | | Aaa | | | | 1,625,592 | |
| | | | | |
| | 2,581 | | | Fannie Mae Mortgage Pool AL0215 | | | 4.500% | | | | 4/01/41 | | | | Aaa | | | | 2,798,251 | |
| | | | | |
| | 1,940 | | | Fannie Mae Mortgage Pool AO9636 | | | 2.500% | | | | 7/01/27 | | | | Aaa | | | | 1,978,284 | |
| | | | | |
| | 3,316 | | | Fannie Mae Mortgage Pool AU2412 | | | 3.000% | | | | 12/01/44 | | | | Aaa | | | | 3,307,186 | |
| | | | | |
| | 3,186 | | | Fannie Mae Mortgage Pool AU3353 | | | 3.000% | | | | 8/01/43 | | | | Aaa | | | | 3,186,476 | |
| | | | | | | | | | | | | | | | | | | | |
Principal
Amount (000) | | | Description (1) | | Coupon | | | Maturity | | | Ratings (2) | | | Value | |
| | | | |
| | | | ASSET-BACKED AND MORTGAGE-BACKED SECURITIES (continued) | | | | | | | | | | |
| | | | | |
| $ | 2,355 | | | Fannie Mae Mortgage Pool AY3376, (WI/DD) | | | 3.500% | | | | 4/01/45 | | | | Aaa | | | $ | 2,429,898 | |
| | | | | |
| | 3,823 | | | Fannie Mae Mortgage Pool MA1028 | | | 4.000% | | | | 4/01/42 | | | | Aaa | | | | 4,067,243 | |
| | | | | |
| | 3 | | | Fannie Mae Real Estate Mortgage Investment Conduit, Pass-Through Certificates 1990-89 K | | | 6.500% | | | | 7/25/20 | | | | Aaa | | | | 3,381 | |
| | | | | |
| | 1,615 | | | Fannie Mae TBA Mortgage Pool, (WI/DD) | | | 3.500% | | | | TBA | | | | Aaa | | | | 1,664,333 | |
| | | | | |
| | 1,556 | | | Fannie Mae, Connecticut Avenue Securities, Series 2014-C03 | | | 1.391% | | | | 7/25/24 | | | | Aaa | | | | 1,555,225 | |
| | | | | |
| | 5 | | | Federal Home Loan Mortgage Corporation, REMIC 1167 E | | | 7.500% | | | | 11/15/21 | | | | Aaa | | | | 5,407 | |
| | | | | |
| | 9 | | | Federal Home Loan Mortgage Corporation, REMIC 1286 A | | | 6.000% | | | | 5/15/22 | | | | Aaa | | | | 9,811 | |
| | | | | |
| | 651 | | | Federal Home Loan Mortgage Corporation, REMIC 2750 HE | | | 5.000% | | | | 2/15/19 | | | | Aaa | | | | 673,144 | |
| | | | | |
| | 330 | | | Freddie Mac Gold Pool 786281 | | | 2.512% | | | | 1/01/28 | | | | Aaa | | | | 350,752 | |
| | | | | |
| | 272 | | | Freddie Mac Gold Pool 847161 | | | 2.400% | | | | 5/01/31 | | | | Aaa | | | | 284,389 | |
| | | | | |
| | 299 | | | Freddie Mac Gold Pool 847190 | | | 2.418% | | | | 4/01/29 | | | | Aaa | | | | 311,060 | |
| | | | | |
| | 1,095 | | | Freddie Mac Gold Pool 847209 | | | 2.331% | | | | 10/01/30 | | | | Aaa | | | | 1,142,110 | |
| | | | | |
| | 735 | | | Freddie Mac Gold Pool 847210 | | | 2.353% | | | | 9/01/33 | | | | Aaa | | | | 786,896 | |
| | | | | |
| | 1,400 | | | Freddie Mac Gold Pool G05852 | | | 5.500% | | | | 3/01/39 | | | | Aaa | | | | 1,566,288 | |
| | | | | |
| | 880 | | | Freddie Mac Mortgage Trust, Multifamily Mortgage Pass-Through Certificates, Series 2013-K712 | | | 3.368% | | | | 5/25/45 | | | | Aaa | | | | 895,727 | |
| | | | | |
| | — | (5) | | Ginnie Mae Mortgage Pool AB3194 | | | 4.500% | | | | 6/01/41 | | | | Aaa | | | | — | |
| | | | | |
| | 3,287 | | | Ginnie Mae Mortgage Pool MA2521 | | | 3.500% | | | | 1/20/45 | | | | Aaa | | | | 3,427,839 | |
| | | | | |
| | 3,726 | | | Government National Mortgage Association Pool AA5391 | | | 3.500% | | | | 6/15/42 | | | | Aaa | | | | 3,871,127 | |
| | | | | |
| | 1,705 | | | Invitation Homes Trust 2013-SFR1 | | | 1.400% | | | | 12/17/30 | | | | Aaa | | | | 1,697,697 | |
| | | | | |
| | 1,269 | | | Master Resecuritization Trust 2009-1 | | | 6.000% | | | | 10/25/36 | | | | A | | | | 1,337,647 | |
| | | | | |
| | 156 | | | Sequoia Mortgage Trust, Mortgage Pass-Through Certificates, Series 2011-1 | | | 4.125% | | | | 2/25/41 | | | | AAA | | | | 156,802 | |
| | | | | |
| | 148 | | | Structured Adjustable Rate Mortgage Loan Trust, Mortgage Pass-Through Certificates, Series 2004-11 | | | 2.518% | | | | 8/25/34 | | | | N/R | | | | 147,633 | |
| | | | | |
| | 1,351 | | | Structured Agency Credit Risk Debt Notes, 2013-DN2 | | | 1.641% | | | | 11/25/23 | | | | Baa1 | | | | 1,353,075 | |
| | | | | |
| | 3 | | | U.S. Small Business Administration Guaranteed Participating Securities Participation Certificates, Series 2006-10A | | | 5.408% | | | | 2/10/16 | | | | Aaa | | | | 3,459 | |
| | | | | |
| | 1,904 | | | U.S. Small Business Administration Guaranteed Participating Securities, Participation Certificates, Series 2010-P10B | | | 3.215% | | | | 9/10/20 | | | | Aaa | | | | 1,955,315 | |
| | | | | |
| | 3,086 | | | United States Department of Veterans, Affairs, Guaranteed REMIC Pass-Through Certificates, Vendee Mortgage Trust, Series 2011-1 | | | 3.750% | | | | 2/15/35 | | | | Aaa | | | | 3,219,226 | |
| | | | | |
| | 1,664 | | | Walter Investment Management Company Capital Trust, Series 2012-AA | | | 4.549% | | | | 10/16/50 | | | | BBB | | | | 1,677,098 | |
| | | | | |
| | 2,000 | | | Wells Fargo Commercial Mortgage Trust, Commercial Mortgage Pass-Through Certificates, Series 2015-C29 | | | 3.637% | | | | 6/15/48 | | | | Aaa | | | | 2,045,610 | |
| | | | | |
| | 3,220 | | | Wells Fargo-RBS Commercial Mortgage Trust, Commercial Mortgage Pass-Through Certificates, Series 2011-C3 | | | 4.375% | | | | 3/15/44 | | | | Aaa | | | | 3,488,985 | |
| $ | 91,520 | | | Total Asset-Backed and Mortgage-Backed Securities (cost $93,253,769) | | | | | | | | | | | | | | | 95,649,638 | |
Nuveen Core Bond Fund (continued)
| | |
| Portfolio of Investments | | June 30, 2015 |
| | | | | | | | | | | | | | | | | | | | |
Principal
Amount (000) | | | Description (1) | | Coupon | | | Maturity | | | Ratings (2) | | | Value | |
| | | | | |
| | | | SOVEREIGN DEBT – 0.6% | | | | | | | | | | | | |
| | | | | |
| | | | Mexico – 0.6% | | | | | | | | | | | | |
| | | | | |
| $ | 1,400 | | | United Mexican States | | | 5.625% | | | | 1/15/17 | | | | A3 | | | $ | 1,491,700 | |
| $ | 1,400 | | | Total Sovereign Debt (cost $1,387,694) | | | | | | | | | | | | | | | 1,491,700 | |
| | | | Total Long-Term Investments (cost $227,231,042) | | | | | | | | | | | | | | | 229,902,055 | |
| | | | | |
| Shares | | | Description (1) | | Coupon | | | | | | | | | Value | |
| | | | |
| | | | INVESTMENTS PURCHASED WITH COLLATERAL FROM SECURITIES LENDING – 5.8% | | | | | | | | | | | | | |
| | | | | |
| | | | Money Market Funds – 5.8% | | | | | | | | | | | | |
| | | | | |
| | 13,740,808 | | | Mount Vernon Securities Lending Trust Prime Portfolio, (7) | | | 0.234% (6) | | | | | | | | | | | $ | 13,740,808 | |
| | | | Total Investments Purchased with Collateral from Securities Lending (cost $13,740,808) | | | | | | | | | | | | 13,740,808 | |
| | | | | |
| Shares | | | Description (1) | | Coupon | | | | | | | | | Value | |
| | | | | |
| | | | SHORT-TERM INVESTMENTS – 2.7% | | | | | | | | | | | | | | | | |
| | | | | |
| | | | Money Market Funds – 2.7% | | | | | | | | | | | | |
| | | | | |
| | 6,366,153 | | | First American Treasury Obligations Fund, Class Z | | | 0.000% (6) | | | | | | | | | | | $ | 6,366,153 | |
| | | | Total Short-Term Investments (cost $6,366,153) | | | | | | | | | | | | | | | 6,366,153 | |
| | | | Total Investments (cost $247,338,003) – 105.5% | | | | | | | | | | | | | | | 250,009,016 | |
| | | | Other Assets Less Liabilities – (5.5)% (8) | | | | | | | | | | | | | | | (12,976,537 | ) |
| | | | Net Assets – 100% | | | | | | | | | | | | | | $ | 237,032,479 | |
Investments in Derivatives as of June 30, 2015
Interest Rate Swaps outstanding:
| | | | | | | | | | | | | | | | | | | | | | | | | | | | | | | | |
| Counterparty | | Notional
Amount | | | Fund
Pay/Receive
Floating Rate | | | Floating Rate Index | | | Fixed Rate
(Annualized) | | | Fixed Rate
Payment
Frequency | | | Termination
Date | | | Value | | | Unrealized
Appreciation
(Depreciation) | |
JPMorgan* | | $ | 5,000,000 | | | | Receive | | | | 3-Month USD-LIBOR-ICE | | | | 2.739 | % | | | Semi-Annually | | | | 11/21/23 | | | $ | (187,062 | ) | | $ | (187,431 | ) |
JPMorgan* | | | 6,000,000 | | | | Receive | | | | 3-Month USD-LIBOR-ICE | | | | 2.354 | | | | Semi-Annually | | | | 5/21/25 | | | | 30,316 | | | | 30,316 | |
| | | $ | 11,000,000 | | | | | | | | | | | | | | | | | | | | | | | $ | (156,746 | ) | | $ | (157,115 | ) |
| * | Citigroup is the clearing broker for this transaction. |
Futures Contracts outstanding:
| | | | | | | | | | | | | | | | | | | | | | | | |
| Description | | Contract
Position | | | Number of
Contracts | | | Contract
Expiration | | | Notional
Amount at
Value* | | | Variation Margin
Receivable/
(Payable) | | | Unrealized
Appreciation
(Depreciation) | |
U.S. Treasury 2-Year Note | | | Short | | | | (45 | ) | | | 9/15 | | | $ | (9,852,188 | ) | | $ | 2,109 | | | $ | (14,334 | ) |
U.S. Treasury 5-Year Note | | | Short | | | | (11 | ) | | | 9/15 | | | | (1,311,836 | ) | | | 430 | | | | (362 | ) |
U.S. Treasury 10-Year Note | | | Short | | | | (53 | ) | | | 9/15 | | | | (6,687,109 | ) | | | 1,656 | | | | (48,825 | ) |
U.S. Treasury Long Bond | | | Short | | | | (11 | ) | | | 9/15 | | | | (1,659,281 | ) | | | 688 | | | | (21,901 | ) |
U.S. Treasury Ultra Bond | | | Long | | | | 48 | | | | 9/15 | | | | 7,395,000 | | | | (2,867 | ) | | | (157,027 | ) |
| | | | | | | | | | | | | | | $ | (12,115,414 | ) | | $ | 2,016 | | | $ | (242,449 | ) |
| * | The aggregate Notional Amount at Value of long and short positions is $7,395,000 and $(19,510,414), respectively. |
For Fund portfolio compliance purposes, the Fund’s industry classifications refer to any one or more of the industry sub-classifications used by one or more widely recognized market indexes or ratings group indexes, and/or as defined by Fund management. This definition may not apply for purposes of this report, which may combine industry sub-classifications into sectors for reporting ease.
| (1) | All percentages shown in the Portfolio of Investments are based on net assets. |
| (2) | Ratings (not covered by the report of independent registered public accounting firm): Using the highest of Standard & Poor’s Group (“Standard & Poor’s”), Moody’s Investors Service, Inc. (“Moody’s”) or Fitch, Inc. (“Fitch”) rating. Ratings below BBB by Standard & Poor’s, Baa by Moody’s or BBB by Fitch are considered to be below investment grade. Holdings designated N/R are not rated by any of these national rating agencies. |
| (3) | Investment, or a portion of investment, is out on loan for securities lending. The total value of the securities out on loan as of the end of the reporting period was $13,267,344. |
| (4) | Perpetual security. Maturity date is not applicable. |
| (5) | Principal Amount (000) rounds to less than $1,000. |
| (6) | The rate shown is the annualized seven-day effective yield as of the end of the reporting period. |
| (7) | The Fund may loan securities representing up to one third of the fair value of its total assets (which includes collateral for securities on loan) to broker-dealers, banks and other institutions. The Fund maintains collateral equal to at least 100% of the fair value of the securities loaned. The cash collateral received by the Fund is invested in this money market fund. See Notes to Financial Statements, Note 3 – Portfolio Securities and Investments in Derivatives, Securities Lending for more information. |
| (8) | Other assets less liabilities includes the unrealized appreciation (depreciation) of the over-the-counter derivatives as presented on the Statement of Assets and Liabilities. The unrealized appreciation (depreciation) of exchange-cleared and exchange-traded derivatives is recognized as part of the receivable or payable for variation margin as presented on the Statement of Assets and Liabilities. |
| 144A | Investment is exempt from registration under Rule 144A of the Securities Act of 1933, as amended. These investments may only be resold in transactions exempt from registration, which are normally those transactions with qualified institutional buyers. |
| USD-LIBOR-ICE | United States Dollar-London Inter-Bank Offered Rate Intercontinental Exchange. |
| (WI/DD) | Investment, or portion of investment, purchased on a when-issued or delayed-delivery basis. |
See accompanying notes to financial statements.
Nuveen Core Plus Bond Fund
| | |
| Portfolio of Investments | | June 30, 2015 |
| | | | | | | | | | | | | | | | | | | | |
| Shares | | | Description (1) | | Coupon | | | | | | Ratings (2) | | | Value | |
| | | | | | | | | | | | | | | | | | | | |
| | | | | |
| | | | LONG-TERM INVESTMENTS – 98.9% | | | | | | | | | | | | | | | | |
| | | | | |
| | | | $25 PAR (OR SIMILAR) RETAIL PREFERRED – 2.5% | | | | | | | | | | | | | | | | |
| | | | | |
| | | | Banks – 1.6% | | | | | | | | | | | | |
| | | | | |
| | 159,208 | | | PNC Financial Services | | | 6.125% | | | | | | | | Baa2 | | | $ | 4,368,667 | |
| | | | | |
| | 95,750 | | | Regions Financial Corporation | | | 6.375% | | | | | | | | BB | | | | 2,410,028 | |
| | | | | |
| | 90,000 | | | Wells Fargo & Company | | | 6.625% | | | | | | | | BBB | | | | 2,484,000 | |
| | | | Total Banks | | | | | | | | | | | | | | | 9,262,695 | |
| | | | | |
| | | | Consumer Finance – 0.4% | | | | | | | | | | | | |
| | | | | |
| | 83,000 | | | Discover Financial Services, (3) | | | 6.500% | | | | | | | | BB– | | | | 2,114,010 | |
| | | | | |
| | | | Insurance – 0.5% | | | | | | | | | | | | |
| | | | | |
| | 104,794 | | | Endurance Specialty Holdings Limited, (3) | | | 7.500% | | | | | | | | BBB– | | | | 2,721,500 | |
| | | | Total $25 Par (or similar) Retail Preferred (cost $13,611,300) | | | | | | | | | | | | | | | 14,098,205 | |
| | | | | |
Principal Amount (000) | | | Description (1) | | Coupon | | | Maturity | | | Ratings (2) | | | Value | |
| | | | | |
| | | | CORPORATE BONDS – 62.3% | | | | | | | | | | | | | | | | |
| | | | | |
| | | | Aerospace & Defense – 0.7% | | | | | | | | | | | | |
| | | | | |
| $ | 1,000 | | | Bombardier Inc., 144A, (3) | | | 6.125% | | | | 1/15/23 | | | | B+ | | | $ | 887,500 | |
| | | | | |
| | 2,780 | | | Exelis, Inc. | | | 5.550% | | | | 10/01/21 | | | | BBB– | | | | 3,058,867 | |
| | 3,780 | | | Total Aerospace & Defense | | | | | | | | | | | | | | | 3,946,367 | |
| | | | | |
| | | | Air Freight & Logistics – 0.2% | | | | | | | | | | | | |
| | | | | |
| | 1,130 | | | XPO Logistics, Inc., 144A | | | 6.500% | | | | 6/15/22 | | | | B1 | | | | 1,105,988 | |
| | | | | |
| | | | Airlines – 0.3% | | | | | | | | | | | | |
| | | | | |
| | 1,639 | | | Northwest Airlines Trust Pass-Through Certificates 2007-1 | | | 7.027% | | | | 11/01/19 | | | | A | | | | 1,839,478 | |
| | | | | |
| | | | Banks – 10.2% | | | | | | | | | | | | |
| | | | | |
| | 2,900 | | | Bancolombia SA | | | 5.950% | | | | 6/03/21 | | | | Baa2 | | | | 3,179,850 | |
| | | | | |
| | 2,955 | | | Bank of America Corporation, (3) | | | 4.000% | | | | 4/01/24 | | | | A | | | | 3,006,934 | |
| | | | | |
| | 4,240 | | | Bank of America Corporation | | | 4.250% | | | | 10/22/26 | | | | A– | | | | 4,153,517 | |
| | | | | |
| | 1,795 | | | Bank of America Corporation, (3) | | | 6.250% | | | | 3/05/65 | | | | BB+ | | | | 1,787,156 | |
| | | | | |
| | 2,965 | | | Barclays Bank PLC | | | 3.650% | | | | 3/16/25 | | | | A | | | | 2,804,291 | |
| | | | | |
| | 1,845 | | | CIT Group Inc. | | | 5.000% | | | | 8/01/23 | | | | BB+ | | | | 1,817,325 | |
| | | | | |
| | 3,425 | | | Citigroup Inc. | | | 4.500% | | | | 1/14/22 | | | | A | | | | 3,689,266 | |
| | | | | |
| | 5,000 | | | Citigroup Inc. | | | 3.875% | | | | 10/25/23 | | | | A | | | | 5,102,600 | |
| | | | | |
| | 1,000 | | | Citigroup Inc. | | | 3.750% | | | | 6/16/24 | | | | A | | | | 1,005,925 | |
| | | | | |
| | 2,000 | | | Citigroup Inc. | | | 4.300% | | | | 11/20/26 | | | | A– | | | | 1,955,644 | |
| | | | | |
| | 2,915 | | | General Electric Capital Corporation | | | 6.875% | | | | 1/10/39 | | | | AA+ | | | | 3,913,895 | |
| | | | | |
| | 1,890 | | | HSBC Holdings PLC | | | 6.800% | | | | 6/01/38 | | | | A+ | | | | 2,346,711 | |
| | | | | |
| | 3,455 | | | JPMorgan Chase & Company | | | 6.750% | | | | 12/31/49 | | | | BBB– | | | | 3,691,426 | |
| | | | | | | | | | | | | | | | | | | | |
Principal Amount (000) | | | Description (1) | | Coupon | | | Maturity | | | Ratings (2) | | | Value | |
| | | | | |
| | | | Banks (continued) | | | | | | | | | | | | |
| | | | | |
| $ | 1,345 | | | JPMorgan Chase & Company | | | 4.500% | | | | 1/24/22 | | | | A+ | | | $ | 1,441,400 | |
| | | | | |
| | 2,665 | | | JPMorgan Chase & Company | | | 3.200% | | | | 1/25/23 | | | | A+ | | | | 2,613,787 | |
| | | | | |
| | 1,680 | | | JPMorgan Chase & Company | | | 3.375% | | | | 5/01/23 | | | | A | | | | 1,631,312 | |
| | | | | |
| | 2,180 | | | JPMorgan Chase & Company, (3) | | | 6.400% | | | | 5/15/38 | | | | A+ | | | | 2,701,541 | |
| | | | | |
| | 1,200 | | | Royal Bank of Scotland Group PLC | | | 6.100% | | | | 6/10/23 | | | | BBB | | | | 1,275,884 | |
| | | | | |
| | 1,400 | | | Santander UK PLC, 144A | | | 5.000% | | | | 11/07/23 | | | | A– | | | | 1,432,598 | |
| | | | | |
| | 2,520 | | | Societe Generale, 144A | | | 5.000% | | | | 1/17/24 | | | | A– | | | | 2,523,417 | |
| | | | | |
| | 1,470 | | | Standard Chartered PLC, 144A, (3) | | | 5.700% | | | | 3/26/44 | | | | A+ | | | | 1,523,908 | |
| | | | | |
| | 1,490 | | | Standard Chartered PLC, 144A, (3) | | | 6.500% | | | | 12/29/49 | | | | BBB | | | | 1,502,854 | |
| | | | | |
| | 1,200 | | | State Bank of India London, 144A | | | 4.875% | | | | 4/17/24 | | | | BBB– | | | | 1,254,736 | |
| | | | | |
| | 1,220 | | | Wells Fargo & Company | | | 3.450% | | | | 2/13/23 | | | | A+ | | | | 1,213,394 | |
| | 54,755 | | | Total Banks | | | | | | | | | | | | | | | 57,569,371 | |
| | | | | |
| | | | Biotechnology – 0.4% | | | | | | | | | | | | |
| | | | | |
| | 2,405 | | | Baxalta Inc., 144A | | | 4.000% | | | | 6/23/25 | | | | BBB+ | | | | 2,387,114 | |
| | | | | |
| | | | Building Products – 0.8% | | | | | | | | | | | | |
| | | | | |
| | 1,695 | | | Masco Corporation | | | 5.950% | | | | 3/15/22 | | | | BBB | | | | 1,902,638 | |
| | | | | |
| | 948 | | | Odebrecht Offshore Drilling Finance Limited, 144A | | | 6.625% | | | | 10/01/22 | | | | BB | | | | 658,791 | |
| | | | | |
| | 2,120 | | | Owens Corning Incorporated | | | 4.200% | | | | 12/15/22 | | | | BBB– | | | | 2,148,764 | |
| | 4,763 | | | Total Building Products | | | | | | | | | | | | | | | 4,710,193 | |
| | | | | |
| | | | Capital Markets – 2.2% | | | | | | | | | | | | |
| | | | | |
| | 3,000 | | | Goldman Sachs Group, Inc. | | | 5.750% | | | | 1/24/22 | | | | A | | | | 3,412,407 | |
| | | | | |
| | 3,685 | | | Goldman Sachs Group, Inc., (3) | | | 6.750% | | | | 10/01/37 | | | | A– | | | | 4,322,313 | |
| | | | | |
| | 4,105 | | | Morgan Stanley | | | 5.500% | | | | 7/28/21 | | | | A | | | | 4,630,805 | |
| | 10,790 | | | Total Capital Markets | | | | | | | | | | | | | | | 12,365,525 | |
| | | | | |
| | | | Chemicals – 2.6% | | | | | | | | | | | | |
| | | | | |
| | 2,000 | | | Agrium Inc. | | | 3.375% | | | | 3/15/25 | | | | BBB | | | | 1,901,612 | |
| | | | | |
| | 2,375 | | | Braskem Finance Limited, 144A, (3) | | | 5.750% | | | | 4/15/21 | | | | BBB– | | | | 2,256,250 | |
| | | | | |
| | 3,830 | | | Incitec Pivot Finance, 144A | | | 6.000% | | | | 12/10/19 | | | | BBB | | | | 4,241,246 | |
| | | | | |
| | 1,400 | | | Office Cherifien Des Phosphates SA, 144A | | | 5.625% | | | | 4/25/24 | | | | BBB– | | | | 1,459,668 | |
| | | | | |
| | 1,830 | | | NOVA Chemicals Corporation, 144A, (3) | | | 5.000% | | | | 5/01/25 | | | | BB+ | | | | 1,857,450 | |
| | | | | |
| | 1,750 | | | Platform Specialty Products Corporation, 144A | | | 6.500% | | | | 2/01/22 | | | | BB– | | | | 1,806,875 | |
| | | | | |
| | 1,000 | | | PolyOne Corporation, (3) | | | 5.250% | | | | 3/15/23 | | | | BB | | | | 990,000 | |
| | 14,185 | | | Total Chemicals | | | | | | | | | | | | | | | 14,513,101 | |
| | | | | |
| | | | Commercial Services & Supplies – 0.4% | | | | | | | | | | | | |
| | | | | |
| | 1,000 | | | ADT Corporation, (3) | | | 6.250% | | | | 10/15/21 | | | | BBB– | | | | 1,050,000 | |
| | | | | |
| | 990 | | | R.R. Donnelley & Sons Company, (3) | | | 7.625% | | | | 6/15/20 | | | | BB– | | | | 1,113,750 | |
| | 1,990 | | | Total Commercial Services & Supplies | | | | | | | | | | | | | | | 2,163,750 | |
Nuveen Core Plus Bond Fund (continued)
| | |
| Portfolio of Investments | | June 30, 2015 |
| | | | | | | | | | | | | | | | | | | | |
Principal Amount (000) | | | Description (1) | | Coupon | | | Maturity | | | Ratings (2) | | | Value | |
| | | | | |
| | | | Construction & Engineering – 0.2% | | | | | | | | | | | | |
| | | | | |
| $ | 1,050 | | | AECOM Technology Corporation, 144A | | | 5.750% | | | | 10/15/22 | | | | BB– | | | $ | 1,063,125 | |
| | | | | |
| | | | Construction Materials – 0.3% | | | | | | | | | | | | |
| | | | | |
| | 1,800 | | | Norbord Inc., 144A, (3) | | | 5.375% | | | | 12/01/20 | | | | Ba2 | | | | 1,791,000 | |
| | | | | |
| | | | Consumer Finance – 1.5% | | | | | | | | | | | | |
| | | | | |
| | 3,348 | | | Capital One Bank | | | 3.375% | | | | 2/15/23 | | | | Baa1 | | | | 3,252,184 | |
| | | | | |
| | 1,500 | | | Discover Bank | | | 4.250% | | | | 3/13/26 | | | | BBB+ | | | | 1,481,975 | |
| | | | | |
| | 1,790 | | | Discover Financial Services | | | 5.200% | | | | 4/27/22 | | | | BBB+ | | | | 1,903,252 | |
| | | | | |
| | 2,000 | | | Ford Motor Credit Company | | | 4.250% | | | | 9/20/22 | | | | BBB– | | | | 2,082,874 | |
| | 8,638 | | | Total Consumer Finance | | | | | | | | | | | | | | | 8,720,285 | |
| | | | | |
| | | | Containers & Packaging – 0.8% | | | | | | | | | | | | |
| | | | | |
| | 2,470 | | | Packaging Corporation of America | | | 3.650% | | | | 9/15/24 | | | | BBB | | | | 2,420,435 | |
| | | | | |
| | 1,945 | | | Rock-Tenn Company | | | 4.900% | | | | 3/01/22 | | | | BBB | | | | 2,094,337 | |
| | 4,415 | | | Total Containers & Packaging | | | | | | | | | | | | | | | 4,514,772 | |
| | | | | |
| | | | Diversified Financial Services – 1.3% | | | | | | | | | | | | |
| | | | | |
| | 2,600 | | | BNP Paribas, (3) | | | 4.250% | | | | 10/15/24 | | | | A | | | | 2,564,286 | |
| | | | | |
| | 1,500 | | | Fly Leasing Limited | | | 6.750% | | | | 12/15/20 | | | | BB | | | | 1,545,000 | |
| | | | | |
| | 3,050 | | | Rabobank Nederland | | | 3.875% | | | | 2/08/22 | | | | Aa2 | | | | 3,172,936 | |
| | 7,150 | | | Total Diversified Financial Services | | | | | | | | | | | | | | | 7,282,222 | |
| | | | | |
| | | | Diversified Telecommunication Services – 2.6% | | | | | | | | | | | | |
| | | | | |
| | 2,970 | | | AT&T, Inc., (3) | | | 5.550% | | | | 8/15/41 | | | | A– | | | | 3,042,973 | |
| | | | | |
| | 3,190 | | | Qwest Corporation | | | 6.750% | | | | 12/01/21 | | | | BBB– | | | | 3,520,963 | |
| | | | | |
| | 2,610 | | | SBA Tower Trust, 144A | | | 3.598% | | | | 4/15/43 | | | | BBB | | | | 2,601,781 | |
| | | | | |
| | 1,000 | | | Verizon Communications | | | 5.150% | | | | 9/15/23 | | | | A– | | | | 1,094,841 | |
| | | | | |
| | 1,000 | | | Verizon Communications, (3) | | | 3.500% | | | | 11/01/24 | | | | A– | | | | 972,659 | |
| | | | | |
| | 2,010 | | | Verizon Communications | | | 6.900% | | | | 4/15/38 | | | | A– | | | | 2,404,163 | |
| | | | | |
| | 700 | | | Verizon Communications | | | 6.550% | | | | 9/15/43 | | | | A– | | | | 818,828 | |
| | 13,480 | | | Total Diversified Telecommunication Services | | | | | | | | | | | | | | | 14,456,208 | |
| | | | | |
| | | | Electric Utilities – 1.5% | | | | | | | | | | | | |
| | | | | |
| | 1,500 | | | Comision Federal de Electricidad of the United States of Mexico, 144A | | | 4.875% | | | | 5/26/21 | | | | BBB+ | | | | 1,567,500 | |
| | | | | |
| | 2,500 | | | Exelon Generation Co. LLC | | | 4.250% | | | | 6/15/22 | | | | BBB | | | | 2,558,990 | |
| | | | | |
| | 2,090 | | | FirstEnergy Transmission LLC, 144A | | | 4.350% | | | | 1/15/25 | | | | Baa3 | | | | 2,144,407 | |
| | | | | |
| | 2,095 | | | PPL Capital Funding Inc. | | | 3.500% | | | | 12/01/22 | | | | BBB+ | | | | 2,119,985 | |
| | 8,185 | | | Total Electric Utilities | | | | | | | | | | | | | | | 8,390,882 | |
| | | | | |
| | | | Electronic Equipment, Instruments & Components – 0.2% | | | | | | | | | | | | |
| | | | | |
| | 1,025 | | | Anixter Inc. | | | 5.125% | | | | 10/01/21 | | | | BB+ | | | | 1,042,938 | |
| | | | | |
| | | | Energy Equipment & Services – 2.3% | | | | | | | | | | | | |
| | | | | |
| | 2,180 | | | Diamond Offshore Drilling Inc., (3) | | | 5.700% | | | | 10/15/39 | | | | A3 | | | | 1,908,222 | |
| | | | | | | | | | | | | | | | | | | | |
Principal Amount (000) | | | Description (1) | | Coupon | | | Maturity | | | Ratings (2) | | | Value | |
| | | | | |
| | | | Energy Equipment & Services (continued) | | | | | | | | | | | | |
| | | | | |
| $ | 3,870 | | | Ensco PLC, (3) | | | 4.700% | | | | 3/15/21 | | | | BBB+ | | | $ | 3,941,982 | |
| | | | | |
| | 2,000 | | | Nabors Industries Inc. | | | 4.625% | | | | 9/15/21 | | | | BBB | | | | 1,986,942 | |
| | | | | |
| | 1,260 | | | Noble Holding International Limited, GDR, (3) | | | 5.950% | | | | 4/01/25 | | | | BBB | | | | 1,242,331 | |
| | | | | |
| | 2,000 | | | Origin Energy Finance Limited, 144A | | | 3.500% | | | | 10/09/18 | | | | Baa2 | | | | 2,051,674 | |
| | | | | |
| | 1,880 | | | Weatherford International PLC | | | 7.000% | | | | 3/15/38 | | | | BBB– | | | | 1,796,959 | |
| | 13,190 | | | Total Energy Equipment & Services | | | | | | | | | | | | | | | 12,928,110 | |
| | | | | |
| | | | Food & Staples Retailing – 0.7% | | | | | | | | | | | | |
| | | | | |
| | 1,600 | | | Kraft Foods Inc. | | | 5.000% | | | | 6/04/42 | | | | BBB– | | | | 1,594,435 | |
| | | | | |
| | 1,000 | | | Supervalu Inc., (3) | | | 6.750% | | | | 6/01/21 | | | | B | | | | 1,010,000 | |
| | | | | |
| | 1,455 | | | Walgreens Boots Alliance, Inc., (3) | | | 3.800% | | | | 11/18/24 | | | | BBB | | | | 1,424,995 | |
| | 4,055 | | | Total Food & Staples Retailing | | | | | | | | | | | | | | | 4,029,430 | |
| | | | | |
| | | | Food Products – 0.1% | | | | | | | | | | | | |
| | | | | |
| | 750 | | | Pilgrim’s Pride Corporation, 144A | | | 5.750% | | | | 3/15/25 | | | | BB+ | | | | 757,500 | |
| | | | | |
| | | | Health Care Equipment & Supplies – 0.2% | | | | | | | | | | | | |
| | | | | |
| | 1,320 | | | Becton Dickinson & Company | | | 3.734% | | | | 12/15/24 | | | | BBB+ | | | | 1,315,560 | |
| | | | | |
| | | | Health Care Providers & Services – 0.5% | | | | | | | | | | | | |
| | | | | |
| | 2,185 | | | UnitedHealth Group Incorporated | | | 6.875% | | | | 2/15/38 | | | | A+ | | | | 2,874,033 | |
| | | | | |
| | | | Hotels, Restaurants & Leisure – 0.3% | | | | | | | | | | | | |
| | | | | |
| | 1,550 | | | Wynn Macau Limited, 144A, (3) | | | 5.250% | | | | 10/15/21 | | | | BB | | | | 1,464,750 | |
| | | | | |
| | | | Household Durables – 0.5% | | | | | | | | | | | | |
| | | | | |
| | 1,500 | | | Brookfield Residential Properties Inc., 144A | | | 6.500% | | | | 12/15/20 | | | | BB– | | | | 1,493,130 | |
| | | | | |
| | 1,375 | | | Harman International Industries, Inc. | | | 4.150% | | | | 5/15/25 | | | | BBB– | | | | 1,355,080 | |
| | 2,875 | | | Total Household Durables | | | | | | | | | | | | | | | 2,848,210 | |
| | | | | |
| | | | Insurance – 2.7% | | | | | | | | | | | | |
| | | | | |
| | 3,975 | | | AFLAC Insurance | | | 6.450% | | | | 8/15/40 | | | | A | | | | 4,830,714 | |
| | | | | |
| | 1,650 | | | Genworth Holdings Inc. | | | 4.800% | | | | 2/15/24 | | | | Ba1 | | | | 1,439,625 | |
| | | | | |
| | 3,015 | | | Liberty Mutual Group Inc., 144A | | | 5.000% | | | | 6/01/21 | | | | BBB | | | | 3,290,143 | |
| | | | | |
| | 1,760 | | | Liberty Mutual Group Inc., 144A | | | 4.950% | | | | 5/01/22 | | | | BBB | | | | 1,892,014 | |
| | | | | |
| | 2,000 | | | Lincoln National Corporation | | | 4.200% | | | | 3/15/22 | | | | A– | | | | 2,098,680 | |
| | | | | |
| | 1,640 | | | Pacific LifeCorp., 144A | | | 6.000% | | | | 2/10/20 | | | | BBB+ | | | | 1,852,856 | |
| | 14,040 | | | Total Insurance | | | | | | | | | | | | | | | 15,404,032 | |
| | | | | |
| | | | Leisure Products – 0.5% | | | | | | | | | | | | |
| | | | | |
| | 2,950 | | | Hyatt Hotels Corporation | | | 3.375% | | | | 7/15/23 | | | | BBB | | | | 2,872,633 | |
| | | | | |
| | | | Machinery – 0.8% | | | | | | | | | | | | |
| | | | | |
| | 1,500 | | | CTP Transportation Products LLC-Finance Inc., 144A | | | 8.250% | | | | 12/15/19 | | | | B+ | | | | 1,552,500 | |
| | | | | |
| | 1,120 | | | Cummins Engine Inc. | | | 4.875% | | | | 10/01/43 | | | | A+ | | | | 1,190,997 | |
| | | | | |
| | 1,850 | | | Ingersoll-Rand Luxembourg Finance SA, (3) | | | 3.550% | | | | 11/01/24 | | | | BBB | | | | 1,810,151 | |
| | 4,470 | | | Total Machinery | | | | | | | | | | | | | | | 4,553,648 | |
Nuveen Core Plus Bond Fund (continued)
| | |
| Portfolio of Investments | | June 30, 2015 |
| | | | | | | | | | | | | | | | | | | | |
Principal Amount (000) | | | Description (1) | | Coupon | | | Maturity | | | Ratings (2) | | | Value | |
| | | | | |
| | | | Media – 4.9% | | | | | | | | | | | | |
| | | | | |
| $ | 3,590 | | | 21st Century Fox America Inc. | | | 6.650% | | | | 11/15/37 | | | | BBB+ | | | $ | 4,368,779 | |
| | | | | |
| | 1,470 | | | CBS Corporation | | | 3.500% | | | | 1/15/25 | | | | BBB | | | | 1,406,452 | |
| | | | | |
| | 1,500 | | | CCO Holdings LLC Finance Corporation, 144A | | | 5.125% | | | | 5/01/23 | | | | BB– | | | | 1,458,750 | |
| | | | | |
| | 5,565 | | | DIRECTV Holdings LLC | | | 3.800% | | | | 3/15/22 | | | | BBB | | | | 5,597,010 | |
| | | | | |
| | 2,000 | | | Dish DBS Corporation | | | 4.250% | | | | 4/01/18 | | | | BB– | | | | 2,035,000 | |
| | | | | |
| | 1,895 | | | NBC Universal Media LLC | | | 6.400% | | | | 4/30/40 | | | | A– | | | | 2,353,095 | |
| | | | | |
| | 1,925 | | | NBC Universal Media LLC, (3) | | | 4.450% | | | | 1/15/43 | | | | A– | | | | 1,850,110 | |
| | | | | |
| | 1,250 | | | Numericable Group SA, 144A | | | 6.000% | | | | 5/15/22 | | | | Ba3 | | | | 1,232,031 | |
| | | | | |
| | 1,635 | | | SES SA, 144A | | | 3.600% | | | | 4/04/23 | | | | BBB | | | | 1,658,856 | |
| | | | | |
| | 1,300 | | | Sinclair Television Group, (3) | | | 6.375% | | | | 11/01/21 | | | | B+ | | | | 1,342,250 | |
| | | | | |
| | 1,800 | | | Sirius XM Radio Inc., 144A | | | 4.250% | | | | 5/15/20 | | | | BB | | | | 1,791,000 | |
| | | | | |
| | 1,250 | | | Unitymedia KabelBW GmbH, 144A | | | 6.125% | | | | 1/15/25 | | | | B | | | | 1,306,250 | |
| | | | | |
| | 1,500 | | | WMG Acquisition Group, 144A, (3) | | | 6.000% | | | | 1/15/21 | | | | B+ | | | | 1,530,000 | |
| | 26,680 | | | Total Media | | | | | | | | | | | | | | | 27,929,583 | |
| | | | | |
| | | | Metals & Mining – 5.2% | | | | | | | | | | | | |
| | | | | |
| | 3,035 | | | Alcoa Inc. | | | 5.400% | | | | 4/15/21 | | | | BBB– | | | | 3,181,044 | |
| | | | | |
| | 1,625 | | | Allegheny Technologies Inc. | | | 6.625% | | | | 8/15/23 | | | | BB+ | | | | 1,655,469 | |
| | | | | |
| | 3,620 | | | Anglogold Holdings PLC | | | 6.500% | | | | 4/15/40 | | | | Baa3 | | | | 3,296,278 | |
| | | | | |
| | 1,570 | | | ArcelorMittal | | | 7.000% | | | | 2/25/22 | | | | Ba1 | | | | 1,691,675 | |
| | | | | |
| | 1,380 | | | Cliffs Natural Resources Inc., (3) | | | 4.200% | | | | 1/15/18 | | | | BB– | | | | 655,500 | |
| | | | | |
| | 1,500 | | | First Quantum Minerals Limited, 144A, (3) | | | 6.750% | | | | 2/15/20 | | | | BB– | | | | 1,451,250 | |
| | | | | |
| | 1,535 | | | Freeport McMoRan, Inc., (3) | | | 3.550% | | | | 3/01/22 | | | | BBB | | | | 1,420,839 | |
| | | | | |
| | 3,700 | | | Newmont Mining Corporation, (3) | | | 3.500% | | | | 3/15/22 | | | | BBB | | | | 3,531,062 | |
| | | | | |
| | 2,000 | | | Nucor Corporation | | | 4.000% | | | | 8/01/23 | | | | A | | | | 2,029,374 | |
| | | | | |
| | 2,770 | | | Rio Tinto Finance USA PLC, (3) | | | 2.875% | | | | 8/21/22 | | | | A– | | | | 2,681,767 | |
| | | | | |
| | 1,440 | | | Teck Resources Limited | | | 6.250% | | | | 7/15/41 | | | | BBB– | | | | 1,158,811 | |
| | | | | |
| | 1,050 | | | Vale Overseas Limited, (3) | | | 4.375% | | | | 1/11/22 | | | | BBB+ | | | | 1,025,800 | |
| | | | | |
| | 1,890 | | | Vale Overseas Limited, (3) | | | 6.875% | | | | 11/10/39 | | | | BBB+ | | | | 1,818,936 | |
| | | | | |
| | 1,160 | | | Xstrata Finance Canada Limited, 144A | | | 4.250% | | | | 10/25/22 | | | | BBB | | | | 1,139,826 | |
| | | | | |
| | 1,075 | | | Xstrata Finance Canada Limited, 144A | | | 6.900% | | | | 11/15/37 | | | | BBB | | | | 1,157,984 | |
| | | | | |
| | 1,755 | | | Yamana Gold Inc. | | | 4.950% | | | | 7/15/24 | | | | Baa3 | | | | 1,690,472 | |
| | 31,105 | | | Total Metals & Mining | | | | | | | | | | | | | | | 29,586,087 | |
| | | | | |
| | | | Multiline Retail – 0.2% | | | | | | | | | | | | |
| | | | | |
| | 1,250 | | | Family Tree Escrow LLC, 144A, (3) | | | 5.250% | | | | 3/01/20 | | | | Ba3 | | | | 1,307,813 | |
| | | | | |
| | | | Oil, Gas & Consumable Fuels – 8.4% | | | | | | | | | | | | |
| | | | | |
| | 3,230 | | | Anadarko Petroleum Corporation | | | 6.200% | | | | 3/15/40 | | | | BBB | | | | 3,640,262 | |
| | | | | |
| | 1,570 | | | Apache Corporation | | | 4.250% | | | | 1/15/44 | | | | BBB+ | | | | 1,363,441 | |
| | | | | |
| | 1,750 | | | Baytex Energy Corporation | | | 6.625% | | | | 7/19/22 | | | | BB | | | | 1,436,149 | |
| | | | | | | | | | | | | | | | | | | | |
Principal Amount (000) | | | Description (1) | | Coupon | | | Maturity | | | Ratings (2) | | | Value | |
| | | | | |
| | | | Oil, Gas & Consumable Fuels (continued) | | | | | | | | | | | | |
| | | | | |
| $ | 1,685 | | | Berkshire Hathaway Energy Company, (3) | | | 6.125% | | | | 4/01/36 | | | | A3 | | | $ | 1,985,034 | |
| | | | | |
| | 2,000 | | | California Resources Corporation, (3) | | | 5.500% | | | | 9/15/21 | | | | BB | | | | 1,740,400 | |
| | | | | |
| | 1,250 | | | Calumet Specialty Products, (3) | | | 6.500% | | | | 4/15/21 | | | | B+ | | | | 1,231,250 | |
| | | | | |
| | 370 | | | Canadian Natural Resources Limited | | | 5.850% | | | | 2/01/35 | | | | BBB+ | | | | 391,174 | |
| | | | | |
| | 2,000 | | | Canadian Oil Sands Trust, 144A, (3) | | | 7.750% | | | | 5/15/19 | | | | Baa2 | | | | 2,175,294 | |
| | | | | |
| | 1,500 | | | Cenovus Energy Inc., (3) | | | 3.800% | | | | 9/15/23 | | | | BBB+ | | | | 1,482,099 | |
| | | | | |
| | 1,800 | | | Chesapeake Energy Corporation, (3) | | | 6.125% | | | | 2/15/21 | | | | BB+ | | | | 1,692,000 | |
| | | | | |
| | 2,750 | | | CNOOC Finance 2014 ULC | | | 4.250% | | | | 4/30/24 | | | | AA– | | | | 2,808,432 | |
| | | | | |
| | 2,000 | | | Continental Resources Inc. | | | 5.000% | | | | 9/15/22 | | | | BBB– | | | | 1,961,262 | |
| | | | | |
| | 1,125 | | | EnLink Midstream Partners LP | | | 4.150% | | | | 6/01/25 | | | | BBB | | | | 1,095,356 | |
| | | | | |
| | 700 | | | Hess Corporation, (3) | | | 3.500% | | | | 7/15/24 | | | | BBB | | | | 674,652 | |
| | | | | |
| | 1,615 | | | Kinder Morgan Energy Partners, LP, (3) | | | 4.250% | | | | 9/01/24 | | | | BBB– | | | | 1,572,905 | |
| | | | | |
| | 2,000 | | | Martin Mid-Stream Partners LP Finance | | | 7.250% | | | | 2/15/21 | | | | B– | | | | 1,965,000 | |
| | | | | |
| | 1,470 | | | NGL Energy Partners LP/Fin Co | | | 5.125% | | | | 7/15/19 | | | | BB– | | | | 1,466,325 | |
| | | | | |
| | 2,255 | | | Petro Canada | | | 6.800% | | | | 5/15/38 | | | | A– | | | | 2,846,076 | |
| | | | | |
| | 1,295 | | | Petrobras International Finance Company | | | 6.875% | | | | 1/20/40 | | | | BBB– | | | | 1,153,664 | |
| | | | | |
| | 1,900 | | | Reliance Holdings USA Inc., 144A | | | 5.400% | | | | 2/14/22 | | | | BBB+ | | | | 2,048,823 | |
| | | | | |
| | 2,000 | | | Sabine Pass Liquefaction LLC, (3) | | | 5.625% | | | | 2/01/21 | | | | BB+ | | | | 2,040,000 | |
| | | | | |
| | 1,955 | | | Southwestern Energy Company, (3) | | | 4.100% | | | | 3/15/22 | | | | BBB– | | | | 1,917,724 | |
| | | | | |
| | 2,560 | | | Spectra Energy Partners LP | | | 4.750% | | | | 3/15/24 | | | | BBB | | | | 2,705,495 | |
| | | | | |
| | 1,750 | | | Targa Resources Inc. | | | 4.250% | | | | 11/15/23 | | | | BB+ | | | | 1,618,750 | |
| | | | | |
| | 2,500 | | | Transocean Inc., (3) | | | 4.300% | | | | 10/15/22 | | | | BBB– | | | | 1,881,250 | |
| | | | | |
| | 1,610 | | | Valero Energy Corporation | | | 3.650% | | | | 3/15/25 | | | | BBB | | | | 1,565,469 | |
| | | | | |
| | 1,380 | | | Woodside Finance Limtied, 144A | | | 3.650% | | | | 3/05/25 | | | | BBB+ | | | | 1,325,313 | |
| | 48,020 | | | Total Oil, Gas & Consumable Fuels | | | | | | | | | | | | | | | 47,783,599 | |
| | | | | |
| | | | Paper & Forest Products – 0.8% | | | | | | | | | | | | |
| | | | | |
| | 1,100 | | | Domtar Corporation | | | 4.400% | | | | 4/01/22 | | | | BBB– | | | | 1,117,896 | |
| | | | | |
| | 1,785 | | | Domtar Corporation | | | 6.750% | | | | 2/15/44 | | | | BBB– | | | | 1,886,768 | |
| | | | | |
| | 1,500 | | | Resolute Forest Products | | | 5.875% | | | | 5/15/23 | | | | BB– | | | | 1,365,000 | |
| | 4,385 | | | Total Paper & Forest Products | | | | | | | | | | | | | | | 4,369,664 | |
| | | | | |
| | | | Personal Products – 0.6% | | | | | | | | | | | | |
| | | | | |
| | 2,265 | | | International Paper Company | | | 8.700% | | | | 6/15/38 | | | | BBB | | | | 3,103,705 | |
| | | | | |
| | | | Pharmaceuticals – 0.2% | | | | | | | | | | | | |
| | | | | |
| | 1,000 | | | Endo Finance LLC / Endo Finco Inc., 144A | | | 6.000% | | | | 2/01/25 | | | | B1 | | | | 1,016,250 | |
| | | | | |
| | | | Real Estate Investment Trust – 3.1% | | | | | | | | | | | | |
| | | | | |
| | 2,780 | | | American Tower Company | | | 5.000% | | | | 2/15/24 | | | | BBB | | | | 2,938,852 | |
| | | | | |
| | 1,670 | | | ARC Property Operating Partnership LP, Clark Acquisition LLC | | | 4.600% | | | | 2/06/24 | | | | BB+ | | | | 1,626,513 | |
| | | | | |
| | 2,200 | | | Digital Realty Trust Inc. | | | 3.625% | | | | 10/01/22 | | | | BBB | | | | 2,145,609 | |
Nuveen Core Plus Bond Fund (continued)
| | |
| Portfolio of Investments | | June 30, 2015 |
| | | | | | | | | | | | | | | | | | | | |
Principal Amount (000) | | | Description (1) | | Coupon | | | Maturity | | | Ratings (2) | | | Value | |
| | | | | |
| | | | Real Estate Investment Trust (continued) | | | | | | | | | | | | |
| | | | | |
| $ | 1,865 | | | Omega Healthcare Investors Inc. | | | 4.950% | | | | 4/01/24 | | | | BBB– | | | $ | 1,907,569 | |
| | | | | |
| | 1,815 | | | Piedmont Operating Partnership LP | | | 4.450% | | | | 3/15/24 | | | | BBB | | | | 1,823,672 | |
| | | | | |
| | 1,200 | | | Plum Creek Timberlands LP | | | 4.700% | | | | 3/15/21 | | | | BBB | | | | 1,284,612 | |
| | | | | |
| | 2,995 | | | Prologis Inc. | | | 6.875% | | | | 3/15/20 | | | | BBB+ | | | | 3,459,734 | |
| | | | | |
| | 2,315 | | | Realty Income Corporation | | | 3.250% | | | | 10/15/22 | | | | BBB+ | | | | 2,247,349 | |
| | 16,840 | | | Total Real Estate Investment Trust | | | | | | | | | | | | | | | 17,433,910 | |
| | | | | |
| | | | Software – 0.9% | | | | | | | | | | | | |
| | | | | |
| | 2,750 | | | Computer Sciences Corporation | | | 4.450% | | | | 9/15/22 | | | | BBB+ | | | | 2,822,823 | |
| | | | | |
| | 2,000 | | | Total System Services Inc. | | | 3.750% | | | | 6/01/23 | | | | BBB+ | | | | 1,964,824 | |
| | 4,750 | | | Total Software | | | | | | | | | | | | | | | 4,787,647 | |
| | | | | |
| | | | Specialty Retail – 0.3% | | | | | | | | | | | | |
| | | | | |
| | 1,225 | | | Best Buy Co., Inc. | | | 5.000% | | | | 8/01/18 | | | | Baa2 | | | | 1,292,375 | |
| | | | | |
| | 500 | | | Guitar Center Inc., 144A | | | 6.500% | | | | 4/15/19 | | | | B– | | | | 457,500 | |
| | 1,725 | | | Total Specialty Retail | | | | | | | | | | | | | | | 1,749,875 | |
| | | | | |
| | | | Technology Hardware, Storage & Peripherals – 0.6% | | | | | | | | | | | | |
| | | | | |
| | 1,965 | | | Apple Inc. | | | 3.850% | | | | 5/04/43 | | | | AA+ | | | | 1,788,504 | |
| | | | | |
| | 1,750 | | | NCR Corporation | | | 5.000% | | | | 7/15/22 | | | | BB | | | | 1,774,063 | |
| | 3,715 | | | Total Technology Hardware, Storage & Peripherals | | | | | | | | | | | | | | | 3,562,567 | |
| | | | | |
| | | | Tobacco – 0.4% | | | | | | | | | | | | |
| | | | | |
| | 2,200 | | | Altria Group Inc. | | | 2.850% | | | | 8/09/22 | | | | BBB+ | | | | 2,114,664 | |
| | | | | |
| | | | Trading Companies & Distributors – 0.3% | | | | | | | | | | | | |
| | | | | |
| | 1,925 | | | Air Lease Corporation | | | 3.875% | | | | 4/01/21 | | | | BBB– | | | | 1,944,250 | |
| | | | | |
| | | | Wireless Telecommunication Services – 1.6% | | | | | | | | | | | | |
| | | | | |
| | 1,000 | | | ENTEL Chile SA, 144A | | | 4.750% | | | | 8/01/26 | | | | BBB+ | | | | 981,650 | |
| | | | | |
| | 2,000 | | | Frontier Communications Corporation, (3) | | | 8.500% | | | | 4/15/20 | | | | BB | | | | 2,090,999 | |
| | | | | |
| | 1,100 | | | Millicom International Cellular SA, 144A | | | 6.625% | | | | 10/15/21 | | | | BB+ | | | | 1,130,249 | |
| | | | | |
| | 1,500 | | | Softbank Corporation, 144A, (3) | | | 4.500% | | | | 4/15/20 | | | | BB+ | | | | 1,505,624 | |
| | | | | |
| | 1,000 | | | Sprint Corporation | | | 7.250% | | | | 9/15/21 | | | | B+ | | | | 974,999 | |
| | | | | |
| | 1,325 | | | T-Mobile USA Inc. | | | 6.731% | | | | 4/28/22 | | | | BB | | | | 1,381,312 | |
| | | | | |
| | 1,422 | | | Viacom Inc. | | | 4.375% | | | | 3/15/43 | | | | BBB+ | | | | 1,152,037 | |
| | 9,347 | | | Total Wireless Telecommunication Services | | | | | | | | | | | | | | | 9,216,870 | |
| $ | 343,772 | | | Total Corporate Bonds (cost $345,040,618) | | | | | | | | | | | | | | | 352,816,709 | |
| | | | | |
Principal
Amount (000) | | | Description (1) | | Coupon | | | Maturity | | | Ratings (2) | | | Value | |
| | | | | |
| | | | $1,000 PAR (OR SIMILAR) INSTITUTIONAL PREFERRED – 6.5% | | | | | | | | | | | | | | | | |
| | | | | |
| | | | Banks – 3.3% | | | | | | | | | | | | |
| | | | | |
| $ | 1,620 | | | Fifth Third Bancorp. | | | 5.100% | | | | N/A (4) | | | | Baa3 | | | $ | 1,518,750 | |
| | | | | |
| | 4,000 | | | General Electric Capital Corporation | | | 7.125% | | | | N/A (4) | | | | A+ | | | | 4,615,000 | |
| | | | | | | | | | | | | | | | | | | | |
Principal
Amount (000) | | | Description (1) | | Coupon | | | Maturity | | | Ratings (2) | | | Value | |
| | | | | |
| | | | Banks (continued) | | | | | | | | | | | | |
| | | | | |
| $ | 3,000 | | | HSBC Holdings PLC | | | 6.375% | | | | N/A (4) | | | | BBB | | | $ | 3,007,500 | |
| | | | | |
| | 1,525 | | | Nordea Bank AB, 144A | | | 6.125% | | | | N/A (4) | | | | BBB | | | | 1,503,554 | |
| | | | | |
| | 1,485 | | | SunTrust Bank Inc., (3) | | | 5.625% | | | | N/A (4) | | | | Baa3 | | | | 1,494,281 | |
| | | | | |
| | 3,500 | | | Wachovia Capital Trust III | | | 5.570% | | | | N/A (4) | | | | BBB | | | | 3,460,625 | |
| | | | | |
| | 2,760 | | | Wells Fargo Capital Trust X | | | 5.950% | | | | 12/15/36 | | | | Baa1 | | | | 2,805,540 | |
| | 17,890 | | | Total Banks | | | | | | | | | | | | | | | 18,405,250 | |
| | | | | |
| | | | Capital Markets – 0.6% | | | | | | | | | | | | |
| | | | | |
| | 2,415 | | | Goldman Sachs Capital II | | | 4.000% | | | | N/A (4) | | | | Ba1 | | | | 1,838,419 | |
| | | | | |
| | 1,500 | | | UBS Group AG, Reg S | | | 7.125% | | | | N/A (4) | | | | BB+ | | | | 1,561,650 | |
| | 3,915 | | | Total Capital Markets | | | | | | | | | | | | | | | 3,400,069 | |
| | | | | |
| | | | Consumer Finance – 0.7% | | | | | | | | | | | | |
| | | | | |
| | 1,485 | | | American Express Company | | | 5.200% | | | | N/A (4) | | | | Baa2 | | | | 1,474,011 | |
| | | | | |
| | 1,100 | | | American Express Company | | | 4.900% | | | | N/A (4) | | | | Baa2 | | | | 1,065,680 | |
| | | | | |
| | 1,375 | | | Capital One Financial Corporation | | | 5.550% | | | | N/A (4) | | | | Baa3 | | | | 1,362,969 | |
| | 3,960 | | | Total Consumer Finance | | | | | | | | | | | | | | | 3,902,660 | |
| | | | | |
| | | | Electric Utilities – 0.3% | | | | | | | | | | | | |
| | | | | |
| | 1,785 | | | Electricite de France, 144A | | | 5.250% | | | | N/A (4) | | | | A– | | | | 1,787,231 | |
| | | | | |
| | | | Insurance – 1.6% | | | | | | | | | | | | |
| | | | | |
| | 1,500 | | | Allstate Corporation | | | 5.750% | | | | 8/15/53 | | | | Baa1 | | | | 1,584,375 | |
| | | | | |
| | 1,585 | | | Catlin Insurance Company Limited, 144A | | | 7.249% | | | | N/A (4) | | | | BBB+ | | | | 1,481,975 | |
| | | | | |
| | 1,895 | | | Principal Financial Group | | | 4.700% | | | | 5/15/55 | | | | Baa2 | | | | 1,885,525 | |
| | | | | |
| | 1,500 | | | Prudential Financial Inc. | | | 5.200% | | | | 3/15/44 | | | | BBB+ | | | | 1,485,750 | |
| | | | | |
| | 2,755 | | | ZFS Finance USA Trust V, 144A | | | 6.500% | | | | 5/09/37 | | | | A | | | | 2,865,200 | |
| | 9,235 | | | Total Insurance | | | | | | | | | | | | | | | 9,302,825 | |
| $ | 36,785 | | | Total $1,000 Par (or similar) Institutional Preferred (cost $35,956,994) | | | | | | | | | | | | | | | 36,798,035 | |
| | | | | |
Principal
Amount (000) | | | Description (1) | | | | | Optional Call
Provision (5) | | | Ratings (2) | | | Value | |
| | | | | |
| | | | MUNICIPAL BONDS – 1.1% | | | | | | | | | | | | | | | | |
| | | | | |
| | | | Illinois – 1.1% | | | | | | | | | | | | |
| | | | | |
| $ | 5,765 | | | Illinois State, General Obligation Bonds, Taxable Series 2011, 5.877%, 3/01/19 | | | | | | | No Opt. Call | | | | A– | | | $ | 6,211,787 | |
| $ | 5,765 | | | Total Municipal Bonds (cost $5,765,000) | | | | | | | | | | | | | | | 6,211,787 | |
| | | | | |
Principal
Amount (000) | | | Description (1) | | Coupon | | | Maturity | | | Ratings (2) | | | Value | |
| | | | | |
| | | | ASSET-BACKED AND MORTGAGE-BACKED SECURITIES – 21.5% | | | | | | | | | | | | |
| | | | | |
| $ | 3,116 | | | 321 Henderson Receivables LLC, Series 2010-3A | | | 3.820% | | | | 12/15/48 | | | | Aaa | | | $ | 3,274,663 | |
| | | | | |
| | 1,250 | | | American Homes 4 Rent, Series 2014-SFR1 | | | 2.350% | | | | 6/17/31 | | | | Baa2 | | | | 1,226,040 | |
| | | | | |
| | 1,612 | | | American Homes 4 Rent, Series 2014-SFR2 | | | 3.786% | | | | 10/17/36 | | | | Aaa | | | | 1,659,179 | |
| | | | | |
| | 3,165 | | | AmeriCold LLC Trust, Series 2010 | | | 6.811% | | | | 1/14/29 | | | | A+ | | | | 3,615,984 | |
Nuveen Core Plus Bond Fund (continued)
| | |
| Portfolio of Investments | | June 30, 2015 |
| | | | | | | | | | | | | | | | | | | | |
Principal
Amount (000) | | | Description (1) | | Coupon | | | Maturity | | | Ratings (2) | | | Value | |
| | | | | |
| | | | ASSET-BACKED AND MORTGAGE-BACKED SECURITIES (continued) | | | | | | | | | | | | |
| | | | | |
| $ | 568 | | | Bank of America Funding Trust, Mortgage Pass-Through Certificates, Series 2007-4 | | | 5.500% | | | | 6/25/37 | | | | C | | | $ | 138,278 | |
| | | | | |
| | 1,250 | | | Bayview Financial Mortgage Pass-Through Trust, Mortgage Pass-Through Certificate Series 2005-D | | | 5.500% | | | | 12/28/35 | | | | BB+ | | | | 1,231,964 | |
| | | | | |
| | 750 | | | CarFinance Capital Auto Trust, Automobile Receivables-Backed Notes, Series 2013-1, 144A | | | 3.450% | | | | 3/15/19 | | | | A2 | | | | 758,756 | |
| | | | | |
| | 2,000 | | | Commercial Mortgage Pass-Through Certificates, Series 2014-SAVA | | | 2.588% | | | | 6/15/34 | | | | A | | | | 2,000,460 | |
| | | | | |
| | 118 | | | Countrywide Alternative Loan Trust, Mortgage Pass-Through Certificates, Series 2004-J1 | | | 6.000% | | | | 2/25/34 | | | | AA+ | | | | 120,031 | |
| | | | | |
| | 1,139 | | | Countrywide Alternative Loan Trust, Mortgage Pass-Through Certificates, Series 2006-19CB | | | 6.000% | | | | 8/25/36 | | | | Caa3 | | | | 1,041,217 | |
| | | | | |
| | 875 | | | Countrywide Home Loan Mortgage Pass-Through Trust, Series 2004-2 | | | 2.379% | | | | 2/25/34 | | | | A | | | | 851,118 | |
| | | | | |
| | 258 | | | Countrywide Home Loans, Asset-Backed Certificates, Series 2003-SC1 | | | 2.441% | | | | 9/25/23 | | | | BB+ | | | | 252,566 | |
| | | | | |
| | 1,095 | | | Credit Suisse Commercial Mortgage Trust, 2014-ICE | | | 1.737% | | | | 4/15/27 | | | | A– | | | | 1,090,173 | |
| | | | | |
| | 2,327 | | | Credit Suisse First Boston Mortgage Securities Corporation, Mortgage-Backed Pass-Through Certificates, Series 2003-8 | | | 6.195% | | | | 4/25/33 | | | | A | | | | 2,228,548 | |
| | | | | |
| | 83 | | | Fannie Mae Mortgage Pool 250551 | | | 7.000% | | | | 5/01/26 | | | | Aaa | | | | 95,741 | |
| | | | | |
| | 362 | | | Fannie Mae Mortgage Pool 252255 | | | 6.500% | | | | 2/01/29 | | | | Aaa | | | | 420,217 | |
| | | | | |
| | 586 | | | Fannie Mae Mortgage Pool 254169 | | | 6.500% | | | | 12/01/31 | | | | Aaa | | | | 644,473 | |
| | | | | |
| | 626 | | | Fannie Mae Mortgage Pool 254379 | | | 7.000% | | | | 7/01/32 | | | | Aaa | | | | 739,651 | |
| | | | | |
| | 481 | | | Fannie Mae Mortgage Pool 254513 | | | 6.000% | | | | 10/01/22 | | | | Aaa | | | | 544,928 | |
| | | | | |
| | 1,287 | | | Fannie Mae Mortgage Pool 255575 | | | 5.500% | | | | 1/01/25 | | | | Aaa | | | | 1,443,872 | |
| | | | | |
| | 236 | | | Fannie Mae Mortgage Pool 256845 | | | 6.500% | | | | 8/01/37 | | | | Aaa | | | | 271,267 | |
| | | | | |
| | 809 | | | Fannie Mae Mortgage Pool 256852 | | | 6.000% | | | | 8/01/27 | | | | Aaa | | | | 917,380 | |
| | | | | |
| | 322 | | | Fannie Mae Mortgage Pool 256890 | | | 6.000% | | | | 9/01/37 | | | | Aaa | | | | 354,581 | |
| | | | | |
| | 69 | | | Fannie Mae Mortgage Pool 340798 | | | 7.000% | | | | 4/01/26 | | | | Aaa | | | | 76,509 | |
| | | | | |
| | 109 | | | Fannie Mae Mortgage Pool 545359 | | | 2.479% | | | | 3/01/31 | | | | Aaa | | | | 113,476 | |
| | | | | |
| | 212 | | | Fannie Mae Mortgage Pool 545813 | | | 7.000% | | | | 7/01/32 | | | | Aaa | | | | 255,081 | |
| | | | | |
| | 138 | | | Fannie Mae Mortgage Pool 545815 | | | 7.000% | | | | 7/01/32 | | | | Aaa | | | | 165,781 | |
| | | | | |
| | 860 | | | Fannie Mae Mortgage Pool 555798 | | | 6.500% | | | | 5/01/33 | | | | Aaa | | | | 992,832 | |
| | | | | |
| | 1,467 | | | Fannie Mae Mortgage Pool 555843 | | | 2.271% | | | | 8/01/30 | | | | Aaa | | | | 1,526,254 | |
| | | | | |
| | 23 | | | Fannie Mae Mortgage Pool 591038 | | | 7.000% | | | | 8/01/16 | | | | Aaa | | | | 23,219 | |
| | | | | |
| | 183 | | | Fannie Mae Mortgage Pool 673010 | | | 5.500% | | | | 12/01/17 | | | | Aaa | | | | 189,082 | |
| | | | | |
| | 1,036 | | | Fannie Mae Mortgage Pool 688330 | | | 6.000% | | | | 3/01/33 | | | | Aaa | | | | 1,175,708 | |
| | | | | |
| | 2,033 | | | Fannie Mae Mortgage Pool 709446 | | | 5.500% | | | | 7/01/33 | | | | Aaa | | | | 2,280,098 | |
| | | | | |
| | 264 | | | Fannie Mae Mortgage Pool 725553 | | | 2.277% | | | | 9/01/33 | | | | Aaa | | | | 279,871 | |
| | | | | |
| | 1,205 | | | Fannie Mae Mortgage Pool 735054 | | | 1.787% | | | | 11/01/34 | | | | Aaa | | | | 1,263,960 | |
| | | | | |
| | 1,505 | | | Fannie Mae Mortgage Pool 735273 | | | 6.500% | | | | 6/01/34 | | | | Aaa | | | | 1,728,715 | |
| | | | | |
| | 730 | | | Fannie Mae Mortgage Pool 745101 | | | 6.000% | | | | 4/01/32 | | | | Aaa | | | | 821,590 | |
| | | | | |
| | 184 | | | Fannie Mae Mortgage Pool 781776 | | | 6.000% | | | | 10/01/34 | | | | Aaa | | | | 210,200 | |
| | | | | |
| | 608 | | | Fannie Mae Mortgage Pool 885536 | | | 6.000% | | | | 8/01/36 | | | | Aaa | | | | 701,294 | |
| | | | | | | | | | | | | | | | | | | | |
Principal
Amount (000) | | | Description (1) | | Coupon | | | Maturity | | | Ratings (2) | | | Value | |
| | | | | |
| | | | ASSET-BACKED AND MORTGAGE-BACKED SECURITIES (continued) | | | | | | | | | | | | |
| | | | | |
| $ | 744 | | | Fannie Mae Mortgage Pool 900555 | | | 6.000% | | | | 9/01/36 | | | | Aaa | | | $ | 848,990 | |
| | | | | |
| | 2,475 | | | Fannie Mae Mortgage Pool 932323 | | | 4.500% | | | | 12/01/39 | | | | Aaa | | | | 2,682,146 | |
| | | | | |
| | — | (6) | | Fannie Mae Mortgage Pool 983077 | | | 5.000% | | | | 5/01/38 | | | | Aaa | | | | 278 | |
| | | | | |
| | — | (6) | | Fannie Mae Mortgage Pool 985344 | | | 5.500% | | | | 7/01/38 | | | | Aaa | | | | 167 | |
| | | | | |
| | 5,859 | | | Fannie Mae Mortgage Pool AB1959 | | | 4.000% | | | | 12/01/40 | | | | Aaa | | | | 6,241,421 | |
| | | | | |
| | 3,281 | | | Fannie Mae Mortgage Pool AC1877 | | | 4.500% | | | | 9/01/39 | | | | Aaa | | | | 3,553,489 | |
| | | | | |
| | 4,087 | | | Fannie Mae Mortgage Pool AD4375 | | | 5.000% | | | | 5/01/40 | | | | Aaa | | | | 4,517,372 | |
| | | | | |
| | 4,897 | | | Fannie Mae Mortgage Pool AE7265 | | | 4.000% | | | | 1/01/41 | | | | Aaa | | | | 5,217,915 | |
| | | | | |
| | 1,497 | | | Fannie Mae Mortgage Pool AL0160 | | | 4.500% | | | | 5/01/41 | | | | Aaa | | | | 1,623,068 | |
| | | | | |
| | 1,223 | | | Fannie Mae Mortgage Pool MA1028 | | | 4.000% | | | | 4/01/42 | | | | Aaa | | | | 1,300,671 | |
| | | | | |
| | 5 | | | Fannie Mae Real Estate Mortgage Investment Conduit, Pass-Through Certificates 1988-24 G | | | 7.000% | | | | 10/25/18 | | | | Aaa | | | | 5,573 | |
| | | | | |
| | 4 | | | Fannie Mae Real Estate Mortgage Investment Conduit, Pass-Through Certificates 1989-44 H | | | 9.000% | | | | 7/25/19 | | | | Aaa | | | | 4,035 | |
| | | | | |
| | 1 | | | Fannie Mae Real Estate Mortgage Investment Conduit, Pass-Through Certificates 1989-90 E | | | 8.700% | | | | 12/25/19 | | | | Aaa | | | | 1,251 | |
| | | | | |
| | 10 | | | Fannie Mae Real Estate Mortgage Investment Conduit, Pass-Through
Certificates 1990-102 J | | | 6.500% | | | | 8/25/20 | | | | Aaa | | | | 10,340 | |
| | | | | |
| | 72 | | | Fannie Mae Real Estate Mortgage Investment Conduit, Pass-Through
Certificates 1990-105 J | | | 6.500% | | | | 9/25/20 | | | | Aaa | | | | 76,910 | |
| | | | | |
| | 3 | | | Fannie Mae Real Estate Mortgage Investment Conduit, Pass-Through Certificates 1990-30 E | | | 6.500% | | | | 3/25/20 | | | | Aaa | | | | 3,577 | |
| | | | | |
| | 7 | | | Fannie Mae Real Estate Mortgage Investment Conduit, Pass-Through Certificates 1990-61 H | | | 7.000% | | | | 6/25/20 | | | | Aaa | | | | 7,680 | |
| | | | | |
| | 6 | | | Fannie Mae Real Estate Mortgage Investment Conduit, Pass-Through Certificates 1990-72 B | | | 9.000% | | | | 7/25/20 | | | | Aaa | | | | 7,113 | |
| | | | | |
| | 48 | | | Fannie Mae Real Estate Mortgage Investment Conduit, Pass-Through
Certificates 1991-134 Z | | | 7.000% | | | | 10/25/21 | | | | Aaa | | | | 52,812 | |
| | | | | |
| | 27 | | | Fannie Mae Real Estate Mortgage Investment Conduit, Pass-Through Certificates 1991-56 M | | | 6.750% | | | | 6/25/21 | | | | Aaa | | | | 28,864 | |
| | | | | |
| | 6 | | | Fannie Mae Real Estate Mortgage Investment Conduit, Pass-Through
Certificates 1992-120 C | | | 6.500% | | | | 7/25/22 | | | | Aaa | | | | 6,730 | |
| | | | | |
| | 236 | | | Fannie Mae Real Estate Mortgage Investment Conduit, Pass-Through Certificates 1996-35 Z | | | 7.000% | | | | 7/25/26 | | | | Aaa | | | | 266,083 | |
| | | | | |
| | 909 | | | Fannie Mae Real Estate Mortgage Investment Conduit, Pass-Through Certificates 2005-62 JE | | | 5.000% | | | | 6/25/35 | | | | Aaa | | | | 1,012,502 | |
| | | | | |
| | 943 | | | Fannie Mae REMIC Pass-Through Certificates 2003-W1 B1 | | | 4.323% | | | | 12/25/42 | | | | AAA | | | | 591,401 | |
| | | | | |
| | 5,000 | | | Fannie Mae TBA Mortgage Pool, (WI/DD) | | | 3.500% | | | | TBA | | | | Aaa | | | | 5,152,735 | |
| | | | | |
| | 2,235 | | | Fannie Mae TBA Mortgage Pool, (WI/DD) | | | 4.000% | | | | TBA | | | | Aaa | | | | 2,367,939 | |
| | | | | |
| | 3,000 | | | Fannie Mae TBA Mortgage Pool, (WI/DD) | | | 5.000% | | | | TBA | | | | Aaa | | | | 3,314,063 | |
| | | | | |
| | 1,934 | | | Fannie Mae, Connecticut Avenue Securities Series 2014-C01 | | | 1.791% | | | | 1/25/24 | | | | AA+ | | | | 1,944,959 | |
| | | | | |
| | 7 | | | Federal Home Loan Mortgage Corporation, REMIC 1022 J | | | 6.000% | | | | 12/15/20 | | | | Aaa | | | | 7,297 | |
| | | | | |
| | 16 | | | Federal Home Loan Mortgage Corporation, REMIC 1118 Z | | | 8.250% | | | | 7/15/21 | | | | Aaa | | | | 18,164 | |
| | | | | |
| | 23 | | | Federal Home Loan Mortgage Corporation, REMIC 162 F | | | 7.000% | | | | 5/15/21 | | | | Aaa | | | | 24,320 | |
Nuveen Core Plus Bond Fund (continued)
| | |
| Portfolio of Investments | | June 30, 2015 |
| | | | | | | | | | | | | | | | | | | | |
Principal
Amount (000) | | | Description (1) | | Coupon | | | Maturity | | | Ratings (2) | | | Value | |
| | | | | |
| | | | ASSET-BACKED AND MORTGAGE-BACKED SECURITIES (continued) | | | | | | | | | | | | |
| | | | | |
| $ | 11 | | | Federal Home Loan Mortgage Corporation, REMIC 1790 A | | | 7.000% | | | | 4/15/22 | | | | Aaa | | | $ | 11,080 | |
| | | | | |
| | 48 | | | Federal Home Loan Mortgage Corporation, REMIC 188 H | | | 7.000% | | | | 9/15/21 | | | | Aaa | | | | 51,806 | |
| | | | | |
| | 350 | | | Federal Home Loan Mortgage Corporation, REMIC 2704 JF | | | 0.737% | | | | 5/15/23 | | | | Aaa | | | | 350,766 | |
| | | | | |
| | 534 | | | Federal Home Loan Mortgage Corporation, REMIC 3591 FP | | | 0.787% | | | | 6/15/39 | | | | Aaa | | | | 539,889 | |
| | | | | |
| | 2 | | | Federal Home Loan Mortgage Corporation, REMIC 6 C | | | 9.050% | | | | 6/15/19 | | | | Aaa | | | | 2,188 | |
| | | | | |
| | 1,870 | | | Freddie Mac Gold Pool 1G2163 | | | 2.260% | | | | 9/01/37 | | | | Aaa | | | | 1,983,323 | |
| | | | | |
| | 321 | | | Freddie Mac Gold Pool 846984 | | | 1.975% | | | | 6/01/31 | | | | Aaa | | | | 340,355 | |
| | | | | |
| | 464 | | | Freddie Mac Gold Pool 847180 | | | 2.447% | | | | 3/01/30 | | | | Aaa | | | | 480,685 | |
| | | | | |
| | 319 | | | Freddie Mac Gold Pool 847190 | | | 2.418% | | | | 4/01/29 | | | | Aaa | | | | 332,367 | |
| | | | | |
| | 469 | | | Freddie Mac Gold Pool 847240 | | | 2.366% | | | | 7/01/30 | | | | Aaa | | | | 487,792 | |
| | | | | |
| | 311 | | | Freddie Mac Mortgage Pool, Various A15521 | | | 6.000% | | | | 11/01/33 | | | | Aaa | | | | 355,018 | |
| | | | | |
| | 514 | | | Freddie Mac Mortgage Pool, Various A17212 | | | 6.500% | | | | 7/01/31 | | | | Aaa | | | | 588,880 | |
| | | | | |
| | 349 | | | Freddie Mac Mortgage Pool, Various C00676 | | | 6.500% | | | | 11/01/28 | | | | Aaa | | | | 405,729 | |
| | | | | |
| | 119 | | | Freddie Mac Mortgage Pool, Various H09059 | | | 7.000% | | | | 8/01/37 | | | | Aaa | | | | 131,452 | |
| | | | | |
| | 157 | | | Freddie Mac Mortgage Pool, Various P10023 | | | 4.500% | | | | 3/01/18 | | | | Aaa | | | | 157,812 | |
| | | | | |
| | 426 | | | Freddie Mac Mortgage Pool, Various P10032 | | | 4.500% | | | | 5/01/18 | | | | Aaa | | | | 427,436 | |
| | | | | |
| | 1,000 | | | Freddie Mac Mortgage Trust, Multifamily Mortgage Pass-Through
Certificates, Series 2012-K711 | | | 3.562% | | | | 8/25/45 | | | | Aaa | | | | 1,036,373 | |
| | | | | |
| | 1,315 | | | Freddie Mac Mortgage Trust, Multifamily Mortgage Pass-Through
Certificates, Series 2013-K712 | | | 3.368% | | | | 5/25/45 | | | | Aaa | | | | 1,338,502 | |
| | | | | |
| | 58 | | | Freddie Mac Non Gold Participation Certificates | | | 2.397% | | | | 5/01/25 | | | | Aaa | | | | 60,893 | |
| | | | | |
| | 4,500 | | | Ginnie Mae Mortgage Pool, (WI/DD) | | | 4.000% | | | | TBA | | | | Aaa | | | | 4,768,858 | |
| | | | | |
| | 542 | | | Goldman Sachs Mortgage Securities Corporation, Mortgage Pass-Through Certificates, Series
2005-RP2 1A2 | | | 7.500% | | | | 3/25/35 | | | | B1 | | | | 596,220 | |
| | | | | |
| | 594 | | | Goldman Sachs Mortgage Securities Corporation, Mortgage Pass-Through Certificates, Series
2005-RP3 1A2 | | | 7.500% | | | | 9/25/35 | | | | B1 | | | | 657,837 | |
| | | | | |
| | 4,212 | | | Government National Mortgage Association Pool 4946 | | | 4.500% | | | | 2/20/41 | | | | Aaa | | | | 4,596,056 | |
| | | | | |
| | 133 | | | Government National Mortgage Association Pool 537699 | | | 7.500% | | | | 11/15/30 | | | | Aaa | | | | 150,742 | |
| | | | | |
| | 1 | | | Government National Mortgage Association Pool 8259 | | | 1.625% | | | | 8/20/23 | | | | Aaa | | | | 536 | |
| | | | | |
| | 682 | | | IndyMac INDX Mortgage Loan Trust, Pass-Through Certificates, Series 2005-AR1 | | | 2.492% | | | | 3/25/35 | | | | BBB+ | | | | 681,164 | |
| | | | | |
| | 3,090 | | | Invitation Homes Trust 2014-SFR1 | | | 2.786% | | | | 6/17/31 | | | | Baa2 | | | | 3,061,498 | |
| | | | | |
| | 607 | | | Lehman Mortgage Trust, Mortgage Pass-Through Certificates, Series 2008-6 | | | 5.517% | | | | 7/25/47 | | | | BB+ | | | | 619,399 | |
| | | | | |
| | 1,904 | | | Master Resecuritization Trust 2009-1 | | | 6.000% | | | | 10/25/36 | | | | A | | | | 2,006,470 | |
| | | | | |
| | 1,767 | | | Mid-State Capital Corporation Trust Notes, Series
2005-1 | | | 5.745% | | | | 1/15/40 | | | | AA | | | | 1,899,724 | |
| | | | | |
| | 1,250 | | | ML_CFC Commercial Mortgage Trust, Pass-Through Certificates, Series 2007-8 | | | 5.881% | | | | 8/12/49 | | | | BB | | | | 1,284,269 | |
| | | | | |
| | 526 | | | Mortgage Asset Securitization Transaction Inc., Alternative Loan Trust Mortgage Pass-Through Certificates Series 2004-1 | | | 7.000% | | | | 1/25/34 | | | | BBB– | | | | 544,164 | |
| | | | | |
| | 4,185 | | | National Credit Union Administration Guaranteed Structured Collateral Notes | | | 2.900% | | | | 10/29/20 | | | | AAA | | | | 4,293,909 | |
| | | | | |
| | 1,654 | | | RBSSP Resecuritization Trust, Series 2012-8 1A1 | | | 0.370% | | | | 10/26/36 | | | | N/R | | | | 1,590,427 | |
| | | | | |
| | 234 | | | Sequoia Mortgage Trust, Mortgage Pass-Through Certificates, Series 2011-1 | | | 4.125% | | | | 2/25/41 | | | | AAA | | | | 235,598 | |
| | | | | | | | | | | | | | | | | | | | |
Principal
Amount (000) | | | Description (1) | | Coupon | | | Maturity | | | Ratings (2) | | | Value | |
| | | | | |
| | | | ASSET-BACKED AND MORTGAGE-BACKED SECURITIES (continued) | | | | | | | | | | | | |
| | | | | |
| $ | 215 | | | Structured Adjustable Rate Mortgage Loan Trust, Mortgage Pass-Through Certificates, Series 2004-11 | | | 2.518% | | | | 8/25/34 | | | | N/R | | | $ | 213,648 | |
| | | | | |
| | 126 | | | U.S. Small Business Administration Guaranteed Participating Securities Participation Certificates, Series 2006-P10B | | | 5.681% | | | | 8/10/16 | | | | Aaa | | | | 130,154 | |
| | | | | |
| | 4,677 | | | United States Department of Veterans, Affairs, Guaranteed REMIC Pass-Through Certificates, Vendee Mortgage Trust, Series 2011-1 | | | 3.750% | | | | 2/15/35 | | | | Aaa | | | | 4,880,347 | |
| | | | | |
| | 3,024 | | | Wachovia Mortgage Loan Trust LLC, Mortgage Pass-Through Certificates, Series 2005-B | | | 2.530% | | | | 10/20/35 | | | | D | | | | 2,628,996 | |
| | | | | |
| | 605 | | | Wells Fargo Mortagge Backed Securities Trust, Mortgage Pass-Through Certificate Series 2007-2 | | | 5.750% | | | | 3/25/37 | | | | Caa2 | | | | 589,808 | |
| $ | 116,661 | | | Total Asset-Backed and Mortgage-Backed Securities (cost $117,148,301) | | | | | | | | | | | | | | | 122,126,792 | |
| | | | | |
Principal
Amount (000) (7) | | | Description (1) | | Coupon | | | Maturity | | | Ratings (2) | | | Value | |
| | | | | |
| | | | SOVEREIGN DEBT – 5.0% | | | | | | | | | | | | | | | | |
| | | | | |
| | | | Costa Rica – 0.2% | | | | | | | | | | | | |
| | | | | |
| $ | 1,000 | | | Republic of Costa Rica, 144A | | | 7.000% | | | | 4/04/44 | | | | Ba1 | | | $ | 967,500 | |
| | | | | |
| | | | Indonesia – 0.4% | | | | | | | | | | | | |
| | | | | |
| | 1,300 | | | Republic of Indonesia, 144A | | | 4.875% | | | | 5/05/21 | | | | Baa3 | | | | 1,379,690 | |
| | | | | |
| | 1,000 | | | Republic of Indonesia, 144A | | | 5.875% | | | | 1/15/24 | | | | Baa3 | | | | 1,105,000 | |
| | | | Total Indonesia | | | | | | | | | | | | | | | 2,484,690 | |
| | | | | |
| | | | Mexico – 1.6% | | | | | | | | | | | | |
| | | | | |
| | 798 | MXN | | Mexico Bonos de DeSarrollo | | | 8.500% | | | | 12/13/18 | | | | A | | | | 5,661,685 | |
| | | | | |
| | 450 | MXN | | Mexico Bonos de DeSarrollo | | | 8.000% | | | | 12/07/23 | | | | A | | | | 3,235,302 | |
| | | | Total Mexico | | | | | | | | | | | | | | | 8,896,987 | |
| | | | | |
| | | | South Africa – 2.8% | | | | | | | | | | | | |
| | | | | |
| | 3,365 | | | Republic of South Africa, (3) | | | 5.875% | | | | 9/16/25 | | | | Baa2 | | | | 3,727,895 | |
| | | | | |
| | 69,500 | ZAR | | Republic of South Africa | | | 7.000% | | | | 2/28/31 | | | | BBB+ | | | | 4,864,314 | |
| | | | | |
| | 76,750 | ZAR | | Republic of South Africa | | | 10.500% | | | | 12/21/26 | | | | BBB+ | | | | 7,343,170 | |
| | | | Total South Africa | | | | | | | | | | | | | | | 15,935,379 | |
| | | | Total Sovereign Debt (cost $31,199,700) | | | | | | | | | | | | | | | 28,284,556 | |
| | | | Total Long-Term Investments (cost $548,721,913) | | | | | | | | | | | | | | | 560,336,084 | |
| | | | | |
| Shares | | | Description (1) | | Coupon | | | | | | | | | Value | |
| | | | |
| | | | INVESTMENTS PURCHASED WITH COLLATERAL FROM SECURITIES LENDING – 12.3% | | | | | | | | | | | | | |
| | | | | |
| | | | Money Market Funds – 12.3% | | | | | | | | | | | | |
| | | | | |
| | 69,688,572 | | | Mount Vernon Securities Lending Trust Prime Portfolio, (9) | | | 0.234% (8) | | | | | | | | | | | $ | 69,688,572 | |
| | | | Total Investments Purchased with Collateral from Securities Lending (cost $69,688,572) | | | | | | | | | | | | 69,688,572 | |
Nuveen Core Plus Bond Fund (continued)
| | |
| Portfolio of Investments | | June 30, 2015 |
| | | | | | | | | | | | | | | | |
| Shares | | | Description (1) | | Coupon | | | | | | | Value | |
| | | | | |
| | | | SHORT-TERM INVESTMENTS – 3.0% | | | | | | | | | | | | |
| | | | | |
| | | | Money Market Funds – 3.0% | | | | | | | | | | |
| | | | | |
| | 16,998,878 | | | First American Treasury Obligations Fund, Class Z | | | 0.000% (8) | | | | | | | $ | 16,998,878 | |
| | | | Total Short-Term Investments (cost $16,998,878) | | | | | | | | | | | 16,998,878 | |
| | | | Total Investments (cost $635,409,363) – 114.2% | | | | | | | | | | | 647,023,534 | |
| | | | Other Assets Less Liabilities – (14.2)% (10) | | | | | | | | | | | (80,544,488 | ) |
| | | | Net Assets – 100% | | | | | | | | | | $ | 566,479,046 | |
Investments in Derivatives as of June 30, 2015
Forward Foreign Currency Exchange Contracts outstanding:
| | | | | | | | | | | | | | | | | | | | |
| Counterparty | | Currency Contracts to Deliver | | Notional Amount
(Local Currency) | | | In Exchange
For Currency | | Notional Amount
(Local Currency) | | | Settlement
Date | | | Unrealized
Appreciation
Depreciation)
(U.S. Dollars) | |
| Bank of America | | Euro | | | 5,400,000 | | | U.S. Dollar | | | 6,117,282 | | | | 8/31/15 | | | $ | 91,763 | |
| Citigroup | | Mexican Peso | | | 61,800,000 | | | U.S. Dollar | | | 4,040,087 | | | | 7/31/15 | | | | 117,350 | |
| Citigroup | | Mexican Peso | | | 17,000,000 | | | U.S. Dollar | | | 1,091,755 | | | | 7/31/15 | | | | 12,685 | |
| Deutsche Bank | | Euro | | | 2,700,000 | | | U.S. Dollar | | | 2,946,510 | | | | 7/31/15 | | | | (64,877 | ) |
| Deutsche Bank | | Japanese Yen | | | 1,030,000,000 | | | U.S. Dollar | | | 8,503,436 | | | | 7/31/15 | | | | 84,082 | |
| Deutsche Bank | | U.S. Dollar | | | 5,871,134 | | | British Pound Sterling | | | 3,780,000 | | | | 7/22/15 | | | | 67,251 | |
| Deutsche Bank | | U.S. Dollar | | | 5,384,376 | | | Japanese Yen | | | 665,000,000 | | | | 7/31/15 | | | | 51,421 | |
| Deutsche Bank | | U.S. Dollar | | | 2,938,808 | | | Japanese Yen | | | 365,000,000 | | | | 7/31/15 | | | | 44,749 | |
| Goldman Sachs | | Canadian Dollar | | | 1,776,000 | | | U.S. Dollar | | | 1,438,325 | | | | 8/31/15 | | | | 17,607 | |
| Morgan Stanley | | South African Rand | | | 60,000,000 | | | U.S. Dollar | | | 4,721,742 | | | | 7/31/15 | | | | (182,161 | ) |
| Morgan Stanley | | U.S. Dollar | | | 56,549 | | | South African Rand | | | 691,000 | | | | 7/31/15 | | | | (73 | ) |
| Nomura Securities | | South African Rand | | | 92,500,000 | | | U.S. Dollar | | | 7,523,016 | | | | 8/31/15 | | | | 3,865 | |
| | | | | | | | | | | | | | | | | | | $ | 243,662 | |
Interest Rate Swaps outstanding:
| | | | | | | | | | | | | | | | | | | | | | | | | | | | | | | | |
| Counterparty | | Notional
Amount | | | Fund
Pay/Receive
Floating
Rate | | | Floating Rate Index | | | Fixed Rate
(Annualized) | | | Fixed Rate
Payment
Frequency | | | Termi
nation
Date | | | Value | | | Unrealized
Appreciation
(Depreciation) | |
JPMorgan | | $ | 12,000,000 | | | | Receive | | | | 3-Month USD
-LIBOR-ICE | | | | 2.078 | % | | | Semi-Annually | | | | 2/19/23 | | | $ | 26,517 | | | $ | 26,517 | |
JPMorgan* | | | 15,000,000 | | | | Receive | | | | 3-Month USD
-LIBOR-ICE | | | | 2.354 | | | | Semi-Annually | | | | 5/21/25 | | | | 75,790 | | | | 75,790 | |
JPMorgan* | | | 17,000,000 | | | | Receive | | | | 3-Month USD
-LIBOR-ICE | | | | 2.739 | | | | Semi-Annually | | | | 11/21/23 | | | | (636,011 | ) | | | (636,461 | ) |
Morgan Stanley* | | | 18,000,000 | | | | Receive | | | | 3-Month USD
-LIBOR-ICE | | | | 2.743 | | | | Semi-Annually | | | | 4/15/24 | | | | (690,564 | ) | | | (690,564 | ) |
| | | $ | 62,000,000 | | | | | | | | | | | | | | | | | | | | | | | $ | (1,224,268 | ) | | $ | (1,224,718 | ) |
| * | Citigroup is the clearing broker for this transaction. |
Futures Contracts outstanding:
| | | | | | | | | | | | | | | | | | | | | | | | |
| Description | | Contract
Position | | | Number of
Contracts | | | Contract
Expiration | | | Notional
Amount at
Value* | | | Variation Margin Receivable/ (Payable) | | | Unrealized
Appreciation
(Depreciation) | |
U.S. Treasury 5-Year Note | | | Short | | | | (84 | ) | | | 9/15 | | | $ | (10,017,657 | ) | | $ | 3,282 | | | $ | (2,679 | ) |
U.S. Treasury 10-Year Note | | | Short | | | | (450 | ) | | | 9/15 | | | | (56,777,344 | ) | | | 9,603 | | | | 299,422 | |
U.S. Treasury Long Bond | | | Long | | | | 50 | | | | 9/15 | | | | 7,542,188 | | | | (3,125 | ) | | | (139,143 | ) |
U.S. Treasury Ultra Bond | | | Long | | | | 24 | | | | 9/15 | | | | 3,697,500 | | | | (1,500 | ) | | | (66,870 | ) |
| | | | | | | | | | | | | | | $ | (55,555,313 | ) | | $ | 8,260 | | | $ | 90,730 | |
| * | The aggregate Notional Amount at Value of long and short positions is $11,239,688 and $(66,795,001), respectively. |
For Fund portfolio compliance purposes, the Fund’s industry classifications refer to any one or more of the industry sub-classifications used by one or more widely recognized market indexes or ratings group indexes, and/or as defined by Fund management. This definition may not apply for purposes of this report, which may combine industry sub-classifications into sectors for reporting ease.
| (1) | All percentages shown in the Portfolio of Investments are based on net assets. |
| (2) | Ratings (not covered by the report of independent registered public accounting firm): Using the highest of Standard & Poor’s Group (“Standard & Poor’s”), Moody’s Investors Service, Inc. (“Moody’s”) or Fitch, Inc. (“Fitch”) rating. Ratings below BBB by Standard & Poor’s, Baa by Moody’s or BBB by Fitch are considered to be below investment grade. Holdings designated N/R are not rated by any of these national rating agencies. |
| (3) | Investment, or a portion of investment, is out on loan for securities lending. The total value of the securities out on loan as of the end of the reporting period was $66,574,107. |
| (4) | Perpetual security. Maturity date is not applicable. |
| (5) | Optional Call Provisions (not covered by the report of independent registered public accounting firm): Dates (month and year) and prices of the earliest optional call or redemption. There may be other call provisions at varying prices at later dates. |
| (6) | Principal Amount (000) rounds to less than $1,000. |
| (7) | Principal Amount (000) denominated in U.S. Dollars, unless otherwise noted. |
| (8) | The rate shown is the annualized seven-day effective yield as of the end of the reporting period. |
| (9) | The Fund may loan securities representing up to one third of the fair value of its total assets (which includes collateral for securities on loan) to broker-dealers, banks and other institutions. The Fund maintains collateral equal to at least 100% of the fair value of the securities loaned. The cash collateral received by the Fund is invested in this money market fund. See Notes to Financial Statements, Note 3 – Portfolio Securities and Investments in Derivatives, Securities Lending for more information. |
| (10) | Other assets less liabilities includes the unrealized appreciation (depreciation) of the over-the-counter derivatives as presented on the Statement of Assets and Liabilities. The unrealized appreciation (depreciation) of exchange-cleared and exchange-traded derivatives is recognized as part of the receivable or payable for variation margin as presented on the Statement of Assets and Liabilities. |
| GDR | Global Depositary Receipt. |
| Reg S | Regulation S allows U.S. companies to sell securities to persons or entities located outside of the United States without registering those securities with the Securities and Exchange Commission. Specifically, Regulation S provides a safe harbor from the registration requirements of the Securities Act for the offers and sales of securities by both foreign and domestic issuers that are made outside the United States. |
| TBA | To be announced. Maturity date not known prior to settlement of this transaction. |
| 144A | Investment is exempt from registration under Rule 144A of the Securities Act of 1933, as amended. These investments may only be resold in transactions exempt from registration, which are normally those transactions with qualified institutional buyers. |
| USD-LIBOR-ICE | United States Dollar-London Inter-Bank Offered Rate Intercontinental Exchange. |
| (WI/DD) | Investment, or portion of investment, purchased on a when-issued or delayed delivery basis. |
See accompanying notes to financial statements.
Nuveen Inflation Protected Securities Fund
| | |
| Portfolio of Investments | | June 30, 2015 |
| | | | | | | | | | | | | | | | | | | | |
| Shares | | | Description (1) | | Coupon | | | | | | Ratings (2) | | | Value | |
| | | | | |
| | | | LONG-TERM INVESTMENTS – 96.3% | | | | | | | | | | | | | | | | |
| | | | | |
| | | | CONVERTIBLE PREFFERED SECURITIES – 0.1% | | | | | | | | | | | | | | | | |
| | | | | |
| | | | Banks �� 0.1% | | | | | | | | | | | | |
| | | | | |
| | 200 | | | Bank of America Corporation | | | 7.250% | | | | | | | | BB+ | | | $ | 222,400 | |
| | | | | |
| | | | Metals & Mining – 0.0% | | | | | | | | | | | | |
| | | | | |
| | 5,000 | | | ArcelorMittal | | | 6.000% | | | | | | | | BB– | | | | 78,050 | |
| | | | Total Convertible Preferred Securities (cost $279,350) | | | | | | | | | | | | | | | 300,450 | |
| | | | | |
| Shares | | | Description (1) | | Coupon | | | | | | Ratings (2) | | | Value | |
| | | | | |
| | | | $25 PAR (OR SIMILAR) RETAIL PREFERRED – 0.1% | | | | | | | | | | | | | | | | |
| | | | | |
| | | | Capital Markets – 0.1% | | | | | | | | | | | | |
| | | | | |
| | 15,000 | | | UBS Preferred Funding Trust IV | | | 0.890% | | | | | | | | BB+ | | | $ | 285,000 | |
| | | | Total $25 Par (or similar) Retail Preferred (cost $241,200) | | | | | | | | | | | | | | | 285,000 | |
| | | | | |
Principal
Amount (000) | | | Description (1) | | Coupon | | | Maturity | | | Ratings (2) | | | Value | |
| | | | | |
| | | | CORPORATE BONDS – 9.9% | | | | | | | | | | | | | | | | |
| | | | | |
| | | | Aerospace & Defense – 0.0% | | | | | | | | | | | | |
| | | | | |
| $ | 200 | | | Bombardier Inc., 144A, (3) | | | 6.000% | | | | 10/15/22 | | | | B+ | | | $ | 177,500 | |
| | | | | |
| | | | Airlines – 0.3% | | | | | | | | | | | | |
| | | | | |
| | 519 | | | American Airlines Group Inc., 144A | | | 5.500% | | | | 10/01/19 | | | | B+ | | | | 522,893 | |
| | | | | |
| | 450 | | | American Airlines Inc., Pass-Through Trust 2013-2B, 144A | | | 5.600% | | | | 7/15/20 | | | | BBB– | | | | 465,959 | |
| | 969 | | | Total Airlines | | | | | | | | | | | | | | | 988,852 | |
| | | | | |
| | | | Auto Components – 0.3% | | | | | | | | | | | | |
| | | | | |
| | 300 | | | American & Axle Manufacturing Inc. | | | 6.625% | | | | 10/15/22 | | | | BB– | | | | 315,000 | |
| | | | | |
| | 250 | | | MPG Holdco I Inc. | | | 7.375% | | | | 10/15/22 | | | | B+ | | | | 266,250 | |
| | | | | |
| | 400 | | | Schaeffler Holding Finance BV, 144A | | | 6.250% | | | | 11/15/19 | | | | B1 | | | | 421,500 | |
| | | | | |
| | 300 | | | Tenneco Inc. | | | 5.375% | | | | 12/15/24 | | | | BB+ | | | | 308,250 | |
| | 1,250 | | | Total Auto Components | | | | | | | | | | | | | | | 1,311,000 | |
| | | | | |
| | | | Automobiles – 0.1% | | | | | | | | | | | | |
| | | | | |
| | 465 | | | General Motors Corporation | | | 4.000% | | | | 4/01/25 | | | | BBB– | | | | 456,460 | |
| | | | | |
| | | | Banks – 0.2% | | | | | | | | | | | | |
| | | | | |
| | 200 | | | Banco do Nordeste do Brasil, 144A | | | 3.625% | | | | 11/09/15 | | | | BBB– | | | | 200,500 | |
| | | | | |
| | 385 | | | CIT Group Inc., 144A, (3) | | | 5.500% | | | | 2/15/19 | | | | BB+ | | | | 401,363 | |
| | | | | |
| | 170 | | | CIT Group Inc. | | | 5.000% | | | | 8/01/23 | | | | BB+ | | | | 167,450 | |
| | 755 | | | Total Banks | | | | | | | | | | | | | | | 769,313 | |
| | | | | |
| | | | Building Products – 0.1% | | | | | | | | | | | | |
| | | | | |
| | 300 | | | Hardwoods Acquisition Inc., 144A | | | 7.500% | | | | 8/01/21 | | | | B | | | | 289,500 | |
| | | | | |
| | 250 | | | Owens Corning Incorporated | | | 4.200% | | | | 12/15/22 | | | | BBB– | | | | 253,392 | |
| | 550 | | | Total Building Products | | | | | | | | | | | | | | | 542,892 | |
| | | | | | | | | | | | | | | | | | | | |
Principal
Amount (000) | | | Description (1) | | Coupon | | | Maturity | | | Ratings (2) | | | Value | |
| | | | | |
| | | | Chemicals – 0.3% | | | | | | | | | | | | |
| | | | | |
| $ | 250 | | | Hexion Inc. | | | 6.625% | | | | 4/15/20 | | | | B3 | | | $ | 229,375 | |
| | | | | |
| | 250 | | | NOVA Chemicals Corporation, 144A, (3) | | | 5.250% | | | | 8/01/23 | | | | BBB– | | | | 253,750 | |
| | | | | |
| | 500 | | | NOVA Chemicals Corporation, 144A, (3) | | | 5.000% | | | | 5/01/25 | | | | BBB– | | | | 501,875 | |
| | | | | |
| | 200 | | | PolyOne Corporation | | | 5.250% | | | | 3/15/23 | | | | BB | | | | 198,000 | |
| | 1,200 | | | Total Chemicals | | | | | | | | | | | | | | | 1,183,000 | |
| | | | | |
| | | | Commercial Services & Supplies – 0.4% | | | | | | | | | | | | |
| | | | | |
| | 250 | | | Clean Harbors Inc. | | | 5.250% | | | | 8/01/20 | | | | BB+ | | | | 253,750 | |
| | | | | |
| | 547 | | | Covanta Energy Corporation, Synthetic Letter of Credit | | | 6.375% | | | | 10/01/22 | | | | Ba3 | | | | 572,299 | |
| | | | | |
| | 500 | | | R.R. Donnelley & Sons Company, (3) | | | 7.625% | | | | 6/15/20 | | | | BB– | | | | 562,500 | |
| | 1,297 | | | Total Commercial Services & Supplies | | | | | | | | | | | | | | | 1,388,549 | |
| | | | | |
| | | | Construction & Engineering – 0.1% | | | | | | | | | | | | |
| | | | | |
| | 500 | | | AECOM Technology Corporation, 144A | | | 5.750% | | | | 10/15/22 | | | | BB– | | | | 506,250 | |
| | | | | |
| | | | Construction Materials – 0.2% | | | | | | | | | | | | |
| | | | | |
| | 300 | | | Cemex SAB de CV, 144A, (3) | | | 5.700% | | | | 1/11/25 | | | | BB– | | | | 286,110 | |
| | | | | |
| | 700 | | | Norbord Inc., 144A | | | 5.375% | | | | 12/01/20 | | | | Ba2 | | | | 696,500 | |
| | 1,000 | | | Total Construction Materials | | | | | | | | | | | | | | | 982,610 | |
| | | | | |
| | | | Containers & Packaging – 0.0% | | | | | | | | | | | | |
| | | | | |
| | 175 | | | Graphic Packaging International Inc. | | | 4.875% | | | | 11/15/22 | | | | BB+ | | | | 175,875 | |
| | | | | |
| | | | Diversified Financial Services – 0.2% | | | | | | | | | | | | |
| | | | | |
| | 500 | | | Fly Leasing Limited | | | 6.750% | | | | 12/15/20 | | | | BB | | | | 515,000 | |
| | | | | |
| | 225 | | | Nationstar Mortgage LLC Capital Corporation, (3) | | | 7.875% | | | | 10/01/20 | | | | B+ | | | | 224,438 | |
| | 725 | | | Total Diversified Financial Services | | | | | | | | | | | | | | | 739,438 | |
| | | | | |
| | | | Diversified Telecommunication Services – 1.0% | | | | | | | | | | | | |
| | | | | |
| | 200 | | | CenturyLink Inc. | | | 6.750% | | | | 12/01/23 | | | | BB+ | | | | 200,625 | |
| | | | | |
| | 250 | | | CyrusOne LP Finance | | | 6.375% | | | | 11/15/22 | | | | B+ | | | | 258,750 | |
| | | | | |
| | 275 | | | Frontier Communications Corporation, (3) | | | 6.250% | | | | 9/15/21 | | | | BB | | | | 250,250 | |
| | | | | |
| | 3,060 | | | SBA Tower Trust, 144A | | | 3.598% | | | | 4/15/43 | | | | BBB | | | | 3,050,364 | |
| | 3,785 | | | Total Diversified Telecommunication Services | | | | | | | | | | | | | | | 3,759,989 | |
| | | | | |
| | | | Electric Utilities – 0.2% | | | | | | | | | | | | |
| | | | | |
| | 570 | | | Comision Federal de Electricidad of the United States of Mexico, 144A | | | 4.875% | | | | 5/26/21 | | | | BBB+ | | | | 595,650 | |
| | | | | |
| | 200 | | | FirstEnergy Corporation | | | 4.250% | | | | 3/15/23 | | | | Baa3 | | | | 201,248 | |
| | 770 | | | Total Electric Utilities | | | | | | | | | | | | | | | 796,898 | |
| | | | | |
| | | | Electronic Equipment, Instruments & Components – 0.1% | | | | | | | | | | | | |
| | | | | |
| | 200 | | | Anixter Inc. | | | 5.125% | | | | 10/01/21 | | | | BB+ | | | | 203,500 | |
| | | | | |
| | | | Energy Equipment & Services – 0.1% | | | | | | | | | | | | |
| | | | | |
| | 500 | | | Regency Energy Partners Finance | | | 6.500% | | | | 7/15/21 | | | | BBB– | | | | 526,875 | |
Nuveen Inflation Protected Securities Fund (continued)
| | |
| Portfolio of Investments | | June 30, 2015 |
| | | | | | | | | | | | | | | | | | | | |
Principal
Amount (000) | | | Description (1) | | Coupon | | | Maturity | | | Ratings (2) | | | Value | |
| | | | | |
| | | | Food Products – 0.1% | | | | | | | | | | | | |
| | | | | |
| $ | 200 | | | JBS Investments GmbH, 144A, (3) | | | 7.250% | | | | 4/03/24 | | | | BB+ | | | $ | 207,000 | |
| | | | | |
| | 300 | | | Pilgrim’s Pride Corporation, 144A, (3) | | | 5.750% | | | | 3/15/25 | | | | BB+ | | | | 303,000 | |
| | 500 | | | Total Food Products | | | | | | | | | | | | | | | 510,000 | |
| | | | | |
| | | | Gas Utilities – 0.1% | | | | | | | | | | | | |
| | | | | |
| | 250 | | | AmeriGas Finance LLC | | | 7.000% | | | | 5/20/22 | | | | Ba2 | | | | 265,000 | |
| | | | | |
| | | | Health Care Providers & Services – 1.0% | | | | | | | | | | | | |
| | | | | |
| | 1,700 | | | Catholic Health Initiatives | | | 1.600% | | | | 11/01/17 | | | | A+ | | | | 1,697,491 | |
| | | | | |
| | 200 | | | Community Health Systems, Inc. | | | 5.125% | | | | 8/01/21 | | | | BB | | | | 203,750 | |
| | | | | |
| | 500 | | | HCA Inc. | | | 4.250% | | | | 10/15/19 | | | | BBB– | | | | 511,875 | |
| | | | | |
| | 1,715 | | | Mayo Clinic Rochester | | | 3.774% | | | | 11/15/43 | | | | AA | | | | 1,578,570 | |
| | 4,115 | | | Total Health Care Providers & Services | | | | | | | | | | | | | | | 3,991,686 | |
| | | | | |
| | | | Hotels, Restaurants & Leisure – 0.1% | | | | | | | | | | | | |
| | | | | |
| | 400 | | | Wynn Macau Limited, 144A, (3) | | | 5.250% | | | | 10/15/21 | | | | BB | | | | 378,000 | |
| | | | | |
| | | | Household Durables – 0.4% | | | | | | | | | | | | |
| | | | | |
| | 450 | | | Brookfield Residential Properties Inc., 144A | | | 6.500% | | | | 12/15/20 | | | | BB– | | | | 447,939 | |
| | | | | |
| | 335 | | | K. Hovnanian Enterprises Inc., 144A | | | 7.250% | | | | 10/15/20 | | | | Ba3 | | | | 341,700 | |
| | | | | |
| | 400 | | | Rialto Holdings LLC-Rialto Corporation, 144A | | | 7.000% | | | | 12/01/18 | | | | B | | | | 416,000 | |
| | | | | |
| | 250 | | | Standard Pacific Corporation | | | 5.875% | | | | 11/15/24 | | | | BB– | | | | 257,500 | |
| | 1,435 | | | Total Household Durables | | | | | | | | | | | | | | | 1,463,139 | |
| | | | | |
| | | | Independent Power & Renewable Electricity Producers – 0.3% | | | | | | | | | | | | |
| | | | | |
| | 275 | | | AES Corporation, (3) | | | 7.375% | | | | 7/01/21 | | | | BB | | | | 301,813 | |
| | | | | |
| | 200 | | | AES Corporation | | | 5.500% | | | | 3/15/24 | | | | BB | | | | 192,500 | |
| | | | | |
| | 500 | | | Calpine Corporation | | | 5.375% | | | | 1/15/23 | | | | BB– | | | | 491,250 | |
| | 975 | | | Total Independent Power & Renewable Electricity Producers | | | | | | | | | | | | | | | 985,563 | |
| | | | | |
| | | | Insurance – 0.1% | | | | | | | | | | | | |
| | | | | |
| | 500 | | | Genworth Holdings Inc. | | | 4.800% | | | | 2/15/24 | | | | Ba1 | | | | 436,250 | |
| | | | | |
| | | | Machinery – 0.1% | | | | | | | | | | | | |
| | | | | |
| | 200 | | | BlueLine Rental Finance Corporation, 144A | | | 7.000% | | | | 2/01/19 | | | | B+ | | | | 205,500 | |
| | | | | |
| | | | Media – 0.9% | | | | | | | | | | | | |
| | | | | |
| | 400 | | | Altice S.A, 144A | | | 7.750% | | | | 5/15/22 | | | | B | | | | 387,000 | |
| | | | | |
| | 300 | | | Cablevision Systems Corporation | | | 5.875% | | | | 9/15/22 | | | | B1 | | | | 291,000 | |
| | | | | |
| | 200 | | | Charter Communications, CCO Holdings LLC | | | 5.125% | | | | 2/15/23 | | | | BB– | | | | 195,000 | |
| | | | | |
| | 300 | | | Dish DBS Corporation | | | 4.250% | | | | 4/01/18 | | | | BB– | | | | 305,250 | |
| | | | | |
| | 200 | | | Midcontinent Communications Finance Company, 144A | | | 6.250% | | | | 8/01/21 | | | | B– | | | | 204,000 | |
| | | | | |
| | 400 | | | Numericable Group SA, 144A | | | 4.875% | | | | 5/15/19 | | | | Ba3 | | | | 396,000 | |
| | | | | |
| | 200 | | | Numericable Group SA, 144A | | | 6.000% | | | | 5/15/22 | | | | Ba3 | | | | 197,125 | |
| | | | | |
| | 350 | | | Sinclair Television Group | | | 6.375% | | | | 11/01/21 | | | | B+ | | | | 361,375 | |
| | | | | | | | | | | | | | | | | | | | |
Principal
Amount (000) | | | Description (1) | | Coupon | | | Maturity | | | Ratings (2) | | | Value | |
| | | | | |
| | | | Media (continued) | | | | | | | | | | | | |
| | | | | |
| $ | 200 | | | Sirius XM Radio Inc., 144A | | | 4.250% | | | | 5/15/20 | | | | BB | | | $ | 199,000 | |
| | | | | |
| | 500 | | | Unitymedia KabelBW GmbH, 144A | | | 6.125% | | | | 1/15/25 | | | | B | | | | 522,500 | |
| | | | | |
| | 500 | | | WMG Acquisition Group, 144A | | | 6.000% | | | | 1/15/21 | | | | B+ | | | | 510,000 | |
| | 3,550 | | | Total Media | | | | | | | | | | | | | | | 3,568,250 | |
| | | | | |
| | | | Metals & Mining – 0.4% | | | | | | | | | | | | |
| | | | | |
| | 250 | | | ArcelorMittal | | | 7.000% | | | | 2/25/22 | | | | Ba1 | | | | 269,375 | |
| | | | | |
| | 250 | | | Coeur d’Alene Mines Corporation, (3) | | | 7.875% | | | | 2/01/21 | | | | B | | | | 211,875 | |
| | | | | |
| | 200 | | | Eldorado Gold Corporation, 144A | | | 6.125% | | | | 12/15/20 | | | | BB | | | | 198,000 | |
| | | | | |
| | 475 | | | Lundin Mining Corporation, 144A | | | 7.500% | | | | 11/01/20 | | | | Ba2 | | | | 511,813 | |
| | | | | |
| | 225 | | | Steel Dynamics, Inc., (3) | | | 5.500% | | | | 10/01/24 | | | | BB+ | | | | 225,000 | |
| | 1,400 | | | Total Metals & Mining | | | | | | | | | | | | | | | 1,416,063 | |
| | | | | |
| | | | Oil, Gas & Consumable Fuels – 1.0% | | | | | | | | | | | | |
| | | | | |
| | 250 | | | Calumet Specialty Products | | | 7.625% | | | | 1/15/22 | | | | B+ | | | | 255,000 | |
| | | | | |
| | 490 | | | Chesapeake Energy Corporation | | | 6.125% | | | | 2/15/21 | | | | BB+ | | | | 460,600 | |
| | | | | |
| | 400 | | | Concho Resources Inc. | | | 5.500% | | | | 10/01/22 | | | | BB+ | | | | 398,000 | |
| | | | | |
| | 175 | | | EV Energy Partners LP / EV Energy Finance Corporation | | | 8.000% | | | | 4/15/19 | | | | B– | | | | 162,750 | |
| | | | | |
| | 250 | | | Martin Mid-Stream Partners LP Finance | | | 7.250% | | | | 2/15/21 | | | | B– | | | | 245,625 | |
| | | | | |
| | 400 | | | Newfield Exploration Company | | | 5.375% | | | | 1/01/26 | | | | BBB– | | | | 396,000 | |
| | | | | |
| | 500 | | | Rose Rock Midstream LP / Rose Rock Finance Corporation | | | 5.625% | | | | 7/15/22 | | | | B1 | | | | 488,750 | |
| | | | | |
| | 200 | | | Sabine Pass Liquefaction LLC | | | 5.625% | | | | 2/01/21 | | | | BB+ | | | | 204,000 | |
| | | | | |
| | 200 | | | Sanchez Energy Corporation, (3) | | | 7.750% | | | | 6/15/21 | | | | B– | | | | 199,000 | |
| | | | | |
| | 150 | | | Targa Resources Inc. | | | 4.250% | | | | 11/15/23 | | | | BB+ | | | | 138,750 | |
| | | | | |
| | 270 | | | Tesoro Logistics LP Finance Corporation, 144A | | | 6.250% | | | | 10/15/22 | | | | BB | | | | 280,800 | |
| | | | | |
| | 500 | | | Western Refining Inc. | | | 6.250% | | | | 4/01/21 | | | | B+ | | | | 503,750 | |
| | 3,785 | | | Total Oil, Gas & Consumable Fuels | | | | | | | | | | | | | | | 3,733,025 | |
| | | | | |
| | | | Paper & Forest Products – 0.0% | | | | | | | | | | | | |
| | | | | |
| | 175 | | | Louisiana Pacific Corporation | | | 7.500% | | | | 6/01/20 | | | | BB | | | | 186,375 | |
| | | | | |
| | | | Personal Products – 0.1% | | | | | | | | | | | | |
| | | | | |
| | 200 | | | Albea Beauty Holdings SA, 144A | | | 8.375% | | | | 11/01/19 | | | | B | | | | 214,000 | |
| | | | | |
| | | | Pharmaceuticals – 0.1% | | | | | | | | | | | | |
| | | | | |
| | 260 | | | Endo Finance LLC, 144A | | | 5.750% | | | | 1/15/22 | | | | B1 | | | | 263,250 | |
| | | | | |
| | 250 | | | VP Escrow Corporation, 144A | | | 6.375% | | | | 10/15/20 | | | | B1 | | | | 263,281 | |
| | 510 | | | Total Pharmaceuticals | | | | | | | | | | | | | | | 526,531 | |
| | | | | |
| | | | Real Estate Investment Trust – 0.1% | | | | | | | | | | | | |
| | | | | |
| | 200 | | | Gaming and Leisure Products Inc., GLP Capital LP Financing II Inc. | | | 4.375% | | | | 11/01/18 | | | | BBB– | | | | 205,250 | |
| | | | | |
| | | | Real Estate Management & Development – 0.1% | | | | | | | | | | | | |
| | | | | |
| | 300 | | | Mattamy Group Corporation, 144A | | | 6.500% | | | | 11/15/20 | | | | BB | | | | 289,500 | |
Nuveen Inflation Protected Securities Fund (continued)
| | |
| Portfolio of Investments | | June 30, 2015 |
| | | | | | | | | | | | | | | | | | | | |
Principal
Amount (000) | | | Description (1) | | Coupon | | | Maturity | | | Ratings (2) | | | Value | |
| | | | | |
| | | | Road & Rail – 0.0% | | | | | | | | | | | | |
| | | | | |
| $ | 175 | | | Hertz Corporation, (3) | | | 7.375% | | | | 1/15/21 | | | | B | | | $ | 182,219 | |
| | | | | |
| | | | Software – 0.1% | | | | | | | | | | | | |
| | | | | |
| | 400 | | | Open Text Corporation, 144A | | | 5.625% | | | | 1/15/23 | | | | BB | | | | 396,000 | |
| | | | | |
| | | | Specialty Retail – 0.3% | | | | | | | | | | | | |
| | | | | |
| | 500 | | | Best Buy Co., Inc. | | | 5.000% | | | | 8/01/18 | | | | Baa2 | | | | 527,500 | |
| | | | | |
| | 475 | | | The Men’s Warehouse Inc., (3) | | | 7.000% | | | | 7/01/22 | | | | B2 | | | | 508,250 | |
| | 975 | | | Total Specialty Retail | | | | | | | | | | | | | | | 1,035,750 | |
| | | | | |
| | | | Technology Hardware, Storage & Peripherals – 0.2% | | | | | | | | | | | | |
| | | | | |
| | 250 | | | Hewlett Packard Company | | | 3.750% | | | | 12/01/20 | | | | A– | | | | 257,627 | |
| | | | | |
| | 500 | | | NCR Corporation | | | 5.000% | | | | 7/15/22 | | | | BB | | | | 506,875 | |
| | 750 | | | Total Technology Hardware, Storage & Peripherals | | | | | | | | | | | | | | | 764,502 | |
| | | | | |
| | | | Textiles, Apparel & Luxury Goods – 0.1% | | | | | | | | | | | | |
| | | | | |
| | 300 | | | Levi Strauss & Company, 144A | | | 5.000% | | | | 5/01/25 | | | | BB | | | | 290,250 | |
| | | | | |
| | | | Trading Companies & Distributors – 0.1% | | | | | | | | | | | | |
| | | | | |
| | 500 | | | United Rentals North America Inc. | | | 7.375% | | | | 5/15/20 | | | | BB– | | | | 533,495 | |
| | | | | |
| | | | Wireless Telecommunication Services – 0.6% | | | | | | | | | | | | |
| | | | | |
| | 200 | | | Altice Financing SA, 144A | | | 6.625% | | | | 2/15/23 | | | | BB– | | | | 198,560 | |
| | | | | |
| | 225 | | | Frontier Communications Corporation | | | 7.625% | | | | 4/15/24 | | | | BB | | | | 198,563 | |
| | | | | |
| | 150 | | | Inmarsat Finance PLC, 144A | | | 4.875% | | | | 5/15/22 | | | | BB+ | | | | 144,750 | |
| | | | | |
| | 200 | | | Millicom International Cellular SA, 144A | | | 6.625% | | | | 10/15/21 | | | | BB+ | | | | 205,500 | |
| | | | | |
| | 200 | | | Millicom International Cellular SA, 144A | | | 6.000% | | | | 3/15/25 | | | | BB+ | | | | 193,000 | |
| | | | | |
| | 200 | | | Softbank Corporation, 144A, (3) | | | 4.500% | | | | 4/15/20 | | | | BB+ | | | | 200,750 | |
| | | | | |
| | 200 | | | Sprint Corporation | | | 7.250% | | | | 9/15/21 | | | | B+ | | | | 195,000 | |
| | | | | |
| | 200 | | | Sprint Nextel Corporation, 144A | | | 7.000% | | | | 3/01/20 | | | | BB | | | | 217,539 | |
| | | | | |
| | 400 | | | Telecom Italia SpA, 144A, (3) | | | 5.303% | | | | 5/30/24 | | | | BBB– | | | | 398,499 | |
| | | | | |
| | 400 | | | T-Mobile USA Inc. | | | 6.731% | | | | 4/28/22 | | | | BB | | | | 416,999 | |
| | 2,375 | | | Total Wireless Telecommunication Services | | | | | | | | | | | | | | | 2,369,160 | |
| $ | 38,311 | | | Total Corporate Bonds (cost $39,044,556) | | | | | | | | | | | | | | | 38,454,509 | |
| | | | | |
Principal
Amount (000) | | | Description (1) | | Coupon | | | Maturity | | | Ratings (2) | | | Value | |
| | | | | |
| | | | $1,000 PAR (OR SIMILAR) INSTITUTIONAL PREFERRED – 0.1% | | | | | | | | | | | | | | | | |
| | | | | |
| | | | Banks – 0.1% | | | | | | | | | | | | |
| | | | | |
| $ | 200 | | | Societe Generale, 144A | | | 1.021% | | | | N/A (4) | | | | BB+ | | | $ | 184,500 | |
| | | | | |
| | | | Capital Markets – 0.0% | | | | | | | | | | | | |
| | | | | |
| | 200 | | | Goldman Sachs Capital II | | | 4.000% | | | | N/A (4) | | | | Ba1 | | | | 152,250 | |
| $ | 400 | | | Total $1,000 Par (or similar) Institutional Preferred (cost $348,152) | | | | | | | | | | | | | | | 336,750 | |
| | | | | | | | | | | | | | | | | | | | |
Principal
Amount (000) | | | Description (1) | | | | | Optional Call
Provisions (5) | | | Ratings (2) | | | Value | |
| | | | | |
| | | | MUNICIPAL BONDS – 0.5% | | | | | | | | | | | | | | | | |
| | | | | |
| | | | Maryland – 0.3% | | | | | | | | | | | | |
| | | | | |
| $ | 1,250 | | | Baltimore County, Maryland, General Obligation Bonds, Taxable Series 2012, 0.951%, 8/01/17 | | | | | | | No Opt. Call | | | | AAA | | | $ | 1,238,775 | |
| | | | | |
| | | | Ohio – 0.2% | | | | | | | | | | | | |
| | | | | |
| | 820 | | | Hamilton County, Ohio, Sewer System Revenue Bonds, Metropolitan Sewer District of Greater Cincinnati, Refunding Series 2013B, 1.233%, 12/01/16 | | | | | | | No Opt. Call | | | | AA+ | | | | 826,281 | |
| $ | 2,070 | | | Total Municipal Bonds (cost $2,070,000) | | | | | | | | | | | | | | | 2,065,056 | |
| | | | | |
Principal
Amount (000) | | | Description (1) | | Coupon | | | Maturity | | | Ratings (2) | | | Value | |
| | | | |
| | | | U.S. GOVERNMENT AND AGENCY OBLIGATIONS – 81.0% | | | | | | | | | | |
| | | | | |
| $ | 6,153 | | | U.S. Treasury Bonds | | | 3.875% | | | | 4/15/29 | | | | Aaa | | | $ | 8,714,733 | |
| | | | | |
| | 16,256 | | | U.S. Treasury Inflation Indexed Obligations | | | 0.125% | | | | 4/15/17 | | | | Aaa | | | | 16,476,551 | |
| | | | | |
| | 14,826 | | | U.S. Treasury Inflation Indexed Obligations | | | 0.125% | | | | 4/15/18 | | | | Aaa | | | | 15,058,642 | |
| | | | | |
| | 3,951 | | | U.S. Treasury Inflation Indexed Obligations | | | 2.125% | | | | 1/15/19 | | | | Aaa | | | | 4,301,600 | |
| | | | | |
| | 5,771 | | | U.S. Treasury Inflation Indexed Obligations | | | 0.125% | | | | 4/15/19 | | | | Aaa | | | | 5,845,446 | |
| | | | | |
| | 4,989 | | | U.S. Treasury Inflation Indexed Obligations | | | 1.375% | | | | 1/15/20 | | | | Aaa | | | | 5,333,750 | |
| | | | | |
| | 9,699 | | | U.S. Treasury Inflation Indexed Obligations | | | 0.125% | | | | 4/15/20 | | | | Aaa | | | | 9,777,217 | |
| | | | | |
| | 13,773 | | | U.S. Treasury Inflation Indexed Obligations | | | 1.250% | | | | 7/15/20 | | | | Aaa | | | | 14,736,766 | |
| | | | | |
| | 21,740 | | | U.S. Treasury Inflation Indexed Obligations | | | 1.125% | | | | 1/15/21 | | | | Aaa | | | | 22,994,881 | |
| | | | | |
| | 12,608 | | | U.S. Treasury Inflation Indexed Obligations | | | 0.625% | | | | 7/15/21 | | | | Aaa | | | | 13,013,432 | |
| | | | | |
| | 24,566 | | | U.S. Treasury Inflation Indexed Obligations | | | 0.125% | | | | 1/15/22 | | | | Aaa | | | | 24,345,027 | |
| | | | | |
| | 15,834 | | | U.S. Treasury Inflation Indexed Obligations | | | 0.125% | | | | 7/15/22 | | | | Aaa | | | | 15,714,164 | |
| | | | | |
| | 23,489 | | | U.S. Treasury Inflation Indexed Obligations | | | 0.125% | | | | 1/15/23 | | | | Aaa | | | | 23,073,848 | |
| | | | | |
| | 22,311 | | | U.S. Treasury Inflation Indexed Obligations | | | 0.375% | | | | 7/15/23 | | | | Aaa | | | | 22,391,228 | |
| | | | | |
| | 15,687 | | | U.S. Treasury Inflation Indexed Obligations | | | 0.625% | | | | 1/15/24 | | | | Aaa | | | | 15,953,895 | |
| | | | | |
| | 13,576 | | | U.S. Treasury Inflation Indexed Obligations | | | 0.125% | | | | 7/15/24 | | | | Aaa | | | | 13,240,127 | |
| | | | | |
| | 9,941 | | | U.S. Treasury Inflation Indexed Obligations | | | 2.375% | | | | 1/15/25 | | | | Aaa | | | | 11,694,775 | |
| | | | | |
| | 21,077 | | | U.S. Treasury Inflation Indexed Obligations | | | 0.250% | | | | 1/15/25 | | | | Aaa | | | | 20,673,773 | |
| | | | | |
| | 6,229 | | | U.S. Treasury Inflation Indexed Obligations | | | 2.000% | | | | 1/15/26 | | | | Aaa | | | | 7,150,200 | |
| | | | | |
| | 4,752 | | | U.S. Treasury Inflation Indexed Obligations | | | 2.375% | | | | 1/15/27 | | | | Aaa | | | | 5,685,191 | |
| | | | | |
| | 1,688 | | | U.S. Treasury Inflation Indexed Obligations | | | 1.750% | | | | 1/15/28 | | | | Aaa | | | | 1,912,649 | |
| | | | | |
| | 1,792 | | | U.S. Treasury Inflation Indexed Obligations | | | 3.625% | | | | 4/15/28 | | | | Aaa | | | | 2,441,571 | |
| | | | | |
| | 4,072 | | | U.S. Treasury Inflation Indexed Obligations | | | 2.500% | | | | 1/15/29 | | | | Aaa | | | | 5,018,287 | |
| | | | | |
| | 4,543 | | | U.S. Treasury Inflation Indexed Obligations | | | 2.125% | | | | 2/15/40 | | | | Aaa | | | | 5,594,434 | |
| | | | | |
| | 5,451 | | | U.S. Treasury Inflation Indexed Obligations | | | 2.125% | | | | 2/15/41 | | | | Aaa | | | | 6,760,960 | |
| | | | | |
| | 12,905 | | | U.S. Treasury Inflation Indexed Obligations | | | 0.750% | | | | 2/15/42 | | | | Aaa | | | | 11,859,728 | |
| | | | | |
| | 5,115 | | | U.S. Treasury Inflation Indexed Obligations | | | 0.625% | | | | 2/15/43 | | | | Aaa | | | | 4,534,390 | |
| | | | | |
| | 1,218 | | | U.S. Treasury Inflation Indexed Obligations | | | 1.375% | | | | 2/15/44 | | | | Aaa | | | | 1,300,459 | |
Nuveen Inflation Protected Securities Fund (continued)
| | |
| Portfolio of Investments | | June 30, 2015 |
| | | | | | | | | | | | | | | | | | | | |
Principal
Amount (000) | | | Description (1) | | Coupon | | | Maturity | | | Ratings (2) | | | Value | |
| | | | | |
| | | | U.S. GOVERNMENT AND AGENCY OBLIGATIONS (continued) | | | | | | | | | | | | |
| | | | | |
| $ | 703 | | | U.S. Treasury Inflation Indexed Obligations | | | 0.750% | | | | 2/15/45 | | | | Aaa | | | $ | 642,445 | |
| $ | 304,715 | | | Total U.S. Government and Agency Obligations (cost $314,048,645) | | | | | | | | | | | | | | | 316,240,169 | |
| | | | | |
Principal
Amount (000) | | | Description (1) | | Coupon | | | Maturity | | | Ratings (2) | | | Value | |
| | | | | |
| | | | ASSET-BACKED AND MORTGAGE-BACKED SECURITIES – 3.8% | | | | | | | | | | | | | | | | |
| | | | | |
| $ | 2,996 | | | Colony Anerican Homes Trust 2014-1A | | | 1.400% | | | | 5/17/31 | | | | Aaa | | | $ | 2,979,787 | |
| | | | | |
| | 2,000 | | | Commercial Mortgage Pass-Through Certificates Series 2012-CR4 | | | 1.801% | | | | 10/15/45 | | | | AAA | | | | 2,011,494 | |
| | | | | |
| | 640 | | | Credit Suisse Commercial Mortgage Trust, 2014-ICE | | | 1.737% | | | | 4/15/27 | | | | A– | | | | 637,179 | |
| | | | | |
| | 680 | | | DBUBS Mortgage Trust, Commercial Mortgage Pass-Through Certificates, Series 2011-LC3A | | | 3.642% | | | | 8/10/44 | | | | Aaa | | | | 692,374 | |
| | | | | |
| | 680 | | | Freddie Mac Mortgage Trust, Multifamily Mortgage Pass-Through Certificates, Series 2013-K712 | | | 3.368% | | | | 5/25/45 | | | | Aaa | | | | 692,153 | |
| | | | | |
| | 2,600 | | | Greenwich Capital Commercial Funding Corporation, Commercial Mortgage Pass-Through Certificates, Series 2007-GG11 | | | 5.736% | | | | 12/10/49 | | | | AAA | | | | 2,759,312 | |
| | | | | |
| | 34 | | | JPMorgan Chase Commercial Mortgage Securities Corporation, Commercial Mortgage Pass-Through Certificates, Series 2010-C1 | | | 3.853% | | | | 6/15/43 | | | | Aaa | | | | 33,586 | |
| | | | | |
| | 2,955 | | | JPMorgan JPMBB Commercial Mortgage Securities Trust, Pass-Through Certificates, Series 2013-C12 | | | 3.664% | | | | 7/15/45 | | | | AAA | | | | 3,076,034 | |
| | | | | |
| | 45 | | | Sequoia Mortgage Trust, Mortgage Pass-Through Certificates, Series 2011-1 | | | 4.125% | | | | 2/25/41 | | | | AAA | | | | 45,328 | |
| | | | | |
| | 2,025 | | | Wells Fargo – Royal Bank of Scotland Commercial Mortgage Trust, Series 2012-C10 A3 | | | 2.875% | | | | 12/15/45 | | | | Aaa | | | | 2,029,666 | |
| $ | 14,655 | | | Total Asset-Backed and Mortgage-Backed Securities (cost $15,122,711) | | | | | | | | | | | | | | | 14,956,913 | |
| | | | | |
| Shares | | | Description (1), (6) | | | | | | | | | | | Value | |
| | | | | |
| | | | INVESTMENT COMPANIES – 0.2% | | | | | | | | | | | | | | | | |
| | | | | |
| | 10,500 | | | Blackrock Credit Allocation Income Trust IV | | | | | | | | | | | | | | $ | 133,035 | |
| | | | | |
| | 5,000 | | | Invesco Dynamic Credit Opportunities Fund | | | | | | | | | | | | | | | 58,050 | |
| | | | | |
| | 35,000 | | | Pimco Income Strategy Fund | | | | | | | | | | | | | | | 380,100 | |
| | | | | |
| | 5,000 | | | Pioneer Floating Rate Trust | | | | | | | | | | | | | | | 56,900 | |
| | | | Total Investment Companies (cost $667,217) | | | | | | | | | | | | | | | 628,085 | |
| | | | | |
Principal
Amount (000) | | | Description (1) | | Coupon | | | Maturity | | | Ratings (2) | | | Value | |
| | | | | |
| | | | SOVEREIGN DEBT – 0.6% | | | | | | | | | | | | | | | | |
| | | | | |
| | | | Canada – 0.5% | | | | | | | | | | | | |
| | | | | |
| $ | 1,500 | | | Quebec Province | | | 7.500% | | | | 7/15/23 | | | | Aa2 | | | $ | 1,991,664 | |
| | | | | |
| | | | Poland – 0.1% | | | | | | | | | | | | |
| | | | | |
| | 250 | | | Republic of Poland | | | 6.375% | | | | 7/15/19 | | | | A2 | | | | 288,875 | |
| $ | 1,750 | | | Total Sovereign Debt (cost $2,249,151) | | | | | | | | | | | | | | | 2,280,539 | |
| | | | Total Long-Term Investments (cost $374,070,982) | | | | | | | | | | | | | | | 375,547,471 | |
| | | | | | | | | | | | | | | | |
| Shares | | | Description (1) | | Coupon | | | | | | | Value | |
| | | | |
| | | | INVESTMENTS PURCHASED WITH COLLATERAL FROM SECURITIES LENDING – 1.4% | | | | | | | | | |
| | | | | |
| | | | Money Market Funds – 1.4% | | | | | | | | | | |
| | | | | |
| | 5,539,700 | | | Mount Vernon Securities Lending Trust Prime Portfolio, (8) | | | 0.234% (7) | | | | | | | $ | 5,539,700 | |
| | | | Total Investments Purchased with Collateral from Securities Lending (cost $5,539,700) | | | | | | | | | | | 5,539,700 | |
| | | | | |
| Shares | | | Description (1) | | Coupon | | | | | | | Value | |
| | | | | |
| | | | SHORT-TERM INVESTMENTS – 3.0% | | | | | | | | | | | | |
| | | | | |
| | | | Money Market Funds – 3.0% | | | | | | | | | | |
| | | | | |
| | 11,665,461 | | | First American Treasury Obligations Fund, Class Z | | | 0.000% (7) | | | | | | | $ | 11,665,461 | |
| | | | Total Short-Term Investments (cost $11,665,461) | | | | | | | | | | | 11,665,461 | |
| | | | Total Investments (cost $391,276,143) – 100.7% | | | | | | | | | | | 392,752,632 | |
| | | | Other Assets Less Liabilities – (0.7)% (9) | | | | | | | | | | | (2,571,287 | ) |
| | | | Net Assets – 100% | | | | | | | | | | $ | 390,181,345 | |
Investments in Derivatives as of June 30, 2015
Interest Rate Swaps outstanding:
| | | | | | | | | | | | | | | | | | | | | | | | | | | | | | | | |
| Counterparty | | Notional
Amount | | | Fund
Pay/Receive
Floating Rate | | | Floating
Rate Index | | | Fixed Rate
(Annualized) | | | Fixed Rate
Payment
Frequency | | | Termination
Date | | | Value | | | Unrealized
Appreciation
(Depreciation) | |
JPMorgan* | | $ | 3,500,000 | | | | Receive | | | | 3-Month USD
-LIBOR-ICE | | | | 2.739 | % | | | Semi-Annually | | | | 11/21/23 | | | $ | (130,943 | ) | | $ | (131,302 | ) |
JPMorgan* | | | 10,000,000 | | | | Receive | | | | 3-Month USD
-LIBOR-ICE | | | | 2.354 | | | | Semi-Annually | | | | 5/21/25 | | | | 50,526 | | | | 50,526 | |
| | | $ | 13,500,000 | | | | | | | | | | | | | | | | | | | | | | | $ | (80,417 | ) | | $ | (80,776 | ) |
| * | Citigroup is the clearing broker for this transaction. |
Futures Contracts outstanding:
| | | | | | | | | | | | | | | | | | | | | | | | |
| Description | | Contract
Position | | | Number of
Contracts | | | Contract
Expiration | | | Notional
Amount at
Value | | | Variation Margin
Receivable/
Payable | | | Unrealized
Appreciation
(Depreciation) | |
U.S. Treasury 5-Year Note | | | Short | | | | (292 | ) | | | 9/15 | | | $ | (34,823,281 | ) | | $ | 18,248 | | | $ | (29,849 | ) |
U.S. Treasury 10-Year Note | | | Long | | | | 356 | | | | 9/15 | | | | 44,917,187 | | | | (11,125 | ) | | | (43,038 | ) |
| | | | | | | | | | | | | | | $ | 10,093,906 | | | $ | 7,123 | | | $ | (72,887 | ) |
Nuveen Inflation Protected Securities Fund (continued)
| | |
| Portfolio of Investments | | June 30, 2015 |
For Fund portfolio compliance purposes, the Fund’s industry classifications refer to any one or more of the industry sub-classifications used by one or more widely recognized market indexes or ratings group indexes, and/or as defined by Fund management. This definition may not apply for purposes of this report, which may combine industry sub-classifications into sectors for reporting ease.
| (1) | All percentages shown in the Portfolio of Investments are based on net assets. |
| (2) | Ratings (not covered by the report of independent registered public accounting firm): Using the highest of Standard & Poor’s Group (“Standard & Poor’s”), Moody’s Investors Service, Inc. (“Moody’s”) or Fitch, Inc. (“Fitch”) rating. Ratings below BBB by Standard & Poor’s, Baa by Moody’s or BBB by Fitch are considered to be below investment grade. Holdings designated N/R are not rated by any of these national rating agencies. |
| (3) | Investment, or a portion of investment, is out on loan for securities lending. The total value of the securities out on loan as of the end of the reporting period was $5,295,254. |
| (4) | Perpetual security. Maturity date is not applicable. |
| (5) | Optional Call Provisions (not covered by the report of independent registered public accounting firm): Dates (month and year) and prices of the earliest optional call or redemption. There may be other call provisions at varying prices at later dates. Certain mortgage-backed securities may be subject to periodic principal paydowns. |
| (6) | A copy of the most recent financial statements for the investment companies in which the Fund invests can be obtained directly from the Securities and Exchange Commission (SEC) on its website at http://www.sec.gov. |
| (7) | The rate shown is the annualized seven-day effective yield as of the end of the reporting period. |
| (8) | The Fund may loan securities representing up to one third of the fair value of its total assets (which includes collateral for securities on loan) to broker-dealers, banks and other institutions. The Fund maintains collateral equal to at least 100% of the fair value of the securities loaned. The cash collateral received by the Fund is invested in this money market fund. See Notes to Financial Statements, Note 3 – Portfolio Securities and Investments in Derivatives, Securities Lending for more information. |
| (9) | Other assets less liabilities includes the unrealized appreciation (depreciation) of the over-the-counter derivatives as presented on the Statement of Assets and Liabilities. The unrealized appreciation (depreciation) of exchange-cleared and exchange-traded derivatives is recognized as part of the receivable or payable for variation margin as presented on the Statement of Assets and Liabilities. |
| 144A | Investment is exempt from registration under Rule 144A of the Securities Act of 1933, as amended. These investments may only be resold in transactions exempt from registration, which are normally those transactions with qualified institutional buyers. |
| USD-LIBOR-ICE | United States Dollar-London Inter-Bank Offered Rate Intercontinental Exchange. |
See accompanying notes to financial statements.
Nuveen Intermediate Government Bond Fund
| | |
| Portfolio of Investments | | June 30, 2015 |
| | | | | | | | | | | | | | | | | | | | |
Principal
Amount (000) | | | Description (1) | | Coupon | | | Maturity | | | Ratings (2) | | | Value | |
| | | | | |
| | | | LONG-TERM INVESTMENTS – 98.9% | | | | | | | | | | | | | | | | |
| | | | | |
| | | | CORPORATE BONDS – 0.5% | | | | | | | | | | | | | | | | |
| | | | | |
| | | | Health Care Providers & Services – 0.5% | | | | | | | | | | | | | | | | |
| | | | | |
| $ | 400 | | | Catholic Health Initiatives | | | 1.600% | | | | 11/01/17 | | | | A+ | | | $ | 399,410 | |
| $ | 400 | | | Total Corporate Bonds (cost $399,884) | | | | | | | | | | | | | | | 399,410 | |
| | | | | |
Principal
Amount (000) | | | Description (1) | | | | | Optional Call
Provisions (3) | | | Ratings (2) | | | Value | |
| | | | | |
| | | | MUNICIPAL BONDS – 3.7% | | | | | | | | | | | | | | | | |
| | | | | |
| | | | Maryland – 0.8% | | | | | | | | | | | | | | | | |
| | | | | |
| $ | 570 | | | Baltimore County, Maryland, General Obligation Bonds, Taxable Series 2012, 0.554%, 8/01/15 | | | | | | | No Opt. Call | | | | AAA | | | $ | 569,875 | |
| | | | | |
| | | | Louisiana – 0.7% | | | | | | | | | | | | | | | | |
| | | | | |
| | 500 | | | Louisiana Local Government Environmental Facilities and Community Development Authority, System Restoration Revenue Bonds, Louisiana Utilities Restoration Corporation Project/EGSL, Series 2010, 3.220%, 2/01/21 | | | | | | | No Opt. Call | | | | AAA | | | | 517,495 | |
| | | | | |
| | | | Ohio – 2.2% | | | | | | | | | | | | | | | | |
| | | | | |
| | 145 | | | Akron, Ohio, General Obligation Bonds, Refunding Various Purpose Series 2014B, 0.950%, 12/01/16 | | | | | | | No Opt. Call | | | | AA– | | | | 145,128 | |
| | | | | |
| | 345 | | | Columbus, Ohio, General Obligation Bonds, Various Purpose, Taxable Series 2014C, 3.000%, 2/15/19 | | | | | | | No Opt. Call | | | | AAA | | | | 361,039 | |
| | | | | |
| | 285 | | | Hamilton County, Ohio, Sewer System Revenue Bonds, Metropolitan Sewer District of Greater Cincinnati, Refunding Series 2013B, 1.233%, 12/01/16 | | | | | | | No Opt. Call | | | | AA+ | | | | 287,183 | |
| | | | | |
| | 845 | | | Ohio State, General Obligation Bonds, Higher Education, Build America Bond Series 2010E, 3.328%, 8/01/17 - AGM Insured | | | | | | | No Opt. Call | | | | AA+ | | | | 884,537 | |
| | 1,620 | | | Total Ohio | | | | | | | | | | | | | | | 1,677,887 | |
| $ | 2,690 | | | Total Municipal Bonds (cost $2,763,815) | | | | | | | | | | | | | | | 2,765,257 | |
| | | | | |
Principal
Amount (000) | | | Description (1) | | Coupon | | | Maturity | | | Ratings (2) | | | Value | |
| | | | | |
| | | | U.S. GOVERNMENT AND AGENCY OBLIGATIONS – 48.1% | | | | | | | | | | | | | | | | |
| | | | | |
| $ | 340 | | | Fannie Mae Notes | | | 1.000% | | | | 4/30/18 | | | | Aaa | | | $ | 337,116 | |
| | | | | |
| | 770 | | | Fannie Mae Notes | | | 1.125% | | | | 7/20/18 | | | | Aaa | | | | 769,416 | |
| | | | | |
| | 1,000 | | | Fannie Mae Notes | | | 1.250% | | | | 9/27/18 | | | | Aaa | | | | 997,689 | |
| | | | | |
| | 1,535 | | | Fannie Mae Notes | | | 1.500% | | | | 6/22/20 | | | | Aaa | | | | 1,516,796 | |
| | | | | |
| | 840 | | | Fannie Mae Notes, (4) | | | 1.625% | | | | 1/21/20 | | | | Aaa | | | | 838,836 | |
| | | | | |
| | 790 | | | Federal Farm Credit Bank Discount Notes | | | 1.030% | | | | 5/11/18 | | | | Aaa | | | | 789,848 | |
| | | | | |
| | 940 | | | Federal Farm Credit Banks, Consolidated Systemwide Notes | | | 0.500% | | | | 8/23/16 | | | | Aaa | | | | 941,016 | |
| | | | | |
| | 360 | | | Federal Farm Credit Banks, Consolidated Systemwide Notes | | | 1.750% | | | | 4/01/21 | | | | Aaa | | | | 352,903 | |
Nuveen Intermediate Government Bond Fund (continued)
| | |
| Portfolio of Investments | | June 30, 2015 |
| | | | | | | | | | | | | | | | | | | | |
Principal
Amount (000) | | | Description (1) | | Coupon | | | Maturity | | | Ratings (2) | | | Value | |
| | | | | |
| | | | U.S. GOVERNMENT AND AGENCY OBLIGATIONS (continued) | | | | | | | | | | | | | | | | |
| | | | | |
| $ | 865 | | | Federal Farm Credit Banks, Consolidated Systemwide Notes | | | 4.875% | | | | 1/17/17 | | | | Aaa | | | $ | 920,965 | |
| | | | | |
| | 1,000 | | | Federal Home Loan Bank Bonds | | | 0.875% | | | | 3/10/17 | | | | Aaa | | | | 1,003,392 | |
| | | | | |
| | 750 | | | Federal Home Loan Bank Bonds | | | 1.750% | | | | 6/12/20 | | | | Aaa | | | | 749,222 | |
| | | | | |
| | 775 | | | Federal Home Loan Bank Bonds, (4) | | | 1.875% | | | | 12/09/22 | | | | Aaa | | | | 749,337 | |
| | | | | |
| | 825 | | | Federal Home Loan Bank Bonds | | | 2.375% | | | | 3/14/25 | | | | Aaa | | | | 792,464 | |
| | | | | |
| | 955 | | | Federal Home Loan Bank Bonds | | | 2.875% | | | | 6/14/24 | | | | Aaa | | | | 967,333 | |
| | | | | |
| | 2,260 | | | Federal Home Loan Bank Bonds | | | 2.875% | | | | 9/13/24 | | | | Aaa | | | | 2,281,025 | |
| | | | | |
| | 1,080 | | | Federal Home Loan Bank Bonds | | | 4.125% | | | | 3/13/20 | | | | Aaa | | | | 1,199,066 | |
| | | | | |
| | 735 | | | Federal Home Loan Banks, Discount Notes | | | 2.220% | | | | 3/28/23 | | | | Aaa | | | | 719,403 | |
| | | | | |
| | 535 | | | Federal National Mortgage Association | | | 0.000% | | | | 10/09/19 | | | | Aaa | | | | 488,630 | |
| | | | | |
| | 710 | | | FICO STRIPS | | | 0.000% | | | | 5/02/17 | | | | Aaa | | | | 699,154 | |
| | | | | |
| | 250 | | | Financing Corporation | | | 9.400% | | | | 2/08/18 | | | | Aaa | | | | 304,180 | |
| | | | | |
| | 780 | | | Freddie Mac Reference Notes | | | 0.750% | | | | 7/14/17 | | | | Aaa | | | | 779,983 | |
| | | | | |
| | 880 | | | Freddie Mac Reference Notes | | | 0.875% | | | | 3/07/18 | | | | Aaa | | | | 876,942 | |
| | | | | |
| | 560 | | | Freddie Mac Reference Notes | | | 1.250% | | | | 10/02/19 | | | | Aaa | | | | 552,523 | |
| | | | | |
| | 590 | | | Freddie Mac Reference Notes | | | 2.375% | | | | 1/13/22 | | | | Aaa | | | | 597,357 | |
| | | | | |
| | 270 | | | Freddie Mac Reference Notes | | | 5.000% | | | | 12/14/18 | | | | Aa2 | | | | 302,971 | |
| | | | | |
| | 530 | | | Tennessee Valley Authority | | | 3.875% | | | | 2/15/21 | | | | Aaa | | | | 583,326 | |
| | | | | |
| | 535 | | | U.S. Treasury Bonds | | | 7.250% | | | | 8/15/22 | | | | Aaa | | | | 722,125 | |
| | | | | |
| | 325 | | | U.S. Treasury Bonds | | | 8.750% | | | | 8/15/20 | | | | Aaa | | | | 438,344 | |
| | | | | |
| | 500 | | | U.S. Treasury Bonds, (4) | | | 8.875% | | | | 2/15/19 | | | | Aaa | | | | 636,172 | |
| | | | | |
| | 935 | | | U.S. Treasury Notes | | | 1.375% | | | | 11/30/18 | | | | Aaa | | | | 942,231 | |
| | | | | |
| | 730 | | | U.S. Treasury Notes | | | 1.500% | | | | 11/30/19 | | | | Aaa | | | | 730,114 | |
| | | | | |
| | 1,165 | | | U.S. Treasury Notes | | | 1.750% | | | | 5/15/23 | | | | Aaa | | | | 1,126,865 | |
| | | | | |
| | 1,175 | | | U.S. Treasury Notes | | | 2.000% | | | | 11/30/20 | | | | Aaa | | | | 1,189,688 | |
| | | | | |
| | 1,000 | | | U.S. Treasury Notes | | | 2.000% | | | | 2/28/21 | | | | Aaa | | | | 1,008,906 | |
| | | | | |
| | 745 | | | U.S. Treasury Notes | | | 2.000% | | | | 11/15/21 | | | | Aaa | | | | 746,339 | |
| | | | | |
| | 1,185 | | | U.S. Treasury Notes | | | 2.000% | | | | 2/15/22 | | | | Aaa | | | | 1,184,815 | |
| | | | | |
| | 2,805 | | | U.S. Treasury Notes | | | 2.000% | | | | 2/15/25 | | | | Aaa | | | | 2,725,231 | |
| | | | | |
| | 2,435 | | | U.S. Treasury Notes, (4) | | | 2.750% | | | | 11/15/23 | | | | Aaa | | | | 2,531,258 | |
| | | | | |
| | 320 | | | U.S. Treasury Notes | | | 3.125% | | | | 5/15/19 | | | | Aaa | | | | 341,475 | |
| | | | | |
| | 1,145 | | | U.S. Treasury Securities, Stripped Interest Payments | | | 0.000% | | | | 2/15/22 | | | | Aaa | | | | 995,520 | |
| $ | 35,925 | | | Total U.S. Government and Agency Obligations (cost $36,026,868) | | | | | | | | 36,429,976 | |
| | | | | |
Principal
Amount (000) | | | Description (1) | | Coupon | | | Maturity | | | Ratings (2) | | | Value | |
| | | |
| | | | ASSET-BACKED AND MORTGAGE-BACKED SECURITIES – 46.6% | | | | | | | | | |
| | | | | |
| $ | 532 | | | 321 Henderson Receivables LLC, Series 2010-3A | | | 3.820% | | | | 12/15/48 | | | | Aaa | | | $ | 558,935 | |
| | | | | |
| | 633 | | | 321 Henderson Receivables LLC., Series 2010-1A | | | 5.560% | | | | 7/15/59 | | | | Aaa | | | | 718,687 | |
| | | | | | | | | | | | | | | | | | | | |
Principal
Amount (000) | | | Description (1) | | Coupon | | | Maturity | | | Ratings (2) | | | Value | |
| | | | | |
| | | | ASSET-BACKED AND MORTGAGE-BACKED SECURITIES (continued) | | | | | | | | | | | | | | | | |
| | | | | |
| $ | 500 | | | Barclays Dryrock Issuance Trust 2014-1 | | | 0.547% | | | | 12/16/19 | | | | AAA | | | $ | 500,002 | |
| | | | | |
| | 802 | | | Colony Anerican Homes Trust 2014-1A | | | 1.400% | | | | 5/17/31 | | | | Aaa | | | | 797,202 | |
| | | | | |
| | 330 | | | Commercial Mortgage Pass-Through Certificates Series 2012-CR4 | | | 1.801% | | | | 10/15/45 | | | | AAA | | | | 331,897 | |
| | | | | |
| | 506 | | | Credit Suisse Commercial Mortgage Trust, 2015-2 | | | 3.000% | | | | 2/25/45 | | | | AAA | | | | 509,843 | |
| | | | | |
| | 261 | | | DBUBS Mortgage Trust, Commercial Mortgage Pass-Through Certificates, Series 2011-LC3A | | | 3.642% | | | | 8/10/44 | | | | Aaa | | | | 265,568 | |
| | | | | |
| | 875 | | | Fannie Mae Alternative Credit Enhanced Securities | | | 1.637% | | | | 11/25/17 | | | | Aaa | | | | 884,613 | |
| | | | | |
| | 995 | | | Fannie Mae Alternative Credit Enhanced Securities | | | 0.476% | | | | 12/25/17 | | | | Aaa | | | | 996,218 | |
| | | | | |
| | 900 | | | Fannie Mae Alternative Credit Enhanced Securities | | | 2.171% | | | | 9/25/19 | | | | Aaa | | | | 913,807 | |
| | | | | |
| | 413 | | | Fannie Mae Connecticut Avenue Securities , Series 2014-C02 | | | 1.141% | | | | 5/25/24 | | | | Aaa | | | | 409,700 | |
| | | | | |
| | 13 | | | Fannie Mae Mortgage Pool 580516 | | | 5.500% | | | | 4/01/16 | | | | Aaa | | | | 13,460 | |
| | | | | |
| | 58 | | | Fannie Mae Mortgage Pool 254414 | | | 7.000% | | | | 7/01/17 | | | | Aaa | | | | 60,205 | |
| | | | | |
| | 54 | | | Fannie Mae Mortgage Pool 254373 | | | 6.500% | | | | 7/01/17 | | | | Aaa | | | | 55,620 | |
| | | | | |
| | 26 | | | Fannie Mae Mortgage Pool 673010 | | | 5.500% | | | | 12/01/17 | | | | Aaa | | | | 26,472 | |
| | | | | |
| | 65 | | | Fannie Mae Mortgage Pool 695765 | | | 5.500% | | | | 4/01/18 | | | | Aaa | | | | 66,858 | |
| | | | | |
| | 95 | | | Fannie Mae Mortgage Pool 254720 | | | 4.500% | | | | 5/01/18 | | | | Aaa | | | | 99,081 | |
| | | | | |
| | 142 | | | Fannie Mae Mortgage Pool 725793 | | | 5.500% | | | | 9/01/19 | | | | Aaa | | | | 150,319 | |
| | | | | |
| | 81 | | | Fannie Mae Mortgage Pool 254179 | | | 6.000% | | | | 1/01/22 | | | | Aaa | | | | 91,978 | |
| | | | | |
| | 88 | | | Fannie Mae Mortgage Pool 254344 | | | 6.500% | | | | 6/01/22 | | | | Aaa | | | | 101,125 | |
| | | | | |
| | 71 | | | Fannie Mae Mortgage Pool 596680 | | | 7.000% | | | | 9/01/31 | | | | Aaa | | | | 77,741 | |
| | | | | |
| | 117 | | | Fannie Mae Mortgage Pool 254169 | | | 6.500% | | | | 12/01/31 | | | | Aaa | | | | 128,895 | |
| | | | | |
| | 228 | | | Fannie Mae Mortgage Pool 745101 | | | 6.000% | | | | 4/01/32 | | | | Aaa | | | | 256,467 | |
| | | | | |
| | 251 | | | Fannie Mae Mortgage Pool 596712 | | | 6.500% | | | | 6/01/32 | | | | Aaa | | | | 286,555 | |
| | | | | |
| | 43 | | | Fannie Mae Mortgage Pool 656269 | | | 6.000% | | | | 8/01/32 | | | | Aaa | | | | 48,250 | |
| | | | | |
| | 735 | | | Fannie Mae Mortgage Pool AD0486 | | | 2.404% | | | | 4/01/34 | | | | Aaa | | | | 783,644 | |
| | | | | |
| | 134 | | | Fannie Mae Mortgage Pool 848390 | | | 1.978% | | | | 12/01/35 | | | | Aaa | | | | 141,104 | |
| | | | | |
| | 204 | | | Fannie Mae Mortgage Pool 886034 | | | 2.702% | | | | 7/01/36 | | | | Aaa | | | | 218,483 | |
| | | | | |
| | 89 | | | Fannie Mae Mortgage Pool 887017 | | | 6.500% | | | | 8/01/36 | | | | Aaa | | | | 103,167 | |
| | | | | |
| | 148 | | | Fannie Mae Mortgage Pool 995949 | | | 2.459% | | | | 9/01/36 | | | | Aaa | | | | 157,361 | |
| | | | | |
| | 574 | | | Fannie Mae Mortgage Pool 914224 | | | 2.360% | | | | 3/01/37 | | | | Aaa | | | | 615,416 | |
| | | | | |
| | 258 | | | Fannie Mae Mortgage Pool 913187 | | | 2.489% | | | | 4/01/37 | | | | Aaa | | | | 277,162 | |
| | | | | |
| | 194 | | | Fannie Mae Mortgage Pool 928519 | | | 7.000% | | | | 6/01/37 | | | | Aaa | | | | 231,782 | |
| | | | | |
| | 375 | | | Fannie Mae Mortgage Pool AE4876 | | | 3.500% | | | | 10/01/40 | | | | Aaa | | | | 387,232 | |
| | | | | |
| | 666 | | | Fannie Mae Mortgage Pool 890310 | | | 4.500% | | | | 12/01/40 | | | | Aaa | | | | 721,099 | |
| | | | | |
| | 604 | | | Fannie Mae Mortgage Pool AB1959 | | | 4.000% | | | | 12/01/40 | | | | Aaa | | | | 643,446 | |
| | | | | |
| | 957 | | | Fannie Mae Mortgage Pool AE0949 | | | 4.000% | | | | 2/01/41 | | | | Aaa | | | | 1,020,317 | |
| | | | | |
| | 1,021 | | | Fannie Mae Mortgage Pool AE0981 | | | 3.500% | | | | 3/01/41 | | | | Aaa | | | | 1,054,588 | |
| | | | | |
| | 846 | | | Fannie Mae Mortgage Pools 467749 | | | 3.240% | | | | 4/01/16 | | | | Aaa | | | | 851,381 | |
| | | | | |
| | 264 | | | Fannie Mae Real Estate Mortgage Investment Conduit, Pass-Through Certificates 2013-M3 ASQ2 | | | 1.083% | | | | 2/25/16 | | | | Aaa | | | | 264,696 | |
Nuveen Intermediate Government Bond Fund (continued)
| | |
| Portfolio of Investments | | June 30, 2015 |
| | | | | | | | | | | | | | | | | | | | |
Principal
Amount (000) | | | Description (1) | | Coupon | | | Maturity | | | Ratings (2) | | | Value | |
| | | | | |
| | | | ASSET-BACKED AND MORTGAGE-BACKED SECURITIES (continued) | | | | | | | | | | | | | | | | |
| | | | | |
| $ | 326 | | | Fannie Mae REMIC Pass-Through Certificates 2002-W1 2A | | | 6.418% | | | | 2/25/42 | | | | Aaa | | | $ | 378,344 | |
| | | | | |
| | 389 | | | Fannie Mae, Connecticut Avenue Securities, Series 2014-C03 | | | 1.391% | | | | 7/25/24 | | | | Aaa | | | | 388,806 | |
| | | | | |
| | 525 | | | FDIC Structures Sale Guaranteed Notes, Series 2010-S1 | | | 3.250% | | | | 4/25/38 | | | | Aaa | | | | 537,988 | |
| | | | | |
| | 6 | | | FDIC Trust 2012-C1 | | | 0.841% | | | | 5/25/35 | | | | Aaa | | | | 6,342 | |
| | | | | |
| | 728 | | | Federal Home Loan Mortgage Corporation, REMIC | | | 0.437% | | | | 11/15/42 | | | | Aaa | | | | 727,387 | |
| | | | | |
| | 461 | | | Freddie Mac Gold Pool 780836 | | | 2.343% | | | | 9/01/33 | | | | Aaa | | | | 491,881 | |
| | | | | |
| | 4 | | | Freddie Mac, REMIC 2629 BO | | | 3.250% | | | | 3/15/18 | | | | Aaa | | | | 4,351 | |
| | | | | |
| | 304 | | | Freddie Mac Gold Pool 848193 | | | 2.351% | | | | 3/01/36 | | | | Aaa | | | | 323,314 | |
| | | | | |
| | 350 | | | Freddie Mac Gold Pool 1H1396 | | | 2.500% | | | | 5/01/37 | | | | Aaa | | | | 373,403 | |
| | | | | |
| | 635 | | | Freddie Mac Gold Pool C09000 | | | 3.500% | | | | 6/01/42 | | | | Aaa | | | | 654,488 | |
| | | | | |
| | 1,056 | | | Freddie Mac Gold Pool C09004 | | | 3.500% | | | | 7/01/42 | | | | Aaa | | | | 1,088,944 | |
| | | | | |
| | 54 | | | Freddie Mac Mortgage Pool, Various G00876 | | | 6.500% | | | | 1/01/28 | | | | Aaa | | | | 61,902 | |
| | | | | |
| | 21 | | | Freddie Mac Mortgage Pool, Various C35768 | | | 7.500% | | | | 1/01/30 | | | | Aaa | | | | 23,295 | |
| | | | | |
| | 133 | | | Freddie Mac Mortgage Pool, Various G01244 | | | 6.500% | | | | 3/01/31 | | | | Aaa | | | | 154,661 | |
| | | | | |
| | 641 | | | Freddie Mac Mortgage Pool G08566 | | | 3.500% | | | | 1/01/44 | | | | Aaa | | | | 660,381 | |
| | | | | |
| | 763 | | | Freddie Mac Mortgage Pool G08631 | | | 3.000% | | | | 3/01/45 | | | | Aaa | | | | 759,309 | |
| | | | | |
| | 354 | | | Freddie Mac Mortgage Trust 2013-KF02 | | | 3.191% | | | | 12/25/45 | | | | AAA | | | | 364,541 | |
| | | | | |
| | 506 | | | Freddie Mac Mulitfamily Strucured Pass-Through Certificates, Series K701 | | | 2.776% | | | | 6/25/17 | | | | Aaa | | | | 515,793 | |
| | | | | |
| | 591 | | | Freddie Mac Multifamily Structured Pass-Through Certificates, Series K010 A1 | | | 3.320% | | | | 7/25/20 | | | | Aaa | | | | 614,012 | |
| | | | | |
| | 672 | | | Freddie Mac Multifamily Structured Pass-Through Certificates, Series K715 | | | 2.059% | | | | 3/25/20 | | | | Aaa | | | | 684,486 | |
| | | | | |
| | 314 | | | Freddie Mac Multifamily Structured Pass-Through Certificates Series KF01 | | | 0.534% | | | | 4/25/19 | | | | Aaa | | | | 312,537 | |
| | | | | |
| | 460 | | | Freddie Mac Structured Pass-Through Certificates, Series K-501 | | | 1.655% | | | | 11/25/16 | | | | Aaa | | | | 464,050 | |
| | | | | |
| | 630 | | | Freddie Mac Structured Pass-Through Certificates, Series K-502 A2 | | | 1.426% | | | | 8/25/17 | | | | AAA | | | | 634,864 | |
| | | | | |
| | 757 | | | Freddie Mac Structured Pass-Through Certificates, Series K008 | | | 2.746% | | | | 12/25/19 | | | | Aaa | | | | 764,461 | |
| | | | | |
| | 760 | | | Ginnie Mae Mortgage Pool | | | 3.500% | | | | 1/20/45 | | | | Aaa | | | | 792,564 | |
| | | | | |
| | 21 | | | Government National Mortgage Association Pool 347332 | | | 7.500% | | | | 12/15/22 | | | | Aaa | | | | 21,315 | |
| | | | | |
| | 5 | | | Government National Mortgage Association Pool 455304 | | | 7.000% | | | | 9/15/27 | | | | Aaa | | | | 5,640 | |
| | | | | |
| | 141 | | | Government National Mortgage Association Pool 780825 | | | 6.500% | | | | 7/15/28 | | | | Aaa | | | | 165,719 | |
| | | | | |
| | 52 | | | Government National Mortgage Association Pool 3120 | | | 6.500% | | | | 8/20/31 | | | | Aaa | | | | 61,996 | |
| | | | | |
| | 65 | | | Government National Mortgage Association Pool 570134 | | | 7.500% | | | | 12/15/31 | | | | Aaa | | | | 68,258 | |
| | | | | |
| | 606 | | | Government National Mortgage Association Pool 633605 | | | 6.000% | | | | 9/15/34 | | | | Aaa | | | | 696,209 | |
| | | | | |
| | 418 | | | Government National Mortgage Association Pool 4946 | | | 4.500% | | | | 2/20/41 | | | | Aaa | | | | 455,926 | |
| | | | | |
| | 7 | | | GRMT Mortgage Loan Trust 2001-1A | | | 8.272% | | | | 7/20/31 | | | | A3 | | | | 6,801 | |
| | | | | |
| | 400 | | | Home Loan Servicing Solutions, HLSS Servicer Advance Receivables Backed Notes 2013-T3 | | | 1.793% | | | | 5/15/46 | | | | AAA | | | | 398,000 | |
| | | | | |
| | 555 | | | Home Loan Servicing Solutions, HLSS Servicer Advance Receivables Backed Notes 2013-T5 | | | 1.979% | | | | 8/15/46 | | | | AAA | | | | 554,445 | |
| | | | | |
| | 731 | | | Invitation Homes Trust 2013-SFR1 | | | 1.400% | | | | 12/17/30 | | | | Aaa | | | | 727,585 | |
| | | | | | | | | | | | | | | | | | | | |
Principal
Amount (000) | | | Description (1) | | Coupon | | | Maturity | | | Ratings (2) | | | Value | |
| | | | | |
| | | | ASSET-BACKED AND MORTGAGE-BACKED SECURITIES (continued) | | | | | | | | | | | | | | | | |
| | | | | |
| $ | 373 | | | JPMorgan Chase Commercial Mortgage Securities Corporation, Commercial Mortgage Pass-Through Certificates, Series 2010-C2 A1 | | | 2.749% | | | | 11/15/43 | | | | AAA | | | $ | 374,784 | |
| | | | | |
| | 579 | | | Morgan Stanley Bank of America Merrill Lynch Trust 2013-C9 | | | 0.825% | | | | 5/15/46 | | | | Aaa | | | | 576,971 | |
| | | | | |
| | 384 | | | Origen Manufactured Housing Contract Trust Collaterlized Notes Series 2005B | | | 5.990% | | | | 1/15/37 | | | | A+ | | | | 402,511 | |
| | | | | |
| | 24 | | | Sequoia Mortgage Trust, Mortgage Pass-Through Certificates, Series 2011-1 | | | 4.125% | | | | 2/25/41 | | | | AAA | | | | 23,981 | |
| | | | | |
| | 443 | | | Structured Agency Credit Risk 2014-DN1 | | | 1.191% | | | | 2/25/24 | | | | A1 | | | | 442,515 | |
| | | | | |
| | 481 | | | U.S. Department of Veterans, Affairs, Guaranteed REMIC Pass-Through Certificates, Vendee Mortgage Trust, Series 2011-1 | | | 3.750% | | | | 2/15/35 | | | | Aaa | | | | 502,198 | |
| | | | | |
| | 173 | | | National Credit Union Administration Guaranteed Structured Collateral Notes | | | 1.600% | | | | 10/29/20 | | | | AAA | | | | 173,171 | |
| | | | | |
| | 40 | | | U.S. Small Business Administration Guaranteed Participating Securities Participation Certificates, Series 2005-10B | | | 4.940% | | | | 8/10/15 | | | | Aaa | | | | 39,694 | |
| | | | | |
| | 350 | | | U.S. Small Business Administration Guaranteed Participating Securities Participation Certificates, Series 2008-10A | | | 5.902% | | | | 2/10/18 | | | | Aaa | | | | 374,447 | |
| | | | | |
| | 456 | | | U.S. Small Business Administration Guaranteed Participating Securities Participation Certificates, Series 2010-P10A | | | 4.108% | | | | 3/10/20 | | | | Aaa | | | | 478,553 | |
| | | | | |
| | 664 | | | Centerpoint Energy Transition Bond Company LLC | | | 0.901% | | | | 4/15/18 | | | | AAA | | | | 664,301 | |
| | | | | |
| | 435 | | | Entergy Arkansas Restoration Funding LLC, Senior Secured Storm Recovery Bonds, Series 2010-A | | | 2.300% | | | | 8/01/21 | | | | AAA | | | | 443,730 | |
| $ | 33,991 | | | Total Asset-Backed and Mortgage-Backed Securities (cost $34,309,012) | | | | | | | | 35,261,230 | |
| | | | Total Long-Term Investments (cost $73,499,579) | | | | | | | | 74,855,873 | |
| | | | | |
| Shares | | | Description (1) | | Coupon | | | | | | | | | Value | |
| | | |
| | | | INVESTMENTS PURCHASED WITH COLLATERAL FROM SECURITIES LENDING – 3.3% | | | | | | | | | |
| | | | | |
| | | | Money Market Funds – 3.3% | | | | | | | | | | | | |
| | | | | |
| | 2,464,209 | | | Mount Vernon Securities Lending Trust Prime Portfolio, (6) | | | 0.234% (5) | | | | | | | | | | | $ | 2,464,209 | |
| | | | Total Investments Purchased with Collateral from Securities Lending (cost $2,464,209) | | | | 2,464,209 | |
| | | | | |
| Shares | | | Description (1) | | Coupon | | | | | | | | | Value | |
| | | | | |
| | | | SHORT-TERM INVESTMENTS – 0.6% | | | | | | | | | | | | |
| | | | | |
| | | | Money Market Funds – 0.6% | | | | | | | | | | | | | | | | |
| | | | | |
| | 454,874 | | | First American Treasury Obligations Fund, Class Z | | | 0.000% (5) | | | | | | | | | | | $ | 454,874 | |
| | | | Total Short-Term Investments (cost $454,874) | | | | | | | | | | | | | | | 454,874 | |
| | | | Total Investments (cost $76,418,662) – 102.8% | | | | | | | | | | | | | | | 77,774,956 | |
| | | | Other Assets Less Liabilities – (2.8)% (7) | | | | | | | | | | | | | | | (2,111,841 | ) |
| | | | Net Assets – 100% | | | | | | | | | | | | | | $ | 75,663,115 | |
Nuveen Intermediate Government Bond Fund (continued)
| | |
| Portfolio of Investments | | June 30, 2015 |
Investments in Derivatives as of June 30, 2015
Interest Rate Swaps outstanding:
| | | | | | | | | | | | | | | | | | | | | | | | | | | | | | | | |
| Counterparty | | Notional
Amount | | | Fund
Pay/Receive
Floating Rate | | | Floating Rate Index | | | Fixed Rate
(Annualized) | | | Fixed Rate
Payment
Frequency | | | Termination
Date | | | Value | | | Unrealized
Appreciation
(Depreciation) | |
JPMorgan* | | $ | 2,000,000 | | | | Receive | | | | 3-Month USD-LIBOR-ICE | | | | 2.354 | % | | | Semi-Annually | | | | 5/21/25 | | | $ | 10,105 | | | $ | 10,105 | |
| * | Citigroup is the clearing broker for this transaction. |
Futures Contracts outstanding:
| | | | | | | | | | | | | | | | | | | | | | | | |
| Description | | Contract
Position | | | Number of
Contracts | | | Contract
Expiration | | | Notional
Amount at
Value* | | | Variation Margin
Receivable/ Payable | | | Unrealized
Appreciation
(Depreciation) | |
U.S. Treasury 2-Year Note | | | Short | | | | (17 | ) | | | 9/15 | | | $ | (3,721,938 | ) | | $ | 797 | | | $ | (5,137 | ) |
U.S. Treasury 5-Year Note | | | Short | | | | (33 | ) | | | 9/15 | | | | (3,935,508 | ) | | | 1,289 | | | | (2,122 | ) |
U.S. Treasury 10-Year Note | | | Long | | | | 44 | | | | 9/15 | | | | 5,551,563 | | | | (1,375 | ) | | | 18,781 | |
U.S. Treasury Long Bond | | | Short | | | | (9 | ) | | | 9/15 | | | | (1,357,594 | ) | | | 562 | | | | (11,294 | ) |
| | | | | | | | | | | | | | | $ | (3,463,477 | ) | | $ | 1,273 | | | $ | 228 | |
| * | The aggregate Notional Amount at Value of long and short positions is $5,551,563 and $(9,015,040), respectively. |
For Fund portfolio compliance purposes, the Fund’s industry classifications refer to any one or more of the industry sub-classifications used by one or more widely recognized market indexes or ratings group indexes, and/or as defined by Fund management. This definition may not apply for purposes of this report, which may combine industry sub-classifications into sectors for reporting ease.
| (1) | All percentages shown in the Portfolio of Investments are based on net assets. |
| (2) | Ratings (not covered by the report of independent registered public accounting firm): Using the highest of Standard & Poor’s Group (“Standard & Poor’s”), Moody’s Investors Service, Inc. (“Moody’s”) or Fitch, Inc. (“Fitch”) rating. Ratings below BBB by Standard & Poor’s, Baa by Moody’s or BBB by Fitch are considered to be below investment grade. Holdings designated N/R are not rated by any of these national rating agencies. |
| (3) | Optional Call Provisions (not covered by the report of independent registered public accounting firm): Dates (month and year) and prices of the earliest optional call or redemption. There may be other call provisions at varying prices at later dates. Certain mortgagebacked securities may be subject to periodic principal paydowns. |
| (4) | Investment, or a portion of investment, is out on loan for securities lending. The total value of the securities out on loan as of the end of the reporting period was $2,363,973. |
| (5) | The rate shown is the annualized seven-day effective yield as of the end of the reporting period. |
| (6) | The Fund may loan securities representing up to one third of the fair value of its total assets (which includes collateral for securities on loan) to broker-dealers, banks and other institutions. The Fund maintains collateral equal to at least 100% of the fair value of the securities loaned. The cash collateral received by the Fund is invested in this money market fund. See Notes to Financial Statements, Note 3 – Portfolio Securities and Investments in Derivatives, Securities Lending for more information. |
| (7) | Other assets less liabilities includes the unrealized appreciation (depreciation) of the over-the-counter derivatives as presented on the Statement of Assets and Liabilities. The unrealized appreciation (depreciation) of exchange-cleared and exchange-traded derivatives is recognized as part of the receivable or payable for variation margin as presented on the Statement of Assets and Liabilities. |
| USD-LIBOR-ICE | United States Dollar-London Inter-Bank Offered Rate Intercontinental Exchange. |
See accompanying notes to financial statements.
Nuveen Short Term Bond Fund
| | |
| Portfolio of Investments | | June 30, 2015 |
| | | | | | | | | | | | | | | | | | | | |
Principal
Amount (000) | | | Description (1) | | Coupon | | | Maturity | | | Ratings (2) | | | Value | |
| | | | | |
| | | | LONG-TERM INVESTMENTS – 98.3% | | | | | | | | | | | | | | | | |
| | | | | |
| | | | CORPORATE BONDS – 46.8% | | | | | | | | | | | | | | | | |
| | | | | |
| | | | Airlines – 1.3% | | | | | | | | | | | | |
| | | | | |
| $ | 2,250 | | | American Airlines Pass-Through Trust 2013-2C, 144A | | | 6.000% | | | | 1/15/17 | | | | BB | | | $ | 2,300,625 | |
| | | | | |
| | 2,113 | | | Delta Air Lines Pass-Through Certificates Series 2012-1A | | | 4.750% | | | | 5/07/20 | | | | A | | | | 2,260,422 | |
| | | | | |
| | 1,470 | | | Delta Air Lines Pass-Through Certificates, Series 2012-1B, 144A, (3) | | | 6.875% | | | | 5/07/19 | | | | BBB– | | | | 1,594,502 | |
| | | | | |
| | 1,724 | | | Delta Airlines | | | 5.300% | | | | 4/15/19 | | | | A | | | | 1,853,566 | |
| | | | | |
| | 989 | | | US Airways Pass-Through Trust | | | 7.076% | | | | 3/20/21 | | | | A | | | | 1,073,292 | |
| | 8,546 | | | Total Airlines | | | | | | | | | | | | | | | 9,082,407 | |
| | | | | |
| | | | Auto Components – 0.4% | | | | | | | | | | | | |
| | | | | |
| | 853 | | | American & Axle Manufacturing Inc. | | | 6.625% | | | | 10/15/22 | | | | BB– | | | | 895,650 | |
| | | | | |
| | 1,965 | | | Schaeffler Holding Finance BV, 144A | | | 6.250% | | | | 11/15/19 | | | | B1 | | | | 2,070,619 | |
| | 2,818 | | | Total Auto Components | | | | | | | | | | | | | | | 2,966,269 | |
| | | | | |
| | | | Automobiles – 0.4% | | | | | | | | | | | | |
| | | | | |
| | 3,000 | | | Volkswagen Group of America Finance LLC, 144A | | | 1.600% | | | | 11/20/17 | | | | A | | | | 3,002,787 | |
| | | | | |
| | | | Banks – 9.2% | | | | | | | | | | | | |
| | | | | |
| | 2,250 | | | Abbey National Treasury Services PLC of London | | | 3.050% | | | | 8/23/18 | | | | A | | | | 2,327,839 | |
| | | | | |
| | 7,820 | | | Bank of America Corporation, (3) | | | 5.650% | | | | 5/01/18 | | | | A | | | | 8,590,333 | |
| | | | | |
| | 3,305 | | | Bank of Nova Scotia | | | 1.375% | | | | 12/18/17 | | | | Aa2 | | | | 3,292,348 | |
| | | | | |
| | 2,115 | | | Barclays Bank PLC | | | 5.000% | | | | 9/22/16 | | | | A2 | | | | 2,213,544 | |
| | | | | |
| | 3,525 | | | BB&T Corporation, (3) | | | 1.450% | | | | 1/12/18 | | | | A+ | | | | 3,510,199 | |
| | | | | |
| | 5,930 | | | Citigroup Inc. | | | 6.125% | | | | 11/21/17 | | | | A | | | | 6,522,834 | |
| | | | | |
| | 2,000 | | | Credit Agricole SA, 144A, (3) | | | 3.000% | | | | 10/01/17 | | | | A | | | | 2,063,856 | |
| | | | | |
| | 2,000 | | | Fifth Third Bancorp. | | | 4.500% | | | | 6/01/18 | | | | A– | | | | 2,118,438 | |
| | | | | |
| | 7,600 | | | General Electric Capital Corporation | | | 5.625% | | | | 5/01/18 | | | | AA+ | | | | 8,411,855 | |
| | | | | |
| | 2,000 | | | HSBC USA Inc. | | | 1.625% | | | | 1/16/18 | | | | AA– | | | | 1,994,534 | |
| | | | | |
| | 1,500 | | | ING Bank NV, 144A | | | 3.750% | | | | 3/07/17 | | | | A1 | | | | 1,558,551 | |
| | | | | |
| | 7,000 | | | JPMorgan Chase & Company | | | 6.000% | | | | 1/15/18 | | | | A+ | | | | 7,710,472 | |
| | | | | |
| | 3,000 | | | KeyCorp. | | | 2.300% | | | | 12/13/18 | | | | A– | | | | 3,026,526 | |
| | | | | |
| | 2,000 | | | Nordea Bank AB, 144A | | | 3.125% | | | | 3/20/17 | | | | AA– | | | | 2,064,276 | |
| | | | | |
| | 2,000 | | | Societe Generale, (3) | | | 2.750% | | | | 10/12/17 | | | | A | | | | 2,049,918 | |
| | | | | |
| | 6,105 | | | Wells Fargo & Company, (3) | | | 2.125% | | | | 4/22/19 | | | | AA– | | | | 6,128,974 | |
| | 60,150 | | | Total Banks | | | | | | | | | | | | | | | 63,584,497 | |
| | | | | |
| | | | Beverages – 0.3% | | | | | | | | | | | | |
| | | | | |
| | 2,000 | | | Heineken NV, 144A | | | 1.400% | | | | 10/01/17 | | | | BBB+ | | | | 2,000,220 | |
| | | | | |
| | | | Biotechnology – 0.1% | | | | | | | | | | | | |
| | | | | |
| | 1,000 | | | Baxalta Inc., 144A | | | 2.000% | | | | 6/22/18 | | | | BBB+ | | | | 998,684 | |
Nuveen Short Term Bond Fund (continued)
| | |
| Portfolio of Investments | | June 30, 2015 |
| | | | | | | | | | | | | | | | | | | | |
Principal
Amount (000) | | | Description (1) | | Coupon | | | Maturity | | | Ratings (2) | | | Value | |
| | | | | |
| | | | Capital Markets – 3.4% | | | | | | | | | | | | |
| | | | | |
| $ | 2,840 | | | Deutsche Bank AG London | | | 2.500% | | | | 2/13/19 | | | | A | | | $ | 2,854,441 | |
| | | | | |
| | 8,660 | | | Goldman Sachs Group, Inc. | | | 6.150% | | | | 4/01/18 | | | | A | | | | 9,628,881 | |
| | | | | |
| | 4,995 | | | Morgan Stanley | | | 5.950% | | | | 12/28/17 | | | | A | | | | 5,490,579 | |
| | | | | |
| | 2,250 | | | Nomura Holdings Incorporated | | | 2.000% | | | | 9/13/16 | | | | BBB+ | | | | 2,266,394 | |
| | | | | |
| | 3,000 | | | UBS AG Stamford | | | 1.800% | | | | 3/26/18 | | | | A | | | | 2,995,536 | |
| | 21,745 | | | Total Capital Markets | | | | | | | | | | | | | | | 23,235,831 | |
| | | | | |
| | | | Chemicals – 1.6% | | | | | | | | | | | | |
| | | | | |
| | 2,215 | | | Eastman Chemical Company | | | 2.400% | | | | 6/01/17 | | | | BBB | | | | 2,251,468 | |
| | | | | |
| | 2,635 | | | Ecolab Inc. | | | 1.450% | | | | 12/08/17 | | | | BBB+ | | | | 2,611,696 | |
| | | | | |
| | 1,665 | | | Ineos Group Holdings SA, 144A, (3) | | | 6.125% | | | | 8/15/18 | | | | B– | | | | 1,700,381 | |
| | | | | |
| | 2,000 | | | Petrologistics LP Finance Corporation | | | 6.250% | | | | 4/01/20 | | | | AA– | | | | 2,138,380 | |
| | | | | |
| | 2,750 | | | Sherwin-Williams Company | | | 1.350% | | | | 12/15/17 | | | | A2 | | | | 2,740,804 | |
| | 11,265 | | | Total Chemicals | | | | | | | | | | | | | | | 11,442,729 | |
| | | | | |
| | | | Commercial Services & Supplies – 0.3% | | | | | | | | | | | | |
| | | | | |
| | 2,000 | | | ERAC USA Finance LLC, 144A | | | 2.800% | | | | 11/01/18 | | | | BBB+ | | | | 2,040,050 | |
| | | | | |
| | | | Consumer Finance – 1.6% | | | | | | | | | | | | |
| | | | | |
| | 2,000 | | | Ally Financial Inc, (3) | | | 8.000% | | | | 12/31/18 | | | | BB+ | | | | 2,232,500 | |
| | | | | |
| | 2,750 | | | American Express Company | | | 1.550% | | | | 5/22/18 | | | | A+ | | | | 2,729,185 | |
| | | | | |
| | 2,000 | | | First Data Corporation, 144A | | | 7.375% | | | | 6/15/19 | | | | BB | | | | 2,079,000 | |
| | | | | |
| | 2,000 | | | Ford Motor Credit Company | | | 1.500% | | | | 1/17/17 | | | | BBB– | | | | 1,997,698 | |
| | | | | |
| | 2,000 | | | Navient Corp., (3) | | | 5.000% | | | | 10/26/20 | | | | BB | | | | 1,960,000 | |
| | 10,750 | | | Total Consumer Finance | | | | | | | | | | | | | | | 10,998,383 | |
| | | | | |
| | | | Diversified Financial Services – 1.0% | | | | | | | | | | | | |
| | | | | |
| | 2,570 | | | BNP Paribas | | | 2.700% | | | | 8/20/18 | | | | A+ | | | | 2,629,971 | |
| | | | | |
| | 1,000 | | | Rabobank Nederland Utrecht | | | 3.375% | | | | 1/19/17 | | | | Aa2 | | | | 1,032,930 | |
| | | | | |
| | 1,500 | | | Rabobank Nederland, (3) | | | 2.250% | | | | 1/14/19 | | | | Aa2 | | | | 1,509,803 | |
| | | | | |
| | 1,000 | | | Synchrony Financial | | | 1.875% | | | | 8/15/17 | | | | BBB– | | | | 999,586 | |
| | | | | |
| | 1,000 | | | Voya Financial Inc. | | | 2.900% | | | | 2/15/18 | | | | BBB | | | | 1,026,196 | |
| | 7,070 | | | Total Diversified Financial Services | | | | | | | | | | | | | | | 7,198,486 | |
| | | | | |
| | | | Diversified Telecommunication Services – 1.5% | | | | | | | | | | | | |
| | | | | |
| | 2,300 | | | AT&T, Inc., (3) | | | 1.400% | | | | 12/01/17 | | | | A– | | | | 2,284,901 | |
| | | | | |
| | 3,420 | | | SBA Tower Trust, 144A | | | 3.598% | | | | 4/15/43 | | | | BBB | | | | 3,409,230 | |
| | | | | |
| | 4,730 | | | Verizon Communications, (3) | | | 3.650% | | | | 9/14/18 | | | | A– | | | | 4,974,953 | |
| | 10,450 | | | Total Diversified Telecommunication Services | | | | | | | | | | | | | | | 10,669,084 | |
| | | | | |
| | | | Electric Utilities – 0.2% | | | | | | | | | | | | |
| | | | | |
| | 1,500 | | | FirstEnergy Corporation | | | 2.750% | | | | 3/15/18 | | | | Baa3 | | | | 1,522,091 | |
| | | | | | | | | | | | | | | | | | | | |
Principal
Amount (000) | | | Description (1) | | Coupon | | | Maturity | | | Ratings (2) | | | Value | |
| | | | | |
| | | | Energy Equipment & Services – 1.1% | | | | | | | | | | | | |
| | | | | |
| $ | 750 | | | Drill Rigs Holdings Inc., 144A, (3) | | | 6.500% | | | | 10/01/17 | | | | B– | | | $ | 658,125 | |
| | | | | |
| | 2,775 | | | Nabors Industries Inc. | | | 6.150% | | | | 2/15/18 | | | | BBB | | | | 2,996,556 | |
| | | | | |
| | 2,000 | | | Regency Energy Partners Finance | | | 6.500% | | | | 7/15/21 | | | | BBB– | | | | 2,107,500 | |
| | | | | |
| | 1,500 | | | SESI, LLC | | | 7.125% | | | | 12/15/21 | | | | BBB– | | | | 1,590,000 | |
| | 7,025 | | | Total Energy Equipment & Services | | | | | | | | | | | | | | | 7,352,181 | |
| | | | | |
| | | | Food & Staples Retailing – 0.6% | | | | | | | | | | | | |
| | | | | |
| | 1,000 | | | Supervalu Inc., (3) | | | 6.750% | | | | 6/01/21 | | | | B | | | | 1,010,000 | |
| | | | | |
| | 3,050 | | | Walgreens Boots Alliance, Inc. | | | 1.750% | | | | 11/17/17 | | | | BBB | | | | 3,061,983 | |
| | 4,050 | | | Total Food & Staples Retailing | | | | | | | | | | | | | | | 4,071,983 | |
| | | | | |
| | | | Food Products – 1.2% | | | | | | | | | | | | |
| | | | | |
| | 1,065 | | | H.J. Heinz Company, 144A, (WI/DD) | | | 2.000% | | | | 7/02/18 | | | | BBB– | | | | 1,064,663 | |
| | | | | |
| | 2,500 | | | Mondelez International Inc. | | | 2.250% | | | | 2/01/19 | | | | Baa1 | | | | 2,504,033 | |
| | | | | |
| | 2,500 | | | Tyson Foods | | | 2.650% | | | | 8/15/19 | | | | BBB | | | | 2,516,498 | |
| | | | | |
| | 2,000 | | | Wm. Wrigley Jr. Company, 144A | | | 2.900% | | | | 10/21/19 | | | | A– | | | | 2,036,448 | |
| | 8,065 | | | Total Food Products | | | | | | | | | | | | | | | 8,121,642 | |
| | | | | |
| | | | Gas Utilities – 0.6% | | | | | | | | | | | | |
| | | | | |
| | 2,238 | | | AmeriGas Finance LLC, (3) | | | 6.750% | | | | 5/20/20 | | | | Ba2 | | | | 2,355,495 | |
| | | | | |
| | 2,000 | | | Ferrellgas LP | | | 8.625% | | | | 6/15/20 | | | | B– | | | | 2,070,000 | |
| | 4,238 | | | Total Gas Utilities | | | | | | | | | | | | | | | 4,425,495 | |
| | | | | |
| | | | Health Care Equipment & Supplies – 0.5% | | | | | | | | | | | | |
| | | | | |
| | 3,260 | | | Becton Dickinson & Company | | | 1.800% | | | | 12/15/17 | | | | BBB+ | | | | 3,260,398 | |
| | | | | |
| | | | Health Care Providers & Services – 1.8% | | | | | | | | | | | | |
| | | | | |
| | 3,000 | | | Aetna Inc. | | | 1.500% | | | | 11/15/17 | | | | A | | | | 3,007,386 | |
| | | | | |
| | 3,000 | | | Cardinal Health Inc. | | | 2.400% | | | | 11/15/19 | | | | A– | | | | 2,975,793 | |
| | | | | |
| | 2,000 | | | Community Health Systems, Inc. | | | 5.125% | | | | 8/15/18 | | | | BB | | | | 2,050,000 | |
| | | | | |
| | 1,000 | | | HCA Inc. | | | 4.250% | | | | 10/15/19 | | | | BBB– | | | | 1,023,750 | |
| | | | | |
| | 1,750 | | | Wellpoint Inc. | | | 1.875% | | | | 1/15/18 | | | | A | | | | 1,746,953 | |
| | | | | |
| | 1,500 | | | Zoetis Incorporated | | | 1.875% | | | | 2/01/18 | | | | Baa2 | | | | 1,495,844 | |
| | 12,250 | | | Total Health Care Providers & Services | | | | | | | | | | | | | | | 12,299,726 | |
| | | | | |
| | | | Hotels, Restaurants & Leisure – 0.3% | | | | | | | | | | | | |
| | | | | |
| | 1,915 | | | MGM Resorts International Inc., (3) | | | 6.750% | | | | 10/01/20 | | | | BB | | | | 2,029,900 | |
| | | | | |
| | | | Household Products – 0.3% | | | | | | | | | | | | |
| | | | | |
| | 1,997 | | | Federated Retail Holdings Inc., Macy’s Inc. | | | 5.900% | | | | 12/01/16 | | | | BBB+ | | | | 2,127,698 | |
| | | | | |
| | | | Independent Power & Renewable Electricity Producers – 0.3% | | | | | | | | | | | | |
| | | | | |
| | 2,000 | | | Dynegy Inc., 144A, (3) | | | 6.750% | | | | 11/01/19 | | | | B+ | | | | 2,081,000 | |
| | | | | |
| | | | Insurance – 1.4% | | | | | | | | | | | | |
| | | | | |
| | 3,380 | | | AFLAC Insurance | | | 2.650% | | | | 2/15/17 | | | | A | | | | 3,459,599 | |
Nuveen Short Term Bond Fund (continued)
| | |
| Portfolio of Investments | | June 30, 2015 |
| | | | | | | | | | | | | | | | | | | | |
Principal
Amount (000) | | | Description (1) | | Coupon | | | Maturity | | | Ratings (2) | | | Value | |
| | | | | |
| | | | Insurance (continued) | | | | | | | | | | | | |
| | | | | |
| $ | 2,700 | | | Prudential Financial Inc. | | | 6.000% | | | | 12/01/17 | | | | A | | | $ | 2,979,223 | |
| | | | | |
| | 1,000 | | | Security Benefit Life Insurance Company, 144A | | | 8.750% | | | | 5/15/16 | | | | BBB | | | | 1,056,875 | |
| | | | | |
| | 2,000 | | | White Mountains Insurance Group, 144A | | | 6.375% | | | | 3/20/17 | | | | BBB | | | | 2,102,590 | |
| | 9,080 | | | Total Insurance | | | | | | | | | | | | | | | 9,598,287 | |
| | | | | |
| | | | Internet & Catalog Retail – 0.4% | | | | | | | | | | | | |
| | | | | |
| | 2,695 | | | Amazon.com Incorporated | | | 1.200% | | | | 11/29/17 | | | | AA– | | | | 2,682,662 | |
| | | | | |
| | | | Life Sciences Tools & Services – 0.4% | | | | | | | | | | | | |
| | | | | |
| | 2,520 | | | Thermo Fischer Scientific Inc. | | | 1.300% | | | | 2/01/17 | | | | BBB | | | | 2,515,814 | |
| | | | | |
| | | | Machinery – 0.2% | | | | | | | | | | | | |
| | | | | |
| | 1,500 | | | BlueLine Rental Finance Corporation, 144A | | | 7.000% | | | | 2/01/19 | | | | B+ | | | | 1,541,250 | |
| | | | | |
| | | | Media – 2.5% | | | | | | | | | | | | |
| | | | | |
| | 2,600 | | | British Sky Broadcasting Group PLC, 144A | | | 6.100% | | | | 2/15/18 | | | | BBB | | | | 2,855,887 | |
| | | | | |
| | 4,000 | | | Comcast Corporation | | | 5.875% | | | | 2/15/18 | | | | A– | | | | 4,438,764 | |
| | | | | |
| | 3,370 | | | DIRECTV Holdings LLC, (3) | | | 2.400% | | | | 3/15/17 | | | | BBB | | | | 3,414,514 | |
| | | | | |
| | 1,600 | | | Discovery Communications Inc. | | | 5.625% | | | | 8/15/19 | | | | BBB | | | | 1,789,053 | |
| | | | | |
| | 2,000 | | | Dish DBS Corporation | | | 4.250% | | | | 4/01/18 | | | | BB– | | | | 2,035,000 | |
| | | | | |
| | 2,000 | | | Numericable Group SA, 144A | | | 4.875% | | | | 5/15/19 | | | | Ba3 | | | | 1,980,000 | |
| | | | | |
| | 1,000 | | | Thomson Reuters Corporation | | | 1.300% | | | | 2/23/17 | | | | BBB+ | | | | 997,672 | |
| | 16,570 | | | Total Media | | | | | | | | | | | | | | | 17,510,890 | |
| | | | | |
| | | | Metals & Mining – 1.7% | | | | | | | | | | | | |
| | | | | |
| | 2,242 | | | Freeport-McMoran Oil & Gas LLC / FCX Oil & Gas Inc. | | | 6.125% | | | | 6/15/19 | | | | BBB | | | | 2,368,113 | |
| | | | | |
| | 2,500 | | | Nucor Corporation | | | 5.850% | | | | 6/01/18 | | | | A | | | | 2,785,743 | |
| | | | | |
| | 1,735 | | | Rio Tinto Finance USA PLC | | | 1.625% | | | | 8/21/17 | | | | A– | | | | 1,736,221 | |
| | | | | |
| | 2,000 | | | Teck Resources Limited | | | 3.850% | | | | 8/15/17 | | | | BBB– | | | | 2,062,374 | |
| | | | | |
| | 2,500 | | | Xstrata Finance Canada Limited, 144A | | | 3.600% | | | | 1/15/17 | | | | BBB | | | | 2,566,060 | |
| | 10,977 | | | Total Metals & Mining | | | | | | | | | | | | | | | 11,518,511 | |
| | | | | |
| | | | Multi-Utilities – 0.4% | | | | | | | | | | | | |
| | | | | |
| | 2,665 | | | Sempra Energy | | | 2.300% | | | | 4/01/17 | | | | BBB+ | | | | 2,704,202 | |
| | | | | |
| | | | Oil, Gas & Consumable Fuels – 4.3% | | | | | | | | | | | | |
| | | | | |
| | 1,625 | | | Anadarko Petroleum Corporation | | | 5.950% | | | | 9/15/16 | | | | BBB | | | | 1,714,235 | |
| | | | | |
| | 1,000 | | | Anadarko Petroleum Corporation | | | 6.375% | | | | 9/15/17 | | | | BBB | | | | 1,097,404 | |
| | | | | |
| | 2,145 | | | Calumet Specialty Products, (3) | | | 6.500% | | | | 4/15/21 | | | | B+ | | | | 2,112,825 | |
| | | | | |
| | 3,000 | | | Canadian Natural Resources Limited | | | 1.750% | | | | 1/15/18 | | | | BBB+ | | | | 2,979,717 | |
| | | | | |
| | 2,000 | | | CNOOC Finance 2014 ULC | | | 1.625% | | | | 4/30/17 | | | | AA– | | | | 2,002,852 | |
| | | | | |
| | 2,000 | | | Kinder Morgan Inc., Delaware | | | 7.000% | | | | 6/15/17 | | | | BBB– | | | | 2,174,928 | |
| | | | | |
| | 4,345 | | | Phillips 66 | | | 2.950% | | | | 5/01/17 | | | | A3 | | | | 4,466,117 | |
| | | | | |
| | 1,965 | | | Sabine Pass Liquefaction LLC, (3) | | | 5.625% | | | | 2/01/21 | | | | BB+ | | | | 2,004,300 | |
| | | | | | | | | | | | | | | | | | | | |
Principal
Amount (000) | | | Description (1) | | Coupon | | | Maturity | | | Ratings (2) | | | Value | |
| | | | | |
| | | | Oil, Gas & Consumable Fuels (continued) | | | | | | | | | | | | |
| | | | | |
| $ | 3,000 | | | Sinopec Group Overseas Development 2014 Limited, 144A | | | 1.051% | | | | 4/10/17 | | | | AA– | | | $ | 2,996,295 | |
| | | | | |
| | 2,085 | | | Spectra Energy Partners LP | | | 2.950% | | | | 9/25/18 | | | | BBB | | | | 2,132,377 | |
| | | | | |
| | 1,780 | | | SunCor Energy Inc. | | | 6.100% | | | | 6/01/18 | | | | A– | | | | 1,984,995 | |
| | | | | |
| | 2,000 | | | Tesoro Logistics LP Finance Corporation, 144A, (3) | | | 5.500% | | | | 10/15/19 | | | | BB | | | | 2,075,000 | |
| | | | | |
| | 2,000 | | | Whiting Petroleum Corporation, (3) | | | 5.000% | | | | 3/15/19 | | | | BB | | | | 1,960,000 | |
| | 28,945 | | | Total Oil, Gas & Consumable Fuels | | | | | | | | | | | | | | | 29,701,045 | |
| | | | | |
| | | | Pharmaceuticals – 0.9% | | | | | | | | | | | | |
| | | | | |
| | 3,540 | | | McKesson Corporation | | | 1.292% | | | | 3/10/17 | | | | BBB+ | | | | 3,534,839 | |
| | | | | |
| | 2,000 | | | Merck & Company Inc. | | | 1.300% | | | | 5/18/18 | | | | AA | | | | 1,992,104 | |
| | | | | |
| | 500 | | | VRX Escrow Corp., 144A | | | 5.375% | | | | 3/15/20 | | | | B1 | | | | 516,250 | |
| | 6,040 | | | Total Pharmaceuticals | | | | | | | | | | | | | | | 6,043,193 | |
| | | | | |
| | | | Real Estate Investment Trust – 1.8% | | | | | | | | | | | | |
| | | | | |
| | 2,000 | | | American Tower Company | | | 4.500% | | | | 1/15/18 | | | | BBB | | | | 2,116,372 | |
| | | | | |
| | 2,000 | | | First Industrial Realty Trust | | | 5.950% | | | | 5/15/17 | | | | BBB– | | | | 2,147,380 | |
| | | | | |
| | 1,395 | | | Gaming and Leisure Products Inc., GLP Capital LP Financing II Inc. | | | 4.375% | | | | 11/01/18 | | | | BBB– | | | | 1,431,619 | |
| | | | | |
| | 2,000 | | | Prologis LP | | | 4.500% | | | | 8/15/17 | | | | BBB+ | | | | 2,120,338 | |
| | | | | |
| | 2,605 | | | Realty Income Corporation | | | 2.000% | | | | 1/31/18 | | | | BBB+ | | | | 2,623,550 | |
| | | | | |
| | 2,000 | | | Ventas Realty LP | | | 2.000% | | | | 2/15/18 | | | | BBB+ | | | | 2,012,248 | |
| | 12,000 | | | Total Real Estate Investment Trust | | | | | | | | | | | | | | | 12,451,507 | |
| | | | | |
| | | | Software – 1.3% | | | | | | | | | | | | |
| | | | | |
| | 3,130 | | | CA Inc. | | | 2.875% | | | | 8/15/18 | | | | BBB+ | | | | 3,192,782 | |
| | | | | |
| | 3,460 | | | Symantec Corporation | | | 2.750% | | | | 6/15/17 | | | | BBB | | | | 3,502,762 | |
| | | | | |
| | 2,000 | | | Total System Services Inc. | | | 2.375% | | | | 6/01/18 | | | | BBB+ | | | | 1,994,358 | |
| | 8,590 | | | Total Software | | | | | | | | | | | | | | | 8,689,902 | |
| | | | | |
| | | | Specialty Retail – 0.8% | | | | | | | | | | | | |
| | | | | |
| | 3,000 | | | AutoZone Inc. | | | 6.950% | | | | 6/15/16 | | | | Baa1 | | | | 3,165,777 | |
| | | | | |
| | 2,250 | | | Best Buy Co., Inc. | | | 5.000% | | | | 8/01/18 | | | | Baa2 | | | | 2,373,750 | |
| | 5,250 | | | Total Specialty Retail | | | | | | | | | | | | | | | 5,539,527 | |
| | | | | |
| | | | Technology Hardware, Storage & Peripherals – 1.0% | | | | | | | | | | | | |
| | | | | |
| | 2,720 | | | Apple Inc., (3) | | | 2.100% | | | | 5/06/19 | | | | AA+ | | | | 2,747,380 | |
| | | | | |
| | 2,960 | | | EMC Corporation | | | 1.875% | | | | 6/01/18 | | | | A1 | | | | 2,965,736 | |
| | | | | |
| | 1,000 | | | Seagate HDD Cayman | | | 3.750% | | | | 11/15/18 | | | | BBB– | | | | 1,042,534 | |
| | 6,680 | | | Total Technology Hardware, Storage & Peripherals | | | | | | | | | | | | | | | 6,755,650 | |
| | | | | |
| | | | Tobacco – 0.7% | | | | | | | | | | | | |
| | | | | |
| | 2,000 | | | BAT International Finance PLC, 144A | | | 2.125% | | | | 6/07/17 | | | | A– | | | | 2,023,070 | |
| | | | | |
| | 3,000 | | | Lorillard Tobacco, (3) | | | 2.300% | | | | 8/21/17 | | | | Baa2 | | | | 3,010,536 | |
| | 5,000 | | | Total Tobacco | | | | | | | | | | | | | | | 5,033,606 | |
Nuveen Short Term Bond Fund (continued)
| | |
| Portfolio of Investments | | June 30, 2015 |
| | | | | | | | | | | | | | | | | | | | |
Principal
Amount (000) | | | Description (1) | | Coupon | | | Maturity | | | Ratings (2) | | | Value | |
| | | | | |
| | | | Transportation Infrastructure – 0.2% | | | | | | | | | | | | |
| | | | | |
| $ | 1,200 | | | Aviation Capital Group Corporation, 144A | | | 3.875% | | | | 9/27/16 | | | | BBB– | | | $ | 1,221,230 | |
| | | | |
| | | | Wireless Telecommunication Services – 0.8% | | | | | | | | | | |
| | | | | |
| | 2,000 | | | America Movil S.A. de C.V. | | | 2.375% | | | | 9/08/16 | | | | A2 | | | | 2,025,239 | |
| | | | | |
| | 3,480 | | | Vodafone Group PLC, (3) | | | 1.500% | | | | 2/19/18 | | | | BBB+ | | | | 3,421,267 | |
| | 5,480 | | | Total Wireless Telecommunication Services | | | | | | | | | | | | | | | 5,446,506 | |
| $ | 312,286 | | | Total Corporate Bonds (cost $322,395,822) | | | | | | | | | | | | | | | 323,465,323 | |
| | | | | |
Principal
Amount (000) | | | Description (1) | | Coupon | | | Maturity | | | Ratings (2) | | | Value | |
| | | |
| | | | $1,000 PAR (OR SIMILAR) INSTITUTIONAL PREFERRED – 0.5% | | | | | | | | | |
| | | | | |
| | | | Banks – 0.5% | | | | | | | | | | | | |
| | | | | |
| $ | 3,000 | | | Citigroup Inc. | | | 8.400% | | | | N/A (4) | | | | BB+ | | | $ | 3,408,750 | |
| $ | 3,000 | | | Total $1,000 Par (or similar) Institutional Preferred (cost $3,465,010) | | | | | | | | 3,408,750 | |
| | | | | |
Principal
Amount (000) | | | Description (1) | | | | | Optional Call
Provisions (5) | | | Ratings (2) | | | Value | |
| | | | | |
| | | | MUNICIPAL BONDS – 2.3% | | | | | | | | | | | | | | | | |
| | | | | |
| | | | Arizona – 0.3% | | | | | | | | | | | | |
| | | | | |
| $ | 2,000 | | | Phoenix Civic Improvement Corporation, Arizona, Excise Tax Revenue Bonds, Refunding Subordinate Series 2011, 2.828%, 7/01/15 | | | | | | | No Opt. Call | | | | AA | | | $ | 2,000,100 | |
| | | | | |
| | | | California – 0.2% | | | | | | | | | | | | |
| | | | | |
| | 1,015 | | | California State, General Obligation Bonds, Various Purpose Build America Taxable Bond Series 2010, 5.750%, 3/01/17 | | | | | | | No Opt. Call | | | | AA– | | | | 1,095,550 | |
| | | | | |
| | | | Guam – 0.3% | | | | | | | | | | | | |
| | | | | |
| | | | Government of Guam, Business Privilege Tax Bonds, Taxable Series 2012B-2: | | | | | | | | | | | | | | | | |
| | 1,155 | | | 2.933%, 1/01/17 | | | | | | | No Opt. Call | | | | A | | | | 1,158,257 | |
| | 1,190 | | | 3.301%, 1/01/18 | | | | | | | No Opt. Call | | | | A | | | | 1,187,763 | |
| | 2,345 | | | Total Guam | | | | | | | | | | | | | | | 2,346,020 | |
| | | | | |
| | | | Massachusetts – 0.5% | | | | | | | | | | | | |
| | | | | |
| | 400 | | | Massachusetts Port Authority, Special Facilities Revenue Bonds, ConRAC Project, Taxable Series 2011B, 3.230%, 7/01/15 | | | | | | | No Opt. Call | | | | A | | | | 400,028 | |
| | | | | |
| | 2,750 | | | University of Massachusetts Building Authority, Project Revenue Bonds, Senior Series 2014-2, 1.185%, 11/01/17 | | | | | | | No Opt. Call | | | | Aa2 | | | | 2,760,588 | |
| | 3,150 | | | Total Massachusetts | | | | | | | | | | | | | | | 3,160,616 | |
| | | | | |
| | | | Nevada – 0.4% | | | | | | | | | | | | |
| | | | | |
| | 2,500 | | | Las Vegas Valley Water District, Nevada, General Obligation Bonds, Refunding Series 2011B, 3.176%, 6/01/17 | | | | | | | No Opt. Call | | | | AA+ | | | | 2,598,125 | |
| | | | | |
| | | | Ohio – 0.2% | | | | | | | | | | | | |
| | | | | |
| | 1,470 | | | Ohio State, General Obligation Bonds, Higher Education, Build America Bond Series 2010E, 3.328%, 8/01/17 – AGM Insured | | | | | | | No Opt. Call | | | | AA+ | | | | 1,538,781 | |
| | | | | | | | | | | | | | | | | | | | |
Principal
Amount (000) | | | Description (1) | | | | | Optional Call
Provisions (5) | | | Ratings (2) | | | Value | |
| | | | | |
| | | | Pennsylvania – 0.2% | | | | | | | | | | | | |
| | | | | |
| $ | 1,500 | | | Allentown Neighborhood Improvement Zone Development Authority, Pennsylvania, Tax Revenue Bonds, Taxable Series 2012B, 4.120%, 5/01/16 | | | | | | | No Opt. Call | | | | Baa2 | | | $ | 1,516,545 | |
| | | | | |
| | | | Texas – 0.2% | | | | | | | | | | | | |
| | | | | |
| | 1,500 | | | Dallas-Ft. Worth International Airport Facility Improvement Corporation, Texas, Revenue Bonds, Learjet Inc., Series 2001A-1, 6.150%, 1/01/16 (Alternative Minimum Tax) | | | | | | | No Opt. Call | | | | B1 | | | | 1,505,670 | |
| $ | 15,480 | | | Total Municipal Bonds (cost $15,581,727) | | | | | | | | | | | | | | | 15,761,407 | |
| | | | | |
Principal
Amount (000) | | | Description (1) | | | | | | | | Ratings (2) | | | Value | |
| | | |
| | | | U.S. GOVERNMENT AND AGENCY OBLIGATIONS – 2.2% | | | | | | | | | |
| | | | | |
| $ | 5,000 | | | U.S. Treasury Notes | | | | | | | | | | | Aaa | | | $ | 5,029,295 | |
| | | | | |
| | 10,000 | | | U.S. Treasury Notes | | | | | | | | | | | Aaa | | | | 9,982,810 | |
| $ | 15,000 | | | Total U.S. Government and Agency Obligations (cost $14,975,218) | | | | | | | | 15,012,105 | |
| | | | | |
Principal
Amount (000) | | | Description (1) | | Coupon | | | Maturity | | | Ratings (2) | | | Value | |
| | | |
| | | | ASSET-BACKED AND MORTGAGE-BACKED SECURITIES – 46.0% | | | | | | | |
| | | | | |
| $ | 604 | | | ACE Securities Corporation, Manufactured Housing Trust Series 2003-MH1 | | | 6.500% | | | | 8/15/30 | | | | AA | | | $ | 661,001 | |
| | | | | |
| | 3,752 | | | American Homes 4 Rent, Series 2014-SFR1 | | | 1.250% | | | | 6/17/31 | | | | Aaa | | | | 3,739,466 | |
| | | | | |
| | 5,170 | | | American Tower Company, 144A | | | 1.551% | | | | 3/15/43 | | | | Aaa | | | | 5,144,016 | |
| | | | | |
| | 4,446 | | | AmeriCold LLC Trust, Series 2010 | | | 1.687% | | | | 1/14/29 | | | | AAA | | | | 4,420,068 | |
| | | | | |
| | 443 | | | Amortizing Residential Collateral Trust Series 2002-BC4 M1 | | | 1.241% | | | | 7/25/32 | | | | Baa2 | | | | 433,360 | |
| | | | | |
| | 1,892 | | | Amortizing Residential Collateral Trust, Series 2002-BC7 | | | 0.951% | | | | 10/25/32 | | | | AA+ | | | | 1,748,340 | |
| | | | | |
| | 165 | | | Bank of America Commercial Mortgage Inc., Commercial Mortgage Pass-Through Certificates, Series 2005-4 | | | 4.933% | | | | 7/10/45 | | | | N/R | | | | 164,443 | |
| | | | | |
| | 2,415 | | | BXHTL Mortgage Trust, Series 2015-JWRZ | | | 1.418% | | | | 5/15/29 | | | | N/R | | | | 2,415,000 | |
| | | | | |
| | 3,000 | | | Cabela’s Master Credit Card Trust, Series 2011-A2 | | | 0.717% | | | | 2/18/20 | | | | AAA | | | | 3,006,630 | |
| | | | | |
| | 906 | | | California Republic Auto Receivables Trust 2013-2 | | | 1.230% | | | | 3/15/19 | | | | Aaa | | | | 908,215 | |
| | | | | |
| | 3,250 | | | California Republic Auto Receivables Trust, Series 2015-1 | | | 1.330% | | | | 4/15/19 | | | | AAA | | | | 3,258,512 | |
| | | | | |
| | 5,000 | | | CAM Mortgage Trust 2015-1 | | | 3.500% | | | | 7/15/64 | | | | N/R | | | | 5,000,000 | |
| | | | | |
| | 61 | | | CarFinance Capital Auto Trust, Automobile Receivables-Backed Notes, Series 2013-1, 144A | | | 1.650% | | | | 7/17/17 | | | | Aa1 | | | | 61,025 | |
| | | | | |
| | 1,499 | | | Centerpoint Energy Transition Bond Company LLC | | | 0.901% | | | | 4/15/18 | | | | AAA | | | | 1,499,251 | |
| | | | | |
| | 3,260 | | | CIT Mortgage Loan Trust, Mortgage Asset-Backed Pass-Through Certificates, Series 2007-1 | | | 1.641% | | | | 10/25/37 | | | | BB | | | | 3,111,960 | |
| | | | | |
| | 4,830 | | | CitiBank Credit Card Issuance Trust 2007-A8 | | | 5.650% | | | | 9/20/19 | | | | AAA | | | | 5,285,199 | |
| | | | | |
| | 159 | | | Citicorp Mortgage Securities I, REMIC Pass-Through Certificates, Series 2007-9 | | | 5.500% | | | | 12/25/22 | | | | Ba3 | | | | 159,253 | |
Nuveen Short Term Bond Fund (continued)
| | |
| Portfolio of Investments | | June 30, 2015 |
| | | | | | | | | | | | | | | | | | | | |
| | | | | |
Principal
Amount (000) | | | Description (1) | | Coupon | | | Maturity | | | Ratings (2) | | | Value | |
| | | |
| | | | ASSET-BACKED AND MORTGAGE-BACKED SECURITIES (continued) | | | | | | | |
| | | | | |
| $ | 261 | | | Citicorp Mortgage Securities Inc., REMIC Pass-Through Certificates, Series 2006-1 5A1 | | | 5.500% | | | | 2/25/26 | | | | Caa1 | | | $ | 265,779 | |
| | | | | |
| | 2,960 | | | Colony American Homes Trust 2015-1A | | | 2.136% | | | | 7/17/32 | | | | A2 | | | | 2,946,488 | |
| | | | | |
| | 6,300 | | | Commercial Mortgage Pass-Through Certificates, Series 2014-SAVA | | | 1.938% | | | | 6/15/34 | | | | AA | | | | 6,290,040 | |
| | | | | |
| | 4,470 | | | Commercial Mortgage Trust 2014-BBG | | | 0.988% | | | | 3/15/29 | | | | AAA | | | | 4,464,918 | |
| | | | | |
| | 2,398 | | | Consumer Credit Orgination Loan Trust, Series 2015-1 | | | 2.820% | | | | 3/15/21 | | | | Baa3 | | | | 2,411,678 | |
| | | | | |
| | 7,350 | | | Consumers Securitization Funding LLC, Series 2014-A | | | 1.334% | | | | 11/01/20 | | | | AAA | | | | 7,348,301 | |
| | | | | |
| | 642 | | | Countrywide Alternative Loan Trust, Mortgage Pass-Through Certificates,
Series 2006-19CB | | | 6.000% | | | | 8/25/36 | | | | Caa3 | | | | 586,601 | |
| | | | | |
| | 1,792 | | | Countrywide Asset Backed Certificates 2005-3 | | | 5.272% | | | | 8/25/35 | | | | Ba1 | | | | 1,811,145 | |
| | | | | |
| | 2,320 | | | Countrywide Asset Backed Certificates, Series 2007-4 A2 | | | 5.529% | | | | 4/25/47 | | | | Caa1 | | | | 2,449,265 | |
| | | | | |
| | 176 | | | Countrywide Home Loan Mortgage Pass-Through Trust, Series 2004-2 | | | 2.379% | | | | 2/25/34 | | | | A | | | | 171,293 | |
| | | | | |
| | 371 | | | Countrywide Home Loans, Asset Backed Certificates Series 2007-7 | | | 0.351% | | | | 10/25/47 | | | | B3 | | | | 369,238 | |
| | | | | |
| | 1,900 | | | Credit Suisse Commercial Mortgage Trust, 2014-ICE | | | 1.737% | | | | 4/15/27 | | | | A– | | | | 1,891,625 | |
| | | | | |
| | 6,216 | | | Credit Suisse Commercial Mortgage Trust, 2015-2 | | | 3.000% | | | | 2/25/45 | | | | AAA | | | | 6,266,434 | |
| | | | | |
| | 5,610 | | | Credit Suisse Commercial Mortgage Trust, Series 2013-6 | | | 2.500% | | | | 7/25/28 | | | | AAA | | | | 5,579,982 | |
| | | | | |
| | 486 | | | Credit Suisse First Boston Mortgage Securities Corporation, Mortgage-Backed Pass-Through Certificates, Series 2003-23 | | | 5.750% | | | | 9/25/33 | | | | AA+ | | | | 516,235 | |
| | | | | |
| | 3,489 | | | Credit-Based Asset Servicing and Securitization Pool 2007-SP1 | | | 6.020% | | | | 12/25/37 | | | | A+ | | | | 3,649,077 | |
| | | | | |
| | 2,241 | | | DBUBS Mortgage Trust, Commercial Mortgage Pass-Through Certificates,
Series 2011-LC3A | | | 3.642% | | | | 8/10/44 | | | | Aaa | | | | 2,281,042 | |
| | | | | |
| | 4,000 | | | Discover Card Master Trust 2013-A1 | | | 0.487% | | | | 8/17/20 | | | | AAA | | | | 3,999,352 | |
| | | | | |
| | 2,500 | | | Drive Auto Receivables Trust, Series 2015-AA | | | 1.010% | | | | 11/15/17 | | | | AAA | | | | 2,501,080 | |
| | | | | |
| | 5,604 | | | DT Auto Owner Trust, Series 2014-3A | | | 0.980% | | | | 4/16/18 | | | | AAA | | | | 5,603,239 | |
| | | | | |
| | 6,437 | | | Entergy Arkansas Restoration Funding LLC, Senior Secured Storm Recovery Bonds, Series 2010-A | | | 2.300% | | | | 8/01/21 | | | | AAA | | | | 6,564,360 | |
| | | | | |
| | 4,088 | | | Entergy Louisiana Investment Recovery Funding LLC, Series 2011-A | | | 2.040% | | | | 9/01/23 | | | | AAA | | | | 4,075,425 | |
| | | | | |
| | 36 | | | Equivantage Acceptance Corporation, Home Equity Loan Asset-Backed Certificates, Series 1996-4 | | | 7.250% | | | | 1/25/28 | | | | N/R | | | | 36,092 | |
| | | | | |
| | 853 | | | Fannie Mae Alternative Credit Enhanced Securities | | | 2.210% | | | | 9/25/20 | | | | Aaa | | | | 870,926 | |
| | | | | |
| | 3,893 | | | Fannie Mae Connecticut Avenue Securities , Series 2014-C04 | | | 2.141% | | | | 11/25/24 | | | | AAA | | | | 3,922,166 | |
| | | | | |
| | 803 | | | Fannie Mae Mortgage Interest Strips 366 25, (I/O) | | | 5.000% | | | | 9/25/24 | | | | Aaa | | | | 60,156 | |
| | | | | |
| | 1,460 | | | Fannie Mae Mortgage Pool MA0771 | | | 3.500% | | | | 6/01/21 | | | | Aaa | | | | 1,540,461 | |
| | | | | |
| | 122 | | | Fannie Mae Mortgage Pool 433988 | | | 2.321% | | | | 11/01/25 | | | | Aaa | | | | 129,797 | |
| | | | | |
| | 1,292 | | | Fannie Mae Mortgage Pool AL2720 | | | 3.000% | | | | 11/01/27 | | | | Aaa | | | | 1,341,291 | |
| | | | | |
| | 112 | | | Fannie Mae Mortgage Pool 625338 | | | 2.228% | | | | 6/01/31 | | | | Aaa | | | | 116,125 | |
| | | | | |
| | 485 | | | Fannie Mae Mortgage Pool 535363 | | | 5.091% | | | | 12/01/31 | | | | Aaa | | | | 517,982 | |
| | | | | |
| | 8 | | | Fannie Mae Mortgage Pool 545791 | | | 2.478% | | | | 3/01/32 | | | | Aaa | | | | 8,346 | |
| | | | | |
| | 114 | | | Fannie Mae Mortgage Pool 634948 | | | 2.540% | | | | 5/01/32 | | | | Aaa | | | | 119,153 | |
| | | | | |
| | 53 | | | Fannie Mae Mortgage Pool 545717 | | | 2.248% | | | | 5/01/32 | | | | Aaa | | | | 54,720 | |
| | | | | |
| | 17 | | | Fannie Mae Mortgage Pool 661645 | | | 2.204% | | | | 10/01/32 | | | | Aaa | | | | 16,925 | |
| | | | | | | | | | | | | | | | | | | | |
| | | | | |
Principal
Amount (000) | | | Description (1) | | Coupon | | | Maturity | | | Ratings (2) | | | Value | |
| | | |
| | | | ASSET-BACKED AND MORTGAGE-BACKED SECURITIES (continued) | | | | | | | |
| | | | | |
| $ | 42 | | | Fannie Mae Mortgage Pool 671884 | | | 2.240% | | | | 12/01/32 | | | | Aaa | | | $ | 43,192 | |
| | | | | |
| | 1,171 | | | Fannie Mae Mortgage Pool AD0486 | | | 2.404% | | | | 4/01/34 | | | | Aaa | | | | 1,247,662 | |
| | | | | |
| | 123 | | | Fannie Mae Mortgage Pool 775389 | | | 2.132% | | | | 4/01/34 | | | | Aaa | | | | 128,391 | |
| | | | | |
| | 923 | | | Fannie Mae Mortgage Pool 725721 | | | 2.382% | | | | 6/01/34 | | | | Aaa | | | | 981,921 | |
| | | | | |
| | 858 | | | Fannie Mae Mortgage Pool 795242 | | | 1.925% | | | | 7/01/34 | | | | Aaa | | | | 901,897 | |
| | | | | |
| | 779 | | | Fannie Mae Mortgage Pool 841068 | | | 2.498% | | | | 11/01/34 | | | | Aaa | | | | 834,933 | |
| | | | | |
| | 806 | | | Fannie Mae Mortgage Pool 797182 | | | 2.323% | | | | 11/01/34 | | | | Aaa | | | | 854,364 | |
| | | | | |
| | 808 | | | Fannie Mae Mortgage Pool 745922 | | | 2.336% | | | | 7/01/35 | | | | Aaa | | | | 860,884 | |
| | | | | |
| | 565 | | | Fannie Mae Mortgage Pool 838958 | | | 2.186% | | | | 8/01/35 | | | | Aaa | | | | 599,815 | |
| | | | | |
| | 79 | | | Fannie Mae Mortgage Pool 838948 | | | 1.885% | | | | 8/01/35 | | | | Aaa | | | | 83,567 | |
| | | | | |
| | 358 | | | Fannie Mae Mortgage Pool 848390 | | | 1.978% | | | | 12/01/35 | | | | Aaa | | | | 376,276 | |
| | | | | |
| | 418 | | | Fannie Mae Mortgage Pool 886034 | | | 2.702% | | | | 7/01/36 | | | | Aaa | | | | 448,884 | |
| | | | | |
| | 1,481 | | | Fannie Mae Mortgage Pool AE0058 | | | 2.418% | | | | 7/01/36 | | | | Aaa | | | | 1,578,568 | |
| | | | | |
| | 111 | | | Fannie Mae Mortgage Pool 555369 | | | 2.360% | | | | 8/01/36 | | | | Aaa | | | | 118,487 | |
| | | | | |
| | 370 | | | Fannie Mae Mortgage Pool 995949 | | | 2.459% | | | | 9/01/36 | | | | Aaa | | | | 393,402 | |
| | | | | |
| | 974 | | | Fannie Mae Mortgage Pool AD0550 | | | 2.244% | | | | 8/01/37 | | | | Aaa | | | | 1,039,729 | |
| | | | | |
| | 1,283 | | | Fannie Mae Real Estate Mortgage Investment Conduit, Pass-Through Certificates 2013-M3 ASQ2 | | | 1.083% | | | | 2/25/16 | | | | Aaa | | | | 1,285,665 | |
| | | | | |
| | 21 | | | Fannie Mae Real Estate Mortgage Investment Conduit, Pass-Through Certificates 1992-150 MA | | | 5.500% | | | | 9/25/22 | | | | Aaa | | | | 22,841 | |
| | | | | |
| | 15 | | | Fannie Mae Real Estate Mortgage Investment Conduit, Pass-Through Certificates 2004-90 GA | | | 4.350% | | | | 3/25/34 | | | | Aaa | | | | 15,314 | |
| | | | | |
| | 481 | | | Fannie Mae Real Estate Mortgage Investment Conduit, Pass-Through Certificates 2004-90 GF | | | 0.491% | | | | 11/25/34 | | | | Aaa | | | | 482,756 | |
| | | | | |
| | 696 | | | Fannie Mae REMIC Pass-Through Certificates 2011-6 BA | | | 2.750% | | | | 6/25/20 | | | | Aaa | | | | 713,857 | |
| | | | | |
| | 3,094 | | | Fannie Mae, Connecticut Avenue Securities Series 2014-C01 | | | 1.791% | | | | 1/25/24 | | | | AA+ | | | | 3,111,934 | |
| | | | | |
| | 3,813 | | | Fannie Mae, Connecticut Avenue Securities, Series 2014-C03 | | | 1.391% | | | | 7/25/24 | | | | Aaa | | | | 3,810,301 | |
| | | | | |
| | 2,063 | | | FDIC Structures Sale Guaranteed Notes, Series 2010-S1 | | | 3.250% | | | | 4/25/38 | | | | Aaa | | | | 2,113,996 | |
| | | | | |
| | 801 | | | FDIC Structures Sale Guaranteed Notes, Series 2010-S1 | | | 0.737% | | | | 2/25/48 | | | | Aaa | | | | 801,081 | |
| | | | | |
| | 63 | | | FDIC Trust 2012-C1 | | | 0.841% | | | | 5/25/35 | | | | Aaa | | | | 63,424 | |
| | | | | |
| | 7 | | | Federal Home Loan Mortgage Corporation, REMIC 1022 J | | | 6.000% | | | | 12/15/20 | | | | Aaa | | | | 7,199 | |
| | | | | |
| | 2,500 | | | Fifth Third Auto Trust, Series 2013 A B | | | 1.210% | | | | 4/15/19 | | | | Aaa | | | | 2,507,765 | |
| | | | | |
| | 2,283 | | | Ford Credit Auto Owners Trust 2013-B | | | 0.570% | | | | 10/15/17 | | | | AAA | | | | 2,282,800 | |
| | | | | |
| | 204 | | | Freddie Mac Gold Pool 786591 | | | 2.508% | | | | 12/01/26 | | | | Aaa | | | | 212,353 | |
| | | | | |
| | 142 | | | Freddie Mac Gold Pool 846946 | | | 2.371% | | | | 1/01/29 | | | | Aaa | | | | 149,365 | |
| | | | | |
| | 95 | | | Freddie Mac Gold Pool 786853 | | | 2.260% | | | | 10/01/29 | | | | Aaa | | | | 98,078 | |
| | | | | |
| | 17 | | | Freddie Mac REMICR 2629 BO | | | 3.250% | | | | 3/15/18 | | | | Aaa | | | | 16,641 | |
| | | | | |
| | 176 | | | Freddie Mac Gold Pool 972055 | | | 3.589% | | | | 4/01/30 | | | | Aaa | | | | 187,711 | |
| | | | | |
| | 43 | | | Freddie Mac Gold Pool 847014 | | | 2.096% | | | | 5/01/30 | | | | Aaa | | | | 44,203 | |
| | | | | |
| | 653 | | | Freddie Mac Gold Pool 847241 | | | 2.352% | | | | 10/01/30 | | | | Aaa | | | | 675,275 | |
Nuveen Short Term Bond Fund (continued)
| | |
| Portfolio of Investments | | June 30, 2015 |
| | | | | | | | | | | | | | | | | | | | |
| | | | | |
Principal
Amount (000) | | | Description (1) | | Coupon | | | Maturity | | | Ratings (2) | | | Value | |
| | | |
| | | | ASSET-BACKED AND MORTGAGE-BACKED SECURITIES (continued) | | | | | | | |
| | | | | |
| $ | 70 | | | Freddie Mac Gold Pool 847367 | | | 2.212% | | | | 6/01/31 | | | | Aaa | | | $ | 73,372 | |
| | | | | |
| | 1,062 | | | Freddie Mac Gold Pool 847331 | | | 2.266% | | | | 8/01/32 | | | | Aaa | | | | 1,121,773 | |
| | | | | |
| | 356 | | | Freddie Mac Gold Pool 847652 | | | 2.385% | | | | 9/01/32 | | | | Aaa | | | | 368,550 | |
| | | | | |
| | 74 | | | Freddie Mac Gold Pool 847063 | | | 2.534% | | | | 10/01/32 | | | | Aaa | | | | 78,636 | |
| | | | | |
| | 398 | | | Freddie Mac Gold Pool 780456 | | | 2.472% | | | | 5/01/33 | | | | Aaa | | | | 423,225 | |
| | | | | |
| | 729 | | | Freddie Mac Gold Pool 780911 | | | 2.344% | | | | 10/01/33 | | | | Aaa | | | | 780,733 | |
| | | | | |
| | 891 | | | Freddie Mac Gold Pool 781296 | | | 2.471% | | | | 3/01/34 | | | | Aaa | | | | 952,219 | |
| | | | | |
| | 1,222 | | | Freddie Mac Gold Pool 848193 | | | 2.351% | | | | 3/01/36 | | | | Aaa | | | | 1,299,971 | |
| | | | | |
| | 84 | | | Freddie Mac Mortgage Pool, Various M30035 | | | 4.500% | | | | 4/01/22 | | | | Aaa | | | | 86,045 | |
| | | | | |
| | 3,587 | | | Freddie Mac Mortgage Trust 2013-KF02 | | | 3.191% | | | | 12/25/45 | | | | AAA | | | | 3,692,753 | |
| | | | | |
| | 1,000 | | | Freddie Mac Mortgage Trust, Multifamily Mortgage Pass-Through Certificates, Series 2012-K711 | | | 3.562% | | | | 8/25/45 | | | | Aaa | | | | 1,036,373 | |
| | | | | |
| | 680 | | | Freddie Mac Multi-Class CertificatesR 3780 FE | | | 0.587% | | | | 12/15/20 | | | | Aaa | | | | 684,050 | |
| | | | | |
| | 4,075 | | | Freddie Mac MultiFamily Mortgage Trust, Structured Pass-Through Certificates, Series 2012-K501 | | | 3.421% | | | | 11/25/46 | | | | AAA | | | | 4,153,982 | |
| | | | | |
| | 2,960 | | | Freddie Mac MultiFamily Mortgage Trust, Structured Pass-Through Certificates, Series 2013-K502 | | | 3.184% | | | | 3/25/45 | | | | AAA | | | | 3,007,156 | |
| | | | | |
| | 518 | | | Freddie Mac Non Gold Participation Certificates 1L1462 | | | 2.338% | | | | 8/01/36 | | | | Aaa | | | | 551,499 | |
| | | | | |
| | 3,500 | | | GAHR Commercial Mortgage Trust, Commercial Mortgage Pass-Through Certificates, Series 2015-NRF | | | 1.482% | | | | 12/15/16 | | | | AAA | | | | 3,499,472 | |
| | | | | |
| | 376 | | | GE Equipment Transportation LLC, Equipment Loan Asset Backed Securities, Series 2013-2 | | | 0.610% | | | | 6/24/16 | | | | Aaa | | | | 375,765 | |
| | | | | |
| | 2,500 | | | General Electric Capital Commercial Mortgage Corporation, Commercial Mortgage Pass-Through Certificates, Series 2007-C1 | | | 5.606% | | | | 12/10/49 | | | | Ba3 | | | | 2,608,330 | |
| | | | | |
| | 2,000 | | | Goldman Sachs Mortgage Securities Corporation II, Commercial Mortgage Pass -Through Certificates, Series 2014-GSFL | | | 2.437% | | | | 7/15/31 | | | | A– | | | | 1,977,054 | |
| | | | | |
| | 2,900 | | | Goldman Sachs Mortgage Securities Corporation II, Commercial Mortgage Pass -Through Certificates, Series 2014-GSFL | | | 1.187% | | | | 7/15/31 | | | | AAA | | | | 2,894,847 | |
| | | | | |
| | 2,128 | | | Goldman Sachs Mortgage Securities Corporation II, Commercial Mortgage Pass-Through Certificates, Series 2010-C1 | | | 3.679% | | | | 8/10/43 | | | | Aaa | | | | 2,204,989 | |
| | | | | |
| | 3,102 | | | Goldman Sachs Mortgage Securities Corporation II, Commercial Mortgage Pass-Through Certificates, Series 2011-GC3 | | | 3.645% | | | | 3/10/44 | | | | Aaa | | | | 3,127,222 | |
| | | | | |
| | 2,130 | | | Goldman Sachs Mortgage Securities Corporation, Commercial Mortgage Pass- Through Certificates, Series 2011-GC5 | | | 2.999% | | | | 8/10/44 | | | | Aaa | | | | 2,167,007 | |
| | | | | |
| | 55 | | | Government National Mortgage Association Pool 8824 | | | 2.000% | | | | 8/20/21 | | | | Aaa | | | | 55,874 | |
| | | | | |
| | 76 | | | Government National Mortgage Association Pool 8006 | | | 1.625% | | | | 7/20/22 | | | | Aaa | | | | 77,847 | |
| | | | | |
| | 55 | | | Government National Mortgage Association Pool 8699 | | | 1.625% | | | | 9/20/25 | | | | Aaa | | | | 57,039 | |
| | | | | |
| | 43 | | | Government National Mortgage Association Pool 8847 | | | 1.625% | | | | 4/20/26 | | | | Aaa | | | | 45,057 | |
| | | | | |
| | 16 | | | Government National Mortgage Association Pool 80106 | | | 1.625% | | | | 8/20/27 | | | | Aaa | | | | 16,844 | |
| | | | | |
| | 23 | | | Government National Mortgage Association Pool 80154 | | | 1.750% | | | | 1/20/28 | | | | Aaa | | | | 23,648 | |
| | | | | |
| | 64 | | | Government National Mortgage Association Pool 80283 | | | 1.625% | | | | 5/20/29 | | | | Aaa | | | | 66,511 | |
| | | | | |
| | 115 | | | Government National Mortgage Association Pool 80469 | | | 1.625% | | | | 11/20/30 | | | | Aaa | | | | 120,026 | |
| | | | | | | | | | | | | | | | | | | | |
| | | | | |
Principal
Amount (000) | | | Description (1) | | Coupon | | | Maturity | | | Ratings (2) | | | Value | |
| | | |
| | | | ASSET-BACKED AND MORTGAGE-BACKED SECURITIES (continued) | | | | | | | |
| | | | | |
| $ | 38 | | | Government National Mortgage Association Pool 80507 | | | 1.625% | | | | 4/20/31 | | | | Aaa | | | $ | 39,772 | |
| | | | | |
| | 142 | | | Government National Mortgage Association Pool 80535 | | | 1.625% | | | | 8/20/31 | | | | Aaa | | | | 147,439 | |
| | | | | |
| | 28 | | | Government National Mortgage Association Pool 80580 | | | 1.750% | | | | 2/20/32 | | | | Aaa | | | | 28,637 | |
| | | | | |
| | 255 | | | Government National Mortgage Association, Guaranteed REMIC Pass-Through Securities and MX Securities Trust 2009-62 EJ | | | 4.500% | | | | 5/16/38 | | | | Aaa | | | | 263,970 | |
| | | | | |
| | 4,525 | | | GP Portfolio Trust 2014-GPP A | | | 2.938% | | | | 2/15/27 | | | | BBB– | | | | 4,531,692 | |
| | | | | |
| | 4,500 | | | Greenwich Capital Commercial Funding Corporation, Commercial Mortgage Pass-Through Certificates Series 2007-GG9 | | | 5.475% | | | | 3/10/39 | | | | BBB | | | | 4,699,391 | |
| | | | | |
| | 500 | | | Home Loan Servicing Solutions, HLSS Servicer Advance Receivables Backed Notes 2012-T2 | | | 4.940% | | | | 10/15/45 | | | | BBB | | | | 499,500 | |
| | | | | |
| | 3,000 | | | Home Loan Servicing Solutions, HLSS Servicer Advance Receivables Backed Notes 2013-T5 | | | 1.979% | | | | 8/15/46 | | | | AAA | | | | 2,997,000 | |
| | | | | |
| | 5,000 | | | Home Loan Servicing Solutions, HLSS Servicer Advance Receivables Backed Notes 2013-T7 | | | 1.981% | | | | 11/15/46 | | | | AAA | | | | 4,975,000 | |
| | | | | |
| | 3,100 | | | Huntingto Auto Trust, Motor Vehicle Installment Payments, Series 2015-1 | | | 1.950% | | | | 6/15/21 | | | | AA+ | | | | 3,104,935 | |
| | | | | |
| | 2,500 | | | Hyatt Hotel Portfolio Trust, Mortgage Pass-Through Certificate, Series 2015-HYT | | | 1.886% | | | | 11/15/29 | | | | AA– | | | | 2,504,720 | |
| | | | | |
| | 716 | | | IMC Home Mortgage Company, Home Equity Loan Pass-Through Certificates, Series 1998-3 | | | 6.720% | | | | 8/20/29 | | | | AA | | | | 736,723 | |
| | | | | |
| | 4,691 | | | Impac Secured Assets Corporation, Mortgage Pass-Through Certificates, Series 2006-5 2A | | | 0.391% | | | | 12/25/36 | | | | Baa2 | | | | 4,411,145 | |
| | | | | |
| | 240 | | | IndyMac INDX Mortgage Loan Trust, Pass-Through Certificates, Series 2005-AR1 | | | 2.492% | | | | 3/25/35 | | | | BBB+ | | | | 239,425 | |
| | | | | |
| | 2,500 | | | Invitation Homes Trust 2013-SFR1 | | | 2.400% | | | | 12/17/30 | | | | Baa2 | | | | 2,442,733 | |
| | | | | |
| | 4,680 | | | Invitation Homes Trust 2013-SFR1 | | | 1.600% | | | | 12/17/30 | | | | Aa2 | | | | 4,617,480 | |
| | | | | |
| | 3,787 | | | Invitation Homes Trust 2014-SFR2 | | | 1.788% | | | | 9/17/31 | | | | Aa2 | | | | 3,764,142 | |
| | | | | |
| | 2,000 | | | Invitation Homes Trust 2014-SFR2 | | | 1.288% | | | | 9/17/31 | | | | Aaa | | | | 1,979,710 | |
| | | | | |
| | 2,000 | | | John Deere Owner Trust, Series 2015-A | | | 1.320% | | | | 6/17/19 | | | | Aaa | | | | 2,006,136 | |
| | | | | |
| | 142 | | | JPMorgan Chase Commercial Mortgage Securities Corporation, Commercial Mortgage Pass-Through Certificates, Series 2010-C1 | | | 3.853% | | | | 6/15/43 | | | | Aaa | | | | 141,754 | |
| | | | | |
| | 1,527 | | | JPMorgan Chase Commercial Mortgage Securities Corporation, Commercial Mortgage Pass-Through Certificates, Series 2010-C2 A1 | | | 2.749% | | | | 11/15/43 | | | | AAA | | | | 1,533,731 | |
| | | | | |
| | 3,000 | | | JPMorgan Chase Commercial Mortgage Securities Corporation, Pass-Through Certificates 2006-LDP6 | | | 5.565% | | | | 4/15/43 | | | | Baa3 | | | | 3,055,092 | |
| | | | | |
| | 3,808 | | | Master Resecuritization Trust 2009-1 | | | 6.000% | | | | 10/25/36 | | | | A | | | | 4,012,939 | |
| | | | | |
| | 1,013 | | | Mercedes-Benz Auto Receivables Trust 2012-1 | | | 0.470% | | | | 10/17/16 | | | | AAA | | | | 1,013,222 | |
| | | | | |
| | 768 | | | Merrill Lynch Mortgage Investors Inc., C-BASS Mortgage Loan Asset Backed Certificates Series 2004-CB8 | | | 5.158% | | | | 12/25/35 | | | | AAA | | | | 767,785 | |
| | | | | |
| | 2,750 | | | ML_CFC Commercial Mortgage Trust, Pass-Through Certificates, Series 2007-8 | | | 5.881% | | | | 8/12/49 | | | | BB | | | | 2,825,391 | |
| | | | | |
| | 47 | | | Mortgage Asset Securitization Transaction Inc., Alternative Loan Trust Mortgage Pass-Through Certificates, Series 2004-13 | | | 8.000% | | | | 1/25/35 | | | | BB | | | | 47,268 | |
Nuveen Short Term Bond Fund (continued)
| | |
| Portfolio of Investments | | June 30, 2015 |
| | | | | | | | | | | | | | | | | | | | |
| | | | | |
Principal
Amount (000) | | | Description (1) | | Coupon | | | Maturity | | | Ratings (2) | | | Value | |
| | | |
| | | | ASSET-BACKED AND MORTGAGE-BACKED SECURITIES (continued) | | | | | | | |
| | | | | |
| $ | 1,042 | | | National Credit Union Administration Guaranteed Structured Collateral Notes | | | 2.900% | | | | 10/29/20 | | | | AAA | | | $ | 1,069,117 | |
| | | | | |
| | 906 | | | National Credit Union Administration, Guaranteed Notes Series 2011-R1 | | | 0.637% | | | | 1/08/20 | | | | Aaa | | | | 910,772 | |
| | | | | |
| | 228 | | | National Credit Union Administration, Guaranteed Notes, Series 2010-R1 | | | 1.840% | | | | 10/07/20 | | | | Aaa | | | | 229,308 | |
| | | | | |
| �� | 1,300 | | | Nationstar Agency Fund Trust, Series 2013-T2A | | | 4.212% | | | | 2/18/48 | | | | BBB | | | | 1,307,852 | |
| | | | | |
| | 3,629 | | | New Residential Mortgage Loan Trust, Mortgage Pass-Through Certificates, Series 2014-2A | | | 3.750% | | | | 5/25/54 | | | | AAA | | | | 3,748,965 | |
| | | | | |
| | 1,800 | | | New Residential Mortgage Loan Trust, Mortgage Pass-Through Certificates, Series 2015-A1 | | | 3.750% | | | | 4/25/52 | | | | Aaa | | | | 1,843,471 | |
| | | | | |
| | 2,000 | | | NLY Commercial Mortgage Trust 2014-FL1 | | | 2.787% | | | | 11/15/30 | | | | A– | | | | 1,998,532 | |
| | | | | |
| | 3,297 | | | PennyMac Loan Trust, Series 2015-NPL1 | | | 4.000% | | | | 3/25/55 | | | | N/R | | | | 3,293,878 | |
| | | | | |
| | 1,096 | | | Porsche Financial Auto Securitization Trust 2104-1 | | | 0.380% | | | | 9/23/16 | | | | AAA | | | | 1,095,598 | |
| | | | | |
| | 370 | | | RBSSP Resecuritization Trust 2009-10 | | | 0.287% | | | | 3/26/37 | | | | N/R | | | | 170,706 | |
| | | | | |
| | 1,925 | | | RBSSP Resecuritization Trust 2009-5 | | | 0.687% | | | | 8/26/37 | | | | BBB | | | | 1,844,813 | |
| | | | | |
| | 2,742 | | | RBSSP Resecuritization Trust, Series 2012-8 1A1 | | | 0.370% | | | | 10/26/36 | | | | N/R | | | | 2,637,458 | |
| | | | | |
| | 3,030 | | | Residential Asset Mortgage Products, Pass-Through Certificates, 2006-RZ4 | | | 0.371% | | | | 10/25/36 | | | | Ba1 | | | | 2,980,967 | |
| | | | | |
| | 3,000 | | | Santander Drive Auto Receivables Trust, Series 2014-1 | | | 1.590% | | | | 10/15/18 | | | | AA | | | | 3,009,519 | |
| | | | | |
| | 4,000 | | | Silverstone Master Issuer PLC, Mortgage Pass-Through Certificate, Series 2015-1A | | | 0.842% | | | | 1/21/70 | | | | AAA | | | | 4,013,152 | |
| | | | | |
| | 1,079 | | | Springleaf Mortgage Loan Trust, Series 2012-3 | | | 1.570% | | | | 12/25/59 | | | | AAA | | | | 1,080,826 | |
| | | | | |
| | 4,499 | | | Springleaf Mortgage Loan Trust, Series 2013-3A | | | 1.870% | | | | 9/25/57 | | | | AAA | | | | 4,488,644 | |
| | | | | |
| | 117 | | | Structured Adjustable Rate Mortgage Loan Trust, Mortgage Pass-Through Certificates, Series 2004-11 | | | 2.518% | | | | 8/25/34 | | | | N/R | | | | 116,429 | |
| | | | | |
| | 3,099 | | | Structured Agency Credit Risk 2014-DN1 | | | 1.191% | | | | 2/25/24 | | | | A1 | | | | 3,097,606 | |
| | | | | |
| | 6,335 | | | Structured Agency Credit Risk Debt Notes 2014-DN2 | | | 1.041% | | | | 4/25/24 | | | | A | | | | 6,325,407 | |
| | | | | |
| | 4,054 | | | Structured Agency Credit Risk Debt Notes, 2013-DN2 | | | 1.641% | | | | 11/25/23 | | | | Baa1 | | | | 4,059,224 | |
| | | | | |
| | 500 | | | Sway Residential Trust, Series 2014-1 | | | 4.486% | | | | 1/17/32 | | | | N/R | | | | 507,245 | |
| | | | | |
| | 334 | | | Thornburg Mortgage Securities Trust, Mortgage Loan Pass-Through Certificates, Series 2007-4 | | | 6.088% | | | | 9/25/37 | | | | BBB+ | | | | 342,883 | |
| | | | | |
| | 2,418 | | | Truman Capital Mortgage Loant Trust, Series 2014-NPL3 | | | 3.125% | | | | 4/25/53 | | | | N/R | | | | 2,415,622 | |
| | | | | |
| | 489 | | | U.S. Small Business Administration Guaranteed Participating Securities Participation Certificates, Series 2005-10B | | | 4.940% | | | | 8/10/15 | | | | Aaa | | | | 490,976 | |
| | | | | |
| | 2 | | | U.S. Small Business Administration Guaranteed Participating Securities Participation Certificates, Series 2006-10A | | | 5.408% | | | | 2/10/16 | | | | Aaa | | | | 1,683 | |
| | | | | |
| | 116 | | | U.S. Small Business Administration Guaranteed Participating Securities, Participation Certificates, Series 2007-10A | | | 5.459% | | | | 2/10/17 | | | | Aaa | | | | 122,867 | |
| | | | | |
| | 2,268 | | | UBS-Barclays Commercial Mortgage Trust 2012-C2 | | | 1.006% | | | | 5/10/63 | | | | Aaa | | | | 2,270,955 | |
| | | | | |
| | 2,884 | | | US Residential Opportunity Fund Trust, Series 2015-1A | | | 3.721% | | | | 1/27/35 | | | | N/R | | | | 2,884,904 | |
| | | | | |
| | 2,968 | | | Vericrest Opportunity Loan Transferee, Series 2014-NPL8 | | | 3.375% | | | | 10/26/54 | | | | N/R | | | | 2,967,845 | |
| | | | | |
| | 3,128 | | | Vornado DP LLC Commercial Mortgage Credit Tenant Lease Series 2010-VNO | | | 2.970% | | | | 9/13/28 | | | | AAA | | | | 3,228,477 | |
| | | | | | | | | | | | | | | | | | | | |
| | | | | |
Principal
Amount (000) | | | Description (1) | | Coupon | | | Maturity | | | Ratings (2) | | | Value | |
| | | |
| | | | ASSET-BACKED AND MORTGAGE-BACKED SECURITIES (continued) | | | | | | | |
| | | | | |
| $ | 4,066 | | | Walter Investment Management Company Capital Trust, Series 2012-AA | | | 4.549% | | | | 10/16/50 | | | | BBB | | | $ | 4,098,407 | |
| | | | | |
| | 2,002 | | | Wells Fargo Home Equity Trust, Series 2005-2 | | | 0.731% | | | | 4/25/35 | | | | A+ | | | | 1,892,512 | |
| | | | | |
| | 445 | | | Wells Fargo Mortgage Backed Securities Trust, Mortgage Pass-Through Certificate Series 2007-2 | | | 5.750% | | | | 3/25/37 | | | | Caa2 | | | | 433,151 | |
| | | | | |
| | 940 | | | Wells Fargo Mortgage Backed Securities Trust, Mortgage Pass-Through Certificate Series 2006-AR14 | | | 2.633% | | | | 10/25/36 | | | | Caa2 | | | | 871,464 | |
| | | | | |
| | 22 | | | Wells Fargo Mortgage Backed Securities, 2005-AR16 Class 3A2 | | | 2.642% | | | | 3/25/35 | | | | BBB– | | | | 20,980 | |
| $ | 316,203 | | | Total Asset-Backed and Mortgage-Backed Securities (cost $316,606,483) | | | | | | | | | | | | 317,773,823 | |
| | | | | |
Principal
Amount (000) (6) | | | Description (1) | | Coupon | | | Maturity | | | Ratings (2) | | | Value | |
| | | | | |
| | | | SOVEREIGN DEBT – 0.5% | | | | | | | | | | | | | | | | |
| | | | | |
| | | | Mexico – 0.5% | | | | | | | | | | | | | | | | |
| | | | | |
| | 495 | MXN | | Mexico Bonos de DeSarrollo | | | 6.250% | | | | 6/16/16 | | | | A | | | $ | 3,232,738 | |
| | | | Total Sovereign Debt (cost $3,723,599) | | | | | | | | | | | | | | | 3,232,738 | |
| | | | Total Long-Term Investments (cost $676,747,859) | | | | | | | | 678,654,146 | |
| | | | | |
| Shares | | | Description (1) | | Coupon | | | | | | | | | Value | |
| | | |
| | | | INVESTMENTS PURCHASED WITH COLLATERAL FROM SECURITIES LENDING – 4.7% | | | | | | | | | |
| | | | | |
| | | | Money Market Funds – 4.7% | | | | | | | | | | | | | | | | |
| | | | | |
| | 32,274,464 | | | Mount Vernon Securities Lending Trust Prime Portfolio, (8) | | | 0.234% (7) | | | | | | | | | | | $ | 32,274,464 | |
| | | | Total Investments Purchased with Collateral from Securities Lending (cost $32,274,464) | | | | 32,274,464 | |
| | | | | |
| Shares | | | Description (1) | | Coupon | | | | | | | | | Value | |
| | | | | |
| | | | SHORT-TERM INVESTMENTS – 1.2% | | | | | | | | | | | | | | | | |
| | | | | |
| | | | Money Market Funds – 1.2% | | | | | | | | | | | | | | | | |
| | | | | |
| | 8,574,230 | | | First American Treasury Obligations Fund, Class Z | | | 0.000% (7) | | | | | | | | | | | $ | 8,574,230 | |
| | | | Total Short-Term Investments (cost $8,574,230) | | | | | | | | 8,574,230 | |
| | | | Total Investments (cost $717,596,553) – 104.2% | | | | | | | | 719,502,840 | |
| | | | Other Assets Less Liabilities – (4.2)% (9) | | | | | | | | (28,778,855 | ) |
| | | | Net Assets – 100% | | | | | | | | | | | | | | $ | 690,723,985 | |
Investments in Derivatives as of June 30, 2015
Interest Rate Swaps outstanding:
| | | | | | | | | | | | | | | | | | | | | | | | | | | | | | | | |
| Counterparty | | Notional
Amount | | | Fund
Pay/Receive
Floating Rate | | | Floating Rate Index | | | Fixed Rate
(Annualized) | | | Fixed Rate
Payment
Frequency | | | Termination
Date | | | Value | | | Unrealized
Appreciation
(Depreciation) | |
JPMorgan* | | $ | 10,000,000 | | | | Receive | | | | 3-Month USD-LIBOR-ICE | | | | 2.739 | % | | | Semi-Annually | | | | 11/21/23 | | | $ | (374,124 | ) | | $ | (374,527 | ) |
JPMorgan* | | | 23,000,000 | | | | Receive | | | | 3-Month USD-LIBOR-ICE | | | | 2.354 | | | | Semi-Annually | | | | 5/21/25 | | | | 116,211 | | | | 116,211 | |
| | | $ | 33,000,000 | | | | | | | | | | | | | | | | | | | | | | | $ | (257,913 | ) | | $ | (258,316 | ) |
| * | Citigroup is the clearing broker for this transaction. |
Nuveen Short Term Bond Fund (continued)
| | |
| Portfolio of Investments | | June 30, 2015 |
Investments in Derivatives as of June 30, 2015 (continued)
Futures Contracts outstanding:
| | | | | | | | | | | | | | | | | | | | | | | | |
| Description | | Contract
Position | | | Number of
Contracts | | | Contract
Expiration | | | Notional
Amount at Value* | | | Variation Margin
Receivable/
Payable | | | Unrealized
Appreciation
(Depreciation) | |
U.S. Treasury 2-Year Note | | | Short | | | | (137 | ) | | | 9/15 | | | $ | (29,994,438 | ) | | $ | 6,422 | | | $ | (94,511 | ) |
U.S. Treasury 5-Year Note | | | Short | | | | (667 | ) | | | 9/15 | | | | (79,544,961 | ) | | | 26,054 | | | | (21,682 | ) |
U.S. Treasury 10-Year Note | | | Long | | | | 346 | | | | 9/15 | | | | 43,655,469 | | | | (10,813 | ) | | | (83,792 | ) |
| | | | | | | | | | | | | | | $ | (65,883,930 | ) | | $ | 21,663 | | | $ | (199,985 | ) |
* The aggregate Notional Amount at Value of long and short positions is $43,655,469 and $(109,539,399), respectively. | | | | | |
For Fund portfolio compliance purposes, the Fund’s industry classifications refer to any one or more of the industry sub-classifications used by one or more widely recognized market indexes or ratings group indexes, and/or as defined by Fund management. This definition may not apply for purposes of this report, which may combine industry sub-classifications into sectors for reporting ease.
| (1) | All percentages shown in the Portfolio of Investments are based on net assets. |
| (2) | Ratings (not covered by the report of independent registered public accounting firm): Using the highest of Standard & Poor’s Group (“Standard & Poor’s”), Moody’s Investors Service, Inc. (“Moody’s”) or Fitch, Inc. (“Fitch”) rating. Ratings below BBB by Standard & Poor’s, Baa by Moody’s or BBB by Fitch are considered to be below investment grade. Holdings designated N/R are not rated by any of these national rating agencies. |
| (3) | Investment, or a portion of investment, is out on loan for securities lending. The total value of the securities out on loan as of the end of the reporting period was $31,352,558. |
| (4) | Perpetual security. Maturity date is not applicable. |
| (5) | Optional Call Provisions (not covered by the report of independent registered public accounting firm): Dates (month and year) and prices of the earliest optional call or redemption. There may be other call provisions at varying prices at later dates. Certain mortgage-backed securities may be subject to periodic principal paydowns. |
| (6) | Principal Amount (000) denominated in U.S. Dollars, unless otherwise noted. |
| (7) | The rate shown is the annualized seven-day effective yield as of the end of the reporting period. |
| (8) | The Fund may loan securities representing up to one third of the fair value of its total assets (which includes collateral for securities on loan) to broker-dealers, banks and other institutions. The Fund maintains collateral equal to at least 100% of the fair value of the securities loaned. The cash collateral received by the Fund is invested in this money market fund. See Notes to Financial Statements, Note 3 – Portfolio Securities and Investments in Derivatives, Securities Lending for more information. |
| (9) | Other assets less liabilities includes the unrealized appreciation (depreciation) of the over-the-counter derivatives as presented on the Statement of Assets and Liabilities. The unrealized appreciation (depreciation) of exchange-cleared and exchange-traded derivatives is recognized as part of the receivable or payable for variation margin as presented on the Statement of Assets and Liabilities. |
| I/O | Interest only security. |
| 144A | Investment is exempt from registration under Rule 144A of the Securities Act of 1933, as amended. These investments may only be resold in transactions exempt from registration, which are normally those transactions with qualified institutional buyers. |
| USD-LIBOR-ICE | United States Dollar-London Inter-Bank Offered Rate Intercontinental Exchange. |
| (WI/DD) | Investment, or portion of investment, purchased on a when-issued or delayed delivery basis. |
See accompanying notes to financial statements.
Statement of
| | | | |
| | Assets and Liabilities | | June 30, 2015 |
| | | | | | | | | | | | | | | | | | | | |
| | | Core
Bond | | | Core Plus
Bond | | | Inflation
Protected
Securities | | | Intermediate
Government
Bond | | | Short Term
Bond | |
Assets | | | | | | | | | | | | | | | | | | | | |
Long-term investments, at value (cost $227,231,042, $548,721,913, $374,070,982, $73,499,579 and $676,747,859, respectively) | | $ | 229,902,055 | | | $ | 560,336,084 | | | $ | 375,547,471 | | | $ | 74,855,873 | | | $ | 678,654,146 | |
Investments purchased with collateral from securities lending, at value (cost approximates value) | | | 13,740,808 | | | | 69,688,572 | | | | 5,539,700 | | | | 2,464,209 | | | | 32,274,464 | |
Short-term investments, at value (cost approximates value) | | | 6,366,153 | | | | 16,998,878 | | | | 11,665,461 | | | | 454,874 | | | | 8,574,230 | |
Cash denominated in foreign currencies (cost $—, $—, $—, $— and $422, respectively) | | | — | | | | — | | | | — | | | | — | | | | 295 | |
Cash | | | — | | | | 344,563 | | | | — | | | | 41,681 | | | | — | |
Cash collateral at brokers(1) | | | 297,885 | | | | 745,765 | | | | 739,224 | | | | 134,105 | | | | 1,161,684 | |
Interest rate swaps premiums paid | | | 369 | | | | 450 | | | | 359 | | | | — | | | | 403 | |
Unrealized appreciation on: | | | | | | | | | | | | | | | | |
Forward foreign currency exchange contracts, net | | | — | | | | 425,896 | | | | — | | | | — | | | | — | |
Interest rate swaps | | | — | | | | 26,517 | | | | — | | | | — | | | | — | |
Receivable for: | | | | | | | | | | | | | | | | |
Dividends | | | — | | | | — | | | | 8,645 | | | | — | | | | — | |
Due from broker | | | 2,201 | | | | 23,914 | | | | 1,436 | | | | 671 | | | | 7,278 | |
Interest | | | 1,675,277 | | | | 5,798,523 | | | | 1,578,370 | | | | 323,929 | | | | 3,598,268 | |
Investments sold | | | 6,008,228 | | | | 27,350 | | | | 50,000 | | | | 86,294 | | | | 73,472 | |
Reclaims | | | — | | | | 25,532 | | | | — | | | | — | | | | — | |
Shares sold | | | 907,393 | | | | 233,297 | | | | 1,477,062 | | | | 1,152 | | | | 759,853 | |
Variation margin on futures contracts | | | 4,883 | | | | 12,885 | | | | 18,248 | | | | 2,648 | | | | 32,476 | |
Variation margin on swap contracts | | | 150,789 | | | | 1,223,849 | | | | 72,890 | | | | — | | | | 239,632 | |
Other assets | | | 29,773 | | | | 44,905 | | | | 28,799 | | | | 11,909 | | | | 74,876 | |
Total assets | | | 259,085,814 | | | | 655,956,980 | | | | 396,727,665 | | | | 78,377,345 | | | | 725,451,077 | |
Liabilities | | | | | | | | | | | | | | | | |
Unrealized depreciation on forward foreign currency exchange contracts, net | | | — | | | | 182,234 | | | | — | | | | — | | | | — | |
Payable for: | | | | | | | | | | | | | | | | |
Collateral from securities lending program | | | 13,740,808 | | | | 69,688,572 | | | | 5,539,700 | | | | 2,464,209 | | | | 32,274,464 | |
Dividends | | | 363,993 | | | | 1,023,722 | | | | — | | | | 56,346 | | | | 609,811 | |
Investments purchased | | | 7,152,228 | | | | 15,578,460 | | | | 284,934 | | | | — | | | | 1,062,870 | |
Shares redeemed | | | 598,601 | | | | 2,596,016 | | | | 364,429 | | | | 94,619 | | | | 298,571 | |
Variation margin on futures contracts | | | 2,867 | | | | 4,625 | | | | 11,125 | | | | 1,375 | | | | 10,813 | |
Variation margin on swap contracts | | | — | | | | — | | | | — | | | | 11,276 | | | | — | |
Accrued expenses: | | | | | | | | | | | | | | | | | | | | |
12b-1 distribution and service fees | | | 3,790 | | | | 24,817 | | | | 15,692 | | | | 2,466 | | | | 48,078 | |
Management fees | | | 83,100 | | | | 181,011 | | | | 97,689 | | | | 20,032 | | | | 210,239 | |
Directors fees | | | 17,703 | | | | 26,807 | | | | 13,553 | | | | 424 | | | | 35,019 | |
Other | | | 90,245 | | | | 171,670 | | | | 219,198 | | | | 63,483 | | | | 177,227 | |
Total liabilities | | | 22,053,335 | | | | 89,477,934 | | | | 6,546,320 | | | | 2,714,230 | | | | 34,727,092 | |
Net assets | | $ | 237,032,479 | | | $ | 566,479,046 | | | $ | 390,181,345 | | | $ | 75,663,115 | | | $ | 690,723,985 | |
(1) – Cash pledged to collateralize the net payment obligations for investments in derivatives.
See accompanying notes to financial statements.
Statement of Assets and Liabilities (continued)
| | | | | | | | | | | | | | | | | | | | |
| | | Core
Bond | | | Core Plus
Bond | | | Inflation
Protected
Securities | | | Intermediate
Government
Bond | | | Short Term
Bond | |
Class A Shares | | | | | | | | | | | | | | | | | | | | |
Net assets | | $ | 14,447,725 | | | $ | 69,967,910 | | | $ | 42,340,690 | | | $ | 9,010,244 | | | $ | 100,544,430 | |
Shares outstanding | | | 1,449,035 | | | | 6,218,395 | | | | 3,876,488 | | | | 1,023,540 | | | | 10,120,348 | |
Net asset value (“NAV”) per share | | $ | 9.97 | | | $ | 11.25 | | | $ | 10.92 | | | $ | 8.80 | | | $ | 9.93 | |
Offering price per share (NAV per share plus maximum sales charge of 3.00%, 4.25%, 4.25%, 3.00% and 2.25%, respectively, of offering price) | | $ | 10.28 | | | $ | 11.75 | | | $ | 11.40 | | | $ | 9.07 | | | $ | 10.16 | |
Class C Shares | | | | | | | | | | | | | | | | |
Net assets | | $ | 971,354 | | | $ | 8,580,324 | | | $ | 9,366,489 | | | $ | 666,743 | | | $ | 33,547,300 | |
Shares outstanding | | | 97,761 | | | | 766,175 | | | | 863,961 | | | | 75,608 | | | | 3,365,611 | |
NAV and offering price per share | | $ | 9.94 | | | $ | 11.20 | | | $ | 10.84 | | | $ | 8.82 | | | $ | 9.97 | |
Class R3 Shares | | | | | | | | | | | | | | | | | | | | |
Net assets | | $ | — | | | $ | 3,751,020 | | | $ | 3,692,860 | | | $ | 136,559 | | | $ | 130,748 | |
Shares outstanding | | | — | | | | 332,221 | | | | 340,228 | | | | 15,519 | | | | 13,138 | |
NAV and offering price per share | | $ | — | | | $ | 11.29 | | | $ | 10.85 | | | $ | 8.80 | | | $ | 9.95 | |
Class R6 Shares(1) | | | | | | | | | | | | | | | | | | | | |
Net assets | | $ | 45,145,410 | | | $ | 43,680,352 | | | $ | 3,074,262 | | | $ | — | | | $ | 27,474,989 | |
Shares outstanding | | | 4,543,818 | | | | 3,887,891 | | | | 278,890 | | | | — | | | | 2,761,828 | |
NAV and offering price per share | | $ | 9.94 | | | $ | 11.23 | | | $ | 11.02 | | | $ | — | | | $ | 9.95 | |
Class I Shares | | | | | | | | | | | | | | | | | | | | |
Net assets | | $ | 176,467,990 | | | $ | 440,499,440 | | | $ | 331,707,044 | | | $ | 65,849,569 | | | $ | 529,026,518 | |
Shares outstanding | | | 17,766,370 | | | | 39,205,950 | | | | 30,101,861 | | | | 7,474,768 | | | | 53,208,061 | |
NAV and offering price per share | | $ | 9.93 | | | $ | 11.24 | | | $ | 11.02 | | | $ | 8.81 | | | $ | 9.94 | |
Net assets consist of: | | | | | | | | | | | | | | | | |
Capital paid-in | | $ | 233,972,352 | | | $ | 556,108,417 | | | $ | 391,758,967 | | | $ | 78,516,930 | | | $ | 700,061,991 | |
Undistributed (Over-distribution of) net investment income | | | (596,106 | ) | | | 226,421 | | | | (1,224,267 | ) | | | (40,066 | ) | | | (1,641,078 | ) |
Accumulated net realized gain (loss) | | | 1,384,784 | | | | (571,858 | ) | | | (1,676,181 | ) | | | (4,180,376 | ) | | | (9,144,634 | ) |
Net unrealized appreciation (depreciation) | | | 2,271,449 | | | | 10,716,066 | | | | 1,322,826 | | | | 1,366,627 | | | | 1,447,706 | |
Net assets | | $ | 237,032,479 | | | $ | 566,479,046 | | | $ | 390,181,345 | | | $ | 75,663,115 | | | $ | 690,723,985 | |
Authorized shares – per class | | | 2 billion | | | | 2 billion | | | | 2 billion | | | | 2 billion | | | | 2 billion | |
Par value per share | | $ | 0.0001 | | | $ | 0.0001 | | | $ | 0.0001 | | | $ | 0.0001 | | | $ | 0.0001 | |
(1) – Class R6 Shares for Core Bond, Core Plus Bond, Inflation Protected Securities and Short Term Bond were established and commenced operations on January 20, 2015.
See accompanying notes to financial statements.
Statement of
| | | | |
| | Operations | | Year Ended June 30, 2015 |
| | | | | | | | | | | | | | | | | | | | |
| | | Core
Bond | | | Core Plus Bond | | | Inflation
Protected
Securities | | | Intermediate
Government
Bond | | | Short Term
Bond | |
Investment Income | | | | | | | | | | | | | | | | | | | | |
Dividend income (net of foreign tax withheld of $—, $—, $281, $— and $—, respectively) | | $ | — | | | $ | 862,218 | | | $ | 129,115 | | | $ | — | | | $ | — | |
Interest income | | | 9,373,540 | | | | 26,139,386 | | | | 1,737,615 | | | | 1,707,661 | | | | 21,721,435 | |
Securities lending income, net | | | 44,416 | | | | 207,068 | | | | 51,213 | | | | 10,095 | | | | 129,493 | |
Total investment income | | | 9,417,956 | | | | 27,208,672 | | | | 1,917,943 | | | | 1,717,756 | | | | 21,850,928 | |
Expenses | | | | | | | | | | | | | | | | | | | | |
Management fees | | | 1,363,596 | | | | 2,700,123 | | | | 1,527,317 | | | | 402,382 | | | | 3,677,739 | |
12b-1 service fees – Class A Shares | | | 37,775 | | | | 177,586 | | | | 78,331 | | | | 23,091 | | | | 271,953 | |
12b-1 distribution and service fees – Class C Shares | | | 7,739 | | | | 93,603 | | | | 65,584 | | | | 6,625 | | | | 361,328 | |
12b-1 distribution and service fees – Class R3 Shares | | | — | | | | 10,731 | | | | 16,800 | | | | 688 | | | | 3,668 | |
Shareholder servicing agent fees | | | 125,748 | | | | 350,890 | | | | 569,728 | | | | 73,118 | | | | 314,035 | |
Custodian fees | | | 96,791 | | | | 187,458 | | | | 105,229 | | | | 56,634 | | | | 262,915 | |
Directors fees | | | 9,528 | | | | 18,103 | | | | 11,254 | | | | 2,872 | | | | 28,118 | |
Professional fees | | | 69,345 | | | | 88,925 | | | | 69,245 | | | | 50,098 | | | | 123,355 | |
Shareholder reporting expenses | | | 21,914 | | | | 63,654 | | | | 40,714 | | | | 13,510 | | | | 54,199 | |
Federal and state registration fees | | | 45,021 | | | | 63,679 | | | | 62,731 | | | | 51,702 | | | | 85,654 | |
Other expenses | | | 14,051 | | | | 21,378 | | | | 10,771 | | | | 7,986 | | | | 36,143 | |
Total expenses before fee waiver/expense reimbursement | | | 1,791,508 | | | | 3,776,130 | | | | 2,557,704 | | | | 688,706 | | | | 5,219,107 | |
Fee waiver/expense reimbursement | | | (187,660 | ) | | | (460,955 | ) | | | (281,563 | ) | | | (144,646 | ) | | | (180,096 | ) |
Net expenses | | | 1,603,848 | | | | 3,315,175 | | | | 2,276,141 | | | | 544,060 | | | | 5,039,011 | |
Net investment income (loss) | | | 7,814,108 | | | | 23,893,497 | | | | (358,198 | ) | | | 1,173,696 | | | | 16,811,917 | |
Realized and Unrealized Gain (Loss) | | | | | | | | | | | | | | | | | | | | |
Net realized gain (loss) from: | | | | | | | | | | | | | | | | | | | | |
Investments and foreign currency | | | 5,031,234 | | | | 4,252,552 | | | | 421,417 | | | | 248,726 | | | | (802,458 | ) |
Forward foreign currency exchange contracts | | | — | | | | 1,634,643 | | | | — | | | | — | | | | — | |
Futures contracts | | | (612,361 | ) | | | (3,194,614 | ) | | | (754,218 | ) | | | (148,062 | ) | | | (2,388,015 | ) |
Swaps | | | (124,922 | ) | | | (1,449,357 | ) | | | (87,457 | ) | | | — | | | | (595,864 | ) |
Change in net unrealized appreciation (depreciation) of: | | | | | | | | | | | | | | | | | | | | |
Investments and foreign currency | | | (8,406,743 | ) | | | (25,921,625 | ) | | | (5,873,341 | ) | | | (230,005 | ) | | | (7,953,868 | ) |
Forward foreign currency exchange contracts | | | — | | | | 113,116 | | | | — | | | | — | | | | — | |
Futures contracts | | | (289,855 | ) | | | (10,137 | ) | | | (139,680 | ) | | | 9,364 | | | | (363,216 | ) |
Swaps | | | (55,935 | ) | | | (522,059 | ) | | | (9,837 | ) | | | 10,105 | | | | (56,331 | ) |
Net realized and unrealized gain (loss) | | | (4,458,582 | ) | | | (25,097,481 | ) | | | (6,443,116 | ) | | | (109,872 | ) | | | (12,159,752 | ) |
Net increase (decrease) in net assets from operations | | $ | 3,355,526 | | | $ | (1,203,984 | ) | | $ | (6,801,314 | ) | | $ | 1,063,824 | | | $ | 4,652,165 | |
See accompanying notes to financial statements.
Statement of
| | | | | | | | | | | | | | | | | | |
| | |
Core Bond | | | | | Core Plus Bond | |
| | | Year Ended 6/30/15 | | | Year Ended
6/30/14 | | | | | Year Ended 6/30/15 | | | Year Ended
6/30/14 | |
Operations | | | | | | | | | | | | | | | | | | |
Net investment income (loss) | | $ | 7,814,108 | | | $ | 10,490,219 | | | | | $ | 23,893,497 | | | $ | 25,578,836 | |
Net realized gain (loss) from: | | | | | | | | | | | | | | | | | | |
Investments and foreign currency | | | 5,031,234 | | | | 3,385,759 | | | | | | 4,252,552 | | | | 6,806,719 | |
Forward foreign currency exchange contracts | | | — | | | | — | | | | | | 1,634,643 | | | | 103,381 | |
Futures contracts | | | (612,361 | ) | | | (775,499 | ) | | | | | (3,194,614 | ) | | | (496,311 | ) |
Swaps | | | (124,922 | ) | | | (62,559 | ) | | | | | (1,449,357 | ) | | | 721,814 | |
Change in net unrealized appreciation (depreciation) of: | | | | | | | | | | | | | | | | | | |
Investments and foreign currency | | | (8,406,743 | ) | | | 10,344,536 | | | | | | (25,921,625 | ) | | | 21,087,506 | |
Forward foreign currency exchange contracts | | | — | | | | — | | | | | | 113,116 | | | | 297,828 | |
Futures contracts | | | (289,855 | ) | | | 358,068 | | | | | | (10,137 | ) | | | (2,134,542 | ) |
Swaps | | | (55,935 | ) | | | (101,180 | ) | | | | | (522,059 | ) | | | (2,811,918 | ) |
Net increase (decrease) in net assets from operations | | | 3,355,526 | | | | 23,639,344 | | | | | | (1,203,984 | ) | | | 49,153,313 | |
Distributions to Shareholders | | | | | | | | | | | | | | | | | | |
From net investment income: | | | | | | | | | | | | | | | | | | |
Class A Shares | | | (410,574 | ) | | | (341,348 | ) | | | | | (2,692,431 | ) | | | (2,697,373 | ) |
Class C Shares | | | (15,077 | ) | | | (6,259 | ) | | | | | (283,270 | ) | | | (136,575 | ) |
Class R3 Shares | | | — | | | | — | | | | | | (77,205 | ) | | | (13,845 | ) |
Class R6 Shares(1) | | | (606,476 | ) | | | — | | | | | | (819,814 | ) | | | — | |
Class I Shares | | | (7,655,076 | ) | | | (9,301,012 | ) | | | | | (19,556,879 | ) | | | (21,420,472 | ) |
From accumulated net realized gains: | | | | | | | | | | | | | | | | | | |
Class A Shares | | | (263,674 | ) | | | (219,231 | ) | | | | | (107,721 | ) | | | (1,118,477 | ) |
Class C Shares | | | (13,719 | ) | | | (6,208 | ) | | | | | (14,759 | ) | | | (67,202 | ) |
Class R3 Shares | | | — | | | | — | | | | | | (2,022 | ) | | | (5,884 | ) |
Class R6 Shares(1) | | | — | | | | — | | | | | | — | | | | — | |
Class I Shares | | | (4,644,858 | ) | | | (5,526,774 | ) | | | | | (758,094 | ) | | | (8,524,192 | ) |
Return of capital: | | | | | | | | | | | | | | | | | | |
Class A Shares | | | — | | | | — | | | | | | — | | | | — | |
Class C Shares | | | — | | | | — | | | | | | — | | | | — | |
Class R3 Shares | | | — | | | | — | | | | | | — | | | | — | |
Class R6 Shares(1) | | | — | | | | — | | | | | | — | | | | — | |
Class I Shares | | | — | | | | — | | | | | | — | | | | — | |
Decrease in net assets from distributions to shareholders | | | (13,609,454 | ) | | | (15,400,832 | ) | | | | | (24,312,195 | ) | | | (33,984,020 | ) |
Fund Share Transactions | | | | | | | | | | | | | | | | | | |
Proceeds from sale of shares | | | 85,693,256 | | | | 46,333,424 | | | | | | 165,027,733 | | | | 91,376,742 | |
Proceeds from shares issued to shareholders due to reinvestment of distributions | | | 5,944,510 | | | | 6,083,753 | | | | | | 10,857,907 | | | | 15,157,788 | |
| | | 91,637,766 | | | | 52,417,177 | | | | | | 175,885,640 | | | | 106,534,530 | |
Cost of shares redeemed | | | (189,624,091 | ) | | | (215,387,498 | ) | | | | | (175,913,051 | ) | | | (203,206,721 | ) |
Net increase (decrease) in net assets from Fund share transactions | | | (97,986,325 | ) | | | (162,970,321 | ) | | | | | (27,411 | ) | | | (96,672,191 | ) |
Net increase (decrease) in net assets | | | (108,240,253 | ) | | | (154,731,809 | ) | | | | | (25,543,590 | ) | | | (81,502,898 | ) |
Net assets at the beginning of period | | | 345,272,732 | | | | 500,004,541 | | | | | | 592,022,636 | | | | 673,525,534 | |
Net assets at the end of period | | $ | 237,032,479 | | | $ | 345,272,732 | | | | | $ | 566,479,046 | | | $ | 592,022,636 | |
Undistributed (Over-distribution of) net investment income at the end of period | | $ | (596,106 | ) | | $ | 401,912 | | | | | $ | 226,421 | | | $ | (319,558 | ) |
(1) – Class R6 Shares were established and commenced operations on January 20, 2015.
See accompanying notes to financial statements.
| | | | | | | | | | | | | | | | | | |
| | | Inflation Protected Securities | | | | | Intermediate Government Bond | |
| | | Year Ended
6/30/15 | | | Year Ended
6/30/14 | | | | | Year Ended
6/30/15 | | | Year Ended
6/30/14 | |
Operations | | | | | | | | | | | | | | | | | | |
Net investment income (loss) | | $ | (358,198 | ) | | $ | 5,529,696 | | | | | $ | 1,173,696 | | | $ | 1,105,481 | |
Net realized gain (loss) from: | | | | | | | | | | | | | | | | | | |
Investments and foreign currency | | | 421,417 | | | | (636,355 | ) | | | | | 248,726 | | | | (291,574 | ) |
Forward foreign currency exchange contracts | | | — | | | | 1,649 | | | | | | — | | | | — | |
Futures contracts | | | (754,218 | ) | | | 342,380 | | | | | | (148,062 | ) | | | 63,635 | |
Swaps | | | (87,457 | ) | | | (43,799 | ) | | | | | — | | | | — | |
Change in net unrealized appreciation (depreciation) of: | | | | | | | | | | | | | | | | | | |
Investments and foreign currency | | | (5,873,341 | ) | | | 10,327,354 | | | | | | (230,005 | ) | | | 616,311 | |
Forward foreign currency exchange contracts | | | — | | | | — | | | | | | — | | | | — | |
Futures contracts | | | (139,680 | ) | | | (80,142 | ) | | | | | 9,364 | | | | (39,323 | ) |
Swaps | | | (9,837 | ) | | | (70,939 | ) | | | | | 10,105 | | | | — | |
Net increase (decrease) in net assets from operations | | | (6,801,314 | ) | | | 15,369,844 | | | | | | 1,063,824 | | | | 1,454,530 | |
Distributions to Shareholders | | | | | | | | | | | | | | | | | | |
From net investment income: | | | | | | | | | | | | | | | | | | |
Class A Shares | | | (152,769 | ) | | | (154,907 | ) | | | | | (95,950 | ) | | | (138,721 | ) |
Class C Shares | | | (11,491 | ) | | | (17,999 | ) | | | | | (1,935 | ) | | | (4,636 | ) |
Class R3 Shares | | | (17,756 | ) | | | (7,015 | ) | | | | | (1,061 | ) | | | (1,450 | ) |
Class R6 Shares(1) | | | — | | | | — | | | | | | — | | | | — | |
Class I Shares | | | (2,430,339 | ) | | | (3,179,552 | ) | | | | | (989,317 | ) | | | (971,041 | ) |
From accumulated net realized gains: | | | | | | | | | | | | | | | | | | |
Class A Shares | | | — | | | | (325,704 | ) | | | | | — | | | | — | |
Class C Shares | | | — | | | | (141,506 | ) | | | | | — | | | | — | |
Class R3 Shares | | | — | | | | (9,071 | ) | | | | | — | | | | — | |
Class R6 Shares(1) | | | — | | | | — | | | | | | — | | | | — | |
Class I Shares | | | — | | | | (5,369,832 | ) | | | | | — | | | | — | |
Return of capital: | | | | | | | | | | | | | | | | | | |
Class A Shares | | | (122,017 | ) | | | — | | | | | | — | | | | (9,999 | ) |
Class C Shares | | | (25,540 | ) | | | — | | | | | | — | | | | (793 | ) |
Class R3 Shares | | | (13,085 | ) | | | — | | | | | | — | | | | (131 | ) |
Class R6 Shares(1) | | | (1,246 | ) | | | — | | | | | | — | | | | — | |
Class I Shares | | | (1,261,968 | ) | | | — | | | | | | — | | | | (60,271 | ) |
Decrease in net assets from distributions to shareholders | | | (4,036,211 | ) | | | (9,205,586 | ) | | | | | (1,088,263 | ) | | | (1,187,042 | ) |
Fund Share Transactions | | | | | | | | | | | | | | | | | | |
Proceeds from sale of shares | | | 144,694,926 | | | | 158,672,789 | | | | | | 34,529,466 | | | | 53,702,453 | |
Proceeds from shares issued to shareholders due to reinvestment of distributions | | | 961,850 | | | | 2,098,537 | | | | | | 192,564 | | | | 322,556 | |
| | | 145,656,776 | | | | 160,771,326 | | | | | | 34,722,030 | | | | 54,025,009 | |
Cost of shares redeemed | | | (100,530,682 | ) | | | (187,476,368 | ) | | | | | (55,617,506 | ) | | | (22,292,736 | ) |
Net increase (decrease) in net assets from Fund share transactions | | | 45,126,094 | | | | (26,705,042 | ) | | | | | (20,895,476 | ) | | | 31,732,273 | |
Net increase (decrease) in net assets | | | 34,288,569 | | | | (20,540,784 | ) | | | | | (20,919,915 | ) | | | 31,999,761 | |
Net assets at the beginning of period | | | 355,892,776 | | | | 376,433,560 | | | | | | 96,583,030 | | | | 64,583,269 | |
Net assets at the end of period | | $ | 390,181,345 | | | $ | 355,892,776 | | | | | $ | 75,663,115 | | | $ | 96,583,030 | |
Undistributed (Over-distribution of) net investment income at the end of period | | $ | (1,224,267 | ) | | $ | 1,692,868 | | | | | $ | (40,066 | ) | | $ | (125,499 | ) |
(1) – Class R6 Shares for Inflation Protected Securities were established and commenced operations on January 20, 2015.
See accompanying notes to financial statements.
Statement of Changes in Net Assets (continued)
| | | | | | | | |
| | |
Short Term Bond | |
| | | Year Ended
6/30/15 | | | Year Ended
6/30/14 | |
Operations | | | | | | | | |
Net investment income (loss) | | $ | 16,811,917 | | | $ | 19,598,926 | |
Net realized gain (loss) from: | | | | | | | | |
Investments and foreign currency | | | (802,458 | ) | | | 3,463,619 | |
Forward foreign currency exchange contracts | | | — | | | | 1,275 | |
Futures contracts | | | (2,388,015 | ) | | | (95,888 | ) |
Swaps | | | (595,864 | ) | | | 157,088 | |
Change in net unrealized appreciation (depreciation) of: | | | | | | | | |
Investments and foreign currency | | | (7,953,868 | ) | | | 6,064,861 | |
Forward foreign currency exchange contracts | | | — | | | | — | |
Futures contracts | | | (363,216 | ) | | | (2,053,693 | ) |
Swaps | | | (56,331 | ) | | | (357,445 | ) |
Net increase (decrease) in net assets from operations | | | 4,652,165 | | | | 26,778,743 | |
Distributions to Shareholders | | | | | | | | |
From net investment income: | | | | | | | | |
Class A Shares | | | (1,658,982 | ) | | | (2,293,445 | ) |
Class C Shares | | | (269,364 | ) | | | (483,118 | ) |
Class R3 Shares | | | (9,008 | ) | | | (13,089 | ) |
Class R6 Shares(1) | | | (212,174 | ) | | | — | |
Class I Shares | | | (14,124,963 | ) | | | (16,617,287 | ) |
From accumulated net realized gains: | | | | | | | | |
Class A Shares | | | — | | | | — | |
Class C Shares | | | — | | | | — | |
Class R3 Shares | | | — | | | | — | |
Class R6 Shares(1) | | | — | | | | — | |
Class I Shares | | | — | | | | — | |
Return of capital: | | | | | | | | |
Class A Shares | | | — | | | | — | |
Class C Shares | | | — | | | | — | |
Class R3 Shares | | | — | | | | — | |
Class R6 Shares(1) | | | — | | | | — | |
Class I Shares | | | — | | | | — | |
Decrease in net assets from distributions to shareholders | | | (16,274,491 | ) | | | (19,406,939 | ) |
Fund Share Transactions | | | | | | | | |
Proceeds from sale of shares | | | 309,686,804 | | | | 543,355,445 | |
Proceeds from shares issued to shareholders due to reinvestment of distributions | | | 4,640,699 | | | | 5,494,886 | |
| | | 314,327,503 | | | | 548,850,331 | |
Cost of shares redeemed | | | (683,861,963 | ) | | | (391,092,749 | ) |
Net increase (decrease) in net assets from Fund share transactions | | | (369,534,460 | ) | | | 157,757,582 | |
Net increase (decrease) in net assets | | | (381,156,786 | ) | | | 165,129,386 | |
Net assets at the beginning of period | | | 1,071,880,771 | | | | 906,751,385 | |
Net assets at the end of period | | $ | 690,723,985 | | | $ | 1,071,880,771 | |
Undistributed (Over-distribution of) net investment income at the end of period | | $ | (1,641,078 | ) | | $ | (1,759,566 | ) |
(1) – Class R6 Shares were established and commenced operations on January 20, 2015.
See accompanying notes to financial statements.
THIS PAGE INTENTIONALLY LEFT BLANK
Financial
Highlights
Core Bond
Selected data for a share outstanding throughout each period:
| | | | | | | | | | | | | | | | | | | | | | | | | | | | | | | | | | |
| | | | | |
| | | | | | Investment Operations | | | | | Less Distributions | | | | |
| | | | | | | | | |
Class (Commencement Date) Year Ended June 30, | | Beginning
NAV | | | Net
Investment
Income
(Loss)(a) | | | Net
Realized/
Unrealized
Gain (Loss) | | | Total | | | | | From
Net
Investment
Income | | | From
Accumulated
Net Realized
Gains | | | Total | | | Ending
NAV | |
Class A (1/95) | | | | | | | | | | | | | | | | | | | | | | | | | | | |
2015 | | $ | 10.36 | | | $ | 0.25 | | | $ | (0.19 | ) | | $ | 0.06 | | | | | $ | (0.28 | ) | | $ | (0.17 | ) | | $ | (0.45 | ) | | $ | 9.97 | |
2014 | | | 10.13 | | | | 0.24 | | | | 0.35 | | | | 0.59 | | | | | | (0.22 | ) | | | (0.14 | ) | | | (0.36 | ) | | | 10.36 | |
2013 | | | 10.67 | | | | 0.18 | | | | (0.20 | ) | | | (0.02 | ) | | | | | (0.18 | ) | | | (0.34 | ) | | | (0.52 | ) | | | 10.13 | |
2012 | | | 10.47 | | | | 0.29 | | | | 0.23 | | | | 0.52 | | | | | | (0.30 | ) | | | (0.02 | ) | | | (0.32 | ) | | | 10.67 | |
2011 | | | 10.33 | | | | 0.33 | | | | 0.14 | | | | 0.47 | | | | | | (0.33 | ) | | | — | | | | (0.33 | ) | | | 10.47 | |
Class C (1/11) | | | | | | | | | | | | | | | | | | | | | | | | | | | |
2015 | | | 10.32 | | | | 0.17 | | | | (0.19 | ) | | | (0.02 | ) | | | | | (0.19 | ) | | | (0.17 | ) | | | (0.36 | ) | | | 9.94 | |
2014 | | | 10.08 | | | | 0.16 | | | | 0.36 | | | | 0.52 | | | | | | (0.14 | ) | | | (0.14 | ) | | | (0.28 | ) | | | 10.32 | |
2013 | | | 10.62 | | | | 0.09 | | | | (0.19 | ) | | | (0.10 | ) | | | | | (0.09 | ) | | | (0.35 | ) | | | (0.44 | ) | | | 10.08 | |
2012 | | | 10.44 | | | | 0.19 | | | | 0.22 | | | | 0.41 | | | | | | (0.22 | ) | | | (0.01 | ) | | | (0.23 | ) | | | 10.62 | |
2011(e) | | | 10.37 | | | | 0.12 | | | | 0.06 | | | | 0.18 | | | | | | (0.11 | ) | | | — | | | | (0.11 | ) | | | 10.44 | |
Class R6 (1/15) | | | | | | | | | | | | | | | | | | | | | | | | | | | |
2015(f) | | | 10.22 | | | | 0.12 | | | | (0.27 | ) | | | (0.15 | ) | | | | | (0.13 | ) | | | — | | | | (0.13 | ) | | | 9.94 | |
Class I (1/93) | | | | | | | | | | | | | | | | | | | | | | | | | | | |
2015 | | | 10.32 | | | | 0.27 | | | | (0.19 | ) | | | 0.08 | | | | | | (0.30 | ) | | | (0.17 | ) | | | (0.47 | ) | | | 9.93 | |
2014 | | | 10.09 | | | | 0.26 | | | | 0.22 | | | | 0.48 | | | | | | (0.11 | ) | | | (0.14 | ) | | | (0.25 | ) | | | 10.32 | |
2013 | | | 10.63 | | | | 0.20 | | | | (0.20 | ) | | | — | | | | | | (0.21 | ) | | | (0.33 | ) | | | (0.54 | ) | | | 10.09 | |
2012 | | | 10.43 | | | | 0.30 | | | | 0.23 | | | | 0.53 | | | | | | (0.32 | ) | | | (0.01 | ) | | | (0.33 | ) | | | 10.63 | |
2011 | | | 10.29 | | | | 0.35 | | | | 0.14 | | | | 0.49 | | | | | | (0.35 | ) | | | — | | | | (0.35 | ) | | | 10.43 | |
| | | | | | | | | | | | | | | | | | | | | | | | | | | | | | |
| | | | Ratios/Supplemental Data | |
| | | | | | | | | Ratios to Average
Net Assets Before
Waiver/Reimbursement | | | | | Ratios to Average
Net Assets After
Waiver/Reimbursement(c) | | | | |
| | | | | | | | |
Total
Return(b) | | | Ending
Net
Assets
(000) | | | | | Expenses | | | Net
Investment
Income
(Loss) | | | | | Expenses | | | Net
Investment
Income
(Loss) | | | Portfolio
Turnover
Rate(d) | |
| | | | | | | | | | | | | | | | | | | | | | | | | | | | | | |
| | 0.52 | % | | $ | 14,448 | | | | | | 0.85 | % | | | 2.34 | % | | | | | 0.78 | % | | | 2.40 | % | | | 44 | % |
| | 5.94 | | | | 14,857 | | | | | | 0.81 | | | | 2.29 | | | | | | 0.78 | | | | 2.32 | | | | 49 | |
| | (0.38 | ) | | | 18,331 | | | | | | 0.79 | | | | 1.63 | | | | | | 0.78 | | | | 1.65 | | | | 85 | |
| | 4.93 | | | | 21,262 | | | | | | 0.95 | | | | 2.61 | | | | | | 0.85 | | | | 2.70 | | | | 75 | |
| | 4.70 | | | | 22,502 | | | | | | 0.94 | | | | 3.10 | | | | | | 0.85 | | | | 3.20 | | | | 58 | |
| | | | | | | | | | | | | | | | | | | | | | | | | | | | | | |
| | (0.20 | ) | | | 971 | | | | | | 1.61 | | | | 1.59 | | | | | | 1.53 | | | | 1.67 | | | | 44 | |
| | 5.24 | | | | 514 | | | | | | 1.56 | | | | 1.54 | | | | | | 1.53 | | | | 1.57 | | | | 49 | |
| | (1.17 | ) | | | 585 | | | | | | 1.54 | | | | 0.87 | | | | | | 1.53 | | | | 0.88 | | | | 85 | |
| | 3.97 | | | | 1,568 | | | | | | 1.69 | | | | 1.79 | | | | | | 1.67 | | | | 1.81 | | | | 75 | |
| | 1.76 | | | | 1,152 | | | | | | 1.79 | * | | | 2.46 | * | | | | | 1.70 | * | | | 2.56 | * | | | 58 | |
| | | | | | | | | | | | | | | | | | | | | | | �� | | | | | | | |
| | (1.46 | ) | | | 45,145 | | | | | | 0.56 | * | | | 2.60 | * | | | | | 0.48 | * | | | 2.68 | * | | | 44 | |
| | | | | | | | | | | | | | | | | | | | | | | | | | | | | | |
| | 0.78 | | | | 176,468 | | | | | | 0.59 | | | | 2.59 | | | | | | 0.53 | | | | 2.65 | | | | 44 | |
| | 6.21 | | | | 329,901 | | | | | | 0.56 | | | | 2.53 | | | | | | 0.53 | | | | 2.56 | | | | 49 | |
| | (0.16 | ) | | | 481,088 | | | | | | 0.54 | | | | 1.88 | | | | | | 0.53 | | | | 1.89 | | | | 85 | |
| | 5.18 | | | | 621,066 | | | | | | 0.70 | | | | 2.85 | | | | | | 0.68 | | | | 2.87 | | | | 75 | |
| | 4.76 | | | | 657,129 | | | | | | 0.74 | | | | 3.30 | | | | | | 0.70 | | | | 3.35 | | | | 58 | |
| (a) | Per share Net Investment Income (Loss) is calculated using the average daily shares method. | |
| (b) | Total return is the combination of changes in NAV without any sales charge, reinvested dividend income at NAV and reinvested capital gains distributions at NAV, if any. Total returns are not annualized. | |
| (c) | After fee waiver and/or expense reimbursement from the Adviser, where applicable. | |
| (d) | Portfolio Turnover Rate is calculated based on the lesser of long-term purchases or sales (as disclosed in Note 5 – Investment Transactions) divided by the average long-term market value during the period. | |
| (e) | For the period January 18, 2011 (commencement of operations) through June 30, 2011. | |
| (f) | For the period January 20, 2015 (commencement of operations) through June 30, 2015. | |
See accompanying notes to financial statements.
Financial Highlights (continued)
Core Plus Bond
Selected data for a share outstanding throughout each period:
| | | | | | | | | | | | | | | | | | | | | | | | | | | | | | | | | | |
| | | | | |
| | | | | | Investment Operations | | | | | Less Distributions | | | | |
| | | | | | | | | |
Class (Commencement Date) Year Ended June 30, | | Beginning
NAV | | | Net
Investment
Income
(Loss)(a) | | | Net
Realized/
Unrealized
Gain (Loss) | | | Total | | | | | From
Net
Investment
Income | | | From
Accumulated
Net Realized
Gains | | | Total | | | Ending
NAV | |
Class A (12/87) | | | | | | | | | | | | | | | | | | | | | | | |
2015 | | $ | 11.75 | | | $ | 0.45 | | | $ | (0.49 | ) | | $ | (0.04 | ) | | | | $ | (0.44 | ) | | $ | (0.02 | ) | | $ | (0.46 | ) | | $ | 11.25 | |
2014 | | | 11.46 | | | | 0.46 | | | | 0.45 | | | | 0.91 | | | | | | (0.43 | ) | | | (0.19 | ) | | | (0.62 | ) | | | 11.75 | |
2013 | | | 11.64 | | | | 0.41 | | | | (0.12 | ) | | | 0.29 | | | | | | (0.42 | ) | | | (0.05 | ) | | | (0.47 | ) | | | 11.46 | |
2012 | | | 11.44 | | | | 0.41 | | | | 0.21 | | | | 0.62 | | | | | | (0.42 | ) | | | — | | | | (0.42 | ) | | | 11.64 | |
2011 | | | 11.22 | | | | 0.43 | | | | 0.21 | | | | 0.64 | | | | | | (0.42 | ) | | | — | | | | (0.42 | ) | | | 11.44 | |
Class C (2/99) | | | | | | | | | | | | | | | | | | | | | | | |
2015 | | | 11.69 | | | | 0.36 | | | | (0.48 | ) | | | (0.12 | ) | | | | | (0.35 | ) | | | (0.02 | ) | | | (0.37 | ) | | | 11.20 | |
2014 | | | 11.40 | | | | 0.37 | | | | 0.45 | | | | 0.82 | | | | | | (0.34 | ) | | | (0.19 | ) | | | (0.53 | ) | | | 11.69 | |
2013 | | | 11.59 | | | | 0.32 | | | | (0.12 | ) | | | 0.20 | | | | | | (0.34 | ) | | | (0.05 | ) | | | (0.39 | ) | | | 11.40 | |
2012 | | | 11.40 | | | | 0.32 | | | | 0.21 | | | | 0.53 | | | | | | (0.34 | ) | | | — | | | | (0.34 | ) | | | 11.59 | |
2011 | | | 11.18 | | | | 0.34 | | | | 0.21 | | | | 0.55 | | | | | | (0.33 | ) | | | — | | | | (0.33 | ) | | | 11.40 | |
Class R3 (9/01) | | | | | | | | | | | | | | | | | | | | | | | |
2015 | | | 11.80 | | | | 0.42 | | | | (0.50 | ) | | | (0.08 | ) | | | | | (0.41 | ) | | | (0.02 | ) | | | (0.43 | ) | | | 11.29 | |
2014 | | | 11.51 | | | | 0.43 | | | | 0.46 | | | | 0.89 | | | | | | (0.41 | ) | | | (0.19 | ) | | | (0.60 | ) | | | 11.80 | |
2013 | | | 11.70 | | | | 0.38 | | | | (0.12 | ) | | | 0.26 | | | | | | (0.40 | ) | | | (0.05 | ) | | | (0.45 | ) | | | 11.51 | |
2012 | | | 11.50 | | | | 0.38 | | | | 0.22 | | | | 0.60 | | | | | | (0.40 | ) | | | — | | | | (0.40 | ) | | | 11.70 | |
2011 | | | 11.27 | | | | 0.40 | | | | 0.22 | | | | 0.62 | | | | | | (0.39 | ) | | | — | | | | (0.39 | ) | | | 11.50 | |
Class R6 (1/15) | | | | | | | | | | | | | | | | | | | | | | | |
2015(f) | | | 11.48 | | | | 0.22 | | | | (0.26 | ) | | | (0.04 | ) | | | | | (0.21 | ) | | | — | | | | (0.21 | ) | | | 11.23 | |
Class I (2/94) | | | | | | | | | | | | | | | | | | | | | | | |
2015 | | | 11.74 | | | | 0.48 | | | | (0.49 | ) | | | (0.01 | ) | | | | | (0.47 | ) | | | (0.02 | ) | | | (0.49 | ) | | | 11.24 | |
2014 | | | 11.44 | | | | 0.49 | | | | 0.46 | | | | 0.95 | | | | | | (0.46 | ) | | | (0.19 | ) | | | (0.65 | ) | | | 11.74 | |
2013 | | | 11.64 | | | | 0.44 | | | | (0.14 | ) | | | 0.30 | | | | | | (0.45 | ) | | | (0.05 | ) | | | (0.50 | ) | | | 11.44 | |
2012 | | | 11.44 | | | | 0.44 | | | | 0.21 | | | | 0.65 | | | | | | (0.45 | ) | | | — | | | | (0.45 | ) | | | 11.64 | |
2011 | | | 11.21 | | | | 0.46 | | | | 0.22 | | | | 0.68 | | | | | | (0.45 | ) | | | — | | | | (0.45 | ) | | | 11.44 | |
| | | | | | | | | | | | | | | | | | | | | | | | | | | | | | |
| | | | Ratios/Supplemental Data | |
| | | | | | | | | Ratios to Average
Net Assets Before
Waiver/Reimbursement | | | | | Ratios to Average
Net Assets After
Waiver/Reimbursement(c) | | | | |
| | | | | | | | |
Total
Return(b) | | | Ending
Net
Assets
(000) | | | | | Expenses | | | Net
Investment
Income
(Loss) | | | | | Expenses | | | Net
Investment
Income
(Loss) | | | Portfolio
Turnover
Rate(d)(e) | |
| | | | | | | | | | | | | | | | | | | | | | | | | | | | | | |
| | (0.41 | )% | | $ | 69,968 | | | | | | 0.85 | % | | | 3.80 | % | | | | | 0.77 | % | | | 3.88 | % | | | 44 | % |
| | 8.23 | | | | 68,728 | | | | | | 0.84 | | | | 3.89 | | | | | | 0.77 | | | | 3.97 | | | | 50 | |
| | 2.40 | | | | 79,740 | | | | | | 0.81 | | | | 3.42 | | | | | | 0.77 | | | | 3.46 | | | | 46 | |
| | 5.52 | | | | 83,264 | | | | | | 0.97 | | | | 3.51 | | | | | | 0.93 | | | | 3.55 | | | | 98 | |
| | 5.73 | | | | 85,980 | | | | | | 0.99 | | | | 3.72 | | | | | | 0.94 | | | | 3.77 | | | | 91 | |
| | | | | | | | | | | | | | | | | | | | | | | | | | | | | | |
| | (1.10 | ) | | | 8,580 | | | | | | 1.60 | | | | 3.06 | | | | | | 1.52 | | | | 3.15 | | | | 44 | |
| | 7.43 | | | | 7,696 | | | | | | 1.59 | | | | 3.13 | | | | | | 1.52 | | | | 3.20 | | | | 50 | |
| | 1.59 | | | | 4,200 | | | | | | 1.56 | | | | 2.67 | | | | | | 1.52 | | | | 2.71 | | | | 46 | |
| | 4.68 | | | | 4,603 | | | | | | 1.72 | | | | 2.76 | | | | | | 1.67 | | | | 2.80 | | | | 98 | |
| | 4.97 | | | | 3,711 | | | | | | 1.74 | | | | 2.97 | | | | | | 1.69 | | | | 3.02 | | | | 91 | |
| | | | | | | | | | | | | | | | | | | | | | | | | | | | | | |
| | (0.70 | ) | | | 3,751 | | | | | | 1.10 | | | | 3.57 | | | | | | 1.02 | | | | 3.65 | | | | 44 | |
| | 7.97 | | | | 638 | | | | | | 1.10 | | | | 3.65 | | | | | | 1.02 | | | | 3.73 | | | | 50 | |
| | 2.11 | | | | 350 | | | | | | 1.06 | | | | 3.18 | | | | | | 1.02 | | | | 3.22 | | | | 46 | |
| | 5.27 | | | | 313 | | | | | | 1.22 | | | | 3.24 | | | | | | 1.18 | | | | 3.27 | | | | 98 | |
| | 5.54 | | | | 380 | | | | | | 1.23 | | | | 3.47 | | | | | | 1.19 | | | | 3.52 | | | | 91 | |
| | | | | | | | | | | | | | | | | | | | | | | | | | | | | | |
| | (0.29 | ) | | | 43,680 | | | | | | 0.54 | * | | | 4.14 | * | | | | | 0.46 | * | | | 4.22 | * | | | 44 | |
| | | | | | | | | | | | | | | | | | | | | | | | | | | | | | |
| | (0.15 | ) | | | 440,499 | | | | | | 0.60 | | | | 4.04 | | | | | | 0.52 | | | | 4.12 | | | | 44 | |
| | 8.64 | | | | 514,961 | | | | | | 0.60 | | | | 4.17 | | | | | | 0.52 | | | | 4.24 | | | | 50 | |
| | 2.52 | | | | 588,627 | | | | | | 0.56 | | | | 3.67 | | | | | | 0.52 | | | | 3.71 | | | | 46 | |
| | 5.79 | | | | 718,505 | | | | | | 0.72 | | | | 3.76 | | | | | | 0.68 | | | | 3.80 | | | | 98 | |
| | 6.09 | | | | 925,541 | | | | | | 0.74 | | | | 3.97 | | | | | | 0.69 | | | | 4.02 | | | | 91 | |
| (a) | Per share Net Investment Income (Loss) is calculated using the average daily shares method. | |
| (b) | Total return is the combination of changes in NAV without any sales charge, reinvested dividend income at NAV and reinvested capital gains distributions at NAV, if any. Total returns are not annualized. | |
| (c) | After fee waiver and/or expense reimbursement from the Adviser, where applicable. | |
| (d) | For fiscal years beginning after June 30, 2011, the Fund will no longer exclude dollar roll transactions, where applicable. | |
| (e) | Portfolio Turnover Rate is calculated based on the lesser of long-term purchases or sales (as disclosed in Note 5 – Investment Transactions) divided by the average long-term market value during the period. | |
| (f) | For the period January 20, 2015 (commencement of operations) through June 30, 2015. | |
See accompanying notes to financial statements.
Financial Highlights (continued)
Inflation Protected Securities
Selected data for a share outstanding throughout each period:
| | | | | | | | | | | | | | | | | | | | | | | | | | | | | | | | | | | | | | |
| | | | | |
| | | | | | Investment Operations | | | | | Less Distributions | | | | |
| | | | | | | | | | |
Class
(Commencement
Date) Year Ended June 30, | | Beginning
NAV | | | Net
Investment
Income
(Loss)(a) | | | Net
Realized/
Unrealized
Gain (Loss) | | | Total | | | | | From
Net
Investment
Income | | | From
Accumulated
Net Realized
Gains | | | Return
of
Capital | | | Total | | | Ending
NAV | |
Class A (10/04) | | | | | | | | | | | | | | | | | | | | | | | | | | | | | | | | | | | |
2015 | | $ | 11.26 | | | $ | (0.03 | ) | | $ | (0.20 | ) | | $ | (0.23 | ) | | | | $ | (0.07 | ) | | $ | — | | | $ | (0.04 | ) | | $ | (0.11 | ) | | $ | 10.92 | |
2014 | | | 11.08 | | | | 0.15 | | | | 0.32 | | | | 0.47 | | | | | | (0.09 | ) | | | (0.20 | ) | | | — | | | | (0.29 | ) | | | 11.26 | |
2013 | | | 11.80 | | | | 0.07 | | | | (0.66 | ) | | | (0.59 | ) | | | | | (0.13 | ) | | | — | | | | — | | | | (0.13 | ) | | | 11.08 | |
2012 | | | 10.94 | | | | 0.23 | | | | 1.01 | | | | 1.24 | | | | | | (0.38 | ) | | | — | | | | — | | | | (0.38 | ) | | | 11.80 | |
2011 | | | 10.33 | | | | 0.35 | | | | 0.40 | | | | 0.75 | | | | | | (0.14 | ) | | | — | | | | — | | | | (0.14 | ) | | | 10.94 | |
Class C (10/04) | | | | | | | | | | | | | | | | | | | | | | | | | | | | | | | | | | | |
2015 | | | 11.21 | | | | (0.11 | ) | | | (0.20 | ) | | | (0.31 | ) | | | | | (0.02 | ) | | | — | | | | (0.04 | ) | | | (0.06 | ) | | | 10.84 | |
2014 | | | 11.03 | | | | 0.06 | | | | 0.35 | | | | 0.41 | | | | | | (0.03 | ) | | | (0.20 | ) | | | — | | | | (0.23 | ) | | | 11.21 | |
2013 | | | 11.72 | | | | (0.03 | ) | | | (0.60 | ) | | | (0.63 | ) | | | | | (0.06 | ) | | | — | | | | — | | | | (0.06 | ) | | | 11.03 | |
2012 | | | 10.84 | | | | 0.14 | | | | 1.00 | | | | 1.14 | | | | | | (0.26 | ) | | | — | | | | — | | | | (0.26 | ) | | | 11.72 | |
2011 | | | 10.24 | | | | 0.26 | | | | 0.41 | | | | 0.67 | | | | | | (0.07 | ) | | | — | | | | — | | | | (0.07 | ) | | | 10.84 | |
Class R3 (10/04) | | | | | | | | | | | | | | | | | | | | | | | | | | | | | | | | | | | |
2015 | | | 11.21 | | | | (0.11 | ) | | | (0.16 | ) | | | (0.27 | ) | | | | | (0.05 | ) | | | — | | | | (0.04 | ) | | | (0.09 | ) | | | 10.85 | |
2014 | | | 11.05 | | | | 0.29 | | | | 0.14 | | | | 0.43 | | | | | | (0.07 | ) | | | (0.20 | ) | | | — | | | | (0.27 | ) | | | 11.21 | |
2013 | | | 11.74 | | | | 0.04 | | | | (0.62 | ) | | | (0.58 | ) | | | | | (0.11 | ) | | | — | | | | — | | | | (0.11 | ) | | | 11.05 | |
2012 | | | 10.84 | | | | 0.22 | | | | 0.97 | | | | 1.19 | | | | | | (0.29 | ) | | | — | | | | — | | | | (0.29 | ) | | | 11.74 | |
2011 | | | 10.31 | | | | 0.11 | | | | 0.54 | | | | 0.65 | | | | | | (0.12 | ) | | | — | | | | — | | | | (0.12 | ) | | | 10.84 | |
Class R6 (1/15) | | | | | | | | | | | | | | | | | | | | | | | | | | | | | | | | | | | |
2015(e) | | | 11.18 | | �� | | — | * | | | (0.16 | ) | | | (0.16 | ) | | | | | — | | | | — | | | | — | * | | | — | | | | 11.02 | |
Class I (10/04) | | | | | | | | | | | | | | | | | | | | | | | | | | | | | | | | | | | |
2015 | | | 11.35 | | | | (0.01 | ) | | | (0.19 | ) | | | (0.20 | ) | | | | | (0.09 | ) | | | — | | | | (0.04 | ) | | | (0.13 | ) | | | 11.02 | |
2014 | | | 11.14 | | | | 0.19 | | | | 0.33 | | | | 0.52 | | | | | | (0.11 | ) | | | (0.20 | ) | | | — | | | | (0.31 | ) | | | 11.35 | |
2013 | | | 11.81 | | | | 0.09 | | | | (0.61 | ) | | | (0.52 | ) | | | | | (0.15 | ) | | | — | | | | — | | | | (0.15 | ) | | | 11.14 | |
2012 | | | 10.96 | | | | 0.25 | | | | 1.01 | | | | 1.26 | | | | | | (0.41 | ) | | | — | | | | — | | | | (0.41 | ) | | | 11.81 | |
2011 | | | 10.34 | | | | 0.40 | | | | 0.38 | | | | 0.78 | | | | | | (0.16 | ) | | | — | | | | — | | | | (0.16 | ) | | | 10.96 | |
| | | | | | | | | | | | | | | | | | | | | | | | | | | | | | |
| | | | Ratios/Supplemental Data | |
| | | | | | | | | Ratios to Average
Net Assets Before
Waiver/Reimbursement | | | | | Ratios to Average
Net Assets After
Waiver/Reimbursement(c) | | | | |
| | | | | | | | |
Total
Return(b) | | | Ending
Net
Assets
(000) | | | | | Expenses | | | Net
Investment
Income
(Loss) | | | | | Expenses | | | Net
Investment
Income
(Loss) | | | Portfolio
Turnover
Rate(d) | |
| | | | | | | | | | | | | | | | | | | | | | | | | | | | | | |
| | (2.04 | )% | | $ | 42,341 | | | | | | 0.92 | % | | | (0.38 | )% | | | | | 0.83 | % | | | (0.29 | )% | | | 34 | % |
| | 4.35 | | | | 24,020 | | | | | | 0.86 | | | | 1.30 | | | | | | 0.83 | | | | 1.33 | | | | 48 | |
| | (5.07 | ) | | | 21,949 | | | | | | 0.81 | | | | 0.56 | | | | | | 0.81 | | | | 0.56 | | | | 52 | |
| | 11.44 | | | | 19,330 | | | | | | 1.00 | | | | 1.81 | | | | | | 0.84 | | | | 1.97 | | | | 47 | |
| | 7.30 | | | | 12,080 | | | | | | 1.09 | | | | 3.05 | | | | | | 0.85 | | | | 3.30 | | | | 45 | |
| | | | | | | | | | | | | | | | | | | | | | | | | | | | | | |
| | (2.75 | ) | | | 9,366 | | | | | | 1.66 | | | | (1.06 | ) | | | | | 1.58 | | | | (0.98 | ) | | | 34 | |
| | 3.76 | | | | 6,954 | | | | | | 1.61 | | | | 0.50 | | | | | | 1.58 | | | | 0.52 | | | | 48 | |
| | (5.39 | ) | | | 9,761 | | | | | | 1.56 | | | | (0.25 | ) | | | | | 1.56 | | | | (0.25 | ) | | | 52 | |
| | 10.62 | | | | 9,703 | | | | | | 1.75 | | | | 1.05 | | | | | | 1.59 | | | | 1.21 | | | | 47 | |
| | 6.59 | | | | 8,043 | | | | | | 1.84 | | | | 2.19 | | | | | | 1.60 | | | | 2.44 | | | | 45 | |
| | | | | | | | | | | | | | | | | | | | | | | | | | | | | | |
| | (2.38 | ) | | | 3,693 | | | | | | 1.15 | | | | (1.05 | ) | | | | | 1.08 | | | | (0.98 | ) | | | 34 | |
| | 3.97 | | | | 3,447 | | | | | | 1.13 | | | | 2.63 | | | | | | 1.08 | | | | 2.68 | | | | 48 | |
| | (5.02 | ) | | | 519 | | | | | | 1.06 | | | | 0.32 | | | | | | 1.06 | | | | 0.32 | | | | 52 | |
| | 11.10 | | | | 173 | | | | | | 1.25 | | | | 1.72 | | | | | | 1.09 | | | | 1.88 | | | | 47 | |
| | 6.31 | | | | 33 | | | | | | 1.38 | | | | 0.78 | | | | | | 1.10 | | | | 1.05 | | | | 45 | |
| | | | | | | | | | | | | | | | | | | | | | | | | | | | | | |
| | (1.39 | ) | | | 3,074 | | | | | | 0.52 | ** | | | (0.12 | )** | | | | | 0.41 | ** | | | (0.01 | )** | | | 34 | |
| | | | | | | | | | | | | | | | | | | | | | | | | | | | | | |
| | (1.78 | ) | | | 331,707 | | | | | | 0.66 | | | | (0.13 | ) | | | | | 0.58 | | | | (0.05 | ) | | | 34 | |
| | 4.82 | | | | 321,472 | | | | | | 0.61 | | | | 1.65 | | | | | | 0.58 | | | | 1.68 | | | | 48 | |
| | (4.46 | ) | | | 344,204 | | | | | | 0.56 | | | | 0.77 | | | | | | 0.56 | | | | 0.77 | | | | 52 | |
| | 11.62 | | | | 321,386 | | | | | | 0.75 | | | | 1.99 | | | | | | 0.59 | | | | 2.15 | | | | 47 | |
| | 7.62 | | | | 255,183 | | | | | | 0.84 | | | | 3.49 | | | | | | 0.60 | | | | 3.74 | | | | 45 | |
| (a) | Per share Net Investment Income (Loss) is calculated using the average daily shares method. | |
| (b) | Total return is the combination of changes in NAV without any sales charge, reinvested dividend income at NAV and reinvested capital gains distributions at NAV, if any. Total returns are not annualized. | |
| (c) | After fee waiver and/or expense reimbursement from the Adviser, where applicable. | |
| (d) | Portfolio Turnover Rate is calculated based on the lesser of long-term purchases or sales (as disclosed in Note 5 – Investment Transactions) divided by the average long-term market value during the period. | |
| (e) | For the period January 20, 2015 (commencement of operations) through June 30, 2015. | |
| * | Rounds to less than $0.01 per share. | |
See accompanying notes to financial statements.
Financial Highlights (continued)
Intermediate Government Bond
Selected data for a share outstanding throughout each period:
| | | | | | | | | | | | | | | | | | | | | | | | | | | | | | | | | | | | | | |
| | | | |
| | | | Investment Operations | | | | | Less Distributions | | | | |
| | | | | | | | | | |
Class (Commencement Date) Year Ended June 30, | | Beginning
NAV | | | Net
Investment
Income
(Loss)(a) | | | Net
Realized/
Unrealized
Gain (Loss) | | | Total | | | | | From
Net
Investment
Income | | | From
Accumulated
Net Realized
Gains | | | Return
of
Capital | | | Total | | | Ending
NAV | |
Class A (10/02) | | | | | | | | | | | | | | | | | | | | | | | | | | | | | | | | | | | |
2015 | | $ | 8.81 | | | $ | 0.10 | | | $ | (0.02 | ) | | $ | 0.08 | | | | | $ | (0.09 | ) | | $ | — | | | $ | — | | | $ | (0.09 | ) | | $ | 8.80 | |
2014 | | | 8.79 | | | | 0.11 | | | | 0.03 | | | | 0.14 | | | | | | (0.11 | ) | | | — | | | | (0.01 | ) | | | (0.12 | ) | | | 8.81 | |
2013 | | | 9.02 | | | | 0.14 | | | | (0.20 | ) | | | (0.06 | ) | | | | | (0.17 | ) | | | — | | | | — | | | | (0.17 | ) | | | 8.79 | |
2012 | | | 8.84 | | | | 0.18 | | | | 0.19 | | | | 0.37 | | | | | | (0.19 | ) | | | — | | | | — | | | | (0.19 | ) | | | 9.02 | |
2011 | | | 8.77 | | | | 0.20 | | | | 0.07 | | | | 0.27 | | | | | | (0.20 | ) | | | — | | | | — | | | | (0.20 | ) | | | 8.84 | |
Class C (10/09) | | | | | | | | | | | | | | | | | | | | | | | | | | | | | | | | | | | |
2015 | | | 8.83 | | | | 0.04 | | | | (0.02 | ) | | | 0.02 | | | | | | (0.03 | ) | | | — | | | | — | | | | (0.03 | ) | | | 8.82 | |
2014 | | | 8.80 | | | | 0.05 | | | | 0.04 | | | | 0.09 | | | | | | (0.05 | ) | | | — | | | | (0.01 | ) | | | (0.06 | ) | | | 8.83 | |
2013 | | | 9.03 | | | | 0.07 | | | | (0.21 | ) | | | (0.14 | ) | | | | | (0.09 | ) | | | — | | | | — | | | | (0.09 | ) | | | 8.80 | |
2012 | | | 8.85 | | | | 0.10 | | | | 0.20 | | | | 0.30 | | | | | | (0.12 | ) | | | — | | | | — | | | | (0.12 | ) | | | 9.03 | |
2011 | | | 8.77 | | | | 0.12 | | | | 0.08 | | | | 0.20 | | | | | | (0.12 | ) | | | — | | | | — | | | | (0.12 | ) | | | 8.85 | |
Class R3 (10/09) | | | | | | | | | | | | | | | | | | | | | | | | | | | | | | | | | | | |
2015 | | | 8.81 | | | | 0.08 | | | | (0.02 | ) | | | 0.06 | | | | | | (0.07 | ) | | | — | | | | — | | | | (0.07 | ) | | | 8.80 | |
2014 | | | 8.78 | | | | 0.09 | | | | 0.04 | | | | 0.13 | | | | | | (0.09 | ) | | | — | | | | (0.01 | ) | | | (0.10 | ) | | | 8.81 | |
2013 | | | 9.01 | | | | 0.12 | | | | (0.21 | ) | | | (0.09 | ) | | | | | (0.14 | ) | | | — | | | | — | | | | (0.14 | ) | | | 8.78 | |
2012 | | | 8.84 | | | | 0.15 | | | | 0.18 | | | | 0.33 | | | | | | (0.16 | ) | | | — | | | | — | | | | (0.16 | ) | | | 9.01 | |
2011 | | | 8.77 | | | | 0.16 | | | | 0.08 | | | | 0.24 | | | | | | (0.17 | ) | | | — | | | | — | | | | (0.17 | ) | | | 8.84 | |
Class I (10/02) | | | | | | | | | | | | | | | | | | | | | | | | | | | | | | | | | | | |
2015 | | | 8.82 | | | | 0.12 | | | | (0.01 | ) | | | 0.11 | | | | | | (0.12 | ) | | | — | | | | — | | | | (0.12 | ) | | | 8.81 | |
2014 | | | 8.80 | | | | 0.13 | | | | 0.04 | | | | 0.17 | | | | | | (0.14 | ) | | | — | | | | (0.01 | ) | | | (0.15 | ) | | | 8.82 | |
2013 | | | 9.03 | | | | 0.16 | | | | (0.21 | ) | | | (0.05 | ) | | | | | (0.18 | ) | | | — | | | | — | | | | (0.18 | ) | | | 8.80 | |
2012 | | | 8.84 | | | | 0.19 | | | | 0.21 | | | | 0.40 | | | | | | (0.21 | ) | | | — | | | | — | | | | (0.21 | ) | | | 9.03 | |
2011 | | | 8.77 | | | | 0.21 | | | | 0.07 | | | | 0.28 | | | | | | (0.21 | ) | | | — | | | | — | | | | (0.21 | ) | | | 8.84 | |
| | | | | | | | | | | | | | | | | | | | | | | | | | | | | | |
| | | | Ratios/Supplemental Data | |
| | | | | | | | | Ratios to Average
Net Assets Before
Waiver/Reimbursement | | | | | Ratios to Average
Net Assets After
Waiver/Reimbursement(c) | | | | |
| | | | | | | | |
Total
Return(b) | | | Ending
Net
Assets
(000) | | | | | Expenses | | | Net
Investment
Income
(Loss) | | | | | Expenses | | | Net
Investment
Income
(Loss) | | | Portfolio
Turnover
Rate(d) | |
| | | | | | | | | | | | | | | | | | | | | | | | | | | | | | |
| | 0.93 | % | | $ | 9,010 | | | | | | 1.02 | % | | | 1.00 | % | | | | | 0.85 | % | | | 1.17 | % | | | 59 | % |
| | 1.65 | | | | 9,621 | | | | | | 1.01 | | | | 1.14 | | | | | | 0.85 | | | | 1.30 | | | | 31 | |
| | (0.74 | ) | | | 11,034 | | | | | | 1.01 | | | | 1.41 | | | | | | 0.85 | | | | 1.57 | | | | 55 | |
| | 4.24 | | | | 12,735 | | | | | | 1.11 | | | | 1.65 | | | | | | 0.77 | | | | 1.99 | | | | 72 | |
| | 3.10 | | | | 14,086 | | | | | | 1.10 | | | | 1.85 | | | | | | 0.73 | | | | 2.22 | | | | 58 | |
| | | | | | | | | | | | | | | | | | | | | | | | | | | | | | |
| | 0.18 | | | | 667 | | | | | | 1.77 | | | | 0.25 | | | | | | 1.60 | | | | 0.42 | | | | 59 | |
| | 0.98 | | | | 639 | | | | | | 1.76 | | | | 0.40 | | | | | | 1.60 | | | | 0.56 | | | | 31 | |
| | (1.53 | ) | | | 1,090 | | | | | | 1.76 | | | | 0.66 | | | | | | 1.60 | | | | 0.82 | | | | 55 | |
| | 3.35 | | | | 1,438 | | | | | | 1.86 | | | | 0.90 | | | | | | 1.60 | | | | 1.16 | | | | 72 | |
| | 2.32 | | | | 1,417 | | | | | | 1.89 | | | | 1.05 | | | | | | 1.58 | | | | 1.37 | | | | 58 | |
| | | | | | | | | | | | | | | | | | | | | | | | | | | | | | |
| | 0.66 | | | | 137 | | | | | | 1.27 | | | | 0.75 | | | | | | 1.10 | | | | 0.92 | | | | 59 | |
| | 1.49 | | | | 137 | | | | | | 1.26 | | | | 0.89 | | | | | | 1.10 | | | | 1.05 | | | | 31 | |
| | (1.00 | ) | | | 168 | | | | | | 1.26 | | | | 1.17 | | | | | | 1.10 | | | | 1.32 | | | | 55 | |
| | 3.79 | | | | 214 | | | | | | 1.36 | | | | 1.39 | | | | | | 1.10 | | | | 1.66 | | | | 72 | |
| | 2.75 | | | | 473 | | | | | | 1.39 | | | | 1.56 | | | | | | 1.08 | | | | 1.87 | | | | 58 | |
| | | | | | | | | | | | | | | | | | | | | | | | | | | | | | |
| | 1.20 | | | | 65,850 | | | | | | 0.77 | | | | 1.24 | | | | | | 0.60 | | | | 1.40 | | | | 59 | |
| | 1.90 | | | | 86,186 | | | | | | 0.76 | | | | 1.36 | | | | | | 0.60 | | | | 1.52 | | | | 31 | |
| | (0.53 | ) | | | 52,291 | | | | | | 0.76 | | | | 1.67 | | | | | | 0.60 | | | | 1.83 | | | | 55 | |
| | 4.50 | | | | 70,060 | | | | | | 0.86 | | | | 1.90 | | | | | | 0.60 | | | | 2.16 | | | | 72 | |
| | 3.25 | | | | 98,960 | | | | | | 0.89 | | | | 2.05 | | | | | | 0.58 | | | | 2.36 | | | | 58 | |
| (a) | Per share Net Investment Income (Loss) is calculated using the average daily shares method. | |
| (b) | Total return is the combination of changes in NAV without any sales charge, reinvested dividend income at NAV and reinvested capital gains distributions at NAV, if any. Total returns are not annualized. | |
| (c) | After fee waiver and/or expense reimbursement from the Adviser, where applicable. | |
| (d) | Portfolio Turnover Rate is calculated based on the lesser of long-term purchases or sales (as disclosed in Note 5 – Investment Transactions) divided by the average long-term market value during the period. | |
See accompanying notes to financial statements.
Financial Highlights (continued)
Short Term Bond
Selected data for a share outstanding throughout each period:
| | | | | | | | | | | | | | | | | | | | | | | | | | | | | | | | | | |
| | | | | |
| | | | | | Investment Operations | | | | | Less Distributions | | | | |
| | | | | | | | | |
Class (Commencement Date) Year Ended June 30, | | Beginning
NAV | | | Net
Investment
Income
(Loss)(a) | | | Net
Realized/
Unrealized
Gain (Loss) | | | Total | | | | | From
Net
Investment
Income | | | From
Accumulated
Net Realized
Gains | | | Total | | | Ending
NAV | |
Class A (12/92) | | | | | | | | | | | | | | | | | | | | | | | |
2015 | | $ | 10.05 | | | $ | 0.16 | | | $ | (0.13 | ) | | $ | 0.03 | | | | | $ | (0.15 | ) | | $ | — | | | $ | (0.15 | ) | | $ | 9.93 | |
2014 | | | 9.97 | | | | 0.19 | | | | 0.08 | | | | 0.27 | | | | | | (0.19 | ) | | | — | | | | (0.19 | ) | | | 10.05 | |
2013 | | | 9.95 | | | | 0.20 | | | | 0.03 | | | | 0.23 | | | | | | (0.21 | ) | | | — | | | | (0.21 | ) | | | 9.97 | |
2012 | | | 10.06 | | | | 0.24 | | | | (0.10 | ) | | | 0.14 | | | | | | (0.25 | ) | | | — | | | | (0.25 | ) | | | 9.95 | |
2011 | | | 9.98 | | | | 0.24 | | | | 0.06 | | | | 0.30 | | | | | | (0.22 | ) | | | — | | | | (0.22 | ) | | | 10.06 | |
Class C (10/09) | | | | | | | | | | | | | | | | | | | | | | | |
2015 | | | 10.08 | | | | 0.08 | | | | (0.12 | ) | | | (0.04 | ) | | | | | (0.07 | ) | | | — | | | | (0.07 | ) | | | 9.97 | |
2014 | | | 10.00 | | | | 0.11 | | | | 0.08 | | | | 0.19 | | | | | | (0.11 | ) | | | — | | | | (0.11 | ) | | | 10.08 | |
2013 | | | 9.97 | | | | 0.12 | | | | 0.04 | | | | 0.16 | | | | | | (0.13 | ) | | | — | | | | (0.13 | ) | | | 10.00 | |
2012 | | | 10.09 | | | | 0.16 | | | | (0.11 | ) | | | 0.05 | | | | | | (0.17 | ) | | | — | | | | (0.17 | ) | | | 9.97 | |
2011 | | | 10.00 | | | | 0.15 | | | | 0.07 | | | | 0.22 | | | | | | (0.13 | ) | | | — | | | | (0.13 | ) | | | 10.09 | |
Class R3 (9/11) | | | | | | | | | | | | | | | | | | | | | | | |
2015 | | | 10.07 | | | | 0.13 | | | | (0.13 | ) | | | 0.00 | | | | | | (0.12 | ) | | | — | | | | (0.12 | ) | | | 9.95 | |
2014 | | | 9.99 | | | | 0.16 | | | | 0.08 | | | | 0.24 | | | | | | (0.16 | ) | | | — | | | | (0.16 | ) | | | 10.07 | |
2013 | | | 9.96 | | | | 0.17 | | | | 0.04 | | | | 0.21 | | | | | | (0.18 | ) | | | — | | | | (0.18 | ) | | | 9.99 | |
2012(e) | | | 9.85 | | | | 0.16 | | | | 0.13 | | | | 0.29 | | | | | | (0.18 | ) | | | — | | | | (0.18 | ) | | | 9.96 | |
Class R6 (1/15) | | | | | | | | | | | | | | | | | | | | | | | |
2015(f) | | | 9.93 | | | | 0.09 | | | | — | * | | | 0.09 | | | | | | (0.07 | ) | | | — | | | | (0.07 | ) | | | 9.95 | |
Class I (2/94) | | | | | | | | | | | | | | | | | | | | | | | |
2015 | | | 10.06 | | | | 0.18 | | | | (0.12 | ) | | | 0.06 | | | | | | (0.18 | ) | | | — | | | | (0.18 | ) | | | 9.94 | |
2014 | | | 9.98 | | | | 0.21 | | | | 0.08 | | | | 0.29 | | | | | | (0.21 | ) | | | — | | | | (0.21 | ) | | | 10.06 | |
2013 | | | 9.95 | | | | 0.22 | | | | 0.04 | | | | 0.26 | | | | | | (0.23 | ) | | | — | | | | (0.23 | ) | | | 9.98 | |
2012 | | | 10.07 | | | | 0.26 | | | | (0.11 | ) | | | 0.15 | | | | | | (0.27 | ) | | | — | | | | (0.27 | ) | | | 9.95 | |
2011 | | | 9.99 | | | | 0.25 | | | | 0.06 | | | | 0.31 | | | | | | (0.23 | ) | | | — | | | | (0.23 | ) | | | 10.07 | |
| | | | | | | | | | | | | | | | | | | | | | | | | | | | | | |
| | | | Ratios/Supplemental Data | |
| | | | | | | | | Ratios to Average
Net Assets Before
Waiver/Reimbursement | | | | | Ratios to Average
Net Assets After
Waiver/Reimbursement(c) | | | | |
| | | | | | | | |
Total
Return(b) | | | Ending
Net
Assets
(000) | | | | | Expenses | | | Net
Investment
Income
(Loss) | | | | | Expenses | | | Net
Investment
Income
(Loss) | | | Portfolio
Turnover
Rate(d) | |
| | | | | | | | | | | | | | | | | | | | | | | | | | | | | | |
| | 0.32 | % | | $ | 100,544 | | | | | | 0.73 | % | | | 1.56 | % | | | | | 0.71 | % | | | 1.58 | % | | | 43 | % |
| | 2.69 | | | | 116,365 | | | | | | 0.73 | | | | 1.84 | | | | | | 0.71 | | | | 1.86 | | | | 43 | |
| | 2.30 | | | | 141,099 | | | | | | 0.73 | | | | 1.96 | | | | | | 0.71 | | | | 1.99 | | | | 42 | |
| | 1.42 | | | | 112,851 | | | | | | 0.82 | | | | 2.33 | | | | | | 0.73 | | | | 2.42 | | | | 56 | |
| | 3.00 | | | | 80,927 | | | | | | 0.87 | | | | 2.22 | | | | | | 0.73 | | | | 2.37 | | | | 58 | |
| | | | | | | | | | | | | | | | | | | | | | | | | | | | | | |
| | (0.36 | ) | | | 33,547 | | | | | | 1.48 | | | | 0.81 | | | | | | 1.46 | | | | 0.83 | | | | 43 | |
| | 1.89 | | | | 39,347 | | | | | | 1.48 | | | | 1.11 | | | | | | 1.46 | | | | 1.13 | | | | 43 | |
| | 1.61 | | | | 44,414 | | | | | | 1.48 | | | | 1.22 | | | | | | 1.46 | | | | 1.24 | | | | 42 | |
| | 0.50 | | | | 42,346 | | | | | | 1.56 | | | | 1.56 | | | | | | 1.55 | | | | 1.57 | | | | 56 | |
| | 2.22 | | | | 5,101 | | | | | | 1.66 | | | | 1.45 | | | | | | 1.58 | | | | 1.53 | | | | 58 | |
| | | | | | | | | | | | | | | | | | | | | | | | | | | | | | |
| | 0.02 | | | | 131 | | | | | | 0.98 | | | | 1.29 | | | | | | 0.96 | | | | 1.31 | | | | 43 | |
| | 2.38 | | | | 1,049 | | | | | | 0.98 | | | | 1.59 | | | | | | 0.96 | | | | 1.61 | | | | 43 | |
| | 2.10 | | | | 516 | | | | | | 0.98 | | | | 1.71 | | | | | | 0.96 | | | | 1.73 | | | | 42 | |
| | 2.92 | | | | 446 | | | | | | 1.06 | ** | | | 2.07 | ** | | | | | 1.05 | ** | | | 2.07 | ** | | | 56 | |
| | | | | | | | | | | | | | | | | | | | | | | | | | | | | | |
| | 0.96 | | | | 27,475 | | | | | | 0.46 | ** | | | 1.95 | ** | | | | | 0.43 | ** | | | 1.98 | ** | | | 43 | |
| | | | | | | | | | | | | | | | | | | | | | | | | | | | | | |
| | 0.57 | | | | 529,027 | | | | | | 0.48 | | | | 1.80 | | | | | | 0.46 | | | | 1.82 | | | | 43 | |
| | 2.93 | | | | 915,119 | | | | | | 0.48 | | | | 2.09 | | | | | | 0.46 | | | | 2.11 | | | | 43 | |
| | 2.65 | | | | 720,722 | | | | | | 0.48 | | | | 2.22 | | | | | | 0.46 | | | | 2.23 | | | | 42 | |
| | 1.51 | | | | 727,242 | | | | | | 0.57 | | | | 2.59 | | | | | | 0.55 | | | | 2.61 | | | | 56 | |
| | 3.16 | | | | 741,969 | | | | | | 0.67 | | | | 2.43 | | | | | | 0.58 | | | | 2.52 | | | | 58 | |
| (a) | Per share Net Investment Income (Loss) is calculated using the average daily shares method. | |
| (b) | Total return is the combination of changes in NAV without any sales charge, reinvested dividend income at NAV and reinvested capital gains distributions at NAV, if any. Total returns are not annualized. | |
| (c) | After fee waiver and/or expense reimbursement from the Adviser, where applicable. | |
| (d) | Portfolio Turnover Rate is calculated based on the lesser of long-term purchases or sales (as disclosed in Note 5 – Investment Transactions) divided by the average long-term market value during the period. | |
| (e) | For the period September 23, 2011 (commencement of operations) through June 30, 2012. | |
| (f) | For the period January 20, 2015 (commencement of operations) through June 30, 2015. | |
| * | Rounds to less than $0.01 per share. | |
See accompanying notes to financial statements.
Notes to
Financial Statements
1. General Information and Significant Accounting Policies
General Information
Trust and Fund Information
Nuveen Investment Funds, Inc. (the “Trust”) is an open-end management investment company registered under the Investment Company Act of 1940, as amended. The Trust is comprised of Nuveen Core Bond Fund (“Core Bond”), Nuveen Core Plus Bond Fund (“Core Plus Bond”), Nuveen Inflation Protected Securities Fund (“Inflation Protected Securities”), Nuveen Intermediate Government Bond Fund (“Intermediate Government Bond”) and Nuveen Short Term Bond Fund (“Short Term Bond”) (each a “Fund” and collectively, the “Funds”), as diversified funds, among others. The Trust was incorporated in the State of Maryland on August 20, 1987.
The end of the reporting period for the Funds is June 30, 2015, and the period covered by these Notes to Financial Statements is the fiscal year ended June 30, 2015 (“the current fiscal period”).
Investment Adviser
The Funds’ investment adviser is Nuveen Fund Advisors, LLC (the “Adviser”), a wholly-owned subsidiary of Nuveen Investments, Inc. (“Nuveen”). The Adviser is responsible for each Fund’s overall investment strategy and asset allocation decisions. The Adviser has entered into sub-advisory agreements with Nuveen Asset Management, LLC (the “Sub-Adviser”), a subsidiary of the Adviser, under which the Sub-Adviser manages the investment portfolios of the Funds.
Investment Objectives and Principal Investment Strategies
Core Bond
Core Bond’s investment objective is to provide investors with current income to the extent consistent with preservation of capital. Under normal market conditions, the Fund invests at least 80% of the sum of its net assets and the amount of any borrowings for investment purposes in bonds, such as U.S. government securities (securities issued or guaranteed by the U.S. government or its agencies or instrumentalities), including zero coupon securities, residential and commercial mortgage-backed securities, asset-backed securities, corporate debt obligations, including obligations issued by special-purpose entities that are backed by corporate debt obligations and municipal securities in an amount not to exceed 20% of the Fund’s net assets. Bonds in the Fund will be rated investment grade at the time of purchase or, if unrated, determined to be of comparable quality by the Sub-Adviser. If the rating of a security is reduced or the credit quality of an unrated security declines after purchase, the Fund is not required to sell the security, but may consider doing so. Unrated securities will not exceed 25% of the Fund’s total assets.
The Fund may invest up to 25% of its total assets in U.S. dollar denominated debt obligations of foreign corporations and governments.
Under normal market conditions, the Fund attempts to maintain a weighted average effective maturity for its portfolio securities of three to ten years and an average effective duration of two to six years. The Fund’s weighted average effective maturity and effective duration are measures of how the value of the Fund’s shares may react to interest rate changes.
To generate additional income, the Fund may invest up to 25% of its total assets in dollar roll transactions. In a dollar roll transaction, the Fund sells mortgage-backed securities for delivery in the current month while contracting with the same party to repurchase similar securities at a future date.
The Fund may utilize the following derivatives: options; futures contracts; options on futures contracts, interest rate caps, collars, and floors; swap agreements, including swap agreements on interest rates, security indexes and specific securities and credit default swap agreements; and options on the foregoing types of swap agreements. The Fund may enter into standardized derivatives contracts traded on domestic or foreign securities exchanges, boards of trade, or similar entities and non-standardized derivatives contracts traded in the over-the-counter (“OTC”) market. The Fund may use these derivatives in an attempt to manage market risk, credit risk and yield curve risk, to manage the effective maturity or duration of securities in the Fund’s portfolio or for speculative purposes in an effort to increase the Fund’s yield or to enhance returns. The use of a derivative is speculative if the Fund is primarily seeking to enhance returns, rather than offset the risk of other positions. The Fund may not use any derivative to gain exposure to a security or type of security that it would be prohibited by its investment restrictions from purchasing directly.
Core Plus Bond
Core Plus Bond’s investment objective is to provide investors with high current income consistent with limited risk to capital. Under normal market conditions, the Fund invests at least 80% of the sum of its net assets and the amount of any borrowings for investment purposes in bonds, such as U.S. government securities (securities issued or guaranteed by the U.S. government or its agencies or instrumentalities), including zero coupon securities,
residential and commercial mortgage-backed securities, asset-backed securities, corporate debt obligations, including obligations issued by special-purpose entities that are backed by corporate debt obligations and municipal securities in an amount not to exceed 20% of the Fund’s net assets.
Up to 20% of the Fund’s total assets may be invested in securities rated lower than investment grade or unrated securities of comparable quality as determined by the Sub-Adviser (securities commonly referred to as “high yield” securities or “junk” bonds). The Fund will not invest in securities rated lower than CCC at the time of purchase or in unrated securities of comparable quality as determined by the Sub-Adviser. If the rating of a security is reduced or the credit quality of an unrated security declines after purchase, the Fund is not required to sell the security, but may consider doing so. Unrated securities will not exceed 25% of the Fund’s total assets.
The Fund may invest up to 35% of its total assets in debt obligations of foreign corporations and foreign governments. However, no more than 10% of the Fund’s total assets may be invested in debt obligations of corporations and governments that are located in emerging market countries. A country is considered to have an “emerging market” if it has a relatively low gross national product per capita compared to the world’s major economies, and the potential for rapid economic growth, provided that no issuer included in the Fund’s current benchmark index will be considered to be located in an emerging market country.
Up to 10% of the Fund’s total assets may have non-U.S. dollar currency exposure from non-U.S. dollar denominated securities and currency derivatives, calculated on an absolute notional basis (i.e., adding together the absolute value of net long and net short exposures to individual non-U.S. dollar currencies).
Under normal market conditions, the Fund attempts to maintain a weighted average effective maturity for its portfolio securities of fifteen years or less and an average effective duration of three to eight years. The Fund’s weighted average effective maturity and average effective duration are measures of how the value of the Fund’s shares may react to interest rate changes.
To generate additional income, the Fund may invest up to 25% of its total assets in dollar roll transactions. In a dollar roll transaction, the Fund sells mortgage-backed securities for delivery in the current month while contracting with the same party to repurchase similar securities at a future date.
The Fund may utilize the following derivatives: options; futures contracts; options on futures contracts; interest rate caps, collars, and floors; foreign currency contracts; options on foreign currencies; swap agreements, including swap agreements on interest rates, currency rates, security indexes and specific securities, and credit default swap agreements; and options on the foregoing types of swap agreements. The Fund may enter into standardized derivatives contracts traded on domestic or foreign securities exchanges, boards of trade, or similar entities, and non-standardized derivatives contracts traded in the OTC market. The Fund may use these derivatives in an attempt to manage market risk, currency risk, credit risk and yield curve risk, to manage the effective maturity or duration of securities in the Fund’s portfolio or for speculative purposes in an effort to increase the Fund’s yield or to enhance returns. The Fund may also use derivatives to gain exposure to non-dollar denominated securities markets to the extent it does not do so through direct investments. The use of a derivative is speculative if the Fund is primarily seeking to enhance returns, rather than offset the risk of other positions. The Fund may not use any derivative to gain exposure to a security or type of security that it would be prohibited by its investment restrictions from purchasing directly.
Inflation Protected Securities
Inflation Protected Securities’ investment objective is to provide investors with total return while providing protection against inflation. Under normal market conditions, the Fund invests at least 80% of the sum of its net assets and the amount of any borrowings for investment purposes in inflation protected debt securities. These securities will be issued by the U.S. and non-U.S. governments, their agencies and instrumentalities, and domestic and foreign corporations. The Fund’s investments in U.S. government inflation protected securities will include U.S. Treasury inflation protected securities as well as inflation protected securities issued by agencies and instrumentalities of the U.S. government. Securities issued by the U.S. Treasury are backed by the full faith and credit of the U.S. government. Some securities issued by agencies and instrumentalities of the U.S. government are supported only by the credit of the issuing agency or instrumentality.
Inflation protected debt securities are designed to provide protection against the negative effects of inflation. Unlike traditional debt securities, which pay regular fixed interest payments on a fixed principal amount, interest payments on inflation protected debt securities will vary with the rate of inflation. The U.S. Treasury uses the Consumer Price Index for Urban Consumers (CPI-U) as the inflation measure. Inflation protected debt securities issued by foreign governments and corporations are generally linked to a non-U.S. inflation rate.
Inflation protected debt securities have two common structures. The U.S. Treasury and some other issuers use a structure that accrues inflation into the principal value of the bond. If the index measuring the rate of inflation rises, the principal value of the security will increase. Because interest payments will be calculated with respect to a larger principal amount, interest payments also will increase. Conversely, if the index measuring the rate of inflation falls, the principal value of the security will fall and interest payments will decrease. Other issuers adjust the interest rates payable on the security according to the rate of inflation, but the principal amount remains the same.
In the event of sustained deflation, the U.S. Treasury has guaranteed that it will repay at maturity at least the original face value of the inflation protected securities that it issues. Other inflation protected debt securities that accrue inflation into their principal value may or may not provide a similar guarantee. For securities that do not provide such a guarantee, the adjusted principal value of the security repaid at maturity may be less than the original principal value.
Notes to Financial Statements (continued)
Up to 20% of the Fund’s assets may be invested in holdings that are not inflation protected, which may include domestic and foreign corporate debt obligations, securities issued or guaranteed by the U.S. government or its agencies and instrumentalities, debt obligations of foreign governments, residential and commercial mortgage-backed securities, asset-backed securities and derivative instruments, as discussed below.
Up to 10% of the Fund’s net assets may be invested in securities that are rated lower than investment grade at the time of purchase or that are unrated and of comparable quality (securities commonly referred to as “high-yield” securities or “junk” bonds). The Fund will not invest in securities rated lower than B at the time of purchase or in unrated securities of comparable quality as determined by the Sub-Adviser. If the rating of a security is reduced or the credit quality of an unrated security declines after purchase, the Fund is not required to sell the security, but may consider doing so.
The Fund may invest up to 20% of its net assets in non-U.S. dollar denominated securities, and may invest without limitation in U.S. dollar denominated securities of foreign corporations and governments.
The Fund may invest in debt securities of any maturity, but expects to maintain, under normal market conditions, a weighted average effective maturity of between eight and fifteen years and an average effective duration of between four and ten years. The Fund’s weighted average effective maturity and average effective duration are measures of how the Fund may react to interest rate changes.
The Fund may utilize the following derivatives: options; futures contracts; options on futures contracts; foreign currency contracts; options on foreign currencies; interest rate caps, collars, and floors; index- and other asset-linked notes; swap agreements, including swap agreements on interest rates, currency rates, security indexes and specific securities, and credit default swap agreements; and options on the foregoing types of swap agreements. The Fund may enter into standardized derivatives contracts traded on domestic or foreign securities exchanges, boards of trade, or similar entities, and non-standardized derivatives contracts traded in the OTC market. The Fund may use these derivatives in an attempt to manage market risk, currency risk, credit risk and yield curve risk, to manage the effective maturity or duration of securities in the Fund’s portfolio or for speculative purposes in an effort to increase the Fund’s yield or to enhance returns. The Fund may also use derivatives to gain exposure to non-dollar denominated securities markets to the extent it does not do so through direct investments. The use of a derivative is speculative if the Fund is primarily seeking to enhance returns, rather than offset the risk of other positions. The Fund may not use any derivative to gain exposure to a security or type of security that it would be prohibited by its investment restrictions from purchasing directly.
Intermediate Government Bond
Intermediate Government Bond’s investment objective is to provide investors with current income to the extent consistent with the preservation of capital. Under normal market conditions, the Fund invests at least 80% of the sum of its net assets and the amount of any borrowings for investment purposes in U.S. government bonds. U.S. government bonds are securities issued or guaranteed by the U.S. government or its agencies or instrumentalities, including U.S. Treasury obligations, mortgage-backed securities issued by the Government National Mortgage Association, the Federal National Mortgage Association (FNMA), and the Federal Home Loan Mortgage Corporation (FHLMC) and non-mortgage-related obligations issued or guaranteed by U.S. government agencies or instrumentalities, such as FNMA, FHLMC, Federal Farm Credit Banks, the Federal Home Loan Bank System, and the Tennessee Valley Authority, including obligations that are issued by private issuers and guaranteed under the Federal Deposit Insurance Corporation (FDIC) Temporary Liquidity Guarantee Program.
U.S. Treasury obligations and some obligations of U.S. government agencies and instrumentalities are supported by the full faith and credit of the U.S. government. Other U.S. government securities are backed by the right of the issuer to borrow from the U.S. Treasury. Still others are supported only by the credit of the issuing agency or instrumentality.
The Fund may invest up to 20% of its total assets, collectively, in non-U.S. government debt obligations, asset-backed securities, residential and commercial mortgage-backed securities, corporate debt obligations, and municipal securities. Such securities will be rated investment grade at the time of purchase or, if unrated, determined to be of comparable quality by the Sub-Adviser. If the rating of a security is reduced or the credit quality of an unrated security declines after purchase, the Fund is not required to sell the security, but may consider doing so.
Under normal market conditions, the Fund attempts to maintain a weighted average effective maturity between three and ten years and an effective duration of between two and one-half and seven years. The Fund’s weighted average effective maturity and effective duration are measures of how the value of the Fund’s shares may react to interest rate changes.
To generate additional income, the Fund may invest up to 10% of its total assets in dollar roll transactions. In a dollar roll transaction, the Fund sells mortgage-backed securities for delivery in the current month while contracting with the same party to repurchase similar securities at a future date.
The Fund may utilize the following derivatives: futures contracts; options on futures contracts, swap agreements, including swap agreements on interest rates, security indexes and specific securities and credit default swap agreements; and options on the foregoing types of swap agreements. The Fund may enter into standardized derivatives contracts that are traded on domestic securities exchanges, boards of trade, or similar entities and non-standardized derivatives contracts traded in the OTC market. The Fund may use these derivatives in an attempt to manage market risk, credit risk and yield curve risk, to manage the effective maturity or duration of securities in the Fund’s portfolio, or for speculative purposes in an effort to increase the Fund’s yield or to enhance returns. The use of a derivative is speculative if the Fund is primarily seeking to enhance returns, rather than offset the risk of other positions. The Fund may not use derivatives to gain exposure to a security or type of security that it would be prohibited by its investment restrictions from purchasing directly.
Short Term Bond
Short Term Bond’s investment objective is to provide investors with current income while maintaining a high degree of principal stability. Under normal market conditions, the Fund invests at least 80% of the sum of its net assets and the amount of any borrowings for investment purposes in bonds, such as U.S. government securities, which are securities issued or guaranteed by the U.S. government or its agencies or instrumentalities, residential and commercial mortgage-backed securities, asset-backed securities, corporate debt obligations, including obligations issued by special-purpose entities that are backed by corporate debt obligations, and municipal securities.
Up to 20% of the Fund’s total assets may be invested in securities rated lower than investment grade or unrated securities of comparable quality as determined by the Sub-Adviser (securities commonly referred to as “high yield” securities or “junk” bonds). The Fund will not invest in securities rated lower than CCC at the time of purchase or in unrated securities of comparable quality as determined by the Sub-Adviser. If the rating of a security is reduced or the credit quality of an unrated security declines after purchase, the Fund is not required to sell the security, but may consider doing so. Unrated securities will not exceed 5% of the Fund’s total assets.
The Fund may invest up to 35% of its total assets in debt obligations of foreign corporations and foreign governments. However, no more than 10% of the Fund’s total assets may be invested in debt obligations of corporations and governments that are located in emerging market countries. A country is considered to have an “emerging market” if it has a relatively low gross national product per capita compared to the world’s major economies, and the potential for rapid economic growth, provided that no issuer included in the Fund’s current benchmark index will be considered to be located in an emerging market country.
Up to 10% of the Fund’s total assets may have non-U.S. dollar currency exposure from non-U.S. dollar denominated securities and currency derivatives, calculated on an absolute notional basis (i.e., adding together the absolute value of net long and net short exposures to individual non-U.S. dollar currencies).
Under normal market conditions, the Fund attempts to maintain a weighted average effective maturity and an average effective duration for its portfolio securities of one to three years. The Fund’s weighted average effective maturity and effective duration are measures of how the value of the Fund’s shares may react to interest rate changes.
The Fund may utilize the following derivatives: options; futures contracts; options on futures contracts; interest rate caps, collars, and floors; foreign currency contracts; options on foreign currencies; swap agreements, including swap agreements on interest rates, currency rates, security indexes and specific securities, and credit default swap agreements; and options on the foregoing types of swap agreements. The Fund may enter into standardized derivatives contracts traded on domestic or foreign securities exchanges, boards of trade, or similar entities, and non-standardized derivatives contracts traded in the OTC market. The Fund may use these derivatives in an attempt to manage market risk, currency risk, credit risk and yield curve risk, to manage the effective maturity or duration of securities in the Fund’s portfolio or for speculative purposes in an effort to increase the Fund’s yield or to enhance returns. The Fund may also use derivatives to gain exposure to non-dollar denominated securities markets to the extent it does not do so through direct investments. The use of a derivative is speculative if the Fund is primarily seeking to enhance returns, rather than offset the risk of other positions. The Fund may not use any derivative to gain exposure to a security or type of security that it would be prohibited by its investment restrictions from purchasing directly.
The Funds’ most recent prospectus provides further descriptions of each Fund’s investment objective, principal investment strategies and principal risks.
Class R6 Shares
Core Bond, Core Plus Bond, Inflation Protected Securities and Short Term Bond began offering Class R6 Shares on January 20, 2015.
Significant Accounting Policies
Each Fund is an investment company and follows accounting and reporting guidance under Financial Accounting Standards Board (FASB) Accounting Standards Codification (ASC) Topic 946 “Financial Services – Investment Companies.” The following is a summary of significant accounting policies followed by the Funds in the preparation of their financial statements in accordance with accounting principles generally accepted in the United States (“U.S. GAAP”).
Investment Transactions
Investment transactions are recorded on a trade date basis. Realized gains and losses from investment transactions are determined on the specific identification method, which is the same basis used for federal income tax purposes. Investments purchased on a when-issued/delayed delivery basis may have extended settlement periods. Any investments so purchased are subject to market fluctuation during this period. The Funds have earmarked securities in their portfolios with a current value at least equal to the amount of the when-issued/delayed delivery purchase commitments.
Notes to Financial Statements (continued)
As of the end of the reporting period, the following Funds’ outstanding when-issued/delayed delivery purchase commitments were as follows:
| | | | | | | | | | | | |
| | | Core
Bond | | | Core Plus
Bond | | | Short Term
Bond | |
| Outstanding when-issued/delayed delivery purchase commitments | | $ | 4,072,348 | | | $ | 15,578,460 | | | $ | 1,062,870 | |
Investment Income
Dividend income is recorded on the ex-dividend date or, for foreign securities, when information is available. Interest income, which reflects the amortization of premiums and accretion of discounts for financial reporting purposes, is recorded on an accrual basis. Interest income also reflects pay down gains and losses, if any. Securities lending income is comprised of fees earned from borrowers and income earned on cash collateral investments, net of lending agent fees.
Professional Fees
Professional fees presented on the Statement of Operations consist of legal fees incurred in the normal course of operations, audit fees, tax consulting fees and, in some cases, workout expenditures. Workout expenditures are incurred in an attempt to protect or enhance an investment or to pursue other claims or legal actions on behalf of Fund shareholders. If a refund is received for workout expenditures paid in a prior reporting period, such amounts will be recognized as “Legal fee refund” on the Statement of Operations.
Dividends and Distributions to Shareholders
Dividends from net investment income are declared daily and distributed to shareholders monthly. Fund shares begin to accrue dividends on the business day after the day when the monies used to purchase Fund shares are collected by the transfer agent.
Net realized capital gains from investment transactions, if any, are declared and distributed to shareholders at least annually. Furthermore, capital gains are distributed only to the extent they exceed available capital loss carryforwards.
Distributions to shareholders are recorded on the ex-dividend date. The amount and timing of distributions are determined in accordance with federal income tax regulations, which may differ from U.S. GAAP.
Share Classes and Sales Charges
Class A Shares are generally sold with an up-front sales charge and incur a 0.25% annual 12b-1 service fee. Class A Share purchases of the Funds, with the exception of Short Term Bond, of $1 million or more are sold at net asset value (“NAV”) without an up-front sales charge. Class A Share purchases of Short Term Bond of $250,000 or more are sold at NAV without an up-front sales charge. Class A Share purchases may be subject to a contingent deferred sales charge (“CDSC”) if redeemed within eighteen months of purchase. Class C Shares are sold without an up-front sales charge but incur a 0.75% annual 12b-1 distribution fee and a 0.25% annual 12b-1 service fee. Class C Shares are subject to a CDSC of 1% if redeemed within twelve months of purchase. Class R3 Shares are sold without an up-front sales charge but incur a 0.25% annual 12b-1 distribution fee and a 0.25% annual 12b-1 service fee. Class R6 Shares and Class I Shares are not subject to any sales charge or 12b-1 distribution or service fees.
Multiclass Operations and Allocations
Income and expenses of the Funds that are not directly attributable to a specific class of shares are prorated among the classes based on the relative settled shares of each class. Expenses directly attributable to a class of shares are recorded to the specific class. Currently, the only expenses that are allocated on a class-specific basis are 12b-1 distribution and service fees.
Sub-transfer agent fees, which are recognized as a component of “Shareholder servicing agent fees” on the Statement of Operations, are not charged to Class R6 Shares and are prorated among the other classes based on their relative net assets.
Realized and unrealized capital gains and losses of the Funds are prorated among the classes based on the relative net assets of each class.
Indemnifications
Under the Trust’s organizational documents, its officers and directors are indemnified against certain liabilities arising out of the performance of their duties to the Trust. In addition, in the normal course of business, the Trust enters into contracts that provide general indemnifications to other parties. The Trust’s maximum exposure under these arrangements is unknown as this would involve future claims that may be made against the Trust that have not yet occurred. However, the Trust has not had prior claims or losses pursuant to these contracts and expects the risk of loss to be remote.
Netting Agreements
In the ordinary course of business, the Funds may enter into transactions subject to enforceable International Swaps and Derivative Association, Inc. (“ISDA”) master agreements or other similar arrangements (“netting agreements”). Generally, the right to offset in netting agreements allows each Fund to offset certain securities and derivatives with a specific counterparty as well as any collateral received or delivered to that counterparty based on the terms of the agreements. Generally, each Fund manages its cash collateral and securities collateral on a counterparty basis.
The Funds’ investments subject to netting agreements as of the end of the reporting period, if any, are further described in Note 3 – Portfolio Securities and Investments in Derivatives.
Use of Estimates
The preparation of financial statements in conformity with U.S. GAAP requires management to make estimates and assumptions that affect the reported amounts of assets and liabilities at the date of the financial statements and the reported amounts of increases and decreases in net assets from operations during the reporting period. Actual results may differ from those estimates.
2. Investment Valuation and Fair Value Measurements
The fair valuation input levels as described below are for fair value measurement purposes.
Fair value is defined as the price that would be received upon selling an investment or transferring a liability in an orderly transaction to an independent buyer in the principal or most advantageous market for the investment. A three-tier hierarchy is used to maximize the use of observable market data and minimize the use of unobservable inputs and to establish classification of fair value measurements for disclosure purposes. Observable inputs reflect the assumptions market participants would use in pricing the asset or liability. Observable inputs are based on market data obtained from sources independent of the reporting entity. Unobservable inputs reflect the reporting entity’s own assumptions about the assumptions market participants would use in pricing the asset or liability. Unobservable inputs are based on the best information available in the circumstances. The following is a summary of the three-tiered hierarchy of valuation input levels.
| | |
| Level 1 – | | Inputs are unadjusted and prices are determined using quoted prices in active markets for identical securities. |
| Level 2 – | | Prices are determined using other significant observable inputs (including quoted prices for similar securities, interest rates, prepayment speeds, credit risk, etc.). |
| Level 3 – | | Prices are determined using significant unobservable inputs (including management’s assumptions in determining the fair value of investments). |
Common stocks and other equity-type securities are valued at the last sales price on the securities exchange on which such securities are primarily traded and are generally classified as Level 1. Securities primarily traded on the NASDAQ National Market (“NASDAQ”) are valued at the NASDAQ Official Closing Price and are generally classified as Level 1. However, securities traded on a securities exchange or NASDAQ for which there were no transactions on a given day or securities not listed on a securities exchange or NASDAQ are valued at the quoted bid price and are generally classified as Level 2.
The exchange traded funds in which the Funds invest are valued at the last sales price on the securities exchange on which such securities are primarily traded and are generally classified as Level 1.
Investments in investment companies are valued at their respective NAVs on the valuation date and are generally classified Level 1.
Prices of fixed-income securities are provided by a pricing service approved by the Funds’ Board of Directors (the “Board”). The pricing service establishes a security’s fair value using methods that may include consideration of the following: yields or prices of investments of comparable quality, type of issue, coupon, maturity and rating, market quotes or indications of value from security dealers, evaluations of anticipated cash flows or collateral, general market conditions and other information and analysis, including the obligor’s credit characteristics considered relevant. These securities are generally classified as Level 2. In pricing certain securities, particularly less liquid and lower quality securities, the pricing service may consider information about a security, its issuer or market activity provided by the Adviser. These securities are generally classified as Level 2 or Level 3 depending on the priority of the significant inputs.
Prices of forward foreign currency exchange contracts and swap contracts are also provided by a pricing service approved by the Board using the same methods as described above and are generally classified as Level 2.
Futures contracts are valued using the closing settlement price or, in the absence of such a price, the last traded price and are generally classified as Level 1.
Investments initially valued in currencies other than the U.S. dollar are converted to the U.S. dollar using exchange rates obtained from pricing services. As a result, the NAV of the Funds’ shares may be affected by changes in the value of currencies in relation to the U.S. dollar. The value of securities traded in markets outside the United States or denominated in currencies other than the U.S. dollar may be affected significantly on a day that the New York Stock Exchange is closed and an investor is not able to purchase, redeem or exchange shares. If significant market events occur between the time of determination of the closing price of a foreign security on an exchange and the time that the Funds’ NAV is determined, or if under the Funds’ procedures, the closing price of a foreign security is not deemed to be reliable, the security would be valued at fair value as determined in accordance with procedures established in good faith by the Board. These securities are generally classified as Level 2 or Level 3 depending on the priority of the significant inputs.
Certain securities may not be able to be priced by the pre-established pricing methods as described above. Such securities may be valued by the Board and/or its appointee at fair value. These securities generally include, but are not limited to, restricted securities (securities which may not be publicly sold without registration under the Securities Act of 1933, as amended) for which a pricing service is unable to provide a market price; securities whose trading has been formally suspended; debt securities that have gone into default and for which there is no current market quotation; a
Notes to Financial Statements (continued)
security whose market price is not available from a pre-established pricing source; a security with respect to which an event has occurred that is likely to materially affect the value of the security after the market has closed but before the calculation of a Fund’s NAV (as may be the case in non-U.S. markets on which the security is primarily traded) or make it difficult or impossible to obtain a reliable market quotation; and a security whose price, as provided by the pricing service, is not deemed to reflect the security’s fair value. As a general principle, the fair value of a security would appear to be the amount that the owner might reasonably expect to receive for it in a current sale. A variety of factors may be considered in determining the fair value of such securities, which may include consideration of the following: yields or prices of investments of comparable quality, type of issue, coupon, maturity and rating, market quotes or indications of value from security dealers, evaluations of anticipated cash flows or collateral, general market conditions and other information and analysis, including the obligor’s credit characteristics considered relevant. These securities are generally classified as Level 2 or Level 3 depending on the priority of the significant inputs. Regardless of the method employed to value a particular security, all valuations are subject to review by the Board and/or its appointee.
The inputs or methodologies used for valuing securities are not an indication of the risks associated with investing in those securities. The following is a summary of each Fund’s fair value measurements as of the end of the reporting period:
| | | | | | | | | | | | | | | | |
| Core Bond | | Level 1 | | | Level 2 | | | Level 3 | | | Total | |
| Long-Term Investments*: | | | | | | | | | | | | | | | | |
Corporate Bonds | | $ | — | | | $ | 102,916,172 | | | $ | — | | | $ | 102,916,172 | |
$1,000 Par (or similar) Institutional Preferred | | | — | | | | 1,503,325 | | | | — | | | | 1,503,325 | |
U.S. Government and Agency Obligations | | | — | | | | 28,341,220 | | | | — | | | | 28,341,220 | |
Asset-Backed and Mortgage-Backed Securities | | | — | | | | 95,649,638 | | | | — | | | | 95,649,638 | |
Sovereign Debt | | | — | | | | 1,491,700 | | | | — | | | | 1,491,700 | |
| Investments Purchased with Collateral from Securities Lending | | | 13,740,808 | | | | — | | | | — | | | | 13,740,808 | |
| Short-Term Investments: | | | | | | | | | | | | | | | | |
Money Market Funds | | | 6,366,153 | | | | — | | | | — | | | | 6,366,153 | |
| Investments in Derivatives: | | | | | | | | | | | | | | | | |
Interest Rate Swaps** | | | — | | | | (157,115 | ) | | | — | | | | (157,115 | ) |
Futures Contracts** | | | (242,449 | ) | | | — | | | | — | | | | (242,449 | ) |
| Total | | $ | 19,864,512 | | | $ | 229,744,940 | | | $ | — | | | $ | 249,609,452 | |
| | | | |
| Core Plus Bond | | | | | | | | | | | | |
| Long-Term Investments*: | | | | | | | | | | | | | | | | |
$25 Par (or similar) Retail Preferred | | $ | 14,098,205 | | | $ | — | | | $ | — | | | $ | 14,098,205 | |
Corporate Bonds | | | — | | | | 352,816,709 | | | | — | | | | 352,816,709 | |
$1,000 Par (or similar) Institutional Preferred | | | — | | | | 36,798,035 | | | | — | | | | 36,798,035 | |
Municipal Bonds | | | — | | | | 6,211,787 | | | | — | | | | 6,211,787 | |
Asset-Backed and Mortgage-Backed Securities | | | — | | | | 122,126,792 | | | | — | | | | 122,126,792 | |
Sovereign Debt | | | — | | | | 28,284,556 | | | | — | | | | 28,284,556 | |
| Investments Purchased with Collateral from Securities Lending | | | 69,688,572 | | | | — | | | | — | | | | 69,688,572 | |
| Short-Term Investments: | | | | | | | | | | | | | | | | |
Money Market Funds | | | 16,998,878 | | | | — | | | | — | | | | 16,998,878 | |
| Investments in Derivatives: | | | | | | | | | | | | | | | | |
Forward Foreign Currency Exchange Contracts** | | | — | | | | 243,662 | | | | — | | | | 243,662 | |
Interest Rate Swaps** | | | — | | | | (1,224,718 | ) | | | — | | | | (1,224,718 | ) |
Futures Contracts** | | | 90,730 | | | | — | | | | — | | | | 90,730 | |
| Total | | $ | 100,876,385 | | | $ | 545,256,823 | | | $ | — | | | $ | 646,133,208 | |
| * | Refer to the Fund’s Portfolio of Investments for industry, state and country, where applicable, classifications. |
| ** | Represents net unrealized appreciation (depreciation) as reported in the Fund’s Portfolio of Investments. |
| | | | | | | | | | | | | | | | |
| Inflation Protected Securities | | Level 1 | | | Level 2 | | | Level 3 | | | Total | |
| Long-Term Investments*: | | | | | | | | | | | | | | | | |
Convertible Preferred Securities | | $ | 300,450 | | | $ | — | | | $ | — | | | $ | 300,450 | |
$25 Par (or similar) Retail Preferred | | | 285,000 | | | | — | | | | — | | | | 285,000 | |
Corporate Bonds | | | — | | | | 38,454,509 | | | | — | | | | 38,454,509 | |
$1,000 Par (or similar) Institutional Preferred | | | — | | | | 336,750 | | | | — | | | | 336,750 | |
Municipal Bonds | | | — | | | | 2,065,056 | | | | — | | | | 2,065,056 | |
U.S. Government and Agency Obligations | | | — | | | | 316,240,169 | | | | — | | | | 316,240,169 | |
Asset-Backed and Mortgage-Backed Securities | | | — | | | | 14,956,913 | | | | — | | | | 14,956,913 | |
Investment Companies | | | 628,085 | | | | — | | | | — | | | | 628,085 | |
Sovereign Debt | | | — | | | | 2,280,539 | | | | — | | | | 2,280,539 | |
| Investments Purchased with Collateral from Securities Lending | | | 5,539,700 | | | | — | | | | — | | | | 5,539,700 | |
| Short-Term Investments: | | | | | | | | | | | | | | | | |
Money Market Funds | | | 11,665,461 | | | | — | | | | — | | | | 11,665,461 | |
| Investments in Derivatives: | | | | | | | | | | | | | | | | |
Interest Rate Swaps** | | | — | | | | (80,776 | ) | | | — | | | | (80,776 | ) |
Futures Contracts** | | | (72,887 | ) | | | — | | | | — | | | | (72,887 | ) |
| Total | | $ | 18,345,809 | | | $ | 374,253,160 | | | $ | — | | | $ | 392,598,969 | |
| | | | |
| Intermediate Government Bond | | | | | | | | | | | | |
| Long-Term Investments*: | | | | | | | | | | | | | | | | |
Corporate Bonds | | $ | — | | | $ | 399,410 | | | $ | — | | | $ | 399,410 | |
Municipal Bonds | | | — | | | | 2,765,257 | | | | — | | | | 2,765,257 | |
U.S. Government and Agency Obligations | | | — | | | | 36,429,976 | | | | — | | | | 36,429,976 | |
Asset-Backed and Mortgage-Backed Securities | | | — | | | | 35,261,230 | | | | — | | | | 35,261,230 | |
| Investments Purchased with Collateral from Securities Lending | | | 2,464,209 | | | | — | | | | — | | | | 2,464,209 | |
| Short-Term Investments: | | | | | | | | | | | | | | | | |
Money Market Funds | | | 454,874 | | | | — | | | | — | | | | 454,874 | |
| Investments in Derivatives: | | | | | | | | | | | | | | | | |
Interest Rate Swaps** | | | — | | | | 10,105 | | | | — | | | | 10,105 | |
Futures Contracts** | | | 228 | | | | — | | | | — | | | | 228 | |
| Total | | $ | 2,919,311 | | | $ | 74,865,978 | | | $ | — | | | $ | 77,785,289 | |
| | | | |
| Short Term Bond | | | | | | | | | | | | |
| Long-Term Investments*: | | | | | | | | | | | | | | | | |
Corporate Bonds | | $ | — | | | $ | 323,465,323 | | | $ | — | | | $ | 323,465,323 | |
$1,000 Par (or similar) Institutional Preferred | | | — | | | | 3,408,750 | | | | — | | | | 3,408,750 | |
Municipal Bonds | | | — | | | | 15,761,407 | | | | — | | | | 15,761,407 | |
U.S. Government and Agency Obligations | | | — | | | | 15,012,105 | | | | — | | | | 15,012,105 | |
Asset-Backed and Mortgage-Backed Securities | | | — | | | | 317,773,823 | | | | — | | | | 317,773,823 | |
Sovereign Debt | | | — | | | | 3,232,738 | | | | — | | | | 3,232,738 | |
| Investments Purchased with Collateral from Securities Lending | | | 32,274,464 | | | | — | | | | — | | | | 32,274,464 | |
| Short-Term Investments: | | | | | | | | | | | | | | | | |
Money Market Funds | | | 8,574,230 | | | | — | | | | — | | | | 8,574,230 | |
| Investments in Derivatives: | | | | | | | | | | | | | | | | |
Interest Rate Swaps** | | | — | | | | (258,316 | ) | | | — | | | | (258,316 | ) |
Futures Contracts** | | | (199,985 | ) | | | — | | | | — | | | | (199,985 | ) |
| Total | | $ | 40,648,709 | | | $ | 678,395,830 | | | $ | — | | | $ | 719,044,539 | |
| * | Refer to the Fund’s Portfolio of Investments for industry, state and country, where applicable, classifications. |
| ** | Represents net unrealized appreciation (depreciation) as reported in the Fund’s Portfolio of Investments. |
The Board is responsible for the valuation process and has appointed the oversight of the daily valuation process to the Adviser’s Valuation Committee. The Valuation Committee, pursuant to the valuation policies and procedures adopted by the Board, is responsible for making fair value determinations, evaluating the effectiveness of the Funds’ pricing policies and reporting to the Board. The Valuation Committee is aided in its efforts by the Adviser’s dedicated Securities Valuation Team, which is responsible for administering the daily valuation process and applying fair value methodologies as approved by the Valuation Committee. When determining the reliability of independent pricing services for investments owned by the Funds, the Valuation Committee, among other things, conducts due diligence reviews of the pricing services and monitors the quality of security prices received through various testing reports conducted by the Securities Valuation Team.
Notes to Financial Statements (continued)
The Valuation Committee will consider pricing methodologies it deems relevant and appropriate when making a fair value determination, based on the facts and circumstances specific to the portfolio instrument. Fair value determinations generally will be derived as follows, using public or private market information:
| | (i) | If available, fair value determinations shall be derived by extrapolating from recent transactions or quoted prices for identical or comparable securities. |
| | (ii) | If such information is not available, an analytical valuation methodology may be used based on other available information including, but not limited to: analyst appraisals, research reports, corporate action information, issuer financial statements and shelf registration statements. Such analytical valuation methodologies may include, but are not limited to: multiple of earnings, discount from market value of a similar freely-traded security, discounted cash flow analysis, book value or a multiple thereof, risk premium/yield analysis, yield to maturity and/or fundamental investment analysis. |
The purchase price of a portfolio instrument will be used to fair value the instrument only if no other valuation methodology is available or deemed appropriate, and it is determined that the purchase price fairly reflects the instrument’s current value.
For each portfolio security that has been fair valued pursuant to the policies adopted by the Board, the fair value price is compared against the last available and next available market quotations. The Valuation Committee reviews the results of such testing and fair valuation occurrences are reported to the Board.
3. Portfolio Securities and Investments in Derivatives
Portfolio Securities
Foreign Currency Transactions
To the extent that the Funds invest in securities and/or contracts that are denominated in a currency other than U.S. dollars, the Funds will be subject to currency risk, which is the risk that an increase in the U.S. dollar relative to the foreign currency will reduce returns or portfolio value. Generally, when the U.S. dollar rises in value against a foreign currency, the Funds’ investments denominated in that currency will lose value because their currency is worth fewer U.S. dollars; the opposite effect occurs if the U.S. dollar falls in relative value. Investments and other assets and liabilities denominated in foreign currencies are converted into U.S. dollars on a spot (i.e. cash) basis at the spot rate prevailing in the foreign currency exchange market at the time of valuation. Purchases and sales of investments and income denominated in foreign currencies are translated into U.S. dollars on the respective dates of such transactions.
The books and records of the Funds are maintained in U.S. dollars. Foreign currencies, assets and liabilities are translated into U.S. dollars at 4:00 p.m. Eastern Time. Investment transactions, income and expenses are translated on the respective dates of such transactions. Net realized foreign currency gains and losses resulting from changes in exchange rates include foreign currency gains and losses between trade date and settlement date of the transactions, foreign currency transactions and the difference between the amounts of interest and dividends recorded on the books of a Fund and the amounts actually received.
The realized gains and losses resulting from changes in foreign currency exchange rates and changes in foreign exchange rates associated with (i) investments, (ii) investments in derivatives and (iii) other assets and liabilities are recognized as a component of “Net realized gain (loss) from investments and foreign currency” on the Statement of Operations, when applicable.
The unrealized gains and losses resulting from changes in foreign currency exchange rates and changes in foreign exchange rates associated with (i) investments and (ii) other assets and liabilities are recognized as a component of “Change in unrealized appreciation (depreciation) of investments and foreign currency” on the Statement of Operations, when applicable. The unrealized gains and losses resulting from changes in foreign exchange rates associated with investments in derivatives are recognized as a component of the respective derivative’s related “Change in net unrealized appreciation (depreciation)” on the Statement of Operations, when applicable.
Inflation-Indexed Bonds
Inflation-indexed bonds are fixed-income securities whose principal value is periodically adjusted to the rate of inflation. The interest rate on these bonds is generally fixed at issuance at a rate lower than typical bonds. Over the life of an inflation-indexed bond however, interest will be paid based on a principal value which is adjusted for inflation. Any increase in the principal amount of an inflation-indexed bond is recognized as a component of “Interest income” on the Statement of Operations, even though investors do not receive their principal until maturity.
Securities Lending
In order to generate additional income, each Fund may lend securities representing up to one-third of the value of its total assets (which includes collateral for securities on loan) to broker-dealers, banks or other institutions. Each Fund’s policy is to receive cash collateral equal to at least 102% of the value of securities loaned, which is recognized as “Collateral from securities lending program” on the Statement of Assets and Liabilities. The adequacy of the collateral is monitored on a daily basis. If the value of the securities on loan increases, such that the level of collateralization falls below
100%, additional collateral is received from the borrower, which is recognized as “Due from broker” on the Statement of Assets and Liabilities, when applicable. As with other extensions of credit, there may be risks of delay in recovery of the securities or even loss of rights in the collateral should the borrower of the security fail financially.
The Funds’ custodian serves as the securities lending agent for the Funds. Each Fund pays the custodian a fee based on the Fund’s proportional share of the custodian’s expense of operating its securities lending program. Collateral for securities on loan is invested in a money market fund, which is recognized as “Investments purchased with collateral from securities lending, at value” on the Statement of Assets and Liabilities.
The following table presents the securities out on loan for the Funds that are subject to netting agreements and the collateral delivered related to those securities, as of the end of the reporting period.
| | | | | | | | | | | | | | |
| Fund | | Counterparty | | Long-Term
Investments, at Value | | | Collateral
Pledged to (from)
Counterparty* | | | Net
Exposure | |
| Core Bond | | U.S. Bank National Association | | $ | 13,267,344 | | | $ | (13,267,344 | ) | | $ | — | |
| Core Plus Bond | | U.S. Bank National Association | | | 66,574,107 | | | | (66,574,107 | ) | | | — | |
| Inflation Protected Securities | | U.S. Bank National Association | | | 5,295,254 | | | | (5,295,254 | ) | | | — | |
| Intermediate Government Bond | | U.S. Bank National Association | | | 2,363,973 | | | | (2,363,973 | ) | | | — | |
| Short Term Bond | | U.S. Bank National Association | | | 31,352,558 | | | | (31,352,558 | ) | | | — | |
| * | As of the end of the reporting period, the value of the collateral pledged from the counterparty exceeded the value of the securities out on loan. Refer to the Fund's Portfolio of Investments for details on the investments purchased with collateral from securities lending and the securities out on loan. |
Income from securities lending, net of fees paid, is recognized on the Statement of Operations as “Securities lending income, net.” Securities lending fees paid by each Fund during the current fiscal period were as follows:
| | | | | | | | | | | | | | | | | | | | |
| | | Core
Bond | | | Core Plus
Bond | | | Inflation
Protected
Securities | | | Intermediate
Government
Bond | | | Short Term
Bond | |
| Securities lending fees paid | | $ | 4,325 | | | $ | 35,569 | | | $ | 2,965 | | | $ | 1,174 | | | $ | 19,107 | |
Zero Coupon Securities
A zero coupon security does not pay a regular interest coupon to its holders during the life of the security. Income to the holder of the security comes from accretion of the difference between the original purchase price of the security at issuance and the par value of the security at maturity and is effectively paid at maturity. The market prices of zero coupon securities generally are more volatile than the market prices of securities that pay interest periodically.
Investments in Derivatives
Each Fund is authorized to invest in certain derivative instruments. The Funds record derivative instruments at fair value, with changes in fair value recognized on the Statement of Operations, when applicable. Even though the Funds’ investments in derivatives may represent economic hedges, they are not considered to be hedge transactions for financial reporting purposes.
Forward Foreign Currency Exchange Contracts
Each Fund is authorized to enter into forward foreign currency exchange contracts (“forward contracts”) under two circumstances: (i) when a Fund enters into a contract for the purchase or sale of a security denominated in a foreign currency to “lock in” the U.S. exchange rate of the transaction, with such period being a short-dated contract covering the period between transaction date and settlement date or (ii) when the Sub-Adviser believes that the currency of a particular foreign country may experience a substantial movement against the U.S. dollar or against another foreign currency.
A forward contract is an agreement between two parties to purchase or sell a specified quantity of a currency at or before a specified date in the future at a specified price. Forward contracts are typically traded in the OTC markets and all details of the contract are negotiated between the counterparties to the agreement. Accordingly, the forward contracts are valued by reference to the contracts traded in the OTC markets. The contractual obligations of a buyer or seller may generally be satisfied by taking or making physical delivery of the underlying currency, establishing an opposite position in the contract and recognizing the profit or loss on both positions simultaneously on the delivery date or, in some instances, paying a cash settlement before the designated date of delivery.
Forward contracts are valued daily at the forward rate. The net amount recorded on these transactions for each counterparty is recognized as a component of “Unrealized appreciation and/or depreciation on forward foreign currency exchange contracts (, net)” on the Statement of Assets and Liabilities. The change in value of the forward contracts during the reporting period is recognized as a component of “Change in net unrealized appreciation (depreciation) of forward foreign currency exchange contracts” on the Statement of Operations. When the contract is closed or offset with the same counterparty, a Fund recognizes the difference between the value of the contract at the time it was entered and the value at the time it was closed or offset as a component of “Net realized gain (loss) from forward foreign currency exchange contracts” on the Statement of Operations.
Notes to Financial Statements (continued)
Forward contracts will generally not be entered into for terms greater than three months, but may have maturities of up to six months or more. The use of forward contracts does not eliminate fluctuations in the underlying prices of a Fund’s investment securities; however, it does establish a rate of exchange that can be achieved in the future. The use of forward contracts involves the risk that anticipated currency movements will not be accurately predicted. A forward contract would limit the risk of loss due to a decline in the value of a particular currency; however, it also would limit any potential gain that might result should the value of the currency increase instead of decrease. These contracts may involve market risk in excess of the unrealized appreciation or depreciation reflected on the Statement of Assets and Liabilities. Forward contracts are subject to counterparty risk if the counterparty fails to perform as specified in the contract due to financial impairment or other reason.
During the current fiscal period, Core Plus Bond invested in forward foreign currency exchange contracts to manage foreign currency exposure. For example, the Fund may reduce unwanted currency exposure from its bond portfolio, or it may take long forward positions in select currencies in an attempt to benefit from the potential price appreciation.
The average notional amount of forward foreign currency exchange contracts outstanding during the current fiscal period was as follows:
| | | | |
| | | Core Plus
Bond | |
| Average notional amount of forward foreign currency exchange contracts outstanding* | | $ | 40,261,710 | |
| * | The average notional amount is calculated based on the outstanding notional at the beginning of the fiscal period and at the end of each fiscal quarter within the current fiscal period. |
The following table presents the fair value of forward foreign currency exchange contracts held by the Fund as of the end of the reporting period, the location of these instruments on the Statement of Assets and Liabilities and the primary underlying risk exposure.
| | | | | | | | | | | | | | |
| | | | | Location on the Statement of Assets and Liabilities | |
| | | | | Asset Derivatives | | | (Liability) Derivatives | |
Underlying
Risk Exposure | | Derivative Instrument | | Location | | Value | | | Location | | Value | |
| Core Plus Bond | | | | | | | | | | | | |
Foreign currency exchange rate | | Forward contracts | | Unrealized appreciation on forward foreign currency exchange contracts, net | | $ | 490,773 | | | Unrealized depreciation on forward foreign currency exchange contracts, net | | $ | — | |
Foreign currency exchange rate | | Forward contracts | | Unrealized appreciation on forward foreign currency exchange contracts, net | | | (64,877 | ) | | Unrealized depreciation on forward foreign currency exchange contracts, net | | | (182,234 | ) |
Total | | | | | | $ | 425,896 | | | | | $ | (182,234 | ) |
The following table presents the forward foreign currency exchange contracts subject to netting agreements and the collateral delivered related to those forward foreign currency exchange contracts as of the end of the reporting period.
| | | | | | | | | | | | | | | | | | | | | | | | | | |
| Fund | | Counterparty | | Gross
Unrealized
Appreciation on
Forward Foreign
Currency Exchange
Contracts* | | | Gross
Unrealized
(Depreciation) on
Forward Foreign
Currency Exchange
Contracts* | | | Amounts
Netted on
Statement of
Assets and
Liabilities | | | Net Unrealized
Appreciation
(Depreciation) on
Forward Foreign
Currency Exchange
Contracts | | | Collateral
Pledged
to (from)
Counterparty | | | Net
Exposure | |
Core Plus Bond | | | | | | | | | | | | | | | | | | | | | | | | | | |
| | Bank of America | | $ | 91,763 | | | $ | — | | | $ | — | | | $ | 91,763 | | | $ | — | | | $ | 91,763 | |
| | Citigroup | | | 130,035 | | | | — | | | | — | | | | 130,035 | | | | — | | | | 130,035 | |
| | Deutsche Bank | | | 247,503 | | | | (64,877 | ) | | | (64,877 | ) | | | 182,626 | | | | — | | | | 182,626 | |
| | Goldman Sachs | | | 17,607 | | | | — | | | | — | | | | 17,607 | | | | — | | | | 17,607 | |
| | Morgan Stanley | | | — | | | | (182,234 | ) | | | — | | | | (182,234 | ) | | | — | | | | (182,234 | ) |
| | | Nomura Securities | | | 3,865 | | | | — | | | | — | | | | 3,865 | | | | — | | | | 3,865 | |
Total | | | | $ | 490,773 | | | $ | (247,111 | ) | | $ | (64,877 | ) | | $ | 243,662 | | | $ | — | | | $ | 243,662 | |
| * | Represents gross unrealized appreciation (depreciation) for the counterparty as reported in the Fund’s Portfolio of Investments. |
The following table presents the amount of net realized gain (loss) and change in net unrealized appreciation (depreciation) recognized on forward foreign currency exchange contracts on the Statement of Operations during the current fiscal period, and the primary underlying risk exposure.
| | | | | | | | | | | | |
| Fund | | Underlying
Risk Exposure | | Derivative
Instrument | | Net Realized
Gain (Loss) from
Forward Foreign Currency
Exchange Contracts | | | Change in Net Unrealized
Appreciation (Depreciation) of
Forward Foreign Currency
Exchange Contracts | |
| Core Plus Bond | | Foreign currency exchange rate | | Forward contracts | | $ | 1,634,643 | | | $ | 113,116 | |
Futures Contracts
Upon execution of a futures contract, a Fund is obligated to deposit cash or eligible securities, also known as “initial margin,” into an account at its clearing broker equal to a specified percentage of the contract amount. Cash held by the broker to cover initial margin requirements on open futures contracts, if any, is recognized as “Cash collateral at brokers” on the Statement of Assets and Liabilities. Investments in futures contracts obligate a Fund and the clearing broker to settle monies on a daily basis representing changes in the prior days “mark-to-market” of the open contracts. If a Fund has unrealized appreciation the clearing broker would credit the Fund’s account with an amount equal to appreciation and conversely if a Fund has unrealized depreciation the clearing broker would debit the Fund’s account with an amount equal to depreciation. These daily cash settlements are also known as “variation margin.” Variation margin is recognized as a receivable and/or payable for “Variation margin on futures contracts” on the Statement of Assets and Liabilities.
During the period the futures contract is open, changes in the value of the contract are recognized as an unrealized gain or loss by “marking-to-market” on a daily basis to reflect the changes in market value of the contract, which is recognized as a component of “Change in net unrealized appreciation (depreciation) of futures contracts” on the Statement of Operations. When the contract is closed or expired, a Fund records a realized gain or loss equal to the difference between the value of the contract on the closing date and value of the contract when originally entered into, which is recognized as a component of “Net realized gain (loss) from futures contracts” on the Statement of Operations.
Risks of investments in futures contracts include the possible adverse movement in the price of the securities or indices underlying the contracts, the possibility that there may not be a liquid secondary market for the contracts and/or that a change in the value of the contract may not correlate with a change in the value of the underlying securities or indices.
During the current fiscal period, each Fund used U.S. Treasury futures as part of their overall portfolio construction strategy to manage portfolio duration and yield curve exposure.
The average notional amount of futures contracts outstanding during current fiscal period was as follows:
| | | | | | | | | | | | | | | | | | | | |
| | | Core
Bond | | | Core Plus
Bond | | | Inflation
Protected
Securities | | | Intermediate
Government
Bond | | | Short Term
Bond | |
| Average notional amount of futures contracts outstanding* | | $ | 89,001,207 | | | $ | 88,502,276 | | | $ | 80,949,614 | | | $ | 17,606,285 | | | $ | 113,956,158 | |
| * | The average notional amount is calculated based on the absolute aggregate notional amount of contracts outstanding at the beginning of the fiscal period and at the end of each quarter within the current fiscal period. |
The following table presents the fair value of all futures contracts held by the Funds as of the end of the reporting period, the location of these instruments on the Statement of Assets and Liabilities and the primary underlying risk exposure.
| | | | | | | | | | | | | | |
| | | | | Location on the Statement of Assets and Liabilities | |
| | | | | Asset Derivatives | | | (Liability) Derivatives | |
Underlying
Risk Exposure | | Derivative Instrument | | Location | | Value | | | Location | | Value | |
Core Bond | | | | | | | | | | | | | | |
| | | | | |
Interest rate | | Futures contracts | | Receivable for variation margin on futures contracts* | | $ | (85,422 | ) | | Payable for variation margin
on futures contracts* | | $ | (157,027 | ) |
Core Plus Bond | | | | | | | | | | | | | | |
| | | | | |
Interest rate | | Futures contracts | | Receivable for variation margin on futures contracts* | | $ | 299,422 | | | — | | $ | — | |
| | | | | Receivable for variation margin on futures contracts* | | | (2,679 | ) | | Payable for variation margin
on futures contracts* | | | (206,013 | ) |
Total | | | | | | $ | 296,743 | | | | | $ | (206,013 | ) |
Inflation Protected Securities | | | | | | | | | | | | | | |
| | | | | |
Interest rate | | Futures contracts | | Receivable for variation margin on futures contracts* | | $ | (29,849 | ) | | Payable for variation margin
on futures contracts* | | $ | (43,038 | ) |
| Intermediate Government Bond | | | | | | | | | | | | |
| | | | | |
Interest rate | | Futures contracts | | Receivable for variation margin on futures contracts* | | $ | (18,553 | ) | | Payable for variation margin
on futures contracts* | | $ | 18,781 | |
Notes to Financial Statements (continued)
| | | | | | | | | | | | | | |
| | | | | Location on the Statement of Assets and Liabilities | |
| | | | | Asset Derivatives | | | (Liability) Derivatives | |
Underlying
Risk Exposure | | Derivative Instrument | | Location | | Value | | | Location | | Value | |
| Short Term Bond | | | | | | | | | | | | |
Interest rate | | Futures contracts | | Receivable for variation margin on futures contracts* | | $ | (116,193 | ) | | Payable for variation margin
on futures contracts* | | $ | (83,792 | ) |
| * | Value represents unrealized appreciation (depreciation) of futures contracts as reported on the Fund’s Portfolio of Investments and not the asset and/or liability derivatives location as described in the table above. |
The following table presents the amount of net realized gain (loss) and change in net unrealized appreciation (depreciation) recognized on futures contracts on the Statement of Operations during the current fiscal period, and the primary underlying risk exposure.
| | | | | | | | | | | | |
| Fund | | Underlying
Risk Exposure | | Derivative
Instrument | | Net Realized
Gain (Loss) from
Futures Contracts | | | Change in Net Unrealized
Appreciation (Depreciation) of
Futures Contracts | |
| Core Bond | | Interest rate | | Futures contracts | | $ | (612,361 | ) | | $ | (289,855 | ) |
| Core Plus Bond | | Interest rate | | Futures contracts | | | (3,194,614 | ) | | | (10,137 | ) |
| Inflation Protected Securities | | Interest rate | | Futures contracts | | | (754,218 | ) | | | (139,680 | ) |
| Intermediate Government Bond | | Interest rate | | Futures contracts | | | (148,062 | ) | | | 9,364 | |
| Short Term Bond | | Interest rate | | Futures contracts | | | (2,388,015 | ) | | | (363,216 | ) |
Interest Rate Swaps
Interest rate swap contracts involve a Fund’s agreement with the counterparty to pay or receive a fixed rate payment in exchange for the counterparty receiving or paying a variable rate payment. Forward interest rate swap contracts involve a Fund’s agreement with a counterparty to pay, in the future, a fixed or variable rate payment in exchange for the counterparty paying the Fund a variable or fixed rate payment, the accruals for which would begin at a specified date in the future (the “effective date”). The amount of the payment obligation is based on the notional amount of the swap contract. Swap contracts do not involve the delivery of securities or other underlying assets or principal. Accordingly, the risk of loss with respect to the swap counterparty on such transactions is limited to the net amount of interest payments that the Fund is to receive.
Interest rate swap contracts are valued daily. Upon entering into an interest rate swap contract (and beginning on the effective date for a forward interest rate swap contract), a Fund accrues the fixed rate payment expected to be paid or received and the variable rate payment expected to be received or paid on the interest rate swap contracts on a daily basis, and recognizes the daily change in the fair value of the Fund’s contractual rights and obligations under the contracts. For OTC swaps, the net amount recorded on these transactions, for each counterparty, is recognized on the Statement of Assets and Liabilities as a component of “Unrealized appreciation or depreciation on interest rate swaps (, net).”
Upon the execution of an exchanged-cleared swap contract, in certain instances a Fund is obligated to deposit cash or eligible securities, also known as “initial margin,” into an account at its clearing broker equal to a specified percentage of the contract amount. Cash held by the broker to cover initial margin requirements on open swap contracts, if any, is recognized as “Cash collateral at brokers” on the Statement of Assets and Liabilities. Investments in exchange-cleared interest rate swap contracts obligate a Fund and the clearing broker to settle monies on a daily basis representing changes in the prior day’s “mark-to-market” of the swap contract. If a Fund has unrealized appreciation, the clearing broker will credit the Fund’s account with an amount equal to the appreciation. Conversely, if the Fund has unrealized depreciation, the clearing broker will debit the Fund’s account with an amount equal to the depreciation. These daily cash settlements are also known as “variation margin.” Variation margin is recognized as a receivable and/or payable for “Variation margin on swap contracts” on the Statement of Assets and Liabilities.
The net amount of periodic payments settled in cash are recognized as a component of “Net realized gain (loss) from swaps” on the Statement of Operations, in addition to the net realized gain or loss recorded upon the termination of the swap contract. For tax purposes, payments expected to be received or paid on the swap contracts are treated as ordinary income or expense, respectively.
Changes in the value of the swap contracts during the fiscal period are recognized as a component of “Change in net unrealized appreciation (depreciation) of swaps.” In certain instances, payments are made or received upon entering into the swap contract to compensate for differences between the stated terms of the swap agreements and prevailing market conditions (credit spreads, currency exchange rates, interest rates, and other relevant factors). Payments received or made at the beginning of the measurement period, if any, are recognized as “Interest rate swaps premiums paid and/or received” on the Statement of Assets and Liabilities.
During the current fiscal period, each Fund invested in interest rate swap contracts as part of an overall portfolio construction strategy to manage duration and overall portfolio yield curve exposure.
The average notional amount of interest rate swap contracts outstanding during the current fiscal period was as follows:
| | | | | | | | | | | | | | | | | | | | |
| | | Core
Bond | | | Core Plus
Bond | | | Inflation
Protected
Securities | | | Intermediate
Government
Bond | | | Short Term
Bond | |
| Average notional amount of interest rate swap contracts outstanding* | | $ | 6,200,000 | | | $ | 50,000,000 | | | $ | 5,500,000 | | | $ | 400,000 | | | $ | 14,600,000 | |
| * | The average notional amount is calculated based on the outstanding notional at the beginning of the fiscal period and at the end of each fiscal quarter within the current fiscal period. |
Credit Default Swaps
A Fund may enter into a credit default swap contract to seek to maintain a total return on a particular investment or portion of its portfolio, or to take an active long or short position with respect to the likelihood of a particular issuer’s default. Credit default swap contracts involve one party making a stream of payments to another party in exchange for the right to receive a specified return if/when there is a credit event by a third party. Generally, a credit event means bankruptcy, failure to pay, or restructuring. The specific credit events applicable for each credit default swap are stated in the terms of the particular swap agreement. Upon occurrence of a specific credit event with respect to the underlying referenced entity, the Fund will either (i) receive that security, or an equivalent amount of cash, from the counterparty in exchange for payment of the notional amount to the counterparty, or (ii) pay a net settlement amount of the credit default swap contract less the recovery value of the referenced obligation or underlying securities comprising the referenced index. The difference between the value of the security delivered and the notional amount received is recorded as a realized gain or loss. Payments received or made at the beginning of the measurement period are recognized as a component of “Credit default swaps premiums paid and/or received” on the Statement of Assets and Liabilities, when applicable.
Credit default swap contracts are valued daily. Changes in the value of a credit default swap during the fiscal period are recognized as a component of “Change in net unrealized appreciation (depreciation) of swaps” and realized gains and losses are recognized as a component of “Net realized gain (loss) from swaps” on the Statement of Operations.
For over-the-counter swaps, the daily change in the market value of the swap contract, along with any daily interest fees accrued, are recognized as components of “Unrealized appreciation or depreciation on credit default swaps (, net)” on the Statement of Assets and Liabilities.
Investments in swaps cleared through an exchange obligate a Fund and the clearing broker to settle monies on a daily basis representing changes in the prior day’s “mark-to-market” of the swap. If a Fund has unrealized appreciation the clearing broker would credit the Fund’s account with an amount equal to the appreciation and conversely if a Fund has unrealized depreciation the clearing broker would debit a Fund’s account with an amount equal to the depreciation. These daily cash settlements are also known as “variation margin.” Variation margin is recognized as a receivable and/or payable for “Variation margin on swap contracts” on the Statement of Assets and Liabilities. The maximum potential amount of future payments the Fund could incur as a buyer or seller of protection in a credit default swap contract is limited to the notional amount of the contract. The maximum potential amount would be offset by the recovery value, if any, of the respective referenced entity. In certain instances, a Fund is obligated to deposit cash or eligible securities, also known as “initial margin,” into an account at its clearing broker equal to a specified percentage of the contract amount. Cash held by the broker to cover initial margin requirements on open swap contracts, if any, is recognized as “Cash collateral at brokers” on the Statement of Assets and Liabilities.
During the current fiscal period, Core Plus Bond used high yield credit default swaps to partially hedge its exposure to the high yield market, however this position was removed shortly after the beginning of the current fiscal period.
The average notional amount of credit default swap contracts outstanding during the current fiscal period was as follows:
| | | | |
| | | Core Plus
Bond | |
| Average notional amount of credit default swap contracts outstanding* | | $ | 4,415,400 | |
| * | The average notional amount is calculated based on the outstanding notional at the beginning of the fiscal period and at the end of each fiscal quarter within the current fiscal period. |
The following table presents the fair value of all swap contracts held by the Funds as of the end of the reporting period, the location of these instruments on the Statement of Assets and Liabilities and the primary underlying risk exposure.
| | | | | | | | | | | | | | |
| | | | | Location on the Statement of Assets and Liabilities | |
| | | | | Asset Derivatives | | | (Liability) Derivatives | |
Underlying
Risk Exposure | | Derivative Instrument | | Location | | Value | | | Location | | Value | |
Core Bond | | | | | | | | | | | | | | |
| | | | | |
Interest rate | | Swaps (Exchange-Cleared) | | Receivable for variation margin on swap contracts* | | $ | 30,316 | | | — | | $ | — | |
| | | | | Receivable for variation margin on swap contracts* | | | (187,431 | ) | | — | | | — | |
Total | | | | | | $ | (157,115 | ) | | | | $ | — | |
| | | | | |
Core Plus Bond | | | | | | | | | | | | | | |
| | | | | |
Interest rate | | Swaps (Exchange-Cleared) | | Receivable for variation margin on swap contracts* | | $ | 75,790 | | | | | | | |
Interest rate | | Swaps (Exchange-Cleared) | | Receivable for variation margin on swap contracts* | | | (1,327,025 | ) | | — | | $ | — | |
Interest rate | | Swaps (OTC) | | Unrealized appreciation on interest rate swaps** | | | 26,517 | | | — | | | — | |
Total | | | | | | $ | (1,224,718 | ) | | | | $ | — | |
Notes to Financial Statements (continued)
| | | | | | | | | | | | | | |
| | | | | Location on the Statement of Assets and Liabilities | |
| | | | | Asset Derivatives | | | (Liability) Derivatives | |
Underlying
Risk Exposure | | Derivative Instrument | | Location | | Value | | | Location | | Value | |
Inflation Protected Securities | | | | | | | | | | | | | | |
| | | | | |
Interest rate | | Swaps (Exchange-Cleared) | | Receivable for variation margin on swap contracts* | | $ | 50,526 | | | — | | $ | — | |
| | | | | Receivable for variation margin on swap contracts* | | | (131,302 | ) | | — | | | — | |
Total | | | | | | $ | (80,776 | ) | | | | $ | — | |
| | | | | |
Intermediate Government Bond | | | | | | | | | | | | | | |
| | | | | |
Interest rate | | Swaps (Exchange-Cleared) | | — | | $ | — | | | Payable for variation margin
on swap contracts* | | $ | 10,105 | |
| | | | | |
Short Term Bond | | | | | | | | | | | | | | |
| | | | | |
Interest rate | | Swaps (Exchange-Cleared) | | Receivable for variation margin on swap contracts* | | $ | 116,211 | | | — | | $ | — | |
| | | | | Receivable for variation margin on swap contracts* | | | (374,527 | ) | | — | | | — | |
Total | | | | | | $ | (258,316 | ) | | | | $ | — | |
| * | Value represents unrealized appreciation (depreciation) of swaps as reported in the Fund’s Portfolio of Investments and not the asset and/or liability derivative location as described in the table above. |
| ** | Some swap contracts require a counterparty to pay or receive a premium, which is disclosed on the Statement of Assets and Liabilities and not reflected in the cumulative unrealized appreciation (depreciation) presented above. |
The following table presents the swap contracts subject to netting agreements and the collateral delivered related to those swap contracts, as of the end of the reporting period.
| | | | | | | | | | | | | | | | | | | | | | | | | | |
| Fund | | Counterparty | | Gross
Unrealized
Appreciation on
Interest
Rate Swaps*** | | | Gross
Unrealized
(Depreciation) on
Interest
Rate Swaps*** | | | Amounts
Netted on
Statement of
Assets and
Liabilities | | | Net Unrealized
Appreciation
(Depreciation) on
Interest
Rate Swaps | | | Collateral
Pledged
to (from)
Counter
party | | | Net
Exposure | |
| Core Plus Bond | | | | | | | | | | | | | | | | | | | | | | | | | | |
| Swaps | | JPMorgan | | $ | 26,517 | | | $ | — | | | $ | — | | | $ | 26,517 | | | $ | (26,517 | ) | | $ | — | |
| *** | Represents gross unrealized appreciation (depreciation) for the counterparty as reported in the Fund’s Portfolio of Investments. |
The following table presents the amount of net realized gain (loss) and change in net unrealized appreciation (depreciation) recognized on swap contracts on the Statement of Operations during the current fiscal period, and the primary underlying risk exposure.
| | | | | | | | | | | | |
| Fund | | Underlying
Risk Exposure | | Derivative
Instrument | | Net Realized
Gain (Loss) from
Swaps | | | Change in Net Unrealized
Appreciation (Depreciation) of
Swaps | |
| Core Bond | | Interest rate | | Swaps | | $ | (124,922 | ) | | $ | (55,935 | ) |
| Core Plus Bond | | | | | | | | | | | | |
| | Credit | | Swaps | | | (355,785 | ) | | | 269,051 | |
| | | Interest rate | | Swaps | | | (1,093,572 | ) | | | (791,110 | ) |
Total | | | | | | $ | (1,449,357 | ) | | $ | (522,059 | ) |
| Inflation Protected Securities | | Interest rate | | Swaps | | $ | (87,457 | ) | | $ | (9,837 | ) |
| Intermediate Government Bond | | Interest rate | | Swaps | | $ | — | | | $ | 10,105 | |
| Short Term Bond | | Interest rate | | Swaps | | $ | (595,864 | ) | | $ | (56,331 | ) |
Market and Counterparty Credit Risk
In the normal course of business each Fund may invest in financial instruments and enter into financial transactions where risk of potential loss exists due to changes in the market (market risk) or failure of the other party to the transaction to perform (counterparty credit risk). The potential loss could exceed the value of the financial assets recorded on the financial statements. Financial assets, which potentially expose each Fund to counterparty credit risk, consist principally of cash due from counterparties on forward, option and swap transactions, when applicable. The extent of each Fund’s exposure to counterparty credit risk in respect to these financial assets approximates their carrying value as recorded on the Statement of Assets and Liabilities.
Each Fund helps manage counterparty credit risk by entering into agreements only with counterparties the Adviser believes have the financial resources to honor their obligations and by having the Adviser monitor the financial stability of the counterparties. Additionally, counterparties may be required to pledge
collateral daily (based on the daily valuation of the financial asset) on behalf of each Fund with a value approximately equal to the amount of any unrealized gain above a pre-determined threshold. Reciprocally, when each Fund has an unrealized loss, the Funds have instructed the custodian to pledge assets of the Funds as collateral with a value approximately equal to the amount of the unrealized loss above a pre-determined threshold. Collateral pledges are monitored and subsequently adjusted if and when the valuations fluctuate, either up or down, by at least the pre-determined threshold amount.
4. Fund Shares
Transactions in Fund shares during the current and prior fiscal period were as follows:
| | | | | | | | | | | | | | | | |
| | | Year Ended
6/30/15 | | | Year Ended
6/30/14 | |
| Core Bond | | Shares | | | Amount | | | Shares | | | Amount | |
| Shares sold: | | | | | | | | | | | | | | | | |
Class A | | | 480,983 | | | $ | 4,953,915 | | | | 190,891 | | | $ | 1,930,242 | |
Class C | | | 96,329 | | | | 982,982 | | | | 26,748 | | | | 272,294 | |
Class R6 | | | 4,651,952 | | | | 47,541,741 | | | | — | | | | — | |
Class I | | | 3,159,449 | | | | 32,214,618 | | | | 4,357,280 | | | | 44,130,888 | |
| Shares issued to shareholders due to reinvestment of distributions: | | | | | | | | | | | | | | | | |
Class A | | | 58,925 | | | | 602,146 | | | | 50,578 | | | | 512,778 | |
Class C | | | 2,063 | | | | 20,945 | | | | 779 | | | | 7,842 | |
Class R6 | | | 51,608 | | | | 521,428 | | | | — | | | | — | |
Class I | | | 470,639 | | | | 4,799,991 | | | | 550,784 | | | | 5,563,133 | |
| | | | 8,971,948 | | | | 91,637,766 | | | | 5,177,060 | | | | 52,417,177 | |
| Shares redeemed: | | | | | | | | | | | | | | | | |
Class A | | | (524,861 | ) | | | (5,370,931 | ) | | | (617,258 | ) | | | (6,266,755 | ) |
Class C | | | (50,490 | ) | | | (511,743 | ) | | | (35,731 | ) | | | (362,204 | ) |
Class R6 | | | (159,742 | ) | | | (1,625,000 | ) | | | — | | | | — | |
Class I | | | (17,818,315 | ) | | | (182,116,417 | ) | | | (20,612,872 | ) | | | (208,758,539 | ) |
| | | | (18,553,408 | ) | | | (189,624,091 | ) | | | (21,265,861 | ) | | | (215,387,498 | ) |
| Net increase (decrease) | | | (9,581,460 | ) | | $ | (97,986,325 | ) | | | (16,088,801 | ) | | $ | (162,970,321 | ) |
| | |
| | | Year Ended
6/30/15 | | | Year Ended
6/30/14 | |
| Core Plus Bond | | Shares | | | Amount | | | Shares | | | Amount | |
| Shares sold: | | | | | | | | | | | | | | | | |
Class A | | | 1,431,910 | | | $ | 16,573,234 | | | | 609,904 | | | $ | 7,036,407 | |
Class A – automatic conversion of Class B Shares | | | — | | | | — | | | | 47,844 | | | | 553,873 | |
Class B – exchanges | | | — | | | | — | | | | 7 | | | | 67 | |
Class C | | | 443,728 | | | | 5,107,553 | | | | 431,928 | | | | 4,981,210 | |
Class R3 | | | 339,863 | | | | 3,921,356 | | | | 28,830 | | | | 336,916 | |
Class R6 | | | 3,988,552 | | | | 45,789,116 | | | | — | | | | — | |
Class I | | | 8,121,755 | | | | 93,636,474 | | | | 6,858,967 | | | | 78,468,269 | |
| Shares issued to shareholders due to reinvestment of distributions: | | | | | | | | | | | | | | | | |
Class A | | | 221,063 | | | | 2,551,674 | | | | 306,398 | | | | 3,514,717 | |
Class B | | | — | | | | — | | | | 351 | | | | 3,977 | |
Class C | | | 13,935 | | | | 159,971 | | | | 15,202 | | | | 173,461 | |
Class R3 | | | 6,838 | | | | 78,938 | | | | 1,703 | | | | 19,642 | |
Class R6 | | | 61,527 | | | | 703,660 | | | | — | | | | — | |
Class I | | | 638,558 | | | | 7,363,664 | | | | 999,670 | | | | 11,445,991 | |
| | | | 15,267,729 | | | | 175,885,640 | | | | 9,300,804 | | | | 106,534,530 | |
| Shares redeemed: | | | | | | | | | | | | | | | | |
Class A | | | (1,282,745 | ) | | | (14,765,373 | ) | | | (2,076,986 | ) | | | (23,905,678 | ) |
Class B | | | — | | | | — | | | | (5,659 | ) | | | (63,898 | ) |
Class B – automatic conversion to Class A Shares | | | — | | | | — | | | | (48,303 | ) | | | (553,873 | ) |
Class C | | | (349,732 | ) | | | (3,968,520 | ) | | | (157,423 | ) | | | (1,798,226 | ) |
Class R3 | | | (68,508 | ) | | | (785,186 | ) | | | (6,944 | ) | | | (80,391 | ) |
Class R6 | | | (162,188 | ) | | | (1,865,000 | ) | | | — | | | | — | |
Class I | | | (13,432,022 | ) | | | (154,528,972 | ) | | | (15,417,145 | ) | | | (176,804,655 | ) |
| | | | (15,295,195 | ) | | | (175,913,051 | ) | | | (17,712,460 | ) | | | (203,206,721 | ) |
| Net increase (decrease) | | | (27,466 | ) | | $ | (27,411 | ) | | | (8,411,656 | ) | | $ | (96,672,191 | ) |
Notes to Financial Statements (continued)
| | | | | | | | | | | | | | | | |
| | | Year Ended
6/30/15 | | | Year Ended
6/30/14 | |
| Inflation Protected Securities | | Shares | | | Amount | | | Shares | | | Amount | |
| Shares sold: | | | | | | | | | | | | | | | | |
Class A | | | 2,506,090 | | | $ | 27,662,729 | | | | 1,516,827 | | | $ | 16,811,833 | |
Class C | | | 397,128 | | | | 4,332,157 | | | | 208,726 | | | | 2,305,112 | |
Class R3 | | | 298,987 | | | | 3,263,207 | | | | 290,561 | | | | 3,169,921 | |
Class R6 | | | 298,908 | | | | 3,338,897 | | | | — | | | | — | |
Class I | | | 9,520,020 | | | | 106,097,936 | | | | 12,315,998 | | | | 136,385,923 | |
| Shares issued to shareholders due to reinvestment of distributions: | | | | | | | | | | | | | | | | |
Class A | | | 22,083 | | | | 245,094 | | | | 41,712 | | | | 453,506 | |
Class C | | | 2,409 | | | | 26,612 | | | | 11,112 | | | | 119,672 | |
Class R3 | | | 2,564 | | | | 28,322 | | | | 1,423 | | | | 15,519 | |
Class R6 | | | — | | | | — | | | | — | | | | — | |
Class I | | | 59,165 | | | | 661,822 | | | | 137,994 | | | | 1,509,840 | |
| | | | 13,107,354 | | | | 145,656,776 | | | | 14,524,353 | | | | 160,771,326 | |
| Shares redeemed: | | | | | | | | | | | | | | | | |
Class A | | | (785,062 | ) | | | (8,679,440 | ) | | | (1,406,435 | ) | | | (15,496,008 | ) |
Class C | | | (155,985 | ) | | | (1,721,376 | ) | | | (484,536 | ) | | | (5,299,593 | ) |
Class R3 | | | (268,797 | ) | | | (2,971,314 | ) | | | (31,480 | ) | | | (346,374 | ) |
Class R6 | | | (20,018 | ) | | | (225,016 | ) | | | — | | | | — | |
Class I | | | (7,807,405 | ) | | | (86,933,536 | ) | | | (15,024,900 | ) | | | (166,334,393 | ) |
| | | | (9,037,267 | ) | | | (100,530,682 | ) | | | (16,947,351 | ) | | | (187,476,368 | ) |
| Net increase (decrease) | | | 4,070,087 | | | $ | 45,126,094 | | | | (2,422,998 | ) | | $ | (26,705,042 | ) |
| | |
| | | Year Ended
6/30/15 | | | Year Ended
6/30/14 | |
| Intermediate Government Bond | | Shares | | | Amount | | | Shares | | | Amount | |
| Shares sold: | | | | | | | | | | | | | | | | |
Class A | | | 301,596 | | | $ | 2,674,606 | | | | 277,799 | | | $ | 2,438,663 | |
Class C | | | 25,473 | | | | 225,799 | | | | 17,265 | | | | 151,807 | |
Class R3 | | | 3,672 | | | | 32,381 | | | | 3,177 | | | | 27,910 | |
Class I | | | 3,567,119 | | | | 31,596,680 | | | | 5,809,758 | | | | 51,084,073 | |
| Shares issued to shareholders due to reinvestment of distributions: | | | | | | | | | | | | | | | | |
Class A | | | 10,037 | | | | 88,789 | | | | 15,493 | | | | 136,135 | |
Class C | | | 218 | | | | 1,929 | | | | 612 | | | | 5,387 | |
Class R3 | | | 119 | | | | 1,057 | | | | 177 | | | | 1,554 | |
Class I | | | 11,379 | | | | 100,789 | | | | 20,402 | | | | 179,480 | |
| | | | 3,919,613 | | | | 34,722,030 | | | | 6,144,683 | | | | 54,025,009 | |
| Shares redeemed: | | | | | | | | | | | | | | | | |
Class A | | | (379,903 | ) | | | (3,366,166 | ) | | | (457,023 | ) | | | (4,011,228 | ) |
Class C | | | (22,419 | ) | | | (198,363 | ) | | | (69,410 | ) | | | (611,389 | ) |
Class R3 | | | (3,860 | ) | | | (34,054 | ) | | | (6,944 | ) | | | (60,826 | ) |
Class I | | | (5,874,316 | ) | | | (52,018,923 | ) | | | (2,004,053 | ) | | | (17,609,293 | ) |
| | | | (6,280,498 | ) | | | (55,617,506 | ) | | | (2,537,430 | ) | | | (22,292,736 | ) |
| Net increase (decrease) | | | (2,360,885 | ) | | $ | (20,895,476 | ) | | | 3,607,253 | | | $ | 31,732,273 | |
| | | | | | | | | | | | | | | | |
| | | Year Ended
6/30/15 | | | Year Ended
6/30/14 | |
| Short Term Bond | | Shares | | | Amount | | | Shares | | | Amount | |
| Shares sold: | | | | | | | | | | | | | | | | |
Class A | | | 4,107,721 | | | $ | 40,925,341 | | | | 7,472,773 | | | $ | 74,862,206 | |
Class C | | | 1,003,522 | | | | 10,034,994 | | | | 1,888,144 | | | | 18,944,511 | |
Class R3 | | | 15,685 | | | | 156,648 | | | | 59,477 | | | | 596,805 | |
Class R6 | | | 3,194,996 | | | | 31,730,928 | | | | — | | | | — | |
Class I | | | 22,741,538 | | | | 226,838,893 | | | | 44,728,214 | | | | 448,951,923 | |
| Shares issued to shareholders due to reinvestment of distributions: | | | | | | | | | | | | | | | | |
Class A | | | 145,594 | | | | 1,450,839 | | | | 193,137 | | | | 1,937,159 | |
Class C | | | 19,118 | | | | 191,160 | | | | 34,458 | | | | 346,546 | |
Class R3 | | | 9 | | | | 91 | | | | 21 | | | | 214 | |
Class R6 | | | 17,912 | | | | 178,439 | | | | — | | | | — | |
Class I | | | 282,764 | | | | 2,820,170 | | | | 319,951 | | | | 3,210,967 | |
| | | | 31,528,859 | | | | 314,327,503 | | | | 54,696,175 | | | | 548,850,331 | |
| Shares redeemed: | | | | | | | | | | | | | | | | |
Class A | | | (5,710,885 | ) | | | (56,917,931 | ) | | | (10,236,248 | ) | | | (102,504,315 | ) |
Class C | | | (1,560,336 | ) | | | (15,591,244 | ) | | | (2,461,089 | ) | | | (24,744,016 | ) |
Class R3 | | | (106,775 | ) | | | (1,067,252 | ) | | | (6,992 | ) | | | (70,325 | ) |
Class R6 | | | (451,080 | ) | | | (4,490,000 | ) | | | — | | | | — | |
Class I | | | (60,814,967 | ) | | | (605,795,536 | ) | | | (26,289,766 | ) | | | (263,774,093 | ) |
| | | | (68,644,043 | ) | | | (683,861,963 | ) | | | (38,994,095 | ) | | | (391,092,749 | ) |
| Net increase (decrease) | | | (37,115,184 | ) | | $ | (369,534,460 | ) | | | 15,702,080 | | | $ | 157,757,582 | |
5. Investment Transactions
Long-term purchases and sales (including maturities but excluding investments purchased with collateral from securities lending and derivative transactions) during the current fiscal period were as follows:
| | | | | | | | | | | | | | | | | | | | |
| | | Core
Bond | | | Core Plus
Bond | | | Inflation
Protected
Securities | | | Intermediate
Government
Bond | | | Short Term
Bond | |
| Purchases: | | | | | | | | | | | | | | | | | | | | |
Investment securities | | $ | 29,581,556 | | | $ | 138,276,961 | | | $ | 37,414,336 | | | $ | 5,179,528 | | | $ | 363,839,707 | |
U.S. Government and agency obligations | | | 98,888,216 | | | | 141,595,999 | | | | 123,224,942 | | | | 44,106,302 | | | | 30,001,562 | |
| Sales and maturities: | | | | | | | | | | | | | | | | | | | | |
Investment securities | | | 89,291,711 | | | | 114,288,180 | | | | 30,321,962 | | | | 5,249,724 | | | | 426,674,944 | |
U.S. Government and agency obligations | | | 116,743,015 | | | | 140,738,350 | | | | 92,676,336 | | | | 50,837,337 | | | | 96,999,761 | |
6. Income Tax Information
Each Fund is a separate taxpayer for federal income tax purposes. Each Fund intends to distribute substantially all of its net investment income and net capital gains to shareholders and to otherwise comply with the requirements of Subchapter M of the Internal Revenue Code applicable to regulated investment companies. Therefore, no federal income tax provision is required.
For all open tax years and all major taxing jurisdictions, management of the Funds has concluded that there are no significant uncertain tax positions that would require recognition in the financial statements. Open tax years are those that are open for examination by taxing authorities (i.e., generally the last four tax year ends and the interim tax period since then). Furthermore, management of the Funds is also not aware of any tax positions for which it is reasonably possible that the total amounts of unrecognized tax benefits will significantly change in the next twelve months.
The following information is presented on an income tax basis. Differences between amounts for financial statement and federal income tax purposes are primarily due to timing differences in recognizing certain gains and losses on investment transactions. To the extent that differences arise that are permanent in nature, such amounts are reclassified within the capital accounts as detailed below. Temporary differences do not require reclassification. Temporary and permanent differences do not impact the NAVs of the Funds.
Notes to Financial Statements (continued)
As of June 30, 2015, the cost and unrealized appreciation (depreciation) of investments (excluding investments in derivatives), as determined on a federal income tax basis, were as follows:
| | | | | | | | | | | | | | | | | | | | |
| | | Core
Bond | | | Core Plus
Bond | | | Inflation
Protected
Securities | | | Intermediate
Government
Bond | | | Short Term
Bond | |
| Cost of investments | | $ | 247,338,003 | | | $ | 635,409,363 | | | $ | 393,134,540 | | | $ | 76,418,662 | | | $ | 717,596,553 | |
| Gross unrealized: | | | | | | | | | | | | | | | | | | | | |
Appreciation | | $ | 5,344,113 | | | $ | 24,191,225 | | | $ | 6,678,075 | | | $ | 1,565,718 | | | $ | 4,780,706 | |
Depreciation | | | (2,673,100 | ) | | | (12,577,054 | ) | | | (7,059,983 | ) | | | (209,424 | ) | | | (2,874,419 | ) |
| Net unrealized appreciation (depreciation) of investments | | $ | 2,671,013 | | | $ | 11,614,171 | | | $ | (381,908 | ) | | $ | 1,356,294 | | | $ | 1,906,287 | |
Permanent differences, primarily due to distribution reallocations, expiration of capital loss carryforwards, federal taxes paid, foreign currency transactions, return of capital distributions, treatment of notional principal contracts, amortization of mark-to-market assets on Sec. 311(e) adjustments and deflation adjustments sold reclass resulted in reclassifications among the Funds’ components of net assets as of June 30, 2015, the Funds’ tax year end, as follows:
| | | | | | | | | | | | | | | | | | | | |
| | | Core
Bond | | | Core Plus
Bond | | | Inflation
Protected
Securities | | | Intermediate
Government
Bond | | | Short Term
Bond | |
| Capital paid-in | | $ | (20 | ) | | $ | (22 | ) | | $ | (1,423,877 | ) | | $ | (2,446,558 | ) | | $ | (7,824,109 | ) |
| Undistributed (Over-distribution of) net investment income | | | (124,923 | ) | | | 82,081 | | | | 1,477,274 | | | | — | | | | (418,938 | ) |
| Accumulated net realized gain (loss) | | | 124,943 | | | | (82,059 | ) | | | (53,397 | ) | | | 2,446,558 | | | | 8,243,047 | |
The tax components of undistributed net ordinary income and net long-term capital gains as of June 30, 2015, the Funds’ tax year end, were as follows:
| | | | | | | | | | | | | | | | | | | | |
| | | Core
Bond | | | Core Plus
Bond | | | Inflation
Protected
Securities | | | Intermediate
Government
Bond | | | Short Term
Bond | |
| Undistributed net ordinary income1 | | $ | 625,622 | | | $ | 2,483,544 | | | $ | — | | | $ | 59,307 | | | $ | 21,293 | |
| Undistributed net long-term capital gains | | | 705,744 | | | | 801,663 | | | | — | | | | — | | | | — | |
| 1 | Undistributed net ordinary income (on a tax basis) has not been reduced for the dividend declared during the period June 1, 2015 through June 30, 2015 and paid on July 1, 2015. Net ordinary income consists of net taxable income derived from dividends, interest and net short-term capital gains, if any. |
The tax character of distributions paid during the Funds’ tax years ended June 30, 2015 and June 30, 2014, was designated for purposes of the dividends paid deduction as follows:
| | | | | | | | | | | | | | | | | | | | |
| 2015 | | Core
Bond | | | Core Plus
Bond | | | Inflation
Protected
Securities | | | Intermediate
Government
Bond | | | Short Term
Bond | |
| Distributions from net ordinary income2 | | $ | 9,599,976 | | | $ | 23,402,734 | | | $ | 2,853,684 | | | $ | 1,114,389 | | | $ | 17,072,409 | |
| Distributions from net long-term capital gains3 | | | 4,146,887 | | | | 884,605 | | | | 128,584 | | | | — | | | | — | |
Return of capital | | | — | | | | — | | | | 1,423,856 | | | | — | | | | — | |
| | | | | | | | | | | | | | | | | | | | |
| 2014 | | Core
Bond | | | Core Plus
Bond | | | Inflation
Protected
Securities | | | Intermediate
Government
Bond | | | Short Term
Bond | |
| Distributions from net ordinary income2 | | $ | 9,820,374 | | | $ | 26,253,024 | | | $ | 3,390,455 | | | $ | 1,105,481 | | | $ | 19,204,634 | |
| Distributions from long-term capital gains | | | 5,763,177 | | | | 8,014,634 | | | | 5,864,404 | | | | — | | | | — | |
| Return of capital | | | — | | | | — | | | | — | | | | 71,194 | | | | — | |
| 2 | Net ordinary income consists of net taxable income derived from dividends, interest and net short-term capital gains, if any. |
| 3 | The Funds designate as long-term capital gain dividends, pursuant to the Internal Revenue Code Section 825(b)(3), the amount necessary to reduce earnings and profits of the Funds related to net capital gain to zero for the tax year ended June 30, 2015. |
As of June 30, 2015, the Funds’ tax year end, the following Funds had unused capital loss carryforwards available for federal income tax purposes to be applied against future capital gains, if any. If not applied, the carryforwards will expire as shown in the following table. The losses not subject to expiration will be utilized first by a Fund.
| | | | | | | | |
| | | Intermediate
Government
Bond | | | Short
Term
Bond | |
| Expiration: | | | | | | | | |
June 30, 2016 | | $ | 164,695 | | | $ | 48,855 | |
June 30, 2017 | | | 3,538,398 | | | | 1,188,199 | |
June 30, 2018 | | | — | | | | 4,103,631 | |
| Not subject to expiration | | | 128,396 | | | | 3,967,046 | |
| Total | | $ | 3,831,489 | | | $ | 9,307,731 | |
During the Funds’ tax year ended June 30, 2015, the following Funds utilized capital loss carryforwards as follows:
| | | | | | | | | | | | |
| | | | | | | Inflation
Protected
Securities | | | Intermediate
Government
Bond | |
| Utilized capital loss carryforwards | | | | | | $ | 21,234 | | | $ | 190,432 | |
As of June 30, 2015, the Funds’ tax year end, the following Funds’ capital loss carryforwards expired as follows:
| | | | | | | | | | | | |
| | | | | | | Intermediate
Government Bond | | | Short Term
Bond | |
| Expired capital loss carryforwards | | | | | | $ | 2,446,535 | | | $ | 7,432,482 | |
The Funds have elected to defer late-year losses in accordance with federal income tax rules. These losses are treated as having arisen on the first day of the following fiscal year. The following Funds have elected to defer losses as follows:
| | | | | | | | | | | | | | |
| | | | | Inflation
Protected
Securities | | | Interemediate
Government
Bond | | | Short Term
Bond | |
| Post-October capital losses4 | | | | $ | 599,478 | | | $ | 44,831 | | | $ | — | |
| Late-year ordinary losses5 | | | | | 9,309 | | | | — | | | | 692,591 | |
| 4 | Capital losses incurred from November 1, 2014 through June 30, 2015, the Funds’ tax year end. |
| 5 | Ordinary losses incurred from January 1, 2015 through June 30, 2015 and/or specified losses incurred from November 1, 2014 through June 30, 2015. |
7. Management Fees and Other Transactions with Affiliates
Each Fund’s management fee compensates the Adviser for overall investment advisory and administrative services and general office facilities. The Sub-Adviser is compensated for its services to the Funds from the management fees paid to the Adviser.
Each Fund’s management fee consists of two components – a fund-level fee, based only on the amount of assets within each individual Fund, and a complex-level fee, based on the aggregate amount of all eligible fund assets managed by the Adviser. This pricing structure enables each Fund’s shareholders to benefit from growth in the assets within their respective Fund as well as from growth in the amount of complex-wide assets managed by the Adviser.
The annual Fund-level fee, payable monthly, for each Fund is calculated according to the following schedule:
| | | | | | | | | | | | | | | | | | | | |
| Average Daily Net Assets | | Core Bond
Fund-Level
Fee | | | Core Plus
Bond
Fund-Level
Fee | | | Inflation
Protected
Securities
Fund-Level
Fee | | | Intermediate
Government
Bond
Fund-Level
Fee | | | Short Term
Bond
Fund-Level
Fee | |
| For the first $125 million | | | 0.2700 | % | | | 0.2800 | % | | | 0.2500 | % | | | 0.2700 | % | | | 0.2200 | % |
| For the next $125 million | | | 0.2575 | | | | 0.2675 | | | | 0.2375 | | | | 0.2575 | | | | 0.2075 | |
| For the next $250 million | | | 0.2450 | | | | 0.2550 | | | | 0.2250 | | | | 0.2450 | | | | 0.1950 | |
| For the next $500 million | | | 0.2325 | | | | 0.2425 | | | | 0.2125 | | | | 0.2325 | | | | 0.1825 | |
| For the next $1 billion | | | 0.2200 | | | | 0.2300 | | | | 0.2000 | | | | 0.2200 | | | | 0.1700 | |
| For net assets over $2 billion | | | 0.1950 | | | | 0.2050 | | | | 0.1750 | | | | 0.1950 | | | | 0.1450 | |
Notes to Financial Statements (continued)
The annual complex-level fee, payable monthly, for each Fund is determined by taking the complex-level fee rate, which is based on the aggregate amount of “eligible assets” of all Nuveen funds as set forth in the schedule below, and making, as appropriate, an upward adjustment to that rate based upon the percentage of the particular fund’s assets that are not “eligible assets.” The complex-level fee schedule for each Fund is as follows:
| | | | |
| Complex-Level Asset Breakpoint Level* | | Effective Rate at Breakpoint Level | |
| $55 billion | | | 0.2000 | % |
| $56 billion | | | 0.1996 | |
| $57 billion | | | 0.1989 | |
| $60 billion | | | 0.1961 | |
| $63 billion | | | 0.1931 | |
| $66 billion | | | 0.1900 | |
| $71 billion | | | 0.1851 | |
| $76 billion | | | 0.1806 | |
| $80 billion | | | 0.1773 | |
| $91 billion | | | 0.1691 | |
| $125 billion | | | 0.1599 | |
| $200 billion | | | 0.1505 | |
| $250 billion | | | 0.1469 | |
| $300 billion | | | 0.1445 | |
| * | The complex-level fee is calculated based upon the aggregate daily “eligible assets” of all Nuveen funds. Eligible assets do not include assets attributable to investments in other Nuveen funds or assets in excess of $2 billion added to the Nuveen fund complex in connection with the Adviser’s assumption of the management of the former First American Funds effective January 1, 2011. Eligible assets include closed-end fund assets managed by the Adviser that are attributable to certain types of leverage. For these purposes, leverage includes the closed-end funds’ use of preferred stock and borrowings and certain investments in the residual interest certificates (also called inverse floating rate securities) in tender option bond (TOB) trusts, including the portion of assets held by the TOB trust that has been effectively financed by the trust’s issuance of floating rate securities, subject to an agreement by the Adviser as to certain funds to limit the amount of such assets for determining eligible assets in certain circumstances. As of June 30, 2015, the complex-level fee rate for each Fund was as follows: |
| | | | |
| Fund | | Complex-Level Fee Rate | |
Core Bond | | | 0.2000 | % |
Core Plus Bond | | | 0.2000 | |
Inflation Protected Securities | | | 0.1807 | |
Intermediate Government Bond | | | 0.2000 | |
Short Term Bond | | | 0.2000 | |
The Adviser has agreed to waive fees and/or reimburse expenses (“Expense Cap”) of each Fund so that the total annual Fund operating expenses (excluding 12b-1 distribution and/or service fees, interest expenses, taxes, acquired fund fees and expenses, fees occurred in acquiring and disposing of portfolio securities and extraordinary expenses) do not exceed the average daily net assets of any class of Fund shares in the amounts and time periods stated in the following table.
| | | | | | | | | | |
| | | | |
| Fund | | | | | | Expense Cap | | | Temporary
Expense Cap
Expiratioin Date |
Core Bond | | | | | | | 0.53 | % | | October 31, 2016 |
Core Plus Bond | | | | | | | 0.52 | | | October 31, 2016 |
Inflation Protected Securities | | | | | | | 0.60 | | | October 31, 2016 |
Intermediate Government Bond | | | | | | | 0.60 | | | October 31, 2016 |
Short Term Bond | | | | | | | 0.47 | | | October 31, 2016 |
The Trust pays no compensation directly to those of its directors who are affiliated with the Adviser or to its officers, all of whom receive remuneration for their services to the Trust from the Adviser or its affiliates. The Board has adopted a deferred compensation plan for independent directors that enable directors to elect to defer receipt of all or a portion of the annual compensation they are entitled to receive from certain Nuveen-advised funds. Under the plan, deferred amounts are treated as though equal dollar amounts had been invested in shares of select Nuveen-advised funds.
During the current fiscal period, Nuveen Securities, LLC, (the “Distributor”), a wholly-owned subsidiary of Nuveen, collected sales charges on purchases of Class A Shares, the majority of which were paid out as concessions to financial intermediaries as follows:
| | | | | | | | | | | | | | | | | | | | |
| | | Core
Bond | | | Core Plus
Bond | | | Inflation
Protected
Securities | | | Intermediate
Government
Bond | | | Short Term
Bond | |
| Sales charges collected (Unaudited) | | $ | 23,963 | | | $ | 95,249 | | | $ | 29,133 | | | $ | 10,306 | | | $ | 168,925 | |
| Paid to financial intermediaries (Unaudited) | | | 20,818 | | | | 86,449 | | | | 25,887 | | | | 9,759 | | | | 163,558 | |
The Distributor also received 12b-1 service fees on Class A Shares, substantially all of which were paid to compensate financial intermediaries for providing services to shareholders relating to their investments.
During the current fiscal period, the Distributor compensated financial intermediaries directly with commission advances at the time of purchase as follows:
| | | | | | | | | | | | | | | | | | | | |
| | | Core
Bond | | | Core Plus
Bond | | | Inflation
Protected
Securities | | | Intermediate
Government
Bond | | | Short Term
Bond | |
| Commission advances (Unaudited) | | $ | 12,798 | | | $ | 70,067 | | | $ | 13,116 | | | $ | 9,116 | | | $ | 183,875 | |
To compensate for commissions advanced to financial intermediaries, all 12b-1 service and distribution fees collected on Class C Shares during the first year following a purchase are retained by the Distributor. During the current fiscal period, the Distributor retained such 12b-1 fees as follows:
| | | | | | | | | | | | | | | | | | | | |
| | | Core
Bond | | | Core Plus
Bond | | | Inflation
Protected
Securities | | | Intermediate
Government
Bond | | | Short Term
Bond | |
| 12b-1 fees retained (Unaudited) | | $ | 2,458 | | | $ | 54,862 | | | $ | 15,697 | | | $ | 780 | | | $ | 45,361 | |
The remaining 12b-1 fees charged to the Funds were paid to compensate financial intermediaries for providing services to shareholders relating to their investments.
The Distributor also collected and retained CDSC on share redemptions during the current fiscal period, as follows:
| | | | | | | | | | | | | | | | | | | | |
| | | Core
Bond | | | Core Plus
Bond | | | Inflation
Protected
Securities | | | Intermediate
Government
Bond | | | Short Term
Bond | |
| CDSC retained (Unaudited) | | $ | 150 | | | $ | 2,863 | | | $ | 860 | | | $ | 276 | | | $ | 29,479 | |
8. Borrowing Arrangements
During the current fiscal period, the Funds participated in an unsecured bank line of credit (“Unsecured Credit Line”) under which outstanding balances would bear interest at a variable rate. The Funds did not draw on this Unsecured Credit Line during the current fiscal period.
Subsequent to the reporting period, the Funds, along with certain other funds managed by the Adviser (“Participating Funds”), entered into a 364-day, $2.53 billion credit agreement with a group of lenders, under which the Participating Funds may borrow. This credit agreement replaces the Unsecured Credit Line described above.
The credit agreement expires in July 2016 unless extended or renewed. The credit agreement has the following terms: a fee of 0.15% per annum on unused commitment amounts and interest at a rate equal to the higher of (a) one-month LIBOR (London Inter-Bank Offered Rate) plus 1.25% per annum or (b) the Fed Funds rate plus 1.25% per annum on amounts borrowed. Participating Funds paid administration, legal and arrangement fees which, along with commitment fees, were allocated among such funds based upon portions of the aggregate commitment available to them and other factors deemed relevant by the Adviser and the Board of each Participating Fund.
9. New Accounting Pronouncement
Financial Accounting Standards Board (“FASB”) Transfers and Servicing (Topic 860): Repurchase-to-Maturity Transactions, Repurchase Financings, and Disclosures
In June 2014, the FASB issued Accounting Standards Update (“ASU”) 2014-11, Transfers and Servicing (Topic 860): Repurchase-to-Maturity Transactions, Repurchase Financings, and Disclosures” (“ASU 2014-11”), that expanded secured borrowing accounting for certain reverse repurchase agreements. ASU 2014-11 also sets forth additional disclosure requirements for certain transactions accounted for as sales in order to provide financial statement users with information to compare to similar transactions accounted for as secured borrowings. ASU 2014-11 is effective prospectively for annual periods beginning after December 15, 2014, and interim periods beginning after March 15, 2015. Management is currently evaluating the impact, if any, of ASU 2014-11 on the Funds’ financial statement disclosures.
Additional
Fund Information (Unaudited)
| | | | | | | | | | |
| | | | | |
| | Fund Manager Nuveen Fund Advisors, LLC 333 West Wacker Drive Chicago, IL 60606 Sub-Adviser Nuveen Asset Management, LLC 333 West Wacker Drive Chicago, IL 60606 | | Independent Registered
Public Accounting Firm PricewaterhouseCoopers LLP Chicago, IL 60606 Custodian U.S. Bank National Association Milwaukee, WI 53202 | | Legal Counsel Chapman and Cutler LLP Chicago, IL 60603 | | Transfer Agent and
Shareholder Services Boston Financial
Data Services Nuveen Investor Services P.O. Box 8530 Boston, MA 02266-8530 (800) 257-8787 | | |
| | | | | | | | | | | | | | |
| | | | | |
| | | | | | | | | | |
| | |
| | Distribution Information: Nuveen Core Plus Bond Fund hereby designates its percentage of dividends paid from net ordinary income as dividends qualifying for the 70% dividends received deduction (“DRD”) for corporations and its percentage as qualified dividend income (“QDI”) for individuals under Section 1 (h)(11) of the Internal Revenue Code as shown in the accompanying table. The actual qualified dividend income distributions will be reported to shareholders on Form 1099-DIV which will be sent to shareholders shortly after calendar year end. | | |
| | | | | | |
| | | | | | | | | | | Core Plus Bond | | |
| | %QDI | | 4% | | |
| | %DRD | | 3% | | |
| | | | | |
| | | | | | | | | | |
| | |
| | Quarterly Form N-Q Portfolio of Investments Information: Each Fund is required to file its complete schedule of portfolio holdings with the Securities and Exchange Commission (SEC) for the first and third quarters of each fiscal year on Form N-Q. You may obtain this information directly from the SEC. Visit the SEC on-line at http://www.sec.gov or in person at the SEC’s Public Reference Room in Washington, D.C. Call the SEC toll-free at (800) SEC-0330 for room hours and operation. | | |
| | | |
| | | | | | |
| | |
| | Nuveen Funds’ Proxy Voting Information: You may obtain (i) information regarding how each fund voted proxies relating to portfolio securities held during the most recent twelve-month period ended June 30, without charge, upon request, by calling Nuveen Investments toll-free at (800) 257-8787 or on Nuveen’s website at www.nuveen.com and (ii) a description of the policies and procedures that each fund used to determine how to vote proxies relating to portfolio securities without charge, upon request, by calling Nuveen Investments toll-free at (800) 257-8787. You may also obtain this information directly from the SEC. Visit the SEC on-line at http://www.sec.gov. | | |
| | | |
| | | | | | |
| | |
| | FINRA BrokerCheck: The Financial Industry Regulatory Authority (FINRA) provides information regarding the disciplinary history of FINRA member firms and associated investment professionals. This information as well as an investor brochure describing FINRA BrokerCheck is available to the public by calling the FINRA BrokerCheck Hotline number at (800) 289-9999 or by visiting www.FINRA.org. | | |
Glossary of Terms
Used in this Report (Unaudited)
Asset-Backed Securities (ABS): Securities whose value and income payments are derived from and collateralized by a specific pool of underlying assets. The pool of assets typically is a group of small and/or illiquid assets that may be difficult to sell individually. The underlying pools of asset-backed securities often include payments from credit cards, auto loans or mortgage loans.
Average Annual Total Return: This is a commonly used method to express an investment’s performance over a particular, usually multi-year time period. It expresses the return that would have been necessary each year to equal the investment’s actual cumulative performance (including change in NAV or offer price and reinvested dividends and capital gains distributions, if any) over the time period being considered.
Barclays U.S. Aggregate Bond Index: An unmanaged index that includes all investment-grade, publicly issued, fixed-rate, dollar denominated, nonconvertible debt issues and commercial mortgage-backed securities with maturities of at least one year and outstanding par values of $150 million or more. Index returns assume reinvestment of distributions, but do not include the effects of any applicable sales charges or management fees.
Barclays Intermediate Government Bond Index: An unmanaged index that includes all publicly issued, U.S. Treasury securities that have a remaining maturity of greater than or equal to 1 year and less than 10 years, are rated investment grade, and have $250 million or more of outstanding face value. Index returns assume reinvestment of distributions, but do not include the effects of any applicable sales charges or management fees.
Barclays U.S. TIPS Index: An unmanaged index that includes all publicly issued, U.S. Treasury inflation-protected securities that have at least one year remaining to maturity, are rated investment grade, and have $250 million or more of outstanding face value. Index returns assume reinvestment of distributions, but do not include the effects of any applicable sales charges or management fees.
Barclays 1-3 Year Government/Credit Bond Index: An unmanaged index that includes all medium and larger issues of U.S. government, investment-grade corporate, and investment-grade international dollar-denominated bonds that have maturities of between 1 and 3 years and are publicly issued. Index returns assume reinvestment of distributions, but do not include the effects of any applicable sales charges or management fees.
Commercial Mortgage-Backed Securities (CMBS): Commercial mortgage-backed securities are backed by cash flows of a mortgage or pool of mortgages on commercial real estate. CMBS generally are structured to provide protection to the senior class investors against potential losses on the underlying mortgage loans. CMBS are typically characterized by the following: i) loans on multi-family housing, non-residential property, ii) payments based on the amortization schedule of 25-30 years with a balloon payment due usually after 10 years, and iii) restrictions on prepayments.
Duration: Duration is a measure of the expected period over which a bond’s principal and interest will be paid, and consequently is a measure of the sensitivity of a bond’s or bond fund’s value to changes when market interest rates change. Generally, the longer a bond’s or fund’s duration, the more the price of the bond or fund will change as interest rates change.
Gross Domestic Product (GDP): The total market value of all final goods and services produced in a country/region in a given year, equal to total consumer, investment and government spending, plus the value of exports, minus the value of imports.
Lipper Core Bond Classification Average: Represents the average annualized returns for all reporting funds in the Lipper Core Bond Classification. Lipper returns account for the effects of management fees and assume reinvestment of distributions, but do not reflect any applicable sales charge.
Glossary of Terms Used in this Report (Unaudited) (continued)
Lipper Core Bond Plus Classification Average: Represents the average annualized returns for all reporting funds in the Lipper Core Bond Plus Classification. Lipper returns account for the effects of management fees and assume reinvestment of distributions, but do not reflect any applicable sales charge.
Lipper Inflation-Protected Bond Funds Classification Average: Represents the average annualized returns for all reporting funds in the Lipper Inflation-Protected Bond Funds Classification. The Lipper returns account for the effects of management fees and assume reinvestment of dividends, but do not reflect any applicable sales charge.
Lipper Intermediate U.S. Government Funds Classification Average: Represents the average annualized returns for all reporting funds in the Lipper Intermediate U.S. Government Classification. Lipper returns account for the effects of management fees and assume reinvestment of distributions, but do not reflect any applicable sales charge.
Lipper Short Investment Grade Debt Funds Classification Average: Represents the average annualized returns for all reporting funds in the Lipper Short Investment Grade Debt Funds Classification. Lipper returns account for the effects of management fees and assume reinvestment of distributions, but do not reflect any applicable sales charge.
Mortgage-Backed Securities (MBS): Mortgage-backed securities (MBS) are bonds backed by pools of mortgages, usually with similar characteristics, and which return principal and interest in each payment. MBS are composed of residential mortgages (RMBS) or commercial mortgages (CMBS). RMBS are further divided into agency RMBS and non-agency RMBS, depending on the issuer.
Net Asset Value (NAV) Per Share: A fund’s Net Assets is equal to its total assets (securities, cash and accrued earnings) less its total liabilities. For funds with multiple classes, Net Assets are determined separately for each share class. NAV per share is equal to the fund’s (or share class’) Net Assets divided by its number of shares outstanding.
Residential Mortgage-Backed Securities (RMBS): Residential mortgage-backed securities are securities the payments on which depend primarily on the cash flow from residential mortgage loans made to borrowers that are secured by residential real estate. RMBS consist of agency and non-agency RMBS. Agency RMBS have agency guarantees that assure investors that they will receive timely payment of interest and principal, regardless of delinquency or default rates on the underlying loans. Agency RMBS include securities issued by the Government National Mortgage Association, the
Federal National Mortgage Association and the Federal Home Loan Mortgage Corporation, and other federal agencies, or issues guaranteed by them. Non-agency RMBS do not have agency guarantees. Non-agency RMBS have credit enhancement built into the structure to shield investors from borrower delinquencies. The spectrum of non-agency residential mortgage loans includes traditional jumbo loans (prime), alternative-A loans (Alt-A), and home equity loans (sub-prime).
Tax Equalization: The practice of treating a portion of the distribution made to a redeeming shareholder, which represents his proportionate part of undistributed net investment income and capital gain as a distribution for tax purposes. Such amounts are referred to as the equalization debits (or payments) and will be considered a distribution to the shareholder of net investment income and capital gain for calculation of the Fund’s dividends paid deduction.
Annual Investment Management Agreement
Approval Process (Unaudited)
The Board of Directors of each Fund (each, a “Board” and each Director, a “Board Member”), including the Board Members who are not parties to the Funds’ advisory or sub-advisory agreements or “interested persons” of any such parties (the “Independent Board Members”), is responsible for overseeing the performance of the investment adviser and sub-adviser to the respective Fund and determining whether to continue such Fund’s advisory agreement (the “Investment Management Agreement”) between the Fund and Nuveen Fund Advisors, LLC (the “Adviser”) and the sub-advisory agreement (the “Sub-Advisory Agreement” and, together with the Investment Management Agreement, the “Advisory Agreements”) between the Adviser and Nuveen Asset Management, LLC (the “Sub-Adviser”). Following an initial term with respect to each Fund upon its commencement of operations, the Board is required to consider the continuation of the Advisory Agreements on an annual basis pursuant to the requirements of the Investment Company Act of 1940, as amended (the “1940 Act”). Accordingly, at an in-person meeting held on May 11-13, 2015 (the “May Meeting”), the Board, including a majority of the Independent Board Members, considered and approved the existing Advisory Agreements for the Funds.
In preparation for its considerations at the May Meeting, the Board received in advance of the meeting extensive materials prepared in connection with the review of the Advisory Agreements. The materials provided a broad range of information regarding the Funds, including, among other things, the nature, extent and quality of services provided by the Adviser and the Sub-Adviser (the Adviser and Sub-Adviser are collectively, the “Fund Advisers” and each, a “Fund Adviser”); Fund performance including performance assessments against peers and the appropriate benchmark(s); fee and expense information of the Funds compared to peers; a description and assessment of shareholder service levels for the Funds; a summary of the performance of certain service providers; a review of product initiatives and shareholder communications; and profitability information of the Fund Advisers as described in further detail below. As part of its annual review, the Board also held a separate meeting on April 14-15, 2015 to review the Funds’ investment performance and consider an analysis by the Adviser of the Sub-Adviser which generally evaluated the Sub-Adviser’s investment team, investment mandate, organizational structure and history, investment philosophy and process, and the performance of the Funds, and any significant changes to the foregoing. During the review, the Independent Board Members asked questions of and requested additional information from management.
The Board considered that the evaluation process with respect to the Fund Advisers is an ongoing process that encompassed the information and knowledge gained throughout the year. The Board, acting directly or through its committees, met regularly during the course of the year and received information and considered factors at each meeting that would be relevant to its annual consideration of the Advisory Agreements, including information relating to Fund performance; Fund expenses; investment team evaluations; and valuation, compliance, regulatory and risk matters. In addition to regular reports, the Adviser provided special reports to the Board to enhance the Board’s understanding on topics that impact some or all of the Nuveen funds and the Adviser (such as presentations on risk and stress testing; the new governance, risk and compliance system; cybersecurity developments; Nuveen fund accounting and reporting matters; regulatory developments impacting the investment company industry and the business plans or other matters impacting the Adviser). The Board also met with key investment personnel managing certain Nuveen fund portfolios during the year.
The Board had created several standing committees including the Open-End Funds Committee and the Closed-End Funds Committee to assist the full Board in monitoring and gaining a deeper insight into the distinctive business practices of closed-end and open-end funds. These Committees met prior to each quarterly Board meeting, and the Adviser provided presentations to these Committees permitting them to delve further into specific matters or initiatives impacting the respective product line.
The Board also continued its program of seeking to have the Board Members or a subset thereof visit each sub-adviser to the Nuveen funds at least once over a multiple year rotation, meeting with key investment and business personnel. In this regard, the Independent Board Members made site visits to multiple equity and fixed-income investment teams of the Sub-Adviser in June 2014.
The Board considered the information provided and knowledge gained at these meetings and visits during the year when performing its annual review of the Advisory Agreements. The Independent Board Members also were assisted throughout the process by independent legal counsel. During the course of the year and during their deliberations regarding the review of advisory contracts, the Independent Board Members met with independent legal counsel in executive sessions without management present. The Independent Board Members also received a memorandum from independent legal counsel outlining the legal standards for their consideration of the proposed continuation of the Advisory Agreements. In addition, it is important to recognize that the management arrangements for the Nuveen funds are the result of many years of review and discussion between the Independent Board Members and Fund management and that the Board Members’ conclusions may be based, in part, on their consideration of fee arrangements and other factors developed in previous years.
Annual Investment Management Agreement Approval Process (Unaudited) (continued)
The Board took into account all factors it believed relevant with respect to each Fund, including, among other things: (a) the nature, extent and quality of the services provided by the Fund Advisers; (b) the investment performance of the Funds and Fund Advisers; (c) the advisory fees and costs of the services to be provided to the Funds and the profitability of the Fund Advisers; (d) the extent of any economies of scale; (e) any benefits derived by the Fund Advisers from the relationship with the Funds; and (f) other factors. Each Board Member may have accorded different weight to the various factors in reaching his or her conclusions with respect to the Advisory Agreements applicable to the respective Fund. The Independent Board Members did not identify any single factor as all-important or controlling. The Independent Board Members’ considerations were instead based on a comprehensive consideration of all the information presented. The principal factors considered by the Board and its conclusions are described below.
A. Nature, Extent and Quality of Services
In evaluating the renewal of the Advisory Agreements, the Independent Board Members received and considered information regarding the nature, extent and quality of the applicable Fund Adviser’s services provided to the respective Fund. The Board reviewed information regarding, among other things, each Fund Adviser’s organization and business, the types of services that each Fund Adviser or its affiliates provided to the Funds, the performance record of the Funds (as described in further detail below), and any initiatives that had been undertaken on behalf of the open-end product line. The Board recognized the high quality of services the Adviser had provided to the Funds over the years and the conscientiousness with which the Adviser provided these services. The Board also considered the improved capital structure of Nuveen Investments, Inc. (“Nuveen”) (the parent of the Adviser) following the acquisition of Nuveen by TIAA-CREF in 2014 (the “TIAA-CREF Transaction”).
With respect to the services, the Board noted the Funds were registered investment companies that operated in a regulated industry and considered the myriad of investment management, administrative, compliance, oversight and other services the Adviser provided to manage and operate the Funds. Such services included, among other things: (a) product management (such as analyzing ways to better position a Nuveen fund in the marketplace, setting dividends; maintaining relationships to gain access to distribution platforms; and providing shareholder communications); (b) fund administration (such as preparing tax returns and other tax compliance services, preparing regulatory filings and shareholder reports; managing fund budgets and expenses; overseeing a fund’s various service providers and supporting and analyzing new and existing funds); (c) Board administration (such as supporting the Board and its committees, in relevant part, by organizing and administering the Board and committee meetings and preparing the necessary reports to assist the Board in its duties); (d) compliance (such as monitoring adherence to a fund’s investment policies and procedures and applicable law; reviewing the compliance program periodically and developing new policies or updating existing compliance policies and procedures as considered necessary or appropriate; responding to regulatory requests; and overseeing compliance testing of the funds’ sub-advisers); (e) legal support (such as preparing or reviewing fund registration statements, proxy statements and other necessary materials; interpreting regulatory requirements and compliance thereof; and maintaining applicable registrations); and (f) investment services (such as overseeing and reviewing the funds’ sub-advisers and their investment teams; analyzing performance of the funds; overseeing investment and risk management; evaluating brokerage transactions and securities lending, overseeing the daily valuation process for portfolio securities and developing and recommending valuation policies and methodologies and changes thereto; reporting to the Board on various matters including performance, risk and valuation; and participating in fund development, leverage management, and the developing or interpreting of investment policies and parameters).
In its review, the Board considered information highlighting the various initiatives that the Adviser had implemented or continued during the last year to enhance its services to the Nuveen funds. The Board recognized that some of these initiatives are a result of a multi-year process. In reviewing the activities of 2014, the Board recognized the Adviser’s continued focus on fund rationalization for open-end funds through mergers, fund closures or repositioning the funds in seeking to enhance shareholder value, reduce costs, improve performance, eliminate fund overlap and better meet shareholder needs. The Board noted the Adviser’s investment in additional staffing to strengthen and improve its services to the Nuveen funds, including with respect to risk management and valuation. The Board recognized that expanding the depth and range of its risk oversight activities had been a major priority for the Adviser in recent years, and the Adviser continued to add to the risk management team, develop additional risk management programs and create committees or other teams designated to oversee or evaluate certain risks, such as liquidity risk, enterprise risk, investment risk and cybersecurity risk. The Adviser had also continued to add to the valuation team, launched its centralized securities valuation system which is intended to provide for uniform pricing and reporting across the complex as the system continues to develop, continued to refine its valuation analysis and updated related policies and procedures and evaluated and assessed pricing services. The Board considered the Adviser’s ongoing investment in information technology and operations and the various projects of the information technology team to support the continued growth and complexity of the Nuveen funds and increase efficiencies in their operations. The Board also recognized the Adviser’s strong commitment to compliance and reviewed information reflecting the compliance group’s ongoing activities to enhance its compliance system and refine its compliance procedures as well as the Chief Compliance Officer’s report regarding the compliance team, the initiatives the team had undertaken in 2014 and proposed for 2015, the compliance functions and reporting process, the record of compliance with the policies and procedures and its supervision activities of other service providers.
With respect to the open-end fund product line, the Adviser had also, among other things: developed new funds in seeking to enhance the product line; enhanced the reporting to the Board and its committees regarding payments to intermediaries; and continued to explore opportunities for potential funds.
As noted, the Adviser also oversees the Sub-Adviser who primarily provides the portfolio advisory services to the Funds. The Board recognized the skill and competency of the Adviser in monitoring and analyzing the performance of the Sub-Adviser and managing the sub-advisory relationship. In considering the Sub-Advisory Agreements and supplementing its prior knowledge, the Board considered a current report provided by the Adviser analyzing, among other things, the Sub-Adviser’s investment team and changes thereto, investment approach, organization and history, and assets under management, and the investment performance of each Fund.
Based on their review, the Independent Board Members found that, overall, the nature, extent and quality of services provided to the Funds under each respective Advisory Agreement were satisfactory.
B. The Investment Performance of the Funds and Fund Advisers
The Board, including the Independent Board Members, considered the performance history of each Fund over various time periods. The Board reviewed reports, including an analysis of the Funds’ performance and the applicable investment team. The Board reviewed, among other things, each Fund’s investment performance both on an absolute basis and in comparison to peer funds (the “Performance Peer Group”) and to recognized and/or customized benchmarks (i.e., generally benchmarks derived from multiple recognized benchmarks) for the quarter, one-, three- and five-year periods ending December 31, 2014, as well as performance information reflecting the first quarter of 2015. In its review, the Board noted that it also reviewed Fund performance results at each of its quarterly meetings.
In evaluating performance, the Board recognized several factors that may impact the performance data as well as the consideration given to particular performance data.
| | • | | The performance data reflected a snapshot in time, in this case as of the end of the most recent calendar year or quarter. A different performance period, however, could generate significantly different results. |
| | • | | Long-term performance can be adversely affected by even one period of significant underperformance so that a single investment decision or theme had the ability to disproportionately affect long-term performance. |
| | • | | The investment experience of a particular shareholder in a fund would vary depending on when such shareholder invested in the fund, the class held (if multiple classes are offered in the fund) and the performance of the fund (or respective class) during that shareholder’s investment period. |
| | • | | Open-end funds offer multiple classes and the performance data provided for open-end funds was based on Class A shares. The performance of the other classes of a fund, however, should be substantially similar on a relative basis because all of the classes would be invested in the same portfolio of securities and differences in performance among classes could be principally attributed to the variations in distribution and servicing expenses of each class. |
| | • | | The Board recognized that the funds in the Performance Peer Group may differ somewhat from the Nuveen fund with which it is being compared and due to these differences, performance comparisons between certain of the Nuveen funds and their Performance Peer Groups may be inexact and the relevancy limited. The Board considered that management had classified the Performance Peer Group as low, medium and high in relevancy. The Board took the analysis of the relevancy of the Performance Peer Group into account when considering the comparative performance data. The Board also considered comparative performance of an applicable benchmark. While the Board was cognizant of the relative performance of a Fund’s peer set and/or benchmark(s), the Board evaluated Fund performance in light of the respective Fund’s investment objectives, investment parameters and guidelines and considered that the variations between the objectives and investment parameters or guidelines of the Fund with its peers and/or benchmarks result in differences in performance results. |
With respect to any Nuveen funds for which the Board has identified performance concerns, the Board monitors such funds closely until performance improves, discusses with the Adviser the reasons for such results, considers those steps necessary or appropriate to address such issues, and reviews the results of any efforts undertaken. The Board is aware, however, that shareholders chose to invest or remain invested in a fund knowing that the Adviser manages the fund and knowing the fund’s fee structure.
In considering the performance data, the Independent Board Members noted the following with respect to the Funds:
For Nuveen Core Bond Fund (the “Core Bond Fund”), the Board noted that, although the Fund ranked in its Performance Peer Group in the fourth quartile in the five-year period, the Fund ranked in the second quartile in the one- and three-year periods and, although the Fund underperformed its benchmark in the one- and five-year periods, the Fund outperformed its benchmark in the three-year period.
For Nuveen Core Plus Bond Fund (the “Core Plus Bond Fund”), the Board noted that the Fund ranked in its Performance Peer Group in the second quartile in the one- and three-year periods and the third quartile in the five-year period. Although the Fund underperformed its benchmark in the one-year period, the Fund outperformed its benchmark in the three- and five-year periods.
For Nuveen Inflation Protected Securities Fund (the “Inflation Protected Securities Fund”), the Board noted that, although the Fund underperformed its benchmark in the one-, three- and five-year periods, the Fund ranked in its Performance Peer Group in the first quartile in the one- and five-year periods and second quartile in the three-year period.
Annual Investment Management Agreement Approval Process (Unaudited) (continued)
For Nuveen Intermediate Government Bond Fund (the “Intermediate Government Bond Fund”), the Board noted that, although the Fund ranked in its Performance Peer Group in the fourth quartile in the one-year period, the Fund ranked in the second quartile in the three-year period and third quartile in the five-year period. The Fund also underperformed its benchmark in the one- and five-year periods, but slightly outperformed its benchmark in the three-year period.
For Nuveen Short Term Bond Fund (the “Short Term Bond Fund”), the Board noted that the Fund ranked in its Performance Peer Group in the third quartile in the one-year period, the first quartile in the three-year period and the second quartile in the five-year period. Although the Fund underperformed its benchmark in the one-year period, the Fund outperformed its benchmark in the three- and five-year periods.
Based on their review, the Independent Board Members determined that each Fund’s investment performance had been satisfactory.
C. Fees, Expenses and Profitability
1. Fees and Expenses
The Board evaluated the management fees and other fees and expenses of each Fund (expressed as a percentage of average net assets) in absolute terms and in comparison to the fee and expense levels of a comparable universe of funds (the “Peer Universe”) and, with respect to open-end funds, to a more focused subset in the Peer Universe (the “Peer Group”), each selected by an independent third-party fund data provider. The Independent Board Members reviewed the methodology regarding the construction of the Peer Universe and Peer Group for each Fund. The Board reviewed, among other things, such Fund’s gross management fees, net management fees and net expense ratios in absolute terms as well as compared to the average and median fee and expense levels of the Peer Universe and/or Peer Group. The Board noted that the net total expense ratios paid by investors in the Funds were the most representative of an investor’s net experience. The Board Members also considered any fee waivers and/or expense reimbursement arrangements currently in effect for the Funds.
In reviewing the comparative fee and expense information, the Independent Board Members recognized that various factors such as the limited size and particular composition of the Peer Universe or Peer Group (including the inclusion of other Nuveen funds in the peer set); expense anomalies; changes in the funds comprising the Peer Universe or Peer Group from year to year; levels of reimbursement or fee waivers; the timing of information used; and differences in services provided can impact the comparative data limiting the usefulness of the data to help make a conclusive assessment of the Funds’ fees and expenses.
In reviewing the fee schedule for a fund, the Independent Board Members also considered the fund-level and complex-wide breakpoint schedules (described in further detail below) and any fee waivers and reimbursements provided by Nuveen. In reviewing fees and expenses, the Board considered the expenses and fees to be higher if they were over 10 basis points higher, slightly higher if they were approximately 6 to 10 basis points higher, in line if they were within approximately 5 basis points higher than the peer average and below if they were below the peer average of the Peer Group. In reviewing the reports, the Board noted that the majority of the Nuveen funds had a net expense ratio near or below their peer average.
The Independent Board Members recognized that the Inflation Protected Securities Fund had a slightly higher net management fee than the peer average but a net expense ratio in line with the peer average. In addition, the Board recognized that the Core Bond Fund, the Core Plus Bond Fund, the Intermediate Government Bond Fund and the Short Term Bond Fund had a net management fee below or in line with the respective peer average and a net expense ratio below the respective peer average.
Based on their review of the fee and expense information provided, the Independent Board Members determined that each Fund’s management fees (as applicable) to a Fund Adviser were reasonable in light of the nature, extent and quality of services provided to the Fund.
2. Comparisons with the Fees of Other Clients
The Board considered information regarding the fees a Fund Adviser assessed to the Nuveen funds compared to that of other clients as described in further detail below. With respect to non-municipal funds, such other clients of the Adviser and/or its affiliated sub-advisers may include: separately managed accounts (such as retail, institutional or wrap accounts), hedge funds, other investment companies that are not offered by Nuveen but are sub-advised by one of Nuveen’s affiliated sub-advisers, foreign investment companies offered by Nuveen, and collective investment trusts.
The Board recognized that each Fund had an affiliated sub-adviser and therefore the overall Fund management fee can be divided into two components, the fee retained by the Adviser and the fee paid to the Sub-Adviser. In reviewing the nature of the services provided by the Adviser, including through its affiliated sub-advisers, the Board considered the range of advisory fee rates for retail and institutional managed accounts advised by Nuveen-affiliated sub-advisers. The Board also reviewed, among other things, the average fee the affiliated sub-advisers assessed such clients as well as the range of fee rates assessed to the different types of clients (such as retail, institutional and wrap accounts as well as non-Nuveen funds) applicable to such sub-advisers.
In reviewing the comparative information, the Board also reviewed information regarding the differences between the Funds and the other clients, including differences in services provided, investment policies, investor profiles, compliance and regulatory requirements and account sizes. The Board recognized the breadth of services necessary to operate a registered investment company (as described above) and that, in general terms,
the Adviser provided the administrative and other support services to the Funds and, although the Sub-Adviser may provide some of these services, the Sub-Adviser essentially provided the portfolio management services. In general, the Board noted that higher fee levels reflected higher levels of service provided by the Fund Adviser, increased investment management complexity, greater product management requirements and higher levels of business risk or some combination of the foregoing. The Independent Board Members considered the differences in structure and operations of separately managed accounts and hedge funds from registered funds and noted that the range of day-to-day services was not generally of the breadth required for the registered funds. Many of the additional administrative services provided by the Adviser were not required for institutional clients or funds sub-advised by a Nuveen-affiliated sub-adviser that were offered by other fund groups. The Independent Board Members also recognized that the management fee rates of the foreign funds advised by the Adviser may vary due to, among other things, differences in the client base, governing bodies, operational complexities and services covered by the management fee. Given the inherent differences in the various products, particularly the extensive services provided to the Funds, the Independent Board Members believed such facts justify the different levels of fees.
3. Profitability of Fund Advisers
In conjunction with their review of fees, the Independent Board Members also considered the profitability of Nuveen for its advisory activities and its financial condition. The Independent Board Members reviewed, among other things, the adjusted operating margins for Nuveen for the last two calendar years, the revenues, expenses, net income (pre-tax and after-tax) and net revenue margins (pre-tax and after-tax) of Nuveen’s managed fund advisory activities for the last two calendar years, the allocation methodology used by Nuveen in preparing the profitability data and a history of the adjustments to the methodology due to changes in the business over time. The Independent Board Members also reviewed the revenues, expenses, net income (pre-tax and after-tax) and revenue margin (pre-tax and post-tax) of the Adviser and, as described in further detail below, each affiliated sub-adviser for the 2014 calendar year. In reviewing the profitability data, the Independent Board Members noted the subjective nature of cost allocation methodologies used to determine profitability as other reasonable methods could also have been employed but yield different results. The Independent Board Members reviewed an analysis of the key drivers behind the changes in revenues and expenses that impacted profitability in 2014. The Independent Board Members recognized that Nuveen’s net revenue margin from advisory activities for 2014 was consistent with 2013. The Independent Board Members also considered the profitability of Nuveen in comparison to the adjusted operating margins of other investment advisers with publicly available data and with comparable assets under management (based on asset size and asset composition) to Nuveen. The Independent Board Members noted that Nuveen’s adjusted operating margins appeared to be reasonable in relation to such other advisers. The Independent Board Members, however, recognized the difficulty of making comparisons of profitability from fund investment advisory contracts as the information is not generally publicly available, the information for the investment advisers that was publicly available may not be representative of the industry and various other factors would impact the profitability data such as differences in services offered, business mix, expense methodology and allocations, capital structure and costs, complex size, and types of funds and other accounts managed.
The Independent Board Members noted this information supplemented the profitability information requested and received during the year and noted that two Independent Board Members served as point persons to review the profitability analysis and methodologies employed, and any changes thereto, and to keep the Board apprised of such changes during the year.
The Independent Board Members determined that Nuveen appeared to be sufficiently profitable to operate as a viable investment management firm and to honor its obligations as a sponsor of the Nuveen funds. The Independent Board Members noted the Adviser’s continued expenditures to upgrade its investment technology and increase personnel and recognized the Adviser’s continued commitment to its business to enhance the Adviser’s capacity and capabilities in providing the services necessary to meet the needs of the Nuveen funds as they grow or change over time. The Independent Board Members also noted that the sub-advisory fees for the Nuveen funds are paid by the Adviser, however, the Board recognized that many of the sub-advisers, including the Sub-Adviser, are affiliated with Nuveen. The Independent Board Members also noted the increased resources and support available to Nuveen as well as an improved capital structure as a result of the TIAA-CREF Transaction.
With respect to the Sub-Adviser, the Independent Board Members reviewed the Sub-Adviser’s revenues, expenses and revenue margins (pre- and post-tax) for its advisory activities for the calendar year ended December 31, 2014. The Independent Board Members also reviewed profitability analysis reflecting the revenues, expenses and the revenue margin (pre- and post-tax) by asset type for the Sub-Adviser for the calendar year ended December 31, 2014.
In evaluating the reasonableness of the compensation, the Independent Board Members also considered other amounts paid to a Fund Adviser by the Funds as well as indirect benefits (such as soft dollar arrangements), if any, the Fund Adviser and its affiliates received or were expected to receive that were directly attributable to the management of a Fund. See Section E below for additional information on indirect benefits a Fund Adviser may receive as a result of its relationship with the Funds.
Based on their review, the Independent Board Members determined that the Adviser’s and the Sub-Adviser’s level of profitability was reasonable in light of the respective services provided.
Annual Investment Management Agreement Approval Process (Unaudited) (continued)
D. Economies of Scale and Whether Fee Levels Reflect These Economies of Scale
The Independent Board Members recognized that, as the assets of a particular fund or the Nuveen complex in the aggregate increase over time, economies of scale may be realized, and the Independent Board Members considered the extent to which the funds benefit from such economies of scale. Although the Independent Board Members recognized that economies of scale are difficult to measure, the Board recognized that one method to help ensure the shareholders share in these benefits is to include breakpoints in the management fee schedule reducing fee rates as asset levels grow. The Independent Board Members noted that, subject to certain exceptions, the management fees of the funds in the Nuveen complex are generally comprised of a fund-level component and complex-level component. Each component of the management fee for each Fund included breakpoints to reduce management fee rates of the Fund as the Fund grows and, as described below, as the Nuveen complex grows. In addition to fund-specific breakpoint schedules which reduce the fee rates of a particular fund as its assets increase, the Independent Board Members recognized that the Adviser also passed on the benefits of economies of scale through the complex-wide fee arrangement which reduced management fee rates as assets in the fund complex reached certain levels. The complex-wide fee arrangement seeks to provide the benefits of economies of scale to fund shareholders when total fund complex assets increase, even if assets of a particular fund are unchanged or have decreased. The approach reflected the notion that some of Nuveen’s costs were attributable to services provided to all its funds in the complex, and therefore all funds benefit if these costs were spread over a larger asset base. The Independent Board Members reviewed the breakpoint and complex-wide schedules and the fee reductions achieved as a result of such structures for the 2014 calendar year.
The Independent Board Members also noted that additional economies of scale were shared with shareholders of the Funds through the adoption of temporary expense caps. The Independent Board Members further considered that as part of the TIAA-CREF Transaction, Nuveen agreed, for a period of two years from the date of the closing of the TIAA-CREF Transaction, not to increase contractual management fees for any Nuveen fund and, with respect to funds with expense caps, not to raise expense cap levels for such funds from levels in effect at that time or scheduled to go into effect prior to the closing of the TIAA-CREF Transaction. The commitment would not limit or otherwise affect mergers or liquidations of any funds in the ordinary course.
Based on their review, the Independent Board Members concluded that the current fee structure was acceptable and reflected economies of scale to be shared with shareholders when assets under management increase.
E. Indirect Benefits
The Independent Board Members received and considered information regarding potential “fall out” or ancillary benefits the respective Fund Adviser or its affiliates may receive as a result of its relationship with the Funds. In this regard, the Independent Board Members recognized that an affiliate of the Adviser served as the Funds’ principal underwriter and may receive compensation therefore from, among other things, sales charges, distribution fees and shareholder services fees (which included fees received pursuant to any 12b-1 plan). The Independent Board Members therefore took into account, among other things, the 12b-1 fees retained by Nuveen during the last calendar year.
In addition to the above, the Independent Board Members considered whether the Fund Adviser received any benefits from soft dollar arrangements whereby a portion of the commissions paid by a Fund for brokerage may be used to acquire research that may be useful to the Fund Adviser in managing the assets of the Fund and other clients. The Funds’ portfolio transactions are allocated by the Sub-Adviser. Accordingly, the Independent Board Members considered that the Sub-Adviser may benefit from research provided by broker-dealers executing portfolio transactions on behalf of the Funds. With respect to any fixed income securities, however, the Board recognized that such securities generally trade on a principal basis that does not generate soft dollar credits. Similarly, the Board recognized that any research received pursuant to soft dollar arrangements by the Sub-Adviser may also benefit the Funds and shareholders to the extent the research enhanced the ability of the Sub-Adviser to manage the Funds. The Independent Board Members noted that the Sub-Adviser’s profitability may be somewhat lower if it had to acquire any such research services directly.
Based on their review, the Independent Board Members concluded that any indirect benefits received by a Fund Adviser as a result of its relationship with the Funds were reasonable and within acceptable parameters.
F. Other Considerations
The Independent Board Members did not identify any single factor discussed previously as all-important or controlling. The Board Members, including the Independent Board Members, concluded that the terms of each Advisory Agreement were fair and reasonable, that the respective Fund Adviser’s fees were reasonable in light of the services provided to each Fund and that the Advisory Agreements be renewed.
Trustees
and Officers (Unaudited)
The management of the Funds, including general supervision of the duties performed for the Funds by the Adviser, is the responsibility of the Board of trustees of the Funds. The number of directors of the Funds is currently set at eleven. None of the trustees who are not “interested” persons of the Funds (referred to herein as “independent trustees”) has ever been a director or employee of, or consultant to, Nuveen or its affiliates. The names and business addresses of the trustees and officers of the Funds, their principal occupations and other affiliations during the past five years, the number of portfolios each oversees and other directorships they hold are set forth below.
The Funds’ Statement of Additional Information (“SAI”) includes more information about the trustees. To request a free copy, call Nuveen Investments at (800) 257-8787 or visit the Funds’ website at www.nuveen.com.
| | | | | | | | |
Name, Year of Birth & Address | | Position(s) Held with the Funds | | Year First Elected or Appointed (1) | | Principal Occupation(s) Including other Directorships During Past 5 Years | | Number of Portfolios in Fund Complex Overseen by Trustee |
| | | |
| Independent Trustee: | | | | |
William J. Schneider 1944 333 W. Wacker Drive Chicago, IL 60606 | | Chairman of the Board and Trustee | | 1996 | | Chairman of Miller-Valentine Partners, a real estate investment company; formerly, Senior Partner and Chief Operating Officer (retired 2004) of Miller-Valentine Group; owner in several other Miller-Valentine entities; Board Member of Med-America Health System, and WDPR Public Radio Station; formerly, member, Business Advisory Council, Cleveland Federal Reserve Bank and University of Dayton Business School Advisory Council. | | 194 |
Jack B. Evans 1948 333 W. Wacker Drive Chicago, IL 60606 | | Trustee | | 1999 | | President, The Hall-Perrine Foundation, a private philanthropic corporation (since 1996); Director and Chairman, United Fire Group, a publicly held company; formerly, President Pro-Tem of the Board of Regents for the State of Iowa University System; Director, Source Media Group; Life Trustee of Coe College; formerly, Director, Alliant Energy; formerly, Director, Federal Reserve Bank of Chicago; formerly, President and Chief Operating Officer, SCI Financial Group, Inc., a regional financial services firm. | | 194 |
William C. Hunter 1948 333 W. Wacker Drive Chicago, IL 60606 | | Trustee | | 2004 | | Dean Emeritus, formerly, Dean, Tippie College of Business, University of Iowa (2006-2012); Director (since 2004) of Xerox Corporation; Director (since 2005), and President (since 2012) Beta Gamma Sigma, Inc., The International Business Honor Society; Director of Wellmark, Inc. (since 2009); formerly, Dean and Distinguished Professor of Finance, School of Business at the University of Connecticut (2003-2006); previously, Senior Vice President and Director of Research at the Federal Reserve Bank of Chicago (1995-2003); formerly, Director (1997-2007), Credit Research Center at Georgetown University. | | 194 |
David J. Kundert 1942 333 W. Wacker Drive Chicago, IL 60606 | | Trustee | | 2005 | | Formerly, Director, Northwestern Mutual Wealth Management Company (2006-2013); retired (since 2004) as Chairman, JPMorgan Fleming Asset Management, President and CEO, Banc One Investment Advisors Corporation, and President, One Group Mutual Funds; prior thereto, Executive Vice President, Banc One Corporation and Chairman and CEO, Banc One Investment Management Group; Regent Emeritus, Member of Investment Committee, Luther College; member of the Wisconsin Bar Association; member of Board of Directors and Chair of Investment Committee, Greater Milwaukee Foundation; member of the Board of Directors (Milwaukee), College Possible. | | 194 |
Trustees and Officers (Unaudited) (continued)
| | | | | | | | |
Name, Year of Birth & Address | | Position(s) Held with the Funds | | Year First Elected or Appointed (1) | | Principal Occupation(s) Including other Directorships During Past 5 Years | | Number of Portfolios in Fund Complex Overseen by Trustee |
John K. Nelson 1962 333 West Wacker Drive Chicago, IL 60606 | | Trustee | | 2013 | | Member of Board of Directors of Core12 LLC (since 2008), a private firm which develops branding, marketing and communications strategies for clients; Director of The Curran Center for Catholic American Studies (since 2009) and The President’s Council, Fordham University (since 2010); formerly senior external advisor to the financial services practice of Deloitte Consulting LLP (2012-2014); formerly, Chairman of the Board of Trustees of Marian University (2010 as trustee, 2011-2014 as Chairman); formerly, Chief Executive Officer of ABN AMRO N.V. North America, and Global Head of its Financial Markets Division (2007-2008); prior senior positions held at ABN AMRO include Corporate Executive Vice President and Head of Global Markets—the Americas (2006-2007), CEO of Wholesale Banking—North America and Global Head of Foreign Exchange and Futures Markets (2001-2006), and Regional Commercial Treasurer and Senior Vice President Trading—North America (1996-2001); formerly, Trustee at St. Edmund Preparatory School in New York City. | | 194 |
Judith M. Stockdale 1947 333 W. Wacker Drive Chicago, IL 60606 | | Trustee | | 1997 | | Board Member, Land Trust Alliance (since 2013) and U.S. Endowment for Forestry and Communities (since 2013); formerly, Executive Director (1994-2012), Gaylord and Dorothy Donnelley Foundation; prior thereto, Executive Director, Great Lakes Protection Fund (1990-1994). | | 194 |
Carole E. Stone 1947 333 W. Wacker Drive Chicago, IL 60606 | | Trustee | | 2007 | | Director, Chicago Board Options Exchange (since 2006), C2 Options Exchange, Incorporated (since 2009) Director, CBOE Holdings, Inc. (since 2010); formerly, Commissioner, New York State Commission on Public Authority Reform (2005-2010). | | 194 |
Virginia L. Stringer 1944 333 W. Wacker Drive Chicago, IL 60606 | | Trustee | | 2011 | | Board Member, Mutual Fund Directors Forum; non-profit board member; former governance consultant; former Owner and President, Strategic Management Resources, Inc., a management consulting firm; former Member, Governing Board, Investment Company Institute’s Independent Directors Council; previously, held several executive positions in general management, marketing and human resources at IBM and The Pillsbury Company; Independent Director, First American Fund Complex (1987-2010) and Chair (1997-2010). | | 194 |
Terence J. Toth 1959 333 W. Wacker Drive Chicago, IL 60606 | | Trustee | | 2008 | | Managing Partner, Promus Capital (since 2008); Director, Fulcrum IT Service LLC (since 2010), Quality Control Corporation (since 2012) and LogicMark LLC (since 2012); formerly, Director, Legal & General Investment Management America, Inc. (2008-2013); formerly, CEO and President, Northern Trust Global Investments (2004-2007); Executive Vice President, Quantitative Management & Securities Lending (2000-2004); prior thereto, various positions with Northern Trust Company (since 1994); member: Chicago Fellowship Board (since 2005), Catalyst Schools of Chicago Board (since 2008) and Mather Foundation Board (since 2012), and a member of its investment committee; formerly, Member, Northern Trust Mutual Funds Board (2005-2007), Northern Trust Global Investments Board (2004-2007), Northern Trust Japan Board (2004-2007), Northern Trust Securities Inc. Board (2003-2007) and Northern Trust Hong Kong Board (1997-2004). | | 194 |
| | | | | | | | |
Name, Year of Birth & Address | | Position(s) Held with the Funds | | Year First Elected or Appointed (1) | | Principal Occupation(s) Including other Directorships During Past 5 Years | | Number of Portfolios in Fund Complex Overseen by Trustee |
| | | |
| Interested Trustee: | | | | |
William Adams IV(2) 1955 333 W. Wacker Drive Chicago, IL 60606 | | Trustee | | 2013 | | Senior Executive Vice President, Global Structured Products (since 2010); Co-President of Nuveen Fund Advisors, LLC (since 2011); Executive Vice President of Nuveen Securities, LLC; President (since 2011), formerly, Managing Director (2010-2011) of Nuveen Commodities Asset Management, LLC; Board Member of the Chicago Symphony Orchestra and of Gilda’s Club Chicago; formerly, Executive Vice President, U.S. Structured Products, of Nuveen Investments, Inc. (1999-2010). | | 194 |
Thomas S. Schreier, Jr.(2) 1962 333 W. Wacker Drive Chicago, IL 60606 | | Trustee | | 2013 | | Vice Chairman, Wealth Management of Nuveen Investments, Inc. (since 2011); Co-President of Nuveen Fund Advisors, LLC; Chairman of Nuveen Asset Management, LLC (since 2011); Co-Chief Executive Officer of Nuveen Securities, LLC (since 2011); Member of Board of Governors and Chairman’s Council of the Investment Company Institute; Director of Allina Health and a Member of its Finance, Audit and Investment Committees, formerly, Chief Executive Officer (2000-2010) and Chief Investment Officer (2007-2010) of FAF Advisors, Inc.; formerly, President of First American Funds (2001-2010). | | 194 |
| | | | | | | | |
Name,
Year of Birth & Address | | Position(s) Held with the Funds | | Year First Elected or Appointed (2) | | Principal Occupation(s) During Past 5 Years | | Number of Portfolios in Fund Complex Overseen by
Officer |
| | | |
| Officers of the Funds: | | | | |
Gifford R. Zimmerman 1956 333 W. Wacker Drive Chicago, IL 60606 | | Chief Administrative Officer | | 1988 | | Managing Director (since 2002), and Assistant Secretary of Nuveen Securities, LLC; Managing Director (since 2004) and Assistant Secretary (since 1994) of Nuveen Investments, Inc.; Managing Director (since 2002), Assistant Secretary (since 1997) and Co-General Counsel (since 2011) of Nuveen Fund Advisors, LLC; Managing Director, Assistant Secretary and Associate General Counsel of Nuveen Asset Management, LLC (since 2011); Managing Director and Assistant Secretary of Symphony Asset Management LLC (since 2003); Vice President and Assistant Secretary of NWQ Investment Management Company, LLC (since 2002), Nuveen Investments Advisers Inc. (since 2002), Santa Barbara Asset Management, LLC (since 2006) and of Winslow Capital Management, LLC, (since 2010); Vice President and Assistant Secretary (since 2013), formerly, Chief Administrative Officer and Chief Compliance Officer (2006-2013) of Nuveen Commodities Asset Management, LLC; Chartered Financial Analyst. | | 195 |
Margo L. Cook 1964 333 W. Wacker Drive Chicago, IL 60606 | | Vice President | | 2009 | | Senior Executive Vice President of Nuveen Investments, Inc.; Executive Vice President, Investment Services of Nuveen Fund Advisors, LLC (since 2011); Managing Director – Investment Services of Nuveen Commodities Asset Management, LLC (since 2011); Co-Chief Executive Officer (since 2015); previously, Executive Vice President (2013-2015) of Nuveen Securities, LLC; Chartered Financial Analyst. | | 195 |
Lorna C. Ferguson 1945 333 W. Wacker Drive Chicago, IL 60606 | | Vice President | | 1998 | | Managing Director (since 2005) of Nuveen Fund Advisors, LLC and Nuveen Securities, LLC (since 2004). | | 195 |
Trustees and Officers (Unaudited) (continued)
| | | | | | | | |
Name,
Year of Birth & Address | | Position(s) Held with the Funds | | Year First Elected or Appointed (2) | | Principal Occupation(s) During Past 5 Years | | Number of Portfolios in Fund Complex Overseen by
Officer |
Stephen D. Foy 1954 333 W. Wacker Drive Chicago, IL 60606 | | Vice President and Controller | | 1998 | | Managing Director (since 2014), formerly, Senior Vice President (2013-2014) and Vice President (2005-2013) of Nuveen Fund Advisors, LLC; Chief Financial Officer of Nuveen Commodities Asset Management, LLC (since 2010); Certified Public Accountant. | | 195 |
Sherri A. Hlavacek 1962 333 W. Wacker Drive Chicago, IL 60606 | | Vice President and Treasurer | | 2015 | | Managing Director and Controller of Nuveen Fund Advisors, LLC and Nuveen Commodities Asset Management, LLC; Managing Director, Treasurer and Controller of Nuveen Asset Management, LLC; Managing Director, Treasurer and Corporate Controller of Nuveen Investments, Inc., Nuveen Investments Advisers Inc. and Nuveen Investments Holdings, Inc.; Managing Director, Chief Financial Officer and Corporate Controller of Nuveen Securities, LLC; Vice President, Controller and Treasurer of NWQ Investment Management Company, LLC, Santa Barbara Asset Management, LLC , Tradewinds Global Investors, LLC, Symphony Asset Management LLC and Winslow Capital Management, LLC; Certified Public Accountant. | | 195 |
Walter M. Kelly 1970 333 W. Wacker Drive Chicago, IL 60606 | | Chief Compliance Officer and Vice President | | 2003 | | Senior Vice President (since 2008) of Nuveen Investments Holdings, Inc. | | 195 |
Tina M. Lazar 1961 333 W. Wacker Drive Chicago, IL 60606 | | Vice President | | 2002 | | Senior Vice President of Nuveen Investments Holdings, Inc. and Nuveen Securities, LLC | | 195 |
Kevin J. McCarthy 1966 333 W. Wacker Drive Chicago, IL 60606 | | Vice President and Secretary | | 2007 | | Managing Director and Assistant Secretary (since 2008), Nuveen Securities, LLC; Managing Director (since 2008), Assistant Secretary (since 2007) and Co-General Counsel (since 2011) of Nuveen Fund Advisors, LLC; Managing Director, Assistant Secretary and Associate General Counsel (since 2011) of Nuveen Asset Management, LLC; Managing Director and Assistant Secretary, Nuveen Investments, Inc.; Vice President (since 2007) and Assistant Secretary of Nuveen Investments Advisers Inc., NWQ Investment Management Company, LLC, Tradewinds Global Investors LLC, Symphony Asset Management LLC, Santa Barbara Asset Management, LLC, and of Winslow Capital Management, LLC. (since 2010); Vice President and Secretary (since 2010) of Nuveen Commodities Asset Management, LLC. | | 195 |
Kathleen L. Prudhomme 1953 901 Marquette Avenue Minneapolis, MN 55402 | | Vice President and Assistant Secretary | | 2011 | | Managing Director, Assistant Secretary and Co-General Counsel (since 2011) of Nuveen Fund Advisors, LLC; Managing Director, Assistant Secretary and Associate General Counsel (since 2011) of Nuveen Asset Management, LLC; Managing Director and Assistant Secretary (since 2011) of Nuveen Securities, LLC; formerly, Deputy General Counsel, FAF Advisors, Inc. (2004-2010). | | 195 |
Joel T. Slager 1978 333 West Wacker Drive Chicago, IL 60606 | | Vice President and Assistant Secretary | | 2013 | | Fund Tax Director for Nuveen Funds (since 2013); previously, Vice President of Morgan Stanley Investment Management, Inc., Assistant Treasurer of the Morgan Stanley Funds (from 2010 to 2013). | | 195 |
| | | | | | | | |
Name,
Year of Birth & Address | | Position(s) Held with the Funds | | Year First Elected or Appointed (2) | | Principal Occupation(s) During Past 5 Years | | Number of Portfolios in Fund Complex Overseen by
Officer |
Jeffery M. Wilson 1956 333 West Wacker Drive Chicago, IL 60606 | | Vice President | | 2011 | | Senior Vice President of Nuveen Securities, LLC (since 2011); formerly, Senior Vice President of FAF Advisors, Inc. (2000-2010). | | 107 |
| (1) | Trustees serve an indefinite term until his/her successor is elected or appointed. The year first elected or appointed represents the year in which the trustee was first elected or appointed to any fund in the Nuveen Fund Complex. |
| (2) | Officers serve one year terms through August of each year. The year first elected or appointed represents the year in which the officer was first elected or appointed to any fund in the Nuveen Fund Complex. |
Notes
Notes
| | | | | | | | | | | | | | |
| | | | | | | | |
| | | | |
| | | | | | | | |
| | | | | |
| | Nuveen Investments: | | | | | | | | |
| | | | Serving Investors for Generations | | | | |
| | |
| | | | |
| | | |
| | | | Since 1898, financial advisors and their clients have relied on Nuveen Investments to provide dependable investment solutions through continued adherence to proven, long-term investing principles. Today, we offer a range of high quality equity and fixed-income solutions designed to be integral components of a well-diversified core portfolio. | | |
| | | |
| | | | | | |
| | | | |
| | | | | | Focused on meeting investor needs. Nuveen Investments provides high-quality investment services designed to help secure the longterm goals of institutional and individual investors as well as the consultants and financial advisors who serve them. Nuveen Investments markets a wide range of specialized investment solutions which provide investors access to capabilities of its high-quality boutique investment affiliates-Nuveen Asset Management, Symphony Asset Management, NWQ Investment Management Company, Santa Barbara Asset Management, Tradewinds Global Investors, Winslow Capital Management, and Gresham Investment Management. In total, Nuveen Investments managed $230 billion as of June 30, 2015. | | |
| | | | | |
| | | | | | | | | | |
| | | | | | Find out how we can help you. To learn more about how the products and services of Nuveen Investments may be able to help you meet your financial goals, talk to your financial advisor, or call us at (800) 257-8787. Please read the information provided carefully before you invest. Investors should consider the investment objective and policies, risk considerations, charges and expenses of any investment carefully. Where applicable, be sure to obtain a prospectus, which contains this and other relevant information. To obtain a prospectus, please contact your securities representative or Nuveen Investments, 333 W. Wacker Dr., Chicago, IL 60606. Please read the prospectus carefully before you invest or send money. Learn more about Nuveen Funds at: www.nuveen.com/mf | | |
| | | | | | |
| | | | | | | | | | | | |
| | Distributed by Nuveen Securities, LLC | 333 West Wacker Drive Chicago, IL 60606 | www.nuveen.com |
MAN-FINC-0615D 9998-INV-Y-08/16
| | |
| | |  |
| Mutual Funds | |
| | | | | | |
| | | | | | | Annual Report June 30, 2015 |
| | | | | | | | | | | | | | | | |
| | | | | | | Share Class / Ticker Symbol |
| | | Fund Name | | | | Class A | | Class C | | Class R3 | | Class R6 | | Class I | | |
|
| | Nuveen Global Total Return Bond Fund | | | | NGTAX | | NGTCX | | NGTRX | | — | | NGTIX | | |
| | Nuveen High Income Bond Fund | | | | FJSIX | | FCSIX | | FANSX | | — | | FJSYX | | |
| | Nuveen Strategic Income Fund | | | | FCDDX | | FCBCX | | FABSX | | FSFRX | | FCBYX | | |
| | Nuveen U.S. Infrastructure Bond Fund | | | | NUSNX | | NUSCX | | — | | — | | NUSIX | | |
| | | | | | | | | | | | |
| | | | | | |
| | | | |
| | | | | | | | |
| | |
| | Life is Complex. | | |
| | |
| | Nuveen makes things e-simple. | | |
| | |
| | It only takes a minute to sign up for e-Reports. Once enrolled, you’ll receive an e-mail as soon as your Nuveen Fund information is ready. No more waiting for delivery by regular mail. Just click on the link within the e-mail to see the report and save it on your computer if you wish. | | |
| | | | |
| | | | | | Free e-Reports right to your e-mail! | | |
| | | |
| | | | | | www.investordelivery.com If you receive your Nuveen Fund distributions and statements from your
financial advisor or brokerage account. |
| | | | |
| | | | or | | www.nuveen.com/accountaccess If you receive your Nuveen Fund distributions and statements directly from Nuveen. Must be preceded by or accompanied by a prospectus. NOT FDIC INSURED MAY LOSE VALUE
NO BANK GUARANTEE | | |
| | | | | | | | | | |
| | | | | | | | | | | | | |

Table
of Contents
Chairman’s Letter
to Shareholders

Dear Shareholders,
For better or for worse, the financial markets have spent the past year waiting for the U.S. Federal Reserve (Fed) to end its ultra-loose monetary policy. The policy has propped up stock and bond markets since the Great Recession, but the question remains: how will markets behave without its influence? This uncertainty has been a considerable source of volatility for stock and bond prices lately, despite the Fed carefully conveying its intention to raise rates slowly and only when the economy shows evidence of readiness.
A large consensus expects at least one rate hike before the end of 2015. After all, the U.S. has reached “full employment” by the Fed’s standards and growth has resumed – albeit unevenly. But the picture is somewhat muddled. Inflation has remained stubbornly low, most recently weighed down by an unexpectedly sharp decline in commodity prices since mid-2014. With the Fed poised to tighten and foreign central banks easing, the U.S. dollar has surged against other currencies, which has weighed on corporate earnings and further contributed to commodity price weakness. U.S. consumers have benefited from an improved labor market and lower prices at the gas pump, but the overall pace of economic expansion has been lackluster.
Nevertheless, the global recovery continues to be led by the U.S. Policy makers around the world are deploying their available tools to try to bolster Europe and Japan’s fragile growth, and manage China’s slowdown. Contagion fears ebb and flow with the headlines about Greece and China. Greece reluctantly agreed to a third bailout package from the European Union in July and China’s central bank and government intervened aggressively to try to stem the sell-off in stock prices. But persistent structural problems in these economies will continue to garner market attention.
Wall Street is fond of saying “markets don’t like uncertainty,” and asset prices are likely to continue to churn in the current macro environment. In times like these, you can look to a professional investment manager with the experience and discipline to maintain the proper perspective on short-term events. And if the daily headlines do concern you, I encourage you to reach out to your financial advisor. Your financial advisor can help you evaluate your investment strategies in light of current events, your time horizon and risk tolerance. On behalf of the other members of the Nuveen Fund Board, we look forward to continuing to earn your trust in the months and years ahead.
Sincerely,

William J. Schneider
Chairman of the Board
August 24, 2015
Portfolio Managers’
Comments
Nuveen Global Total Return Bond Fund
Nuveen High Income Bond Fund
Nuveen Strategic Income Fund
Nuveen U.S. Infrastructure Bond Fund
These Funds feature portfolio management by Nuveen Asset Management, LLC, an affiliate of Nuveen Investments, Inc. In this report, the various portfolio management teams for the Funds discuss economic and fixed income market conditions, key investment strategies and the Funds’ performance for the twelve-month reporting period ended June 30, 2015. These management teams include:
Nuveen Global Total Return Bond Fund
Timothy A. Palmer, CFA, and Steve S. Lee, CFA, have managed the Fund since its inception in 2011.
Nuveen High Income Bond Fund
John T. Fruit, CFA, has managed the Fund since 2006. Jeffrey T. Schmitz, CFA, has been part of the management team for the Fund since 2008.
Nuveen Strategic Income Fund
Timothy A. Palmer, CFA, has been the lead manager of the Fund since 2005. Jeffrey J. Ebert has been on the management team since 2000. Marie A. Newcome, CFA, joined the Fund as a co-portfolio manager in 2011.
Nuveen U.S. Infrastructure Bond Fund
Daniel J. Close, CFA, Jeffrey J. Ebert and Jeffrey T. Schmitz, CFA, have managed the Fund since its inception on May 12, 2014.
Effective February 28, 2015, the Nuveen U.S. Infrastructure Income Fund changed its name to the Nuveen U.S. Infrastructure Bond Fund. There were no changes to the Fund’s investment objective or strategy.
What factors affected the U.S. economy and domestic and global markets during the twelve-month reporting period ended June 30, 2015?
During this reporting period, the U.S. economy continued to expand at a moderate pace. The Federal Reserve (Fed) maintained efforts to bolster growth and promote progress toward its mandates of maximum employment and price stability by holding the benchmark fed funds rate at the record low level of zero to 0.25% that it established in December 2008. At its October 2014 meeting, the Fed announced that it would end its bond buying stimulus program as of November 1, 2014, after tapering its monthly asset purchases of mortgage-backed and longer-term Treasury securities from the original $85 billion per month to $15 billion per month over the course of seven consecutive meetings (December 2013 through September 2014). In making the announcement, the Fed cited substantial improvement in the outlook for the labor market since the inception of the current asset purchase program as well as sufficient underlying strength in the broader economy to support ongoing progress toward maximum employment in a context of
Certain statements in this report are forward-looking statements. Discussions of specific investments are for illustration only and are not intended as recommendations of individual investments. The forward-looking statements and other views expressed herein are those of the portfolio managers as of the date of this report. Actual future results or occurrences may differ significantly from those anticipated in any forward-looking statements and the views expressed herein are subject to change at any time, due to numerous market and other factors. The Funds disclaim any obligation to update publicly or revise any forward-looking statements or views expressed herein.
Ratings shown are the highest rating given by one of the following national rating agencies: Standard & Poor’s (S&P), Moody’s Investors Service, Inc. (Moody’s) or Fitch, Inc. (Fitch). Credit ratings are subject to change. AAA, AA, A and BBB are investment grade ratings; BB, B, CCC, CC, C and D are below investment grade ratings. Certain bonds backed by U.S. Government or agency securities are regarded as having an implied rating equal to the rating of such securities. Holdings designated N/R are not rated by these national rating agencies.
Refer to the Glossary of Terms Used in this Report for further definition of the terms used within this section.
Portfolio Managers’ Comments (continued)
price stability. The Fed also reiterated that it would continue to look at a wide range of factors, including labor market conditions, indicators of inflationary pressures and readings on financial developments, in determining future actions. Additionally, the Fed stated that it would likely maintain the current target range for the fed funds rate for a considerable time after the end of the asset purchase program, especially if projected inflation continues to run below the Fed’s 2% longer run goal. However, if economic data shows faster progress, the Fed indicated that it could raise the fed funds rate sooner than expected.
The Fed changed its language slightly in December, indicating it would be “patient” in normalizing monetary policy. This shift helped ease investors’ worries that the Fed might raise rates too soon. However, as employment data released early in the year continued to look strong, anticipation began building that the Fed could raise its main policy rate as soon as June. As widely expected, after its March meeting, the Fed eliminated “patient” from its statement but also highlighted the policy makers’ less optimistic view of the economy’s overall health as well as downgraded their inflation projections. The Fed’s April meeting seemed to further signal that a June rate hike was off the table. While the Fed attributed the first quarter’s economic weakness to temporary factors, the meeting minutes from April revealed that many Committee members believed the economic data available in June would be insufficient to meet the Fed’s criteria for initiating a rate increase. The June meeting bore out that presumption, and the Fed decided to keep the target rate near zero. But the Committee also continued to telegraph the likelihood of at least one rate increase in 2015, which many analysts forecasted for September.
According to the government’s advanced estimate, the U.S. economy increased at a 2.3% annualized rate in the second quarter of 2015, as measured by GDP, compared with a decrease of 0.6% in the first quarter of 2015 and increases of 5.0% in the third quarter 2014 and 2.2% in the fourth quarter 2014. The increase in real GDP growth rate from the first quarter of 2015 to the second quarter of 2015 primarily reflects positive contributions from personal consumption expenditures (PCE), exports, state and local government spending, and residential fixed investment that were partly offset by negative contributions from federal government spending, private inventory investment and non-residential fixed investment. The Consumer Price Index (CPI), rose 0.1% year-over-year as of June 2015. The core CPI (which excludes food and energy) increased 1.8% during the same period, below the Fed’s unofficial longer term inflation objective of 2.0%. As of June 2015, the U.S. unemployment rate was 5.3%, a level not seen since mid-2008. This figure is also considered “full employment” by some Fed officials. The housing market continued to post consistent gains as of its most recent reading in May 2015. The average home price in the S&P/Case-Shiller Index of 20 major metropolitan areas rose 4.9% for the twelve months ended May 2015 (most recent data available at the time this report was prepared).
A number of challenges weighed on global economies and financial markets during the reporting period, as oil price moves drove large swings in market sentiment. Additionally concerns around the pace of domestic and global economic growth, continued signs of weakness out of China, Greece’s continuing debt crisis, a strengthening dollar and geopolitical concerns emanating from the Middle East appeared to further provoke economic and market uncertainty. Central banks around the globe began to loosen their monetary policies in an effort to pump additional liquidity into their economies, while at the same time the U.S. Fed began to taper. For the reporting period, U.S. equity markets posted generally positive returns as investor appetite for risk returned to the market and risk aversion appeared to subside. However, while broad market performance was admirable for the reporting period, it came with fairly significant volatility.
Likewise, U.S. interest rates were volatile in response to changes in monetary policy and global capital flows, with yields on the benchmark 10-year Treasury fluctuating in a broad range during the year with no sustained trend. Yields moved higher in mid-2014, then declined significantly as concerns about global economic weakness captured the spotlight. Yields hit a low point in early February before rising again, then settling into a trading range by the end of June. The U.S. Treasury yield curve flattened significantly as yields on long Treasuries dropped, while yields in the short to intermediate section of the curve rose modestly as investors anticipated a Fed tightening in mid-2015. However, disappointing U.S. economic data in early 2015 pushed out expectations for a lift-off in the fed funds rate and the yield curve steepened again somewhat.
The environment over much of the reporting period proved to be challenging for the riskier areas of the bond market with corporate bonds, particularly in the high-yield area, falling short of Treasuries and the broader bond market. High yield bonds from energy and commodity-related issuers exhibited significant volatility, particularly in the final months of 2014, as the sharp drop in oil prices and uncertainty about base commodity prices affected these sectors. Bonds from these issuers partially recovered later in the reporting period as prices for oil and other commodities gained back some of their lost ground. Generally speaking, higher yielding bonds
outperformed in the reporting period’s latter months because they were better able to absorb the impact of rising rates versus sectors with less income.
How did the Funds perform during the twelve-month reporting period ended June 30, 2015?
The tables in the Fund Performance and Expense Ratios section of this report provide total return performance information for the one-year, five-year, ten-year and/or since inception periods ended June 30, 2015. Each Fund’s Class A Share total returns at net asset value (NAV) are compared with the performance of the appropriate Barclays Index and Lipper classification average. A more detailed account of each Fund’s performance is provided later in this report.
What strategies were used to manage the Funds during the twelve-month reporting period and how did these strategies influence performance?
All of the Funds continued to employ the same fundamental investment strategies and tactics used previously, although implementation of those strategies depended on the individual characteristics of the portfolios, as well as market conditions. The Funds’ management teams use a highly collaborative, research-driven approach that we believe offers the best opportunity to achieve consistent, superior long-term performance on a risk-adjusted basis across the full range of market environments. During the reporting period, the Funds were generally positioned for an environment of continued moderate economic growth and improving financial conditions. Nonetheless, during the reporting period we made smaller scaled shifts on an ongoing basis that were geared toward improving each Fund’s profile in response to changing conditions and valuations. These strategic moves are discussed in more detail within each Fund’s section of this report.
Nuveen Global Total Return Bond Fund
The Fund’s Class A Shares at NAV underperformed the Barclays Global Aggregate Unhedged Bond Index and the Lipper Global Income Funds Classification Average for the twelve-month reporting period. Global economies struggled to deal with a number of challenges in the first half of the reporting period, including disappointing economic growth levels, a dramatic drop in commodity prices and ongoing geopolitical unrest. While the Fed was in the process of tapering its quantitative easing program in the U.S. in late 2014, central banks outside of the U.S. began to incorporate more accommodative policies in an effort to pump additional liquidity into their economies. U.S. bond yields changed little over the reporting period, but at times were quite volatile in response to changes in monetary policy and global capital flows. The shape of the U.S. Treasury curve was also volatile with the yield curve flattening dramatically in late 2014 as yields on long Treasuries plunged, while yields on short to intermediate maturities rose modestly in response to investors pulling forward the timing of Fed tightening into mid-2015. Subsequently, weak U.S. economic data in early 2015 caused the market to view a mid-year tightening as unlikely and the yield curve flattening that occurred in late 2014 partially reversed course.
Across global markets, the most important development during the reporting period was the active intervention of central banks in an effort to spur economic growth. The European Central Bank (ECB) launched its large-scale quantitative easing (QE) program in 2015 and other central banks announced widespread policy accommodation. Prior to those moves, global interest rates fell sharply in the wake of declining inflation, continued policy easing and sluggish growth. Developed market long-term yields fell through the end of 2014 and foreign markets generally outperformed U.S. Treasuries. This trend continued in the opening months of 2015, but global interest rates shot higher in the closing months of the reporting period. That resulted in weaker performance for global bonds in the second quarter of 2015. While the dollar gained against major currencies for most of the reporting period, the trend reversed course in the closing months.
Emerging market (EM) debt was negatively affected by falling commodity prices, weaker growth, fears of looming Fed rate action, geopolitical risk and investor outflows in the first half of the reporting period. The economic environment stabilized somewhat in the early part of 2015, as did commodity prices. Improvement in the economies of the U.S. and other developed nations in 2015 also provided a boost for EM debt. During the reporting period however, EM debt markets across most regions were hard hit with the exception of Asia.
The dollar rallied strongly in the second half of 2014 thanks to the relative strength of the U.S. economy compared to other developed markets and the Fed’s tapering of its quantitative easing program. Hardest hit were the Japanese yen and currencies of
Portfolio Managers’ Comments (continued)
oil-producing countries. The dollar maintained its strength in the first quarter of 2015 as growing discord created by the Greek debt crisis continued to be a challenge. However, the dollar gave back some of its gains in the reporting period’s final months amid improvement in global economies.
For virtually all of the reporting period, investors favored higher quality sectors of the market, while corporate bonds, particularly in the high yield area, underperformed the broader bond market. Energy and commodity related issuers sustained significant volatility in the high yield market as uncertainty about base commodity prices affected these sectors. The sharpest drops occurred in the closing months of 2014 as oil prices declined dramatically. Energy and commodity issuers performed better in the final months of the reporting period when commodity prices recovered some of the ground lost in 2014. As concerns about risks to the global economy rose, investors appeared to move away from the riskier parts of the bond market. Within investment grade credit, BBB rated bonds suffered versus higher rated peers. In the high yield bond segment, BB rated bonds outperformed lower quality B rated and CCC rated bonds for much of the past year. However, as interest rates began to increase, high yield bonds were better positioned to absorb the impact of rising rates than sectors with less income. In the final months of the reporting period, investors’ risk appetite appeared to improve. High yield bonds subsequently outperformed investment grade corporates and Treasury bonds, while the lower quality sectors of the high yield market also performed better.
Investment grade bonds generally fared better than high yield bonds for much of the reporting period, although their returns continued to lag those of Treasury bonds. The corporate market weakened in late 2014 due to a heavy new issue calendar and growing risk aversion by investors. Spreads between corporate bonds and Treasuries reached their widest points near the end of 2014. Spreads narrowed a bit early in 2015 before widening again in the closing months of the reporting period. Increasing investor worries about Greece’s ongoing debt crisis and the risk of a disorderly Greek exit from the European Monetary Union fueled investor worries. Investment grade corporates ended the reporting period with a very weak performance in the second quarter. Despite uncertainty in European markets from the Greek situation and strained lending conditions, European and non-U.S. corporates outperformed their U.S. counterparts, driven significantly by the ECB’s adoption of an expansive QE monetary policy early in 2015 and its positive implications for credit conditions.
Among the securitized sectors of the bond market in the U.S., mortgage-backed securities (MBS) struggled to keep pace with Treasuries for much of the year due to higher volatility and concerns about the Fed normalizing policy. For much of the reporting period, commercial mortgage-backed securities (CMBS) benefited from improving commercial real estate fundamentals and relative immunity to energy-related spread volatility. However, late in the reporting period, CMBS spreads widened due to increased supply, ongoing concerns about loan origination quality and wider corporate spreads.
During the first six months of the reporting period, the Fund benefited from its significant overweighting to the U.S. dollar, particularly versus major developed currencies such as the euro and yen. Although the dollar’s rally was broad-based during this time, the Fund’s relative positioning across other currencies also produced positive selection effects as currency performance varied. Notable selection gains were from the Mexican peso, Brazilian real, Indian rupee and British pound. During this same time frame, the largest detractors to the Fund’s relative return were its overweight exposures to both the high yield corporate and EM corporate sectors. Both suffered in large part due to sluggish global growth and concerns regarding the decline in oil and other commodity prices. EM credit was further pressured by uncertainty regarding the outlook for Fed policy. Additionally, the investment grade corporate sector detracted modestly from performance in the first half of the reporting period due to our issue selection and lower quality bias. While our financial exposure helped investment returns as the segment outperformed other corporates and posted positive excess returns, this was not sufficient to counteract the declines in our BBB rated, basic industries and energy positions. A defensive duration strategy, which lessens the Fund’s sensitivity to interest rates, also limited returns at a time when global rates were declining, although we partially offset that with successful positioning around the reshaping of global yield curves.
In the second half of the reporting period, currency exposures took a toll on relative performance. As the strong U.S. dollar rally continued, our U.S. dollar weight was not enough to overcome periods of underperformance from other currencies held in the Fund. Our underweight in the euro and overweight in the Mexican peso performed poorly as the sharp sell-off in developed bond markets drove position liquidation and generally weaker EM currencies. However, our underweight in the yen contributed favorably to the Fund’s relative performance. Late in the reporting period, an overweight position in investment grade credit was also a detriment to the Fund’s performance as that sector posted negative excess returns. However, our favorable issue selection and overweight to financials within the investment grade segment offset some of the negative impact. In contrast, our holdings in the high yield
corporate and EM corporate sectors benefited the Fund’s relative return in the reporting period’s second half. The incremental income generated by holdings in the high yield corporate sector helped these securities to better weather the rise in Treasury yields. Dollar-denominated EM bonds also significantly added to returns as that sector performed particularly well in the closing months of the reporting period. Our defensive global duration positioning, which was a negative factor for much of the reporting period, began to work in the Fund’s favor in the second quarter of 2015.
The Fund’s key sector themes continued to focus on our positioning in favor of credit sectors with corresponding underweights to mortgage and government securities. Despite continued market volatility and market concerns regarding sluggish economic growth, we continued to believe these sectors would benefit from strong credit fundamentals. Credit sectors remain attractive, compensating for both credit risk and near-term volatility. Any shifts made in credit selection were based on market opportunities and research ideas. We marginally decreased the Fund’s exposure to investment grade credit toward the end of the reporting period, focusing greater emphasis on local market government bonds. Within our corporate portfolio, we continued to favor financials given their attractive valuations and strong liquidity, leverage and capital positions. Consistent with this favorable view of financials and our theme of utilizing diversified income sources, we increased the Fund’s weighting in preferred securities slightly. We continued to closely monitor the Fund’s exposure to the volatile energy sector as we seek to determine where attractive opportunities may present themselves or if existing positions should be scaled back.
In the final months of the reporting period, we decreased the Fund’s U.S. dollar exposure to neutral and focused more on currency selection as the momentum for the U.S. dollar waned. The Fund’s currency positions shifted modestly, depending on fundamental developments and valuation shifts. We tactically reduced the Fund’s yen underweight, but increased the size of its euro underweight. We reduced the Fund’s exposure to commodity currencies such as the Australian dollar and the South African rand, but increased its exposure to the British pound. We also took gains in peripheral European bonds and reduced positions in the U.K. as the ECB’s sovereign bond purchases drove rates lower. We increased exposure to German bunds, anticipating that they will perform well given still-muted inflation expectations.
Our global duration exposure remained modestly defensive in light of the persistent low interest rate environment and our view that interest rate risk is asymmetrically skewed toward higher yields, particularly in the U.S. However, we have not taken a more defensive posture given the still muted inflation risk globally and significant remaining economic slack. Additionally, the outlook for continued high levels of accommodation from major central banks (even as the Fed shifts) will be supportive of global liquidity. These factors will likely keep any upturn in interest rates modest. While the Fund remained positioned for a flatter yield curve, we made tactical adjustments to our implementation of this view based on valuation changes and policy developments in major markets. We continue to expect a flattening of the U.S. yield curve as the Fed heads toward moving the fed funds rate off of zero.
During the reporting period, we also continued to utilize various derivative instruments. We used foreign currency exchange contracts to gain exposure to selected foreign currencies, as well as in some cases to hedge the currency risk present in a foreign bond. The overall effect of the foreign currency exchange contracts was positive as the majority of the positions were used for hedging purposes during the reporting period as the U.S. dollar rallied.
We sold U.S. Treasury futures and Euro dollar futures as part of an overall portfolio construction strategy to manage portfolio duration and yield curve exposure and purchased selected foreign bond futures to actively manage exposure to those markets. The effect of these activities was slightly negative.
We used interest rate swaps as part of an overall portfolio interest rate strategy. For example, we used swaps in which the Fund pays a fixed rate of interest in exchange for a floating rate in anticipation of rising interest rates. The effect of these contracts on the Fund’s performance was slightly negative during the reporting period.
We used credit default swaps to take on credit risk and earn a commensurate credit spread. The Fund no longer held these swap contracts at period end. The effect of these swap positions on performance was negligible during the reporting period, as the positions were minimal. These derivative exposures are integrated with the overall portfolio construction and as such a portion of losses and gains may be naturally related to and/or may offset impacts elsewhere in the portfolio.
Portfolio Managers’ Comments (continued)
Nuveen High Income Bond Fund
The Fund’s Class A Shares at NAV underperformed both the Barclays High Yield 2% Issuer Capped Index and the Lipper High Current Yield Funds Classification Average for the twelve-month reporting period. During the closing months of 2014, the high yield market faced a challenging environment sparked by a confluence of factors. These included an abundant supply of high-yield bonds in an environment of declining demand for risk-oriented assets, weakness in the equities market, a decline in oil prices that affected high yield issuers in the prominent energy sector and renewed concerns that interest rates were headed higher. Early in 2015, bond yields declined amid signs of economic weakness, while at the same time, oil prices partially rebounded. Those factors helped high yield bonds recover some of the losses from earlier months.
Interest rates trended higher from mid-2014 to the end of the year, then retreated in the early weeks of 2015 before moving up again and operating in a trading range by mid-summer. Much of the focus was on the Fed and its intentions in managing short-term interest rates. The Fed made clear indications that rate hikes (the first since 2006) are to be expected yet in 2015, but that the extent of its actions will likely be driven by the economy. Anticipation of rate hikes had an impact on the various segments of the bond market throughout most of the past year. The Treasury yield curve steepened in the later months of the reporting period due to deteriorating market technicals and stretched valuations. The yield on the benchmark 10-year Treasury rose 80 basis points in the first half of 2015 with short-term rates showing less fluctuation. The high yield market was able to absorb most of the impact as spreads moved only marginally higher to 514 basis points over Treasuries by the end of the reporting period.
The primary factor affecting the high yield bond market and the performance of the Fund for much of the year was the fluctuation in oil prices. More than 13% of common high yield indexes consist of credits exposed to oil, more so than any other market. As prices declined during the closing months of 2014 from $100 per barrel to $55 per barrel (WTI crude), the energy segment significantly lagged the broader high yield market. The energy sub-sectors of exploration and production (E&P) and oil field services suffered even greater declines in the final months of 2014. However, in early 2015, a modest recovery in oil prices helped oil-related bonds make up a portion of that lost ground. The Fund’s main detractor during the reporting period was its energy exposure, particularly an overweight to the oil field services sub-sector where we were unable to avoid a number of price declines. The commodities area was another sector that saw negative movement, which was a byproduct of a downgrade in growth expectations for China (a major consumer of commodity products) and an oversupply of bonds from commodity issuers. The metals and mining index ended the period trading at 15-year high spreads in comparison to the broader high yield market. While the Fund was mostly void of exposure to iron ore, certain coal and base metal-related credits remained weak and detracted from performance.
Performance based on issuer quality was distinguished by two fairly different periods. In the first half of the reporting period, higher quality credits significantly outperformed lower quality credits within the high yield sector. Bonds rated BB were down modestly while B rated and CCC rated bonds suffered more significant losses. This reflected a general desire among investors to avoid risk during the closing months of 2014 as economic questions mounted. As a result, yield spreads between BB rated bonds and the lower rated B and CCC issuers reached their highest levels since the financial crisis of 2008. This had a negative impact on the Fund as we held modest overweights in lower quality credits, while maintaining an underweight position in BB rated bonds. However, by March 2015, a reversal in the “flight-to-quality” occurred. Lower quality issues began to perform better and generated higher returns in the closing months of the period. Investors appeared to be concerned that higher BB rated bonds would be more sensitive to an upturn in interest rates that began to occur in 2015. The late turnaround in performance for lower quality credits helped the Fund make up some of the lost ground from earlier in the period.
The Fund’s overweight exposure to European high yield bonds was a modest detractor to its comparative performance. The Barclays Pan-European High Yield Sub-index declined 14.83% dramatically underperforming the rest of the high yield market. Bank issues in particular were hard hit over most of the period due to concerns about some of the asset quality reviews and stress tests being performed within the eurozone. Many of the banks will also soon be subject to new and additional capital adequacy ratios, along with other various regulatory and depositor protection requirements. Even though banks are required to set aside reserves for fines and litigation expenses, we believe these will not present problems for bond issuers over the long term, and in fact, European holdings performed better in the closing months of the reporting period.
Emerging market (EM) corporate securities were also down for the year with the Barclays Emerging Markets (EM) USD Aggregate Bond Index returning -3.49%. Concerns ranging from slower growth, exposure to lower commodity prices, weak currencies and certain corporate governance issues in China and Brazil continued to weigh on the market. Although small in nature, price declines
witnessed in some of the Fund’s holdings from Brazil were a net negative to performance. We remained generally more cautious about EM credit due to geopolitical risk in various spots around the globe, combined with slower growth rates in dominant EM countries such as China and Brazil. Therefore, we pared back the Fund’s EM exposure during the reporting period.
On the plus side, the Fund’s exposures to consumer cyclical areas such as autos, building materials and restaurants were positive contributors to performance during the reporting period.
The fundamentals of the high yield bond market continue to appear to be strong outside of the energy and commodities sectors. Default rates were well contained over the reporting period. Lackluster economic growth has resulted in subdued earnings for a number of high yield bond issuers, but new issue volume has declined year-to-date in 2015 and quality has improved. The majority of defaults so far in 2015 have come from the energy and commodity sectors. Even so, the default rate among energy issuers over the past twelve months is still at a historically low level of less than 2%. The high yield market appeared to be in a stronger position by mid-2015 compared to where it stood throughout much of 2014.
As oil prices improved in early 2015, we saw an opportunity to strategically add back to the Fund’s position in the energy exploration and production sector that we had pared back in the second half of 2014. The outlook for oil prices and energy credit risk has improved, but the downside risk for oil prices continues to be a tactical risk both to energy bond prices and to the broader high yield market in general. We believe the sector is positioned to outperform the high yield bond market as a whole in the coming months given the significant yield advantage and generally strong liquidity among individual credits within the high yield energy universe. We’re more cautious in the oilfield services sector, although we believe the default risk being priced into that sector is overstated.
From a quality standpoint, the Fund remained positioned with modest overweights in CCC rated and B rated securities while maintaining an underweight position in higher rated BB securities. We were still able to identify value dislocations due to the significant underperformance of lower-rated bonds in 2014, although some of that advantage disappeared as lower rated bonds enjoyed better performance as the Fund’s reporting period concluded. We continue to have a constructive view of cyclicals, but with a preference for U.S. consumer-driven cyclicals over global industrial cyclicals such as retail, homebuilding and building products, automotive and paper/packaging. We also continue to add exposure to certain preferred securities in the financial and real estate sectors and to convertible preferreds within the utility sector. We are taking advantage of price dislocations to selectively add to holdings in closed-end funds that invest in floating-rate bank loans, corporate debt and emerging market debt, comprising approximately 2.1% of the Fund’s holdings for the reporting period.
During the reporting period, we also continued to utilize various derivative instruments. We used Treasury note and bond futures as part of an overall portfolio construction strategy to manage the Fund’s duration and yield curve exposures. To decrease the duration of the Fund’s portfolio, we acquired short Treasury bond or Treasury note futures positions. The effect of these activities slightly detracted from performance during the reporting period. We also used interest rate swaps as part of our portfolio construction strategy to manage the Fund’s duration and overall portfolio yield curve exposure. The interest rate swaps also detracted slightly from performance during the reporting period.
In addition, we used foreign currency exchange contracts to manage the Fund’s foreign currency exposures. During the reporting period, these instruments were used primarily for hedging purposes to reduce unwanted currency exposure from the Fund’s bond portfolio. These positions had a slightly positive impact on performance during the reporting period.
We used credit default swaps to add diversified exposure to a broad segment of the credit markets, or to express a view on credit as part of an overall portfolio sector management strategy. For example, to increase the Fund’s credit exposure to the high yield bond segment of the market, we acquired long CDX High Yield Index swaps. These swap positions had a slightly positive impact on performance during the reporting period. The positions were sold off during the period.
Nuveen Strategic Income Fund
The Fund’s Class A Shares at NAV underperformed the Barclays Aggregate Bond Index and the Lipper Multi-Sector Income Funds Classification Average for the twelve-month reporting period. Global economies struggled to deal with a number of challenges in the first half of the reporting period, including disappointing economic growth levels, a dramatic drop in commodity prices and ongoing geopolitical unrest. While the Fed was in the process of tapering its quantitative easing program in the U.S. in late 2014, central banks outside of the U.S. began to incorporate more accommodative policies in an effort to pump additional liquidity into their
Portfolio Managers’ Comments (continued)
economies. U.S. bond yields changed little over the reporting period, but at times were quite volatile in response to changes in monetary policy and global capital flows. The shape of the U.S. Treasury curve was also volatile with the yield curve flattening dramatically in late 2014 as yields on long Treasuries plunged, while yields on short to intermediate maturities rose modestly in response to investors pulling forward the timing of Fed tightening into mid-2015. Subsequently, weak U.S. economic data in early 2015 caused the market to view a mid-year tightening as unlikely and the yield curve flattening that occurred in late 2014 partially reversed course.
For virtually all of the reporting period, investors favored higher quality sectors of the market, while corporate bonds, particularly in the high yield area, underperformed the broader bond market. Energy and commodity related issuers sustained significant volatility in the high yield market as uncertainty about base commodity prices affected these sectors. The sharpest drops occurred in the closing months of 2014 as oil prices declined dramatically. Energy and commodity issuers performed better in the final months of the reporting period when commodity prices recovered some of the ground lost in 2014. As concerns about risks to the global economy rose, investors appeared to move away from the riskier parts of the bond market. Within investment grade credit, BBB rated bonds suffered versus higher rated peers. In the high yield bond segment, BB bonds outperformed lower quality B rated and CCC rated bonds for much of the past year. However, as interest rates began to increase, high yield bonds were better positioned to absorb the impact of rising rates than sectors with less income. In the final months of the reporting period, investors’ risk appetite appeared to improve. High yield bonds subsequently outperformed investment grade corporates and Treasury bonds, while the lower quality sectors of the high yield market also performed better.
Investment grade bonds generally fared better than high yield bonds for much of the past year, although their returns continued to lag those of Treasury bonds. The corporate market weakened in late 2014 due to a heavy new issue calendar and growing risk aversion by investors. Spreads between corporate bonds and Treasuries reached their widest points near the end of 2014. Spreads narrowed a bit early in 2015 before widening again in the closing months of the reporting period. Increasing investor worries about Greece’s ongoing debt crisis and the risk of a disorderly Greek exit from the European Monetary Union fueled investor worries. Investment grade corporates ended the reporting period with a very weak performance in the second quarter.
Among the securitized sectors of the bond market, mortgage-backed securities (MBS) issued by government agencies such as Fannie Mae (FNMA), Ginnie Mae (GNMA) and Freddie Mac (FHLMC) struggled to keep pace with Treasuries for much of the year due to higher volatility and concerns about the Fed normalizing policy. In early 2015, investors became concerned about prepayment risk due to lower rates and a reduction in mortgage insurance costs for Federal Housing Administration (FHA) loans, which comprise the bulk of GNMA securities. The lower insurance costs created an incentive for FHA borrowers to refinance, resulting in dramatic underperformance among GNMA pass-through securities and creating broader concerns about policy risk for the MBS market. For much of the reporting period, commercial mortgage-backed securities (CMBS) benefited from improving commercial real estate fundamentals and relative immunity to energy-related spread volatility. However, late in the reporting period, CMBS spreads widened due to increased supply, ongoing concerns about loan origination quality and wider corporate spreads.
Across global markets, the most important development during the reporting period was the active intervention of central banks in an effort to spur economic growth. The European Central Bank (ECB) launched its large-scale quantitative easing program in 2015 and other central banks announced widespread policy accommodation. Prior to those moves, global interest rates fell sharply in the wake of declining inflation, continued policy easing and sluggish growth. Developed market long-term yields fell through the end of 2014 and foreign markets generally outperformed U.S. Treasuries. This trend continued in the opening months of 2015, but global interest rates shot higher in the closing months of the reporting period. That resulted in weaker performance for global bonds in the second quarter of 2015. While the dollar gained against major currencies for most of the current reporting period, the trend reversed course in the closing months.
Emerging market (EM) debt was negatively affected by falling commodity prices, weaker growth, fears of looming Fed rate action, geopolitical risk and investor outflows in the first half of the reporting period. The economic environment stabilized somewhat in the early part of 2015, as did commodity prices. Improvement in the economies of the U.S. and other developed nations in 2015 also provided a boost for EM debt. For the reporting period however, EM debt markets across most regions were hard hit with the exception of Asia.
The dollar rallied strongly in the second half of 2014 thanks to the relative strength of the U.S. economy compared to other developed markets and the Fed’s tapering of its quantitative easing program. Hardest hit were the Japanese yen and currencies of
oil-producing countries. The dollar maintained its strength in the first quarter of 2015 as growing discord created by the Greek debt crisis continued to be a challenge. However, the dollar gave back some of its gains in the reporting period’s final months amid improvement in global economies.
The bulk of the Fund’s return shortfall compared to the Barclays benchmark occurred during the first six months of the reporting period. The primary factor was the Fund’s above average weighting in the high yield corporate sector, which underperformed the broader bond market significantly during that six-month stretch as energy and commodity issuers struggled. However, the high yield market recovered in 2015 and our large allocation to the sector was the greatest positive performance driver in the second half of the reporting period. The Fund’s foreign currency positions also had a negative impact on relative performance, particularly in the second half of the reporting period. Notably, the Fund’s currency positioning in favor of select EM currencies suffered, while hedges through short positions in developed country currencies did not sufficiently offset EM declines as the U.S. dollar rallied. Contributing to the negative impact was increased market volatility and pressure on EM currencies as concerns about Fed rate hikes grew. A third sector that hurt the Fund’s relative performance was our overweight position in investment grade bonds. Our prominent position in industrial bonds, particularly those rated BBB, was a drag on performance late in 2014, while investment grade credits within energy, metals and mining also hindered results as commodity prices dropped. In the final months of the reporting period, investment grade credit again struggled as its performance lagged that of the broader bond market.
Financials represented one of the Fund’s positive contributors during the reporting period. An overweight position in that sector within the investment grade category worked in the Fund’s favor over much of the reporting period, as financials proved to be strong performers. The financial sector traded with relatively low volatility throughout the reporting period. Effective credit selection generally worked to the benefit of the Fund as well. The Fund’s exposure to local EM bonds was a small positive relative contributor during the reporting period, benefiting from higher yields and market selection. Our duration and yield curve positioning were not large performance drivers over the full reporting period as their impacts largely offset one another. Our short duration profile helped during periods where rates rose and hurt when rates fell. We were generally positioned for a flatter yield curve during the reporting period, which was beneficial during the first half of the reporting period, but hurt in second half as the curve steepened. The net effect of these positions on portfolio returns was marginally positive.
The Fund’s key sector themes continued to focus on positioning in favor of credit sectors with corresponding underweights to mortgage and government securities. Despite continued market volatility and ongoing concerns about the strength of the economy worldwide, we believe that credit sectors are best positioned to benefit from attractive fundamental factors. These sectors can compensate for both credit risk and near-term volatility in the interest rate environment. Toward the end of the reporting period, we made shifts in credit selection based on market opportunities and research ideas. As a result, we added to the Fund’s weight in the high yield sector, while reducing its exposure to investment grade credit. We believe high yield bonds offer more attractive value in the current environment along with an income advantage. Financial issuers continued to be in favor as they remain attractively valued, but also offered strong liquidity, leverage and capital positions. Consistent with our focus on financials and the Fund’s broader theme emphasizing diversified income sources, we increased its weighting in preferred securities. We continue to monitor the energy sector closely and assess the credit impact of developments in oil prices and other fundamental factors affecting energy issuers.
We marginally reduced the Fund’s weighting in foreign positions, although net currency positions remained approximately neutral to the U.S. dollar. Our duration positioning remained modestly defensive in light of the persistent low interest rate environment and our view that interest rate risk is asymmetrically skewed toward higher yields. However, we have not taken a more defensive posture given the still-muted inflation risk globally and the outlook for continued high levels of global liquidity and economic slack. These factors will likely keep any upturn in interest rates modest. While the Fund remained positioned for a flatter yield curve during the year, we made tactical adjustments to our implementation of this view based on valuation changes and policy developments. We continue to expect a flattening yield curve as the Fed heads toward moving the fed funds rate off of zero.
During the reporting period, we also continued to utilize various derivative instruments. We used foreign currency exchange forward contracts to manage the Fund’s foreign currency exposure. For example, the Fund may reduce unwanted currency exposure from the Fund’s portfolio, or may take long forward positions in select currencies in an attempt to benefit from the potential price appreciation. These positions had a slightly negative impact on performance during the reporting period.
We utilized domestic and foreign interest rate futures as part of an overall portfolio construction strategy to manage the Fund’s duration and yield curve exposure. To decrease the duration of the Fund’s portfolio, we established short Treasury bond or Treasury note
Portfolio Managers’ Comments (continued)
futures positions. The overall effect on performance during the reporting period was slightly negative. We also utilized interest rate swaps to manage portfolio duration and yield curve exposure and these positions also detracted slightly from performance during the reporting period.
In addition, we entered into credit default swaps as a way to take on credit risk and earn credit spread. The effect of these activities on performance was slightly negative during the period and the positions were sold off.
Nuveen U.S. Infrastructure Bond Fund
The Fund’s Class A Shares at NAV underperformed both the Barclays Taxable Municipal Aggregate Eligible Index and the Lipper General & Insured Municipal Debt Funds Classification Average for the twelve-month reporting period. Global economies struggled to deal with a number of challenges in the first half of the reporting period, including disappointing economic growth levels, a dramatic drop in commodity prices and ongoing geopolitical unrest. While the Fed was in the process of tapering its quantitative easing program in the U.S. in late 2014, central banks outside of the U.S. began to incorporate more accommodative policies in an effort to pump additional liquidity into their economies. U.S. bond yields changed little over the reporting period, but at times were quite volatile in response to changes in monetary policy and global capital flows. The shape of the U.S. Treasury curve was also volatile with the yield curve flattening dramatically in late 2014 as yields on long Treasuries plunged, while yields on short to intermediate maturities rose modestly in response to investors pulling forward the timing of Fed tightening into mid-2015. Subsequently, weak U.S. economic data in early 2015 caused the market to view a mid-year tightening as unlikely and the yield curve flattening that occurred in late 2014 partially reversed course.
During the reporting period, interest rates in the taxable municipal bond market gyrated as the average yield of the Barclays Taxable Municipal Aggregate Eligible Index fell from 4.14% on June 30, 2014 to 3.53% on January 30, 2015, but then rebounded to 4.30% by the end of June 2015. The result was a total return of 2.21%, in which the yield return of 4.30% more than compensated for a loss of market value of 1.89%. Because of the fluctuation in interest rates, with no consistent trend, the pattern of returns by maturity was mixed. For example, taxable municipal bonds maturing in 12 to 17 years returned 1.10%, and those maturing in 17 to 22 years returned 2.31%, while those maturing in 4 to 6 years returned 2.53%. Credit spreads generally widened as bonds rated AAA within the index returned 4.04%, while AA bonds returned 3.21%, A rated bonds returned 0.99% and BBB/Baa bonds returned -0.43%. (However, it should be noted that the low return from the BBB/Baa segment reflected a small sample of just five issuers that were heavily affected by low returns from general obligations from the City of Chicago and the Chicago Board of Education.) The best performing sectors in the taxable municipal market were general government appropriation debt, incremental tax, hospitals, housing, airports and public power.
For virtually all of the reporting period, high yield corporates underperformed the broader bond market as investors favored higher quality sectors of the market. Energy and commodity related issuers sustained significant volatility in the high yield market as uncertainty about base commodity prices affected these sectors. The sharpest drops occurred in the closing months of 2014 as oil prices declined dramatically. Energy and commodity issuers performed better in the final months of the reporting period when commodity prices recovered some of the ground lost in 2014. Also, as concerns about risks to the global economy rose, investors appeared to move away from the riskier parts of the bond market and higher rated BB bonds outperformed lower quality B rated and CCC rated bonds. However, as interest rates began to increase, high yield bonds were better positioned to absorb the impact of rising rates. In the final months of the reporting period, investors’ risk appetite appeared to improve and high yield bonds outperformed investment grade corporates and Treasury bonds, while the lower-quality sectors of the high yield market also performed better. The Barclays U.S. Corporate High Yield Bond Index ended the reporting period with a -0.39% twelve-month return.
Investment grade bonds generally fared better than high yield bonds for much of the reporting period, although their returns continued to lag those of Treasury bonds. The corporate market weakened in late 2014 due to a heavy new issue calendar and growing risk aversion by investors. Spreads between corporate bonds and Treasuries reached their widest points near the end of 2014. Spreads narrowed a bit early in 2015 before widening again in the closing months of the reporting period. Increasing investor worries about Greece’s ongoing debt crisis and the risk of a disorderly Greek exit from the European Monetary Union fueled investor worries. Investment grade corporates ended the reporting period with very weak performance in the second quarter. Throughout the reporting period, financial names held up better than industrials as positive fundamental credit trends remained intact and the finan-
cial sector traded with better liquidity and lower volatility than the broader credit market. The Barclays U.S. Corporate Investment Grade Index returned 0.75% during the reporting period.
The Fund launched in 2014 with a goal to provide investors with an attractive level of income by investing in a portfolio of debt securities from various entities that own, operate or develop infrastructure assets in the United States. These investments include municipal, high yield corporate and investment grade corporate bonds that finance either public or private infrastructure projects. We define infrastructure as the vital structures, facilities and services that support the U.S. economy and society including: transportation; energy and utilities; communications; and social and government functions. During the reporting period, approximately 65% of the Fund was allocated to the municipal bond market, approximately 20% to the high yield corporate market and the remainder to the investment grade corporate market. As noted in the market overview comments, the municipal bond market turned in the strongest absolute returns over this time frame. Therefore, the Fund’s most significant sources of underperformance versus the benchmark Barclays Taxable Municipal Aggregate Eligible Index were its allocations to the high yield and investment grade corporate sectors.
In terms of performance within each of the three segments, the Fund’s municipal bond portfolio underperformed relative to its benchmark. The sole cause of the shortfall was the use of interest rate futures, which meaningfully shortened the average duration of the Fund’s municipal bond portfolio versus its index. This lessened the portfolio’s interest rate sensitivity during a period where rates rallied. On the other hand, the municipal portfolio benefited from its overweight to bonds maturing in 22 years or longer as well as its exposure to bonds rated below investment grade (which are not in the index) and underweight to A rated bonds. At the sector level, overweights in appropriation debt, airports and public power contributed positively to performance as these segments outperformed. The absence of Chicago General Obligation Bonds and Chicago Board of Education Bonds also helped.
The Fund’s high yield portfolio strongly outperformed its benchmark, more than offsetting the modestly negative return of the asset class. Industry weightings were particularly beneficial to performance driven by our lack of exposure to the more cyclical, commodity related areas such as metals/mining, oil and oil services that dramatically underperformed the overall high yield market during the reporting period. Instead, our portfolio’s energy exposure was focused in pipeline and refiner credits, which proved to be much more defensive than the exploration and oil services names. We also benefited from an underweight to European high yield names, which underperformed over the reporting period. In addition, quality distribution had a slightly positive impact. Our high yield portfolio was positioned with moderate overweights to B rated and CCC rated securities relative to the index. This benefited performance as investors’ search for yield was strong, while the demand for higher quality credits fell later in the reporting period due to their greater sensitivity to rising interest rates.
The investment grade portion of the Fund also modestly outperformed on a relative basis due in part to our duration and yield curve positioning. We maintained a portfolio duration that was around two years longer than the benchmark and concentrated in the 10 to 30 year part of the yield curve. This contributed to performance as rates 10 years and longer fell approximately 20 basis points during the reporting period. Security selection also proved beneficial, particularly in utilities where our lower beta holdings outperformed.
The Fund’s inflows/outflows were more evenly balanced as the reporting period progressed. However, as a result of rising rates, particularly later in the reporting period, our duration hedge counterparty was required to post cash to the Fund (resulting in a modestly positive cash position). As shareholder inflows hit the Fund, generally speaking we allocated around 65% to public infrastructure, 20% to high yield private infrastructure and 15% to investment grade private infrastructure. In the municipal sleeve, we established one new position, added to our existing positions and exited one holding. Trading activity in the high yield portfolio revolved around increasing the number of holdings to 31 credits by the end of the reporting period to broaden industry exposures, in addition to monetizing secondary market relative value opportunities. In the investment grade sleeve, we rotated several of our utility exposures, either by trimming names or by adding new positions. As part of our investment process, the bonds that we focus on are typically backed by assets that have recurring revenue streams and natural monopolies, for example an electric or gas utility, or long-term contracts that offer predictable revenue streams, such as a pipeline. The Fund’s largest concentrations continued to be found in the transportation, energy, electric utilities, dedicated tax (primarily backing mass public transit), water/sewer and industrial sectors as of the end of the reporting period.
We also shorted U.S. Treasury futures contracts to hedge against potential increases in interest rates. The effect on performance was negative during the reporting period, as longer term interest rates moved lower.
Risk Considerations
and Dividend Information
Risk Considerations
Nuveen Global Total Return Bond Fund
Mutual fund investing involves risk; principal loss is possible. Debt securities such as those held by the Fund, are subject to market risk, credit risk, interest rate risk, call risk, and income risk. As interest rates rise, bond prices fall. Below investment grade or high yield debt securities are subject to liquidity risk and heightened credit risk. Foreign investments involve additional risks, including currency fluctuation, political and economic instability, lack of liquidity and differing legal and accounting standards. The Fund gains additional exposure to currency rates, and therefore to the risk of currency fluctuation, through investment in foreign currency contracts. The risks of foreign investments are magnified in emerging markets. Asset-backed and mortgage-backed securities are also subject to prepayment risk, liquidity risk, default risk and adverse economic developments. The Fund’s potential use of derivative instruments involves a high degree of financial risk and additional transaction costs.
Nuveen High Income Bond Fund
Mutual fund investing involves risk; principal loss is possible. Debt or fixed income securities such as those held by the Fund, are subject to market risk, credit risk, interest rate risk, call risk, derivatives risk, income risk, and other investment company risk. As interest rates rise, bond prices fall. Below investment grade or high yield debt securities are subject to liquidity risk and heightened credit risk. Foreign investments involve additional risks, including currency fluctuation, political and economic instability, lack of liquidity and differing legal and accounting standards.
Nuveen Strategic Income Fund
Mutual fund investing involves risk; principal loss is possible. Debt or fixed income securities such as those held by the Fund, are subject to market risk, credit risk, interest rate risk, call risk, derivatives risk, dollar roll transaction risk, and income risk. As interest rates rise, bond prices fall. Below investment grade or high yield debt securities are subject to liquidity risk and heightened credit risk. Foreign investments involve additional risks, including currency fluctuation, political and economic instability, lack of liquidity and differing legal and accounting standards. These risks are magnified in emerging markets. Asset-backed and mortgage-backed securities are subject to additional risks such as prepayment risk, liquidity risk, default risk and adverse economic developments.
Nuveen U.S. Infrastructure Bond Fund
Mutual fund investing involves risk; principal loss is possible. There is no guarantee the Fund’s investment objectives will be achieved. Because the Fund may invest in infrastructure-related securities, the Fund could have greater exposure to adverse economic, regulatory, political, legal and other changes affecting the issuers of such securities. The Fund is subject to, interest rate risk; as interest rates rise, bond prices fall. Price changes are generally greater for longer-duration bonds. Credit risk refers to the risk that an issuer may fail to make interest or principal payments when due or that the value of a security may decline due to concerns about the issuer making such payments. Declines in value will generally be greater for securities with longer maturities. Investments in below investment grade or high yield securities are subject to liquidity risk and heightened credit risk. The Fund’s use of inverse floaters creates effective leverage. Leverage involves the risk that the Fund could lose more than its original investment and also increases the Fund’s exposure to volatility and interest rate risk. Non-U.S./Emerging Markets involve additional risks, including currency fluctuation, political and economic instability, lack of liquidity and differing legal and accounting standards. These risks are magnified in emerging markets. More information on these risk considerations, as well as information on other risks to which the Fund is subject, such as bond market liquidity, call, currency, derivatives, general municipal securities market, income, loan settlement risk, market, municipal lease obligations, and zero coupon bonds risks, are included in the Fund’s prospectus.
Dividend Information
Each Fund seeks to pay regular monthly dividends out of its net investment income at a rate that reflects its past and projected performance. To permit each Fund to maintain a more stable monthly dividend, the Fund may pay dividends at a rate that may be more or less than the amount of net investment income actually earned by the Fund during the period. If the Fund has cumulatively earned more than it has paid in dividends, it will hold the excess in reserve as undistributed net investment income (UNII) as part of the Fund’s net asset value. Conversely, if the Fund has cumulatively paid in dividends more than it has earned, the excess will constitute negative UNII that will likewise be reflected in the Fund’s net asset value. Each Fund will, over time, pay all its net investment income as dividends to shareholders.
As of June 30, 2015, all of the Funds had positive UNII balances for tax purposes. The Nuveen High Income Bond Fund and Nuveen Strategic Income Fund had positive UNII balances while the Nuveen Global Total Return Bond Fund and Nuveen U.S. Infrastructure Bond Fund had negative UNII balances for financial reporting purposes.
All monthly dividends paid by the Funds during the current reporting period were paid from net investment income. If a portion of a Fund’s monthly distributions was sourced from or comprised of elements other than net investment income, including capital gains and/or a return of capital, shareholders would have received a notice to that effect. For financial reporting purposes the composition and per share amounts of each Fund’s dividends for the reporting period are presented in this report’s Statement of Changes in Net Assets and Financial Highlights, respectively. For income tax purposes, distribution information for each Fund as of its most recent tax year end is presented in Note 6 – Income Tax Information within the Notes to Financial Statements of this report.
THIS PAGE INTENTIONALLY LEFT BLANK
Fund Performance
and Expense Ratios
The Fund Performance and Expense Ratios for each Fund are shown within this section of the report.
Returns quoted represent past performance, which is no guarantee of future results. Current performance may be higher or lower than the performance shown. Investment returns and principal value will fluctuate so that when shares are redeemed, they may be worth more or less than their original cost. Returns without sales charges would be lower if the sales charge were included. Returns do not reflect the deduction of taxes that a shareholder would pay on Fund distributions or the redemption of Fund shares.
Returns may reflect an agreement by the investment adviser to waive certain fees and/or reimburse expenses during the periods presented. If any such waivers and/or reimbursements had not been in place, returns would have been reduced. See Notes to Financial Statements, Note 7 – Management Fees and Other Transactions with Affiliates for more information. For the most recent month-end performance visit www.nuveen.com or call (800) 257-8787.
Returns reflect differences in sales charges and expenses, which are primarily differences in distribution and service fees. Fund returns assume reinvestment of dividends and capital gains.
Comparative index and Lipper return information is provided for Class A Shares at net asset value (NAV) only.
The expense ratios shown reflect total operating expenses (before fee waivers and/or expense reimbursements, if any) as shown in the most recent prospectus. The expense ratios include management fees and other fees and expenses.
Fund Performance and Expense Ratios (continued)
Nuveen Global Total Return Bond Fund
Refer to the first page of this Fund Performance and Expense Ratios section for further explanation of the information included within this section. Refer to the Glossary of Terms Used in this Report for definitions of terms used in this section.
Fund Performance
Average Annual Total Returns as of June 30, 2015
| | | | | | | | |
| | | Average Annual | |
| | | 1-Year | | | Since
Inception | |
Class A Shares at NAV | | | (7.45)% | | | | 2.56% | |
Class A Shares at maximum Offering Price | | | (11.85)% | | | | 1.17% | |
Barclays Global Aggregate Unhedged Bond Index | | | (7.09)% | | | | (0.13)% | |
Lipper Global Income Funds Classification Average | | | (4.04)% | | | | 1.75% | |
| | |
Class C Shares | | | (8.15)% | | | | 1.92% | |
Class R3 Shares | | | (7.72)% | | | | 2.37% | |
Class I Shares | | | (7.26)% | | | | 2.88% | |
Since inception returns are from 12/02/11. Indexes and Lipper averages are not available for direct investment.
Class A Shares have a maximum 4.75% sales charge (Offering Price). Class A Share purchases of $1 million or more are sold at net asset value without an up-front sales charge but may be subject to a contingent deferred sales charge (CDSC), also known as a back-end sales charge, if redeemed within eighteen months of purchase. Class C Shares have a 1% CDSC for redemptions within less than twelve months, which is not reflected in the one-year total return. Class R3 Shares have no sales charge and are only available for purchase by eligible retirement plans. Class I Shares have no sales charge and may be purchased under limited circumstances or by specified classes of investors.
Expense Ratios as of Most Recent Prospectus
| | | | | | | | | | | | | | | | |
| | | Share Class | |
| | | Class A | | | Class C | | | Class R3 | | | Class I | |
Gross Expense Ratios | | | 1.91% | | | | 2.65% | | | | 2.14% | | | | 1.65% | |
Net Expense Ratios | | | 0.97% | | | | 1.72% | | | | 1.22% | | | | 0.72% | |
The Fund’s investment adviser has agreed to waive fees and/or reimburse expenses through October 31, 2016, so that total annual Fund operating expenses (excluding 12b-1 distribution and/or service fees, interest expenses, taxes, acquired fund fees and expenses, fees incurred in acquiring and disposing of portfolio securities, and extraordinary expenses) do not exceed 0.75% of the average daily net assets of any class of Fund shares. The expense limitation expiring October 31, 2016, may be terminated or modified prior to that date only with the approval of the Board of Trustees of the Fund.
Growth of an Assumed $10,000 Investment as of June 30, 2015 – Class A Shares
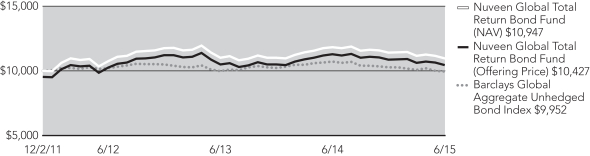
The graphs do not reflect the deduction of taxes that a shareholder may pay on Fund distributions or the redemption of Fund shares.
Fund Performance and Expense Ratios (continued)
Nuveen High Income Bond Fund
Refer to the first page of this Fund Performance and Expense Ratios section for further explanation of the information included within this section. Refer to Glossary of Terms Used in this Report for definitions of terms used in this section.
Fund Performance
Average Annual Total Returns as of June 30, 2015
| | | | | | | | | | | | |
| | | Average Annual | |
| | | 1-Year | | | 5-Year | | | 10-Year | |
Class A Shares at NAV | | | (4.82)% | | | | 7.99% | | | | 6.79% | |
Class A Shares at maximum Offering Price | | | (9.31)% | | | | 6.95% | | | | 6.27% | |
Barclays High Yield 2% Issuer Capped Index | | | (0.39)% | | | | 8.58% | | | | 7.90% | |
Lipper High Current Yield Funds Classification Average | | | (1.29)% | | | | 7.60% | | | | 6.55% | |
| | | |
Class C Shares | | | (5.45)% | | | | 7.25% | | | | 6.04% | |
Class R3 Shares | | | (5.07)% | | | | 7.72% | | | | 6.53% | |
Class I Shares | | | (4.55)% | | | | 8.28% | | | | 7.07% | |
Indexes and Lipper averages are not available for direct investment.
Class A Shares have a maximum 4.75% sales charge (Offering Price). Class A Share purchases of $1 million or more are sold at net asset value without an up-front sales charge but may be subject to a contingent deferred sales charge (CDSC), also known as a back-end sales charge, if redeemed within eighteen months of purchase. Class C Shares have a 1% CDSC for redemptions within less than twelve months, which is not reflected in the one-year total return. Class R3 Shares have no sales charge and are only available for purchase by eligible retirement plans. Class I Shares have no sales charge and may be purchased under limited circumstances or by specified classes of investors.
Expense Ratios as of Most Recent Prospectus
| | | | | | | | | | | | | | | | |
| | | Share Class | |
| | | Class A | | | Class C | | | Class R3 | | | Class I | |
Expense Ratios | | | 1.00% | | | | 1.75% | | | | 1.25% | | | | 0.76% | |
Growth of an Assumed $10,000 Investment as of June 30, 2015 – Class A Shares
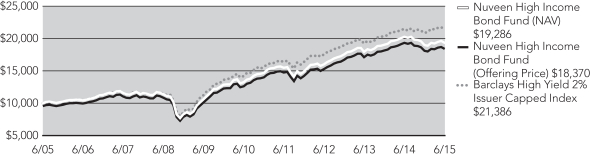
The graphs do not reflect the deduction of taxes that a shareholder may pay on Fund distributions or the redemption of Fund shares.
Fund Performance and Expense Ratios (continued)
Nuveen Strategic Income Fund
Refer to the first page of this Fund Performance and Expense Ratios section for further explanation of the information included within this section. Refer to Glossary of Terms Used in this Report for definitions of terms used in this section.
Fund Performance
Average Annual Total Returns as of June 30, 2015
| | | | | | | | | | | | |
| | | Average Annual | |
| | | 1-Year | | | 5-Year | | | 10-Year | |
Class A Shares at NAV | | | (0.80)% | | | | 5.88% | | | | 5.81% | |
Class A Shares at maximum Offering Price | | | (4.98)% | | | | 4.95% | | | | 5.35% | |
Barclays Aggregate Bond Index | | | 1.86% | | | | 3.35% | | | | 4.44% | |
Lipper Multi-Sector Income Funds Classification Average | | | (0.36)% | | | | 5.32% | | | | 5.17% | |
| | | |
Class C Shares | | | (1.50)% | | | | 5.08% | | | | 5.01% | |
Class R3 Shares | | | (1.01)% | | | | 5.59% | | | | 5.49% | |
Class I Shares | | | (0.54)% | | | | 6.13% | | | | 6.05% | |
| | | | |
| | | Cumulative | |
| | | Since Inception | |
Class R6 Shares | | | (0.10)% | |
Since inception return for Class R6 Shares is from 1/20/15. Indexes and Lipper averages are not available for direct investment.
Class A Shares have a maximum 4.25% sales charge (Offering Price). Class A Share purchases of $1 million or more are sold at net asset value without an up-front sales charge but may be subject to a contingent deferred sales charge (CDSC), also known as a back-end sales charge, if redeemed within eighteen months of purchase. Class C Shares have a 1% CDSC for redemptions within less than twelve months, which is not reflected in the one-year total return. Class R3 Shares have no sales charge and are only available for purchase by eligible retirement plans. Class R6 Shares have no sales charge and are available only to certain limited categories of investors as described in the prospectus. Class I Shares have no sales charge and may be purchased under limited circumstances or by specified classes of investors.
Expense Ratios as of Most Recent Prospectus
| | | | | | | | | | | | | | | | | | | | |
| | | Share Class | |
| | | Class A | | | Class C | | | Class R3 | | | Class R6 | | | Class I | |
Gross Expense Ratios | | | 0.92% | | | | 1.67% | | | | 1.17% | | | | 0.63% | | | | 0.67% | |
Net Expense Ratios | | | 0.85% | | | | 1.60% | | | | 1.10% | | | | 0.56% | | | | 0.60% | |
The Fund’s investment adviser has contractually agreed to waive fees and/or reimburse other Fund expenses through October 31, 2016, so that total annual Fund operating expenses (excluding 12b-1 distribution and/or service fees, interest expenses, taxes, acquired fund fees and expenses, fees incurred in acquiring and disposing of portfolio securities and extraordinary expenses) do not exceed 0.59% of the average daily net assets of any class of Fund shares. However, because Class R6 shares are not subject to sub-transfer agent and similar fees, the total annual fund operating expenses for the Class R6 shares will be less than the expense limitation. Fee waivers and/or expense reimbursements will not be terminated prior to that time without the approval of the Fund’s Board of Directors.
Growth of an Assumed $10,000 Investment as of June 30, 2015 – Class A Shares
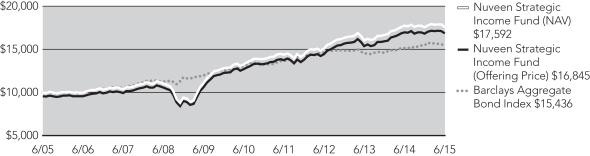
The graphs do not reflect the deduction of taxes that a shareholder may pay on Fund distributions or the redemption of Fund shares.
Fund Performance and Expense Ratios (continued)
Nuveen U.S. Infrastructure Bond Fund
Refer to the first page of this Fund Performance and Expense Ratios section for further explanation of the information included within this section. Refer to the Glossary of Terms Used in this Report for definitions of terms used in this section.
Fund Performance
Average Annual Total Returns as of June 30, 2015
| | | | | | | | |
| | | Average Annual | |
| | | 1-Year | | | Since
Inception | |
Class A Shares at NAV | | | 0.70% | | | | 2.32% | |
Class A Shares at maximum Offering Price | | | (3.58)% | | | | (1.52)% | |
Barclays Taxable Municipal Aggregate Eligible Index | | | 2.21% | | | | 4.69% | |
Lipper General & Insured Municipal Debt Funds Classification Average | | | 3.03% | | | | 3.36% | |
| | |
Class C Shares | | | (0.03)% | | | | 1.57% | |
Class I Shares | | | 0.96% | | | | 2.57% | |
Since inception returns are from 5/12/14. Indexes and Lipper averages are not available for direct investment.
Class A Shares have a maximum 4.25% sales charge (Offering Price). Class A Share purchases of $1 million or more are sold at net asset value without an up-front sales charge but may be subject to a contingent deferred sales charge (CDSC), also known as a back-end sales charge, if redeemed within eighteen months of purchase. Class C Shares have a 1% CDSC for redemptions within less than twelve months, which is not reflected in the one-year total return. Class I Shares have no sales charge and may be purchased under limited circumstances or by specified classes of investors.
Expense Ratios as of Most Recent Prospectus
| | | | | | | | | | | | |
| | | Share Class | |
| | | Class A | | | Class C | | | Class I | |
Gross Expense Ratios | | | 1.69% | | | | 2.44% | | | | 1.44% | |
Net Expense Ratios | | | 0.96% | | | | 1.71% | | | | 0.71% | |
The Fund’s investment adviser has agreed to waive fees and/or reimburse expenses through October 31, 2017, so that total annual Fund operating expenses (excluding 12b-1 distribution and/or service fees, interest expenses, taxes, acquired fund fees and expenses, fees incurred in acquiring and disposing of portfolio securities, and extraordinary expenses) do not exceed 0.74% of the average daily net assets of any class of Fund shares. The expense limitation may be terminated or modified prior to that date only with the approval of the Fund’s Board of Trustees.
Growth of an Assumed $10,000 Investment as of June 30, 2015 – Class A Shares
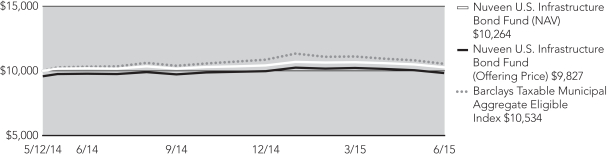
The graphs do not reflect the deduction of taxes that a shareholder may pay on Fund distributions or the redemption of Fund shares.
Yields as of June 30, 2015
Dividend Yield is the most recent dividend per share (annualized) divided by the offering price per share.
The SEC 30-Day Yield is a standardized measure of a Fund’s yield that accounts for the future amortization of premiums or discounts of bonds held in the Fund’s portfolio. The SEC 30-Day Yield is computed under an SEC standardized formula and is based on the maximum offer price per share. Subsidized yields reflect fee waivers and/or expense reimbursements from the investment adviser during the period. If any such waivers and/or reimbursements had not been in place, yields would have been reduced. Unsubsidized yields do not reflect waivers and/or reimbursements from the investment adviser during the period. Refer to the Fund Performance and Expense Ratios page for further details on the investment adviser’s most recent agreement with the Fund to waive fees and/or reimburse expenses, where applicable. Dividend Yield may differ from the SEC 30-Day Yield because the Fund may be paying out more or less than it is earning and it may not include the effect of amortization of bond premium.
Nuveen Global Total Return Bond Fund
| | | | | | | | | | | | | | | | |
| | | Share Class | |
| | | Class A1 | | | Class C | | | Class R3 | | | Class I | |
Dividend Yield | | | 3.77% | | | | 3.16% | | | | 3.68% | | | | 4.20% | |
SEC 30-Day Yield – Subsidized | | | 3.66% | | | | 3.08% | | | | 3.61% | | | | 4.10% | |
SEC 30-Day Yield – Unsubsidized | | | 2.90% | | | | 2.29% | | | | 2.79% | | | | 3.30% | |
Nuveen High Income Bond Fund
| | | | | | | | | | | | | | | | |
| | | Share Class | |
| | | Class A1 | | | Class C | | | Class R3 | | | Class I | |
Dividend Yield | | | 6.18% | | | | 5.69% | | | | 6.21% | | | | 6.76% | |
SEC 30-Day Yield | | | 7.13% | | | | 6.73% | | | | 7.24% | | | | 7.75% | |
Nuveen Strategic Income Fund
| | | | | | | | | | | | | | | | | | | | |
| | | Share Class | |
| | | Class A1 | | | Class C | | | Class R3 | | | Class R6 | | | Class I | |
Dividend Yield | | | 4.66% | | | | 4.07% | | | | 4.63% | | | | 5.15% | | | | 5.15% | |
SEC 30-Day Yield – Subsidized | | | 4.52% | | | | 3.97% | | | | 4.47% | | | | 5.16% | | | | 4.98% | |
SEC 30-Day Yield – Unsubsidized | | | 4.33% | | | | 3.77% | | | | 4.27% | | | | 4.95% | | | | 4.78% | |
Nuveen U.S. Infrastructure Bond Fund
| | | | | | | | | | | | |
| | | Share Class | |
| | | Class A1 | | | Class C | | | Class I | |
Dividend Yield | | | 3.89% | | | | 3.27% | | | | 4.31% | |
SEC 30-Day Yield – Subsidized | | | 3.79% | | | | 3.18% | | | | 4.21% | |
SEC 30-Day Yield – Unsubsidized | | | 2.65% | | | | 2.01% | | | | 3.02% | |
| 1 | The SEC Yield for Class A Shares quoted in the table reflects the maximum sales load. Investors paying a reduced load because of volume discounts, investors paying no load because they qualify for one of the several exclusions from the load, and existing shareholders who previously paid a load but would like to know the SEC Yield applicable to their shares on a going-forward basis, should understand that the SEC Yield effectively applicable to them would be higher than the figure quoted in the table. |
Holding
Summaries as of June 30, 2015
This data relates to the securities held in each Fund’s portfolio of investments as of the end of this reporting period. It should not be construed as a measure of performance for the Fund itself. Holdings are subject to change.
Ratings shown are the highest rating given by one of the following national rating agencies: Standard & Poor’s, Moody’s Investors Service, Inc. or Fitch, Inc. Credit ratings are subject to change. AAA, AA, A and BBB are investment grade ratings; BB, B, CCC, CC, C and D are below investment grade ratings. Certain bonds backed by U.S. Government or agency securities are regarded as having an implied rating equal to the rating of such securities. Holdings designated N/R are not rated by these national rating agencies.
Refer to the Glossary of Terms Used in this Report for definitions of terms used within this section.
Nuveen Global Total Return Bond Fund
Fund Allocation
(% of net assets)
| | | | |
Convertible Preferred Securities | | | 0.4% | |
$25 Par (or similar) Retail Preferred | | | 1.7% | |
Corporate Bonds | | | 51.4% | |
Convertible Bonds | | | 0.1% | |
$1,000 (par or similar) Institutional Preferred | | | 4.8% | |
Asset-Backed and Mortgage-Backed Securities | | | 4.8% | |
Sovereign Debt | | | 35.4% | |
Repurchase Agreements | | | 4.3% | |
Other Assets Less Liabilities | | | (2.9)% | |
Net Assets | | | 100% | |
Corporate Debt: Industries
(% of total corporate bond holdings)
| | | | |
Banks | | | 17.2% | |
Oil, Gas & Consumable Fuels | | | 13.2% | |
Metals & Mining | | | 7.3% | |
Wireless Telecommunication Services | | | 7.2% | |
Chemicals | | | 4.9% | |
Capital Markets | | | 3.9% | |
Real Estate Investment Trust | | | 3.5% | |
Electric Utilities | | | 3.5% | |
Software | | | 3.1% | |
Diversified Telecommunication Services | | | 3.1% | |
Energy Equipment & Services | | | 3.1% | |
Media | | | 2.9% | |
Automobiles | | | 2.8% | |
Beverages | | | 2.2% | |
Industrial Conglomerates | | | 2.1% | |
Diversified Consumer Services | | | 2.0% | |
Other | | | 18.0% | |
Total | | | 100% | |
Portfolio Credit Quality
(% of total long-term
investments)1
| | | | |
AAA/U.S. Guaranteed | | | 7.1% | |
AA | | | 3.5% | |
A | | | 27.3% | |
BBB | | | 39.5% | |
BB or Lower | | | 22.6% | |
Total | | | 100% | |
Country Allocation
(% of net assets)
| | | | |
United States | | | 34.8% | |
Mexico | | | 14.9% | |
United Kingdom | | | 7.7% | |
South Africa | | | 6.8% | |
France | | | 3.7% | |
Australia | | | 3.2% | |
Poland | | | 3.1% | |
Canada | | | 2.4% | |
China | | | 2.2% | |
Hungary | | | 1.8% | |
Germany | | | 1.6% | |
Brazil | | | 1.5% | |
Other | | | 19.2% | |
Other Assets Less Liabilities | | | (2.9)% | |
Net Assets | | | 100% | |
| 1 | Excluding investments in derivatives. |
Holding Summaries as of June 30, 2015 (continued)
Nuveen High Income Bond Fund
Fund Allocation
(% of net assets)
| | | | |
Common Stocks | | | 0.8% | |
Exchange-Traded Funds | | | 1.1% | |
Convertible Preferred Securities | | | 0.8% | |
Variable Rate Senior Loan Interests | | | 5.2% | |
$25 Par (or similar) Retail Preferred | | | 4.9% | |
Corporate Bonds | | | 80.4% | |
Convertible Bonds | | | 0.3% | |
$1,000 (par or similar) Institutional Preferred | | | 4.3% | |
Asset-Backed Securities | | | 0.0% | |
Investment Companies | | | 2.1% | |
Warrants | | | 0.0% | |
Investments Purchased with Collateral from Securities Lending | | | 16.7% | |
Money Market Funds | | | 1.1% | |
Other Assets Less Liabilities | | | (17.7)% | |
Net Assets | | | 100% | |
Corporate Debt: Industries
(% of total corporate bond holdings)
| | | | |
Oil, Gas & Consumable Fuels | | | 18.2% | |
Metals & Mining | | | 6.8% | |
Media | | | 5.3% | |
Wireless Telecommunication Services | | | 3.8% | |
Chemicals | | | 3.5% | |
Hotels, Restaurants & Leisure | | | 3.3% | |
Diversified Financial Services | | | 3.2% | |
Diversified Telecommunication Services | | | 3.1% | |
Marine | | | 3.0% | |
Auto Components | | | 2.8% | |
Food Products | | | 2.8% | |
Building Products | | | 2.7% | |
Energy Equipment & Services | | | 2.7% | |
Paper & Forest Products | | | 2.5% | |
Real Estate Management & Development | | | 2.3% | |
Containers & Packaging | | | 2.0% | |
Banks | | | 2.0% | |
Construction Materials | | | 2.0% | |
Health Care Providers & Services | | | 1.9% | |
Food & Staples Retailing | | | 1.8% | |
Electric Utilities | | | 1.6% | |
Consumer Finance | | | 1.6% | |
Household Durables | | | 1.5% | |
Other | | | 19.6% | |
Total | | | 100% | |
Portfolio Credit Quality
(% of total long-term
fixed-income investments)1
| | | | |
AA | | | 0.0% | |
A | | | 0.4% | |
BBB | | | 3.8% | |
BB or Lower | | | 88.1% | |
N/R (not rated) | | | 7.7% | |
Total | | | 100% | |
| 1 | Excluding investments in derivatives. |
Nuveen Strategic Income Fund
Fund Allocation
(% of net assets)
| | | | |
Common Stocks | | | 0.0% | |
Convertible Preferred Securities | | | 0.1% | |
Variable Rate Senior Loan Interests | | | 1.4% | |
$25 Par (or similar) Retail Preferred | | | 1.9% | |
Corporate Bonds | | | 71.8% | |
$1,000 (par or similar) Institutional Preferred | | | 7.0% | |
Asset-Backed and Mortgage-Backed Securities | | | 4.9% | |
Investment Companies | | | 0.1% | |
Sovereign Debt | | | 10.5% | |
Investments Purchased with Collateral from Securities Lending | | | 12.1% | |
Money Market Funds | | | 1.5% | |
Other Assets Less Liabilities | | | (11.3)% | |
Net Assets | | | 100% | |
Corporate Debt: Industries
(% of total corporate bond holdings)
| | | | |
Oil, Gas & Consumable Fuels | | | 13.7% | |
Banks | | | 12.8% | |
Capital Markets | | | 5.5% | |
Diversified Telecommunication Services | | | 5.1% | |
Media | | | 5.1% | |
Metals & Mining | | | 4.4% | |
Chemicals | | | 3.4% | |
Real Estate Investment Trust | | | 3.3% | |
Insurance | | | 2.8% | |
Wireless Telecommunication Services | | | 2.7% | |
Energy Equipment & Services | | | 2.6% | |
Electric Utilities | | | 2.4% | |
Diversified Financial Services | | | 2.3% | |
Consumer Finance | | | 2.2% | |
Independent Power & Renewable Electricity Producers | | | 1.9% | |
Specialty Retail | | | 1.7% | |
Household Durables | | | 1.6% | |
Commercial Services & Supplies | | | 1.5% | |
Building Products | | | 1.4% | |
Containers & Packaging | | | 1.3% | |
Software | | | 1.2% | |
Auto Components | | | 1.1% | |
Other | | | 20.0% | |
Total | | | 100% | |
Portfolio Credit Quality
(% of total long-term
fixed-income investments)1
| | | | |
AAA/U.S. Guaranteed | | | 2.7% | |
AA | | | 0.9% | |
A | | | 20.7% | |
BBB | | | 37.2% | |
BB or Lower | | | 38.1% | |
N/R (not rated) | | | 0.4% | |
Total | | | 100% | |
| 1 | Excluding investments in derivatives. |
Holding Summaries as of June 30, 2015 (continued)
Nuveen U.S. Infrastructure Bond Fund
Fund Allocation
(% of net assets)
| | | | |
Corporate Bonds | | | 36.9% | |
Municipal Bonds | | | 61.3% | |
Other Assets Less Liabilities | | | 1.8% | |
Net Assets | | | 100% | |
States and Territories
(% of net assets)
| | | | |
California | | | 12.2% | |
Illinois | | | 11.8% | |
New York | | | 7.4% | |
New Jersey | | | 4.7% | |
Arizona | | | 4.1% | |
Ohio | | | 4.1% | |
Other | | | 17.0% | |
Total | | | 61.3% | |
Portfolio Composition
(% of net assets)
| | | | |
Transportation | | | 19.9% | |
Tax Obligation/Limited | | | 14.3% | |
Oil, Gas & Consumable Fuels | | | 12.0% | |
Utilities | | | 9.5% | |
Tax Obligation/General | | | 8.1% | |
Water and Sewer | | | 6.7% | |
Electric Utilities | | | 4.8% | |
Road & Rail | | | 4.1% | |
Other | | | 18.8% | |
Other Assets Less Liabilities | | | 1.8% | |
Net Assets | | | 100% | |
Portfolio Credit Quality
(% of total long-term investments)1
| | | | |
AAA/U.S. Guaranteed | | | 2.1% | |
AA | | | 40.3% | |
A | | | 19.8% | |
BBB | | | 14.3% | |
BB or Lower | | | 23.5% | |
Total | | | 100% | |
| 1 | Excluding investments in derivatives. |
Expense
Examples
As a shareholder of one or more of the Funds, you incur two types of costs: (1) transaction costs, including up-front and back-end sales charges (loads) or redemption fees, where applicable; and (2) ongoing costs, including management fees; distribution and service (12b-1) fees, where applicable; and other Fund expenses. The Examples below are intended to help you understand your ongoing costs (in dollars) of investing in the Funds and to compare these costs with the ongoing costs of investing in other mutual funds. Since the expense examples for Class R6 Shares reflect only the first 162 days of the Class’s operations, they may not provide a meaningful understanding of the Class’s ongoing expenses.
The Examples below are based on an investment of $1,000 invested at the beginning of the period and held through the period ended June 30, 2015.
The beginning of the period is January 1, 2015.
The information under “Actual Performance,” together with the amount you invested, allows you to estimate actual expenses incurred over the reporting period. Simply divide your account value by $1,000 (for example, an $8,600 account value divided by $1,000 = 8.60) and multiply the result by the cost shown for your share class, in the row entitled “Expenses Incurred During Period” to estimate the expenses incurred on your account during this period.
The information under “Hypothetical Performance,” provides information about hypothetical account values and hypothetical expenses based on each Fund’s actual expense ratios and an assumed rate of return of 5% per year before expenses, which is not the Fund’s actual return. The hypothetical account values and expenses may not be used to estimate the actual ending account balance or expense you incurred for the period. You may use this information to compare the ongoing costs of investing in the Fund and other funds. To do so, compare this 5% hypothetical example with the 5% hypothetical examples that appear in the shareholder reports of the other funds.
Please note that the expenses shown in the table are meant to highlight your ongoing costs only and do not reflect any transaction costs. Therefore, the hypothetical information is useful in comparing ongoing costs only, and will not help you determine the relative total costs of owning different funds or share classes. In addition, if these transaction costs were included, your costs would have been higher.
Nuveen Global Total Return Bond Fund
| | | | | | | | | | | | | | | | |
| | | Share Class | |
| | | Class A | | | Class C | | | Class R3 | | | Class I | |
Actual Performance | | | | | | | | | | | | | | | | |
Beginning Account Value | | $ | 1,000.00 | | | $ | 1,000.00 | | | $ | 1,000.00 | | | $ | 1,000.00 | |
Ending Account Value | | $ | 959.70 | | | $ | 956.10 | | | $ | 958.10 | | | $ | 960.50 | |
Expenses Incurred During Period | | $ | 4.66 | | | $ | 8.29 | | | $ | 5.92 | | | $ | 3.45 | |
Hypothetical Performance (5% annualized return before expenses) | | | | | | | | | | | | | | | | |
Beginning Account Value | | $ | 1,000.00 | | | $ | 1,000.00 | | | $ | 1,000.00 | | | $ | 1,000.00 | |
Ending Account Value | | $ | 1,020.03 | | | $ | 1,016.31 | | | $ | 1,018.74 | | | $ | 1,021.27 | |
Expenses Incurred During Period | | $ | 4.81 | | | $ | 8.55 | | | $ | 6.11 | | | $ | 3.56 | |
For each class of the Fund, expenses are equal to the Fund’s annualized net expense ratio of 0.96%, 1.71%, 1.22% and 0.71% for Classes A, C, R3 and I, respectively, multiplied by the average account value over the period, multiplied by 181/365 (to reflect the one-half year period).
Expense Examples (continued)
Nuveen High Income Bond Fund
| | | | | | | | | | | | | | | | |
| | | Share Class | |
| | | Class A | | | Class C | | | Class R3 | | | Class I | |
Actual Performance | | | | | | | | | | | | | | | | |
Beginning Account Value | | $ | 1,000.00 | | | $ | 1,000.00 | | | $ | 1,000.00 | | | $ | 1,000.00 | |
Ending Account Value | | $ | 1,016.40 | | | $ | 1,013.60 | | | $ | 1,014.10 | | | $ | 1,017.80 | |
Expenses Incurred During Period | | $ | 4.85 | | | $ | 8.59 | | | $ | 6.04 | | | $ | 3.60 | |
Hypothetical Performance (5% annualized return before expenses) | | | | | | | | | | | | | | | | |
Beginning Account Value | | $ | 1,000.00 | | | $ | 1,000.00 | | | $ | 1,000.00 | | | $ | 1,000.00 | |
Ending Account Value | | $ | 1,019.98 | | | $ | 1,016.27 | | | $ | 1,018.79 | | | $ | 1,021.22 | |
Expenses Incurred During Period | | $ | 4.86 | | | $ | 8.60 | | | $ | 6.06 | | | $ | 3.61 | |
For each class of the Fund, expenses are equal to the Fund’s annualized net expense ratio of 0.97%, 1.72%, 1.21% and 0.72% for Classes A, C, R3 and I, respectively, multiplied by the average account value over the period, multiplied by 181/365 (to reflect the one-half year period).
Nuveen Strategic Income Fund
| | | | | | | | | | | | | | | | | | | | |
| | | Share Class | |
| | | Class A | | | Class C | | | Class R3 | | | Class R6 | | | Class I | |
Actual Performance | | | | | | | | | | | | | | | | | | | | |
Beginning Account Value | | $ | 1,000.00 | | | $ | 1,000.00 | | | $ | 1,000.00 | | | $ | 1,000.00 | | | $ | 1,000.00 | |
Ending Account Value | | $ | 1,001.20 | | | $ | 997.20 | | | $ | 1,000.10 | | | $ | 999.00 | | | $ | 1,002.50 | |
Expenses Incurred During Period | | $ | 4.07 | | | $ | 7.77 | | | $ | 5.31 | | | $ | 2.22 | | | $ | 2.83 | |
Hypothetical Performance (5% annualized return before expenses) | | | | | | | | | | | | | | | | | | | | |
Beginning Account Value | | $ | 1,000.00 | | | $ | 1,000.00 | | | $ | 1,000.00 | | | $ | 1,000.00 | | | $ | 1,000.00 | |
Ending Account Value | | $ | 1,020.73 | | | $ | 1,017.01 | | | $ | 1,019.49 | | | $ | 1,019.97 | | | $ | 1,021.97 | |
Expenses Incurred During Period | | $ | 4.11 | | | $ | 7.85 | | | $ | 5.36 | | | $ | 2.24 | | | $ | 2.86 | |
For each class of the Fund, expenses are equal to the Fund’s annualized net expense ratio of 0.82%, 1.57%, 1.07% and 0.57% for Classes A, C, R3 and I, respectively, multiplied by the average account value over the period, multiplied by 181/365 (to reflect the one-half year period). For Class R6, expenses are equal to the Fund’s annualized net expense ratio of 0.50%, multiplied by the average account value over the period, multiplied by 162/365 (to reflect 162 days in the period since class commencement of operations
Nuveen U.S. Infrastructure Bond Fund (formerly Nuveen U.S. Infrastructure Income Fund)
| | | | | | | | | | | | |
| | | Share Class | |
| | | Class A | | | Class C | | | Class I | |
Actual Performance | | | | | | | | | | | | |
Beginning Account Value | | $ | 1,000.00 | | | $ | 1,000.00 | | | $ | 1,000.00 | |
Ending Account Value | | $ | 986.30 | | | $ | 982.60 | | | $ | 987.50 | |
Expenses Incurred During Period | | $ | 4.68 | | | $ | 8.36 | | | $ | 3.45 | |
Hypothetical Performance (5% annualized return before expenses) | | | | | | | | | | | | |
Beginning Account Value | | $ | 1,000.00 | | | $ | 1,000.00 | | | $ | 1,000.00 | |
Ending Account Value | | $ | 1,020.08 | | | $ | 1,016.36 | | | $ | 1,021.32 | |
Expenses Incurred During Period | | $ | 4.76 | | | $ | 8.50 | | | $ | 3.51 | |
For each class of the Fund, expenses are equal to the Fund’s annualized net expense ratio of 0.95%, 1.70% and 0.70% for Classes A, C, and I, respectively, multiplied by the average account value over the period, multiplied by 181/365 (to reflect the one half year period).
Report of
Independent Registered Public Accounting Firm
To the Board of Directors/Trustees and Shareholders of
Nuveen Investment Trust and Nuveen Investment Funds, Inc.:
In our opinion, the accompanying statements of assets and liabilities, including the portfolios of investments, and the related statements of operations and of changes in net assets and the financial highlights present fairly, in all material respects, the financial position of Nuveen Global Total Return Bond Fund and Nuveen U.S. Infrastructure Bond Fund (formerly Nuveen U.S. Infrastructure Income Fund) (each a series of Nuveen Investment Trust), and Nuveen High Income Bond Fund and Nuveen Strategic Income Fund (each a series of Nuveen Investment Funds, Inc.) (hereinafter collectively referred to as the “Funds”) at June 30, 2015, the results of each of their operations for the year then ended, the changes in each of their net assets and the financial highlights for each of the periods presented for each series of Nuveen Investment Trust, and the results of each of their operations for the year then ended, the changes in each of their net assets for each of the two years in the period then ended and the financial highlights for each of the four years in the period then ended for each series of Nuveen Investment Funds, Inc., in conformity with accounting principles generally accepted in the United States of America. These financial statements and financial highlights (hereafter referred to as “financial statements”) are the responsibility of the Funds’ management. Our responsibility is to express an opinion on these financial statements based on our audits. We conducted our audits of these financial statements in accordance with the standards of the Public Company Accounting Oversight Board (United States). Those standards require that we plan and perform the audit to obtain reasonable assurance about whether the financial statements are free of material misstatement. An audit includes examining, on a test basis, evidence supporting the amounts and disclosures in the financial statements, assessing the accounting principles used and significant estimates made by management, and evaluating the overall financial statement presentation. We believe that our audits, which included confirmation of securities at June 30, 2015 by correspondence with the custodian and brokers, provide a reasonable basis for our opinion. The financial statements of Nuveen High Income Bond Fund and Nuveen Strategic Income Fund for the periods ended June 30, 2011 and prior were audited by other independent auditors whose report dated August 26, 2011 expressed an unqualified opinion on those statements.
PricewaterhouseCoopers LLP
Chicago, IL
August 27, 2015
Nuveen Global Total Return Bond Fund
| | |
| Portfolio of Investments | | June 30, 2015 |
| | | | | | | | | | | | | | | | | | | | |
| Shares | | | Description (1) | | Coupon | | | | | | Ratings (2) | | | Value | |
| | | | | |
| | | | LONG-TERM INVESTMENTS – 98.6% | | | | | | | | | | | | | | | | |
| | | | | |
| | | | CONVERTIBLE PREFERRED SECURITIES – 0.4% | | | | | | | | | | | | | | | | |
| | | | | |
| | | | Banks – 0.4% | | | | | | | | | | | | |
| | | | | |
| | 75 | | | Bank of America Corporation | | | 7.250% | | | | | | | | BB+ | | | $ | 83,400 | |
| | | | Total Convertible Preferred Securities (cost $63,225) | | | | | | | | | | | | | | | 83,400 | |
| | | | | |
| Shares | | | Description (1) | | Coupon | | | | | | Ratings (2) | | | Value | |
| | | | | |
| | | | $25 PAR (OR SIMILAR) RETAIL PREFERRED – 1.7% | | | | | | | | | | | | | | | | |
| | | | | |
| | | | Banks – 0.9% | | | | | | | | | | | | |
| | | | | |
| | 1,875 | | | Citigroup Inc. | | | 7.125% | | | | | | | | BB+ | | | $ | 51,319 | |
| | | | | |
| | 2,400 | | | PNC Financial Services | | | 6.125% | | | | | | | | Baa2 | | | | 65,856 | |
| | | | | |
| | 2,000 | | | Regions Financial Corporation | | | 6.375% | | | | | | | | BB | | | | 50,340 | |
| | | | Total Banks | | | | | | | | | | | | | | | 167,515 | |
| | | | | |
| | | | Consumer Finance – 0.4% | | | | | | | | | | | | |
| | | | | |
| | 3,000 | | | Discover Financial Services | | | 6.500% | | | | | | | | BB– | | | | 76,410 | |
| | | | | |
| | | | Insurance – 0.4% | | | | | | | | | | | | |
| | | | | |
| | 2,400 | | | Hartford Financial Services Group Inc. | | | 7.875% | | | | | | | | BBB– | | | | 71,376 | |
| | | | Total $25 Par (or similar) Retail Preferred (cost $292,963) | | | | | | | | | | | | | | | 315,301 | |
| | | | | |
Principal
Amount (000) (3) | | | Description (1) | | Coupon | | | Maturity | | | Ratings (2) | | | Value | |
| | | | | |
| | | | CORPORATE BONDS – 51.4% | | | | | | | | | | | | | | | | |
| | | | | |
| | | | Air Freight & Logistics – 0.1% | | | | | | | | | | | | |
| | | | | |
| $ | 15 | | | XPO Logistics, Inc., 144A | | | 6.500% | | | | 6/15/22 | | | | B1 | | | $ | 14,681 | |
| | | | | |
| | | | Auto Components – 0.5% | | | | | | | | | | | | |
| | | | | |
| | 45 | | | American & Axle Manufacturing Inc. | | | 6.625% | | | | 10/15/22 | | | | BB– | | | | 47,250 | |
| | | | | |
| | 50 | | | Stackpole International Intermediate Company, 144A | | | 7.750% | | | | 10/15/21 | | | | B+ | | | | 49,250 | |
| | | | Total Auto Components | | | | | | | | | | | | | | | 96,500 | |
| | | | | |
| | | | Automobiles – 1.4% | | | | | | | | | | | | |
| | | | | |
| | 200 | EUR | | Fiat Finance & Trade SA, Reg S | | | 7.000% | | | | 3/23/17 | | | | BB– | | | | 238,857 | |
| | | | | |
| | 30 | | | General Motors Financial Company Inc. | | | 4.250% | | | | 5/15/23 | | | | BBB– | | | | 30,356 | |
| | | | Total Automobiles | | | | | | | | | | | | | | | 269,213 | |
| | | | | |
| | | | Banks – 8.9% | | | | | | | | | | | | |
| | | | | |
| | 100 | | | Bank of America Corporation | | | 4.200% | | | | 8/26/24 | | | | A– | | | | 99,759 | |
| | | | | |
| | 200 | | | Barclays Bank PLC | | | 3.650% | | | | 3/16/25 | | | | A | | | | 189,160 | |
| | | | | |
| | 45 | | | CIT Group Inc. | | | 5.000% | | | | 8/01/23 | | | | BB+ | | | | 44,325 | |
| | | | | |
| | 95 | | | Citigroup Inc. | | | 4.500% | | | | 1/14/22 | | | | A | | | | 102,330 | |
| | | | | |
| | 30 | | | Citigroup Inc. | | | 6.125% | | | | 8/25/36 | | | | A– | | | | 34,271 | |
| | | | | | | | | | | | | | | | | | | | |
Principal
Amount (000) (3) | | | Description (1) | | Coupon | | | Maturity | | | Ratings (2) | | | Value | |
| | | | | |
| | | | Banks (continued) | | | | | | | | | | | | |
| | | | | |
| $ | 200 | | | Credit Agricole SA, 144A | | | 6.625% | | | | 12/23/64 | | | | BB+ | | | $ | 195,200 | |
| | | | | |
| | 25 | | | General Electric Capital Corporation | | | 6.875% | | | | 1/10/39 | | | | AA+ | | | | 33,567 | |
| | | | | |
| | 25 | | | HSBC Holdings PLC | | | 6.800% | | | | 6/01/38 | | | | A+ | | | | 31,041 | |
| | | | | |
| | 40 | | | JPMorgan Chase & Company | | | 3.375% | | | | 5/01/23 | | | | A | | | | 38,841 | |
| | | | | |
| | 45 | | | JPMorgan Chase & Company | | | 6.400% | | | | 5/15/38 | | | | A+ | | | | 55,766 | |
| | | | | |
| | 155 | | | JPMorgan Chase & Company | | | 6.750% | | | | 12/31/49 | | | | BBB– | | | | 165,607 | |
| | | | | |
| | 35 | | | Royal Bank of Scotland Group PLC | | | 6.100% | | | | 6/10/23 | | | | BBB | | | | 37,213 | |
| | | | | |
| | 200 | | | Santander UK PLC, 144A | | | 5.000% | | | | 11/07/23 | | | | A– | | | | 204,655 | |
| | | | | |
| | 200 | | | Societe Generale, 144A | | | 5.000% | | | | 1/17/24 | | | | A– | | | | 200,271 | |
| | | | | |
| | 200 | | | State Bank of India London, 144A | | | 4.875% | | | | 4/17/24 | | | | BBB– | | | | 209,123 | |
| | | | | |
| | 25 | | | Wells Fargo & Company | | | 3.450% | | | | 2/13/23 | | | | A+ | | | | 24,865 | |
| | | | Total Banks | | | | | | | | | | | | | | | 1,665,994 | |
| | | | | |
| | | | Beverages – 1.1% | | | | | | | | | | | | |
| | | | | |
| | 200 | | | Coca-Cola Icecek AS, 144A | | | 4.750% | | | | 10/01/18 | | | | BBB | | | | 210,878 | |
| | | | | |
| | | | Building Products – 0.3% | | | | | | | | | | | | |
| | | | | |
| | 60 | | | Owens Corning Incorporated | | | 4.200% | | | | 12/15/22 | | | | BBB– | | | | 60,814 | |
| | | | | |
| | | | Capital Markets – 2.0% | | | | | | | | | | | | |
| | | | | |
| | 125 | | | Goldman Sachs Group, Inc. | | | 5.750% | | | | 1/24/22 | | | | A | | | | 142,184 | |
| | | | | |
| | 85 | | | Goldman Sachs Group, Inc. | | | 3.625% | | | | 1/22/23 | | | | A | | | | 84,464 | |
| | | | | |
| | 75 | | | Morgan Stanley | | | 3.750% | | | | 2/25/23 | | | | A | | | | 75,836 | |
| | | | | |
| | 75 | | | Morgan Stanley | | | 4.350% | | | | 9/08/26 | | | | A– | | | | 73,491 | |
| | | | Total Capital Markets | | | | | | | | | | | | | | | 375,975 | |
| | | | | |
| | | | Chemicals – 2.5% | | | | | | | | | | | | |
| | | | | |
| | 25 | | | Hexion Inc. | | | 6.625% | | | | 4/15/20 | | | | B3 | | | | 22,938 | |
| | | | | |
| | 10 | | | Huntsman International LLC | | | 8.625% | | | | 3/15/21 | | | | B+ | | | | 10,524 | |
| | | | | |
| | 200 | | | Mexichem SAB de CV, 144A | | | 4.875% | | | | 9/19/22 | | | | BBB | | | | 207,000 | |
| | | | | |
| | 25 | | | Momentive Performance Materials Inc., (4), (7) | | | 8.875% | | | | 10/15/20 | | | | N/R | | | | — | |
| | | | | |
| | 25 | | | Momentive Performance Materials Inc. | | | 3.880% | | | | 10/24/21 | | | | B | | | | 22,438 | |
| | | | | |
| | 200 | | | Office Cherifien Des Phosphates SA, 144A | | | 5.625% | | | | 4/25/24 | | | | BBB– | | | | 208,522 | |
| | | | Total Chemicals | | | | | | | | | | | | | | | 471,422 | |
| | | | | |
| | | | Consumer Finance – 0.9% | | | | | | | | | | | | |
| | | | | |
| | 100 | | | Capital One Bank | | | 3.375% | | | | 2/15/23 | | | | Baa1 | | | | 97,138 | |
| | | | | |
| | 75 | | | Discover Financial Services | | | 5.200% | | | | 4/27/22 | | | | BBB+ | | | | 79,745 | |
| | | | Total Consumer Finance | | | | | | | | | | | | | | | 176,883 | |
| | | | | |
| | | | Containers & Packaging – 0.2% | | | | | | | | | | | | |
| | | | | |
| | 50 | CAD | | Cascades Inc., 144A | | | 5.500% | | | | 7/15/21 | | | | Ba3 | | | | 39,532 | |
Nuveen Global Total Return Bond Fund (continued)
| | |
| Portfolio of Investments | | June 30, 2015 |
| | | | | | | | | | | | | | | | | | | | |
Principal
Amount (000) (3) | | | Description (1) | | Coupon | | | Maturity | | | Ratings (2) | | | Value | |
| | | | | |
| | | | Diversified Consumer Services – 0.9% | | | | | | | | | | | | |
| | | | | |
| $ | 20 | | | Nine West Holdings Incorporated, 144A | | | 8.250% | | | | 3/15/19 | | | | CCC | | | $ | 13,400 | |
| | | | | |
| | 100 | GBP | | Pizza Express, 144A | | | 6.625% | | | | 8/01/21 | | | | B | | | | 162,184 | |
| | | | Total Diversified Consumer Services | | | | | | | | | | | | | | | 175,584 | |
| | | | | |
| | | | Diversified Financial Services – 1.1% | | | | | | | | | | | | |
| | | | | |
| | 200 | | | BNP Paribas | | | 4.250% | | | | 10/15/24 | | | | A | | | | 197,253 | |
| | | | |
| | | | Diversified Telecommunication Services – 1.6% | | | | | | | | | | |
| | | | | |
| | 25 | | | AT&T, Inc. | | | 5.550% | | | | 8/15/41 | | | | A– | | | | 25,614 | |
| | | | | |
| | 35 | | | Brasil Telecom SA, 144A | | | 5.750% | | | | 2/10/22 | | | | BB+ | | | | 30,319 | |
| | | | | |
| | 100 | | | IntelSat Jackson Holdings | | | 6.625% | | | | 12/15/22 | | | | CCC+ | | | | 91,000 | |
| | | | | |
| | 65 | | | Qwest Corporation | | | 6.750% | | | | 12/01/21 | | | | BBB– | | | | 71,744 | |
| | | | | |
| | 55 | | | Verizon Communications | | | 5.150% | | | | 9/15/23 | | | | A– | | | | 60,216 | |
| | | | | |
| | 20 | | | Verizon Communications | | | 6.550% | | | | 9/15/43 | | | | A– | | | | 23,395 | |
| | | | Total Diversified Telecommunication Services | | | | | | | | | | | | | | | 302,288 | |
| | | | | |
| | | | Electric Utilities – 1.8% | | | | | | | | | | | | |
| | | | | |
| | 55 | | | APT Pipelines Limited, 144A | | | 3.875% | | | | 10/11/22 | | | | BBB | | | | 54,426 | |
| | | | | |
| | 25 | | | Constellation Energy Group | | | 5.150% | | | | 12/01/20 | | | | BBB+ | | | | 27,664 | |
| | | | | |
| | 200 | | | Eskom Holdings Limited, 144A | | | 7.125% | | | | 2/11/25 | | | | BB+ | | | | 202,356 | |
| | | | | |
| | 50 | | | FirstEnergy Corporation | | | 4.250% | | | | 3/15/23 | | | | Baa3 | | | | 50,312 | |
| | | | Total Electric Utilities | | | | | | | | | | | | | | | 334,758 | |
| | | | | |
| | | | Energy Equipment & Services – 1.6% | | | | | | | | | | | | |
| | | | | |
| | 20 | | | Diamond Offshore Drilling Inc. | | | 5.700% | | | | 10/15/39 | | | | A3 | | | | 17,507 | |
| | | | | |
| | 55 | | | Nabors Industries Inc. | | | 4.625% | | | | 9/15/21 | | | | BBB | | | | 54,641 | |
| | | | | |
| | 200 | | | Origin Energy Finance Limited, 144A | | | 3.500% | | | | 10/09/18 | | | | Baa2 | | | | 205,165 | |
| | | | | |
| | 25 | | | Weatherford International PLC | | | 7.000% | | | | 3/15/38 | | | | BBB– | | | | 23,896 | |
| | | | Total Energy Equipment & Services | | | | | | | | | | | | | | | 301,209 | |
| | | | | |
| | | | Household Durables – 0.3% | | | | | | | | | | | | |
| | | | | |
| | 50 | | | Brookfield Residential Properties Inc., 144A | | | 6.500% | | | | 12/15/20 | | | | BB– | | | | 49,771 | |
| | | | | |
| | | | Household Products – 0.5% | | | | | | | | | | | | |
| | | | | |
| | 100 | | | Kimberly-Clark de Mexico, S.A.B. de C.V, 144A | | | 3.250% | | | | 3/12/25 | | | | A | | | | 97,199 | |
| | | | | |
| | | | Independent Power & Renewable Electricity Producers – 0.7% | | | | | | | | | | | | |
| | | | | |
| | 100 | | | AES Corporation | | | 7.375% | | | | 7/01/21 | | | | BB | | | | 109,750 | |
| | | | | |
| | 20 | | | GenOn Energy Inc. | | | 9.500% | | | | 10/15/18 | | | | B | | | | 20,400 | |
| | | | Total Independent Power & Renewable Electricity Producers | | | | | | | | | | | | | | | 130,150 | |
| | | | | |
| | | | Industrial Conglomerates – 1.1% | | | | | | | | | | | | |
| | | | | |
| | 200 | | | Alfa SAB de CV, 144A | | | 5.250% | | | | 3/25/24 | | | | BBB– | | | | 205,000 | |
| | | | | |
| | | | Insurance – 0.9% | | | | | | | | | | | | |
| | | | | |
| | 50 | | | Genworth Holdings Inc. | | | 4.800% | | | | 2/15/24 | | | | Ba1 | | | | 43,625 | |
| | | | | | | | | | | | | | | | | | | | |
Principal
Amount (000) (3) | | | Description (1) | | Coupon | | | Maturity | | | Ratings (2) | | | Value | |
| | | | | |
| | | | Insurance (continued) | | | | | | | | | | | | |
| | | | | |
| $ | 30 | | | Liberty Mutual Group Inc., 144A | | | 4.950% | | | | 5/01/22 | | | | BBB | | | $ | 32,250 | |
| | | | | |
| | 100 | | | Symetra Financial Corporation | | | 4.250% | | | | 7/15/24 | | | | BBB+ | | | | 99,765 | |
| | | | Total Insurance | | | | | | | | | | | | | | | 175,640 | |
| | | | | |
| | | | Machinery – 0.8% | | | | | | | | | | | | |
| | | | | |
| | 55 | | | Eaton Corporation | | | 4.150% | | | | 11/01/42 | | | | A– | | | | 50,740 | |
| | | | | |
| | 50 | | | Ingersoll Rand | | | 5.750% | | | | 6/15/43 | | | | BBB | | | | 55,022 | |
| | | | | |
| | 40 | | | Terex Corporation | | | 6.000% | | | | 5/15/21 | | | | BB | | | | 40,200 | |
| | | | Total Machinery | | | | | | | | | | | | | | | 145,962 | |
| | | | | |
| | | | Media – 1.5% | | | | | | | | | | | | |
| | | | | |
| | 70 | | | 21st Century Fox America Inc. | | | 6.650% | | | | 11/15/37 | | | | BBB+ | | | | 85,185 | |
| | | | | |
| | 20 | | | Cequel Communication Holdings I, 144A | | | 5.125% | | | | 12/15/21 | | | | B– | | | | 18,163 | |
| | | | | |
| | 20 | | | Comcast Corporation | | | 6.400% | | | | 5/15/38 | | | | A– | | | | 24,337 | |
| | | | | |
| | 55 | | | DIRECTV Holdings LLC | | | 3.800% | | | | 3/15/22 | | | | BBB | | | | 55,316 | |
| | | | | |
| | 30 | | | NBC Universal Media LLC | | | 4.375% | | | | 4/01/21 | | | | A– | | | | 32,492 | |
| | | | | |
| | 45 | | | SES SA, 144A | | | 3.600% | | | | 4/04/23 | | | | BBB | | | | 45,657 | |
| | | | | |
| | 25 | CAD | | Videotron Limited, 144A | | | 5.625% | | | | 6/15/25 | | | | BB | | | | 20,692 | |
| | | | Total Media | | | | | | | | | | | | | | | 281,842 | |
| | | | | |
| | | | Metals & Mining – 3.8% | | | | | | | | | | | | |
| | | | | |
| | 105 | | | Alcoa Inc. | | | 5.400% | | | | 4/15/21 | | | | BBB– | | | | 110,053 | |
| | | | | |
| | 45 | | | Allegheny Technologies Inc. | | | 6.125% | | | | 8/15/23 | | | | BB+ | | | | 45,844 | |
| | | | | |
| | 25 | | | Anglogold Holdings PLC | | | 6.500% | | | | 4/15/40 | | | | Baa3 | | | | 22,764 | |
| | | | | |
| | 55 | | | ArcelorMittal | | | 7.000% | | | | 2/25/22 | | | | Ba1 | | | | 59,263 | |
| | | | | |
| | 35 | | | Century Aluminum Company, 144A | | | 7.500% | | | | 6/01/21 | | | | BB– | | | | 35,481 | |
| | | | | |
| | 50 | | | Cliffs Natural Resources Inc. | | | 4.800% | | | | 10/01/20 | | | | B3 | | | | 23,750 | |
| | | | | |
| | 25 | | | Coeur d’Alene Mines Corporation | | | 7.875% | | | | 2/01/21 | | | | B | | | | 21,188 | |
| | | | | |
| | 25 | | | First Quantum Minerals Limited, 144A | | | 6.750% | | | | 2/15/20 | | | | BB– | | | | 24,188 | |
| | | | | |
| | 75 | | | Freeport McMoRan, Inc. | | | 3.550% | | | | 3/01/22 | | | | BBB | | | | 69,422 | |
| | | | | |
| | 65 | | | Newmont Mining Corporation | | | 3.500% | | | | 3/15/22 | | | | BBB | | | | 62,032 | |
| | | | | |
| | 35 | | | Teck Resources Limited | | | 6.250% | | | | 7/15/41 | | | | BBB– | | | | 28,166 | |
| | | | | |
| | 25 | | | Vale Overseas Limited | | | 6.875% | | | | 11/10/39 | | | | BBB+ | | | | 24,060 | |
| | | | | |
| | 80 | | | Xstrata Finance Canada Limited, 144A | | | 3.600% | | | | 1/15/17 | | | | BBB | | | | 82,114 | |
| | | | | |
| | 100 | | | Yamana Gold Inc. | | | 4.950% | | | | 7/15/24 | | | | Baa3 | | | | 96,323 | |
| | | | Total Metals & Mining | | | | | | | | | | | | | | | 704,648 | |
| | | | | |
| | | | Multiline Retail – 0.1% | | | | | | | | | | | | |
| | | | | |
| | 25 | | | Family Tree Escrow LLC, 144A | | | 5.250% | | | | 3/01/20 | | | | Ba3 | | | | 26,156 | |
| | | | | |
| | | | Oil, Gas & Consumable Fuels – 6.8% | | | | | | | | | | | | |
| | | | | |
| | 50 | | | Amerada Hess Corporation | | | 7.125% | | | | 3/15/33 | | | | BBB | | | | 57,363 | |
| | | | | |
| | 50 | | | Anadarko Petroleum Corporation | | | 6.200% | | | | 3/15/40 | | | | BBB | | | | 56,351 | |
Nuveen Global Total Return Bond Fund (continued)
| | |
| Portfolio of Investments | | June 30, 2015 |
| | | | | | | | | | | | | | | | | | | | |
Principal
Amount (000) (3) | | | Description (1) | | Coupon | | | Maturity | | | Ratings (2) | | | Value | |
| | | | | |
| | | | Oil, Gas & Consumable Fuels (continued) | | | | | | | | | | | | |
| | | | | |
| $ | 80 | | | Apache Corporation | | | 4.250% | | | | 1/15/44 | | | | BBB+ | | | $ | 69,475 | |
| | | | | |
| | 150 | CAD | | Baytex Energy Corporation | | | 6.625% | | | | 7/19/22 | | | | BB | | | | 123,098 | |
| | | | | |
| | 70 | | | California Resources Corporation | | | 5.500% | | | | 9/15/21 | | | | BB | | | | 60,914 | |
| | | | | |
| | 25 | | | Calumet Specialty Products | | | 7.625% | | | | 1/15/22 | | | | B+ | | | | 25,500 | |
| | | | | |
| | 30 | | | Cenovus Energy Inc. | | | 3.800% | | | | 9/15/23 | | | | BBB+ | | | | 29,642 | |
| | | | | |
| | 200 | | | CNOOC Finance 2014 ULC | | | 4.250% | | | | 4/30/24 | | | | AA– | | | | 204,248 | |
| | | | | |
| | 5 | | | Concho Resources Inc. | | | 5.500% | | | | 10/01/22 | | | | BB+ | | | | 4,975 | |
| | | | | |
| | 25 | | | Martin Mid-Stream Partners LP Finance | | | 7.250% | | | | 2/15/21 | | | | B– | | | | 24,563 | |
| | | | | |
| | 20 | CAD | | Paramount Resources Limited, 144A | | | 7.625% | | | | 12/04/19 | | | | BB– | | | | 16,593 | |
| | | | | |
| | 25 | | | Petrobras International Finance Company | | | 5.375% | | | | 1/27/21 | | | | BBB– | | | | 24,045 | |
| | | | | |
| | 25 | | | Petrobras International Finance Company | | | 6.875% | | | | 1/20/40 | | | | BBB– | | | | 22,272 | |
| | | | | |
| | 200 | | | Sinopec Group Overseas Development 2012, 144A | | | 3.900% | | | | 5/17/22 | | | | AA– | | | | 204,388 | |
| | | | | |
| | 200 | | | Thai Oil PCL, 144A | | | 3.625% | | | | 1/23/23 | | | | Baa1 | | | | 196,850 | |
| | | | | |
| | 85 | | | Transocean Inc. | | | 3.800% | | | | 10/15/22 | | | | BBB– | | | | 63,963 | |
| | | | | |
| | 50 | | | Western Refining Inc. | | | 6.250% | | | | 4/01/21 | | | | B+ | | | | 50,375 | |
| | | | | |
| | 45 | | | Woodside Finance Limited, 144A | | | 3.650% | | | | 3/05/25 | | | | BBB+ | | | | 43,217 | |
| | | | Total Oil, Gas & Consumable Fuels | | | | | | | | | | | | | | | 1,277,832 | |
| | | | | |
| | | | Paper & Forest Products – 0.8% | | | | | | | | | | | | |
| | | | | |
| | 25 | | | Domtar Corporation | | | 4.400% | | | | 4/01/22 | | | | BBB– | | | | 25,407 | |
| | | | | |
| | 80 | | | Domtar Corporation | | | 6.750% | | | | 2/15/44 | | | | BBB– | | | | 84,561 | |
| | | | | |
| | 50 | | | Resolute Forest Products | | | 5.875% | | | | 5/15/23 | | | | BB– | | | | 45,500 | |
| | | | Total Paper & Forest Products | | | | | | | | | | | | | | | 155,468 | |
| | | | | |
| | | | Personal Products – 0.2% | | | | | | | | | | | | |
| | | | | |
| | 30 | | | International Paper Company | | | 8.700% | | | | 6/15/38 | | | | BBB | | | | 41,109 | |
| | | | | |
| | | | Real Estate Investment Trust – 1.7% | | | | | | | | | | | | |
| | | | | |
| | 70 | | | American Tower Company | | | 5.000% | | | | 2/15/24 | | | | BBB | | | | 74,000 | |
| | | | | |
| | 50 | | | ARC Property Operating Partnership LP, Clark Acquisition LLC | | | 4.600% | | | | 2/06/24 | | | | BB+ | | | | 48,698 | |
| | | | | |
| | 75 | | | Digital Realty Trust Inc. | | | 3.625% | | | | 10/01/22 | | | | BBB | | | | 73,146 | |
| | | | | |
| | 80 | | | HCP Inc. | | | 3.750% | | | | 2/01/19 | | | | BBB+ | | | | 83,217 | |
| | | | | |
| | 15 | | | Prologis Inc. | | | 6.875% | | | | 3/15/20 | | | | BBB+ | | | | 17,328 | |
| | | | | |
| | 20 | | | Simon Property Group, L.P. | | | 5.650% | | | | 2/01/20 | | | | A | | | | 22,793 | |
| | | | Total Real Estate Investment Trust | | | | | | | | | | | | | | | 319,182 | |
| | | | | |
| | | | Road & Rail – 0.2% | | | | | | | | | | | | |
| | | | | |
| | 30 | | | Hertz Corporation | | | 7.375% | | | | 1/15/21 | | | | B | | | | 31,238 | |
| | | | | |
| | | | Software – 1.6% | | | | | | | | | | | | |
| | | | | |
| | 25 | | | BMC Software Finance Inc., 144A | | | 8.125% | | | | 7/15/21 | | | | CCC+ | | | | 20,250 | |
| | | | | |
| | 75 | | | Computer Sciences Corporation | | | 4.450% | | | | 9/15/22 | | | | BBB+ | | | | 76,986 | |
| | | | | | | | | | | | | | | | | | | | |
Principal
Amount (000) (3) | | | Description (1) | | Coupon | | | Maturity | | | Ratings (2) | | | Value | |
| | | | | |
| | | | Software (continued) | | | | | | | | | | | | |
| | | | | |
| $ | 200 | | | SixSigma Networks Mexico SA de CV, 144A | | | 8.250% | | | | 11/07/21 | | | | BB– | | | $ | 206,740 | |
| | | | Total Software | | | | | | | | | | | | | | | 303,976 | |
| | | | | |
| | | | Specialty Retail – 0.3% | | | | | | | | | | | | |
| | | | | |
| | 35 | | | Swiss Re Treasury US Corporation, 144A | | | 4.250% | | | | 12/06/42 | | | | AA– | | | | 33,771 | |
| | | | | |
| | 25 | | | The Men’s Warehouse Inc., 144A | | | 7.000% | | | | 7/01/22 | | | | B2 | | | | 26,750 | |
| | | | Total Specialty Retail | | | | | | | | | | | | | | | 60,521 | |
| | | | | |
| | | | Tobacco – 0.7% | | | | | | | | | | | | |
| | | | | |
| | 100 | | | Altria Group Inc. | | | 2.850% | | | | 8/09/22 | | | | BBB+ | | | | 96,121 | |
| | | | | |
| | 30 | | | Reynolds American Inc. | | | 3.250% | | | | 11/01/22 | | | | BBB– | | | | 28,895 | |
| | | | Total Tobacco | | | | | | | | | | | | | | | 125,016 | |
| | | | | |
| | | | Trading Companies & Distributors – 0.6% | | | | | | | | | | | | |
| | | | | |
| | 100 | | | United Rentals North America Inc. | | | 7.375% | | | | 5/15/20 | | | | BB– | | | | 106,699 | |
| | | | | |
| | | | Transportation Infrastructure – 0.2% | | | | | | | | | | | | |
| | | | | |
| | 35 | | | Asciano Finance, 144A | | | 5.000% | | | | 4/07/18 | | | | BBB | | | | 37,510 | |
| | | | | |
| | | | Wireless Telecommunication Services – 3.7% | | | | | | | | | | | | |
| | | | | |
| | 75 | | | Colombia Telecommunicaciones S.A. ESP, 144A | | | 8.500% | | | | 9/30/65 | | | | B+ | | | | 77,813 | |
| | | | | |
| | 150 | | | Deutsche Telekom International Finance BV, 144A | | | 4.875% | | | | 3/06/42 | | | | BBB+ | | | | 150,026 | |
| | | | | |
| | 200 | | | ENTEL Chile SA, 144A | | | 4.750% | | | | 8/01/26 | | | | BBB+ | | | | 196,330 | |
| | | | | |
| | 200 | | | Softbank Corporation, 144A | | | 4.500% | | | | 4/15/20 | | | | BB+ | | | | 200,750 | |
| | | | | |
| | 50 | | | Sprint Corporation | | | 7.250% | | | | 9/15/21 | | | | B+ | | | | 48,750 | |
| | | | | |
| | 28 | | | Viacom Inc. | | | 4.375% | | | | 3/15/43 | | | | BBB+ | | | | 22,684 | |
| | | | Total Wireless Telecommunication Services | | | | | | | | | | | | | | | 696,353 | |
| | | | Total Corporate Bonds (cost $9,698,380) | | | | | | | | | | | | | | | 9,664,256 | |
| | | | | |
Principal
Amount (000) | | | Description (1) | | Coupon | | | Maturity | | | Ratings (2) | | | Value | |
| | | |
| | | | CONVERTIBLE BONDS – 0.1% | | | | | | | | | |
| | | | | |
| | | | Real Estate Investment Trust – 0.1% | | | | | | | | | | | | |
| | | | | |
| $ | 20 | | | Boston Properties Limited Partnership | | | 4.125% | | | | 5/15/21 | | | | A– | | | $ | 21,248 | |
| $ | 20 | | | Total Convertible Bonds (cost $20,281) | | | | | | | | | | | | | | | 21,248 | |
| | | | | |
Principal
Amount (000) | | | Description (1) | | Coupon | | | Maturity | | | Ratings (2) | | | Value | |
| | | | | |
| | | | $1,000 PAR (OR SIMILAR) INSTITUTIONAL PREFERRED – 4.8% | | | | | | | | | | | | | | | | |
| | | | | |
| | | | Banks – 2.4% | | | | | | | | | | | | |
| | | | | |
| $ | 200 | | | Barclays PLC | | | 8.250% | | | | N/A (5) | | | | BB+ | | | $ | 211,192 | |
| | | | | |
| | 35 | | | Fifth Third Bancorp. | | | 5.100% | | | | N/A (5) | | | | Baa3 | | | | 32,813 | |
| | | | | |
| | 200 | | | HSBC Holdings PLC | | | 6.375% | | | | N/A (5) | | | | BBB | | | | 200,500 | |
| | 435 | | | Total Banks | | | | | | | | | | | | | | | 444,505 | |
Nuveen Global Total Return Bond Fund (continued)
| | |
| Portfolio of Investments | | June 30, 2015 |
| | | | | | | | | | | | | | | | | | | | |
| | | | | |
Principal
Amount (000) | | | Description (1) | | Coupon | | | Maturity | | | Ratings (2) | | | Value | |
| | | | | |
| | | | Capital Markets – 1.4% | | | | | | | | | | | | |
| | | | | |
| $ | 75 | | | Goldman Sachs Capital II | | | 4.000% | | | | N/A (5) | | | | Ba1 | | | $ | 57,094 | |
| | | | | |
| | 200 | | | UBS Group AG, Reg S | | | 7.125% | | | | N/A (5) | | | | BB+ | | | | 208,220 | |
| | 275 | | | Total Capital Markets | | | | | | | | | | | | | | | 265,314 | |
| | | | | |
| | | | Diversified Financial Services – 0.2% | | | | | | | | | | | | |
| | | | | |
| | 30 | | | Rabobank Nederland, 144A | | | 11.000% | | | | N/A (5) | | | | Baa2 | | | | 38,025 | |
| | | | | |
| | | | Electric Utilities – 0.5% | | | | | | | | | | | | |
| | | | | |
| | 100 | | | Electricite de France, 144A | | | 5.250% | | | | N/A (5) | | | | A– | | | | 100,125 | |
| | | | | |
| | | | Insurance – 0.3% | | | | | | | | | | | | |
| | | | | |
| | 25 | | | Genworth Financial Inc. | | | 6.150% | | | | 11/15/66 | | | | Ba2 | | | | 15,250 | |
| | | | | |
| | 50 | | | Prudential Financial Inc. | | | 5.200% | | | | 3/15/44 | | | | BBB+ | | | | 49,524 | |
| | 75 | | | Total Insurance | | | | | | | | | | | | | | | 64,774 | |
| $ | 915 | | | Total $1,000 Par (or similar) Institutional Preferred (cost $929,926) | | | | | | | | | | | | | | | 912,743 | |
| | | | | |
Principal
Amount (000) | | | Description (1) | | Coupon | | | Maturity | | | Ratings (2) | | | Value | |
| | | | | |
| | | | ASSET-BACKED AND MORTGAGE–BACKED SECURITIES – 4.8% | | | | | | | | | | | | |
| | | | | |
| $ | 58 | | | Banc of America Alternative Loan Trust, Pass Through Certificates, Series 2006-6 | | | 6.000% | | | | 7/25/46 | | | | Caa3 | | | $ | 47,448 | |
| | | | | |
| | 55 | | | Countrywide Asset Backed Certificates, Series 2007-4 A2 | | | 5.530% | | | | 4/25/47 | | | | Caa1 | | | | 57,629 | |
| | | | | |
| | 34 | | | Countrywide Home Loans Mortgage, Series 2005-27 | | | 5.500% | | | | 12/25/35 | | | | Caa1 | | | | 32,200 | |
| | | | | |
| | 145 | | | Fannie Mae TBA Mortgage Pool, (WI/DD) | | | 4.500% | | | | TBA | | | | Aaa | | | | 566,822 | |
| | | | | |
| | 535 | | | Fannie Mae TBA Mortgage Pool, (WI/DD) | | | 4.000% | | | | TBA | | | | Aaa | | | | 156,759 | |
| | | | | |
| | 40 | | | Freddie Mac Mortgage Trust, Multifamily Mortgage Pass-Through Certificates, Series 2013-K712, 144A | | | 3.484% | | | | 5/25/45 | | | | Aaa | | | | 40,715 | |
| $ | 867 | | | Total Asset-Backed and Mortgage–Backed Securities (cost $897,664) | | | | | | | | | | | | | | | 901,573 | |
| | | | | |
Principal
Amount (000) (3) | | | Description (1) | | Coupon | | | Maturity | | | Ratings (2) | | | Value | |
| | | | | |
| | | | SOVEREIGN DEBT – 35.4% | | | | | | | | | | | | | | | | |
| | | | | |
| | | | Australia – 1.4% | | | | | | | | | | | | |
| | | | | |
| | 325 | AUD | | Australian Government, Reg S | | | 4.250% | | | | 7/21/17 | | | | Aaa | | | $ | 261,920 | |
| | | | | |
| | | | Bermuda – 0.6% | | | | | | | | | | | | |
| | | | | |
| $ | 100 | | | Bermuda Government, 144A | | | 5.603% | | | | 7/20/20 | | | | A+ | | | | 111,000 | |
| | | | | |
| | | | Brazil – 1.0% | | | | | | | | | | | | |
| | | | | |
| | 600 | BRL | | Letra De Tesouro Nacional de Brazil | | | 0.000% | | | | 1/01/16 | | | | BBB+ | | | | 180,241 | |
| | | | | |
| | | | Colombia – 0.9% | | | | | | | | | | | | |
| | | | | |
| | 130 | | | Republic of Colombia | | | 8.125% | | | | 5/21/24 | | | | BBB | | | | 166,595 | |
| | | | | |
| | | | Costa Rica – 1.0% | | | | | | | | | | | | |
| | | | | |
| | 200 | | | Republic of Costa Rica, 144A | | | 7.000% | | | | 4/04/44 | | | | Ba1 | | | | 193,500 | |
| | | | | | | | | | | | | | | | | | | | |
| | | | | |
Principal
Amount (000) (3) | | | Description (1) | | Coupon | | | Maturity | | | Ratings (2) | | | Value | |
| | | | | |
| | | | Dominican Republic – 0.5% | | | | | | | | | | | | |
| | | | | |
| $ | 100 | | | Dominican Republic, 144A | | | 5.500% | | | | 1/27/25 | | | | BB– | | | $ | 100,250 | |
| | | | | |
| | | | Germany – 0.8% | | | | | | | | | | | | |
| | | | | |
| | 120 | EUR | | Bundesobligation, Reg S | | | 1.750% | | | | 2/15/24 | | | | Aaa | | | | 146,426 | |
| | | | | |
| | | | Hungary – 1.8% | | | | | | | | | | | | |
| | | | | |
| | 85,000 | HUF | | Republic of Hungary, Government Bond | | | 5.500% | | | | 6/24/25 | | | | BBB– | | | | 338,376 | |
| | | | | |
| | | | Indonesia – 1.2% | | | | | | | | | | | | |
| | | | | |
| | 100 | | | Republic of Indonesia, 144A | | | 5.875% | | | | 3/13/20 | | | | Baa3 | | | | 111,250 | |
| | | | | |
| | 100 | EUR | | Republic of Indonesia, 144A | | | 2.875% | | | | 7/08/21 | | | | Baa3 | | | | 112,321 | |
| | | | Total Indonesia | | | | | | | | | | | | | | | 223,571 | |
| | | | | |
| | | | Italy – 1.4% | | | | | | | | | | | | |
| | | | | |
| | 210 | EUR | | Buoni Poliennali del Tesoro, Italian Treasury Bond | | | 3.750% | | | | 9/01/24 | | | | BBB+ | | | | 262,322 | |
| | | | | |
| | | | Malaysia – 1.4% | | | | | | | | | | | | |
| | | | | |
| | 1,000 | MYR | | Republic of Malaysia | | | 3.172% | | | | 7/15/16 | | | | A | | | | 265,408 | |
| | | | | |
| | | | Mexico – 11.0% | | | | | | | | | | | | |
| | | | | |
| | 4,750 | MXN | | Mexico Bonos de DeSarrollo | | | 7.750% | | | | 12/14/17 | | | | A | | | | 326,320 | |
| | | | | |
| | 9,000 | MXN | | Mexico Bonos de DeSarrollo | | | 4.750% | | | | 6/14/18 | | | | A3 | | | | 574,938 | |
| | | | | |
| | 3,000 | MXN | | Mexico Bonos de DeSarrollo | | | 5.000% | | | | 12/11/19 | | | | A | | | | 189,293 | |
| | | | | |
| | 8,650 | MXN | | Mexico Bonos de DeSarrollo | | | 8.000% | | | | 12/07/23 | | | | A | | | | 621,897 | |
| | | | | |
| | 3,825 | MXN | | Mexico Bonos de DeSarrollo | | | 7.750% | | | | 11/13/42 | | | | A | | | | 271,214 | |
| | | | | |
| | 100 | EUR | | United Mexican States | | | 4.000% | | | | 10/15/30 | | | | A3 | | | | 96,660 | |
| | | | Total Mexico | | | | | | | | | | | | | | | 2,080,322 | |
| | | | | |
| | | | Poland – 3.1% | | | | | | | | | | | | |
| | | | | |
| | 200 | PLN | | Republic of Poland | | | 3.250% | | | | 7/25/19 | | | | A | | | | 54,687 | |
| | | | | |
| | 500 | PLN | | Republic of Poland | | | 5.750% | | | | 9/23/22 | | | | A | | | | 155,251 | |
| | | | | |
| | 1,300 | PLN | | Republic of Poland | | | 4.000% | | | | 10/25/23 | | | | A | | | | 366,074 | |
| | | | Total Poland | | | | | | | | | | | | | | | 576,012 | |
| | | | | |
| | | | Portugal – 0.9% | | | | | | | | | | | | |
| | | | | |
| | 160 | EUR | | Portugal Obrigacoes do Tesouro, 144A, Reg S | | | 2.875% | | | | 10/15/25 | | | | Ba1 | | | | 176,746 | |
| | | | | |
| | | | Romania – 0.6% | | | | | | | | | | | | |
| | | | | |
| | 100 | | | Republic of Romania, 144A | | | 6.125% | | | | 1/22/44 | | | | BBB– | | | | 112,200 | |
| | | | | |
| | | | South Africa – 5.6% | | | | | | | | | | | | |
| | | | | |
| | 3,800 | ZAR | | Republic of South Africa | | | 7.250% | | | | 1/15/20 | | | | BBB+ | | | | 306,068 | |
| | | | | |
| | 4,900 | ZAR | | Republic of South Africa | | | 6.750% | | | | 3/31/21 | | | | BBB+ | | | | 381,093 | |
| | | | | |
| | 3,800 | ZAR | | Republic of South Africa | | | 10.500% | | | | 12/21/26 | | | | BBB+ | | | | 363,571 | |
| | | | Total South Africa | | | | | | | | | | | | | | | 1,050,732 | |
Nuveen Global Total Return Bond Fund (continued)
| | |
| Portfolio of Investments | | June 30, 2015 |
| | | | | | | | | | | | | | | | | | | | |
| | | | | |
Principal
Amount (000) (3) | | | Description (1) | | Coupon | | | Maturity | | | Ratings (2) | | | Value | |
| | | | | |
| | | | Sweden – 0.8% | | | | | | | | | | | | |
| | | | | |
| | 1,000 | SEK | | Republic of Sweden | | | 3.500% | | | | 6/01/22 | | | | Aaa | | | $ | 143,856 | |
| | | | | |
| | | | United Kingdom – 0.9% | | | | | | | | | | | | |
| | | | | |
| | 100 | GBP | | United Kingdom, Treasury Bill, Reg S | | | 3.750% | | | | 9/07/19 | | | | Aa1 | | | | 172,910 | |
| | | | | |
| | | | Uruguay – 0.5% | | | | | | | | | | | | |
| | | | | |
| $ | 100 | | | Republic of Uruguay | | | 5.100% | | | | 6/18/50 | | | | BBB | | | | 95,250 | |
| | | | Total Sovereign Debt (cost $7,807,071) | | | | | | | | | | | | | | | 6,657,637 | |
| | | | Total Long-Term Investments (cost $19,709,510) | | | | | | | | | | | | | | | 18,556,158 | |
| | | | | |
Principal
Amount (000) | | | Description (1) | | Coupon | | | Maturity | | | | | | Value | |
| | | | | |
| | | | SHORT-TERM INVESTMENTS – 4.3% | | | | | | | | | | | | | | | | |
| | | | | |
| | | | Repurchase Agreements – 4.3% | | | | | | | | | | | | |
| | | | | |
| $ | 803 | | | Repurchase Agreement with Fixed Income Clearing Corporation, dated 6/30/15, repurchase price $802,879, collateralized by $825,000 U.S. Treasury Notes, 2.250%, due 11/15/24, value $820,875 | | | 0.000% | | | | 7/01/15 | | | | | | | $ | 802,879 | |
| | | | Total Short-Term Investments (cost $802,879) | | | | | | | | | | | | | | | 802,879 | |
| | | | Total Investments (cost $20,512,389) – 102.9% | | | | | | | | | | | | | | | 19,359,037 | |
| | | | Other Assets Less Liabilities – (2.9)% (6) | | | | | | | | | | | | | | | (539,642 | ) |
| | | | Net Assets – 100% | | | | | | | | | | | | | | $ | 18,819,395 | |
Investments in Derivatives as of June 30, 2015
Forward Foreign Currency Exchange Contracts outstanding:
| | | | | | | | | | | | | | | | | | | | |
| Counterparty | | Currency Contracts to Deliver | | Amount
(Local Currency) | | | In Exchange
For Currency | | Amount
(Local Currency) | | | Settlement
Date | | | Unrealized Appreciation
Depreciation)
(U.S. Dollars) | |
| Bank of America | | Canadian Dollar | | | 770,000 | | | U.S. Dollar | | | 614,972 | | | | 7/31/15 | | | $ | (1,291 | ) |
| Bank of America | | Hungarian Forint | | | 102,000,000 | | | U.S. Dollar | | | 377,764 | | | | 7/13/15 | | | | 17,348 | |
| Bank of America | | Mexican Peso | | | 7,500,000 | | | U.S. Dollar | | | 477,340 | | | | 7/31/15 | | | | 1,146 | |
| Bank of America | | Mexican Peso | | | 14,800,000 | | | U.S. Dollar | | | 949,799 | | | | 7/31/15 | | | | 10,107 | |
| Bank of America | | U.S. Dollar | | | 1,888 | | | Hungarian Forint | | | 530,000 | | | | 7/13/15 | | | | (15 | ) |
| Bank of America | | U.S. Dollar | | | 5,665 | | | Hungarian Forint | | | 1,600,000 | | | | 7/13/15 | | | | (11 | ) |
| Bank of America | | U.S. Dollar | | | 579,470 | | | Malaysian Ringgit | | | 2,100,000 | | | | 7/14/15 | | | | (20,454 | ) |
| Bank of America | | U.S. Dollar | | | 550,063 | | | Indonesian Rupiah | | | 7,400,000,000 | | | | 7/15/15 | | | | 2,890 | |
| Bank of America | | U.S. Dollar | | | 814,565 | | | Mexican Peso | | | 12,550,000 | | | | 7/31/15 | | | | (17,732 | ) |
| Bank of America | | U.S. Dollar | | | 958,723 | | | Mexican Peso | | | 14,800,000 | | | | 7/31/15 | | | | (19,032 | ) |
| Bank of America | | U.S. Dollar | | | 555,427 | | | Indian Rupee | | | 36,000,000 | | | | 8/10/15 | | | | 7,648 | |
| Bank of America | | U.S. Dollar | | | 367,751 | | | Polish Zloty | | | 1,373,000 | | | | 8/31/15 | | | | (3,165 | ) |
| Citigroup | | Euro | | | 880,000 | | | U.S. Dollar | | | 961,284 | | | | 7/31/15 | | | | (20,151 | ) |
| Citigroup | | Swedish Krona | | | 1,090,000 | | | U.S. Dollar | | | 125,310 | | | | 7/31/15 | | | | (6,252 | ) |
| Citigroup | | U.S. Dollar | | | 116,840 | | | Euro | | | 107,000 | | | | 7/31/15 | | | | 2,494 | |
| Citigroup | | U.S. Dollar | | | 1,046,342 | | | Euro | | | 940,000 | | | | 7/31/15 | | | | 2,009 | |
| Citigroup | | U.S. Dollar | | | 999,386 | | | Japanese Yen | | | 124,000,000 | | | | 7/31/15 | | | | 14,159 | |
| Credit Suisse | | Brazilian Real | | | 543,000 | | | U.S. Dollar | | | 169,301 | | | | 7/02/15 | | | | (5,347 | ) |
| Credit Suisse | | Brazilian Real | | | 543,000 | | | U.S. Dollar | | | 173,877 | | | | 8/04/15 | | | | 1,240 | |
| Credit Suisse | | U.S. Dollar | | | 175,842 | | | Brazilian Real | | | 543,000 | | | | 7/02/15 | | | | (1,193 | ) |
| Deutsche Bank | | U.S. Dollar | | | 341,334 | | | Pound Sterling | | | 220,000 | | | | 7/22/15 | | | | 4,293 | |
| Deutsche Bank | | U.S. Dollar | | | 621,284 | | | Pound Sterling | | | 400,000 | | | | 7/22/15 | | | | 7,130 | |
Investments in Derivatives as of June 30, 2015 (continued)
Forward Foreign Currency Exchange Contracts outstanding (continued):
| | | | | | | | | | | | | | | | | | | | |
| Counterparty | | Currency Contracts to Deliver | | Amount
(Local Currency) | | | In Exchange
For Currency | | Amount
(Local Currency) | | | Settlement
Date | | | Unrealized Appreciation
Depreciation)
(U.S. Dollars) | |
| Deutsche Bank | | U.S. Dollar | | | 928,333 | | | Japanese Yen | | | 115,000,000 | | | | 7/31/15 | | | $ | 11,648 | |
| Deutsche Bank | | U.S. Dollar | | | 947,326 | | | Japanese Yen | | | 117,000,000 | | | | 7/31/15 | | | | 9,002 | |
| Goldman Sachs | | Canadian Dollar | | | 226,000 | | | U.S. Dollar | | | 183,030 | | | | 8/31/15 | | | | 2,231 | |
| Goldman Sachs | | Canadian Dollar | | | 409,000 | | | U.S. Dollar | | | 328,517 | | | | 8/31/15 | | | | 1,318 | |
| Goldman Sachs | | U.S. Dollar | | | 896,010 | | | Pound Sterling | | | 569,000 | | | | 8/28/15 | | | | (2,328 | ) |
| Morgan Stanley | | Australian Dollar | | | 1,250,000 | | | U.S. Dollar | | | 957,375 | | | | 7/31/15 | | | | (5,533 | ) |
| Morgan Stanley | | Australian Dollar | | | 1,250,000 | | | U.S. Dollar | | | 957,375 | | | | 7/31/15 | | | | (5,533 | ) |
| Morgan Stanley | | Singapore Dollar | | | 1,300,000 | | | U.S. Dollar | | | 961,944 | | | | 7/31/15 | | | | (2,843 | ) |
| Morgan Stanley | | South African Rand | | | 12,500,000 | | | U.S. Dollar | | | 983,696 | | | | 7/31/15 | | | | (38,657 | ) |
| Morgan Stanley | | South Korean Won | | | 880,000,000 | | | U.S. Dollar | | | 789,202 | | | | 8/03/15 | | | | 4,014 | |
| Morgan Stanley | | U.S. Dollar | | | 593,022 | | | Malaysian Ringgit | | | 2,150,000 | | | | 7/14/15 | | | | (20,696 | ) |
| Morgan Stanley | | U.S. Dollar | | | 597,113 | | | Chilean Peso | | | 362,000,000 | | | | 7/22/15 | | | | (31,880 | ) |
| Morgan Stanley | | U.S. Dollar | | | 966,700 | | | Australian Dollar | | | 1,250,000 | | | | 7/31/15 | | | | (3,792 | ) |
| | | | | | | | | | | | | | | | | | | $ | (107,228 | ) |
Interest Rate Swaps outstanding:
| | | | | | | | | | | | | | | | | | | | | | | | | | | | | | | | |
| Counterparty | | Notional
Amount | | | Fund
Pay/Receive
Floating Rate | | | Floating Rate Index | | | Fixed Rate
(Annualized) | | | Fixed Rate
Payment
Frequency | | | Termination
Date | | | Value | | | Unrealized
Appreciation
(Depreciation) | |
JPMorgan | | $ | 200,000 | | | | Receive | | | | 3-Month USD-LIBOR-ICE | | | | 2.078 | % | | | Semi-Annually | | | | 2/19/23 | | | $ | (1,248 | ) | | $ | (1,248 | ) |
Futures Contracts outstanding:
| | | | | | | | | | | | | | | | | | | | | | | | |
| Description | | Contract
Position | | | Number of
Contracts | | | Contract
Expiration | | | Notional
Amount at
Value* | | | Variation Margin
Receivable/ (Payable) | | | Unrealized
Appreciation
(Depreciation) | |
Euro-Bund | | | Long | | | | 4 | | | | 9/15 | | | $ | 677,829 | | | $ | 1,020 | | | $ | 7,064 | |
U.S. Treasury 5-Year Note | | | Short | | | | (9 | ) | | | 9/15 | | | | (1,073,320 | ) | | | 351 | | | | (296 | ) |
U.S. Treasury 10-Year Note | | | Short | | | | (18 | ) | | | 9/15 | | | | (2,271,094 | ) | | | 563 | | | | 16,053 | |
| | | | | | | | | | | | | | | $ | (2,666,585 | ) | | $ | 1,934 | | | $ | 22,821 | |
| * | Total aggregate Notional Amount at Value of long and short positions is $677,829 and $(3,344,414), respectively. |
Nuveen Global Total Return Bond Fund (continued)
| | |
| Portfolio of Investments | | June 30, 2015 |
For Fund portfolio compliance purposes, the Fund’s industry classifications refer to any one or more of the industry sub-classifications used by one or more widely recognized market indexes or ratings group indexes, and/or as defined by Fund management. This definition may not apply for purposes of this report, which may combine industry sub-classifications into sectors for reporting ease.
| (1) | All percentages shown in the Portfolio of Investments are based on net assets. |
| (2) | Ratings (not covered by the report of independent registered public accounting firm): Using the highest of Standard & Poor’s Group (“Standard & Poor’s”), Moody’s Investors Service, Inc. (“Moody’s”) or Fitch, Inc. (“Fitch”) rating. Ratings below BBB by Standard & Poor’s, Baa by Moody’s or BBB by Fitch are considered to be below investment grade. Holdings designated N/R are not rated by any of these national rating agencies. |
| (3) | Principal Amount (000) denominated in U.S. Dollars, unless otherwise noted. |
| (4) | Investment valued at fair value using methods determined in good faith by, or at the discretion of, the Board. For fair value measurement disclosure purposes, investment classified as Level 3. See Notes to Financial Statements, Note 2 – Investment Valuation and Fair Value Measurements for more information. |
| (5) | Perpetual security. Maturity date is not applicable. |
| (6) | Other assets less liabilities includes the unrealized appreciation (depreciation) of the over-the-counter derivatives as presented on the Statement of Assets and Liabilities. The unrealized appreciation (depreciation) of exchange-cleared and exchange-traded derivatives is recognized as part of the cash collateral at brokers and/or the receivable or payable for variation margin as presented on the Statement of Assets and Liabilities, when applicable. |
| (7) | As of, or subsequent to, the end of the reporting period, this security is non-income producing. Non-income producing, in the case of a fixed-income security, generally denotes that the issuer has (1) defaulted on the payment of principal or interest, (2) is under the protection of the Federal Bankruptcy Court or (3) the Fund’s Adviser has concluded that the issue is not likely to meet its future interest payment obligations and has ceased accruing additional income on the Fund’s records. |
| Reg S | Regulation S allows U.S. companies to sell securities to persons or entities located outside of the United States without registering those securities with the Securities and Exchange Commission. Specifically, Regulation S provides a safe harbor from the registration requirements of the Securities Act for the offers and sales of securities by both foreign and domestic issuers that are made outside the United States. |
| TBA | To be announced. Maturity date not known prior to settlement of this transaction. |
| (WI/DD) | Investment, or portion of investment, purchased on a when-issued or delayed delivery basis. |
| 144A | Investment is exempt from registration under Rule 144A of the Securities Act of 1933, as amended. These investments may only be resold in transactions exempt from registration, which are normally those transactions with qualified institutional buyers. |
| USD-LIBOR-ICE | United States Dollar-London Inter-Bank Offered Rate-Intercontinental Exchange. |
See accompanying notes to financial statements.
Nuveen High Income Bond Fund
| | |
| Portfolio of Investments | | June 30, 2015 |
| | | | | | | | | | | | | | | | | | |
| Shares | | | Description (1) | | | | | | | | | | Value | |
| | | | | |
| | | | LONG-TERM INVESTMENTS – 99.9% | | | | | | | | | | | | | | |
| | | | | |
| | | | COMMON STOCKS – 0.8% | | | | | | | | | | | | | | |
| | | | | |
| | | | Banks – 0.1% | | | | | | | | | | | |
| | | | | |
| | 38,000 | | | Bank of America Corporation | | | | | | | | | | | | $ | 646,760 | |
| | | | | |
| | | | Building Products – 0.0% | | | | | | | | | | | |
| | | | | |
| | 527 | | | Dayton Superior, Class A, (2), (3) | | | | | | | | | | | | | 30,195 | |
| | | | | |
| | 585 | | | Dayton Superior, Class 1, (2), (3) | | | | | | | | | | | | | 33,550 | |
| | | | Total Building Products | | | | | | | | | | | | | 63,745 | |
| | | | | |
| | | | Capital Markets – 0.1% | | | | | | | | | | | |
| | | | | |
| | 5,732 | | | Adamas Finance Asia Limited, (2) | | | | | | | | | | | | | 3,955 | |
| | | | | |
| | 50,000 | | | Och-Ziff Capital Management Group, Class A Shares | | | | | | | | | | | | | 611,000 | |
| | | | Total Capital Markets | | | | | | | | | | | | | 614,955 | |
| | | | | |
| | | | Media – 0.2% | | | | | | | | | | | |
| | | | | |
| | 56,000 | | | Cablevision Systems Corporation, (4) | | | | | | | | | | | | | 1,340,640 | |
| | | | | |
| | | | Metals & Mining – 0.0% | | | | | | | | | | | |
| | | | | |
| | 499,059 | | | Northland Resources SA, (2), (3) | | | | | | | | | | | | | 50 | |
| | | | | |
| | | | Oil, Gas & Consumable Fuels – 0.0% | | | | | | | | | | | |
| | | | | |
| | 50,119 | | | Connacher Oil and Gas Limited, (2), (15) | | | | | | | | | | | | | 74,176 | |
| | | | | |
| | | | Real Estate Investment Trust – 0.4% | | | | | | | | | | | |
| | | | | |
| | 23,000 | | | Liberty Property Trust | | | | | | | | | | | | | 741,060 | |
| | | | | |
| | 18,000 | | | Mid-America Apartment Communities | | | | | | | | | | | | | 1,310,580 | |
| | | | Total Real Estate Investment Trust | | | | | | | | | | | | | 2,051,640 | |
| | | | Total Common Stocks (cost $5,022,618) | | | | | | | | | | | | | 4,791,966 | |
| | | | | |
| Shares | | | Description (1), (5) | | | | | | | | | | Value | |
| | | | | |
| | | | EXCHANGE-TRADED FUNDS – 1.1% | | | | | | | | | | | | | | |
| | | | | |
| | 10,000 | | | iShares Transportation Average ETF, (4) | | | | | | | | | | | | $ | 1,449,800 | |
| | | | | |
| | 58,000 | | | SPDR S&P Homebuilders ETF, (4) | | | | | | | | | | | | | 2,123,960 | |
| | | | | |
| | 62,500 | | | Vanguard MSCI European Exchange Traded Fund | | | | | | | | | | | | | 3,373,750 | |
| | | | Total Exchange-Traded Funds (cost $6,928,574) | | | | | | | | | | | | | 6,947,510 | |
| | | | | |
| Shares | | | Description (1) | | Coupon | | | | | Ratings (6) | | | Value | |
| | | | | |
| | | | CONVERTIBLE PREFERRED SECURITIES – 0.8% | | | | | | | | | | | | | | |
| | | | | |
| | | | Electric Utilities – 0.3% | | | | | | | | | | | |
| | | | | |
| | 45,000 | | | Exelon Corporation, (4) | | | 6.500% | | | | | | BBB– | | | $ | 2,041,200 | |
| | | |
| | | | Independent Power & Renewable Electricity Producers – 0.2% | | | | | | |
| | | | | |
| | 13,000 | | | Dynegy Inc. | | | 5.375% | | | | | | N/R | | | | 1,292,200 | |
Nuveen High Income Bond Fund (continued)
| | |
| Portfolio of Investments | | June 30, 2015 |
| | | | | | | | | | | | | | | | | | | | |
| Shares | | | Description (1) | | Coupon | | | | | | Ratings (6) | | | Value | |
| | | | | |
| | | | Metals & Mining – 0.1% | | | | | | | | | | | | |
| | | | | |
| | 43,500 | | | ArcelorMittal | | | 6.000% | | | | | | | | BB– | | | $ | 679,035 | |
| | | | | |
| | | | Oil, Gas & Consumable Fuels – 0.2% | | | | | | | | | | | | |
| | | | | |
| | 20,000 | | | Anadarko Petroleum Corporation | | | 7.500% | | | | | | | | N/R | | | | 1,008,200 | |
| | | | Total Convertible Preferred Securities (cost $5,481,053) | | | | | | | | | | | | 5,020,635 | |
| | | | | |
Principal
Amount (000) | | | Description (1) | | Coupon (8) | | | Maturity (7) | | | Ratings (6) | | | Value | |
| | | |
| | | | VARIABLE RATE SENIOR LOAN INTERESTS – 5.2% (8) | | | | | | | | | |
| | | | | |
| | | | Auto Components – 0.6% | | | | | | | | | | | | | | | | |
| | | | | |
| $ | 4,000 | | | Crowne Group LLC, Second Lien Term Loan C | | | 9.000% | | | | 9/29/21 | | | | CCC+ | | | $ | 3,940,000 | |
| | | | | |
| | | | Construction Materials – 0.4% | | | | | | | | | | | | |
| | | | | |
| | 2,500 | | | Atkore International Inc. | | | 7.750% | | | | 9/27/21 | | | | CCC+ | | | | 2,352,082 | |
| | | | | |
| | | | Diversified Financial Services – 0.3% | | | | | | | | | | | | |
| | | | | |
| | 2,000 | | | Jill Acquisition LLC, First Lien Term Loan B | | | 6.000% | | | | 5/08/22 | | | | B | | | | 1,995,000 | |
| | | |
| | | | Diversified Telecommunication Services – 0.2% | | | | | | | |
| | | | | |
| | 1,457 | | | Birch Communications Inc., First Lien Term Loan B | | | 7.750% | | | | 4/19/20 | | | | B | | | | 1,462,756 | |
| | | | | |
| | | | Health Care Equipment & Supplies – 0.3% | | | | | | | | | | | | |
| | | | | |
| | 2,000 | | | Surgery Center Holdings Inc., Second Lien Term Loan | | | 8.500% | | | | 7/24/21 | | | | CCC+ | | | | 2,000,000 | |
| | | | | |
| | | | Health Care Providers & Services – 0.5% | | | | | | | | | | | | |
| | | | | |
| | 3,000 | | | RegionalCare Hospital Pernters Inc., Second Lien Term Loan | | | 10.500% | | | | 10/21/19 | | | | CCC+ | | | | 3,037,500 | |
| | | | | |
| | | | Hotels, Restaurants & Leisure – 1.1% | | | | | | | | | | | | |
| | | | | |
| | 993 | | | Amaya BV, First Lien Term Loan | | | 5.000% | | | | 7/29/21 | | | | BB | | | | 992,293 | |
| | | | | |
| | 2,500 | | | Amaya BV, Second Lien Term Loan | | | 8.000% | | | | 7/29/22 | | | | B | | | | 2,528,909 | |
| | | | | |
| | 1,891 | | | Caesars Entertainment Corporation, Term Loan B5, (9) | | | 10.000% | | | | 3/01/17 | | | | D | | | | 1,681,993 | |
| | | | | |
| | 1,965 | | | Rock Ohio Caesar LLC, Term Loan B | | | 5.000% | | | | 3/29/19 | | | | B+ | | | | 1,929,384 | |
| | 7,349 | | | Total Hotels, Restaurants & Leisure | | | | | | | | | | | | | | | 7,132,579 | |
| | | |
| | | | Independent Power & Renewable Electricity Producers – 0.3% | | | | | | | |
| | | | | |
| | 130 | | | Empire Generating Company LLC, Term Loan C | | | 5.250% | | | | 3/13/21 | | | | B+ | | | | 125,217 | |
| | | | | |
| | 1,778 | | | Empire Generating Company LLC | | | 5.250% | | | | 3/13/21 | | | | B+ | | | | 1,707,294 | |
| | 1,908 | | | Total Independent Power & Renewable Electricity Producers | | | | | | | | | | | | | | | 1,832,511 | |
| | | | | |
| | | | Oil, Gas & Consumable Fuels – 0.8% | | | | | | | | | | | | |
| | | | | |
| | 2,957 | | | Arch Coal Inc., Term Loan B | | | 6.250% | | | | 5/16/18 | | | | B | | | | 2,047,713 | |
| | | | | |
| | 2,493 | | | Fieldwood Energy LLC, Second Lien Term Loan | | | 8.375% | | | | 9/30/20 | | | | B2 | | | | 1,913,078 | |
| | | | | |
| | 2,000 | | | Samson Investment Company Second Lien Term Loan | | | 5.000% | | | | 9/25/18 | | | | Caa2 | | | | 805,000 | |
| | 7,450 | | | Total Oil, Gas & Consumable Fuels | | | | | | | | | | | | | | | 4,765,791 | |
| | | | | |
| | | | Professional Services – 0.5% | | | | | | | | | | | | |
| | | | | |
| | 2,000 | | | Sedgwick Claims Management Service Inc., Second Lien Term Loan | | | 6.750% | | | | 2/28/22 | | | | CCC+ | | | | 1,966,666 | |
| | | | | | | | | | | | | | | | | | | | |
| | | | | |
Principal
Amount (000) | | | Description (1) | | Coupon (8) | | | Maturity (7) | | | Ratings (6) | | | Value | |
| | | | | |
| | | | Professional Services (continued) | | | | | | | | | | | | |
| | | | | |
| $ | 1,000 | | | Sedgwick Claims Management Service Inc., Second Lien Term Loan | | | 6.750% | | | | 2/28/22 | | | | Caa2 | | | $ | 983,333 | |
| | 3,000 | | | Total Professional Services | | | | | | | | | | | | | | | 2,949,999 | |
| | | | | |
| | | | Software – 0.2% | | | | | | | | | | | | |
| | | | | |
| | 1,000 | | | Deltek Incorporated, Second Lien Term Loan | | | 9.500% | | | | 6/19/23 | | | | CCC+ | | | | 1,010,000 | |
| $ | 35,664 | | | Total Variable Rate Senior Loan Interests (cost $35,148,009) | | | | | | | | | | | | | | | 32,478,218 | |
| | | | | |
| Shares | | | Description (1) | | Coupon | | | | | | Ratings (6) | | | Value | |
| | | | | |
| | | | $25 PAR (OR SIMILAR) RETAIL PREFERRED – 4.9% | | | | | | | | | | | | | | | | |
| | | | | |
| | | | Banks – 1.0% | | | | | | | | | | | | |
| | | | | |
| | 48,608 | | | Bank of America Corporation | | | 4.000% | | | | | | | | BB+ | | | $ | 1,026,601 | |
| | | | | |
| | 40,000 | | | HSBC USA Inc. | | | 4.000% | | | | | | | | BBB+ | | | | 949,200 | |
| | | | | |
| | 109,536 | | | HSBC USA Inc. | | | 1.024% | | | | | | | | BBB+ | | | | 2,453,605 | |
| | | | | |
| | 75,000 | | | RBS Capital Funding Trust V | | | 5.900% | | | | | | | | BB– | | | | 1,817,250 | |
| | | | Total Banks | | | | | | | | | | | | | | | 6,246,656 | |
| | | | | |
| | | | Capital Markets – 0.5% | | | | | | | | | | | | |
| | | | | |
| | 152,330 | | | Morgan Stanley | | | 4.000% | | | | | | | | Ba1 | | | | 3,151,708 | |
| | | | | |
| | | | Food Products – 0.3% | | | | | | | | | | | | |
| | | | | |
| | 60,000 | | | CHS Inc. | | | 0.000% | | | | | | | | N/R | | | | 1,525,200 | |
| | | | | |
| | | | Household Durables – 0.2% | | | | | | | | | | | | |
| | | | | |
| | 72,510 | | | Hovnanian Enterprises Incorporated | | | 7.625% | | | | | | | | Caa2 | | | | 970,184 | |
| | | | | |
| | | | Insurance – 0.2% | | | | | | | | | | | | |
| | | | | |
| | 60,000 | | | AmTrust Financial Services Inc. | | | 0.000% | | | | | | | | N/R | | | | 1,510,800 | |
| | | | | |
| | | | Multi-Utilities – 0.2% | | | | | | | | | | | | |
| | | | | |
| | 27,000 | | | Dominion Resources Inc. | | | 0.000% | | | | | | | | Baa3 | | | | 1,260,900 | |
| | | | | |
| | | | Real Estate Investment Trust – 2.5% | | | | | | | | | | | | |
| | | | | |
| | 50,960 | | | Colony Financial Inc. | | | 7.125% | | | | | | | | N/R | | | | 1,185,330 | |
| | | | | |
| | 60,000 | | | Colony Financial Inc. | | | 0.000% | | | | | | | | N/R | | | | 1,500,000 | |
| | | | | |
| | 75,000 | | | Coresite Realty Corporation | | | 7.250% | | | | | | | | N/R | | | | 1,953,750 | |
| | | | | |
| | 50,000 | | | Corporate Office Properties Trust | | | 7.375% | | | | | | | | BB | | | | 1,315,000 | |
| | | | | |
| | 70,000 | | | General Growth Properties | | | 6.375% | | | | | | | | N/R | | | | 1,771,700 | |
| | | | | |
| | 70,000 | | | Northstar Realty Finance Corporation | | | 8.750% | | | | | | | | N/R | | | | 1,764,700 | |
| | | | | |
| | 72,767 | | | Northstar Realty Finance Corporation | | | 8.500% | | | | | | | | N/R | | | | 1,813,354 | |
| | | | | |
| | 40,500 | | | Pebblebrook Hotel Trust | | | 6.500% | | | | | | | | N/R | | | | 1,027,080 | |
| | | | | |
| | 79,000 | | | Summit Hotel Properties Inc. | | | 7.125% | | | | | | | | N/R | | | | 2,046,100 | |
| | | | | |
| | 50,000 | | | Urstadt Biddle Properties, (4) | | | 6.750% | | | | | | | | N/R | | | | 1,324,000 | |
| | | | Total Real Estate Investment Trust | | | | | | | | | | | | | | | 15,701,014 | |
| | | | Total $25 Par (or similar) Retail Preferred (cost $29,388,692) | | | | | | | | | | | | | | | 30,366,462 | |
Nuveen High Income Bond Fund (continued)
| | |
| Portfolio of Investments | | June 30, 2015 |
| | | | | | | | | | | | | | | | | | | | |
Principal
Amount (000) (10) | | | Description (1) | | Coupon | | | Maturity | | | Ratings (6) | | | Value | |
| | | | | |
| | | | CORPORATE BONDS – 80.4% | | | | | | | | | | | | | | | | |
| | | | | |
| | | | Aerospace & Defense – 0.9% | | | | | | | | | | | | |
| | | | | |
| $ | 2,500 | | | Bombardier Inc., 144A | | | 7.500% | | | | 3/15/18 | | | | B+ | | | $ | 2,612,500 | |
| | | | | |
| | 3,000 | | | DAE Aviation Holdings Inc., 144A, (WI/DD) | | | 10.000% | | | | 7/15/23 | | | | CCC | | | | 2,959,500 | |
| | | | Total Aerospace & Defense | | | | | | | | | | | | | | | 5,572,000 | |
| | | | | |
| | | | Air Freight & Logistics – 0.5% | | | | | | | | | | | | |
| | | | | |
| | 2,900 | EUR | | XPO Logistics, Inc., 144A | | | 5.750% | | | | 6/15/21 | | | | B1 | | | | 3,176,492 | |
| | | | | |
| | | | Airlines – 0.8% | | | | | | | | | | | | |
| | | | | |
| | 2,100 | | | Air Canada, 144A, (4) | | | 7.750% | | | | 4/15/21 | | | | B | | | | 2,241,750 | |
| | | | | |
| | 2,500 | | | VistaJet Malta Finance PLC, 144A, (4) | | | 7.750% | | | | 6/01/20 | | | | B | | | | 2,400,000 | |
| | | | Total Airlines | | | | | | | | | | | | | | | 4,641,750 | |
| | | | | |
| | | | Auto Components – 2.3% | | | | | | | | | | | | |
| | | | | |
| | 2,475 | | | Jac Holding Corporation, 144A, (4) | | | 11.500% | | | | 10/01/19 | | | | B | | | | 2,543,063 | |
| | | | | |
| | 3,060 | | | Midas Intermediate Holdco II LLC / Midas Intermediate Holdco II Finance Inc., 144A | | | 7.875% | | | | 10/01/22 | | | | Caa1 | | | | 3,052,350 | |
| | | | | |
| | 3,350 | | | MPG Holdco I Inc. | | | 7.375% | | | | 10/15/22 | | | | B+ | | | | 3,567,750 | |
| | | | | |
| | 2,000 | | | Nexteer Automotive Group Limited, 144A | | | 5.875% | | | | 11/15/21 | | | | BB+ | | | | 2,050,000 | |
| | | | | |
| | 2,900 | | | Stackpole International Intermediate Company, 144A, (4) | | | 7.750% | | | | 10/15/21 | | | | B+ | | | | 2,856,500 | |
| | | | Total Auto Components | | | | | | | | | | | | | | | 14,069,663 | |
| | | | | |
| | | | Banks – 1.6% | | | | | | | | | | | | |
| | | | | |
| | 1,000 | | | Banco Do Brasil, 144A | | | 9.000% | | | | 12/18/64 | | | | BB– | | | | 902,200 | |
| | | | | |
| | 3,230 | | | Popular Inc., (4) | | | 7.000% | | | | 7/01/19 | | | | BB– | | | | 3,230,000 | |
| | | | | |
| | 3,625 | EUR | | Royal Bank of Scotland Group PLC | | | 5.500% | | | | 11/29/49 | | | | BB– | | | | 4,031,235 | |
| | | | | |
| | 2,000 | | | Turkiye Vakiflar Bankasi T.A.O, 144A | | | 6.000% | | | | 11/01/22 | | | | BB+ | | | | 1,958,720 | |
| | | | Total Banks | | | | | | | | | | | | | | | 10,122,155 | |
| | | | | |
| | | | Building Products – 2.2% | | | | | | | | | | | | |
| | | | | |
| | 1,950 | | | Associated Materials Inc. | | | 9.125% | | | | 11/01/17 | | | | B– | | | | 1,618,500 | |
| | | | | |
| | 2,000 | | | Builders FirstSource, Inc., 144A, (4) | | | 7.625% | | | | 6/01/21 | | | | B | | | | 2,070,000 | |
| | | | | |
| | 2,000 | | | Corporativo Javer S.A. de C.V, 144A | | | 9.875% | | | | 4/06/21 | | | | B+ | | | | 2,135,000 | |
| | | | | |
| | 2,750 | | | NCI Building Systems, Inc., 144A | | | 8.250% | | | | 1/15/23 | | | | B+ | | | | 2,928,750 | |
| | | | | |
| | 3,000 | | | NWH Escrow Corporation, 144A | | | 7.500% | | | | 8/01/21 | | | | B | | | | 2,820,000 | |
| | | | | |
| | 2,800 | | | Odebrecht Finance Limited, 144A, (4) | | | 7.125% | | | | 6/26/42 | | | | BBB– | | | | 2,142,000 | |
| | | | Total Building Products | | | | | | | | | | | | | | | 13,714,250 | |
| | | | | |
| | | | Chemicals – 2.8% | | | | | | | | | | | | |
| | | | | |
| | 2,000 | | | Chemours Co, 144A | | | 6.625% | | | | 5/15/23 | | | | BB– | | | | 1,937,500 | |
| | | | | |
| | 2,000 | | | Hexion Inc. | | | 10.000% | | | | 4/15/20 | | | | B3 | | | | 2,055,000 | |
| | | | | |
| | 2,500 | | | Hexion US Finance Corporation | | | 8.875% | | | | 2/01/18 | | | | CCC | | | | 2,256,250 | |
| | | | | |
| | 2,500 | | | Kissner Milling Company Limited, 144A | | | 7.250% | | | | 6/01/19 | | | | B | | | | 2,543,750 | |
| | | | | |
| | 3,525 | | | Momentive Performance Materials Inc., (3), (9) | | | 8.875% | | | | 10/15/20 | | | | N/R | | | | — | |
| | | | | | | | | | | | | | | | | | | | |
Principal
Amount (000) (10) | | | Description (1) | | Coupon | | | Maturity | | | Ratings (6) | | | Value | |
| | | | | |
| | | | Chemicals (continued) | | | | | | | | | | | | |
| | | | | |
| $ | 3,525 | | | Momentive Performance Materials Inc., (4) | | | 3.880% | | | | 10/24/21 | | | | B | | | $ | 3,163,688 | |
| | | | | |
| | 1,800 | | | Platform Specialty Products Corporation, 144A | | | 6.500% | | | | 2/01/22 | | | | BB– | | | | 1,858,500 | |
| | | | | |
| | 1,250 | | | Rayonier AM Products Inc., 144A, (4) | | | 5.500% | | | | 6/01/24 | | | | BB+ | | | | 1,115,625 | |
| | | | | |
| | 2,700 | | | Tronox Finance LLC, (4) | | | 6.375% | | | | 8/15/20 | | | | BB– | | | | 2,504,250 | |
| | | | Total Chemicals | | | | | | | | | | | | | | | 17,434,563 | |
| | | | | |
| | | | Commercial Services & Supplies – 1.2% | | | | | | | | | | | | |
| | | | | |
| | 3,050 | | | Casella Waste Systems Inc. | | | 7.750% | | | | 2/15/19 | | | | B– | | | | 3,080,500 | |
| | | | | |
| | 3,420 | CAD | | GFL Environmental Corporation, 144A | | | 7.500% | | | | 6/18/18 | | | | B | | | | 2,738,054 | |
| | | | | |
| | 1,490 | EUR | | Waste Italia SPA, 144A | | | 10.500% | | | | 11/15/19 | | | | B2 | | | | 1,428,738 | |
| | | | Total Commercial Services & Supplies | | | | | | | | | | | | | | | 7,247,292 | |
| | | | | |
| | | | Communications Equipment – 0.3% | | | | | | | | | | | | |
| | | | | |
| | 2,000 | | | Broadview Networks Holdings Inc. | | | 10.500% | | | | 11/15/17 | | | | N/R | | | | 1,895,000 | |
| | | | | |
| | | | Construction & Engineering – 1.0% | | | | | | | | | | | | |
| | | | | |
| | 1,530 | | | AECOM Technology Corporation, 144A | | | 5.875% | | | | 10/15/24 | | | | BB– | | | | 1,551,038 | |
| | | | | |
| | 1,500 | | | Boart Longyear Management Pty Ltd, 144A, (4) | | �� | 7.000% | | | | 4/01/21 | | | | CCC | | | | 990,000 | |
| | | | | |
| | 2,250 | | | Michael Baker Holdings LLC Finance Corporation, 144A | | | 8.875% | | | | 4/15/19 | | | | B– | | | | 2,058,750 | |
| | | | | |
| | 15,000 | NOK | | VV Holding AS, 144A | | | 6.700% | | | | 7/10/19 | | | | N/R | | | | 1,885,738 | |
| | | | Total Construction & Engineering | | | | | | | | | | | | | | | 6,485,526 | |
| | | | | |
| | | | Construction Materials – 1.6% | | | | | | | | | | | | |
| | | | | |
| | 3,500 | | | Cemex Finance LLC, 144A | | | 9.375% | | | | 10/12/22 | | | | BB– | | | | 3,898,125 | |
| | | | | |
| | 2,825 | | | Norbord Inc., 144A | | | 5.375% | | | | 12/01/20 | | | | Ba2 | | | | 2,810,875 | |
| | | | | |
| | 3,000 | | | Reliance Intermediate Holdings LP, 144A | | | 6.500% | | | | 4/01/23 | | | | BB– | | | | 3,120,000 | |
| | | | Total Construction Materials | | | | | | | | | | | | | | | 9,829,000 | |
| | | | | |
| | | | Consumer Finance – 1.3% | | | | | | | | | | | | |
| | | | | |
| | 2,000 | | | Constellis Holdings LLC / Constellis Finance Corporation, 144A | | | 9.750% | | | | 5/15/20 | | | | B | | | | 1,930,000 | |
| | | | | |
| | 1,945 | | | Covenant Surgical Partners Inc., 144A | | | 8.750% | | | | 8/01/19 | | | | B– | | | | 1,971,258 | |
| | | | | |
| | 2,250 | | | Credit Acceptance Corporation, 144A | | | 7.375% | | | | 3/15/23 | | | | BB | | | | 2,323,125 | |
| | | | | |
| | 2,000 | | | Enova International, Inc. | | | 9.750% | | | | 6/01/21 | | | | B | | | | 1,890,000 | |
| | | | Total Consumer Finance | | | | | | | | | | | | | | | 8,114,383 | |
| | | | | |
| | | | Containers & Packaging – 1.7% | | | | | | | | | | | | |
| | | | | |
| | 2,086 | | | Ardagh Finance Holdings SA, 144A, (4) | | | 8.625% | | | | 6/15/19 | | | | CCC+ | | | | 2,159,268 | |
| | | | | |
| | 240 | | | Ardagh Packaging Finance / MP HD USA, 144A | | | 7.000% | | | | 11/15/20 | | | | Caa1 | | | | 244,800 | |
| | | | | |
| | 3,000 | | | Cascades Inc., 144A | | | 5.500% | | | | 7/15/22 | | | | Ba3 | | | | 2,902,500 | |
| | | | | |
| | 3,000 | | | Coveris Holdings SA, 144A | | | 7.875% | | | | 11/01/19 | | | | B– | | | | 2,985,000 | |
| | | | | |
| | 2,000 | | | PaperWorks Industries Inc., 144A | | | 9.500% | | | | 8/15/19 | | | | B– | | | | 1,990,000 | |
| | | | Total Containers & Packaging | | | | | | | | | | | | | | | 10,281,568 | |
| | | | | |
| | | | Diversified Consumer Services – 1.2% | | | | | | | | | | | | |
| | | | | |
| | 2,000 | | | Gibson Brands Inc., 144A | | | 8.875% | | | | 8/01/18 | | | | B– | | | | 2,020,000 | |
Nuveen High Income Bond Fund (continued)
| | |
| Portfolio of Investments | | June 30, 2015 |
| | | | | | | | | | | | | | | | | | | | |
Principal
Amount (000) (10) | | | Description (1) | | Coupon | | | Maturity | | | Ratings (6) | | | Value | |
| | | | | |
| | | | Diversified Consumer Services (continued) | | | | | | | | | | | | |
| | | | | |
| $ | 3,185 | | | Jones Group Inc. | | | 6.125% | | | | 11/15/34 | | | | CCC | | | $ | 1,449,175 | |
| | | | | |
| | 2,300 | GBP | | Pizza Express, 144A | | | 8.625% | | | | 8/01/22 | | | | CCC+ | | | | 3,803,377 | |
| | | | Total Diversified Consumer Services | | | | | | | | | | | | | | | 7,272,552 | |
| | | |
| | | | Diversified Financial Services – 2.6% | | | | | | | |
| | | | | |
| | 2,400 | | | Argos Merger Sub Inc., 144A, (4) | | | 7.125% | | | | 3/15/23 | | | | B– | | | | 2,514,000 | |
| | | | | |
| | 2,500 | | | CNG Holdings Inc., 144A, (4) | | | 9.375% | | | | 5/15/20 | | | | B– | | | | 1,812,500 | |
| | | | | |
| | 2,800 | | | Fly Leasing Limited | | | 6.375% | | | | 10/15/21 | | | | BB | | | | 2,835,000 | |
| | | | | |
| | 2,180 | | | James Hardie International Finance Limited, 144A | | | 5.875% | | | | 2/15/23 | | | | BBB– | | | | 2,245,400 | |
| | | | | |
| | 2,000 | | | Jefferies Finance LLC Corporation, 144A, (4) | | | 7.375% | | | | 4/01/20 | | | | B+ | | | | 1,965,000 | |
| | | | | |
| | 2,435 | | | Nationstar Mortgage LLC Capital Corporation, (4) | | | 7.875% | | | | 10/01/20 | | | | B+ | | | | 2,428,913 | |
| | | | | |
| | 2,300 | | | Ziggo Bond Finance B.V, 144A | | | 5.875% | | | | 1/15/25 | | | | B | | | | 2,254,000 | |
| | | | Total Diversified Financial Services | | | | | | | | | | | | | | | 16,054,813 | |
| | | |
| | | | Diversified Telecommunication Services – 2.5% | | | | | | | |
| | | | | |
| | 3,225 | | | CenturyLink Inc. | | | 7.650% | | | | 3/15/42 | | | | BB+ | | | | 2,918,625 | |
| | | | | |
| | 3,000 | | | Citizens Communications Company | | | 9.000% | | | | 8/15/31 | | | | BB | | | | 2,730,000 | |
| | | | | |
| | 2,950 | | | Consolidated Communications Finance Company, 144A | | | 6.500% | | | | 10/01/22 | | | | B– | | | | 2,843,063 | |
| | | | | |
| | 2,750 | | | GCI Inc. | | | 6.875% | | | | 4/15/25 | | | | BB– | | | | 2,777,500 | |
| | | | | |
| | 3,035 | | | IntelSat Jackson Holdings, (4) | | | 6.625% | | | | 12/15/22 | | | | CCC+ | | | | 2,761,850 | |
| | | | | |
| | 2,000 | | | Windstream Corporation, (4) | | | 6.375% | | | | 8/01/23 | | | | BB | | | | 1,627,500 | |
| | | | Total Diversified Telecommunication Services | | | | | | | | | | | | | | | 15,658,538 | |
| | | | | |
| | | | Electric Utilities – 1.3% | | | | | | | | | | | | |
| | | | | |
| | 1,587 | | | Energy Future Intermediate Holding Company LLC, 144A, (9) | | | 11.750% | | | | 3/01/22 | | | | N/R | | | | 1,807,028 | |
| | | | | |
| | 3,450 | | | Intergen NV, 144A | | | 7.000% | | | | 6/30/23 | | | | B+ | | | | 3,070,500 | |
| | | | | |
| | 237 | | | Midwest Generation LLC | | | 8.560% | | | | 1/02/16 | | | | N/R | | | | 236,951 | |
| | | | | |
| | 2,500 | | | PPL Energy Supply LLC, 144A, (4) | | | 6.500% | | | | 6/01/25 | | | | BB– | | | | 2,500,000 | |
| | | | | |
| | 1,000 | | | Texas Competitive Electric Holdings, 144A, (9) | | | 11.500% | | | | 10/01/20 | | | | N/R | | | | 610,000 | |
| | | | Total Electric Utilities | | | | | | | | | | | | | | | 8,224,479 | |
| | | | | |
| | | | Energy Equipment & Services – 2.1% | | | | | | | | | | | | |
| | | | | |
| | 2,425 | | | Basic Energy Services, Inc., (4) | | | 7.750% | | | | 2/15/19 | | | | B | | | | 2,018,813 | |
| | | | | |
| | 2,500 | | | Calfrac Holdings LP, 144A | | | 7.500% | | | | 12/01/20 | | | | BB– | | | | 2,308,500 | |
| | | | | |
| | 1,550 | | | Drill Rigs Holdings Inc., 144A | | | 6.500% | | | | 10/01/17 | | | | B– | | | | 1,360,125 | |
| | | | | |
| | 750 | | | McDermott International Inc., 144A, (4) | | | 8.000% | | | | 5/01/21 | | | | BB– | | | | 675,000 | |
| | | | | |
| | 1,500 | | | Murray Energy Corporation, 144A, (4) | | | 11.250% | | | | 4/15/21 | | | | B3 | | | | 1,260,000 | |
| | | | | |
| | 1,670 | | | Pacific Drilling V Limited, 144A, (4) | | | 7.250% | | | | 12/01/17 | | | | B+ | | | | 1,436,200 | |
| | | | | |
| | 1,000 | | | SAExploration Holdings Inc. | | | 10.000% | | | | 7/15/19 | | | | B– | | | | 600,000 | |
| | | | | |
| | 2,000 | | | Seventy Seven Energy Inc. | | | 6.625% | | | | 11/15/19 | | | | B | | | | 1,580,000 | |
| | | | | |
| | 3,250 | | | Seventy Seven Energy Inc. | | | 6.500% | | | | 7/15/22 | | | | CCC+ | | | | 2,080,000 | |
| | | | Total Energy Equipment & Services | | | | | | | | | | | | | | | 13,318,638 | |
| | | | | | | | | | | | | | | | | | | | |
Principal
Amount (000) (10) | | | Description (1) | | Coupon | | | Maturity | | | Ratings (6) | | | Value | |
| | | | | |
| | | | Food & Staples Retailing – 1.4% | | | | | | | | | | | | |
| | | | | |
| $ | 2,500 | | | Kehe Distributors LLC Finance, 144A | | | 7.625% | | | | 8/15/21 | | | | B– | | | $ | 2,625,000 | |
| | | | | |
| | 2,000 | | | Roundy’s Supermarkets Inc., 144A, (4) | | | 10.250% | | | | 12/15/20 | | | | Caa1 | | | | 1,700,000 | |
| | | | | |
| | 3,000 | | | Supervalu Inc., (4) | | | 7.750% | | | | 11/15/22 | | | | B | | | | 3,148,125 | |
| | | | | |
| | 1,500 | | | Tops Holding LLC / Tops Markets II Corporation, 144A | | | 8.000% | | | | 6/15/22 | | | | B3 | | | | 1,501,875 | |
| | | | Total Food & Staples Retailing | | | | | | | | | | | | | | | 8,975,000 | |
| | | | | |
| | | | Food Products – 2.2% | | | | | | | | | | | | |
| | | | | |
| | 3,500 | | | Diamond Foods Inc., 144A | | | 7.000% | | | | 3/15/19 | | | | CCC+ | | | | 3,587,500 | |
| | | | | |
| | 3,050 | | | JBS Investments GmbH, 144A, (4) | | | 7.250% | | | | 4/03/24 | | | | BB+ | | | | 3,156,750 | |
| | | | | |
| | 2,950 | | | Land O Lakes Capital Trust I, 144A | | | 7.450% | | | | 3/15/28 | | | | BB | | | | 3,134,375 | |
| | | | | |
| | 2,200 | | | Marfrig Holding Europe BV, 144A, (4) | | | 8.375% | | | | 5/09/18 | | | | B+ | | | | 2,215,840 | |
| | | | | |
| | 2,000 | | | Southern States Cooperative Inc., 144A | | | 10.000% | | | | 8/15/21 | | | | B– | | | | 1,870,000 | |
| | | | Total Food Products | | | | | | | | | | | | | | | 13,964,465 | |
| | | | | |
| | | | Gas Utilities – 0.9% | | | | | | | | | | | | |
| | | | | |
| | 3,000 | | | Ferrellgas LP | | | 6.750% | | | | 1/15/22 | | | | B+ | | | | 3,007,500 | |
| | | | | |
| | 2,800 | | | LBC Tank Terminals Holdings Netherlands BV, 144A | | | 6.875% | | | | 5/15/23 | | | | B | | | | 2,891,000 | |
| | | | Total Gas Utilities | | | | | | | | | | | | | | | 5,898,500 | |
| | | | | |
| | | | Health Care Equipment & Supplies – 0.5% | | | | | | | | | | | | |
| | | | | |
| | 1,050 | EUR | | Labco SAS, Reg S | | | 8.500% | | | | 1/15/18 | | | | BB– | | | | 1,214,492 | |
| | | | | |
| | 1,800 | | | Tenet Healthcare Corporation | | | 6.875% | | | | 11/15/31 | | | | B3 | | | | 1,665,000 | |
| | | | Total Health Care Equipment & Supplies | | | | | | | | | | | | | | | 2,879,492 | |
| | | | | |
| | | | Health Care Providers & Services – 1.5% | | | | | | | | | | | | |
| | | | | |
| | 2,905 | | | Community Health Systems, Inc. | | | 5.125% | | | | 8/01/21 | | | | BB | | | | 2,959,469 | |
| | | | | |
| | 2,000 | | | Opal Acquisition Inc., 144A | | | 8.875% | | | | 12/15/21 | | | | CCC+ | | | | 1,950,000 | |
| | | | | |
| | 2,000 | | | Select Medical Corporation | | | 6.375% | | | | 6/01/21 | | | | B– | | | | 2,020,000 | |
| | | | | |
| | 2,500 | | | Surgical Care Affiliates Inc., 144A | | | 6.000% | | | | 4/01/23 | | | | B– | | | | 2,500,000 | |
| | | | Total Health Care Providers & Services | | | | | | | | | | | | | | | 9,429,469 | |
| | | | | |
| | | | Hotels, Restaurants & Leisure – 2.7% | | | | | | | | | | | | |
| | | | | |
| | 2,250 | | | Caesars Entertainment Resort Properties LLC | | | 8.250% | | | | 10/01/20 | | | | B+ | | | | 2,119,230 | |
| | | | | |
| | 2,000 | | | Caesars Growth Properties Holdings LLC / Caesars Growth Properties Finance Inc., 144A, (4) | | | 9.375% | | | | 5/01/22 | | | | B– | | | | 1,500,000 | |
| | | | | |
| | 1,250 | | | Grupo Posadas SAB de CV, 144A | | | 7.875% | | | | 6/30/22 | | | | B+ | | | | 1,265,625 | |
| | | | | |
| | 2,000 | CAD | | River Cree Enterprises LP, 144A | | | 11.000% | | | | 1/20/21 | | | | B– | | | | 1,649,319 | |
| | | | | |
| | 2,000 | | | Roc Finance LLC and Roc Finance 1 Corporation, 144A | | | 12.125% | | | | 9/01/18 | | | | B– | | | | 2,135,000 | |
| | | | | |
| | 2,935 | | | Scientific Games International Inc., (4) | | | 6.250% | | | | 9/01/20 | | | | B– | | | | 2,281,963 | |
| | | | | |
| | 2,000 | | | Viking Cruises Limited, 144A | | | 6.250% | | | | 5/15/25 | | | | B+ | | | | 1,985,000 | |
| | | | | |
| | 3,850 | | | Wynn Macau Limited, 144A, (4) | | | 5.250% | | | | 10/15/21 | | | | BB | | | | 3,638,250 | |
| | | | Total Hotels, Restaurants & Leisure | | | | | | | | | | | | | | | 16,574,387 | |
Nuveen High Income Bond Fund (continued)
| | |
| Portfolio of Investments | | June 30, 2015 |
| | | | | | | | | | | | | | | | | | | | |
Principal
Amount (000) (10) | | | Description (1) | | Coupon | | | Maturity | | | Ratings (6) | | | Value | |
| | | | | |
| | | | Household Durables – 1.2% | | | | | | | | | | | | |
| | | | | |
| $ | 2,000 | | | Brookfield Residential Properties Inc., 144A | | | 6.500% | | | | 12/15/20 | | | | BB– | | | $ | 1,990,840 | |
| | | | | |
| | 2,000 | | | K. Hovnanian Enterprises Inc. | | | 5.000% | | | | 11/01/21 | | | | Ba3 | | | | 1,705,000 | |
| | | | | |
| | 2,500 | | | KB Home, (4) | | | 7.625% | | | | 5/15/23 | | | | B+ | | | | 2,612,500 | |
| | | | | |
| | 1,000 | | | RSI Home Products Incorporated, 144A | | | 6.500% | | | | 3/15/23 | | | | B+ | | | | 1,007,500 | |
| | | | Total Household Durables | | | | | | | | | | | | | | | 7,315,840 | |
| | | | | |
| | | | Independent Power & Renewable Electricity Producers – 1.1% | | | | | | | | | | | | |
| | | | | |
| | 1,500 | | | Abengoa Yield PLC, 144A | | | 7.000% | | | | 11/15/19 | | | | BB+ | | | | 1,545,000 | |
| | | | | |
| | 2,575 | | | AES Corporation | | | 5.500% | | | | 3/15/24 | | | | BB | | | | 2,478,438 | |
| | | | | |
| | 2,500 | | | GenOn Energy Inc., (4) | | | 7.875% | | | | 6/15/17 | | | | B | | | | 2,531,250 | |
| | | | Total Independent Power & Renewable Electricity Producers | | | | | | | | | | | | | | | 6,554,688 | |
| | | | | |
| | | | Industrial Conglomerates – 0.4% | | | | | | | | | | | | |
| | | | | |
| | 2,500 | | | Techniplas, LLC, 144A | | | 10.000% | | | | 5/01/20 | | | | B | | | | 2,518,750 | |
| | | | | |
| | | | Insurance – 0.5% | | | | | | | | | | | | |
| | | | | |
| | 3,570 | | | Genworth Holdings Inc. | | | 4.800% | | | | 2/15/24 | | | | Ba1 | | | | 3,114,825 | |
| | | | | |
| | | | Leisure Products – 0.5% | | | | | | | | | | | | |
| | | | | |
| | 1,500 | | | 24 Hour Holdings III LLC, 144A, (4) | | | 8.000% | | | | 6/01/22 | | | | CCC+ | | | | 1,203,750 | |
| | | | | |
| | 2,000 | CAD | | Gateway Casinos & Entertainment Limited, 144A | | | 8.500% | | | | 11/26/20 | | | | B+ | | | | 1,593,275 | |
| | | | Total Leisure Products | | | | | | | | | | | | | | | 2,797,025 | |
| | | | | |
| | | | Machinery – 1.1% | | | | | | | | | | | | |
| | | | | |
| | 3,000 | | | Commercial Vehicle Group, (4) | | | 7.875% | | | | 4/15/19 | | | | B | | | | 3,075,000 | |
| | | | | |
| | 3,730 | | | CTP Transportation Products LLC-Finance Inc., 144A | | | 8.250% | | | | 12/15/19 | | | | B+ | | | | 3,860,550 | |
| | | | Total Machinery | | | | | | | | | | | | | | | 6,935,550 | |
| | | | | |
| | | | Marine – 2.4% | | | | | | | | | | | | |
| | | | | |
| | 6,941 | NOK | | BOA SBL AS, 144A | | | 7.010% | | | | 4/19/18 | | | | N/R | | | | 637,593 | |
| | | | | |
| | 9,646 | NOK | | E Forland AS, 144A, Reg S | | | 8.170% | | | | 9/04/18 | | | | N/R | | | | 1,137,981 | |
| | | | | |
| | 3,000 | | | Eletson Holdings Inc., 144A | | | 9.625% | | | | 1/15/22 | | | | B | | | | 2,925,000 | |
| | | | | |
| | 2,750 | | | Global Ship Lease Inc., 144A | | | 10.000% | | | | 4/01/19 | | | | B | | | | 2,866,875 | |
| | | | | |
| | 2,750 | | | Navios Maritime Acquisition Corporation, 144A | | | 8.125% | | | | 11/15/21 | | | | BB– | | | | 2,708,750 | |
| | | | | |
| | 2,500 | | | Navios South American Logisitics Inc., Finance US Inc., 144A, (4) | | | 7.250% | | | | 5/01/22 | | | | B+ | | | | 2,393,750 | |
| | | | | |
| | 2,200 | | | Topaz Marine SA, 144A | | | 8.625% | | | | 11/01/18 | | | | B– | | | | 2,150,500 | |
| | | | Total Marine | | | | | | | | | | | | | | | 14,820,449 | |
| | | | | |
| | | | Media – 4.2% | | | | | | | | | | | | |
| | | | | |
| | 2,600 | | | Altice S.A, 144A | | | 7.750% | | | | 5/15/22 | | | | B | | | | 2,515,500 | |
| | | | | |
| | 4,500 | | | Altice US Financing SA, 144A | | | 7.750% | | | | 7/15/25 | | | | CCC+ | | | | 4,320,000 | |
| | | | | |
| | 2,850 | | | Charter Communications, CCO Holdings LLC | | | 5.125% | | | | 2/15/23 | | | | BB– | | | | 2,778,750 | |
| | | | | |
| | 3,650 | | | Clear Channel Communications, Inc., (4) | | | 10.000% | | | | 1/15/18 | | | | CCC– | | | | 2,938,250 | |
| | | | | |
| | 1,500 | | | Clear Channel Communications, Inc. | | | 11.250% | | | | 3/01/21 | | | | CCC+ | | | | 1,456,875 | |
| | | | | |
| | 2,750 | | | Lee Enterprises Inc., 144A | | | 9.500% | | | | 3/15/22 | | | | B2 | | | | 2,798,125 | |
| | | | | | | | | | | | | | | | | | | | |
Principal
Amount (000) (10) | | | Description (1) | | Coupon | | | Maturity | | | Ratings (6) | | | Value | |
| | | | | |
| | | | Media (continued) | | | | | | | | | | | | |
| | | | | |
| $ | 2,600 | | | Midcontinent Communications Finance Company, 144A | | | 6.250% | | | | 8/01/21 | | | | B– | | | $ | 2,652,000 | |
| | | | | |
| | 2,500 | | | Radio One Inc., 144A, (4) | | | 9.250% | | | | 2/15/20 | | | | CCC | | | | 2,275,000 | |
| | | | | |
| | 2,500 | | | SiTV Inc., 144A | | | 10.375% | | | | 7/01/19 | | | | B– | | | | 2,062,500 | |
| | | | | |
| | 3,150 | CAD | | Videotron Limited, 144A | | | 5.625% | | | | 6/15/25 | | | | BB | | | | 2,607,136 | |
| | | | Total Media | | | | | | | | | | | | | | | 26,404,136 | |
| | | | | |
| | | | Metals & Mining – 5.4% | | | | | | | | | | | | |
| | | | | |
| | 2,000 | | | AK Steel Corporation, (4) | | | 7.625% | | | | 10/01/21 | | | | B– | | | | 1,630,000 | |
| | | | | |
| | 2,300 | | | Anglogold Holdings PLC | | | 5.125% | | | | 8/01/22 | | | | Baa3 | | | | 2,211,779 | |
| | | | | |
| | 2,000 | | | ArcelorMittal | | | 10.600% | | | | 6/01/19 | | | | Ba1 | | | | 2,395,000 | |
| | | | | |
| | 3,465 | | | Century Aluminum Company, 144A | | | 7.500% | | | | 6/01/21 | | | | BB– | | | | 3,512,644 | |
| | | | | |
| | 1,900 | | | Coeur d’Alene Mines Corporation, (4) | | | 7.875% | | | | 2/01/21 | | | | B | | | | 1,610,250 | |
| | | | | |
| | 500 | | | Compania Minera Ares SAC, 144A, (4) | | | 7.750% | | | | 1/23/21 | | | | BB+ | | | | 513,125 | |
| | | | | |
| | 2,975 | | | Eldorado Gold Corporation, 144A | | | 6.125% | | | | 12/15/20 | | | | BB | | | | 2,945,246 | |
| | | | | |
| | 2,849 | | | First Quantum Minerals Limited, 144A, (4) | | | 6.750% | | | | 2/15/20 | | | | BB– | | | | 2,756,408 | |
| | | | | |
| | 2,000 | | | Gold Fields Orogen Holdings BVI Limited, 144A | | | 4.875% | | | | 10/07/20 | | | | BB+ | | | | 1,830,000 | |
| | | | | |
| | 1,610 | | | Hudbay Minerals, Inc. | | | 9.500% | | | | 10/01/20 | | | | B– | | | | 1,706,600 | |
| | | | | |
| | 2,000 | | | Imperial Metals Corporation, 144A, (4) | | | 7.000% | | | | 3/15/19 | | | | CCC | | | | 1,935,000 | |
| | | | | |
| | 2,550 | | | Lundin Mining Corporation, 144A | | | 7.500% | | | | 11/01/20 | | | | Ba2 | | | | 2,747,625 | |
| | | | | |
| | 3,504 | | | Northland Resources AB, 144A, Reg S | | | 15.000% | | | | 7/15/19 | | | | N/R | | | | 35,044 | |
| | | | | |
| | 1,583 | | | Northland Resources AB, 144A, Reg S, (9) | | | 4.000% | | | | 10/15/20 | | | | N/R | | | | 3,166 | |
| | | | | |
| | 1,406 | | | Permian Holdings Incorporated, 144A | | | 10.500% | | | | 1/15/18 | | | | B– | | | | 899,840 | |
| | | | | |
| | 2,500 | | | Tempel Steel Company, 144A | | | 12.000% | | | | 8/15/16 | | | | CCC+ | | | | 2,368,750 | |
| | | | | |
| | 2,950 | | | Tupy S/A, 144A | | | 6.625% | | | | 7/17/24 | | | | BB | | | | 2,887,313 | |
| | | | | |
| | 2,000 | | | Westmoreland Coal Co, 144A, (4) | | | 8.750% | | | | 1/01/22 | | | | B | | | | 1,860,000 | |
| | | | Total Metals & Mining | | | | | | | | | | | | | | | 33,847,790 | |
| | | | | |
| | | | Multiline Retail – 0.5% | | | | | | | | | | | | |
| | | | | |
| | 3,350 | | | J.C. Penney Company Inc. | | | 8.125% | | | | 10/01/19 | | | | Caa2 | | | | 3,316,500 | |
| | | | | |
| | | | Oil, Gas & Consumable Fuels – 14.3% | | | | | | | | | | | | |
| | | | | |
| | 3,000 | | | American Eagle Energy Corporation, 144A, (9) | | | 11.000% | | | | 9/01/19 | | | | N/R | | | | 1,035,000 | |
| | | | | |
| | 2,500 | | | Armstrong Energy Inc. | | | 11.750% | | | | 12/15/19 | | | | B– | | | | 1,768,750 | |
| | | | | |
| | 1,900 | CAD | | Athabasca Oil Corporation, 144A | | | 7.500% | | | | 11/19/17 | | | | B | | | | 1,395,717 | |
| | | | | |
| | 2,000 | | | Atlas Energy Holdings Operating Company | | | 9.250% | | | | 8/15/21 | | | | B– | | | | 1,500,000 | |
| | | | | |
| | 2,000 | CAD | | Baytex Energy Corporation | | | 6.625% | | | | 7/19/22 | | | | BB | | | | 1,641,313 | |
| | | | | |
| | 2,250 | | | Bellatrix Exploration Limited, 144A, (4) | | | 8.500% | | | | 5/15/20 | | | | B– | | | | 2,109,375 | |
| | | | | |
| | 2,000 | | | California Resources Corporation, (4) | | | 6.000% | | | | 11/15/24 | | | | BB | | | | 1,720,000 | |
| | | | | |
| | 2,860 | | | Calumet Specialty Products | | | 7.625% | | | | 1/15/22 | | | | B+ | | | | 2,917,200 | |
| | | | | |
| | 1,250 | | | Carrizo Oil and Gas Inc. | | | 6.250% | | | | 4/15/23 | | | | B | | | | 1,253,125 | |
| | | | | |
| | 2,000 | | | CGG SA | | | 6.875% | | | | 1/15/22 | | | | B | | | | 1,660,000 | |
| | | | | |
| | 1,572 | | | Chaparral Energy Inc., (4) | | | 9.875% | | | | 10/01/20 | | | | B– | | | | 1,281,180 | |
Nuveen High Income Bond Fund (continued)
| | |
| Portfolio of Investments | | June 30, 2015 |
| | | | | | | | | | | | | | | | | | | | |
Principal
Amount (000) (10) | | | Description (1) | | Coupon | | | Maturity | | | Ratings (6) | | | Value | |
| | | | | |
| | | | Oil, Gas & Consumable Fuels (continued) | | | | | | | | | | | | |
| | | | | |
| $ | 1,400 | | | Chesapeake Energy Corporation, (4) | | | 6.500% | | | | 8/15/17 | | | | BB+ | | | $ | 1,433,250 | |
| | | | | |
| | 2,680 | | | Crestwood Midstream Partners LP, (4) | | | 6.125% | | | | 3/01/22 | | | | BB | | | | 2,733,600 | |
| | | | | |
| | 2,200 | | | Denbury Resources Inc. | | | 5.500% | | | | 5/01/22 | | | | BB | | | | 1,963,500 | |
| | | | | |
| | 1,500 | | | Energy XXI Gulf Coast Inc., 144A, (4) | | | 9.250% | | | | 12/15/17 | | | | B– | | | | 798,750 | |
| | | | | |
| | 1,000 | | | Energy XXI Gulf Coast Inc., 144A, (4) | | | 11.000% | | | | 3/15/20 | | | | BB | | | | 875,000 | |
| | | | | |
| | 1,800 | | | EnQuest PLC, 144A, (4) | | | 7.000% | | | | 4/15/22 | | | | B | | | | 1,422,000 | |
| | | | | |
| | 2,885 | | | EV Energy Partners LP / EV Energy Finance Corporation | | | 8.000% | | | | 4/15/19 | | | | B– | | | | 2,683,050 | |
| | | | | |
| | 10,000 | NOK | | GasLog Limited, 144A, Reg S | | | 6.800% | | | | 6/27/18 | | | | N/R | | | | 1,316,854 | |
| | | | | |
| | 2,600 | | | Gibson Energy, 144A | | | 6.750% | | | | 7/15/21 | | | | BB | | | | 2,684,500 | |
| | | | | |
| | 3,000 | | | Global Partners LP/GLP Finance, 144A | | | 7.000% | | | | 6/15/23 | | | | B+ | | | | 2,947,496 | |
| | | | | |
| | 3,000 | | | Golden Close Maritime Corporation Limited, 144A, Reg S | | | 9.000% | | | | 10/24/19 | | | | N/R | | | | 2,580,000 | |
| | | | | |
| | 1,600 | | | Halcon Resources Corporation, 144A, (4) | | | 8.625% | | | | 2/01/20 | | | | B2 | | | | 1,580,000 | |
| | | | | |
| | 1,000 | | | Halcon Resources Corporation | | | 9.750% | | | | 7/15/20 | | | | CCC | | | | 672,500 | |
| | | | | |
| | 2,656 | | | Iona Energy Company UK, Reg S | | | 9.500% | | | | 9/27/18 | | | | N/R | | | | 796,875 | |
| | | | | |
| | 2,185 | | | Key Energy Services Inc., (4) | | | 6.750% | | | | 3/01/21 | | | | B | | | | 1,289,150 | |
| | | | | |
| | 1,500 | | | Linn Energy LLC Finance Corporation | | | 8.625% | | | | 4/15/20 | | | | B1 | | | | 1,230,315 | |
| | | | | |
| | 4,220 | | | Martin Mid-Stream Partners LP Finance | | | 7.250% | | | | 2/15/21 | | | | B– | | | | 4,146,150 | |
| | | | | |
| | 2,765 | | | MEG Energy Corporation, 144A | | | 6.375% | | | | 1/30/23 | | | | BB– | | | | 2,557,625 | |
| | | | | |
| | 1,950 | | | Memorial Production Partners LP Finance Corporation | | | 7.625% | | | | 5/01/21 | | | | B– | | | | 1,857,375 | |
| | | | | |
| | 2,921 | | | Metro Exploration Holding Inc. | | | 11.500% | | | | 2/15/16 | | | | N/R | | | | 175,266 | |
| | | | | |
| | 1,500 | | | Niska Gas Storage Canada ULC Finance Corporation | | | 6.500% | | | | 4/01/19 | | | | CCC+ | | | | 1,410,000 | |
| | | | | |
| | 1,250 | | | Northern Blizzard Resources Inc., 144A | | | 7.250% | | | | 2/01/22 | | | | B | | | | 1,193,750 | |
| | | | | |
| | 1,375 | | | Northern Oil and Gas Inc. | | | 8.000% | | | | 6/01/20 | | | | B– | | | | 1,251,250 | |
| | | | | |
| | 1,225 | | | Oasis Petroleum Inc., (4) | | | 6.875% | | | | 3/15/22 | | | | B+ | | | | 1,243,375 | |
| | | | | |
| | 1,250 | CAD | | Paramount Resources Limited, 144A | | | 7.625% | | | | 12/04/19 | | | | BB– | | | | 1,037,080 | |
| | | | | |
| | 3,750 | | | Peabody Energy Corporation, 144A, (4) | | | 10.000% | | | | 3/15/22 | | | | BB+ | | | | 2,325,000 | |
| | | | | |
| | 2,350 | | | Penn Virginia Corporation, (4) | | | 8.500% | | | | 5/01/20 | | | | CCC+ | | | | 2,109,125 | |
| | | | | |
| | 2,500 | | | Pertamina Persero PT, 144A | | | 6.500% | | | | 5/27/41 | | | | Baa3 | | | | 2,478,250 | |
| | | | | |
| | 525 | | | Rex Energy Corporation | | | 8.875% | | | | 12/01/20 | | | | CCC+ | | | | 472,500 | |
| | | | | |
| | 50 | | | Rose Rock Midstream LP / Rose Rock Finance Corporation | | | 5.625% | | | | 7/15/22 | | | | B1 | | | | 48,875 | |
| | | | | |
| | 2,874 | | | Sabine Pass Liquefaction LLC | | | 5.625% | | | | 2/01/21 | | | | BB+ | | | | 2,931,480 | |
| | | | | |
| | 2,352 | | | Sabine Pass LNG LP | | | 7.500% | | | | 11/30/16 | | | | BB+ | | | | 2,475,504 | |
| | | | | |
| | 1,525 | | | Sanchez Energy Corporation, (4) | | | 7.750% | | | | 6/15/21 | | | | B– | | | | 1,517,375 | |
| | | | | |
| | 2,000 | | | Sanjel Corporation, 144A, Reg S | | | 7.500% | | | | 6/19/19 | | | | N/R | | | | 1,465,000 | |
| | | | | |
| | 1,500 | | | Seven Generations Energy Limited, 144A | | | 6.750% | | | | 5/01/23 | | | | B2 | | | | 1,496,250 | |
| | | | | |
| | 13,000 | NOK | | Ship Finance International Limited, Reg S | | | 5.450% | | | | 3/19/19 | | | | N/R | | | | 1,600,036 | |
| | | | | |
| | 1,600 | | | Summit Midstream Holdings LLC Finance | | | 7.500% | | | | 7/01/21 | | | | B | | | | 1,676,000 | |
| | | | | |
| | 2,030 | | | Talos Production LLC, 144A | | | 9.750% | | | | 2/15/18 | | | | CCC+ | | | | 1,766,100 | |
| | | | | |
| | 1,900 | | | Transocean Inc., (4) | | | 6.375% | | | | 12/15/21 | | | | BBB– | | | | 1,710,000 | |
| | | | | |
| | 2,025 | | | Vanguard Natural Resources Finance, (4) | | | 7.875% | | | | 4/01/20 | | | | B | | | | 1,933,875 | |
| | | | | | | | | | | | | | | | | | | | |
Principal
Amount (000) (10) | | | Description (1) | | Coupon | | | Maturity | | | Ratings (6) | | | Value | |
| | | | | |
| | | | Oil, Gas & Consumable Fuels (continued) | | | | | | | | | | | | |
| | | | | |
| $ | 3,070 | | | Western Refining Inc. | | | 6.250% | | | | 4/01/21 | | | | B+ | | | $ | 3,093,025 | |
| | | | Total Oil, Gas & Consumable Fuels | | | | | | | | | | | | | | | 89,258,766 | |
| | | | | |
| | | | Paper & Forest Products – 2.1% | | | | | | | | | | | | |
| | | | | |
| | 1,900 | | | Mercer International Inc. | | | 7.750% | | | | 12/01/22 | | | | B+ | | | | 2,042,500 | |
| | | | | |
| | 4,550 | | | Millar Western Forest Products Ltd | | | 8.500% | | | | 4/01/21 | | | | B– | | | | 4,379,375 | |
| | | | | |
| | 2,675 | | | Resolute Forest Products | | | 5.875% | | | | 5/15/23 | | | | BB– | | | | 2,434,250 | |
| | | | | |
| | 2,250 | | | Tembec Industries, Inc., 144A | | | 9.000% | | | | 12/15/19 | | | | B– | | | | 2,137,500 | |
| | | | | |
| | 2,950 | | | Verso Paper Holdings LLC | | | 11.750% | | | | 1/15/19 | | | | B– | | | | 1,784,750 | |
| | | | Total Paper & Forest Products | | | | | | | | | | | | | | | 12,778,375 | |
| | | | | |
| | | | Personal Products – 0.6% | | | | | | | | | | | | |
| | | | | |
| | 3,500 | | | Albea Beauty Holdings SA, 144A | | | 8.375% | | | | 11/01/19 | | | | B | | | | 3,745,000 | |
| | | | | |
| | | | Pharmaceuticals – 0.5% | | | | | | | | | | | | |
| | | | | |
| | 2,900 | | | VP Escrow Corporation, 144A | | | 6.375% | | | | 10/15/20 | | | | B1 | | | | 3,054,063 | |
| | | | | |
| | | | Professional Services – 0.4% | | | | | | | | | | | | |
| | | | | |
| | 2,500 | | | CEB Inc., 144A | | | 5.625% | | | | 6/15/23 | | | | BB– | | | | 2,512,500 | |
| | | | | |
| | | | Real Estate Investment Trust – 0.7% | | | | | | | | | | | | |
| | | | | |
| | 2,500 | | | Communications Sales & Leasing Inc., 144A | | | 8.250% | | | | 10/15/23 | | | | BB | | | | 2,456,250 | |
| | | | | |
| | 1,750 | | | KWG Property Holdings Limited, Reg S | | | 13.250% | | | | 3/22/17 | | | | B+ | | | | 1,911,875 | |
| | | | Total Real Estate Investment Trust | | | | | | | | | | | | | | | 4,368,125 | |
| | | | | |
| | | | Real Estate Management & Development – 1.8% | | | | | | | | | | | | |
| | | | | |
| | 1,800 | | | Future Land Development Holdings Limited, Reg S | | | 10.250% | | | | 7/21/19 | | | | B+ | | | | 1,839,528 | |
| | | | | |
| | 1,625 | | | Gemdale International Investment Limited, Reg S | | | 7.125% | | | | 11/16/17 | | | | Ba3 | | | | 1,677,813 | |
| | | | | |
| | 3,000 | | | Hunt Companies Inc., 144A | | | 9.625% | | | | 3/01/21 | | | | N/R | | | | 3,090,000 | |
| | | | | |
| | 1,000 | | | Kaisa Group Holdings Limited, 144A, (9) | | | 8.875% | | | | 3/19/18 | | | | Ca | | | | 520,000 | |
| | | | | |
| | 2,715 | | | Mattamy Group Corporation, 144A | | | 6.500% | | | | 11/15/20 | | | | BB | | | | 2,619,975 | |
| | | | | |
| | 1,500 | | | Yanlord Land Group Limited, 144A | | | 10.625% | | | | 3/29/18 | | | | Ba3 | | | | 1,570,980 | |
| | | | Total Real Estate Management & Development | | | | | | | | | | | | | | | 11,318,296 | |
| | | | | |
| | | | Road & Rail – 0.3% | | | | | | | | | | | | |
| | | | | |
| | 2,113 | | | JCH Parent Inc., 144A | | | 10.500% | | | | 3/15/19 | | | | CCC– | | | | 1,589,656 | |
| | | | | |
| | | | Semiconductors & Semiconductor Equipment – 0.4% | | | | | | | | | | | | |
| | | | | |
| | 2,950 | | | Advanced Micro Devices, Inc., (4) | | | 7.000% | | | | 7/01/24 | | | | B– | | | | 2,492,750 | |
| | | | | |
| | | | Software – 0.7% | | | | | | | | | | | | |
| | | | | |
| | 2,000 | | | BCP Singapore VI Cayman Financing Company Limited, 144A | | | 8.000% | | | | 4/15/21 | | | | BB– | | | | 2,012,500 | |
| | | | | |
| | 1,000 | | | Boxer Parent Company Inc./BMC Software, 144A, (4) | | | 9.000% | | | | 10/15/19 | | | | CCC+ | | | | 710,000 | |
| | | | | |
| | 1,725 | | | SixSigma Networks Mexico SA de CV, 144A | | | 8.250% | | | | 11/07/21 | | | | BB– | | | | 1,783,133 | |
| | | | Total Software | | | | | | | | | | | | | | | 4,505,633 | |
| | | | | |
| | | | Specialty Retail – 0.3% | | | | | | | | | | | | |
| | | | | |
| | 1,600 | | | Neiman Marcus Mariposa Borrower / Merger Sub LLC, 144A, (4) | | | 8.000% | | | | 10/15/21 | | | | CCC+ | | | | 1,684,000 | |
Nuveen High Income Bond Fund (continued)
| | |
| Portfolio of Investments | | June 30, 2015 |
| | | | | | | | | | | | | | | | | | | | |
Principal
Amount (000) (10) | | | Description (1) | | Coupon | | | Maturity | | | Ratings (6) | | | Value | |
| | | | | |
| | | | Trading Companies & Distributors – 0.2% | | | | | | | | | | | | |
| | | | | |
| $ | 1,500 | | | Aviation Capital SA, 144A | | | 7.500% | | | | 5/27/20 | | | | B+ | | | $ | 1,466,250 | |
| | | | | |
| | | | Transportation Infrastructure – 0.6% | | | | | | | | | | | | |
| | | | | |
| | 3,400 | | | Navigator Holdings Limited, 144A, Reg S | | | 9.000% | | | | 12/18/17 | | | | N/R | | | | 3,571,986 | |
| | | | | |
| | | | Wireless Telecommunication Services – 3.1% | | | | | | | | | | | | |
| | | | | |
| | 15,500 | SEK | | AINMT Scandinavia Holdings AB, Reg S | | | 9.750% | | | | 3/19/19 | | | | N/R | | | | 1,991,291 | |
| | | | | |
| | 1,900 | | | Colombia Telecommunicaciones S.A. ESP, 144A | | | 8.500% | | | | 9/30/65 | | | | B+ | | | | 1,971,250 | |
| | | | | |
| | 1,900 | | | Digicel Limited, 144A | | | 6.750% | | | | 3/01/23 | | | | B1 | | | | 1,862,570 | |
| | | | | |
| | 2,075 | | | FairPoint Communications Inc., 144A | | | 8.750% | | | | 8/15/19 | | | | B | | | | 2,158,000 | |
| | | | | |
| | 3,800 | | | Millicom International Cellular SA, 144A | | | 6.000% | | | | 3/15/25 | | | | BB+ | | | | 3,667,000 | |
| | | | | |
| | 3,515 | | | Sprint Corporation, (4) | | | 7.250% | | | | 9/15/21 | | | | B+ | | | | 3,427,125 | |
| | | | | |
| | 2,000 | | | T-Mobile USA Inc., (4) | | | 6.250% | | | | 4/01/21 | | | | BB | | | | 2,050,000 | |
| | | | | |
| | 2,000 | | | Wind Acquisition Finance SA, 144A | | | 7.375% | | | | 4/23/21 | | | | B | | | | 2,022,499 | |
| | | | Total Wireless Telecommunication Services | | | | | | | | | | | | | | | 19,149,735 | |
| | | | Total Corporate Bonds (cost $534,181,484) | | | | | | | | | | | | | | | 499,954,663 | |
| | | | | |
Principal
Amount (000) | | | Description (1) | | Coupon | | | Maturity | | | Ratings (6) | | | Value | |
| | | |
| | | | CONVERTIBLE BONDS – 0.3% | | | | | | | | | |
| | | | | |
| | | | Metals & Mining – 0.0% | | | | | | | | | | | | |
| | | | | |
| $ | 1,500 | | | Great Western Mineral Group, Reg S, (9) | | | 8.000% | | | | 4/06/17 | | | | N/R | | | $ | 75,000 | |
| | | | | |
| | | | Oil, Gas & Consumable Fuels – 0.3% | | | | | | | | | | | | |
| | | | | |
| | 1,465 | | | Alpha Natural Resources Inc., (9) | | | 4.875% | | | | 12/15/20 | | | | CCC– | | | | 98,888 | |
| | | | | |
| | 2,300 | | | DCP Midstream LLC, 144A | | | 5.850% | | | | 5/21/43 | | | | BB | | | | 1,822,750 | |
| | 3,765 | | | Total Oil, Gas & Consumable Fuels | | | | | | | | | | | | | | | 1,921,638 | |
| $ | 5,265 | | | Total Convertible Bonds (cost $4,812,976) | | | | | | | | | | | | | | | 1,996,638 | |
| | | | | |
Principal
Amount (000)/
Shares (10) | | | Description (1) | | Coupon | | | Maturity | | | Ratings (6) | | | Value | |
| | | | | |
| | | | $1,000 PAR (OR SIMILAR) INSTITUTIONAL PREFERRED – 4.3% | | | | | | | | | | | | | | | | |
| | | | | |
| | | | Banks – 3.0% | | | | | | | | | | | | |
| | | | | |
| $ | 1,900 | | | BAC Capital Trust XIV | | | 4.000% | | | | 9/29/49 | | | | BBB– | | | $ | 1,512,874 | |
| | | | | |
| | 2,760 | EUR | | Barclays PLC | | | 6.500% | | | | N/A (11) | | | | BB+ | | | | 3,065,915 | |
| | | | | |
| | 3,000 | EUR | | Barclays PLC | | | 8.000% | | | | N/A (11) | | | | BB+ | | | | 3,545,230 | |
| | | | | |
| | 2,638 | | | Lloyd’s Banking Group PLC | | | 7.500% | | | | N/A (11) | | | | BB+ | | | | 2,717,140 | |
| | | | | |
| | 3,700 | | | Societe Generale, 144A | | | 1.021% | | | | N/A (11) | | | | BB+ | | | | 3,413,250 | |
| | | | | |
| | 2,000 | | | Societe Generale, 144A, (4) | | | 7.875% | | | | N/A (11) | | | | BB+ | | | | 2,010,000 | |
| | | | | |
| | 3,000 | | | U.S. Bancorp. | | | 3.500% | | | | N/A (11) | | | | A3 | | | | 2,403,000 | |
| | | | Total Banks | | | | | | | | | | | | | | | 18,667,409 | |
| | | | | | | | | | | | | | | | | | | | |
Principal
Amount (000)/
Shares (10) | | | Description (1) | | Coupon | | | Maturity | | | Ratings (6) | | | Value | |
| | | | | |
| | | | Capital Markets – 0.3% | | | | | | | | | | | | |
| | | | | |
| $ | 2,840 | | | Goldman Sachs Capital II | | | 4.000% | | | | N/A (11) | | | | Ba1 | | | $ | 2,161,950 | |
| | | | | |
| | | | Diversified Financial Services – 0.3% | | | | | | | | | | | | |
| | | | | |
| | 2,000 | | | Banco BTG Pactual SA/Luxembourg, 144A, (4) | | | 8.750% | | | | N/A (11) | | | | Ba3 | | | | 2,006,000 | |
| | | | | |
| | | | Industrial Conglomerates – 0.1% | | | | | | | | | | | | |
| | | | | |
| | 2,000 | | | OAS Financial Limited, 144A | | | 0.000% | | | | N/A (11) | | | | N/R | | | | 408,000 | |
| | | | | |
| | | | Insurance – 0.6% | | | | | | | | | | | | |
| | | | | |
| | 2,000 | | | Glen Meadows Pass-Through Trust, 144A | | | 6.505% | | | | 2/12/67 | | | | BBB– | | | | 1,860,000 | |
| | | | | |
| | 2,000 | | | XL Capital Ltd | | | 6.500% | | | | N/A (11) | | | | BBB | | | | 1,711,260 | |
| | | | Total Insurance | | | | | | | | | | | | | | | 3,571,260 | |
| | | | Total $1,000 Par (or similar) Institutional Preferred (cost $27,718,894) | | | | 26,814,619 | |
| | | | | |
Principal
Amount (000) | | | Description (1) | | Coupon | | | Maturity | | | Ratings (6) | | | Value | |
| | | | | |
| | | | ASSET-BACKED SECURITIES – 0.0% | | | | | | | | | | | | | | | | |
| | | | | |
| $ | 1 | | | Green Tree Financial Corporation, Manufactured Housing Contract Pass-Through Certificates, Series 1998-1 | | | 6.040% | | | | 11/01/29 | | | | AA | | | $ | 1,363 | |
| $ | 1 | | | Total Asset-Backed Securities (cost $1,334) | | | | | | | | | | | | | | | 1,363 | |
| | | | | |
| Shares | | | Description (1), (5) | | | | | | | | | | | Value | |
| | | | | |
| | | | INVESTMENT COMPANIES – 2.1% | | | | | | | | | | | | | | | | |
| | | | | |
| | 63,500 | | | Adams Natural Resources Fund Inc. | | | | | | | | | | | | | | $ | 1,417,954 | |
| | | | | |
| | 144,000 | | | Blackrock Credit Allocation Income Trust IV | | | | | | | | | | | | | | | 1,824,480 | |
| | | | | |
| | 43,000 | | | BlackRock MuniHoldings Insured Fund Inc. | | | | | | | | | | | | | | | 557,710 | |
| | | | | |
| | 163,500 | | | First Trust Strategic High Income Fund II | | | | | | | | | | | | | | | 2,163,105 | |
| | | | | |
| | 47,500 | | | Gabelli Global Gold Natural Resources and Income Trust | | | | | | | | | | | | | | | 309,225 | |
| | | | | |
| | 142,500 | | | Invesco Dynamic Credit Opportunities Fund | | | | | | | | | | | | | | | 1,654,425 | |
| | | | | |
| | 183,500 | | | Pimco Income Strategy Fund | | | | | | | | | | | | | | | 1,992,810 | |
| | | | | |
| | 150,000 | | | Pioneer Floating Rate Trust | | | | | | | | | | | | | | | 1,707,000 | |
| | | | | |
| | 100,309 | | | Western Asset Emerging Markets Income Fund | | | | | | | | | | | | | | | 1,076,316 | |
| | | | | |
| | 32,351 | | | WhiteHorse Finance Incorporated | | | | | | | | | | | | | | | 409,564 | |
| | | | Total Investment Companies (cost $14,231,594) | | | | | | | | | | | | | | | 13,112,589 | |
| | | | | |
| Shares | | | Description (1) | | | | | | | | | | | Value | |
| | | | | |
| | | | WARRANTS – 0.0% | | | | | | | | | | | | | | | | |
| | | | | |
| | 336,891 | | | Iona Energy Inc., (3) | | | | | | | | | | | | | | $ | 9,962 | |
| | | | | |
| | 6,707 | | | FairPoint Communications Inc., (15) | | | | | | | | | | | | | | | 335 | |
| | | | Total Warrants (cost $—) | | | | | | | | | | | | | | | 10,297 | |
| | | | Total Long-Term Investments (cost $662,915,228) | | | | 621,494,960 | |
Nuveen High Income Bond Fund (continued)
| | |
| Portfolio of Investments | | June 30, 2015 |
| | | | | | | | | | | | | | | | |
| Shares | | | Description (1) | | Coupon | | | | | | | Value | |
| | | |
| | | | INVESTMENTS PURCHASED WITH COLLATERAL FROM SECURITIES LENDING – 16.7% | | | | | | |
| | | | | |
| | | | Money Market Funds – 16.7% | | | | | | | | | | |
| | | | | |
| | 104,213,543 | | | Mount Vernon Securities Lending Trust Prime Portfolio, (13) | | | 0.234% (12) | | | | | | | $ | 104,213,543 | |
| | | | Total Investments Purchased with Collateral from Securities Lending (cost $104,213,543) | | | 104,213,543 | |
| | | | | |
| Shares | | | Description (1) | | Coupon | | | | | | | Value | |
| | | | | |
| | | | SHORT-TERM INVESTMENTS – 1.1% | | | | | | | | | | |
| | | | | |
| | | | Money Market Funds – 1.1% | | | | | | | | | | | | |
| | | | | |
| | 6,916,507 | | | First American Treasury Obligations Fund, Class Z | | | 0.000% (12) | | | | | | | $ | 6,916,507 | |
| | | | Total Short-Term Investments (cost $6,916,507) | | | | | | | | | | | 6,916,507 | |
| | | | Total Investments (cost $774,045,278) – 117.7% | | | | | | | | | | | 732,625,010 | |
| | | | Other Assets Less Liabilities – (17.7)% (14) | | | | | | | | | | | (110,279,909 | ) |
| | | | Net Assets – 100% | | | | | | | | | | $ | 622,345,101 | |
Investments in Derivatives as of June 30, 2015
Forward Foreign Currency Exchange Contracts outstanding:
| | | | | | | | | | | | | | | | | | | | |
| Counterparty | | Currency Contracts to Deliver | | Amount
(Local Currency) | | | In Exchange
For Currency | | Amount
(Local Currency) | | | Settlement
Date | | | Unrealized
Appreciation
Depreciation)
(U.S. Dollars) | |
| Bank of America | | Pound Sterling | | | 2,290,000 | | | U.S. Dollar | | | 3,603,984 | | | | 9/30/15 | | | $ | 8,234 | |
| Citigroup | | Euro | | | 400,000 | | | U.S. Dollar | | | 452,107 | | | | 7/31/15 | | | | 5,976 | |
| Citigroup | | Euro | | | 2,500,000 | | | U.S. Dollar | | | 2,811,050 | | | | 7/31/15 | | | | 22,729 | |
| Citigroup | | Euro | | | 18,506,900 | | | U.S. Dollar | | | 20,600,586 | | | | 7/31/15 | | | | (40,687 | ) |
| Citigroup | | U.S. Dollar | | | 63,883 | | | Euro | | | 57,000 | | | | 7/31/15 | | | | (310 | ) |
| Citigroup | | U.S. Dollar | | | 3,048,220 | | | Euro | | | 2,740,000 | | | | 7/31/15 | | | | 7,780 | |
| Citigroup | | U.S. Dollar | | | 4,116,689 | | | Euro | | | 3,770,000 | | | | 7/31/15 | | | | 88,099 | |
| Goldman Sachs | | Canadian Dollar | | | 16,874,000 | | | U.S. Dollar | | | 13,665,703 | | | | 8/31/15 | | | | 167,280 | |
| Goldman Sachs | | Norwegian Krone | | | 63,356,000 | | | U.S. Dollar | | | 8,068,413 | | | | 7/31/15 | | | | (6,133 | ) |
| Goldman Sachs | | Swedish Krona | | | 15,525,000 | | | U.S. Dollar | | | 1,796,625 | | | | 7/31/15 | | | | (77,381 | ) |
| Goldman Sachs | | U.S. Dollar | | | 1,028,457 | | | Norwegian Krone | | | 8,100,000 | | | | 7/31/15 | | | | 3,866 | |
| Goldman Sachs | | U.S. Dollar | | | 768,691 | | | Canadian Dollar | | | 953,000 | | | | 8/31/15 | | | | (6,335 | ) |
| | | | | | | | | | | | | | | | | | | $ | 173,118 | |
Interest Rate Swaps outstanding:
| | | | | | | | | | | | | | | | | | | | | | | | | | | | | | | | |
| Counterparty | | Notional
Amount | | | Fund
Pay/Receive
Floating Rate | | | Floating Rate Index | | | Fixed Rate
(Annualized) | | | Fixed Rate
Payment
Frequency | | | Termination
Date | | | Value | | | Unrealized
Appreciation
(Depreciation) | |
Bank of America* | | $ | 37,000,000 | | | | Receive | | | | 3-Month
USD-LIBOR-ICE | | | | 1.573 | % | | | Semi-Annually | | | | 10/10/18 | | | $ | (346,419 | ) | | $ | (346,790 | ) |
JPMorgan* | | | 19,000,000 | | | | Receive | | | | 3-Month
USD-LIBOR-ICE | | | | 2.354 | % | | | Semi-Annually | | | | 5/21/25 | | | | 96,000 | | | | 96,000 | |
| | | $ | 56,000,000 | | | | | | | | | | | | | | | | | | | | | | | $ | (250,419 | ) | | $ | (250,790 | ) |
| * | Citigroup is the clearing broker for this transaction. |
Futures Contracts outstanding:
| | | | | | | | | | | | | | | | | | | | | | | | |
| Description | | Contract
Position | | | Number of
Contracts | | | Contract
Expiration | | | Notional
Amount at
Value | | | Variation Margin
Receivable/
(Payable) | | | Unrealized
Appreciation
(Depreciation) | |
U.S. Treasury 10-Year Note | | | Long | | | | 328 | | | | 9/15 | | | $ | 41,384,375 | | | $ | (10,250 | ) | | $ | (275,517 | ) |
For Fund portfolio compliance purposes, the Fund’s industry classifications refer to any one or more of the industry sub-classifications used by one or more widely recognized market indexes or ratings group indexes, and/or as defined by Fund management. This definition may not apply for purposes of this report, which may combine industry sub-classifications into sectors for reporting ease.
| (1) | All percentages shown in the Portfolio of Investments are based on net assets. |
| (2) | Non-income producing; issuer has not declared a dividend within the past twelve months. |
| (3) | Investment valued at fair value using methods determined in good faith by, or at discretion of, the Board. For fair value measurement disclosure purposes, investment classified as Level 3. See Notes to Financial Statements, Note 2 – Investment Valuation and Fair Value Measurements for more information. |
| (4) | Investment, or a portion of investment, is out on loan for securities lending. The total value of the securities out on loan as of the end of the reporting period was $94,391,235. |
| (5) | A copy of the most recent financial statements for these exchange-traded funds and investment companies can be obtained directly from the Securities and Exchange Commission (SEC) on its website at http://www.sec.gov. |
| (6) | Ratings (not covered by the report of independent registered public accounting firm): Using the highest of Standard & Poor’s Group (“Standard & Poor’s”), Moody’s Investors Service, Inc. (“Moody’s”) or Fitch, Inc. (“Fitch”) rating. Ratings below BBB by Standard & Poor’s, Baa by Moody’s or BBB by Fitch are considered to be below investment grade. Holdings designated N/R are not rated by any of these national rating agencies. |
| (7) | Senior loans generally are subject to mandatory and/or optional prepayment. Because of these mandatory prepayment conditions and because there may be significant economic incentives for a borrower to prepay, prepayments of senior loans may occur. As a result, the actual remaining maturity of senior loans held may be substantially less than the stated maturities shown. |
| (8) | Senior loans generally pay interest at rates which are periodically adjusted by reference to a base short-term, floating lending rate plus an assigned fixed rate. These floating lending rates are generally (i) the lending rate referenced by the London Inter-Bank Offered Rate (“LIBOR”), or (ii) the prime rate offered by one or more major United States banks. Senior loans may be considered restricted in that the Fund ordinarily is contractually obligated to receive approval from the agent bank and/or borrower prior to the disposition of a senior loan. The rate shown is the coupon as of the end of the reporting period. |
| (9) | As of, or subsequent to, the end of the reporting period, this security is non-income producing. Non-income producing, in the case of a fixed-income security, generally denotes that the issuer has (1) defaulted on the payment of principal or interest, (2) is under the protection of the Federal Bankruptcy Court or (3) the Fund’s Adviser has concluded that the issue is not likely to meet its future interest payment obligations and has ceased accruing additional income on the Fund’s records. |
| (10) | Principal Amount (000) denominated in U.S. Dollars, unless otherwise noted. |
| (11) | Perpetual security. Maturity date is not applicable. |
| (12) | The rate shown is the annualized seven-day effective yield as of the end of the reporting period. |
| (13) | The Fund may loan securities representing up to one third of the fair value of its total assets (which includes collateral for securities on loan) to broker-dealers, banks and other institutions. The Fund maintains collateral equal to at least 100% of the fair value of the securities loaned. The cash collateral received by the Fund is invested in this money market fund. See Notes to Financial Statements, Note 3 – Portfolio Securities and Investments in Derivatives, Securities Lending for more information. |
| (14) | Other assets less liabilities includes the unrealized appreciation (depreciation) of the over-the-counter derivatives as presented on the Statement of Assets and Liabilities. The unrealized appreciation (depreciation) of exchange-cleared and exchange-traded derivatives is recognized as part of the cash collateral at brokers and/or the receivable or payable for variation margin as presented on the Statement of Assets and Liabilities, when applicable. |
| (15) | For fair value measurement disclosure purposes, investment classified as Level 2. See Notes to Financial Statements, Note 2 – Investment Valuation and Fair Value Measurements for more information. |
| Reg S | Regulation S allows U.S. companies to sell securities to persons or entities located outside of the United States without registering those securities with the Securities and Exchange Commission. Specifically, Regulation S provides a safe harbor from the registration requirements of the Securities Act for the offers and sales of securities by both foreign and domestic issuers that are made outside the United States. |
| 144A | Investment is exempt from registration under Rule 144A of the Securities Act of 1933, as amended. These investments may only be resold in transactions exempt from registration, which are normally those transactions with qualified institutional buyers. |
| (WI/DD) | Investment, or portion of investment, purchased on a when-issued or delayed delivery basis. |
| USD-LIBOR-ICE | United States Dollar-London Inter-Bank Offered Rate-Intercontinental Exchange |
See accompanying notes to financial statements.
Nuveen Strategic Income Fund
| | |
| Portfolio of Investments | | June 30, 2015 |
| | | | | | | | | | | | | | | | | | | | |
| Shares | | | Description (1) | | | | | | | | | | | Value | |
| | | | | |
| | | | LONG-TERM INVESTMENTS – 97.7% | | | | | | | | | | | | | | | | |
| | | | | |
| | | | COMMON STOCKS – 0.0% | | | | | | | | | | | | | | | | |
| | | | | |
| | | | Building Products – 0.0% | | | | | | | | | | | | |
| | | | | |
| | 50 | | | Dayton Superior, Class A, (2), (3) | | | | | | | | | | | | | | $ | 2,839 | |
| | | | | |
| | 55 | | | Dayton Superior, Class 1, (2), (3) | | | | | | | | | | | | | | | 3,154 | |
| | | | Total Building Products | | | | | | | | | | | | | | | 5,993 | |
| | | | Total Common Stocks (cost $20,079) | | | | | | | | | | | | | | | 5,993 | |
| | | | | |
| Shares | | | Description (1) | | Coupon | | | | | | Ratings (4) | | | Value | |
| | | |
| | | | CONVERTIBLE PREFERRED SECURITIES – 0.1% | | | | | | | | | |
| | | | | |
| | | | Electric Utilities – 0.0% | | | | | | | | | | | | |
| | | | | |
| | 10,000 | | | Exelon Corporation, (7) | | | 6.500% | | | | | | | | BBB– | | | $ | 453,600 | |
| |
| | | | Independent Power & Renewable Electricity Producers – 0.1% | |
| | | | | |
| | 7,500 | | | Dynegy Inc. | | | 5.375% | | | | | | | | N/R | | | | 745,500 | |
| | | | Total Convertible Preferred Securities (cost $1,253,000) | | | | 1,199,100 | |
| | | | | |
Principal
Amount (000) | | | Description (1) | | Coupon (6) | | | Maturity (5) | | | Ratings (4) | | | Value | |
| | | | |
| | | | VARIABLE RATE SENIOR LOAN INTERESTS – 1.4% (6) | | | | | | | | | | | | | |
| | | | | |
| | | | Auto Components – 0.2% | | | | | | | | | | | | |
| | | | | |
| $ | 993 | | | Cooper-Standard Automotive Inc., Term Loan B | | | 4.000% | | | | 4/05/21 | | | | BB– | | | $ | 992,293 | |
| | | | | |
| | 1,990 | | | Crowne Group LLC, First Lien Term Loan B | | | 6.000% | | | | 9/29/20 | | | | B | | | | 1,990,000 | |
| | 2,983 | | | Total Auto Components | | | | | | | | | | | | | | | 2,982,293 | |
| | | | | |
| | | | Diversified Financial Services – 0.1% | | | | | | | | | | | | |
| | | | | |
| | 1,000 | | | Jill Acquisition LLC, First Lien Term Loan B | | | 6.000% | | | | 5/08/22 | | | | B | | | | 997,500 | |
| | | | | |
| | | | Electrical Equipment – 0.0% | | | | | | | | | | | | |
| | | | | |
| | 498 | | | Custom Sensors & Technologies Inc., First Lien Term Loan | | | 4.500% | | | | 9/30/21 | | | | B | | | | 497,344 | |
| | | | |
| | | | Health Care Equipment & Supplies – 0.1% | | | | | | | | | | |
| | | | | |
| | 998 | | | Surgery Center Holdings Inc., First Lien Term Loan | | | 5.250% | | | | 7/24/20 | | | | B1 | | | | 995,006 | |
| | | | |
| | | | Health Care Providers & Services – 0.2% | | | | | | | | | | |
| | | | | |
| | 1,985 | | | RegionalCare Hospital Partners Inc., First Lien Term Loan | | | 6.000% | | | | 4/23/19 | | | | B | | | | 1,986,240 | |
| | | | | |
| | | | Hotels, Restaurants & Leisure – 0.4% | | | | | | | | | | | | |
| | | | | |
| | 1,990 | | | Amaya BV, First Lien Term Loan | | | 5.000% | | | | 7/29/21 | | | | BB | | | | 1,989,588 | |
| | | | | |
| | 1,500 | | | Life Time Fitness, First Lien Term Loan B | | | 4.250% | | | | 6/10/22 | | | | BB– | | | | 1,490,859 | |
| | | | | |
| | 985 | | | Rock Ohio Caesar LLC, Term Loan B | | | 5.000% | | | | 3/29/19 | | | | B+ | | | | 967,146 | |
| | 4,475 | | | Total Hotels, Restaurants & Leisure | | | | | | | | | | | | | | | 4,447,593 | |
| | | | | | | | | | | | | | | | | | | | |
Principal
Amount (000) | | | Description (1) | | Coupon (6) | | | Maturity (5) | | | Ratings (4) | | | Value | |
| | | | | |
| | | | Independent Power & Renewable Electricity Producers – 0.1% | | | | | | | | | | | | |
| | | | | |
| $ | 65 | | | Empire Generating Company LLC, Term Loan C | | | 5.250% | | | | 3/12/21 | | | | B+ | | | $ | 62,608 | |
| | | | | |
| | 888 | | | Empire Generating Company LLC | | | 5.250% | | | | 3/12/21 | | | | B+ | | | | 853,650 | |
| | 953 | | | Total Independent Power & Renewable Electricity Producers | | | | | | | | | | | | | | | 916,258 | |
| | | | | |
| | | | Oil, Gas & Consumable Fuels – 0.1% | | | | | | | | | | | | |
| | | | | |
| | 985 | | | Arch Coal Inc., Term Loan B | | | 6.250% | | | | 5/16/18 | | | | B | | | | 682,004 | |
| | | | | |
| | 2,000 | | | Samson Investment Company Second Lien Term Loan | | | 5.000% | | | | 9/25/18 | | | | Caa2 | | | | 805,000 | |
| | 2,985 | | | Total Oil, Gas & Consumable Fuels | | | | | | | | | | | | | | | 1,487,004 | |
| | | | | |
| | | | Professional Services – 0.2% | | | | | | | | | | | | |
| | | | | |
| | 1,000 | | | Sedgwick Claims Management Service Inc., Second Lien Term Loan | | | 6.750% | | | | 2/28/22 | | | | CCC+ | | | | 983,333 | |
| | | | | |
| | 1,000 | | | Sedgwick Claims Management Service Inc., Second Lien Term Loan | | | 6.750% | | | | 2/28/22 | | | | Caa2 | | | | 983,333 | |
| | 2,000 | | | Total Professional Services | | | | | | | | | | | | | | | 1,966,666 | |
| $ | 17,877 | | | Total Variable Rate Senior Loan Interests (cost $17,740,472) | | | | | | | | | | | | 16,275,904 | |
| | | | | |
| Shares | | | Description (1) | | Coupon | | | | | | Ratings (4) | | | Value | |
| | | | |
| | | | $25 PAR (OR SIMILAR) RETAIL PREFERRED – 1.9% | | | | | | | | | | | | | |
| | | | | |
| | | | Banks – 1.2% | | | | | | | | | | | | |
| | | | | |
| | 20,600 | | | AgriBank FCB, (16) | | | 6.875% | | | | | | | | BBB+ | | | $ | 2,168,150 | |
| | | | | |
| | 50,000 | | | Citigroup Inc., (7) | | | 6.875% | | | | | | | | BB+ | | | | 1,333,000 | |
| | | | | |
| | 20,000 | | | Cobank Agricultural Credit Bank, (16) | | | 6.200% | | | | | | | | BBB+ | | | | 2,026,250 | |
| | | | | |
| | 118,392 | | | PNC Financial Services | | | 6.125% | | | | | | | | Baa2 | | | | 3,248,676 | |
| | | | | |
| | 95,250 | | | Regions Financial Corporation | | | 6.375% | | | | | | | | BB | | | | 2,397,443 | |
| | | | | |
| | 14,000 | | | Royal Bank of Scotland Group PLC | | | 5.750% | | | | | | | | B+ | | | | 339,220 | |
| | | | | |
| | 110,000 | | | Wells Fargo & Company | | | 6.625% | | | | | | | | BBB | | | | 3,036,000 | |
| | | | Total Banks | | | | | | | | | | | | | | | 14,548,739 | |
| | | | | |
| | | | Capital Markets – 0.1% | | | | | | | | | | | | |
| | | | | |
| | 73,000 | | | Goldman Sachs Group, Inc. | | | 5.500% | | | | | | | | Ba1 | | | | 1,789,960 | |
| | | | | |
| | | | Consumer Finance – 0.2% | | | | | | | | | | | | |
| | | | | |
| | 83,000 | | | Discover Financial Services | | | 6.500% | | | | | | | | BB– | | | | 2,114,010 | |
| | | | | |
| | | | Insurance – 0.4% | | | | | | | | | | | | |
| | | | | |
| | 73,140 | | | Endurance Specialty Holdings Limited | | | 7.500% | | | | | | | | BBB– | | | | 1,899,446 | |
| | | | | |
| | 100,000 | | | Reinsurance Group of America Inc. | | | 6.200% | | | | | | | | BBB | | | | 2,723,000 | |
| | | | Total Insurance | | | | | | | | | | | | | | | 4,622,446 | |
| | | | | |
| | | | Multi-Utilities – 0.0% | | | | | | | | | | | | |
| | | | | |
| | 5,000 | | | Dominion Resources Inc. | | | 0.000% | | | | | | | | Baa3 | | | | 233,500 | |
| | | | Total $25 Par (or similar) Retail Preferred (cost $22,449,828) | | | | | | | | | | | | 23,308,655 | |
Nuveen Strategic Income Fund (continued)
| | |
| Portfolio of Investments | | June 30, 2015 |
| | | | | | | | | | | | | | | | | | | | |
Principal
Amount (000) (8) | | | Description (1) | | Coupon | | | Maturity | | | Ratings (4) | | | Value | |
| | | | | |
| | | | CORPORATE BONDS – 71.8% | | | | | | | | | | | | | | | | |
| | | | | |
| | | | Aerospace & Defense – 0.6% | | | | | | | | | | | | |
| | | | | |
| $ | 1,500 | | | Bombardier Inc., 144A | | | 7.500% | | | | 3/15/18 | | | | B+ | | | $ | 1,567,500 | |
| | | | | |
| | 2,140 | | | Exelis, Inc. | | | 5.550% | | | | 10/01/21 | | | | BBB– | | | | 2,354,668 | |
| | | | | |
| | 3,000 | | | Martin Marietta Materials | | | 4.250% | | | | 7/02/24 | | | | BBB | | | | 3,036,951 | |
| | | | Total Aerospace & Defense | | | | | | | | | | | | | | | 6,959,119 | |
| | | | | |
| | | | Air Freight & Logistics – 0.1% | | | | | | | | | | | | |
| | | | | |
| | 1,750 | | | XPO Logistics, Inc., 144A | | | 6.500% | | | | 6/15/22 | | | | B1 | | | | 1,712,813 | |
| | | | | |
| | | | Airlines – 0.7% | | | | | | | | | | | | |
| | | | | |
| | 2,000 | | | Air Canada, 144A, (7) | | | 7.750% | | | | 4/15/21 | | | | B | | | | 2,135,000 | |
| | | | | |
| | 2,000 | | | American Airlines Group Inc., 144A | | | 4.625% | | | | 3/01/20 | | | | B+ | | | | 1,935,000 | |
| | | | | |
| | 2,941 | | | Northwest Airlines Trust Pass Through Certificates 2007-1 | | | 7.027% | | | | 11/01/19 | | | | A | | | | 3,300,863 | |
| | | | | |
| | 1,500 | | | VistaJet Malta Finance PLC, 144A, (7) | | | 7.750% | | | | 6/01/20 | | | | B | | | | 1,440,000 | |
| | | | Total Airlines | | | | | | | | | | | | | | | 8,810,863 | |
| | | | | |
| | | | Asset-Backed Securities – 0.1% | | | | | | | | | | | | |
| | | | | |
| | 1,769 | | | American Airlines Inc., Pass Through Trust 2013-2B, 144A | | | 5.600% | | | | 7/15/20 | | | | BBB– | | | | 1,831,220 | |
| | | | | |
| | | | Auto Components – 0.8% | | | | | | | | | | | | |
| | | | | |
| | 1,575 | | | American & Axle Manufacturing Inc. | | | 6.625% | | | | 10/15/22 | | | | BB– | | | | 1,653,750 | |
| | | | | |
| | 1,000 | | | Midas Intermediate Holdco II LLC / Midas Intermediate Holdco II Finance Inc., 144A | | | 7.875% | | | | 10/01/22 | | | | Caa1 | | | | 997,500 | |
| | | | | |
| | 1,500 | | | MPG Holdco I Inc. | | | 7.375% | | | | 10/15/22 | | | | B+ | | | | 1,597,500 | |
| | | | | |
| | 1,250 | | | Nexteer Automotive Group Limited, 144A | | | 5.875% | | | | 11/15/21 | | | | BB+ | | | | 1,281,250 | |
| | | | | |
| | 1,300 | | | Schaeffler Holding Finance BV, 144A | | | 6.250% | | | | 11/15/19 | | | | B1 | | | | 1,369,875 | |
| | | | | |
| | 1,250 | | | Stackpole International Intermediate Company, 144A, (7) | | | 7.750% | | | | 10/15/21 | | | | B+ | | | | 1,231,250 | |
| | | | | |
| | 1,580 | | | Tenneco Inc. | | | 5.375% | | | | 12/15/24 | | | | BB+ | | | | 1,623,450 | |
| | | | Total Auto Components | | | | | | | | | | | | | | | 9,754,575 | |
| | | | | |
| | | | Automobiles – 0.6% | | | | | | | | | | | | |
| | | | | |
| | 1,000 | EUR | | Fiat Finance & Trade SA, Reg S | | | 7.000% | | | | 3/23/17 | | | | BB– | | | | 1,194,285 | |
| | | | | |
| | 3,000 | | | General Motors Corporation, (7) | | | 4.000% | | | | 4/01/25 | | | | BBB– | | | | 2,944,902 | |
| | | | | |
| | 3,240 | | | General Motors Financial Company Inc. | | | 4.250% | | | | 5/15/23 | | | | BBB– | | | | 3,278,430 | |
| | | | Total Automobiles | | | | | | | | | | | | | | | 7,417,617 | |
| | | | | |
| | | | Banks – 9.2% | | | | | | | | | | | | |
| | | | | |
| | 1,000 | | | Banco Do Brasil, 144A | | | 9.000% | | | | 12/31/49 | | | | BB– | | | | 902,200 | |
| | | | | |
| | 2,000 | | | Bancolombia SA | | | 5.950% | | | | 6/03/21 | | | | Baa2 | | | | 2,193,000 | |
| | | | | |
| | 15,750 | | | Bank of America Corporation, (7) | | | 4.000% | | | | 4/01/24 | | | | A | | | | 16,026,806 | |
| | | | | |
| | 4,210 | | | Bank of America Corporation | | | 4.200% | | | | 8/26/24 | | | | A– | | | | 4,199,862 | |
| | | | | |
| | 4,025 | | | Bank of America Corporation | | | 4.250% | | | | 10/22/26 | | | | A– | | | | 3,942,902 | |
| | | | | |
| | 5,125 | | | Bank of America Corporation, (7) | | | 6.250% | | | | 3/05/65 | | | | BB+ | | | | 5,102,604 | |
| | | | | |
| | 2,700 | | | Barclays Bank PLC | | | 3.650% | | | | 3/16/25 | | | | A | | | | 2,553,655 | |
| | | | | | | | | | | | | | | | | | | | |
Principal
Amount (000) (8) | | | Description (1) | | Coupon | | | Maturity | | | Ratings (4) | | | Value | |
| | | | | |
| | | | Banks (continued) | | | | | | | | | | | | |
| | | | | |
| $ | 1,760 | | | CIT Group Inc. | | | 5.000% | | | | 8/01/23 | | | | BB+ | | | $ | 1,733,600 | |
| | | | | |
| | 7,000 | | | Citigroup Inc. | | | 3.875% | | | | 10/25/23 | | | | A | | | | 7,143,640 | |
| | | | | |
| | 7,210 | | | Citigroup Inc. | | | 3.750% | | | | 6/16/24 | | | | A | | | | 7,252,719 | |
| | | | | |
| | 6,000 | | | Citigroup Inc. | | | 4.300% | | | | 11/20/26 | | | | A– | | | | 5,866,932 | |
| | | | | |
| | 1,835 | | | Citigroup Inc. | | | 6.125% | | | | 8/25/36 | | | | A– | | | | 2,096,256 | |
| | | | | |
| | 3,500 | | | Credit Agricole, S.A, 144A, (7) | | | 6.625% | | | | 12/23/64 | | | | BB+ | | | | 3,416,000 | |
| | | | | |
| | 2,545 | | | General Electric Capital Corporation | | | 6.875% | | | | 1/10/39 | | | | AA+ | | | | 3,417,105 | |
| | | | | |
| | 2,360 | | | HSBC Holdings PLC | | | 6.800% | | | | 6/01/38 | | | | A+ | | | | 2,930,285 | |
| | | | | |
| | 4,515 | | | JPMorgan Chase & Company | | | 4.500% | | | | 1/24/22 | | | | A+ | | | | 4,838,604 | |
| | | | | |
| | 3,605 | | | JPMorgan Chase & Company | | | 3.375% | | | | 5/01/23 | | | | A | | | | 3,500,524 | |
| | | | | |
| | 3,000 | | | JPMorgan Chase & Company | | | 4.125% | | | | 12/15/26 | | | | A | | | | 2,949,828 | |
| | | | | |
| | 2,280 | | | JPMorgan Chase & Company, (7) | | | 6.400% | | | | 5/15/38 | | | | A+ | | | | 2,825,465 | |
| | | | | |
| | 4,620 | | | JP Morgan Chase & Company | | | 6.750% | | | | 12/31/49 | | | | BBB– | | | | 4,936,147 | |
| | | | | |
| | 1,000 | | | Popular Inc., (7) | | | 7.000% | | | | 7/01/19 | | | | BB– | | | | 1,000,000 | |
| | | | | |
| | 1,220 | | | Royal Bank of Scotland Group PLC | | | 6.100% | | | | 6/10/23 | | | | BBB | | | | 1,297,149 | |
| | | | | |
| | 1,500 | EUR | | Royal Bank of Scotland Group PLC | | | 5.500% | | | | 11/29/49 | | | | BB– | | | | 1,668,097 | |
| | | | | |
| | 3,335 | | | Santander UK PLC, 144A, (7) | | | 5.000% | | | | 11/07/23 | | | | A– | | | | 3,412,652 | |
| | | | | |
| | 2,485 | | | Societe Generale, 144A | | | 5.000% | | | | 1/17/24 | | | | A– | | | | 2,488,370 | |
| | | | | |
| | 1,960 | | | Standard Chartered PLC, 144A, (7) | | | 5.700% | | | | 3/26/44 | | | | A+ | | | | 2,031,877 | |
| | | | | |
| | 3,110 | | | Standard Chartered PLC, 144A, (7) | | | 6.500% | | | | 12/29/49 | | | | BBB | | | | 3,136,830 | |
| | | | | |
| | 1,500 | | | State Bank of India London, 144A | | | 3.622% | | | | 4/17/19 | | | | BBB– | | | | 1,532,705 | |
| | | | | |
| | 2,000 | | | State Bank of India London, 144A | | | 4.875% | | | | 4/17/24 | | | | BBB– | | | | 2,091,226 | |
| | | | | |
| | 4,500 | | | Wells Fargo & Company | | | 4.100% | | | | 6/03/26 | | | | A+ | | | | 4,518,968 | |
| | | | Total Banks | | | | | | | | | | | | | | | 111,006,008 | |
| | | | | |
| | | | Beverages – 0.5% | | | | | | | | | | | | |
| | | | | |
| | 1,250 | | | Andalou Efes Biracilik ve Malt Sanayii AS, 144A | | | 3.375% | | | | 11/01/22 | | | | BBB– | | | | 1,107,150 | |
| | | | | |
| | 800 | | | Coca-Cola Icecek AS, 144A | | | 4.750% | | | | 10/01/18 | | | | BBB | | | | 843,511 | |
| | | | | |
| | 1,350 | | | Constellation Brands Inc. | | | 4.250% | | | | 5/01/23 | | | | BB+ | | | | 1,329,750 | |
| | | | | |
| | 2,000 | | | DS Services of America, Inc., 144A | | | 10.000% | | | | 9/01/21 | | | | BB– | | | | 2,340,000 | |
| | | | Total Beverages | | | | | | | | | | | | | | | 5,620,411 | |
| | | | | |
| | | | Building Products – 1.0% | | | | | | | | | | | | |
| | | | | |
| | 1,000 | | | Associated Materials Inc. | | | 9.125% | | | | 11/01/17 | | | | B– | | | | 830,000 | |
| | | | | |
| | 1,500 | | | Builders FirstSource, Inc., 144A, (7) | | | 7.625% | | | | 6/01/21 | | | | B | | | | 1,552,500 | |
| | | | | |
| | 1,500 | | | Hardwoods Acquisition Inc., 144A | | | 7.500% | | | | 8/01/21 | | | | B | | | | 1,447,500 | |
| | | | | |
| | 1,875 | | | Masco Corporation | | | 5.950% | | | | 3/15/22 | | | | BBB | | | | 2,104,688 | |
| | | | | |
| | 2,000 | | | NCI Building Systems, Inc., 144A | | | 8.250% | | | | 1/15/23 | | | | B+ | | | | 2,130,000 | |
| | | | | |
| | 1,896 | | | Odebrecht Offshore Drilling Finance Limited, 144A | | | 6.625% | | | | 10/01/22 | | | | BB | | | | 1,317,581 | |
| | | | | |
| | 2,740 | | | Owens Corning Incorporated | | | 4.200% | | | | 12/15/22 | | | | BBB– | | | | 2,777,176 | |
| | | | Total Building Products | | | | | | | | | | | | | | | 12,159,445 | |
Nuveen Strategic Income Fund (continued)
| | |
| Portfolio of Investments | | June 30, 2015 |
| | | | | | | | | | | | | | | | | | | | |
Principal
Amount (000) (8) | | | Description (1) | | Coupon | | | Maturity | | | Ratings (4) | | | Value | |
| | | | | |
| | | | Capital Markets – 4.0% | | | | | | | | | | | | |
| | | | | |
| $ | 6,000 | | | Goldman Sachs Group, Inc. | | | 5.750% | | | | 1/24/22 | | | | A | | | $ | 6,824,814 | |
| | | | | |
| | 18,000 | | | Goldman Sachs Group, Inc. | | | 4.000% | | | | 3/03/24 | | | | A | | | | 18,314,064 | |
| | | | | |
| | 10,380 | | | Morgan Stanley | | | 3.750% | | | | 2/25/23 | | | | A | | | | 10,495,633 | |
| | | | | |
| | 12,500 | | | Morgan Stanley | | | 4.350% | | | | 9/08/26 | | | | A– | | | | 12,248,500 | |
| | | | Total Capital Markets | | | | | | | | | | | | | | | 47,883,011 | |
| | | | | |
| | | | Chemicals – 2.4% | | | | | | | | | | | | |
| | | | | |
| | 3,000 | | | Agrium Inc. | | | 3.375% | | | | 3/15/25 | | | | BBB | | | | 2,852,418 | |
| | | | | |
| | 2,625 | | | Braskem Finance Limited, 144A, (7) | | | 5.750% | | | | 4/15/21 | | | | BBB– | | | | 2,493,750 | |
| | | | | |
| | 2,000 | | | CF Industries Inc. | | | 5.150% | | | | 3/15/34 | | | | Baa2 | | | | 1,975,410 | |
| | | | | |
| | 1,500 | | | Chemours Co, 144A, (7) | | | 6.625% | | | | 5/15/23 | | | | BB– | | | | 1,453,125 | |
| | | | | |
| | 1,565 | | | Eastman Chemical Company | | | 3.600% | | | | 8/15/22 | | | | BBB | | | | 1,581,958 | |
| | | | | |
| | 2,000 | | | Eastman Chemical Company | | | 3.800% | | | | 3/15/25 | | | | BBB | | | | 1,996,466 | |
| | | | | |
| | 1,450 | | | Hexion Inc. | | | 6.625% | | | | 4/15/20 | | | | B3 | | | | 1,330,375 | |
| | | | | |
| | 964 | | | Ineos Group Holdings SA, 144A, (7) | | | 6.125% | | | | 8/15/18 | | | | B– | | | | 984,485 | |
| | | | | |
| | 1,700 | | | Mexichem SAB de CV, 144A | | | 4.875% | | | | 9/19/22 | | | | BBB | | | | 1,759,500 | |
| | | | | |
| | 2,000 | | | Momentive Performance Materials Inc., (3), (9) | | | 8.875% | | | | 10/15/20 | | | | N/R | | | | — | |
| | | | | |
| | 2,000 | | | Momentive Performance Materials Inc. | | | 3.880% | | | | 10/24/21 | | | | B | | | | 1,795,000 | |
| | | | | |
| | 2,000 | | | NOVA Chemicals Corporation, 144A | | | 5.250% | | | | 8/01/23 | | | | BBB– | | | | 2,030,000 | |
| | | | | |
| | 1,350 | | | NOVA Chemicals Corporation, 144A, (7) | | | 5.000% | | | | 5/01/25 | | | | BBB– | | | | 1,355,063 | |
| | | | | |
| | 1,600 | | | Office Cherifien Des Phosphates SA, 144A | | | 5.625% | | | | 4/25/24 | | | | BBB– | | | | 1,668,192 | |
| | | | | |
| | 1,750 | | | Platform Specialty Products Corporation, 144A | | | 6.500% | | | | 2/01/22 | | | | BB– | | | | 1,806,875 | |
| | | | | |
| | 1,605 | | | PolyOne Corporation | | | 5.250% | | | | 3/15/23 | | | | BB | | | | 1,588,950 | |
| | | | | |
| | 1,385 | | | Rayonier AM Products Inc., 144A | | | 5.500% | | | | 6/01/24 | | | | BB+ | | | | 1,236,113 | |
| | | | | |
| | 1,500 | | | Tronox Finance LLC, (7) | | | 6.375% | | | | 8/15/20 | | | | BB– | | | | 1,391,250 | |
| | | | Total Chemicals | | | | | | | | | | | | | | | 29,298,930 | |
| | | | | |
| | | | Commercial Services & Supplies – 1.0% | | | | | | | | | | | | |
| | | | | |
| | 1,995 | | | ABX Group Inc. | | | 6.375% | | | | 12/01/19 | | | | Ba3 | | | | 1,935,150 | |
| | | | | |
| | 1,290 | | | ADT Corporation, (7) | | | 6.250% | | | | 10/15/21 | | | | BBB– | | | | 1,354,500 | |
| | | | | |
| | 1,800 | | | Casella Waste Systems Inc. | | | 7.750% | | | | 2/15/19 | | | | B– | | | | 1,818,000 | |
| | | | | |
| | 1,325 | | | Clean Harbors Inc. | | | 5.250% | | | | 8/01/20 | | | | BB+ | | | | 1,344,875 | |
| | | | | |
| | 1,220 | | | Covanta Energy Corporation, Synthetic Letter of Credit | | | 6.375% | | | | 10/01/22 | | | | Ba3 | | | | 1,276,425 | |
| | | | | |
| | 250 | | | Covanta Holding Corporation | | | 5.875% | | | | 3/01/24 | | | | Ba3 | | | | 249,375 | |
| | | | | |
| | 2,000 | | | ERAC USA Finance LLC, 144A, (7) | | | 3.850% | | | | 11/15/24 | | | | BBB+ | | | | 2,007,406 | |
| | | | | |
| | 1,000 | CAD | | GFL Environmental Corporation, 144A | | | 7.500% | | | | 6/18/18 | | | | B | | | | 800,600 | |
| | | | | |
| | 800 | | | R.R. Donnelley & Sons Company, (7) | | | 7.625% | | | | 6/15/20 | | | | BB– | | | | 900,000 | |
| | | | | |
| | 1,000 | | | West Corporation, 144A | | | 5.375% | | | | 7/15/22 | | | | B+ | | | | 935,000 | |
| | | | Total Commercial Services & Supplies | | | | | | | | | | | | | | | 12,621,331 | |
| | | | | | | | | | | | | | | | | | | | |
Principal
Amount (000) (8) | | | Description (1) | | Coupon | | | Maturity | | | Ratings (4) | | | Value | |
| | | | | |
| | | | Communications Equipment – 0.2% | | | | | | | | | | | | |
| | | | | |
| $ | 2,000 | | | Avaya Inc., 144A | | | 7.000% | | | | 4/01/19 | | | | B1 | | | $ | 1,955,000 | |
| | | | | |
| | 1,000 | | | Goodman Networks Inc., (7) | | | 12.125% | | | | 7/01/18 | | | | B– | | | | 830,000 | |
| | | | Total Communications Equipment | | | | | | | | | | | | | | | 2,785,000 | |
| | | | | |
| | | | Construction & Engineering – 0.1% | | | | | | | | | | | | |
| | | | | |
| | 1,450 | | | AECOM Technology Corporation, 144A | | | 5.750% | | | | 10/15/22 | | | | BB– | | | | 1,468,125 | |
| | | | | |
| | 500 | | | Boart Longyear Management Pty Ltd, 144A | | | 7.000% | | | | 4/01/21 | | | | CCC | | | | 330,000 | |
| | | | Total Construction & Engineering | | | | | | | | | | | | | | | 1,798,125 | |
| | | | | |
| | | | Construction Materials – 0.5% | | | | | | | | | | | | |
| | | | | |
| | 1,500 | | | Cemex Finance LLC, 144A | | | 9.375% | | | | 10/12/22 | | | | BB– | | | | 1,670,625 | |
| | | | | |
| | 1,500 | | | Cemex SAB de CV, 144A, (7) | | | 5.700% | | | | 1/11/25 | | | | BB– | | | | 1,430,550 | |
| | | | | |
| | 1,200 | | | Norbord Inc., 144A | | | 5.375% | | | | 12/01/20 | | | | Ba2 | | | | 1,194,000 | |
| | | | | |
| | 2,000 | | | Reliance Intermediate Holdings LP, 144A | | | 6.500% | | | | 4/01/23 | | | | BB– | | | | 2,080,000 | |
| | | | Total Construction Materials | | | | | | | | | | | | | | | 6,375,175 | |
| | | | | |
| | | | Consumer Finance – 1.6% | | | | | | | | | | | | |
| | | | | |
| | 3,938 | | | Capital One Bank | | | 3.375% | | | | 2/15/23 | | | | Baa1 | | | | 3,825,298 | |
| | | | | |
| | 1,500 | | | Credit Acceptance Corporation, 144A | | | 7.375% | | | | 3/15/23 | | | | BB | | | | 1,548,750 | |
| | | | | |
| | 3,500 | | | Discover Bank | | | 4.250% | | | | 3/13/26 | | | | BBB+ | | | | 3,457,941 | |
| | | | | |
| | 3,215 | | | Discover Financial Services | | | 5.200% | | | | 4/27/22 | | | | BBB+ | | | | 3,418,410 | |
| | | | | |
| | 1,500 | | | Enova International, Inc. | | | 9.750% | | | | 6/01/21 | | | | B | | | | 1,417,500 | |
| | | | | |
| | 1,456 | | | First Data Corporation, 144A | | | 6.750% | | | | 11/01/20 | | | | BB | | | | 1,538,817 | |
| | | | | |
| | 3,445 | | | Ford Motor Credit Company | | | 4.250% | | | | 9/20/22 | | | | BBB– | | | | 3,587,750 | |
| | | | Total Consumer Finance | | | | | | | | | | | | | | | 18,794,466 | |
| | | | | |
| | | | Containers & Packaging – 0.9% | | | | | | | | | | | | |
| | | | | |
| | 1,043 | | | Ardagh Finance Holdings SA, 144A | | | 8.625% | | | | 6/15/19 | | | | CCC+ | | | | 1,079,634 | |
| | | | | |
| | 2,100 | CAD | | Cascades Inc., 144A | | | 5.500% | | | | 7/15/21 | | | | Ba3 | | | | 1,660,328 | |
| | | | | |
| | 3,600 | | | Packaging Corporation of America | | | 3.650% | | | | 9/15/24 | | | | BBB | | | | 3,527,759 | |
| | | | | |
| | 1,000 | | | PaperWorks Industries Inc., 144A | | | 9.500% | | | | 8/15/19 | | | | B– | | | | 995,000 | |
| | | | | |
| | 3,640 | | | Rock-Tenn Company | | | 4.900% | | | | 3/01/22 | | | | BBB | | | | 3,919,479 | |
| | | | Total Containers & Packaging | | | | | | | | | | | | | | | 11,182,200 | |
| | | | | |
| | | | Diversified Consumer Services – 0.4% | | | | | | | | | | | | |
| | | | | |
| | 1,000 | | | Gibson Brands Inc., 144A | | | 8.875% | | | | 8/01/18 | | | | B– | | | | 1,010,000 | |
| | | | | |
| | 1,220 | | | Nine West Holdings Incorporated, 144A | | | 8.250% | | | | 3/15/19 | | | | CCC | | | | 817,400 | |
| | | | | |
| | 1,500 | GBP | | Pizza Express, 144A | | | 6.625% | | | | 8/01/21 | | | | B | | | | 2,432,746 | |
| | | | Total Diversified Consumer Services | | | | | | | | | | | | | | | 4,260,146 | |
| | | | | |
| | | | Diversified Financial Services – 1.7% | | | | | | | | | | | | |
| | | | | |
| | 2,000 | | | Argos Merger Sub Inc., 144A, (7) | | | 7.125% | | | | 3/15/23 | | | | B– | | | | 2,095,000 | |
| | | | | |
| | 5,465 | | | BNP Paribas, (7) | | | 4.250% | | | | 10/15/24 | | | | A | | | | 5,389,933 | |
| | | | | |
| | 1,250 | | | CNG Holdings Inc., 144A | | | 9.375% | | | | 5/15/20 | | | | B– | | | | 906,250 | |
Nuveen Strategic Income Fund (continued)
| | |
| Portfolio of Investments | | June 30, 2015 |
| | | | | | | | | | | | | | | | | | | | |
Principal
Amount (000) (8) | | | Description (1) | | Coupon | | | Maturity | | | Ratings (4) | | | Value | |
| | | | | |
| | | | Diversified Financial Services (continued) | | | | | | | | | | | | |
| | | | | |
| $ | 1,500 | | | Fly Leasing Limited | | | 6.750% | | | | 12/15/20 | | | | BB | | | $ | 1,545,000 | |
| | | | | |
| | 1,750 | | | James Hardie International Finance Limited, 144A | | | 5.875% | | | | 2/15/23 | | | | BBB– | | | | 1,802,500 | |
| | | | | |
| | 1,500 | | | Jefferies Finance LLC Corporation, 144A, (7) | | | 7.375% | | | | 4/01/20 | | | | B+ | | | | 1,473,750 | |
| | | | | |
| | 1,300 | | | Jefferies LoanCore LLC Finance Corporation, 144A | | | 6.875% | | | | 6/01/20 | | | | B | | | | 1,261,000 | |
| | | | | |
| | 1,745 | | | Nationstar Mortgage LLC Capital Corporation, (7) | | | 7.875% | | | | 10/01/20 | | | | B+ | | | | 1,740,638 | |
| | | | | |
| | 3,705 | | | Synchrony Financial, (7) | | | 4.250% | | | | 8/15/24 | | | | BBB– | | | | 3,720,913 | |
| | | | Total Diversified Financial Services | | | | | | | | | | | | | | | 19,934,984 | |
| | | |
| | | | Diversified Telecommunication Services – 3.7% | | | | | | | |
| | | | | |
| | 5,000 | | | AT&T, Inc. | | | 3.000% | | | | 6/30/22 | | | | A– | | | | 4,827,820 | |
| | | | | |
| | 1,250 | | | AT&T, Inc., (7) | | | 5.550% | | | | 8/15/41 | | | | A– | | | | 1,280,713 | |
| | | | | |
| | 2,780 | | | Brasil Telecom SA, 144A, (7) | | | 5.750% | | | | 2/10/22 | | | | BB+ | | | | 2,408,175 | |
| | | | | |
| | 3,000 | | | CenturyLink Inc., 144A | | | 5.625% | | | | 4/01/25 | | | | BB+ | | | | 2,707,500 | |
| | | | | |
| | 1,000 | | | CenturyLink Inc. | | | 6.750% | | | | 12/01/23 | | | | BB+ | | | | 1,003,125 | |
| | | | | |
| | 1,100 | | | CyrusOne LP Finance | | | 6.375% | | | | 11/15/22 | | | | B+ | | | | 1,138,500 | |
| | | | | |
| | 1,470 | | | Frontier Communications Corporation, (7) | | | 8.500% | | | | 4/15/20 | | | | BB | | | | 1,536,885 | |
| | | | | |
| | 1,000 | | | Frontier Communications Corporation | | | 7.625% | | | | 4/15/24 | | | | BB | | | | 882,500 | |
| | | | | |
| | 1,750 | | | GCI Inc. | | | 6.875% | | | | 4/15/25 | | | | BB– | | | | 1,767,500 | |
| | | | | |
| | 1,835 | | | IntelSat Jackson Holdings, (7) | | | 6.625% | | | | 12/15/22 | | | | CCC+ | | | | 1,669,850 | |
| | | | | |
| | 1,000 | | | Level 3 Financing Inc., (7) | | | 5.375% | | | | 8/15/22 | | | | BB | | | | 1,010,000 | |
| | | | | |
| | 1,480 | | | Qualitytech LP/QTS Finance Corp. | | | 5.875% | | | | 8/01/22 | | | | B+ | | | | 1,487,400 | |
| | | | | |
| | 2,360 | | | Qwest Corporation | | | 6.750% | | | | 12/01/21 | | | | BBB– | | | | 2,604,850 | |
| | | | | |
| | 3,000 | | | SBA Communications Corporation | | | 4.875% | | | | 7/15/22 | | | | B | | | | 2,921,250 | |
| | | | | |
| | 11,385 | | | Verizon Communications | | | 5.150% | | | | 9/15/23 | | | | A– | | | | 12,464,765 | |
| | | | | |
| | 3,000 | | | Verizon Communications, (7) | | | 3.500% | | | | 11/01/24 | | | | A– | | | | 2,917,977 | |
| | | | | |
| | 700 | | | Verizon Communications | | | 6.550% | | | | 9/15/43 | | | | A– | | | | 818,828 | |
| | | | | |
| | 1,265 | | | Windstream Corporation | | | 6.375% | | | | 8/01/23 | | | | BB | | | | 1,029,394 | |
| | | | Total Diversified Telecommunication Services | | | | | | | | | | | | | | | 44,477,032 | |
| | | | | |
| | | | Electric Utilities – 1.7% | | | | | | | | | | | | |
| | | | | |
| | 2,030 | | | APT Pipelines Limited, 144A | | | 3.875% | | | | 10/11/22 | | | | BBB | | | | 2,008,813 | |
| | | | | |
| | 2,485 | | | Comision Federal de Electricidad of the United States of Mexico, 144A | | | 4.875% | | | | 5/26/21 | | | | BBB+ | | | | 2,596,825 | |
| | | | | |
| | 2,010 | | | Constellation Energy Group | | | 5.150% | | | | 12/01/20 | | | | BBB+ | | | | 2,224,204 | |
| | | | | |
| | 2,600 | | | Eskom Holdings Limited, 144A, (7) | | | 7.125% | | | | 2/11/25 | | | | BB+ | | | | 2,630,628 | |
| | | | | |
| | 3,145 | | | Exelon Generation Co. LLC | | | 4.250% | | | | 6/15/22 | | | | BBB | | | | 3,219,209 | |
| | | | | |
| | 1,250 | | | FirstEnergy Corporation | | | 4.250% | | | | 3/15/23 | | | | Baa3 | | | | 1,257,803 | |
| | | | | |
| | 2,615 | | | FirstEnergy Transmission LLC, 144A | | | 4.350% | | | | 1/15/25 | | | | Baa3 | | | | 2,683,074 | |
| | | | | |
| | 1,750 | | | Intergen NV, 144A | | | 7.000% | | | | 6/30/23 | | | | B+ | | | | 1,557,500 | |
| | | | | |
| | 1,700 | | | PPL Energy Supply LLC, 144A, (7) | | | 6.500% | | | | 6/01/25 | | | | BB– | | | | 1,700,000 | |
| | | | | |
| | 1,000 | | | RJS Power Holdings LLC, 144A | | | 5.125% | | | | 7/15/19 | | | | BB– | | | | 980,000 | |
| | | | Total Electric Utilities | | | | | | | | | | | | | | | 20,858,056 | |
| | | | | | | | | | | | | | | | | | | | |
Principal
Amount (000) (8) | | | Description (1) | | Coupon | | | Maturity | | | Ratings (4) | | | Value | |
| | | | | |
| | | | Electrical Equipment – 0.2% | | | | | | | | | | | | |
| | | | | |
| $ | 2,000 | | | Molex Electronic Technologies LLC, 144A | | | 3.900% | | | | 4/15/25 | | | | BBB | | | $ | 1,937,904 | |
| | | |
| | | | Electronic Equipment, Instruments & Components – 0.1% | | | | | | | |
| | | | | |
| | 1,400 | | | Anixter Inc. | | | 5.125% | | | | 10/01/21 | | | | BB+ | | | | 1,424,500 | |
| | | | | |
| | | | Energy Equipment & Services – 1.9% | | | | | | | | | | | | |
| | | | | |
| | 1,100 | | | Calfrac Holdings LP, 144A | | | 7.500% | | | | 12/01/20 | | | | BB– | | | | 1,015,740 | |
| | | | | |
| | 1,985 | | | Diamond Offshore Drilling Inc., (7) | | | 5.700% | | | | 10/15/39 | | | | A3 | | | | 1,737,532 | |
| | | | | |
| | 500 | | | Drill Rigs Holdings Inc., 144A, (7) | | | 6.500% | | | | 10/01/17 | | | | B– | | | | 438,750 | |
| | | | | |
| | 3,075 | | | Ensco PLC, (7) | | | 4.700% | | | | 3/15/21 | | | | BBB+ | | | | 3,132,195 | |
| | | | | |
| | 2,500 | | | Ensco PLC, (7) | | | 5.200% | | | | 3/15/25 | | | | BBB+ | | | | 2,475,163 | |
| | | | | |
| | 500 | | | McDermott International Inc., 144A | | | 8.000% | | | | 5/01/21 | | | | BB– | | | | 450,000 | |
| | | | | |
| | 1,835 | | | Nabors Industries Inc., (7) | | | 4.625% | | | | 9/15/21 | | | | BBB | | | | 1,823,019 | |
| | | | | |
| | 3,000 | | | Noble Holding International Limited, (7), GDR | | | 5.950% | | | | 4/01/25 | | | | BBB | | | | 2,957,931 | |
| | | | | |
| | 2,000 | | | Origin Energy Finance Limited, 144A | | | 3.500% | | | | 10/09/18 | | | | Baa2 | | | | 2,051,674 | |
| | | | | |
| | 750 | | | Pacific Drilling V Limited, 144A, (7) | | | 7.250% | | | | 12/01/17 | | | | B+ | | | | 645,000 | |
| | | | | |
| | 2,750 | | | Regency Energy Partners Finance | | | 5.000% | | | | 10/01/22 | | | | BBB– | | | | 2,793,442 | |
| | | | | |
| | 1,500 | | | Seventy Seven Energy Inc., (7) | | | 6.625% | | | | 11/15/19 | | | | B | | | | 1,185,000 | |
| | | | | |
| | 700 | | | Seventy Seven Energy Inc. | | | 6.500% | | | | 7/15/22 | | | | CCC+ | | | | 448,000 | |
| | | | | |
| | 1,385 | | | Weatherford International PLC | | | 7.000% | | | | 3/15/38 | | | | BBB– | | | | 1,323,823 | |
| | | | Total Energy Equipment & Services | | | | | | | | | | | | | | | 22,477,269 | |
| | | | | |
| | | | Food & Staples Retailing – 0.8% | | | | | | | | | | | | |
| | | | | |
| | 3,185 | | | Kraft Foods Inc. | | | 5.000% | | | | 6/04/42 | | | | BBB– | | | | 3,173,923 | |
| | | | | |
| | 1,000 | | | Rite Aid Corporation, 144A | | | 6.125% | | | | 4/01/23 | | | | B | | | | 1,030,000 | |
| | | | | |
| | 2,000 | | | Supervalu Inc., (7) | | | 7.750% | | | | 11/15/22 | | | | B | | | | 2,098,750 | |
| | | | | |
| | 3,000 | | | Walgreens Boots Alliance, Inc. | | | 3.800% | | | | 11/18/24 | | | | BBB | | | | 2,938,134 | |
| | | | Total Food & Staples Retailing | | | | | | | | | | | | | | | 9,240,807 | |
| | | | | |
| | | | Food Products – 0.7% | | | | | | | | | | | | |
| | | | | |
| | 1,500 | | | BRF Brasil Foods SA, 144A | | | 4.750% | | | | 5/22/24 | | | | BBB | | | | 1,471,875 | |
| | | | | |
| | 1,750 | | | Diamond Foods Inc., 144A | | | 7.000% | | | | 3/15/19 | | | | CCC+ | | | | 1,793,750 | |
| | | | | |
| | 2,000 | | | Grupo Bimbo SAB de CV, 144A | | | 3.875% | | | | 6/27/24 | | | | BBB | | | | 1,993,340 | |
| | | | | |
| | 1,295 | | | Pilgrim’s Pride Corporation, 144A, (7) | | | 5.750% | | | | 3/15/25 | | | | BB+ | | | | 1,307,950 | |
| | | | | |
| | 2,000 | | | Tyson Foods, (7) | | | 3.950% | | | | 8/15/24 | | | | BBB | | | | 2,014,676 | |
| | | | Total Food Products | | | | | | | | | | | | | | | 8,581,591 | |
| | | | | |
| | | | Gas Utilities – 0.2% | | | | | | | | | | | | |
| | | | | |
| | 1,390 | | | Ferrellgas LP | | | 6.750% | | | | 1/15/22 | | | | B+ | | | | 1,393,475 | |
| | | | | |
| | 200 | | | LBC Tank Terminals Holdings Netherlands BV, 144A | | | 6.875% | | | | 5/15/23 | | | | B | | | | 206,500 | |
| | | | | |
| | 1,250 | | | Suburban Propane Partners LP | | | 5.500% | | | | 6/01/24 | | | | BB– | | | | 1,249,375 | |
| | | | Total Gas Utilities | | | | | | | | | | | | | | | 2,849,350 | |
Nuveen Strategic Income Fund (continued)
| | |
| Portfolio of Investments | | June 30, 2015 |
| | | | | | | | | | | | | | | | | | | | |
Principal
Amount (000) (8) | | | Description (1) | | Coupon | | | Maturity | | | Ratings (4) | | | Value | |
| | | |
| | | | Health Care Equipment & Supplies – 0.4% | | | | | | | |
| | | | | |
| | 250 | EUR | | Labco SAS, Reg S | | | 8.500% | | | | 1/15/18 | | | | BB– | | | $ | 289,165 | |
| | | | | |
| | 3,000 | | | Medtronic, PLC, 144A | | | 3.500% | | | | 3/15/25 | | | | A | | | | 2,989,761 | |
| | | | | |
| | 1,000 | | | Tenet Healthcare Corporation, (7) | | | 4.375% | | | | 10/01/21 | | | | Ba2 | | | | 977,500 | |
| | | | Total Health Care Equipment & Supplies | | | | | | | | | | | | | | | 4,256,426 | |
| | | |
| | | | Health Care Providers & Services – 0.7% | | | | | | | |
| | | | | |
| | 2,000 | | | Aetna Inc. | | | 3.500% | | | | 11/15/24 | | | | A | | | | 1,960,550 | |
| | | | | |
| | 3,000 | | | HCA Inc. | | | 5.375% | | | | 2/01/25 | | | | BB– | | | | 3,048,900 | |
| | | | | |
| | 255 | | | IASIS Healthcare Capital Corporation | | | 8.375% | | | | 5/15/19 | | | | CCC+ | | | | 263,925 | |
| | | | | |
| | 1,750 | | | Kindred Healthcare Inc., (7) | | | 6.375% | | | | 4/15/22 | | | | B2 | | | | 1,747,813 | |
| | | | | |
| | 1,000 | | | Select Medical Corporation | | | 6.375% | | | | 6/01/21 | | | | B– | | | | 1,010,000 | |
| | | | Total Health Care Providers & Services | | | | | | | | | | | | | | | 8,031,188 | |
| | | | | |
| | | | Hotels, Restaurants & Leisure – 0.8% | | | | | | | | | | | | |
| | | | | |
| | 1,500 | | | 1011778 BC ULC/New Red Finance Inc., 144A, (7) | | | 6.000% | | | | 4/01/22 | | | | B– | | | | 1,541,250 | |
| | | | | |
| | 1,250 | | | Caesars Entertainment Resort Properties LLC | | | 8.250% | | | | 10/01/20 | | | | B+ | | | | 1,177,350 | |
| | | | | |
| | 1,250 | | | Caesars Growth Properties Holdings LLC / Caesars Growth Properties Finance Inc., 144A, (7) | | | 9.375% | | | | 5/01/22 | | | | B– | | | | 937,500 | |
| | | | | |
| | 1,500 | | | Roc Finance LLC and Roc Finance 1 Corporation, 144A | | | 12.125% | | | | 9/01/18 | | | | B– | | | | 1,601,250 | |
| | | | | |
| | 2,000 | | | Scientific Games International Inc. | | | 10.000% | | | | 12/01/22 | | | | B | | | | 1,915,000 | |
| | | | | |
| | 2,350 | | | Wynn Macau Limited, 144A, (7) | | | 5.250% | �� | | | 10/15/21 | | | | BB | | | | 2,220,750 | |
| | | | Total Hotels, Restaurants & Leisure | | | | | | | | | | | | | | | 9,393,100 | |
| | | | | |
| | | | Household Durables – 1.2% | | | | | | | | | | | | |
| | | | | |
| | 1,875 | | | Brookfield Residential Properties Inc., 144A | | | 6.500% | | | | 12/15/20 | | | | BB– | | | | 1,866,413 | |
| | | | | |
| | 2,940 | | | Harman International Industries, Inc. | | | 4.150% | | | | 5/15/25 | | | | BBB– | | | | 2,897,408 | |
| | | | | |
| | 2,000 | | | K. Hovnanian Enterprises Inc., 144A | | | 7.250% | | | | 10/15/20 | | | | Ba3 | | | | 2,040,000 | |
| | | | | |
| | 1,750 | | | KB Home | | | 7.000% | | | | 12/15/21 | | | | B+ | | | | 1,806,875 | |
| | | | | |
| | 1,000 | | | KB Home | | | 7.625% | | | | 5/15/23 | | | | B+ | | | | 1,045,000 | |
| | | | | |
| | 1,500 | | | RSI Home Products Incorporated, 144A | | | 6.500% | | | | 3/15/23 | | | | B+ | | | | 1,511,250 | |
| | | | | |
| | 1,000 | | | Standard Pacific Corporation | | | 5.875% | | | | 11/15/24 | | | | BB– | | | | 1,030,000 | |
| | | | | |
| | 1,800 | | | William Lyon Homes Incorporated | | | 8.500% | | | | 11/15/20 | | | | B– | | | | 1,944,000 | |
| | | | Total Household Durables | | | | | | | | | | | | | | | 14,140,946 | |
| | | | | |
| | | | Household Products – 0.3% | | | | | | | | | | | | |
| | | | | |
| | 1,300 | | | Kimberly-Clark de Mexico, S.A.B. de C.V, 144A | | | 3.250% | | | | 3/12/25 | | | | A | | | | 1,263,587 | |
| | | | | |
| | 2,000 | | | Macys Retail Holdings Inc. | | | 4.500% | | | | 12/15/34 | | | | BBB+ | | | | 1,918,936 | |
| | | | Total Household Products | | | | | | | | | | | | | | | 3,182,523 | |
| | | |
| | | | Independent Power & Renewable Electricity Producers – 1.4% | | | | | | | |
| | | | | |
| | 2,000 | | | Abengoa Yield PLC, 144A | | | 7.000% | | | | 11/15/19 | | | | BB+ | | | | 2,060,000 | |
| | | | | |
| | 3,700 | | | AES Corporation, (7) | | | 7.375% | | | | 7/01/21 | | | | BB | | | | 4,060,750 | |
| | | | | |
| | 3,000 | | | Calpine Corporation | | | 5.750% | | | | 1/15/25 | | | | BB– | | | | 2,917,500 | |
| | | | | | | | | | | | | | | | | | | | |
Principal
Amount (000) (8) | | | Description (1) | | Coupon | | | Maturity | | | Ratings (4) | | | Value | |
| | |
| | | | Independent Power & Renewable Electricity Producers (continued) | | | | |
| | | | | |
| $ | 1,000 | | | Columbia Pipeline Group, Inc., 144A | | | 4.500% | | | | 6/01/25 | | | | Baa2 | | | $ | 983,745 | |
| | | | | |
| | 1,000 | | | Dynegy Inc., 144A | | | 6.750% | | | | 11/01/19 | | | | B+ | | | | 1,040,500 | |
| | | | | |
| | 2,000 | | | Dynegy Inc., 144A | | | 7.625% | | | | 11/01/24 | | | | B+ | | | | 2,115,000 | |
| | | | | |
| | 1,500 | | | GenOn Energy Inc., (7) | | | 7.875% | | | | 6/15/17 | | | | B | | | | 1,518,750 | |
| | | | | |
| | 1,650 | | | GenOn Energy Inc. | | | 9.500% | | | | 10/15/18 | | | | B | | | | 1,683,000 | |
| | | | Total Independent Power & Renewable Electricity Producers | | | | | | | | | | | | | | | 16,379,245 | |
| | | | | |
| | | | Industrial Conglomerates – 0.2% | | | | | | | | | | | | |
| | | | | |
| | 1,000 | | | Alfa SAB de CV, 144A, (7) | | | 5.250% | | | | 3/25/24 | | | | BBB– | | | | 1,025,000 | |
| | | | | |
| | 1,000 | | | Stena AB, 144A | | | 7.000% | | | | 2/01/24 | | | | BB | | | | 965,000 | |
| | | | Total Industrial Conglomerates | | | | | | | | | | | | | | | 1,990,000 | |
| | | | | |
| | | | Insurance – 2.0% | | | | | | | | | | | | |
| | | | | |
| | 2,475 | | | AFLAC Insurance | | | 6.450% | | | | 8/15/40 | | | | A | | | | 3,007,803 | |
| | | | | |
| | 3,000 | | | Fairfax US Inc., 144A | | | 4.875% | | | | 8/13/24 | | | | BBB– | | | | 2,912,613 | |
| | | | | |
| | 3,255 | | | Genworth Holdings Inc. | | | 4.800% | | | | 2/15/24 | | | | Ba1 | | | | 2,839,988 | |
| | | | | |
| | 3,370 | | | Liberty Mutual Group Inc., 144A | | | 4.950% | | | | 5/01/22 | | | | BBB | | | | 3,622,777 | |
| | | | | |
| | 3,498 | | | Lincoln National Corporation | | | 4.200% | | | | 3/15/22 | | | | A– | | | | 3,670,591 | |
| | | | | |
| | 2,840 | | | Pacific LifeCorp., 144A | | | 6.000% | | | | 2/10/20 | | | | BBB+ | | | | 3,208,604 | |
| | | | | |
| | 3,015 | | | Symetra Financial Corporation | | | 4.250% | | | | 7/15/24 | | | | BBB+ | | | | 3,007,927 | |
| | | | | |
| | 1,830 | | | UnumProvident Corporation | | | 5.625% | | | | 9/15/20 | | | | BBB | | | | 2,059,220 | |
| | | | Total Insurance | | | | | | | | | | | | | | | 24,329,523 | |
| | | | | |
| | | | IT Services – 0.1% | | | | | | | | | | | | |
| | | | | |
| | 1,770 | | | Zayo Group LLC / Zayo Capital Inc., 144A | | | 6.000% | �� | | | 4/01/23 | | | | B– | | | | 1,748,229 | |
| | | | | |
| | | | Machinery – 0.7% | | | | | | | | | | | | |
| | | | | |
| | 1,310 | | | BlueLine Rental Finance Corporation, 144A | | | 7.000% | | | | 2/01/19 | | | | B+ | | | | 1,346,025 | |
| | | | | |
| | 925 | | | Commercial Vehicle Group, (7) | | | 7.875% | | | | 4/15/19 | | | | B | | | | 948,125 | |
| | | | | |
| | 1,510 | | | CTP Transportation Products LLC-Finance Inc., 144A | | | 8.250% | | | | 12/15/19 | | | | B+ | | | | 1,562,850 | |
| | | | | |
| | 3,100 | | | Ingersoll-Rand Luxembourg Finance SA | | | 3.550% | | | | 11/01/24 | | | | BBB | | | | 3,033,226 | |
| | | | | |
| | 1,640 | | | Terex Corporation, (7) | | | 6.000% | | | | 5/15/21 | | | | BB | | | | 1,648,200 | |
| | | | Total Machinery | | | | | | | | | | | | | | | 8,538,426 | |
| | | | | |
| | | | Marine – 0.5% | | | | | | | | | | | | |
| | | | | |
| | 2,000 | | | Eletson Holdings Inc., 144A | | | 9.625% | | | | 1/15/22 | | | | B | | | | 1,950,000 | |
| | | | | |
| | 1,000 | | | Global Ship Lease Inc., 144A | | | 10.000% | | | | 4/01/19 | | | | B | | | | 1,042,500 | |
| | | | | |
| | 1,200 | | | Navios Maritime Acquisition Corporation, 144A | | | 8.125% | | | | 11/15/21 | | | | BB– | | | | 1,182,000 | |
| | | | | |
| | 1,350 | | | Navios South American Logisitics Inc., Finance US Inc., 144A | | | 7.250% | | | | 5/01/22 | | | | B+ | | | | 1,292,625 | |
| | | | Total Marine | | | | | | | | | | | | | | | 5,467,125 | |
| | | | | |
| | | | Media – 3.7% | | | | | | | | | | | | |
| | | | | |
| | 2,750 | | | 21st Century Fox America Inc. | | | 6.650% | | | | 11/15/37 | | | | BBB+ | | | | 3,346,558 | |
| | | | | |
| | 1,500 | | | Altice S.A, 144A | | | 7.750% | | | | 5/15/22 | | | | B | | | | 1,451,250 | |
Nuveen Strategic Income Fund (continued)
| | |
| Portfolio of Investments | | June 30, 2015 |
| | | | | | | | | | | | | | | | | | | | |
Principal
Amount (000) (8) | | | Description (1) | | Coupon | | | Maturity | | | Ratings (4) | | | Value | |
| | | | | |
| | | | Media (continued) | | | | | | | | | | | | |
| | | | | |
| $ | 1,850 | | | Cablevision Systems Corporation | | | 5.875% | | | | 9/15/22 | | | | B1 | | | $ | 1,794,500 | |
| | | | | |
| | 2,810 | | | CBS Corporation | | | 3.500% | | | | 1/15/25 | | | | BBB | | | | 2,688,524 | |
| | | | | |
| | 1,175 | | | Cequel Communication Holdings I, 144A | | | 5.125% | | | | 12/15/21 | | | | B– | | | | 1,067,047 | |
| | | | | |
| | 740 | | | Charter Communications, CCO Holdings LLC | | | 5.125% | | | | 2/15/23 | | | | BB– | | | | 721,500 | |
| | | | | |
| | 1,000 | | | Clear Channel Communications, Inc. | | | 11.250% | | | | 3/01/21 | | | | CCC+ | | | | 971,250 | |
| | | | | |
| | 1,790 | | | Comcast Corporation | | | 6.400% | | | | 5/15/38 | | | | A– | | | | 2,178,127 | |
| | | | | |
| | 3,000 | | | Cox Communications Inc., 144A | | | 3.850% | | | | 2/01/25 | | | | BBB+ | | | | 2,883,147 | |
| | | | | |
| | 3,000 | | | CSC Holdings Inc. | | | 6.750% | | | | 11/15/21 | | | | BB | | | | 3,165,000 | |
| | | | | |
| | 5,335 | | | DIRECTV Holdings LLC | | | 3.800% | | | | 3/15/22 | | | | BBB | | | | 5,365,687 | |
| | | | | |
| | 1,460 | | | Dish DBS Corporation | | | 4.250% | | | | 4/01/18 | | | | BB– | | | | 1,485,550 | |
| | | | | |
| | 1,590 | | | Dish DBS Corporation | | | 5.875% | | | | 11/15/24 | | | | BB– | | | | 1,527,394 | |
| | | | | |
| | 1,000 | | | Lee Enterprises Inc., 144A | | | 9.500% | | | | 3/15/22 | | | | B2 | | | | 1,017,500 | |
| | | | | |
| | 1,000 | | | McClatchy Company | | | 9.000% | | | | 12/15/22 | | | | B1 | | | | 952,500 | |
| | | | | |
| | 1,000 | | | Midcontinent Communications Finance Company, 144A | | | 6.250% | | | | 8/01/21 | | | | B– | | | | 1,020,000 | |
| | | | | |
| | 2,006 | | | Numericable Group SA, 144A | | | 6.000% | | | | 5/15/22 | | | | Ba3 | | | | 1,977,164 | |
| | | | | |
| | 1,750 | | | Radio One Inc., 144A, (7) | | | 7.375% | | | | 10/15/22 | | | | B | | | | 1,715,000 | |
| | | | | |
| | 1,310 | | | Sinclair Television Group | | | 6.375% | | | | 11/01/21 | | | | B+ | | | | 1,352,575 | |
| | | | | |
| | 1,000 | | | Sirius XM Radio Inc., 144A | | | 5.750% | | | | 8/01/21 | | | | BB | | | | 1,027,500 | |
| | | | | |
| | 1,750 | | | Tribune Media Company, 144A | | | 5.875% | | | | 7/15/22 | | | | BB– | | | | 1,763,125 | |
| | | | | |
| | 1,500 | | | Unitymedia KabelBW GmbH, 144A | | | 6.125% | | | | 1/15/25 | | | | B | | | | 1,567,500 | |
| | | | | |
| | 1,750 | CAD | | Videotron Limited, 144A | | | 5.625% | | | | 6/15/25 | | | | BB | | | | 1,448,409 | |
| | | | | |
| | 1,500 | | | WMG Acquisition Group, 144A, (7) | | | 6.000% | | | | 1/15/21 | | | | B+ | | | | 1,530,000 | |
| | | | Total Media | | | | | | | | | | | | | | | 44,016,807 | |
| | | | | |
| | | | Metals & Mining – 3.2% | | | | | | | | | | | | |
| | | | | |
| | 500 | | | AK Steel Corporation, (7) | | | 7.625% | | | | 10/01/21 | | | | B– | | | | 407,500 | |
| | | | | |
| | 3,055 | | | Alcoa Inc. | | | 5.400% | | | | 4/15/21 | | | | BBB– | | | | 3,202,007 | |
| | | | | |
| | 2,500 | | | Allegheny Technologies Inc. | | | 5.875% | | | | 8/15/23 | | | | BB+ | | | | 2,546,875 | |
| | | | | |
| | 2,690 | | | Anglogold Holdings PLC | | | 6.500% | | | | 4/15/40 | | | | Baa3 | | | | 2,449,444 | |
| | | | | |
| | 2,040 | | | ArcelorMittal | | | 7.000% | | | | 2/25/22 | | | | Ba1 | | | | 2,198,100 | |
| | | | | |
| | 2,000 | | | Century Aluminum Company, 144A | | | 7.500% | | | | 6/01/21 | | | | BB– | | | | 2,027,500 | |
| | | | | |
| | 2,060 | | | Cliffs Natural Resources Inc., (7) | | | 4.800% | | | | 10/01/20 | | | | B3 | | | | 978,500 | |
| | | | | |
| | 1,750 | | | Eldorado Gold Corporation, 144A | | | 6.125% | | | | 12/15/20 | | | | BB | | | | 1,732,500 | |
| | | | | |
| | 1,550 | | | First Quantum Minerals Limited, 144A, (7) | | | 6.750% | | | | 2/15/20 | | | | BB– | | | | 1,499,625 | |
| | | | | |
| | 3,165 | | | Freeport McMoRan, Inc., (7) | | | 3.550% | | | | 3/01/22 | | | | BBB | | | | 2,929,613 | |
| | | | | |
| | 2,000 | | | Lundin Mining Corporation, 144A | | | 7.500% | | | | 11/01/20 | | | | Ba2 | | | | 2,155,000 | |
| | | | | |
| | 2,610 | | | Newmont Mining Corporation, (7) | | | 3.500% | | | | 3/15/22 | | | | BBB | | | | 2,490,830 | |
| | | | | |
| | 1,775 | | | Teck Resources Limited | | | 6.125% | | | | 10/01/35 | | | | BBB– | | | | 1,463,179 | |
| | | | | |
| | 1,140 | | | Teck Resources Limited | | | 6.250% | | | | 7/15/41 | | | | BBB– | | | | 917,392 | |
| | | | | | | | | | | | | | | | | | | | |
Principal
Amount (000) (8) | | | Description (1) | | Coupon | | | Maturity | | | Ratings (4) | | | Value | |
| | | | | |
| | | | Metals & Mining (continued) | | | | | | | | | | | | |
| | | | | |
| $ | 1,500 | | | Tupy S.A., 144A | | | 6.625% | | | | 7/17/24 | | | | BB | | | $ | 1,468,125 | |
| | | | | |
| | 2,000 | | | Vale Overseas Limited, (7) | | | 4.375% | | | | 1/11/22 | | | | BBB+ | | | | 1,953,904 | |
| | | | | |
| | 2,000 | | | Westmoreland Coal Co, 144A | | | 8.750% | | | | 1/01/22 | | | | B | | | | 1,860,000 | |
| | | | | |
| | 1,985 | | | Xstrata Finance Canada Limited, 144A | | | 4.250% | | | | 10/25/22 | | | | BBB | | | | 1,950,479 | |
| | | | | |
| | 1,265 | | | Xstrata Finance Canada Limited, 144A | | | 6.900% | | | | 11/15/37 | | | | BBB | | | | 1,362,650 | |
| | | | | |
| | 3,000 | | | Yamana Gold Inc. | | | 4.950% | | | | 7/15/24 | | | | Baa3 | | | | 2,889,696 | |
| | | | Total Metals & Mining | | | | | | | | | | | | | | | 38,482,919 | |
| | | | | |
| | | | Multiline Retail – 0.2% | | | | | | | | | | | | |
| | | | | |
| | 1,200 | | | Family Tree Escrow LLC, 144A, (7) | | | 5.250% | | | | 3/01/20 | | | | Ba3 | | | | 1,255,500 | |
| | | | | |
| | 1,500 | | | J.C. Penney Company Inc., (7) | | | 8.125% | | | | 10/01/19 | | | | Caa2 | | | | 1,485,000 | |
| | | | Total Multiline Retail | | | | | | | | | | | | | | | 2,740,500 | |
| | | | | |
| | | | Oil, Gas & Consumable Fuels – 9.8% | | | | | | | | | | | | |
| | | | | |
| | 740 | | | Amerada Hess Corporation | | | 7.125% | | | | 3/15/33 | | | | BBB | | | | 848,966 | |
| | | | | |
| | 4,170 | | | Anadarko Petroleum Corporation | | | 6.200% | | | | 3/15/40 | | | | BBB | | | | 4,699,655 | |
| | | | | |
| | 1,600 | | | Antero Resources Corporation, (7) | | | 5.125% | | | | 12/01/22 | | | | BB | | | | 1,512,000 | |
| | | | | |
| | 3,650 | | | Apache Corporation | | | 4.250% | | | | 1/15/44 | | | | BBB+ | | | | 3,169,784 | |
| | | | | |
| | 1,700 | CAD | | Baytex Energy Corporation | | | 6.625% | | | | 7/19/22 | | | | BB | | | | 1,395,116 | |
| | | | | |
| | 1,000 | | | Bellatrix Exploration Limited, 144A | | | 8.500% | | | | 5/15/20 | | | | B– | | | | 937,500 | |
| | | | | |
| | 1,295 | | | Berkshire Hathaway Energy Company | | | 6.125% | | | | 4/01/36 | | | | A3 | | | | 1,525,590 | |
| | | | | |
| | 2,965 | | | BP Capital Markets PLC, (7) | | | 3.814% | | | | 2/10/24 | | | | A | | | | 3,018,841 | |
| | | | | |
| | 2,130 | | | California Resources Corporation, (7) | | | 5.500% | | | | 9/15/21 | | | | BB | | | | 1,853,526 | |
| | | | | |
| | 1,900 | | | Calumet Specialty Products | | | 7.625% | | | | 1/15/22 | | | | B+ | | | | 1,938,000 | |
| | | | | |
| | 1,410 | | | Canadian Natural Resources Limited | | | 5.850% | | | | 2/01/35 | | | | BBB+ | | | | 1,490,689 | |
| | | | | |
| | 1,700 | | | Canadian Oil Sands Trust, 144A | | | 7.750% | | | | 5/15/19 | | | | Baa2 | | | | 1,849,000 | |
| | | | | |
| | 1,120 | | | Cenovus Energy Inc., (7) | | | 3.800% | | | | 9/15/23 | | | | BBB+ | | | | 1,106,634 | |
| | | | | |
| | 1,500 | | | Chaparral Energy Inc. | | | 7.625% | | | | 11/15/22 | | | | B– | | | | 1,080,000 | |
| | | | | |
| | 900 | | | Chesapeake Energy Corporation | | | 6.125% | | | | 2/15/21 | | | | BB+ | | | | 846,000 | |
| | | | | |
| | 1,000 | | | Chesapeake Energy Corporation, (7) | | | 4.875% | | | | 4/15/22 | | | | BB+ | | | | 867,500 | |
| | | | | |
| | 4,300 | | | CNOOC Finance 2014 ULC | | | 4.250% | | | | 4/30/24 | | | | AA– | | | | 4,391,366 | |
| | | | | |
| | 1,425 | | | Concho Resources Inc. | | | 5.500% | | | | 10/01/22 | | | | BB+ | | | | 1,417,875 | |
| | | | | |
| | 2,965 | | | Continental Resources Inc. | | | 5.000% | | | | 9/15/22 | | | | BBB– | | | | 2,907,571 | |
| | | | | |
| | 1,750 | | | Crestwood Midstream Partners LP | | | 6.125% | | | | 3/01/22 | | | | BB | | | | 1,785,000 | |
| | | | | |
| | 1,500 | | | Denbury Resources Inc. | | | 5.500% | | | | 5/01/22 | | | | BB | | | | 1,338,750 | |
| | | | | |
| | 1,400 | | | Energy Transfer Equity LP | | | 5.875% | | | | 1/15/24 | | | | BB+ | | | | 1,451,800 | |
| | | | | |
| | 1,000 | | | Energy Transfer Equity LP | | | 5.500% | | | | 6/01/27 | | | | BB+ | | | | 997,500 | |
| | | | | |
| | 500 | | | Energy XXI Gulf Coast Inc., 144A, (7) | | | 11.000% | | | | 3/15/20 | | | | BB | | | | 437,500 | |
| | | | | |
| | 2,315 | | | EnLink Midstream Partners LP | | | 4.150% | | | | 6/01/25 | | | | BBB | | | | 2,254,000 | |
| | | | | |
| | 1,450 | | | EnQuest PLC, 144A | | | 7.000% | | | | 4/15/22 | | | | B | | | | 1,145,500 | |
Nuveen Strategic Income Fund (continued)
| | |
| Portfolio of Investments | | June 30, 2015 |
| | | | | | | | | | | | | | | | | | | | |
Principal
Amount (000) (8) | | | Description (1) | | Coupon | | | Maturity | | | Ratings (4) | | | Value | |
| | | | | |
| | | | Oil, Gas & Consumable Fuels (continued) | | | | | | | | | | | | |
| | | | | |
| $ | 1,500 | | | EV Energy Partners LP / EV Energy Finance Corporation | | | 8.000% | | | | 4/15/19 | | | | B– | | | $ | 1,395,000 | |
| | | | | |
| | 2,000 | | | Gibson Energy, 144A | | | 6.750% | | | | 7/15/21 | | | | BB | | | | 2,065,000 | �� |
| | | | | |
| | 1,500 | | | Global Partners LP/GLP Finance | | | 6.250% | | | | 7/15/22 | | | | B+ | | | | 1,440,000 | |
| | | | | |
| | 750 | | | Halcon Resources Corporation, (7) | | | 8.875% | | | | 5/15/21 | | | | CCC | | | | 493,125 | |
| | | | | |
| | 2,300 | | | Hess Corporation, (7) | | | 3.500% | | | | 7/15/24 | | | | BBB | | | | 2,216,712 | |
| | | | | |
| | 2,415 | | | Kinder Morgan Energy Partners, LP | | | 4.250% | | | | 9/01/24 | | | | BBB– | | | | 2,352,053 | |
| | | | | |
| | 600 | | | Kinder Morgan Energy Partners, LP | | | 6.950% | | | | 1/15/38 | | | | BBB– | | | | 644,812 | |
| | | | | |
| | 1,500 | | | Linn Energy LLC Finance Corporation | | | 8.625% | | | | 4/15/20 | | | | B1 | | | | 1,230,315 | |
| | | | | |
| | 5,000 | | | Marathon Petroleum Corporation, (7) | | | 3.625% | | | | 9/15/24 | | | | BBB | | | | 4,909,040 | |
| | | | | |
| | 1,660 | | | Martin Mid-Stream Partners LP Finance | | | 7.250% | | | | 2/15/21 | | | | B– | | | | 1,630,950 | |
| | | | | |
| | 2,000 | | | MEG Energy Corporation, 144A | | | 6.375% | | | | 1/30/23 | | | | BB– | | | | 1,850,000 | |
| | | | | |
| | 1,000 | | | Memorial Production Partners LP Finance Corporation | | | 7.625% | | | | 5/01/21 | | | | B– | | | | 952,500 | |
| | | | | |
| | 2,000 | | | MPLX LP | | | 4.000% | | | | 2/15/25 | | | | BBB– | | | | 1,951,342 | |
| | | | | |
| | 2,095 | | | Newfield Exploration Company | | | 5.375% | | | | 1/01/26 | | | | BBB– | | | | 2,074,050 | |
| | | | | |
| | 1,550 | | | NGL Energy Partners LP/Fin Co | | | 5.125% | | | | 7/15/19 | | | | BB– | | | | 1,546,125 | |
| | | | | |
| | 1,000 | | | Niska Gas Storage Canada ULC Finance Corporation | | | 6.500% | | | | 4/01/19 | | | | CCC+ | | | | 940,000 | |
| | | | | |
| | 1,000 | | | Northern Oil and Gas Inc. | | | 8.000% | | | | 6/01/20 | | | | B– | | | | 910,000 | |
| | | | | |
| | 1,750 | | | Oasis Petroleum Inc., (7) | | | 6.875% | | | | 3/15/22 | | | | B+ | | | | 1,776,250 | |
| | | | | |
| | 1,130 | CAD | | Paramount Resources Limited, 144A | | | 7.625% | | | | 12/04/19 | | | | BB– | | | | 937,520 | |
| | | | | |
| | 1,750 | | | Peabody Energy Corporation, 144A, (7) | | | 10.000% | | | | 3/15/22 | | | | BB+ | | | | 1,085,000 | |
| | | | | |
| | 1,245 | | | Penn Virginia Corporation, (7) | | | 8.500% | | | | 5/01/20 | | | | CCC+ | | | | 1,117,388 | |
| | | | | |
| | 1,000 | | | Pertamina Persero PT, 144A | | | 4.875% | | | | 5/03/22 | | | | Baa3 | | | | 1,008,750 | |
| | | | | |
| | 1,275 | | | Petro Canada | | | 6.800% | | | | 5/15/38 | | | | A– | | | | 1,609,200 | |
| | | | | |
| | 1,770 | | | Petrobras International Finance Company | | | 6.875% | | | | 1/20/40 | | | | BBB– | | | | 1,576,822 | |
| | | | | |
| | 3,000 | | | Reliance Holdings USA Inc., 144A | | | 5.400% | | | | 2/14/22 | | | | BBB+ | | | | 3,234,984 | |
| | | | | |
| | 1,720 | | | Rose Rock Midstream LP / Rose Rock Finance Corporation, (7) | | | 5.625% | | | | 7/15/22 | | | | B1 | | | | 1,681,300 | |
| | | | | |
| | 1,750 | | | Sabine Pass Liquefaction LLC, (7) | | | 5.625% | | | | 2/01/21 | | | | BB+ | | | | 1,785,000 | |
| | | | | |
| | 1,000 | | | Seven Generations Energy Limited, 144A | | | 6.750% | | | | 5/01/23 | | | | B2 | | | | 997,500 | |
| | | | | |
| | 1,845 | | | Sinopec Group Overseas Development 2012, 144A | | | 3.900% | | | | 5/17/22 | | | | AA– | | | | 1,885,496 | |
| | | | | |
| | 2,600 | | | Southeast Supply Header LLC, 144A | | | 4.250% | | | | 6/15/24 | | | | BBB– | | | | 2,565,417 | |
| | | | | |
| | 1,445 | | | Southwestern Energy Company, (7) | | | 4.100% | | | | 3/15/22 | | | | BBB– | | | | 1,417,448 | |
| | | | | |
| | 1,000 | | | Summit Midstream Holdings LLC Finance | | | 7.500% | | | | 7/01/21 | | | | B | | | | 1,047,500 | |
| | | | | |
| | 1,520 | | | Targa Resources Inc. | | | 4.250% | | | | 11/15/23 | | | | BB+ | | | | 1,406,000 | |
| | | | | |
| | 1,500 | | | Tesoro Logistics LP Finance Corporation, 144A | | | 5.500% | | | | 10/15/19 | | | | BB | | | | 1,556,250 | |
| | | | | |
| | 1,900 | | | Thai Oil PCL, 144A | | | 3.625% | | | | 1/23/23 | | | | Baa1 | | | | 1,870,075 | |
| | | | | |
| | 1,000 | | | Transocean Inc., (7) | | | 6.375% | | | | 12/15/21 | | | | BBB– | | | | 900,000 | |
| | | | | |
| | 4,100 | | | Transocean Inc., (7) | | | 3.800% | | | | 10/15/22 | | | | BBB– | | | | 3,085,246 | |
| | | | | |
| | 3,325 | | | Valero Energy Corporation | | | 3.650% | | | | 3/15/25 | | | | BBB | | | | 3,233,034 | |
| | | | | |
| | 1,500 | | | Vanguard Natural Resources Finance | | | 7.875% | | | | 4/01/20 | | | | B | | | | 1,432,500 | |
| | | | | | | | | | | | | | | | | | | | |
Principal
Amount (000) (8) | | | Description (1) | | Coupon | | | Maturity | | | Ratings (4) | | | Value | |
| | | | | |
| | | | Oil, Gas & Consumable Fuels (continued) | | | | | | | | | | | | |
| | | | | |
| $ | 2,000 | | | Western Refining Inc. | | | 6.250% | | | | 4/01/21 | | | | B+ | | | $ | 2,015,000 | |
| | | | | |
| | 1,500 | | | Whiting Petroleum Corporation | | | 5.750% | | | | 3/15/21 | | | | BB | | | | 1,476,000 | |
| | | | | |
| | 2,875 | | | Woodside Finance Limited, 144A | | | 3.650% | | | | 3/05/25 | | | | BBB+ | | | | 2,761,070 | |
| | | | Total Oil, Gas & Consumable Fuels | | | | | | | | | | | | | | | 118,327,437 | |
| | | | | |
| | | | Paper & Forest Products – 0.7% | | | | | | | | | | | | |
| | | | | |
| | 3,100 | | | Domtar Corporation | | | 6.750% | | | | 2/15/44 | | | | BBB– | | | | 3,276,740 | |
| | | | | |
| | 1,500 | | | Mercer International Inc. | | | 7.750% | | | | 12/01/22 | | | | B+ | | | | 1,612,500 | |
| | | | | |
| | 1,750 | | | Resolute Forest Products | | | 5.875% | | | | 5/15/23 | | | | BB– | | | | 1,592,500 | |
| | | | | |
| | 950 | | | Sappi Papier Holding GMBH, 144A | | | 6.625% | | | | 4/15/21 | | | | BB | | | | 985,625 | |
| | | | | |
| | 1,500 | | | Tembec Industries, Inc., 144A | | | 9.000% | | | | 12/15/19 | | | | B– | | | | 1,425,000 | |
| | | | Total Paper & Forest Products | | | | | | | | | | | | | | | 8,892,365 | |
| | | | | |
| | | | Personal Products – 0.5% | | | | | | | | | | | | |
| | | | | |
| | 1,500 | | | Albea Beauty Holdings SA, 144A | | | 8.375% | | | | 11/01/19 | | | | B | | | | 1,605,000 | |
| | | | | |
| | 2,915 | | | International Paper Company | | | 8.700% | | | | 6/15/38 | | | | BBB | | | | 3,994,392 | |
| | | | Total Personal Products | | | | | | | | | | | | | | | 5,599,392 | |
| | | | | |
| | | | Pharmaceuticals – 0.4% | | | | | | | | | | | | |
| | | | | |
| | 2,000 | | | Endo Finance LLC, 144A | | | 5.750% | | | | 1/15/22 | | | | B1 | | | | 2,025,000 | |
| | | | | |
| | 1,950 | | | VP Escrow Corporation, 144A | | | 6.375% | | | | 10/15/20 | | | | B1 | | | | 2,053,594 | |
| | | | | |
| | 1,000 | | | VRX Escrow Corp., 144A | | | 5.875% | | | | 5/15/23 | | | | B1 | | | | 1,025,000 | |
| | | | Total Pharmaceuticals | | | | | | | | | | | | | | | 5,103,594 | |
| | | | | |
| | | | Professional Services – 0.1% | | | | | | | | | | | | |
| | | | | |
| | 1,500 | | | CEB Inc., 144A | | | 5.625% | | | | 6/15/23 | | | | BB– | | | | 1,507,500 | |
| | | | | |
| | | | Real Estate Investment Trust – 2.4% | | | | | | | | | | | | |
| | | | | |
| | 3,070 | | | American Tower Company | | | 5.000% | | | | 2/15/24 | | | | BBB | | | | 3,245,423 | |
| | | | | |
| | 1,795 | | | ARC Property Operating Partnership LP, Clark Acquisition LLC | | | 4.600% | | | | 2/06/24 | | | | BB+ | | | | 1,748,258 | |
| | | | | |
| | 1,500 | | | Communications Sales & Leasing Inc., 144A | | | 6.000% | | | | 4/15/23 | | | | BBB– | | | | 1,467,015 | |
| | | | | |
| | 3,300 | | | Crown Castle International Corporation | | | 5.250% | | | | 1/15/23 | | | | BBB– | | | | 3,323,925 | |
| | | | | |
| | 3,500 | | | Digital Realty Trust Inc. | | | 3.625% | | | | 10/01/22 | | | | BBB | | | | 3,413,470 | |
| | | | | |
| | 750 | | | KWG Property Holdings Limited, Reg S | | | 13.250% | | | | 3/22/17 | | | | B+ | | | | 819,375 | |
| | | | | |
| | 2,060 | | | Omega Healthcare Investors Inc. | | | 4.950% | | | | 4/01/24 | | | | BBB– | | | | 2,107,020 | |
| | | | | |
| | 2,080 | | | Piedmont Operating Partnership LP | | | 4.450% | | | | 3/15/24 | | | | BBB | | | | 2,089,938 | |
| | | | | |
| | 1,420 | | | Plum Creek Timberlands LP | | | 4.700% | | | | 3/15/21 | | | | BBB | | | | 1,520,124 | |
| | | | | |
| | 2,125 | | | Prologis Inc. | | | 6.875% | | | | 3/15/20 | | | | BBB+ | | | | 2,454,736 | |
| | | | | |
| | 2,000 | | | Realogy Group LLC / Realogy Co-Issuer Corporation, 144A, (7) | | | 5.250% | | | | 12/01/21 | | | | B | | | | 2,025,000 | |
| | | | | |
| | 3,000 | | | Senior Housing Properties Trust | | | 4.750% | | | | 5/01/24 | | | | BBB– | | | | 3,013,845 | |
| | | | | |
| | 1,425 | | | Sovereign Bank | | | 8.750% | | | | 5/30/18 | | | | Baa2 | | | | 1,661,001 | |
| | | | Total Real Estate Investment Trust | | | | | | | | | | | | | | | 28,889,130 | |
Nuveen Strategic Income Fund (continued)
| | |
| Portfolio of Investments | | June 30, 2015 |
| | | | | | | | | | | | | | | | | | | | |
Principal
Amount (000) (8) | | | Description (1) | | Coupon | | | Maturity | | | Ratings (4) | | | Value | |
| | |
| | | | Real Estate Management & Development – 0.4% | | | | |
| | | | | |
| $ | 500 | | | Crescent Resources LLC, 144A | | | 10.250% | | | | 8/15/17 | | | | B+ | | | $ | 530,625 | |
| | | | | |
| | 675 | | | Gemdale International Investment Limited, Reg S | | | 7.125% | | | | 11/16/17 | | | | Ba3 | | | | 696,938 | |
| | | | | |
| | 2,000 | | | Hunt Companies Inc., 144A | | | 9.625% | | | | 3/01/21 | | | | N/R | | | | 2,060,000 | |
| | | | | |
| | 500 | | | Kaisa Group Holdings Limited, 144A, (9) | | | 8.875% | | | | 3/19/18 | | | | Ca | | | | 260,000 | |
| | | | | |
| | 1,315 | | | Mattamy Group Corporation, 144A, (7) | | | 6.500% | | | | 11/15/20 | | | | BB | | | | 1,268,975 | |
| | | | Total Real Estate Management & Development | | | | | | | | | | | | | | | 4,816,538 | |
| | | | | |
| | | | Road & Rail – 0.2% | | | | | | | | | | | | |
| | | | | |
| | 1,000 | | | Hertz Corporation, (7) | | | 7.375% | | | | 1/15/21 | | | | B | | | | 1,041,250 | |
| | | | | |
| | 1,750 | | | Watco Companies LLC Finance, 144A | | | 6.375% | | | | 4/01/23 | | | | B | | | | 1,771,875 | |
| | | | Total Road & Rail | | | | | | | | | | | | | | | 2,813,125 | |
| | |
| | | | Semiconductors & Semiconductor Equipment – 0.4% | | | | |
| | | | | |
| | 1,500 | | | Advanced Micro Devices, Inc. | | | 7.000% | | | | 7/01/24 | | | | B– | | | | 1,267,500 | |
| | | | | |
| | 3,000 | | | Micron Technology, Inc., 144A | | | 5.500% | | | | 2/01/25 | | | | BB | | | | 2,811,000 | |
| | | | | |
| | 1,000 | | | NXP BV, 144A | | | 5.750% | | | | 3/15/23 | | | | BB | | | | 1,040,000 | |
| | | | Total Semiconductors & Semiconductor Equipment | | | | | | | | | | | | | | | 5,118,500 | |
| | | | | |
| | | | Software – 0.9% | | | | | | | | | | | | |
| | | | | |
| | 1,500 | | | BMC Software Finance Inc., 144A | | | 8.125% | | | | 7/15/21 | | | | CCC+ | | | | 1,215,000 | |
| | | | | |
| | 2,395 | | | Computer Sciences Corporation | | | 4.450% | | | | 9/15/22 | | | | BBB+ | | | | 2,458,422 | |
| | | | | |
| | 2,065 | | | Open Text Corporation, 144A | | | 5.625% | | | | 1/15/23 | | | | BB | | | | 2,044,350 | |
| | | | | |
| | 1,100 | | | SixSigma Networks Mexico SA de CV, 144A | | | 8.250% | | | | 11/07/21 | | | | BB– | | | | 1,137,070 | |
| | | | | |
| | 1,000 | | | SS&C Technologies Holdings, Inc., 144A, (WI/DD) | | | 5.875% | | | | 7/15/23 | | | | B+ | | | | 1,010,000 | |
| | | | | |
| | 2,500 | | | Total System Services Inc. | | | 3.750% | | | | 6/01/23 | | | | BBB+ | | | | 2,456,030 | |
| | | | Total Software | | | | | | | | | | | | | | | 10,320,872 | |
| | | | | |
| | | | Specialty Retail – 1.2% | | | | | | | | | | | | |
| | | | | |
| | 2,000 | | | Bed Bath and Beyond Incorporated | | | 3.749% | | | | 8/01/24 | | | | A– | | | | 1,995,012 | |
| | | | | |
| | 1,150 | | | Best Buy Co., Inc. | | | 5.000% | | | | 8/01/18 | | | | Baa2 | | | | 1,213,250 | |
| | | | | |
| | 1,175 | | | Guitar Center Inc., 144A | | | 6.500% | | | | 4/15/19 | | | | B– | | | | 1,075,125 | |
| | | | | |
| | 3,000 | | | L Brands, Inc. | | | 5.625% | | | | 10/15/23 | | | | BB+ | | | | 3,150,000 | |
| | | | | |
| | 1,250 | | | Neiman Marcus Mariposa Borrower / Merger Sub LLC, 144A | | | 8.000% | | | | 10/15/21 | | | | CCC+ | | | | 1,315,625 | |
| | | | | |
| | 4,485 | | | Signet UK Finance PLC | | | 4.700% | | | | 6/15/24 | | | | BBB– | | | | 4,529,250 | |
| | | | | |
| | 1,450 | | | The Men’s Warehouse Inc., (7) | | | 7.000% | | | | 7/01/22 | | | | B2 | | | | 1,551,500 | |
| | | | Total Specialty Retail | | | | | | | | | | | | | | | 14,829,762 | |
| | |
| | | | Technology Hardware, Storage & Peripherals – 0.1% | | | | |
| | | | | |
| | 950 | | | NCR Corporation | | | 6.375% | | | | 12/15/23 | | | | BB | | | | 1,007,000 | |
| | | | | |
| | | | Textiles, Apparel & Luxury Goods – 0.3% | | | | | | | | | | | | |
| | | | | |
| | 1,695 | | | Levi Strauss & Company, 144A | | | 5.000% | | | | 5/01/25 | | | | BB | | | | 1,639,913 | |
| | | | | |
| | 1,750 | | | Polymer Group Inc., 144A, (7) | | | 6.875% | | | | 6/01/19 | | | | CCC+ | | | | 1,610,000 | |
| | | | Total Textiles, Apparel & Luxury Goods | | | | | | | | | | | | | | | 3,249,913 | |
| | | | | | | | | | | | | | | | | | | | |
Principal
Amount (000) (8) | | | Description (1) | | Coupon | | | Maturity | | | Ratings (4) | | | Value | |
| | | | | |
| | | | Tobacco – 0.7% | | | | | | | | | | | | |
| | | | | |
| $ | 1,006 | | | Altria Group Inc. | | | 9.950% | | | | 11/10/38 | | | | BBB+ | | | $ | 1,619,897 | |
| | | | | |
| | 2,800 | | | Imperial Tobacco Finance, 144A | | | 3.500% | | | | 2/11/23 | | | | BBB | | | | 2,724,834 | |
| | | | | |
| | 3,765 | | | Reynolds American Inc. | | | 3.250% | | | | 11/01/22 | | | | BBB– | | | | 3,626,282 | |
| | | | Total Tobacco | | | | | | | | | | | | | | | 7,971,013 | |
| | |
| | | | Trading Companies & Distributors – 0.5% | | | | |
| | | | | |
| | 1,995 | | | Air Lease Corporation | | | 3.875% | | | | 4/01/21 | | | | BBB– | | | | 2,014,950 | |
| | | | | |
| | 2,237 | | | United Rentals North America Inc. | | | 7.375% | | | | 5/15/20 | | | | BB– | | | | 2,386,857 | |
| | | | | |
| | 2,000 | | | United Rentals North America Inc. | | | 4.625% | | | | 7/15/23 | | | | BB+ | | | | 1,961,200 | |
| | | | Total Trading Companies & Distributors | | | | | | | | | | | | | | | 6,363,007 | |
| | |
| | | | Transportation Infrastructure – 0.2% | | | | |
| | | | | |
| | 2,000 | | | Aeropuerto Internacional de Tocumen SA | | | 5.750% | | | | 10/09/23 | | | | BBB | | | | 2,080,000 | |
| | | | | |
| | 825 | | | Asciano Finance, 144A | | | 5.000% | | | | 4/07/18 | | | | BBB | | | | 884,153 | |
| | | | Total Transportation Infrastructure | | | | | | | | | | | | | | | 2,964,153 | |
| | |
| | | | Wireless Telecommunication Services – 1.9% | | | | |
| | | | | |
| | 1,000 | | | Altice Financing SA, 144A | | | 6.625% | | | | 2/15/23 | | | | BB– | | | | 992,800 | |
| | | | | |
| | 2,000 | | | Colombia Telecommunicaciones S.A. ESP, 144A | | | 8.500% | | | | 9/30/65 | | | | B+ | | | | 2,075,000 | |
| | | | | |
| | 1,500 | | | Digicel Limited, 144A | | | 6.000% | | | | 4/15/21 | | | | B1 | | | | 1,446,180 | |
| | | | | |
| | 1,500 | | | Digicel Limited, 144A | | | 6.750% | | | | 3/01/23 | | | | B1 | | | | 1,470,450 | |
| | | | | |
| | 3,000 | | | ENTEL Chile SA, 144A | | | 4.750% | | | | 8/01/26 | | | | BBB+ | | | | 2,944,953 | |
| | | | | |
| | 750 | | | FairPoint Communications Inc., 144A | | | 8.750% | | | | 8/15/19 | | | | B | | | | 780,000 | |
| | | | | |
| | 1,115 | | | Inmarsat Finance PLC, 144A | | | 4.875% | | | | 5/15/22 | | | | BB+ | | | | 1,075,975 | |
| | | | | |
| | 2,300 | | | Millicom International Cellular SA, 144A | | | 6.000% | | | | 3/15/25 | | | | BB+ | | | | 2,219,500 | |
| | | | | |
| | 1,000 | | | Softbank Corporation, 144A | | | 4.500% | | | | 4/15/20 | | | | BB+ | | | | 1,003,750 | |
| | | | | |
| | 4,000 | | | Sprint Corporation | | | 7.250% | | | | 9/15/21 | | | | B+ | | | | 3,900,000 | |
| | | | | |
| | 1,350 | | | Telecom Italia SpA, 144A | | | 5.303% | | | | 5/30/24 | | | | BBB– | | | | 1,344,938 | |
| | | | | |
| | 1,225 | | | T-Mobile USA Inc. | | | 6.731% | | | | 4/28/22 | | | | BB | | | | 1,277,063 | |
| | | | | |
| | 2,306 | | | Viacom Inc. | | | 4.375% | | | | 3/15/43 | | | | BBB+ | | | | 1,868,213 | |
| | | | | |
| | 1,000 | | | Wind Acquisition Finance SA, 144A | | | 4.750% | | | | 7/15/20 | | | | BB | | | | 985,000 | |
| | | | Total Wireless Telecommunication Services | | | | | | | | | | | | | | | 23,383,822 | |
| | | | Total Corporate Bonds (cost $871,052,717) | | | | 865,906,028 | |
| | | | | |
Principal
Amount (000) (8) | | | Description (1) | | Coupon | | | Maturity | | | Ratings (4) | | | Value | |
| | |
| | | | $1,000 PAR (OR SIMILAR) INSTITUTIONAL PREFERRED – 7.0% | | | | | |
| | | | | |
| | | | Banks – 3.8% | | | | | | | | | | | | |
| | | | | |
| $ | 1,000 | | | Banco Bilbao Vizcaya Argentaria S.A, Reg S | | | 9.000% | | | | N/A (10) | | | | BB | | | $ | 1,075,000 | |
| | | | | |
| | 3,500 | | | Barclays PLC, (7) | | | 8.250% | | | | N/A (10) | | | | BB+ | | | | 3,695,860 | |
| | | | | |
| | 2,830 | EUR | | Barclays PLC | | | 6.500% | | | | N/A (10) | | | | BB+ | | | | 3,143,673 | |
| | | | | |
| | 2,000 | | | Citigroup Inc. | | | 8.400% | | | | N/A (10) | | | | BB+ | | | | 2,272,500 | |
Nuveen Strategic Income Fund (continued)
| | |
| Portfolio of Investments | | June 30, 2015 |
| | | | | | | | | | | | | | | | | | | | |
Principal
Amount (000) (8) | | | Description (1) | | Coupon | | | Maturity | | | Ratings (4) | | | Value | |
| | | | | |
| | | | Banks (continued) | | | | | | | | | | | | |
| | | | | |
| $ | 1,525 | | | Fifth Third Bancorp. | | | 5.100% | | | | N/A (10) | | | | Baa3 | | | $ | 1,429,688 | |
| | | | | |
| | 6,000 | | | General Electric Capital Corporation | | | 7.125% | | | | N/A (10) | | | | A+ | | | | 6,922,500 | |
| | | | | |
| | 4,488 | | | HSBC Holdings PLC, (7) | | | 6.375% | | | | N/A (10) | | | | BBB | | | | 4,499,220 | |
| | | | | |
| | 2,000 | | | ING Groep N.V | | | 6.000% | | | | N/A (10) | | | | Ba1 | | | | 1,973,750 | |
| | | | | |
| | 1,448 | | | Lloyd’s Banking Group PLC | | | 7.500% | | | | N/A (10) | | | | BB+ | | | | 1,491,440 | |
| | | | | |
| | 4,230 | | | Nordea Bank AB, 144A | | | 6.125% | | | | N/A (10) | | | | BBB | | | | 4,170,514 | |
| | | | | |
| | 1,500 | | | Societe Generale, 144A | | | 1.021% | | | | N/A (10) | | | | BB+ | | | | 1,383,750 | |
| | | | | |
| | 2,000 | | | Societe Generale, 144A, (7) | | | 7.875% | | | | N/A (10) | | | | BB+ | | | | 2,010,000 | |
| | | | | |
| | 2,620 | | | SunTrust Bank Inc., (7) | | | 5.625% | | | | N/A (10) | | | | Baa3 | | | | 2,636,375 | |
| | | | | |
| | 5,585 | | | Wachovia Capital Trust III | | | 5.570% | | | | N/A (10) | | | | BBB | | | | 5,522,169 | |
| | | | | |
| | 3,000 | | | Wells Fargo & Company, (7) | | | 5.875% | | | | N/A (10) | | | | BBB | | | | 3,071,400 | |
| | | | Total Banks | | | | | | | | | | | | | | | 45,297,839 | |
| | | | | |
| | | | Capital Markets – 1.3% | | | | | | | | | | | | |
| | | | | |
| | 4,000 | | | Credit Suisse Group AG, 144A | | | 7.500% | | | | N/A (10) | | | | BB+ | | | | 4,164,800 | |
| | | | | |
| | 2,515 | | | Deutsche Bank AG, (7) | | | 7.500% | | | | N/A (10) | | | | BB+ | | | | 2,508,711 | |
| | | | | |
| | 1,495 | | | Goldman Sachs Capital II | | | 4.000% | | | | N/A (10) | | | | Ba1 | | | | 1,138,069 | |
| | | | | |
| | 3,020 | | | State Street Corporation | | | 5.250% | | | | N/A (10) | | | | Baa1 | | | | 3,023,775 | |
| | | | | |
| | 4,800 | | | UBS Group AG, Reg S | | | 7.125% | | | | N/A (10) | | | | BB+ | | | | 4,997,280 | |
| | | | Total Capital Markets | | | | | | | | | | | | | | | 15,832,635 | |
| | | | | |
| | | | Consumer Finance – 0.6% | | | | | | | | | | | | |
| | | | | |
| | 2,620 | | | American Express Company | | | 5.200% | | | | N/A (10) | | | | Baa2 | | | | 2,600,612 | |
| | | | | |
| | 2,250 | | | American Express Company | | | 4.900% | | | | N/A (10) | | | | Baa2 | | | | 2,179,800 | |
| | | | | |
| | 2,825 | | | Capital One Financial Corporation, (7) | | | 5.550% | | | | N/A (10) | | | | Baa3 | | | | 2,800,281 | |
| | | | Total Consumer Finance | | | | | | | | | | | | | | | 7,580,693 | |
| | | | | |
| | | | Diversified Financial Services – 0.3% | | | | | | | | | | | | |
| | | | | |
| | 1,500 | | | Banco BTG Pactual SA/Luxembourg, 144A | | | 8.750% | | | | N/A (10) | | | | Ba3 | | | | 1,504,500 | |
| | | | | |
| | 1,170 | | | Rabobank Nederland, 144A | | | 11.000% | | | | N/A (10) | | | | Baa2 | | | | 1,482,975 | |
| | | | Total Diversified Financial Services | | | | | | | | | | | | | | | 2,987,475 | |
| | | | | |
| | | | Electric Utilities – 0.1% | | | | | | | | | | | | |
| | | | | |
| | 1,570 | | | Electricite de France, 144A | | | 5.250% | | | | N/A (10) | | | | A– | | | | 1,571,963 | |
| | | | | |
| | | | Industrial Conglomerates – 0.0% | | | | | | | | | | | | |
| | | | | |
| | 1,000 | | | OAS Financial Limited, 144A | | | 0.000% | | | | N/A (10) | | | | N/R | | | | 204,000 | |
| | | | | |
| | | | Insurance – 0.9% | | | | | | | | | | | | |
| | | | | |
| | 1,500 | | | Allstate Corporation | | | 5.750% | | | | 8/15/53 | | | | Baa1 | | | | 1,584,375 | |
| | | | | |
| | 2,050 | | | Catlin Insurance Company Limited, 144A | | | 7.249% | | | | N/A (10) | | | | BBB+ | | | | 1,916,750 | |
| | | | | |
| | 1,985 | | | Genworth Financial Inc., (7) | | | 6.150% | | | | 11/15/66 | | | | Ba2 | | | | 1,210,850 | |
| | | | | |
| | 1,435 | | | Prudential Financial Inc. | | | 5.200% | | | | 3/15/44 | | | | BBB+ | | | | 1,421,368 | |
| | | | | |
| | 3,000 | | | White Mountains Insurance Group, 144A | | | 7.506% | | | | N/A (10) | | | | BB+ | | | | 3,135,000 | |
| | | | | | | | | | | | | | | | | | | | |
Principal
Amount (000) (8) | | | Description (1) | | Coupon | | | Maturity | | | Ratings (4) | | | Value | |
| | | | | |
| | | | Insurance (continued) | | | | | | | | | | | | |
| | | | | |
| $ | 1,860 | | | ZFS Finance USA Trust V | | | 6.500% | | | | 5/09/37 | | | | A | | | $ | 1,934,400 | |
| | | | Total Insurance | | | | | | | | | | | | | | | 11,202,743 | |
| | | | Total $1,000 Par (or similar) Institutional Preferred (cost $84,874,007) | | | | | | | | 84,677,348 | |
| | | | | |
Principal
Amount (000) | | | Description (1) | | Coupon | | | Maturity | | | Ratings (4) | | | Value | |
| | |
| | | | ASSET-BACKED AND MORTGAGE-BACKED SECURITIES – 4.9% | | | | |
| | | | | |
| $ | 1,223 | | | 321 Henderson Receivables LLC, Series 2010-3A | | | 3.820% | | | | 12/15/48 | | | | Aaa | | | $ | 1,285,234 | |
| | | | | |
| | 1,250 | | | American Homes 4 Rent, Series 2014-SFR1 | | | 2.350% | | | | 6/17/31 | | | | Baa2 | | | | 1,226,040 | |
| | | | | |
| | 2,384 | | | American Homes 4 Rent, Series 2014-SFR2 | | | 3.786% | | | | 10/17/36 | | | | Aaa | | | | 2,453,142 | |
| | | | | |
| | 2,270 | | | AmeriCold LLC Trust, Series 2010 | | | 6.811% | | | | 1/14/29 | | | | A+ | | | | 2,593,455 | |
| | | | | |
| | 2,246 | | | Banc of America Alternative Loan Trust, Pass-Through Certificates, Series 2006-6 | | | 6.000% | | | | 7/25/46 | | | | Caa3 | | | | 1,850,477 | |
| | | | | |
| | 36 | | | Bank of America Alternative Loan Trust, Series 2005-5 2 CB1 | | | 6.000% | | | | 6/25/35 | | | | Caa1 | | | | 34,119 | |
| | | | | |
| | 68 | | | Bank of America Commercial Mortgage Inc., Commercial Mortgage Pass-Through Certificates, Series 2005-4 | | | 4.933% | | | | 7/10/45 | | | | AAA | | | | 67,712 | |
| | | | | |
| | 793 | | | CAM Mortgage Trust 2014-2 | | | 4.450% | | | | 5/15/48 | | | | N/R | | | | 793,857 | |
| | | | | |
| | 4,687 | | | Colony American Homes Trust 2014-1A | | | 1.400% | | | | 5/17/31 | | | | Aaa | | | | 4,661,689 | |
| | | | | |
| | 3,000 | | | Commercial Mortgage Pass-Through Certificates, Series 2014-SAVA | | | 2.586% | | | | 6/15/34 | | | | A | | | | 3,000,690 | |
| | | | | |
| | 270 | | | Countrywide Alternative Loan Trust, Mortgage Pass-Through Certificates, Series 2004-24CB | | | 5.000% | | | | 11/25/19 | | | | B3 | | | | 272,299 | |
| | | | | |
| | 599 | | | Countrywide Alternative Loan Trust, Mortgage Pass-Through Certificates, Series 2006-19CB | | | 6.000% | | | | 8/25/36 | | | | Caa3 | | | | 547,494 | |
| | | | | |
| | 1,747 | | | Countrywide Asset Backed Certificates, Series 2007-4 A2 | | | 5.530% | | | | 3/25/29 | | | | Caa1 | | | | 1,844,153 | |
| | | | | |
| | 482 | | | Countrywide Home Loan Mortgage Pass-Through Trust, Series 2004-2 | | | 2.385% | | | | 2/25/34 | | | | A | | | | 469,341 | |
| | | | | |
| | 1,373 | | | Countrywide Home Loans Mortgage, Series 2005-27 | | | 5.500% | | | | 1/25/23 | | | | Caa1 | | | | 1,288,012 | |
| | | | | |
| | 186 | | | Countrywide Home Loans, Asset Backed Certificates Series 2007-7 | | | 0.347% | | | | 10/25/47 | | | | B3 | | | | 185,041 | |
| | | | | |
| | 183 | | | Credit Suisse First Boston Mortgage Securities Corporation, Mortgage-Backed Pass-Through Certificates, Series 2003-23 | | | 5.750% | | | | 9/25/33 | | | | AA+ | | | | 194,104 | |
| | | | | |
| | 472 | | | Fannie Mae Mortgage Interest Strips 366 25, (I/O) | | | 5.000% | | | | 9/01/24 | | | | Aaa | | | | 35,326 | |
| | | | | |
| | 360 | | | Fannie Mae Mortgage Pool AA0005 | | | 5.500% | | | | 11/01/38 | | | | Aaa | | | | 403,909 | |
| | | | | |
| | 301 | | | Fannie Mae Mortgage Pool AA0889 | | | 5.500% | | | | 12/01/38 | | | | Aaa | | | | 337,853 | |
| | | | | |
| | 2,310 | | | Fannie Mae Mortgage Pool AC1877 | | | 4.500% | | | | 9/01/39 | | | | Aaa | | | | 2,501,700 | |
| | | | | |
| | 202 | | | Fannie Mae Mortgage Pool AL1187 | | | 5.500% | | | | 7/01/24 | | | | Aaa | | | | 207,773 | |
| | | | | |
| | 357 | | | Fannie Mae Mortgage Pool 255628 | | | 5.500% | | | | 2/01/25 | | | | Aaa | | | | 400,045 | |
| | | | | |
| | 1,236 | | | Fannie Mae Mortgage Pool 255956 | | | 5.500% | | | | 10/01/25 | | | | Aaa | | | | 1,386,852 | |
| | | | | |
| | 149 | | | Fannie Mae Mortgage Pool 256890 | | | 6.000% | | | | 9/01/37 | | | | Aaa | | | | 163,461 | |
| | | | | |
| | 154 | | | Fannie Mae Mortgage Pool 725205 | | | 5.000% | | | | 3/01/34 | | | | Aaa | | | | 171,039 | |
| | | | | |
| | 55 | | | Fannie Mae Mortgage Pool 725553 | | | 2.269% | | | | 9/01/33 | | | | Aaa | | | | 58,490 | |
| | | | | |
| | 218 | | | Fannie Mae Mortgage Pool 725773 | | | 5.500% | | | | 9/01/34 | | | | Aaa | | | | 246,131 | |
| | | | | |
| | 84 | | | Fannie Mae Mortgage Pool 735060 | | | 6.000% | | | | 11/01/34 | | | | Aaa | | | | 96,349 | |
Nuveen Strategic Income Fund (continued)
| | |
| Portfolio of Investments | | June 30, 2015 |
| | | | | | | | | | | | | | | | | | | | |
Principal
Amount (000) | | | Description (1) | | Coupon | | | Maturity | | | Ratings (4) | | | Value | |
| |
| | | | ASSET-BACKED AND MORTGAGE-BACKED SECURITIES (continued) | |
| | | | | |
| $ | 65 | | | Fannie Mae Mortgage Pool 735606 | | | 1.806% | | | | 5/01/35 | | | | Aaa | | | $ | 68,040 | |
| | | | | |
| | 69 | | | Fannie Mae Mortgage Pool 745101 | | | 6.000% | | | | 4/01/32 | | | | Aaa | | | | 78,110 | |
| | | | | |
| | 277 | | | Fannie Mae Mortgage Pool 745324 | | | 6.000% | | | | 3/01/34 | | | | Aaa | | | | 312,257 | |
| | | | | |
| | 299 | | | Fannie Mae Mortgage Pool 745548 | | | 2.365% | | | | 1/01/35 | | | | Aaa | | | | 313,113 | |
| | | | | |
| | 64 | | | Fannie Mae Mortgage Pool 824163 | | | 5.500% | | | | 4/01/35 | | | | Aaa | | | | 72,028 | |
| | | | | |
| | 150 | | | Fannie Mae Mortgage Pool 831377 | | | 6.500% | | | | 4/01/36 | | | | Aaa | | | | 173,044 | |
| | | | | |
| | 79 | | | Fannie Mae Mortgage Pool 838948 | | | 1.885% | | | | 8/01/35 | | | | Aaa | | | | 83,567 | |
| | | | | |
| | 234 | | | Fannie Mae Mortgage Pool 843435 | | | 5.500% | | | | 6/01/33 | | | | Aaa | | | | 263,455 | |
| | | | | |
| | 75 | | | Fannie Mae Mortgage Pool 852909 | | | 6.500% | | | | 4/01/36 | | | | Aaa | | | | 85,833 | |
| | | | | |
| | — | (11) | | Fannie Mae Mortgage Pool 889618 | | | 5.500% | | | | 5/01/38 | | | | Aaa | | | | 244 | |
| | | | | |
| | 178 | | | Fannie Mae Mortgage Pool 893318 | | | 6.500% | | | | 8/01/36 | | | | Aaa | | | | 204,366 | |
| | | | | |
| | 22 | | | Fannie Mae Mortgage Pool 905597 | | | 5.785% | | | | 12/01/36 | | | | Aaa | | | | 23,527 | |
| | | | | |
| | 591 | | | Fannie Mae Mortgage Pool 932323 | | | 4.500% | | | | 12/01/39 | | | | Aaa | | | | 640,500 | |
| | | | | |
| | 99 | | | Fannie Mae Mortgage Pool 944340 | | | 6.000% | | | | 6/01/37 | | | | Aaa | | | | 112,063 | |
| | | | | |
| | 57 | | | Fannie Mae Mortgage Pool 946228 | | | 6.159% | | | | 9/01/37 | | | | Aaa | | | | 61,196 | |
| | | | | |
| | — | (11) | | Fannie Mae Mortgage Pool 985344 | | | 5.500% | | | | 7/01/38 | | | | Aaa | | | | 131 | |
| | | | | |
| | 8,000 | | | Fannie Mae TBA Mortgage Pool, (WI/DD) | | | 3.500% | | | | TBA | | | | Aaa | | | | 8,244,375 | |
| | | | | |
| | 657 | | | FDIC Structures Sale Guaranteed Notes, Series 2010-S1 | | | 0.730% | | | | 2/25/48 | | | | Aaa | | | | 657,653 | |
| | | | | |
| | 14 | | | Federal Home Loan Mortgage Corporation, Mortgage Pool 1B3220 | | | 2.306% | | | | 1/01/37 | | | | Aaa | | | | 14,740 | |
| | | | | |
| | 7 | | | Federal Home Loan Mortgage Corporation, Series 2376 | | | 5.500% | | | | 11/15/16 | | | | Aaa | | | | 7,090 | |
| | | | | |
| | 396 | | | Freddie Mac Gold Pool 1L0117 | | | 2.658% | | | | 10/01/29 | | | | Aaa | | | | 417,059 | |
| | | | | |
| | 742 | | | Freddie Mac Gold Pool 1K1238 | | | 2.384% | | | | 7/01/36 | | | | Aaa | | | | 793,699 | |
| | | | | |
| | 199 | | | Freddie Mac Gold Pool 847240 | | | 2.339% | | | | 7/01/30 | | | | Aaa | | | | 206,801 | |
| | | | | |
| | 136 | | | Freddie Mac Gold Pool 847411 | | | 2.289% | | | | 5/01/33 | | | | Aaa | | | | 141,729 | |
| | | | | |
| | 1,441 | | | Freddie Mac Gold Pool 848289 | | | 2.404% | | | | 5/01/38 | | | | Aaa | | | | 1,532,969 | |
| | | | | |
| | 348 | | | Freddie Mac Mortgage Pool, Various A17212 | | | 6.500% | | | | 7/01/31 | | | | Aaa | | | | 398,439 | |
| | | | | |
| | 65 | | | Freddie Mac Mortgage Pool, Various H09059 | | | 7.000% | | | | 8/01/37 | | | | Aaa | | | | 72,069 | |
| | | | | |
| | 1,405 | | | Freddie Mac Mortgage Trust, Multifamily Mortgage Pass-Through Certificates, Series 2013-K712 | | | 3.484% | | | | 5/25/45 | | | | Aaa | | | | 1,430,110 | |
| | | | | |
| | 19 | | | Freddie Mac Non Gold Participation Certificates 847681 | | | 2.249% | | | | 12/01/36 | | | | Aaa | | | | 20,127 | |
| | | | | |
| | 107 | | | Government National Mortgage Association, Guaranteed REMIC Pass-Through Securities and MX Securities Trust | | | 4.500% | | | | 5/16/38 | | | | Aaa | | | | 110,246 | |
| | | | | |
| | 21 | | | GRMT Mortgage Loan Trust 2001-1A | | | 8.272% | | | | 7/20/31 | | | | A3 | | | | 20,402 | |
| | | | | |
| | 1,500 | | | Impac Secured Assets Corporation, Mortgage Pass-Through Certificates, Series 2000-3 | | | 8.000% | | | | 10/25/30 | | | | CCC | | | | 1,455,611 | |
| | | | | |
| | 276 | | | IndyMac INDX Mortgage Loan Trust, Pass-Through Certificates, Series 2005-AR1 | | | 2.474% | | | | 3/25/35 | | | | BBB+ | | | | 275,339 | |
| | | | | |
| | 3,909 | | | Invitation Homes Trust 2014-SFR1 | | | 2.785% | | | | 6/19/31 | | | | Baa2 | | | | 3,873,934 | |
| | | | | |
| | 998 | | | JPMorgan Alternative Loan Trust, Mortgage Pass-Through Certificates, Series 2007-S1 | | | 0.471% | | | | 4/25/47 | | | | CCC | | | | 899,054 | |
| | | | | | | | | | | | | | | | | | | | |
Principal
Amount (000) | | | Description (1) | | Coupon | | | Maturity | | | Ratings (4) | | | Value | |
| |
| | | | ASSET-BACKED AND MORTGAGE-BACKED SECURITIES (continued) | |
| | | | | |
| $ | 640 | | | Lehman Mortgage Trust, Mortgage Pass-Through Certificates, Series 2008-6 | | | 5.528% | | | | 4/25/38 | | | | BB+ | | | $ | 653,761 | |
| | | | | |
| | 2,901 | | | Master RePerforming Loan Trust 2005-1 | | | 7.500% | | | | 8/25/34 | | | | Ba3 | | | | 3,032,336 | |
| | | | | |
| | 230 | | | Merrill Lynch Mortgage Investors Inc, Commercial Mortgage Pass-Through Certificates, Series 2006 | | | 5.204% | | | | 12/12/49 | | | | A1 | | | | 241,236 | |
| | | | | |
| | 1,000 | | | ML_CFC Commercial Mortgage Trust, Pass-Through Certificates, Series 2007-8 | | | 6.076% | | | | 8/12/49 | | | | BB | | | | 1,027,415 | |
| | | | | |
| | 278 | | | Oaktree Real Estate Investments, Commercial Mortgage Asset Backed Securities ORES NPL LLC 2013-LV2I, 144A | | | 3.081% | | | | 9/25/25 | | | | N/R | | | | 278,421 | |
| | | | | |
| | 551 | | | RBSSP Resecuritization Trust, Series 2012-8 1A1 | | | 0.334% | | | | 10/28/36 | | | | N/R | | | | 530,142 | |
| | | | | |
| | 134 | | | Residential Accredit Loans Inc., Mortgage Asset-Backed Pass-Through Certificates, Series 2005-QS12 | | | 5.500% | | | | 8/25/35 | | | | Caa2 | | | | 121,307 | |
| | | | | |
| | 160 | | | Sequoia Mortgage Trust, Mortgage Pass-Through Certificates, Series 2011-1 | | | 4.125% | | | | 2/25/41 | | | | AAA | | | | 161,545 | |
| | | | | |
| | 492 | | | Wachovia Mortgage Loan Trust LLC, Mortgage Pass-Through Certificates, Series 2005-B | | | 2.504% | | | | 10/20/35 | | | | D | | | | 427,926 | |
| | | | | |
| | 333 | | | Washington Mutual Mortgage Securities Corporation, Mortgage Pass-Through Certificates, Series 2004-RA3 | | | 6.343% | | | | 8/25/38 | | | | AA | | | | 351,706 | |
| | | | | |
| | 21 | | | Wells Fargo Mortgage Backed Securities, 2005-AR16 Class 3A2 | | | 2.642% | | | | 10/25/35 | | | | BBB– | | | | 21,153 | |
| | | | | |
| | 508 | | | National Credit Union Administration Guaranteed Structured Collateral Notes | | | 2.900% | | | | 10/29/20 | | | | AAA | | | | 521,221 | |
| $ | 58,442 | | | Total Asset-Backed and Mortgage-Backed Securities (cost $57,749,416) | | | | 59,206,876 | |
| | | | | |
| Shares | | | Description (1), (12) | | | | | | | | | | | Value | |
| | | | | |
| | | | INVESTMENT COMPANIES – 0.1% | | | | | | | | | | | | |
| | | | | |
| | 36,000 | | | Blackrock Credit Allocation Income Trust IV | | | | | | | | | | | | | | $ | 456,120 | |
| | | | | |
| | 40,000 | | | CBRE Clarion Global Real Estate Income Fund | | | | | | | | | | | | | | | 318,400 | |
| | | | Total Investment Companies (cost $700,232) | | | | | | | | | | | | | | | 774,520 | |
| | | | | |
Principal
Amount (000) (8) | | | Description (1) | | Coupon | | | Maturity | | | Ratings (4) | | | Value | |
| | | | | |
| | | | SOVEREIGN DEBT – 10.5% | | | | | | | | | | | | | | | | |
| | | | | |
| | | | Colombia – 0.1% | | | | | | | | | | | | |
| | | | | |
| $ | 850 | | | Republic of Colombia | | | 8.125% | | | | 5/21/24 | | | | BBB | | | $ | 1,089,275 | |
| | | | | |
| | | | Costa Rica – 0.4% | | | | | | | | | | | | |
| | | | | |
| | 5,200 | | | Republic of Costa Rica, 144A | | | 7.000% | | | | 4/04/44 | | | | Ba1 | | | | 5,031,000 | |
| | | | | |
| | | | Dominican Republic – 0.4% | | | | | | | | | | | | |
| | | | | |
| | 4,800 | | | Dominican Republic, 144A | | | 5.500% | | | | 1/27/25 | | | | BB– | | | | 4,812,000 | |
| | | | | |
| | | | Hungary – 0.7% | | | | | | | | | | | | |
| | | | | |
| | 2,240,000 | HUF | | Republic of Hungary, Government Bond | | | 5.500% | | | | 6/24/25 | | | | BBB– | | | | 8,917,215 | |
Nuveen Strategic Income Fund (continued)
| | |
| Portfolio of Investments | | June 30, 2015 |
| | | | | | | | | | | | | | | | | | | | |
Principal
Amount (000) (8) | | | Description (1) | | Coupon | | | Maturity | | | Ratings (4) | | | Value | |
| | | | | |
| | | | Indonesia – 0.5% | | | | | | | | | | | | |
| | | | | |
| $ | 790 | | | Republic of Indonesia, 144A | | | 5.875% | | | | 3/13/20 | | | | Baa3 | | | $ | 878,875 | |
| | | | | |
| | 1,290 | | | Republic of Indonesia, 144A | | | 4.875% | | | | 5/05/21 | | | | Baa3 | | | | 1,369,077 | |
| | | | | |
| | 3,400 | EUR | | Republic of Indonesia, 144A | | | 2.875% | | | | 7/08/21 | | | | Baa3 | | | | 3,818,926 | |
| | | | Total Indonesia | | | | | | | | | | | | | | | 6,066,878 | |
| | | | | |
| | | | Mexico – 3.1% | | | | | | | | | | | | |
| | | | | |
| | 177,000 | MXN | | Mexico Bonos de DeSarrollo | | | 8.500% | | | | 12/13/18 | | | | A | | | | 12,557,873 | |
| | | | | |
| | 71,750 | MXN | | Mexico Bonos de DeSarrollo | | | 6.500% | | | | 6/10/21 | | | | A | | | | 4,753,481 | |
| | | | | |
| | 122,550 | MXN | | Mexico Bonos de DeSarrollo | | | 8.000% | | | | 12/07/23 | | | | A | | | | 8,810,805 | |
| | | | | |
| | 60,500 | MXN | | Mexico Bonos de DeSarrollo | | | 10.000% | | | | 12/05/24 | | | | A | | | | 4,928,724 | |
| | | | | |
| | 84,800 | MXN | | Mexico Bonos de DeSarrollo | | | 7.750% | | | | 11/13/42 | | | | A | | | | 6,012,807 | |
| | | | Total Mexico | | | | | | | | | | | | | | | 37,063,690 | |
| | | | | |
| | | | Poland – 0.7% | | | | | | | | | | | | |
| | | | | |
| | 15,000 | PLN | | Republic of Poland | | | 3.250% | | | | 7/25/19 | | | | A | | | | 4,101,519 | |
| | | | | |
| | 11,700 | PLN | | Republic of Poland | | | 5.750% | | | | 9/23/22 | | | | A | | | | 3,632,912 | |
| | | | Total Poland | | | | | | | | | | | | | | | 7,734,431 | |
| | | | | |
| | | | South Africa – 4.2% | | | | | | | | | | | | |
| | | | | |
| | 105,000 | ZAR | | Republic of South Africa | | | 8.000% | | | | 12/21/18 | | | | BBB+ | | | | 8,752,733 | |
| | | | | |
| | 75,600 | ZAR | | Republic of South Africa | | | 6.750% | | | | 3/31/21 | | | | BBB+ | | | | 5,879,724 | |
| | | | | |
| | 3,250 | | | Republic of South Africa, (7) | | | 5.875% | | | | 9/16/25 | | | | Baa2 | | | | 3,600,493 | |
| | | | | |
| | 253,500 | ZAR | | Republic of South Africa | | | 10.500% | | | | 12/21/26 | | | | BBB+ | | | | 24,253,987 | |
| | | | | |
| | 124,800 | ZAR | | Republic of South Africa | | | 7.000% | | | | 2/28/31 | | | | BBB+ | | | | 8,734,769 | |
| | | | Total South Africa | | | | | | | | | | | | | | | 51,221,706 | |
| | | | | |
| | | | Turkey – 0.3% | | | | | | | | | | | | |
| | | | | |
| | 3,000 | | | Republic of Turkey, Government Bond | | | 6.250% | | | | 9/26/22 | | | | Baa3 | | | | 3,337,320 | |
| | | | | |
| | | | Uruguay – 0.1% | | | | | | | | | | | | |
| | | | | |
| | 850 | | | Republic of Uruguay, (7) | | | 5.100% | | | | 6/18/50 | | | | BBB | | | | 809,625 | |
| | | | Total Sovereign Debt (cost $145,861,665) | | | | | | | | | | | | | | | 126,083,140 | |
| | | | Total Long-Term Investments (cost $1,201,701,416) | | | | | | | | | | | | | | | 1,177,437,564 | |
| | | | | |
| Shares | | | Description (1) | | Coupon | | | | | | | | | Value | |
| | | |
| | | | INVESTMENTS PURCHASED WITH COLLATERAL FROM SECURITIES LENDING – 12.1% | | | | | | | | | |
| | | | | |
| | | | Money Market Funds – 12.1% | | | | | | | | | | | | |
| | | | | |
| | 146,196,005 | | | Mount Vernon Securities Lending Trust Prime Portfolio, (14) | | | 0.234% (13) | | | | | | | | | | | $ | 146,196,005 | |
| | | | Total Investments Purchased with Collateral from Securities Lending (cost $146,196,005) | | | | | | | | 146,196,005 | |
| | | | | | | | | | | | | | | | |
| Shares | | | Description (1) | | Coupon | | | | | | | Value | |
| | | | | |
| | | | SHORT-TERM INVESTMENTS – 1.5% | | | | | | | | | | | | |
| | | | | |
| | | | Money Market Funds – 1.5% | | | | | | | | | | |
| | | | | |
| | 18,215,453 | | | First American Treasury Obligations Fund, Class Z | | | 0.000% (13) | | | | | | | $ | 18,215,453 | |
| | | | Total Short-Term Investments (cost $18,215,453) | | | | | | | | | | | 18,215,453 | |
| | | | Total Investments (cost $1,366,112,874) – 111.3% | | | | | | | | | | | 1,341,849,022 | |
| | | | Other Assets Less Liabilities – (11.3)% (15) | | | | | | | | | | | (136,620,933 | ) |
| | | | Net Assets – 100% | | | | | | | | | | $ | 1,205,228,089 | |
Investments in Derivatives as of June 30, 2015
Forward Foreign Currency Exchange Contracts outstanding:
| | | | | | | | | | | | | | | | | | | | |
| Counterparty | | Currency Contracts to Deliver | | Amount
(Local Currency) | | | In Exchange
For Currency | | Amount
(Local Currency) | | | Settlement
Date | | | Unrealized
Appreciation
Depreciation)
(U.S. Dollars) | |
| Bank of America | | Canadian Dollar | | | 17,400,000 | | | U.S. Dollar | | | 13,896,765 | | | | 7/31/15 | | | $ | (28,282 | ) |
| Bank of America | | Euro | | | 11,210,000 | | | U.S. Dollar | | | 12,699,024 | | | | 8/31/15 | | | | 190,493 | |
| Bank of America | | Hungarian Forint | | | 1,350,000,000 | | | U.S. Dollar | | | 4,997,039 | | | | 7/13/15 | | | | 227,105 | |
| Bank of America | | Hungarian Forint | | | 1,350,000,000 | | | U.S. Dollar | | | 4,999,815 | | | | 7/13/15 | | | | 229,881 | |
| Bank of America | | Pound Sterling | | | 1,530,000 | | | U.S. Dollar | | | 2,407,902 | | | | 9/30/15 | | | | 5,501 | |
| Bank of America | | U.S. Dollar | | | 240,763 | | | Hungarian Forint | | | 68,000,000 | | | | 7/13/15 | | | | (500 | ) |
| Bank of America | | U.S. Dollar | | | 14,431,567 | | | Malaysian Ringgit | | | 52,300,000 | | | | 7/14/15 | | | | (585,874 | ) |
| Citigroup | | Euro | | | 10,280,423 | | | U.S. Dollar | | | 11,443,447 | | | | 7/31/15 | | | | (22,601 | ) |
| Citigroup | | Mexican Peso | | | 127,000,000 | | | U.S. Dollar | | | 8,149,500 | | | | 7/31/15 | | | | 88,211 | |
| Citigroup | | Mexican Peso | | | 410,160,000 | | | U.S. Dollar | | | 26,813,626 | | | | 7/31/15 | | | | 778,838 | |
| Citigroup | | U.S. Dollar | | | 1,288,513 | | | Euro | | | 1,180,000 | | | | 7/31/15 | | | | 27,575 | |
| Citigroup | | U.S. Dollar | | | 10,168,940 | | | Euro | | | 9,100,423 | | | | 7/31/15 | | | | (18,979 | ) |
| Citigroup | | U.S. Dollar | | | 4,337,143 | | | Mexican Peso | | | 67,000,000 | | | | 7/31/15 | | | | (84,337 | ) |
| Deutsche Bank | | Euro | | | 16,700,000 | | | U.S. Dollar | | | 18,224,710 | | | | 7/31/15 | | | | (401,276 | ) |
| Deutsche Bank | | Japanese Yen | | | 3,259,000,000 | | | U.S. Dollar | | | 26,905,533 | | | | 7/31/15 | | | | 266,043 | |
| Deutsche Bank | | U.S. Dollar | | | 12,037,378 | | | Pound Sterling | | | 7,750,000 | | | | 7/22/15 | | | | 137,882 | |
| Deutsche Bank | | U.S. Dollar | | | 8,007,741 | | | Japanese Yen | | | 989,000,000 | | | | 7/31/15 | | | | 76,474 | |
| Deutsche Bank | | U.S. Dollar | | | 18,276,973 | | | Japanese Yen | | | 2,270,000,000 | | | | 7/31/15 | | | | 278,303 | |
| Goldman Sachs | | Canadian Dollar | | | 7,559,000 | | | U.S. Dollar | | | 6,121,788 | | | | 8/31/15 | | | | 74,936 | |
| Morgan Stanley | | Australian Dollar | | | 22,000,000 | | | U.S. Dollar | | | 16,806,900 | | | | 7/31/15 | | | | (135,757 | ) |
| Morgan Stanley | | South African Rand | | | 166,000,000 | | | U.S. Dollar | | | 13,063,486 | | | | 7/31/15 | | | | (503,978 | ) |
| Morgan Stanley | | U.S. Dollar | | | 17,013,920 | | | Australian Dollar | | | 22,000,000 | | | | 7/31/15 | | | | (71,263 | ) |
| Nomura Securities | | South African Rand | | | 421,950,000 | | | U.S. Dollar | | | 34,317,154 | | | | 8/31/15 | | | | 17,630 | |
| UBS | | Polish Zloty | | | 14,110,000 | | | U.S. Dollar | | | 3,782,910 | | | | 8/31/15 | | | | 36,511 | |
| UBS | | Polish Zloty | | | 15,500,000 | | | U.S. Dollar | | | 4,140,186 | | | | 8/31/15 | | | | 24,724 | |
| | | | | | | | | | | | | | | | | | | $ | 607,260 | |
Interest Rate Swaps outstanding:
| | | | | | | | | | | | | | | | | | | | | | | | | | | | | | | | |
| Counterparty | | Notional
Amount | | | Fund
Pay/Receive
Floating Rate | | | Floating Rate Index | | | Fixed Rate
(Annualized) | | | Fixed Rate
Payment
Frequency | | | Termination
Date | | | Value | | | Unrealized
Appreciation
(Depreciation) | |
Bank of America* | | $ | 19,000,000 | | | | Receive | | | | 3-Month USD-LIBOR-ICE | | | | 1.573 | % | | | Semi-Annually | | | | 10/10/18 | | | $ | (177,891 | ) | | $ | (178,209 | ) |
JPMorgan | | | 21,000,000 | | | | Receive | | | | 3-Month USD-LIBOR-ICE | | | | 2.113 | | | | Semi-Annually | | | | 2/21/22 | | | | (203,013 | ) | | | (203,013 | ) |
JPMorgan | | | 10,800,000 | | | | Receive | | | | 3-Month USD-LIBOR-ICE | | | | 2.078 | | | | Semi-Annually | | | | 2/19/23 | | | | 23,865 | | | | 23,865 | |
JPMorgan* | | | 17,000,000 | | | | Receive | | | | 3-Month USD-LIBOR-ICE | | | | 2.739 | | | | Semi-Annually | | | | 11/21/23 | | | | (636,010 | ) | | | (636,460 | ) |
JPMorgan* | | | 32,000,000 | | | | Receive | | | | 3-Month USD-LIBOR-ICE | | | | 2.354 | | | | Semi-Annually | | | | 5/21/25 | | | | 161,685 | | | | 161,685 | |
Morgan Stanley* | | | 26,000,000 | | | | Receive | | | | 3-Month USD-LIBOR-ICE | | | | 2.743 | | | | Semi-Annually | | | | 4/15/24 | | | | (997,482 | ) | | | (997,482 | ) |
| | | $ | 125,800,000 | | | | | | | | | | | | | | | | | | | | | | | $ | (1,828,846 | ) | | $ | (1,829,614 | ) |
| * | Citigroup is the clearing broker for this transactions. |
Nuveen Strategic Income Fund (continued)
| | |
| Portfolio of Investments | | June 30, 2015 |
Futures Contracts outstanding:
| | | | | | | | | | | | | | | | | | | | | | | | |
| Description | | Contract
Position | | | Number of
Contracts | | | Contract
Expiration | | | Notional
Amount at
Value* | | | Variation Margin
Receivable/(Payable) | | | Unrealized
Appreciation
(Depreciation) | |
Euro-Bund | | | Long | | | | 105 | | | | 9/15 | | | $ | 17,793,039 | | | $ | 26,925 | | | $ | (18,110 | ) |
U.S. Treasury 5-Year Note | | | Short | | | | (575 | ) | | | 9/15 | | | | (68,573,243 | ) | | | 22,461 | | | | (19,981 | ) |
U.S. Treasury 10-Year Note | | | Short | | | | (1,294 | ) | | | 9/15 | | | | (163,266,406 | ) | | | 31,137 | | | | 891,202 | |
U.S. Treasury Long Bond | | | Long | | | | 61 | | | | 9/15 | | | | 9,201,469 | | | | (3,813 | ) | | | (184,488 | ) |
U.S. Treasury Ultra Bond | | | Long | | | | 220 | | | | 9/15 | | | | 33,893,750 | | | | (13,750 | ) | | | (1,072,404 | ) |
| | | | | | | | | | | | | | | $ | (170,951,391 | ) | | $ | 62,960 | | | $ | (403,781 | ) |
| * | Total aggregate Notional Amount at Value of long and short positions is $60,888,258 and $(231,839,649), respectively. |
For Fund portfolio compliance purposes, the Fund’s industry classifications refer to any one or more of the industry sub-classifications used by one or more widely recognized market indexes or ratings group indexes, and/or as defined by Fund management. This definition may not apply for purposes of this report, which may combine industry sub-classifications into sectors for reporting ease.
| (1) | All percentages shown in the Portfolio of Investments are based on net assets. |
| (2) | Non-income producing; issuer has not declared a dividend within the past twelve months. |
| (3) | Investment valued at fair value using methods determined in good faith by, or at discretion of, the Board. For fair value measurement disclosure purposes, investment classified as Level 3. See Notes to Financial Statements, Note 2 – Investment Valuation and Fair Value Measurements for more information. |
| (4) | Ratings (not covered by the report of independent registered public accounting firm): Using the highest of Standard & Poor’s Group (“Standard & Poor’s”), Moody’s Investors Service, Inc. (“Moody’s”) or Fitch, Inc. (“Fitch”) rating. Ratings below BBB by Standard & Poor’s, Baa by Moody’s or BBB by Fitch are considered to be below investment grade. Holdings designated N/R are not rated by any of these national rating agencies. |
| (5) | Senior loans generally are subject to mandatory and/or optional prepayment. Because of these mandatory prepayment conditions and because there may be significant economic incentives for a borrower to prepay, prepayments of senior loans may occur. As a result, the actual remaining maturity of senior loans held may be substantially less than the stated maturities shown. |
| (6) | Senior loans generally pay interest at rates which are periodically adjusted by reference to a base short-term, floating lending rate plus an assigned fixed rate. These floating lending rates are generally (i) the lending rate referenced by the London Inter-Bank Offered Rate (“LIBOR”), or (ii) the prime rate offered by one or more major United States banks. Senior loans may be considered restricted in that the Fund ordinarily is contractually obligated to receive approval from the agent bank and/or borrower prior to the disposition of a senior loan. The rate shown is the coupon as of the end of the reporting period. |
| (7) | Investment, or a portion of investment, is out on loan for securities lending. The total value of the securities out on loan as of the end of the reporting period was $139,053,010. |
| (8) | Principal Amount (000) denominated in U.S. Dollars, unless otherwise noted. |
| (9) | As of, or subsequent to, the end of the reporting period, this security is non-income producing. Non-income producing, in the case of a fixed-income security, generally denotes that the issuer has (1) defaulted on the payment of principal or interest, (2) is under the protection of the Federal Bankruptcy Court or (3) the Fund’s Adviser has concluded that the issue is not likely to meet its future interest payment obligations and has ceased accruing additional income on the Fund’s records. |
| (10) | Perpetual security. Maturity date is not applicable. |
| (11) | Principal Amount (000) rounds to less than $1,000. |
| (12) | A copy of the most recent financial statements for these investment companies can be obtained directly from the Securities and Exchange Commission (SEC) on its website at http://www.sec.gov. |
| (13) | The rate shown is the annualized seven-day effective yield as of the end of the reporting period. |
| (14) | The Fund may loan securities representing up to one third of the fair value of its total assets (which includes collateral for securities on loan) to broker-dealers, banks and other institutions. The Fund maintains collateral equal to at least 100% of the fair value of the securities loaned. The cash collateral received by the Fund is invested in this money market fund. See Notes to Financial Statements, Note 3 – Portfolio Securities and Investments in Derivatives, Securities Lending for more information. |
| (15) | Other assets less liabilities includes the unrealized appreciation (depreciation) of the over-the-counter derivatives as presented on the Statement of Assets and Liabilities. The unrealized appreciation (depreciation) of exchange-cleared and exchange-traded derivatives is recognized as part of the cash collateral at brokers and/or the receivable or payable for variation margin as presented on the Statement of Assets and Liabilities, when applicable. |
| (16) | For fair value measurement disclosure purposes, investment classified as Level 2. See Notes to Financial Statements, Note 2 – Investment Valuation and Fair Value Measurements for more information. |
| GDR | Global Depositary Receipt |
| Reg S | Regulation S allows U.S. companies to sell securities to persons or entities located outside of the United States without registering those securities with the Securities and Exchange Commission. Specifically, Regulation S provides a safe harbor from the registration requirements of the Securities Act for the offers and sales of securities by both foreign and domestic issuers that are made outside the United States. |
| TBA | To be announced. Maturity date not known prior to settlement of this transaction. |
| 144A | Investment is exempt from registration under Rule 144A of the Securities Act of 1933, as amended. These investments may only be resold in transactions exempt from registration, which are normally those transactions with qualified institutional buyers. |
| (WI/DD) | Investment, or portion of investment, purchased on a when-issued or delayed delivery basis. |
| USD-LIBOR-ICE | United States Dollar-London Inter-Bank Offered Rate-Intercontinental Exchange |
See accompanying notes to financial statements.
Nuveen U.S. Infrastructure Bond Fund
(formerly U.S. Infrastructure Income Fund)
| | |
Portfolio of Investments | | June 30, 2015 |
| | | | | | | | | | | | | | | | | | | | |
Principal
Amount (000) | | | Description (1) | | Coupon | | | Maturity | | | Ratings (2) | | | Value | |
| | | | | |
| | | | LONG-TERM INVESTMENTS – 98.2% | | | | | | | | | | | | | | | | |
| | | | | |
| | | | CORPORATE BONDS – 36.9% | | | | | | | | | | | | | | | | |
| | | | | |
| | | | Commercial Services & Supplies – 1.9% | | | | | | | | | | | | |
| | | | | |
| $ | 70 | | | ADS Waste Holdings Inc. | | | 8.250% | | | | 10/01/20 | | | | CCC+ | | | $ | 72,450 | |
| | | | | |
| | 81 | | | Casella Waste Systems Inc. | | | 7.750% | | | | 2/15/19 | | | | B– | | | | 81,810 | |
| | 151 | | | Total Commercial Services & Supplies | | | | | | | | | | | | | | | 154,260 | |
| | | | | |
| | | | Construction & Engineering – 0.6% | | | | | | | | | | | | |
| | | | | |
| | 50 | | | AECOM Technology Corporation, 144A | | | 5.875% | | | | 10/15/24 | | | | BB– | | | | 50,688 | |
| | | | | |
| | | | Diversified Telecommunication Services – 2.4% | | | | | | | | | | | | |
| | | | | |
| | 65 | | | IntelSat Jackson Holdings | | | 6.625% | | | | 12/15/22 | | | | CCC+ | | | | 59,150 | |
| | | | | |
| | 90 | | | Qualitytech LP/QTS Finance Corp. | | | 5.875% | | | | 8/01/22 | | | | B+ | | | | 90,450 | |
| | | | | |
| | 50 | | | SBA Communications Corporation | | | 4.875% | | | | 7/15/22 | | | | B | | | | 48,688 | |
| | 205 | | | Total Diversified Telecommunication Services | | | | | | | | | | | | | | | 198,288 | |
| | | | | |
| | | | Electric Utilities – 4.8% | | | | | | | | | | | | |
| | | | | |
| | 65 | | | Exelon Generation Co. LLC | | | 4.250% | | | | 6/15/22 | | | | BBB | | | | 66,534 | |
| | | | | |
| | 95 | | | Mississippi Power Company | | | 4.250% | | | | 3/15/42 | | | | A | | | | 84,578 | |
| | | | | |
| | 40 | | | Northern States Power Company | | | 2.600% | | | | 5/15/23 | | | | Aa3 | | | | 38,773 | |
| | | | | |
| | 70 | | | PPL Capital Funding Inc. | | | 3.500% | | | | 12/01/22 | | | | BBB+ | | | | 70,835 | |
| | | | | |
| | 60 | | | PPL Energy Supply LLC, 144A | | | 6.500% | | | | 6/01/25 | | | | BB– | | | | 60,000 | |
| | | | | |
| | 70 | | | Progress Energy, Inc. | | | 3.150% | | | | 4/01/22 | | | | BBB+ | | | | 69,976 | |
| | 400 | | | Total Electric Utilities | | | | | | | | | | | | | | | 390,696 | |
| | | | | |
| | | | Energy Equipment & Services – 0.6% | | | | | | | | | | | | |
| | | | | |
| | 50 | | | Compressco Partners LP / Compressco Finance Corporation, 144A | | | 7.250% | | | | 8/15/22 | | | | B | | | | 47,750 | |
| | | | | |
| | | | Health Care Equipment & Supplies – 1.0% | | | | | | | | | | | | |
| | | | | |
| | 75 | | | Tenet Healthcare Corporation | | | 6.750% | | | | 2/01/20 | | | | B3 | | | | 78,375 | |
| | | | | |
| | | | Health Care Providers & Services – 2.8% | | | | | | | | | | | | |
| | | | | |
| | 65 | | | Community Health Systems, Inc. | | | 6.875% | | | | 2/01/22 | | | | B+ | | | | 68,575 | |
| | | | | |
| | 75 | | | Kindred Healthcare Inc. | | | 6.375% | | | | 4/15/22 | | | | B2 | | | | 74,906 | |
| | | | | |
| | 66 | | | Select Medical Corporation | | | 6.375% | | | | 6/01/21 | | | | B– | | | | 66,660 | |
| | | | | |
| | 20 | | | Surgical Care Affiliates Inc., 144A | | | 6.000% | | | | 4/01/23 | | | | B– | | | | 20,000 | |
| | 226 | | | Total Health Care Providers & Services | | | | | | | | | | | | | | | 230,141 | |
| | |
| | | | Independent Power & Renewable Electricity Producers – 2.1% | | | | |
| | | | | |
| | 65 | | | Dynegy Inc., 144A | | | 7.625% | | | | 11/01/24 | | | | B+ | | | | 68,736 | |
| | | | | |
| | 65 | | | GenOn Energy Inc. | | | 9.500% | | | | 10/15/18 | | | | B | | | | 66,300 | |
| | | | | |
| | 35 | | | TerraForm Power Operating LLC, 144A | | | 5.875% | | | | 2/01/23 | | | | BB– | | | | 35,525 | |
| | 165 | | | Total Independent Power & Renewable Electricity Producers | | | | | | | | | | | | | | | 170,561 | |
| | | | | | | | | | | | | | | | | | | | |
Principal
Amount (000) | | | Description (1) | | Coupon | | | Maturity | | | Ratings (2) | | | Value | |
| | | | | |
| | | | Internet Software & Services – 0.5% | | | | | | | | | | | | |
| | | | | |
| $ | 40 | | | Equinix Inc. | | | 5.750% | | | | 1/01/25 | | | | BB | | | $ | 39,600 | |
| | | | | |
| | | | IT Services – 0.9% | | | | | | | | | | | | |
| | | | | |
| | 75 | | | Zayo Group LLC / Zayo Capital Inc., 144A | | | 6.000% | | | | 4/01/23 | | | | B– | | | | 74,078 | |
| | | | | |
| | | | Multi-Utilities – 1.2% | | | | | | | | | | | | |
| | | | | |
| | 100 | | | Public Service Electric & Gas Company | | | 4.050% | | | | 5/01/45 | | | | Aa3 | | | | 95,439 | |
| | | | | |
| | | | Oil, Gas & Consumable Fuels – 12.0% | | | | | | | | | | | | | | | | |
| | | | | |
| | 90 | | | Berkshire Hathaway Energy Company | | | 3.750% | | | | 11/15/23 | | | | A3 | | | | 92,108 | |
| | | | | |
| | 70 | | | Calumet Specialty Products | | | 7.625% | | | | 1/15/22 | | | | B+ | | | | 71,400 | |
| | | | | |
| | 35 | | | Crestwood Midstream Partners LP | | | 6.125% | | | | 3/01/22 | | | | BB | | | | 35,700 | |
| | | | | |
| | 30 | | | Energy Transfer Equity LP | | | 5.500% | | | | 6/01/27 | | | | BB+ | | | | 29,925 | |
| | | | | |
| | 70 | | | Enterprise Products Operating Group LLP | | | 3.350% | | | | 3/15/23 | | | | BBB+ | | | | 68,364 | |
| | | | | |
| | 75 | | | Global Partners LP/GLP Finance | | | 6.250% | | | | 7/15/22 | | | | B+ | | | | 72,000 | |
| | | | | |
| | 70 | | | Kinder Morgan Energy Partners, LP | | | 3.500% | | | | 9/01/23 | | | | BBB– | | | | 65,257 | |
| | | | | |
| | 76 | | | Martin Mid-Stream Partners LP Finance | | | 7.250% | | | | 2/15/21 | | | | B– | | | | 74,670 | |
| | | | | |
| | 55 | | | MPLX LP | | | 4.000% | | | | 2/15/25 | | | | BBB– | | | | 53,662 | |
| | | | | |
| | 50 | | | NGL Energy Partners LP/Fin Co | | | 5.125% | | | | 7/15/19 | | | | BB– | | | | 49,875 | |
| | | | | |
| | 10 | | | NGL Energy Partners LP/Fin Co | | | 6.875% | | | | 10/15/21 | | | | BB– | | | | 10,400 | |
| | | | | |
| | 85 | | | Rose Rock Midstream LP / Rose Rock Finance Corporation | | | 5.625% | | | | 7/15/22 | | | | B1 | | | | 83,088 | |
| | | | | |
| | 25 | | | Sabine Pass Liquefaction LLC | | | 6.250% | | | | 3/15/22 | | | | BB+ | | | | 25,875 | |
| | | | | |
| | 100 | | | Southeast Supply Header LLC, 144A | | | 4.250% | | | | 6/15/24 | | | | BBB– | | | | 98,670 | |
| | | | | |
| | 15 | | | Summit Midstream Holdings LLC Finance | | | 7.500% | | | | 7/01/21 | | | | B | | | | 15,713 | |
| | | | | |
| | 50 | | | Tesoro Logistics LP Finance Corporation, 144A | | | 6.250% | | | | 10/15/22 | | | | BB | | | | 51,750 | |
| | | | | |
| | 80 | | | Western Refining Inc. | | | 6.250% | | | | 4/01/21 | | | | B+ | | | | 80,600 | |
| | 986 | | | Total Oil, Gas & Consumable Fuels | | | | | | | | | | | | | | | 979,057 | |
| | | | | |
| | | | Real Estate Investment Trust – 2.0% | | | | | | | | | | | | |
| | | | | |
| | 100 | | | American Tower Company | | | 5.000% | | | | 2/15/24 | | | | BBB | | | | 105,714 | |
| | | | | |
| | 60 | | | Communications Sales & Leasing Inc., 144A | | | 8.250% | | | | 10/15/23 | | | | BB | | | | 58,950 | |
| | 160 | | | Total Real Estate Investment Trust | | | | | | | | | | | | | | | 164,664 | |
| | | | | |
| | | | Road & Rail – 4.1% | | | | | | | | | | | | |
| | | | | |
| | 95 | | | Burlington Northern Santa Fe Corporation | | | 4.375% | | | | 9/01/42 | | | | A3 | | | | 91,509 | |
| | | | | |
| | 90 | | | Norfolk Southern Corporation | | | 3.850% | | | | 1/15/24 | | | | BBB+ | | | | 92,500 | |
| | | | | |
| | 85 | | | Union Pacific Corporation | | | 4.750% | | | | 12/15/43 | | | | A | | | | 89,005 | |
| | | | | |
| | 60 | | | Watco Companies LLC Finance, 144A | | | 6.375% | | | | 4/01/23 | | | | B | | | | 60,750 | |
| | 330 | | | Total Road & Rail | | | | | | | | | | | | | | | 333,764 | |
| $ | 3,013 | | | Total Corporate Bonds (cost $3,063,459) | | | | | | | | | | | | | | | 3,007,361 | |
Nuveen U.S. Infrastructure Bond Fund (continued)
(formerly U.S. Infrastructure Income Fund)
| | |
| Portfolio of Investments | | June 30, 2015 |
| | | | | | | | | | | | | | | | | | |
Principal
Amount (000) | | | Description (1) | | | | Optional Call
Provisions (3) | | | Ratings (2) | | | Value | |
| | | | | |
| | | | MUNICIPAL BONDS – 61.3% | | | | | | | | | | | | | | |
| | | | | |
| | | | Arizona – 4.1% | | | | | | | | | | | |
| | | | | |
| $ | 110 | | | Phoenix, Arizona, Various Purpose General Obligation Bonds, Build America Taxable Bonds, Series 2009A, 5.269%, 7/01/34 | | | | | No Opt. Call | | | | AA+ | | | $ | 124,994 | |
| | | | | |
| | 80 | | | Salt River Project Agricultural Improvement and Power District, Arizona, Electric System Revenue Bonds, Build America Bonds, Series 2010A, 4.839%, 1/01/41 | | | | | No Opt. Call | | | | Aa1 | | | | 88,693 | |
| | | | | |
| | 105 | | | Salt Verde Financial Corporation, Arizona, Senior Gas Revenue Bonds, Citigroup Energy Inc Prepay Contract Obligations, Series 2007, 5.250%, 12/01/28 | | | | | No Opt. Call | | | | A– | | | | 121,486 | |
| | 295 | | | Total Arizona | | | | | | | | | | | | | 335,173 | |
| | | | | |
| | | | California – 12.2% | | | | | | | | | | | |
| | | | | |
| | 250 | | | Alameda Corridor Transportation Authority, California, User Fee Revenue Bonds, Subordinate Lien Series 2004B, 0.000%, 10/01/31 – AMBAC Insured | | | | | No Opt. Call | | | | BBB+ | | | | 92,530 | |
| | | | | |
| | 100 | | | Bay Area Toll Authority, California, Revenue Bonds, San Francisco Bay Area Toll Bridge, Build America Federally Taxable Bond Series 2009F-2, 6.263%, 4/01/49 | | | | | No Opt. Call | | | | AA | | | | 129,732 | |
| | | | | |
| | 100 | | | California State, Various Purpose General Obligation Bonds, Build America Federally Taxable Bonds, Series 2009, 7.550%, 4/01/39 | | | | | No Opt. Call | | | | AA– | | | | 144,974 | |
| | | | | |
| | 85 | | | Los Angeles Department of Airports, California, Revenue Bonds, Los Angeles International Airport, Build America Taxable Bonds, Series 2009C, 6.582%, 5/15/39 | | | | | No Opt. Call | | | | AA– | | | | 107,143 | |
| | | | | |
| | 100 | | | Los Angeles Department of Water and Power, California, Power System Revenue Bonds, Federally Taxable – Direct Payment – Build America Bonds, Series 2010A, 5.716%, 7/01/39 | | | | | No Opt. Call | | | | AA– | | | | 118,201 | |
| | | | | |
| | 10 | | | Los Angeles Department of Water and Power, California, Waterworks Revenue Bonds, Build America Taxable Bonds, Series 2009C, 6.008%, 7/01/39 | | | | | No Opt. Call | | | | AA | | | | 12,158 | |
| | | | | |
| | 95 | | | Sacramento Municipal Utility District, California, Electric Revenue Bonds, Federally Taxable Build America Bonds, Series 2010W, 6.156%, 5/15/36 | | | | | No Opt. Call | | | | AA– | | | | 114,124 | |
| | | | | |
| | 130 | | | San Francisco City and County Public Utilities Commission, California, Water Revenue Bonds, Build America Taxable Bonds, Series 2010E, 6.000%, 11/01/40 | | | | | No Opt. Call | | | | AA– | | | | 155,890 | |
| | | | | |
| | 100 | | | University of California, General Revenue Bonds, Build America Taxable Bonds, Series 2009R, 5.770%, 5/15/43 | | | | | No Opt. Call | | | | AA | | | | 120,241 | |
| | 970 | | | Total California | | | | | | | | | | | | | 994,993 | |
| | | | | |
| | | | Colorado – 0.5% | | | | | | | | | | | |
| | | | | |
| | 100 | | | E-470 Public Highway Authority, Colorado, Toll Revenue Bonds, Refunding Series 2006B, 0.000%, 9/01/35 – NPFG Insured | | | | | 9/26 at 63.78 | | | | AA– | | | | 38,189 | |
| | | | | |
| | | | Illinois – 11.8% | | | | | | | | | | | |
| | | | | |
| | 65 | | | Chicago Greater Metropolitan Water Reclamation District, Illinois, General Obligation Bonds, Build America Taxable Bonds, Series 2009, 5.720%, 12/01/38 | | | | | No Opt. Call | | | | AAA | | | | 75,817 | |
| | | | | |
| | 105 | | | Chicago Transit Authority, Illinois, Sales Tax Receipts Revenue Bonds, Federally Taxable Build America Bonds, Series 2010B, 6.200%, 12/01/40 | | | | | No Opt. Call | | | | AA | | | | 110,999 | |
| | | | | |
| | 100 | | | Chicago, Illinois, General Airport Revenue Bonds, O’Hare International Airport, Third Lien, Build America Taxable Bond Series 2010B, 6.845%, 1/01/38 | | | | | 1/20 at 100.00 | | | | A2 | | | | 109,830 | |
| | | | | | | | | | | | | | | | | | |
Principal
Amount (000) | | | Description (1) | | | | Optional Call
Provisions (3) | | | Ratings (2) | | | Value | |
| | | | | |
| | | | Illinois (continued) | | | | | | | | | | | |
| | | | | |
| $ | 120 | | | Chicago, Illinois, Wastewater Transmission Revenue Bonds, Build America Taxable Bond Series 2010B, 6.900%, 1/01/40 | | | | | No Opt. Call | | | | AA | | | $ | 136,864 | |
| | | | | |
| | 100 | | | Cook County, Illinois, General Obligation Bonds, Build America Taxable Bonds, Series 2010D, 6.229%, 11/15/34 | | | | | No Opt. Call | | | | AA | | | | 99,783 | |
| | | | | |
| | 110 | | | Illinois State, General Obligation Bonds, Taxable Build America Bonds, Series 2010-1, 6.630%, 2/01/35 | | | | | No Opt. Call | | | | A– | | | | 113,552 | |
| | | | | |
| | 150 | | | Illinois Toll Highway Authority, Toll Highway Revenue Bonds, Build America Taxable Bonds, Senior Lien Series 2009A, 6.184%, 1/01/34 | | | | | No Opt. Call | | | | AA– | | | | 181,283 | |
| | | | | |
| | 120 | | | Northern Illinois Municipal Power Agency, Power Project Revenue Bonds, Prairie State Project, Build America Bond Series 2009C, 6.859%, 1/01/39 | | | | | No Opt. Call | | | | A2 | | | | 133,060 | |
| | 870 | | | Total Illinois | | | | | | | | | | | | | 961,188 | |
| | | | | |
| | | | Louisiana – 1.6% | | | | | | | | | | | |
| | | | | |
| | 120 | | | East Baton Rouge Sewerage Commission, Louisiana, Revenue Bonds, Build America Taxable Bonds, Series 2010B, 6.087%, 2/01/45 | | | | | 2/20 at 100.00 | | | | AA | | | | 132,733 | |
| | | | | |
| | | | Massachusetts – 0.2% | | | | | | | | | | | |
| | | | | |
| | 10 | | | Massachusetts State, General Obligation Bonds, Consolidated Loan, Build America Taxable Bonds, Series 2010, 5.456%, 12/01/39 | | | | | No Opt. Call | | | | AA+ | | | | 11,951 | |
| | | | | |
| | | | Missouri – 0.9% | | | | | | | | | | | |
| | | | | |
| | 60 | | | Missouri Joint Municipal Electric Utility Commission, Power Project Revenue Bonds, Plum Point Project, Build America Bond Series 2009A, 7.730%, 1/01/39 | | | | | No Opt. Call | | | | A– | | | | 75,523 | |
| | | | | |
| | | | New Jersey – 4.7% | | | | | | | | | | | |
| | | | | |
| | 50 | | | New Jersey Economic Development Authority, Special Facilities Revenue Bonds, Continental Airlines Inc., Series 1999, 5.250%, 9/15/29 (Alternative Minimum Tax) | | | | | 9/22 at 101.00 | | | | BB– | | | | 54,223 | |
| | | | | |
| | 25 | | | New Jersey Transportation Trust Fund Authority, Transportation System Bonds, Build America Bonds Issuer Subsidy Program, Series 2009B, 6.875%, 12/15/39 | | | | | 6/19 at 100.00 | | | | A– | | | | 26,126 | |
| | | | | |
| | 100 | | | New Jersey Transportation Trust Fund Authority, Transportation System Bonds, Build America Bonds Issuer Subsidy Program, Series 2010C, 6.104%, 12/15/28 | | | | | 12/20 at 100.00 | | | | A– | | | | 104,535 | |
| | | | | |
| | 150 | | | New Jersey Turnpike Authority, Revenue Bonds, Build America Taxable Bonds, Series 2010A, 7.102%, 1/01/41 | | | | | No Opt. Call | | | | A+ | | | | 202,009 | |
| | 325 | | | Total New Jersey | | | | | | | | | | | | | 386,893 | |
| | | | | |
| | | | New York – 7.4% | | | | | | | | | | | |
| | | | | |
| | 105 | | | Metropolitan Transportation Authority, New York, Dedicated Tax Fund Bonds, Build America Taxable Bonds, Series 2010A-2, 6.089%, 11/15/40 | | | | | No Opt. Call | | | | AA | | | | 129,926 | |
| | | | | |
| | 100 | | | Metropolitan Transportation Authority, New York, Transportation Revenue Bonds, Build America Taxable Bonds, Series 2010B-1, 6.648%, 11/15/39 | | | | | No Opt. Call | | | | AA– | | | | 128,238 | |
| | | | | |
| | 100 | | | New York City Municipal Water Finance Authority, New York, Water and Sewer System Revenue Bonds, Second Generation Resolution, Build America Taxable Bonds, Fiscal 2011 Series AA, 5.790%, 6/15/41 | | | | | 6/20 at 100.00 | | | | AA+ | | | | 109,814 | |
Nuveen U.S. Infrastructure Bond Fund (continued)
(formerly U.S. Infrastructure Income Fund)
| | |
| Portfolio of Investments | | June 30, 2015 |
| | | | | | | | | | | | | | | | | | |
Principal
Amount (000) | | | Description (1) | | | | Optional Call
Provisions (3) | | | Ratings (2) | | | Value | |
| | | | | |
| | | | New York (continued) | | | | | | | | | | | |
| | | | | |
| $ | 100 | | | New York City Transitional Finance Authority, New York, Building Aid Revenue Bonds, Build America Taxable Bond Fiscal 2011 Series 2010S-1B, 6.828%, 7/15/40 | | | | | No Opt. Call | | | | AA | | | $ | 128,385 | |
| | | | | |
| | 100 | | | Port Authority of New York and New Jersey, Consolidated Revenue Bonds, One Hundred Eighty-First Series 2014, 4.960%, 8/01/46 | | | | | No Opt. Call | | | | AA– | | | | 106,414 | |
| | 505 | | | Total New York | | | | | | | | | | | | | 602,777 | |
| | | | | |
| | | | Ohio – 4.1% | | | | | | | | | | | |
| | | | | |
| | 100 | | | American Municipal Power Inc., Ohio, Combined Hydroelectric Projects Revenue Bonds, Build America Bond Series 2009B, 6.449%, 2/15/44 | | | | | No Opt. Call | | | | A | | | | 121,244 | |
| | | | | |
| | 100 | | | JobsOhio Beverage System, Ohio, Statewide Liquor Profits Revenue Bonds, Senior Lien Taxable Series 2013B, 4.532%, 1/01/35 | | | | | No Opt. Call | | | | AA | | | | 104,311 | |
| | | | | |
| | 95 | | | Ohio State University, General Receipts Bonds, Build America Taxable Bond Series 2010C, 4.910%, 6/01/40 | | | | | No Opt. Call | | | | Aa1 | | | | 105,256 | |
| | 295 | | | Total Ohio | | | | | | | | | | | | | 330,811 | |
| | | | | |
| | | | Oregon – 1.5% | | | | | | | | | | | |
| | | | | |
| | 100 | | | Oregon State Department of Transportation, Highway User Tax Revenue Bonds, Federally Taxable Build America Bonds, Series 2010A, 5.834%, 11/15/34 | | | | | No Opt. Call | | | | AA+ | | | | 122,446 | |
| | | | | |
| | | | Pennsylvania – 2.7% | | | | | | | | | | | |
| | | | | |
| | 100 | | | Commonwealth Financing Authority, Pennsylvania, State Appropriation Lease Bonds, Build America Taxable Bonds, Series 2009D, 6.218%, 6/01/39 | | | | | No Opt. Call | | | | A+ | | | | 115,796 | |
| | | | | |
| | 90 | | | Pennsylvania Turnpike Commission, Turnpike Revenue Bonds, Build America Taxable Bonds, Series 2009A, 6.105%, 12/01/39 | | | | | No Opt. Call | | | | A+ | | | | 108,026 | |
| | 190 | | | Total Pennsylvania | | | | | | | | | | | | | 223,822 | |
| | | | | |
| | | | Tennessee – 1.5% | | | | | | | | | | | |
| | | | | |
| | 100 | | | Metropolitan Government Nashville & Davidson County Convention Center Authority, Tennessee, Tourism Tax Revenue Bonds, Build America Taxable Bonds, Subordinate Lien Series 2010B, 6.731%, 7/01/43 | | | | | No Opt. Call | | | | Aa3 | | | | 124,102 | |
| | | | | |
| | | | Texas – 4.0% | | | | | | | | | | | |
| | | | | |
| | 75 | | | Dallas County Hospital District, Texas, General Obligation Limited Tax Bonds, Build America Taxable Bonds, Series 2009C, 5.621%, 8/15/44 | | | | | No Opt. Call | | | | AA+ | | | | 89,932 | |
| | | | | |
| | 100 | | | North Texas Tollway Authority, System Revenue Bonds, Taxable Build America Bonds, Series 2010-B2, 8.910%, 2/01/30 | | | | | 2/20 at 100.00 | | | | Baa3 | | | | 118,175 | |
| | | | | |
| | 95 | | | Texas Private Activity Bond Surface Transportation Corporation, Senior Lien Revenue Bonds, LBJ Infrastructure Group LLC IH-635 Managed Lanes Project, Series 2010, 7.500%, 6/30/33 | | | | | 6/20 at 100.00 | | | | Baa3 | | | | 116,170 | |
| | 270 | | | Total Texas | | | | | | | | | | | | | 324,277 | |
| | | | | |
| | | | Virginia – 3.0% | | | | | | | | | | | |
| | | | | |
| | 100 | | | Metropolitan Washington Airports Authority, Virginia, Dulles Toll Road Second Senior Lien Revenue Bonds, Build America Bonds, Series 2009D, 7.462%, 10/01/46 – AGC Insured | | | | | No Opt. Call | | | | BBB+ | | | | 130,554 | |
| | | | | |
| | 100 | | | Virginia Transportation Board, Transportation Revenue Bonds, Capital Projects, Build America Taxable Bonds, Series 2010A-2, 5.350%, 5/15/35 | | | | | No Opt. Call | | | | AA+ | | | | 113,547 | |
| | 200 | | | Total Virginia | | | | | | | | | | | | | 244,101 | |
| | | | | | | | | | | | | | | | | | |
Principal
Amount (000) | | | Description (1) | | | | Optional Call
Provisions (3) | | | Ratings (2) | | | Value | |
| | | | | |
| | | | Washington – 1.1% | | | | | | | | | | | |
| | | | | |
| $ | 75 | | | Central Puget Sound Regional Transit Authority, Washington, Sales and Use Tax Revenue Bonds, Build America Taxable Bonds, Series 2009S-2T, 5.491%, 11/01/39 | | | | | No Opt. Call | | | | AAA | | | $ | 90,280 | |
| $ | 4,485 | | | Total Municipal Bonds (cost $5,038,356) | | | | | | | | | | | | | 4,999,259 | |
| | | | Total Long-Term Investments (cost $8,101,815) | | | | 8,006,620 | |
| | | | Other Assets Less Liabilities – 1.8% (4) | | | | | | | | | | | | | 146,996 | |
| | | | Net Assets – 100% | | | | | | | | | | | | $ | 8,153,616 | |
Investments in Derivatives as of June 30, 2015
Futures Contracts outstanding:
| | | | | | | | | | | | | | | | | | | | | | | | |
| Description | | Contract
Position | | | Number of
Contracts | | | Contract
Expiration | | | Notional
Amount
at Value | | | Variation
Margin
Receivable/
(Payable) | | | Unrealized
Appreciation
(Depreciation) | |
| U.S. Treasury Long Bond | | | Short | | | | (7 | ) | | | 9/15 | | | $ | (1,055,906 | ) | | $ | 438 | | | $ | 29,296 | |
For Fund portfolio compliance purposes, the Fund’s industry classifications refer to any one or more of the industry sub-classifications used by one or more widely recognized market indexes or ratings group indexes, and/or as defined by Fund management. This definition may not apply for purposes of this report, which may combine industry sub-classifications into sectors for reporting ease.
| (1) | All percentages shown in the Portfolio of Investments are based on net assets. |
| (2) | Ratings (not covered by the report of independent registered public accounting firm): Using the highest of Standard & Poor’s Group (“Standard & Poor’s”), Moody’s Investors Service, Inc. (“Moody’s”) or Fitch, Inc. (“Fitch”) rating. Ratings below BBB by Standard & Poor’s, Baa by Moody’s or BBB by Fitch are considered to be below investment grade. Holdings designated N/R are not rated by any of these national rating agencies. |
| (3) | Optional Call Provisions (not covered by the report of independent registered public accounting firm): Dates (month and year) and prices of the earliest optional call or redemption. There may be other call provisions at varying prices at later dates. Certain mortgage-backed securities may be subject to periodic principal paydowns. |
| (4) | Other assets less liabilities includes the unrealized appreciation (depreciation) of the over-the-counter derivatives as presented on the Statement of Assets and Liabilities. The unrealized appreciation (depreciation) of exchange-cleared and exchange-traded derivatives is recognized as part of the cash collateral at brokers and/or the receivable or payable for variation margin as presented on the Statement of Assets and Liabilities, when applicable. |
| 144A | Investment is exempt from registration under Rule 144A of the Securities Act of 1933, as amended. These investments may only be resold in transactions exempt from registration, which are normally transactions with qualified institutional buyers. |
See accompanying notes to financial statements.
Statement of
| | | | |
| | Assets and Liabilities | | June 30, 2015 |
| | | | | | | | | | | | | | | | |
| | | Global Total
Return Bond | | | High Income
Bond | | | Strategic
Income | | | U.S. Infrastructure
Bond | |
Assets | | | | | | | | | | | | | | | | |
Long-term investments, at value (cost $19,709,510, $662,915,228, $1,201,701,416 and $8,101,815, respectively) | | $ | 18,556,158 | | | $ | 621,494,960 | | | $ | 1,177,437,564 | | | $ | 8,006,620 | |
Investments purchased with collateral from securities lending, at value (cost approximates value) | | | — | | | | 104,213,543 | | | | 146,196,005 | | | | — | |
Short-term investments, at value (cost approximates value) | | | 802,879 | | | | 6,916,507 | | | | 18,215,453 | | | | — | |
Cash denominated in foreign currencies (cost $19,779, $66,779, $— and $—, respectively) | | | 20,070 | | | | 66,234 | | | | — | | | | — | |
Cash | | | — | | | | — | | | | 369,976 | | | | 32,335 | |
Cash collateral at brokers(1) | | | 125,000 | | | | 1,148,210 | | | | 4,279,379 | | | | 35,000 | |
Interest rate swaps premiums paid | | | — | | | | 371 | | | | 768 | | | | — | |
Unrealized appreciation on forward foreign currency exchange contracts, net | | | 33,294 | | | | 173,118 | | | | 1,318,258 | | | | — | |
Receivable for: | | | | | | | | | | | | | | | | |
Dividends | | | 2,541 | | | | 384,223 | | | | 70,392 | | | | — | |
Due from broker | | | — | | | | 54,442 | | | | 50,743 | | | | — | |
Interest | | | 226,261 | | | | 10,818,894 | | | | 14,932,092 | | | | 122,936 | |
Investments sold | | | — | | | | 2,110,562 | | | | 1,443,137 | | | | — | |
Reclaims | | | 2,398 | | | | — | | | | — | | | | — | |
Reimbursement from Adviser | | | 3,507 | | | | — | | | | — | | | | 3,837 | |
Shares sold | | | 2,895 | | | | 397,021 | | | | 2,640,712 | | | | 3,973 | |
Variation margin on futures contracts | | | 1,934 | | | | — | | | | 80,523 | | | | 438 | |
Variation margin on swap contracts | | | — | | | | 298,229 | | | | 1,659,453 | | | | — | |
Other assets | | | 17,543 | | | | 53,660 | | | | 117,551 | | | | 22,879 | |
Total assets | | | 19,794,480 | | | | 748,129,974 | | | | 1,368,812,006 | | | | 8,228,018 | |
Liabilities | | | | | | | | | | | | | | | | |
Cash overdraft | | | — | | | | 472,459 | | | | — | | | | — | |
Unrealized depreciation on: | | | | | | | | | | | | | | | | |
Forward foreign currency exchange contracts, net | | | 140,522 | | | | — | | | | 710,998 | | | | — | |
Interest rate swaps, net | | | 1,248 | | | | — | | | | 179,148 | | | | — | |
Payable for: | | | | | | | | | | | | | | | | |
Collateral from securities lending program | | | — | | | | 104,213,543 | | | | 146,196,005 | | | | — | |
Dividends | | | 43,933 | | | | 1,934,142 | | | | 2,162,541 | | | | 24,623 | |
Investments purchased | | | 722,113 | | | | 8,877,225 | | | | 10,284,288 | | | | 30,183 | |
Shares redeemed | | | 3,277 | | | | 9,624,882 | | | | 3,119,580 | | | | 90 | |
Variation margin on futures contracts | | | — | | | | 10,250 | | | | 17,563 | | | | — | |
Accrued expenses: | | | | | | | | | | | | | | | | |
Management fees | | | — | | | | 312,026 | | | | 315,583 | | | | — | |
Directors/Trustees fees | | | 106 | | | | 29,672 | | | | 31,881 | | | | 46 | |
12b-1 distribution and service fees | | | 531 | | | | 75,928 | | | | 155,212 | | | | 112 | |
Other | | | 63,355 | | | | 234,746 | | | | 411,118 | | | | 19,348 | |
Total liabilities | | | 975,085 | | | | 125,784,873 | | | | 163,583,917 | | | | 74,402 | |
Net assets | | $ | 18,819,395 | | | $ | 622,345,101 | | | $ | 1,205,228,089 | | | $ | 8,153,616 | |
| (1) | Cash pledged to collateralize the net payment obligations for investments in derivatives. |
See accompanying notes to financial statements.
| | | | | | | | | | | | | | | | |
| | | Global Total
Return Bond | | | High Income
Bond | | | Strategic
Income | | | U.S. Infrastructure
Bond | |
Class A Shares | | | | | | | | | | | | | | | | |
Net assets | | $ | 1,612,382 | | | $ | 119,534,965 | | | $ | 288,080,130 | | | $ | 255,382 | |
Shares outstanding | | | 87,853 | | | | 14,521,591 | | | | 26,260,121 | | | | 12,997 | |
Net asset value (“NAV”) per share | | $ | 18.35 | | | $ | 8.23 | | | $ | 10.97 | | | $ | 19.65 | |
Offering price per share (NAV per share plus maximum sales charge of 4.75%,
4.75%, 4.25% and 4.25%, respectively, of offering price) | | $ | 19.27 | | | $ | 8.64 | | | $ | 11.46 | | | $ | 20.52 | |
Class C Shares | | | | | | | | | | | | | | | | |
Net assets | | $ | 203,754 | | | $ | 55,409,230 | | | $ | 110,659,661 | | | $ | 73,309 | |
Shares outstanding | | | 11,051 | | | | 6,742,004 | | | | 10,150,154 | | | | 3,730 | |
NAV and offering price per share | | $ | 18.44 | | | $ | 8.22 | | | $ | 10.90 | | | $ | 19.65 | |
Class R3 Shares | | | | | | | | | | | | | | | | |
Net assets | | $ | 45,033 | | | $ | 995,394 | | | $ | 12,271,975 | | | $ | — | |
Shares outstanding | | | 2,446 | | | | 118,454 | | | | 1,114,303 | | | | — | |
NAV and offering price per share | | $ | 18.41 | | | $ | 8.40 | | | $ | 11.01 | | | $ | — | |
Class R6 Shares(2) | | | | | | | | | | | | | | | | |
Net assets | | $ | — | | | $ | — | | | $ | 20,497,740 | | | $ | — | |
Shares outstanding | | | — | | | | — | | | | 1,869,565 | | | | — | |
NAV and offering price per share | | $ | — | | | $ | — | | | $ | 10.96 | | | $ | — | |
Class I Shares | | | | | | | | | | | | | | | | |
Net assets | | $ | 16,958,226 | | | $ | 446,405,512 | | | $ | 773,718,583 | | | $ | 7,824,925 | |
Shares outstanding | | | 920,559 | | | | 54,076,378 | | | | 70,583,083 | | | | 398,228 | |
NAV and offering price per share | | $ | 18.42 | | | $ | 8.26 | | | $ | 10.96 | | | $ | 19.65 | |
Net assets consist of: | | | | | | | | | | | | | | | | |
Capital paid-in | | $ | 20,697,217 | | | $ | 692,339,447 | | | $ | 1,259,768,606 | | | $ | 8,330,854 | |
Undistributed (Over-distribution of) net investment income | | | (471,513 | ) | | | 2,281,412 | | | | 14,977,584 | | | | (6,935 | ) |
Accumulated net realized gain (loss) | | | (166,086 | ) | | | (30,501,514 | ) | | | (43,620,250 | ) | | | (104,404 | ) |
Net unrealized appreciation (depreciation) | | | (1,240,223 | ) | | | (41,774,244 | ) | | | (25,897,851 | ) | | | (65,899 | ) |
Net assets | | $ | 18,819,395 | | | $ | 622,345,101 | | | $ | 1,205,228,089 | | | $ | 8,153,616 | |
Authorized shares – per class | | | Unlimited | | | | 2 billion | | | | 2 billion | | | | Unlimited | |
Par value per share | | $ | 0.01 | | | $ | 0.0001 | | | $ | 0.0001 | | | $ | 0.01 | |
| (2) | Class R6 Shares for Strategic Income were established and commenced operations on January 20, 2015. |
See accompanying notes to financial statements.
Statement of
| | | | |
| | Operations | | Year Ended June 30, 2015 |
| | | | | | | | | | | | | | | | |
| | | Global Total
Return Bond | | | High Income
Bond | | | Strategic
Income | | | U.S. Infrastructure
Bond | |
Investment Income | | | | | | | | | | | | | | | | |
Dividend income (net of foreign tax withheld of $—, $7,178, $— and $—, respectively) | | $ | 25,240 | | | $ | 3,653,838 | | | $ | 1,518,603 | | | $ | — | |
Interest income (net of foreign tax withheld of $47, $32,500, $20,748 and $—, respectively) | | | 905,292 | | | | 54,780,785 | | | | 53,315,647 | | | | 370,146 | |
Securities lending income, net | | | — | | | | 778,804 | | | | 425,088 | | | | — | |
Total investment income | | | 930,532 | | | | 59,213,427 | | | | 55,259,338 | | | | 370,146 | |
Expenses | | | | | | | | | | | | | | | | |
Management fees | | | 112,425 | | | | 4,546,123 | | | | 5,525,523 | | | | 47,626 | |
12b-1 service fees – Class A Shares | | | 3,894 | | | | 412,570 | | | | 557,617 | | | | 367 | |
12b-1 distribution and service fees – Class C Shares | | | 2,027 | | | | 635,392 | | | | 862,322 | | | | 627 | |
12b-1 distribution and service fees – Class R3 Shares | | | 243 | | | | 5,739 | | | | 47,650 | | | | — | |
Shareholder servicing agent fees | | | 2,799 | | | | 599,568 | | | | 737,120 | | | | 714 | |
Custodian fees | | | 64,452 | | | | 378,662 | | | | 350,127 | | | | 22,776 | |
Directors/Trustees fees | | | 868 | | | | 25,370 | | | | 32,599 | | | | 331 | |
Professional fees | | | 44,470 | | | | 106,988 | | | | 123,161 | | | | 15,805 | |
Shareholder reporting expenses | | | 23,084 | | | | 73,402 | | | | 170,571 | | | | 5,071 | |
Federal and state registration fees | | | 50,550 | | | | 74,110 | | | | 172,287 | | | | 17,032 | |
Other | | | 14,168 | | | | 29,793 | | | | 34,731 | | | | 6,915 | |
Total expenses before fee waiver/expense reimbursement | | | 318,980 | | | | 6,887,717 | | | | 8,613,708 | | | | 117,264 | |
Fee waiver/expense reimbursement | | | (170,497 | ) | | | — | | | | (992,944 | ) | | | (61,661 | ) |
Net expenses | | | 148,483 | | | | 6,887,717 | | | | 7,620,764 | | | | 55,603 | |
Net investment income (loss) | | | 782,049 | | | | 52,325,710 | | | | 47,638,574 | | | | 314,543 | |
Realized and Unrealized Gain (Loss) | | | | | | | | | | | | | | | | |
Net realized gain (loss) from: | | | | | | | | | | | | | | | | |
Investments and foreign currency | | | (326,542 | ) | | | (34,123,226 | ) | | | (9,317,210 | ) | | | 3,619 | |
Forward foreign currency exchange contracts | | | (250,808 | ) | | | 13,219,277 | | | | 18,051,609 | | | | — | |
Futures contracts | | | (182,445 | ) | | | (578,896 | ) | | | (6,149,196 | ) | | | (106,378 | ) |
Swaps | | | 13,589 | | | | (1,827,472 | ) | | | (863,146 | ) | | | — | |
Change in net unrealized appreciation (depreciation) of: | | | | | | | | | | | | | | | | |
Investments and foreign currency | | | (1,418,081 | ) | | | (73,863,867 | ) | | | (56,122,617 | ) | | | (212,989 | ) |
Forward foreign currency exchange contracts | | | (103,660 | ) | | | 146,922 | | | | 790,473 | | | | — | |
Futures contracts | | | 13,462 | | | | (352,543 | ) | | | (495,755 | ) | | | 44,447 | |
Swaps | | | (28,185 | ) | | | 320,392 | | | | (1,179,760 | ) | | | — | |
Net realized and unrealized gain (loss) | | | (2,282,670 | ) | | | (97,059,413 | ) | | | (55,285,602 | ) | | | (271,301 | ) |
Net increase (decrease) in net assets from operations | | $ | (1,500,621 | ) | | $ | (44,733,703 | ) | | $ | (7,647,028 | ) | | $ | 43,242 | |
See accompanying notes to financial statements.
Statement of
| | | | | | | | | | | | | | | | | | |
| | | Global Total Return Bond | | | | | High Income Bond | |
| | | Year Ended
6/30/15 | | | Year Ended
6/30/14 | | | | | Year Ended
6/30/15 | | | Year Ended
6/30/14 | |
Operations | | | | | | | | | | | | | | | | | | |
Net investment income (loss) | | $ | 782,049 | | | $ | 797,824 | | | | | $ | 52,325,710 | | | $ | 54,450,944 | |
Net realized gain (loss) from: | | | | | | | | | | | | | | | | | | |
Investments and foreign currency | | | (326,542 | ) | | | 275,982 | | | | | | (34,123,226 | ) | | | 10,688,684 | |
Forward foreign currency exchange contracts | | | (250,808 | ) | | | (355,340 | ) | | | | | 13,219,277 | | | | (869,241 | ) |
Futures contracts | | | (182,445 | ) | | | 6,740 | | | | | | (578,896 | ) | | | (77,978 | ) |
Options purchased | | | — | | | | (15,802 | ) | | | | | — | | | | — | |
Swaps | | | 13,589 | | | | 80,592 | | | | | | (1,827,472 | ) | | | (2,055,236 | ) |
Change in net unrealized appreciation (depreciation) of: | | | | | | | | | | | | | | | | | | |
Investments and foreign currency | | | (1,418,081 | ) | | | 693,937 | | | | | | (73,863,867 | ) | | | 41,655,840 | |
Forward foreign currency exchange contracts | | | (103,660 | ) | | | 76,850 | | | | | | 146,922 | | | | 183,932 | |
Futures contracts | | | 13,462 | | | | (44,565 | ) | | | | | (352,543 | ) | | | (720,436 | ) |
Options purchased | | | — | | | | 4,270 | | | | | | — | | | | — | |
Swaps | | | (28,185 | ) | | | (22,510 | ) | | | | | 320,392 | | | | (571,182 | ) |
Net increase (decrease) in net assets from operations | | | (1,500,621 | ) | | | 1,497,978 | | | | | | (44,733,703 | ) | | | 102,685,327 | |
Distributions to Shareholders | | | | | | | | | | | | | | | | | | |
From net investment income: | | | | | | | | | | | | | | | | | | |
Class A Shares | | | (64,249 | ) | | | (41,491 | ) | | | | | (10,263,959 | ) | | | (11,488,067 | ) |
Class C Shares | | | (6,623 | ) | | | (4,753 | ) | | | | | (3,494,239 | ) | | | (4,133,973 | ) |
Class R3 Shares | | | (1,868 | ) | | | (1,637 | ) | | | | | (68,691 | ) | | | (57,707 | ) |
Class R6 Shares | | | — | | | | — | | | | | | — | | | | — | |
Class I Shares | | | (798,173 | ) | | | (689,699 | ) | | | | | (37,801,973 | ) | | | (40,883,363 | ) |
From accumulated net realized gains: | | | | | | | | | | | | | | | | | | |
Class A Shares | | | (20,483 | ) | | | (15,286 | ) | | | | | (1,298,112 | ) | | | (3,748,641 | ) |
Class C Shares | | | (2,560 | ) | | | (2,340 | ) | | | | | (551,922 | ) | | | (1,550,786 | ) |
Class R3 Shares | | | (670 | ) | | | (762 | ) | | | | | (10,919 | ) | | | (18,187 | ) |
Class R6 Shares | | | — | | | | — | | | | | | — | | | | — | |
Class I Shares | | | (250,904 | ) | | | (279,368 | ) | | | | | (5,141,766 | ) | | | (12,406,397 | ) |
Decrease in net assets from distributions to shareholders | | | (1,145,530 | ) | | | (1,035,336 | ) | | | | | (58,631,581 | ) | | | (74,287,121 | ) |
Fund Share Transactions | | | | | | | | | | | | | | | | | | |
Proceeds from sale of shares | | | 1,078,129 | | | | 3,495,146 | | | | | | 477,217,806 | | | | 544,164,005 | |
Proceeds from shares issued to shareholders due to reinvestment of distributions | | | 364,059 | | | | 290,859 | | | | | | 25,563,889 | | | | 32,009,771 | |
| | | 1,442,188 | | | | 3,786,005 | | | | | | 502,781,695 | | | | 576,173,776 | |
Cost of shares redeemed | | | (688,048 | ) | | | (1,174,138 | ) | | | | | (779,613,360 | ) | | | (308,712,801 | ) |
Net increase (decrease) in net assets from Fund share transactions | | | 754,140 | | | | 2,611,867 | | | | | | (276,831,665 | ) | | | 267,460,975 | |
Net increase (decrease) in net assets | | | (1,892,011 | ) | | | 3,074,509 | | | | | | (380,196,949 | ) | | | 295,859,181 | |
Net assets at the beginning of period | | | 20,711,406 | | | | 17,636,897 | | | | | | 1,002,542,050 | | | | 706,682,869 | |
Net assets at the end of period | | $ | 18,819,395 | | | $ | 20,711,406 | | | | | $ | 622,345,101 | | | $ | 1,002,542,050 | |
Undistributed (Over-distribution of) net investment income at the end of period | | $ | (471,513 | ) | | $ | 219,048 | | | | | $ | 2,281,412 | | | $ | (5,000,570 | ) |
See accompanying notes to financial statements.
Statement of Changes in Net Assets (continued)
| | | | | | | | | | | | | | | | | | |
| | | Strategic Income | | | | | U.S. Infrastructure Bond | |
| | | Year Ended
6/30/15 | | | Year Ended
6/30/14 | | | | | Year Ended
6/30/15 | | | Period 5/12/14
(commencement of operations)
through 6/30/14 | |
Operations | | | | | | | | | | | | | | | | | | |
Net investment income (loss) | | $ | 47,638,574 | | | $ | 32,370,172 | | | | | $ | 314,543 | | | $ | 33,999 | |
Net realized gain (loss) from: | | | | | | | | | | | | | | | | | | |
Investments and foreign currency | | | (9,317,210 | ) | | | 7,067,274 | | | | | | 3,619 | | | | 459 | |
Forward foreign currency exchange contracts | | | 18,051,609 | | | | (3,086,868 | ) | | | | | — | | | | — | |
Futures contracts | | | (6,149,196 | ) | | | (192,845 | ) | | | | | (106,378 | ) | | | — | |
Options purchased | | | — | | | | (81,130 | ) | | | | | — | | | | — | |
Swaps | | | (863,146 | ) | | | 1,328,009 | | | | | | — | | | | — | |
Change in net unrealized appreciation (depreciation) of: | | | | | | | | | | | | | | | | | | |
Investments and foreign currency | | | (56,122,617 | ) | | | 33,944,503 | | | | | | (212,989 | ) | | | 117,794 | |
Forward foreign currency exchange contracts | | | 790,473 | | | | 1,021,813 | | | | | | — | | | | — | |
Futures contracts | | | (495,755 | ) | | | (955,534 | ) | | | | | 44,447 | | | | (15,151 | ) |
Options purchased | | | — | | | | 81,130 | | | | | | — | | | | — | |
Swaps | | | (1,179,760 | ) | | | (3,796,978 | ) | | | | | — | | | | — | |
Net increase (decrease) in net assets from operations | | | (7,647,028 | ) | | | 67,699,546 | | | | | | 43,242 | | | | 137,101 | |
Distributions to Shareholders | | | | | | | | | | | | | | | | | | |
From net investment income: | | | | | | | | | | | | | | | | | | |
Class A Shares | | | (10,648,005 | ) | | | (4,217,324 | ) | | | | | (6,013 | ) | | | (163 | ) |
Class C Shares | | | (3,444,106 | ) | | | (1,540,102 | ) | | | | | (2,019 | ) | | | (130 | ) |
Class R3 Shares | | | (433,800 | ) | | | (167,160 | ) | | | | | — | | | | — | |
Class R6 Shares(1) | | | (447,293 | ) | | | — | | | | | | — | | | | — | |
Class I Shares | | | (37,555,701 | ) | | | (27,194,188 | ) | | | | | (325,689 | ) | | | (23,805 | ) |
From accumulated net realized gains: | | | | | | | | | | | | | | | | | | |
Class A Shares | | | — | | | | — | | | | | | — | | | | — | |
Class C Shares | | | — | | | | — | | | | | | — | | | | — | |
Class R3 Shares | | | — | | | | — | | | | | | — | | | | — | |
Class R6 Shares(1) | | | — | | | | — | | | | | | — | | | | — | |
Class I Shares | | | — | | | | — | | | | | | — | | | | — | |
Decrease in net assets from distributions to shareholders | | | (52,528,905 | ) | | | (33,118,774 | ) | | | | | (333,721 | ) | | | (24,098 | ) |
Fund Share Transactions | | | | | | | | | | | | | | | | | | |
Proceeds from sale of shares | | | 804,277,621 | | | | 318,782,287 | | | | | | 1,695,746 | | | | 7,000,500 | |
Proceeds from shares issued to shareholders due to reinvestment of distributions | | | 26,744,855 | | | | 12,232,390 | | | | | | 27,419 | | | | — | |
| | | 831,022,476 | | | | 331,014,677 | | | | | | 1,723,165 | | | | 7,000,500 | |
Cost of shares redeemed | | | (359,677,544 | ) | | | (200,728,971 | ) | | | | | (392,069 | ) | | | (504 | ) |
Net increase (decrease) in net assets from Fund share transactions | | | 471,344,932 | | | | 130,285,706 | | | | | | 1,331,096 | | | | 6,999,996 | |
Net increase (decrease) in net assets | | | 411,168,999 | | | | 164,866,478 | | | | | | 1,040,617 | | | | 7,112,999 | |
Net assets at the beginning of period | | | 794,059,090 | | | | 629,192,612 | | | | | | 7,112,999 | | | | — | |
Net assets at the end of period | | $ | 1,205,228,089 | | | $ | 794,059,090 | | | | | $ | 8,153,616 | | | $ | 7,112,999 | |
Undistributed (Over-distribution of) net investment income at the end of period | | $ | 14,977,584 | | | $ | 9,747,103 | | | | | $ | (6,935 | ) | | $ | 10,036 | |
| (1) | Class R6 Shares were established and commenced operations on January 20, 2015. |
See accompanying notes to financial statements.
THIS PAGE INTENTIONALLY LEFT BLANK
Financial
Highlights
Global Total Return Bond
Selected data for a share outstanding throughout each period:
| | | | | | | | | | | | | | | | | | | | | | | | | | | | | | | | | | |
| | | | | |
| | | | | | Investment Operations | | | | | Less Distributions | | | | |
| | | | | | | | | |
Class (Commencement Date) Year Ended June 30, | | Beginning
NAV | | | Net
Investment
Income
(Loss)(a) | | | Net
Realized/
Unrealized
Gain (Loss) | | | Total | | | | | From
Net
Investment
Income | | | From
Accumulated
Net Realized
Gains | | | Total | | | Ending
NAV | |
Class A (12/11) | | | | | | | | | | | | | | | | | | | | | | | |
2015 | | $ | 20.97 | | | $ | 0.73 | | | $ | (2.26 | ) | | $ | (1.53 | ) | | | | $ | (0.82 | ) | | $ | (0.27 | ) | | $ | (1.09 | ) | | $ | 18.35 | |
2014 | | | 20.54 | | | | 0.79 | | | | 0.68 | | | | 1.47 | | | | | | (0.73 | ) | | | (0.31 | ) | | | (1.04 | ) | | | 20.97 | |
2013 | | | 21.19 | | | | 0.72 | | | | (0.14 | ) | | | 0.58 | | | | | | (0.86 | ) | | | (0.37 | ) | | | (1.23 | ) | | | 20.54 | |
2012(d) | | | 20.00 | | | | 0.41 | | | | 1.07 | | | | 1.48 | | | | | | (0.29 | ) | | | — | | | | (0.29 | ) | | | 21.19 | |
Class C (12/11) | | | | | | | | | | | | | | | | | | | | | | | |
2015 | | | 21.04 | | | | 0.58 | | | | (2.26 | ) | | | (1.68 | ) | | | | | (0.65 | ) | | | (0.27 | ) | | | (0.92 | ) | | | 18.44 | |
2014 | | | 20.58 | | | | 0.63 | | | | 0.70 | | | | 1.33 | | | | | | (0.56 | ) | | | (0.31 | ) | | | (0.87 | ) | | | 21.04 | |
2013 | | | 21.18 | | | | 0.56 | | | | (0.10 | ) | | | 0.46 | | | | | | (0.69 | ) | | | (0.37 | ) | | | (1.06 | ) | | | 20.58 | |
2012(d) | | | 20.00 | | | | 0.29 | | | | 1.13 | | | | 1.42 | | | | | | (0.24 | ) | | | — | | | | (0.24 | ) | | | 21.18 | |
Class R3 (12/11) | | | | | | | | | | | | | | | | | | | | | | | |
2015 | | | 21.03 | | | | 0.68 | | | | (2.27 | ) | | | (1.59 | ) | | | | | (0.76 | ) | | | (0.27 | ) | | | (1.03 | ) | | | 18.41 | |
2014 | | | 20.58 | | | | 0.74 | | | | 0.69 | | | | 1.43 | | | | | | (0.67 | ) | | | (0.31 | ) | | | (0.98 | ) | | | 21.03 | |
2013 | | | 21.20 | | | | 0.66 | | | | (0.11 | ) | | | 0.55 | | | | | | (0.80 | ) | | | (0.37 | ) | | | (1.17 | ) | | | 20.58 | |
2012(d) | | | 20.00 | | | | 0.35 | | | | 1.13 | | | | 1.48 | | | | | | (0.28 | ) | | | — | | | | (0.28 | ) | | | 21.20 | |
Class I (12/11) | | | | | | | | | | | | | | | | | | | | | | | |
2015 | | | 21.05 | | | | 0.78 | | | | (2.27 | ) | | | (1.49 | ) | | | | | (0.87 | ) | | | (0.27 | ) | | | (1.14 | ) | | | 18.42 | |
2014 | | | 20.61 | | | | 0.84 | | | | 0.69 | | | | 1.53 | | | | | | (0.78 | ) | | | (0.31 | ) | | | (1.09 | ) | | | 21.05 | |
2013 | | | 21.23 | | | | 0.77 | | | | (0.11 | ) | | | 0.66 | | | | | | (0.91 | ) | | | (0.37 | ) | | | (1.28 | ) | | | 20.61 | |
2012(d) | | | 20.00 | | | | 0.42 | | | | 1.12 | | | | 1.54 | | | | | | (0.31 | ) | | | — | | | | (0.31 | ) | | | 21.23 | |
| | | | | | | | | | | | | | | | | | | | | | | | | | | | | | |
| | | | Ratios/Supplemental Data | |
| | | | | | | | | Ratios to Average
Net Assets Before
Waiver/Reimbursement | | | | | Ratios to Average
Net Assets After
Waiver/Reimbursement(c) | | | | |
| | | | | | | | |
Total
Return(b) | | | Ending
Net
Assets
(000) | | | | | Expenses | | | Net
Investment
Income
(Loss) | | | | | Expenses | | | Net
Investment
Income
(Loss) | | | Portfolio
Turnover
Rate(e) | |
| | | | | | | | | | | | | | | | | | | | | | | | | | | | | | |
| | (7.45 | )% | | $ | 1,612 | | | | | | 1.82 | % | | | 2.85 | % | | | | | 0.96 | % | | | 3.71 | % | | | 89 | % |
| | 7.45 | | | | 1,378 | | | | | | 2.03 | | | | 2.81 | | | | | | 0.97 | | | | 3.87 | | | | 109 | |
| | 2.47 | | | | 1,037 | | | | | | 2.16 | | | | 2.10 | | | | | | 0.97 | | | | 3.29 | | | | 176 | |
| | 7.42 | | | | 310 | | | | | | 2.44 | * | | | 1.99 | * | | | | | 0.98 | * | | | 3.46 | * | | | 116 | |
| | | | | | | | | | | | | | | | | | | | | | | | | | | | | | |
| | (8.15 | ) | | | 204 | | | | | | 2.57 | | | | 2.11 | | | | | | 1.71 | | | | 2.96 | | | | 89 | |
| | 6.74 | | | | 204 | | | | | | 2.77 | | | | 2.06 | | | | | | 1.72 | | | | 3.11 | | | | 109 | |
| | 1.94 | | | | 158 | | | | | | 2.99 | | | | 1.29 | | | | | | 1.72 | | | | 2.56 | | | | 176 | |
| | 7.10 | | | | 53 | | | | | | 2.74 | * | | | 1.41 | * | | | | | 1.72 | * | | | 2.42 | * | | | 116 | |
| | | | | | | | | | | | | | | | | | | | | | | | | | | | | | |
| | (7.72 | ) | | | 45 | | | | | | 2.07 | | | | 2.60 | | | | | | 1.21 | | | | 3.46 | | | | 89 | |
| | 7.26 | | | | 51 | | | | | | 2.26 | | | | 2.57 | | | | | | 1.22 | | | | 3.61 | | | | 109 | |
| | 2.34 | | | | 50 | | | | | | 2.31 | | | | 1.91 | | | | | | 1.22 | | | | 3.00 | | | | 176 | |
| | 7.38 | | | | 53 | | | | | | 2.24 | * | | | 1.91 | * | | | | | 1.23 | * | | | 2.92 | * | | | 116 | |
| | | | | | | | | | | | | | | | | | | | | | | | | | | | | | |
| | (7.26 | ) | | | 16,958 | | | | | | 1.57 | | | | 3.10 | | | | | | 0.71 | | | | 3.95 | | | | 89 | |
| | 7.76 | | | | 19,078 | | | | | | 1.77 | | | | 3.09 | | | | | | 0.72 | | | | 4.13 | | | | 109 | |
| | 2.86 | | | | 16,392 | | | | | | 1.81 | | | | 2.41 | | | | | | 0.72 | | | | 3.50 | | | | 176 | |
| | 7.71 | | | | 14,767 | | | | | | 1.74 | * | | | 2.41 | * | | | | | 0.73 | * | | | 3.42 | * | | | 116 | |
| (a) | Per share Net Investment Income (Loss) is calculated using the average daily shares method. | |
| (b) | Total return is the combination of changes in NAV without any sales charge, reinvested dividend income at NAV and reinvested capital gains distributions at NAV, if any. Total returns are not annualized. | |
| (c) | After fee waiver and/or expense reimbursement from the Adviser, where applicable. | |
| (d) | For the period December 2, 2011 (commencement of operations) through June 30, 2012. | |
| (e) | Portfolio Turnover Rate is calculated based on the lesser of long-term purchases or sales (as disclosed in Note 5 – Investment Transactions) divided by the average long-term market value during the period. | |
See accompanying notes to financial statements.
Financial Highlights (continued)
High Income Bond
Selected data for a share outstanding throughout each period:
| | | | | | | | | | | | | | | | | | | | | | | | | | | | | | | | | | |
| | | | |
| | | | Investment Operations | | | | | Less Distributions | | | | |
| | | | | | | | | |
Class (Commencement Date) Year Ended June 30, | | Beginning
NAV | | | Net
Investment
Income
(Loss)(a) | | | Net
Realized/
Unrealized
Gain (Loss) | | | Total | | | | | From
Net
Investment
Income | | | From
Accumulated
Net Realized
Gains | | | Total | | | Ending
NAV | |
Class A (8/01) | | | | | | | | | | | | | | | | | | | | | | | | | | | | | | | |
2015 | | $ | 9.29 | | | $ | 0.55 | | | $ | (1.00 | ) | | $ | (0.45 | ) | | | | $ | (0.54 | ) | | $ | (0.07 | ) | | $ | (0.61 | ) | | $ | 8.23 | |
2014 | | | 8.99 | | | | 0.58 | | | | 0.53 | | | | 1.11 | | | | | | (0.61 | ) | | | (0.20 | ) | | | (0.81 | ) | | | 9.29 | |
2013 | | | 8.64 | | | | 0.63 | | | | 0.39 | | | | 1.02 | | | | | | (0.67 | ) | | | — | | | | (0.67 | ) | | | 8.99 | |
2012 | | | 9.05 | | | | 0.69 | | | | (0.38 | ) | | | 0.31 | | | | | | (0.69 | ) | | | (0.03 | ) | | | (0.72 | ) | | | 8.64 | |
2011 | | | 8.28 | | | | 0.67 | | | | 0.76 | | | | 1.43 | | | | | | (0.66 | ) | | | — | | | | (0.66 | ) | | | 9.05 | |
Class C (8/01) | | | | | | | | | | | | | | | | | | | | | | | | | | | | | | | |
2015 | | | 9.27 | | |
| 0.49
|
| | | (0.99 | ) | | | (0.50 | ) | | | | | (0.48 | ) | | | (0.07 | ) | | | (0.55 | ) | | | 8.22 | |
2014 | | | 8.98 | | | | 0.51 | | | | 0.52 | | | | 1.03 | | | | | | (0.54 | ) | | | (0.20 | ) | | | (0.74 | ) | | | 9.27 | |
2013 | | | 8.62 | | | | 0.56 | | | | 0.40 | | | | 0.96 | | | | | | (0.60 | ) | | | — | | | | (0.60 | ) | | | 8.98 | |
2012 | | | 9.01 | | | | 0.63 | | | | (0.37 | ) | | | 0.26 | | | | | | (0.62 | ) | | | (0.03 | ) | | | (0.65 | ) | | | 8.62 | |
2011 | | | 8.25 | | | | 0.60 | | | | 0.75 | | | | 1.35 | | | | | | (0.59 | ) | | | — | | | | (0.59 | ) | | | 9.01 | |
Class R3 (9/01) | | | | | | | | | | | | | | | | | | | | | | | | | | | | | | | |
2015 | | | 9.48 | | | | 0.53 | | | | (1.01 | ) | | | (0.48 | ) | | | | | (0.53 | ) | | | (0.07 | ) | | | (0.60 | ) | | | 8.40 | |
2014 | | | 9.17 | | | | 0.57 | | | | 0.54 | | | | 1.11 | | | | | | (0.60 | ) | | | (0.20 | ) | | | (0.80 | ) | | | 9.48 | |
2013 | | | 8.81 | | | | 0.62 | | | | 0.40 | | | | 1.02 | | | | | | (0.66 | ) | | | — | | | | (0.66 | ) | | | 9.17 | |
2012 | | | 9.23 | | | | 0.67 | | | | (0.38 | ) | | | 0.29 | | | | | | (0.68 | ) | | | (0.03 | ) | | | (0.71 | ) | | | 8.81 | |
2011 | | | 8.44 | | | | 0.66 | | | | 0.77 | | | | 1.43 | | | | | | (0.64 | ) | | | — | | | | (0.64 | ) | | | 9.23 | |
Class I (8/01) | | | | | | | | | | | | | | | | | | | | | | | | | | | | | | | |
2015 | | | 9.31 | | | | 0.57 | | | | (0.98 | ) | | | (0.41 | ) | | | | | (0.57 | ) | | | (0.07 | ) | | | (0.64 | ) | | | 8.26 | |
2014 | | | 9.01 | | | | 0.60 | | | | 0.53 | | | | 1.13 | | | | | | (0.63 | ) | | | (0.20 | ) | | | (0.83 | ) | | | 9.31 | |
2013 | | | 8.65 | | | | 0.66 | | | | 0.39 | | | | 1.05 | | | | | | (0.69 | ) | | | — | | | | (0.69 | ) | | | 9.01 | |
2012 | | | 9.05 | | | | 0.71 | | | | (0.37 | ) | | | 0.34 | | | | | | (0.71 | ) | | | (0.03 | ) | | | (0.74 | ) | | | 8.65 | |
2011 | | | 8.29 | | | | 0.69 | | | | 0.75 | | | | 1.44 | | | | | | (0.68 | ) | | | — | | | | (0.68 | ) | | | 9.05 | |
| | | | | | | | | | | | | | | | | | | | | | | | | | | | | | |
| | | | Ratios/Supplemental Data | |
| | | | | | | | | Ratios to Average
Net Assets Before
Waiver/Reimbursement | | | | | Ratios to Average
Net Assets After
Waiver/Reimbursement(c) | | | | |
| | | | | | | | |
Total
Return(b) | | | Ending
Net
Assets
(000) | | | | | Expenses | | | Net
Investment
Income
(Loss) | | | | | Expenses | | | Net
Investment
Income
(Loss) | | | Portfolio
Turnover
Rate(d) | |
| | | | | | | | | | | | | | | | | | | | | | | | | | | | | | |
| | (4.82 | )% | | $ | 119,535 | | | | | | 0.97 | % | | | 6.31 | % | | | | | 0.97 | % | | | 6.31 | % | | | 80 | % |
| | 12.88 | | | | 209,830 | | | | | | 0.95 | | | | 6.37 | | | | | | 0.95 | | | | 6.37 | | | | 85 | |
| | 11.99 | | | | 141,132 | | | | | | 0.94 | | | | 6.92 | | | | | | 0.94 | | | | 6.92 | | | | 133 | |
| | 3.76 | | | | 92,018 | | | | | | 1.06 | | | | 7.98 | | | | | | 1.04 | | | | 7.99 | | | | 124 | |
| | 17.61 | | | | 30,984 | | | | | | 1.22 | | | | 7.38 | | | | | | 1.10 | | | | 7.50 | | | | 130 | |
| | | | | | | | | | | | | | | | | | | | | | | | | | | | | | |
| | (5.45 | ) | | | 55,409 | | | | | | 1.72 | | | | 5.62 | | | | | | 1.72 | | | | 5.62 | | | | 80 | |
| | 11.98 | | | | 71,974 | | | | | | 1.70 | | | | 5.64 | | | | | | 1.70 | | | | 5.64 | | | | 85 | |
| | 11.33 | | | | 67,466 | | | | | | 1.70 | | | | 6.21 | | | | | | 1.70 | | | | 6.21 | | | | 133 | |
| | 3.18 | | | | 48,667 | | | | | | 1.80 | | | | 7.26 | | | | | | 1.79 | | | | 7.27 | | | | 124 | |
| | 16.67 | | | | 9,792 | | | | | | 1.97 | | | | 6.64 | | | | | | 1.85 | | | | 6.76 | | | | 130 | |
| | | | | | | | | | | | | | | | | | | | | | | | | | | | | | |
| | (5.07 | ) | | | 995 | | | | | | 1.21 | | | | 6.03 | | | | | | 1.21 | | | | 6.03 | | | | 80 | |
| | 12.65 | | | | 1,099 | | | | | | 1.20 | | | | 6.09 | | | | | | 1.20 | | | | 6.09 | | | | 85 | |
| | 11.79 | | | | 697 | | | | | | 1.19 | | | | 6.69 | | | | | | 1.19 | | | | 6.69 | | | | 133 | |
| | 3.46 | | | | 615 | | | | | | 1.31 | | | | 7.66 | | | | | | 1.29 | | | | 7.68 | | | | 124 | |
| | 17.28 | | | | 309 | | | | | | 1.47 | | | | 7.12 | | | | | | 1.35 | | | | 7.25 | | | | 130 | |
| | | | | | | | | | | | | | | | | | | | | | | | | | | | | | |
| | (4.55 | ) | | | 446,406 | | | | | | 0.72 | | | | 6.56 | | | | | | 0.72 | | | | 6.56 | | | | 80 | |
| | 13.15 | | | | 719,640 | | | | | | 0.71 | | | | 6.61 | | | | | | 0.71 | | | | 6.61 | | | | 85 | |
| | 12.39 | | | | 495,863 | | | | | | 0.70 | | | | 7.24 | | | | | | 0.70 | | | | 7.24 | | | | 133 | |
| | 4.15 | | | | 465,299 | | | | | | 0.84 | | | | 8.19 | | | | | | 0.80 | | | | 8.23 | | | | 124 | |
| | 17.77 | | | | 460,785 | | | | | | 0.97 | | | | 7.63 | | | | | | 0.85 | | | | 7.75 | | | | 130 | |
| (a) | Per share Net Investment Income (Loss) is calculated using the average daily shares method. | |
| (b) | Total return is the combination of changes in NAV without any sales charge, reinvested dividend income at NAV and reinvested capital gains distributions at NAV, if any. Total returns are not annualized. | |
| (c) | After fee waiver and/or expense reimbursement from the Adviser, where applicable. As of October 31, 2013, the Adviser is no longer reimbursing the Fund for any fees and expenses. | |
| (d) | Portfolio Turnover Rate is calculated based on the lesser of long-term purchases or sales (as disclosed in Note 5 – Investment Transactions) divided by the average long-term market value during the period. | |
See accompanying notes to financial statements.
Financial Highlights (continued)
Strategic Income
Selected data for a share outstanding throughout each period:
| | | | | | | | | | | | | | | | | | | | | | | | | | | | | | | | | | |
| | | | | |
| | | | | | Investment Operations | | | | | Less Distributions | | | | |
| | | | | | | | | |
Class (Commencement Date) Year Ended June 30, | | Beginning
NAV | | | Net
Investment
Income
(Loss)(a) | | | Net
Realized/
Unrealized
Gain (Loss) | | | Total | | | | | From
Net
Investment
Income | | | From
Accumulated
Net Realized
Gains | | | Total | | | Ending
NAV | |
Class A (2/00) | | | | | | | | | | | | | | | | | | | | | | | |
2015 | | $ | 11.60 | | | $ | 0.49 | | | $ | (0.58 | ) | | $ | (0.09 | ) | | | | $ | (0.54 | ) | | $ | — | �� | | $ | (0.54 | ) | | $ | 10.97 | |
2014 | | | 11.02 | | | | 0.53 | | | | 0.59 | | | | 1.12 | | | | | | (0.54 | ) | | | — | | | | (0.54 | ) | | | 11.60 | |
2013 | | | 10.83 | | | | 0.52 | | | | 0.16 | | | | 0.68 | | | | | | (0.49 | ) | | | — | | | | (0.49 | ) | | | 11.02 | |
2012 | | | 10.72 | | | | 0.44 | | | | 0.10 | | | | 0.54 | | | | | | (0.43 | ) | | | — | | | | (0.43 | ) | | | 10.83 | |
2011 | | | 10.27 | | | | 0.43 | | | | 0.45 | | | | 0.88 | | | | | | (0.43 | ) | | | — | | | | (0.43 | ) | | | 10.72 | |
Class C (2/00) | | | | | | | | | | | | | | | | | | | | | | | |
2015 | | | 11.52 | | | | 0.40 | | | | (0.57 | ) | | | (0.17 | ) | | | | | (0.45 | ) | | | — | | | | (0.45 | ) | | | 10.90 | |
2014 | | | 10.94 | | | | 0.44 | | | | 0.60 | | | | 1.04 | | | | | | (0.46 | ) | | | — | | | | (0.46 | ) | | | 11.52 | |
2013 | | | 10.76 | | | | 0.43 | | | | 0.16 | | | | 0.59 | | | | | | (0.41 | ) | | | — | | | | (0.41 | ) | | | 10.94 | |
2012 | | | 10.65 | | | | 0.36 | | | | 0.09 | | | | 0.45 | | | | | | (0.34 | ) | | | — | | | | (0.34 | ) | | | 10.76 | |
2011 | | | 10.20 | | | | 0.35 | | | | 0.44 | | | | 0.79 | | | | | | (0.34 | ) | | | — | | | | (0.34 | ) | | | 10.65 | |
Class R3 (9/01) | | | | | | | | | | | | | | | | | | | | | | | |
2015 | | | 11.64 | | | | 0.46 | | | | (0.57 | ) | | | (0.11 | ) | | | | | (0.52 | ) | | | — | | | | (0.52 | ) | | | 11.01 | |
2014 | | | 11.05 | | | | 0.51 | | | | 0.60 | | | | 1.11 | | | | | | (0.52 | ) | | | — | | | | (0.52 | ) | | | 11.64 | |
2013 | | | 10.88 | | | | 0.49 | | | | 0.15 | | | | 0.64 | | | | | | (0.47 | ) | | | — | | | | (0.47 | ) | | | 11.05 | |
2012 | | | 10.77 | | | | 0.41 | | | | 0.10 | | | | 0.51 | | | | | | (0.40 | ) | | | — | | | | (0.40 | ) | | | 10.88 | |
2011 | | | 10.31 | | | | 0.41 | | | | 0.45 | | | | 0.86 | | | | | | (0.40 | ) | | | — | | | | (0.40 | ) | | | 10.77 | |
Class R6 (1/15) | | | | | | | | | | | | | | | | | | | | | | | | | | | | | | | | | | |
2015(f) | | | 11.22 | | | | 0.24 | | | | (0.25 | ) | | | (0.01 | ) | | | | | (0.25 | ) | | | — | | | | (0.25 | ) | | | 10.96 | |
Class I (2/00) | | | | | | | | | | | | | | | | | | | | | | | |
2015 | | | 11.59 | | | | 0.52 | | | | (0.58 | ) | | | (0.06 | ) | | | | | (0.57 | ) | | | — | | | | (0.57 | ) | | | 10.96 | |
2014 | | | 11.01 | | | | 0.56 | | | | 0.59 | | | | 1.15 | | | | | | (0.57 | ) | | | — | | | | (0.57 | ) | | | 11.59 | |
2013 | | | 10.83 | | | | 0.55 | | | | 0.15 | | | | 0.70 | | | | | | (0.52 | ) | | | — | | | | (0.52 | ) | | | 11.01 | |
2012 | | | 10.71 | | | | 0.45 | | | | 0.12 | | | | 0.57 | | | | | | (0.45 | ) | | | — | | | | (0.45 | ) | | | 10.83 | |
2011 | | | 10.26 | | | | 0.46 | | | | 0.44 | | | | 0.90 | | | | | | (0.45 | ) | | | — | | | | (0.45 | ) | | | 10.71 | |
| | | | | | | | | | | | | | | | | | | | | | | | | | | | | | |
| | | | Ratios/Supplemental Data | |
| | | | | | | | | Ratios to Average
Net Assets Before
Waiver/Reimbursement | | | | | Ratios to Average
Net Assets After
Waiver/Reimbursement(c) | | | | |
| | | | | | | | |
Total
Return(b) | | | Ending
Net
Assets
(000) | | | | | Expenses | | | Net
Investment
Income
(Loss) | | | | | Expenses | | | Net
Investment
Income
(Loss) | | | Portfolio
Turnover
Rate(d)(e) | |
| | | | | | | | | | | | | | | | | | | | | | | | | | | | | | |
| | (0.80 | )% | | $ | 288,080 | | | | | | 0.92 | % | | | 4.25 | % | | | | | 0.82 | % | | | 4.34 | % | | | 47 | % |
| | 10.46 | | | | 128,189 | | | | | | 0.91 | | | | 4.65 | | | | | | 0.84 | | | | 4.73 | | | | 50 | |
| | 6.25 | | | | 72,341 | | | | | | 0.90 | | | | 4.50 | | | | | | 0.84 | | | | 4.57 | | | | 69 | |
| | 5.14 | | | | 52,802 | | | | | | 0.93 | | | | 4.01 | | | | | | 0.85 | | | | 4.10 | | | | 199 | |
| | 8.69 | | | | 25,045 | | | | | | 1.05 | | | | 3.93 | | | | | | 0.88 | | | | 4.10 | | | | 98 | |
| | | | | | | | | | | | | | | | | | | | | | | | | | | | | | |
| | (1.50 | ) | | | 110,660 | | | | | | 1.67 | | | | 3.51 | | | | | | 1.57 | | | | 3.60 | | | | 47 | |
| | 9.59 | | | | 48,335 | | | | | | 1.66 | | | | 3.91 | | | | | | 1.59 | | | | 3.98 | | | | 50 | |
| | 5.50 | | | | 35,146 | | | | | | 1.65 | | | | 3.75 | | | | | | 1.59 | | | | 3.81 | | | | 69 | |
| | 4.32 | | | | 31,085 | | | | | | 1.67 | | | | 3.30 | | | | | | 1.60 | | | | 3.37 | | | | 199 | |
| | 7.85 | | | | 8,092 | | | | | | 1.80 | | | | 3.22 | | | | | | 1.73 | | | | 3.29 | | | | 98 | |
| | | | | | | | | | | | | | | | | | | | | | | | | | | | | | |
| | (1.01 | ) | | | 12,272 | | | | | | 1.17 | | | | 4.00 | | | | | | 1.07 | | | | 4.09 | | | | 47 | |
| | 10.19 | | | | 5,321 | | | | | | 1.16 | | | | 4.41 | | | | | | 1.09 | | | | 4.48 | | | | 50 | |
| | 5.89 | | | | 2,926 | | | | | | 1.15 | | | | 4.27 | | | | | | 1.09 | | | | 4.34 | | | | 69 | |
| | 4.83 | | | | 1,903 | | | | | | 1.19 | | | | 3.73 | | | | | | 1.12 | | | | 3.80 | | | | 199 | |
| | 8.40 | | | | 1,020 | | | | | | 1.29 | | | | 3.73 | | | | | | 1.23 | | | | 3.79 | | | | 98 | |
| | | | | | | | | | | | | | | | | | | | | | | | | | | | | | |
| | (0.10 | ) | | | 20,498 | | | | | | 0.61 | * | | | 4.70 | * | | | | | 0.50 | * | | | 4.81 | * | | | 47 | |
| | | | | | | | | | | | | | | | | | | | | | | | | | | | | | |
| | (0.54 | ) | | | 773,719 | | | | | | 0.67 | | | | 4.48 | | | | | | 0.57 | | | | 4.57 | | | | 47 | |
| | 10.77 | | | | 612,214 | | | | | | 0.66 | | | | 4.92 | | | | | | 0.59 | | | | 5.00 | | | | 50 | |
| | 6.42 | | | | 517,292 | | | | | | 0.65 | | | | 4.75 | | | | | | 0.59 | | | | 4.81 | | | | 69 | |
| | 5.35 | | | | 534,608 | | | | | | 0.69 | | | | 4.19 | | | | | | 0.63 | | | | 4.26 | | | | 199 | |
| | 8.99 | | | | 615,107 | | | | | | 0.80 | | | | 4.22 | | | | | | 0.73 | | | | 4.29 | | | | 98 | |
| (a) | Per share Net Investment Income (Loss) is calculated using the average daily shares method. | |
| (b) | Total return is the combination of changes in NAV without any sales charge, reinvested dividend income at NAV and reinvested capital gains distributions at NAV, if any. Total returns are not annualized. | |
| (c) | After fee waiver and/or expense reimbursement from the Adviser, where applicable. | |
| (d) | For fiscal years beginning after June 30, 2011, the Fund will no longer exclude dollar roll transactions, where applicable. | |
| (e) | Portfolio Turnover Rate is calculated based on the lesser of long-term purchases or sales (as disclosed in Note 5 – Investment Transactions) divided by the average long-term market value during the period. | |
| (f) | For the period January 20, 2015 (commencement of operations) through June 30, 2015. | |
See accompanying notes to financial statements.
Financial Highlights (continued)
U.S. Infrastructure Bond
Selected data for a share outstanding throughout each period:
| | | | | | | | | | | | | | | | | | | | | | | | | | | | | | | | | | |
| | | | | |
| | | | | | Investment Operations | | | | | Less Distributions | | | | |
| | | | | | | | | |
Class (Commencement Date) Year Ended June 30, | | Beginning
NAV | | | Net
Investment
Income
(Loss)(a) | | | Net
Realized/
Unrealized
Gain (Loss) | | | Total | | | | | From
Net
Investment
Income | | | From
Accumulated
Net Realized
Gains | | | Total | | | Ending
NAV | |
Class A (5/14) | | | | | | | | | | | | | | | | | | | | | | | |
2015 | | $ | 20.32 | | | $ | 0.78 | | | $ | (0.63 | ) | | $ | 0.15 | | | | | $ | (0.82 | ) | | $ | — | | | $ | (0.82 | ) | | $ | 19.65 | |
2014(d) | | | 20.00 | | | | 0.09 | | | | 0.30 | | | | 0.39 | | | | | | (0.07 | ) | | | — | | | | (0.07 | ) | | | 20.32 | |
Class C (5/14) | | | | | | | | | | | | | | | | | | | | | | | |
2015 | | | 20.31 | | | | 0.62 | | | | (0.62 | ) | | | — | | | | | | (0.66 | ) | | | — | | | | (0.66 | ) | | | 19.65 | |
2014(d) | | | 20.00 | | | | 0.07 | | | | 0.29 | | | | 0.36 | | | | | | (0.05 | ) | | | — | | | | (0.05 | ) | | | 20.31 | |
Class I (5/14) | | | | | | | | | | | | | | | | | | | | | | | |
2015 | | | 20.32 | | | | 0.83 | | | | (0.62 | ) | | | 0.21 | | | | | | (0.88 | ) | | | — | | | | (0.88 | ) | | | 19.65 | |
2014(d) | | | 20.00 | | | | 0.10 | | | | 0.29 | | | | 0.39 | | | | | | (0.07 | ) | | | — | | | | (0.07 | ) | | | 20.32 | |
| | | | | | | | | | | | | | | | | | | | | | | | | | | | | | |
| | | | Ratios/Supplemental Data | |
| | | | | | | | | Ratios to Average
Net Assets Before
Waiver/Reimbursement | | | | | Ratios to Average
Net Assets After
Waiver/Reimbursement(c) | | | | |
| | | | | | | | |
Total
Return(b) | | | Ending
Net
Assets
(000) | | | | | Expenses | | | Net
Investment
Income
(Loss) | | | | | Expenses | | | Net
Investment
Income
(Loss) | | | Portfolio
Turnover
Rate(e) | |
| | | | | | | | | | | | | | | | | | | | | | | | | | | | | | |
| | 0.70 | % | | $ | 255 | | | | | | 1.79 | % | | | 3.04 | % | | | | | 0.95 | % | | | 3.87 | % | | | 15 | % |
| | 1.93 | | | | 51 | | | | | | 3.46 | * | | | 0.77 | * | | | | | 0.96 | * | | | 3.27 | * | | | 4 | |
| | | | | | | | | | | | | | | | | | | | | | | | | | | | | | |
| | (0.03 | ) | | | 73 | | | | | | 2.51 | | | | 2.27 | | | | | | 1.70 | | | | 3.08 | | | | 15 | |
| | 1.81 | | | | 51 | | | | | | 4.20 | * | | | 0.03 | * | | | | | 1.71 | * | | | 2.52 | * | | | 4 | |
| | | | | | | | | | | | | | | | | | | | | | | | | | | | | | |
| | 0.96 | | | | 7,825 | | | | | | 1.50 | | | | 3.27 | | | | | | 0.70 | | | | 4.07 | | | | 15 | |
| | 1.95 | | | | 7,011 | | | | | | 3.20 | * | | | 1.03 | * | | | | | 0.71 | * | | | 3.52 | * | | | 4 | |
| (a) | Per share Net Investment Income (Loss) is calculated using the average daily shares method. | |
| (b) | Total return is the combination of changes in NAV without any sales charge, reinvested dividend income at NAV and reinvested capital gains distributions at NAV, if any. Total returns are not annualized. | |
| (c) | After fee waiver and/or expense reimbursement from the Adviser, where applicable. | |
| (d) | For the period May 12, 2014 (commencement of operations) through June 30, 2014. | |
| (e) | Portfolio Turnover Rate is calculated based on the lesser of long-term purchases or sales (as disclosed in Note 5 – Investment Transactions) divided by the average long-term market value during the period. | |
See accompanying notes to financial statements.
Notes to
Financial Statements
1. General Information and Significant Accounting Policies
General Information
Trust and Fund Information
Nuveen Investment Funds, Inc. and Nuveen Investment Trust (each a “Trust” and collectively, the “Trusts”), are open-end management investment companies registered under the Investment Company Act of 1940, as amended. Nuveen Investment Funds, Inc. is comprised of the Nuveen High Income Bond Fund (“High Income Bond”) and Nuveen Strategic Income Fund (“Strategic Income”) and Nuveen Investment Trust is comprised of the Nuveen Global Total Return Bond Fund (“Global Total Return Bond”) and Nuveen U.S. Infrastructure Bond Fund (“U.S. Infrastructure Bond”) formerly Nuveen U.S. Infrastructure Income Fund (each a “Fund” and collectively, the “Funds”), as diversified funds, among others. Nuveen Investment Funds, Inc. was incorporated in the state of Maryland on August 20, 1987. Nuveen Investment Trust was organized as a Massachusetts business trust in May 6, 1996.
The end of the reporting period for the Funds is June 30, 2015, and the period covered by these Notes to Financial Statements is the fiscal year ended June 30, 2015 (“the current fiscal period”).
Investment Adviser
The Funds’ investment adviser is Nuveen Fund Advisors, LLC (the “Adviser”), a wholly-owned subsidiary of Nuveen Investments, Inc. (“Nuveen”). The Adviser is responsible for each Fund’s overall investment strategy and asset allocation decisions. The Adviser has entered into sub-advisory agreements with Nuveen Asset Management, LLC (the “Sub-Adviser”), a subsidiary of the Adviser, under which the Sub-Adviser manages the investment portfolios of the Funds.
Investment Objectives and Principal Investment Strategies
Global Total Return Bond
Global Total Return Bond’s investment objective is to seek total return. Under normal market conditions, the Fund invests at least 80% of the sum of its net assets and the amount of any borrowings for investment purposes, in bonds from issuers located around the world. The bonds in which the Fund may invest may be of any maturity and include: debt obligations of foreign governments; domestic and foreign corporate debt obligations, including obligations issued by special-purpose entities that are backed by corporate debt obligations; U.S. government securities (securities issued or guaranteed by the U.S. government or its agencies or instrumentalities); residential and commercial mortgage-backed securities; and asset-backed securities.
Under normal market conditions, the Fund invests at least 40% of its net assets in non-U.S. issuers and is invested in issuers located in at least three countries (including the U.S.). The Fund may invest in debt obligations issued by governmental and corporate issuers located in emerging markets countries.
The Fund invests in securities that are U.S. dollar-denominated and in securities that are denominated in foreign currencies. As described in more detail below, the Fund may utilize various currency-related derivatives in an effort to enhance the Fund’s total return or to manage risk.
Up to 30% of the Fund’s net assets may be invested in securities rated lower than investment grade or in unrated securities of comparable quality as determined by the Sub-Adviser (such securities commonly referred to as “high yield” securities or “junk” bonds). If the rating of a security is reduced or the credit quality of an unrated security declines after purchase, the Fund is not required to sell the security, but may consider doing so.
The Fund may utilize the following derivatives: options; futures contracts; options on futures contracts; interest rate caps, collars, and floors; foreign currency contracts; options on foreign currencies; swap agreements, including swap agreements on interest rates, currency rates, security indexes and specific securities, and credit default swap agreements; and options on foregoing types of swap agreements. The Fund may enter into standardized derivatives contracts traded on domestic or foreign securities exchanges, boards of trade, or similar entities, and non-standardized derivatives contracts traded in the over-the-counter (“OTC”) market. The Fund may use these derivatives in an attempt to manage market risk, currency risk, credit risk and yield curve risk, to manage the effective maturity or duration of securities in the Fund’s portfolio or for speculative purposes in an effort to enhance returns. The Fund may also use derivatives to gain exposure to non-dollar denominated securities markets to the extent it does not do so through direct investments. The use of a derivative is speculative if the Fund is primarily seeking to enhance returns, rather than offset the risk of other positions. The Fund may not use any derivative to gain exposure to a security or type of security that it would be prohibited by its investment restrictions from purchasing directly.
High Income Bond
High Income Bond’s investment objective is to provide investors with a high level of current income. Under normal market conditions, the Fund invests at least 80% of the sum of its net assets and the amount of any borrowings for investment purposes in bonds rated lower than investment grade at the time of purchase or in unrated bonds of comparable quality (securities commonly referred to as “high-yield” securities or “junk” bonds). These bonds generally provide high income in an effort to compensate investors for their higher risk of default, which is the failure to make required interest or principal payments. High-yield bond issuers include small or relatively new companies lacking the history or capital to merit investment-grade status, former blue chip companies downgraded because of financial problems, companies electing to borrow heavily to finance or avoid a takeover or buyout, and firms with heavy debt loads. The Fund may invest up to 20% of its net assets in fixed and floating rate loans, including senior loans and secured and unsecured junior loans. The Fund may invest in exchange-traded funds (“ETFs”), closed-end funds and other investment companies.
There is no minimum rating requirement and no limitation on the average maturity or average effective duration of securities held by the Fund.
The Fund may invest without limitation in debt obligations of foreign corporations and governments, provided that no more than 20% of the Fund’s total assets may be invested in debt obligations issued by governmental and corporate issuers that are located in emerging market countries. A country is considered to have an “emerging market” if it has a relatively low gross national product per capita compared to the world’s major economies, and the potential for rapid economic growth, provided that no issuer included in the Fund’s current benchmark index will be considered to be located in an emerging market country.
The Fund may utilize the following derivatives: options; futures contracts; options on futures contracts; foreign currency contracts; options on foreign currencies; swap agreements, including interest rate swaps, currency swaps, total return swaps, and credit default swaps; and options on swap agreements. The Fund may use these derivatives in an attempt to manage market risk, currency risk, credit risk and yield curve risk, to manage the effective maturity or duration of securities in the Fund’s portfolio or for speculative purposes in an effort to increase the Fund’s yield or to enhance returns. The use of a derivative is speculative if the Fund is primarily seeking to enhance returns, rather than offset the risk of other positions.
Strategic Income
Strategic Income’s investment objective is to provide investors with total return. Under normal market conditions, the Fund invests at least 80% of the sum of its net assets and the amount of any borrowings for investment purposes in debt securities, including U.S. government securities (securities issued or guaranteed by the U.S. government or its agencies or instrumentalities), residential and commercial mortgage-backed securities, asset-backed securities, domestic and foreign corporate debt obligations, including obligations issued by special-purpose entities that are backed by corporate debt obligations and debt obligations of foreign governments. The Fund may invest in fixed and floating rate loans, including senior loans and secured and unsecured junior loans, in an amount not to exceed 20% of the Fund’s net assets and municipal securities in an amount not to exceed 20% of net assets.
The Fund may invest up to 30% of its total assets in non-U.S. dollar denominated debt obligations of foreign corporations and governments, including debt obligations issued by governmental and corporate issuers that are located in emerging market countries. The Fund may invest without limitation in U.S. dollar denominated securities of foreign issuers.
The Fund may invest up to 50% of its total assets in securities rated lower than investment grade or unrated securities of comparable quality as determined by the Sub-Adviser (securities commonly referred to as “high yield” securities or “junk” bonds). The Fund will not invest in securities rated lower than CCC at the time of purchase or in unrated securities of comparable quality as determined by the Sub-Adviser. If the rating of a security is reduced or the credit quality of an unrated security declines after purchase, the Fund is not required to sell the security, but may consider doing so. Unrated securities will not exceed 25% of the Fund’s total assets.
To generate additional income, the Fund may invest up to 25% of its total assets in dollar roll transactions. In a dollar roll transaction, the Fund sells mortgage-backed securities for delivery in the current month while contracting with the same party to repurchase similar securities at a future date.
Under normal market conditions the Fund attempts to maintain a weighted average effective maturity for its portfolio securities of fifteen years or less and an average effective duration of three to eight years. The Fund’s weighted average effective maturity and average effective duration are measures of how the value of the Fund’s shares may react to interest rate changes.
The Fund may utilize the following derivatives: options; futures contracts; options on futures contracts; interest rate caps, collars, and floors; foreign currency contracts; options on foreign currencies; swap agreements, including swap agreements on interest rates, currency rates, security indexes and specific securities, and credit default swap agreements; and options on the foregoing types of swap agreements. The Fund may enter into standardized derivatives contracts traded on domestic or foreign securities exchanges, boards of trade, or similar entities, and non-standardized derivatives contracts traded in the OTC market. The Fund may use these derivatives in an attempt to manage market risk, currency risk, credit risk and yield curve risk, to manage the effective maturity or duration of securities in the Fund’s portfolio or for speculative purposes in an effort to increase the Fund’s yield or to enhance returns. The Fund may also use derivatives to gain exposure to non-dollar denominated securities markets to the extent it does not do so through direct investments. The use of a derivative is speculative if the Fund is primarily seeking to enhance returns, rather than offset the risk of other positions. The Fund may not use any derivative to gain exposure to a security or type of security that it would be prohibited by its investment restrictions from purchasing directly.
Notes to Financial Statements (continued)
U.S. Infrastructure Bond
Effective February 28, 2015, the Nuveen U.S. Infrastructure Income Fund was renamed the Nuveen U.S. Infrastructure Bond Fund. U.S. Infrastructure Bond’s investment objective is to seek current income consistent with limited risk to capital. Under normal market conditions, the Fund invests at least 80% of the sum of its net assets and the amount of any borrowings for investment purposes in infrastructure-related debt securities of U.S. issuers. Such securities include taxable and tax-exempt municipal bonds issued to finance the ownership, development, construction, renovation or operation of infrastructure assets and debt securities issued by, or loans issued to, infrastructure-related companies, which include companies involved in the ownership, development, construction, renovation, financing or operation of infrastructure assets, or that provide the services and raw materials necessary for the construction and maintenance of infrastructure assets.
Infrastructure assets are the physical structures and networks upon which the operation, growth and development of a community depends, which include water, sewer, and energy utilities; transportation and communication networks; health care facilities, schools, government accommodations and other public service facilities; and shipping, timber, steel, alternative energy, and other resources and services necessary for the construction and maintenance of these physical structures and networks.
Municipal bonds in which the Fund invests include obligations issued by U.S. states and their subdivisions, authorities, instrumentalities and corporations, as well as obligations issued by U.S. territories (such as Puerto Rico, the U.S. Virgin Islands and Guam). The Fund may invest in all types of municipal bonds including general obligation bonds, revenue bonds and participation interests in municipal leases. The Fund may invest in zero coupon bonds, which are issued at substantial discounts from their value at maturity and pay no cash income to their holders until they mature.
The Fund does not seek to provide income exempt from federal income tax. The Fund may invest in both taxable and tax-exempt municipal bonds. The Fund does not anticipate investing in tax-exempt bonds to the extent that its dividends will qualify as “exempt-interest dividends” and, as a result, it is expected that the Fund’s dividends will be taxable.
Other debt securities in which the Fund may invest include corporate debt obligations, including obligations issued by special-purpose entities that are backed by corporate debt obligations, fixed and floating rate loans, including senior loans and secured and unsecured junior loans. For the period July 1, 2014 through February 28, 2015, the Fund may have invested in convertible bonds and preferred securities.
The Fund may invest up to 20% of its total assets in debt obligations of non-U.S. issuers, including debt obligations issued by issuers that are located in emerging market countries.
The Fund may invest up to 40% of its net assets in securities rated below investment grade or, if unrated, judged by the Sub-Adviser to be of comparable quality. Such securities are commonly referred to as “high yield” securities or “junk” bonds.
The Fund is not subject to any formal restrictions on its average portfolio maturity or duration, or on the duration or maturity of the individual securities in which it invests. However, the Fund generally invests in longer term bonds which are more sensitive to interest rate risk.
The Fund may invest up to 15% of its net assets in securities whose interest payments vary inversely with changes in short-term interest rates (“inverse floaters”). Inverse floaters are derivative securities that provide leveraged exposure to underlying bonds. The Fund’s investments in inverse floaters are designed to increase the Fund’s income and returns through this leveraged exposure. These investments are speculative, however, and also create the possibility that income and returns will be diminished.
The Fund may utilize the following derivatives: options; futures contracts; options on futures contracts; interest rate caps, collars, and floors; foreign currency contracts; options on foreign currencies; swap agreements, including swap agreements on interest rates, currency rates, security indexes and specific securities, and credit default swap agreements; and options on the foregoing types of swap agreements. The Fund may enter into standardized derivatives contracts traded on domestic or foreign securities exchanges, boards of trade, or similar entities, and non-standardized derivatives contracts traded in the OTC market. The Fund may use these derivatives in an attempt to manage market risk, currency risk, credit risk and yield curve risk, to manage the effective maturity or duration of securities in the Fund’s portfolio or for speculative purposes in an effort to increase the Fund’s yield or to enhance returns. The use of a derivative is speculative if the Fund is primarily seeking to enhance returns, rather than offset the risk of other positions.
The Funds’ most recent prospectus provides further descriptions of each Fund’s investment objective, principal investment strategies and principal risks.
Class R6 Shares
Strategic Income began offering Class R6 Shares on January 20, 2015.
Significant Accounting Policies
Each Fund is an investment company and follows accounting and reporting guidance under Financial Accounting Standards Board (FASB) Accounting Standards Codification (ASC) Topic 946 “Financial Services – Investment Companies.” The following is a summary of significant accounting policies followed by the Funds in the preparation of their financial statements in accordance with accounting principles generally accepted in the United States (“U.S. GAAP”).
Investment Transactions
Investment transactions are recorded on a trade date basis. Trade date for senior and subordinated loans purchased in the “primary market” is considered the date on which loan allocations are determined. Trade date for senior and subordinated loans purchased in the “secondary market” is the date on which the transaction is entered into. Realized gains and losses from investment transactions are determined on the specific identification method, which is the same basis used for federal income tax purposes. Investments purchased on a when-issued/delayed delivery basis may have extended settlement periods. Any investments so purchased are subject to market fluctuation during this period. The Funds have earmarked securities in their portfolios with a current value at least equal to the amount of the when-issued/delayed delivery purchase commitments.
As of the end of the reporting period, the following Funds’ outstanding when-issued/delayed delivery purchase commitments were as follows:
| | | | | | | | | | | | |
| | | Global Total
Return
Bond | | | High Income
Bond | | | Strategic
Income | |
| Outstanding when-issued/delayed delivery purchase commitments | | $ | 722,113 | | | $ | 2,959,500 | | | $ | 9,225,000 | |
Investment Income
Dividend income is recorded on the ex-dividend date or, for foreign securities, when information is available. Interest income, which reflects the amortization of premiums and includes accretion of discounts for financial reporting purposes, is recorded on an accrual basis. Interest income also reflects pay down gains and losses, if any. Fee income consists primarily of amendment fees. Amendment fees are earned as compensation for evaluating and accepting changes to an original senior loan agreement and are recognized when received. Fee income and amendment fees, if any, are recognized as a component of “Interest income” on the Statement of Operations. Securities lending income is comprised of fees earned from borrowers and income earned on cash collateral investments, net of lending agent fees.
Professional Fees
Professional fees presented on the Statement of Operations consist of legal fees incurred in the normal course of operations, audit fees, tax consulting fees and, in some cases, workout expenditures. Workout expenditures are incurred in an attempt to protect or enhance an investment, or to pursue other claims or legal actions on behalf of Fund shareholders. If a refund is received for workout expenditures paid in a prior reporting period, such amounts will be recognized as “Legal fee refund” on the Statement of Operations.
Dividends and Distributions to Shareholders
Dividends from net investment income are declared daily and distributed to shareholders monthly. Fund shares begin to accrue dividends on the business day after the day when the monies used to purchase Fund shares are collected by the transfer agent.
Net realized capital gains from investment transactions, if any, are declared and distributed to shareholders at least annually. Furthermore, capital gains are distributed only to the extent they exceed available capital loss carryforwards.
Distributions to shareholders are recorded on the ex-dividend date. The amount and timing of distributions are determined in accordance with federal income tax regulations, which may differ from U.S. GAAP.
Share Classes and Sales Charges
Class A Shares are generally sold with an up-front sales charge and incur a 0.25% annual 12b-1 service fee. Class A Share purchases of the Funds of $1 million or more are sold at net asset value (“NAV”) without an up-front sales charge. Class A Share purchases may be subject to a contingent deferred sales charge (“CDSC”) if redeemed within eighteen months of purchase. Class C Shares are sold without an up-front sales charge but incur a 0.75% annual 12b-1 distribution fee and a 0.25% annual 12b-1 service fee. Class C Shares are subject to a CDSC of 1% if redeemed within twelve months of purchase. Class R3 Shares are sold without an up-front sales charge but incur a 0.25% annual 12b-1 distribution fee and a 0.25% annual 12b-1 service fee. Class R6 and Class I Shares are not subject to any sales charge or 12b-1 distribution or service fees.
Multiclass Operations and Allocations
Income and expenses of the Funds that are not directly attributable to a specific class of shares are prorated among the classes based on the relative settled shares of each class. Currently, the only expenses that are allocated on a class-specific basis are 12b-1 distribution and shareholder service fees.
Sub-transfer agent fees, which are recognized as a component of “Shareholder servicing agent fees” on the Statement of Operations, are not charged to Class R6 Shares and are prorated among the other classes based on their relative net assets.
Realized and unrealized capital gains and losses of the Funds are prorated among the classes based on the relative net assets of each class.
Indemnifications
Under each Trust’s organizational documents, its officers and directors/trustees are indemnified against certain liabilities arising out of the performance of their duties to each Trust. In addition, in the normal course of business, each Trust enters into contracts that provide general indemnifications to other
Notes to Financial Statements (continued)
parties. Each Trust’s maximum exposure under these arrangements is unknown as this would involve future claims that may be made against each Trust that have not yet occurred. However, each Trust has not had prior claims or losses pursuant to these contracts and expects the risk of loss to be remote.
Netting Agreements
In the ordinary course of business, the Funds may enter into transactions subject to enforceable master repurchase agreements (Global Total Return Bond and U.S. Infrastructure Bond only), International Swaps and Derivative Association, Inc. (“ISDA”) master agreements or other similar arrangements (“netting agreements”). Generally, the right to offset in netting agreements allows each Fund to offset certain securities and derivatives with a specific counterparty as well as any collateral received or delivered to that counterparty based on the terms of the agreements. Generally, each Fund manages its cash collateral and securities collateral on a counterparty basis.
The Funds’ investments subject to netting agreements as of the end of the reporting period, if any, are further described in Note 3 – Portfolio Securities and Investments in Derivatives.
Use of Estimates
The preparation of financial statements in conformity with U.S. GAAP requires management to make estimates and assumptions that affect the reported amounts of assets and liabilities at the date of the financial statements and the reported amounts of increases and decreases in net assets from operations during the reporting period. Actual results may differ from those estimates.
2. Investment Valuation and Fair Value Measurements
The fair valuation input levels as described below are for fair value measurement purposes.
Fair value is defined as the price that would be received upon selling an investment or transferring a liability in an orderly transaction to an independent buyer in the principal or most advantageous market for the investment. A three-tier hierarchy is used to maximize the use of observable market data and minimize the use of unobservable inputs and to establish classification of fair value measurements for disclosure purposes. Observable inputs reflect the assumptions market participants would use in pricing the asset or liability. Observable inputs are based on market data obtained from sources independent of the reporting entity. Unobservable inputs reflect the reporting entity’s own assumptions about the assumptions market participants would use in pricing the asset or liability. Unobservable inputs are based on the best information available in the circumstances. The following is a summary of the three-tiered hierarchy of valuation input levels.
| | |
| Level 1 – | | Inputs are unadjusted and prices are determined using quoted prices in active markets for identical securities. |
| Level 2 – | | Prices are determined using other significant observable inputs (including quoted prices for similar securities, interest rates, prepayment speeds, credit risk, etc.). |
| Level 3 – | | Prices are determined using significant unobservable inputs (including management’s assumptions in determining the fair value of investments). |
Common stocks and other equity-type securities are valued at the last sales price on the securities exchange on which such securities are primarily traded and are generally classified as Level 1. Securities primarily traded on the NASDAQ National Market (“NASDAQ”) are valued at the NASDAQ Official Closing Price and are generally classified as Level 1. However, securities traded on a securities exchange or NASDAQ for which there were no transactions on a given day or securities not listed on a securities exchange or NASDAQ are valued at the quoted bid price and are generally classified as Level 2.
ETFs are valued at the last sales price on the securities exchange on which such securities are primarily traded and are generally classified as Level 1.
Investments in investment companies are valued at their respective NAV on valuation date and are generally classified as Level 1.
Prices of fixed-income securities are provided by a pricing service approved by the Funds’ Board of Directors/Trustees (the “Board”). The pricing service establishes a security’s fair value using methods that may include consideration of the following: yields or prices of investments of comparable quality, type of issue, coupon, maturity and rating, market quotes or indications of value from security dealers, evaluations of anticipated cash flows or collateral, general market conditions and other information and analysis, including the obligor’s credit characteristics considered relevant. These securities are generally classified as Level 2. In pricing certain securities, particularly less liquid and lower quality securities, the pricing service may consider information about a security, its issuer, or market activity provided by the Adviser. These securities are generally classified as Level 2 or Level 3 depending on the priority of the significant inputs.
Prices of forward foreign currency exchange contracts and swap contracts are also priced by a pricing service approved by the Board using the same methods as described above, and are generally classified as Level 2.
Investments initially valued in currencies other than the U.S. dollar are converted to the U.S. dollar using exchange rates obtained from pricing services. As a result, the NAV of the Funds’ shares may be affected by changes in the value of currencies in relation to the U.S. dollar. The value of securities traded in markets outside the United States or denominated in currencies other than the U.S. dollar may be affected significantly on a day that the New York Stock Exchange (NYSE) is closed and an investor is not able to purchase, redeem or exchange shares. If significant market events occur between the time of determination of the closing price of a foreign security on an exchange and the time that the Funds’ NAV is determined, or if under the
Funds’ procedures, the closing price of a foreign security is not deemed to be reliable, the security would be valued at fair value as determined in accordance with procedures established in good faith by the Board. These securities are generally classified as Level 2 or Level 3 depending on the priority of the significant inputs.
The value of exchange-traded options are based on the mean of the closing bid and ask prices. Futures contracts are valued using the closing settlement price or, in the absence of such a price, the last traded price. Exchange-traded options and futures contracts are generally classified as Level 1. Options traded in the OTC market are valued using an evaluated mean price and are generally classified as Level 2.
Repurchase agreements are valued at contract amount plus accrued interest, which approximates market value. These securities are generally classified as Level 2.
Certain securities may not be able to be priced by the pre-established pricing methods as described above. Such securities may be valued by the Board and/or its appointee at fair value. These securities generally include, but are not limited to, restricted securities (securities which may not be publicly sold without registration under the Securities Act of 1933, as amended) for which a pricing service is unable to provide a market price; securities whose trading has been formally suspended; debt securities that have gone into default and for which there is no current market quotation; a security whose market price is not available from a pre-established pricing source; a security with respect to which an event has occurred that is likely to materially affect the value of the security after the market has closed but before the calculation of a Fund’s NAV (as may be the case in non-U.S. markets on which the security is primarily traded) or make it difficult or impossible to obtain a reliable market quotation; and a security whose price, as provided by the pricing service, is not deemed to reflect the security’s fair value. As a general principle, the fair value of a security would appear to be the amount that the owner might reasonably expect to receive for it in a current sale. A variety of factors may be considered in determining the fair value of such securities, which may include consideration of the following: yields or prices of investments of comparable quality, type of issue, coupon, maturity and rating, market quotes or indications of value from security dealers, evaluations of anticipated cash flows or collateral, general market conditions and other information and analysis, including the obligor’s credit characteristics considered relevant. These securities are generally classified as Level 2 or Level 3 depending on the priority of the significant inputs. Regardless of the method employed to value a particular security, all valuations are subject to review by the Board and/or its appointee.
The inputs or methodologies used for valuing securities are not an indication of the risks associated with investing in those securities. The following is a summary of each Fund’s fair value measurements as of the end of the reporting period:
| | | | | | | | | | | | | | | | |
| Global Total Return Bond | | Level 1 | | | Level 2 | | | Level 3 | | | Total | |
| Long-Term Investments*: | | | | | | | | | | | | | | | | |
Convertible Preferred Securities | | $ | 83,400 | | | $ | — | | | $ | — | | | $ | 83,400 | |
$25 Par (or similar) Retail Preferred | | | 315,301 | | | | — | | | | — | | | | 315,301 | |
Corporate Bonds** | | | — | | | | 9,664,256 | | | | — | **** | | | 9,664,256 | |
Convertible Bonds | | | — | | | | 21,248 | | | | — | | | | 21,248 | |
$1,000 Par (or similar) Institutional Preferred | | | — | | | | 912,743 | | | | — | | | | 912,743 | |
Asset-Backed and Mortgage-Backed Securities | | | — | | | | 901,573 | | | | — | | | | 901,573 | |
Sovereign Debt | | | — | | | | 6,657,637 | | | | — | | | | 6,657,637 | |
| Short-Term Investments: | | | | | | | | | | | | | | | | |
Repurchase Agreements | | | — | | | | 802,879 | | | | — | | | | 802,879 | |
| Investments in Derivatives: | | | | | | | | | | | | | | | | |
Forward Foreign Currency Exchange Contracts*** | | | — | | | | (107,228 | ) | | | — | | | | (107,228 | ) |
Interest Rate Swaps*** | | | — | | | | (1,248 | ) | | | — | | | | (1,248 | ) |
Futures Contracts*** | | | 22,821 | | | | — | | | | — | | | | 22,821 | |
| Total | | $ | 421,522 | | | $ | 18,851,860 | | | $ | — | **** | | $ | 19,273,382 | |
| * | Refer to the Fund’s Portfolio of Investments for industry and country classifications, where applicable. |
| ** | Refer to the Fund’s Portfolio of Investments for a breakdown of these securities classified as Level 3. |
| *** | Represents net unrealized appreciation (depreciation) as reported in the Fund’s Portfolio of Investments. |
| **** | Value equals zero as of the end of the reporting period. |
Notes to Financial Statements (continued)
| | | | | | | | | | | | | | | | |
| High Income Bond | | Level 1 | | | Level 2 | | | Level 3 | | | Total | |
| Long-Term Investments*: | | | | | | | | | | | | | | | | |
Common Stocks** | | $ | 4,653,995 | | | $ | 74,176 | | | $ | 63,795 | | | $ | 4,791,966 | |
Exchange-Traded Funds | | | 6,947,510 | | | | — | | | | — | | | | 6,947,510 | |
Convertible Preferred Securities | | | 5,020,635 | | | | — | | | | — | | | | 5,020,635 | |
Variable Rate Senior Loan Interests | | | — | | | | 32,478,218 | | | | — | | | | 32,478,218 | |
$25 Par (or similar) Retail Preferred | | | 30,366,462 | | | | — | | | | — | | | | 30,366,462 | |
Corporate Bonds** | | | — | | | | 499,954,663 | | | | — | **** | | | 499,954,663 | |
Convertible Bonds | | | — | | | | 1,996,638 | | | | — | | | | 1,996,638 | |
$1,000 Par (or similar) Institutional Preferred | | | — | | | | 26,814,619 | | | | — | | | | 26,814,619 | |
Asset-Backed Securities | | | — | | | | 1,363 | | | | — | | | | 1,363 | |
Investment Companies | | | 13,112,589 | | | | — | | | | — | | | | 13,112,589 | |
Warrants** | | | — | | | | 335 | | | | 9,962 | | | | 10,297 | |
| Investments Purchased with Collateral from Securities Lending | | | 104,213,543 | | | | — | | | | — | | | | 104,213,543 | |
| Short-Term Investments: | | | | | | | | | | | | | | | | |
Money Market Funds | | | 6,916,507 | | | | — | | | | — | | | | 6,916,507 | |
| Investments in Derivatives: | | | | | | | | | | | | | | | | |
Forward Foreign Currency Exchange Contracts*** | | | — | | | | 173,118 | | | | — | | | | 173,118 | |
Interest Rate Swaps*** | | | — | | | | (250,790 | ) | | | — | | | | (250,790 | ) |
Futures Contracts*** | | | (275,517 | ) | | | — | | | | — | | | | (275,517 | ) |
| Total | | $ | 170,955,724 | | | $ | 561,242,340 | | | $ | 73,757 | | | $ | 732,271,821 | |
| | | | |
| Strategic Income | | | | | | | | | | | | |
| Long-Term Investments*: | | | | | | | | | | | | | | | | |
Common Stocks** | | $ | — | | | $ | — | | | $ | 5,993 | | | $ | 5,993 | |
Convertible Preferred Securities | | | 1,199,100 | | | | — | | | | — | | | | 1,199,100 | |
Variable Rate Senior Loan Interests | | | — | | | | 16,275,904 | | | | — | | | | 16,275,904 | |
$25 Par (or similar) Retail Preferred** | | | 19,114,255 | | | | 4,194,400 | | | | — | | | | 23,308,655 | |
Corporate Bonds** | | | — | | | | 865,906,028 | | | | — | **** | | | 865,906,028 | |
$1,000 Par (or similar) Institutional Preferred | | | — | | | | 84,677,348 | | | | — | | | | 84,677,348 | |
Asset-Backed and Mortgage-Backed Securities | | | — | | | | 59,206,876 | | | | — | | | | 59,206,876 | |
Investment Companies | | | 774,520 | | | | — | | | | — | | | | 774,520 | |
Sovereign Debt | | | — | | | | 126,083,140 | | | | — | | | | 126,083,140 | |
| Investments Purchased with Collateral from Securities Lending | | | 146,196,005 | | | | — | | | | — | | | | 146,196,005 | |
| Short-Term Investments: | | | | | | | | | | | | | | | | |
Money Market Funds | | | 18,215,453 | | | | — | | | | — | | | | 18,215,453 | |
| Investments in Derivatives: | | | | | | | | | | | | | | | | |
Forward Foreign Currency Exchange Contracts*** | | | — | | | | 607,260 | | | | — | | | | 607,260 | |
Interest Rate Swaps*** | | | — | | | | (1,829,614 | ) | | | — | | | | (1,829,614 | ) |
Futures Contracts*** | | | (403,781 | ) | | | — | | | | — | | | | (403,781 | ) |
| Total | | $ | 185,095,552 | | | $ | 1,155,121,342 | | | $ | 5,993 | | | $ | 1,340,222,887 | |
| | | | |
| U.S. Infrastructure Bond | | | | | | | | | | | | |
| Long-Term Investments*: | | | | | | | | | | | | | | | | |
Corporate Bonds | | $ | — | | | $ | 3,007,361 | | | $ | — | | | $ | 3,007,361 | |
Municipal Bonds | | | — | | | | 4,999,259 | | | | — | | | | 4,999,259 | |
| Investments in Derivatives: | | | | | | | | | | | | | | | | |
Futures Contracts*** | | | 29,296 | | | | — | | | | — | | | | 29,296 | |
| Total | | $ | 29,296 | | | $ | 8,006,620 | | | $ | — | | | $ | 8,035,916 | |
| * | Refer to the Fund’s Portfolio of Investments for industry, state and country classifications, where applicable. |
| ** | Refer to the Fund’s Portfolio of Investments for a breakdown of these securities classified as Level 2 and/or Level 3, where applicable. |
| *** | Represents net unrealized appreciation (depreciation) as reported in the Fund’s Portfolio of Investments. |
| **** | Value equals zero as of the end of the reporting period. |
The Board is responsible for the valuation process and has delegated the oversight of the daily valuation process to the Adviser’s Valuation Committee. The Valuation Committee, pursuant to the valuation policies and procedures adopted by the Board, is responsible for making fair value determinations, evaluating the effectiveness of the Funds’ pricing policies and reporting to the Board. The Valuation Committee is aided in its efforts by the Adviser’s dedicated Securities Valuation Team, which is responsible for administering the daily valuation process and applying fair value methodologies as approved by the Valuation Committee. When determining the reliability of independent pricing services for investments owned by the Funds, the Valuation Committee, among other things, conducts due diligence reviews of the pricing services and monitors the quality of security prices received through various testing reports conducted by the Securities Valuation Team.
The Valuation Committee will consider pricing methodologies it deems relevant and appropriate when making a fair value determination, based on the facts and circumstances specific to the portfolio instrument. Fair value determinations generally will be derived as follows, using public or private market information:
| | (i) | If available, fair value determinations shall be derived by extrapolating from recent transactions or quoted prices for identical or comparable securities. |
| | (ii) | If such information is not available, an analytical valuation methodology may be used based on other available information including, but not limited to: analyst appraisals, research reports, corporate action information, issuer financial statements and shelf registration statements. Such analytical valuation methodologies may include, but are not limited to: multiple of earnings, discount from market value of a similar freely-traded security, discounted cash flow analysis, book value or a multiple thereof, risk premium/yield analysis, yield to maturity and/or fundamental investment analysis. |
The purchase price of a portfolio instrument will be used to fair value the instrument only if no other valuation methodology is available or deemed appropriate, and it is determined that the purchase price fairly reflects the instrument’s current value.
For each portfolio security that has been fair valued pursuant to the policies adopted by the Board, the fair value price is compared against the last available and next available market quotations. The Valuation Committee reviews the results of such testing and fair valuation occurrences are reported to the Board.
3. Portfolio Securities and Investments in Derivatives
Portfolio Securities
Foreign Currency Transactions
To the extent that the Funds invest in securities and/or contracts that are denominated in a currency other than U.S. dollars, the Funds will be subject to currency risk, which is the risk that an increase in the U.S. dollar relative to the foreign currency will reduce returns or portfolio value. Generally, when the U.S. dollar rises in value against a foreign currency, the Funds’ investments denominated in that currency will lose value because their currency is worth fewer U.S. dollars; the opposite effect occurs if the U.S. dollar falls in relative value. Investments and other assets and liabilities denominated in foreign currencies are converted into U.S. dollars on a spot (i.e. cash) basis at the spot rate prevailing in the foreign currency exchange market at the time of valuation. Purchases and sales of investments and income denominated in foreign currencies are translated into U.S. dollars on the respective dates of such transactions.
As of the end of the reporting period, Global Total Return Bond’s investments in non-U.S. securities were as follows:
| | | | | | | | |
| Global Total Return Bond | | Value | | �� | % of
Net Assets | |
| Country: | | | | | | | | |
Mexico | | $ | 2,796,261 | | | | 14.9 | % |
United Kingdom | | | 1,447,713 | | | | 7.7 | |
South Africa | | | 1,275,852 | | | | 6.8 | |
France | | | 692,849 | | | | 3.7 | |
Australia | | | 602,239 | | | | 3.2 | |
Poland | | | 576,014 | | | | 3.1 | |
Canada | | | 460,347 | | | | 2.4 | |
China | | | 408,639 | | | | 2.2 | |
Hungary | | | 338,376 | | | | 1.8 | |
Germany | | | 296,451 | | | | 1.6 | |
Brazil | | | 280,936 | | | | 1.5 | |
Other countries | | | 3,626,901 | | | | 19.2 | |
| Total non-U.S. securities | | $ | 12,802,578 | | | | 68.1 | % |
The books and records of the Funds are maintained in U.S. dollars. Foreign currencies, assets and liabilities are translated into U.S. dollars at 4:00 p.m. Eastern Time. Investment transactions, income and expenses are translated on the respective dates of such transactions. Net realized foreign currency gains and losses resulting from changes in exchange rates include foreign currency gains and losses between trade date and settlement date of the transactions, foreign currency transactions, and the difference between the amounts of interest and dividends recorded on the books of the Funds and the amounts actually received.
The realized gains and losses resulting from changes in foreign currency exchange rates and changes in foreign exchange rates associated with (i) investments, (ii) investments in derivatives and (iii) other assets and liabilities are recognized as a component of “Net realized gain (loss) from investments and foreign currency” on the Statement of Operations, when applicable.
The unrealized gains and losses resulting from changes in foreign currency exchange rates and changes in foreign exchange rates associated with (i) investments and (ii) other assets and liabilities are recognized as a component of “Change in net unrealized appreciation (depreciation) of investments
Notes to Financial Statements (continued)
and foreign currency” on the Statement of Operations, when applicable. The unrealized gains and losses resulting from changes in foreign exchange rates associated with investments in derivatives are recognized as a component of the respective derivative’s related “Change in net unrealized appreciation (depreciation)” on the Statement of Operations, when applicable.
Repurchase Agreements
Global Total Return Bond and U.S. Infrastructure Bond are authorized to invest in repurchase agreements. In connection with transactions in repurchase agreements, it is each Fund’s policy that its custodian take possession of the underlying collateral securities, the fair value of which exceeds the principal amount of the repurchase transaction, including accrued interest, at all times. If the counterparty defaults, and the fair value of the collateral declines, realization of the collateral may be delayed or limited.
The following table presents the repurchase agreements for the Funds that are subject to netting agreements as of the end of the reporting period, and the collateral delivered related to those repurchase agreements.
| | | | | | | | | | | | | | |
| Fund | | Counterparty | | Short-Term
Investments, at Value | | | Collateral
Pledged (From)
Counterparty* | | | Net
Exposure | |
| Global Total Return Bond | | Fixed Income Clearing Corporation | | $ | 802,879 | | | $ | (802,879 | ) | | $ | — | |
| * | As of the end of the reporting period, the value of the collateral pledged from the counterparty exceeded the value of the repurchase agreements. Refer to the Fund’s Portfolio of Investments for details on the repurchase agreements. |
Securities Lending
In order to generate additional income, High Income Bond and Strategic Income may lend securities representing up to one-third of the value of each Fund’s total assets (which includes collateral for securities on loan) to broker-dealers, banks or other institutions. Each Fund’s policy is to receive cash collateral equal to at least 102% of the value of securities loaned, which is recognized as “Collateral from securities lending program” on the Statement of Assets and Liabilities. The adequacy of the collateral is monitored on a daily basis. If the value of the securities on loan increases, such that the level of collateralization falls below 100%, additional collateral is received from the borrower, which is recognized as “Due from broker” on the Statement of Assets and Liabilities, when applicable. As with other extensions of credit, there may be risks of delay in recovery of the securities or even loss of rights in the collateral should the borrower of the security fail financially.
The custodian for these Funds serves as their securities lending agent. Each Fund pays the custodian a fee based on the Fund’s proportional share of the custodian’s expense of operating its securities lending program. Collateral for securities on loan is invested in a money market fund, which is recognized as “Investments purchased with collateral from securities lending, at value” on the Statement of Assets and Liabilities.
The following table presents the securities out on loan for the Funds that are subject to netting agreements as of the end of the reporting period, and the collateral delivered related to those securities.
| | | | | | | | | | | | | | |
| Fund | | Counterparty | | Long-Term
Investments, at Value | | | Collateral
Pledged (From)
Counterparty* | | | Net
Exposure | |
| High Income Bond | | U.S. Bank National Association | | $ | 94,391,235 | | | $ | (94,391,235 | ) | | $ | — | |
| Strategic Income | | U.S. Bank National Association | | | 139,053,010 | | | | (139,053,010 | ) | | | — | |
| * | As of the end of the reporting period, the value of the collateral pledged from the counterparty exceeded the value of the securities out on loan. Refer to the Fund's Portfolio of Investments for details on the securities out on loan. |
Income from securities lending, net of fees paid, is recognized on the Statement of Operations as “Securities lending income, net.” Securities lending fees paid by each Fund during the current fiscal period, were as follows:
| | | | | | | | |
| | | High Income
Bond | | | Strategic
Income | |
| Securities lending fees paid | | $ | 135,620 | | | $ | 74,734 | |
Zero Coupon Securities
A zero coupon security does not pay a regular interest coupon to its holders during the life of the security. Income to the holder of the security comes from accretion of the difference between the original purchase price of the security at issuance and the par value of the security at maturity and is effectively paid at maturity. The market prices of zero coupon securities generally are more volatile than the market prices of securities that pay interest periodically.
Investments in Derivatives
Each Fund is authorized to invest in certain derivatives. The Funds record derivative instruments at fair value, with changes in fair value recognized on the Statement of Operations, when applicable. Even though the Funds’ investments in derivatives may represent economic hedges, they are not considered to be hedge transactions for financial reporting purposes.
Forward Foreign Currency Exchange Contracts
Each Fund is authorized to enter into forward foreign currency exchange contracts (“forward contract”) under two circumstances: (i) when a Fund enters into a contract for the purchase or sale of a security denominated in a foreign currency to “lock in” the U.S. exchange rate of the transaction, with such period being a short-dated contract covering the period between transaction date and settlement date; or (ii) when the Sub-Adviser believes that the currency of a particular foreign country may experience a substantial movement against the U.S. dollar or against another foreign currency.
A forward contract is an agreement between two parties to purchase or sell a specified quantity of a currency at or before a specified date in the future at a specified price. Forward contracts are typically traded in the OTC markets and all details of the contract are negotiated between the counterparties to the agreement. Accordingly, the forward contracts are valued by reference to the contracts traded in the OTC markets. The contractual obligations of a buyer or seller may generally be satisfied by taking or making physical delivery of the underlying currency, establishing an opposite position in the contract and recognizing the profit or loss on both positions simultaneously on the delivery date or, in some instances, paying a cash settlement before the designated date of delivery.
Forward contracts are valued daily at the forward rate. The net amount recorded on these transactions for each counterparty is recognized as a component of “Unrealized appreciation and/or depreciation on forward foreign currency exchange contracts, (net)” on the Statement of Assets and Liabilities. The change in value of the forward contracts during the reporting period is recognized as a component of “Change in net unrealized appreciation (depreciation) of forward foreign currency exchange contracts” on the Statement of Operations. When the contract is closed or offset with the same counterparty, a Fund recognizes the difference between the value of the contract at the time it was entered and the value at the time it was closed or offset as a component of “Net realized gain (loss) from forward foreign currency exchange contracts” on the Statement of Operations.
Forward contracts will generally not be entered into for terms greater than three months, but may have maturities of up to six months or more. The use of forward contracts does not eliminate fluctuations in the underlying prices of a Fund’s investment securities; however, it does establish a rate of exchange that can be achieved in the future. The use of forward contracts involves the risk that anticipated currency movements will not be accurately predicted. A forward contract would limit the risk of loss due to a decline in the value of a particular currency; however, it also would limit any potential gain that might result should the value of the currency increase instead of decrease. These contracts may involve market risk in excess of the unrealized appreciation or depreciation reflected on the Statement of Assets and Liabilities. Forward contracts are subject to counterparty risk if the counterparty fails to perform as specified in the contract due to financial impairment or other reason.
During the current fiscal period, Global Total Return Bond, High Income Bond and Strategic Income invested in forward foreign currency exchange contracts. Global Total Return Bond used foreign currency exchange contracts to gain exposure to selected foreign currencies, and in some cases, to hedge the currency risk present in a foreign bond. High Income Bond and Strategic Income used forward foreign currency exchange contracts to manage foreign currency exposure. For example, High Income Bond and Strategic Income may reduce unwanted currency exposure from their portfolios, or may take long forward positions in select currencies in an attempt to benefit from the potential price appreciation.
The average notional amount of forward foreign currency exchange contracts outstanding during the current fiscal period was as follows:
| | | | | | | | | | | | |
| | | Global Total
Return Bond | | | High Income
Bond | | | Strategic
Income | |
| Average notional amount of forward foreign currency exchange contracts outstanding* | | $ | 17,917,867 | | | $ | 71,279,930 | | | $ | 322,037,420 | |
| * | The average notional amount is calculated based on the outstanding notional at the beginning of the fiscal period and at the end of each fiscal quarter within the current fiscal period. |
The following table presents the fair value of all forward foreign currency exchange contracts held by the Funds as of the end of the reporting period, the location of these instruments on the Statement of Assets and Liabilities and the primary underlying risk exposure.
| | | | | | | | | | | | | | |
| | | | | Location on the Statement of Assets and Liabilities | |
| | | | | Asset Derivatives | | | (Liability) Derivatives | |
Underlying
Risk Exposure | | Derivative Instrument | | Location | | Value | | | Location | | Value | |
Global Total Return Bond | | | | | | | | | | | | | | |
| | | | | |
Foreign currency exchange rate | | Forward contracts | | Unrealized appreciation on forward foreign currency exchange contracts, net | | $ | 35,622 | | | Unrealized depreciation on
forward foreign currency
exchange contracts, net | | $ | (203,577 | ) |
Foreign currency exchange rate | | Forward contracts | | Unrealized appreciation on forward foreign currency exchange contracts, net | | | (2,328 | ) | | Unrealized depreciation on
forward foreign currency
exchange contracts, net | | | 63,055 | |
| | | | | |
Total | | | | | | $ | 33,294 | | | | | $ | (140,522 | ) |
Notes to Financial Statements (continued)
| | | | | | | | | | | | | | |
| | | | | Location on the Statement of Assets and Liabilities | |
| | | | | Asset Derivatives | | | (Liability) Derivatives | |
Underlying
Risk Exposure | | Derivative Instrument | | Location | | Value | | | Location | | Value | |
High Income Bond | | | | | | | | | | | | | | |
| | | | | |
Foreign currency exchange rate | | Forward contracts | | Unrealized appreciation on forward foreign currency exchange contracts, net | | $ | 303,964 | | | — | | $ | — | |
Foreign currency exchange rate | | Forward contracts | | Unrealized appreciation on forward foreign currency exchange contracts, net | | | (130,846 | ) | | — | | | — | |
| | | | | |
Total | | | | | | $ | 173,118 | | | | | $ | — | |
| | | | | |
Strategic Income | | | | | | | | | | | | | | |
| | | | | |
Foreign currency exchange rate | | Forward contracts | | Unrealized appreciation on forward foreign currency exchange contracts, net | | $ | 2,460,107 | | | Unrealized depreciation
on forward foreign currency
exchange contracts, net | | $ | (710,998 | ) |
Foreign currency exchange rate | | Forward contracts | | Unrealized appreciation on forward foreign currency exchange contracts, net | | | (1,141,849 | ) | | — | | | — | |
| | | | | |
Total | | | | | | $ | 1,318,258 | | | | | $ | (710,998 | ) |
The following table presents the forward foreign currency exchange contracts subject to netting agreements and the collateral delivered related to those forward foreign currency exchange contracts as of the end of the reporting period.
| | | | | | | | | | | | | | | | | | | | | | | | | | |
| Fund | | Counterparty | | Gross
Unrealized
Appreciation on
Forward Foreign
Currency Exchange
Contracts* | | | Gross
Unrealized
(Depreciation) on
Forward Foreign
Currency Exchange
Contracts* | | | Amounts
Netted on
Statement of
Assets and
Liabilities | | | Net Unrealized
Appreciation
(Depreciation) on
Forward Foreign
Currency Exchange
Contracts | | | Collateral
Pledged
to (from)
Counterparty | | | Net
Exposure | |
| Global Total Return Bond | | | | | | | | | | | | | | | | | | | | | | | | |
| | Bank of America | | $ | 39,139 | | | $ | (61,700 | ) | | $ | 39,139 | | | $ | (22,561 | ) | | $ | — | | | $ | (22,561 | ) |
| | Citigroup | | | 18,662 | | | | (26,403 | ) | | | 18,662 | | | | (7,741 | ) | | | — | | | | (7,741 | ) |
| | Credit Suisse | | | 1,240 | | | | (6,540 | ) | | | 1,240 | | | | (5,300 | ) | | | — | | | | (5,300 | ) |
| | Deutsche Bank | | | 32,073 | | | | — | | | | — | | | | 32,073 | | | | — | | | | 32,073 | |
| | Goldman Sachs | | | 3,549 | | | | (2,328 | ) | | | (2,328 | ) | | | 1,221 | | | | — | | | | 1,221 | |
| | | Morgan Stanley | | | 4,014 | | | | (108,934 | ) | | | 4,014 | | | | (104,920 | ) | | | — | | | | (104,920 | ) |
Total | | | | $ | 98,677 | | | $ | (205,905 | ) | | $ | 60,727 | | | $ | (107,228 | ) | | $ | — | | | $ | (107,228 | ) |
| High Income Bond | | | | | | | | | | | | | | | | | | | | | | | | |
| | Bank of America | | $ | 8,234 | | | $ | — | | | $ | — | | | $ | 8,234 | | | $ | — | | | $ | 8,234 | |
| | Citigroup | | | 124,584 | | | | (40,997 | ) | | | (40,997 | ) | | | 83,587 | | | | — | | | | 83,587 | |
| | | Goldman Sachs | | | 171,146 | | | | (89,849 | ) | | | (89,849 | ) | | | 81,297 | | | | — | | | | 81,297 | |
Total | | | | $ | 303,964 | | | $ | (130,846 | ) | | $ | (130,846 | ) | | $ | 173,118 | | | $ | — | | | $ | 173,118 | |
Strategic Income | | | | | | | | | | | | | | | | | | | | | | | | |
| | Bank of America | | $ | 652,980 | | | $ | (614,656 | ) | | $ | (614,656 | ) | | $ | 38,324 | | | $ | — | | | $ | 38,324 | |
| | Citigroup | | | 894,624 | | | | (125,917 | ) | | | (125,917 | ) | | | 768,707 | | | | (530,000 | ) | | | 238,707 | |
| | Deutsche Bank | | | 758,702 | | | | (401,276 | ) | | | (401,276 | ) | | | 357,426 | | | | (310,000 | ) | | | 47,426 | |
| | Goldman Sachs | | | 74,936 | | | | — | | | | — | | | | 74,936 | | | | — | | | | 74,936 | |
| | Morgan Stanley | | | — | | | | (710,998 | ) | | | — | | | | (710,998 | ) | | | 465,000 | | | | (245,998 | ) |
| | Nomura Securities | | | 17,630 | | | | — | | | | — | | | | 17,630 | | | | — | | | | 17,630 | |
| | | UBS | | | 61,235 | | | | — | | | | — | | | | 61,235 | | | | — | | | | 61,235 | |
Total | | | | $ | 2,460,107 | | | $ | (1,852,847 | ) | | $ | (1,141,849 | ) | | $ | 607,260 | | | $ | (375,000 | ) | | $ | 232,260 | |
| * | Represents gross unrealized appreciation (depreciation) for the counterparty as reported in the Fund’s Portfolio of Investments. |
The following table presents the amount of net realized gain (loss) and change in net unrealized appreciation (depreciation) recognized on forward foreign currency exchange contracts on the Statement of Operations during the current fiscal period, and the primary underlying risk exposure.
| | | | | | | | | | | | |
| Fund | | Underlying
Risk Exposure | | Derivative
Instrument | | Net Realized
Gain (Loss) from
Forward Foreign Currency
Exchange Contracts | | | Change in Net Unrealized
Appreciation (Depreciation) of
Forward Foreign Currency
Exchange Contracts | |
| Global Total Return Bond | | Foreign currency exchange rate | | Forward contracts | | $ | (250,808 | ) | | $ | (103,660 | ) |
| High Income Bond | | Foreign currency exchange rate | | Forward contracts | | | 13,219,277 | | | | 146,922 | |
| Strategic Income | | Foreign currency exchange rate | | Forward contracts | | | 18,051,609 | | | | 790,473 | |
Futures Contracts
Upon execution of a futures contract, a Fund is obligated to deposit cash or eligible securities, also known as “initial margin,” into an account at its clearing broker equal to a specified percentage of the contract amount. Cash held by the broker to cover initial margin requirements on open futures contracts, if any, is recognized as “Cash collateral at brokers” on the Statement of Assets and Liabilities. Investments in futures contracts obligate a Fund and the clearing broker to settle monies on a daily basis representing changes in the prior days “mark-to-market” of the open contracts. If a Fund has unrealized appreciation the clearing broker would credit the Fund’s account with an amount equal to appreciation and conversely if a Fund has unrealized depreciation the clearing broker would debit the Fund’s account with an amount equal to depreciation. These daily cash settlements are also known as “variation margin.” Variation margin is recognized as a receivable and/or payable for “Variation margin on futures contracts” on the Statement of Assets and Liabilities.
During the period the futures contract is open, changes in the value of the contract are recognized as an unrealized gain or loss by “marking-to-market” on a daily basis to reflect the changes in market value of the contract, which is recognized as a component of “Change in net unrealized appreciation (depreciation) of futures contracts” on the Statement of Operations. When the contract is closed or expired, a Fund records a realized gain or loss equal to the difference between the value of the contract on the closing date and value of the contract when originally entered into, which is recognized as a component of “Net realized gain (loss) from futures contracts” on the Statement of Operations.
Risks of investments in futures contracts include the possible adverse movement in the price of the securities or indices underlying the contracts, the possibility that there may not be a liquid secondary market for the contracts and/or that a change in the value of the contract may not correlate with a change in the value of the underlying securities or indices.
During the current fiscal period, each of the Funds invested in futures contracts. Global Total Return Bond and Strategic Income used U.S. Treasury and Eurodollar futures as part of an overall portfolio construction strategy to manage portfolio duration and yield curve exposure; using selected foreign bond futures to actively manage exposure to those markets. High Income Bond used U.S. Treasury futures as part of an overall portfolio construction strategy to manage portfolio duration and yield curve exposure. U.S. Infrastructure Bond shorted U.S. Treasury futures to hedge against potential increases in interest rates.
The average notional amount of futures contracts outstanding during the current fiscal period was as follows:
| | | | | | | | | | | | | | | | |
| | | Global Total
Return
Bond | | | High Income
Bond | | | Strategic
Income | | | U.S. Infrastructure
Bond | |
| Average notional amount of futures contracts outstanding* | | $ | 5,911,491 | | | $ | 28,376,728 | | | $ | 230,843,602 | | | $ | 1,363,850 | |
| * | The average notional amount is calculated based on the absolute aggregate notional amount of contracts outstanding at the beginning of the fiscal period and at the end of each quarter within the current fiscal period. |
The following table presents the fair value of all futures contracts held by the Funds as of the end of the reporting period, the location of these instruments on the Statement of Assets and Liabilities and the primary underlying risk exposure.
| | | | | | | | | | | | | | |
| | | | | Location on the Statement of Assets and Liabilities | |
| | | | | Asset Derivatives | | | (Liability) Derivatives | |
Underlying
Risk Exposure | | Derivative Instrument | | Location | | Value | | | Location | | Value | |
Global Total Return Bond | | | | | | | | | | | | | | |
| | | | | |
Interest rate | | Futures contracts | | Receivable for variation margin on futures contracts* | | $ | 23,117 | | | — | | $ | — | |
Interest rate | | Futures contracts | | Receivable for variation margin on futures contracts* | | | (296 | ) | | — | | | — | |
Total | | | | | | $ | 22,821 | | | | | $ | — | |
| | | | | |
High Income Bond | | | | | | | | | | | | | | |
| | | | | |
Interest rate | | Futures contracts | | — | | $ | — | | | Payable for variation margin
on futures contracts* | | $ | (275,517 | ) |
| | | | | |
Strategic Income | | | | | | | | | | | | | | |
| | | | | |
Interest rate | | Futures contracts | | Receivable for variation margin on futures contracts* | | $ | 891,202 | | | Payable for variation margin
on futures contracts* | | $ | (1,256,892 | ) |
Interest rate | | Futures contracts | | Receivable for variation margin on futures contracts* | | | (38,091 | ) | | — | | | — | |
Total | | | | | | $ | 853,111 | | | | | $ | (1,256,892 | ) |
Notes to Financial Statements (continued)
| | | | | | | | | | | | | | |
| | | | | Location on the Statement of Assets and Liabilities | |
| | | | | Asset Derivatives | | | (Liability) Derivatives | |
Underlying
Risk Exposure | | Derivative Instrument | | Location | | Value | | | Location | | Value | |
U.S. Infrastructure Bond | | | | | | | | | | | | | | |
| | | | | |
Interest rate | | Futures contracts | | Receivable for variation margin on futures contracts* | | $ | 29,296 | | | — | | $ | — | |
| * | Value represents unrealized appreciation (depreciation) of futures contracts as reported in the Fund’s Portfolio of Investments and not the asset and/or liability derivatives location as described in the table above. |
The following table presents the amount of net realized gain (loss) and change in net unrealized appreciation (depreciation) recognized on futures contracts on the Statement of Operations during the current fiscal period, and the primary underlying risk exposure.
| | | | | | | | | | | | |
| Fund | | Underlying
Risk Exposure | | Derivative
Instrument | | Net Realized
Gain (Loss) from
Futures Contracts | | | Change in Net Unrealized
Appreciation (Depreciation) of
Futures Contracts | |
| Global Total Return Bond | | Interest rate | | Futures contracts | | $ | (182,445 | ) | | $ | 13,462 | |
| High Income Bond | | Interest rate | | Futures contracts | | | (578,896 | ) | | | (352,543 | ) |
| Strategic Income | | Interest rate | | Futures contracts | | | (6,149,196 | ) | | | (495,755 | ) |
| U.S. Infrastructure Bond | | Interest rate | | Futures contracts | | | (106,378 | ) | | | 44,447 | |
Interest Rate Swaps
Interest rate swap contracts involve a Fund’s agreement with the counterparty to pay or receive a fixed rate payment in exchange for the counterparty receiving or paying a variable rate payment. Forward interest rate swap contracts involve a Fund’s agreement with a counterparty to pay, in the future, a fixed or variable rate payment in exchange for the counterparty paying the Fund a variable or fixed rate payment, the accruals for which would begin at a specified date in the future (the “effective date”). The amount of the payment obligation is based on the notional amount of the swap contract. Swap contracts do not involve the delivery of securities or other underlying assets or principal. Accordingly, the risk of loss with respect to the swap counterparty on such transactions is limited to the net amount of interest payments that the Fund is to receive.
Interest rate swap contracts are valued daily. Upon entering into an interest rate swap contract (and beginning on the effective date for a forward interest rate swap contract), a Fund accrues the fixed rate payment expected to be paid or received and the variable rate payment expected to be received or paid on the interest rate swap contracts on a daily basis, and recognizes the daily change in the fair value of the Fund’s contractual rights and obligations under the contracts. For OTC swaps, the net amount recorded on these transactions, for each counterparty, is recognized on the Statement of Assets and Liabilities as a component of “Unrealized appreciation or depreciation on interest rate swaps (, net).”
Upon the execution of an exchanged-cleared swap contract, in certain instances a Fund is obligated to deposit cash or eligible securities, also known as “initial margin,” into an account at its clearing broker equal to a specified percentage of the contract amount. Cash held by the broker to cover initial margin requirements on open swap contracts, if any, is recognized as “Cash collateral at brokers” on the Statement of Assets and Liabilities. Investments in exchange-cleared interest rate swap contracts obligate a Fund and the clearing broker to settle monies on a daily basis representing changes in the prior day’s “mark-to-market” of the swap contract. If a Fund has unrealized appreciation, the clearing broker will credit the Fund’s account with an amount equal to the appreciation. Conversely, if the Fund has unrealized depreciation, the clearing broker will debit the Fund’s account with an amount equal to the depreciation. These daily cash settlements are also known as “variation margin.” Variation margin is recognized as a receivable and/or payable for “Variation margin on swap contracts” on the Statement of Assets and Liabilities.
The net amount of periodic payments settled in cash are recognized as a component of “Net realized gain (loss) from swaps” on the Statement of Operations, in addition to the net realized gain or loss recorded upon the termination of the swap contract. For tax purposes, payments expected to be received or paid on the swap contacts are treated as ordinary income or expense, respectively.
Changes in the value of the swap contracts during the fiscal period are recognized as a component of “Change in net unrealized appreciation (depreciation) of swaps.” In certain instances, payments are made or received upon entering into the swap contract to compensate for differences between the stated terms of the swap agreements and prevailing market conditions (credit spreads, currency exchange rates, interest rates, and other relevant factors). Payments received or made at the beginning of the measurement period, if any, are recognized as “Interest rate swaps premiums paid and/or received” on the Statement of Assets and Liabilities.
During the current fiscal period, Global Total Return Bond, High Income Bond and Strategic Income invested in interest rate swap contracts as part of an overall portfolio construction strategy to manage duration and overall portfolio yield curve exposure.
The average notional amount of interest rate swap contracts outstanding during the current fiscal period was as follows:
| | | | | | | | | | | | |
| | | Global Total
Return
Bond | | | High Income
Bond | | | Strategic
Income | |
| Average notional amount of interest rate swap contracts outstanding* | | $ | 600,000 | | | $ | 40,800,000 | | | $ | 100,200,000 | |
| * | The average notional amount is calculated based on the outstanding notional at the beginning of the fiscal period and at the end of each fiscal quarter within the current fiscal period. |
Credit Default Swaps
A Fund may enter into a credit default swap contract to seek to maintain a total return on a particular investment or portion of its portfolio, or to take an active long or short position with respect to the likelihood of a particular issuer’s default. Credit default swap contracts involve one party making a stream of payments to another party in exchange for the right to receive a specified return if/when there is a credit event by a third party. Generally, a credit event means bankruptcy, failure to pay, or restructuring. The specific credit events applicable for each credit default swap are stated in the terms of the particular swap agreement. Upon occurrence of a specific credit event with respect to the underlying referenced entity, the Fund will either (i) receive that security, or an equivalent amount of cash, from the counterparty in exchange for payment of the notional amount to the counterparty, or (ii) pay a net settlement amount of the credit default swap contract less the recovery value of the referenced obligation or underlying securities comprising the referenced index. The difference between the value of the security delivered and the notional amount received is recorded as a realized gain or loss. Payments received or made at the beginning of the measurement period are recognized as a component of “Credit default swaps premiums paid and/or received” on the Statement of Assets and Liabilities, when applicable.
Credit default swap contracts are valued daily. Changes in the value of a credit default swap during the fiscal period are recognized as a component of “Change in net unrealized appreciation (depreciation) of swaps” and realized gains and losses are recognized as a component of “Net realized gain (loss) from swaps” on the Statement of Operations.
For over-the-counter swaps, the daily change in the market value of the swap contract, along with any daily interest fees accrued, are recognized as components of “Unrealized appreciation or depreciation on credit default swaps (, net)” on the Statement of Assets and Liabilities.
Investments in swaps cleared through an exchange obligate a Fund and the clearing broker to settle monies on a daily basis representing changes in the prior days “mark-to-market” of the swap. If a Fund has unrealized appreciation the clearing broker would credit the Fund’s account with an amount equal to the appreciation and conversely if a Fund has unrealized depreciation the clearing broker would debit a Fund’s account with an amount equal to the depreciation. These daily cash settlements are also known as “variation margin.” Variation margin is recognized as a receivable and/or payable for “Variation margin on swap contracts” on the Statement of Assets and Liabilities. The maximum potential amount of future payments the Fund could incur as a buyer of protection in a credit default swap contract is limited to the notional amount of the contract. The maximum potential amount would be offset by the recovery value, if any, of the respective referenced entity. In certain instances, a Fund is obligated to deposit cash or eligible securities, also known as “initial margin,” into an account at its clearing broker equal to a specified percentage of the contract amount. Cash held by the broker to cover initial margin requirements on open swap contracts, if any, is recognized as “Cash collateral at brokers” on the Statement of Assets and Liabilities.
During the current fiscal period, Global Total Return Bond, High Income Bond and Strategic Income invested in credit default swap contracts. Global Total Return Bond and Strategic Income used High Yield CDX swaps as a way to take on credit risk and earn a commensurate credit spread. High Income Bond used High Yield CDX swaps to partially hedge broad high yield market exposure.
The average notional amount of credit default swap contracts outstanding during the current fiscal period was as follows:
| | | | | | | | | | | | |
| | | Global Total
Return
Bond | | | High Income
Bond | | |
Strategic
Income | |
| Average notional amount of credit default swap contracts outstanding* | | $ | 79,200 | | | $ | 21,780,000 | | | $ | 15,127,600 | |
| * | The average notional amount is calculated based on the outstanding notional at the beginning of the fiscal period and at the end of each fiscal quarter within the current fiscal period. |
The following table presents the fair value of all swap contracts held by the Funds as of the end of the reporting period, the location of these instruments on the Statement of Assets and Liabilities and the primary underlying risk exposure.
| | | | | | | | | | | | | | |
| | | | | Location on the Statement of Assets and Liabilities | |
| | | Derivative Instrument | | Asset Derivatives | | | (Liability) Derivatives | |
Underlying
Risk Exposure | | | Location | | Value | | | Location | | Value | |
| Global Total Return Bond | | | | | | | | | | | | |
Interest rate | | Swaps (OTC) | | — | | $ | — | | | Unrealized depreciation
on interest rate swaps** | | $ | (1,248 | ) |
| | | | | |
| High Income Bond | | | | | | | | | | | | |
Interest Rate | | Swaps (Exchange-Cleared) | | Receivable for variation margin on swap contracts* | | $ | (346,790 | ) | | — | | $ | — | |
Interest Rate | | Swaps (Exchange-Cleared) | | Receivable for variation margin on swap contracts* | | | 96,000 | | | — | | | — | |
Total | | | | | | $ | (250,790 | ) | | | | $ | — | |
Notes to Financial Statements (continued)
| | | | | | | | | | | | | | |
| | | | | Location on the Statement of Assets and Liabilities | |
| | | Derivative Instrument | | Asset Derivatives | | | (Liability) Derivatives | |
Underlying
Risk Exposure | | | Location | | Value | | | Location | | Value | |
| Strategic Income | | | | | | | | | | | | |
Interest Rate | | Swaps (Exchange-Cleared) | | Receivable for variation margin on swap contracts* | | $ | 161,685 | | | — | | $ | — | |
Interest Rate | | Swaps (Exchange-Cleared) | | Receivable for variation margin on swap contracts* | | | (1,812,151 | ) | | — | | | — | |
Interest Rate | | Swaps (OTC) | | — | | | — | | | Unrealized depreciation on
interest rate swaps, net** | | | (203,013 | ) |
Interest Rate | | Swaps (OTC) | | — | | | — | | | Unrealized depreciation on
interest rate swaps, net** | | | 23,865 | |
Total | | | | | | $ | (1,650,466 | ) | | | | $ | (179,148 | ) |
| * | Value represents unrealized appreciation (depreciation) of swaps as reported in the Fund’s Portfolio of Investments and not the asset and/or liability derivative location as described in the table above. |
| ** | Some swap contracts require a counterparty to pay or receive a premium, which is disclosed on the Statement of Assets and Liabilities but is not reflected in the cumulative appreciation (depreciation) presented above. |
The following table presents the swap contacts, which are subject to netting agreements and the collateral delivered related to those swap contracts as of the end of the reporting period.
| | | | | | | | | | | | | | | | | | | | | | | | | | |
| Fund | | Counterparty | | Gross
Unrealized
Appreciation on
Interest
Rate Swaps*** | | | Gross
Unrealized
(Depreciation) on
Interest
Rate Swaps*** | | | Amounts
Netted on
Statement of
Assets and
Liabilities | | | Net Unrealized
Appreciation
(Depreciation) on
Interest
Rate Swaps | | | Collateral
Pledged
to (from)
Counterparty | | | Net
Exposure | |
| Global Total Return Bond | | | | | | | | | | | | | | | | | | | | | | | | | | |
| | | JPMorgan | | $ | — | | | $ | (1,248 | ) | | $ | — | | | $ | (1,248 | ) | | $ | — | | | $ | (1,248 | ) |
| Strategic Income | | | | | | | | | | | | | | | | | | | | | | | | | | |
| | | JPMorgan | | $ | 23,865 | | | $ | (203,013 | ) | | $ | 23,865 | | | $ | (179,148 | ) | | $ | 20,000 | | | $ | (159,148 | ) |
| *** | Represents gross unrealized appreciation (depreciation) for the counterparty as reported in the Fund’s Portfolio of Investments. |
The following table presents the amount of net realized gain (loss) and change in net unrealized appreciation (depreciation) recognized on swap contracts on the Statement of Operations during the current fiscal period, and the primary underlying risk exposure.
| | | | | | | | | | | | |
| Fund | | Underlying
Risk Exposure | | Derivative
Instrument | | Net Realized
Gain (Loss)
from Swaps | | | Change in Net
Unrealized Appreciation
(Depreciation) of
Swaps | |
| Global Total Return Bond | | | | | | | | | | |
| | Credit | | Swaps | | $ | 6,366 | | | $ | — | |
| | | Interest rate | | Swaps | | | 7,223 | | | | (28,185 | ) |
| Total | | | | | | $ | 13,589 | | | $ | (28,185 | ) |
| High Income Bond | | | | | | | | | | | | |
| | Credit | | Swaps | | $ | (1,333,815 | ) | | $ | 301,627 | |
| | | Interest rate | | Swaps | | | (493,657 | ) | | | 18,765 | |
| Total | | | | | | $ | (1,827,472 | ) | | $ | 320,392 | |
| Strategic Income | | | | | | | | | | | | |
| | Credit | | Swaps | | $ | 1,059,885 | | | $ | — | |
| | | Interest rate | | Swaps | | | (1,923,031 | ) | | | (1,179,760 | ) |
| Total | | | | | | $ | (863,146 | ) | | $ | (1,179,760 | ) |
Market and Counterparty Credit Risk
In the normal course of business each Fund may invest in financial instruments and enter into financial transactions where risk of potential loss exists due to changes in the market (market risk) or failure of the other party to the transaction to perform (counterparty credit risk). The potential loss could exceed the value of the financial assets recorded on the financial statements. Financial assets, which potentially expose each Fund to counterparty credit risk, consist principally of cash due from counterparties on forward, option and swap transactions, when applicable. The extent of each Fund’s exposure to counterparty credit risk in respect to these financial assets approximates their carrying value as recorded on the Statement of Assets and Liabilities.
Each Fund helps manage counterparty credit risk by entering into agreements only with counterparties the Adviser believes have the financial resources to honor their obligations and by having the Adviser monitor the financial stability of the counterparties. Additionally, counterparties may be
required to pledge collateral daily (based on the daily valuation of the financial asset) on behalf of each Fund with a value approximately equal to the amount of any unrealized gain above a pre-determined threshold. Reciprocally, when each Fund has an unrealized loss, the Funds have instructed the custodian to pledge assets of the Funds as collateral with a value approximately equal to the amount of the unrealized loss above a pre-determined threshold. Collateral pledges are monitored and subsequently adjusted if and when the valuations fluctuate, either up or down, by at least the pre-determined threshold amount.
4. Fund Shares
Transactions in Fund shares during the current and prior fiscal period were as follows:
| | | | | | | | | | | | | | | | |
| | | Year Ended
6/30/15 | | | Year Ended
6/30/14 | |
| Global Total Return Bond | | Shares | | | Amount | | | Shares | | | Amount | |
| Shares sold: | | | | | | | | | | | | | | | | |
Class A | | | 33,410 | | | $ | 663,020 | | | | 32,064 | | | $ | 647,508 | |
Class C | | | 3,771 | | | | 75,939 | | | | 2,561 | | | | 51,759 | |
Class R3 | | | — | | | | — | | | | — | | | | — | |
Class I | | | 17,049 | | | | 339,170 | | | | 135,898 | | | | 2,795,879 | |
| Shares issued to shareholders due to reinvestment of distributions: | | | | | | | | | | | | | | | | |
Class A | | | 4,268 | | | | 83,527 | | | | 2,747 | | | | 55,686 | |
Class C | | | 360 | | | | 7,063 | | | | 251 | | | | 5,092 | |
Class R3 | | | 9 | | | | 168 | | | | 7 | | | | 151 | |
Class I | | | 13,892 | | | | 273,301 | | | | 11,324 | | | | 229,930 | |
| | | | 72,759 | | | | 1,442,188 | | | | 184,852 | | | | 3,786,005 | |
| Shares redeemed: | | | | | | | | | | | | | | | | |
Class A | | | (15,528 | ) | | | (302,329 | ) | | | (19,617 | ) | | | (401,764 | ) |
Class C | | | (2,786 | ) | | | (56,510 | ) | | | (770 | ) | | | (15,455 | ) |
Class R3 | | | — | | | | (2 | ) | | | — | | | | — | |
Class I | | | (16,704 | ) | | | (329,207 | ) | | | (36,367 | ) | | | (756,919 | ) |
| | | | (35,018 | ) | | | (688,048 | ) | | | (56,754 | ) | | | (1,174,138 | ) |
| Net increase (decrease) | | | 37,741 | | | $ | 754,140 | | | | 128,098 | | | $ | 2,611,867 | |
| | |
| | | Year Ended
6/30/15 | | | Year Ended
6/30/14 | |
| High Income Bond | | Shares | | | Amount | | | Shares | | | Amount | |
| Shares sold: | | | | | | | | | | | | | | | | |
Class A | | | 20,579,913 | | | $ | 179,760,260 | | | | 14,494,390 | | | $ | 132,162,411 | |
Class A – automatic conversion of Class B Shares | | | — | | | | — | | | | 88,915 | | | | 826,694 | |
Class B – exchanges | | | — | | | | — | | | | 3,885 | | | | 35,313 | |
Class C | | | 1,237,977 | | | | 10,700,119 | | | | 2,489,184 | | | | 22,649,986 | |
Class R3 | | | 57,519 | | | | 514,788 | | | | 79,740 | | | | 742,363 | |
Class I | | | 32,641,176 | | | | 286,242,639 | | | | 42,439,856 | | | | 387,747,238 | |
| Shares issued to shareholders due to reinvestment of distributions: | | | | | | | | | | | | | | | | |
Class A | | | 1,136,540 | | | | 9,756,311 | | | | 1,411,539 | | | | 12,846,739 | |
Class B | | | — | | | | — | | | | 10,090 | | | | 91,136 | |
Class C | | | 380,202 | | | | 3,252,087 | | | | 505,346 | | | | 4,585,469 | |
Class R3 | | | 7,898 | | | | 69,117 | | | | 6,442 | | | | 59,876 | |
Class I | | | 1,453,361 | | | | 12,486,374 | | | | 1,581,856 | | | | 14,426,551 | |
| | | | 57,494,586 | | | | 502,781,695 | | | | 63,111,243 | | | | 576,173,776 | |
| Shares redeemed: | | | | | | | | | | | | | | | | |
Class A | | | (29,786,857 | ) | | | (259,748,690 | ) | | | (9,096,635 | ) | | | (82,834,295 | ) |
Class B | | | — | | | | — | | | | (94,861 | ) | | | (863,612 | ) |
Class B – automatic conversion to Class A Shares | | | — | | | | — | | | | (89,394 | ) | | | (826,694 | ) |
Class C | | | (2,641,731 | ) | | | (22,651,623 | ) | | | (2,745,982 | ) | | | (24,972,705 | ) |
Class R3 | | | (62,900 | ) | | | (537,346 | ) | | | (46,274 | ) | | | (432,632 | ) |
Class I | | | (57,301,772 | ) | | | (496,675,701 | ) | | | (21,745,368 | ) | | | (198,782,863 | ) |
| | | | (89,793,260 | ) | | | (779,613,360 | ) | | | (33,818,514 | ) | | | (308,712,801 | ) |
| Net increase (decrease) | | | (32,298,674 | ) | | $ | (276,831,665 | ) | | | 29,292,729 | | | $ | 267,460,975 | |
Notes to Financial Statements (continued)
| | | | | | | | | | | | | | | | |
| | | Year Ended
6/30/15 | | | Year Ended
6/30/14 | |
| Strategic Income | | Shares | | | Amount | | | Shares | | | Amount | |
| Shares sold: | | | | | | | | | | | | | | | | |
Class A | | | 22,233,359 | | | $ | 252,302,027 | | | | 6,807,287 | | | $ | 77,145,009 | |
Class A – automatic conversion of Class B Shares | | | — | | | | — | | | | 76,185 | | | | 881,815 | |
Class B – exchanges | | | — | | | | — | | | | 5,178 | | | | 56,981 | |
Class C | | | 6,832,580 | | | | 77,016,680 | | | | 1,865,289 | | | | 20,993,661 | |
Class R3 | | | 930,153 | | | | 10,536,994 | | | | 313,904 | | | | 3,562,838 | |
Class R6 | | | 1,927,736 | | | | 21,625,297 | | | | — | | | | — | |
Class I | | | 39,093,277 | | | | 442,796,623 | | | | 19,152,870 | | | | 216,141,983 | |
| Shares issued to shareholders due to reinvestment of distributions: | | | | | | | | | | | | | | | | |
Class A | | | 874,773 | | | | 9,870,223 | | | | 323,227 | | | | 3,647,943 | |
Class B | | | — | | | | — | | | | 3,772 | | | | 42,022 | |
Class C | | | 247,639 | | | | 2,777,282 | | | | 107,640 | | | | 1,205,845 | |
Class R3 | | | 31,479 | | | | 356,678 | | | | 14,015 | | | | 158,616 | |
Class R6 | | | 33,785 | | | | 377,964 | | | | — | | | | — | |
Class I | | | 1,184,390 | | | | 13,362,708 | | | | 637,344 | | | | 7,177,964 | |
| | | | 73,389,171 | | | | 831,022,476 | | | | 29,306,711 | | | | 331,014,677 | |
| Shares redeemed: | | | | | | | | | | | | | | | | |
Class A | | | (7,902,380 | ) | | | (89,477,691 | ) | | | (2,719,218 | ) | | | (30,498,573 | ) |
Class B | | | — | | | | — | | | | (68,173 | ) | | | (760,354 | ) |
Class B – automatic conversion to Class A Shares | | | — | | | | — | | | | (76,583 | ) | | | (881,815 | ) |
Class C | | | (1,125,835 | ) | | | (12,594,984 | ) | | | (988,539 | ) | | | (10,984,313 | ) |
Class R3 | | | (304,433 | ) | | | (3,451,611 | ) | | | (135,481 | ) | | | (1,526,676 | ) |
Class R6 | | | (91,956 | ) | | | (1,035,000 | ) | | | — | | | | — | |
Class I | | | (22,515,883 | ) | | | (253,118,258 | ) | | | (13,947,269 | ) | | | (156,077,240 | ) |
| | | | (31,940,487 | ) | | | (359,677,544 | ) | | | (17,935,263 | ) | | | (200,728,971 | ) |
| Net increase (decrease) | | | 41,448,684 | | | $ | 471,344,932 | | | | 11,371,448 | | | $ | 130,285,706 | |
| | |
| | | Year Ended
6/30/15 | | | For the period 5/12/14
(commencement of operations)
through 6/30/14 | |
| U.S. Infrastructure Bond | | Shares | | | Amount | | | Shares | | | Amount | |
| Shares sold: | | | | | | | | | | | | | | | | |
Class A | | | 10,805 | | | $ | 219,867 | | | | 2,500 | | | $ | 50,000 | |
Class C | | | 1,230 | | | | 25,000 | | | | 2,500 | | | | 50,000 | |
Class I | | | 71,062 | | | | 1,450,879 | | | | 345,025 | | | | 6,900,500 | |
| Shares issued to shareholders due to reinvestment of distributions: | | | | | | | | | | | | | | | | |
Class A | | | 195 | | | | 3,950 | | | | — | | | | — | |
Class C | | | 18 | | | | 379 | | | | — | | | | — | |
Class I | | | 1,138 | | | | 23,090 | | | | — | | | | — | |
| | | | 84,448 | | | | 1,723,165 | | | | 350,025 | | | | 7,000,500 | |
| Shares redeemed: | | | | | | | | | | | | | | | | |
Class A | | | (503 | ) | | | (10,250 | ) | | | — | | | | — | |
Class C | | | (18 | ) | | | (379 | ) | | | — | | | | — | |
Class I | | | (18,972 | ) | | | (381,440 | ) | | | (25 | ) | | | (504 | ) |
| | | | (19,493 | ) | | | (392,069 | ) | | | (25 | ) | | | (504 | ) |
| Net increase (decrease) | | | 64,955 | | | $ | 1,331,096 | | | | 350,000 | | | $ | 6,999,996 | |
5. Investment Transactions
Long-term purchases and sales (including maturities but excluding investments purchased with collateral from securities lending and derivative transactions) during the current fiscal period were as follows:
| | | | | | | | | | | | | | | | |
| | | Global
Total Return
Bond | | | High Income
Bond | | | Strategic
Income | | | U.S. Infrastructure
Bond | |
| Purchases: | | | | | | | | | | | | | | | | |
Investment securities | | $ | 7,842,783 | | | $ | 628,467,801 | | | $ | 796,291,340 | | | $ | 2,378,263 | |
U.S. Government and agency obligations | | | 9,699,548 | | | | — | | | | 172,268,399 | | | | — | |
| Sales and maturities: | | | | | | | | | | | | | | | | |
Investment securities | | $ | 7,588,371 | | | $ | 867,700,725 | | | $ | 302,711,233 | | | $ | 1,170,918 | |
U.S. Government and agency obligations | | | 9,822,783 | | | | — | | | | 177,686,979 | | | | — | |
6. Income Tax Information
Each Fund is a separate taxpayer for federal income tax purposes. Each Fund intends to distribute substantially all of its net investment income and net capital gains to shareholders and to otherwise comply with the requirements of Subchapter M of the Internal Revenue Code applicable to regulated investment companies. Therefore, no federal income tax provision is required.
For all open tax years and all major taxing jurisdictions, management of the Funds has concluded that there are no significant uncertain tax positions that would require recognition in the financial statements. Open tax years are those that are open for examination by taxing authorities (i.e., generally the last four tax year ends and the interim tax period since then). Furthermore, management of the Funds is also not aware of any tax positions for which it is reasonably possible that the total amounts of unrecognized tax benefits will significantly change in the next twelve months.
The following information is presented on an income tax basis. Differences between amounts for financial statement and federal income tax purposes are primarily due to timing differences in recognizing certain gains and losses on investment transactions. To the extent that differences arise that are permanent in nature, such amounts are reclassified within the capital accounts as detailed below. Temporary differences do not require reclassification. Temporary and permanent differences do not impact the NAVs of the Funds.
As of June 30, 2015, the cost and unrealized appreciation (depreciation) of investments (excluding investments in derivatives), as determined on a federal income tax basis, were as follows:
| | | | | | | | | | | | | | | | |
| | | Global
Total Return
Bond | | | High Income
Bond | | | Strategic
Income | | | U.S. Infrastructure
Bond | |
| Cost of investments | | $ | 20,516,939 | | | $ | 774,980,349 | | | $ | 1,366,430,587 | | | $ | 8,127,209 | |
| Gross unrealized: | | | | | | | | | | | | | | | | |
Appreciation | | $ | 312,150 | | | $ | 8,554,794 | | | $ | 21,131,427 | | | $ | 47,146 | |
Depreciation | | | (1,470,052 | ) | | | (50,910,133 | ) | | | (45,712,992 | ) | | | (167,735 | ) |
| Net unrealized appreciation (depreciation) of investments | | $ | (1,157,902 | ) | | $ | (42,355,339 | ) | | $ | (24,581,565 | ) | | $ | (120,589 | ) |
Permanent differences, primarily due to federal taxes paid, treatment of notional principal contracts, nondeductible stock issuance costs, distribution reallocation, adjustments for investments in real estate investment trusts, investments in partnerships and foreign currency transactions resulted in reclassifications among the Funds’ components of net assets as of June 30, 2015, the Funds’ tax year end, as follows:
| | | | | | | | | | | | | | | | |
| | | Global
Total Return
Bond | | | High Income
Bond | | | Strategic
Income | | | U.S. Infrastructure
Bond | |
| Capital paid-in | | $ | — | | | $ | 2,671 | | | $ | 11,280 | | | $ | (152 | ) |
| Undistributed (Over-distribution of) net investment income | | | (601,697 | ) | | | 6,585,134 | | | | 10,120,812 | | | | 2,207 | |
| Accumulated net realized gain (loss) | | | 601,697 | | | | (6,587,805 | ) | | | (10,132,092 | ) | | | (2,055 | ) |
The tax components of undistributed net ordinary income and net long-term capital gains as of June 30, 2015, the Funds’ tax year end, were as follows:
| | | | | | | | | | | | | | | | |
| | | Global
Total Return
Bond | | | High Income
Bond | | | Strategic
Income | | | U.S. Infrastructure
Bond | |
| Undistributed net ordinary income1 | | $ | 76,666 | | | $ | 6,128,479 | | | $ | 21,235,649 | | | $ | 47,620 | |
| Undistributed net long-term capital gains | | | — | | | | — | | | | — | | | | — | |
| 1 | Undistributed net ordinary income (on a tax basis) has not been reduced for the dividend declared during the period June 1, 2015 through June 30, 2015 and paid on July 1, 2015. Net ordinary income consists of net taxable income derived from dividends, interest and net short-term capital gains, if any. |
Notes to Financial Statements (continued)
The tax character of distributions paid during the Funds’ tax years ended June 30, 2015 and June 30, 2014, was designated for purposes of the dividends paid deduction as follows:
| | | | | | | | | | | | | | | | |
| 2015 | | Global
Total Return Bond | | | High Income
Bond | | | Strategic
Income | | | U.S. Infrastructure
Bond | |
| Distributions from net ordinary income2 | | $ | 987,815 | | | $ | 54,503,646 | | | $ | 50,714,515 | | | $ | 328,659 | |
| Distributions from net long-term capital gains3 | | | 156,028 | | | | 5,641,156 | | | | — | | | | — | |
| | | | |
| 2014 | | Global
Total Return
Bond | | | High Income
Bond | | | Strategic
Income | | | U.S. Infrastructure
Bond | |
| Distributions from net ordinary income2 | | $ | 914,394 | | | $ | 66,420,739 | | | $ | 32,566,945 | | | | $ — | |
| Distributions from net long-term capital gains | | | 109,476 | | | | 6,948,022 | | | | — | | | | — | |
| 2 | Net ordinary income consists of net taxable income derived from dividends, interest and net short-term capital gains, if any. |
| 3 | The Funds hereby designates as long-term capital gain dividend, pursuant to the Internal Revenue Code Section 852(b)(3), the amount necessary to reduce earnings and profits of the Funds related to net capital gain to zero for the tax year ended June 30, 2015. |
As of June 30, 2015, the Funds’ tax year end, the following Funds had unused capital loss carryforwards available for federal income tax purposes to be applied against future capital gains, if any. If not applied, the carryforwards will expire as shown in the following table. The losses not subject to expiration will be utilized first by a Fund.
| | | | | | | | | | | | |
| | | Global
Total Return Bond | | | Strategic
Income | | | U.S. Infrastructure
Bond | |
| Expiration June 30, 2018 | | $ | — | | | $ | 35,110,019 | | | $ | — | |
| Not subject to expiration | | | 136,207 | | | | 8,596,300 | | | | 75,108 | |
| Total | | $ | 136,207 | | | $ | 43,706,319 | | | $ | 75,108 | |
The Funds have elected to defer late-year losses in accordance with federal income tax rules. These losses are treated as having arisen on the first day of the following fiscal year. The following Funds have elected to defer losses as follows:
| | | | | | | | |
| | | Global
Total Return
Bond | | | High Income
Bond | |
| Post-October capital losses4 | | $ | — | | | $ | 29,845,915 | |
| Late-year ordinary losses5 | | | 544,566 | | | | — | |
| 4 | Capital losses incurred from November 1, 2014 through June 30, 2015, the Funds’ tax year end. |
| 5 | Ordinary losses incurred from January 1, 2015 through June 30, 2015 and/or specified losses incurred from November 1, 2014 through June 30, 2015. |
7. Management Fees and Other Transactions with Affiliates
Each Fund’s management fee compensates the Adviser for overall investment advisory and administrative services and general office facilities. The Sub-Adviser is compensated for its services to the Funds from the management fees paid to the Adviser.
Each Fund’s management fee consists of two components – a fund-level fee, based only on the amount of assets within each individual Fund, and a complex-level fee, based on the aggregate amount of all eligible fund assets managed by the Adviser. This pricing structure enables each Fund’s shareholders to benefit from growth in the assets within their respective Fund as well as from growth in the amount of complex-wide assets managed by the Adviser.
The annual Fund-level fee, payable monthly, for each Fund is calculated according to the following schedule:
| | | | | | | | | | | | | | | | |
| Average Daily Net Assets | | Global Total
Return Bond
Fund-Level
Fee | | | High Income
Bond
Fund-Level
Fee | | | Strategic
Income
Fund-Level
Fee | | | U.S. Infrastructure
Bond
Fund-Level
Fee | |
| For the first $125 million | | | 0.4000 | % | | | 0.4000 | % | | | 0.3600 | % | | | 0.4500 | % |
| For the next $125 million | | | 0.3875 | | | | 0.3875 | | | | 0.3475 | | | | 0.4375 | |
| For the next $250 million | | | 0.3750 | | | | 0.3750 | | | | 0.3350 | | | | 0.4250 | |
| For the next $500 million | | | 0.3625 | | | | 0.3625 | | | | 0.3225 | | | | 0.4125 | |
| For the next $1 billion | | | 0.3500 | | | | 0.3500 | | | | 0.3100 | | | | 0.4000 | |
| For net assets over $2 billion | | | 0.3250 | | | | 0.3250 | | | | 0.2850 | | | | 0.3875 | |
The annual complex-level fee, payable monthly, for each Fund is determined by taking the complex-level fee rate, which is based on the aggregate amount of “eligible assets” of all Nuveen funds as set forth in the schedule below, and for High Income Bond and Strategic Income, making, as appropriate, an upward adjustment to that rate based upon the percentage of the particular fund’s assets that are not “eligible assets.” The complex-level fee schedule for each Fund is as follows:
| | | | |
| Complex-Level Asset Breakpoint Level* | | Effective Rate at Breakpoint Level | |
| $55 billion | | | 0.2000 | % |
| $56 billion | | | 0.1996 | |
| $57 billion | | | 0.1989 | |
| $60 billion | | | 0.1961 | |
| $63 billion | | | 0.1931 | |
| $66 billion | | | 0.1900 | |
| $71 billion | | | 0.1851 | |
| $76 billion | | | 0.1806 | |
| $80 billion | | | 0.1773 | |
| $91 billion | | | 0.1691 | |
| $125 billion | | | 0.1599 | |
| $200 billion | | | 0.1505 | |
| $250 billion | | | 0.1469 | |
| $300 billion | | | 0.1445 | |
| * | The complex-level fee is calculated based upon the aggregate daily “eligible assets” of all Nuveen funds. Eligible assets do not include assets attributable to investments in other Nuveen funds or assets in excess of $2 billion added to the Nuveen fund complex in connection with the Adviser’s assumption of the management of the former First American Funds effective January 1, 2011. Eligible assets include closed-end fund assets managed by the Adviser that are attributable to certain types of leverage. For these purposes, leverage includes the closed-end funds’ use of preferred stock and borrowings and certain investments in the residual interest certificates (also called inverse floating rate securities) in tender option bond (TOB) trusts, including the portion of assets held by the TOB trust that has been effectively financed by the trust’s issuance of floating rate securities, subject to an agreement by the Adviser as to certain funds to limit the amount of such assets for determining eligible assets in certain circumstances. As of June 30, 2015, the complex-level fee for each Fund was as follows: |
| | | | |
| Fund | | Complex-Level Fee | |
Global Total Return Bond | | | 0.1643 | % |
High Income Bond | | | 0.1887 | |
Strategic Income | | | 0.1821 | |
U.S. Infrastructure Bond | | | 0.1643 | |
The Adviser has agreed to waive fees and/or reimburse expenses (“Expense Cap”) of the following Funds so that total annual Fund operating expenses (excluding 12b-1 distribution and/or service fees, interest expenses, taxes, acquired fund fees and expenses, fees incurred in acquiring and disposing of portfolio securities and extraordinary expenses) do not exceed the average daily net assets of any class of Fund shares in the amounts and for the time periods stated in the following table:
| | | | | | |
| Fund | | Expense Cap | | | Expense Cap
Expiration Date |
Global Total Return Bond | | | 0.75 | % | | October 31, 2016 |
Strategic Income | | | 0.59 | | | October 31, 2016 |
U.S. Infrastructure Bond | | | 0.74 | | | October 31, 2017 |
Neither Trust pays compensation directly to those of its directors/trustees who are affiliated with the Adviser or to its officers, all of whom receive remuneration for their services to each Trust from the Adviser or its affiliates. The Board has adopted a deferred compensation plan for independent directors/trustees that enable directors/trustees to elect to defer receipt of all or a portion of the annual compensation they are entitled to receive from certain Nuveen-advised funds. Under the plan, deferred amounts are treated as though equal dollar amounts had been invested in shares of select Nuveen-advised funds.
During the current fiscal period, Nuveen Securities, LLC. (the “Distributor”), a wholly-owned subsidiary of Nuveen, collected sales charges on purchases of Class A Shares, the majority of which were paid out as concessions to financial intermediaries as follows:
| | | | | | | | | | | | | | | | |
| | | Global
Total Return
Bond | | | High Income
Bond | | | Strategic
Income | | | U.S. Infrastructure
Bond | |
| Sales charges collected (Unaudited) | | $ | 7,616 | | | $ | 429,092 | | | $ | 833,206 | | | $ | 6,625 | |
| Paid to financial intermediaries (Unaudited) | | | 6,765 | | | | 385,710 | | | | 769,669 | | | | 5,835 | |
The Distributor also received 12b-1 service fees on Class A Shares, substantially all of which were paid to compensate financial intermediaries for providing services to shareholders relating to their investments.
Notes to Financial Statements (continued)
During the current fiscal period, the Distributor compensated financial intermediaries directly with commission advances at the time of purchase as follows:
| | | | | | | | | | | | | | | | |
| | | Global
Total Return
Bond | | | High Income
Bond | | | Strategic
Income | | | U.S. Infrastructure
Bond | |
| Commission advances (Unaudited) | | $ | 1,474 | | | $ | 130,764 | | | $ | 1,046,265 | | | $ | 250 | |
To compensate for commissions advanced to financial intermediaries, all 12b-1 service and distribution fees collected on Class C Shares during the first year following a purchase are retained by the Distributor. During the current fiscal period, the Distributor retained such 12b-1 fees as follows:
| | | | | | | | | | | | | | | | |
| | | Global
Total Return
Bond | | | High Income
Bond | | | Strategic
Income | | | U.S. Infrastructure
Bond | |
| 12b-1 fees retained (Unaudited) | | $ | 935 | | | $ | 114,059 | | | $ | 501,411 | | | $ | 535 | |
The remaining 12b-1 fees charged to the Funds were paid to compensate financial intermediaries for providing services to shareholders relating to their investments.
The Distributor also collected and retained CDSC on share redemptions during the current fiscal period, as follows:
| | | | | | | | | | | | | | | | |
| | | Global
Total Return
Bond | | | High Income
Bond | | | Strategic
Income | | | U.S. Infrastructure
Bond | |
| CDSC retained (Unaudited) | | $ | 33 | | | $ | 33,140 | | | $ | 65,403 | | | $ | — | |
As of the end of the reporting period, Nuveen owned shares of the Funds as follows:
| | | | | | | | |
| | | Global
Total Return
Bond | | | U.S. Infrastructure
Bond | |
| Class A | | | — | | | | 2,500 | |
| Class C | | | 2,280 | | | | 2,500 | |
| Class R3 | | | 2,280 | | | | — | |
| Class I | | | 676,175 | | | | 345,000 | |
8. Borrowing Arrangements
During the current fiscal period, the Funds participated in an unsecured bank line of credit (“Unsecured Credit Line”) under which outstanding balances would bear interest at a variable rate. On December 31, 2014, High Income Bond utilized $4,769,708 of the Unsecured Credit Line at an annualized interest rate of 1.34% on its respective outstanding balance. The remaining Funds in this report did not draw on this Unsecured Credit Line during the current fiscal period.
Subsequent to the reporting period, the Funds, along with certain other funds managed by the Adviser (“Participating Funds”), entered into a 364-day, $2.53 billion credit agreement with a group of lenders, under which the Participating Funds may borrow. This credit agreement replaces the Unsecured Credit Line described above.
The credit agreement expires in July 2016 unless extended or renewed. The credit agreement has the following terms: a fee of 0.15% per annum on unused commitment amounts and interest at a rate equal to the higher of (a) one-month LIBOR (London Inter-Bank Offered Rate) plus 1.25% per annum or (b) the Fed Funds rate plus 1.25% per annum on amounts borrowed. Participating Funds paid administration, legal and arrangement fees which, along with commitment fees, were allocated among such funds based upon portions of the aggregate commitment available to them and other factors deemed relevant by the Adviser and the Board of each Participating Fund.
9. New Accounting Pronouncement
Financial Accounting Standards Board (“FASB”) Transfers and Servicing (Topic 860): Repurchase-to-Maturity Transactions, Repurchase Financings, and Disclosures
In June 2014, the FASB issued Accounting Standards Update (“ASU”) 2014-11, Transfers and Servicing (Topic 860): Repurchase-to-Maturity Transactions, Repurchase Financings, and Disclosures” (“ASU 2014-11”), that expanded secured borrowing accounting for certain reverse repurchase agreements. ASU 2014-11 also sets forth additional disclosure requirements for certain transactions accounted for as sales in order to provide financial statement users with information to compare to similar transactions accounted for as secured borrowings. ASU 2014-11 is effective prospectively for annual periods beginning after December 15, 2014, and interim periods beginning after March 15, 2015. Management is currently evaluating the impact, if any, of ASU 2014-11 on the Funds’ financial statement disclosures.
Additional
Fund Information (Unaudited)
| | | | | | | | | | |
| | | | | |
| | Fund Manager Nuveen Fund Advisors, LLC 333 West Wacker Drive Chicago, IL 60606 Sub-Adviser Nuveen Asset Management, LLC 333 West Wacker Drive Chicago, IL 60606 | | Independent Registered
Public Accounting Firm PricewaterhouseCoopers LLP Chicago, IL 60606 Custodian State Street Bank & Trust
Company Boston, MA 02111 U.S. Bank National
Association Milwaukee, WI 53202 | | Legal Counsel Chapman and Cutler LLP Chicago, IL 60603 | | Transfer Agent and
Shareholder Services Boston Financial
Data Services Nuveen Investor Services P.O. Box 8530 Bostoxn, MA 02266-8530 (800) 257-8787 | | |
| | | | | | | | | | | | | | |
| | | | | |
| | | | | | | | | | |
| | |
| | Distribution Information: The following Funds hereby designate their percentages of dividends paid from net ordinary income as dividends qualifying for the 70% dividends received deduction (“DRD”) for corporations and their percentages as qualified dividend income (“QDI”) for individuals under Section 1(h)(11) of the Internal Revenue Code as shown in the accompanying table. The actual qualified dividend income distributions will be reported to shareholders on Form 1099-DIV which will be sent to shareholders shortly after calendar year end. | | |
| | | | | | | |
| | | | | | | | | | | High Income Bond | | Strategic Income | | |
| | %QDI | | 3% | | 3% | | |
| | %DRD | | 2% | | 2% | | |
| | | | | |
| | | | | | | | | | |
| | |
| | Quarterly Form N-Q Portfolio of Investments Information: Each Fund is required to file its complete schedule of portfolio holdings with the Securities and Exchange Commission (SEC) for the first and third quarters of each fiscal year on Form N-Q. You may obtain this information directly from the SEC. Visit the SEC on-line at http://www.sec.gov or in person at the SEC’s Public Reference Room in Washington, D.C. Call the SEC toll-free at (800) SEC-0330 for room hours and operation. | | |
| | | |
| | | | | | |
| | |
| | Nuveen Funds’ Proxy Voting Information: You may obtain (i) information regarding how each fund voted proxies relating to portfolio securities held during the most recent twelve-month period ended June 30, without charge, upon request, by calling Nuveen Investments toll-free at (800) 257-8787 or on Nuveen’s website at www.nuveen.com and (ii) a description of the policies and procedures that each fund used to determine how to vote proxies relating to portfolio securities without charge, upon request, by calling Nuveen Investments toll-free at (800) 257-8787. You may also obtain this information directly from the SEC. Visit the SEC on-line at http://www.sec.gov. | | |
| | | |
| | | | | | |
| | |
| | FINRA BrokerCheck: The Financial Industry Regulatory Authority (FINRA) provides information regarding the disciplinary history of FINRA member firms and associated investment professionals. This information as well as an investor brochure describing FINRA BrokerCheck is available to the public by calling the FINRA BrokerCheck Hotline number at (800) 289-9999 or by visiting www.FINRA.org. | | |
Glossary of Terms
Used in this Report (Unaudited)
Asset-Backed Securities (ABS): Securities whose value and income payments are derived from and collateralized by a specific pool of underlying assets. The pool of assets typically is a group of small and/or illiquid assets that may be difficult to sell individually. The underlying pools of asset-backed securities often include payments from credit cards, auto loans or mortgage loans.
Average Annual Total Return: This is a commonly used method to express an investment’s performance over a particular, usually multi-year time period. It expresses the return that would have been necessary each year to equal the investment’s actual cumulative performance (including change in NAV or offer price and reinvested dividends and capital gains distributions, if any) over the time period being considered.
Barclays Aggregate Bond Index: An unmanaged index that includes all investment-grade, publicly issued, fixed-rate, dollar denominated, nonconvertible debt issues and commercial mortgage-backed securities with maturities of at least one year and outstanding par values of $150 million or more. Index returns assume reinvestment of distributions, but do not include the effects of any applicable sales charges or management fees.
Barclays Emerging Markets USD Aggregate Bond Index is a hard currency emerging markets debt benchmark that includes fixed and floating-rate U.S. dollar-denominated debt issued from sovereign, quasi-sovereign and corporate emerging market issuers. Index returns assume reinvestment of distributions, but do not include the effects of any applicable sales charges or management fees.
Barclays Global Aggregate Unhedged Bond Index: An index that provides a broad-based measure of the global investment grade fixed-rate debt markets. Index returns assume reinvestment of distributions, but do not include the effects of any applicable sales charges or management fees.
Barclays High Yield 2% Issuer Capped Index: An issuer-constrained version of the U.S. Corporate High-Yield Index that covers the U.S. dollar denominated, non-investment grade, fixed-rate, taxable corporate bond market. Index returns assume reinvestment of distributions, but do not include the effects of any applicable sales charges or management fees.
Barclays Pan-European High Yield Index: An unmanaged index that measures the market of non-investment grade, fixed-rate corporate bonds denominated in the following currencies: euro, Pounds sterling, Norwegian krone, Swedish krona, and Swiss franc. Securities are classified as high yield if the middle rating of Moody’s, Fitch, and S&P is Ba1/BB+/BB+ or below. Inclusion is based on the currency of issue, and not the domicile of the issuer. The index excludes emerging market debt. Index returns account for the effects of management fees and assume reinvestment of distributions, but do not reflect any applicable sales charges.
Barclays Taxable Municipal Aggregate Eligible Index: A rules based, market-value weighted index engineered for the long-term taxable bond market. To be included in the index, the bonds must meet the eligibility requirements of the U.S. Aggregate Index. Index returns assume reinvestment of distributions, but do not reflect any applicable sales charges or management fees.
Barclays U.S. Corporate Investment Grade Index: A broad-based benchmark that measures the investment grade, fixed-rate, taxable corporate bond market. Index returns assume reinvestment of distributions, but do not reflect any applicable sales charges or management fees.
Barclays U.S. Corporate High Yield Bond Index is an unmanaged index that covers the universe of fixed rate, non-investment grade debt. Index returns assume reinvestment of distributions, but do not include the effects of any applicable sales charges or management fees.
Commercial Mortgage-Backed Securities (CMBS): Commercial mortgage-backed securities are backed by cash flows of a mortgage or pool of mortgages on commercial real estate. CMBS generally are structured to provide protection to the senior class investors against potential losses on the underlying mortgage loans. CMBS are typically characterized by the following: i) loans on multi-family housing, non-residential property, ii) payments based on the amortization schedule of 25-30 years with a balloon payment due usually after 10 years, and iii) restrictions on prepayments.
Duration: Duration is a measure of the expected period over which a bond’s principal and interest will be paid, and consequently is a measure of the sensitivity of a bond’s or bond fund’s value to changes when market interest rates change. Generally, the longer a bond’s or fund’s duration, the more the price of the bond or fund will change as interest rates change.
Gross Domestic Product (GDP): The total market value of all final goods and services produced in a country/region in a given year, equal to total consumer, investment and government spending, plus the value of exports, minus the value of imports.
Lipper General & Insured Municipal Debt Funds Classification Average: Represents the average annualized total return for all reporting funds in the Lipper General & Insured Municipal Debt Funds Classification. Lipper returns account for the effects of management fees and assume reinvestment of distributions, but do not reflect any applicable sales charges.
Lipper Global Income Funds Classification Average: Represents the average annualized returns for all reporting funds in the Lipper Global Income Funds Classification. Lipper returns account for the effects of management fees and assume reinvestment of distributions, but do not reflect any applicable sales charge.
Lipper High Current Yield Funds Classification Average: Represents the average annualized returns for all reporting funds in the Lipper High Current Yield Funds Classification. Lipper returns account for the effects of management fees and assume reinvestment of distributions, but do not reflect any applicable sales charge.
Lipper Multi-Sector Income Funds Classification Average: Represents the average annualized returns for all reporting funds in the Lipper Multi-Sector Income Funds Classification. Lipper returns account for the effects of management fees and assume reinvestment of distributions, but do not reflect any applicable sales charge.
Mortgage-Backed Securities (MBS): Mortgage-backed securities (MBS) are bonds backed by pools of mortgages, usually with similar characteristics, and which return principal and interest in each payment. MBS are composed of residential mortgages (RMBS) or commercial mortgages (CMBS). RMBS are further divided into agency RMBS and non-agency RMBS, depending on the issuer.
Net Asset Value (NAV) Per Share: A fund’s Net Assets is equal to its total assets (securities, cash and accrued earnings) less its total liabilities. For funds with multiple classes, Net Assets are determined separately for each share class. NAV per share is equal to the fund’s (or share class’) Net Assets divided by its number of shares outstanding.
Residential Mortgage-Backed Securities (RMBS): Residential mortgage-backed securities are securities the payments on which depend primarily on the cash flow from residential mortgage loans made to borrowers that are secured by residential real estate. RMBS consist of agency and non-agency RMBS. Agency RMBS have agency guarantees that assure investors that they will receive timely payment of interest and principal, regardless of delinquency or default rates on the underlying loans. Agency RMBS include securities issued by the Government National Mortgage Association, the Federal National Mortgage Association and the Federal Home Loan Mortgage Corporation, and other federal agencies, or issues guaranteed by them. Non-agency RMBS do not have agency guarantees. Non-agency RMBS have credit enhancement built into the structure to shield investors from borrower delinquencies. The spectrum of non-agency residential mortgage loans includes traditional jumbo loans (prime), alternative-A loans (Alt-A), and home equity loans (sub-prime).
Tax Equalization: The practice of treating a portion of the distribution made to a redeeming shareholder, which represents his proportionate part of undistributed net investment income and capital gain as a distribution for tax purposes. Such amounts are referred to as the equalization debits (or payments) and will be considered a distribution to the shareholder of net investment income and capital gain for calculation of the Fund’s dividends paid deduction.
Annual Investment Management Agreement
Approval Process (Unaudited)
The Board of Directors or Trustees (as the case may be) of each Fund (each, a “Board” and each Director or Trustee, a “Board Member”), including the Board Members who are not parties to the Funds’ advisory or sub-advisory agreements or “interested persons” of any such parties (the “Independent Board Members”), is responsible for overseeing the performance of the investment adviser and sub-adviser to the respective Fund and determining whether to continue such Fund’s advisory agreement (the “Investment Management Agreement”) between the Fund and Nuveen Fund Advisors, LLC (the “Adviser”) and the sub-advisory agreement (the “Sub-Advisory Agreement” and, together with the Investment Management Agreement, the “Advisory Agreements”) between the Adviser and Nuveen Asset Management, LLC (the “Sub-Adviser”). Following an initial term with respect to each Fund upon its commencement of operations, the Board is required to consider the continuation of the Advisory Agreements on an annual basis pursuant to the requirements of the Investment Company Act of 1940, as amended (the “1940 Act”). Accordingly, at an in-person meeting held on May 11-13, 2015 (the “May Meeting”), the Board, including a majority of the Independent Board Members, considered and approved the existing Advisory Agreements for the Funds.
In preparation for its considerations at the May Meeting, the Board received in advance of the meeting extensive materials prepared in connection with the review of the Advisory Agreements. The materials provided a broad range of information regarding the Funds, including, among other things, the nature, extent and quality of services provided by the Adviser and the Sub-Adviser (the Adviser and Sub-Adviser are collectively, the “Fund Advisers” and each, a “Fund Adviser”); Fund performance including performance assessments against peers and the appropriate benchmark(s); fee and expense information of the Funds compared to peers; a description and assessment of shareholder service levels for the Funds; a summary of the performance of certain service providers; a review of product initiatives and shareholder communications; and profitability information of the Fund Advisers as described in further detail below. As part of its annual review, the Board also held a separate meeting on April 14-15, 2015 to review the Funds’ investment performance and consider an analysis by the Adviser of the Sub-Adviser which generally evaluated the Sub-Adviser’s investment team, investment mandate, organizational structure and history, investment philosophy and process, and the performance of the Funds, and any significant changes to the foregoing. During the review, the Independent Board Members asked questions of and requested additional information from management.
The Board considered that the evaluation process with respect to the Fund Advisers is an ongoing process that encompassed the information and knowledge gained throughout the year. The Board, acting directly or through its committees, met regularly during the course of the year and received information and considered factors at each meeting that would be relevant to its annual consideration of the Advisory Agreements, including information relating to Fund performance; Fund expenses; investment team evaluations; and valuation, compliance, regulatory and risk matters. In addition to regular reports, the Adviser provided special reports to the Board to enhance the Board’s understanding on topics that impact some or all of the Nuveen funds and the Adviser (such as presentations on risk and stress testing; the new governance, risk and compliance system; cybersecurity developments; Nuveen fund accounting and reporting matters; regulatory developments impacting the investment company industry and the business plans or other matters impacting the Adviser). The Board also met with key investment personnel managing certain Nuveen fund portfolios during the year.
The Board had created several standing committees including the Open-End Funds Committee and the Closed-End Funds Committee to assist the full Board in monitoring and gaining a deeper insight into the distinctive business practices of closed-end and open-end funds. These Committees met prior to each quarterly Board meeting, and the Adviser provided presentations to these Committees permitting them to delve further into specific matters or initiatives impacting the respective product line.
The Board also continued its program of seeking to have the Board Members or a subset thereof visit each sub-adviser to the Nuveen funds at least once over a multiple year rotation, meeting with key investment and business personnel. In this regard, the Independent Board Members made site visits to multiple equity and fixed-income investment teams of the Sub-Adviser in June 2014.
The Board considered the information provided and knowledge gained at these meetings and visits during the year when performing its annual review of the Advisory Agreements. The Independent Board Members also were assisted throughout the process by independent legal counsel. During the course of the year and during their deliberations regarding the review of advisory contracts, the Independent Board Members met with independent legal counsel in executive sessions without management present. The Independent Board Members also received a memorandum from independent legal counsel outlining the legal standards for their consideration of the proposed continuation of the Advisory Agreements. In addition, it is important to recognize that the management arrangements for the Nuveen funds are the result of many years of review and discussion between the Independent Board Members and Fund management and that the Board Members’ conclusions may be based, in part, on their consideration of fee arrangements and other factors developed in previous years.
The Board took into account all factors it believed relevant with respect to each Fund, including, among other things: (a) the nature, extent and quality of the services provided by the Fund Advisers; (b) the investment performance of the Funds and Fund Advisers; (c) the advisory fees and costs of the services to be provided to the Funds and the profitability of the Fund Advisers; (d) the extent of any economies of scale; (e) any benefits derived by the
Fund Advisers from the relationship with the Funds; and (f) other factors. Each Board Member may have accorded different weight to the various factors in reaching his or her conclusions with respect to the Advisory Agreements applicable to the respective Fund. The Independent Board Members did not identify any single factor as all-important or controlling. The Independent Board Members’ considerations were instead based on a comprehensive consideration of all the information presented. The principal factors considered by the Board and its conclusions are described below.
A. Nature, Extent and Quality of Services
In evaluating the renewal of the Advisory Agreements, the Independent Board Members received and considered information regarding the nature, extent and quality of the applicable Fund Adviser’s services provided to the respective Fund. The Board reviewed information regarding, among other things, each Fund Adviser’s organization and business, the types of services that each Fund Adviser or its affiliates provided to the Funds, the performance record of the Funds (as described in further detail below), and any initiatives that had been undertaken on behalf of the open-end product line. The Board recognized the high quality of services the Adviser had provided to the Funds over the years and the conscientiousness with which the Adviser provided these services. The Board also considered the improved capital structure of Nuveen Investments, Inc. (“Nuveen”) (the parent of the Adviser) following the acquisition of Nuveen by TIAA-CREF in 2014 (the “TIAA-CREF Transaction”).
With respect to the services, the Board noted the Funds were registered investment companies that operated in a regulated industry and considered the myriad of investment management, administrative, compliance, oversight and other services the Adviser provided to manage and operate the Funds. Such services included, among other things: (a) product management (such as analyzing ways to better position a Nuveen fund in the marketplace, setting dividends; maintaining relationships to gain access to distribution platforms; and providing shareholder communications); (b) fund administration (such as preparing tax returns and other tax compliance services, preparing regulatory filings and shareholder reports; managing fund budgets and expenses; overseeing a fund’s various service providers and supporting and analyzing new and existing funds); (c) Board administration (such as supporting the Board and its committees, in relevant part, by organizing and administering the Board and committee meetings and preparing the necessary reports to assist the Board in its duties); (d) compliance (such as monitoring adherence to a fund’s investment policies and procedures and applicable law; reviewing the compliance program periodically and developing new policies or updating existing compliance policies and procedures as considered necessary or appropriate; responding to regulatory requests; and overseeing compliance testing of the funds’ sub-advisers); (e) legal support (such as preparing or reviewing fund registration statements, proxy statements and other necessary materials; interpreting regulatory requirements and compliance thereof; and maintaining applicable registrations); and (f) investment services (such as overseeing and reviewing the funds’ sub-advisers and their investment teams; analyzing performance of the funds; overseeing investment and risk management; evaluating brokerage transactions and securities lending, overseeing the daily valuation process for portfolio securities and developing and recommending valuation policies and methodologies and changes thereto; reporting to the Board on various matters including performance, risk and valuation; and participating in fund development, leverage management, and the developing or interpreting of investment policies and parameters).
In its review, the Board considered information highlighting the various initiatives that the Adviser had implemented or continued during the last year to enhance its services to the Nuveen funds. The Board recognized that some of these initiatives are a result of a multi-year process. In reviewing the activities of 2014, the Board recognized the Adviser’s continued focus on fund rationalization for open-end funds through mergers, fund closures or repositioning the funds in seeking to enhance shareholder value, reduce costs, improve performance, eliminate fund overlap and better meet shareholder needs. The Board noted the Adviser’s investment in additional staffing to strengthen and improve its services to the Nuveen funds, including with respect to risk management and valuation. The Board recognized that expanding the depth and range of its risk oversight activities had been a major priority for the Adviser in recent years, and the Adviser continued to add to the risk management team, develop additional risk management programs and create committees or other teams designated to oversee or evaluate certain risks, such as liquidity risk, enterprise risk, investment risk and cybersecurity risk. The Adviser had also continued to add to the valuation team, launched its centralized securities valuation system which is intended to provide for uniform pricing and reporting across the complex as the system continues to develop, continued to refine its valuation analysis and updated related policies and procedures and evaluated and assessed pricing services. The Board considered the Adviser’s ongoing investment in information technology and operations and the various projects of the information technology team to support the continued growth and complexity of the Nuveen funds and increase efficiencies in their operations. The Board also recognized the Adviser’s strong commitment to compliance and reviewed information reflecting the compliance group’s ongoing activities to enhance its compliance system and refine its compliance procedures as well as the Chief Compliance Officer’s report regarding the compliance team, the initiatives the team had undertaken in 2014 and proposed for 2015, the compliance functions and reporting process, the record of compliance with the policies and procedures and its supervision activities of other service providers.
With respect to the open-end fund product line, the Adviser had also, among other things: developed new funds in seeking to enhance the product line; enhanced the reporting to the Board and its committees regarding payments to intermediaries; and continued to explore opportunities for potential funds.
As noted, the Adviser also oversees the Sub-Adviser who primarily provides the portfolio advisory services to the Funds. The Board recognized the skill and competency of the Adviser in monitoring and analyzing the performance of the Sub-Adviser and managing the sub-advisory relationship. In considering the Sub-Advisory Agreements and supplementing its prior knowledge, the Board considered a current report provided by the Adviser
Annual Investment Management Agreement Approval Process (Unaudited) (continued)
analyzing, among other things, the Sub-Adviser’s investment team and changes thereto, investment approach, organization and history, and assets under management, and the investment performance of each Fund.
Based on their review, the Independent Board Members found that, overall, the nature, extent and quality of services provided to the Funds under each respective Advisory Agreement were satisfactory.
B. The Investment Performance of the Funds and Fund Advisers
The Board, including the Independent Board Members, considered the performance history of each Fund over various time periods. The Board reviewed reports, including an analysis of the Funds’ performance and the applicable investment team. The Board reviewed, among other things, each Fund’s investment performance both on an absolute basis and in comparison to peer funds (the “Performance Peer Group”) and to recognized and/or customized benchmarks (i.e., generally benchmarks derived from multiple recognized benchmarks) for the quarter, one-, three- and five-year periods ending December 31, 2014, as well as performance information reflecting the first quarter of 2015 (or for such shorter periods available for Nuveen Global Total Return Bond Fund (the “Global Total Return Fund”) and Nuveen U.S. Infrastructure Bond Fund (the “U.S. Infrastructure Fund”), which did not exist for part of the foregoing time frame). In its review, the Board noted that it also reviewed Fund performance results at each of its quarterly meetings.
In evaluating performance, the Board recognized several factors that may impact the performance data as well as the consideration given to particular performance data.
| | • | | The performance data reflected a snapshot in time, in this case as of the end of the most recent calendar year or quarter. A different performance period, however, could generate significantly different results. |
| | • | | Long-term performance can be adversely affected by even one period of significant underperformance so that a single investment decision or theme had the ability to disproportionately affect long-term performance. |
| | • | | The investment experience of a particular shareholder in a fund would vary depending on when such shareholder invested in the fund, the class held (if multiple classes are offered in the fund) and the performance of the fund (or respective class) during that shareholder’s investment period. |
| | • | | Open-end funds offer multiple classes and the performance data provided for open-end funds was based on Class A shares. The performance of the other classes of a fund, however, should be substantially similar on a relative basis because all of the classes would be invested in the same portfolio of securities and differences in performance among classes could be principally attributed to the variations in distribution and servicing expenses of each class. |
| | • | | The Board recognized that the funds in the Performance Peer Group may differ somewhat from the Nuveen fund with which it is being compared and due to these differences, performance comparisons between certain of the Nuveen funds and their Performance Peer Groups may be inexact and the relevancy limited. The Board considered that management had classified the Performance Peer Group as low, medium and high in relevancy. The Board took the analysis of the relevancy of the Performance Peer Group into account when considering the comparative performance data. The Board also considered comparative performance of an applicable benchmark. While the Board was cognizant of the relative performance of a Fund’s peer set and/or benchmark(s), the Board evaluated Fund performance in light of the respective Fund’s investment objectives, investment parameters and guidelines and considered that the variations between the objectives and investment parameters or guidelines of the Fund with its peers and/or benchmarks result in differences in performance results. |
With respect to any Nuveen funds for which the Board has identified performance concerns, the Board monitors such funds closely until performance improves, discusses with the Adviser the reasons for such results, considers those steps necessary or appropriate to address such issues, and reviews the results of any efforts undertaken. The Board is aware, however, that shareholders chose to invest or remain invested in a fund knowing that the Adviser manages the fund and knowing the fund’s fee structure.
In considering the performance data, the Independent Board Members noted the following with respect to the Funds:
For the Global Total Return Fund, the Board noted that the Fund ranked in its Performance Peer Group in the second quartile for the one- and three-year periods and outperformed its benchmark for such periods.
For Nuveen High Income Bond Fund, the Board noted that, although the Fund ranked in the fourth quartile in its Performance Peer Group in the shorter one-year period, the Fund ranked in the first quartile in the three-year period and second quartile in the five-year period. Although the Fund underperformed its benchmark in the one- and five-year periods, the Fund slightly outperformed its benchmark in the three-year period.
For Nuveen Strategic Income Fund (the “Strategic Income Fund”), the Board noted that the Fund ranked in its Performance Peer Group in the first quartile in the one- and three-year periods and the second quartile in the five-year period. Although the Fund underperformed its benchmark in the one-year period, it outperformed its benchmark in the three- and five-year periods.
For the U.S. Infrastructure Fund, the Board noted that the Fund was new with a performance history that was too short to make a conclusive assessment of its limited performance record.
Except as otherwise noted above, based on their review, the Independent Board Members determined that each Fund’s investment performance had been satisfactory.
C. Fees, Expenses and Profitability
1. Fees and Expenses
The Board evaluated the management fees and other fees and expenses of each Fund (expressed as a percentage of average net assets) in absolute terms and in comparison to the fee and expense levels of a comparable universe of funds (the “Peer Universe”) and, with respect to open-end funds, to a more focused subset in the Peer Universe (the “Peer Group”), each selected by an independent third-party fund data provider. The Independent Board Members reviewed the methodology regarding the construction of the Peer Universe and Peer Group for each Fund. The Board reviewed, among other things, such Fund’s gross management fees, net management fees and net expense ratios in absolute terms as well as compared to the average and median fee and expense levels of the Peer Universe and/or Peer Group. The Board noted that the net total expense ratios paid by investors in the Funds were the most representative of an investor’s net experience. The Board Members also considered any fee waivers and/or expense reimbursement arrangements currently in effect for the Funds.
In reviewing the comparative fee and expense information, the Independent Board Members recognized that various factors such as the limited size and particular composition of the Peer Universe or Peer Group (including the inclusion of other Nuveen funds in the peer set); expense anomalies; changes in the funds comprising the Peer Universe or Peer Group from year to year; levels of reimbursement or fee waivers; the timing of information used; and differences in services provided can impact the comparative data limiting the usefulness of the data to help make a conclusive assessment of the Funds’ fees and expenses.
In reviewing the fee schedule for a fund, the Independent Board Members also considered the fund-level and complex-wide breakpoint schedules (described in further detail below) and any fee waivers and reimbursements provided by Nuveen. In reviewing fees and expenses, the Board considered the expenses and fees to be higher if they were over 10 basis points higher, slightly higher if they were approximately 6 to 10 basis points higher, in line if they were within approximately 5 basis points higher than the peer average and below if they were below the peer average of the Peer Group. In reviewing the reports, the Board noted that the majority of the Nuveen funds had a net expense ratio near or below their peer average.
The Independent Board Members recognized that the Funds had a net management fee and a net expense ratio below their peer averages. With respect to the Global Total Return Fund and the U.S. Infrastructure Fund, the Board noted that these Funds did not have a management fee after fee waivers and expense reimbursements for the latest fiscal year.
Based on their review of the fee and expense information provided, the Independent Board Members determined that each Fund’s management fees (as applicable) to a Fund Adviser were reasonable in light of the nature, extent and quality of services provided to the Fund.
2. Comparisons with the Fees of Other Clients
The Board considered information regarding the fees a Fund Adviser assessed to the Nuveen funds compared to that of other clients as described in further detail below. With respect to non-municipal funds, such other clients of the Adviser and/or its affiliated sub-advisers may include: separately managed accounts (such as retail, institutional or wrap accounts), hedge funds, other investment companies that are not offered by Nuveen but are sub-advised by one of Nuveen’s affiliated sub-advisers, foreign investment companies offered by Nuveen, and collective investment trusts.
The Board recognized that each Fund had an affiliated sub-adviser and therefore the overall Fund management fee can be divided into two components, the fee retained by the Adviser and the fee paid to the Sub-Adviser. In reviewing the nature of the services provided by the Adviser, including through its affiliated sub-advisers, the Board considered the range of advisory fee rates for retail and institutional managed accounts advised by Nuveen-affiliated sub-advisers. The Board also reviewed, among other things, the average fee the affiliated sub-advisers assessed such clients as well as the range of fee rates assessed to the different types of clients (such as retail, institutional and wrap accounts as well as non-Nuveen funds) applicable to such sub-advisers.
In reviewing the comparative information, the Board also reviewed information regarding the differences between the Funds and the other clients, including differences in services provided, investment policies, investor profiles, compliance and regulatory requirements and account sizes. The Board recognized the breadth of services necessary to operate a registered investment company (as described above) and that, in general terms, the Adviser provided the administrative and other support services to the Funds and, although the Sub-Adviser may provide some of these services, the Sub-Adviser essentially provided the portfolio management services. In general, the Board noted that higher fee levels reflected higher levels of service provided by the Fund Adviser, increased investment management complexity, greater product management requirements and higher levels of business risk or some combination of the foregoing. The Independent Board Members considered the differences in structure and operations of
Annual Investment Management Agreement Approval Process (Unaudited) (continued)
separately managed accounts and hedge funds from registered funds and noted that the range of day-to-day services was not generally of the breadth required for the registered funds. Many of the additional administrative services provided by the Adviser were not required for institutional clients or funds sub-advised by a Nuveen-affiliated sub-adviser that were offered by other fund groups. The Independent Board Members also recognized that the management fee rates of the foreign funds advised by the Adviser may vary due to, among other things, differences in the client base, governing bodies, operational complexities and services covered by the management fee. Given the inherent differences in the various products, particularly the extensive services provided to the Funds, the Independent Board Members believed such facts justify the different levels of fees.
3. Profitability of Fund Advisers
In conjunction with their review of fees, the Independent Board Members also considered the profitability of Nuveen for its advisory activities and its financial condition. The Independent Board Members reviewed, among other things, the adjusted operating margins for Nuveen for the last two calendar years, the revenues, expenses, net income (pre-tax and after-tax) and net revenue margins (pre-tax and after-tax) of Nuveen’s managed fund advisory activities for the last two calendar years, the allocation methodology used by Nuveen in preparing the profitability data and a history of the adjustments to the methodology due to changes in the business over time. The Independent Board Members also reviewed the revenues, expenses, net income (pre-tax and after-tax) and revenue margin (pre-tax and post-tax) of the Adviser and, as described in further detail below, each affiliated sub-adviser for the 2014 calendar year. In reviewing the profitability data, the Independent Board Members noted the subjective nature of cost allocation methodologies used to determine profitability as other reasonable methods could also have been employed but yield different results. The Independent Board Members reviewed an analysis of the key drivers behind the changes in revenues and expenses that impacted profitability in 2014. The Independent Board Members recognized that Nuveen’s net revenue margin from advisory activities for 2014 was consistent with 2013. The Independent Board Members also considered the profitability of Nuveen in comparison to the adjusted operating margins of other investment advisers with publicly available data and with comparable assets under management (based on asset size and asset composition) to Nuveen. The Independent Board Members noted that Nuveen’s adjusted operating margins appeared to be reasonable in relation to such other advisers. The Independent Board Members, however, recognized the difficulty of making comparisons of profitability from fund investment advisory contracts as the information is not generally publicly available, the information for the investment advisers that was publicly available may not be representative of the industry and various other factors would impact the profitability data such as differences in services offered, business mix, expense methodology and allocations, capital structure and costs, complex size, and types of funds and other accounts managed.
The Independent Board Members noted this information supplemented the profitability information requested and received during the year and noted that two Independent Board Members served as point persons to review the profitability analysis and methodologies employed, and any changes thereto, and to keep the Board apprised of such changes during the year.
The Independent Board Members determined that Nuveen appeared to be sufficiently profitable to operate as a viable investment management firm and to honor its obligations as a sponsor of the Nuveen funds. The Independent Board Members noted the Adviser’s continued expenditures to upgrade its investment technology and increase personnel and recognized the Adviser’s continued commitment to its business to enhance the Adviser’s capacity and capabilities in providing the services necessary to meet the needs of the Nuveen funds as they grow or change over time. The Independent Board Members also noted that the sub-advisory fees for the Nuveen funds are paid by the Adviser, however, the Board recognized that many of the sub-advisers, including the Sub-Adviser, are affiliated with Nuveen. The Independent Board Members also noted the increased resources and support available to Nuveen as well as an improved capital structure as a result of the TIAA-CREF Transaction.
With respect to the Sub-Adviser, the Independent Board Members reviewed the Sub-Adviser’s revenues, expenses and revenue margins (pre- and post-tax) for its advisory activities for the calendar year ended December 31, 2014. The Independent Board Members also reviewed profitability analysis reflecting the revenues, expenses and the revenue margin (pre- and post-tax) by asset type for the Sub-Adviser for the calendar year ended December 31, 2014.
In evaluating the reasonableness of the compensation, the Independent Board Members also considered other amounts paid to a Fund Adviser by the Funds as well as indirect benefits (such as soft dollar arrangements), if any, the Fund Adviser and its affiliates received or were expected to receive that were directly attributable to the management of a Fund. See Section E below for additional information on indirect benefits a Fund Adviser may receive as a result of its relationship with the Funds.
Based on their review, the Independent Board Members determined that the Adviser’s and the Sub-Adviser’s level of profitability was reasonable in light of the respective services provided.
D. Economies of Scale and Whether Fee Levels Reflect These Economies of Scale
The Independent Board Members recognized that, as the assets of a particular fund or the Nuveen complex in the aggregate increase over time, economies of scale may be realized, and the Independent Board Members considered the extent to which the funds benefit from such economies of scale. Although the Independent Board Members recognized that economies of scale are difficult to measure, the Board recognized that one method
to help ensure the shareholders share in these benefits is to include breakpoints in the management fee schedule reducing fee rates as asset levels grow. The Independent Board Members noted that, subject to certain exceptions, the management fees of the funds in the Nuveen complex are generally comprised of a fund-level component and complex-level component. Each component of the management fee for each Fund included breakpoints to reduce management fee rates of the Fund as the Fund grows and, as described below, as the Nuveen complex grows. In addition to fund-specific breakpoint schedules which reduce the fee rates of a particular fund as its assets increase, the Independent Board Members recognized that the Adviser also passed on the benefits of economies of scale through the complex-wide fee arrangement which reduced management fee rates as assets in the fund complex reached certain levels. The complex-wide fee arrangement seeks to provide the benefits of economies of scale to fund shareholders when total fund complex assets increase, even if assets of a particular fund are unchanged or have decreased. The approach reflected the notion that some of Nuveen’s costs were attributable to services provided to all its funds in the complex, and therefore all funds benefit if these costs were spread over a larger asset base. The Independent Board Members reviewed the breakpoint and complex-wide schedules and the fee reductions achieved as a result of such structures for the 2014 calendar year.
The Independent Board Members also noted that additional economies of scale were shared with shareholders of the Global Total Return Fund, the Strategic Income Fund and the U.S. Infrastructure Fund through the adoption of temporary expense caps. The Independent Board Members further considered that as part of the TIAA-CREF Transaction, Nuveen agreed, for a period of two years from the date of the closing of the TIAA-CREF Transaction, not to increase contractual management fees for any Nuveen fund and, with respect to funds with expense caps, not to raise expense cap levels for such funds from levels in effect at that time or scheduled to go into effect prior to the closing of the TIAA-CREF Transaction. The commitment would not limit or otherwise affect mergers or liquidations of any funds in the ordinary course.
Based on their review, the Independent Board Members concluded that the current fee structure was acceptable and reflected economies of scale to be shared with shareholders when assets under management increase.
E. Indirect Benefits
The Independent Board Members received and considered information regarding potential “fall out” or ancillary benefits the respective Fund Adviser or its affiliates may receive as a result of its relationship with the Funds. In this regard, the Independent Board Members recognized that an affiliate of the Adviser served as the Funds’ principal underwriter and may receive compensation therefore from, among other things, sales charges, distribution fees and shareholder services fees (which included fees received pursuant to any 12b-1 plan). The Independent Board Members therefore took into account, among other things, the 12b-1 fees retained by Nuveen during the last calendar year.
In addition to the above, the Independent Board Members considered whether the Fund Adviser received any benefits from soft dollar arrangements whereby a portion of the commissions paid by a Fund for brokerage may be used to acquire research that may be useful to the Fund Adviser in managing the assets of the Fund and other clients. The Funds’ portfolio transactions are allocated by the Sub-Adviser. Accordingly, the Independent Board Members considered that the Sub-Adviser may benefit from research provided by broker-dealers executing portfolio transactions on behalf of the Funds. With respect to any fixed income securities, however, the Board recognized that such securities generally trade on a principal basis that does not generate soft dollar credits. Similarly, the Board recognized that any research received pursuant to soft dollar arrangements by the Sub-Adviser may also benefit the Funds and shareholders to the extent the research enhanced the ability of the Sub-Adviser to manage the Funds. The Independent Board Members noted that the Sub-Adviser’s profitability may be somewhat lower if it had to acquire any such research services directly.
Based on their review, the Independent Board Members concluded that any indirect benefits received by a Fund Adviser as a result of its relationship with the Funds were reasonable and within acceptable parameters.
F. Other Considerations
The Independent Board Members did not identify any single factor discussed previously as all-important or controlling. The Board Members, including the Independent Board Members, concluded that the terms of each Advisory Agreement were fair and reasonable, that the respective Fund Adviser’s fees were reasonable in light of the services provided to each Fund and that the Advisory Agreements be renewed.
Trustees
and Officers (Unaudited)
The management of the Funds, including general supervision of the duties performed for the Funds by the Adviser, is the responsibility of the Board of trustees of the Funds. The number of directors of the Funds is currently set at eleven. None of the trustees who are not “interested” persons of the Funds (referred to herein as “independent trustees”) has ever been a director or employee of, or consultant to, Nuveen or its affiliates. The names and business addresses of the trustees and officers of the Funds, their principal occupations and other affiliations during the past five years, the number of portfolios each oversees and other directorships they hold are set forth below.
The Funds’ Statement of Additional Information (“SAI”) includes more information about the trustees. To request a free copy, call Nuveen Investments at (800) 257-8787 or visit the Funds’ website at www.nuveen.com.
| | | | | | | | |
Name, Year of Birth & Address | | Position(s) Held with the Funds | | Year First Elected or Appointed (1) | | Principal Occupation(s) Including other Directorships During Past 5 Years | | Number of Portfolios in Fund Complex Overseen by Trustee |
| | | |
| Independent Trustee: | | | | |
William J. Schneider 1944 333 W. Wacker Drive Chicago, IL 60606 | | Chairman of the Board and Trustee | | 1996 | | Chairman of Miller-Valentine Partners, a real estate investment company; formerly, Senior Partner and Chief Operating Officer (retired 2004) of Miller-Valentine Group; owner in several other Miller-Valentine entities; Board Member of Med-America Health System, and WDPR Public Radio Station; formerly, member, Business Advisory Council, Cleveland Federal Reserve Bank and University of Dayton Business School Advisory Council. | | 194 |
Jack B. Evans 1948 333 W. Wacker Drive Chicago, IL 60606 | | Trustee | | 1999 | | President, The Hall-Perrine Foundation, a private philanthropic corporation (since 1996); Director and Chairman, United Fire Group, a publicly held company; formerly, President Pro-Tem of the Board of Regents for the State of Iowa University System; Director, Source Media Group; Life Trustee of Coe College; formerly, Director, Alliant Energy; formerly, Director, Federal Reserve Bank of Chicago; formerly, President and Chief Operating Officer, SCI Financial Group, Inc., a regional financial services firm. | | 194 |
William C. Hunter 1948 333 W. Wacker Drive Chicago, IL 60606 | | Trustee | | 2004 | | Dean Emeritus, formerly, Dean, Tippie College of Business, University of Iowa (2006-2012); Director (since 2004) of Xerox Corporation; Director (since 2005), and President (since 2012) Beta Gamma Sigma, Inc., The International Business Honor Society; Director of Wellmark, Inc. (since 2009); formerly, Dean and Distinguished Professor of Finance, School of Business at the University of Connecticut (2003-2006); previously, Senior Vice President and Director of Research at the Federal Reserve Bank of Chicago (1995-2003); formerly, Director (1997-2007), Credit Research Center at Georgetown University. | | 194 |
David J. Kundert 1942 333 W. Wacker Drive Chicago, IL 60606 | | Trustee | | 2005 | | Formerly, Director, Northwestern Mutual Wealth Management Company (2006-2013); retired (since 2004) as Chairman, JPMorgan Fleming Asset Management, President and CEO, Banc One Investment Advisors Corporation, and President, One Group Mutual Funds; prior thereto, Executive Vice President, Banc One Corporation and Chairman and CEO, Banc One Investment Management Group; Regent Emeritus, Member of Investment Committee, Luther College; member of the Wisconsin Bar Association; member of Board of Directors and Chair of Investment Committee, Greater Milwaukee Foundation; member of the Board of Directors (Milwaukee), College Possible. | | 194 |
| | | | | | | | |
Name, Year of Birth & Address | | Position(s) Held with the Funds | | Year First Elected or Appointed (1) | | Principal Occupation(s) Including other Directorships During Past 5 Years | | Number of Portfolios in Fund Complex Overseen by Trustee |
John K. Nelson 1962 333 West Wacker Drive Chicago, IL 60606 | | Trustee | | 2013 | | Member of Board of Directors of Core12 LLC (since 2008), a private firm which develops branding, marketing and communications strategies for clients; Director of The Curran Center for Catholic American Studies (since 2009) and The President’s Council, Fordham University (since 2010); formerly senior external advisor to the financial services practice of Deloitte Consulting LLP (2012-2014); formerly, Chairman of the Board of Trustees of Marian University (2010 as trustee, 2011-2014 as Chairman); formerly, Chief Executive Officer of ABN AMRO N.V. North America, and Global Head of its Financial Markets Division (2007-2008); prior senior positions held at ABN AMRO include Corporate Executive Vice President and Head of Global Markets—the Americas (2006-2007), CEO of Wholesale Banking—North America and Global Head of Foreign Exchange and Futures Markets (2001-2006), and Regional Commercial Treasurer and Senior Vice President Trading—North America (1996-2001); formerly, Trustee at St. Edmund Preparatory School in New York City. | | 194 |
Judith M. Stockdale 1947 333 W. Wacker Drive Chicago, IL 60606 | | Trustee | | 1997 | | Board Member, Land Trust Alliance (since 2013) and U.S. Endowment for Forestry and Communities (since 2013); formerly, Executive Director (1994-2012), Gaylord and Dorothy Donnelley Foundation; prior thereto, Executive Director, Great Lakes Protection Fund (1990-1994). | | 194 |
Carole E. Stone 1947 333 W. Wacker Drive Chicago, IL 60606 | | Trustee | | 2007 | | Director, Chicago Board Options Exchange (since 2006), C2 Options Exchange, Incorporated (since 2009) Director, CBOE Holdings, Inc. (since 2010); formerly, Commissioner, New York State Commission on Public Authority Reform (2005-2010). | | 194 |
Virginia L. Stringer 1944 333 W. Wacker Drive Chicago, IL 60606 | | Trustee | | 2011 | | Board Member, Mutual Fund Directors Forum; non-profit board member; former governance consultant; former Owner and President, Strategic Management Resources, Inc., a management consulting firm; former Member, Governing Board, Investment Company Institute’s Independent Directors Council; previously, held several executive positions in general management, marketing and human resources at IBM and The Pillsbury Company; Independent Director, First American Fund Complex (1987-2010) and Chair (1997-2010). | | 194 |
Terence J. Toth 1959 333 W. Wacker Drive Chicago, IL 60606 | | Trustee | | 2008 | | Managing Partner, Promus Capital (since 2008); Director, Fulcrum IT Service LLC (since 2010), Quality Control Corporation (since 2012) and LogicMark LLC (since 2012); formerly, Director, Legal & General Investment Management America, Inc. (2008-2013); formerly, CEO and President, Northern Trust Global Investments (2004-2007); Executive Vice President, Quantitative Management & Securities Lending (2000-2004); prior thereto, various positions with Northern Trust Company (since 1994); member: Chicago Fellowship Board (since 2005), Catalyst Schools of Chicago Board (since 2008) and Mather Foundation Board (since 2012), and a member of its investment committee; formerly, Member, Northern Trust Mutual Funds Board (2005-2007), Northern Trust Global Investments Board (2004-2007), Northern Trust Japan Board (2004-2007), Northern Trust Securities Inc. Board (2003-2007) and Northern Trust Hong Kong Board (1997-2004). | | 194 |
Trustees and Officers (Unaudited) (continued)
| | | | | | | | |
Name, Year of Birth & Address | | Position(s) Held with the Funds | | Year First Elected or Appointed (1) | | Principal Occupation(s) Including other Directorships During Past 5 Years | | Number of Portfolios in Fund Complex Overseen by Trustee |
| | | |
| Interested Trustee: | | | | |
William Adams IV(2) 1955 333 W. Wacker Drive Chicago, IL 60606 | | Trustee | | 2013 | | Senior Executive Vice President, Global Structured Products (since 2010); Co-President of Nuveen Fund Advisors, LLC (since 2011); Executive Vice President of Nuveen Securities, LLC; President (since 2011), formerly, Managing Director (2010-2011) of Nuveen Commodities Asset Management, LLC; Board Member of the Chicago Symphony Orchestra and of Gilda’s Club Chicago; formerly, Executive Vice President, U.S. Structured Products, of Nuveen Investments, Inc. (1999-2010). | | 194 |
Thomas S. Schreier, Jr.(2) 1962 333 W. Wacker Drive Chicago, IL 60606 | | Trustee | | 2013 | | Vice Chairman, Wealth Management of Nuveen Investments, Inc. (since 2011); Co-President of Nuveen Fund Advisors, LLC; Chairman of Nuveen Asset Management, LLC (since 2011); Co-Chief Executive Officer of Nuveen Securities, LLC (since 2011); Member of Board of Governors and Chairman’s Council of the Investment Company Institute; Director of Allina Health and a Member of its Finance, Audit and Investment Committees, formerly, Chief Executive Officer (2000-2010) and Chief Investment Officer (2007-2010) of FAF Advisors, Inc.; formerly, President of First American Funds (2001-2010). | | 194 |
| | | | | | | | |
Name,
Year of Birth & Address | | Position(s) Held with the Funds | | Year First Elected or Appointed (2) | | Principal Occupation(s) During Past 5 Years | | Number of Portfolios in Fund Complex Overseen by
Officer |
| | | |
| Officers of the Funds: | | | | |
Gifford R. Zimmerman 1956 333 W. Wacker Drive Chicago, IL 60606 | | Chief Administrative Officer | | 1988 | | Managing Director (since 2002), and Assistant Secretary of Nuveen Securities, LLC; Managing Director (since 2004) and Assistant Secretary (since 1994) of Nuveen Investments, Inc.; Managing Director (since 2002), Assistant Secretary (since 1997) and Co-General Counsel (since 2011) of Nuveen Fund Advisors, LLC; Managing Director, Assistant Secretary and Associate General Counsel of Nuveen Asset Management, LLC (since 2011); Managing Director and Assistant Secretary of Symphony Asset Management LLC (since 2003); Vice President and Assistant Secretary of NWQ Investment Management Company, LLC (since 2002), Nuveen Investments Advisers Inc. (since 2002), Santa Barbara Asset Management, LLC (since 2006) and of Winslow Capital Management, LLC, (since 2010); Vice President and Assistant Secretary (since 2013), formerly, Chief Administrative Officer and Chief Compliance Officer (2006-2013) of Nuveen Commodities Asset Management, LLC; Chartered Financial Analyst. | | 195 |
Margo L. Cook 1964 333 W. Wacker Drive Chicago, IL 60606 | | Vice President | | 2009 | | Senior Executive Vice President of Nuveen Investments, Inc.; Executive Vice President, Investment Services of Nuveen Fund Advisors, LLC (since 2011); Managing Director – Investment Services of Nuveen Commodities Asset Management, LLC (since 2011); Co-Chief Executive Officer (since 2015); previously, Executive Vice President (2013-2015) of Nuveen Securities, LLC; Chartered Financial Analyst. | | 195 |
Lorna C. Ferguson 1945 333 W. Wacker Drive Chicago, IL 60606 | | Vice President | | 1998 | | Managing Director (since 2005) of Nuveen Fund Advisors, LLC and Nuveen Securities, LLC (since 2004). | | 195 |
| | | | | | | | |
Name,
Year of Birth & Address | | Position(s) Held with the Funds | | Year First Elected or Appointed (2) | | Principal Occupation(s) During Past 5 Years | | Number of Portfolios in Fund Complex Overseen by
Officer |
Stephen D. Foy 1954 333 W. Wacker Drive Chicago, IL 60606 | | Vice President and Controller | | 1998 | | Managing Director (since 2014), formerly, Senior Vice President (2013-2014) and Vice President (2005-2013) of Nuveen Fund Advisors, LLC; Chief Financial Officer of Nuveen Commodities Asset Management, LLC (since 2010); Certified Public Accountant. | | 195 |
Sherri A. Hlavacek 1962 333 W. Wacker Drive Chicago, IL 60606 | | Vice President and Treasurer | | 2015 | | Managing Director and Controller of Nuveen Fund Advisors, LLC and Nuveen Commodities Asset Management, LLC; Managing Director, Treasurer and Controller of Nuveen Asset Management, LLC; Managing Director, Treasurer and Corporate Controller of Nuveen Investments, Inc., Nuveen Investments Advisers Inc. and Nuveen Investments Holdings, Inc.; Managing Director, Chief Financial Officer and Corporate Controller of Nuveen Securities, LLC; Vice President, Controller and Treasurer of NWQ Investment Management Company, LLC, Santa Barbara Asset Management, LLC , Tradewinds Global Investors, LLC, Symphony Asset Management LLC and Winslow Capital Management, LLC; Certified Public Accountant. | | 195 |
Walter M. Kelly 1970 333 W. Wacker Drive Chicago, IL 60606 | | Chief Compliance Officer and Vice President | | 2003 | | Senior Vice President (since 2008) of Nuveen Investments Holdings, Inc. | | 195 |
Tina M. Lazar 1961 333 W. Wacker Drive Chicago, IL 60606 | | Vice President | | 2002 | | Senior Vice President of Nuveen Investments Holdings, Inc. and Nuveen Securities, LLC | | 195 |
Kevin J. McCarthy 1966 333 W. Wacker Drive Chicago, IL 60606 | | Vice President and Secretary | | 2007 | | Managing Director and Assistant Secretary (since 2008), Nuveen Securities, LLC; Managing Director (since 2008), Assistant Secretary (since 2007) and Co-General Counsel (since 2011) of Nuveen Fund Advisors, LLC; Managing Director, Assistant Secretary and Associate General Counsel (since 2011) of Nuveen Asset Management, LLC; Managing Director and Assistant Secretary, Nuveen Investments, Inc.; Vice President (since 2007) and Assistant Secretary of Nuveen Investments Advisers Inc., NWQ Investment Management Company, LLC, Tradewinds Global Investors LLC, Symphony Asset Management LLC, Santa Barbara Asset Management, LLC, and of Winslow Capital Management, LLC. (since 2010); Vice President and Secretary (since 2010) of Nuveen Commodities Asset Management, LLC. | | 195 |
Kathleen L. Prudhomme 1953 901 Marquette Avenue Minneapolis, MN 55402 | | Vice President and Assistant Secretary | | 2011 | | Managing Director, Assistant Secretary and Co-General Counsel (since 2011) of Nuveen Fund Advisors, LLC; Managing Director, Assistant Secretary and Associate General Counsel (since 2011) of Nuveen Asset Management, LLC; Managing Director and Assistant Secretary (since 2011) of Nuveen Securities, LLC; formerly, Deputy General Counsel, FAF Advisors, Inc. (2004-2010). | | 195 |
Joel T. Slager 1978 333 West Wacker Drive Chicago, IL 60606 | | Vice President and Assistant Secretary | | 2013 | | Fund Tax Director for Nuveen Funds (since 2013); previously, Vice President of Morgan Stanley Investment Management, Inc., Assistant Treasurer of the Morgan Stanley Funds (from 2010 to 2013). | | 195 |
Trustees and Officers (Unaudited) (continued)
| | | | | | | | |
Name,
Year of Birth & Address | | Position(s) Held with the Funds | | Year First Elected or Appointed (2) | | Principal Occupation(s) During Past 5 Years | | Number of Portfolios in Fund Complex Overseen by
Officer |
Jeffery M. Wilson 1956 333 West Wacker Drive Chicago, IL 60606 | | Vice President | | 2011 | | Senior Vice President of Nuveen Securities, LLC (since 2011); formerly, Senior Vice President of FAF Advisors, Inc. (2000-2010). | | 107 |
| (1) | Trustees serve an indefinite term until his/her successor is elected or appointed. The year first elected or appointed represents the year in which the trustee was first elected or appointed to any fund in the Nuveen Fund Complex. |
| (2) | Officers serve one year terms through August of each year. The year first elected or appointed represents the year in which the officer was first elected or appointed to any fund in the Nuveen Fund Complex. |
Notes
Notes
Notes
| | | | | | | | | | | | | | |
| | | | | | | | |
| | | | |
| | | | | | | | |
| | | | | |
| | Nuveen Investments: | | | | | | | | |
| | | | Serving Investors for Generations | | |
| | |
| | | | |
| | | |
| | | | Since 1898, financial advisors and their clients have relied on Nuveen Investments to provide dependable investment solutions through continued adherence to proven, long-term investing principles. Today, we offer a range of high quality equity and fixed-income solutions designed to be integral components of a well-diversified core portfolio. | | |
| | | |
| | | | | | |
| | | | |
| | | | | | Focused on meeting investor needs. Nuveen Investments provides high-quality investment services designed to help secure the longterm goals of institutional and individual investors as well as the consultants and financial advisors who serve them. Nuveen Investments markets a wide range of specialized investment solutions which provide investors access to capabilities of its high-quality boutique investment affiliates-Nuveen Asset Management, Symphony Asset Management, NWQ Investment Management Company, Santa Barbara Asset Management, Tradewinds Global Investors, Winslow Capital Management, and Gresham Investment Management. In total, Nuveen Investments managed $230 billion as of June 30, 2015. | | |
| | | | | |
| | | | | | | | | | |
| | | | | | Find out how we can help you. To learn more about how the products and services of Nuveen Investments may be able to help you meet your financial goals, talk to your financial advisor, or call us at (800) 257-8787. Please read the information provided carefully before you invest. Investors should consider the investment objective and policies, risk considerations, charges and expenses of any investment carefully. Where applicable, be sure to obtain a prospectus, which contains this and other relevant information. To obtain a prospectus, please contact your securities representative or Nuveen Investments, 333 W. Wacker Dr., Chicago, IL 60606. Please read the prospectus carefully before you invest or send money. Learn more about Nuveen Funds at: www.nuveen.com/mf | | |
| | | | | | |
| | | | | | | | | | | | |
| | Distributed by Nuveen Securities, LLC | 333 West Wacker Drive Chicago, IL 60606 | www.nuveen.com | | |
MAN-GHSU-0615D 10003-INV-Y-08-16
ITEM 2. CODE OF ETHICS.
As of the end of the period covered by this report, the registrant has adopted a code of ethics that applies to the registrant’s principal executive officer, principal financial officer, principal accounting officer or controller, or persons performing similar functions. There were no amendments to or waivers from the code during the period covered by this report. The registrant has posted the code of ethics on its website at www.nuveen.com/MutualFunds/ShareholderResources/FundGovernance.aspx. (To view the code, click on Code of Conduct.)
ITEM 3. AUDIT COMMITTEE FINANCIAL EXPERT.
The registrant’s Board of Directors or Trustees (“Board”) determined that the registrant has at least one “audit committee financial expert” (as defined in Item 3 of Form N-CSR) serving on its Audit Committee. The registrant’s audit committee financial experts are Carole E. Stone and Jack B. Evans, who are “independent” for purposes of Item 3 of Form N-CSR.
Ms. Stone served for five years as Director of the New York State Division of the Budget. As part of her role as Director, Ms. Stone was actively involved in overseeing the development of the State’s operating, local assistance and capital budgets, its financial plan and related documents; overseeing the development of the State’s bond-related disclosure documents and certifying that they fairly presented the State’s financial position; reviewing audits of various State and local agencies and programs; and coordinating the State’s system of internal audit and control. Prior to serving as Director, Ms. Stone worked as a budget analyst/examiner with increasing levels of responsibility over a 30 year period, including approximately five years as Deputy Budget Director. Ms. Stone has also served as Chair of the New York State Racing Association Oversight Board, as Chair of the Public Authorities Control Board, as a Commissioner on the New York State Commission on Public Authority Reform and as a member of the Boards of Directors of several New York State public authorities. These positions have involved overseeing operations and finances of certain entities and assessing the adequacy of project/entity financing and financial reporting. Currently, Ms. Stone is on the Board of Directors of CBOE Holdings, Inc., of the Chicago Board Options Exchange, and of C2 Options Exchange. Ms. Stone’s position on the boards of these entities and as a member of both CBOE Holdings’ Audit Committee and its Finance Committee has involved, among other things, the oversight of audits, audit plans and preparation of financial statements.
Mr. Evans was formerly President and Chief Operating Officer of SCI Financial Group, Inc., a full service registered broker-dealer and registered investment adviser (“SCI”). As part of his role as President and Chief Operating Officer, Mr. Evans actively supervised the Chief Financial Officer (the “CFO”) and actively supervised the CFO’s preparation of financial statements and other filings with various regulatory authorities. In such capacity, Mr. Evans was actively involved in the preparation of SCI’s financial statements and the resolution of issues raised in connection therewith. Mr. Evans has also served on the audit committee of various reporting companies. At such companies, Mr. Evans was involved in the oversight of audits, audit plans, and the preparation of financial statements. Mr. Evans also formerly chaired the audit committee of the Federal Reserve Bank of Chicago.
ITEM 4. PRINCIPAL ACCOUNTANT FEES AND SERVICES.
The following tables show the amount of fees that PricewaterhouseCoopers LLP, the Funds’ auditor, billed to the Funds’ during the Funds’ last two full fiscal years. The Audit Committee approved in advance all audit services and non-audit services that PricewaterhouseCoopers LLP provided to the Funds, except for those non-audit services that were subject to the pre-approval exception under Rule 2-01 of Regulation S-X (the “pre-approval exception”). The preapproval exception for services provided directly to the Funds waives the pre-approval requirement for services other than audit, review or attest services if: (A) the aggregate amount of all such services provided constitutes no more than 5% of the total amount of revenues paid by the Funds during the fiscal year in which the services are provided; (B) the Funds did not recognize the services as non-audit services at the time of the engagement; and (C) the services are promptly brought to the Audit Committee’s attention, and the Committee (or its delegate) approves the services before the audit is completed.
The Audit Committee has delegated certain pre-approval responsibilities to its Chairman (or, in his absence, any other member of the Audit Committee).
SERVICES THAT THE AUDITOR BILLED TO THE FUNDS
| | | | | | | | | | | | | | | | |
Fiscal Year Ended June 30, 2015 | | Audit Fees Billed
to Funds 1 | | | Audit-Related Fees
Billed to Funds 2 | | | Tax Fees
Billed to Funds 3 | | | All Other Fees
Billed to Funds 4 | |
Fund Name | | | | | | | | | | | | | | | | |
Nuveen Core Plus Bond Fund | | | 41,769 | | | | 0 | | | | 2,380 | | | | 0 | |
Nuveen High Income Bond Fund | | | 33,303 | | | | 0 | | | | 2,380 | | | | 0 | |
Nuveen Intermediate Government Bond Fund | | | 39,682 | | | | 0 | | | | 2,380 | | | | 0 | |
Nuveen Inflation Protected Securities Fund | | | 40,082 | | | | 0 | | | | 2,380 | | | | 0 | |
Nuveen Core Bond Fund | | | 40,473 | | | | 0 | | | | 2,380 | | | | 0 | |
Nuveen Short Term Bond Fund | | | 43,239 | | | | 0 | | | | 2,380 | | | | 0 | |
Nuveen Strategic Income Fund | | | 44,548 | | | | 0 | | | | 2,380 | | | | 0 | |
| | | | | | | | | | | | | | | | |
Total | | $ | 283,096 | | | $ | 0 | | | $ | 16,660 | | | $ | 0 | |
| 1 | | “Audit Fees” are the aggregate fees billed for professional services for the audit of the Fund’s annual financial statements and services provided in connection with statutory and regulatory filings or engagements. |
| 2 | | “Audit-Related Fees” are the aggregate fees billed for assurance and related services reasonably related to the performance of the audit or review of financial statements that are not reported under “Audit Fees”. These fees include offerings related to the Fund’s common shares and leverage. |
| 3 | | “Tax Fees” are the aggregate fees billed for professional services for tax advice, tax compliance, and tax planning. These fees include: all global withholding tax services; excise and state tax reviews; capital gain, tax equalization and taxable basis calculations performed by the principal accountant. |
| 4 | | “All Other Fees” are the aggregate fees billed for products and services other than “Audit Fees”, “Audit-Related Fees” and “Tax Fees”. These fees represent all “Agreed-Upon Procedures” engagements pertaining to the Fund’s use of leverage. |
| | | | | | | | | | | | | | | | |
| | | Percentage Approved Pursuant to Pre-approval Exception | |
| | | Audit Fees Billed
to Funds | | | Audit-Related Fees
Billed to Funds | | | Tax Fees
Billed to Funds | | | All Other Fees
Billed to Funds | |
Fund Name | | | | | | | | | | | | | | | | |
Nuveen Core Plus Bond Fund | | | 0 | % | | | 0 | % | | | 0 | % | | | 0 | % |
Nuveen High Income Bond Fund | | | 0 | % | | | 0 | % | | | 0 | % | | | 0 | % |
Nuveen Intermediate Government Bond Fund | | | 0 | % | | | 0 | % | | | 0 | % | | | 0 | % |
Nuveen Inflation Protected Securities Fund | | | 0 | % | | | 0 | % | | | 0 | % | | | 0 | % |
Nuveen Core Bond Fund | | | 0 | % | | | 0 | % | | | 0 | % | | | 0 | % |
Nuveen Short Term Bond Fund | | | 0 | % | | | 0 | % | | | 0 | % | | | 0 | % |
Nuveen Strategic Income Fund | | | 0 | % | | | 0 | % | | | 0 | % | | | 0 | % |
| | | | |
June 30, 2014 | | Audit Fees Billed
to Funds 1 | | | Audit-Related Fees
Billed to Funds 2 | | | Tax Fees
Billed to Funds 3 | | | All Other Fees
Billed to Funds 4 | |
Fund Name | | | | | | | | | | | | | | | | |
Nuveen Core Plus Bond Fund | | | 40,740 | | | | 0 | | | | 2,831 | | | | 0 | |
Nuveen High Income Bond Fund | | | 33,593 | | | | 0 | | | | 2,869 | | | | 0 | |
Nuveen Intermediate Government Bond Fund | | | 38,536 | | | | 0 | | | | 2,134 | | | | 0 | |
Nuveen Inflation Protected Securities Fund | | | 38,833 | | | | 0 | | | | 2,491 | | | | 0 | |
Nuveen Core Bond Fund | | | 39,753 | | | | 0 | | | | 2,630 | | | | 0 | |
Nuveen Short Term Bond Fund | | | 42,965 | | | | 0 | | | | 3,112 | | | | 0 | |
Nuveen Strategic Income Fund | | | 41,446 | | | | 0 | | | | 2,780 | | | | 0 | |
| | | | | | | | | | | | | | | | |
Total | | $ | 275,866 | | | $ | 0 | | | $ | 18,847 | | | $ | 0 | |
| 1 | | “Audit Fees” are the aggregate fees billed for professional services for the audit of the Fund’s annual financial statements and services provided in connection with statutory and regulatory filings or engagements. |
| 2 | | “Audit-Related Fees” are the aggregate fees billed for assurance and related services reasonably related to the performance of the audit or review of financial statements that are not reported under “Audit Fees”. These fees include offerings related to the Fund’s common shares and leverage. |
| 3 | | “Tax Fees” are the aggregate fees billed for professional services for tax advice, tax compliance, and tax planning. These fees include: all global withholding tax services; excise and state tax reviews; capital gain, tax equalization and taxable basis calculations performed by the principal accountant. |
| 4 | | “All Other Fees” are the aggregate fees billed for products and services other than “Audit Fees”, “Audit-Related Fees” and “Tax Fees”. These fees represent all “Agreed-Upon Procedures” engagements pertaining to the Fund’s use of leverage. |
| | | | | | | | | | | | | | | | |
| | | Percentage Approved Pursuant to Pre-approval Exception | |
| | | Audit Fees Billed
to Funds | | | Audit-Related Fees
Billed to Funds | | | Tax Fees
Billed to Funds | | | All Other Fees
Billed to Funds | |
Fund Name | | | | | | | | | | | | | | | | |
Nuveen Core Plus Bond Fund | | | 0 | % | | | 0 | % | | | 0 | % | | | 0 | % |
Nuveen High Income Bond Fund | | | 0 | % | | | 0 | % | | | 0 | % | | | 0 | % |
Nuveen Intermediate Government Bond Fund | | | 0 | % | | | 0 | % | | | 0 | % | | | 0 | % |
Nuveen Inflation Protected Securities Fund | | | 0 | % | | | 0 | % | | | 0 | % | | | 0 | % |
Nuveen Core Bond Fund | | | 0 | % | | | 0 | % | | | 0 | % | | | 0 | % |
Nuveen Short Term Bond Fund | | | 0 | % | | | 0 | % | | | 0 | % | | | 0 | % |
Nuveen Strategic Income Fund | | | 0 | % | | | 0 | % | | | 0 | % | | | 0 | % |
| | | | | | | | | | | | |
Fiscal Year Ended June 30, 2015 | | Audit-Related Fees
Billed to Adviser and
Affiliated Fund
Service Providers | | | Tax Fees Billed to
Adviser and
Affiliated Fund
Service Providers | | | All Other Fees
Billed to Adviser
and Affiliated Fund
Service Providers | |
Nuveen Investment Funds, Inc. | | $ | 0 | | | $ | 0 | | | $ | 0 | |
| |
| | | Percentage Approved Pursuant to Pre-approval Exception | |
| | | Audit-Related Fees
Billed to Adviser and
Affiliated Fund
Service Providers | | | Tax Fees Billed to
Adviser and
Affiliated Fund
Service Providers | | | All Other Fees
Billed to Adviser
and Affiliated Fund
Service Providers | |
| | | 0 | % | | | 0 | % | | | 0 | % |
| | | |
Fiscal Year Ended June 30, 2014 | | Audit-Related Fees
Billed to Adviser and
Affiliated Fund
Service Providers | | | Tax Fees Billed to
Adviser and
Affiliated Fund
Service Providers | | | All Other Fees
Billed to Adviser
and Affiliated Fund
Service Providers | |
Nuveen Investment Funds, Inc. | | $ | 0 | | | $ | 0 | | | $ | 0 | |
| |
| | | Percentage Approved Pursuant to Pre-approval Exception | |
| | | Audit-Related Fees
Billed to Adviser and
Affiliated Fund
Service Providers | | | Tax Fees Billed to
Adviser and
Affiliated Fund
Service Providers | | | All Other Fees
Billed to Adviser
and Affiliated Fund
Service Providers | |
| | | 0 | % | | | 0 | % | | | 0 | % |
| | | | | | | | | | | | | | | | |
Fiscal Year Ended June 30, 2015 | | Total Non-Audit Fees
Billed to Trust | | | Total Non-Audit Fees
billed to Adviser and
Affiliated Fund Service
Providers (engagements
related directly to the
operations and financial
reporting of the Trust) | | | Total Non-Audit Fees
billed to Adviser and
Affiliated Fund
Service Providers (all
other engagements) | | | Total | |
Fund Name | | | | | | | | | | | | | | | | |
Nuveen Core Plus Bond Fund | | | 2,380 | | | | 0 | | | | 0 | | | | 2,380 | |
Nuveen High Income Bond Fund | | | 2,380 | | | | 0 | | | | 0 | | | | 2,380 | |
Nuveen Intermediate Government Bond Fund | | | 2,380 | | | | 0 | | | | 0 | | | | 2,380 | |
Nuveen Inflation Protected Securities Fund | | | 2,380 | | | | 0 | | | | 0 | | | | 2,380 | |
Nuveen Core Bond Fund | | | 2,380 | | | | 0 | | | | 0 | | | | 2,380 | |
Nuveen Short Term Bond Fund | | | 2,380 | | | | 0 | | | | 0 | | | | 2,380 | |
Nuveen Strategic Income Fund | | | 2,380 | | | | 0 | | | | 0 | | | | 2,380 | |
| | | | | | | | | | | | | | | | |
Total | | $ | 16,660 | | | $ | 0 | | | $ | 0 | | | $ | 16,660 | |
“Non-Audit Fees billed to Fund” for both fiscal year ends represent “Tax Fees” and “All Other Fees” billed to Fund in their respective amounts from the previous table.
Less than 50 percent of the hours expended on the principal accountant’s engagement to audit the registrant’s financial statements for the most recent fiscal year were attributed to work performed by persons other than the principal accountant’s full-time, permanent employees.
| | | | | | | | | | | | | | | | |
Fiscal Year Ended June 30, 2014 | | Total Non-Audit Fees
Billed to Trust | | | Total Non-Audit Fees
billed to Adviser and
Affiliated Fund Service
Providers (engagements
related directly to the
operations and financial
reporting of the Trust) | | | Total Non-Audit Fees
billed to Adviser and
Affiliated Fund Service
Providers (all other
engagements) | | | Total | |
Fund Name | | | | | | | | | | | | | | | | |
Nuveen Core Plus Bond Fund | | | 2,831 | | | | 0 | | | | 0 | | | | 2,831 | |
Nuveen High Income Bond Fund | | | 2,869 | | | | 0 | | | | 0 | | | | 2,869 | |
Nuveen Intermediate Government Bond Fund | | | 2,134 | | | | 0 | | | | 0 | | | | 2,134 | |
Nuveen Inflation Protected Securities Fund | | | 2,491 | | | | 0 | | | | 0 | | | | 2,491 | |
Nuveen Core Bond Fund | | | 2,630 | | | | 0 | | | | 0 | | | | 2,630 | |
Nuveen Short Term Bond Fund | | | 3,112 | | | | 0 | | | | 0 | | | | 3,112 | |
Nuveen Strategic Income Fund | | | 2,780 | | | | 0 | | | | 0 | | | | 2,780 | |
| | | | | | | | | | | | | | | | |
Total | | $ | 18,847 | | | $ | 0 | | | $ | 0 | | | $ | 18,847 | |
“Non-Audit Fees billed to Fund” for both fiscal year ends represent “Tax Fees” and “All Other Fees” billed to Fund in their respective amounts from the previous table.
Audit Committee Pre-Approval Policies and Procedures. Generally, the Audit Committee must approve (i) all non-audit services to be performed for the Funds by the Funds’ independent accountant and (ii) all audit and non-audit services to be performed by the Funds’ independent accountant for the Affiliated Fund Service Providers with respect to the operations and financial reporting of the Funds. Regarding tax and research projects conducted by the independent accountant for the Funds and Affiliated Fund Service Providers (with respect to operations and financial reports of the Trust), such engagements will be (i) pre-approved by the Audit Committee if they are expected to be for amounts greater than $10,000; (ii) reported to the Audit Committee Chairman for his verbal approval prior to engagement if they are expected to be for amounts under $10,000 but greater than $5,000; and (iii) reported to the Audit Committee at the next Audit Committee meeting if they are expected to be for an amount under $5,000.
ITEM 5. AUDIT COMMITTEE OF LISTED REGISTRANTS.
Not applicable to this registrant.
ITEM 6. SCHEDULE OF INVESTMENTS.
| a) | | See Portfolio of Investments in Item 1. |
ITEM 7. DISCLOSURE OF PROXY VOTING POLICIES AND PROCEDURES FOR CLOSED-END
MANAGEMENT INVESTMENT COMPANIES.
Not applicable to this registrant.
ITEM 8. PORTFOLIO MANAGERS OF CLOSED-END MANAGEMENT INVESTMENT COMPANIES.
Not applicable to this registrant.
ITEM 9. PURCHASES OF EQUITY SECURITIES BY CLOSED-END MANAGEMENT INVESTMENT COMPANY AND AFFILIATED PURCHASERS.
Not applicable to this registrant.
ITEM 10. SUBMISSION OF MATTERS TO A VOTE OF SECURITY HOLDERS.
There have been no material changes to the procedures by which shareholders may recommend nominees to the registrant’s Board of Trustees implemented after the registrant last provided disclosure in response to this Item.
ITEM 11. CONTROLS AND PROCEDURES.
| | (a) | | The registrant’s principal executive and principal financial officers, or persons performing similar functions, have concluded that the registrant’s disclosure controls and procedures (as defined in Rule 30a-3(c) under the Investment Company Act of 1940, as amended (the “1940 Act”) (17 CFR 270.30a-3(c))) are effective, as of a date within 90 days of the filing date of this report that includes the disclosure required by this paragraph, based on their evaluation of the controls and procedures required by Rule 30a-3(b) under the 1940 Act (17 CFR 270.30a-3(b)) and Rules 13a-15(b) or 15d-15(b) under the Securities Exchange Act of 1934, as amended (the “Exchange Act”) (17 CFR 240.13a-15(b) or 240.15d-15(b)). |
| | (b) | | There were no changes in the registrant’s internal control over financial reporting (as defined in Rule 30a-3(d) under the 1940 Act (17 CFR 270.30a-3(d)) that occurred during the second fiscal quarter of the period covered by this report that has materially affected, or is reasonably likely to materially affect, the registrant’s internal control over financial reporting. |
ITEM 12. EXHIBITS.
File the exhibits listed below as part of this Form.
| | |
| (a)(1) | | Any code of ethics, or amendment thereto, that is the subject of the disclosure required by Item 2, to the extent that the registrant intends to satisfy the Item 2 requirements through filing of an exhibit: Not applicable because the code is posted on registrant’s website at www.nuveen.com/MutualFunds/ShareholderResources/FundGovernance.aspx and there were no amendments during the period covered by this report. (To view the code, click on Code of Conduct.) |
| |
| (a)(2) | | A separate certification for each principal executive officer and principal financial officer of the registrant as required by Rule 30a-2(a) under the 1940 Act (17 CFR 270.30a-2(a)) in the exact form set forth below: See EX-99.CERT attached hereto. |
| |
| (a)(3) | | Any written solicitation to purchase securities under Rule 23c-1 under the 1940 Act (17 CFR 270.23c-1) sent or given during the period covered by the report by or on behalf of the registrant to 10 or more persons: Not applicable to this registrant. |
| |
| (b) | | If the report is filed under Section 13(a) or 15(d) of the Exchange Act, provide the certifications required by Rule 30a-2(b) under the 1940 Act (17 CFR 270.30a-2(b)), Rule 13a-14(b) or Rule 15d-14(b) under the Exchange Act (17 CFR 240.13a-14(b) or 240.15d-14(b)), and Section 1350 of Chapter 63 of Title 18 of the United States Code (18 U.S.C. 1350) as an Exhibit. A certification furnished pursuant to this paragraph will not be deemed “filed” for purposes of Section 18 of the Exchange Act (15 U.S.C. 78r), or otherwise subject to the liability of that section. Such certification will not be deemed to be incorporated by reference into any filing under the Securities Act of 1933 or the Exchange Act, except to the extent that the registration specifically incorporates it by reference: See EX-99.906 CERT attached hereto. |
SIGNATURES
Pursuant to the requirements of the Securities Exchange Act of 1934 and the Investment Company Act of 1940, the registrant has duly caused this report to be signed on its behalf by the undersigned, thereunto duly authorized.
(Registrant) Nuveen Investment Funds, Inc.
| | |
| |
| By (Signature and Title) | | /s/ Kevin J. McCarthy |
| | Kevin J. McCarthy |
| | Vice President and Secretary |
Date: September 8, 2015
Pursuant to the requirements of the Securities Exchange Act of 1934 and the Investment Company Act of 1940, this report has been signed below by the following persons on behalf of the registrant and in the capacities and on the dates indicated.
| | |
| |
| By (Signature and Title) | | /s/ Gifford R. Zimmerman |
| | Gifford R. Zimmerman |
| | Chief Administrative Officer |
| | (principal executive officer) |
Date: September 8, 2015
| | |
| |
| By (Signature and Title) | | /s/ Stephen D. Foy |
| | Stephen D. Foy |
| | Vice President and Controller |
| | (principal financial officer) |
Date: September 8, 2015