UNITED STATES
SECURITIES AND EXCHANGE COMMISSION
Washington, D.C. 20549
FORM N-CSR
CERTIFIED SHAREHOLDER REPORT OF REGISTERED MANAGEMENT
INVESTMENT COMPANIES
Investment Company Act file number 811-05309
Nuveen Investment Funds, Inc.
(Exact name of registrant as specified in charter)
Nuveen Investments
333 West Wacker Drive, Chicago, IL 60606
(Address of principal executive offices) (Zip code)
Kevin J. McCarthy
Nuveen Investments
333 West Wacker Drive
Chicago, IL 60606
(Name and address of agent for service)
Registrant’s telephone number, including area code: (312) 917-7700
Date of fiscal year end: October 31
Date of reporting period: October 31, 2015
Form N-CSR is to be used by management investment companies to file reports with the Commission not later than 10 days after the transmission to stockholders of any report that is required to be transmitted to stockholders under Rule 30e-1 under the Investment Company Act of 1940 (17 CFR 270.30e-1). The Commission may use the information provided on Form N-CSR in its regulatory, disclosure review, inspection, and policy making roles.
A registrant is required to disclose the information specified by Form N-CSR, and the Commission will make this information public. A registrant is not required to respond to the collection of information contained in Form N-CSR unless the Form displays a currently valid Office of Management and Budget (“OMB”) control number. Please direct comments concerning the accuracy of the information collection burden estimate and any suggestions for reducing the burden to Secretary, Securities and Exchange Commission, 450 Fifth Street, NW, Washington, DC 20549-0609. The OMB has reviewed this collection of information under the clearance requirements of 44 U.S.C. ss.3507.
ITEM 1. REPORTS TO STOCKHOLDERS.
| | |
| | |  |
| Mutual Funds | |
| | | | | | |
| | | | | | | Annual Report October 31, 2015 |
| | | | | | | | | | | | | | |
| | | | | | | Share Class / Ticker Symbol | | |
| | | Fund Name | | | | Class A | | Class C | | Class R3 | | Class I | | |
| | |
| | Nuveen Equity Index Fund | | | | FAEIX | | FCEIX | | FADSX | | FEIIX | | |
| | Nuveen Mid Cap Index Fund | | | | FDXAX | | FDXCX | | FMCYX | | FIMEX | | |
| | Nuveen Small Cap Index Fund | | | | FMDAX | | FPXCX | | ARSCX | | ASETX | | |
| | | | | | | | | | | | |
| | | | | | |
| | | | |
| | | | | | | | |
| | |
| | Life is Complex. | | |
| | |
| | Nuveen makes things e-simple. | | |
| | |
| | It only takes a minute to sign up for e-Reports. Once enrolled, you’ll receive an e-mail as soon as your Nuveen Fund information is ready. No more waiting for delivery by regular mail. Just click on the link within the e-mail to see the report and save it on your computer if you wish. | | |
| | | | |
| | | | | | Free e-Reports right to your e-mail! | | |
| | | |
| | | | | | www.investordelivery.com If you receive your Nuveen Fund distributions and statements from your
financial advisor or brokerage account. |
| | | | |
| | | | or | | www.nuveen.com/accountaccess If you receive your Nuveen Fund distributions and statements directly from Nuveen. Must be preceded by or accompanied by a prospectus. NOT FDIC INSURED MAY LOSE VALUE
NO BANK GUARANTEE | | |
| | | | | | | | | | |
| | | | | | | | | | | | | |

Table
of Contents
Chairman’s Letter
to Shareholders

Dear Shareholders,
For better or for worse, the financial markets spent most of the past year waiting for the U.S. Federal Reserve (Fed) to end its accommodative monetary policy. The policy has propped up stock and bond markets since the Great Recession, but the question remains: how will markets behave without its influence? This uncertainty was a considerable source of volatility for stock and bond prices for much of 2015, despite the Fed carefully conveying its intention to raise rates slowly and only when the economy shows evidence of readiness.
As was widely expected, the long-awaited Fed rate hike materialized in mid-December. While the move was interpreted as a vote of confidence on the economy’s underlying strength, the Fed emphasized that future rate increases will be gradual and guided by its ongoing assessment of financial conditions. How efficiently the financial markets process the confluence of rising borrowing costs, softer commodity prices, stubbornly low U.S. inflation, and a strong U.S. dollar, against a backdrop of anemic global economic growth, remains to be seen.
Nevertheless, the global recovery continues to be led by the United States. Policy makers in Europe and Japan are deploying their available tools to try to bolster their economies’ fragile growth, while Chinese authorities have stepped up efforts to manage China’s slowdown. With sentiment regarding China growing increasingly bearish and the Fed now working toward normalizing its interest-rate policy, the actions of the world’s central banks remain under intense scrutiny.
In the meantime, asset prices could continue to churn as risks both known and unknown begin to emerge. In times like these, you can look to a professional investment manager with the experience and discipline to maintain the proper perspective on short-term events. And if the daily headlines do concern you, I encourage you to reach out to your financial advisor. Your financial advisor can help you evaluate your investment strategies in light of current events, your time horizon and risk tolerance.
On behalf of the other members of the Nuveen Fund Board, we look forward to continuing to earn your trust in the months and years ahead.
Sincerely,

William J. Schneider
Chairman of the Board
December 21, 2015
Portfolio Managers’
Comments
Nuveen Equity Index Fund
Nuveen Mid Cap Index Fund
Nuveen Small Cap Index Fund
These Funds feature portfolio management by Nuveen Asset Management, LLC, an affiliate of Nuveen Investments, Inc. During this reporting period, David A. Friar and Michael N. Lindh, CFA and CPA, were the portfolio managers for the Funds. David has managed the Nuveen Equity Index Fund since 2000 and the Nuveen Mid Cap Index Fund and the Nuveen Small Cap Index Fund since 2001. Michael was named co-manager of all three Funds in 2014.
On the following pages, the portfolio managers discuss economic and market conditions, key investment strategies and the Funds’ performance for the twelve-month reporting period ended October 31, 2015.
What factors affected the U.S. economy and the financial markets during the twelve-month reporting period ended October 31, 2015?
During this reporting period, the U.S. economy continued to expand at a moderate pace. The Federal Reserve (Fed) maintained efforts to bolster growth and promote progress toward its mandates of maximum employment and price stability by holding the benchmark fed funds rate at the record low level of zero to 0.25% that it established in December 2008, a level that remained in place until December 2015 when the Fed increased its benchmark rate to a range of 0.25% to 0.50% (subsequent to the close of this reporting period). At its October 2014 meeting, the Fed announced that it would end its bond-buying stimulus program as of November 1, 2014, after tapering its monthly asset purchases of mortgage-backed and longer-term Treasury securities from the original $85 billion per month to $15 billion per month over the course of seven consecutive meetings (December 2013 through September 2014). In making the announcement, the Fed cited substantial improvement in the labor market as well as sufficient underlying strength in the broader economy to support ongoing progress toward maximum employment in a context of price stability. The Fed also reiterated that it would continue to look at a wide range of factors, including labor market conditions, indicators of inflationary pressures and readings on financial developments, in determining future actions. Additionally, the Fed stated that it would likely maintain the current target range for the fed funds rate for a considerable time, especially if projected inflation continued to run below the Fed’s 2% longer run goal. However, if economic data shows faster progress, the Fed indicated that it could raise the fed funds rate sooner than expected.
The Fed changed its language slightly in December 2014, indicating it would be “patient” in normalizing monetary policy. This shift helped ease investors’ worries that the Fed might raise rates too soon. However, as employment data released early in 2015 continued to look strong, anticipation began building that the Fed could raise its main policy rate as soon as June. As widely expected, after its March meeting, the Fed eliminated “patient” from its statement, but also highlighted the policymakers’ less optimistic view of the economy’s overall health as well as downgraded their inflation projections. The Fed’s April meeting seemed to further signal that a June rate hike was off the table. While the Fed attributed the first quarter’s economic weakness to temporary factors, the meeting minutes from April revealed that many Committee members believed the economic data available in June would be insufficient to meet the Fed’s criteria for initiating a rate increase. The June meeting bore out that presumption and the Fed decided to keep the target rate near zero. But the Committee also continued to telegraph the likelihood of at least one rate increase in 2015, which many analysts forecasted for September.
Certain statements in this report are forward-looking statements. Discussions of specific investments are for illustration only and are not intended as recommendations of individual investments. The forward-looking statements and other views expressed herein are those of the portfolio managers as of the date of this report. Actual future results or occurrences may differ significantly from those anticipated in any forward-looking statements and the views expressed herein are subject to change at any time, due to numerous market and other factors. The Funds disclaim any obligation to update publicly or revise any forward-looking statements or views expressed herein.
Refer to the Glossary of Terms Used in this Report for further definition of the terms used within this section.
Portfolio Managers’ Comments (continued)
During the September 2015 meeting, the Fed decided to keep the federal funds rate near zero despite broad speculation that it would increase rates. The Committee said it will keep the rate near zero until the economy has seen further improvement toward reaching the Fed’s goals of maximum employment and inflation approaching 2%. This assessment will take into account a wide range of information, including measures of labor market conditions, indicators of inflation pressures and inflation expectations, and readings on financial and international developments. At the Fed’s October 2015 meeting, the Committee again held steady, while opening the door for a potential December rate hike. (The Fed did raise rates at its December meeting, subsequent to the close of this reporting period.)
The U.S. economy proved to be fairly resilient compared to other economies around the globe, boosted by an improving job market, declining gas prices and low mortgage rates. According to the government’s gross domestic product (GDP) “second” estimate, the U.S. economy increased at a 2.1% annualized rate in the third quarter of 2015, compared with increases of 3.9% in the second quarter, 0.6% in the first quarter of 2015 and 2.2% in the fourth quarter 2014. The deceleration in real GDP in the third quarter primarily reflected a downturn in private inventory investment and decelerations in exports, in nonresidential fixed investment, in state and local government spending and in residential fixed investment that were partly offset by a deceleration in imports. The Consumer Price Index (CPI) increased 0.2% essentially unchanged year-over-year as of October 2015. The core CPI (which excludes food and energy) increased 0.2% during the same period, below the Fed’s unofficial longer term inflation objective of 2.0%. As of October 2015, the U.S. unemployment rate was 5.0%, a figure that is also considered “full employment” by some Fed officials. The housing market continued to post consistent gains as of its most recent reading for September 2015. The average home price in the S&P/Case-Shiller Index of 20 major metropolitan areas rose 5.5% for the twelve months ended September 2015 (most recent data available at the time this report was prepared).
Meanwhile, a number of issues weighed on economies across the globe including geopolitical turmoil, weak growth overseas and sharply falling oil prices, which were caused by the faltering global economy and OPEC’s refusal to give up market share. Falling oil prices propelled significant appreciation in the U.S. dollar, which hit a multi-year high versus a basket of other major currencies, supported by the confident Fed and weaker data coming out of Europe, Japan and China. In an effort to improve their economic growth, countries across the globe maintained extraordinarily accommodative monetary policies. The European Central Bank (ECB) launched a massive quantitative easing program via a government bond-buying program that pumped more than 1 trillion euros into the weak eurozone economy, while other central banks around the world enacted more than 30 policy easing actions during the first few months of 2015.
Political drama also dominated the news partway through the reporting period, including the escalating tensions over Greece’s debt issues and aggressive policy intervention by the Chinese government to deflate the country’s stock market bubble. In late June, Greece took front and center in world market headlines with defaults on its payments to the International Monetary Fund and threats of a potential exit from the European Monetary Union (EMU). However, by mid-July, Greece had agreed to austerity measures in return for more bailout funds. Meanwhile, after skyrocketing for nearly a year, China’s stock market suddenly shifted gears in June and embarked on a massive sell-off that quickly spilled over to the rest of the world. Investors pulled money out of Chinese stocks despite efforts by China’s government to stem the tide, including further rate cuts, a 1 trillion yuan bond for infrastructure build-out, new regulations surrounding equity purchases and redemptions and the unexpected devaluation of the yuan currency in mid-August. A number of factors helped fuel the sell-off, including weak Chinese economic data and falling commodity prices. By August 2015, oil prices had fallen to their lowest levels of the reporting period with prices for West Texas Intermediate (WTI) crude dipping below the $40/barrel level for a short time. Following the drop, the price of WTI crude reversed course and ended the reporting period around $47/barrel.
With this backdrop, global volatility spiked across all asset classes during the reporting period. Oil and gas shares, other energy-related stocks and petrocurrencies were hit hard around the world due to dramatically falling commodity prices. In overseas stock markets, news of widespread monetary policy moves across the globe gave equities a boost through May however, in the summer months renewed fears over China and uncertainty about the Fed’s next move hit markets, spurring a massive global sell-off in August. Overall for the reporting period, international equity markets were collectively much weaker than the U.S. market and ended with flat to negative returns. For example, the MSCI EAFE Index returned -0.07% for the twelve-month reporting period. Emerging market stocks experienced even greater headwinds from the strong U.S. dollar, weak Chinese data, the commodity sell-off and Fed uncertainty, significantly underperforming developed market peers. As measured by the MSCI Emerging Markets Index, this segment ended the period with a -14.53% return.
In the U.S., equities experienced a correction in August 2015 in connection with the above-mentioned factors and dipped again in late September, before rising back to mid-2015 levels in the final month of the reporting period. The S&P 500® Index ended up posting a return of 5.20% for the twelve-month reporting period. However, the positive overall index results masked the more than 40% spread between the return of the best performing sector, consumer discretionary and the worst performing sector, energy, which fell by more than 19%. Larger, more established companies outperformed riskier, smaller-cap stocks, which continued to be hampered by heightened risk aversion and the pending Fed rate tightening, which will remove liquidity from the market. The small-cap segment produced a 0.34% return as measured by the Russell 2000® Index versus a 4.86% return for the larger-cap Russell 1000® Index. Across the capitalization spectrum, growth stocks outperformed value stocks, particularly in the larger-cap area.
Nuveen Equity Index Fund
How did the Fund perform during the twelve-month reporting period ended October 31, 2015?
The tables in the Fund Performance and Expense Ratios section of this report provide total returns for the Fund for the one-year, five-year and ten-year periods ended October 31, 2015. Comparative performance information is provided for the Fund’s Class A Shares at net asset value (NAV). The Fund’s Class A Shares at NAV performed in line with the Lipper S&P 500® Index Objective Funds Classification Average, but underperformed the S&P 500® Index during the twelve-month reporting period.
What strategies were used to manage the Fund during the reporting period and how did these strategies influence performance?
The Fund’s investment objective is to replicate the return of the S&P 500® Index as closely as possible, with consideration given to turnover costs and fees. S&P/Dow Jones changes the index definition as often as weekly, deleting firms as they are acquired or when the membership committee determines that a firm is no longer representative of the index definition. Additionally, index weights are changed to reflect merger and acquisition activity or share issuance and repurchasing. These changes typically result in low turnover, well below 20% per year. We believe the Fund’s objective can best be achieved by investing in approximately 90% to 100% of the issues included in the S&P 500® Index, depending on the size of the Fund. During the reporting period, we held essentially all of the issues found in the index. In addition, we aggressively tracked and implemented the occasional changes to index member names, as well as changes to the relative weights in the index.
The Fund performed very similarly to the S&P 500® Index during the reporting period. The index experienced a divergence of more than 40% between the returns of its top- and bottom-performing sectors during the Fund’s fiscal year. The best-performing sector in the S&P 500® Index, consumer discretionary, rose more than 20%, followed by information technology, which was up more than 11%. At the same time, the energy sector in the index produced a significantly negative return, falling more than 19%.
We also continued to invest in S&P 500® Index futures to convert cash into the equivalent of an S&P 500® Index holding in order to manage cash flow activity and minimize tracking error to the Fund’s benchmark index. These contracts are used as a means to efficiently gain exposure to a broad base of equity securities. The Fund’s holdings of futures, which were matched to the level of cash, were helpful in keeping the Fund fully invested, neither overexposed nor underexposed to equities, despite cash flows. Due to generally rising equity prices during the reporting period, these positions contributed positively to performance.
Nuveen Mid Cap Index Fund
How did the Fund perform during the twelve-month reporting period ended October 31, 2015?
The tables in the Fund Performance and Expense Ratios section of this report provide total returns for the Fund for the one-year, five-year and ten-year periods ended October 31, 2015. Comparative performance information is provided for the Fund’s Class A Shares at net asset value (NAV). The Fund’s Class A Shares at NAV outperformed the Lipper Mid-Cap Core Funds Classification Average, but underperformed the S&P MidCap 400® Index for the twelve-month reporting period.
Portfolio Managers’ Comments (continued)
What strategies were used to manage the Fund during the reporting period and how did these strategies influence performance?
The Fund’s investment objective is to replicate the return of the S&P MidCap 400® Index as closely as possible, with consideration given to turnover costs and fees. S&P/Dow Jones changes the index definition as often as weekly, deleting firms as they are acquired or when the membership committee determines that a firm is no longer representative of the index definition. Additionally, index weights are changed to reflect merger and acquisition activity or share issuance and repurchasing. These changes typically result in low turnover, well below 20% per year. We believe the Fund’s objective can best be achieved by investing in approximately 90% to 100% of the issues included in the S&P MidCap 400® Index, depending on the size of the Fund. During the reporting period, we held essentially all of the issues found in the index. In addition, we aggressively tracked and implemented the occasional changes to index member names, as well as changes to the relative weights in the index.
The Fund performed very similarly to the S&P MidCap 400® Index during the reporting period. The index experienced a divergence of more than 63% between the returns of its top- and bottom-performing sectors during the Fund’s fiscal year. The best-performing sector in the S&P MidCap 400® Index, health care, rose more than 14%, followed by information technology, which was up more than 10%. At the same time, the energy sector in the index produced a significantly negative return, falling more than 48%.
We also continued to invest in e-mini S&P MidCap 400® futures to convert cash into the equivalent of an S&P MidCap 400® Index holding in order to manage cash flow activity and minimize tracking error to the Fund’s benchmark index. These contracts are used as a means to efficiently gain exposure to a broad base of equity securities. The Fund’s holdings of futures, which were matched to the level of cash, were helpful in keeping the Fund fully invested, neither overexposed nor underexposed to equities, despite cash flows. Due to generally rising equity prices during the reporting period, these positions contributed positively to performance.
Nuveen Small Cap Index Fund
How did the Fund perform during the twelve-month reporting period ended October 31, 2015?
The tables in the Fund Performance and Expense Ratios section of this report provide total returns for the Fund for the one-year, five-year and ten-year periods ended October 31, 2015. Comparative performance information is provided for the Fund’s Class A Shares at net asset value (NAV). The Fund’s Class A Shares at NAV performed in line with the Lipper Small-Cap Core Funds Classification Average, but underperformed the Russell 2000® Index for the twelve-month reporting period.
What strategies were used to manage the Fund during the reporting period and how did these strategies influence performance?
The Fund’s investment objective is to replicate the return of the Russell 2000® Index as closely as possible, with consideration given to turnover costs and fees. Russell Investments reconstitutes this index near the end of June each year, generally selecting the stocks that are numbered 1001 through 3000 of the largest eligible U.S. companies. (To reduce turnover expenses, companies near the 1000 breakpoint remain in their prior category.) Throughout the remainder of the year, the number of stocks in the index will vary as appropriate IPOs are added quarterly and stocks are removed because of merger and acquisition activity or delisting. Share changes due to issuance and repurchasing are adjusted monthly. During the reporting period, these changes resulted in an approximately 12% level of turnover. The majority of changes are from successful firms that move up to the Russell 1000® Index. We believe the Fund’s objective can best be achieved by investing in approximately 90% to 100% of the issues included in the Russell 2000® Index, depending on the size of the Fund. During the reporting period, we held essentially all of the issues found in the index. In addition, we aggressively tracked and implemented the occasional changes to index member names, as well as changes to the relative weights in the index.
The Fund performed very similarly to the Russell 2000® Index during the reporting period. The index experienced a divergence of more than 53% between the returns of its top- and bottom-performing sectors during the Fund’s fiscal year. The best-performing sector in the Russell 2000® Index, information technology, rose more than 9%, followed by health care, which was up more than 8%. At the same time, the energy sector in the index produced a significantly negative return, falling more than 43%.
We also continued to invest in e-mini Russell 2000® futures to convert cash into the equivalent of a Russell 2000® Index holding in order to manage cash flow activity and minimize tracking error to the Fund’s benchmark index. These contracts are used as a means to efficiently gain exposure to a broad base of equity securities. The Fund’s holdings of futures, which were matched to the level of cash, were helpful in keeping the Fund fully invested, neither overexposed nor underexposed to equities, despite cash flows. Due to relatively stable small cap equity prices during the reporting period, there was no meaningful contribution to performance from these positions.
Risk Considerations
Nuveen Equity Index Fund
Nuveen Mid Cap Index Fund
Nuveen Small Cap Index Fund
Mutual fund investing involves risk; principal loss is possible. The Funds’ investments in common stocks involve the risk of decline due to adverse company or industry news or a general economic decline. The use of derivatives involves substantial financial risk and transaction costs. In addition, each Fund may fail to match index performance. Small- and mid-cap stocks are subject to greater price volatility and liquidity risks.
Fund Performance
and Expense Ratios
The Fund Performance and Expense Ratios for each Fund are shown within this section of the report.
Returns quoted represent past performance, which is no guarantee of future results. Current performance may be higher or lower than the performance shown. Investment returns and principal value will fluctuate so that when shares are redeemed, they may be worth more or less than their original cost. Returns without sales charges would be lower if the sales charge were included. Returns do not reflect the deduction of taxes that a shareholder would pay on Fund distributions or the redemption of Fund shares.
Returns may reflect fee waivers and/or expense reimbursements by the investment adviser during the periods presented. If any such waivers and/or reimbursements had not been in place, returns would have been reduced. See Notes to Financial Statements, Note 7—Management Fees and Other Transactions with Affiliates for more information. For the most recent month-end performance visit www.nuveen.com or call (800) 257-8787.
Returns reflect differences in sales charges and expenses, which are primarily differences in distribution and service fees, and assume reinvestment of dividends and capital gains.
Comparative index and Lipper return information is provided for Class A Shares at net asset value (NAV) only.
The expense ratios shown reflect total operating expenses (before fee waivers and/or expense reimbursements, if any) as shown in the most recent prospectus. The expense ratios include management fees and other fees and expenses.
Fund Performance and Expense Ratios (continued)
Nuveen Equity Index Fund
Refer to the first page of this Fund Performance and Expense Ratios section for further explanation of the information included within this section. Refer to the Glossary of Terms Used in this Report for definitions of terms used within this section.
Fund Performance
Average Annual Total Returns as of October 31, 2015
| | | | | | | | | | | | |
| | | Average Annual | |
| | | 1-Year | | | 5-Year | | | 10-Year | |
Class A Shares | | | 4.63% | | | | 13.63% | | | | 7.28% | |
S&P 500® Index | | | 5.20% | | | | 14.33% | | | | 7.85% | |
Lipper S&P 500® Index Objective Funds Classification Average | | | 4.65% | | | | 13.69% | | | | 7.32% | |
| | | |
Class C Shares | | | 3.84% | | | | 12.80% | | | | 6.49% | |
Class R3 Shares | | | 4.37% | | | | 13.35% | | | | 7.02% | |
Class I Shares | | | 4.90% | | | | 13.92% | | | | 7.55% | |
Average Annual Total Returns as of September 30, 2015 (Most Recent Calendar Quarter)
| | | | | | | | | | | | |
| | | Average Annual | |
| | | 1-Year | | | 5-Year | | | 10-Year | |
Class A Shares | | | (1.15)% | | | | 12.65% | | | | 6.24% | |
Class C Shares | | | (1.92)% | | | | 11.81% | | | | 5.45% | |
Class R3 Shares | | | (1.43)% | | | | 12.38% | | | | 5.98% | |
Class I Shares | | | (0.93)% | | | | 12.93% | | | | 6.51% | |
Indexes and Lipper averages are not available for direct investment.
Class A Shares have no sales charge and are available only through fee-based programs and certain retirement plans. Class C Shares have a 1% CDSC for redemptions within less than twelve months of purchase, which is not reflected in the one-year total return. Class R3 Shares have no sales charge and are available to only certain retirement plans. Class I Shares have no sales charge and may be purchased under limited circumstances or by specified classes of investors.
Expense Ratios as of Most Recent Prospectus
| | | | | | | | | | | | | | | | |
| | | Share Class | |
| | | Class A | | | Class C | | | Class R3 | | | Class I | |
Gross Expense Ratios | | | 0.73% | | | | 1.48% | | | | 0.98% | | | | 0.48% | |
Net Expense Ratios | | | 0.62% | | | | 1.37% | | | | 0.87% | | | | 0.37% | |
The Fund’s investment adviser has contractually agreed to waive fees and/or reimburse other Fund expenses through September 30, 2016, so that total annual Fund operating expenses (excluding 12b-1 distribution and/or service fees, interest expenses, taxes, acquired fund fees and expenses, fees incurred in acquiring and disposing of portfolio securities and extraordinary expenses) do not exceed 0.37% of the average daily net assets of any class of Fund shares. Fee waivers and/or expense reimbursements will not be terminated prior to that time without the approval of the Fund’s Board of Directors.
Growth of an Assumed $10,000 Investment as of October 31, 2015 – Class A Shares
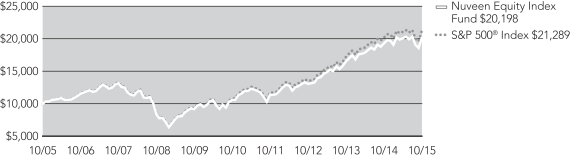
The graphs do not reflect the deduction of taxes that a shareholder may pay on Fund distributions or the redemption of Fund shares.
Fund Performance and Expense Ratios (continued)
Nuveen Mid Cap Index Fund
Refer to the first page of this Fund Performance and Expense Ratios section for further explanation of the information included within this section. Refer to the Glossary of Terms Used in this Report for definitions of terms used within this section.
Fund Performance
Average Annual Total Returns as of October 31, 2015
| | | | | | | | | | | | |
| | | Average Annual | |
| | | 1-Year | | | 5-Year | | | 10-Year | |
Class A Shares | | | 2.86% | | | | 12.74% | | | | 8.50% | |
S&P MidCap 400® Index | | | 3.42% | | | | 13.41% | | | | 9.09% | |
Lipper Mid-Cap Core Funds Classification Average | | | 0.87% | | | | 11.67% | | | | 7.38% | |
| | | |
Class C Shares | | | 2.13% | | | | 11.89% | | | | 7.69% | |
Class R3 Shares | | | 2.64% | | | | 12.46% | | | | 8.22% | |
Class I Shares | | | 3.11% | | | | 13.00% | | | | 8.76% | |
Average Annual Total Returns as of September 30, 2015 (Most Recent Calendar Quarter)
| | | | | | | | | | | | |
| | | Average Annual | |
| | | 1-Year | | | 5-Year | | | 10-Year | |
Class A Shares | | | 0.81% | | | | 12.25% | | | | 7.67% | |
Class C Shares | | | 0.07% | | | | 11.42% | | | | 6.87% | |
Class R3 Shares | | | 0.56% | | | | 11.98% | | | | 7.40% | |
Class I Shares | | | 1.06% | | | | 12.53% | | | | 7.94% | |
Indexes and Lipper averages are not available for direct investment.
Class A Shares have no sales charge and are available only through fee-based programs and certain retirement plans. Class C Shares have a 1% contingent deferred sales charge (CDSC) for redemptions within less than twelve months of purchase, which is not reflected in the one-year total return. Class R3 Shares have no sales charge and are available to only certain retirement plans. Class I Shares have no sales charge and may be purchased under limited circumstances or by specified classes of investors.
Expense Ratios as of Most Recent Prospectus
| | | | | | | | | | | | | | | | |
| | | Share Class | |
| | | Class A | | | Class C | | | Class R3 | | | Class I | |
Gross Expense Ratios | | | 0.81% | | | | 1.56% | | | | 1.06% | | | | 0.56% | |
Net Expense Ratios | | | 0.74% | | | | 1.49% | | | | 0.99% | | | | 0.49% | |
The Fund’s investment adviser has contractually agreed to waive fees and/or reimburse other Fund expenses through September 30, 2016, so that total annual Fund operating expenses (excluding 12b-1 distribution and/or service fees, interest expenses, taxes, acquired fund fees and expenses, fees incurred in acquiring and disposing of portfolio securities and extraordinary expenses) do not exceed 0.50% of the average daily net assets of any class of Fund shares. Fee waivers and/or expense reimbursements will not be terminated prior to that time without the approval of the Fund’s Board of Directors.
Growth of an Assumed $10,000 Investment as of October 31, 2015 – Class A Shares
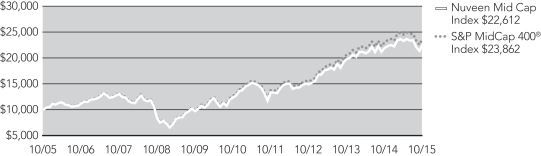
The graphs do not reflect the deduction of taxes that a shareholder may pay on Fund distributions or the redemption of Fund shares.
Fund Performance and Expense Ratios (continued)
Nuveen Small Cap Index Fund
Refer to the first page of this Fund Performance and Expense Ratios section for further explanation of the information included within this section. Refer to the Glossary of Terms Used in this Report for definitions of terms used within this section.
Fund Performance
Average Annual Total Returns as of October 31, 2015
| | | | | | | | | | | | |
| | | Average Annual | |
| | | 1-Year | | | 5-Year | | | 10-Year | |
Class A Shares | | | (0.31)% | | | | 11.41% | | | | 6.94% | |
Russell 2000® Index | | | 0.34% | | | | 12.06% | | | | 7.47% | |
Lipper Small-Cap Core Funds Classification Average | | | (0.32)% | | | | 11.30% | | | | 7.14% | |
| | | |
Class C Shares | | | (1.05)% | | | | 10.57% | | | | 6.13% | |
Class R3 Shares | | | (0.52)% | | | | 11.14% | | | | 6.67% | |
Class I Shares | | | (0.06)% | | | | 11.70% | | | | 7.20% | |
Average Annual Total Returns as of September 30, 2015 (Most Recent Calendar Quarter)
| | | | | | | | | | | | |
| | | Average Annual | |
| | | 1-Year | | | 5-Year | | | 10-Year | |
Class A Shares | | | 0.65% | | | | 11.08% | | | | 6.02% | |
Class C Shares | | | (0.18)% | | | | 10.24% | | | | 5.22% | |
Class R3 Shares | | | 0.32% | | | | 10.79% | | | | 5.75% | |
Class I Shares | | | 0.83% | | | | 11.35% | | | | 6.28% | |
Indexes and Lipper averages are not available for direct investment.
Class A Shares have no sales charge and are available only through fee-based programs and certain retirement plans. Class C Shares have a 1% contingent deferred sales charge (CDSC) for redemptions within less than twelve months of purchase, which is not reflected in the one-year total return. Class R3 Shares have no sales charge and are available to only certain retirement plans. Class I Shares have no sales charge and may be purchased under limited circumstances or by specified classes of investors.
Expense Ratios as of Most Recent Prospectus
| | | | | | | | | | | | | | | | |
| | | Share Class | |
| | | Class A | | | Class C | | | Class R3 | | | Class I | |
Gross Expense Ratios | | | 1.09% | | | | 1.84% | | | | 1.34% | | | | 0.84% | |
Net Expense Ratios | | | 0.87% | | | | 1.62% | | | | 1.12% | | | | 0.62% | |
The Fund’s investment adviser has contractually agreed to waive fees and/or reimburse other Fund expenses through September 30, 2016, so that total annual fund operating expenses (excluding 12b-1 distribution and/or service fees, interest expenses, taxes, acquired fund fees and expenses, fees incurred in acquiring and disposing of portfolio securities and extraordinary expenses) do not exceed 0.58% of the average daily net assets of any class of Fund shares. Fee waivers and/or expense reimbursements will not be terminated prior to that time without the approval of the Fund’s Board of Directors.
Growth of an Assumed $10,000 Investment as of October 31, 2015 – Class A Shares
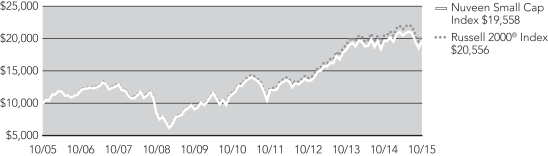
The graphs do not reflect the deduction of taxes that a shareholder may pay on Fund distributions or the redemption of Fund shares.
Holding
Summaries as of October 31, 2015
This data relates to the securities held in each Fund’s portfolio of investments as of the end of this reporting period. It should not be construed as a measure of performance for the Fund itself. Holdings are subject to change.
Nuveen Equity Index Fund
Fund Allocation
(% of net assets)
| | | | |
Common Stocks | | | 98.5% | |
Common Stock Rights | | | 0.0% | |
Investments Purchased with Collateral from Securities Lending | | | 23.1% | |
Money Market Funds | | | 1.0% | |
U.S. Government and Agency Obligations | | | 0.4% | |
Other Assets Less Liabilities | | | (23.0)% | |
Net Assets | | | 100% | |
Portfolio Composition
(% of net assets)
| | | | |
Oil, Gas & Consumable Fuels | | | 5.9% | |
Banks | | | 5.8% | |
Pharmaceuticals | | | 5.5% | |
Technology Hardware, Storage & Peripherals | | | 4.5% | |
Software | | | 4.1% | |
Internet Software & Services | | | 3.9% | |
IT Services | | | 3.7% | |
Biotechnology | | | 3.7% | |
Media | | | 3.2% | |
Insurance | | | 2.7% | |
Aerospace & Defense | | | 2.7% | |
Health Care Providers & Services | | | 2.6% | |
Real Estate Investment Trust | | | 2.6% | |
Specialty Retail | | | 2.5% | |
Industrial Conglomerates | | | 2.5% | |
Semiconductors & Semiconductor Equipment | | | 2.4% | |
Diversified Telecommunication Services | | | 2.3% | |
Beverages | | | 2.3% | |
Food & Staples Retailing | | | 2.2% | |
Chemicals | | | 2.2% | |
Capital Markets | | | 2.1% | |
Internet & Catalog Retail | | | 2.1% | |
Health Care Equipment & Supplies | | | 2.0% | |
Diversified Financial Services | | | 2.0% | |
Hotels, Restaurants & Leisure | | | 1.9% | |
Household Products | | | 1.7% | |
Other | | | 19.4% | |
Common Stock Rights | | | 0.0% | |
Investments Purchased with Collateral from Securities Lending | | | 23.1% | |
Money Market Funds | | | 1.0% | |
U.S. Government and Agency Obligations | | | 0.4% | |
Other Assets Less Liabilities | | | (23.0)% | |
Net Assets | | | 100.0% | |
Top Five Common Stock
Holdings
(% of net assets)
| | | | |
Apple, Inc | | | 3.7% | |
Microsoft Corporation | | | 2.3% | |
Exxon Mobil Corporation | | | 1.9% | |
General Electric Company | | | 1.6% | |
Johnson & Johnson | | | 1.5% | |
Nuveen Mid Cap Index Fund
Fund Allocation
(% of net assets)
| | | | |
Common Stocks | | | 94.7% | |
Common Stock Rights | | | 0.0% | |
Investments Purchased with Collateral from Securities Lending | | | 28.7% | |
Money Market Funds | | | 5.0% | |
U.S. Government and Agency Obligations | | | 0.5% | |
Other Assets Less Liabilities | | | (28.9)% | |
Net Assets | | | 100% | |
Portfolio Composition
(% of net assets)
| | | | |
Real Estate Investment Trust | | | 9.3% | |
Banks | | | 5.3% | |
Insurance | | | 5.1% | |
Software | | | 4.7% | |
Machinery | | | 4.3% | |
Health Care Equipment & Supplies | | | 4.0% | |
IT Services | | | 3.8% | |
Electronic Equipment, Instruments & Components | | | 3.4% | |
Chemicals | | | 3.3% | |
Specialty Retail | | | 2.7% | |
Health Care Providers & Services | | | 2.6% | |
Food Products | | | 2.3% | |
Household Durables | | | 2.1% | |
Oil, Gas & Consumable Fuels | | | 2.0% | |
Hotels, Restaurants & Leisure | | | 1.9% | |
Capital Markets | | | 1.9% | |
Semiconductors & Semiconductor Equipment | | | 1.8% | |
Commercial Services & Supplies | | | 1.7% | |
Electric Utilities | | | 1.7% | |
Gas Utilities | | | 1.6% | |
Aerospace & Defense | | | 1.5% | |
Media | | | 1.5% | |
Metals & Mining | | | 1.5% | |
Diversified Financial Services | | | 1.4% | |
Containers & Packaging | | | 1.4% | |
Energy Equipment & Services | | | 1.4% | |
Life Sciences Tools & Services | | | 1.3% | |
Other | | | 19.2% | |
Common Stock Rights | | | 0.0% | |
Investments Purchased with Collateral from Securities Lending | | | 28.7% | |
Money Market Funds | | | 5.0% | |
U.S. Government and Agency Obligations | | | 0.5% | |
Other Assets Less Liabilities | | | (28.9)% | |
Net Assets | | | 100.0% | |
Top Five Common Stock
Holdings
(% of net assets)
| | | | |
Church & Dwight Company Inc. | | | 0.7% | |
Alaska Air Group Inc. | | | 0.6% | |
Hologic Inc. | | | 0.6% | |
Federal Realty Investment Trust | | | 0.6% | |
Foot Locker, Inc. | | | 0.6% | |
Holding Summaries as of October 31, 2015 (continued)
Nuveen Small Cap Index Fund
Fund Allocation
(% of net assets)
| | | | |
Common Stocks | | | 96.2% | |
Exchange-Traded Funds | | | 0.0% | |
Common Stock Rights | | | 0.0% | |
Warrants | | | 0.0% | |
Investments Purchased with Collateral from Securities Lending | | | 31.2% | |
Money Market Funds | | | 3.6% | |
U.S. Government and Agency Obligations | | | 0.2% | |
Other Assets Less Liabilities | | | (31.2)% | |
Net Assets | | | 100% | |
Portfolio Composition
(% of net assets)
| | | | |
Real Estate Investment Trust | | | 8.8% | |
Banks | | | 8.7% | |
Biotechnology | | | 5.8% | |
Software | | | 4.4% | |
Health Care Equipment & Supplies | | | 3.4% | |
Semiconductors & Semiconductor Equipment | | | 3.2% | |
Hotels, Restaurants & Leisure | | | 3.2% | |
Specialty Retail | | | 2.9% | |
Health Care Providers & Services | | | 2.6% | |
Machinery | | | 2.5% | |
Electronic Equipment, Instruments & Components | | | 2.5% | |
Insurance | | | 2.5% | |
IT Services | | | 2.5% | |
Internet Software & Services | | | 2.3% | |
Commercial Services & Supplies | | | 2.1% | |
Oil, Gas & Consumable Fuels | | | 2.0% | |
Thrifts & Mortgage Finance | | | 2.0% | |
Chemicals | | | 1.8% | |
Pharmaceuticals | | | 1.7% | |
Food Products | | | 1.7% | |
Communications Equipment | | | 1.6% | |
Media | | | 1.5% | |
Aerospace & Defense | | | 1.4% | |
Professional Services | | | 1.4% | |
Capital Markets | | | 1.3% | |
Household Durables | | | 1.3% | |
Electric Utilities | | | 1.3% | |
Other | | | 19.8% | |
Exchange-Traded Funds | | | 0.0% | |
Common Stock Rights | | | 0.0% | |
Warrants | | | 0.0% | |
Investments Purchased with Collateral from Securities Lending | | | 31.2% | |
Money Market Funds | | | 3.6% | |
U.S. Government and Agency Obligations | | | 0.2% | |
Other Assets Less Liabilities | | | (31.2)% | |
Net Assets | | | 100.0% | |
Top Five Common Stock Holdings
(% of net assets)
| | | | |
Steris Corporation | | | 0.3% | |
Tyler Technologies Inc. | | | 0.3% | |
Manhattan Associates Inc. | | | 0.3% | |
CubeSmart | | | 0.3% | |
Anacor Pharmaceuticals Inc. | | | 0.3% | |
Expense
Examples
As a shareholder of one or more of the Funds, you incur two types of costs: (1) transaction costs, including up-front and back-end sales charges (loads) or redemption fees, where applicable; and (2) ongoing costs, including management fees; distribution and service (12b-1) fees, where applicable; and other Fund expenses. The Examples below are intended to help you understand your ongoing costs (in dollars) of investing in the Funds and to compare these costs with the ongoing costs of investing in other mutual funds.
The Examples below are based on an investment of $1,000 invested at the beginning of the period and held through the period ended October 31, 2015.
The beginning of the period is May 1, 2015.
The information under “Actual Performance,” together with the amount you invested, allows you to estimate actual expenses incurred over the reporting period. Simply divide your account value by $1,000 (for example, an $8,600 account value divided by $1,000 = 8.60) and multiply the result by the cost shown for your share class, in the row entitled “Expenses Incurred During Period” to estimate the expenses incurred on your account during this period.
The information under “Hypothetical Performance,” provides information about hypothetical account values and hypothetical expenses based on each respective Fund’s actual expense ratio and an assumed rate of return of 5% per year before expenses, which is not the Fund’s actual return. The hypothetical account values and expenses may not be used to estimate the actual ending account balance or expense you incurred for the period. You may use this information to compare the ongoing costs of investing in the Fund and other funds. To do so, compare this 5% hypothetical example with the 5% hypothetical examples that appear in the shareholder reports of the other funds.
Please note that the expenses shown in the tables are meant to highlight your ongoing costs only and do not reflect any transaction costs. Therefore, the hypothetical information is useful in comparing ongoing costs only, and will not help you determine the relative total costs of owning different funds or share classes. In addition, if these transaction costs were included, your costs would have been higher.
Nuveen Equity Index Fund
| | | | | | | | | | | | | | | | |
| | | Share Class | |
| | | Class A | | | Class C | | | Class R3 | | | Class I | |
Actual Performance | | | | | | | | | | | | | | | | |
Beginning Account Value | | $ | 1,000.00 | | | $ | 1,000.00 | | | $ | 1,000.00 | | | $ | 1,000.00 | |
Ending Account Value | | $ | 1,004.70 | | | $ | 1,001.20 | | | $ | 1,003.40 | | | $ | 1,006.00 | |
Expenses Incurred During Period | | $ | 3.13 | | | $ | 6.91 | | | $ | 4.39 | | | $ | 1.87 | |
Hypothetical Performance (5% annualized return before expenses) | | | | | | | | | | | | | | | | |
Beginning Account Value | | $ | 1,000.00 | | | $ | 1,000.00 | | | $ | 1,000.00 | | | $ | 1,000.00 | |
Ending Account Value | | $ | 1,022.08 | | | $ | 1,018.30 | | | $ | 1,020.82 | | | $ | 1,023.34 | |
Expenses Incurred During Period | | $ | 3.16 | | | $ | 6.97 | | | $ | 4.43 | | | $ | 1.89 | |
For each class of the Fund, expenses are equal to the Fund’s annualized net expense ratio of 0.62%, 1.37%, 0.87% and 0.37% for Classes A, C, R3 and I, respectively, multiplied by the average account value over the period, multiplied by 184/365 (to reflect the one-half year period).
Expense Examples (continued)
Nuveen Mid Cap Index Fund
| | | | | | | | | | | | | | | | |
| | | Share Class | |
| | | Class A | | | Class C | | | Class R3 | | | Class I | |
Actual Performance | | | | | | | | | | | | | | | | |
Beginning Account Value | | $ | 1,000.00 | | | $ | 1,000.00 | | | $ | 1,000.00 | | | $ | 1,000.00 | |
Ending Account Value | | $ | 968.90 | | | $ | 965.40 | | | $ | 967.90 | | | $ | 970.00 | |
Expenses Incurred During Period | | $ | 3.62 | | | $ | 7.33 | | | $ | 4.86 | | | $ | 2.38 | |
Hypothetical Performance (5% annualized return before expenses) | | | | | | | | | | | | | | | | |
Beginning Account Value | | $ | 1,000.00 | | | $ | 1,000.00 | | | $ | 1,000.00 | | | $ | 1,000.00 | |
Ending Account Value | | $ | 1,021.53 | | | $ | 1,017.74 | | | $ | 1,020.27 | | | $ | 1,022.79 | |
Expenses Incurred During Period | | $ | 3.72 | | | $ | 7.53 | | | $ | 4.99 | | | $ | 2.45 | |
For each class of the Fund, expenses are equal to the Fund’s annualized net expense ratio of 0.73%, 1.48%, 0.98% and 0.48% for Classes A, C, R3 and I, respectively, multiplied by the average account value over the period, multiplied by 184/365 (to reflect the one-half year period).
Nuveen Small Cap Index Fund
| | | | | | | | | | | | | | | | |
| | | Share Class | |
| | | Class A | | | Class C | | | Class R3 | | | Class I | |
Actual Performance | | | | | | | | | | | | | | | | |
Beginning Account Value | | $ | 1,000.00 | | | $ | 1,000.00 | | | $ | 1,000.00 | | | $ | 1,000.00 | |
Ending Account Value | | $ | 955.50 | | | $ | 951.80 | | | $ | 954.30 | | | $ | 957.00 | |
Expenses Incurred During Period | | $ | 3.99 | | | $ | 7.67 | | | $ | 5.22 | | | $ | 2.76 | |
Hypothetical Performance (5% annualized return before expenses) | | | | | | | | | | | | | | | | |
Beginning Account Value | | $ | 1,000.00 | | | $ | 1,000.00 | | | $ | 1,000.00 | | | $ | 1,000.00 | |
Ending Account Value | | $ | 1,021.12 | | | $ | 1,017.34 | | | $ | 1,019.86 | | | $ | 1,022.38 | |
Expenses Incurred During Period | | $ | 4.13 | | | $ | 7.93 | | | $ | 5.40 | | | $ | 2.85 | |
For each class of the Fund, expenses are equal to the Fund’s annualized net expense ratio of 0.81%, 1.56%, 1.06% and 0.56% for Classes A, C, R3 and I, respectively, multiplied by the average account value over the period, multiplied by 184/365 (to reflect the one-half year period).
Report of
Independent Registered Public Accounting Firm
To the Board of Directors and Shareholders of
Nuveen Investment Funds, Inc.:
In our opinion, the accompanying statements of assets and liabilities, including the portfolios of investments, and the related statements of operations and of changes in net assets and the financial highlights present fairly, in all material respects, the financial position of Nuveen Equity Index Fund, Nuveen Mid Cap Index Fund and Nuveen Small Cap Index Fund (each a series of the Nuveen Investment Funds, Inc., hereinafter referred to as the “Funds”) at October 31, 2015, the results of each of their operations for the year then ended, the changes in each of their net assets for each of the two years in the period then ended and the financial highlights for each of the four years in the period then ended, in conformity with accounting principles generally accepted in the United States of America. These financial statements and financial highlights (hereafter referred to as “financial statements”) are the responsibility of the Funds’ management. Our responsibility is to express an opinion on these financial statements based on our audits. We conducted our audits of these financial statements in accordance with the standards of the Public Company Accounting Oversight Board (United States). Those standards require that we plan and perform the audit to obtain reasonable assurance about whether the financial statements are free of material misstatement. An audit includes examining, on a test basis, evidence supporting the amounts and disclosures in the financial statements, assessing the accounting principles used and significant estimates made by management, and evaluating the overall financial statement presentation. We believe that our audits, which included confirmation of securities at October 31, 2015 by correspondence with the custodian and brokers, provide a reasonable basis for our opinion. The financial statements of the Funds for the year ended October 31, 2011 were audited by other independent auditors whose report dated December 28, 2011 expressed an unqualified opinion on those statements.
PricewaterhouseCoopers LLP
Chicago, IL
December 28, 2015
Nuveen Equity Index Fund
| | |
| Portfolio of Investments | | October 31, 2015 |
| | | | | | | | |
| Shares | | | Description (1) | | Value | |
| | |
| | | | LONG-TERM INVESTMENTS – 98.5% | | | | |
| | |
| | | | COMMON STOCKS – 98.5% | | | | |
| | |
| | | | Aerospace & Defense – 2.7% | | | |
| | |
| | 27,198 | | | Boeing Company | | $ | 4,027,208 | |
| | |
| | 13,208 | | | General Dynamics Corporation | | | 1,962,445 | |
| | |
| | 33,059 | | | Honeywell International Inc., (2) | | | 3,414,333 | |
| | |
| | 3,483 | | | L-3 Communications Holdings, Inc. | | | 440,251 | |
| | |
| | 11,314 | | | Lockheed Martin Corporation | | | 2,487,157 | |
| | |
| | 8,195 | | | Northrop Grumman Corporation | | | 1,538,611 | |
| | |
| | 5,845 | | | Precision Castparts Corporation | | | 1,349,084 | |
| | |
| �� | 12,904 | | | Raytheon Company | | | 1,514,930 | |
| | |
| | 5,594 | | | Rockwell Collins, Inc. | | | 485,112 | |
| | |
| | 12,744 | | | Textron Inc. | | | 537,414 | |
| | |
| | 35,011 | | | United Technologies Corporation, (2) | | | 3,445,432 | |
| | | | Total Aerospace & Defense | | | 21,201,977 | |
| | |
| | | | Air Freight & Logistics – 0.7% | | | |
| | |
| | 6,167 | | | C.H. Robinson Worldwide, Inc. | | | 427,866 | |
| | |
| | 8,090 | | | Expeditors International of Washington, Inc. | | | 402,801 | |
| | |
| | 11,149 | | | FedEx Corporation | | | 1,739,801 | |
| | |
| | 29,348 | | | United Parcel Service, Inc., Class B | | | 3,023,431 | |
| | | | Total Air Freight & Logistics | | | 5,593,899 | |
| | |
| | | | Airlines – 0.6% | | | |
| | |
| | 27,751 | | | American Airlines Group Inc. | | | 1,282,651 | |
| | |
| | 34,734 | | | Delta Air Lines, Inc. | | | 1,765,877 | |
| | |
| | 28,262 | | | Southwest Airlines Co. | | | 1,308,248 | |
| | |
| | 9,814 | | | United Continental Holdings Inc., (2) (3) | | | 591,882 | |
| | | | Total Airlines | | | 4,948,658 | |
| | |
| | | | Auto Components – 0.4% | | | |
| | |
| | 9,980 | | | BorgWarner Inc. | | | 427,344 | |
| | |
| | 12,578 | | | Delphi Automotive PLC | | | 1,046,364 | |
| | |
| | 11,547 | | | Goodyear Tire & Rubber Company | | | 379,203 | |
| | |
| | 27,693 | | | Johnson Controls, Inc., (2) | | | 1,251,170 | |
| | | | Total Auto Components | | | 3,104,081 | |
| | |
| | | | Automobiles – 0.6% | | | |
| | |
| | 168,121 | | | Ford Motor Company | | | 2,489,872 | |
| | |
| | 56,717 | | | General Motors Company | | | 1,979,990 | |
| | |
| | 8,842 | | | Harley-Davidson, Inc., (2) | | | 437,237 | |
| | | | Total Automobiles | | | 4,907,099 | |
| | | | | | | | |
| Shares | | | Description (1) | | Value | |
| | |
| | | | Banks – 5.8% | | | |
| | |
| | 444,140 | | | Bank of America Corporation | | $ | 7,452,669 | |
| | |
| | 31,443 | | | BB&T Corporation | | | 1,168,107 | |
| | |
| | 128,315 | | | Citigroup Inc. | | | 6,822,509 | |
| | |
| | 7,529 | | | Comerica Incorporated | | | 326,759 | |
| | |
| | 34,253 | | | Fifth Third Bancorp. | | | 652,520 | |
| | |
| | 35,700 | | | Huntington BancShares Inc. | | | 391,629 | |
| | |
| | 156,945 | | | JP Morgan Chase & Co. | | | 10,083,716 | |
| | |
| | 38,314 | | | KeyCorp. | | | 475,860 | |
| | |
| | 5,767 | | | M&T Bank Corporation | | | 691,175 | |
| | |
| | 13,072 | | | People’s United Financial, Inc. | | | 208,498 | |
| | |
| | 21,903 | | | PNC Financial Services Group, Inc. | | | 1,976,965 | |
| | |
| | 56,685 | | | Regions Financial Corporation | | | 530,005 | |
| | |
| | 21,831 | | | SunTrust Banks, Inc. | | | 906,423 | |
| | |
| | 74,983 | | | U.S. Bancorp, (2) | | | 3,162,783 | |
| | |
| | 198,164 | | | Wells Fargo & Company | | | 10,728,599 | |
| | |
| | 8,340 | | | Zions Bancorporation, (2) | | | 239,942 | |
| | | | Total Banks | | | 45,818,159 | |
| | |
| | | | Beverages – 2.3% | | | |
| | |
| | 6,591 | | | Brown-Forman Corporation | | | 699,832 | |
| | |
| | 165,899 | | | Coca-Cola Company, (2) | | | 7,025,823 | |
| | |
| | 9,065 | | | Coca-Cola Enterprises Inc. | | | 465,397 | |
| | |
| | 7,323 | | | Constellation Brands, Inc., Class A | | | 987,140 | |
| | |
| | 8,109 | | | Dr. Pepper Snapple Group, (2) | | | 724,701 | |
| | |
| | 6,752 | | | Molson Coors Brewing Company, Class B | | | 594,851 | |
| | |
| | 6,099 | | | Monster Beverage Corporation, (3) | | | 831,416 | |
| | |
| | 62,423 | | | PepsiCo, Inc. | | | 6,379,006 | |
| | | | Total Beverages | | | 17,708,166 | |
| | |
| | | | Biotechnology – 3.7% | | | |
| | |
| | 72,721 | | | AbbVie Inc. | | | 4,330,536 | |
| | |
| | 9,468 | | | Alexion Pharmaceuticals Inc., (2) (3) | | | 1,666,368 | |
| | |
| | 32,155 | | | Amgen Inc. | | | 5,086,278 | |
| | |
| | 23,670 | | | Baxalta Inc. | | | 815,668 | |
| | |
| | 9,948 | | | Biogen Inc., (3) | | | 2,889,993 | |
| | |
| | 33,543 | | | Celgene Corporation, (2) (3) | | | 4,116,062 | |
| | |
| | 62,150 | | | Gilead Sciences, Inc. | | | 6,720,279 | |
| | |
| | 3,223 | | | Regeneron Pharmaceuticals, Inc., (2) (3) | | | 1,796,468 | |
| | |
| | 10,403 | | | Vertex Pharmaceuticals Inc., (2) (3) | | | 1,297,670 | |
| | | | Total Biotechnology | | | 28,719,322 | |
Nuveen Equity Index Fund (continued)
| | |
| Portfolio of Investments | | October 31, 2015 |
| | | | | | | | |
| Shares | | | Description (1) | | Value | |
| | |
| | | | Building Products – 0.1% | | | |
| | |
| | 4,046 | | | Allegion PLC | | $ | 263,678 | |
| | |
| | 15,575 | | | Masco Corporation, (2) | | | 451,675 | |
| | | | Total Building Products | | | 715,353 | |
| | |
| | | | Capital Markets – 2.1% | | | |
| | |
| | 2,427 | | | Affiliated Managers Group Inc., (3) | | | 437,491 | |
| | |
| | 7,671 | | | Ameriprise Financial, Inc. | | | 884,927 | |
| | |
| | 47,430 | | | Bank New York Mellon | | | 1,975,459 | |
| | |
| | 5,371 | | | BlackRock Inc., (2) | | | 1,890,431 | |
| | |
| | 50,117 | | | Charles Schwab Corporation | | | 1,529,571 | |
| | |
| | 12,615 | | | E*Trade Group Inc., (3) | | | 359,654 | |
| | |
| | 16,495 | | | Franklin Resources, Inc. | | | 672,336 | |
| | |
| | 16,992 | | | Goldman Sachs Group, Inc. | | | 3,186,000 | |
| | |
| | 18,214 | | | Invesco LTD | | | 604,158 | |
| | |
| | 4,125 | | | Legg Mason, Inc. | | | 184,594 | |
| | |
| | 64,797 | | | Morgan Stanley | | | 2,136,357 | |
| | |
| | 9,277 | | | Northern Trust Corporation | | | 653,008 | |
| | |
| | 17,410 | | | State Street Corporation | | | 1,201,290 | |
| | |
| | 11,111 | | | T. Rowe Price Group Inc., (2) | | | 840,214 | |
| | | | Total Capital Markets | | | 16,555,490 | |
| | |
| | | | Chemicals – 2.2% | | | |
| | |
| | 8,378 | | | Air Products & Chemicals Inc., (2) | | | 1,164,374 | |
| | |
| | 2,875 | | | Airgas, Inc. | | | 276,460 | |
| | |
| | 9,953 | | | CF Industries Holdings, Inc. | | | 505,314 | |
| | |
| | 45,831 | | | Dow Chemical Company | | | 2,368,088 | |
| | |
| | 38,284 | | | E.I. Du Pont de Nemours and Company | | | 2,427,206 | |
| | |
| | 6,300 | | | Eastman Chemical Company, (2) | | | 454,671 | |
| | |
| | 11,334 | | | Ecolab Inc., (2) | | | 1,364,047 | |
| | |
| | 5,648 | | | FMC Corporation | | | 229,930 | |
| | |
| | 3,420 | | | International Flavors & Fragrances Inc. | | | 396,925 | |
| | |
| | 16,613 | | | LyondellBasell Industries NV | | | 1,543,514 | |
| | |
| | 20,135 | | | Monsanto Company, (2) | | | 1,876,985 | |
| | |
| | 13,125 | | | Mosaic Company, (2) | | | 443,494 | |
| | |
| | 11,496 | | | PPG Industries, Inc. | | | 1,198,573 | |
| | |
| | 12,192 | | | Praxair, Inc., (2) | | | 1,354,409 | |
| | |
| | 3,349 | | | Sherwin-Williams Company | | | 893,614 | |
| | |
| | 5,050 | | | Sigma-Aldrich Corporation | | | 705,586 | |
| | | | Total Chemicals | | | 17,203,190 | |
| | | | | | | | |
| Shares | | | Description (1) | | Value | |
| | |
| | | | Commercial Services & Supplies – 0.4% | | | |
| | |
| | 7,244 | | | ADT Corporation | | $ | 239,342 | |
| | |
| | 4,222 | | | Cintas Corporation | | | 393,026 | |
| | |
| | 8,529 | | | Pitney Bowes Inc., (2) | | | 176,124 | |
| | |
| | 10,549 | | | Republic Services, Inc. | | | 461,413 | |
| | |
| | 3,705 | | | Stericycle Inc., (3) | | | 449,676 | |
| | |
| | 17,806 | | | Tyco International PLC | | | 648,851 | |
| | |
| | 18,006 | | | Waste Management, Inc. | | | 968,003 | |
| | | | Total Commercial Services & Supplies | | | 3,336,435 | |
| | |
| | | | Communications Equipment – 1.5% | | | |
| | |
| | 215,086 | | | Cisco Systems, Inc. | | | 6,205,231 | |
| | |
| | 3,055 | | | F5 Networks, Inc., (2), (3) | | | 336,661 | |
| | |
| | 4,578 | | | Harris Corporation | | | 362,257 | |
| | |
| | 14,862 | | | Juniper Networks Inc. | | | 466,518 | |
| | |
| | 7,850 | | | Motorola Solutions Inc., (2) | | | 549,264 | |
| | |
| | 68,915 | | | QUALCOMM, Inc. | | | 4,094,929 | |
| | | | Total Communications Equipment | | | 12,014,860 | |
| | |
| | | | Construction & Engineering – 0.1% | | | |
| | |
| | 6,235 | | | Fluor Corporation, (2) | | | 298,095 | |
| | |
| | 5,312 | | | Jacobs Engineering Group, Inc., (3) | | | 213,224 | |
| | |
| | 8,958 | | | Quanta Services Incorporated, (2), (3) | | | 180,145 | |
| | | | Total Construction & Engineering | | | 691,464 | |
| | |
| | | | Construction Materials – 0.1% | | | |
| | |
| | 2,751 | | | Martin Marietta Materials | | | 426,818 | |
| | |
| | 5,890 | | | Vulcan Materials Company | | | 568,856 | |
| | | | Total Construction Materials | | | 995,674 | |
| | |
| | | | Consumer Finance – 0.7% | | | |
| | |
| | 36,945 | | | American Express Company | | | 2,706,591 | |
| | |
| | 23,108 | | | Capital One Financial Corporation | | | 1,823,221 | |
| | |
| | 18,714 | | | Discover Financial Services | | | 1,052,101 | |
| | |
| | 16,451 | | | Navient Corporation | | | 216,989 | |
| | | | Total Consumer Finance | | | 5,798,902 | |
| | |
| | | | Containers & Packaging – 0.2% | | | |
| | |
| | 3,850 | | | Avery Dennison Corporation | | | 250,134 | |
| | |
| | 6,050 | | | Ball Corporation | | | 414,425 | |
| | |
| | 6,819 | | | Owens-Illinois, Inc., (3) | | | 146,949 | |
| | |
| | 8,739 | | | Sealed Air Corporation, (2) | | | 429,260 | |
| | |
| | 11,026 | | | WestRock Company, (2) | | | 592,758 | |
| | | | Total Containers & Packaging | | | 1,833,526 | |
Nuveen Equity Index Fund (continued)
| | |
| Portfolio of Investments | | October 31, 2015 |
| | | | | | | | |
| Shares | | | Description (1) | | Value | |
| | |
| | | | Distributors – 0.1% | | | |
| | |
| | 6,437 | | | Genuine Parts Company, (2) | | $ | 584,222 | |
| | |
| | | | Diversified Consumer Services – 0.1% | | | |
| | |
| | 11,641 | | | H & R Block Inc. | | | 433,744 | |
| | |
| | | | Diversified Financial Services – 2.0% | | | |
| | |
| | 77,129 | | | Berkshire Hathaway Inc., Class B, (2), (3) | | | 10,491,087 | |
| | |
| | 13,419 | | | CME Group, Inc., (2) | | | 1,267,693 | |
| | |
| | 4,727 | | | Intercontinental Exchange Group, Inc. | | | 1,193,095 | |
| | |
| | 14,558 | | | Leucadia National Corporation | | | 291,306 | |
| | |
| | 11,574 | | | McGraw-Hill Companies, Inc., (2) | | | 1,072,215 | |
| | |
| | 7,523 | | | Moody’s Corporation | | | 723,412 | |
| | |
| | 5,009 | | | NASDAQ Stock Market, Inc. | | | 289,971 | |
| | | | Total Diversified Financial Services | | | 15,328,779 | |
| | |
| | | | Diversified Telecommunication Services – 2.3% | | | |
| | |
| | 259,846 | | | AT&T Inc., (2) | | | 8,707,439 | |
| | |
| | 23,842 | | | CenturyLink Inc., (2) | | | 672,583 | |
| | |
| | 44,316 | | | Frontier Communications Corporation, (2) | | | 227,784 | |
| | |
| | 12,147 | | | Level 3 Communications Inc., (3) | | | 618,890 | |
| | |
| | 172,482 | | | Verizon Communications Inc., (2) | | | 8,085,956 | |
| | | | Total Diversified Telecommunication Services | | | 18,312,652 | |
| | |
| | | | Electric Utilities – 1.6% | | | |
| | |
| | 20,720 | | | American Electric Power Company, Inc. | | | 1,173,788 | |
| | |
| | 29,246 | | | Duke Energy Corporation | | | 2,090,212 | |
| | |
| | 13,778 | | | Edison International, (2) | | | 833,845 | |
| | |
| | 7,593 | | | Entergy Corporation | | | 517,539 | |
| | |
| | 13,433 | | | Eversource Energy | | | 684,277 | |
| | |
| | 36,422 | | | Exelon Corporation | | | 1,016,902 | |
| | |
| | 18,367 | | | FirstEnergy Corp. | | | 573,050 | |
| | |
| | 18,783 | | | NextEra Energy Inc. | | | 1,928,263 | |
| | |
| | 10,691 | | | Pepco Holdings, Inc. | | | 284,701 | |
| | |
| | 4,683 | | | Pinnacle West Capital Corporation | | | 297,417 | |
| | |
| | 28,254 | | | PPL Corporation, (2) | | | 971,938 | |
| | |
| | 38,410 | | | Southern Company, (2) | | | 1,732,291 | |
| | |
| | 21,437 | | | Xcel Energy, Inc., (2) | | | 763,800 | |
| | | | Total Electric Utilities | | | 12,868,023 | |
| | |
| | | | Electrical Equipment – 0.5% | | | |
| | |
| | 10,842 | | | Ametek Inc., (2) | | | 594,358 | |
| | |
| | 19,754 | | | Eaton PLC | | | 1,104,446 | |
| | |
| | 28,264 | | | Emerson Electric Company, (2) | | | 1,334,909 | |
| | |
| | 5,692 | | | Rockwell Automation, Inc., (2) | | | 621,339 | |
| | | | Total Electrical Equipment | | | 3,655,052 | |
| | | | | | | | |
| Shares | | | Description (1) | | Value | |
| | |
| | | | Electronic Equipment, Instruments & Components – 0.4% | | | |
| | |
| | 13,065 | | | Amphenol Corporation, Class A, (2) | | $ | 708,384 | |
| | |
| | 53,225 | | | Corning Incorporated | | | 989,985 | |
| | |
| | 5,925 | | | FLIR Systems Inc. | | | 158,020 | |
| | |
| | 17,195 | | | TE Connectivity Limited | | | 1,108,046 | |
| | | | Total Electronic Equipment, Instruments & Components | | | 2,964,435 | |
| | |
| | | | Energy Equipment & Services – 1.1% | | | |
| | |
| | 18,383 | | | Baker Hughes Incorporated, (2) | | | 968,416 | |
| | |
| | 8,094 | | | Cooper Cameron Corporation, (3) | | | 550,473 | |
| | |
| | 2,842 | | | Diamond Offshore Drilling, Inc., (2) | | | 56,499 | |
| | |
| | 9,911 | | | Ensco PLC, (2) | | | 164,820 | |
| | |
| | 9,766 | | | FMC Technologies Inc., (3) | | | 330,384 | |
| | |
| | 35,984 | | | Halliburton Company | | | 1,381,066 | |
| | |
| | 4,852 | | | Helmerich & Payne Inc. | | | 273,022 | |
| | |
| | 16,403 | | | National-Oilwell Varco Inc. | | | 617,409 | |
| | |
| | 53,697 | | | Schlumberger Limited | | | 4,196,957 | |
| | |
| | 14,876 | | | Transocean Inc., (2) | | | 235,487 | |
| | | | Total Energy Equipment & Services | | | 8,774,533 | |
| | |
| | | | Food & Staples Retailing – 2.2% | | | |
| | |
| | 18,586 | | | Costco Wholesale Corporation, (2) | | | 2,938,818 | |
| | |
| | 47,717 | | | CVS Health Corporation, (2) | | | 4,713,485 | |
| | |
| | 41,460 | | | Kroger Co. | | | 1,567,188 | |
| | |
| | 25,110 | | | Sysco Corporation, (2) | | | 1,035,787 | |
| | |
| | 36,903 | | | Walgreens Boots Alliance Inc. | | | 3,124,946 | |
| | |
| | 66,737 | | | Wal-Mart Stores, Inc., (2) | | | 3,820,026 | |
| | |
| | 15,151 | | | Whole Foods Market, Inc. | | | 453,924 | |
| | | | Total Food & Staples Retailing | | | 17,654,174 | |
| | |
| | | | Food Products – 1.7% | | | |
| | |
| | 26,236 | | | Archer-Daniels-Midland Company, (2) | | | 1,197,936 | |
| | |
| | 7,516 | | | Campbell Soup Company | | | 381,738 | |
| | |
| | 18,462 | | | ConAgra Foods, Inc. | | | 748,634 | |
| | |
| | 25,210 | | | General Mills, Inc., (2) | | | 1,464,953 | |
| | |
| | 6,206 | | | Hershey Foods Corporation | | | 550,410 | |
| | |
| | 5,699 | | | Hormel Foods Corporation | | | 384,967 | |
| | |
| | 4,098 | | | JM Smucker Company | | | 481,064 | |
| | |
| | 10,596 | | | Kellogg Company | | | 747,230 | |
| | |
| | 4,883 | | | Keurig Green Mountain Inc., (2) | | | 247,812 | |
| | |
| | 25,047 | | | Kraft Heinz Company | | | 1,952,915 | |
| | |
| | 5,404 | | | McCormick & Company, Incorporated | | | 453,828 | |
| | |
| | 8,566 | | | Mead Johnson Nutrition Company, Class A Shares | | | 702,412 | |
Nuveen Equity Index Fund (continued)
| | |
| Portfolio of Investments | | October 31, 2015 |
| | | | | | | | |
| Shares | | | Description (1) | | Value | |
| | |
| | | | Food Products (continued) | | | |
| | |
| | 68,790 | | | Mondelez International Inc., (2) | | $ | 3,175,346 | |
| | |
| | 12,127 | | | Tyson Foods, Inc., Class A, (2) | | | 537,954 | |
| | | | Total Food Products | | | 13,027,199 | |
| | |
| | | | Gas Utilities – 0.0% | | | |
| | |
| | 5,075 | | | AGL Resources Inc. | | | 317,187 | |
| | |
| | | | Health Care Equipment & Supplies – 2.0% | | | |
| | |
| | 62,961 | | | Abbott Laboratories, (2) | | | 2,820,653 | |
| | |
| | 23,017 | | | Baxter International, Inc. | | | 860,606 | |
| | |
| | 8,856 | | | Becton, Dickinson and Company, (2) | | | 1,262,157 | |
| | |
| | 57,928 | | | Boston Scientific Corporation, (2), (3) | | | 1,058,924 | |
| | |
| | 3,140 | | | C. R. Bard, Inc. | | | 585,139 | |
| | |
| | 5,913 | | | DENTSPLY International Inc., (2) | | | 359,806 | |
| | |
| | 4,634 | | | Edwards Lifesciences Corporation, (3) | | | 728,233 | |
| | |
| | 1,571 | | | Intuitive Surgical, Inc., (3) | | | 780,159 | |
| | |
| | 60,266 | | | Medtronic, PLC | | | 4,454,863 | |
| | |
| | 11,846 | | | Saint Jude Medical Inc., (2) | | | 755,893 | |
| | |
| | 12,642 | | | Stryker Corporation, (2) | | | 1,208,828 | |
| | |
| | 4,220 | | | Varian Medical Systems, Inc., (3) | | | 331,397 | |
| | |
| | 7,216 | | | Zimmer Holdings, Inc. | | | 754,577 | |
| | | | Total Health Care Equipment & Supplies | | | 15,961,235 | |
| | |
| | | | Health Care Providers & Services – 2.6% | | | |
| | |
| | 15,495 | | | Aetna Inc. | | | 1,778,516 | |
| | |
| | 8,826 | | | AmerisourceBergen Corporation | | | 851,797 | |
| | |
| | 11,188 | | | Anthem Inc., (2) | | | 1,556,810 | |
| | |
| | 13,992 | | | Cardinal Health, Inc. | | | 1,150,142 | |
| | |
| | 10,885 | | | CIGNA Corporation | | | 1,459,025 | |
| | |
| | 7,507 | | | Davita Inc., (3) | | | 581,868 | |
| | |
| | 30,842 | | | Express Scripts, Holding Company, (2), (3) | | | 2,664,132 | |
| | |
| | 12,266 | | | HCA Holdings Inc., (3) | | | 843,778 | |
| | |
| | 994 | | | Henry Schein Inc., (2), (3) | | | 150,800 | |
| | |
| | 6,334 | | | Humana Inc., (2) | | | 1,131,442 | |
| | |
| | 3,709 | | | Laboratory Corporation of America Holdings, (3) | | | 455,243 | |
| | |
| | 9,792 | | | McKesson HBOC Inc. | | | 1,750,810 | |
| | |
| | 3,623 | | | Patterson Companies, Inc. | | | 171,730 | |
| | |
| | 6,074 | | | Quest Diagnostics Incorporated | | | 412,728 | |
| | |
| | 4,278 | | | Tenet Healthcare Corporation, (2), (3) | | | 134,201 | |
| | |
| | 40,256 | | | UnitedHealth Group Incorporated, (2) | | | 4,741,352 | |
| | |
| | 3,986 | | | Universal Health Services, Inc., Class B | | | 486,651 | |
| | | | Total Health Care Providers & Services | | | 20,321,025 | |
| | | | | | | | |
| Shares | | | Description (1) | | Value | |
| | |
| | | | Health Care Technology – 0.1% | | | |
| | |
| | 13,264 | | | Cerner Corporation, (2), (3) | | $ | 879,271 | |
| | |
| | | | Hotels, Restaurants & Leisure – 1.9% | | | |
| | |
| | 19,074 | | | Carnival Corporation | | | 1,031,522 | |
| | |
| | 1,313 | | | Chipotle Mexican Grill, (2), (3) | | | 840,622 | |
| | |
| | 5,781 | | | Darden Restaurants, Inc., (2) | | | 357,786 | |
| | |
| | 8,720 | | | Marriott International, Inc., Class A, (2) | | | 669,522 | |
| | |
| | 40,536 | | | McDonald’s Corporation, (2) | | | 4,550,166 | |
| | |
| | 7,285 | | | Royal Caribbean Cruises Limited, (2) | | | 716,480 | |
| | |
| | 63,457 | | | Starbucks Corporation, (2) | | | 3,970,504 | |
| | |
| | 7,226 | | | Starwood Hotels & Resorts Worldwide, Inc. | | | 577,141 | |
| | |
| | 5,077 | | | Wyndham Worldwide Corporation, (2) | | | 413,014 | |
| | |
| | 3,487 | | | Wynn Resorts Ltd | | | 243,916 | |
| | |
| | 18,286 | | | YUM! Brands, Inc., (2) | | | 1,296,660 | |
| | | | Total Hotels, Restaurants & Leisure | | | 14,667,333 | |
| | |
| | | | Household Durables – 0.4% | | | |
| | |
| | 12,845 | | | D.R. Horton, Inc. | | | 378,157 | |
| | |
| | 5,101 | | | Garmin Limited, (2) | | | 180,932 | |
| | |
| | 3,159 | | | Harman International Industries Inc. | | | 347,364 | |
| | |
| | 5,827 | | | Leggett and Platt Inc., (2) | | | 262,390 | |
| | |
| | 7,771 | | | Lennar Corporation, Class A, (2) | | | 389,094 | |
| | |
| | 2,755 | | | Mohawk Industries Inc., (2), (3) | | | 538,602 | |
| | |
| | 11,363 | | | Newell Rubbermaid Inc., (2) | | | 482,132 | |
| | |
| | 13,877 | | | Pulte Corporation | | | 254,365 | |
| | |
| | 3,407 | | | Whirlpool Corporation | | | 545,597 | |
| | | | Total Household Durables | | | 3,378,633 | |
| | |
| | | | Household Products – 1.7% | | | |
| | |
| | 5,548 | | | Clorox Company | | | 676,523 | |
| | |
| | 35,960 | | | Colgate-Palmolive Company, (2) | | | 2,385,946 | |
| | |
| | 15,397 | | | Kimberly-Clark Corporation | | | 1,843,175 | |
| | |
| | 114,734 | | | Procter & Gamble Company | | | 8,763,383 | |
| | | | Total Household Products | | | 13,669,027 | |
| | |
| | | | Independent Power & Renewable Electricity Producers – 0.1% | | | |
| | |
| | 28,861 | | | AES Corporation | | | 316,028 | |
| | |
| | 14,672 | | | NRG Energy Inc. | | | 189,122 | |
| | | | Total Independent Power & Renewable Electricity Producers | | | 505,150 | |
| | |
| | | | Industrial Conglomerates – 2.5% | | | |
| | |
| | 26,826 | | | 3M Co., (2) | | | 4,217,315 | |
| | |
| | 26,044 | | | Danaher Corporation, (2) | | | 2,430,166 | |
Nuveen Equity Index Fund (continued)
| | |
| Portfolio of Investments | | October 31, 2015 |
| | | | | | | | |
| Shares | | | Description (1) | | Value | |
| | |
| | | | Industrial Conglomerates (continued) | | | |
| | |
| | 426,118 | | | General Electric Company | | $ | 12,323,333 | |
| | |
| | 4,490 | | | Roper Technologies, Inc., (2) | | | 836,711 | |
| | | | Total Industrial Conglomerates | | | 19,807,525 | |
| | |
| | | | Insurance – 2.7% | | | |
| | |
| | 13,811 | | | Ace Limited, (2) | | | 1,568,101 | |
| | |
| | 18,350 | | | AFLAC Incorporated | | | 1,169,812 | |
| | |
| | 17,297 | | | Allstate Corporation | | | 1,070,338 | |
| | |
| | 56,391 | | | American International Group, Inc. | | | 3,556,016 | |
| | |
| | 11,915 | | | AON PLC | | | 1,111,789 | |
| | |
| | 2,873 | | | Assurant Inc. | | | 234,236 | |
| | |
| | 9,717 | | | Chubb Corporation | | | 1,256,894 | |
| | |
| | 6,256 | | | Cincinnati Financial Corporation, (2) | | | 376,799 | |
| | |
| | 21,700 | | | Genworth Financial Inc., Class A, (2), (3) | | | 101,556 | |
| | |
| | 17,759 | | | Hartford Financial Services Group, Inc. | | | 821,531 | |
| | |
| | 11,408 | | | Lincoln National Corporation | | | 610,442 | |
| | |
| | 13,322 | | | Loews Corporation, (2) | | | 485,720 | |
| | |
| | 22,769 | | | Marsh & McLennan Companies, Inc., (2) | | | 1,269,144 | |
| | |
| | 47,189 | | | MetLife, Inc. | | | 2,377,382 | |
| | |
| | 11,590 | | | Principal Financial Group, Inc. | | | 581,354 | |
| | |
| | 22,578 | | | Progressive Corporation, (2) | | | 748,009 | |
| | |
| | 19,158 | | | Prudential Financial, Inc. | | | 1,580,535 | |
| | |
| | 5,333 | | | Torchmark Corporation, (2) | | | 309,367 | |
| | |
| | 13,477 | | | Travelers Companies, Inc., (2) | | | 1,521,419 | |
| | |
| | 10,551 | | | Unum Group | | | 365,592 | |
| | |
| | 11,601 | | | XL Capital Ltd, Class A | | | 441,766 | |
| | | | Total Insurance | | | 21,557,802 | |
| | |
| | | | Internet & Catalog Retail – 2.1% | | | |
| | |
| | 16,149 | | | Amazon.com, Inc., (3) | | | 10,107,659 | |
| | |
| | 4,335 | | | Expedia, Inc. | | | 590,860 | |
| | |
| | 17,948 | | | NetFlix.com Inc., (3) | | | 1,945,204 | |
| | |
| | 2,193 | | | priceline.com Incorporated, (3) | | | 3,189,148 | |
| | |
| | 4,733 | | | TripAdvisor Inc., (2), (3) | | | 396,531 | |
| | | | Total Internet & Catalog Retail | | | 16,229,402 | |
| | |
| | | | Internet Software & Services – 3.9% | | | |
| | |
| | 7,786 | | | Akamai Technologies, Inc., (3) | | | 473,545 | |
| | |
| | 12,104 | | | Alphabet Inc., Class A, (3) | | | 8,925,369 | |
| | |
| | 12,139 | | | Alphabet Inc., Class C Shares, (3) | | | 8,628,523 | |
| | |
| | 46,752 | | | eBay Inc., (3) | | | 1,304,381 | |
| | |
| | 92,019 | | | Facebook Inc., Class A Shares, (3) | | | 9,383,177 | |
| | | | | | | | |
| Shares | | | Description (1) | | Value | |
| | |
| | | | Internet Software & Services (continued) | | | |
| | |
| | 4,431 | | | VeriSign, Inc., (2), (3) | | $ | 357,139 | |
| | |
| | 36,909 | | | Yahoo! Inc., (3) | | | 1,314,699 | |
| | | | Total Internet Software & Services | | | 30,386,833 | |
| | |
| | | | IT Services – 3.7% | | | |
| | |
| | 26,485 | | | Accenture Limited | | | 2,839,192 | |
| | |
| | 2,625 | | | Alliance Data Systems Corporation, (3) | | | 780,439 | |
| | |
| | 19,857 | | | Automatic Data Processing, Inc., (2) | | | 1,727,360 | |
| | |
| | 26,564 | | | Cognizant Technology Solutions Corporation, Class A, (2), (3) | | | 1,809,274 | |
| | |
| | 5,823 | | | Computer Sciences Corporation | | | 387,754 | |
| | |
| | 11,988 | | | Fidelity National Information Services | | | 874,165 | |
| | |
| | 10,014 | | | Fiserv, Inc., (3) | | | 966,451 | |
| | |
| | 38,729 | | | International Business Machines Corporation (IBM) | | | 5,425,158 | |
| | |
| | 40,989 | | | MasterCard, Inc. | | | 4,057,501 | |
| | |
| | 13,825 | | | Paychex, Inc. | | | 713,093 | |
| | |
| | 46,752 | | | PayPal Holdings, Inc., (3) | | | 1,683,539 | |
| | |
| | 6,006 | | | Teradata Corporation, (2), (3) | | | 168,829 | |
| | |
| | 6,937 | | | Total System Services Inc. | | | 363,846 | |
| | |
| | 81,751 | | | Visa Inc., (2) | | | 6,342,243 | |
| | |
| | 21,836 | | | Western Union Company, (2) | | | 420,343 | |
| | |
| | 43,885 | | | Xerox Corporation | | | 412,080 | |
| | | | Total IT Services | | | 28,971,267 | |
| | |
| | | | Leisure Products – 0.1% | | | |
| | |
| | 4,737 | | | Hasbro, Inc. | | | 363,944 | |
| | |
| | 14,308 | | | Mattel, Inc., (2) | | | 351,691 | |
| | | | Total Leisure Products | | | 715,635 | |
| | |
| | | | Life Sciences Tools & Services – 0.4% | | | |
| | |
| | 14,574 | | | Agilent Technologies, Inc. | | | 550,314 | |
| | |
| | 4,788 | | | Perkinelmer Inc. | | | 247,252 | |
| | |
| | 16,901 | | | Thermo Fisher Scientific, Inc. | | | 2,210,313 | |
| | |
| | 3,497 | | | Waters Corporation, (3) | | | 446,917 | |
| | | | Total Life Sciences Tools & Services | | | 3,454,796 | |
| | |
| | | | Machinery – 1.2% | | | |
| | |
| | 25,529 | | | Caterpillar Inc., (2) | | | 1,863,362 | |
| | |
| | 7,092 | | | Cummins Inc., (2) | | | 734,093 | |
| | |
| | 14,120 | | | Deere & Company, (2) | | | 1,101,360 | |
| | |
| | 6,783 | | | Dover Corporation, (2) | | | 437,029 | |
| | |
| | 5,697 | | | Flowserve Corporation | | | 264,113 | |
| | |
| | 14,305 | | | Illinois Tool Works, Inc. | | | 1,315,202 | |
| | |
| | 11,195 | | | Ingersoll Rand Company Limited, Class A, (2) | | | 663,416 | |
Nuveen Equity Index Fund (continued)
| | |
| Portfolio of Investments | | October 31, 2015 |
| | | | | | | | |
| Shares | | | Description (1) | | Value | |
| | |
| | | | Machinery (continued) | | | |
| | |
| | 15,502 | | | PACCAR Inc., (2) | | $ | 816,180 | |
| | |
| | 5,864 | | | Parker Hannifin Corporation | | | 613,961 | |
| | |
| | 7,597 | | | Pentair Limited | | | 424,824 | |
| | |
| | 2,466 | | | Snap-on Incorporated | | | 409,085 | |
| | |
| | 6,501 | | | Stanley Black & Decker Inc. | | | 688,976 | |
| | |
| | 7,671 | | | Xylem Inc. | | | 279,301 | |
| | | | Total Machinery | | | 9,610,902 | |
| | |
| | | | Media – 3.2% | | | |
| | |
| | 9,324 | | | Cablevision Systems Corporation, (2) | | | 303,869 | |
| | |
| | 19,147 | | | CBS Corporation, Class B, (2) | | | 890,718 | |
| | |
| | 99,172 | | | Comcast Corporation, Class A | | | 6,210,151 | |
| | |
| | 6,466 | | | Discovery Communications Inc., Class A Shares, (2), (3) | | | 190,359 | |
| | |
| | 10,034 | | | Discovery Communications Inc., Class C Shares, (3) | | | 276,136 | |
| | |
| | 17,463 | | | Interpublic Group of Companies, Inc. | | | 400,427 | |
| | |
| | 21,759 | | | News Corporation, Class A Shares | | | 335,089 | |
| | |
| | 10,332 | | | Omnicom Group, Inc., (2) | | | 774,073 | |
| | |
| | 4,020 | | | Scripps Networks Interactive, Class A Shares, (2) | | | 241,522 | |
| | |
| | 9,594 | | | TEGNA Inc. | | | 259,422 | |
| | |
| | 11,955 | | | Time Warner Cable, Class A | | | 2,264,277 | |
| | |
| | 34,871 | | | Time Warner Inc., (2) | | | 2,627,236 | |
| | |
| | 65,466 | | | Twenty First Century Fox Inc., Class A Shares, (2) | | | 2,009,152 | |
| | |
| | 15,110 | | | Viacom Inc., Class B | | | 745,074 | |
| | |
| | 66,017 | | | Walt Disney Company, (2) | | | 7,508,774 | |
| | | | Total Media | | | 25,036,279 | |
| | |
| | | | Metals & Mining – 0.3% | | | |
| | |
| | 50,026 | | | Alcoa Inc. | | | 446,732 | |
| | |
| | 45,403 | | | Freeport-McMoRan, Inc., (2) | | | 534,393 | |
| | |
| | 22,463 | | | Newmont Mining Corporation | | | 437,130 | |
| | |
| | 13,932 | | | Nucor Corporation | | | 589,324 | |
| | | | Total Metals & Mining | | | 2,007,579 | |
| | |
| | | | Multiline Retail – 0.7% | | | |
| | |
| | 12,565 | | | Dollar General Corporation, (2) | | | 851,530 | |
| | |
| | 10,024 | | | Dollar Tree Stores Inc., (2), (3) | | | 656,472 | |
| | |
| | 8,368 | | | Kohl’s Corporation, (2) | | | 385,932 | |
| | |
| | 14,226 | | | Macy’s, Inc., (2) | | | 725,241 | |
| | |
| | 5,962 | | | Nordstrom, Inc. | | | 388,782 | |
| | |
| | 27,003 | | | Target Corporation | | | 2,084,092 | |
| | | | Total Multiline Retail | | | 5,092,049 | |
| | | | | | | | |
| Shares | | | Description (1) | | Value | |
| | |
| | | | Multi-Utilities – 1.1% | | | |
| | |
| | 10,261 | | | Ameren Corporation | | $ | 448,200 | |
| | |
| | 18,193 | | | CenterPoint Energy, Inc. | | | 337,480 | |
| | |
| | 12,016 | | | CMS Energy Corporation | | | 433,417 | |
| | |
| | 12,386 | | | Consolidated Edison, Inc., (2) | | | 814,379 | |
| | |
| | 25,099 | | | Dominion Resources, Inc., (2) | | | 1,792,822 | |
| | |
| | 7,584 | | | DTE Energy Company | | | 618,779 | |
| | |
| | 13,778 | | | NiSource Inc. | | | 263,986 | |
| | |
| | 20,305 | | | PG&E Corporation | | | 1,084,287 | |
| | |
| | 21,393 | | | Public Service Enterprise Group Incorporated | | | 883,317 | |
| | |
| | 6,044 | | | Scana Corporation, (2) | | | 357,926 | |
| | |
| | 9,842 | | | Sempra Energy, (2) | | | 1,007,919 | |
| | |
| | 9,553 | | | TECO Energy, Inc. | | | 257,931 | |
| | |
| | 13,330 | | | WEC Energy Group, Inc., (2) | | | 687,295 | |
| | | | Total Multi-Utilities | | | 8,987,738 | |
| | |
| | | | Oil, Gas & Consumable Fuels – 5.9% | | | |
| | |
| | 21,481 | | | Anadarko Petroleum Corporation | | | 1,436,649 | |
| | |
| | 16,713 | | | Apache Corporation, (2) | | | 787,684 | |
| | |
| | 17,492 | | | Cabot Oil & Gas Corporation | | | 379,751 | |
| | |
| | 22,842 | | | Chesapeake Energy Corporation, (2) | | | 162,863 | |
| | |
| | 79,527 | | | Chevron Corporation, (2) | | | 7,227,414 | |
| | |
| | 2,781 | | | Cimarex Energy Company | | | 328,325 | |
| | |
| | 13,778 | | | Columbia Pipeline Group, Inc. | | | 286,169 | |
| | |
| | 52,142 | | | ConocoPhillips, (2) | | | 2,781,776 | |
| | |
| | 9,678 | | | CONSOL Energy Inc. | | | 64,455 | |
| | |
| | 16,872 | | | Devon Energy Corporation | | | 707,443 | |
| | |
| | 23,922 | | | EOG Resources, Inc. | | | 2,053,704 | |
| | |
| | 6,443 | | | EQT Corporation | | | 425,689 | |
| | |
| | 176,822 | | | Exxon Mobil Corporation | | | 14,630,252 | |
| | |
| | 10,331 | | | Hess Corporation | | | 580,705 | |
| | |
| | 73,355 | | | Kinder Morgan, Inc. | | | 2,006,259 | |
| | |
| | 29,472 | | | Marathon Oil Corporation, (2) | | | 541,695 | |
| | |
| | 22,975 | | | Marathon Petroleum Corporation | | | 1,190,105 | |
| | |
| | 7,293 | | | Murphy Oil Corporation | | | 207,340 | |
| | |
| | 6,149 | | | Newfield Exploration Company, (3) | | | 247,128 | |
| | |
| | 16,236 | | | Noble Energy, Inc. | | | 581,898 | |
| | |
| | 32,484 | | | Occidental Petroleum Corporation, (2) | | | 2,421,357 | |
| | |
| | 7,868 | | | ONEOK, Inc. | | | 266,883 | |
| | |
| | 22,935 | | | Phillips 66 | | | 2,042,362 | |
| | |
| | 6,447 | | | Pioneer Natural Resources Company | | | 884,142 | |
Nuveen Equity Index Fund (continued)
| | |
| Portfolio of Investments | | October 31, 2015 |
| | | | | | | | |
| Shares | | | Description (1) | | Value | |
| | |
| | | | Oil, Gas & Consumable Fuels (continued) | | | |
| | |
| | 7,041 | | | Range Resources Corporation, (2) | | $ | 214,328 | |
| | |
| | 15,921 | | | Southwestern Energy Company, (2), (3) | | | 175,768 | |
| | |
| | 28,391 | | | Spectra Energy Corporation, (2) | | | 811,131 | |
| | |
| | 5,325 | | | Tesoro Corporation | | | 569,402 | |
| | |
| | 21,509 | | | Valero Energy Corporation | | | 1,417,873 | |
| | |
| | 28,508 | | | Williams Companies, Inc. | | | 1,124,356 | |
| | | | Total Oil, Gas & Consumable Fuels | | | 46,554,906 | |
| | |
| | | | Paper & Forest Products – 0.1% | | | |
| | |
| | 17,883 | | | International Paper Company | | | 763,425 | |
| | |
| | | | Personal Products – 0.1% | | | |
| | |
| | 9,441 | | | Estee Lauder Companies Inc., Class A, (2) | | | 759,623 | |
| | |
| | | | Pharmaceuticals – 5.5% | | | |
| | |
| | 16,218 | | | Allergan PLC, (3) | | | 5,002,766 | |
| | |
| | 70,498 | | | Bristol-Myers Squibb Company, (2) | | | 4,649,343 | |
| | |
| | 41,299 | | | Eli Lilly and Company, (2) | | | 3,368,759 | |
| | |
| | 7,802 | | | Endo International PLC, (3) | | | 468,042 | |
| | |
| | 117,273 | | | Johnson & Johnson | | | 11,848,091 | |
| | |
| | 4,949 | | | Mallinckrodt PLC, (3) | | | 325,001 | |
| | |
| | 119,480 | | | Merck & Company Inc., (2) | | | 6,530,777 | |
| | |
| | 16,778 | | | Mylan NV, (2), (3) | | | 739,742 | |
| | |
| | 5,847 | | | Perrigo Company | | | 922,306 | |
| | |
| | 260,411 | | | Pfizer Inc. | | | 8,807,100 | |
| | |
| | 21,570 | | | Zoetis Incorporated | | | 927,726 | |
| | | | Total Pharmaceuticals | | | 43,589,653 | |
| | |
| | | | Professional Services – 0.2% | | | |
| | |
| | 1,524 | | | Dun and Bradstreet Inc. | | | 173,538 | |
| | |
| | 5,033 | | | Equifax Inc. | | | 536,367 | |
| | |
| | 14,889 | | | Nielsen Holdings PLC | | | 707,376 | |
| | |
| | 5,712 | | | Robert Half International Inc. | | | 300,794 | |
| | | | Total Professional Services | | | 1,718,075 | |
| | |
| | | | Real Estate Investment Trust – 2.6% | | | |
| | |
| | 17,820 | | | American Tower Corporation, REIT, (2) | | | 1,821,739 | |
| | |
| | 6,987 | | | Apartment Investment & Management Company, Class A | | | 273,821 | |
| | |
| | 5,488 | | | AvalonBay Communities, Inc. | | | 959,467 | |
| | |
| | 7,526 | | | Boston Properties, Inc. | | | 947,147 | |
| | |
| | 14,272 | | | Crown Castle International Corporation | | | 1,219,685 | |
| | |
| | 2,408 | | | Equinix Inc., (2) | | | 714,405 | |
| | |
| | 15,899 | | | Equity Residential | | | 1,229,311 | |
| | |
| | 1,855 | | | Essex Property Trust Inc. | | | 408,916 | |
| | | | | | | | |
| Shares | | | Description (1) | | Value | |
| | |
| | | | Real Estate Investment Trust (continued) | | | |
| | |
| | 23,234 | | | General Growth Properties Inc. | | $ | 672,624 | |
| | |
| | 19,524 | | | Health Care Property Investors Inc., (2) | | | 726,293 | |
| | |
| | 33,075 | | | Host Hotels & Resorts Inc. | | | 573,190 | |
| | |
| | 8,124 | | | Iron Mountain Inc. | | | 248,919 | |
| | |
| | 17,455 | | | Kimco Realty Corporation | | | 467,270 | |
| | |
| | 5,956 | | | Macerich Company | | | 504,711 | |
| | |
| | 7,427 | | | Plum Creek Timber Company | | | 302,576 | |
| | |
| | 22,162 | | | Prologis Inc. | | | 946,982 | |
| | |
| | 6,141 | | | Public Storage, Inc. | | | 1,409,114 | |
| | |
| | 9,834 | | | Realty Income Corporation | | | 486,390 | |
| | |
| | 13,163 | | | Simon Property Group, Inc. | | | 2,651,818 | |
| | |
| | 4,109 | | | SL Green Realty Corporation | | | 487,410 | |
| | |
| | 13,282 | | | Ventas Inc. | | | 713,509 | |
| | |
| | 7,575 | | | Vornado Realty Trust | | | 761,666 | |
| | |
| | 13,499 | | | Welltower Inc. | | | 875,680 | |
| | |
| | 21,895 | | | Weyerhaeuser Company | | | 642,180 | |
| | | | Total Real Estate Investment Trust | | | 20,044,823 | |
| | |
| | | | Real Estate Management & Development – 0.1% | | | |
| | |
| | 11,829 | | | CBRE Group Inc., (3) | | | 440,985 | |
| | |
| | | | Road & Rail – 0.8% | | | |
| | |
| | 41,783 | | | CSX Corporation | | | 1,127,723 | |
| | |
| | 3,894 | | | J.B. Hunt Transports Services Inc. | | | 297,385 | |
| | |
| | 4,810 | | | Kansas City Southern Industries | | | 398,076 | |
| | |
| | 12,892 | | | Norfolk Southern Corporation, (2) | | | 1,031,747 | |
| | |
| | 2,505 | | | Ryder System, Inc., (2) | | | 179,809 | |
| | |
| | 37,029 | | | Union Pacific Corporation | | | 3,308,541 | |
| | | | Total Road & Rail | | | 6,343,281 | |
| | |
| | | | Semiconductors & Semiconductor Equipment – 2.4% | | | |
| | |
| | 12,734 | | | Altera Corporation | | | 669,172 | |
| | |
| | 13,260 | | | Analog Devices, Inc., (2) | | | 797,191 | |
| | |
| | 52,086 | | | Applied Materials, Inc. | | | 873,482 | |
| | |
| | 10,350 | | | Avago Technologies Limited | | | 1,274,395 | |
| | |
| | 22,999 | | | Broadcom Corporation, Class A | | | 1,182,149 | |
| | |
| | 3,188 | | | First Solar Inc., (3) | | | 181,939 | |
| | |
| | 200,626 | | | Intel Corporation | | | 6,793,196 | |
| | |
| | 6,763 | | | KLA-Tencor Corporation | | | 453,933 | |
| | |
| | 6,695 | | | Lam Research Corporation | | | 512,770 | |
| | |
| | 10,127 | | | Linear Technology Corporation, (2) | | | 449,841 | |
| | |
| | 8,556 | | | Microchip Technology Incorporated, (2) | | | 413,169 | |
Nuveen Equity Index Fund (continued)
| | |
| Portfolio of Investments | | October 31, 2015 |
| | | | | | | | |
| Shares | | | Description (1) | | Value | |
| | |
| | | | Semiconductors & Semiconductor Equipment (continued) | | | |
| | |
| | 45,560 | | | Micron Technology, Inc., (3) | | $ | 754,474 | |
| | |
| | 22,496 | | | NVIDIA Corporation | | | 638,212 | |
| | |
| | 6,290 | | | Qorvo Inc., (3) | | | 276,320 | |
| | |
| | 8,386 | | | Skyworks Solutions Inc. | | | 647,735 | |
| | |
| | 43,997 | | | Texas Instruments Incorporated | | | 2,495,510 | |
| | |
| | 10,936 | | | Xilinx, Inc. | | | 520,772 | |
| | | | Total Semiconductors & Semiconductor Equipment | | | 18,934,260 | |
| | |
| | | | Software – 4.1% | | | |
| | |
| | 12,390 | | | Activision Blizzard Inc., (2) | | | 430,676 | |
| | |
| | 20,099 | | | Adobe Systems Incorporated, (2), (3) | | | 1,781,977 | |
| | |
| | 9,930 | | | Autodesk, Inc., (3) | | | 548,037 | |
| | |
| | 13,388 | | | CA Technologies | | | 370,981 | |
| | |
| | 6,778 | | | Citrix Systems, (2), (3) | | | 556,474 | |
| | |
| | 13,150 | | | Electronic Arts Inc., (2), (3) | | | 947,720 | |
| | |
| | 11,658 | | | Intuit, Inc., (2) | | | 1,135,839 | |
| | |
| | 342,112 | | | Microsoft Corporation | | | 18,008,776 | |
| | |
| | 134,820 | | | Oracle Corporation | | | 5,236,409 | |
| | |
| | 7,753 | | | Red Hat, Inc., (3) | | | 613,340 | |
| | |
| | 25,578 | | | Salesforce.com, Inc., (2), (3) | | | 1,987,666 | |
| | |
| | 28,788 | | | Symantec Corporation | | | 593,033 | |
| | | | Total Software | | | 32,210,928 | |
| | |
| | | | Specialty Retail – 2.5% | | | |
| | |
| | 3,095 | | | Advance Auto Parts, Inc., (2) | | | 614,141 | |
| | |
| | 1,921 | | | AutoNation Inc., (3) | | | 121,388 | |
| | |
| | 1,342 | | | AutoZone, Inc., (2), (3) | | | 1,052,678 | |
| | |
| | 7,244 | | | Bed Bath and Beyond Inc., (2), (3) | | | 431,960 | |
| | |
| | 12,332 | | | Best Buy Co., Inc. | | | 431,990 | |
| | |
| | 8,849 | | | CarMax, Inc., (2), (3) | | | 522,179 | |
| | |
| | 4,514 | | | GameStop Corporation, (2) | | | 207,960 | |
| | |
| | 11,120 | | | Gap, Inc., (2) | | | 302,686 | |
| | |
| | 54,934 | | | Home Depot, Inc., (2) | | | 6,792,040 | |
| | |
| | 10,371 | | | L Brands Inc. | | | 995,409 | |
| | |
| | 39,443 | | | Lowe’s Companies, Inc. | | | 2,912,077 | |
| | |
| | 4,270 | | | O’Reilly Automotive Inc., (2), (3) | | | 1,179,630 | |
| | |
| | 17,499 | | | Ross Stores, Inc., (2) | | | 885,099 | |
| | |
| | 296 | | | Signet Jewelers Limited | | | 44,678 | |
| | |
| | 27,093 | | | Staples, Inc. | | | 351,938 | |
| | |
| | 4,752 | | | Tiffany & Co. | | | 391,755 | |
| | |
| | 28,773 | | | TJX Companies, Inc. | | | 2,105,896 | |
| | | | | | | | |
| Shares | | | Description (1) | | Value | |
| | |
| | | | Specialty Retail (continued) | | | |
| | |
| | 4,622 | | | Tractor Supply Company, (2) | | $ | 427,027 | |
| | |
| | 4,118 | | | Urban Outfitters, Inc., (2), (3) | | | 117,775 | |
| | | | Total Specialty Retail | | | 19,888,306 | |
| | |
| | | | Technology Hardware, Storage & Peripherals – 4.5% | | | |
| | |
| | 243,638 | | | Apple, Inc. | | | 29,114,741 | |
| | |
| | 82,131 | | | EMC Corporation, (2) | | | 2,153,475 | |
| | |
| | 76,394 | | | HP Inc. | | | 2,059,582 | |
| | |
| | 13,185 | | | NetApp, Inc. | | | 448,290 | |
| | |
| | 8,793 | | | SanDisk Corporation, (2) | | | 677,061 | |
| | |
| | 13,423 | | | Seagate Technology | | | 510,879 | |
| | |
| | 9,179 | | | Western Digital Corporation | | | 613,341 | |
| | | | Total Technology Hardware, Storage & Peripherals | | | 35,577,369 | |
| | |
| | | | Textiles, Apparel & Luxury Goods – 1.0% | | | |
| | |
| | 11,685 | | | Coach, Inc., (2) | | | 364,572 | |
| | |
| | 1,816 | | | Fossil Group Inc., (2), (3) | | | 98,809 | |
| | |
| | 16,987 | | | Hanesbrands Inc. | | | 542,565 | |
| | |
| | 8,094 | | | Michael Kors Holdings Limited, (3) | | | 312,752 | |
| | |
| | 29,450 | | | Nike, Inc., Class B, (2) | | | 3,858,833 | |
| | |
| | 3,109 | | | PVH Corporation, (2) | | | 282,764 | |
| | |
| | 2,555 | | | Ralph Lauren Corporation | | | 283,017 | |
| | |
| | 7,547 | | | Under Armour, Inc., (2), (3) | | | 717,569 | |
| | |
| | 14,377 | | | VF Corporation | | | 970,735 | |
| | | | Total Textiles, Apparel & Luxury Goods | | | 7,431,616 | |
| | |
| | | | Thrifts & Mortgage Finance – 0.0% | | | |
| | |
| | 21,026 | | | Hudson City Bancorp, Inc. | | | 212,783 | |
| | |
| | | | Tobacco – 1.6% | | | |
| | |
| | 83,166 | | | Altria Group, Inc., (2) | | | 5,029,048 | |
| | |
| | 65,515 | | | Philip Morris International, (2) | | | 5,791,526 | |
| | |
| | 35,157 | | | Reynolds American Inc., (2) | | | 1,698,820 | |
| | | | Total Tobacco | | | 12,519,394 | |
| | |
| | | | Trading Companies & Distributors – 0.2% | | | |
| | |
| | 11,497 | | | Fastenal Company, (2) | | | 450,223 | |
| | |
| | 4,352 | | | United Rentals Inc., (3) | | | 325,791 | |
| | |
| | 2,519 | | | W.W. Grainger, Inc. | | | 528,991 | |
| | | | Total Trading Companies & Distributors | | | 1,305,005 | |
| | | | Total Common Stocks (cost $289,742,814) | | | 774,600,168 | |
Nuveen Equity Index Fund (continued)
| | |
| Portfolio of Investments | | October 31, 2015 |
| | | | | | | | | | | | | | | | | | | | |
| | | | | |
| Shares | | | Description (1) | | | | | | | | | | | Value | |
| | | | | |
| | | | COMMON STOCK RIGHTS – 0.0% | | | | | | | | | | | | |
| | | | | |
| | 10,067 | | | Safeway Incorporated, (4) | | | | | | | | | | | | | | $ | 1,711 | |
| | | | | |
| | 10,067 | | | Safeway Incorporated, (4) | | | | | | | | | | | | | | | 101 | |
| | | | Total Common Stock Rights (cost $–) | | | | | | | | | | | | | | | 1,812 | |
| | | | Total Long-Term Investments (cost $289,742,814) | | | | | | | | | | | | | | | 774,601,980 | |
| | | | | |
| Shares | | | Description (1) | | | | | | | | | | | Value | |
| | | | |
| | | | INVESTMENTS PURCHASED WITH COLLATERAL FROM SECURITIES LENDING – 23.1% | | | | | | | | | | | | | |
| | | | | |
| | | | Money Market Funds – 23.1% | | | | | | | | | | | | |
| | | | | |
| | 181,894,352 | | | Mount Vernon Securities Lending Prime Portfolio, 0.256%, (5), (6) | | | | | | | | | | | | | | $ | 181,894,352 | |
| | | | Total Investments Purchased with Collateral from Securities Lending (cost $181,894,352) | | | | | | | | | | | | 181,894,352 | |
| | | | | |
Shares/
Principal
Amount (000) | | | Description (1) | | Coupon | | | Maturity | | | Ratings (7) | | | Value | |
| | | | | |
| | | | SHORT-TERM INVESTMENTS – 1.4% | | | | | | | | | | | | |
| | | | | |
| | | | Money Market Funds – 1.0% | | | | | | | | | | | | |
| | | | | |
| | 8,170,670 | | | First American Treasury Obligations Fund, Class Z | | | 0.000% | (5) | | | N/A | | | | N/A | | | $ | 8,170,670 | |
| | | | | |
| | | | U.S. Government and Agency Obligations – 0.4% | | | | | | | | | | | | |
| | | | | |
| $ | 3,000 | | | U.S. Treasury Bills, (8) | | | 0.000% | | | | 11/12/15 | | | | AAA | | | | 2,999,991 | |
| | | | Total Short-Term Investments (cost $11,170,558) | | | | | | | | | | | | | | | 11,170,661 | |
| | | | Total Investments (cost $482,807,724) – 123.0% | | | | | | | | | | | | | | | 967,666,993 | |
| | | | Other Assets Less Liabilities – (23.0)% (9) | | | | | | | | | | | | | | | (181,120,288) | |
| | | | Net Assets – 100% | | | | | | | | | | | | | | $ | 786,546,705 | |
Investments in Derivatives as of October 31, 2015
Futures Contracts Outstanding:
| | | | | | | | | | | | | | | | | | | | | | | | |
| Description | | Contract
Position | | | Number of
Contracts | | | Contract
Expiration | | | Notional
Amount
at Value | | | Variable Margin
Receivable/
(Payable) | | | Unrealized
Appreciation
(Depreciation) | |
S&P 500® Index | | | Long | | | | 21 | | | | 12/15 | | | $ | 10,886,925 | | | | (48,825 | ) | | $ | 641,465 | |
For Fund portfolio compliance purposes, the Fund’s industry classifications refer to any one or more of the industry sub-classifications used by one or more widely recognized market indexes or ratings group indexes, and/or as defined by Fund management. This definition may not apply for purposes of this report which may combine industry sub-classifications into sectors for reporting ease.
| (1) | All percentages shown in the Portfolio of Investments are based on net assets. |
| (2) | Investment, or a portion of investment, is out on loan for securities lending. The total value of the securities out on loan as of the end of the reporting period was $176,089,018. |
| (3) | Non-income producing; issuer has not declared a dividend within the past twelve months. |
| (4) | Investment valued at fair value using methods determined in good faith by, or at the discretion of, the Board. For fair value measurement disclosure purposes, investment classified as Level 3. See Notes to Financial Statements, Note 2 – Investment Valuation and Fair Value Measurements for more information. |
| (5) | The rate shown is the annualized seven-day effective yield as of the end of the reporting period. |
| (6) | The Fund may loan securities representing up to one third of the fair value of its total assets (which includes collateral for securities on loan) to broker dealers, banks, and other institutions. The Fund maintains collateral equal to at least 100% of the fair value of the securities loaned. The cash collateral received by the Fund is invested in this money market fund. See Notes to Financial Statements, Note 3 – Portfolio Securities and Investments in Derivatives, Securities Lending for more information. |
| (7) | Ratings (not covered by the report of independent registered public accounting firm): Using the highest of Standard & Poor’s Group (“Standard & Poor’s”), Moody’s Investors Service, Inc. (“Moody’s”) or Fitch, Inc. (“Fitch”) rating. Ratings below BBB by Standard & Poor’s, Baa by Moody’s or BBB by Fitch are considered to be below investment grade. Holdings designated N/R are not rated by any of these national rating agencies. |
| (8) | Investment, or portion of investment, segregated as collateral for investments in derivatives. |
| (9) | Other assets less liabilities includes the unrealized appreciation (depreciation) of certain over-the-counter derivatives as presented on the Statement of Assets and Liabilities. The unrealized appreciation (depreciation) of exchange-cleared and exchange-traded derivatives is recognized as part of the cash collateral at broker and/or the receivable or payable for variation margin as presented on the Statement of Assets and Liabilities, when applicable. |
| REIT | Real Estate Investment Trust |
See accompanying notes to financial statements.
Nuveen Mid Cap Index Fund
| | |
| Portfolio of Investments | | October 31, 2015 |
| | | | | | | | |
| Shares | | | Description (1) | | Value | |
| | |
| | | | LONG-TERM INVESTMENTS – 94.7% | | | | |
| | |
| | | | COMMON STOCKS – 94.7% | | | | |
| | |
| | | | Aerospace & Defense – 1.5% | | | |
| | |
| | 39,964 | | | BE Aerospace Inc. | | $ | 1,876,310 | |
| | |
| | 12,914 | | | Esterline Technologies Corporation, (2) | | | 995,024 | |
| | |
| | 19,837 | | | Huntington Ingalls Industries Inc. | | | 2,379,250 | |
| | |
| | 19,982 | | | KLX Inc. | | | 781,496 | |
| | |
| | 23,737 | | | Orbital ATK, Inc. | | | 2,032,362 | |
| | |
| | 9,113 | | | Teledyne Technologies Inc., (2) | | | 813,153 | |
| | |
| | 20,220 | | | Triumph Group Inc. | | | 941,848 | |
| | | | Total Aerospace & Defense | | | 9,819,443 | |
| | |
| | | | Airlines – 1.1% | | | |
| | |
| | 53,200 | | | Alaska Air Group, Inc. | | | 4,056,500 | |
| | |
| | 125,552 | | | JetBlue Airways Corporation, (2), (3) | | | 3,118,712 | |
| | | | Total Airlines | | | 7,175,212 | |
| | |
| | | | Auto Components – 0.4% | | | |
| | |
| | 46,504 | | | Dana Holding Corporation, (3) | | | 781,267 | |
| | |
| | 117,874 | | | Gentex Corporation, (3) | | | 1,931,955 | |
| | | | Total Auto Components | | | 2,713,222 | |
| | |
| | | | Automobiles – 0.2% | | | |
| | |
| | 18,086 | | | Thor Industries, Inc. | | | 978,091 | |
| | |
| | | | Banks – 5.3% | | | |
| | |
| | 65,082 | | | Associated Banc-Corp., (3) | | | 1,258,686 | |
| | |
| | 34,136 | | | BancorpSouth Inc., (3) | | | 851,010 | |
| | |
| | 17,947 | | | Bank of Hawaii Corporation, (3) | | | 1,175,170 | |
| | |
| | 24,427 | | | Bank of the Ozarks, Inc., (3) | | | 1,221,839 | |
| | |
| | 29,910 | | | Cathay General Bancorp., (3) | | | 936,183 | |
| | |
| | 19,315 | | | City National Corporation | | | 1,730,624 | |
| | |
| | 34,315 | | | Commerce Bancshares Inc., (3) | | | 1,563,048 | |
| | |
| | 21,597 | | | Cullen/Frost Bankers, Inc., (3) | | | 1,478,099 | |
| | |
| | 57,920 | | | East West Bancorp Inc. | | | 2,339,389 | |
| | |
| | 95,564 | | | First Horizon National Corporation, (3) | | | 1,355,098 | |
| | |
| | 142,966 | | | First Niagara Financial Group Inc. | | | 1,479,698 | |
| | |
| | 66,791 | | | FirstMerit Corporation | | | 1,255,003 | |
| | |
| | 76,330 | | | Fulton Financial Corporation, (3) | | | 1,024,349 | |
| | |
| | 33,236 | | | Hancock Holding Company, (3) | | | 917,314 | |
| | |
| | 22,992 | | | International Bancshares Corporation, (3) | | | 619,634 | |
| | | | | | | | |
| Shares | | | Description (1) | | Value | |
| | |
| | | | Banks (continued) | | | |
| | |
| | 38,710 | | | Pacwest Bancorp., (3) | | $ | 1,743,498 | |
| | |
| | 24,224 | | | Prosperity Bancshares, Inc., (3) | | | 1,244,629 | |
| | |
| | 20,196 | | | Signature Bank, (2) | | | 3,007,588 | |
| | |
| | 20,129 | | | SVB Financial Group, (2) | | | 2,457,147 | |
| | |
| | 56,137 | | | Synovus Financial Corp. | | | 1,775,632 | |
| | |
| | 67,305 | | | TCF Financial Corporation | | | 1,035,824 | |
| | |
| | 27,240 | | | Trustmark Corporation, (3) | | | 654,577 | |
| | |
| | 75,358 | | | Umpqua Holdings Corporation, (3) | | | 1,258,479 | |
| | |
| | 80,975 | | | Valley National Bancorp., (3) | | | 850,238 | |
| | |
| | 36,481 | | | Webster Financial Corporation | | | 1,353,445 | |
| | | | Total Banks | | | 34,586,201 | |
| | |
| | | | Beverages – 0.1% | | | |
| | |
| | 3,632 | | | Boston Beer Company, (2), (3) | | | 797,551 | |
| | |
| | | | Biotechnology – 0.4% | | | |
| | |
| | 17,926 | | | United Therapeutics Corporation, (2), (3) | | | 2,628,489 | |
| | |
| | | | Building Products – 1.3% | | | |
| | |
| | 67,073 | | | Fortune Brands Home & Security, (3) | | | 3,509,930 | |
| | |
| | 16,989 | | | Lennox International Inc., (3) | | | 2,256,309 | |
| | |
| | 30,742 | | | Smith AO Corporation | | | 2,361,600 | |
| | | | Total Building Products | | | 8,127,839 | |
| | |
| | | | Capital Markets – 1.9% | | | |
| | |
| | 48,763 | | | Eaton Vance Corporation | | | 1,760,832 | |
| | |
| | 38,208 | | | Federated Investors Inc., (3) | | | 1,174,132 | |
| | |
| | 60,651 | | | Janus Capital Group Inc., (3) | | | 941,910 | |
| | |
| | 50,145 | | | Raymond James Financial Inc. | | | 2,763,491 | |
| | |
| | 53,181 | | | SEI Investments Company | | | 2,755,839 | |
| | |
| | 18,965 | | | Stifel Financial Corporation, (2) | | | 842,615 | |
| | |
| | 34,425 | | | Waddell & Reed Financial, Inc., Class A | | | 1,271,660 | |
| | |
| | 43,821 | | | WisdomTree Investments Inc., (3) | | | 842,678 | |
| | | | Total Capital Markets | | | 12,353,157 | |
| | |
| | | | Chemicals – 3.3% | | | |
| | |
| | 44,899 | | | Albemarle Corporation | | | 2,402,994 | |
| | |
| | 25,514 | | | Ashland Inc. | | | 2,799,396 | |
| | |
| | 24,225 | | | Cabot Corporation | | | 870,647 | |
| | |
| | 72,089 | | | Chemours Company | | | 499,577 | |
| | |
| | 28,336 | | | Cytec Industries, Inc. | | | 2,108,765 | |
| | |
| | 13,928 | | | Minerals Technologies Inc. | | | 820,916 | |
| | |
| | 4,470 | | | NewMarket Corporation, (3) | | | 1,760,018 | |
| | |
| | 55,147 | | | Olin Corporation | | | 1,057,719 | |
Nuveen Mid Cap Index Fund (continued)
| | |
| Portfolio of Investments | | October 31, 2015 |
| | | | | | | | |
| Shares | | | Description (1) | | Value | |
| | |
| | | | Chemicals (continued) | | | |
| | |
| | 38,020 | | | PolyOne Corporation | | $ | 1,271,389 | |
| | |
| | 53,822 | | | RPM International, Inc. | | | 2,460,204 | |
| | |
| | 17,575 | | | Scotts Miracle Gro Company | | | 1,162,762 | |
| | |
| | 19,978 | | | Sensient Technologies Corporation | | | 1,303,964 | |
| | |
| | 31,715 | | | Valspar Corporation, (3) | | | 2,567,329 | |
| | | | Total Chemicals | | | 21,085,680 | |
| | |
| | | | Commercial Services & Supplies – 1.7% | | | |
| | |
| | 22,336 | | | Clean Harbors, Inc., (2), (3) | | | 1,038,401 | |
| | |
| | 45,312 | | | Copart Inc., (2) | | | 1,640,748 | |
| | |
| | 20,219 | | | Deluxe Corporation | | | 1,204,041 | |
| | |
| | 18,218 | | | HNI Corporation, (3) | | | 782,281 | |
| | |
| | 23,929 | | | Miller (Herman) Inc. | | | 759,267 | |
| | |
| | 12,823 | | | MSA Safety Inc. | | | 557,544 | |
| | |
| | 80,624 | | | R.R. Donnelley & Sons Company, (3) | | | 1,360,127 | |
| | |
| | 38,928 | | | Rollins Inc. | | | 1,044,049 | |
| | |
| | 50,066 | | | Waste Connections Inc. | | | 2,727,596 | |
| | | | Total Commercial Services & Supplies | | | 11,114,054 | |
| | |
| | | | Communications Equipment – 1.0% | | | |
| | |
| | 53,115 | | | Arris Group Inc., (2), (3) | | | 1,501,030 | |
| | |
| | 46,863 | | | Ciena Corporation, (2), (3) | | | 1,131,273 | |
| | |
| | 14,802 | | | Interdigital Inc. | | | 751,053 | |
| | |
| | 37,611 | | | NetScout Systems, Inc., (2) | | | 1,349,107 | |
| | |
| | 16,071 | | | Plantronics Inc. | | | 861,727 | |
| | |
| | 55,802 | | | Polycom Inc., (2) | | | 768,952 | |
| | | | Total Communications Equipment | | | 6,363,142 | |
| | |
| | | | Construction & Engineering – 0.5% | | | |
| | |
| | 60,190 | | | AECOM, (2), (3) | | | 1,773,799 | |
| | |
| | 14,689 | | | Granite Construction Inc. | | | 482,387 | |
| | |
| | 59,455 | | | KBR Inc. | | | 1,096,350 | |
| | | | Total Construction & Engineering | | | 3,352,536 | |
| | |
| | | | Construction Materials – 0.2% | | | |
| | |
| | 20,215 | | | Eagle Materials Inc., (3) | | | 1,334,796 | |
| | |
| | | | Consumer Finance – 0.2% | | | |
| | |
| | 170,772 | | | SLM Corporation | | | 1,205,650 | |
| | |
| | | | Containers & Packaging – 1.4% | | | |
| | |
| | 26,438 | | | AptarGroup Inc. | | | 1,944,779 | |
| | |
| | 29,730 | | | Bemis Company, Inc. | | | 1,361,039 | |
| | |
| | 12,325 | | | Greif Inc. | | | 404,014 | |
| | |
| | 39,714 | | | Packaging Corp. of America | | | 2,718,423 | |
| | | | | | | | |
| Shares | | | Description (1) | | Value | |
| | |
| | | | Containers & Packaging (continued) | | | |
| | |
| | 17,563 | | | Silgan Holdings, Inc. | | $ | 893,430 | |
| | |
| | 41,221 | | | Sonoco Products Company | | | 1,759,724 | |
| | | | Total Containers & Packaging | | | 9,081,409 | |
| | |
| | | | Distributors – 0.6% | | | |
| | |
| | 121,930 | | | LKQ Corporation, (2) | | | 3,610,347 | |
| | |
| | | | Diversified Consumer Services – 0.8% | | | |
| | |
| | 40,055 | | | Apollo Group, Inc., (2) | | | 290,799 | |
| | |
| | 23,083 | | | Devry Education Group Inc., (3) | | | 543,835 | |
| | |
| | 1,775 | | | Graham Holdings Company | | | 980,634 | |
| | |
| | 86,251 | | | Service Corporation International | | | 2,437,453 | |
| | |
| | 25,380 | | | Sothebys Holdings Inc., (3) | | | 879,417 | |
| | | | Total Diversified Consumer Services | | | 5,132,138 | |
| | |
| | | | Diversified Financial Services – 1.4% | | | |
| | |
| | 34,731 | | | CBOE Holdings Inc. | | | 2,328,366 | |
| | |
| | 15,701 | | | FactSet Research Systems Inc. | | | 2,749,559 | |
| | |
| | 11,522 | | | Marketaxess | | | 1,167,294 | |
| | |
| | 45,213 | | | MSCI Inc., Class A Shares | | | 3,029,271 | |
| | | | Total Diversified Financial Services | | | 9,274,490 | |
| | |
| | | | Electric Utilities – 1.7% | | | |
| | |
| | 23,456 | | | Cleco Corporation | | | 1,243,168 | |
| | |
| | 62,100 | | | Great Plains Energy Incorporated | | | 1,707,750 | |
| | |
| | 40,990 | | | Hawaiian Electric Industries, (3) | | | 1,199,367 | |
| | |
| | 20,320 | | | IDACORP, INC, (3) | | | 1,358,392 | |
| | |
| | 80,438 | | | OGE Energy Corp. | | | 2,293,287 | |
| | |
| | 32,174 | | | PNM Resources Inc. | | | 904,733 | |
| | |
| | 49,239 | | | Westar Energy Inc. | | | 1,954,788 | |
| | | | Total Electric Utilities | | | 10,661,485 | |
| | |
| | | | Electrical Equipment – 1.1% | | | |
| | |
| | 17,454 | | | Acuity Brands Inc., (3) | | | 3,815,444 | |
| | |
| | 21,752 | | | Hubbell Incorporated, Class B | | | 2,106,681 | |
| | |
| | 18,228 | | | Regal-Beloit Corporation | | | 1,162,764 | |
| | | | Total Electrical Equipment | | | 7,084,889 | |
| | |
| | | | Electronic Equipment, Instruments & Components – 3.4% | | | |
| | |
| | 40,618 | | | Arrow Electronics, Inc., (2) | | | 2,233,584 | |
| | |
| | 55,904 | | | Avnet Inc. | | | 2,539,719 | |
| | |
| | 17,612 | | | Belden Inc. | | | 1,127,696 | |
| | |
| | 31,769 | | | Cognex Corporation | | | 1,194,514 | |
| | |
| | 17,068 | | | FEI Company, (3) | | | 1,232,139 | |
| | |
| | 62,691 | | | Ingram Micro, Inc., Class A | | | 1,866,938 | |
Nuveen Mid Cap Index Fund (continued)
| | |
| Portfolio of Investments | | October 31, 2015 |
| | | | | | | | |
| Shares | | | Description (1) | | Value | |
| | |
| | | | Electronic Equipment, Instruments & Components (continued) | | | |
| | |
| | 14,324 | | | IPG Photonics Corporation, (2), (3) | | $ | 1,183,449 | |
| | |
| | 63,748 | | | Jabil Circuit Inc. | | | 1,464,929 | |
| | |
| | 58,774 | | | Keysight Technologies, Inc., (2) | | | 1,944,244 | |
| | |
| | 34,346 | | | Knowles Corporation, (2), (3) | | | 572,204 | |
| | |
| | 39,739 | | | National Instruments Corporation | | | 1,210,847 | |
| | |
| | 15,445 | | | Tech Data Corporation, (2) | | | 1,124,242 | |
| | |
| | 105,376 | | | Trimble Navigation Limited, (2) | | | 2,397,304 | |
| | |
| | 54,793 | | | Vishay Intertechnology Inc., (3) | | | 580,806 | |
| | |
| | 20,393 | | | Zebra Technologies Corporation, Class A, (2) | | | 1,568,222 | |
| | | | Total Electronic Equipment, Instruments & Components | | | 22,240,837 | |
| | |
| | | | Energy Equipment & Services – 1.4% | | | |
| | |
| | 23,371 | | | Atwood Oceanics Inc., (3) | | | 386,790 | |
| | |
| | 16,432 | | | Dril Quip Inc., (2) | | | 1,011,554 | |
| | |
| | 115,453 | | | Nabors Industries Inc. | | | 1,159,148 | |
| | |
| | 96,255 | | | Noble Corporation PLC, (3) | | | 1,296,555 | |
| | |
| | 40,523 | | | Oceaneering International Inc. | | | 1,702,776 | |
| | |
| | 21,329 | | | Oil States International Inc., (2) | | | 640,083 | |
| | |
| | 58,365 | | | Patterson-UTI Energy, Inc., (3) | | | 869,055 | |
| | |
| | 49,522 | | | Rowan Companies Inc. | | | 974,593 | |
| | |
| | 63,254 | | | Superior Energy Services, Inc., (3) | | | 895,677 | |
| | | | Total Energy Equipment & Services | | | 8,936,231 | |
| | |
| | | | Food & Staples Retailing – 0.5% | | | |
| | |
| | 15,502 | | | Casey’s General Stores, Inc. | | | 1,646,622 | |
| | |
| | 105,649 | | | SUPERVALU INC. | | | 694,114 | |
| | |
| | 20,044 | | | United Natural Foods Inc., (2), (3) | | | 1,011,220 | |
| | | | Total Food & Staples Retailing | | | 3,351,956 | |
| | |
| | | | Food Products – 2.3% | | | |
| | |
| | 37,756 | | | Dean Foods Company | | | 683,761 | |
| | |
| | 70,997 | | | Flowers Foods Inc. | | | 1,916,919 | |
| | |
| | 40,484 | | | Hain Celestial Group Inc., (2), (3) | | | 2,018,127 | |
| | |
| | 30,062 | | | Ingredion Inc., (3) | | | 2,857,694 | |
| | |
| | 7,841 | | | Lancaster Colony Corporation, (3) | | | 891,679 | |
| | |
| | 24,209 | | | Post Holdings Inc., (2), (3) | | | 1,555,912 | |
| | |
| | 8,751 | | | Tootsie Roll Industries Inc., (3) | | | 277,757 | |
| | |
| | 17,072 | | | Treehouse Foods Inc., (2), (3) | | | 1,462,046 | |
| | |
| | 70,235 | | | WhiteWave Foods Company, (2) | | | 2,878,230 | |
| | | | Total Food Products | | | 14,542,125 | |
| | |
| | | | Gas Utilities – 1.6% | | | |
| | |
| | 40,468 | | | Atmos Energy Corporation | | | 2,549,484 | |
| | | | | | | | |
| Shares | | | Description (1) | | Value | |
| | |
| | | | Gas Utilities (continued) | | | |
| | |
| | 33,934 | | | National Fuel Gas Company, (3) | | $ | 1,782,553 | |
| | |
| | 20,994 | | | One Gas Inc., (3) | | | 1,025,347 | |
| | |
| | 70,747 | | | Questar Corporation | | | 1,460,926 | |
| | |
| | 66,264 | | | UGI Corporation | | | 2,429,901 | |
| | |
| | 20,965 | | | WGL Holdings Inc. | | | 1,304,652 | |
| | | | Total Gas Utilities | | | 10,552,863 | |
| | |
| | | | Health Care Equipment & Supplies – 4.0% | | | |
| | |
| | 29,018 | | | Align Technology, Inc., (2) | | | 1,899,518 | |
| | |
| | 19,364 | | | Cooper Companies, Inc., (3) | | | 2,950,299 | |
| | |
| | 18,629 | | | Halyard Health Inc., (2), (3) | | | 552,909 | |
| | |
| | 23,191 | | | Hill Rom Holdings Inc. | | | 1,221,934 | |
| | |
| | 101,712 | | | Hologic Inc., (2) | | | 3,952,528 | |
| | |
| | 38,100 | | | Idexx Labs Inc., (2), (3) | | | 2,614,422 | |
| | |
| | 16,862 | | | Livanova PLC, (2), (3) | | | 1,117,613 | |
| | |
| | 56,683 | | | ResMed Inc., (3) | | | 3,265,508 | |
| | |
| | 22,356 | | | Sirona Dental Systems, Inc., (2) | | | 2,439,710 | |
| | |
| | 28,519 | | | Steris Corporation, (3) | | | 2,137,499 | |
| | |
| | 15,953 | | | Teleflex Inc., (3) | | | 2,121,749 | |
| | |
| | 22,368 | | | West Pharmaceutical Services Inc., (3) | | | 1,342,304 | |
| | | | Total Health Care Equipment & Supplies | | | 25,615,993 | |
| | |
| | | | Health Care Providers & Services – 2.6% | | | |
| | |
| | 19,320 | | | AmSurg Corporation, (2), (3) | | | 1,354,139 | |
| | |
| | 47,350 | | | Centene Corporation, (2), (3) | | | 2,816,378 | |
| | |
| | 46,557 | | | Community Health Systems, Inc., (2) | | | 1,305,458 | |
| | |
| | 32,396 | | | Health Net Inc., (2) | | | 2,081,767 | |
| | |
| | 18,390 | | | Lifepoint Hospitals Inc., (2) | | | 1,266,703 | |
| | |
| | 38,820 | | | Medax Inc., (2) | | | 2,735,645 | |
| | |
| | 16,026 | | | Molina Healthcare Inc., (2), (3) | | | 993,612 | |
| | |
| | 25,485 | | | Owens and Minor Inc., (3) | | | 913,637 | |
| | |
| | 34,357 | | | VCA Antech, Inc., (2) | | | 1,881,733 | |
| | |
| | 17,721 | | | Wellcare Health Plans Inc., (2) | | | 1,570,081 | |
| | | | Total Health Care Providers & Services | | | 16,919,153 | |
| | |
| | | | Health Care Technology – 0.1% | | | |
| | |
| | 64,524 | | | Allscripts Healthcare Solutions Inc., (2), (3) | | | 907,207 | |
| | |
| | | | Hotels, Restaurants & Leisure – 1.9% | | | |
| | |
| | 25,089 | | | Brinker International Inc., (3) | | | 1,141,800 | |
| | |
| | 7,312 | | | Buffalo Wild Wings, Inc., (2), (3) | | | 1,128,022 | |
| | |
| | 9,589 | | | CBRL Group Inc., (3) | | | 1,318,104 | |
| | |
| | 17,061 | | | Cheesecake Factory Inc., (3) | | | 822,340 | |
Nuveen Mid Cap Index Fund (continued)
| | |
| Portfolio of Investments | | October 31, 2015 |
| | | | | | | | |
| Shares | | | Description (1) | | Value | |
| | |
| | | | Hotels, Restaurants & Leisure (continued) | | | |
| | |
| | 22,471 | | | Dominos Pizza Inc., (3) | | $ | 2,396,982 | |
| | |
| | 35,654 | | | Dunkin Brands Group Inc., (3) | | | 1,476,432 | |
| | |
| | 11,274 | | | Intl Speedway Corporation | | | 391,095 | |
| | |
| | 14,885 | | | Jack in the Box Inc. | | | 1,109,379 | |
| | |
| | 10,410 | | | Panera Bread Company, (2) | | | 1,846,422 | |
| | |
| | 94,869 | | | The Wendy’s Company | | | 869,000 | |
| | | | Total Hotels, Restaurants & Leisure | | | 12,499,576 | |
| | |
| | | | Household Durables – 2.1% | | | |
| | |
| | 21,403 | | | CalAtlantic Group Inc., (3) | | | 815,240 | |
| | |
| | 72,697 | | | Jarden Corporation | | | 3,256,826 | |
| | |
| | 36,339 | | | KB Home, (3) | | | 476,041 | |
| | |
| | 15,777 | | | MDC Holdings Inc., (3) | | | 410,044 | |
| | |
| | 1,485 | | | NVR Inc., (2) | | | 2,432,074 | |
| | |
| | 24,558 | | | Tempur Pedic International Inc., (2) | | | 1,911,595 | |
| | |
| | 64,626 | | | Toll Brothers Inc., (2) | | | 2,324,597 | |
| | |
| | 58,898 | | | Tri Pointe Homes, Incorporated, (2), (3) | | | 764,496 | |
| | |
| | 20,524 | | | Tupperware Corporation, (3) | | | 1,208,248 | |
| | | | Total Household Durables | | | 13,599,161 | |
| | |
| | | | Household Products – 0.9% | | | |
| | |
| | 53,626 | | | Church & Dwight Company Inc. | | | 4,616,659 | |
| | |
| | 24,911 | | | Energizer Holdings, Inc. | | | 1,066,938 | |
| | | | Total Household Products | | | 5,683,597 | |
| | |
| | | | Independent Power & Renewable Electricity Producers – 0.0% | | | |
| | |
| | 33,375 | | | Talen Energy Corporation, (2), (3) | | | 289,695 | |
| | |
| | | | Industrial Conglomerates – 0.4% | | | |
| | |
| | 25,887 | | | Carlisle Companies Inc. | | | 2,252,169 | |
| | |
| | | | Insurance – 5.1% | | | |
| | |
| | 6,538 | | | Alleghany Corporation, (2) | | | 3,244,613 | |
| | |
| | 28,928 | | | American Financial Group Inc. | | | 2,088,312 | |
| | |
| | 63,456 | | | Arthur J. Gallagher & Co. | | | 2,774,931 | |
| | |
| | 26,433 | | | Aspen Insurance Holdings Limited | | | 1,284,908 | |
| | |
| | 48,019 | | | Brown & Brown Inc., (3) | | | 1,549,573 | |
| | |
| | 80,145 | | | CNO Financial Group Inc., (3) | | | 1,539,585 | |
| | |
| | 16,509 | | | Endurance Specialty Holdings Limited | | | 1,042,213 | |
| | |
| | 18,550 | | | Everest Reinsurance Group Ltd | | | 3,301,344 | |
| | |
| | 43,155 | | | First American Corporation, (3) | | | 1,645,500 | |
| | |
| | 17,796 | | | Hanover Insurance Group Inc. | | | 1,499,313 | |
| | |
| | 20,946 | | | Kemper Corporation, (3) | | | 748,191 | |
| | |
| | 14,657 | | | Mercury General Corporation, (3) | | | 791,625 | |
| | | | | | | | |
| Shares | | | Description (1) | | Value | |
| | |
| | | | Insurance (continued) | | | |
| | |
| | 97,875 | | | Old Republic International Corporation | | $ | 1,765,665 | |
| | |
| | 21,981 | | | Primerica Inc., (3) | | | 1,046,955 | |
| | |
| | 28,133 | | | Reinsurance Group of America Inc. | | | 2,538,722 | |
| | |
| | 16,378 | | | RenaisasnceRE Holdings, Limited | | | 1,795,520 | |
| | |
| | 17,667 | | | StanCorp Financial Group Inc. | | | 2,026,758 | |
| | |
| | 42,760 | | | WR Berkley Corporation, (3) | | | 2,387,291 | |
| | | | Total Insurance | | | 33,071,019 | |
| | |
| | | | Internet & Catalog Retail – 0.1% | | | |
| | |
| | 13,878 | | | Hosting Site Network, Inc. | | | 858,354 | |
| | |
| | | | Internet Software & Services – 0.2% | | | |
| | |
| | 47,058 | | | Rackspace Hosting Inc., (2) | | | 1,216,449 | |
| | |
| | | | IT Services – 3.8% | | | |
| | |
| | 31,085 | | | Acxiom Corporation, (2) | | | 687,600 | |
| | |
| | 48,742 | | | Broadridge Financial Solutions, Inc. | | | 2,904,048 | |
| | |
| | 40,988 | | | Convergys Corporation, (3) | | | 1,052,162 | |
| | |
| | 37,097 | | | CoreLogic Inc. | | | 1,446,041 | |
| | |
| | 11,596 | | | DST Systems Inc. | | | 1,416,451 | |
| | |
| | 34,071 | | | Gartner Inc., (2) | | | 3,089,218 | |
| | |
| | 27,542 | | | Global Payments Inc. | | | 3,757,004 | |
| | |
| | 34,154 | | | Henry Jack and Associates Inc., (3) | | | 2,641,470 | |
| | |
| | 27,679 | | | Leidos Holdings Inc. | | | 1,455,085 | |
| | |
| | 26,383 | | | Maximus Inc., (3) | | | 1,799,321 | |
| | |
| | 22,658 | | | NeuStar, Inc., (2), (3) | | | 616,071 | |
| | |
| | 16,476 | | | Science Applications International Corporation | | | 755,589 | |
| | |
| | 45,128 | | | VeriFone Holdings Inc., (2) | | | 1,360,158 | |
| | |
| | 15,653 | | | WEX Inc., (2) | | | 1,407,361 | |
| | | | Total IT Services | | | 24,387,579 | |
| | |
| | | | Leisure Products – 0.9% | | | |
| | |
| | 37,454 | | | Brunswick Corporation | | | 2,015,400 | |
| | |
| | 25,091 | | | Polaris Industries Inc., (3) | | | 2,818,723 | |
| | |
| | 26,105 | | | Vista Outdoor Inc., (2) | | | 1,167,416 | |
| | | | Total Leisure Products | | | 6,001,539 | |
| | |
| | | | Life Sciences Tools & Services – 1.3% | | | |
| | |
| | 8,149 | | | Bio-Rad Laboratories Inc., (2), (3) | | | 1,136,623 | |
| | |
| | 13,448 | | | Bio-Techne Corporation | | | 1,186,114 | |
| | |
| | 19,537 | | | Charles River Laboratories International, Inc., (2) | | | 1,274,594 | |
| | |
| | 11,802 | | | Mettler-Toledo International Inc., (2), (3) | | | 3,670,304 | |
| | |
| | 22,030 | | | Parexel International Corporation, (2) | | | 1,390,534 | |
| | | | Total Life Sciences Tools & Services | | | 8,658,169 | |
Nuveen Mid Cap Index Fund (continued)
| | |
| Portfolio of Investments | | October 31, 2015 |
| | | | | | | | |
| Shares | | | Description (1) | | Value | |
| | |
| | | | Machinery – 4.3% | | | |
| | |
| | 32,882 | | | AGCO Corporation, (3) | | $ | 1,591,160 | |
| | |
| | 20,365 | | | CLARCOR, Inc., (3) | | | 1,015,399 | |
| | |
| | 19,965 | | | Crane Company | | | 1,050,958 | |
| | |
| | 53,124 | | | Donaldson Company, Inc., (3) | | | 1,604,345 | |
| | |
| | 24,485 | | | Graco Inc., (3) | | | 1,797,199 | |
| | |
| | 32,565 | | | IDEX Corporation, (3) | | | 2,499,689 | |
| | |
| | 37,040 | | | ITT Industries, Inc. | | | 1,466,043 | |
| | |
| | 33,653 | | | Joy Global Inc., (3) | | | 578,159 | |
| | |
| | 31,735 | | | Kennametal Inc., (3) | | | 892,388 | |
| | |
| | 32,486 | | | Lincoln Electric Holdings Inc., (3) | | | 1,942,988 | |
| | |
| | 24,173 | | | Nordson Corporation, (3) | | | 1,722,085 | |
| | |
| | 32,096 | | | Oshkosh Truck Corporation, (3) | | | 1,318,825 | |
| | |
| | 44,553 | | | Terex Corporation | | | 893,733 | |
| | |
| | 30,969 | | | Timken Company | | | 978,620 | |
| | |
| | 16,258 | | | Toro Company | | | 1,223,740 | |
| | |
| | 62,574 | | | Trinity Industries Inc., (3) | | | 1,693,878 | |
| | |
| | 9,667 | | | Valmont Industries, Inc. | | | 1,048,289 | |
| | |
| | 38,958 | | | Wabtec Corporation | | | 3,228,449 | |
| | |
| | 23,835 | | | Woodward Governor Company, (3) | | | 1,084,493 | |
| | | | Total Machinery | | | 27,630,440 | |
| | |
| | | | Marine – 0.2% | | | |
| | |
| | 23,018 | | | Kirby Corporation, (2) | | | 1,502,845 | |
| | |
| | | | Media – 1.5% | | | |
| | |
| | 23,873 | | | AMC Networks Inc., Class A Shares, (2), (3) | | | 1,763,976 | |
| | |
| | 1,774 | | | Cable One, Inc. | | | 768,923 | |
| | |
| | 42,058 | | | Cinemark Holdings Inc. | | | 1,490,536 | |
| | |
| | 29,059 | | | Dreamworks Animation SKG Inc., (2), (3) | | | 588,154 | |
| | |
| | 18,915 | | | John Wiley and Sons Inc., Class A | | | 989,822 | |
| | |
| | 57,485 | | | Live Nation Inc., (2) | | | 1,568,191 | |
| | |
| | 14,948 | | | Meredith Corporation, (3) | | | 702,855 | |
| | |
| | 50,986 | | | New York Times, Class A | | | 677,094 | |
| | |
| | 45,071 | | | Time Inc. | | | 837,419 | |
| | | | Total Media | | | 9,386,970 | |
| | |
| | | | Metals & Mining – 1.5% | | | |
| | |
| | 43,488 | | | Allegheny Technologies, Inc., (3) | | | 639,274 | |
| | |
| | 21,446 | | | Carpenter Technology Inc., (3) | | | 714,366 | |
| | |
| | 47,560 | | | Commercial Metals Company | | | 683,437 | |
| | |
| | 13,545 | | | Compass Minerals International, Inc. | | | 1,100,396 | |
| | |
| | 31,390 | | | Reliance Steel & Aluminum Company | | | 1,882,144 | |
| | | | | | | | |
| Shares | | | Description (1) | | Value | |
| | |
| | | | Metals & Mining (continued) | | | |
| | |
| | 26,244 | | | Royal Gold, Inc. | | $ | 1,255,513 | |
| | |
| | 96,647 | | | Steel Dynamics Inc. | | | 1,785,070 | |
| | |
| | 58,448 | | | United States Steel Corporation, (3) | | | 682,673 | |
| | |
| | 19,849 | | | Worthington Industries, Inc. | | | 609,364 | |
| | | | Total Metals & Mining | | | 9,352,237 | |
| | |
| | | | Multiline Retail – 0.3% | | | |
| | |
| | 22,592 | | | Big Lots, Inc., (2) | | | 1,041,491 | |
| | |
| | 123,108 | | | J.C. Penney Company, Inc., (3) | | | 1,128,900 | |
| | | | Total Multiline Retail | | | 2,170,391 | |
| | |
| | | | Multi-Utilities – 1.0% | | | |
| | |
| | 44,810 | | | Alliant Energy Corporation | | | 2,644,686 | |
| | |
| | 18,027 | | | Black Hills Corporation | | | 825,276 | |
| | |
| | 77,395 | | | MDU Resources Group Inc., (3) | | | 1,459,670 | |
| | |
| | 33,310 | | | Vectren Corporation | | | 1,514,606 | |
| | | | Total Multi-Utilities | | | 6,444,238 | |
| | |
| | | | Oil, Gas & Consumable Fuels – 2.0% | | | |
| | |
| | 123,667 | | | California Resources Corporation, (3) | | | 499,615 | |
| | |
| | 156,435 | | | Denbury Resources Inc., (3) | | | 553,780 | |
| | |
| | 29,399 | | | Energen Corporation, (3) | | | 1,709,552 | |
| | |
| | 42,017 | | | Gulfport Energy Corporation, (2) | | | 1,280,258 | |
| | |
| | 76,907 | | | HollyFrontier Company | | | 3,766,136 | |
| | |
| | 64,747 | | | QEP Resources Inc. | | | 1,000,989 | |
| | |
| | 27,086 | | | SM Energy Company, (3) | | | 903,318 | |
| | |
| | 28,145 | | | Western Refining Inc. | | | 1,171,395 | |
| | |
| | 29,074 | | | World Fuel Services Corporation | | | 1,292,630 | |
| | |
| | 93,958 | | | WPX Energy Inc., (2), (3) | | | 644,552 | |
| | | | Total Oil, Gas & Consumable Fuels | | | 12,822,225 | |
| | |
| | | | Paper & Forest Products – 0.3% | | | |
| | |
| | 26,244 | | | Domtar Corporation | | | 1,082,303 | |
| | |
| | 57,007 | | | Louisiana-Pacific Corporation, (2), (3) | | | 1,006,744 | |
| | | | Total Paper & Forest Products | | | 2,089,047 | |
| | |
| | | | Personal Products – 0.4% | | | |
| | |
| | 173,242 | | | Avon Products, Inc., (3) | | | 698,165 | |
| | |
| | 24,911 | | | Edgewell Personal Care Co | | | 2,110,211 | |
| | | | Total Personal Products | | | 2,808,376 | |
| | |
| | | | Pharmaceuticals – 0.3% | | | |
| | |
| | 31,395 | | | Akorn, Inc., (2), (3) | | | 839,502 | |
| | |
| | 39,209 | | | Catalent, Inc., (2) | | | 1,042,175 | |
| | | | Total Pharmaceuticals | | | 1,881,677 | |
Nuveen Mid Cap Index Fund (continued)
| | |
| Portfolio of Investments | | October 31, 2015 |
| | | | | | | | |
| Shares | | | Description (1) | | Value | |
| | |
| | | | Professional Services – 1.2% | | | |
| | |
| | 13,653 | | | CEB Inc. | | $ | 1,020,698 | |
| | |
| | 16,502 | | | FTI Consulting Inc., (2) | | | 561,233 | |
| | |
| | 32,162 | | | Manpower Inc. | | | 2,951,828 | |
| | |
| | 25,841 | | | Towers Watson & Company, Class A Shares | | | 3,192,914 | |
| | | | Total Professional Services | | | 7,726,673 | |
| | |
| | | | Real Estate Investment Trust – 9.3% | | | |
| | |
| | 28,940 | | | Alexandria Real Estate Equities Inc. | | | 2,597,076 | |
| | |
| | 42,376 | | | American Campus Communities Inc., (3) | | | 1,719,194 | |
| | |
| | 77,759 | | | BioMed Realty Trust Inc. | | | 1,820,338 | |
| | |
| | 33,246 | | | Camden Property Trust, (3) | | | 2,453,222 | |
| | |
| | 33,227 | | | Care Capital Properties, Inc. | | | 1,094,830 | |
| | |
| | 48,138 | | | Communications Sales & Leasing, Inc., (3) | | | 967,092 | |
| | |
| | 35,386 | | | Corporate Office Properties | | | 813,878 | |
| | |
| | 47,003 | | | Corrections Corporation of America | | | 1,339,586 | |
| | |
| | 54,879 | | | Douglas Emmett Inc. | | | 1,676,553 | |
| | |
| | 133,090 | | | Duke Realty Corporation | | | 2,754,963 | |
| | |
| | 25,575 | | | Equity One Inc. | | | 679,784 | |
| | |
| | 44,491 | | | Extra Space Storage Inc. | | | 3,525,467 | |
| | |
| | 27,173 | | | Federal Realty Investment Trust | | | 3,899,054 | |
| | |
| | 36,402 | | | Highwoods Properties, Inc. | | | 1,581,667 | |
| | |
| | 60,484 | | | Hospitality Properties Trust, (3) | | | 1,623,391 | |
| | |
| | 33,210 | | | Kilroy Realty Corporation, (3) | | | 2,186,546 | |
| | |
| | 26,516 | | | Lamar Advertising Company | | | 1,496,298 | |
| | |
| | 42,033 | | | LaSalle Hotel Properties, (3) | | | 1,236,191 | |
| | |
| | 59,658 | | | Liberty Property Trust | | | 2,029,565 | |
| | |
| | 35,811 | | | Mack-Cali Realty Corporation | | | 779,247 | |
| | |
| | 30,298 | | | Mid-America Apartment Communities | | | 2,581,087 | |
| | |
| | 49,760 | | | National Retail Properties, Inc. | | | 1,890,880 | |
| | |
| | 64,362 | | | Omega Healthcare Investors Inc., (3) | | | 2,221,776 | |
| | |
| | 13,921 | | | Post Properties, Inc. | | | 831,641 | |
| | |
| | 16,396 | | | Potlatch Corporation, (3) | | | 512,211 | |
| | |
| | 51,082 | | | Rayonier Inc. | | | 1,157,007 | |
| | |
| | 37,298 | | | Regency Centers Corporation | | | 2,534,772 | |
| | |
| | 94,418 | | | Senior Housing Properties Trust | | | 1,434,209 | |
| | |
| | 9,680 | | | Sovran Self Storage Inc. | | | 966,742 | |
| | |
| | 33,683 | | | Tanger Factory Outlet Centers, (3) | | | 1,177,221 | |
| | |
| | 25,553 | | | Taubman Centers Inc. | | | 1,967,070 | |
| | |
| | 101,560 | | | UDR Inc., (3) | | | 3,499,758 | |
| | |
| | 32,581 | | | Urban Edge Properties | | | 773,473 | |
| | | | | | | | |
| Shares | | | Description (1) | | Value | |
| | |
| | | | Real Estate Investment Trust (continued) | | | |
| | |
| | 45,397 | | | Weingarten Realty Trust | | $ | 1,623,397 | |
| | |
| | 73,739 | | | WP GLIMCHER, Inc. | | | 856,847 | |
| | | | Total Real Estate Investment Trust | | | 60,302,033 | |
| | |
| | | | Real Estate Management & Development – 0.6% | | | |
| | |
| | 17,321 | | | Alexander & Baldwin Inc., (3) | | | 653,695 | |
| | |
| | 18,000 | | | Jones Lang LaSalle Inc. | | | 3,000,780 | |
| | | | Total Real Estate Management & Development | | | 3,654,475 | |
| | |
| | | | Road & Rail – 0.7% | | | |
| | |
| | 20,603 | | | Genesee & Wyoming Inc., (2) | | | 1,382,461 | |
| | |
| | 18,068 | | | Landstar System | | | 1,139,007 | |
| | |
| | 28,192 | | | Old Dominion Freight Line, (2), (3) | | | 1,746,212 | |
| | |
| | 17,344 | | | Werner Enterprises, Inc. | | | 458,922 | |
| | | | Total Road & Rail | | | 4,726,602 | |
| | |
| | | | Semiconductors & Semiconductor Equipment – 1.8% | | | |
| | |
| | 261,638 | | | Advanced Micro Devices, Inc., (2), (3) | | | 554,673 | |
| | |
| | 170,037 | | | Atmel Corporation | | | 1,292,281 | |
| | |
| | 41,254 | | | Cree, Inc., (2), (3) | | | 1,039,188 | |
| | |
| | 132,849 | | | Cypress Semiconductor Corporation, (3) | | | 1,400,228 | |
| | |
| | 50,463 | | | Fairchild Semiconductor International Inc., Class A, (2) | | | 841,723 | |
| | |
| | 57,253 | | | Integrated Device Technology, Inc., (2) | | | 1,459,952 | |
| | |
| | 52,016 | | | Intersil Holding Corporation, Class A | | | 704,817 | |
| | |
| | 16,148 | | | Silicon Laboratories Inc., (2) | | | 806,916 | |
| | |
| | 125,648 | | | SunEdison Inc., (2), (3) | | | 917,230 | |
| | |
| | 14,652 | | | Synaptics, Inc., (2) | | | 1,246,739 | |
| | |
| | 82,674 | | | Teradyne Inc. | | | 1,613,796 | |
| | | | Total Semiconductors & Semiconductor Equipment | | | 11,877,543 | |
| | |
| | | | Software – 4.7% | | | |
| | |
| | 46,389 | | | ACI Worldwide, Inc., (2), (3) | | | 1,111,017 | |
| | |
| | 37,429 | | | Ansys Inc., (2), (3) | | | 3,567,358 | |
| | |
| | 116,942 | | | Cadence Design Systems, Inc., (2), (3) | | | 2,598,451 | |
| | |
| | 64,410 | | | CDK Global Inc. | | | 3,206,974 | |
| | |
| | 17,917 | | | CommVault Systems, Inc., (2) | | | 725,997 | |
| | |
| | 12,743 | | | Fair Isaac Corporation | | | 1,177,071 | |
| | |
| | 55,330 | | | Fortinet Inc., (2) | | | 1,901,139 | |
| | |
| | 29,493 | | | Manhattan Associates Inc., (2) | | | 2,148,565 | |
| | |
| | 39,112 | | | Mentor Graphics Corporation | | | 1,063,846 | |
| | |
| | 47,914 | | | Parametric Technology Corporation, (2) | | | 1,698,072 | |
| | |
| | 36,283 | | | Rovi Corporation, (2), (3) | | | 331,989 | |
| | |
| | 26,494 | | | Solarwinds, Inc., (2) | | | 1,537,447 | |
Nuveen Mid Cap Index Fund (continued)
| | |
| Portfolio of Investments | | October 31, 2015 |
| | | | | | | | |
| Shares | | | Description (1) | | Value | |
| | |
| | | | Software (continued) | | | |
| | |
| | 27,791 | | | Solera Holdings Inc. | | $ | 1,519,056 | |
| | |
| | 62,501 | | | Synopsys Inc., (2) | | | 3,123,800 | |
| | |
| | 13,477 | | | Tyler Technologies Inc., (2), (3) | | | 2,295,942 | |
| | |
| | 11,450 | | | Ultimate Software Group, Inc., (2), (3) | | | 2,339,808 | |
| | | | Total Software | | | 30,346,532 | |
| | |
| | | | Specialty Retail – 2.7% | | | |
| | |
| | 26,507 | | | Aaron Rents Inc. | | | 653,928 | |
| | |
| | 29,482 | | | Abercrombie & Fitch Co., Class A, (3) | | | 624,724 | |
| | |
| | 69,104 | | | American Eagle Outfitters, Inc., (3) | | | 1,055,909 | |
| | |
| | 64,679 | | | Ascena Retail Group Inc., (2) | | | 861,524 | |
| | |
| | 18,934 | | | Cabela’s Incorporated, (2), (3) | | | 741,645 | |
| | |
| | 58,829 | | | Chico’s FAS, Inc., (3) | | | 813,017 | |
| | |
| | 30,545 | | | CST Brands Inc. | | | 1,097,482 | |
| | |
| | 40,127 | | | Dick’s Sporting Goods Inc. | | | 1,787,658 | |
| | |
| | 57,391 | | | Foot Locker, Inc., (3) | | | 3,888,240 | |
| | |
| | 24,103 | | | Guess Inc., (3) | | | 507,368 | |
| | |
| | 17,941 | | | Murphy USA Inc., (2) | | | 1,101,039 | |
| | |
| | 196,559 | | | Office Depot, Inc., (2) | | | 1,497,780 | |
| | |
| | 21,325 | | | Rent-A-Center Inc., (3) | | | 392,167 | |
| | |
| | 35,358 | | | Williams-Sonoma Inc., (3) | | | 2,607,653 | |
| | | | Total Specialty Retail | | | 17,630,134 | |
| | |
| | | | Technology Hardware, Storage & Peripherals – 0.6% | | | |
| | |
| | 41,665 | | | 3D Systems Corporation, (2), (3) | | | 419,150 | |
| | |
| | 26,092 | | | Diebold Inc., (3) | | | 962,012 | |
| | |
| | 25,150 | | | Lexmark International, Inc., Class A | | | 817,124 | |
| | |
| | 67,819 | | | NCR Corporation, (2) | | | 1,803,985 | |
| | | | Total Technology Hardware, Storage & Peripherals | | | 4,002,271 | |
| | |
| | | | Textiles, Apparel & Luxury Goods – 0.8% | | | |
| | |
| | 21,689 | | | Carter’s Inc. | | | 1,971,096 | |
| | |
| | 13,751 | | | Deckers Outdoor Corporation, (2) | | | 765,381 | |
| | |
| | 51,116 | | | Kate Spade & Company, (2), (3) | | | 918,555 | |
| | |
| | 49,101 | | | Skechers USA Inc., (2), (3) | | | 1,531,951 | |
| | | | Total Textiles, Apparel & Luxury Goods | | | 5,186,983 | |
| | |
| | | | Thrifts & Mortgage Finance – 0.6% | | | |
| | |
| | 178,800 | | | New York Community Bancorp Inc., (3) | | | 2,953,776 | |
| | |
| | 40,929 | | | Washington Federal Inc. | | | 1,020,769 | |
| | | | Total Thrifts & Mortgage Finance | | | 3,974,545 | |
| | |
| | | | Trading Companies & Distributors – 0.7% | | | |
| | |
| | 18,597 | | | GATX Corporation, (3) | | | 868,480 | |
| | | | | | | | | | | | | | | | | | | | |
| Shares | | | Description (1) | | | | | | | | | | | Value | |
| | | | | |
| | | | Trading Companies & Distributors (continued) | | | | | | | | | | | | |
| | | | | |
| | 19,131 | | | MSC Industrial Direct Inc., Class A, (3) | | | | | | | | | | | | | | $ | 1,200,853 | |
| | | | | |
| | 43,336 | | | NOW Inc., (2), (3) | | | | | | | | | | | | | | | 715,477 | |
| | | | | |
| | 11,520 | | | Watsco Inc. | | | | | | | | | | | | | | | 1,417,306 | |
| | | | Total Trading Companies & Distributors | | | | | | | | | | | | | | | 4,202,116 | |
| | | | | |
| | | | Water Utilities – 0.3% | | | | | | | | | | | | |
| | | | | |
| | 71,520 | | | Aqua America Inc. | | | | | | | | | | | | | | | 2,045,472 | |
| | | | | |
| | | | Wireless Telecommunication Services – 0.2% | | | | | | | | | | | | |
| | | | | |
| | 39,973 | | | Telephone and Data Systems Inc. | | | | | | | | | | | | | | | 1,144,827 | |
| | | | Total Common Stocks (cost $456,761,420) | | | | | | | | | | | | | | | 612,972,145 | |
| | | | | |
| Shares | | | Description (1) | | | | | | | | | | | Value | |
| | | | | |
| | | | COMMON STOCK RIGHTS – 0.0% | | | | | | | | | | | | | | | | |
| | | | | |
| | 100,634 | | | Community Health Systems Inc. | | | | | | | | | | | | | | $ | 956 | |
| | | | Total Common Stock Rights (cost $—) | | | | | | | | | | | | | | | 956 | |
| | | | Total Long-Term Investments (cost $456,761,420) | | | | | | | | 612,973,101 | |
| | | | | |
| Shares | | | Description (1) | | | | | | | | | | | Value | |
| |
| | | | INVESTMENTS PURCHASED WITH COLLATERAL FROM SECURITIES LENDING – 28.7% | |
| | | | | |
| | | | Money Market Funds – 28.7% | | | | | | | | | | | | |
| | | |
| | 185,712,712 | | | Mount Vernon Securities Lending Prime Portfolio, 0.256%, (4), (5) | | | | | | | $ | 185,712,712 | |
| | | | Total Investments Purchased with Collateral from Securities Lending (cost $185,712,712) | | | | | | | | 185,712,712 | |
| | | | | |
Shares/ Principal Amount (000) | | | Description (1) | | Coupon | | | Maturity | | | Ratings (6) | | | Value | |
| | | | | |
| | | | SHORT-TERM INVESTMENTS – 5.5% | | | | | | | | | | | | | | | | |
| | | | | |
| | | | Money Market Funds – 5.0% | | | | | | | | | | | | |
| | | | | |
| | 32,646,053 | | | First American Treasury Obligations Fund, Class Z | | | 0.000% (4) | | | | N/A | | | | N/A | | | $ | 32,646,053 | |
| | | | |
| | | | U.S. Government and Agency Obligations – 0.5% | | | | | | | | | | | | | |
| | | | | |
| $ | 3,000 | | | U.S. Treasury Bills, (7) | | | 0.000% | | | | 11/12/15 | | | | AAA | | | | 2,999,991 | |
| | | | Total Short-Term Investments (cost $35,645,941) | | | | | | | | 35,646,044 | |
| | | | Total Investments (cost $678,120,073) – 128.9% | | | | | | | | | | | | | | | 834,331,857 | |
| | | | Other Assets Less Liabilities – (28.9)% (8) | | | | | | | | | | | | | | | (187,075,398) | |
| | | | Net Assets – 100% | | | | | | | | | | | | | | $ | 647,256,459 | |
Nuveen Mid Cap Index Fund (continued)
| | |
| Portfolio of Investments | | October 31, 2015 |
Investment in Derivatives as of October 31, 2015
Futures Contracts outstanding:
| | | | | | | | | | | | | | | | | | | | | | | | |
| Description | | Contract
Position | | | Number of Contracts | | | Contract Expiration | | | Notional Amount at Value | | | Variable Margin Receivable/ (Payable) | | | Unrealized
Appreciation
(Depreciation) | |
S&P MidCap 400® E-Mini Index | | | Long | | | | 251 | | | | 12/15 | | | | 36,179,140 | | | | 7,537 | | | | 804,044 | |
For Fund portfolio compliance purposes, the Fund’s industry classifications refer to any one or more of the industry sub-classifications used by one or more widely recognized market indexes or ratings group indexes, and/or as defined by Fund management. This definition may not apply for purposes of this report which may combine industry sub-classifications into sectors for reporting ease.
| (1) | All percentages shown in the Portfolio of Investments are based on net assets. |
| (2) | Non-income producing; issuer has not declared a dividend within the past twelve months. |
| (3) | Investment, or a portion of investment, is out on loan for securities lending. The total value of the securities out on loan as of the end of the reporting period was $179,056,613. |
| (4) | The rate shown is the annualized seven-day effective yield as of the end of the reporting period. |
| (5) | The Fund may loan securities representing up to one third of the fair value of its total assets (which includes collateral for securities on loan) to broker dealers, banks, and other institutions. The Fund maintains collateral equal to at least 100% of the fair value of the securities loaned. The cash collateral received by the Fund is invested in this money market fund. See Notes to Financial Statements, Note 3 – Portfolio Securities and Investments in Derivatives, Securities Lending for more information. |
| (6) | Ratings (not covered by the report of independent registered public accounting firm): Using the highest of Standard & Poor’s Group (“Standard & Poor’s”), Moody’s Investors Service, Inc. (“Moody’s”) or Fitch, Inc. (“Fitch”) rating. Ratings below BBB by Standard & Poor’s, Baa by Moody’s or BBB by Fitch are considered to be below investment grade. Holdings designated N/R are not rated by any of these national rating agencies. |
| (7) | Investment, or portion of investment, segregated as collateral for investments in derivatives. |
| (8) | Other assets less liabilities includes the unrealized appreciation (depreciation) of certain over-the-counter derivatives as presented on the Statement of Assets and Liabilities. The unrealized appreciation (depreciation) of exchange-cleared and exchange-traded derivatives is recognized as part of the cash collateral at broker and/or the receivable or payable for variation margin as presented on the Statement of Assets and Liabilities, when applicable. |
See accompanying notes to financial statements.
Nuveen Small Cap Index Fund
| | |
| Portfolio of Investments | | October 31, 2015 |
| | | | | | | | |
| Shares | | | Description (1) | | Value | |
| | |
| | | | LONG-TERM INVESTMENTS – 96.2% | | | | |
| | |
| | | | COMMON STOCKS – 96.2% | | | | |
| | |
| | | | Aerospace & Defense – 1.4% | | | |
| | |
| | 2,624 | | | AAR Corporation | | $ | 59,539 | |
| | |
| | 4,638 | | | Aerojet Rocketdyne Holdings Inc., (2), (3) | | | 78,568 | |
| | |
| | 1,478 | | | Aerovironment, Inc., (3) | | | 34,097 | |
| | |
| | 547 | | | American Science & Engineering Inc., (2) | | | 20,502 | |
| | |
| | 1,628 | | | Astronics Corporation, (3) | | | 61,555 | |
| | |
| | 1,598 | | | Cubic Corporation | | | 71,670 | |
| | |
| | 3,518 | | | Curtiss Wright Corporation | | | 244,712 | |
| | |
| | 5,363 | | | DigitalGlobe Inc., (3) | | | 80,070 | |
| | |
| | 842 | | | Ducommon Inc. | | | 18,221 | |
| | |
| | 1,361 | | | Engility Holdings Inc., (3) | | | 43,811 | |
| | |
| | 2,302 | | | Esterline Technologies Corporation, (3) | | | 177,369 | |
| | |
| | 1,423 | | | Heico Corporation | | | 71,776 | |
| | |
| | 2,953 | | | Heico Corporation, Class A | | | 128,987 | |
| | |
| | 2,537 | | | Keyw Holding Corporation, (2), (3) | | | 18,089 | |
| | |
| | 3,902 | | | KLX Inc., (3) | | | 152,607 | |
| | |
| | 3,663 | | | Kratos Defense & Security Solutions Inc., (3) | | | 18,278 | |
| | |
| | 2,864 | | | Moog Inc., Class A Shares, (3) | | | 176,881 | |
| | |
| | 374 | | | National Presto Industries Inc. | | | 32,931 | |
| | |
| | 785 | | | Sparton Corporation, (3) | | | 18,471 | |
| | |
| | 3,954 | | | Taser International, Inc., (2), (3) | | | 92,563 | |
| | |
| | 2,614 | | | Teledyne Technologies Inc., (3) | | | 233,247 | |
| | |
| | 778 | | | Vectrus, Inc., (3) | | | 19,349 | |
| | | | Total Aerospace & Defense | | | 1,853,293 | |
| | |
| | | | Air Freight & Logistics – 0.5% | | | |
| | |
| | 3,904 | | | Air Transport Services Group Inc., (3) | | | 38,220 | |
| | |
| | 1,849 | | | Atlas Air Worldwide Holdings Inc., (3) | | | 76,253 | |
| | |
| | 2,192 | | | Echo Global Logistics, Inc., (3) | | | 52,148 | |
| | |
| | 2,290 | | | Forward Air Corporation, (2) | | | 103,874 | |
| | |
| | 2,668 | | | Hub Group, Inc., (3) | | | 106,667 | |
| | |
| | 650 | | | Park Ohio Holdings Corporation | | | 22,425 | |
| | |
| | 2,001 | | | Radiant Logistics, Inc., (3) | | | 7,944 | |
| | |
| | 6,827 | | | UTI Worldwide, Inc. | | | 48,677 | |
| | |
| | 5,291 | | | XPO Logistics, Incorporated, (2), (3) | | | 146,878 | |
| | | | Total Air Freight & Logistics | | | 603,086 | |
Nuveen Small Cap Index Fund (continued)
| | |
| Portfolio of Investments | | October 31, 2015 |
| | | | | | | | |
| Shares | | | Description (1) | | Value | |
| | |
| | | | Airlines – 0.4% | | | |
| | |
| | 993 | | | Allegiant Travel Company | | $ | 196,068 | |
| | |
| | 3,529 | | | Hawaiian Holdings Inc., (2), (3) | | | 122,456 | |
| | |
| | 3,861 | | | Republic Airways Holdings, Inc., (3) | | | 22,239 | |
| | |
| | 3,962 | | | Skywest Inc. | | | 75,436 | |
| | |
| | 1,863 | | | Virgin America Inc., (2), (3) | | | 66,341 | |
| | | | Total Airlines | | | 482,540 | |
| | |
| | | | Auto Components – 1.2% | | | |
| | |
| | 5,248 | | | American Axle and Manufacturing Holdings Inc. | | | 116,296 | |
| | |
| | 4,258 | | | Cooper Tire & Rubber | | | 177,942 | |
| | |
| | 1,005 | | | Cooper-Standard Holdings Inc., (2), (3) | | | 65,365 | |
| | |
| | 12,066 | | | Dana Holding Corporation, (2) | | | 202,709 | |
| | |
| | 1,978 | | | Dorman Products, Inc., (2), (3) | | | 92,333 | |
| | |
| | 1,833 | | | Drew Industries Inc., (3) | | | 109,668 | |
| | |
| | 2,516 | | | Federal Mogul Corporation, Class A Shares, (3) | | | 19,499 | |
| | |
| | 821 | | | Fox Factory Holding Corporation, (3) | | | 14,573 | |
| | |
| | 2,655 | | | Gentherm Inc., (2), (3) | | | 130,520 | |
| | |
| | 1,340 | | | Horizon Global Corporation, (3) | | | 11,779 | |
| | |
| | 884 | | | Metaldyne Performance Group Inc. | | | 19,289 | |
| | |
| | 3,543 | | | Modine Manufacturing Company | | | 29,655 | |
| | |
| | 1,384 | | | Motorcar Parts of America, Inc., (3) | | | 46,585 | |
| | |
| | 2,116 | | | Remy International Inc. | | | 62,401 | |
| | |
| | 1,535 | | | Standard Motor Products Inc. | | | 67,924 | |
| | |
| | 2,190 | | | Stoneridge Inc., (2), (3) | | | 27,791 | |
| | |
| | 268 | | | Strattec Security Corporation | | | 16,032 | |
| | |
| | 1,733 | | | Superior Industries International Inc. | | | 34,105 | |
| | |
| | 4,538 | | | Tenneco Inc., (3) | | | 256,805 | |
| | |
| | 1,662 | | | Tower International Inc. | | | 45,655 | |
| | | | Total Auto Components | | | 1,546,926 | |
| | |
| | | | Automobiles – 0.0% | | | |
| | |
| | 1,991 | | | Winnebago Industries Inc., (2) | | | 41,791 | |
| | |
| | | | Banks – 8.7% | | | |
| | |
| | 1,280 | | | 1st Source Corporation | | | 40,653 | |
| | |
| | 377 | | | Access National Corporation | | | 7,800 | |
| | |
| | 613 | | | American National Bankshares, Inc. | | | 15,448 | |
| | |
| | 1,951 | | | Ameris Bancorp. | | | 61,457 | |
| | |
| | 775 | | | Ames National Corporation | | | 19,375 | |
| | |
| | 124 | | | Arrow Financial Corporation | | | 3,422 | |
| | |
| | 2,567 | | | Banc of California Inc. | | | 33,474 | |
| | |
| | 551 | | | BancFirst Corporation | | | 33,958 | |
| | | | | | | | |
| Shares | | | Description (1) | | Value | |
| | |
| | | | Banks (continued) | | | |
| | |
| | 2,304 | | | Banco Latinoamericano de Exportaciones S.A. | | $ | 62,277 | |
| | |
| | 2,566 | | | Bancorp, Inc., (3) | | | 18,475 | |
| | |
| | 7,141 | | | BancorpSouth Inc., (2) | | | 178,025 | |
| | |
| | 453 | | | Bank of Marin Bancorp California | | | 24,091 | |
| | |
| | 5,768 | | | Bank of the Ozarks, Inc., (2) | | | 288,515 | |
| | |
| | 1,518 | | | Banner Corporation | | | 74,488 | |
| | |
| | 441 | | | Bar Harbor Bankshares | | | 15,589 | |
| | |
| | 5,883 | | | BBCN Bancorp Inc. | | | 98,776 | |
| | |
| | 1,948 | | | Berkshire Hills Bancorp, Inc., (2) | | | 55,713 | |
| | |
| | 2,207 | | | Blue Hills Bancorp, Inc. | | | 31,317 | |
| | |
| | 2,092 | | | BNC Bancorp., (2) | | | 46,965 | |
| | |
| | 6,205 | | | Boston Private Financial Holdings Inc. | | | 71,109 | |
| | |
| | 931 | | | Bridge Bancorp Inc., (2) | | | 26,729 | |
| | |
| | 1,126 | | | Bryn Mawr Bank | | | 32,800 | |
| | |
| | 575 | | | Camden National Corporation | | | 22,477 | |
| | |
| | 1,662 | | | Capital Bank Financial Corporation, Class A Shares | | | 53,683 | |
| | |
| | 825 | | | Capital City Bank | | | 12,738 | |
| | |
| | 2,522 | | | Cardinal Financial Corporation | | | 57,325 | |
| | |
| | 2,498 | | | Cascade Bancorp., (3) | | | 14,014 | |
| | |
| | 5,911 | | | Cathay General Bancorp., (2) | | | 185,014 | |
| | |
| | 3,362 | | | Centerstate Banks of Florida, Inc. | | | 49,018 | |
| | |
| | 1,327 | | | Central Pacific Financial Corporation | | | 29,672 | |
| | |
| | 284 | | | Century Bancorp, Inc. | | | 12,624 | |
| | |
| | 2,457 | | | Chemical Financial Corporation | | | 83,366 | |
| | |
| | 964 | | | Citizens & Northern Corporation | | | 19,097 | |
| | |
| | 1,125 | | | City Holding Company | | | 53,809 | |
| | |
| | 1,198 | | | CNB Financial Corporation | | | 22,259 | |
| | |
| | 2,954 | | | Cobiz, Inc. | | | 36,807 | |
| | |
| | 4,079 | | | Columbia Banking Systems Inc. | | | 135,912 | |
| | |
| | 3,016 | | | Community Bank System Inc., (2) | | | 122,932 | |
| | |
| | 1,211 | | | Community Trust Bancorp, Inc. | | | 41,743 | |
| | |
| | 876 | | | CommunityOne Bancorp., (3) | | | 11,335 | |
| | |
| | 1,358 | | | ConnectOne Bancorp, Inc. | | | 24,240 | |
| | |
| | 678 | | | CU Bancorp., (3) | | | 16,353 | |
| | |
| | 1,978 | | | Customers Bancorp Inc., (3) | | | 54,395 | |
| | |
| | 7,860 | | | CVB Financial, (2) | | | 137,157 | |
| | |
| | 2,212 | | | Eagle Bancorp, Inc., (3) | | | 105,291 | |
| | |
| | 604 | | | Enterprise Bancorp, Inc. | | | 14,025 | |
| | |
| | 1,509 | | | Enterprise Financial Services Corporation | | | 42,795 | |
Nuveen Small Cap Index Fund (continued)
| | |
| Portfolio of Investments | | October 31, 2015 |
| | | | | | | | |
| Shares | | | Description (1) | | Value | |
| | |
| | | | Banks (continued) | | | |
| | |
| | 12,519 | | | F.N.B. Corporation PA | | $ | 168,631 | |
| | |
| | 555 | | | Farmers Capital Bank Corporation | | | 15,052 | |
| | |
| | 2,069 | | | FCB Financial Holdings, Inc., Class A Shares, (3) | | | 73,574 | |
| | |
| | 1,221 | | | Fidelity Southern Corporation | | | 25,580 | |
| | |
| | 1,075 | | | Financial Institutions, Inc. | | | 28,079 | |
| | |
| | 797 | | | First Bancorp Maine | | | 16,841 | |
| | |
| | 1,640 | | | First Bancorp of North Carolina, Inc. | | | 30,389 | |
| | |
| | 8,409 | | | First Bancorp of Puerto Rico, (2), (3) | | | 31,870 | |
| | |
| | 2,012 | | | First Busey Corporation | | | 41,990 | |
| | |
| | 638 | | | First Business Financial Services, Inc. | | | 15,727 | |
| | |
| | 570 | | | First Citizens Bancshares, Inc. | | | 146,000 | |
| | |
| | 7,292 | | | First Commonwealth Financial Corporation | | | 67,013 | |
| | |
| | 1,269 | | | First Community Bancshares, Inc. | | | 24,403 | |
| | |
| | 1,253 | | | First Connecticut Bancorp. | | | 21,777 | |
| | |
| | 4,476 | | | First Financial Bancorp. | | | 86,297 | |
| | |
| | 4,744 | | | First Financial Bankshares, Inc., (2) | | | 157,785 | |
| | |
| | 817 | | | First Financial Corporation | | | 27,999 | |
| | |
| | 1,404 | | | First Interstate BancSystem Inc., Montana | | | 39,817 | |
| | |
| | 2,911 | | | First Merchants Corporation, (2) | | | 76,356 | |
| | |
| | 5,838 | | | First Midwest Bancorp, Inc. | | | 104,033 | |
| | |
| | 1,158 | | | First NBC Bank Holding Company, (3) | | | 43,066 | |
| | |
| | 989 | | | First of Long Island Corporation, (2) | | | 27,465 | |
| | |
| | 12,263 | | | FirstMerit Corporation | | | 230,422 | |
| | |
| | 2,346 | | | Flushing Financial Corporation | | | 49,360 | |
| | |
| | 13,069 | | | Fulton Financial Corporation, (2) | | | 175,386 | |
| | |
| | 1,066 | | | German American Bancorp, Inc. | | | 33,398 | |
| | |
| | 5,587 | | | Glacier Bancorp, Inc., (2) | | | 152,860 | |
| | |
| | 859 | | | Great Southern Bancorp. | | | 41,515 | |
| | |
| | 3,056 | | | Great Western Bancorp Inc. | | | 86,363 | |
| | |
| | 752 | | | Green Bancorp, Inc., (3) | | | 9,212 | |
| | |
| | 1,144 | | | Guaranty Bancorp. | | | 18,853 | |
| | |
| | 2,812 | | | Hampton Roads Bankshares, Inc., (3) | | | 5,202 | |
| | |
| | 5,761 | | | Hancock Holding Company | | | 159,004 | |
| | |
| | 2,469 | | | Hanmi Financial Corporation | | | 62,960 | |
| | |
| | 1,235 | | | Heartland Financial USA, Inc. | | | 45,497 | |
| | |
| | 1,614 | | | Heritage Commerce Corporation | | | 17,076 | |
| | |
| | 2,411 | | | Heritage Financial Corporation | | | 44,411 | |
| | |
| | 1,681 | | | Heritage Oaks Bancorp | | | 14,810 | |
| | |
| | 5,633 | | | Hilltop Holdings Inc., (3) | | | 118,124 | |
| | | | | | | | |
| Shares | | | Description (1) | | Value | |
| | |
| | | | Banks (continued) | | | |
| | |
| | 4,199 | | | Home Bancshares, Inc., (2) | | $ | 180,221 | |
| | |
| | 1,609 | | | HomeTrust Bancshares Inc., (3) | | | 30,474 | |
| | |
| | 724 | | | Horizon Bancorp. | | | 18,896 | |
| | |
| | 2,437 | | | IberiaBank Corporation, (2) | | | 147,755 | |
| | |
| | 1,907 | | | Independent Bank Corporation, Massachusetts, (2) | | | 89,133 | |
| | |
| | 1,778 | | | Independent Bank Corporation, Michigan | | | 25,745 | |
| | |
| | 709 | | | Independent Bank Group Inc. | | | 27,616 | |
| | |
| | 4,005 | | | International Bancshares Corporation, (2) | | | 107,935 | |
| | |
| | 25,259 | | | Investors Bancorp, Inc., (2) | | | 315,990 | |
| | |
| | 3,127 | | | Lakeland Bancorp, Inc. | | | 36,367 | |
| | |
| | 1,282 | | | Lakeland Financial Corporation | | | 57,600 | |
| | |
| | 3,522 | | | LegacyTexas Financial Group Inc. | | | 101,081 | |
| | |
| | 1,698 | | | Mainsource Financial Group | | | 36,745 | |
| | |
| | 5,527 | | | MB Financial, Inc. | | | 178,190 | |
| | |
| | 1,305 | | | Mercantile Bank Corporation | | | 28,788 | |
| | |
| | 400 | | | Merchants Bancshares, Inc. | | | 12,608 | |
| | |
| | 876 | | | Metro Bancorp, Inc. | | | 27,138 | |
| | |
| | 565 | | | MidWestOne Financial Group Inc. | | | 17,312 | |
| | |
| | 2,740 | | | National Bank Holdings Corporation | | | 60,444 | |
| | |
| | 538 | | | National Bankshares, Inc., (2) | | | 17,566 | |
| | |
| | 9,614 | | | National Penn Bancshares, Inc. | | | 115,753 | |
| | |
| | 3,388 | | | NBT Bancorp, Inc., (2) | | | 95,237 | |
| | |
| | 2,608 | | | NewBridge Bancorp. | | | 29,496 | |
| | |
| | 3,490 | | | OFG Bancorp., (2) | | | 32,143 | |
| | |
| | 8,447 | | | Old National Bancorp., (2) | | | 118,258 | |
| | |
| | 2,179 | | | Old Second Bancorp, Inc. | | | 14,599 | |
| | |
| | 770 | | | Opus Bank | | | 28,682 | |
| | |
| | 1,490 | | | Pacific Continental Corporation | | | 21,367 | |
| | |
| | 1,335 | | | Pacific Premier Bancorp, Inc., (3) | | | 28,502 | |
| | |
| | 959 | | | Park National Corporation, (2) | | | 87,000 | |
| | |
| | 3,464 | | | Park Sterling Bank Inc. | | | 25,114 | |
| | |
| | 937 | | | Peapack Gladstone Financial Corporation | | | 21,186 | |
| | |
| | 401 | | | Penns Woods Bancorp, Inc. | | | 17,865 | |
| | |
| | 900 | | | Peoples Bancorp, Inc. | | | 17,244 | |
| | |
| | 586 | | | Peoples Financial Services Corporation, (2) | | | 23,862 | |
| | |
| | 2,654 | | | Pinnacle Financial Partners, Inc. | | | 139,653 | |
| | |
| | 910 | | | Preferred Bank Los Angeles | | | 30,130 | |
| | |
| | 5,815 | | | Privatebancorp, Inc. | | | 243,241 | |
| | |
| | 5,024 | | | Prosperity Bancshares, Inc., (2) | | | 258,133 | |
Nuveen Small Cap Index Fund (continued)
| | |
| Portfolio of Investments | | October 31, 2015 |
| | | | | | | | |
| Shares | | | Description (1) | | Value | |
| | |
| | | | Banks (continued) | | | |
| | |
| | 863 | | | QCR Holdings, Inc. | | $ | 19,659 | |
| | |
| | 2,972 | | | Renasant Corporation, (2) | | | 102,920 | |
| | |
| | 807 | | | Republic Bancorp, Inc. | | | 20,522 | |
| | |
| | 2,304 | | | S&T Bancorp, Inc. | | | 73,452 | |
| | |
| | 1,824 | | | Sandy Spring Bancorp, Inc. | | | 50,160 | |
| | |
| | 1,222 | | | Seacoast Banking Corporation of Florida, (3) | | | 18,923 | |
| | |
| | 1,648 | | | ServisFirst Bancshares Inc. | | | 69,842 | |
| | |
| | 1,014 | | | Sierra Bancorp. | | | 16,437 | |
| | |
| | 2,207 | | | Simmons First National Corporation | | | 113,749 | |
| | |
| | 1,788 | | | South State Corporation | | | 138,570 | |
| | |
| | 1,946 | | | Southside Bancshares, Inc. | | | 52,347 | |
| | |
| | 1,534 | | | Southwest Bancorp, Inc. | | | 25,940 | |
| | |
| | 2,492 | | | State Bank Financial Corporation | | | 53,329 | |
| | |
| | 8,676 | | | Sterling Bancorp. | | | 133,524 | |
| | |
| | 772 | | | Stonegate Bank | | | 24,094 | |
| | |
| | 963 | | | Suffolk Bancorp. | | | 28,784 | |
| | |
| | 674 | | | Sun Bancorp, Inc., (3) | | | 13,487 | |
| | |
| | 1,204 | | | SY Bancorp, Inc. | | | 45,367 | |
| | |
| | 4,041 | | | Talmer Bancorp Inc., Class A | | | 67,970 | |
| | |
| | 3,340 | | | Texas Capital BancShares, Inc., (3) | | | 184,368 | |
| | |
| | 1,204 | | | Tompkins Financial Corporation | | | 65,353 | |
| | |
| | 3,434 | | | Towne Bank | | | 73,694 | |
| | |
| | 1,334 | | | Trico Bancshares | | | 35,164 | |
| | |
| | 1,712 | | | Tristate Capital Holdings Inc., (3) | | | 21,383 | |
| | |
| | 1,099 | | | Triumph Bancorp Inc., (3) | | | 18,342 | |
| | |
| | 4,996 | | | Trustmark Corporation, (2) | | | 120,054 | |
| | |
| | 2,926 | | | UMB Financial Corporation | | | 143,608 | |
| | |
| | 16,313 | | | Umpqua Holdings Corporation, (2) | | | 272,427 | |
| | |
| | 3,336 | | | Union Bankshares Corporation | | | 83,567 | |
| | |
| | 5,136 | | | United Bankshares, Inc., (2) | | | 203,129 | |
| | |
| | 3,858 | | | United Community Banks, Inc. | | | 77,777 | |
| | |
| | 1,259 | | | Univest Corporation of Pennsylvania | | | 24,790 | |
| | |
| | 17,586 | | | Valley National Bancorp., (2) | | | 184,653 | |
| | |
| | 1,206 | | | Washington Trust Bancorp, Inc. | | | 46,793 | |
| | |
| | 6,714 | | | Webster Financial Corporation, (2) | | | 249,089 | |
| | |
| | 2,574 | | | WesBanco, Inc. | | | 84,041 | |
| | |
| | 1,206 | | | West Bancorp, Inc. | | | 23,831 | |
| | |
| | 1,889 | | | Westamerica Bancorp., (2) | | | 83,513 | |
| | |
| | 6,457 | | | Western Alliance Bancorporation, (3) | | | 230,838 | |
| | | | | | | | |
| Shares | | | Description (1) | | Value | |
| | |
| | | | Banks (continued) | | | |
| | |
| | 5,160 | | | Wilshire Bancorp, Inc. | | $ | 55,160 | |
| | |
| | 3,507 | | | Wintrust Financial Corporation | | | 177,068 | |
| | |
| | 1,513 | | | Yadkin Financial Inc. | | | 35,631 | |
| | | | Total Banks | | | 11,561,152 | |
| | |
| | | | Beverages – 0.2% | | | |
| | |
| | 646 | | | Boston Beer Company, (2), (3) | | | 141,855 | |
| | |
| | 4,925 | | | Castle Brands, Inc., (2), (3) | | | 6,403 | |
| | |
| | 362 | | | Coca-Cola Bottling Company Consolidated, (2) | | | 76,458 | |
| | |
| | 852 | | | Craft Brewers Alliance Inc., (3) | | | 6,526 | |
| | |
| | 792 | | | MGI Ingredients, Inc. | | | 13,725 | |
| | |
| | 945 | | | National Beverage Corporation, (3) | | | 35,570 | |
| | | | Total Beverages | | | 280,537 | |
| | |
| | | | Biotechnology – 5.8% | | | |
| | |
| | 765 | | | Abeona Therapeutics Inc., (3) | | | 3,022 | |
| | |
| | 5,895 | | | Acadia Pharmaceuticals, Inc., (2), (3) | | | 205,264 | |
| | |
| | 1,605 | | | Acceleron Pharma Inc., (3) | | | 50,092 | |
| | |
| | 8,678 | | | Achillion Pharmaceuticals, Inc., (2), (3) | | | 67,862 | |
| | |
| | 3,165 | | | Acorda Therapeutics, Inc., (2), (3) | | | 114,067 | |
| | |
| | 768 | | | Adamas Pharmaceuticals Inc., (3) | | | 11,336 | |
| | |
| | 617 | | | Aduro Biotech, Inc., (2), (3) | | | 16,665 | |
| | |
| | 2,242 | | | Advaxis Inc., (2), (3) | | | 24,864 | |
| | |
| | 1,855 | | | Aegerion Pharmaceuticals Inc., (2), (3) | | | 27,231 | |
| | |
| | 1,131 | | | Affimed NV, (3) | | | 7,171 | |
| | |
| | 5,651 | | | Agenus Inc., (3) | | | 25,769 | |
| | |
| | 820 | | | Aimmune Therapeutics Inc., (3) | | | 12,341 | |
| | |
| | 1,803 | | | Akebia Therapeutics Inc., (3) | | | 16,083 | |
| | |
| | 1,727 | | | Alder Biopharmaceuticals Inc., (3) | | | 55,229 | |
| | |
| | 2,550 | | | AMAG Pharmaceuticals Inc., (2), (3) | | | 102,000 | |
| | |
| | 8,566 | | | Amicus Therapeutics, Inc., (3) | | | 64,245 | |
| | |
| | 3,032 | | | Anacor Pharmaceuticals Inc., (3) | | | 340,827 | |
| | |
| | 2,931 | | | Anthera Pharmaceuticals Inc., (3) | | | 16,912 | |
| | |
| | 650 | | | Applied Genetic Technologies Corporation, (3) | | | 7,800 | |
| | |
| | 1,228 | | | Ardelyx, Inc., (3) | | | 20,115 | |
| | |
| | 17,902 | | | Arena Pharmaceuticals, Inc., (2), (3) | | | 33,835 | |
| | |
| | 12,383 | | | Ariad Pharmaceuticals, Inc., (2), (3) | | | 84,700 | |
| | |
| | 10,434 | | | Array Biopharma, Inc., (2), (3) | | | 53,422 | |
| | |
| | 4,234 | | | Arrowhead Research Corporation, (2), (3) | | | 21,805 | |
| | |
| | 772 | | | Asterias Biotherapeutics, Inc., (3) | | | 3,536 | |
| | |
| | 1,245 | | | Atara Biotherapeutics Inc., (2), (3) | | | 32,084 | |
Nuveen Small Cap Index Fund (continued)
| | |
| Portfolio of Investments | | October 31, 2015 |
| | | | | | | | |
| Shares | | | Description (1) | | Value | |
| | |
| | | | Biotechnology (continued) | | | |
| | |
| | 446 | | | aTyr Pharma, Inc., (3) | | $ | 5,557 | |
| | |
| | 1,445 | | | Avalanche Biotechnologies Inc., (3) | | | 12,181 | |
| | |
| | 1,044 | | | Axovant Sciences Limited, (2), (3) | | | 12,726 | |
| | |
| | 652 | | | Bellicum Pharmaceuticals, Inc., (3) | | | 8,157 | |
| | |
| | 5,434 | | | BioCryst Pharmaceuticals, Inc., (2), (3) | | | 48,852 | |
| | |
| | 364 | | | BioSpecifics Technologies Corporation, (3) | | | 21,261 | |
| | |
| | 4,198 | | | BioTime Inc., (2), (3) | | | 15,826 | |
| | |
| | 692 | | | Blueprint Medicines Corporation, (3) | | | 13,902 | |
| | |
| | 619 | | | Calithera Biosciences, Inc., (2), (3) | | | 5,286 | |
| | |
| | 1,468 | | | Cara Therapeutics Inc., (3) | | | 20,802 | |
| | |
| | 332 | | | Catabasis Pharmaceuticals Inc., (3) | | | 2,317 | |
| | |
| | 5,572 | | | Catalyst Pharmaceutical Partners, Inc., (3) | | | 17,608 | |
| | |
| | 7,283 | | | Celldex Therapeutics, Inc., (2), (3) | | | 87,833 | |
| | |
| | 728 | | | Cellular Biomedicine Group, Inc., (3) | | | 15,288 | |
| | |
| | 5,310 | | | Cepheid, Inc., (2), (3) | | | 177,354 | |
| | |
| | 2,049 | | | ChemoCentryx Inc., (2), (3) | | | 14,323 | |
| | |
| | 541 | | | Chiasma Inc., (2), (3) | | | 12,302 | |
| | |
| | 3,374 | | | Chimerix Inc., (3) | | | 132,193 | |
| | |
| | 356 | | | Cidara Therapeutics, Inc., (2), (3) | | | 4,849 | |
| | |
| | 2,056 | | | Clovis Oncology Inc., (2), (3) | | | 205,415 | |
| | |
| | 1,744 | | | Coherus Biosciences Inc., (3) | | | 48,570 | |
| | |
| | 1,137 | | | Concert Pharmaceuticals Inc., (3) | | | 25,821 | |
| | |
| | 2,297 | | | CorMedix Inc., (2), (3) | | | 5,834 | |
| | |
| | 11,611 | | | CTI BioPharma Corp., (2), (3) | | | 15,443 | |
| | |
| | 8,227 | | | Curis, Inc., (3) | | | 16,783 | |
| | |
| | 2,720 | | | Cytokinetics, Inc., (3) | | | 23,419 | |
| | |
| | 4,884 | | | CytRx Corporation, (2), (3) | | | 13,578 | |
| | |
| | 1,117 | | | Dicerna Pharmaceuticals Inc., (3) | | | 11,192 | |
| | |
| | 10,774 | | | Dyax Corporation, (3) | | | 296,608 | |
| | |
| | 2,710 | | | Dynavax Technologies Corporation, (3) | | | 61,544 | |
| | |
| | 634 | | | Eagle Pharmaceuticals Inc., (2), (3) | | | 40,392 | |
| | |
| | 2,287 | | | Emergent BioSolutions, Inc., (3) | | | 73,527 | |
| | |
| | 1,184 | | | Enanta Pharmaceuticals Inc., (2), (3) | | | 33,259 | |
| | |
| | 2,148 | | | Epizyme Inc., (2), (3) | | | 28,117 | |
| | |
| | 970 | | | Esperion Therapeutics Inc., (2), (3) | | | 23,280 | |
| | |
| | 7,089 | | | EXACT Sciences Corporation, (2), (3) | | | 59,051 | |
| | |
| | 16,662 | | | Exelixis, Inc., (2), (3) | | | 100,305 | |
| | |
| | 1,817 | | | Fibrocell Science Inc., (3) | | | 6,941 | |
| | |
| | 3,540 | | | FibroGen, Inc., (3) | | | 82,517 | |
| | | | | | | | |
| Shares | | | Description (1) | | Value | |
| | |
| | | | Biotechnology (continued) | | | |
| | |
| | 1,574 | | | Five Prime Therapeutics Inc., (2), (3) | | $ | 50,604 | |
| | |
| | 1,028 | | | Flexion Therapeutics Inc., (2), (3) | | | 16,941 | |
| | |
| | 881 | | | Foundation Medicine Inc., (2), (3) | | | 19,752 | |
| | |
| | 11,572 | | | Galena Biopharma Inc., (2), (3) | | | 19,441 | |
| | |
| | 1,595 | | | Genocea Biosciences Inc., (3) | | | 7,640 | |
| | |
| | 1,295 | | | Genomic Health, Inc., (3) | | | 27,091 | |
| | |
| | 11,692 | | | Geron Corporation, (2), (3) | | | 40,571 | |
| | |
| | 508 | | | Global Blood Therapeutics Inc., (3) | | | 23,688 | |
| | |
| | 7,845 | | | Halozyme Therapeutics, Inc., (2), (3) | | | 122,774 | |
| | |
| | 2,161 | | | Heron Therapeutics Inc., (2), (3) | | | 59,255 | |
| | |
| | 6,317 | | | Idera Pharmaceuticals, Inc., (2), (3) | | | 17,435 | |
| | |
| | 1,586 | | | Ignyta, Inc., (3) | | | 16,241 | |
| | |
| | 837 | | | Immune Design Corporation, (3) | | | 10,881 | |
| | |
| | 6,375 | | | Immunogen, Inc., (3) | | | 74,587 | |
| | |
| | 6,413 | | | Immunomedics, Inc., (2), (3) | | | 19,175 | |
| | |
| | 3,765 | | | Infinity Pharmaceuticals, Inc., (3) | | | 38,968 | |
| | |
| | 5,312 | | | Inovio Pharmaceuticals Inc., (2), (3) | | | 33,625 | |
| | |
| | 4,549 | | | Insmed Incorporated, (3) | | | 90,252 | |
| | |
| | 1,740 | | | Insys Therapeutics Inc., (2), (3) | | | 44,822 | |
| | |
| | 564 | | | Invitae Corporation, (2), (3) | | | 4,298 | |
| | |
| | 9,268 | | | Ironwood Pharmaceuticals Inc., (2), (3) | | | 105,284 | |
| | |
| | 1,708 | | | Karyopharm Therapeutics Inc., (2), (3) | | | 22,802 | |
| | |
| | 7,809 | | | Keryx Biopharmaceuticals, Inc., (2), (3) | | | 34,984 | |
| | |
| | 2,133 | | | Kite Pharma Inc., (2), (3) | | | 145,151 | |
| | |
| | 1,016 | | | La Jolla Pharmaceutical Company, (3) | | | 25,390 | |
| | |
| | 3,066 | | | Lexicon Genetics, Inc., (2), (3) | | | 29,158 | |
| | |
| | 1,297 | | | Ligand Pharmaceuticals, Inc., (2), (3) | | | 117,184 | |
| | |
| | 3,331 | | | Lion Biotechnologies Inc., (3) | | | 21,552 | |
| | |
| | 575 | | | Loxo Oncology Inc., (3) | | | 13,443 | |
| | |
| | 2,327 | | | MacroGenics Inc., (3) | | | 72,300 | |
| | |
| | 17,687 | | | MannKind Corporation, (2), (3) | | | 58,544 | |
| | |
| | 1,643 | | | Medgenics Inc., (3) | | | 10,762 | |
| | |
| | 8,092 | | | Merrimack Pharmaceuticals, Incorporated, (2), (3) | | | 75,579 | |
| | |
| | 8,035 | | | MiMedx Group Inc., (2), (3) | | | 58,495 | |
| | |
| | 847 | | | Mirati Therapeutics, Inc., (3) | | | 29,967 | |
| | |
| | 4,519 | | | Momenta Pharmaceuticals, Inc., (2), (3) | | | 74,157 | |
| | |
| | 5,136 | | | Myriad Genetics Inc., (2), (3) | | | 207,340 | |
| | |
| | 490 | | | NantikWest Inc., (3) | | | 5,831 | |
| | |
| | 737 | | | Natera, Inc., (3) | | | 6,080 | |
Nuveen Small Cap Index Fund (continued)
| | |
| Portfolio of Investments | | October 31, 2015 |
| | | | | | | | |
| Shares | | | Description (1) | | Value | |
| | |
| | | | Biotechnology (continued) | | | |
| | |
| | 11,127 | | | Navidea Biopharmaceuticals Incorporated, (2), (3) | | $ | 22,477 | |
| | |
| | 6,317 | | | Neurocrine Biosciences Inc., (2), (3) | | | 310,102 | |
| | |
| | 1,539 | | | NewLink Genetics Corporation, (2), (3) | | | 58,898 | |
| | |
| | 370 | | | Nivalis Therapeutics Inc., (3) | | | 2,967 | |
| | |
| | 3,382 | | | Northwest Biotherapeutics, Inc., (2), (3) | | | 16,504 | |
| | |
| | 19,824 | | | Novavax, Inc., (2), (3) | | | 133,812 | |
| | |
| | 3,096 | | | Ocata Therapeutics Inc., (2), (3) | | | 13,622 | |
| | |
| | 1,250 | | | Oncomed Pharmaceuticals Inc., (2), (3) | | | 25,013 | |
| | |
| | 7,015 | | | Oncothyreon Inc., (3) | | | 20,764 | |
| | |
| | 1,752 | | | Ophthotech Corporation, (3) | | | 87,477 | |
| | |
| | 7,569 | | | Orexigen Therapeutics Inc., (2), (3) | | | 23,010 | |
| | |
| | 6,711 | | | Organovo Holdings Inc., (2), (3) | | | 20,200 | |
| | |
| | 1,382 | | | Osiris Therapeutics, Inc., (2), (3) | | | 23,535 | |
| | |
| | 1,092 | | | Otonomy, Inc., (2), (3) | | | 23,631 | |
| | |
| | 1,735 | | | OvaScience Inc., (2), (3) | | | 22,503 | |
| | |
| | 12,455 | | | PDL Biopahrma Inc., (2) | | | 57,044 | |
| | |
| | 13,687 | | | Peregrine Pharmaceuticals, Inc., Reg S, (3) | | | 15,329 | |
| | |
| | 1,206 | | | Pfenex Inc., (3) | | | 21,804 | |
| | |
| | 3,417 | | | Portola Pharmaceuticals Inc., (3) | | | 162,683 | |
| | |
| | 5,394 | | | Progenics Pharmaceuticals, Inc., (2), (3) | | | 39,592 | |
| | |
| | 570 | | | Proteon Therapeutics, Inc., (3) | | | 7,809 | |
| | |
| | 2,314 | | | Prothena Corporation PLC, (2), (3) | | | 119,194 | |
| | |
| | 2,503 | | | PTC Therapeutics Inc., (2), (3) | | | 62,250 | |
| | |
| | 2,441 | | | Radius Health Inc., (2), (3) | | | 156,785 | |
| | |
| | 5,952 | | | Raptor Pharmaceuticals Corporation, (3) | | | 32,438 | |
| | |
| | 2,092 | | | Regulus Therapeutics Incorporated, (2), (3) | | | 13,912 | |
| | |
| | 2,430 | | | Repligen Corporation, (3) | | | 80,773 | |
| | |
| | 2,586 | | | Retrophin Inc., (2), (3) | | | 49,470 | |
| | |
| | 6,789 | | | Rigel Pharmaceuticals, Inc., (3) | | | 17,244 | |
| | |
| | 1,019 | | | Sage Therapeutics, Inc., (2), (3) | | | 51,184 | |
| | |
| | 5,271 | | | Sangamo Biosciences, Inc., (3) | | | 37,161 | |
| | |
| | 3,311 | | | Sarepta Therapeutics Inc., (2), (3) | | | 79,663 | |
| | |
| | 633 | | | Seres Therapeutics Inc., (2), (3) | | | 18,762 | |
| | |
| | 2,099 | | | Sorrento Therapeutics, Inc., (3) | | | 18,135 | |
| | |
| | 621 | | | Spark Therapeutics, Inc., (2), (3) | | | 33,472 | |
| | |
| | 5,086 | | | Spectrum Pharmaceuticals, Inc., (3) | | | 26,498 | |
| | |
| | 1,150 | | | Stemline Therapeutics Inc., (3) | | | 10,224 | |
| | |
| | 7,400 | | | Synergy Pharmaceuticals Inc., (2), (3) | | | 47,434 | |
| | |
| | 6,121 | | | Synta Pharmaceuticals Corporation, (3) | | | 4,101 | |
| | | | | | | | |
| Shares | | | Description (1) | | Value | |
| | |
| | | | Biotechnology (continued) | | | |
| | |
| | 672 | | | T2 Biosystems, Inc., (3) | | $ | 7,473 | |
| | |
| | 1,720 | | | Tesaro Inc., (2), (3) | | | 78,208 | |
| | |
| | 2,614 | | | TG Therapeutics Inc., (2), (3) | | | 32,335 | |
| | |
| | 4,725 | | | Threshold Pharmaceuticals, Inc., (3) | | | 18,002 | |
| | |
| | 138 | | | Tobira Therapeutics Inc., (2), (3) | | | 1,391 | |
| | |
| | 701 | | | Tokai Pharmaceuticals, Inc., (2), (3) | | | 7,746 | |
| | |
| | 2,347 | | | Trevena Inc., (3) | | | 22,578 | |
| | |
| | 2,188 | | | Trovagene, Inc., (2), (3) | | | 9,430 | |
| | |
| | 2,842 | | | Ultragenyx Pharmaceutical Inc., (2), (3) | | | 282,353 | |
| | |
| | 3,092 | | | Vanda Pharmaceuticals, Inc., (2), (3) | | | 33,208 | |
| | |
| | 2,180 | | | Verastem Inc., (3) | | | 4,011 | |
| | |
| | 1,663 | | | Versartis Inc., (3) | | | 17,179 | |
| | |
| | 981 | | | Vitae Pharmaceuticals, Inc., (3) | | | 11,654 | |
| | |
| | 1,241 | | | Vital Therapies Inc., (2), (3) | | | 9,643 | |
| | |
| | 454 | | | vTv Therapeutics Inc., Class A Shares, (3) | | | 3,332 | |
| | |
| | 298 | | | XBiotech Inc., (2), (3) | | | 4,226 | |
| | |
| | 2,103 | | | Xencor Inc., (3) | | | 22,775 | |
| | |
| | 7,014 | | | XOMA Limited, (2), (3) | | | 8,557 | |
| | |
| | 1,219 | | | Zafgen Inc., (2), (3) | | | 11,739 | |
| | |
| | 8,483 | | | ZIOPHARM Oncology, Inc., (2), (3) | | | 96,621 | |
| | | | Total Biotechnology | | | 7,720,471 | |
| | |
| | | | Building Products – 0.9% | | | |
| | |
| | 3,028 | | | Aaon, Inc. | | | 61,983 | |
| | |
| | 2,488 | | | Advanced Drainage Systems, Inc., (2) | | | 78,173 | |
| | |
| | 949 | | | American Woodmark Company | | | 68,992 | |
| | |
| | 2,160 | | | Apogee Enterprises, Inc. | | | 106,985 | |
| | |
| | 3,748 | | | Builders FirstSource, Inc., (3) | | | 44,301 | |
| | |
| | 2,328 | | | Continental Building Products Inc., (3) | | | 40,903 | |
| | |
| | 2,392 | | | Gibraltar Industries Inc. | | | 60,565 | |
| | |
| | 2,530 | | | Griffon Corporation, (2) | | | 43,465 | |
| | |
| | 1,416 | | | Insteel Industries, Inc. | | | 30,288 | |
| | |
| | 2,233 | | | Masonite International Corporation, (2), (3) | | | 133,690 | |
| | |
| | 2,006 | | | NCI Building Systems Inc., (3) | | | 20,983 | |
| | |
| | 708 | | | Nortek Inc., (3) | | | 43,436 | |
| | |
| | 948 | | | Patrick Industries, Inc., (3) | | | 38,470 | |
| | |
| | 3,664 | | | PGT, Inc., (3) | | | 44,188 | |
| | |
| | 1,722 | | | Ply Gem Holdings Inc., (3) | | | 20,354 | |
| | |
| | 2,506 | | | Quanex Building Products Corporation, (2) | | | 47,288 | |
| | |
| | 3,205 | | | Simpson Manufacturing Company Inc., (2) | | | 121,726 | |
Nuveen Small Cap Index Fund (continued)
| | |
| Portfolio of Investments | | October 31, 2015 |
| | | | | | | | |
| Shares | | | Description (1) | | Value | |
| | |
| | | | Building Products (continued) | | | |
| | |
| | 2,373 | | | Trex Company Inc., (3) | | $ | 92,713 | |
| | |
| | 1,554 | | | Universal Forest Products Inc. | | | 112,867 | |
| | | | Total Building Products | | | 1,211,370 | |
| | |
| | | | Capital Markets – 1.3% | | | |
| | |
| | 1,579 | | | Arlington Asset Investment Corporation | | | 21,869 | |
| | |
| | 64 | | | Ashford Inc., (3) | | | 4,112 | |
| | |
| | 13,514 | | | BGC Partners Inc., Class A | | | 116,896 | |
| | |
| | 1,324 | | | Calamos Asset Management, Inc. Class A | | | 12,432 | |
| | |
| | 781 | | | CIFC Corporation | | | 5,405 | |
| | |
| | 1,503 | | | Cohen & Steers Inc. | | | 45,977 | |
| | |
| | 8,240 | | | Cowen Group, Inc., Class A, (2), (3) | | | 34,690 | |
| | |
| | 235 | | | Diamond Hill Investment Group, Inc. | | | 47,012 | |
| | |
| | 2,566 | | | Evercore Partners Inc. | | | 138,564 | |
| | |
| | 3,836 | | | Financial Engines Inc., (2) | | | 123,366 | |
| | |
| | 503 | | | GAMCO Investors Inc. | | | 29,013 | |
| | |
| | 2,193 | | | Greenhill & Co Inc., (2) | | | 56,623 | |
| | |
| | 2,799 | | | HFF Inc., Class A Shares, (3) | | | 96,621 | |
| | |
| | 891 | | | Houlihan Lokey Inc. | | | 19,522 | |
| | |
| | 1,112 | | | INTL FCStone Inc., (3) | | | 35,573 | |
| | |
| | 2,532 | | | Investment Technology Group | | | 40,537 | |
| | |
| | 10,860 | | | Janus Capital Group Inc., (2) | | | 168,656 | |
| | |
| | 2,481 | | | KCG Holdings Inc., Class A Shares, (3) | | | 30,988 | |
| | |
| | 7,739 | | | Ladenburg Thalmann Financial Services Inc., (2), (3) | | | 19,657 | |
| | |
| | 464 | | | Medley Management Inc., Class A Shares | | | 3,406 | |
| | |
| | 1,301 | | | Moelis & Company, (2) | | | 38,353 | |
| | |
| | 1,876 | | | OM Asset Management PLC | | | 28,478 | |
| | |
| | 826 | | | Oppenheimer Holdings Inc., Class A | | | 15,157 | |
| | |
| | 1,172 | | | Piper Jaffray Companies, (3) | | | 41,688 | |
| | |
| | 946 | | | Pzena Investments Management, Inc. | | | 9,015 | |
| | |
| | 3,642 | | | RCS Capital Corporation, (2) | | | 2,761 | |
| | |
| | 1,600 | | | Safeguard Scientifics Inc., (2), (3) | | | 28,400 | |
| | |
| | 5,020 | | | Stifel Financial Corporation, (3) | | | 223,039 | |
| | |
| | 1,406 | | | Virtu Financial, Inc., Class A Shares | | | 34,025 | |
| | |
| | 507 | | | Virtus Investment Partners Inc. | | | 59,339 | |
| | |
| | 582 | | | Westwood Holding Group Inc. | | | 33,814 | |
| | |
| | 8,439 | | | WisdomTree Investments Inc., (2) | | | 162,282 | |
| | | | Total Capital Markets | | | 1,727,270 | |
| | |
| | | | Chemicals – 1.8% | | | |
| | |
| | 2,167 | | | A Schulman, Inc. | | | 77,774 | |
| | | | | | | | |
| Shares | | | Description (1) | | Value | |
| | |
| | | | Chemicals (continued) | | | |
| | |
| | 2,230 | | | American Vanguard Corp., (2) | | $ | 29,904 | |
| | |
| | 5,195 | | | Axiall Corporation | | | 105,199 | |
| | |
| | 2,300 | | | Balchem Corporation, (2) | | | 157,090 | |
| | |
| | 3,899 | | | Calgon Carbon Corporation | | | 67,063 | |
| | |
| | 537 | | | Chase Corporation, Common Stock | | | 23,848 | |
| | |
| | 4,969 | | | Chemtura Corporation, (2), (3) | | | 158,710 | |
| | |
| | 567 | | | Core Molding Technologies, Inc., (3) | | | 11,363 | |
| | |
| | 5,399 | | | Ferro Corporation | | | 67,434 | |
| | |
| | 3,957 | | | Flotek Industries Inc., (2), (3) | | | 71,622 | |
| | |
| | 1,811 | | | FutureFuel Corporation | | | 27,908 | |
| | |
| | 3,730 | | | H.B. Fuller Company | | | 141,703 | |
| | |
| | 785 | | | Hawkins Inc. | | | 32,530 | |
| | |
| | 1,547 | | | Innophos Holdings, Inc. | | | 65,732 | |
| | |
| | 1,792 | | | Innospec, Inc. | | | 98,990 | |
| | |
| | 4,326 | | | Interpid Potash Inc., (3) | | | 16,698 | |
| | |
| | 682 | | | KMG Chemicals, Inc. | | | 14,349 | |
| | |
| | 1,587 | | | Koppers Holdings Inc. | | | 30,090 | |
| | |
| | 2,318 | | | Kraton Performance Polymers Inc., (3) | | | 47,264 | |
| | |
| | 1,690 | | | Kronos Worldwide Inc. | | | 13,351 | |
| | |
| | 1,500 | | | LSB Industries Inc., (2), (3) | | | 23,475 | |
| | |
| | 2,568 | | | Minerals Technologies Inc. | | | 151,358 | |
| | |
| | 12,087 | | | Olin Corporation | | | 231,829 | |
| | |
| | 3,465 | | | OMNOVA Solutions Inc., (3) | | | 24,879 | |
| | |
| | 6,596 | | | PolyOne Corporation | | | 220,570 | |
| | |
| | 1,025 | | | Quaker Chemical Corporation | | | 81,365 | |
| | |
| | 3,007 | | | Rayonier Advanced Materials Inc., (2) | | | 27,725 | |
| | |
| | 1,766 | | | Rentech, Inc., (3) | | | 10,331 | |
| | |
| | 3,298 | | | Senomyx, Inc., (2), (3) | | | 16,325 | |
| | |
| | 3,456 | | | Sensient Technologies Corporation | | | 225,573 | |
| | |
| | 1,426 | | | Stepan Company | | | 75,478 | |
| | |
| | 1,657 | | | Trecora Resources, (3) | | | 23,596 | |
| | |
| | 1,927 | | | Tredegar Corporation | | | 27,479 | |
| | |
| | 925 | | | Trinseo SA, (2), (3) | | | 30,016 | |
| | |
| | 4,766 | | | Tronox Limited, Class A, (2) | | | 29,597 | |
| | |
| | 1,413 | | | Valhi Inc., (2) | | | 3,490 | |
| | | | Total Chemicals | | | 2,461,708 | |
| | |
| | | | Commercial Services & Supplies – 2.1% | | | |
| | |
| | 4,142 | | | ABM Industries Inc. | | | 117,633 | |
| | |
| | 8,130 | | | Acco Brands Corporation, (3) | | | 65,609 | |
Nuveen Small Cap Index Fund (continued)
| | |
| Portfolio of Investments | | October 31, 2015 |
| | | | | | | | |
| Shares | | | Description (1) | | Value | |
| | |
| | | | Commercial Services & Supplies (continued) | | | |
| | |
| | 1,602 | | | American Ecology Corporation | | $ | 62,814 | |
| | |
| | 3,140 | | | ARC Document Solutions, (3) | | | 19,531 | |
| | |
| | 3,534 | | | Brady Corporation | | | 80,398 | |
| | |
| | 3,597 | | | Brinks Company | | | 111,435 | |
| | |
| | 3,219 | | | Casella Waste Systems, Inc., (3) | | | 19,539 | |
| | |
| | 1,467 | | | CECO Environmental Corporation | | | 13,086 | |
| | |
| | 7,937 | | | Civeo Corporation, (3) | | | 14,763 | |
| | |
| | 3,693 | | | Deluxe Corporation | | | 219,918 | |
| | |
| | 2,028 | | | Ennis Inc. | | | 40,621 | |
| | |
| | 2,834 | | | Essendant Inc. | | | 97,971 | |
| | |
| | 1,479 | | | G&K Services, Inc. | | | 97,348 | |
| | |
| | 5,288 | | | Healthcare Services Group, Inc., (2) | | | 197,031 | |
| | |
| | 825 | | | Heritage-Crystal Clean, Inc., (3) | | | 9,834 | |
| | |
| | 3,291 | | | HNI Corporation, (2) | | | 141,316 | |
| | |
| | 2,829 | | | Innerworkings, Inc., (3) | | | 21,161 | |
| | |
| | 4,944 | | | Interface, Inc. | | | 96,655 | |
| | |
| | 2,703 | | | Kimball International Inc., Class B | | | 29,517 | |
| | |
| | 3,610 | | | Knoll Inc. | | | 83,896 | |
| | |
| | 2,313 | | | Matthews International Corporation | | | 133,529 | |
| | |
| | 2,007 | | | McGrath Rentcorp. | | | 60,310 | |
| | |
| | 4,413 | | | Miller (Herman) Inc. | | | 140,024 | |
| | |
| | 3,389 | | | Mobile Mini, Inc. | | | 116,039 | |
| | |
| | 2,167 | | | MSA Safety Inc. | | | 94,221 | |
| | |
| | 963 | | | Multi Color Corporation | | | 74,960 | |
| | |
| | 562 | | | NL Industries Inc. | | | 1,961 | |
| | |
| | 2,230 | | | Quad Graphics Inc. | | | 28,767 | |
| | |
| | 1,193 | | | SP Plus Corporation, (3) | | | 30,421 | |
| | |
| | 6,160 | | | Steelcase Inc. | | | 119,566 | |
| | |
| | 1,585 | | | Team, Inc., (3) | | | 55,475 | |
| | |
| | 4,456 | | | Tetra Tech, Inc. | | | 119,866 | |
| | |
| | 1,264 | | | TRC Companies, (3) | | | 13,057 | |
| | |
| | 1,099 | | | UniFirst Corporation | | | 115,472 | |
| | |
| | 1,586 | | | Viad Corporation | | | 47,754 | |
| | |
| | 3,860 | | | West Corporation | | | 91,907 | |
| | | | Total Commercial Services & Supplies | | | 2,783,405 | |
| | |
| | | | Communications Equipment – 1.6% | | | |
| | |
| | 3,943 | | | ADTRAN, Inc. | | | 61,235 | |
| | |
| | 1,726 | | | Aerohive Networks Inc., (2), (3) | | | 11,633 | |
| | |
| | 960 | | | Alliance Fiber | | | 13,066 | |
| | | | | | | | |
| Shares | | | Description (1) | | Value | |
| | |
| | | | Communications Equipment (continued) | | | |
| | |
| | 1,146 | | | Applied Optoelectronics Inc., (3) | | $ | 23,631 | |
| | |
| | 822 | | | Bel Fuse, Inc., Class B | | | 14,821 | |
| | |
| | 1,136 | | | Black Box Corporation | | | 13,871 | |
| | |
| | 2,680 | | | CalAmp Corporation, (3) | | | 50,813 | |
| | |
| | 3,217 | | | Calix Inc., (3) | | | 22,487 | |
| | |
| | 9,146 | | | Ciena Corporation, (2), (3) | | | 220,784 | |
| | |
| | 885 | | | Clearfield Inc., (2), (3) | | | 12,417 | |
| | |
| | 1,189 | | | Comtech Telecom Corporation | | | 28,726 | |
| | |
| | 2,155 | | | Digi International, Inc., (3) | | | 27,800 | |
| | |
| | 1,445 | | | EMCORE Corporation, (3) | | | 9,884 | |
| | |
| | 7,484 | | | Extreme Networks Inc., (3) | | | 26,868 | |
| | |
| | 7,686 | | | Finisar Corporation, (3) | | | 87,390 | |
| | |
| | 6,548 | | | Harmonic Inc., (3) | | | 37,716 | |
| | |
| | 9,837 | | | Infinera Corporation, (2), (3) | | | 194,379 | |
| | |
| | 2,668 | | | Interdigital Inc., (2) | | | 135,374 | |
| | |
| | 4,467 | | | IXIA, (3) | | | 64,369 | |
| | |
| | 1,292 | | | KVH Industries, Inc., (3) | | | 12,662 | |
| | |
| | 2,564 | | | Netgear, Inc., (3) | | | 106,150 | |
| | |
| | 6,791 | | | NetScout Systems, Inc., (3) | | | 243,593 | |
| | |
| | 2,787 | | | Novatel Wireless, (2), (3) | | | 5,992 | |
| | |
| | 7,552 | | | Oclaro Inc., (3) | | | 22,127 | |
| | |
| | 2,896 | | | Plantronics Inc. | | | 155,284 | |
| | |
| | 9,989 | | | Polycom Inc., (3) | | | 137,648 | |
| | |
| | 5,569 | | | Ruckus Wireless Incorporated, (3) | | | 62,818 | |
| | |
| | 4,906 | | | ShoreTel, Inc., (3) | | | 46,313 | |
| | |
| | 3,650 | | | Sonus Networks, Inc., (3) | | | 24,127 | |
| | |
| | 2,305 | | | Ubiquiti Networks Inc., (2) | | | 67,260 | |
| | |
| | 3,159 | | | ViaSat, Inc., (3) | | | 208,368 | |
| | | | Total Communications Equipment | | | 2,149,606 | |
| | |
| | | | Construction & Engineering – 0.7% | | | |
| | |
| | 2,713 | | | Aegion Corporation, (3) | | | 52,334 | |
| | |
| | 1,630 | | | Ameresco Inc., Class A Shares, (3) | | | 10,562 | |
| | |
| | 1,010 | | | Argan, Inc. | | | 37,320 | |
| | |
| | 2,759 | | | Comfort Systems USA Inc. | | | 88,095 | |
| | |
| | 2,521 | | | Dycom Industries Inc., (3) | | | 191,823 | |
| | |
| | 4,636 | | | Emcor Group Inc. | | | 223,826 | |
| | |
| | 2,917 | | | Furmanite Corporation, (3) | | | 20,273 | |
| | |
| | 2,911 | | | Granite Construction Inc. | | | 95,597 | |
| | |
| | 4,640 | | | Great Lakes Dredge & Dock Corporation | | | 18,560 | |
Nuveen Small Cap Index Fund (continued)
| | |
| Portfolio of Investments | | October 31, 2015 |
| | | | | | | | |
| Shares | | | Description (1) | | Value | |
| | |
| | | | Construction & Engineering (continued) | | | |
| | |
| | 1,458 | | | HC2 Holdings, Inc., (2), (3) | | $ | 11,022 | |
| | |
| | 4,938 | | | MasTec Inc., (3) | | | 82,810 | |
| | |
| | 1,547 | | | MYR Group Inc., (3) | | | 34,807 | |
| | |
| | 737 | | | Northwest Pipe Company, (3) | | | 9,736 | |
| | |
| | 378 | | | NV5 Holdings Inc., (3) | | | 8,800 | |
| | |
| | 2,127 | | | Orion Marine Group Inc., (3) | | | 8,317 | |
| | |
| | 2,941 | | | Primoris Services Corporation, (2) | | | 58,585 | |
| | |
| | 2,886 | | | Tutor Perini Corporation, (3) | | | 48,427 | |
| | | | Total Construction & Engineering | | | 1,000,894 | |
| | |
| | | | Construction Materials – 0.2% | | | |
| | |
| | 5,454 | | | Headwater Inc., (3) | | | 112,080 | |
| | |
| | 1,890 | | | Summit Materials, Inc., Class A Shares, (3) | | | 39,803 | |
| | |
| | 162 | | | United States Lime & Minerals, Inc. | | | 7,914 | |
| | |
| | 1,101 | | | US Concrete, Inc., (2), (3) | | | 61,061 | |
| | | | Total Construction Materials | | | 220,858 | |
| | |
| | | | Consumer Finance – 0.5% | | | |
| | |
| | 2,032 | | | Cash America International, Inc., (2) | | | 70,165 | |
| | |
| | 1,926 | | | Encore Capital Group, Inc., (2), (3) | | | 78,388 | |
| | |
| | 1,996 | | | Enova International, Inc., (3) | | | 25,948 | |
| | |
| | 3,821 | | | EZCORP, Inc., (2), (3) | | | 25,448 | |
| | |
| | 2,086 | | | First Cash Financial Services, Inc., (3) | | | 79,581 | |
| | |
| | 3,395 | | | Green Dot Corporation, Class A Shares, (3) | | | 62,943 | |
| | |
| | 932 | | | JG Wentworth Company, (3) | | | 4,772 | |
| | |
| | 1,615 | | | Nelnet Inc. | | | 57,785 | |
| | |
| | 3,574 | | | PRA Group Inc., (2), (3) | | | 195,855 | |
| | |
| | 861 | | | Regional Management Corporation, (3) | | | 14,043 | |
| | |
| | 557 | | | World Acceptance Corporation, (2), (3) | | | 21,238 | |
| | | | Total Consumer Finance | | | 636,166 | |
| | |
| | | | Containers & Packaging – 0.3% | | | |
| | |
| | 294 | | | AEP Industries, Inc., (3) | | | 23,520 | |
| | |
| | 8,831 | | | Berry Plastics Corporation, (3) | | | 295,839 | |
| | |
| | 2,278 | | | Greif Inc. | | | 74,673 | |
| | |
| | 1,804 | | | Myers Industries, Inc. | | | 28,160 | |
| | | | Total Containers & Packaging | | | 422,192 | |
| | |
| | | | Distributors – 0.3% | | | |
| | |
| | 1,557 | | | Audiovox Corporation, (3) | | | 8,034 | |
| | |
| | 1,709 | | | Core-Mark Holding Company, Inc. | | | 138,925 | |
| | |
| | 1,020 | | | Fenix Parts, Inc., (3) | | | 8,027 | |
| | |
| | 3,219 | | | Pool Corporation, (2) | | | 262,477 | |
| | | | | | | | |
| Shares | | | Description (1) | | Value | |
| | |
| | | | Distributors (continued) | | | |
| | |
| | 542 | | | Weyco Group, Inc. | | $ | 15,387 | |
| | | | Total Distributors | | | 432,850 | |
| | |
| | | | Diversified Consumer Services – 1.0% | | | |
| | |
| | 1,946 | | | 2U Inc., (2), (3) | | | 40,827 | |
| | |
| | 1,269 | | | American Public Education Inc., (3) | | | 27,575 | |
| | |
| | 6,977 | | | Apollo Group, Inc., (3) | | | 50,653 | |
| | |
| | 985 | | | Ascent Media Corporation, (3) | | | 21,453 | |
| | |
| | 1,225 | | | Bridgepoint Education Inc., (3) | | | 9,494 | |
| | |
| | 2,764 | | | Bright Horizons Family Solutions Inc., (2), (3) | | | 176,951 | |
| | |
| | 962 | | | Cambium Learning Group Inc., (3) | | | 4,627 | |
| | |
| | 848 | | | Capella Education Company | | | 38,287 | |
| | |
| | 5,010 | | | Career Education Corporation, (3) | | | 18,086 | |
| | |
| | 1,243 | | | Carriage Services Inc. | | | 26,737 | |
| | |
| | 5,712 | | | Chegg Inc., (2), (3) | | | 39,413 | |
| | |
| | 557 | | | Collectors Universe, Inc. | | | 9,631 | |
| | |
| | 4,713 | | | Devry Education Group Inc., (2) | | | 111,038 | |
| | |
| | 3,482 | | | Grand Canyon Education Inc., (2), (3) | | | 144,712 | |
| | |
| | 10,125 | | | Houghton Mifflin Harcourt Company, (3) | | | 198,349 | |
| | |
| | 2,498 | | | K12, Inc., (2), (3) | | | 24,256 | |
| | |
| | 295 | | | Liberty Tax Inc., Class A Shares | | | 6,812 | |
| | |
| | 6,979 | | | LifeLock, Incorporated, (2), (3) | | | 97,776 | |
| | |
| | 3,027 | | | Regis Corporation | | | 50,006 | |
| | |
| | 4,601 | | | Sothebys Holdings Inc., (2) | | | 159,425 | |
| | |
| | 949 | | | Steiner Leisure Limited, (3) | | | 60,129 | |
| | |
| | 811 | | | Strayer Education Inc. | | | 42,918 | |
| | |
| | 1,768 | | | Universal Technical Institute Inc. | | | 7,514 | |
| | |
| | 2,038 | | | Weight Watcher’s International Inc., (2) | | | 31,344 | |
| | | | Total Diversified Consumer Services | | | 1,398,013 | |
| | |
| | | | Diversified Financial Services – 0.3% | | | |
| | |
| | 5,918 | | | FNFV Group, (3) | | | 66,518 | |
| | |
| | 2,387 | | | Gain Capital Holdings Inc. | | | 17,783 | |
| | |
| | 2,761 | | | Marketaxess | | | 279,717 | |
| | |
| | 688 | | | Marlin Business Services Corporation | | | 12,150 | |
| | |
| | 1,787 | | | Newstar Financial, Inc., (3) | | | 18,853 | |
| | |
| | 890 | | | On Deck Capital, Inc., (2), (3) | | | 8,473 | |
| | |
| | 1,765 | | | PICO Holdings, Inc., (3) | | | 17,050 | |
| | |
| | 1,013 | | | Resource America Inc. | | | 7,790 | |
| | |
| | 2,215 | | | Tiptree Financial Inc., Class A | | | 14,996 | |
| | | | Total Diversified Financial Services | | | 443,330 | |
Nuveen Small Cap Index Fund (continued)
| | |
| Portfolio of Investments | | October 31, 2015 |
| | | | | | | | |
| Shares | | | Description (1) | | Value | |
| | |
| | | | Diversified Telecommunication Services – 0.7% | | | |
| | |
| | 6,519 | | | 8X8, Inc., (2), (3) | | $ | 69,493 | |
| | |
| | 728 | | | Atlantic Tele-Network, Inc. | | | 55,634 | |
| | |
| | 16,215 | | | Cincinnati Bell Inc., (3) | | | 61,131 | |
| | |
| | 3,406 | | | Cogent Communications Group, Inc. | | | 104,632 | |
| | |
| | 3,909 | | | Consolidated Communications Holdings, Inc. | | | 86,389 | |
| | |
| | 1,543 | | | FairPoint Communications Inc., (3) | | | 24,750 | |
| | |
| | 2,622 | | | General Communication, Inc., (3) | | | 53,397 | |
| | |
| | 35,215 | | | Globalstar, Inc., (2), (3) | | | 63,387 | |
| | |
| | 822 | | | Hawaiian Telcom Holdco Inc., (3) | | | 18,758 | |
| | |
| | 1,281 | | | IDT Corporation | | | 16,589 | |
| | |
| | 4,709 | | | inContact, Inc., (3) | | | 41,910 | |
| | |
| | 2,517 | | | Inteliquent Incn | | | 52,152 | |
| | |
| | 2,121 | | | Intelsat SA, (2), (3) | | | 14,041 | |
| | |
| | 6,253 | | | Iridium Communications Inc., (2), (3) | | | 51,337 | |
| | |
| | 1,459 | | | Lumos Networks Corporation | | | 18,909 | |
| | |
| | 3,454 | | | Orbcomm, Inc., (3) | | | 20,517 | |
| | |
| | 960 | | | Pacific DataVision, Inc., (3) | | | 26,899 | |
| | |
| | 3,436 | | | Premiere Global Services, Inc., (3) | | | 47,004 | |
| | |
| | 691 | | | Straight Path Communications Inc., Class B Shares, (2), (3) | | | 21,421 | |
| | |
| | 13,733 | | | Vonage Holdings Corporation, (3) | | | 83,359 | |
| | |
| | 7,457 | | | Windstream Holdings Inc., (2) | | | 48,545 | |
| | | | Total Diversified Telecommunication Services | | | 980,254 | |
| | |
| | | | Electric Utilities – 1.3% | | | |
| | |
| | 3,286 | | | ALLETE Inc. | | | 164,990 | |
| | |
| | 4,474 | | | Cleco Corporation | | | 237,122 | |
| | |
| | 2,988 | | | El Paso Electric Company | | | 115,546 | |
| | |
| | 3,351 | | | Empire District Electric Company | | | 75,565 | |
| | |
| | 926 | | | Genie Energy Limited, Class B Shares, (2) | | | 10,501 | |
| | |
| | 3,724 | | | IDACORP, INC, (2) | | | 248,949 | |
| | |
| | 2,689 | | | MGE Energy, Inc. | | | 110,975 | |
| | |
| | 2,828 | | | Otter Tail Power Corporation | | | 77,600 | |
| | |
| | 5,892 | | | PNM Resources Inc. | | | 165,683 | |
| | |
| | 5,850 | | | Portland General Electric Company | | | 216,918 | |
| | |
| | 4,187 | | | UIL Holdings Corporation | | | 213,495 | |
| | |
| | 1,077 | | | Unitil Corp. | | | 38,201 | |
| | | | Total Electric Utilities | | | 1,675,545 | |
| | |
| | | | Electrical Equipment – 0.7% | | | |
| | |
| | 462 | | | Allied Motion | | | 8,912 | |
| | |
| | 1,906 | | | AZZ Inc. | | | 105,459 | |
| | | | | | | | |
| Shares | | | Description (1) | | Value | |
| | |
| | | | Electrical Equipment (continued) | | | |
| | |
| | 1,533 | | | Encore Wire Corporation | | $ | 65,566 | |
| | |
| | 3,289 | | | EnerSys | | | 200,596 | |
| | |
| | 2,040 | | | Enphase Energy Incorporated, (2), (3) | | | 7,344 | |
| | |
| | 3,523 | | | Franklin Electric Company, Inc. | | | 116,118 | |
| | |
| | 17,816 | | | Fuelcell Energy Inc., (2), (3) | | | 15,758 | |
| | |
| | 5,115 | | | Generac Holdings Inc., (2), (3) | | | 161,429 | |
| | |
| | 3,615 | | | General Cable Corporation | | | 55,635 | |
| | |
| | 1,801 | | | LSI Industries, Inc. | | | 19,343 | |
| | |
| | 12,959 | | | Plug Power Inc., (2), (3) | | | 31,231 | |
| | |
| | 720 | | | Powell Industries Inc. | | | 23,990 | |
| | |
| | 362 | | | Power Solutions International Inc., (2), (3) | | | 6,530 | |
| | |
| | 1,660 | | | PowerSecure International, Inc., (3) | | | 20,684 | |
| | |
| | 214 | | | Preformed Line Products Company | | | 9,095 | |
| | |
| | 1,322 | | | Sunrun Inc., (3) | | | 9,796 | |
| | |
| | 2,260 | | | Thermon Group Holdings Inc., (3) | | | 45,449 | |
| | |
| | 1,273 | | | Vicor Corporation | | | 12,297 | |
| | | | Total Electrical Equipment | | | 915,232 | |
| | |
| | | | Electronic Equipment, Instruments & Components – 2.5% | | | |
| | |
| | 1,184 | | | Agilysys Inc. | | | 13,462 | |
| | |
| | 2,107 | | | Anixter International Inc., (2), (3) | | | 144,498 | |
| | |
| | 3,417 | | | AVX Group | | | 46,130 | |
| | |
| | 1,071 | | | Badger Meter Inc. | | | 64,881 | |
| | |
| | 3,154 | | | Belden Inc. | | | 201,951 | |
| | |
| | 3,876 | | | Benchmark Electronics Inc., (3) | | | 76,667 | |
| | |
| | 3,112 | | | Checkpoint Systems Inc., (3) | | | 23,278 | |
| | |
| | 1,763 | | | Coherent Inc., (3) | | | 95,555 | |
| | |
| | 1,540 | | | Control4 Corporation, (2), (3) | | | 10,072 | |
| | |
| | 2,456 | | | CTS Corporation | | | 44,650 | |
| | |
| | 3,044 | | | Daktronics Inc. | | | 29,527 | |
| | |
| | 1,316 | | | DTS, Inc., (3) | | | 39,164 | |
| | |
| | 1,273 | | | Electro Rent Corporation | | | 13,214 | |
| | |
| | 313 | | | ePlus, Inc., (3) | | | 26,423 | |
| | |
| | 2,724 | | | Fabrinet, (3) | | | 59,029 | |
| | |
| | 1,336 | | | FARO Technologies, Inc., (3) | | | 45,143 | |
| | |
| | 3,073 | | | FEI Company, (2) | | | 221,840 | |
| | |
| | 2,530 | | | GSI Group, Inc., (3) | | | 34,180 | |
| | |
| | 3,878 | | | II VI Inc., (3) | | | 70,269 | |
| | |
| | 2,867 | | | Insight Enterprises Inc., (3) | | | 72,822 | |
| | |
| | 5,513 | | | InvenSense Incorporated, (2), (3) | | | 65,715 | |
Nuveen Small Cap Index Fund (continued)
| | |
| Portfolio of Investments | | October 31, 2015 |
| | | | | | | | |
| Shares | | | Description (1) | | Value | |
| | |
| | | | Electronic Equipment, Instruments & Components (continued) | | | |
| | |
| | 2,843 | | | Itron Inc., (3) | | $ | 104,423 | |
| | |
| | 2,027 | | | Kimball Electronics Inc., (3) | | | 23,088 | |
| | |
| | 6,456 | | | Knowles Corporation, (2), (3) | | | 107,557 | |
| | |
| | 1,669 | | | Littelfuse Inc. | | | 166,783 | |
| | |
| | 2,578 | | | Mercury Computer Systems Inc., (3) | | | 44,238 | |
| | |
| | 205 | | | Mesa Laboratories, Inc. | | | 22,929 | |
| | |
| | 2,837 | | | Methode Electronics, Inc. | | | 94,557 | |
| | |
| | 1,103 | | | MTS Systems Corporation, (2) | | | 72,831 | |
| | |
| | 732 | | | Multi Fineline Electronix, Inc., (3) | | | 13,601 | |
| | |
| | 3,091 | | | Newport Corporation, (3) | | | 46,705 | |
| | |
| | 1,465 | | | OSI Systems Inc., (3) | | | 126,254 | |
| | |
| | 1,508 | | | Park Electrochemical Corporation | | | 24,641 | |
| | |
| | 777 | | | PC Connection, Inc., (3) | | | 18,057 | |
| | |
| | 2,486 | | | Plexus Corporation, (3) | | | 86,065 | |
| | |
| | 3,119 | | | RealD Inc., (3) | | | 31,720 | |
| | |
| | 2,174 | | | Rofin Sinar Technologies Inc., (3) | | | 62,959 | |
| | |
| | 1,405 | | | Rogers Corporation, (3) | | | 65,361 | |
| | |
| | 6,111 | | | Sanmina-SCI Corporation, (3) | | | 126,314 | |
| | |
| | 2,211 | | | ScanSource, Inc., (3) | | | 76,302 | |
| | |
| | 2,127 | | | SYNNEX Corporation | | | 188,112 | |
| | |
| | 2,710 | | | Tech Data Corporation, (3) | | | 197,261 | |
| | |
| | 4,366 | | | TTM Technologies, Inc., (3) | | | 31,872 | |
| | |
| | 2,974 | | | Universal Display Corporation, (3) | | | 102,038 | |
| | |
| | 10,017 | | | Vishay Intertechnology Inc., (2) | | | 106,180 | |
| | |
| | 987 | | | Vishay Precision Group Inc., (3) | | | 11,578 | |
| | | | Total Electronic Equipment, Instruments & Components | | | 3,349,896 | |
| | |
| | | | Energy Equipment & Services – 0.9% | | | |
| | |
| | 4,782 | | | Atwood Oceanics Inc., (2) | | | 79,142 | |
| | |
| | 3,154 | | | Basic Energy Services, Inc., (2), (3) | | | 11,701 | |
| | |
| | 2,577 | | | Bristow Group Inc. | | | 89,499 | |
| | |
| | 4,172 | | | C&J Energy Services Inc., (2), (3) | | | 20,818 | |
| | |
| | 1,451 | | | Carbo Ceramics Inc., (2) | | | 25,422 | |
| | |
| | 1,577 | | | ERA Group Incorporated, (3) | | | 21,936 | |
| | |
| | 5,134 | | | Exterran Holdings, Inc. | | | 111,613 | |
| | |
| | 4,731 | | | Fairmount Santrol Holdings Inc., (2), (3) | | | 12,632 | |
| | |
| | 4,388 | | | Forum Energy Technologies Incorporated, (3) | | | 58,141 | |
| | |
| | 1,018 | | | Geospace Technologies Corporation, (2), (3) | | | 15,636 | |
| | |
| | 1,894 | | | Gulfmark Offshore Inc., (2) | | | 11,819 | |
| | |
| | 7,833 | | | Helix Energy Solutions Group, (3) | | | 45,275 | |
| | | | | | | | |
| Shares | | | Description (1) | | Value | |
| | |
| | | | Energy Equipment & Services (continued) | | | |
| | |
| | 2,367 | | | Hornbeck Offshore Services Inc., (2), (3) | | $ | 31,978 | |
| | |
| | 1,225 | | | Independence Contract Drilling Inc., (3) | | | 8,612 | |
| | |
| | 10,021 | | | ION Geophysical Corporation, (3) | | | 3,708 | |
| | |
| | 10,187 | | | Key Energy Services Inc., (2), (3) | | | 5,352 | |
| | |
| | 2,049 | | | Matrix Service Company, (3) | | | 46,512 | |
| | |
| | 17,648 | | | McDermott International Inc., (3) | | | 81,357 | |
| | |
| | 967 | | | Natural Gas Services Group, (3) | | | 21,777 | |
| | |
| | 6,221 | | | Newpark Resources Inc., (2), (3) | | | 35,211 | |
| | |
| | 1,467 | | | Nordic American Offshore Limited, (2) | | | 8,846 | |
| | |
| | 5,543 | | | North Atlantic Drilling Limited, (2) | | | 4,576 | |
| | |
| | 3,816 | | | Oil States International Inc., (3) | | | 114,518 | |
| | |
| | 9,394 | | | Parker Drilling Company, (2), (3) | | | 26,867 | |
| | |
| | 1,048 | | | PHI Inc. Non-Voting, (3) | | | 19,954 | |
| | |
| | 4,866 | | | Pioneer Energy Services Corporation, (3) | | | 11,240 | |
| | |
| | 928 | | | RigNet, Inc., (3) | | | 27,840 | |
| | |
| | 1,349 | | | SeaCor Smit Inc., (3) | | | 78,809 | |
| | |
| | 4,157 | | | Seventy Seven Energy Inc., (2), (3) | | | 4,739 | |
| | |
| | 2,517 | | | Tesco Corporation | | | 20,136 | |
| | |
| | 5,886 | | | TETRA Technologies, (3) | | | 39,672 | |
| | |
| | 3,478 | | | Tidewater Inc., (2) | | | 42,953 | |
| | |
| | 3,727 | | | Unit Corporation, (3) | | | 46,997 | |
| | |
| | 3,950 | | | US Silica Holdings Inc., (2) | | | 71,337 | |
| | | | Total Energy Equipment & Services | | | 1,256,625 | |
| | |
| | | | Food & Staples Retailing – 0.9% | | | |
| | |
| | 2,100 | | | Andersons, Inc. | | | 74,340 | |
| | |
| | 2,874 | | | Casey’s General Stores, Inc. | | | 305,276 | |
| | |
| | 1,489 | | | Fairway Group Holdings Inc., (2), (3) | | | 1,727 | |
| | |
| | 3,188 | | | Fresh Market Inc., (2), (3) | | | 79,445 | |
| | |
| | 986 | | | Ingles Markets, Inc. | | | 49,241 | |
| | |
| | 693 | | | Natural Grocers by Vitamin Cottage Incorporated, (2), (3) | | | 16,597 | |
| | |
| | 1,451 | | | PriceSmart, Inc., (2) | | | 124,757 | |
| | |
| | 1,795 | | | Smart & Final Stores, Inc., (3) | | | 26,458 | |
| | |
| | 2,782 | | | SpartanNash Co | | | 77,618 | |
| | |
| | 19,362 | | | SUPERVALU INC. | | | 127,208 | |
| | |
| | 1,378 | | | The Chef’s Warehouse Inc., (2), (3) | | | 20,877 | |
| | |
| | 3,703 | | | United Natural Foods Inc., (2), (3) | | | 186,816 | |
| | |
| | 527 | | | Village Super Market, Inc. | | | 13,207 | |
| | |
| | 854 | | | Weis Markets Inc. | | | 35,134 | |
| | | | Total Food & Staples Retailing | | | 1,138,701 | |
Nuveen Small Cap Index Fund (continued)
| | |
| Portfolio of Investments | | October 31, 2015 |
| | | | | | | | |
| Shares | | | Description (1) | | Value | |
| | |
| | | | Food Products – 1.7% | | | |
| | |
| | 226 | | | Alico Inc. | | $ | 9,648 | |
| | |
| | 1,108 | | | Amplify Snack Brands, Inc., (2), (3) | | | 13,385 | |
| | |
| | 601 | | | Arcadia Biosciences Inc., (3) | | | 1,683 | |
| | |
| | 4,161 | | | B&G Foods Inc. | | | 151,003 | |
| | |
| | 4,044 | | | Boulder Brands Inc., (2), (3) | | | 35,830 | |
| | |
| | 1,019 | | | Calavo Growers, Inc. | | | 52,387 | |
| | |
| | 2,296 | | | Cal-Maine Foods, Inc., (2) | | | 122,744 | |
| | |
| | 12,220 | | | Darling International Inc., (2), (3) | | | 123,666 | |
| | |
| | 6,978 | | | Dean Foods Company | | | 126,372 | |
| | |
| | 1,949 | | | Diamond Foods Inc., (3) | | | 77,219 | |
| | |
| | 503 | | | Farmer Brothers Company | | | 14,275 | |
| | |
| | 2,464 | | | Fresh Del Monte Produce Inc. | | | 112,432 | |
| | |
| | 1,536 | | | Freshpet, Inc., (2), (3) | | | 14,976 | |
| | |
| | 1,171 | | | Inventure Group, (3) | | | 10,141 | |
| | |
| | 1,102 | | | J&K Snack Foods Corporation | | | 135,315 | |
| | |
| | 641 | | | John B Sanfillippo & Son, Inc. | | | 41,486 | |
| | |
| | 1,370 | | | Lancaster Colony Corporation, (2) | | | 155,796 | |
| | |
| | 2,076 | | | Landec Corporation, (3) | | | 25,535 | |
| | |
| | 384 | | | Lifeway Foods, Inc. | | | 4,358 | |
| | |
| | 834 | | | Limoneira Company, (2) | | | 13,227 | |
| | |
| | 1,659 | | | Omega Protein Corporation, (3) | | | 30,194 | |
| | |
| | 4,552 | | | Post Holdings Inc., (2), (3) | | | 292,557 | |
| | |
| | 1,657 | | | Sanderson Farms Inc., (2) | | | 115,178 | |
| | |
| | 19 | | | Seaboard Corporation | | | 63,992 | |
| | |
| | 633 | | | Seneca Foods Corporation, (3) | | | 18,471 | |
| | |
| | 3,693 | | | Snyders Lance Inc. | | | 131,249 | |
| | |
| | 1,378 | | | Tootsie Roll Industries Inc., (2) | | | 43,738 | |
| | |
| | 3,172 | | | Treehouse Foods Inc., (2), (3) | | | 271,650 | |
| | | | Total Food Products | | | 2,208,507 | |
| | |
| | | | Gas Utilities – 1.2% | | | |
| | |
| | 1,129 | | | Chesapeake Utilities Corporation | | | 58,945 | |
| | |
| | 2,783 | | | Laclede Group Inc. | | | 163,000 | |
| | |
| | 6,330 | | | New Jersey Resources Corporation | | | 200,534 | |
| | |
| | 2,083 | | | Northwest Natural Gas Company | | | 99,505 | |
| | |
| | 3,890 | | | One Gas Inc., (2) | | | 189,988 | |
| | |
| | 5,827 | | | Piedmont Natural Gas Company, (2) | | | 333,945 | |
| | |
| | 5,114 | | | South Jersey Industries Inc., (2) | | | 135,572 | |
| | |
| | 3,464 | | | Southwest Gas Corporation | | | 212,897 | |
| | |
| | 3,678 | | | WGL Holdings Inc. | | | 228,882 | |
| | | | Total Gas Utilities | | | 1,623,268 | |
| | | | | | | | |
| Shares | | | Description (1) | | Value | |
| | |
| | | | Health Care Equipment & Supplies – 3.4% | | | |
| | |
| | 1,667 | | | Abaxis, Inc. | | $ | 83,700 | |
| | |
| | 3,097 | | | Abiomed, Inc., (2), (3) | | | 228,125 | |
| | |
| | 5,954 | | | Accuray, Inc., (2), (3) | | | 39,892 | |
| | |
| | 918 | | | Analogic Corporation | | | 80,435 | |
| | |
| | 1,917 | | | AngioDynamics, Inc., (3) | | | 24,116 | |
| | |
| | 1,118 | | | Anika Therapeutics, Inc., (3) | | | 43,065 | |
| | |
| | 9,053 | | | Antares Pharma Inc., (2), (3) | | �� | 12,493 | |
| | |
| | 2,126 | | | AtriCure, Inc., (3) | | | 39,384 | |
| | |
| | 106 | | | ATRION Corporation | | | 39,114 | |
| | |
| | 2,541 | | | Cantel Medical Corporation | | | 150,630 | |
| | |
| | 2,346 | | | Cardiovascular Systems, Inc., (3) | | | 32,140 | |
| | |
| | 6,943 | | | Cerus Corporation, (2), (3) | | | 33,118 | |
| | |
| | 763 | | | ConforMIS Inc., (2), (3) | | | 14,932 | |
| | |
| | 2,042 | | | Conmed Corporation | | | 82,824 | |
| | |
| | 1,664 | | | Corindus Vascular Robotics, Inc., (2), (3) | | | 5,325 | |
| | |
| | 1,885 | | | CryoLife Inc. | | | 19,868 | |
| | |
| | 1,072 | | | Cutera, Inc., (3) | | | 14,547 | |
| | |
| | 1,597 | | | Cynosure, Inc., (3) | | | 60,111 | |
| | |
| | 485 | | | EndoChoice Holdings Inc., (3) | | | 5,005 | |
| | |
| | 4,964 | | | Endologix, Inc., (3) | | | 42,393 | |
| | |
| | 409 | | | Entellus Medical, Inc., (3) | | | 6,949 | |
| | |
| | 757 | | | Exactech, Inc., (3) | | | 12,892 | |
| | |
| | 3,228 | | | Genmark Diagnostics Inc., (2), (3) | | | 20,530 | |
| | |
| | 509 | | | Glaukos Corporation, (2), (3) | | | 10,200 | |
| | |
| | 5,101 | | | Globus Medical Inc., Class A, (3) | | | 114,007 | |
| | |
| | 1,930 | | | Greatbatch, Inc., (3) | | | 103,159 | |
| | |
| | 3,823 | | | Haemonetics Corporation, (3) | | | 129,141 | |
| | |
| | 3,441 | | | Halyard Health Inc., (3) | | | 102,129 | |
| | |
| | 1,277 | | | Heartware International Inc., (2), (3) | | | 55,154 | |
| | |
| | 1,001 | | | ICU Medical, Inc., (3) | | | 110,080 | |
| | |
| | 1,163 | | | Inogen Inc., (3) | | | 49,707 | |
| | |
| | 4,198 | | | Insulet Corporation, (3) | | | 125,520 | |
| | |
| | 1,937 | | | Integra Lifesciences Holdings Corporation, (3) | | | 115,387 | |
| | |
| | 2,494 | | | Invacare Corporation | | | 43,096 | |
| | |
| | 1,965 | | | InVivo Therapeutics Holdings Corporation, (2), (3) | | | 14,266 | |
| | |
| | 339 | | | Invuity Inc., (3) | | | 4,553 | |
| | |
| | 208 | | | iRadimed Corporation, (3) | | | 5,512 | |
| | |
| | 1,302 | | | K2M Group Holdings Inc., (3) | | | 23,762 | |
| | |
| | 904 | | | Lantheus Holdings Inc., (3) | | | 2,712 | |
Nuveen Small Cap Index Fund (continued)
| | |
| Portfolio of Investments | | October 31, 2015 |
| | | | | | | | |
| Shares | | | Description (1) | | Value | |
| | |
| | | | Health Care Equipment & Supplies (continued) | | | |
| | |
| | 1,717 | | | LDR Holding Corporation, (3) | | $ | 43,440 | |
| | |
| | 879 | | | LeMaitre Vascular, Inc. | | | 11,708 | |
| | |
| | 3,159 | | | Livanova PLC, (2), (3) | | | 209,379 | |
| | |
| | 3,234 | | | Masimo Corporation, (3) | | | 128,325 | |
| | |
| | 3,086 | | | Meridian Bioscience, Inc. | | | 58,665 | |
| | |
| | 3,333 | | | Merit Medical Systems, Inc., (3) | | | 61,794 | |
| | |
| | 2,493 | | | Natus Medical, Inc., (3) | | | 113,506 | |
| | |
| | 2,740 | | | Neogen Corporation, (2), (3) | | | 148,097 | |
| | |
| | 1,231 | | | Nevro Corporation, (3) | | | 50,188 | |
| | |
| | 3,615 | | | NuVasive, Inc., (3) | | | 170,483 | |
| | |
| | 4,764 | | | Nxstage Medical, Inc., (3) | | | 79,606 | |
| | |
| | 4,331 | | | OraSure Technologies, Inc., (3) | | | 22,521 | |
| | |
| | 1,429 | | | Orthofix International NV, (3) | | | 48,657 | |
| | |
| | 1,290 | | | Oxford Immunotec Global PLC, (3) | | | 16,177 | |
| | |
| | 2,210 | | | Quidel Corporation, (3) | | | 42,476 | |
| | |
| | 3,634 | | | Rockwell Medical Technologies, Inc., (2), (3) | | | 42,082 | |
| | |
| | 4,243 | | | RTI Biologics Inc., (3) | | | 17,842 | |
| | |
| | 645 | | | SeaSpine Holdings Corporation, (3) | | | 9,727 | |
| | |
| | 875 | | | Second Sight Medical Products, Inc., (2), (3) | | | 5,145 | |
| | |
| | 445 | | | Sientra, Inc., (3) | | | 1,673 | |
| | |
| | 3,224 | | | Spectranetics Corporation, (3) | | | 39,397 | |
| | |
| | 2,977 | | | STAAR Surgical Company, (2), (3) | | | 24,263 | |
| | |
| | 5,764 | | | Steris Corporation, (2) | | | 432,012 | |
| | |
| | 962 | | | Surmodics Inc., (3) | | | 20,519 | |
| | |
| | 1,306 | | | Tandem Diabetes Care Inc., (2), (3) | | | 11,845 | |
| | |
| | 3,302 | | | TransEnterix Inc., (3) | | | 8,222 | |
| | |
| | 8,565 | | | Unilife Corporation, (2), (3) | | | 6,455 | |
| | |
| | 275 | | | Utah Medical Products, Inc. | | | 16,217 | |
| | |
| | 1,329 | | | Vascular Solutions, Inc., (3) | | | 42,687 | |
| | |
| | 997 | | | Veracyte Inc., (2), (3) | | | 6,490 | |
| | |
| | 5,321 | | | West Pharmaceutical Services Inc., (2) | | | 319,313 | |
| | |
| | 6,748 | | | Wright Medical Group, Inc., (3) | | | 130,439 | |
| | |
| | 2,383 | | | Zeltiq Aesthetics Inc., (2), (3) | | | 80,402 | |
| | | | Total Health Care Equipment & Supplies | | | 4,519,725 | |
| | |
| | | | Health Care Providers & Services – 2.6% | | | |
| | |
| | 588 | | | AAC Holdings, Inc., (2), (3) | | | 13,642 | |
| | |
| | 2,154 | | | Aceto Corporation | | | 64,965 | |
| | |
| | 456 | | | Addus HomeCare Corporation, (3) | | | 11,391 | |
| | |
| | 458 | | | Adeptus Health Inc., Class A Shares, (2), (3) | | | 29,720 | |
| | | | | | | | |
| Shares | | | Description (1) | | Value | |
| | |
| | | | Health Care Providers & Services (continued) | | | |
| | |
| | 2,905 | | | Air Methods Corporation, (2), (3) | | $ | 118,902 | |
| | |
| | 416 | | | Alliance Imaging Inc., (3) | | | 3,519 | |
| | |
| | 531 | | | Almost Family, Inc., (3) | | | 21,973 | |
| | |
| | 2,118 | | | Amedisys, Inc., (2), (3) | | | 83,830 | |
| | |
| | 3,518 | | | AMN Healthcare Services Inc., (3) | | | 99,806 | |
| | |
| | 3,580 | | | AmSurg Corporation, (2), (3) | | | 250,922 | |
| | |
| | 5,306 | | | Bioscrip, Inc., (2), (3) | | | 10,453 | |
| | |
| | 2,047 | | | BioTelemetry Inc., (3) | | | 26,652 | |
| | |
| | 2,250 | | | Capital Senior Living Corporation, (3) | | | 50,895 | |
| | |
| | 1,264 | | | Chemed Corporation, (2) | | | 198,815 | |
| | |
| | 906 | | | Civitas Solutions Inc., (3) | | | 23,311 | |
| | |
| | 637 | | | Corvel Corporation, (3) | | | 21,148 | |
| | |
| | 2,413 | | | Cross Country Healthcare, Inc., (3) | | | 32,576 | |
| | |
| | 2,675 | | | Diplomat Pharmacy, Inc., (2), (3) | | | 75,194 | |
| | |
| | 1,883 | | | Ensign Group Inc. | | | 79,387 | |
| | |
| | 3,058 | | | ExamWorks Group Inc., (3) | | | 86,358 | |
| | |
| | 3,338 | | | Five Star Quality Care Inc., (3) | | | 10,915 | |
| | |
| | 2,712 | | | Genesis Healthcare Inc., (3) | | | 13,452 | |
| | |
| | 2,731 | | | Hanger Orthopedic Group Inc., (3) | | | 39,381 | |
| | |
| | 2,682 | | | HealthEquity, Inc., (3) | | | 87,728 | |
| | |
| | 6,768 | | | HealthSouth Corporation, (2) | | | 235,729 | |
| | |
| | 2,296 | | | Healthways Inc., (2), (3) | | | 27,024 | |
| | |
| | 1,286 | | | IPC The Hospitalist Company, Inc., (3) | | | 100,951 | |
| | |
| | 6,173 | | | Kindred Healthcare Inc. | | | 82,718 | |
| | |
| | 740 | | | Landauer Inc., (2) | | | 29,223 | |
| | |
| | 958 | | | LHC Group, Inc., (3) | | | 43,172 | |
| | |
| | 2,022 | | | Magellan Health Services, Inc., (3) | | | 107,975 | |
| | |
| | 2,903 | | | Molina Healthcare Inc., (2), (3) | | | 179,986 | |
| | |
| | 799 | | | National Healthcare Corporation | | | 52,159 | |
| | |
| | 817 | | | National Research Corporation | | | 12,525 | |
| | |
| | 2,364 | | | Nobilis Health Corporation, (2), (3) | | | 6,666 | |
| | |
| | 4,668 | | | Owens and Minor Inc., (2) | | | 167,348 | |
| | |
| | 2,248 | | | Pharmerica Corporation, (3) | | | 64,225 | |
| | |
| | 1,012 | | | Providence Service Corporation, (2), (3) | | | 52,270 | |
| | |
| | 2,536 | | | RadNet, Inc., (3) | | | 16,763 | |
| | |
| | 7,767 | | | Select Medical Corporation, (2) | | | 87,767 | |
| | |
| | 1,591 | | | Surgical Care Affiliates Inc., (3) | | | 47,110 | |
| | |
| | 5,327 | | | Team Health Holdings Inc., (3) | | | 317,862 | |
| | |
| | 699 | | | Teladoc, Inc., (2), (3) | | | 13,749 | |
Nuveen Small Cap Index Fund (continued)
| | |
| Portfolio of Investments | | October 31, 2015 |
| | | | | | | | |
| Shares | | | Description (1) | | Value | |
| | |
| | | | Health Care Providers & Services (continued) | | | |
| | |
| | 1,787 | | | Triple-S Management Corporation, Class B Shares, (3) | | $ | 36,794 | |
| | |
| | 1,208 | | | Trupanion Inc., (2), (3) | | | 7,937 | |
| | |
| | 3,201 | | | Universal American Corporation, (3) | | | 23,879 | |
| | |
| | 947 | | | US Physical Therapy, Inc. | | | 46,460 | |
| | |
| | 3,258 | | | Wellcare Health Plans Inc., (3) | | | 288,659 | |
| | | | Total Health Care Providers & Services | | | 3,503,886 | |
| | |
| | | | Health Care Technology – 0.5% | | | |
| | |
| | 2,495 | | | Castlight Health Inc., Class B, (2), (3) | | | 12,625 | |
| | |
| | 866 | | | Computer Programs and Systems, Inc., (2) | | | 32,917 | |
| | |
| | 513 | | | Connecture, Inc., (3) | | | 3,027 | |
| | |
| | 976 | | | Evolent Health Inc., (3) | | | 12,542 | |
| | |
| | 1,868 | | | Healthstream, Inc., (3) | | | 44,477 | |
| | |
| | 6,548 | | | HMS Holdings Corporation, (3) | | | 68,950 | |
| | |
| | 666 | | | Imprivata Inc., (3) | | | 7,186 | |
| | |
| | 4,465 | | | MedAssets Inc., (3) | | | 105,731 | |
| | |
| | 4,089 | | | Medidata Solutions, Inc., (3) | | | 175,827 | |
| | |
| | 2,681 | | | Omnicell, Inc., (3) | | | 72,923 | |
| | |
| | 757 | | | Press Ganey Holdings, Inc., (2), (3) | | | 23,724 | |
| | |
| | 3,865 | | | Quality Systems Inc. | | | 54,303 | |
| | |
| | 1,757 | | | Vocera Communications Incorporated, (3) | | | 20,680 | |
| | | | Total Health Care Technology | | | 634,912 | |
| | |
| | | | Hotels, Restaurants & Leisure – 3.2% | | | |
| | |
| | 7,492 | | | Belmond Limited, Class A, (3) | | | 80,464 | |
| | |
| | 2 | | | Biglari Holdings Inc., (3) | | | 768 | |
| | |
| | 1,588 | | | BJ’s Restaurants, Inc., (3) | | | 68,173 | |
| | |
| | 9,169 | | | Bloomin Brands | | | 155,598 | |
| | |
| | 1,749 | | | Bob Evans Farms, (2) | | | 75,679 | |
| | |
| | 613 | | | Bojangles’, Inc., (3) | | | 10,194 | |
| | |
| | 6,013 | | | Boyd Gaming Corporation, (3) | | | 120,200 | |
| | |
| | 1,125 | | | Bravo Brio Restaurant Group, (3) | | | 13,208 | |
| | |
| | 1,405 | | | Buffalo Wild Wings, Inc., (2), (3) | | | 216,749 | |
| | |
| | 3,544 | | | Caesars Acquisition Company, Class A, (3) | | | 25,942 | |
| | |
| | 3,977 | | | Caesar’s Entertainment Corporation, (2), (3) | | | 32,015 | |
| | |
| | 2,731 | | | Carrols Restaurant Group, Inc., (3) | | | 32,117 | |
| | |
| | 1,419 | | | CBRL Group Inc., (2) | | | 195,056 | |
| | |
| | 3,619 | | | Cheesecake Factory Inc., (2) | | | 174,436 | |
| | |
| | 995 | | | Churchill Downs Inc. | | | 146,096 | |
| | |
| | 1,216 | | | Chuy’s Holdings Inc., (2), (3) | | | 33,087 | |
| | |
| | 3,249 | | | ClubCorp Holdings Inc. | | | 66,410 | |
| | | | | | | | |
| Shares | | | Description (1) | | Value | |
| | |
| | | | Hotels, Restaurants & Leisure (continued) | | | |
| | |
| | 1,685 | | | Dave & Buster’s Entertainment Inc., (3) | | $ | 65,007 | |
| | |
| | 1,743 | | | Del Friscos Restaurant Group, (3) | | | 23,478 | |
| | |
| | 6,239 | | | Denny’s Corporation, (3) | | | 68,379 | |
| | |
| | 3,080 | | | Diamond Resorts International Inc., (2), (3) | | | 87,595 | |
| | |
| | 1,255 | | | DineEquity Inc. | | | 104,730 | |
| | |
| | 995 | | | El Pollo Loco Holdings, Inc., (3) | | | 11,423 | |
| | |
| | 2,085 | | | Eldorado Resorts Inc., (3) | | | 20,641 | |
| | |
| | 1,216 | | | Empire Resorts, Inc., (2), (3) | | | 5,642 | |
| | |
| | 1,984 | | | Fiesta Restaurant Group, (3) | | | 70,154 | |
| | |
| | 851 | | | Habit Restaurants Inc., Class A Shares, (2), (3) | | | 20,322 | |
| | |
| | 2,895 | | | Interval Leisure Group Inc., (2) | | | 51,097 | |
| | |
| | 2,065 | | | Intl Speedway Corporation | | | 71,635 | |
| | |
| | 1,042 | | | Intrawest Resorts Holdings Inc., (3) | | | 9,336 | |
| | |
| | 1,635 | | | Isle of Capri Casinos, (3) | | | 31,278 | |
| | |
| | 1,022 | | | J Alexanders Holdings Inc., (3) | | | 9,852 | |
| | |
| | 2,765 | | | Jack in the Box Inc. | | | 206,075 | |
| | |
| | 1,026 | | | Jamba, Inc., (2), (3) | | | 13,595 | |
| | |
| | 625 | | | Kona Grill, Inc., (3) | | | 8,594 | |
| | |
| | 4,797 | | | Krispy Kreme Doughnuts Inc., (3) | | | 65,671 | |
| | |
| | 6,925 | | | La Quinta Holdings Inc., (3) | | | 104,914 | |
| | |
| | 1,543 | | | Marcus Corporation | | | 31,925 | |
| | |
| | 1,912 | | | Marriott Vacations World, (2) | | | 123,133 | |
| | |
| | 715 | | | Monarch Casino & Resort, Inc., (3) | | | 15,687 | |
| | |
| | 2,220 | | | Morgans Hotel Group Company, (3) | | | 7,970 | |
| | |
| | 839 | | | Noodles & Company, (3) | | | 12,392 | |
| | |
| | 2,141 | | | Papa John’s International, Inc., (2) | | | 150,234 | |
| | |
| | 672 | | | Papa Murphy’s Holdings Inc., (2), (3) | | | 9,280 | |
| | |
| | 5,904 | | | Penn National Gaming, Inc., (3) | | | 105,445 | |
| | |
| | 4,477 | | | Pinnacle Entertainment Inc., (3) | | | 156,740 | |
| | |
| | 1,145 | | | Planet Fitness Inc., (3) | | | 18,709 | |
| | |
| | 1,713 | | | Popeye’s Louisiana Kitchen Inc., (3) | | | 96,682 | |
| | |
| | 1,158 | | | Potbelly Corporation, (2), (3) | | | 12,970 | |
| | |
| | 1,045 | | | Red Robin Gourmet Burgers, Inc., (3) | | | 78,260 | |
| | |
| | 4,765 | | | Ruby Tuesday, Inc., (3) | | | 24,921 | |
| | |
| | 2,583 | | | Ruth’s Chris Steak House, Inc. | | | 40,062 | |
| | |
| | 3,714 | | | Scientific Games Corporation, (2), (3) | | | 41,188 | |
| | |
| | 5,056 | | | Seaworld Entertainment | | | 100,766 | |
| | |
| | 424 | | | Shake Shack Inc., Class A Shares, (3) | | | 19,322 | |
| | |
| | 3,846 | | | Sonic Corporation | | | 109,765 | |
| | |
| | 969 | | | Speedway Motorsports Inc. | | | 17,897 | |
Nuveen Small Cap Index Fund (continued)
| | |
| Portfolio of Investments | | October 31, 2015 |
| | | | | | | | |
| Shares | | | Description (1) | | Value | |
| | |
| | | | Hotels, Restaurants & Leisure (continued) | | | |
| | |
| | 4,826 | | | Texas Roadhouse, Inc. | | $ | 165,773 | |
| | |
| | 2,688 | | | Vail Resorts, Inc. | | | 306,889 | |
| | |
| | 492 | | | Wingstop Inc., (2), (3) | | | 11,380 | |
| | |
| | 1,428 | | | Zoe’s Kitchen Inc., (2), (3) | | | 49,166 | |
| | | | Total Hotels, Restaurants & Leisure | | | 4,202,166 | |
| | |
| | | | Household Durables – 1.3% | | | |
| | |
| | 796 | | | Bassett Furniture, Inc. | | | 25,440 | |
| | |
| | 2,090 | | | Beazer Homes USA, Inc., (2), (3) | | | 29,762 | |
| | |
| | 5,691 | | | CalAtlantic Group Inc., (2) | | | 216,770 | |
| | |
| | 656 | | | Cavco Industries, Inc., (3) | | | 64,682 | |
| | |
| | 1,125 | | | Century Communities, Inc., (3) | | | 21,465 | |
| | |
| | 706 | | | CSS Industries Inc. | | | 19,274 | |
| | |
| | 1,957 | | | Ethan Allen Interiors Inc., (2) | | | 53,250 | |
| | |
| | 380 | | | Flexsteel Industries, Inc. | | | 16,526 | |
| | |
| | 1,598 | | | Green Brick Partners, Inc., (3) | | | 16,859 | |
| | |
| | 2,108 | | | Helen of Troy Limited, (3) | | | 209,135 | |
| | |
| | 800 | | | Hooker Furniture Corporation | | | 19,856 | |
| | |
| | 9,055 | | | Hovnanian Enterprises Inc., (2), (3) | | | 18,653 | |
| | |
| | 1,471 | | | Installed Building Products Inc., (3) | | | 32,583 | |
| | |
| | 2,199 | | | Irobot Corporation, (2), (3) | | | 65,992 | |
| | |
| | 6,037 | | | KB Home, (2) | | | 79,085 | |
| | |
| | 3,787 | | | La Z Boy Inc. | | | 108,119 | |
| | |
| | 1,108 | | | LGI Homes Inc., (2), (3) | | | 31,057 | |
| | |
| | 1,665 | | | Libbey Inc., (2) | | | 56,011 | |
| | |
| | 809 | | | Lifetime Brands, Inc. | | | 12,434 | |
| | |
| | 1,897 | | | M/I Homes, Inc., (3) | | | 43,536 | |
| | |
| | 3,029 | | | MDC Holdings Inc., (2) | | | 78,724 | |
| | |
| | 2,933 | | | Meritage Corporation, (2), (3) | | | 103,418 | |
| | |
| | 307 | | | Nacco Industries Inc. | | | 13,763 | |
| | |
| | 650 | | | New Home Company Inc., (3) | | | 9,302 | |
| | |
| | 1,502 | | | Skullcandy Inc., (3) | | | 8,411 | |
| | |
| | 2,404 | | | Taylor Morrison, (3) | | | 44,306 | |
| | |
| | 11,946 | | | Tri Pointe Homes, Incorporated, (2), (3) | �� | | 155,059 | |
| | |
| | 1,173 | | | Univeral Electronics Inc., (3) | | | 55,800 | |
| | |
| | 909 | | | WCI Communities Inc., (3) | | | 21,716 | |
| | |
| | 1,360 | | | William Lyon Homes Inc., Class A Shares, (3) | | | 29,022 | |
| | |
| | 2,184 | | | Zagg Inc., (3) | | | 18,520 | |
| | | | Total Household Durables | | | 1,678,530 | |
| | | | | | | | |
| Shares | | | Description (1) | | Value | |
| | |
| | | | Household Products – 0.2% | | | |
| | |
| | 3,128 | | | Central Garden & Pet Company, (3) | | $ | 52,801 | |
| | |
| | 5,816 | | | HRG Group, Inc., (3) | | | 78,225 | |
| | |
| | 402 | | | Oil Dri Corporation | | | 12,615 | |
| | |
| | 463 | | | Orchids Paper Products Company | | | 13,571 | |
| | |
| | 1,077 | | | WD 40 Company | | | 102,940 | |
| | | | Total Household Products | | | 260,152 | |
| | |
| | | | Independent Power & Renewable Electricity Producers – 0.5% | | | |
| | |
| | 3,628 | | | Abengoa Yield PLC, (2) | | | 67,227 | |
| | |
| | 9,360 | | | Atlantic Power Corporation, (2) | | | 19,094 | |
| | |
| | 9,530 | | | Dynegy Inc., (3) | | | 185,168 | |
| | |
| | 2,552 | | | NRG Yield Inc., Class A Shares | | | 35,039 | |
| | |
| | 4,641 | | | NRG Yield, Inc., Class C Shares, (2) | | | 67,016 | |
| | |
| | 2,546 | | | Ormat Technologies Inc., (2) | | | 96,035 | |
| | |
| | 4,120 | | | Pattern Energy Group Inc. | | | 96,367 | |
| | |
| | 6,171 | | | Talen Energy Corporation, (2), (3) | | | 53,564 | |
| | |
| | 1,594 | | | Vivint Solar Inc., (2), (3) | | | 18,857 | |
| | | | Total Independent Power & Renewable Electricity Producers | | | 638,367 | |
| | |
| | | | Industrial Conglomerates – 0.0% | | | |
| | |
| | 2,825 | | | Raven Industries, Inc., (2) | | | 51,443 | |
| | |
| | | | Insurance – 2.5% | | | |
| | |
| | 3,328 | | | Ambac Financial Group, Inc., (2), (3) | | | 53,747 | |
| | |
| | 5,765 | | | American Equity Investment Life Holding Company, (2) | | | 148,045 | |
| | |
| | 1,448 | | | Amerisafe, Inc. | | | 79,249 | |
| | |
| | 2,066 | | | Argo Group International Holdings Inc. | | | 129,166 | |
| | |
| | 767 | | | Atlas Financial Holdings Inc., (3) | | | 14,588 | |
| | |
| | 770 | | | Baldwin & Lyons, Class B | | | 17,887 | |
| | |
| | 3,620 | | | Citizens Inc., (2), (3) | | | 30,408 | |
| | |
| | 14,567 | | | CNO Financial Group Inc., (2) | | | 279,832 | |
| | |
| | 2,188 | | | Crawford & Co | | | 13,128 | |
| | |
| | 618 | | | Donegal Group, Inc., B | | | 8,745 | |
| | |
| | 1,378 | | | eHealth, Inc., (3) | | | 16,467 | |
| | |
| | 564 | | | EMC Insurance Group Inc. | | | 14,100 | |
| | |
| | 2,434 | | | Employers Holdings, Inc. | | | 64,428 | |
| | |
| | 662 | | | Enstar Group, Limited, (3) | | | 104,464 | |
| | |
| | 740 | | | FBL Financial Group Inc. | | | 46,546 | |
| | |
| | 1,071 | | | Federated National Holding Company | | | 32,971 | |
| | |
| | 872 | | | Fidelity & Guaranty Life | | | 23,282 | |
| | |
| | 8,018 | | | First American Corporation | | | 305,726 | |
| | |
| | 634 | | | Global Indemnity PLC, (3) | | | 18,012 | |
Nuveen Small Cap Index Fund (continued)
| | |
| Portfolio of Investments | | October 31, 2015 |
| | | | | | | | | | | | | | |
| Shares | | | Description (1) | | | | | | | | Value | |
| | | | | |
| | | | Insurance (continued) | | | | | | | | | |
| | | | | |
| | 2,134 | | | Greenlight Capital Re, Ltd, (2), (3) | | | | | | | | $ | 46,863 | |
| | | | | |
| | 1,184 | | | Hallmark Financial Services, Inc., (3) | | | | | | | | | 15,380 | |
| | | | | |
| | 635 | | | HCI Group Inc., (2) | | | | | | | | | 27,692 | |
| | | | | |
| | 1,826 | | | Heritage Insurance Holdings, Inc., (3) | | | | | | | | | 40,391 | |
| | | | | |
| | 3,159 | | | Horace Mann Educators Corporation | | | | | | | | | 108,164 | |
| | | | | |
| | 657 | | | Independence Holding Company | | | | | | | | | 8,909 | |
| | | | | |
| | 893 | | | Infinity Property and Casualty Corporation | | | | | | | | | 71,904 | |
| | | | | |
| | 814 | | | James River Group Holdings, Limited | | | | | | | | | 23,956 | |
| | | | | |
| | 329 | | | Kansas City Life Insurance Company | | | | | | | | | 16,131 | |
| | | | | |
| | 3,216 | | | Kemper Corporation, (2) | | | | | | | | | 114,876 | |
| | | | | |
| | 3,878 | | | Maiden Holdings, Ltd, (2) | | | | | | | | | 60,303 | |
| | | | | |
| | 10,045 | | | MBIA Inc., (3) | | | | | | | | | 75,438 | |
| | | | | |
| | 2,752 | | | National General Holdings Corporation | | | | | | | | | 54,242 | |
| | | | | |
| | 554 | | | National Interstate Corporation | | | | | | | | | 15,900 | |
| | | | | |
| | 173 | | | National Western Life Group Inc., (2) | | | | | | | | | 44,632 | |
| | | | | |
| | 812 | | | Navigators Group, Inc., (3) | | | | | | | | | 69,304 | |
| | | | | |
| | 1,758 | | | OneBeacon Insurance Group Limited, Class A | | | | | | | | | 25,298 | |
| | | | | |
| | 616 | | | Patriot National Inc., (3) | | | | | | | | | 7,823 | |
| | | | | |
| | 3,799 | | | Primerica Inc., (2) | | | | | | | | | 180,946 | |
| | | | | |
| | 3,195 | | | RLI Corporation, (2) | | | | | | | | | 194,416 | |
| | | | | |
| | 1,006 | | | Safety Insurance Group, Inc. | | | | | | | | | 58,298 | |
| | | | | |
| | 4,213 | | | Selective Insurance Group Inc. | | | | | | | | | 153,732 | |
| | | | | |
| | 1,245 | | | State Auto Financial Corporation | | | | | | | | | 29,693 | |
| | | | | |
| | 2,026 | | | State National Companies Inc. | | | | | | | | | 18,295 | |
| | | | | |
| | 1,666 | | | Stewart Information Services Corporation | | | | | | | | | 66,923 | |
| | | | | |
| | 5,555 | | | Symetra Financial Corporation | | | | | | | | | 176,260 | |
| | | | | |
| | 6,242 | | | Third Point Reinsurance Limited, (2), (3) | | | | | | | | | 85,328 | |
| | | | | |
| | 1,600 | | | United Fire Group Inc. | | | | | | | | | 59,504 | |
| | | | | |
| | 1,290 | | | United Insurance Holdings Corporation | | | | | | | | | 21,311 | |
| | | | | |
| | 2,417 | | | Universal Insurance Holdings Inc. | | | | | | | | | 76,256 | |
| | | | Total Insurance | | | | | | | | | 3,348,959 | |
| | | | | |
| | | | Internet & Catalog Retail – 0.6% | | | | | | | | | |
| | | | | |
| | 1,928 | | | 1-800-Flowers, (2), (3) | | | | | | | | | 19,145 | |
| | | | | |
| | 878 | | | Blue Nile Inc., (3) | | | | | | | | | 29,940 | |
| | | | | |
| | 1,478 | | | Etsy, Inc., (2), (3) | | | | | | | | | 16,110 | |
| | | | | |
| | 3,273 | | | EVINE Live Inc., (3) | | | | | | | | | 8,444 | |
| | | | | |
| | 1,350 | | | FTD Companies Inc., (3) | | | | | | | | | 38,232 | |
| | | | | |
| | 2,405 | | | Hosting Site Network, Inc. | | | | | | | | | 148,749 | |
| | | | | |
| | 1,213 | | | Lands’ End Inc., (2), (3) | | | | | | | | | 29,937 | |
| | | | | | | | | | | | | | |
| Shares | | | Description (1) | | | | | | | | Value | |
| | | | | |
| | | | Internet & Catalog Retail (continued) | | | | | | | | | |
| | | | | |
| | 5,531 | | | Liberty TripAdvisor Holdings Inc., (3) | | | | | | | | $ | 172,512 | |
| | | | | |
| | 2,139 | | | Nutri System Inc. | | | | | | | | | 49,475 | |
| | | | | |
| | 932 | | | Overstock.com, Inc., (3) | | | | | | | | | 14,595 | |
| | | | | |
| | 1,565 | | | PetMed Express, Inc., (2) | | | | | | | | | 26,323 | |
| | | | | |
| | 2,780 | | | Shutterfly, Inc., (2), (3) | | | | | | | | | 115,954 | |
| | | | | |
| | 7,807 | | | Travelport Worldwide Limited | | | | | | | | | 105,785 | |
| | | | | |
| | 1,483 | | | Wayfair Inc., Class A Shares, (2), (3) | | | | | | | | | 62,686 | |
| | | | Total Internet & Catalog Retail | | | | | | | | | 837,887 | |
| | | | | |
| | | | Internet Software & Services – 2.3% | | | | | | | | | |
| | | | | |
| | 3,168 | | | Actua Corporation, (3) | | | | | | | | | 43,877 | |
| | | | | |
| | 594 | | | Alarm Com Holdings Inc., (3) | | | | | | | | | 7,514 | |
| | | | | |
| | 1,306 | | | Amber Road Inc., (3) | | | | | | | | | 5,250 | |
| | | | | |
| | 3,237 | | | Angie’s List, (2), (3) | | | | | | | | | 25,022 | |
| | | | | |
| | 377 | | | Apigee Corp., (3) | | | | | | | | | 3,638 | |
| | | | | |
| | 415 | | | Appfolio Inc., Class A Shares, (3) | | | | | | | | | 7,267 | |
| | | | | |
| | 4,936 | | | Bankrate Inc., (3) | | | | | | | | | 58,590 | |
| | | | | |
| | 3,876 | | | Bazaarvoice Inc., (3) | | | | | | | | | 17,171 | |
| | | | | |
| | 583 | | | BenefitFocus Inc., (2), (3) | | | | | | | | | 18,633 | |
| | | | | |
| | 3,026 | | | Blucora Inc., (3) | | | | | | | | | 29,655 | |
| | | | | |
| | 965 | | | Box, Inc., Class A Shares, (2), (3) | | | | | | | | | 12,043 | |
| | | | | |
| | 2,344 | | | Brightcove Inc., (3) | | | | | | | | | 14,533 | |
| | | | | |
| | 1,428 | | | Carbonite Inc., (3) | | | | | | | | | 14,451 | |
| | | | | |
| | 1,417 | | | CareCom Inc., (3) | | | | | | | | | 8,516 | |
| | | | | |
| | 1,605 | | | ChannelAdvisor Corporation, (3) | | | | | | | | | 13,996 | |
| | | | | |
| | 2,427 | | | Cimpress NV, (2), (3) | | | | | | | | | 191,490 | |
| | | | | |
| | 2,546 | | | ComScore Inc., (2), (3) | | | | | | | | | 108,918 | |
| | | | | |
| | 2,435 | | | Constant Contact Inc., (3) | | | | | | | | | 63,553 | |
| | | | | |
| | 3,990 | | | Cornerstone OnDemand Inc., (3) | | | | | | | | | 125,685 | |
| | | | | |
| | 1,729 | | | Cvent Inc., (3) | | | | | | | | | 54,654 | |
| | | | | |
| | 2,470 | | | Demandware Incorporated, (2), (3) | | | | | | | | | 140,049 | |
| | | | | |
| | 3,005 | | | DHI Group Inc., (3) | | | | | | | | | 27,195 | |
| | | | | |
| | 7,938 | | | Earthlink Holdings Corporation | | | | | | | | | 67,870 | |
| | | | | |
| | 4,335 | | | Endurance International Group Holdings Inc., (2), (3) | | | | | | | | | 57,786 | |
| | | | | |
| | 2,641 | | | Envestnet Inc., (2), (3) | | | | | | | | | 78,860 | |
| | | | | |
| | 1,596 | | | Everyday Health Inc., (3) | | | | | | | | | 15,002 | |
| | | | | |
| | 1,754 | | | Five9, Inc., (3) | | | | | | | | | 7,595 | |
| | | | | |
| | 4,155 | | | Gogo Inc., (2), (3) | | | | | | | | | 58,710 | |
| | | | | |
| | 5,561 | | | GrubHub Inc., (2), (3) | | | | | | | | | 133,353 | |
| | | | | |
| | 1,809 | | | GTT Communications Inc., (3) | | | | | | | | | 33,864 | |
Nuveen Small Cap Index Fund (continued)
| | |
| Portfolio of Investments | | October 31, 2015 |
| | | | | | | | | | | | | | |
| Shares | | | Description (1) | | | | | | | | Value | |
| | | | | |
| | | | Internet Software & Services (continued) | | | | | | | | | |
| | | | | |
| | 555 | | | Hortonworks Inc., (2), (3) | | | | | | | | $ | 10,800 | |
| | | | | |
| | 4,213 | | | Internap Network Services Corporation, (3) | | | | | | | | | 28,480 | |
| | | | | |
| | 3,046 | | | Intralinks Holdings Inc., (3) | | | | | | | | | 26,653 | |
| | | | | |
| | 3,566 | | | J2 Global Inc., (2) | | | | | | | | | 276,543 | |
| | | | | |
| | 4,452 | | | Limelight Networks Inc., (3) | | | | | | | | | 9,082 | |
| | | | | |
| | 1,778 | | | Liquidity Services, Inc., (3) | | | | | | | | | 14,562 | |
| | | | | |
| | 4,204 | | | Liveperson, Inc., (3) | | | | | | | | | 32,791 | |
| | | | | |
| | 1,822 | | | LogMeIn Inc., (3) | | | | | | | | | 122,730 | |
| | | | | |
| | 2,650 | | | Marchex, Inc. | | | | | | | | | 11,448 | |
| | | | | |
| | 2,042 | | | Marin Software Inc., (3) | | | | | | | | | 7,310 | |
| | | | | |
| | 2,573 | | | Marketo Inc., (2), (3) | | | | | | | | | 75,723 | |
| | | | | |
| | 506 | | | MaxPoint Interactive, Inc., (3) | | | | | | | | | 2,439 | |
| | | | | |
| | 528 | | | MINDBODY, Inc., Class A Shares, (2), (3) | | | | | | | | | 8,258 | |
| | | | | |
| | 7,058 | | | Monster Worldwide Inc., (3) | | | | | | | | | 44,254 | |
| | | | | |
| | 444 | | | New Relic, Inc., (3) | | | | | | | | | 17,605 | |
| | | | | |
| | 4,848 | | | NIC, Incorporated | | | | | | | | | 91,967 | |
| | | | | |
| | 1,933 | | | OPOWER Inc., (2), (3) | | | | | | | | | 18,653 | |
| | | | | |
| | 4,515 | | | Quotient Technology Inc., (2), (3) | | | | | | | | | 25,013 | |
| | | | | |
| | 1,440 | | | Q2 Holdings Inc., (3) | | | | | | | | | 35,496 | |
| | | | | |
| | 2,613 | | | QuinStreet, Inc., (3) | | | | | | | | | 14,502 | |
| | | | | |
| | 1,780 | | | RealNetworks Inc., (3) | | | | | | | | | 6,906 | |
| | | | | |
| | 600 | | | Reis, Inc. | | | | | | | | | 14,604 | |
| | | | | |
| | 2,841 | | | RetailMeNot Inc., (3) | | | | | | | | | 24,972 | |
| | | | | |
| | 1,952 | | | Rocket Fuel Inc., (2), (3) | | | | | | | | | 8,979 | |
| | | | | |
| | 2,041 | | | SciQuest Inc., (3) | | | | | | | | | 24,206 | |
| | | | | |
| | 1,452 | | | Shutterstock Incorporated, (2), (3) | | | | | | | | | 41,353 | |
| | | | | |
| | 1,257 | | | SPS Commerce Inc., (3) | | | | | | | | | 90,278 | |
| | | | | |
| | 1,055 | | | Stamps.com Inc., (2), (3) | | | | | | | | | 79,769 | |
| | | | | |
| | 1,286 | | | TechTarget Inc., (3) | | | | | | | | | 11,998 | |
| | | | | |
| | 1,445 | | | Textura Corporation, (2), (3) | | | | | | | | | 42,425 | |
| | | | | |
| | 572 | | | Travelzoo Inc., (3) | | | | | | | | | 5,114 | |
| | | | | |
| | 3,619 | | | TrueCar Inc., (2), (3) | | | | | | | | | 22,221 | |
| | | | | |
| | 1,086 | | | United Online, Inc. | | | | | | | | | 12,684 | |
| | | | | |
| | 3,242 | | | Web.com, Inc., (3) | | | | | | | | | 76,090 | |
| | | | | |
| | 2,796 | | | WebMD Health Corporation, Class A, (2), (3) | | | | | | | | | 113,685 | |
| | | | | |
| | 1,384 | | | Wix.com Limited, (3) | | | | | | | | | 30,614 | |
| | | | | |
| | 571 | | | Xactly Corp., (3) | | | | | | | | | 5,310 | |
| | | | | |
| | 2,088 | | | XO Group, Incorporated, (3) | | | | | | | | | 31,591 | |
| | | | | |
| | 2,397 | | | Xoom Corporation, (3) | | | | | | | | | 59,781 | |
| | | | Total Internet Software & Services | | | | | | | | | 3,021,629 | |
| | | | | | | | | | | | | | |
| Shares | | | Description (1) | | | | | | | | Value | |
| | | | | |
| | | | IT Services – 2.5% | | | | | | | | | |
| | | | | |
| | 1,464 | | | 6D Global Technologies Inc., (2), (3), (4) | | | | | | | | $ | 426 | |
| | | | | |
| | 5,782 | | | Acxiom Corporation, (3) | | | | | | | | | 127,898 | |
| | | | | |
| | 4,015 | | | Blackhawk Network Holdings Inc., (3) | | | | | | | | | 170,959 | |
| | | | | |
| | 1,823 | | | CACI International Inc., (3) | | | | | | | | | 176,904 | |
| | | | | |
| | 3,319 | | | Cardtronics Inc., (2), (3) | | | | | | | | | 114,506 | |
| | | | | |
| | 858 | | | Cass Information Systems, Inc. | | | | | | | | | 44,753 | |
| | | | | |
| | 6,217 | | | Ciber, Inc., (3) | | | | | | | | | 22,195 | |
| | | | | |
| | 7,309 | | | Convergys Corporation, (2) | | | | | | | | | 187,622 | |
| | | | | |
| | 2,422 | | | CSG Systems International Inc. | | | | | | | | | 81,185 | |
| | | | | |
| | 1,527 | | | Datalink Corporation, (3) | | | | | | | | | 11,147 | |
| | | | | |
| | 3,618 | | | EPAM Systems Inc., (3) | | | | | | | | | 279,852 | |
| | | | | |
| | 3,837 | | | Euronet Worldwide, Inc., (3) | | | | | | | | | 307,881 | |
| | | | | |
| | 4,855 | | | Everi Holdings Inc., (3) | | | | | | | | | 22,721 | |
| | | | | |
| | 4,865 | | | Evertec Inc. | | | | | | | | | 88,738 | |
| | | | | |
| | 2,535 | | | Exlservice Holdings, Inc., (3) | | | | | | | | | 112,199 | |
| | | | | |
| | 743 | | | Forrester Research, Inc., (2) | | | | | | | | | 23,977 | |
| | | | | |
| | 1,771 | | | Hackett Group, Inc. | | | | | | | | | 26,352 | |
| | | | | |
| | 2,707 | | | Heartland Payment Systems Inc. | | | | | | | | | 200,318 | |
| | | | | |
| | 4,853 | | | Lionbridge Technologies, Inc., (3) | | | | | | | | | 26,158 | |
| | | | | |
| | 1,357 | | | Luxoft Holding Inc., (3) | | | | | | | | | 90,430 | |
| | | | | |
| | 1,858 | | | ManTech International Corporation, Class A | | | | | | | | | 53,696 | |
| | | | | |
| | 4,873 | | | Maximus Inc., (2) | | | | | | | | | 332,339 | |
| | | | | |
| | 2,867 | | | ModusLink Global Solutions Inc., (3) | | | | | | | | | 8,286 | |
| | | | | |
| | 2,263 | | | Moneygram International Inc., (3) | | | | | | | | | 22,879 | |
| | | | | |
| | 4,095 | | | NeuStar, Inc., (2), (3) | | | | | | | | | 111,343 | |
| | | | | |
| | 2,681 | | | Perficient, Inc., (3) | | | | | | | | | 44,826 | |
| | | | | |
| | 892 | | | PFSweb, Inc., (3) | | | | | | | | | 14,290 | |
| | | | | |
| | 3,402 | | | Science Applications International Corporation | | | | | | | | | 156,016 | |
| | | | | |
| | 4,356 | | | ServiceSource International Inc., (3) | | | | | | | | | 18,600 | |
| | | | | |
| | 3,055 | | | Sykes Enterprises Inc., (3) | | | | | | | | | 88,595 | |
| | | | | |
| | 2,321 | | | Syntel Inc. | | | | | | | | | 109,180 | |
| | | | | |
| | 1,202 | | | TeleTech Holdings, Inc. | | | | | | | | | 34,978 | |
| | | | | |
| | 3,693 | | | Unisys Corporation, (2), (3) | | | | | | | | | 49,486 | |
| | | | | |
| | 2,193 | | | Virtusa Corporation, (3) | | | | | | | | | 125,944 | |
| | | | Total IT Services | | | | | | | | | 3,286,679 | |
| | | | | |
| | | | Leisure Products – 0.3% | | | | | | | | | |
| | | | | |
| | 1,001 | | | Arctic Cat, Inc., (2) | | | | | | | | | 20,561 | |
| | | | | |
| | 1,752 | | | Black Diamond Group Inc., (3) | | | | | | | | | 9,706 | |
| | | | | |
| | 5,924 | | | Callaway Golf Company | | | | | | | | | 58,944 | |
| | | | | |
| | 799 | | | Escalade, Inc. | | | | | | | | | 11,849 | |
Nuveen Small Cap Index Fund (continued)
| | |
| Portfolio of Investments | | October 31, 2015 |
| | | | | | | | | | | | | | |
| Shares | | | Description (1) | | | | | | | | Value | |
| | | | | |
| | | | Leisure Products (continued) | | | | | | | | | |
| | | | | |
| | 1,447 | | | JAKKS Pacific Inc., (2) | | | | | | | | $ | 11,460 | |
| | | | | |
| | 413 | | | Johnson Outdoors, Inc. | | | | | | | | | 8,851 | |
| | | | | |
| | 1,320 | | | Malibu Boats Inc., Class A, (3) | | | | | | | | | 18,757 | |
| | | | | |
| | 877 | | | Marine Products Corporation | | | | | | | | | 6,200 | |
| | | | | |
| | 515 | | | MCBC Holdings, Inc., (3) | | | | | | | | | 6,783 | |
| | | | | |
| | 2,419 | | | Nautilus Group, Inc., (3) | | | | | | | | | 41,220 | |
| | | | | |
| | 3,354 | | | Performance Sports Group Limited, (2), (3) | | | | | | | | | 38,504 | |
| | | | | |
| | 3,977 | | | Smith & Wesson Holding Corporation, (3) | | | | | | | | | 71,029 | |
| | | | | |
| | 1,382 | | | Sturm, Ruger, & Company, (2) | | | | | | | | | 78,691 | |
| | | | Total Leisure Products | | | | | | | | | 382,555 | |
| | | | | |
| | | | Life Sciences Tools & Services – 0.6% | | | | | | | | | |
| | | | | |
| | 1,591 | | | Accelerate Diagnostics Inc., (2), (3) | | | | | | | | | 26,681 | |
| | | | | |
| | 5,719 | | | Affymetrix, Inc., (2), (3) | | | | | | | | | 52,615 | |
| | | | | |
| | 1,827 | | | Albany Molecular Research Inc., (2), (3) | | | | | | | | | 32,959 | |
| | | | | |
| | 2,316 | | | Cambrex Corporation, (3) | | | | | | | | | 106,467 | |
| | | | | |
| | 2,177 | | | Fluidigm Corporation, (3) | | | | | | | | | 23,533 | |
| | | | | |
| | 2,475 | | | Harvard Bioscience, Inc., (3) | | | | | | | | | 7,277 | |
| | | | | |
| | 959 | | | INC Research Holdings Inc., Class A Shares, (3) | | | | | | | | | 40,000 | |
| | | | | |
| | 2,909 | | | Luminex Corporation, (3) | | | | | | | | | 52,944 | |
| | | | | |
| | 992 | | | NanoString Technologies, Inc., (3) | | | | | | | | | 14,394 | |
| | | | | |
| | 3,960 | | | NeoGenomics Inc., (3) | | | | | | | | | 27,918 | |
| | | | | |
| | 4,710 | | | Pacific Biosciences of California Inc., (3) | | | | | | | | | 33,441 | |
| | | | | |
| | 4,080 | | | Parexel International Corporation, (3) | | | | | | | | | 257,530 | |
| | | | | |
| | 1,512 | | | PRA Health Sciences, Inc., (2), (3) | | | | | | | | | 52,980 | |
| | | | | |
| | 9,028 | | | Sequenom, Inc., (2), (3) | | | | | | | | | 15,799 | |
| | | | Total Life Sciences Tools & Services | | | | | | | | | 744,538 | |
| | | | | |
| | | | Machinery – 2.5% | | | | | | | | | |
| | | | | |
| | 2,985 | | | Accuride Corporation, (3) | | | | | | | | | 8,418 | |
| | | | | |
| | 4,406 | | | Actuant Corporation | | | | | | | | | 100,457 | |
| | | | | |
| | 553 | | | Alamo Group Inc. | | | | | | | | | 25,947 | |
| | | | | |
| | 2,184 | | | Albany International Corporation, Class A | | | | | | | | | 82,053 | |
| | | | | |
| | 1,953 | | | Altra Industrial Motion, Inc., (2) | | | | | | | | | 51,676 | |
| | | | | |
| | 733 | | | American Railcar Industries, (2) | | | | | | | | | 42,309 | |
| | | | | |
| | 1,402 | | | Astec Industries Inc. | | | | | | | | | 45,565 | |
| | | | | |
| | 4,053 | | | Barnes Group Inc. | | | | | | | | | 152,352 | |
| | | | | |
| | 3,597 | | | Blount International Inc., (3) | | | | | | | | | 21,834 | |
| | | | | |
| | 3,299 | | | Briggs & Stratton Corporation | | | | | | | | | 58,623 | |
| | | | | |
| | 2,259 | | | Chart Industries, Inc., (3) | | | | | | | | | 38,832 | |
| | | | | |
| | 1,269 | | | CIRCOR International Inc., (2) | | | | | | | | | 58,272 | |
| | | | | | | | | | | | | | |
| Shares | | | Description (1) | | | | | | | | Value | |
| | | | | |
| | | | Machinery (continued) | | | | | | | | | |
| | | | | |
| | 3,710 | | | CLARCOR, Inc., (2) | | | | | | | | $ | 184,981 | |
| | | | | |
| | 1,625 | | | Columbus McKinnon Corporation NY | | | | | | | | | 30,371 | |
| | | | | |
| | 1,998 | | | Commercial Vehicle Group Inc., (3) | | | | | | | | | 8,312 | |
| | | | | |
| | 1,728 | | | Douglas Dynamics Inc. | | | | | | | | | 37,912 | |
| | | | | |
| | 1,689 | | | EnPro Industries Inc. | | | | | | | | | 82,947 | |
| | | | | |
| | 1,930 | | | ESCO Technologies Inc. | | | | | | | | | 71,584 | |
| | | | | |
| | 769 | | | ExOne Company, (2), (3) | | | | | | | | | 8,228 | |
| | | | | |
| | 4,625 | | | Federal Signal Corporation | | | | | | | | | 69,652 | |
| | | | | |
| | 936 | | | Freightcar America Inc. | | | | | | | | | 17,016 | |
| | | | | |
| | 1,654 | | | Global Brass & Copper Holdings Inc. | | | | | | | | | 37,198 | |
| | | | | |
| | 1,410 | | | Gorman-Rupp Company | | | | | | | | | 40,312 | |
| | | | | |
| | 782 | | | Graham Corporation | | | | | | | | | 13,271 | |
| | | | | |
| | 1,952 | | | Greenbrier Companies Inc., (2) | | | | | | | | | 74,254 | |
| | | | | |
| | 5,924 | | | Harsco Corporation | | | | | | | | | 63,565 | |
| | | | | |
| | 4,655 | | | Hillenbrand Inc. | | | | | | | | | 138,114 | |
| | | | | |
| | 538 | | | Hurco Companies, Inc. | | | | | | | | | 14,456 | |
| | | | | |
| | 701 | | | Hyster-Yale Materials Handling Inc. | | | | | | | | | 41,023 | |
| | | | | |
| | 2,162 | | | John Bean Technologies Corporation | | | | | | | | | 96,987 | |
| | | | | |
| | 866 | | | Kadant Inc. | | | | | | | | | 35,610 | |
| | | | | |
| | 769 | | | LB Foster Company | | | | | | | | | 11,327 | |
| | | | | |
| | 874 | | | Lindsay Manufacturing Company, (2) | | | | | | | | | 59,240 | |
| | | | | |
| | 1,320 | | | Lydall Inc., (3) | | | | | | | | | 45,184 | |
| | | | | |
| | 7,222 | | | Meritor Inc., (3) | | | | | | | | | 78,503 | |
| | | | | |
| | 936 | | | Midwest Air Group Inc. | | | | | | | | | 21,228 | |
| | | | | |
| | 887 | | | Milacron Holdings Corporation, (3) | | | | | | | | | 15,141 | |
| | | | | |
| | 4,214 | | | Mueller Industries Inc. | | | | | | | | | 132,825 | |
| | | | | |
| | 11,900 | | | Mueller Water Products Inc. | | | | | | | | | 104,720 | |
| | | | | |
| | 3,774 | | | Navistar International Corporation, (2), (3) | | | | | | | | | 46,420 | |
| | | | | |
| | 1,983 | | | NN, Incorporated, (2) | | | | | | | | | 27,365 | |
| | | | | |
| | 230 | | | OmegaFlex, Inc., (3) | | | | | | | | | 9,508 | |
| | | | | |
| | 1,723 | | | Proto Labs Incorporated, (2), (3) | | | | | | | | | 111,719 | |
| | | | | |
| | 1,731 | | | RBC Bearings Inc., (2), (3) | | | | | | | | | 118,383 | |
| | | | | |
| | 7,531 | | | Rexnord Corporation, (3) | | | | | | | | | 139,173 | |
| | | | | |
| | 945 | | | Standex International Corporation | | | | | | | | | 84,785 | |
| | | | | |
| | 1,680 | | | Sun Hydraulics Corporation | | | | | | | | | 49,207 | |
| | | | | |
| | 1,361 | | | Tennant Company | | | | | | | | | 78,829 | |
| | | | | |
| | 3,416 | | | Titan International Inc. | | | | | | | | | 24,254 | |
| | | | | |
| | 3,350 | | | TriMas Corporation, (3) | | | | | | | | | 67,033 | |
| | | | | |
| | 640 | | | Twin Disc, Inc. | | | | | | | | | 7,539 | |
| | | | | |
| | 5,023 | | | Wabash National Corporation, (2), (3) | | | | | | | | | 60,125 | |
Nuveen Small Cap Index Fund (continued)
| | |
| Portfolio of Investments | | October 31, 2015 |
| | | | | | | | | | | | | | |
| Shares | | | Description (1) | | | | | | | | Value | |
| | | | | |
| | | | Machinery (continued) | | | | | | | | | |
| | | | | |
| | 2,083 | | | Watts Water Technologies, Inc., (2) | | | | | | | | $ | 113,399 | |
| | | | | |
| | 4,831 | | | Woodward Governor Company, (2) | | | | | | | | | 219,811 | |
| | | | | |
| | 846 | | | Xerium Technologies, (2), (3) | | | | | | | | | 11,421 | |
| | | | Total Machinery | | | | | | | | | 3,389,270 | |
| | | | | |
| | | | Marine – 0.2% | | | | | | | | | |
| | | | | |
| | 1,643 | | | Eagle Bulk Shipping Inc., (2), (3) | | | | | | | | | 10,022 | |
| | | | | |
| | 5,375 | | | Golden Ocean Group Limited, (2), (3) | | | | | | | | | 10,589 | |
| | | | | |
| | 3,214 | | | Matson Incorporated | | | | | | | | | 147,298 | |
| | | | | |
| | 6,401 | | | Navios Maritime Holdings Inc., (2) | | | | | | | | | 13,506 | |
| | | | | |
| | 3,139 | | | Safe Bulkers Inc., (2) | | | | | | | | | 9,668 | |
| | | | | |
| | 24,796 | | | Scorpio Bulkers Inc., (2), (3) | | | | | | | | | 34,714 | |
| | | | | |
| | 1,781 | | | Ultrapetrol Limited, (3) | | | | | | | | | 802 | |
| | | | Total Marine | | | | | | | | | 226,599 | |
| | | | | |
| | | | Media – 1.5% | | | | | | | | | |
| | | | | |
| | 1,632 | | | AMC Entertainment Holdings Inc. | | | | | | | | | 44,668 | |
| | | | | |
| | 1,877 | | | Carmike Cinemas, Inc., (3) | | | | | | | | | 48,070 | |
| | | | | |
| | 5,684 | | | Central European Media Enterprises Limited, (2), (3) | | | | | | | | | 12,277 | |
| | | | | |
| | 2,888 | | | Crown Media Holdings, Inc., (3) | | | | | | | | | 16,722 | |
| | | | | |
| | 10,548 | | | Cumulus Media, Inc., (3) | | | | | | | | | 4,843 | |
| | | | | |
| | 77 | | | Daily Journal Corporation, (3) | | | | | | | | | 15,762 | |
| | | | | |
| | 5,618 | | | Dreamworks Animation SKG Inc., (2), (3) | | | | | | | | | 113,708 | |
| | | | | |
| | 4,322 | | | E.W. Scripps Company, Class A, (2) | | | | | | | | | 95,343 | |
| | | | | |
| | 1,993 | | | Entercom Communications Corporation, (3) | | | | | | | | | 22,003 | |
| | | | | |
| | 4,596 | | | Entravision Communications Corporation | | | | | | | | | 40,261 | |
| | | | | |
| | 2,092 | | | Eros International PLC, (2), (3) | | | | | | | | | 23,368 | |
| | | | | |
| | 3,428 | | | Global Eagle Acquisition Corporation, (3) | | | | | | | | | 45,661 | |
| | | | | |
| | 4,746 | | | Gray Television Inc. | | | | | | | | | 75,414 | |
| | | | | |
| | 3,818 | | | Harte-Hanks Inc. | | | | | | | | | 16,227 | |
| | | | | |
| | 648 | | | Hemisphere Media Group Inc., (2), (3) | | | | | | | | | 8,767 | |
| | | | | |
| | 4,467 | | | Imax Corporation, (2), (3) | | | | | | | | | 171,488 | |
| | | | | |
| | 1,804 | | | Journal Media Group Inc. | | | | | | | | | 22,081 | |
| | | | | |
| | 969 | | | Loral Space & Communications, Inc., (3) | | | | | | | | | 43,324 | |
| | | | | |
| | 2,279 | | | Martha Stewart Living Omnimedia Inc., (3) | | | | | | | | | 13,765 | |
| | | | | |
| | 3,309 | | | MDC Partners, Inc. | | | | | | | | | 68,761 | |
| | | | | |
| | 7,088 | | | Media General Inc. | | | | | | | | | 105,328 | |
| | | | | |
| | 2,718 | | | Meredith Corporation, (2) | | | | | | | | | 127,800 | |
| | | | | |
| | 4,547 | | | National CineMedia, Inc. | | | | | | | | | 64,567 | |
| | | | | |
| | 3,432 | | | New Media Investment Group Inc. | | | | | | | | | 55,255 | |
| | | | | |
| | 10,171 | | | New York Times, Class A | | | | | | | | | 135,071 | |
| | | | | |
| | 2,315 | | | Nexstar Broadcasting Group, Inc., (2) | | | | | | | | | 123,227 | |
| | | | | | | | | | | | | | |
| Shares | | | Description (1) | | | | | | | | Value | |
| | | | | |
| | | | Media (continued) | | | | | | | | | |
| | | | | |
| | 1,341 | | | Reading International Inc., A, (3) | | | | | | | | $ | 20,785 | |
| | | | | |
| | 939 | | | Rentrak Corporation, (3) | | | | | | | | | 51,814 | |
| | | | | |
| | 291 | | | Saga Communications Inc. Class A Shares | | | | | | | | | 12,519 | |
| | | | | |
| | 1,973 | | | Scholastic Corporation | | | | | | | | | 80,637 | |
| | | | | |
| | 3,426 | | | SFX Entertainment Inc., (2), (3) | | | | | | | | | 3,187 | |
| | | | | |
| | 4,900 | | | Sinclair Broadcast Group, Series A, (2) | | | | | | | | | 147,049 | |
| | | | | |
| | 1,774 | | | Sizmek Inc., (3) | | | | | | | | | 10,520 | |
| | | | | |
| | 717 | | | T2 Biosystems, Inc., (2), (3) | | | | | | | | | 7,858 | |
| | | | | |
| | 8,100 | | | Time Inc. | | | | | | | | | 150,498 | |
| | | | | |
| | 1,945 | | | Tribune Publishing Company | | | | | | | | | 18,361 | |
| | | | | |
| | 2,307 | | | World Wrestling Entertainment Inc., (2) | | | | | | | | | 41,134 | |
| | | | Total Media | | | | | | | | | 2,058,123 | |
| | | | | |
| | | | Metals & Mining – 0.7% | | | | | | | | | |
| | | | | |
| | 13,151 | | | AK Steel Holding Corporation, (2) | | | | | | | | | 38,006 | |
| | | | | |
| | 3,729 | | | Carpenter Technology Inc., (2) | | | | | | | | | 124,213 | |
| | | | | |
| | 3,645 | | | Century Aluminum Company, (3) | | | | | | | | | 13,195 | |
| | | | | |
| | 11,338 | | | Cliffs Natural Resources Inc., (2) | | | | | | | | | 31,293 | |
| | | | | |
| | 10,056 | | | Coeur d’Alene Mines Corporation, (3) | | | | | | | | | 27,151 | |
| | | | | |
| | 8,560 | | | Commercial Metals Company | | | | | | | | | 123,007 | |
| | | | | |
| | 4,806 | | | Globe Specialty Metals Inc. | | | | | | | | | 60,652 | |
| | | | | |
| | 194 | | | Handy & Harman Limited, (3) | | | | | | | | | 4,608 | |
| | | | | |
| | 961 | | | Haynes International Inc. | | | | | | | | | 37,911 | |
| | | | | |
| | 27,393 | | | Hecla Mining Company, (2) | | | | | | | | | 56,704 | |
| | | | | |
| | 4,327 | | | Horsehead Holding Corp., (2), (3) | | | | | | | | | 12,289 | |
| | | | | |
| | 1,269 | | | Kaiser Aluminum Corporation, (2) | | | | | | | | | 103,157 | |
| | | | | |
| | 1,491 | | | Materion Corporation | | | | | | | | | 44,954 | |
| | | | | |
| | 755 | | | Olympic Steel Inc. | | | | | | | | | 7,225 | |
| | | | | |
| | 1,810 | | | Real Industry, Inc., (3) | | | | | | | | | 17,195 | |
| | | | | |
| | 885 | | | Ryerson Holding Corporation, (3) | | | | | | | | | 5,177 | |
| | | | | |
| | 2,041 | | | Schnitzer Steel Industries, Inc. | | | | | | | | | 34,411 | |
| | | | | |
| | 8,926 | | | Stillwater Mining Company, (2), (3) | | | | | | | | | 83,369 | |
| | | | | |
| | 4,825 | | | SunCoke Energy Inc. | | | | | | | | | 23,932 | |
| | | | | |
| | 2,952 | | | TimkenSteel Corporation | | | | | | | | | 31,409 | |
| | | | | |
| | 3,551 | | | Worthington Industries, Inc. | | | | | | | | | 109,016 | |
| | | | Total Metals & Mining | | | | | | | | | 988,874 | |
| | | | | |
| | | | Multiline Retail – 0.4% | | | | | | | | | |
| | | | | |
| | 3,659 | | | Big Lots, Inc., (2) | | | | | | | | | 168,680 | |
| | | | | |
| | 5,577 | | | Burlington Store Inc., (2), (3) | | | | | | | | | 268,142 | |
| | | | | |
| | 2,858 | | | Freds Inc. | | | | | | | | | 39,526 | |
Nuveen Small Cap Index Fund (continued)
| | |
| Portfolio of Investments | | October 31, 2015 |
| | | | | | | | | | | | | | |
| Shares | | | Description (1) | | | | | | | | Value | |
| | | | | |
| | | | Multiline Retail (continued) | | | | | | | | | |
| | | | | |
| | 758 | | | Ollie’s Bargain Outlet Holdings, Inc., (3) | | | | | | | | $ | 12,014 | |
| | | | | |
| | 3,256 | | | Tuesday Morning Corporation, (3) | | | | | | | | | 17,615 | |
| | | | Total Multiline Retail | | | | | | | | | 505,977 | |
| | | | | |
| | | | Multi-Utilities – 0.4% | | | | | | | | | |
| | | | | |
| | 4,666 | | | Avista Corporation | | | | | | | | | 157,944 | |
| | | | | |
| | 3,462 | | | Black Hills Corporation | | | | | | | | | 158,490 | |
| | | | | |
| | 3,350 | | | Northwestern Corporation, (2) | | | | | | | | | 181,537 | |
| | | | Total Multi-Utilities | | | | | | | | | 497,971 | |
| | | | | |
| | | | Oil, Gas & Consumable Fuels – 2.0% | | | | | | | | | |
| | | | | |
| | 7,168 | | | Abraxas Petroleum Corporation, (3) | | | | | | | | | 11,397 | |
| | | | | |
| | 166 | | | Adams Resources and Energy, Incorporated | | | | | | | | | 7,380 | |
| | | | | |
| | 2,310 | | | Alon USA Energy, Inc. | | | | | | | | | 38,693 | |
| | | | | |
| | 2,673 | | | Approach Resources Inc., (2), (3) | | | | | | | | | 6,308 | |
| | | | | |
| | 1,456 | | | Ardmore Shipping Corporation | | | | | | | | | 20,894 | |
| | | | | |
| | 3,855 | | | Bill Barrett Corporation, (2), (3) | | | | | | | | | 18,774 | |
| | | | | |
| | 3,677 | | | Bonanza Creek Energy Inc., (3) | | | | | | | | | 20,922 | |
| | | | | |
| | 5,104 | | | Callon Petroleum Company Del, (3) | | | | | | | | | 44,303 | |
| | | | | |
| | 4,314 | | | Carrizo Oil & Gas, Inc., (3) | | | | | | | | | 162,336 | |
| | | | | |
| | 456 | | | Clayton Williams Energy, (2), (3) | | | | | | | | | 27,164 | |
| | | | | |
| | 5,267 | | | Clean Energy Fuels Corporation, (2), (3) | | | | | | | | | 29,759 | |
| | | | | |
| | 4,726 | | | Cloud Peak Energy Inc., (2), (3) | | | | | | | | | 14,036 | |
| | | | | |
| | 1,350 | | | Contango Oil & Gas Company, (3) | | | | | | | | | 10,328 | |
| | | | | |
| | 4,243 | | | Delek US Holdings Inc. | | | | | | | | | 115,410 | |
| | | | | |
| | 6,868 | | | DHT Maritime Inc. | | | | | | | | | 53,982 | |
| | | | | |
| | 1,851 | | | Dorian LPG Limited, (3) | | | | | | | | | 21,805 | |
| | | | | |
| | 3,553 | | | Eclipse Resources Corporation, (2), (3) | | | | | | | | | 7,639 | |
| | | | | |
| | 3,232 | | | Energy Fuels, Inc., (2), (3) | | | | | | | | | 8,791 | |
| | | | | |
| | 7,271 | | | Energy XXI Limited Bermuda, (2) | | | | | | | | | 12,579 | |
| | | | | |
| | 1,025 | | | Erin Energy Corporation, (2), (3) | | | | | | | | | 4,100 | |
| | | | | |
| | 1,412 | | | Evolution Petroleum Corporation | | | | | | | | | 9,743 | |
| | | | | |
| | 12,249 | | �� | Exco Resources Inc., (2) | | | | | | | | | 13,719 | |
| | | | | |
| | 7,993 | | | Frontline Limited, (2) | | | | | | | | | 25,258 | |
| | | | | |
| | 3,079 | | | GasLog Limited, (2) | | | | | | | | | 35,624 | |
| | | | | |
| | 5,997 | | | Gastar Exploration Inc., (2), (3) | | | | | | | | | 9,415 | |
| | | | | |
| | 1,245 | | | Gener8 Maritime Inc., (3) | | | | | | | | | 12,948 | |
| | | | | |
| | 2,807 | | | Green Plains Renewable Energy, Inc. | | | | | | | | | 57,572 | |
| | | | | |
| | 27,162 | | | Halcon Resources Corporation, (2), (3) | | | | | | | | | 19,043 | |
| | | | | |
| | 672 | | | Hallador Energy Company, (2) | | | | | | | | | 4,092 | |
| | | | | |
| | 77 | | | Isramco, Inc., (3) | | | | | | | | | 7,315 | |
| | | | | | | | | | | | | | |
| Shares | | | Description (1) | | | | | | | | Value | |
| | | | | |
| | | | Oil, Gas & Consumable Fuels (continued) | | | | | | | | | |
| | | | | |
| | 2,142 | | | Jones Energy Inc., Class A, (3) | | | | | | | | $ | 11,010 | |
| | | | | |
| | 15,415 | | | Magnum Hunter Resources Corporation, (3) | | | | | | | | | 4,103 | |
| | | | | |
| | 5,411 | | | Matador Resources Company, (2), (3) | | | | | | | | | 139,117 | |
| | | | | |
| | 6,632 | | | Navios Maritime Acquisition Corporation | | | | | | | | | 23,743 | |
| | | | | |
| | 6,596 | | | Nordic American Tanker Shipping Ltd, (2) | | | | | | | | | 100,787 | |
| | | | | |
| | 4,735 | | | Northern Oil and Gas Inc., (2), (3) | | | | | | | | | 23,864 | |
| | | | | |
| | 10,296 | | | Oasis Petroleum Inc., (2), (3) | | | | | | | | | 119,742 | |
| | | | | |
| | 2,355 | | | Pacific Ethanol, Inc., (3) | | | | | | | | | 14,154 | |
| | | | | |
| | 1,160 | | | Panhandle Oil and Gas Inc. | | | | | | | | | 21,321 | |
| | | | | |
| | 1,184 | | | Par Petroleum Corporation, (3) | | | | | | | | | 26,995 | |
| | | | | |
| | 6,823 | | | Parsley Energy Inc. Class A Shares, (2), (3) | | | | | | | | | 120,972 | |
| | | | | |
| | 2,963 | | | PDC Energy Inc., (2), (3) | | | | | | | | | 178,787 | |
| | | | | |
| | 1,369 | | | Peabody Energy Corporation, (2) | | | | | | | | | 17,510 | |
| | | | | |
| | 5,087 | | | Penn Virginia Corporation, (2) | | | | | | | | | 3,148 | |
| | | | | |
| | 3,250 | | | Renewable Energy Group Inc., (3) | | | | | | | | | 25,643 | |
| | | | | |
| | 3,768 | | | Rex Energy Inc., (2), (3) | | | | | | | | | 8,516 | |
| | | | | |
| | 429 | | | Rex Stores Corporation, (2), (3) | | | | | | | | | 23,556 | |
| | | | | |
| | 1,503 | | | Ring Energy Inc., (3) | | | | | | | | | 15,616 | |
| | | | | |
| | 4,856 | | | RSP Permian Inc., (2), (3) | | | | | | | | | 133,152 | |
| | | | | |
| | 3,951 | | | Sanchez Energy Corporation, (2), (3) | | | | | | | | | 23,508 | |
| | | | | |
| | 32,025 | | | SandRidge Energy Inc., (3) | | | | | | | | | 11,859 | |
| | | | | |
| | 13,227 | | | Scorpio Tankers Inc. | | | | | | | | | 120,630 | |
| | | | | |
| | 3,247 | | | SemGroup Corporation, A Shares | | | | | | | | | 147,901 | |
| | | | | |
| | 4,386 | | | Ship Financial International Limited, (2) | | | | | | | | | 74,957 | |
| | | | | |
| | 6,129 | | | Solazyme Inc., (2), (3) | | | | | | | | | 20,103 | |
| | | | | |
| | 4,355 | | | Stone Energy Corporation, (3) | | | | | | | | | 24,344 | |
| | | | | |
| | 7,697 | | | Synergy Resources Corporation, (3) | | | | | | | | | 86,129 | |
| | | | | |
| | 7,028 | | | Teekay Tankers Limited, Class A Shares | | | | | | | | | 53,694 | |
| | | | | |
| | 1,826 | | | TransAtlantic Petroleum Limited, (3) | | | | | | | | | 4,620 | |
| | | | | |
| | 3,449 | | | Triangle Petroleum Corporation, (3) | | | | | | | | | 4,139 | |
| | | | | |
| | 11,331 | | | Ultra Petroleum Corporation, (2), (3) | | | | | | | | | 62,094 | |
| | | | | |
| | 6,805 | | | Uranium Energy Corporation, (2), (3) | | | | | | | | | 7,622 | |
| | | | | |
| | 2,888 | | | W&T Offshore Inc., (2) | | | | | | | | | 9,415 | |
| | | | | |
| | 5,262 | | | Western Refining Inc. | | | | | | | | | 219,004 | |
| | | | | |
| | 1,225 | | | Westmoreland Coal Company, (2), (3) | | | | | | | | | 8,771 | |
| | | | Total Oil, Gas & Consumable Fuels | | | | | | | | | 2,721,855 | |
| | | | | |
| | | | Paper & Forest Products – 0.6% | | | | | | | | | |
| | | | | |
| | 2,923 | | | Boise Cascade Company, (3) | | | | | | | | | 87,485 | |
| | | | | |
| | 1,410 | | | Clearwater Paper Corporation, (3) | | | | | | | | | 71,106 | |
Nuveen Small Cap Index Fund (continued)
| | |
| Portfolio of Investments | | October 31, 2015 |
| | | | | | | | | | | | | | |
| Shares | | | Description (1) | | | | | | | | Value | |
| | | | | |
| | | | Paper & Forest Products (continued) | | | | | | | | | |
| | | | | |
| | 812 | | | Deltic Timber Corporation, (2) | | | | | | | | $ | 50,312 | |
| | | | | |
| | 3,341 | | | Glatfelter | | | | | | | | | 64,815 | |
| | | | | |
| | 6,299 | | | KapStone Paper and Packaging Corp. | | | | | | | | | 137,003 | |
| | | | | |
| | 10,537 | | | Louisiana-Pacific Corporation, (2), (3) | | | | | | | | | 186,083 | |
| | | | | |
| | 1,285 | | | Neenah Paper, Inc. | | | | | | | | | 86,622 | |
| | | | | |
| | 2,253 | | | Schweitzer-Mauduit International Inc. | | | | | | | | | 87,461 | |
| | | | | |
| | 3,033 | | | Wausau Paper Corp. | | | | | | | | | 30,967 | |
| | | | Total Paper & Forest Products | | | | | | | | | 801,854 | |
| | | | | |
| | | | Personal Products – 0.2% | | | | | | | | | |
| | | | | |
| | 2,005 | | | Elizabeth Arden, Inc., (2), (3) | | | | | | | | | 25,143 | |
| | | | | |
| | 1,290 | | | Inter Parfums, Inc. | | | | | | | | | 35,630 | |
| | | | | |
| | 803 | | | Medifast, Inc., (2), (3) | | | | | | | | | 22,460 | |
| | | | | |
| | 582 | | | Natural Health Trends Corporation, (2) | | | | | | | | | 28,669 | |
| | | | | |
| | 844 | | | Nature’s Sunshine Products | | | | | | | | | 10,001 | |
| | | | | |
| | 620 | | | Nutraceutical International Corporation, (3) | | | | | | | | | 15,190 | |
| | | | | |
| | 851 | | | Revlon Inc., (3) | | | | | | | | | 26,696 | |
| | | | | |
| | 1,442 | | | Synutra International Inc., (2), (3) | | | | | | | | | 8,234 | |
| | | | | |
| | 417 | | | USANA Health Sciences, Inc., (2), (3) | | | | | | | | | 53,626 | |
| | | | Total Personal Products | | | | | | | | | 225,649 | |
| | | | | |
| | | | Pharmaceuticals – 1.7% | | | | | | | | | |
| | | | | |
| | 1,517 | | | Aerie Pharmaceuticals Inc., (2), (3) | | | | | | | | | 34,603 | |
| | | | | |
| | 770 | | | Agile Therapeutics, Inc., (3) | | | | | | | | | 6,114 | |
| | | | | |
| | 2,034 | | | Alimera Sciences, Inc., (2), (3) | | | | | | | | | 6,122 | |
| | | | | |
| | 2,349 | | | Amphastar Pharmaceuticals, Inc., (3) | | | | | | | | | 27,812 | |
| | | | | |
| | 583 | | | ANI Pharmaceuticals Inc., (2), (3) | | | | | | | | | 24,393 | |
| | | | | |
| | 2,227 | | | Aratana Therapeutics Inc., (3) | | | | | | | | | 15,567 | |
| | | | | |
| | 1,062 | | | Assembly Biosciences Inc., (3) | | | | | | | | | 10,195 | |
| | | | | |
| | 3,246 | | | Biodelivery Sciences, Inc., (2), (3) | | | | | | | | | 17,463 | |
| | | | | |
| | 907 | | | Carbylan Therapeutics, Inc., (3) | | | | | | | | | 3,265 | |
| | | | | |
| | 6,185 | | | Catalent, Inc., (3) | | | | | | | | | 164,397 | |
| | | | | |
| | 2,352 | | | Cempra Inc., (2), (3) | | | | | | | | | 52,214 | |
| | | | | |
| | 493 | | | Collegium Pharmaceutical Inc., (2), (3) | | | | | | | | | 9,056 | |
| | | | | |
| | 4,436 | | | Corcept Therapeutics, Inc., (3) | | | | | | | | | 16,369 | |
| | | | | |
| | 642 | | | Corium International, Inc., (3) | | | | | | | | | 4,455 | |
| | | | | |
| | 4,497 | | | DepoMed, Inc., (3) | | | | | | | | | 78,698 | |
| | | | | |
| | 1,148 | | | Dermira, Inc., (3) | | | | | | | | | 30,985 | |
| | | | | |
| | 8,315 | | | Durect Corporation, (3) | | | | | | | | | 16,963 | |
| | | | | |
| | 2,909 | | | Endocyte Inc., (3) | | | | | | | | | 14,952 | |
| | | | | |
| | 417 | | | Flex Pharma Inc., (3) | | | | | | | | | 4,725 | |
| | | | | | | | | | | | | | |
| Shares | | | Description (1) | | | | | | | | Value | |
| | | | | |
| | | | Pharmaceuticals (continued) | | | | | | | | | |
| | | | | |
| | 1,673 | | | Foamix Pharmaceuticals Limited, (3) | | | | | | | | $ | 11,928 | |
| | | | | |
| | 421 | | | Heska Corporation, (3) | | | | | | | | | 12,950 | |
| | | | | |
| | 5,303 | | | Impax Laboratories Inc., (2), (3) | | | | | | | | | 183,643 | |
| | | | | |
| | 1,216 | | | Intersect ENT, Inc., (3) | | | | | | | | | 23,299 | |
| | | | | |
| | 1,972 | | | Intra-Cellular Therapies Inc., (2), (3) | | | | | | | | | 94,360 | |
| | | | | |
| | 1,994 | | | Lannett Company Inc., (2), (3) | | | | | | | | | 89,271 | |
| | | | | |
| | 4,899 | | | Medicines Company, (2), (3) | | | | | | | | | 167,742 | |
| | | | | |
| | 9,847 | | | Nektar Therapeutics, (2), (3) | | | | | | | | | 116,884 | |
| | | | | |
| | 407 | | | Neos Therapeutics Inc., (3) | | | | | | | | | 5,763 | |
| | | | | |
| | 1,110 | | | Ocular Therapeutic, Inc., (2), (3) | | | | | | | | | 9,579 | |
| | | | | |
| | 2,799 | | | Omeros Corporation, (2), (3) | | | | | | | | | 35,071 | |
| | | | | |
| | 2,696 | | | Pacira Pharmaceuticals, Inc., (2), (3) | | | | | | | | | 134,665 | |
| | | | | |
| | 902 | | | Paratek Pharmaceuticals, Inc., (3) | | | | | | | | | 15,659 | |
| | | | | |
| | 3,220 | | | Pernix Therapeutics Holdings, Incorporated, (2), (3) | | | | | | | | | 9,048 | |
| | | | | |
| | 1,291 | | | Phibro Animal Health Corporation, Class A Shares | | | | | | | | | 43,068 | |
| | | | | |
| | 2,120 | | | Pozen Inc., (2), (3) | | | | | | | | | 12,402 | |
| | | | | |
| | 3,868 | | | Prestige Brands Holdings Inc., (2), (3) | | | | | | | | | 189,571 | |
| | | | | |
| | 2,411 | | | Relypsa Inc., (2), (3) | | | | | | | | | 38,552 | |
| | | | | |
| | 1,157 | | | Revance Therapeutics Inc., (2), (3) | | | | | | | | | 45,320 | |
| | | | | |
| | 1,568 | | | Sagent Pharmaceuticals Inc., (3) | | | | | | | | | 26,358 | |
| | | | | |
| | 3,668 | | | SciClone Pharmaceuticals, Inc., (3) | | | | | | | | | 27,950 | |
| | | | | |
| | 1,839 | | | Sucampo Pharmaceuticals, Inc., (2), (3) | | | | | | | | | 35,603 | |
| | | | | |
| | 2,539 | | | Supernus Pharmaceuticals Incorporated, (3) | | | | | | | | | 41,893 | |
| | | | | |
| | 3,058 | | | Teligent, Inc., (2), (3) | | | | | | | | | 22,232 | |
| | | | | |
| | 2,672 | | | Tetraphase Pharmaceuticals Inc., (2), (3) | | | | | | | | | 24,128 | |
| | | | | |
| | 9,393 | | | TherapeuticsMD, (2), (3) | | | | | | | | | 55,137 | |
| | | | | |
| | 1,824 | | | Theravance Biopharma Inc., (3) | | | | | | | | | 27,269 | |
| | | | | |
| | 6,388 | | | Theravance Inc., (2) | | | | | | | | | 56,087 | |
| | | | | |
| | 6,973 | | | Vivus, Inc., (2), (3) | | | | | | | | | 8,786 | |
| | | | | |
| | 4,544 | | | Xenoport, Inc., (2), (3) | | | | | | | | | 27,764 | |
| | | | | |
| | 1,824 | | | Zogenix Inc., (3) | | | | | | | | | 21,505 | |
| | | | | |
| | 1,343 | | | ZS Pharma, Inc., (3) | | | | | | | | | 87,308 | |
| | | | | |
| | 254 | | | Zynerba Pharmaceuticals Inc., (3) | | | | | | | | | 3,198 | |
| | | | Total Pharmaceuticals | | | | | | | | | 2,242,341 | |
| | | | | |
| | | | Professional Services – 1.4% | | | | | | | | | |
| | | | | |
| | 3,882 | | | Acacia Research | | | | | | | | | 25,854 | |
| | | | | |
| | 556 | | | Barrett Business Services, Inc. | | | | | | | | | 27,233 | |
| | | | | |
| | 3,170 | | | CBIZ Inc., (3) | | | | | | | | | 34,077 | |
| | | | | |
| | 1,176 | | | CDI Corporation | | | | | | | | | 9,408 | |
Nuveen Small Cap Index Fund (continued)
| | |
| Portfolio of Investments | | October 31, 2015 |
| | | | | | | | | | | | | | |
| Shares | | | Description (1) | | | | | | | | Value | |
| | | | | |
| | | | Professional Services (continued) | | | | | | | | | |
| | | | | |
| | 2,475 | | | CEB Inc. | | | | | | | | $ | 185,031 | |
| | | | | |
| | 677 | | | CRA International, Inc., (3) | | | | | | | | | 15,842 | |
| | | | | |
| | 1,922 | | | Exponent, Inc. | | | | | | | | | 98,810 | |
| | | | | |
| | 758 | | | Franklin Covey Company, (3) | | | | | | | | | 12,985 | |
| | | | | |
| | 3,077 | | | FTI Consulting Inc., (2), (3) | | | | | | | | | 104,649 | |
| | | | | |
| | 1,023 | | | GP Strategies Corporation, (3) | | | | | | | | | 25,667 | |
| | | | | |
| | 1,412 | | | Heidrick & Struggles International, Inc. | | | | | | | | | 37,503 | |
| | | | | |
| | 2,323 | | | Hill International, Inc., (3) | | | | | | | | | 7,852 | |
| | | | | |
| | 1,714 | | | Huron Consulting Group, Inc., (3) | | | | | | | | | 82,786 | |
| | | | | |
| | 1,445 | | | ICF International, Inc., (3) | | | | | | | | | 44,318 | |
| | | | | |
| | 1,432 | | | Insperity Inc. | | | | | | | | | 66,531 | |
| | | | | |
| | 2,122 | | | Kelly Services, Inc. | | | | | | | | | 33,528 | |
| | | | | |
| | 1,824 | | | KForce Inc. | | | | | | | | | 51,273 | |
| | | | | |
| | 3,729 | | | Korn Ferry International | | | | | | | | | 135,624 | |
| | | | | |
| | 1,270 | | | Mistras Group Inc., (3) | | | | | | | | | 24,028 | |
| | | | | |
| | 3,567 | | | Navigant Consulting Inc., (3) | | | | | | | | | 61,352 | |
| | | | | |
| | 3,825 | | | On Assignment, Inc., (3) | | | | | | | | | 172,546 | |
| | | | | |
| | 12,699 | | | Pendrell Corporation, (3) | | | | | | | | | 8,508 | |
| | | | | |
| | 2,780 | | | Resources Connection, Inc. | | | | | | | | | 49,901 | |
| | | | | |
| | 4,112 | | | RPX Corporation, (3) | | | | | | | | | 58,555 | |
| | | | | |
| | 3,139 | | | The Advisory Board Company, (2), (3) | | | | | | | | | 137,582 | |
| | | | | |
| | 3,044 | | | TriNet Group Inc., (2), (3) | | | | | | | | | 57,775 | |
| | | | | |
| | 3,102 | | | TrueBlue Inc., (3) | | | | | | | | | 89,865 | |
| | | | | |
| | 705 | | | Volt Information Sciences Inc., (3) | | | | | | | | | 6,077 | |
| | | | | |
| | 307 | | | VSE Corporation | | | | | | | | | 17,640 | |
| | | | | |
| | 2,644 | | | WageWorks, Incorporated, (3) | | | | | | | | | 126,965 | |
| | | | Total Professional Services | | | | | | | | | 1,809,765 | |
| | | | | |
| | | | Real Estate Investment Trust – 8.8% | | | | | | | | | |
| | | | | |
| | 4,449 | | | Acadia Realty Trust | | | | | | | | | 146,328 | |
| | | | | |
| | 2,201 | | | AG Mortgage Investment Trust Inc. | | | | | | | | | 33,477 | |
| | | | | |
| | 1,103 | | | Agree Realty Corporation | | | | | | | | | 35,715 | |
| | | | | |
| | 164 | | | Alexander’s Inc. | | | | | | | | | 64,762 | |
| | | | | |
| | 4,231 | | | Altisource Residential Corporation | | | | | | | | | 60,884 | |
| | | | | |
| | 2,781 | | | American Assets Trust Inc. | | | | | | | | | 117,247 | |
| | | | | |
| | 3,785 | | | American Capital Mortgage Investment Corporation | | | | | | | | | 54,920 | |
| | | | | |
| | 2,495 | | | American Residential Properties Inc. | | | | | | | | | 41,342 | |
| | | | | |
| | 7,752 | | | Anworth Mortgage Asset Corporation | | | | | | | | | 36,977 | |
| | | | | |
| | 3,326 | | | Apollo Commercial Real Estate Finance, Inc. | | | | | | | | | 55,245 | |
| | | | | |
| | 2,485 | | | Apollo Residential Mortgage Inc. | | | | | | | | | 31,982 | |
| | | | | | | | | | | | | | |
| Shares | | | Description (1) | | | | | | | | Value | |
| | | | | |
| | | | Real Estate Investment Trust (continued) | | | | | | | | | |
| | | | | |
| | 2,217 | | | Ares Commercial Real Estate Corporation | | | | | | | | $ | 27,358 | |
| | | | | |
| | 1,936 | | | Armada Hoffler Properties Inc. | | | | | | | | | 20,793 | |
| | | | | |
| | 3,258 | | | Armour Residential REIT Inc. | | | | | | | | | 66,854 | |
| | | | | |
| | 2,219 | | | Ashford Hospitality Prime Inc. | | | | | | | | | 32,619 | |
| | | | | |
| | 6,139 | | | Ashford Hospitality Trust Inc. | | | | | | | | | 42,236 | |
| | | | | |
| | 1,393 | | | Bluerock Residential Growth REIT, Inc. | | | | | | | | | 16,326 | |
| | | | | |
| | 5,020 | | | Campus Crest Communities Inc. | | | | | | | | | 33,283 | |
| | | | | |
| | 7,087 | | | Capstead Mortgage Corporation, (2) | | | | | | | | | 68,390 | |
| | | | | |
| | 3,558 | | | CareTrust REIT Inc. | | | | | | | | | 40,277 | |
| | | | | |
| | 2,925 | | | CatchMark Timber Trust Inc., Class A | | | | | | | | | 32,029 | |
| | | | | |
| | 6,026 | | | Cedar Shopping Centers Inc. | | | | | | | | | 42,122 | |
| | | | | |
| | 17,518 | | | Chambers Street Properties | | | | | | | | | 124,027 | |
| | | | | |
| | 2,962 | | | Chatham Lodging Trust | | | | | | | | | 67,800 | |
| | | | | |
| | 4,551 | | | Chesapeake Lodging Trust | | | | | | | | | 125,335 | |
| | | | | |
| | 8,327 | | | Colony Financial Inc. | | | | | | | | | 169,371 | |
| | | | | |
| | 1,800 | | | Coresite Realty Corporation | | | | | | | | | 98,910 | |
| | | | | |
| | 16,021 | | | Cousins Properties, Inc. | | | | | | | | | 160,851 | |
| | | | | |
| | 12,304 | | | CubeSmart | | | | | | | | | 342,297 | |
| | | | | |
| | 4,897 | | | CyrusOne Inc. | | | | | | | | | 172,766 | |
| | | | | |
| | 11,697 | | | CYS Investments Inc., (2) | | | | | | | | | 90,301 | |
| | | | | |
| | 6,056 | | | DCT Industrial Trust Inc. | | | | | | | | | 224,799 | |
| | | | | |
| | 15,177 | | | DiamondRock Hospitality Company | | | | | | | | | 177,267 | |
| | | | | |
| | 4,671 | | | Dupont Fabros Technology Inc., (2) | | | | | | | | | 149,892 | |
| | | | | |
| | 4,242 | | | Dynex Capital, Inc., (2) | | | | | | | | | 28,124 | |
| | | | | |
| | 1,068 | | | Easterly Government Properties, Inc. | | | | | | | | | 18,669 | |
| | | | | |
| | 2,428 | | | EastGroup Properties Inc. | | | | | | | | | 136,356 | |
| | | | | |
| | 3,607 | | | Education Realty Trust Inc. | | | | | | | | | 129,527 | |
| | | | | |
| | 4,229 | | | Entertainment Properties Trust, (2) | | | | | | | | | 240,249 | |
| | | | | |
| | 4,765 | | | Equity One Inc. | | | | | | | | | 126,654 | |
| | | | | |
| | 11,093 | | | FelCor Lodging Trust Inc. | | | | | | | | | 89,299 | |
| | | | | |
| | 8,189 | | | First Industrial Realty Trust, Inc. | | | | | | | | | 177,538 | |
| | | | | |
| | 4,558 | | | First Potomac Realty Trust | | | | | | | | | 53,739 | |
| | | | | |
| | 6,978 | | | Franklin Street Properties Corporation | | | | | | | | | 72,711 | |
| | | | | |
| | 5,629 | | | Geo Group Inc. | | | | | | | | | 181,648 | |
| | | | | |
| | 449 | | | Getty Realty Corporation | | | | | | | | | 7,579 | |
| | | | | |
| | 1,466 | | | Gladstone Commercial Corporation | | | | | | | | | 23,471 | |
| | | | | |
| | 4,416 | | | Government Properties Income Trust, (2) | | | | | | | | | 71,892 | |
| | | | | |
| | 4,237 | | | Gramercy Property Trust Inc. | | | | | | | | | 96,095 | |
| | | | | |
| | 2,830 | | | Hannon Armstrong Sustainable Infrastructure Capital Inc. | | | | | | | | | 50,968 | |
| | | | | |
| | 7,159 | | | Hatteras Financial Corp. | | | | | | | | | 102,445 | |
Nuveen Small Cap Index Fund (continued)
| | |
| Portfolio of Investments | | October 31, 2015 |
| | | | | | | | | | | | | | |
| Shares | | | Description (1) | | | | | | | | Value | |
| | | | | |
| | | | Real Estate Investment Trust (continued) | | | | | | | | | |
| | | | | |
| | 7,448 | | | Healthcare Realty Trust, Inc., (2) | | | | | | | | $ | 196,329 | |
| | | | | |
| | 3,631 | | | Hersha Hospitality Trust | | | | | | | | | 87,180 | |
| | | | | |
| | 6,989 | | | Highwoods Properties, Inc. | | | | | | | | | 303,672 | |
| | | | | |
| | 5,064 | | | Hudson Pacific Properties Inc. | | | | | | | | | 144,678 | |
| | | | | |
| | 2,426 | | | Independence Realty Trust | | | | | | | | | 19,020 | |
| | | | | |
| | 6,770 | | | Inland Real Estate Corporation | | | | | | | | | 59,915 | |
| | | | | |
| | 9,108 | | | Invesco Mortgage Capital Inc. | | | | | | | | | 109,751 | |
| | | | | |
| | 9,068 | | | Investors Real Estate Trust, (2) | | | | | | | | | 73,632 | |
| | | | | |
| | 6,582 | | | iStar Financial Inc., (2), (3) | | | | | | | | | 85,171 | |
| | | | | |
| | 6,182 | | | Kite Realty Group Trust | | | | | | | | | 163,267 | |
| | | | | |
| | 2,941 | | | Ladder Capital Corporation | | | | | | | | | 41,939 | |
| | | | | |
| | 8,356 | | | LaSalle Hotel Properties, (2) | | | | | | | | | 245,750 | |
| | | | | |
| | 15,196 | | | Lexington Corporate Properties Trust | | | | | | | | | 134,333 | |
| | | | | |
| | 2,700 | | | LTC Properties Inc. | | | | | | | | | 115,695 | |
| | | | | |
| | 6,592 | | | Mack-Cali Realty Corporation | | | | | | | | | 143,442 | |
| | | | | |
| | 16,650 | | | Medical Properties Trust Inc. | | | | | | | | | 188,145 | |
| | | | | |
| | 4,338 | | | Monmouth Real Estate Investment Corporation | | | | | | | | | 45,159 | |
| | | | | |
| | 12,317 | | | Monogram Residential Trust, Inc. | | | | | | | | | 121,446 | |
| | | | | |
| | 2,563 | | | National Health Investors Inc. | | | | | | | | | 150,551 | |
| | | | | |
| | 1,693 | | | National Storage Affiliates Trust | | | | | | | | | 25,463 | |
| | | | | |
| | 17,029 | | | New Residential Investment | | | | | | | | | 206,562 | |
| | | | | |
| | 6,395 | | | New Senior Investment Group Inc. | | | | | | | | | 64,078 | |
| | | | | |
| | 8,140 | | | New York Mortgage Trust, Inc., (2) | | | | | | | | | 46,235 | |
| | | | | |
| | 12,016 | | | New York REIT, Inc. | | | | | | | | | 136,982 | |
| | | | | |
| | 1,401 | | | NexPoint Residential Trust, Inc. | | | | | | | | | 18,465 | |
| | | | | |
| | 978 | | | One Liberty Properties Inc. | | | | | | | | | 23,042 | |
| | | | | |
| | 1,356 | | | Orchid Island Capital Inc. | | | | | | | | | 12,041 | |
| | | | | |
| | 5,741 | | | Parkway Properties Inc. | | | | | | | | | 96,047 | |
| | | | | |
| | 5,118 | | | Pebblebrook Hotel Trust | | | | | | | | | 174,933 | |
| | | | | |
| | 5,331 | | | Penn Real Estate Investment Trust | | | | | | | | | 119,841 | |
| | | | | |
| | 5,517 | | | PennyMac Mortgage Investment Trust | | | | | | | | | 80,659 | |
| | | | | |
| | 5,418 | | | Physicians Realty Trust | | | | | | | | | 86,580 | |
| | | | | |
| | 3,009 | | | Potlatch Corporation, (2) | | | | | | | | | 94,001 | |
| | | | | |
| | 1,644 | | | Preferred Apartment Communities Inc. | | | | | | | | | 18,002 | |
| | | | | |
| | 1,411 | | | PS Business Parks Inc. | | | | | | | | | 121,050 | |
| | | | | |
| | 2,064 | | | QTS Realty Trust Inc., Class A Shares | | | | | | | | | 88,773 | |
| | | | | |
| | 6,131 | | | RAIT Investment Trust, (2) | | | | | | | | | 29,735 | |
| | | | | |
| | 5,534 | | | Ramco-Gershenson Properties Trust | | | | | | | | | 92,971 | |
| | | | | |
| | 6,435 | | | Redwood Trust Inc. | | | | | | | | | 85,457 | |
| | | | | | | | | | | | | | |
| Shares | | | Description (1) | | | | | | | | Value | |
| | | | | |
| | | | Real Estate Investment Trust (continued) | | | | | | | | | |
| | | | | |
| | 2,505 | | | Resource Capital Corporation, (2) | | | | | | | | $ | 32,164 | |
| | | | | |
| | 7,359 | | | Retail Opportunity Investments Corporation | | | | | | | | | 133,419 | |
| | | | | |
| | 3,560 | | | Rexford Industrial Realty Inc. | | | | | | | | | 53,934 | |
| | | | | |
| | 9,777 | | | RLJ Lodging Trust | | | | | | | | | 245,305 | |
| | | | | |
| | 2,880 | | | Rouse Properties Inc., (2) | | | | | | | | | 50,659 | |
| | | | | |
| | 3,216 | | | Ryman Hospitalities Properties, (2) | | | | | | | | | 169,162 | |
| | | | | |
| | 4,802 | | | Sabra Health Care Real Estate Investment Trust Inc. | | | | | | | | | 108,909 | |
| | | | | |
| | 654 | | | Saul Centers Inc. | | | | | | | | | 36,670 | |
| | | | | |
| | 4,635 | | | Select Income REIT | | | | | | | | | 93,627 | |
| | | | | |
| | 2,689 | | | Silver Bay Realty Trust Corporation | | | | | | | | | 43,562 | |
| | | | | |
| | 2,557 | | | Sovran Self Storage Inc. | | | | | | | | | 255,368 | |
| | | | | |
| | 4,184 | | | STAG Industrial Inc., (2) | | | | | | | | | 85,856 | |
| | | | | |
| | 2,823 | | | Starwood Waypoint Residential Trust | | | | | | | | | 69,446 | |
| | | | | |
| | 2,204 | | | STORE Capital Corporation | | | | | | | | | 49,965 | |
| | | | | |
| | 19,177 | | | Strategic Hotels & Resorts Inc., (3) | | | | | | | | | 270,396 | |
| | | | | |
| | 6,652 | | | Summit Hotel Properties Inc., (2) | | | | | | | | | 87,008 | |
| | | | | |
| | 3,446 | | | Sun Communities Inc. | | | | | | | | | 230,951 | |
| | | | | |
| | 15,435 | | | Sunstone Hotel Investors Inc. | | | | | | | | | 223,190 | |
| | | | | |
| | 3,321 | | | Terreno Realty Corporation | | | | | | | | | 74,324 | |
| | | | | |
| | 1,690 | | | UMH Properties Inc. | | | | | | | | | 16,714 | |
| | | | | |
| | 2,266 | | | United Development Funding IV, (2) | | | | | | | | | 38,975 | |
| | | | | |
| | 940 | | | Universal Health Realty Income Trust | | | | | | | | | 46,709 | |
| | | | | |
| | 6,567 | | | Urban Edge Properties | | | | | | | | | 155,901 | |
| | | | | |
| | 1,935 | | | Urstadt Biddle Properties Inc. | | | | | | | | | 38,893 | |
| | | | | |
| | 5,039 | | | Washington Real Estate Investment Trust, (2) | | | | | | | | | 136,103 | |
| | | | | |
| | 3,235 | | | Western Asset Mortgage Capital Corporation, (2) | | | | | | | | | 36,944 | |
| | | | | |
| | 1,779 | | | Whitestone Real Estate Investment Trust | | | | | | | | | 21,988 | |
| | | | | |
| | 2,665 | | | Winthrop Realty Trust, Inc. | | | | | | | | | 38,616 | |
| | | | | |
| | 8,259 | | | Xenia Hotels & Resorts Inc. | | | | | | | | | 143,211 | |
| | | | Total Real Estate Investment Trust | | | | | | | | | 11,649,707 | |
| | | | | |
| | | | Real Estate Management & Development – 0.4% | | | | | | | | | |
| | | | | |
| | 3,614 | | | Alexander & Baldwin Inc., (2) | | | | | | | | | 136,392 | |
| | | | | |
| | 66 | | | Altisource Asset Management Corporation, (2), (3) | | | | | | | | | 1,624 | |
| | | | | |
| | 976 | | | Altisource Portfolio Solutions SA, (3) | | | | | | | | | 26,167 | |
| | | | | |
| | 787 | | | AV Homes Inc., (3) | | | | | | | | | 10,420 | |
| | | | | |
| | 333 | | | Consolidated Tomoka Land Company | | | | | | | | | 17,066 | |
| | | | | |
| | 2,708 | | | Forestar Real Estate Group Inc., (3) | | | | | | | | | 38,318 | |
| | | | | |
| | 546 | | | FRP Holdings Inc., (3) | | | | | | | | | 18,018 | |
| | | | | |
| | 6,863 | | | Kennedy-Wilson Holdings Inc., (2) | | | | | | | | | 168,281 | |
Nuveen Small Cap Index Fund (continued)
| | |
| Portfolio of Investments | | October 31, 2015 |
| | | | | | | | | | | | | | |
| Shares | | | Description (1) | | | | | | | | Value | |
| | | | | |
| | | | Real Estate Management & Development (continued) | | | | | | | | | |
| | | | | |
| | 1,005 | | | Marcus & Millichap Inc., (3) | | | | | | | | $ | 43,788 | |
| | | | | |
| | 825 | | | ReMax Holdings Inc. | | | | | | | | | 31,078 | |
| | | | | |
| | 4,078 | | | St Joe Company, (2), (3) | | | | | | | | | 80,826 | |
| | | | | |
| | 1,049 | | | Tejon Ranch Company, (3) | | | | | | | | | 23,634 | |
| | | | Total Real Estate Management & Development | | | | | | | | | 595,612 | |
| | | | | |
| | | | Road & Rail – 0.5% | | | | | | | | | |
| | | | | |
| | 2,016 | | | ArcBest Corporation | | | | | | | | | 52,214 | |
| | | | | |
| | 1,622 | | | Celadon Group, Inc. | | | | | | | | | 23,487 | |
| | | | | |
| | 867 | | | Covenant Transport, Inc., (3) | | | | | | | | | 16,733 | |
| | | | | |
| | 3,726 | | | Heartland Express, Inc., (2) | | | | | | | | | 70,161 | |
| | | | | |
| | 4,539 | | | Knight Transportation Inc., (2) | | | | | | | | | 115,381 | |
| | | | | |
| | 1,845 | | | Marten Transport, Ltd. | | | | | | | | | 30,240 | |
| | | | | |
| | 260 | | | PAM Transportation Services, Inc., (3) | | | | | | | | | 9,285 | |
| | | | | |
| | 2,162 | | | Roadrunner Transportation System Inc., (3) | | | | | | | | | 23,004 | |
| | | | | |
| | 1,856 | | | Saia, Inc., (3) | | | | | | | | | 43,820 | |
| | | | | |
| | 6,596 | | | Swift Transportation Company, (2), (3) | | | | | | | | | 103,095 | |
| | | | | |
| | 450 | | | Universal Truckload Services, Inc. | | | | | | | | | 7,191 | |
| | | | | |
| | 725 | | | USA Truck, Inc., (3) | | | | | | | | | 13,181 | |
| | | | | |
| | 3,275 | | | Werner Enterprises, Inc. | | | | | | | | | 86,656 | |
| | | | | |
| | 2,424 | | | YRC Worldwide Inc., (3) | | | | | | | | | 44,262 | |
| | | | Total Road & Rail | | | | | | | | | 638,710 | |
| | | | | |
| | | | Semiconductors & Semiconductor Equipment – 3.2% | | | | | | | | | |
| | | | | |
| | 3,024 | | | Advanced Energy Industries Inc., (3) | | | | | | | | | 85,519 | |
| | | | | |
| | 47,048 | | | Advanced Micro Devices, Inc., (2), (3) | | | | | | | | | 99,742 | |
| | | | | |
| | 1,447 | | | Alpha & Omega Semiconductor Limited, (3) | | | | | | | | | 12,849 | |
| | | | | |
| | 2,317 | | | Ambarella, Incorporated, (2), (3) | | | | | | | | | 114,552 | |
| | | | | |
| | 6,883 | | | Amkor Technology Inc., (3) | | | | | | | | | 42,812 | |
| | | | | |
| | 6,092 | | | Applied Micro Circuits Corporation, (3) | | | | | | | | | 39,476 | |
| | | | | |
| | 9,027 | | | Axcelis Technologies Inc., (3) | | | | | | | | | 25,276 | |
| | | | | |
| | 4,991 | | | Brooks Automation Inc. | | | | | | | | | 55,101 | |
| | | | | |
| | 1,871 | | | Cabot Microelectronics Corporation, (3) | | | | | | | | | 78,900 | |
| | | | | |
| | 992 | | | Cascade Microtech, Inc., (2), (3) | | | | | | | | | 15,197 | |
| | | | | |
| | 4,098 | | | Cavium Networks Inc., (3) | | | | | | | | | 290,753 | |
| | | | | |
| | 1,628 | | | CEVA, Inc., (3) | | | | | | | | | 38,046 | |
| | | | | |
| | 4,691 | | | Cirrus Logic Inc., (3) | | | | | | | | | 144,624 | |
| | | | | |
| | 2,060 | | | Cohu Inc. | | | | | | | | | 25,935 | |
| | | | | |
| | 2,827 | | | Diodes Inc., (3) | | | | | | | | | 64,738 | |
| | | | | |
| | 1,647 | | | DSP Group Inc., (3) | | | | | | | | | 16,635 | |
| | | | | |
| | 10,373 | | | Entegris Inc., (3) | | | | | | | | | 133,086 | |
| | | | | | | | | | | | | | |
| Shares | | | Description (1) | | | | | | | | Value | |
| | | | | |
| | | | Semiconductors & Semiconductor Equipment (continued) | | | | | | | | | |
| | | | | |
| | 3,064 | | | Exar Corporation, (3) | | | | | | | | $ | 17,434 | |
| | | | | |
| | 8,612 | | | Fairchild Semiconductor International Inc., Class A, (3) | | | | | | | | | 143,648 | |
| | | | | |
| | 4,309 | | | FormFactor Inc., (3) | | | | | | | | | 35,506 | |
| | | | | |
| | 2,833 | | | Inphi Corporation, (3) | | | | | | | | | 84,338 | |
| | | | | |
| | 10,973 | | | Integrated Device Technology, Inc., (3) | | | | | | | | | 279,812 | |
| | | | | |
| | 2,343 | | | Integrated Silicon Solution | | | | | | | | | 52,671 | |
| | | | | |
| | 9,988 | | | Intersil Holding Corporation, Class A | | | | | | | | | 135,337 | |
| | | | | |
| | 1,836 | | | IXYS Corporation | | | | | | | | | 22,877 | |
| | | | | |
| | 5,526 | | | Kopin Corporation, (3) | | | | | | | | | 14,754 | |
| | | | | |
| | 8,640 | | | Lattice Semiconductor Corporation, (3) | | | | | | | | | 39,571 | |
| | | | | |
| | 1,736 | | | MA-COM Technology Solutions Holdings Incorporated, (2), (3) | | | | | | | | | 58,573 | |
| | | | | |
| | 5,537 | | | Mattson Technology, Inc., (3) | | | | | | | | | 12,957 | |
| | | | | |
| | 3,825 | | | Maxlinear Inc., (3) | | | | | | | | | 49,725 | |
| | | | | |
| | 7,040 | | | Microsemi Corporation, (3) | | | | | | | | | 253,510 | |
| | | | | |
| | 3,948 | | | MKS Instruments Inc., (2) | | | | | | | | | 139,128 | |
| | | | | |
| | 2,924 | | | Monolithic Power Systems, Inc. | | | | | | | | | 182,516 | |
| | | | | |
| | 1,926 | | | Nanometrics Inc., (3) | | | | | | | | | 29,429 | |
| | | | | |
| | 2,066 | | | NeoPhotonics Corporation, (3) | | | | | | | | | 17,086 | |
| | | | | |
| | 375 | | | NVE Corporation | | | | | | | | | 22,234 | |
| | | | | |
| | 4,350 | | | Omnivision Technologies, Inc., (3) | | | | | | | | | 125,585 | |
| | | | | |
| | 1,997 | | | PDF Solutions, Inc., (3) | | | | | | | | | 21,088 | |
| | | | | |
| | 1,719 | | | Pericom Semiconductor Corporation | | | | | | | | | 29,997 | |
| | | | | |
| | 4,781 | | | Photronics Inc., (3) | | | | | | | | | 45,850 | |
| | | | | |
| | 12,902 | | | PMC-Sierra, Inc., (3) | | | | | | | | | 153,792 | |
| | | | | |
| | 2,176 | | | Power Integrations Inc., (2) | | | | | | | | | 110,127 | |
| | | | | |
| | 8,540 | | | Rambus Inc., (3) | | | | | | | | | 88,133 | |
| | | | | |
| | 2,578 | | | Rudolph Technologies, (3) | | | | | | | | | 32,973 | |
| | | | | |
| | 4,910 | | | Semtech Corporation, (3) | | | | | | | | | 85,925 | |
| | | | | |
| | 2,618 | | | Sigma Designs, Inc., (3) | | | | | | | | | 23,065 | |
| | | | | |
| | 3,160 | | | Silicon Laboratories Inc., (2), (3) | | | | | | | | | 157,905 | |
| | | | | |
| | 2,725 | | | Synaptics, Inc., (3) | | | | | | | | | 231,870 | |
| | | | | |
| | 3,892 | | | Tessera Technologies Inc. | | | | | | | | | 136,103 | |
| | | | | |
| | 1,991 | | | Ultra Clean Holdings, Inc., (3) | | | | | | | | | 9,716 | |
| | | | | |
| | 2,041 | | | Ultratech Stepper Inc., (3) | | | | | | | | | 31,901 | |
| | | | | |
| | 2,986 | | | Veeco Instruments Inc., (3) | | | | | | | | | 53,808 | |
| | | | | |
| | 3,963 | | | Xcerra Corporation, (3) | | | | | | | | | 27,503 | |
| | | | Total Semiconductors & Semiconductor Equipment | | | | | | | | | 4,239,688 | |
| | | | | |
| | | | Software – 4.4% | | | | | | | | | |
| | | | | |
| | 2,508 | | | A10 Networks Inc., (3) | | | | | | | | | 18,007 | |
| | | | | |
| | 8,635 | | | ACI Worldwide, Inc., (2), (3) | | | | | | | | | 206,808 | |
Nuveen Small Cap Index Fund (continued)
| | |
| Portfolio of Investments | | October 31, 2015 |
| | | | | | | | | | | | | | |
| Shares | | | Description (1) | | | | | | | | Value | |
| | | | | |
| | | | Software (continued) | | | | | | | | | |
| | | | | |
| | 2,000 | | | American Software, Inc. | | | | | | | | $ | 20,460 | |
| | | | | |
| | 6,315 | | | Aspen Technology Inc., (3) | | | | | | | | | 261,378 | |
| | | | | |
| | 2,703 | | | AVG Technologies NV, (3) | | | | | | | | | 64,061 | |
| | | | | |
| | 615 | | | Barracuda Networks Inc., (3) | | | | | | | | | 11,796 | |
| | | | | |
| | 3,467 | | | Blackbaud, Inc. | | | | | | | | | 217,346 | |
| | | | | |
| | 3,053 | | | Bottomline Technologies, Inc., (2), (3) | | | | | | | | | 84,507 | |
| | | | | |
| | 2,217 | | | Broadsoft Inc., (3) | | | | | | | | | 70,877 | |
| | | | | |
| | 4,146 | | | Callidus Software, Inc., (3) | | | | | | | | | 72,016 | |
| | | | | |
| | 3,346 | | | CommVault Systems, Inc., (3) | | | | | | | | | 135,580 | |
| | | | | |
| | 526 | | | Digimarc Corporation, (2) | | | | | | | | | 11,814 | |
| | | | | |
| | 3,602 | | | Digital Turbine Inc., (2), (3) | | | | | | | | | 5,979 | |
| | | | | |
| | 1,983 | | | Ebix, Inc., (2) | | | | | | | | | 54,989 | |
| | | | | |
| | 2,193 | | | Ellie Mae Incorporated, (2), (3) | | | | | | | | | 160,045 | |
| | | | | |
| | 2,096 | | | EnerNOC, Inc., (3) | | | | | | | | | 16,433 | |
| | | | | |
| | 2,409 | | | EPIQ Systems, Inc. | | | | | | | | | 33,244 | |
| | | | | |
| | 2,297 | | | Fair Isaac Corporation, (2) | | | | | | | | | 212,174 | |
| | | | | |
| | 2,827 | | | Fleetmatics Group Limited, (2), (3) | | | | | | | | | 157,351 | |
| | | | | |
| | 2,023 | | | Gigamon Inc., (3) | | | | | | | | | 53,063 | |
| | | | | |
| | 1,130 | | | Globant S.A, (2), (3) | | | | | | | | | 39,064 | |
| | | | | |
| | 8,901 | | | Glu Mobile, Inc., (2), (3) | | | | | | | | | 36,672 | |
| | | | | |
| | 1,399 | | | Guidance Software, Inc., (3) | | | | | | | | | 7,890 | |
| | | | | |
| | 5,190 | | | Guidewire Software Incorporated, (3) | | | | | | | | | 302,214 | |
| | | | | |
| | 1,391 | | | HubSpot, Inc., (2), (3) | | | | | | | | | 72,165 | |
| | | | | |
| | 1,991 | | | Imperva Incorporated, (2), (3) | | | | | | | | | 140,604 | |
| | | | | |
| | 4,191 | | | Infoblox, Incorporated, (3) | | | | | | | | | 68,355 | |
| | | | | |
| | 1,291 | | | Interactive Intelligence Group, (3) | | | | | | | | | 41,751 | |
| | | | | |
| | 3,301 | | | Jive Software Inc., (3) | | | | | | | | | 16,076 | |
| | | | | |
| | 5,457 | | | Manhattan Associates Inc., (3) | | | | | | | | | 397,542 | |
| | | | | |
| | 7,511 | | | Mentor Graphics Corporation | | | | | | | | | 204,299 | |
| | | | | |
| | 686 | | | Microstrategy Inc., (3) | | | | | | | | | 118,040 | |
| | | | | |
| | 2,876 | | | MobileIron, Inc., (2), (3) | | | | | | | | | 11,101 | |
| | | | | |
| | 1,494 | | | Model N Inc., (3) | | | | | | | | | 15,089 | |
| | | | | |
| | 2,962 | | | Monotype Imaging Holdings Inc. | | | | | | | | | 80,981 | |
| | | | | |
| | 770 | | | Park City Group Inc., (2), (3) | | | | | | | | | 8,971 | |
| | | | | |
| | 2,333 | | | Paycom Software Inc., (3) | | | | | | | | | 88,677 | |
| | | | | |
| | 1,145 | | | Paylocity Holding Corporation, (3) | | | | | | | | | 38,438 | |
| | | | | |
| | 2,748 | | | Pegasystems, Inc. | | | | | | | | | 76,642 | |
| | | | | |
| | 3,743 | | | Progress Software Corporation, (3) | | | | | | | | | 90,880 | |
| | | | | |
| | 2,916 | | | Proofpoint, Incorporated, (2), (3) | | | | | | | | | 205,403 | |
| | | | | |
| | 1,874 | | | PROS Holdings, Inc., (3) | | | | | | | | | 45,013 | |
| | | | | | | | | | | | | | |
| Shares | | | Description (1) | | | | | | | | Value | |
| | | | | |
| | | | Software (continued) | | | | | | | | | |
| | | | | |
| | 490 | | | QAD Inc. A | | | | | | | | $ | 12,515 | |
| | | | | |
| | 6,756 | | | QLIK Technologies Inc., (3) | | | | | | | | | 211,936 | |
| | | | | |
| | 1,838 | | | Qualys Incorporated, (3) | | | | | | | | | 64,918 | |
| | | | | |
| | 591 | | | Rapid7 Inc., (2), (3) | | | | | | | | | 12,151 | |
| | | | | |
| | 3,879 | | | RealPage Inc., (2), (3) | | | | | | | | | 65,555 | |
| | | | | |
| | 3,962 | | | RingCentral Inc., Class A, (3) | | | | | | | | | 73,297 | |
| | | | | |
| | 6,539 | | | Rovi Corporation, (2), (3) | | | | | | | | | 59,832 | |
| | | | | |
| | 1,902 | | | Sapiens International Corporation NV | | | | | | | | | 22,463 | |
| | | | | |
| | 2,548 | | | SeaChange International, Inc., (3) | | | | | | | | | 16,486 | |
| | | | | |
| | 2,715 | | | Silver Springs Networks Inc., (3) | | | | | | | | | 35,594 | |
| | | | | |
| | 2,873 | | | Synchronoss Technologies, Inc., (2), (3) | | | | | | | | | 101,072 | |
| | | | | |
| | 6,257 | | | Take-Two Interactive Software, Inc., (3) | | | | | | | | | 207,732 | |
| | | | | |
| | 2,879 | | | Tangoe Inc., (3) | | | | | | | | | 23,838 | |
| | | | | |
| | 3,965 | | | TeleCommunication Systems, (3) | | | | | | | | | 16,217 | |
| | | | | |
| | 2,113 | | | TeleNav Inc., (3) | | | | | | | | | 15,214 | |
| | | | | |
| | 1,898 | | | The Rubicon Project Inc., (3) | | | | | | | | | 28,774 | |
| | | | | |
| | 7,392 | | | TiVo, Inc., (3) | | | | | | | | | 67,119 | |
| | | | | |
| | 1,033 | | | TubeMogul Inc., (2), (3) | | | | | | | | | 12,344 | |
| | | | | |
| | 2,490 | | | Tyler Technologies Inc., (2), (3) | | | | | | | | | 424,196 | |
| | | | | |
| | 662 | | | Varonis Systems Inc., (3) | | | | | | | | | 10,572 | |
| | | | | |
| | 2,170 | | | Vasco Data Security International, Inc., (2), (3) | | | | | | | | | 41,252 | |
| | | | | |
| | 4,539 | | | Verint Systems Inc., (3) | | | | | | | | | 215,966 | |
| | | | | |
| | 3,299 | | | VirnetX Holding Corporation, (3) | | | | | | | | | 12,536 | |
| | | | | |
| | 556 | | | Workiva Inc., (3) | | | | | | | | | 9,218 | |
| | | | | |
| | 1,715 | | | Xura Incorporated, (3) | | | | | | | | | 44,384 | |
| | | | | |
| | 1,345 | | | Yodlee, Inc., (3) | | | | | | | | | 22,569 | |
| | | | | |
| | 3,974 | | | Zendesk Inc., (3) | | | | | | | | | 79,957 | |
| | | | | |
| | 4,596 | | | Zix Corporation, (3) | | | | | | | | | 23,807 | |
| | | | Total Software | | | | | | | | | 5,905,309 | |
| | | | | |
| | | | Specialty Retail – 2.9% | | | | | | | | | |
| | | | | |
| | 5,144 | | | Abercrombie & Fitch Co., Class A, (2) | | | | | | | | | 109,001 | |
| | | | | |
| | 14,453 | | | American Eagle Outfitters, Inc., (2) | | | | | | | | | 220,842 | |
| | | | | |
| | 603 | | | America’s Car-Mart, Inc., (3) | | | | | | | | | 20,647 | |
| | | | | |
| | 2,016 | | | Asbury Automotive Group, Inc., (3) | | | | | | | | | 159,667 | |
| | | | | |
| | 12,695 | | | Ascena Retail Group Inc., (2), (3) | | | | | | | | | 169,097 | |
| | | | | |
| | 2,371 | | | Barnes & Noble Education, Inc., (3) | | | | | | | | | 34,972 | |
| | | | | |
| | 3,753 | | | Barnes & Noble Inc. | | | | | | | | | 48,751 | |
| | | | | |
| | 2,432 | | | bebe stores, Inc., (2) | | | | | | | | | 2,700 | |
| | | | | |
| | 1,401 | | | Big 5 Sporting Goods Corporation | | | | | | | | | 12,819 | |
| | | | | |
| | 884 | | | Boot Barn Holdings, Inc., (2), (3) | | | | | | | | | 13,260 | |
Nuveen Small Cap Index Fund (continued)
| | |
| Portfolio of Investments | | October 31, 2015 |
| | | | | | | | | | | | | | |
| Shares | | | Description (1) | | | | | | | | Value | |
| | | | | |
| | | | Specialty Retail (continued) | | | | | | | | | |
| | | | | |
| | 2,094 | | | Buckle Inc., (2) | | | | | | | | $ | 74,211 | |
| | | | | |
| | 957 | | | Build-A-Bear-Workshop, Inc., (3) | | | | | | | | | 14,891 | |
| | | | | |
| | 3,240 | | | Caleres Inc. | | | | | | | | | 99,014 | |
| | | | | |
| | 1,946 | | | Cato Corporation | | | | | | | | | 73,481 | |
| | | | | |
| | 10,602 | | | Chico’s FAS, Inc., (2) | | | | | | | | | 146,520 | |
| | | | | |
| | 1,524 | | | Childrens Place Retail Stores Inc., (2) | | | | | | | | | 81,793 | |
| | | | | |
| | 2,825 | | | Christopher & Banks Corporation | | | | | | | | | 4,125 | |
| | | | | |
| | 1,151 | | | Citi Trends, Inc. | | | | | | | | | 30,582 | |
| | | | | |
| | 2,024 | | | Conn’s, Inc., (2), (3) | | | | | | | | | 38,395 | |
| | | | | |
| | 1,195 | | | Container Store Group Inc., (3) | | | | | | | | | 13,635 | |
| | | | | |
| | 2,818 | | | Destination XL Group Inc., (3) | | | | | | | | | 16,457 | |
| | | | | |
| | 6,251 | | | Express Inc., (2), (3) | | | | | | | | | 120,644 | |
| | | | | |
| | 3,405 | | | Finish Line, Inc. | | | | | | | | | 63,435 | |
| | | | | |
| | 4,029 | | | Five Below, Incorporated, (2), (3) | | | | | | | | | 138,356 | |
| | | | | |
| | 3,130 | | | Francescas Holdings Corporation, (2), (3) | | | | | | | | | 44,477 | |
| | | | | |
| | 1,779 | | | Genesco Inc., (3) | | | | | | | | | 111,454 | |
| | | | | |
| | 1,726 | | | Group 1 Automotive Inc. | | | | | | | | | 150,076 | |
| | | | | |
| | 4,579 | | | Guess Inc., (2) | | | | | | | | | 96,388 | |
| | | | | |
| | 1,563 | | | Haverty Furniture Companies Inc., (2) | | | | | | | | | 36,590 | |
| | | | | |
| | 1,841 | | | Hibbett Sporting Goods, Inc., (2), (3) | | | | | | | | | 62,889 | |
| | | | | |
| | 1,135 | | | Kirkland’s, Inc., (3) | | | | | | | | | 26,094 | |
| | | | | |
| | 1,684 | | | Lithia Motors Inc. | | | | | | | | | 197,685 | |
| | | | | |
| | 2,003 | | | Lumber Liquidators Inc., (2), (3) | | | | | | | | | 27,681 | |
| | | | | |
| | 1,945 | | | Marinemax Inc., (3) | | | | | | | | | 30,731 | |
| | | | | |
| | 1,517 | | | Mattress Firm Holding Corporation, (2), (3) | | | | | | | | | 64,579 | |
| | | | | |
| | 3,573 | | | Mens Wearhouse Inc. | | | | | | | | | 142,849 | |
| | | | | |
| | 2,355 | | | Monro Muffler Brake, Inc., (2) | | | | | | | | | 174,670 | |
| | | | | |
| | 1,364 | | | Outerwall Inc., (2) | | | | | | | | | 81,840 | |
| | | | | |
| | 1,860 | | | Party City Holdco Inc., (2), (3) | | | | | | | | | 29,444 | |
| | | | | |
| | 4,128 | | | Pep Boys – Manny, Moe & Jack | | | | | | | | | 62,085 | |
| | | | | |
| | 6,668 | | | Pier 1 Imports, Inc., (2) | | | | | | | | | 49,477 | |
| | | | | |
| | 3,922 | | | Rent-A-Center Inc., (2) | | | | | | | | | 72,126 | |
| | | | | |
| | 2,417 | | | Restoration Hardware Holdings Incorporated, (2), (3) | | | | | | | | | 249,169 | |
| | | | | |
| | 3,869 | | | Select Comfort Corporation, (3) | | | | | | | | | 82,023 | |
| | | | | |
| | 1,172 | | | Shoe Carnival, Inc. | | | | | | | | | 26,335 | |
| | | | | |
| | 2,434 | | | Sonic Automotive Inc. | | | | | | | | | 60,704 | |
| | | | | |
| | 1,329 | | | Sportsman’s Warehouse Holdings Inc., (3) | | | | | | | | | 14,300 | |
| | | | | |
| | 2,362 | | | Stage Stores Inc. | | | | | | | | | 22,982 | |
| | | | | |
| | 2,152 | | | Stein Mart, Inc. | | | | | | | | | 19,067 | |
| | | | | |
| | 908 | | | Systemax Inc., (3) | | | | | | | | | 8,417 | |
| | | | | | | | | | | | | | |
| Shares | | | Description (1) | | | | | | | | Value | |
| | | | | |
| | | | Specialty Retail (continued) | | | | | | | | | |
| | | | | |
| | 2,005 | | | Tile Shop Holdings Inc., (3) | | | | | | | | $ | 29,093 | |
| | | | | |
| | 819 | | | Tilly’s Inc., Class A Shares, (3) | | | | | | | | | 5,971 | |
| | | | | |
| | 2,200 | | | Vitamin Shoppe Inc., (3) | | | | | | | | | 63,118 | |
| | | | | |
| | 1,415 | | | West Marine, Inc., (3) | | | | | | | | | 14,405 | |
| | | | | |
| | 168 | | | Winmark Corporation | | | | | | | | | 16,926 | |
| | | | | |
| | 1,468 | | | Zumiez, Inc., (3) | | | | | | | | | 25,661 | |
| | | | Total Specialty Retail | | | | | | | | | 3,806,601 | |
| | | | | |
| | | | Technology Hardware, Storage & Peripherals – 0.7% | | | | | | | | | |
| | | | | |
| | 2,389 | | | Avid Technology Inc., (3) | | | | | | | | | 20,187 | |
| | | | | |
| | 3,019 | | | Cray, Inc., (2), (3) | | | | | | | | | 89,453 | |
| | | | | |
| | 4,797 | | | Diebold Inc., (2) | | | | | | | | | 176,865 | |
| | | | | |
| | 1,369 | | | Eastman Kodak Company, (3) | | | | | | | | | 17,140 | |
| | | | | |
| | 3,467 | | | Electronics For Imaging, (2), (3) | | | | | | | | | 161,007 | |
| | | | | |
| | 2,598 | | | Imation Corporation | | | | | | | | | 5,248 | |
| | | | | |
| | 2,199 | | | Immersion Corporation, (3) | | | | | | | | | 28,543 | |
| | | | | |
| | 3,746 | | | Nimble Storage Inc., (3) | | | | | | | | | 84,660 | |
| | | | | |
| | 6,453 | | | QLogic Corporation, (3) | | | | | | | | | 80,017 | |
| | | | | |
| | 15,921 | | | Quantum Corporation, (3) | | | | | | | | | 13,374 | |
| | | | | |
| | 2,575 | | | Silicon Graphics International Corporation, (3) | | | | | | | | | 11,253 | |
| | | | | |
| | 3,766 | | | Stratasys, Inc., (2), (3) | | | | | | | | | 96,033 | |
| | | | | |
| | 2,727 | | | Super Micro Computer Inc., (2), (3) | | | | | | | | | 76,929 | |
| | | | | |
| | 6,217 | | | Violin Memory Inc., (2), (3) | | | | | | | | | 10,009 | |
| | | | Total Technology Hardware, Storage & Peripherals | | | | | | | | | 870,718 | |
| | | | | |
| | | | Textiles, Apparel & Luxury Goods – 0.8% | | | | | | | | | |
| | | | | |
| | 633 | | | Cherokee Inc. | | | | | | | | | 11,489 | |
| | | | | |
| | 2,130 | | | Columbia Sportswear Company, (2) | | | | | | | | | 116,831 | |
| | | | | |
| | 5,694 | | | Crocs, Inc., (3) | | | | | | | | | 61,495 | |
| | | | | |
| | 680 | | | Culp Inc. | | | | | | | | | 20,407 | |
| | | | | |
| | 2,412 | | | Deckers Outdoor Corporation, (3) | | | | | | | | | 134,252 | |
| | | | | |
| | 2,978 | | | G III Apparel Group, Limited, (3) | | | | | | | | | 164,058 | |
| | | | | |
| | 3,531 | | | Iconix Brand Group, Inc., (2), (3) | | | | | | | | | 54,095 | |
| | | | | |
| | 1,187 | | | Movado Group Inc. | | | | | | | | | 30,553 | |
| | | | | |
| | 1,084 | | | Oxford Industries Inc. | | | | | | | | | 78,937 | |
| | | | | |
| | 942 | | | Perry Ellis International, Inc., (3) | | | | | | | | | 20,225 | |
| | | | | |
| | 1,864 | | | Sequential Brands Group Inc., (2), (3) | | | | | | | | | 23,319 | |
| | | | | |
| | 4,162 | | | Steven Madden Limited, (2), (3) | | | | | | | | | 145,046 | |
| | | | | |
| | 549 | | | Superior Uniform Group Inc. | | | | | | | | | 9,355 | |
| | | | | |
| | 3,929 | | | Tumi Holdings Inc., (3) | | | | | | | | | 62,982 | |
| | | | | |
| | 1,136 | | | Unifi Inc., (3) | | | | | | | | | 34,750 | |
Nuveen Small Cap Index Fund (continued)
| | |
| Portfolio of Investments | | October 31, 2015 |
| | | | | | | | | | | | | | |
| Shares | | | Description (1) | | | | | | | | Value | |
| | | | | |
| | | | Textiles, Apparel & Luxury Goods (continued) | | | | | | | | | |
| | | | | |
| | 1,574 | | | Vera Bradley Inc., (2), (3) | | | | | | | | $ | 19,691 | |
| | | | | |
| | 866 | | | Vince Holding Company, (3) | | | | | | | | | 3,940 | |
| | | | | |
| | 7,634 | | | Wolverine World Wide Inc., (2) | | | | | | | | | 141,763 | |
| | | | Total Textiles, Apparel & Luxury Goods | | | | | | | | | 1,133,188 | |
| | | | | |
| | | | Thrifts & Mortgage Finance – 2.0% | | | | | | | | | |
| | | | | |
| | 510 | | | Anchor BanCorp Wisconsin Inc., (3) | | | | | | | | | 20,920 | |
| | | | | |
| | 6,717 | | | Astoria Financial Corporation | | | | | | | | | 107,203 | |
| | | | | |
| | 3,611 | | | Bank Mutual Corporation | | | | | | | | | 26,144 | |
| | | | | |
| | 1,445 | | | BankFinancial Corporation | | | | | | | | | 17,817 | |
| | | | | |
| | 201 | | | BBX Capital Corporation, (3) | | | | | | | | | 3,688 | |
| | | | | |
| | 985 | | | Bear State Financial Inc., (3) | | | | | | | | | 10,786 | |
| | | | | |
| | 6,118 | | | Beneficial Bancorp, Inc., (3) | | | | | | | | | 84,857 | |
| | | | | |
| | 1,135 | | | BofI Holdings, Inc., (2), (3) | | | | | | | | | 90,811 | |
| | | | | |
| | 5,475 | | | Brookline Bancorp, Inc. | | | | | | | | | 62,141 | |
| | | | | |
| | 599 | | | BSB Bancorp Inc., (3) | | | | | | | | | 13,172 | |
| | | | | |
| | 10,404 | | | Capitol Federal Financial Inc. | | | | | | | | | 135,044 | |
| | | | | |
| | 1,227 | | | Charter Financial Corporation | | | | | | | | | 16,074 | |
| | | | | |
| | 1,920 | | | Clifton Bancorp Inc. | | | | | | | | | 27,994 | |
| | | | | |
| | 2,302 | | | Dime Community Bancshares, Inc. | | | | | | | | | 39,940 | |
| | | | | |
| | 4,110 | | | Essent Group Limited, (3) | | | | | | | | | 99,051 | |
| | | | | |
| | 7,066 | | | Everbank Financial Corporation | | | | | | | | | 121,959 | |
| | | | | |
| | 808 | | | Federal Agricultural Mortgage Corporation | | | | | | | | | 23,723 | |
| | | | | |
| | 749 | | | First Defiance Financial Corporation | | | | | | | | | 28,687 | |
| | | | | |
| | 1,572 | | | Flagstar Bancorp Inc., (3) | | | | | | | | | 34,961 | |
| | | | | |
| | 942 | | | Fox Chase Bancorp. | | | | | | | | | 16,494 | |
| | | | | |
| | 97 | | | Hingham Institution for Savings | | | | | | | | | 12,359 | |
| | | | | |
| | 1,525 | | | HomeStreet Inc. | | | | | | | | | 31,918 | |
| | | | | |
| | 637 | | | Impac Mortgage Holdings Inc., (2), (3) | | | | | | | | | 14,237 | |
| | | | | |
| | 6,918 | | | Kearny Financial Corporation | | | | | | | | | 82,670 | |
| | | | | |
| | 429 | | | LendingTree, Inc., (3) | | | | | | | | | 52,063 | |
| | | | | |
| | 4,064 | | | Meridian Bancorp, Inc. | | | | | | | | | 57,059 | |
| | | | | |
| | 475 | | | Meta Financial Group, Inc. | | | | | | | | | 20,463 | |
| | | | | |
| | 25,121 | | | MGIC Investment Corporation, (2), (3) | | | | | | | | | 236,137 | |
| | | | | |
| | 2,906 | | | Nationstar Mortgage Holdings, Incorporated, (2), (3) | | | | | | | | | 38,563 | |
| | | | | |
| | 3,919 | | | NMI Holdings Inc., Class A Shares, (3) | | | | | | | | | 29,471 | |
| | | | | |
| | 3,470 | | | Northfield Bancorp Inc. | | | | | | | | | 53,160 | |
| | | | | |
| | 6,986 | | | Northwest Bancshares Inc., (2) | | | | | | | | | 94,032 | |
| | | | | |
| | 1,064 | | | OceanFirst Financial Corporation | | | | | | | | | 19,641 | |
| | | | | |
| | 7,946 | | | Ocwen Financial Corporation, (3) | | | | | | | | | 55,543 | |
| | | | | |
| | 3,255 | | | Oritani Financial Corporation | | | | | | | | | 51,820 | |
| | | | | | | | | | | | | | |
| Shares | | | Description (1) | | | | | | | | Value | |
| | | | | |
| | | | Thrifts & Mortgage Finance (continued) | | | | | | | | | |
| | | | | |
| | 1,038 | | | PennyMac Financial Services Inc., (3) | | | | | | | | $ | 17,169 | |
| | | | | |
| | 3,673 | | | PHH Corporation, (3) | | | | | | | | | 53,993 | |
| | | | | |
| | 4,675 | | | Provident Financial Services Inc. | | | | | | | | | 94,996 | |
| | | | | |
| | 14,157 | | | Radian Group Inc., (2) | | | | | | | | | 204,852 | |
| | | | | |
| | 1,153 | | | Stonegate Mortgage Corporation, (3) | | | | | | | | | 6,607 | |
| | | | | |
| | 678 | | | Territorial Bancorp Inc. | | | | | | | | | 18,903 | |
| | | | | |
| | 7,030 | | | TrustCo Bank Corporation NY | | | | | | | | | 43,797 | |
| | | | | |
| | 4,114 | | | United Community Financial Corporation | | | | | | | | | 22,545 | |
| | | | | |
| | 3,659 | | | United Financial Bancorp Inc. | | | | | | | | | 47,494 | |
| | | | | |
| | 1,958 | | | Walker & Dunlop Inc., (3) | | | | | | | | | 56,802 | |
| | | | | |
| | 2,791 | | | Walter Investment Management Corporation , (2) | | | | | | | | | 33,380 | |
| | | | | |
| | 7,014 | | | Washington Federal Inc. | | | | | | | | | 174,929 | |
| | | | | |
| | 2,233 | | | Waterstone Financial Inc. | | | | | | | | | 29,744 | |
| | | | | |
| | 1,962 | | | WSFS Financial Corporation, (2) | | | | | | | | | 62,333 | |
| | | | Total Thrifts & Mortgage Finance | | | | | | | | | 2,698,146 | |
| | | | | |
| | | | Tobacco – 0.2% | | | | | | | | | |
| | | | | |
| | 1,671 | | | Universal Corporation, (2) | | | | | | | | | 90,251 | |
| | | | | |
| | 6,340 | | | Vector Group Ltd., (2) | | | | | | | | | 153,745 | |
| | | | Total Tobacco | | | | | | | | | 243,996 | |
| | | | | |
| | | | Trading Companies & Distributors – 0.7% | | | | | | | | | |
| | | | | |
| | 4,616 | | | Aircastle LTD | | | | | | | | | 104,599 | |
| | | | | |
| | 2,971 | | | Applied Industrial Technologies Inc. | | | | | | | | | 122,732 | |
| | | | | |
| | 3,671 | | | Beacon Roofing Supply Company, (3) | | | | | | | | | 129,917 | |
| | | | | |
| | 1,271 | | | CAI International Inc., (3) | | | | | | | | | 14,769 | |
| | | | | |
| | 932 | | | DXP Enterprises, Inc., (2), (3) | | | | | | | | | 28,202 | |
| | | | | |
| | 2,309 | | | H&E Equipment Services, Inc. | | | | | | | | | 44,587 | |
| | | | | |
| | 2,014 | | | Kaman Corporation | | | | | | | | | 78,324 | |
| | | | | |
| | 429 | | | Lawson Products, Inc. | | | | | | | | | 11,158 | |
| | | | | |
| | 7,618 | | | MRC Global Inc., (3) | | | | | | | | | 90,654 | |
| | | | | |
| | 811 | | | Neff Corporation, Class A Shares, (3) | | | | | | | | | 4,752 | |
| | | | | |
| | 2,618 | | | Rush Enterprises, Class A, (3) | | | | | | | | | 63,827 | |
| | | | | |
| | 1,175 | | | Stock Building Supply Holdings Inc., (3) | | | | | | | | | 20,304 | |
| | | | | |
| | 2,460 | | | TAL International Group Inc. | | | | | | | | | 41,722 | |
| | | | | |
| | 1,674 | | | Textainer Group Holdings Limited, (2) | | | | | | | | | 32,743 | |
| | | | | |
| | 1,345 | | | Titan Machinery, Inc., (2), (3) | | | | | | | | | 16,449 | |
| | | | | |
| | 2,970 | | | Univar Inc., (3) | | | | | | | | | 52,450 | |
| | | | | |
| | 602 | | | Veritiv Corporation, (2), (3) | | | | | | | | | 25,284 | |
| | | | Total Trading Companies & Distributors | | | | | | | | | 882,473 | |
Nuveen Small Cap Index Fund (continued)
| | |
| Portfolio of Investments | | October 31, 2015 |
| | | | | | | | | | | | | | |
| Shares | | | Description (1) | | | | | | | | Value | |
| | | | | |
| | | | Transportation Infrastructure – 0.0% | | | | | | | | | |
| | | | | |
| | 4,066 | | | Wesco Aircraft Holdings Inc., (3) | | | | | | | | $ | 50,662 | |
| | | | | |
| | | | Water Utilities – 0.3% | | | | | | | | | |
| | | | | |
| | 2,794 | | | American States Water Co | | | | | | | | | 113,856 | |
| | | | | |
| | 631 | | | Artesian Resources Corporation | | | | | | | | | 15,371 | |
| | | | | |
| | 3,542 | | | California Water Service Group | | | | | | | | | 79,199 | |
| | | | | |
| | 845 | | | Connecticut Water Service, Inc. | | | | | | | | | 31,104 | |
| | | | | |
| | 1,089 | | | Consolidated Water Company, Limited | | | | | | | | | 12,055 | |
| | | | | |
| | 1,240 | | | Middlesex Water Company | | | | | | | | | 31,955 | |
| | | | | |
| | 1,215 | | | SJW Corporation | | | | | | | | | 38,552 | |
| | | | | |
| | 1,003 | | | York Water Company | | | | | | | | | 23,250 | |
| | | | Total Water Utilities | | | | | | | | | 345,342 | |
| | | | | |
| | | | Wireless Telecommunication Services – 0.1% | | | | | | | | | |
| | | | | |
| | 2,708 | | | Boingo Wireless Inc., (3) | | | | | | | | | 20,933 | |
| | | | | |
| | 1,274 | | | NTELOS Holdings Corporation | | | | | | | | | 11,708 | |
| | | | | |
| | 1,868 | | | Shenandoah Telecommunications Company | | | | | | | | | 87,404 | |
| | | | | |
| | 1,680 | | | Spok Holdings, Inc. | | | | | | | | | 30,290 | |
| | | | Total Wireless Telecommunication Services | | | | | | | | | 150,335 | |
| | | | Total Common Stocks (cost $97,101,506) | | | | | | | | | 127,915,679 | |
| | | | | |
| Shares | | | Description (1), (5) | | | | | | | | Value | |
| | | | | |
| | | | EXCHANGE-TRADED FUNDS – 0.0% | | | | | | | | | | |
| | | | | |
| | 3,608 | | | CorEnergy Infrastructure Trust Inc. | | | | | | | | $ | 18,437 | |
| | | | Total Exchange-Traded Funds (cost $26,247) | | | | | | | | | 18,437 | |
| | | | | |
| Shares | | | Description (1) | | | | | | | | Value | |
| | | | | |
| | | | COMMON STOCK RIGHTS – 0.0% | | | | | | | | | | |
| | | | | |
| | 591 | | | Actavis PLC, (3), (4) | | | | | | | | $ | 5774 | |
| | | | | |
| | 6,523 | | | Chelsea Therapeutics International Limited, (4) | | | | | | | | | — | |
| | | | | |
| | 692 | | | Clinical Data, Inc., (3), (4) | | | | | | | | | — | |
| | | | | |
| | 1,250 | | | Durata Therapeutics Inc., (2), (4) | | | | | | | | | 1,025 | |
| | | | | |
| | 1,493 | | | Gerber Scientific Inc., (3), (4) | | | | | | | | | — | |
| | | | | |
| | 4,499 | | | Leap Wireless International Inc. (3), (4) | | | | | | | | | 11,338 | |
| | | | | |
| | 424 | | | Omthera Pharmaceuticals Inc., (3), (4) | | | | | | | | | — | |
| | | | | |
| | 2,878 | | | Trius Therapeutics Inc., (3), (4) | | | | | | | | | — | |
| | | | Total Common Stock Rights (cost $–) | | | | | | | | | 18,137 | |
| | | | | | | | | | | | | | | | | | | | |
| Shares | | | Description (1) | | | | | | | | | | | Value | |
| | | | | |
| | | | WARRANTS – 0.0% | | | | | | | | | | | | | | | | |
| | | | | |
| | 106 | | | Imperial Holdings, Inc., (4) | | | | | | | | | | | | | | $ | 21 | |
| | | | | |
| | 1,328 | | | Magnum Hunter Resources Corporation, (2), (4) | | | | | | | | | | | | | | | — | |
| | | | | |
| | 157 | | | Tejon Ranch Company, (6) | | | | | | | | | | | | | | | 18 | |
| | | | Total Warrants (cost $855) | | | | | | | | | | | | | | | 39 | |
| | | | Total Long-Term Investments (cost $97,128,608) | | | | | | | | | | | | | | | 127,952,292 | |
| | | | | |
| Shares | | | Description (1) | | | | | | | | | | | Value | |
| | | | |
| | | | INVESTMENTS PURCHASED WITH COLLATERAL FROM SECURITIES LENDING – 31.2% | | | | | | | | | | | | | |
| | | | | |
| | | | Money Market Funds – 31.2% | | | | | | | | | | | | |
| | | | | |
| | 41,498,024 | | | Mount Vernon Securities Lending Prime Portfolio, 0.256%, (7), (8) | | | | | | | | | | | | | | $ | 41,498,024 | |
| | | | Total Investments Purchased with Collateral from Securities Lending (cost $41,498,024) | | | | | | | | | | | | 41,498,024 | |
| | | | | |
Shares/
Principal
Amount (000) | | | Description (1) | | Coupon | | | Maturity | | | Ratings (9) | | | Value | |
| | | | | |
| | | | SHORT-TERM INVESTMENTS – 3.8% | | | | | | | | | | | | |
| | | | | |
| | | | Money Market Funds – 3.6% | | | | | | | | | | | | |
| | | | | |
| | 4,747,542 | | | First American Treasury Obligations Fund, Class Z | | | 0.000% (7) | | | | N/A | | | | N/A | | | $ | 4,747,542 | |
| | | | | |
| | | | U.S. Government and Agency Obligations – 0.2% | | | | | | | | | | | | |
| | | | | |
| $ | 275 | | | U.S. Treasury Bills, (10) | | | 0.000% | | | | 11/12/15 | | | | AAA | | | | 274,999 | |
| | | | Total Short-Term Investments (cost $5,022,531) | | | | | | | | | | | | | | | 5,022,541 | |
| | | | Total Investments (cost $143,649,163) – 131.2% | | | | | | | | | | | | | | | 174,472,857 | |
| | | | Other Assets Less Liabilities – (31.2)% (11) | | | | | | | | | | | | | | | (41,482,690) | |
| | | | Net Assets – 100% | | | | | | | | | | | | | | $ | 132,990,167 | |
Nuveen Small Cap Index Fund (continued)
| | |
| Portfolio of Investments | | October 31, 2015 |
Investments in Derivatives as of October 31, 2015
Futures Contracts outstanding:
| | | | | | | | | | | | | | | | | | | | | | | | |
| Description | | Contract
Position | | | Number of Contracts | | | Contract Expiration | | | Notional Amount at Value | | | Variable Margin Receivable/ (Payable) | | | Unrealized
Appreciation
(Depreciation) | |
| Russell 2000® Mini Index | | | Long | | | | 40 | | | | 12/15 | | | | 4,633,200 | | | $ | (10,400 | ) | | $ | 34,645 | |
For Fund portfolio compliance purposes, the Fund’s industry classifications refer to any one or more of the industry sub-classifications used by one or more widely recognized market indexes or ratings group indexes, and/or as defined by Fund management. This definition may not apply for purposes of this report which may combine industry sub-classifications into sectors for reporting ease.
| (1) | All percentages shown in the Portfolio of Investments are based on net assets. |
| (2) | Investment, or a portion of investment, is out on loan for securities lending. The total value of the securities out on loan as of the end of the reporting period was $39,502,828. |
| (3) | Non-income producing; issuer has not declared a dividend within the past twelve months. |
| (4) | Investment valued at fair value using methods determined in good faith by, or at the discretion of, the Board. For fair value measurement disclosure purposes, investment classified as Level 3. See Notes to Financial Statements, Note 2 – Investment Valuation and Fair Value Measurements for more information. |
| (5) | A copy of the most recent financial statements for these exchange-traded funds can be obtained from the Securities and Exchange Commission on its website at http://www.sec.gov. |
| (6) | For fair value measurement disclosure purposes, investment classified as Level 2. See Notes to Financial Statements, Note 2 – Investment Valuation and Fair Value Measurements for more information. |
| (7) | The rate shown is the annualized seven-day effective yield as of the end of the reporting period. |
| (8) | The Fund may loan securities representing up to one third of the fair value of its total assets (which includes collateral for securities on loan) to broker dealers, banks, and other institutions. The Fund maintains collateral equal to at least 100% of the fair value of the securities loaned. The cash collateral received by the Fund is invested in this money market fund. See Notes to Financial Statements, Note 3 – Portfolio Securities and Investments in Derivatives, Securities Lending for more information. |
| (9) | Ratings (not covered by the report of independent registered public accounting firm): Using the highest of Standard & Poor’s Group (“Standard & Poor’s”), Moody’s Investors Service, Inc. (“Moody’s”) or Fitch, Inc. (“Fitch”) rating. Ratings below BBB by Standard & Poor’s, Baa by Moody’s or BBB by Fitch are considered to be below investment grade. Holdings designated N/R are not rated by any of these national rating agencies. |
| (10) | Investment, or portion of investment, segregated as collateral for investments in derivatives. |
| (11) | Other assets less liabilities includes the unrealized appreciation (depreciation) of certain over-the-counter derivatives as presented on the Statement of Assets and Liabilities. The unrealized appreciation (depreciation) of exchange-cleared and exchange-traded derivatives is recognized as part of the cash collateral at brokers and/or the receivable or payable for variation margin as presented on the Statement of Assets and Liabilities, when applicable. |
| Reg S | Regulation S allows U.S. companies to sell securities to persons or entities located outside of the United States without registering those securities with the Securities and Exchange Commission. Specifically, Regulation S provides a safe harbor from the registration requirements of the Securities Act for the offers and sales of securities by both foreign and domestic issuers that are made outside the United States. |
| REIT | Real Estate Investment Trust |
See accompanying notes to financial statements.
Statement of
| | | | |
| | Assets and Liabilities | | October 31, 2015 |
| | | | | | | | | | | | |
| | | Equity
Index | | | Mid Cap
Index | | | Small Cap
Index | |
Assets | | | | | | | | | | | | |
Long-term investments, at value (cost $289,742,814, $456,761,420 and $97,128,608, respectively) | | $ | 774,601,980 | | | $ | 612,973,101 | | | $ | 127,952,292 | |
Investments purchased with collateral from securities lending, at value (cost approximates value) | | | 181,894,352 | | | | 185,712,712 | | | | 41,498,024 | |
Short-Term investments, at value (cost $11,170,558, $35,645,941 and $5,022,531, respectively) | | | 11,170,661 | | | | 35,646,044 | | | | 5,022,541 | |
Receivable for: | | | | | | | | | | | | |
Dividends | | | 884,931 | | | | 327,522 | | | | 47,566 | |
Due from Broker | | | 25,629 | | | | 35,604 | | | | 40,935 | |
Investments sold | | | 120,619 | | | | 1,096,990 | | | | 202,919 | |
Reclaims | | | 7,043 | | | | — | | | | — | |
Shares sold | | | 1,170,394 | | | | 966,173 | | | | 471,069 | |
Variation margin on futures contracts | | | — | | | | 7,537 | | | | — | |
Other assets | | | 46,613 | | | | 42,512 | | | | 21,018 | |
Total assets | | | 969,922,222 | | | | 836,808,195 | | | | 175,256,364 | |
Liabilities | | | | | | | | | | | | |
Payable for: | | | | | | | | | | | | |
Collateral from securities lending program | | | 181,894,352 | | | | 185,712,712 | | | | 41,498,024 | |
Investments purchased | | | 118,009 | | | | 1,181,207 | | | | 94,711 | |
Shares redeemed | | | 753,125 | | | | 1,975,214 | | | | 485,549 | |
Variation margin on future contracts | | | 48,825 | | | | — | | | | 10,400 | |
Accrued expenses: | | | | | | | | | | | | |
Directors fees | | | 32,237 | | | | 22,980 | | | | 1,047 | |
Management fees | | | 113,521 | | | | 110,709 | | | | 10,832 | |
12b-1 distribution and service fees | | | 99,393 | | | | 151,802 | | | | 30,651 | |
Other | | | 316,055 | | | | 397,112 | | | | 134,983 | |
Total liabilities | | | 183,375,517 | | | | 189,551,736 | | | | 42,266,197 | |
Net assets | | $ | 786,546,705 | | | $ | 647,256,459 | | | $ | 132,990,167 | |
Class A Shares | | | | | | | | | | | | |
Net assets | | $ | 192,626,212 | | | $ | 210,930,142 | | | $ | 43,050,283 | |
Shares outstanding | | | 6,786,824 | | | | 11,686,764 | | | | 3,036,078 | |
Net asset value (“NAV”) and offering price per share | | $ | 28.38 | | | $ | 18.05 | | | $ | 14.18 | |
Class C Shares | | | | | | | | | | | | |
Net assets | | $ | 17,001,643 | | | $ | 19,066,475 | | | $ | 3,225,414 | |
Shares outstanding | | | 606,157 | | | | 1,101,021 | | | | 239,903 | |
NAV and offering price per share | | $ | 28.05 | | | $ | 17.32 | | | $ | 13.44 | |
Class R3 Shares | | | | | | | | | | | | |
Net assets | | $ | 108,691,234 | | | $ | 217,247,712 | | | $ | 45,088,547 | |
Shares outstanding | | | 3,828,042 | | | | 12,207,430 | | | | 3,271,868 | |
NAV and offering price per share | | $ | 28.39 | | | $ | 17.80 | | | $ | 13.78 | |
Class I Shares | | | | | | | | | | | | |
Net assets | | $ | 468,227,616 | | | $ | 200,012,130 | | | $ | 41,625,923 | |
Shares outstanding | | | 16,502,519 | | | | 11,035,610 | | | | 2,925,281 | |
NAV and offering price per share | | $ | 28.37 | | | $ | 18.12 | | | $ | 14.23 | |
Net assets consist of: | | | | | | | | | | | | |
Capital paid-in | | $ | 265,034,686 | | | $ | 446,697,314 | | | $ | 96,560,870 | |
Undistributed (Over-distribution of) net investment income | | | 2,212,442 | | | | 4,012,411 | | | | 771,545 | |
Accumulated net realized gain (loss) | | | 33,798,843 | | | | 39,530,906 | | | | 4,799,413 | |
Net unrealized appreciation (depreciation) | | | 485,500,734 | | | | 157,015,828 | | | | 30,858,339 | |
Net assets | | $ | 786,546,705 | | | $ | 647,256,459 | | | $ | 132,990,167 | |
Authorized shares – per class | | $ | 2 billion | | | $ | 2 billion | | | $ | 2 billion | |
Par value per share | | $ | 0.0001 | | | $ | 0.0001 | | | $ | 0.0001 | |
See accompanying notes to financial statements.
Statement of
| | | | |
| | Operations | | Year Ended October 31, 2015 |
| | | | | | | | | | | | |
| | | Equity
Index | | | Mid Cap
Index | | | Small Cap
Index | |
Investment Income | | | | | | | | | | | | |
Dividend and interest income (net of foreign tax withheld of $765, $1,444 and $735, respectively) | | $ | 16,551,062 | | | $ | 9,737,823 | | | $ | 1,837,461 | |
Securities lending income, net | | | 136,763 | | | | 430,582 | | | | 365,117 | |
Total investment income | | | 16,687,825 | | | | 10,168,405 | | | | 2,202,578 | |
Expenses | | | | | | | | | | | | |
Management fees | | | 2,263,907 | | | | 2,066,443 | | | | 464,013 | |
12b-1 service fees – Class A Shares | | | 503,221 | | | | 546,467 | | | | 107,663 | |
12b-1 distribution and service fees – Class C Shares | | | 157,751 | | | | 167,041 | | | | 27,592 | |
12b-1 distribution and service fees – Class R3 Shares | | | 502,804 | | | | 1,151,724 | | | | 247,010 | |
Shareholder servicing agent fees | | | 1,178,337 | | | | 1,146,081 | | | | 233,640 | |
Custodian fees | | | 156,895 | | | | 128,662 | | | | 149,583 | |
Directors fees | | | 21,888 | | | | 18,391 | | | | 3,839 | |
Professional fees | | | 73,913 | | | | 60,045 | | | | 28,107 | |
Shareholder reporting expenses | | | 93,180 | | | | 201,578 | | | | 56,556 | |
Federal and state registration fees | | | 64,461 | | | | 69,173 | | | | 55,361 | |
Other expenses | | | 48,447 | | | | 47,455 | | | | 73,927 | |
Total expenses before fee waiver/expense reimbursement | | | 5,064,804 | | | | 5,603,060 | | | | 1,447,291 | |
Fee waiver/expense reimbursement | | | (859,624 | ) | | | (510,086 | ) | | | (274,626 | ) |
Net expenses | | | 4,205,180 | | | | 5,092,974 | | | | 1,172,665 | |
Net investment income (loss) | | | 12,482,645 | | | | 5,075,431 | | | | 1,029,913 | |
Realized and Unrealized Gain (Loss) | | | | | | | | | | | | |
Net realized gain (loss) from: | | | | | | | | | | | | |
Investments | | | 53,316,491 | | | | 47,671,172 | | | | 6,035,615 | |
Futures contracts | | | (773,985 | ) | | | (2,125,431 | ) | | | (133,511 | ) |
Change in net unrealized appreciation (depreciation) of: | | | | | | | | | | | | |
Investments | | | (28,106,248 | ) | | | (33,094,574 | ) | | | (7,297,609 | ) |
Futures contracts | | | 372,931 | | | | 890,732 | | | | (63,340 | ) |
Net realized and unrealized gain (loss) | | | 24,809,189 | | | | 13,341,899 | | | | (1,458,845 | ) |
Net increase (decrease) in net assets from operations | | $ | 37,291,834 | | | $ | 18,417,330 | | | $ | (428,932 | ) |
See accompanying notes to financial statements.
Statement of
| | | | | | | | | | | | | | | | | | |
| | | Equity Index | | | | | Mid Cap Index | |
| | | Year Ended
10/31/15 | | | Year Ended
10/31/14 | | | | | Year Ended
10/31/15 | | | Year Ended
10/31/14 | |
Operations | | | | | | | | | | | | | | | | | | |
Net investment income (loss) | | $ | 12,482,645 | | | $ | 12,188,234 | | | | | $ | 5,075,431 | | | $ | 4,700,032 | |
Net realized gain (loss) from: | | | | | | | | | | | | | | | | | | |
Investments | | | 53,316,491 | | | | 47,183,736 | | | | | | 47,671,172 | | | | 29,306,428 | |
Futures contracts | | | (773,985 | ) | | | 3,559,825 | | | | | | (2,125,431 | ) | | | 6,397,071 | |
Change in net unrealized appreciation (depreciation) of: | | | | | | | | | | | | | | | | | | |
Investments | | | (28,106,248 | ) | | | 61,690,836 | | | | | | (33,094,574 | ) | | | 27,967,853 | |
Futures contracts | | | 372,931 | | | | (149,399 | ) | | | | | 890,732 | | | | (1,556,867 | ) |
Net increase (decrease) in net assets from operations | | | 37,291,834 | | | | 124,473,232 | | | | | | 18,417,330 | | | | 66,814,517 | |
Distributions to Shareholders | | | | | | | | | | | | | | | | | | |
From net investment income: | | | | | | | | | | | | | | | | | | |
Class A Shares | | | (2,738,996 | ) | | | (2,726,149 | ) | | | | | (1,853,365 | ) | | | (1,225,635 | ) |
Class C Shares | | | (97,002 | ) | | | (77,803 | ) | | | | | (19,009 | ) | | | — | |
Class R3 Shares | | | (1,131,525 | ) | | | (809,289 | ) | | | | | (1,422,983 | ) | | | (767,824 | ) |
Class I Shares | | | (8,154,510 | ) | | | (8,606,676 | ) | | | | | (2,407,249 | ) | | | (1,934,833 | ) |
From accumulated net realized gains: | | | | | | | | | | | | | | | | | | |
Class A Shares | | | (9,192,119 | ) | | | (13,698,118 | ) | | | | | (9,630,727 | ) | | | (7,006,416 | ) |
Class C Shares | | | (655,527 | ) | | | (816,443 | ) | | | | | (694,689 | ) | | | (432,841 | ) |
Class R3 Shares | | | (4,022,116 | ) | | | (4,767,202 | ) | | | | | (10,517,244 | ) | | | (7,116,110 | ) |
Class I Shares | | | (24,548,328 | ) | | | (38,641,025 | ) | | | | | (9,847,361 | ) | | | (8,216,759 | ) |
Decrease in net assets from distributions to shareholders | | | (50,540,123 | ) | | | (70,142,705 | ) | | | | | (36,392,627 | ) | | | (26,700,418 | ) |
Fund Share Transactions | | | | | | | | | | | | | | | | | | |
Proceeds from sale of shares | | | 146,699,781 | | | | 120,916,624 | | | | | | 141,016,955 | | | | 159,221,687 | |
Proceeds from shares issued to shareholders due to reinvestment of distributions | | | 43,105,273 | | | | 58,544,863 | | | | | | 33,191,887 | | | | 23,558,777 | |
| | | 189,805,054 | | | | 179,461,487 | | | | | | 174,208,842 | | | | 182,780,464 | |
Cost of shares redeemed | | | (218,320,680 | ) | | | (194,721,398 | ) | | | | | (171,596,895 | ) | | | (166,917,433 | ) |
Net increase (decrease) in net assets from Fund share transactions | | | (28,515,626 | ) | | | (15,259,911 | ) | | | | | 2,611,947 | | | | 15,863,031 | |
Net increase (decrease) in net assets | | | (41,763,915 | ) | | | 39,070,616 | | | | | | (15,363,350 | ) | | | 55,977,130 | |
Net assets at the beginning of period | | | 828,310,620 | | | | 789,240,004 | | | | | | 662,619,809 | | | | 606,642,679 | |
Net assets at the end of period | | $ | 786,546,705 | | | $ | 828,310,620 | | | | | $ | 647,256,459 | | | $ | 662,619,809 | |
Undistributed (Over-distribution of) net investment income at the end of period | | $ | 2,212,442 | | | $ | 1,771,445 | | | | | $ | 4,012,411 | | | $ | 4,459,501 | |
See accompanying notes to financial statements.
Statement of Changes in Net Assets (continued)
| | | | | | | | |
| | | Small Cap Index | |
| | | Year Ended
10/31/15 | | | Year Ended
10/31/14 | |
Operations | | | | | | | | |
Net investment income (loss) | | $ | 1,029,913 | | | $ | 973,945 | |
Net realized gain (loss) from: | | | | | | | | |
Investments | | | 6,035,615 | | | | 6,949,801 | |
Futures contracts | | | (133,511 | ) | | | 835,042 | |
Change in net unrealized appreciation (depreciation) of: | | | | | | | | |
Investments | | | (7,297,609 | ) | | | 1,719,680 | |
Futures contracts | | | (63,340 | ) | | | (335,989 | ) |
Net increase (decrease) in net assets from operations | | | (428,932 | ) | | | 10,142,479 | |
Distributions to Shareholders | | | | | | | | |
From net investment income: | | | | | | | | |
Class A Shares | | | (365,247 | ) | | | (343,366 | ) |
Class C Shares | | | (2,919 | ) | | | (2,125 | ) |
Class R3 Shares | | | (310,921 | ) | | | (240,588 | ) |
Class I Shares | | | (520,976 | ) | | | (499,459 | ) |
From accumulated net realized gains: | | | | | | | | |
Class A Shares | | | (2,179,623 | ) | | | (2,138,261 | ) |
Class C Shares | | | (139,573 | ) | | | (122,652 | ) |
Class R3 Shares | | | (2,670,039 | ) | | | (2,218,626 | ) |
Class I Shares | | | (2,441,130 | ) | | | (2,498,135 | ) |
Decrease in net assets from distributions to shareholders | | | (8,630,428 | ) | | | (8,063,212 | ) |
Fund Share Transactions | | | | | | | | |
Proceeds from sale of shares | | | 38,060,059 | | | | 41,924,541 | |
Proceeds from shares issued to shareholders due to reinvestment of distributions | | | 7,920,049 | | | | 7,014,093 | |
| | | 45,980,108 | | | | 48,938,634 | |
Cost of shares redeemed | | | (44,615,077 | ) | | | (44,300,708 | ) |
Net increase (decrease) in net assets from Fund share transactions | | | 1,365,031 | | | | 4,637,926 | |
Net increase (decrease) in net assets | | | (7,694,329 | ) | | | 6,717,193 | |
Net assets at the beginning of period | | | 140,684,496 | | | | 133,967,303 | |
Net assets at the end of period | | $ | 132,990,167 | | | $ | 140,684,496 | |
Undistributed (Over-distribution of) net investment income at the end of period | | $ | 771,545 | | | $ | 886,010 | |
See accompanying notes to financial statements.
THIS PAGE INTENTIONALLY LEFT BLANK
Financial
Highlights
Equity Index
Selected data for a share outstanding throughout each period:
| | | | | | | | | | | | | | | | | | | | | | | | | | | | | | | | | | |
| | | | | |
| | | | | | Investment Operations | | | | | Less Distributions | | | | |
| | | | | | | | | |
Class (Commencement Date) Year Ended October 31, | | Beginning
NAV | | | Net
Investment
Income
(Loss)(a) | | | Net
Realized/
Unrealized
Gain (Loss) | | | Total | | | | | From
Net
Investment
Income | | | From Accumulated Net Realized
Gains | | | Total | | | Ending
NAV | |
Class A (12/92) | | | | | | | | | | | | | | | | | | | | | | | | | | | |
2015 | | $ | 28.86 | | | $ | 0.40 | | | $ | 0.84 | | | $ | 1.24 | | | | | $ | (0.38 | ) | | $ | (1.34 | ) | | $ | (1.72 | ) | | $ | 28.38 | |
2014 | | | 27.10 | | | | 0.38 | | | | 3.78 | | | | 4.16 | | | | | | (0.38 | ) | | | (2.02 | ) | | | (2.40 | ) | | | 28.86 | |
2013 | | | 22.35 | | | | 0.38 | | | | 5.31 | | | | 5.69 | | | | | | (0.39 | ) | | | (0.55 | ) | | | (0.94 | ) | | | 27.10 | |
2012 | | | 21.44 | | | | 0.34 | | | | 2.48 | | | | 2.82 | | | | | | (0.35 | ) | | | (1.56 | ) | | | (1.91 | ) | | | 22.35 | |
2011 | | | 21.51 | | | | 0.30 | | | | 1.26 | | | | 1.56 | | | | | | (0.26 | ) | | | (1.37 | ) | | | (1.63 | ) | | | 21.44 | |
Class C (2/99) | | | | | | | | | | | | | | | | | | | | | | | | | | | |
2015 | | | 28.54 | | | | 0.18 | | | | 0.84 | | | | 1.02 | | | | | | (0.17 | ) | | | (1.34 | ) | | | (1.51 | ) | | | 28.05 | |
2014 | | | 26.82 | | | | 0.17 | | | | 3.74 | | | | 3.91 | | | | | | (0.17 | ) | | | (2.02 | ) | | | (2.19 | ) | | | 28.54 | |
2013 | | | 22.13 | | | | 0.20 | | | | 5.24 | | | | 5.44 | | | | | | (0.20 | ) | | | (0.55 | ) | | | (0.75 | ) | | | 26.82 | |
2012 | | | 21.24 | | | | 0.17 | | | | 2.46 | | | | 2.63 | | | | | | (0.18 | ) | | | (1.56 | ) | | | (1.74 | ) | | | 22.13 | |
2011 | | | 21.32 | | | | 0.13 | | | | 1.26 | | | | 1.39 | | | | | | (0.10 | ) | | | (1.37 | ) | | | (1.47 | ) | | | 21.24 | |
Class R3 (9/01) | | | | | | | | | | | | | | | | | | | | | | | | | | | |
2015 | | | 28.87 | | | | 0.32 | | | | 0.85 | | | | 1.17 | | | | | | (0.31 | ) | | | (1.34 | ) | | | (1.65 | ) | | | 28.39 | |
2014 | | | 27.04 | | | | 0.31 | | | | 3.85 | | | | 4.16 | | | | | | (0.31 | ) | | | (2.02 | ) | | | (2.33 | ) | | | 28.87 | |
2013 | | | 22.31 | | | | 0.31 | | | | 5.30 | | | | 5.61 | | | | | | (0.33 | ) | | | (0.55 | ) | | | (0.88 | ) | | | 27.04 | |
2012 | | | 21.40 | | | | 0.28 | | | | 2.48 | | | | 2.76 | | | | | | (0.29 | ) | | | (1.56 | ) | | | (1.85 | ) | | | 22.31 | |
2011 | | | 21.47 | | | | 0.25 | | | | 1.26 | | | | 1.51 | | | | | | (0.21 | ) | | | (1.37 | ) | | | (1.58 | ) | | | 21.40 | |
Class I (2/94) | | | | | | | | | | | | | | | | | | | | | | | | | | | |
2015 | | | 28.85 | | | | 0.47 | | | | 0.84 | | | | 1.31 | | | | | | (0.45 | ) | | | (1.34 | ) | | | (1.79 | ) | | | 28.37 | |
2014 | | | 27.09 | | | | 0.45 | | | | 3.78 | | | | 4.23 | | | | | | (0.45 | ) | | | (2.02 | ) | | | (2.47 | ) | | | 28.85 | |
2013 | | | 22.35 | | | | 0.45 | | | | 5.29 | | | | 5.74 | | | | | | (0.45 | ) | | | (0.55 | ) | | | (1.00 | ) | | | 27.09 | |
2012 | | | 21.43 | | | | 0.39 | | | | 2.49 | | | | 2.88 | | | | | | (0.40 | ) | | | (1.56 | ) | | | (1.96 | ) | | | 22.35 | |
2011 | | | 21.50 | | | | 0.36 | | | | 1.26 | | | | 1.62 | | | | | | (0.32 | ) | | | (1.37 | ) | | | (1.69 | ) | | | 21.43 | |
| | | | | | | | | | | | | | | | | | | | | | | | | | | | | | |
| | | | Ratios/Supplemental Data | |
| | | | | | | | | Ratios to Average
Net Assets Before
Waiver/Reimbursement | | | | | Ratios to Average
Net Assets After
Waiver/Reimbursement(c) | | | | |
| | | | | | | | |
Total
Return(b) | | | Ending
Net
Assets
(000) | | | | | Expenses | | | Net
Investment
Income
(Loss) | | | | | Expenses | | | Net
Investment
Income
(Loss) | | | Portfolio
Turnover
Rate(d) | |
| | | | | | | | | | | | | | | | | | | | | | | | | | | | | | |
| | 4.63 | % | | $ | 192,626 | | | | | | 0.72 | % | | | 1.30 | % | | | | | 0.62 | % | | | 1.40 | % | | | 2 | % |
| | 16.55 | | | | 203,668 | | | | | | 0.73 | | | | 1.27 | | | | | | 0.62 | | | | 1.38 | | | | 2 | |
| | 26.32 | | | | 183,491 | | | | | | 0.71 | | | | 1.48 | | | | | | 0.62 | | | | 1.57 | | | | 2 | |
| | 14.51 | | | | 143,664 | | | | | | 0.69 | | | | 1.49 | | | | | | 0.62 | | | | 1.56 | | | | 1 | |
| | 7.41 | | | | 119,172 | | | | | | 0.70 | | | | 1.29 | | | | | | 0.62 | | | | 1.37 | | | | 2 | |
| | | | | | | | | | | | | | | | | | | | | | | | | | | | | | |
| | 3.84 | | | | 17,002 | | | | | | 1.47 | | | | 0.54 | | | | | | 1.37 | | | | 0.64 | | | | 2 | |
| | 15.71 | | | | 13,275 | | | | | | 1.48 | | | | 0.52 | | | | | | 1.37 | | | | 0.63 | | | | 2 | |
| | 25.35 | | | | 10,752 | | | | | | 1.46 | | | | 0.72 | | | | | | 1.37 | | | | 0.82 | | | | 2 | |
| | 13.70 | | | | 8,095 | | | | | | 1.44 | | | | 0.75 | | | | | | 1.37 | | | | 0.82 | | | | 1 | |
| | 6.61 | | | | 8,261 | | | | | | 1.45 | | | | 0.55 | | | | | | 1.37 | | | | 0.62 | | | | 2 | |
| | | | | | | | | | | | | | | | | | | | | | | | | | | | | | |
| | 4.37 | | | | 108,691 | | | | | | 0.97 | | | | 1.03 | | | | | | 0.87 | | | | 1.14 | | | | 2 | |
| | 16.27 | | | | 81,677 | | | | | | 0.98 | | | | 1.02 | | | | | | 0.87 | | | | 1.13 | | | | 2 | |
| | 25.96 | | | | 61,823 | | | | | | 0.97 | | | | 1.19 | | | | | | 0.87 | | | | 1.29 | | | | 2 | |
| | 14.26 | | | | 33,685 | | | | | | 0.94 | | | | 1.22 | | | | | | 0.87 | | | | 1.28 | | | | 1 | |
| | 7.15 | | | | 14,218 | | | | | | 0.95 | | | | 1.06 | | | | | | 0.87 | | | | 1.13 | | | | 2 | |
| | | | | | | | | | | | | | | | | | | | | | | | | | | | | | |
| | 4.90 | | | | 468,228 | | | | | | 0.47 | | | | 1.55 | | | | | | 0.37 | | | | 1.66 | | | | 2 | |
| | 16.84 | | | | 529,691 | | | | | | 0.48 | | | | 1.53 | | | | | | 0.37 | | | | 1.64 | | | | 2 | |
| | 26.59 | | | | 531,131 | | | | | | 0.46 | | | | 1.76 | | | | | | 0.37 | | | | 1.85 | | | | 2 | |
| | 14.85 | | | | 556,215 | | | | | | 0.44 | | | | 1.75 | | | | | | 0.37 | | | | 1.82 | | | | 1 | |
| | 7.68 | | | | 597,030 | | | | | | 0.45 | | | | 1.55 | | | | | | 0.37 | | | | 1.63 | | | | 2 | |
| (a) | Per share Net Investment Income (Loss) is calculated using the average daily shares method. | |
| (b) | Total return is the combination of changes in NAV, reinvested dividend income at NAV and reinvested capital gains distributions at NAV, if any. Total returns are not annualized. | |
| (c) | After fee waiver and/or expense reimbursement from the Adviser, where applicable. | |
| (d) | Portfolio Turnover Rate is calculated based on the lesser of long-term purchases or sales (as disclosed in Note 5 – Investment Transactions) divided by the average long-term market value during the period. | |
See accompanying notes to financial statements.
Financial Highlights (continued)
Mid Cap Index
Selected data for a share outstanding throughout each period:
| | | | | | | | | | | | | | | | | | | | | | | | | | | | | | | | | | |
| | | | | |
| | | | | | Investment Operations | | | | | Less Distributions | | | | |
| | | | | | | | | |
Class (Commencement Date) Year Ended October 31, | | Beginning
NAV | | | Net
Investment
Income
(Loss)(a) | | | Net
Realized/
Unrealized
Gain (Loss) | | | Total | | | | | From Net
Investment
Income | | | From
Accumulated
Net Realized
Gains | | | Total | | | Ending
NAV | |
Class A (11/99) | | | | | | | | | | | | | | | | | | | | | | | | | | | | | | | |
2015 | | $ | 18.58 | | | $ | 0.14 | | | $ | 0.35 | | | $ | 0.49 | | | | | $ | (0.16 | ) | | $ | (0.86 | ) | | $ | (1.02 | ) | | $ | 18.05 | |
2014 | | | 17.50 | | | | 0.13 | | | | 1.71 | | | | 1.84 | | | | | | (0.11 | ) | | | (0.65 | ) | | | (0.76 | ) | | | 18.58 | |
2013 | | | 13.76 | | | | 0.13 | | | | 4.17 | �� | | | 4.30 | | | | | | (0.10 | ) | | | (0.46 | ) | | | (0.56 | ) | | | 17.50 | |
2012 | | | 12.87 | | | | 0.09 | | | | 1.31 | | | | 1.40 | | | | | | (0.03 | ) | | | (0.48 | ) | | | (0.51 | ) | | | 13.76 | |
2011 | | | 11.98 | | | | 0.05 | | | | 0.92 | | | | 0.97 | | | | | | (0.08 | ) | | | — | | | | (0.08 | ) | | | 12.87 | |
Class C (9/01) | | | | | | | | | | | | | | | | | | | | | | | | | | | | | | | |
2015 | | | 17.86 | | | | — | * | | | 0.34 | | | | 0.34 | | | | | | (0.02 | ) | | | (0.86 | ) | | | (0.88 | ) | | | 17.32 | |
2014 | | | 16.87 | | | | — | * | | | 1.64 | | | | 1.64 | | | | | | — | | | | (0.65 | ) | | | (0.65 | ) | | | 17.86 | |
2013 | | | 13.28 | | | | 0.01 | | | | 4.04 | | | | 4.05 | | | | | | — | | | | (0.46 | ) | | | (0.46 | ) | | | 16.87 | |
2012 | | | 12.51 | | | | (0.01 | ) | | | 1.26 | | | | 1.25 | | | | | | — | | | | (0.48 | ) | | | (0.48 | ) | | | 13.28 | |
2011 | | | 11.67 | | | | (0.05 | ) | | | 0.89 | | | | 0.84 | | | | | | — | | | | — | | | | — | | | | 12.51 | |
Class R3 (11/00) | | | | | | | | | | | | | | | | | | | | | | | | | | | | | | | |
2015 | | | 18.33 | | | | 0.10 | | | | 0.34 | | | | 0.44 | | | | | | (0.11 | ) | | | (0.86 | ) | | | (0.97 | ) | | | 17.80 | |
2014 | | | 17.28 | | | | 0.09 | | | | 1.68 | | | | 1.77 | | | | | | (0.07 | ) | | | (0.65 | ) | | | (0.72 | ) | | | 18.33 | |
2013 | | | 13.59 | | | | 0.10 | | | | 4.11 | | | | 4.21 | | | | | | (0.06 | ) | | | (0.46 | ) | | | (0.52 | ) | | | 17.28 | |
2012 | | | 12.73 | | | | 0.06 | | | | 1.28 | | | | 1.34 | | | | | | — | | | | (0.48 | ) | | | (0.48 | ) | | | 13.59 | |
2011 | | | 11.86 | | | | 0.01 | | | | 0.92 | | | | 0.93 | | | | | | (0.06 | ) | | | — | | | | (0.06 | ) | | | 12.73 | |
Class I (11/99) | | | | | | | | | | | | | | | | | | | | | | | | | | | | | | | |
2015 | | | 18.65 | | | | 0.19 | | | | 0.34 | | | | 0.53 | | | | | | (0.20 | ) | | | (0.86 | ) | | | (1.06 | ) | | | 18.12 | |
2014 | | | 17.57 | | | | 0.18 | | | | 1.70 | | | | 1.88 | | | | | | (0.15 | ) | | | (0.65 | ) | | | (0.80 | ) | | | 18.65 | |
2013 | | | 13.81 | | | | 0.18 | | | | 4.17 | | | | 4.35 | | | | | | (0.13 | ) | | | (0.46 | ) | | | (0.59 | ) | | | 17.57 | |
2012 | | | 12.92 | | | | 0.12 | | | | 1.32 | | | | 1.44 | | | | | | (0.07 | ) | | | (0.48 | ) | | | (0.55 | ) | | | 13.81 | |
2011 | | | 12.03 | | | | 0.08 | | | | 0.91 | | | | 0.99 | | | | | | (0.10 | ) | | | — | | | | (0.10 | ) | | | 12.92 | |
| | | | | | | | | | | | | | | | | | | | | | | | | | | | | | |
| | | | Ratios/Supplemental Data | |
| | | | | | | | | Ratios to Average
Net Assets Before
Waiver/Reimbursement | | | | | Ratios to Average
Net Assets After
Waiver/Reimbursement(c) | | | | |
| | | | | | | | |
Total
Return(b) | | | Ending
Net
Assets
(000) | | | | | Expenses | | | Net
Investment
Income
(Loss) | | | | | Expenses | | | Net
Investment
Income
(Loss) | | | Portfolio
Turnover
Rate(d) | |
| | | | | | | | | | | | | | | | | | | | | | | | | | | | | | |
| | 2.86 | % | | $ | 210,930 | | | | | | 0.80 | % | | | 0.70 | % | | | | | 0.73 | % | | | 0.77 | % | | | 12 | % |
| | 10.94 | | | | 210,964 | | | | | | 0.80 | | | | 0.66 | | | | | | 0.73 | | | | 0.73 | | | | 10 | |
| | 32.46 | | | | 185,942 | | | | | | 0.76 | | | | 0.84 | | | | | | 0.73 | | | | 0.86 | | | | 7 | |
| | 11.48 | | | | 104,467 | | | | | | 0.80 | | | | 0.61 | | | | | | 0.74 | | | | 0.67 | | | | 7 | |
| | 8.07 | | | | 68,856 | | | | | | 0.79 | | | | 0.32 | | | | | | 0.75 | | | | 0.36 | | | | 23 | |
| | | | | | | | | | | | | | | | | | | | | | | | | | | | | | |
| | 2.13 | | | | 19,066 | | | | | | 1.55 | | | | (0.06 | ) | | | | | 1.48 | | | | 0.02 | | | | 12 | |
| | 10.10 | | | | 13,810 | | | | | | 1.55 | | | | (0.09 | ) | | | | | 1.48 | | | | (0.02 | ) | | | 10 | |
| | 31.51 | | | | 10,925 | | | | | | 1.51 | | | | 0.07 | | | | | | 1.48 | | | | 0.10 | | | | 7 | |
| | 10.60 | | | | 5,290 | | | | | | 1.55 | | | | (0.13 | ) | | | | | 1.49 | | | | (0.07 | ) | | | 7 | |
| | 7.20 | | | | 3,302 | | | | | | 1.53 | | | | (0.42 | ) | | | | | 1.50 | | | | (0.39 | ) | | | 23 | |
| | | | | | | | | | | | | | | | | | | | | | | | | | | | | | |
| | 2.64 | | | | 217,248 | | | | | | 1.05 | | | | 0.45 | | | | | | 0.98 | | | | 0.52 | | | | 12 | |
| | 10.64 | | | | 221,651 | | | | | | 1.05 | | | | 0.41 | | | | | | 0.98 | | | | 0.48 | | | | 10 | |
| | 32.16 | | | | 186,673 | | | | | | 1.01 | | | | 0.60 | | | | | | 0.98 | | | | 0.62 | | | | 7 | |
| | 11.14 | | | | 113,834 | | | | | | 1.05 | | | | 0.36 | | | | | | 0.99 | | | | 0.42 | | | | 7 | |
| | 7.83 | | | | 65,060 | | | | | | 1.04 | | | | 0.07 | | | | | | 1.00 | | | | 0.11 | | | | 23 | |
| | | | | | | | | | | | | | | | | | | | | | | | | | | | | | |
| | 3.11 | | | | 200,012 | | | | | | 0.55 | | | | 0.95 | | | | | | 0.48 | | | | 1.03 | | | | 12 | |
| | 11.16 | | | | 216,194 | | | | | | 0.55 | | | | 0.91 | | | | | | 0.48 | | | | 0.98 | | | | 10 | |
| | 32.82 | | | | 223,102 | | | | | | 0.51 | | | | 1.12 | | | | | | 0.48 | | | | 1.14 | | | | 7 | |
| | 11.80 | | | | 168,328 | | | | | | 0.55 | | | | 0.87 | | | | | | 0.49 | | | | 0.93 | | | | 7 | |
| | 8.23 | | | | 170,174 | | | | | | 0.53 | | | | 0.59 | | | | | | 0.50 | | | | 0.63 | | | | 23 | |
| (a) | Per share Net Investment Income (Loss) is calculated using the average daily shares method. | |
| (b) | Total return is the combination of changes in NAV, reinvested dividend income at NAV and reinvested capital gains distributions at NAV, if any. Total returns are not annualized. | |
| (c) | After fee waiver and/or expense reimbursement from the Adviser, where applicable. | |
| (d) | Portfolio Turnover Rate is calculated based on the lesser of long-term purchases or sales (as disclosed in Note 5 – Investment Transactions) divided by the average long-term market value during the period. | |
| * | Rounds to less than 0.01 per share. | |
See accompanying notes to financial statements.
Financial Highlights (continued)
Small Cap Index
Selected data for a share outstanding throughout each period:
| | | | | | | | | | | | | | | | | | | | | | | | | | | | | | | | | | |
| | | | | |
| | | | | | Investment Operations | | | | | Less Distributions | | | | |
| | | | | | | | | |
Class (Commencement Date) Year Ended October 31, | | Beginning
NAV | | | Net
Investment
Income
(Loss)(a) | | | Net
Realized/
Unrealized
Gain (Loss) | | | Total | | | | | From
Net
Investment
Income | | | From
Accumulated
Net Realized
Gains | | | Total | | | Ending
NAV | |
Class A (12/98) | | | | | | | | | | | | | | | | | | | | | | | | | | | | | | | | | | |
2015 | | $ | 15.18 | | | $ | 0.11 | | | $ | (0.17 | ) | | $ | (0.06 | ) | | | | $ | (0.13 | ) | | $ | (0.81 | ) | | $ | (0.94 | ) | | $ | 14.18 | |
2014 | | | 14.99 | | | | 0.10 | | | | 0.98 | | | | 1.08 | | | | | | (0.12 | ) | | | (0.77 | ) | | | (0.89 | ) | | | 15.18 | |
2013 | | | 11.59 | | | | 0.14 | | | | 3.79 | | | | 3.93 | | | | | | (0.08 | ) | | | (0.45 | ) | | | (0.53 | ) | | | 14.99 | |
2012 | | | 10.43 | | | | 0.08 | | | | 1.11 | | | | 1.19 | | | | | | (0.03 | ) | | | — | | | | (0.03 | ) | | | 11.59 | |
2011 | | | 9.89 | | | | 0.05 | | | | 0.55 | | | | 0.60 | | | | | | (0.06 | ) | | | — | | | | (0.06 | ) | | | 10.43 | |
Class C (9/01) | | | | | | | | | | | | | | | | | | | | | | | | | | | | | | | | | | |
2015 | | | 14.43 | | | | — | ** | | | (0.16 | ) | | | (0.16 | ) | | | | | (0.02 | ) | | | (0.81 | ) | | | (0.83 | ) | | | 13.44 | |
2014 | | | 14.31 | | | | (0.01 | ) | | | 0.91 | | | | 0.90 | | | | | | (0.01 | ) | | | (0.77 | ) | | | (0.78 | ) | | | 14.43 | |
2013 | | | 11.08 | | | | 0.03 | | | | 3.65 | | | | 3.68 | | | | | | — | | | | (0.45 | ) | | | (0.45 | ) | | | 14.31 | |
2012 | | | 10.02 | | | | — | | | | 1.06 | | | | 1.06 | | | | | | — | | | | — | | | | — | | | | 11.08 | |
2011 | | | 9.52 | | | | (0.03 | ) | | | 0.53 | | | | 0.50 | | | | | | — | | | | — | | | | — | | | | 10.02 | |
Class R3 (12/98) | | | | | | | | | | | | | | | | | | | | | | | | | | | | | | | | | | |
2015 | | | 14.77 | | | | 0.07 | | | | (0.16 | ) | | | (0.09 | ) | | | | | (0.09 | ) | | | (0.81 | ) | | | (0.90 | ) | | | 13.78 | |
2014 | | | 14.62 | | | | 0.07 | | | | 0.93 | | | | 1.00 | | | | | | (0.08 | ) | | | (0.77 | ) | | | (0.85 | ) | | | 14.77 | |
2013 | | | 11.31 | | | | 0.10 | | | | 3.72 | | | | 3.82 | | | | | | (0.06 | ) | | | (0.45 | ) | | | (0.51 | ) | | | 14.62 | |
2012 | | | 10.18 | | | | 0.05 | | | | 1.08 | | | | 1.13 | | | | | | — | | | | — | | | | — | | | | 11.31 | |
2011 | | | 9.66 | | | | 0.03 | | | | 0.53 | | | | 0.56 | | | | | | (0.04 | ) | | | — | | | | (0.04 | ) | | | 10.18 | |
Class I (12/98) | | | | | | | | | | | | | | | | | | | | | | | | | | | | | | | | | | |
2015 | | | 15.23 | | | | 0.15 | | | | (0.17 | ) | | | (0.02 | ) | | | | | (0.17 | ) | | | (0.81 | ) | | | (0.98 | ) | | | 14.23 | |
2014 | | | 15.04 | | | | 0.14 | | | | 0.97 | | | | 1.11 | | | | | | (0.15 | ) | | | (0.77 | ) | | | (0.92 | ) | | | 15.23 | |
2013 | | | 11.63 | | | | 0.17 | | | | 3.80 | | | | 3.97 | | | | | | (0.11 | ) | | | (0.45 | ) | | | (0.56 | ) | | | 15.04 | |
2012 | | | 10.46 | | | | 0.11 | | | | 1.12 | | | | 1.23 | | | | | | (0.06 | ) | | | — | | | | (0.06 | ) | | | 11.63 | |
2011 | | | 9.91 | | | | 0.08 | | | | 0.55 | | | | 0.63 | | | | | | (0.08 | ) | | | — | | | | (0.08 | ) | | | 10.46 | |
| | | | | | | | | | | | | | | | | | | | | | | | | | | | | | |
| | | | Ratios/Supplemental Data | |
| | | | | | | | | Ratios to Average
Net Assets Before
Waiver/Reimbursement | | | | | Ratios to Average
Net Assets After
Waiver/Reimbursement(c) | | | | |
| | | | | | | | |
Total
Return(b) | | | Ending
Net
Assets
(000) | | | | | Expenses | | | Net
Investment
Income
(Loss) | | | | | Expenses | | | Net
Investment
Income
(Loss) | | | Portfolio
Turnover
Rate(d) | |
| | | | | | | | | | | | | | | | | | | | | | | | | | | | | | |
| | (0.31 | )% | | $ | 43,050 | | | | | | 1.01 | % | | | 0.56 | % | | | | | 0.81 | % | | | 0.75 | % | | | 14 | % |
| | 7.54 | | | | 42,411 | | | | | | 1.03 | | | | 0.49 | | | | | | 0.81 | | | | 0.71 | | | | 12 | |
| | 35.52 | | | | 41,769 | | | | | | 1.07 | | | | 0.81 | | | | | | 0.82 | | | | 1.06 | | | | 11 | |
| | 11.44 | | | | 28,640 | | | | | | 1.27 | | | | 0.28 | | | | | | 0.83 | | | | 0.72 | | | | 20 | |
| | 6.03 | | | | 19,406 | | | | | | 1.17 | | | | 0.15 | | | | | | 0.83 | | | | 0.50 | | | | 14 | |
| | | | | | | | | | | | | | | | | | | | | | | | | | | | | | |
| | (1.05 | ) | | | 3,225 | | | | | | 1.76 | | | | (0.20 | ) | | | | | 1.56 | | | | (0.01 | ) | | | 14 | |
| | 6.64 | | | | 2,500 | | | | | | 1.78 | | | | (0.27 | ) | | | | | 1.56 | | | | (0.05 | ) | | | 12 | |
| | 34.57 | | | | 2,155 | | | | | | 1.82 | | | | — | * | | | | | 1.57 | | | | 0.25 | | | | 11 | |
| | 10.58 | | | | 1,246 | | | | | | 2.00 | | | | (0.46 | ) | | | | | 1.58 | | | | (0.03 | ) | | | 20 | |
| | 5.25 | | | | 1,330 | | | | | | 1.90 | | | | (0.58 | ) | | | | | 1.58 | | | | (0.26 | ) | | | 14 | |
| | | | | | | | | | | | | | | | | | | | | | | | | | | | | | |
| | (0.52 | ) | | | 45,089 | | | | | | 1.26 | | | | 0.30 | | | | | | 1.06 | | | | 0.50 | | | | 14 | |
| | 7.19 | | | | 48,483 | | | | | | 1.28 | | | | 0.24 | | | | | | 1.06 | | | | 0.46 | | | | 12 | |
| | 35.24 | | | | 41,350 | | | | | | 1.32 | | | | 0.49 | | | | | | 1.07 | | | | 0.74 | | | | 11 | |
| | 11.13 | | | | 20,198 | | | | | | 1.52 | | | | 0.02 | | | | | | 1.08 | | | | 0.47 | | | | 20 | |
| | 5.79 | | | | 11,824 | | | | | | 1.44 | | | | (0.12 | ) | | | | | 1.08 | | | | 0.24 | | | | 14 | |
| | | | | | | | | | | | | | | | | | | | | | | | | | | | | | |
| | (0.06 | ) | | | 41,626 | | | | | | 0.75 | | | | 0.81 | | | | | | 0.56 | | | | 1.00 | | | | 14 | |
| | 7.76 | | | | 47,291 | | | | | | 0.78 | | | | 0.75 | | | | | | 0.56 | | | | 0.96 | | | | 12 | |
| | 35.82 | | | | 48,694 | | | | | | 0.82 | | | | 1.05 | | | | | | 0.57 | | | | 1.30 | | | | 11 | |
| | 11.79 | | | | 33,733 | | | | | | 1.00 | | | | 0.55 | | | | | | 0.58 | | | | 0.97 | | | | 20 | |
| | 6.33 | | | | 40,135 | | | | | | 0.90 | | | | 0.42 | | | | | | 0.58 | | | | 0.75 | | | | 14 | |
| (a) | Per share Net Investment Income (Loss) is calculated using the average daily shares method. | |
| (b) | Total return is the combination of changes in NAV, reinvested dividend income at NAV and reinvested capital gains distributions at NAV, if any. Total returns are not annualized. | |
| (c) | After fee waiver and/or expense reimbursement from the Adviser, where applicable. | |
| (d) | Portfolio Turnover Rate is calculated based on the lesser of long-term purchases or sales (as disclosed in Note 5 – Investment Transactions) divided by the average long-term market value during the period. | |
| * | Rounds to less than 0.01%. | |
| ** | Rounds to less than 0.01 per share. | |
See accompanying notes to financial statements.
Notes to
Financial Statements
1. General Information and Significant Accounting Policies
General Information
Trust and Fund Information
Nuveen Investment Funds, Inc. (the “Trust”), is an open-end management investment company registered under the Investment Company Act of 1940, as amended. The Trust is comprised of Nuveen Equity Index Fund (“Equity Index”), Nuveen Mid Cap Index Fund (“Mid Cap Index”) and Nuveen Small Cap Index Fund (“Small Cap Index”) (each a “Fund” and collectively, the “Funds”), as diversified funds, among others. The Trust was incorporated in the state of Maryland on August 20, 1987.
The end of the reporting period for the Funds is October 31, 2015, and the period covered by these Notes to Financial Statements is the fiscal year ended October 31, 2015 (the ”current fiscal period”).
Investment Adviser
The Funds’ investment adviser is Nuveen Fund Advisors, LLC (the “Adviser”), a wholly-owned subsidiary of Nuveen Investments, Inc. (“Nuveen”). The Adviser is responsible for each Fund’s overall investment strategy and asset allocation decisions. The Adviser has entered into sub-advisory agreements with Nuveen Asset Management, LLC (the “Sub-Adviser”), a subsidiary of the Adviser, under which the Sub-Adviser manages the investment portfolios of the Funds.
Investment Objectives and Principal Investment Strategies
Equity Index’s investment objective is to provide investment results that correspond to the performance of the Standard & Poor’s 500® Index. Mid Cap Index’s investment objective is to provide investment results that correspond to the performance of the Standard & Poor’s MidCap 400® Index. Small Cap Index’s investment objective is to provide investment results that correspond to the performance of the Russell® 2000 Index.
Under normal market conditions, each Fund invests at least 90% of the sum of its net assets and the amount of any borrowings for investment purposes in common stocks included in its corresponding index. Each Fund also may invest in stock index futures contracts, options on stock indices and options on stock index futures (“derivatives”) on its corresponding index. Each Fund may make these investments to maintain the liquidity needed to meet redemption requests, to increase the level of Fund assets devoted to replicating the composition of its corresponding index and to reduce transaction costs.
The Funds’ most recent prospectus provides further descriptions of each Fund’s investment objective, principal investment strategies and principal risks.
Significant Accounting Policies
Each Fund is an investment company and follows accounting and reporting guidance under Financial Accounting Standards Board (FASB) Accounting Standards Codification (ASC) Topic 946 “Financial Services-Investment Companies.” The following is a summary of significant accounting policies followed by the Funds in the preparation of their financial statements in accordance with accounting principles generally accepted in the United States of America (“U.S. GAAP”).
Investment Transactions
Investment transactions are recorded on a trade date basis. Realized gains and losses from investment transactions are determined on the specific identification method, which is the same basis used for federal income tax purposes.
Investment Income
Dividend income is recorded on the ex-dividend date or, for foreign securities, when information is available. Interest income is recorded on an accrual basis. Securities lending income is comprised of fees earned from borrowers and income earned on cash collateral investments, net of lending agent fees.
Professional Fees
Professional fees presented on the Statement of Operations consist of legal fees incurred in the normal course of operations, audit fees, tax consulting fees and, in some cases, workout expenditures. Workout expenditures are incurred in an attempt to protect or enhance an investment or to pursue other claims or legal actions on behalf of Fund shareholders. If a refund is received for workout expenditures paid in a prior reporting period, such amounts will be recognized as “Legal fee refund” on the Statement of Operations.
Dividends and Distributions to Shareholders
Dividends from net investment income are declared and distributed to shareholders annually (except for Equity Index, which are declared and distributed to shareholders quarterly). Net realized capital gains from investment transactions, if any, are declared and distributed to shareholders at least annually. Furthermore, capital gains are distributed only to the extent they exceed available capital loss carryforwards.
Distributions to shareholders are recorded on the ex-dividend date. The amount and timing of distributions are determined in accordance with federal income tax regulations, which may differ from U.S. GAAP.
Share Classes and Sales Charges
The Funds only issue Class A Shares for purchase by certain retirement plans and by qualifying clients of investment advisers, financial planners or other financial intermediaries that charge periodic or asset-based fees for their services. Class A Shares are offered to those investors at their net asset value (“NAV”) per share with no up-front sales charge. Class A Shares incur a 0.25% annual 12b-1 service fee. Class C Shares are sold without an up-front sales charge but incur a 0.75% annual 12b-1 distribution fee and a 0.25% annual 12b-1 service fee. Class C Shares are subject to a CDSC of 1% if redeemed within twelve months of purchase. Class R3 Shares are sold without an up-front sales charge but incur a 0.25% annual 12b-1 distribution fee and a 0.25% annual 12b-1 service fee. Class I Shares are not subject to any sales charge or 12b-1 distribution or service fees.
Multiclass Operations and Allocations
Income and expenses of the Funds that are not directly attributable to a specific class of shares are prorated among the classes based on the relative net assets of each class. Expenses directly attributable to a class of shares are recorded to the specific class. Currently, the only expenses that are allocated on a class-specific basis are 12b-1 distribution and service fees.
Realized and unrealized capital gains and losses of the Funds are prorated among the classes based on the relative net assets of each class.
Indemnifications
Under the Trust’s organizational documents, its officers and directors are indemnified against certain liabilities arising out of the performance of their duties to the Trust. In addition, in the normal course of business, the Trust enters into contracts that provide general indemnifications to other parties. The Trust’s maximum exposure under these arrangements is unknown as this would involve future claims that may be made against the Trust that have not yet occurred. However, the Trust has not had prior claims or losses pursuant to these contracts and expects the risk of loss to be remote.
Netting Agreements
In the ordinary course of business, the Funds may enter into transactions subject to enforceable International Swaps and Derivative Association, Inc. (“ISDA”) master agreements or other similar arrangements (“netting agreements”). Generally, the right to offset in netting agreements allows each Fund to offset certain securities and derivatives with a specific counterparty as well as any collateral received or delivered to that counterparty based on the terms of the agreements. Generally, each Fund manages its cash collateral and securities collateral on a counterparty basis.
The Funds’ investments subject to netting agreements as of the end of the reporting period, if any, are further described in Note 3 – Portfolio Securities and Investments in Derivatives.
Use of Estimates
The preparation of financial statements in conformity with U.S. GAAP requires management to make estimates and assumptions that affect the reported amounts of assets and liabilities at the date of the financial statements and the reported amounts of increases and decreases in net assets from operations during the reporting period. Actual results may differ from those estimates.
2. Investment Valuation and Fair Value Measurements
The fair valuation input levels as described below are for fair value measurement purposes.
Fair value is defined as the price that would be received upon selling an investment or transferring a liability in an orderly transaction to an independent buyer in the principal or most advantageous market for the investment. A three-tier hierarchy is used to maximize the use of observable market data and minimize the use of unobservable inputs and to establish classification of fair value measurements for disclosure purposes. Observable inputs reflect the assumptions market participants would use in pricing the asset or liability. Observable inputs are based on market data obtained from sources independent of the reporting entity. Unobservable inputs reflect the reporting entity’s own assumptions about the assumptions market participants would use in pricing the asset or liability. Unobservable inputs are based on the best information available in the circumstances. The following is a summary of the three-tiered hierarchy of valuation input levels.
| | |
| Level 1 – | | Inputs are unadjusted and prices are determined using quoted prices in active markets for identical securities. |
| Level 2 – | | Prices are determined using other significant observable inputs (including quoted prices for similar securities, interest rates, prepayment speeds, credit risk, etc.). |
| Level 3 – | | Prices are determined using significant unobservable inputs (including management’s assumptions in determining the fair value of investments). |
Notes to Financial Statements (continued)
Common stocks and other equity-type securities are valued at the last sales price on the securities exchange on which such securities are primarily traded and are generally classified as Level 1. Securities primarily traded on the NASDAQ National Market (“NASDAQ”) are valued at the NASDAQ Official Closing Price and are generally classified as Level 1. However, securities traded on a securities exchange or NASDAQ for which there were no transactions on a given day or securities not listed on a securities exchange or NASDAQ are valued at the quoted bid price and are generally classified as Level 2. Prices of certain American Depositary Receipts (“ADR”) held by the Funds that trade in the United States are valued based on the last traded price, official closing price, or the most recent bid price of the underlying non-U.S.-traded stock, adjusted as appropriate for the underlying-to-ADR conversion ratio and foreign exchange rate, and from time-to-time may also be adjusted further to take into account material events that may take place after the close of the local non-U.S. market but before the close of the New York Stock Exchange, which may represent a transfer from a Level 1 to a Level 2 security.
Exchange traded funds are valued at the last sales price on the securities exchange on which such securities are primarily traded and are generally classified as Level 1.
Investments in investment companies are valued at their respective NAVs on the valuation date and are generally classified as Level 1.
Prices of fixed-income securities are provided by a pricing service approved by the Funds’ Board of Directors (the ”Board”). The pricing service establishes a security’s fair value using methods that may include consideration of the following: yields or prices of investments of comparable quality, type of issue, coupon, maturity and rating, market quotes or indications of value from security dealers, evaluations of anticipated cash flows or collateral, general market conditions and other information and analysis, including the obligor’s credit characteristics considered relevant. These securities are generally classified as Level 2. In pricing certain securities, particularly less liquid and lower quality securities, the pricing service may consider information about a security, its issuer or market activity provided by the Adviser. These securities are generally classified as Level 2 or Level 3 depending on the priority of the significant inputs.
Futures contracts are valued using the closing settlement price or, in the absence of such a price, the last traded price and are generally classified as Level 1.
Certain securities may not be able to be priced by the pre-established pricing methods as described above. Such securities may be valued by the Board and/or its appointee at fair value. These securities generally include, but are not limited to, restricted securities (securities which may not be publicly sold without registration under the Securities Act of 1933, as amended) for which a pricing service is unable to provide a market price; securities whose trading has been formally suspended; debt securities that have gone into default and for which there is no current market quotation; a security whose market price is not available from a pre-established pricing source; a security with respect to which an event has occurred that is likely to materially affect the value of the security after the market has closed but before the calculation of a Fund’s NAV (as may be the case in non-U.S. markets on which the security is primarily traded) or make it difficult or impossible to obtain a reliable market quotation; and a security whose price, as provided by the pricing service, is not deemed to reflect the security’s fair value. As a general principle, the fair value of a security would appear to be the amount that the owner might reasonably expect to receive for it in a current sale. A variety of factors may be considered in determining the fair value of such securities, which may include consideration of the following: yields or prices of investments of comparable quality, type of issue, coupon, maturity and rating, market quotes or indications of value from security dealers, evaluations of anticipated cash flows or collateral, general market conditions and other information and analysis, including the obligor’s credit characteristics considered relevant. These securities are generally classified as Level 2 or Level 3 depending on the priority of the significant inputs. Regardless of the method employed to value a particular security, all valuations are subject to review by the Board and/or its appointee.
The inputs or methodologies used for valuing securities are not an indication of the risks associated with investing in those securities. The following is a summary of each Fund’s fair value measurements as of the end of the reporting period:
| | | | | | | | | | | | | | | | |
| Equity Index | | Level 1 | | | Level 2 | | | Level 3 | | | Total | |
| Long-Term Investments: | | | | | | | | | | | | | | | | |
Common Stocks* | | $ | 774,600,168 | | | $ | — | | | $ | — | | | $ | 774,600,168 | |
Common Stock Rights | | | — | | | | — | | | | 1,812 | *** | | | 1,812 | |
| Investments Purchased with Collateral from Securities Lending | | | 181,894,352 | | | | — | | | | — | | | | 181,894,352 | |
| Short-Term Investments: | | | | | | | | | | | | | | | | |
Money Market Funds | | | 8,170,670 | | | | — | | | | — | | | | 8,170,670 | |
U.S. Government and Agency Obligations | | | — | | | | 2,999,991 | | | | — | | | | 2,999,991 | |
| Investments in Derivatives: | | | | | | | | | | | | | | | | |
Futures Contracts** | | | 641,465 | | | | — | | | | — | | | | 641,465 | |
| Total | | $ | 965,306,655 | | | $ | 2,999,991 | | | $ | 1,812 | | | $ | 968,308,458 | |
| | | | | | | | | | | | | | | | |
| Mid Cap Index | | Level 1 | | | Level 2 | | | Level 3 | | | Total | |
| Long-Term Investments: | | | | | | | | | | | | | | | | |
Common Stocks* | | $ | 612,972,145 | | | $ | — | | | $ | — | | | $ | 612,972,145 | |
Common Stock Rights | | | 956 | | | | — | | | | — | | | | 956 | |
| Investments Purchased with Collateral from Securities Lending | | | 185,712,712 | | | | — | | | | — | | | | 185,712,712 | |
| Short-Term Investments: | | | | | | | | | | | | | | | | |
Money Market Funds | | | 32,646,053 | | | | — | | | | — | | | | 32,646,053 | |
U.S. Government & Agency Obligations | | | — | | | | 2,999,991 | | | | — | | | | 2,999,991 | |
| Investments in Derivatives: | | | | | | | | | | | | | | | | |
Futures Contracts** | | | 804,044 | | | | — | | | | — | | | | 804,044 | |
| Total | | $ | 832,135,910 | | | $ | 2,999,991 | | | $ | — | | | $ | 835,135,901 | |
| | | | |
| Small Cap Index | | | | | | | | | | | | |
| Long-Term Investments: | | | | | | | | | | | | | | | | |
Common Stocks* | | $ | 127,915,253 | | | $ | — | | | $ | 426 | *** | | $ | 127,915,679 | |
Exchange-Traded Funds | | | 18,437 | | | | — | | | | — | | | | 18,437 | |
Common Stock Rights | | | — | | | | — | | | | 18,137 | *** | | | 18,137 | |
Warrants | | | — | | | | 18 | | | | 21 | *** | | | 39 | |
| Investments Purchased with Collateral from Securities Lending | | | 41,498,024 | | | | — | | | | — | | | | 41,498,024 | |
| Short-Term Investments: | | | | | | | | | | | | | | | | |
Money Market Funds | | | 4,747,542 | | | | — | | | | — | | | | 4,747,542 | |
U.S. Government & Agency Obligations | | | — | | | | 274,999 | | | | — | | | | 274,999 | |
| Investments in Derivatives: | | | | | | | | | | | | | | | | |
Futures Contracts** | | | 34,645 | | | | — | | | | — | | | | 34,645 | |
| Total | | $ | 174,213,901 | | | $ | 275,017 | | | $ | 18,584 | | | $ | 174,507,502 | |
| * | Refer to the Fund’s Portfolio of Investments for industry classifications. |
| ** | Represents net unrealized appreciation (depreciation) as reported in the Fund’s Portfolio of Investments. |
| *** | Refer to the Fund’s Portfolio of Investments for securities classified as Level 3. |
The Board is responsible for the valuation process and has appointed the oversight of the daily valuation process to the Adviser’s Valuation Committee. The Valuation Committee, pursuant to the valuation policies and procedures adopted by the Board is responsible for making fair value determinations, evaluating the effectiveness of the Funds’ pricing policies and reporting to the Board. The Valuation Committee is aided in its efforts by the Adviser’s dedicated Securities Valuation Team, which is responsible for administering the daily valuation process and applying fair value methodologies as approved by the Valuation Committee. When determining the reliability of independent pricing services for investments owned by the Funds, the Valuation Committee, among other things, conducts due diligence reviews of the pricing services and monitors the quality of security prices received through various testing reports conducted by the Securities Valuation Team.
The Valuation Committee will consider pricing methodologies it deems relevant and appropriate when making a fair value determination, based on the facts and circumstances specific to the portfolio instrument. Fair value determinations generally will be derived as follows, using public or private market information:
| | (i) | If available, fair value determinations shall be derived by extrapolating from recent transactions or quoted prices for identical or comparable securities. |
| | (ii) | If such information is not available, an analytical valuation methodology may be used based on other available information including, but not limited to: analyst appraisals, research reports, corporate action information, issuer financial statements and shelf registration statements. Such analytical valuation methodologies may include, but are not limited to: multiple of earnings, discount from market value of a similar freely- traded security, discounted cash flow analysis, book value or a multiple thereof, risk premium/yield analysis, yield to maturity and/or fundamental investment analysis. |
The purchase price of a portfolio instrument will be used to fair value the instrument only if no other valuation methodology is available or deemed appropriate, and it is determined that the purchase price fairly reflects the instrument’s current value.
For each portfolio security that has been fair valued pursuant to the policies adopted by the Board, the fair value price is compared against the last available and next available market quotations. The Valuation Committee reviews the results of such testing and fair valuation occurrences are reported to the Board.
Notes to Financial Statements (continued)
3. Portfolio Securities and Investments in Derivatives
Portfolio Securities
Securities Lending
In order to generate additional income, each Fund may lend securities representing up to one-third of the value of its total assets (which includes collateral for securities on loan) to broker-dealers, banks or other institutions. When loaning securities, each Fund retains the benefits of owning the securities, including the economic equivalent of dividends or interest generated by the security. Each Fund also has the ability to recall the securities on loan at any time.
Each Fund’s policy is to receive, at the inception of a loan, cash collateral equal to at least 102% of the value of securities loaned, which is recognized as “Payable for collateral from securities lending program” on the Statement of Assets and Liabilities. Collateral for securities on loan is invested in a money market fund, which is recognized as “Investments purchased with collateral from securities lending, at value” on the Statement of Assets and Liabilities. The market value of the securities loaned is determined at the close of each business day in order to determine the adequacy of the collateral. If the value of the securities on loan increases such that the level of collateralization falls below 100%, additional collateral is received from the borrower on the next business day, which is recognized as “Due from broker” on the Statement of Assets and Liabilities.
Securities out on loan are subject to termination at any time at the option of the borrower or the Fund. Upon termination, the borrower is required to return to the Fund securities identical to the securities loaned. Generally, in the event the borrower defaults on its obligation to return the loaned securities, the Fund has the right to use the collateral to acquire identical securities. In the event the Fund is delayed or prevented from exercising its right to dispose of the collateral, there may be a loss to the Fund. Under each Fund’s securities lending agreement, however, the securities lending agent has indemnified the Fund against losses resulting from borrower default, except to the extent that those losses result from a decrease in the value of the collateral due to its investment by the Fund. The Fund bears the risk of loss with respect to the investment of collateral.
The Fund’s custodian, U.S. Bank National Association, serves as its securities lending agent. Each Fund pays the custodian a fee based on its proportional share of the custodian’s expense of operating its securities lending program. Income earned from the securities lending program is paid to the Fund, net of any fees paid. Income from securities lending, net of fees paid, is recognized as “Securities lending income, net” on the Statement of Operations.
The following table presents the securities out on loan for the Funds, and the collateral delivered related to those securities, as of the end of the reporting period.
| | | | | | | | | | | | | | |
| Fund | | Asset Class out on Loan | | Long-Term
Investments, at Value | | | Collateral
Pledged (From)
Counterparty* | | | Net
Exposure | |
| Equity Index | | Common Stocks | | $ | 176,089,018 | | | $ | (176,089,018 | ) | | $ | — | |
| Mid Cap Index | | Common Stocks | | | 179,056,613 | | | | (179,056,613 | ) | | | — | |
| Small Cap Index | | Common Stocks | | | 39,502,828 | | | | (39,502,828 | ) | | | — | |
| * | As of the end of the reporting period, the value of the collateral pledged from the counterparty exceeded the value of the securities out on loan. Refer to the Fund’s Portfolio of Investments for details on the securities out on loan. |
Securities lending fees paid by each Fund during the current fiscal period were as follows:
| | | | | | | | | | | | |
| | | Equity
Index | | | Mid Cap
Index | | | Small Cap
Index | |
| Securities lending fees paid | | $ | 12,865 | | | $ | 74,260 | | | $ | 68,551 | |
Investments in Derivatives
Each Fund is authorized to invest in certain derivative instruments. The Funds record derivative instruments at fair value, with changes in fair value recognized on the Statement of Operations, when applicable. Even though the Funds’ investments in derivatives may represent economic hedges, they are not considered to be hedge transactions for financial reporting purposes.
Futures Contracts
Upon execution of a futures contract, a Fund is obligated to deposit cash or eligible securities, also known as “initial margin,” into an account at its clearing broker equal to a specified percentage of the contract amount. Cash held by the broker to cover initial margin requirements on open futures contracts, if any, is recognized as “Cash collateral at brokers” on the Statement of Assets and Liabilities. Investments in futures contracts obligate a Fund and the clearing broker to settle monies on a daily basis representing changes in the prior days “mark-to-market” of the open contracts. If a Fund has unrealized appreciation the clearing broker would credit the Fund’s account with an amount equal to appreciation and conversely if a Fund has unrealized depreciation the clearing broker would debit the Fund’s account with an amount equal to depreciation. These daily cash settlements are also known as “variation margin.” Variation margin is recognized as a receivable and/or payable for “Variation margin on futures contracts” on the Statement of Assets and Liabilities.
During the period the futures contract is open, changes in the value of the contract are recognized as an unrealized gain or loss by “marking-to-market” on a daily basis to reflect the changes in market value of the contract, which is recognized as a component of “Change in net unrealized appreciation (depreciation) of futures contracts” on the Statement of Operations. When the contract is closed or expired, the Fund records a realized gain or loss equal to the difference between the value of the contract on the closing date and value of the contract when originally entered into, which is recognized as a component of “Net realized gain (loss) from futures contracts” on the Statement of Operations.
Risks of investments in futures contracts include the possible adverse movement in the price of the securities or indices underlying the contracts, the possibility that there may not be a liquid secondary market for the contracts and/or that a change in the value of the contract may not correlate with a change in the value of the underlying securities or indices.
During the current fiscal period, each Fund continued to invest in index futures contracts to convert cash into the equivalent of its corresponding index holding in order to manage cash flow activity and minimize tracking error to the Fund’s benchmark index. These futures contracts are used as a means to efficiently gain exposure to a broad base of equity securities. The Funds’ holdings of futures, which were matched to the level of cash, were helpful in keeping the Funds fully invested, neither overexposed nor underexposed to equities, despite cash flows.
The average notional amount of futures contracts outstanding during the current fiscal period was as follows:
| | | | | | | | | | | | |
| | | Equity
Index | | | Mid Cap
Index | | | Small Cap
Index | |
| Average notional amount of futures contracts outstanding* | | $ | 25,697,285 | | | $ | 35,777,900 | | | $ | 4,692,606 | |
| * | The average notional amount is calculated based on the absolute aggregate notional of contracts outstanding at the beginning of the fiscal period and at the end of each fiscal quarter within the current fiscal period. |
The following table presents the fair value of all futures contracts held by the Funds as of the end of the reporting period, the location of these instruments on the Statement of Assets and Liabilities and the primary underlying risk exposure.
| | | | | | | | | | | | | | |
| | | | | Location on the Statement of Assets and Liabilities | |
| | | | | Asset Derivatives | | | (Liability) Derivatives | |
Underlying Risk Exposure | | Derivative
Instrument | | Location | | Value | | | Location | | Value | |
Equity Index | | | | | | | | | | | | | | |
| | | | | |
Equity | | Futures contracts | | — | | $ | — | | | Payable for variation margin on futures contracts* | | $ | 641,465 | |
Mid Cap Index | | | | | | | | | | | | | | |
| | | | | |
Equity | | Futures contracts | | Receivable for variation margin on futures contracts* | | $ | 804,044 | | | — | | $ | — | |
Small Cap Index | | | | | | | | | | | | | | |
| | | | | |
Equity | | Futures contracts | | — | | $ | — | | | Payable for variation margin on futures contracts* | | $ | 34,645 | |
| * | Value represents unrealized appreciation (depreciation) of futures contracts as reported in the Fund’s Portfolio of Investments and not the asset and/or liability derivative location as described in the table above. |
The following table presents the amount of net realized gain (loss) and change in net unrealized appreciation (depreciation) recognized on futures contracts on the Statement of Operations during the current fiscal period, and the primary underlying risk exposure.
| | | | | | | | | | | | |
| Fund | | Underlying
Risk Exposure | | Derivative
Instrument | | Net Realized
Gain (Loss) from
Futures Contracts | | | Change in Net Unrealized
Appreciation (Depreciation) of
Futures Contracts | |
| Equity Index | | Equity | | Futures contracts | | $ | (773,985 | ) | | $ | 372,931 | |
| Mid Cap Index | | Equity | | Futures contracts | | | (2,125,431 | ) | | | 890,732 | |
| Small Cap Index | | Equity | | Futures contracts | | | (133,511 | ) | | | (63,340 | ) |
Market and Counterparty Credit Risk
In the normal course of business each Fund may invest in financial instruments and enter into financial transactions where risk of potential loss exists due to changes in the market (market risk) or failure of the other party to the transaction to perform (counterparty credit risk). The potential loss could exceed the value of the financial assets recorded on the financial statements. Financial assets, which potentially expose each Fund to counterparty credit risk, consist principally of cash due from counterparties on forward, option and swap transactions, when applicable. The extent of each Fund’s exposure to counterparty credit risk in respect to these financial assets approximates their carrying value as recorded on the Statement of Assets and Liabilities.
Each Fund helps manage counterparty credit risk by entering into agreements only with counterparties the Adviser believes have the financial resources to honor their obligations and by having the Adviser monitor the financial stability of the counterparties. Additionally, counterparties may be
Notes to Financial Statements (continued)
required to pledge collateral daily (based on the daily valuation of the financial asset) on behalf of each Fund with a value approximately equal to the amount of any unrealized gain above a pre-determined threshold. Reciprocally, when each Fund has an unrealized loss, the Funds have instructed the custodian to pledge assets of the Funds as collateral with a value approximately equal to the amount of the unrealized loss above a pre-determined threshold. Collateral pledges are monitored and subsequently adjusted if and when the valuations fluctuate, either up or down, by at least the pre-determined threshold amount.
4. Fund Shares
Transactions in Fund shares during the current and prior fiscal period were as follows:
| | | | | | | | | | | | | | | | |
| | | Year Ended
10/31/15 | | | Year Ended
10/31/14 | |
| Equity Index | | Shares | | | Amount | | | Shares | | | Amount | |
| Shares sold: | | | | | | | | | | | | | | | | |
Class A | | | 1,212,174 | | | $ | 34,121,252 | | | | 1,307,037 | | | $ | 35,388,787 | |
Class A – automatic conversion of Class B shares | | | — | | | | — | | | | 55,084 | | | | 1,538,960 | |
Class B – exchanges | | | — | | | | — | | | | 125 | | | | 3,123 | |
Class C | | | 193,873 | | | | 5,395,103 | | | | 92,098 | | | | 2,466,862 | |
Class R3 | | | 1,908,120 | | | | 53,887,095 | | | | 1,026,703 | | | | 28,097,173 | |
Class I | | | 1,887,351 | | | | 53,296,331 | | | | 1,965,076 | | | | 53,421,719 | |
| Shares issued to shareholders due to reinvestment of distributions: | | | | | | | | | | | | | | | | |
Class A | | | 434,119 | | | | 11,853,413 | | | | 627,808 | | | | 16,153,656 | |
Class B | | | — | | | | — | | | | 5,659 | | | | 141,239 | |
Class C | | | 24,084 | | | | 647,854 | | | | 29,948 | | | | 757,197 | |
Class R3 | | | 188,810 | | | | 5,152,266 | | | | 210,416 | | | | 5,575,149 | |
Class I | | | 931,976 | | | | 25,451,740 | | | | 1,395,678 | | | | 35,917,622 | |
| | | | 6,780,507 | | | | 189,805,054 | | | | 6,715,632 | | | | 179,461,487 | |
| Shares redeemed: | | | | | | | | | | | | | | | | |
Class A | | | (1,915,955 | ) | | | (53,987,783 | ) | | | (1,703,667 | ) | | | (46,501,590 | ) |
Class B | | | — | | | | — | | | | (26,286 | ) | | | (690,636 | ) |
Class B – automatic conversion to Class A shares | | | — | | | | — | | | | (56,225 | ) | �� | | (1,538,960 | ) |
Class C | | | (77,013 | ) | | | (2,121,030 | ) | | | (57,675 | ) | | | (1,551,116 | ) |
Class R3 | | | (1,097,819 | ) | | | (30,921,236 | ) | | | (694,183 | ) | | | (18,988,069 | ) |
Class I | | | (4,674,020 | ) | | | (131,290,631 | ) | | | (4,606,481 | ) | | | (125,451,027 | ) |
| | | | (7,764,807 | ) | | | (218,320,680 | ) | | | (7,144,517 | ) | | | (194,721,398 | ) |
| Net increase (decrease) | | | (984,300 | ) | | $ | (28,515,626 | ) | | | (428,885 | ) | | $ | (15,259,911 | ) |
| | |
| | | Year Ended
10/31/15 | | | Year Ended
10/31/14 | |
| Mid Cap Index | | Shares | | | Amount | | | Shares | | | Amount | |
Shares sold: | | | | | | | | | | | | | | | | |
Class A | | | 3,139,586 | | | $ | 57,778,779 | | | | 3,510,580 | | | $ | 62,371,495 | |
Class C | | | 406,773 | | | | 7,204,779 | | | | 248,580 | | | | 4,274,540 | |
Class R3 | | | 2,148,382 | | | | 39,123,107 | | | | 2,833,347 | | | | 49,841,942 | |
Class I | | | 1,991,692 | | | | 36,910,290 | | | | 2,382,696 | | | | 42,733,710 | |
Shares issued to shareholders due to reinvestment of distributions: | | | | | | | | | | | | | | | | |
Class A | | | 648,368 | | | | 11,355,683 | | | | 479,770 | | | | 8,140,858 | |
Class C | | | 40,092 | | | | 669,243 | | | | 24,377 | | | | 395,884 | |
Class R3 | | | 692,188 | | | | 11,929,814 | | | | 471,325 | | | | 7,877,667 | |
Class I | | | 524,713 | | | | 9,237,147 | | | | 419,344 | | | | 7,144,368 | |
| | | | 9,591,794 | | | | 174,208,842 | | | | 10,370,019 | | | | 182,780,464 | |
Shares redeemed: | | | | | | | | | | | | | | | | |
Class A | | | (3,456,224 | ) | | | (63,497,156 | ) | | | (3,259,127 | ) | | | (58,375,215 | ) |
Class C | | | (118,923 | ) | | | (2,097,267 | ) | | | (147,324 | ) | | | (2,507,924 | ) |
Class R3 | | | (2,723,885 | ) | | | (49,197,900 | ) | | | (2,015,515 | ) | | | (35,598,193 | ) |
Class I | | | (3,071,661 | ) | | | (56,804,572 | ) | | | (3,912,305 | ) | | | (70,436,101 | ) |
| | | | (9,370,693 | ) | | | (171,596,895 | ) | | | (9,334,271 | ) | | | (166,917,433 | ) |
Net increase (decrease) | | | 221,101 | | | $ | 2,611,947 | | | | 1,035,748 | | | $ | 15,863,031 | |
| | | | | | | | | | | | | | | | |
| | | Year Ended
10/31/15 | | | Year Ended
10/31/14 | |
| Small Cap Index | | Shares | | | Amount | | | Shares | | | Amount | |
| Shares sold: | | | | | | | | | | | | | | | | |
Class A | | | 996,304 | | | $ | 14,851,836 | | | | 1,009,419 | | | $ | 15,016,701 | |
Class C | | | 82,412 | | | | 1,146,424 | | | | 51,078 | | | | 723,706 | |
Class R3 | | | 850,411 | | | | 12,243,536 | | | | 1,014,591 | | | | 14,675,770 | |
Class I | | | 661,394 | | | | 9,818,263 | | | | 777,476 | | | | 11,508,364 | |
| Shares issued to shareholders due to reinvestment of distributions: | | | | | | | | | | | | | | | | |
Class A | | | 179,793 | | | | 2,527,081 | | | | 171,196 | | | | 2,468,225 | |
Class C | | | 9,884 | | | | 130,829 | | | | 8,480 | | | | 115,665 | |
Class R3 | | | 218,581 | | | | 2,980,871 | | | | 175,256 | | | | 2,454,748 | |
Class I | | | 161,444 | | | | 2,281,268 | | | | 136,460 | | | | 1,975,455 | |
| | | | 3,160,223 | | | | 45,980,108 | | | | 3,343,956 | | | | 48,938,634 | |
| Shares redeemed: | | | | | | | | | | | | | | | | |
Class A | | | (934,579 | ) | | | (13,847,561 | ) | | | (1,171,987 | ) | | | (17,420,852 | ) |
Class C | | | (25,630 | ) | | | (356,749 | ) | | | (36,931 | ) | | | (520,340 | ) |
Class R3 | | | (1,079,100 | ) | | | (15,525,187 | ) | | | (736,541 | ) | | | (10,624,111 | ) |
Class I | | | (1,003,280 | ) | | | (14,885,580 | ) | | | (1,046,432 | ) | | | (15,735,405 | ) |
| | | | (3,042,589 | ) | | | (44,615,077 | ) | | | (2,991,891 | ) | | | (44,300,708 | ) |
| Net increase (decrease) | | | 117,634 | | | $ | 1,365,031 | | | | 352,065 | | | $ | 4,637,926 | |
5. Investment Transactions
Long-term purchases and sales (excluding investments purchased with collateral from securities lending and derivative transactions) during the current fiscal period were as follows:
| | | | | | | | | | | | |
| | | Equity
Index | | | Mid Cap
Index | | | Small Cap
Index | |
| Purchases | | $ | 14,031,245 | | | $ | 78,244,461 | | | $ | 18,880,523 | |
| Sales | | | 70,158,905 | | | | 74,363,268 | | | | 22,133,950 | |
6. Income Tax Information
Each Fund is a separate taxpayer for federal income tax purposes. Each Fund intends to distribute substantially all of its net investment income and net capital gains to shareholders and to otherwise comply with the requirements of Subchapter M of the Internal Revenue Code applicable to regulated investment companies. Therefore, no federal income tax provision is required.
For all open tax years and all major taxing jurisdictions, management of the Funds has concluded that there are no significant uncertain tax positions that would require recognition in the financial statements. Open tax years are those that are open for examination by taxing authorities (i.e., generally the last four tax year ends and the interim tax period since then). Furthermore, management of the Funds is also not aware of any tax positions for which it is reasonably possible that the total amounts of unrecognized tax benefits will significantly change in the next twelve months.
The following information is presented on an income tax basis. Differences between amounts for financial statement and federal income tax purposes are primarily due to timing differences in recognizing certain gains and losses on investment transactions. To the extent that differences arise that are permanent in nature, such amounts are reclassified within the capital accounts as detailed below. Temporary differences do not require reclassification. Temporary and permanent differences do not impact the NAVs of the Funds.
As of October 31, 2015, the cost and unrealized appreciation (depreciation) of investments (excluding investments in derivatives), as determined on a federal income tax basis, were as follows:
| | | | | | | | | | | | |
| | | Equity
Index | | | Mid Cap
Index | | | Small Cap
Index | |
| Cost of investments | | $ | 492,305,496 | | | $ | 678,715,213 | | | $ | 143,984,992 | |
| Gross unrealized: | | | | | | | | | | | | |
Appreciation | | $ | 496,468,923 | | | $ | 190,165,594 | | | $ | 44,467,079 | |
Depreciation | | | (21,107,426 | ) | | | (34,548,950 | ) | | | (13,979,214 | ) |
| Net unrealized appreciation (depreciation) of investments | | $ | 475,361,497 | | | $ | 155,616,644 | | | $ | 30,487,865 | |
Notes to Financial Statements (continued)
Permanent differences, primarily due to distribution reallocations, federal taxes paid, foreign currency transactions, investments in passive foreign investment companies, real estate investment trust adjustments and tax equalization resulted in reclassifications among the Funds’ components of net assets as of October 31, 2015, the Funds’ tax year end, as follows:
| | | | | | | | | | | | |
| | | Equity
Index | | | Mid Cap
Index | | | Small Cap
Index | |
| Capital paid-in | | $ | 6,612,859 | | | $ | 5,220,441 | | | $ | 613,449 | |
| Undistributed (Over-distribution of) net investment income | | | 80,385 | | | | 180,085 | | | | 55,685 | |
| Accumulated net realized gain (loss) | | | (6,693,244 | ) | | | (5,400,526 | ) | | | (669,134 | ) |
The tax components of undistributed net ordinary income and net long-term capital gains as of October 31, 2015, the Funds’ tax year end, were as follows:
| | | | | | | | | | | | |
| | | Equity
Index | | | Mid Cap
Index | | | Small Cap
Index | |
| Undistributed net ordinary income1 | | $ | 2,757,697 | | | $ | 4,292,554 | | | $ | 967,357 | |
| Undistributed net long-term capital gains | | | 43,400,773 | | | | 40,680,583 | | | | 4,996,967 | |
| 1 | Net ordinary income consists of net taxable income derived from dividends, interest and short-term capital gains, if any. |
The tax character of distributions paid during the Funds’ tax years ended October 31, 2015 and October 31, 2014, was designated for purposes of the dividends paid deduction as follows:
| | | | | | | | | | | | |
| 2015 | | Equity
Index | | | Mid Cap
Index | | | Small Cap
Index | |
| Distributions from net ordinary income1 | | $ | 13,683,153 | | | $ | 9,058,762 | | | $ | 2,215,354 | |
| Distributions from net long-term capital gains | | | 36,856,970 | | | | 27,333,865 | | | | 6,415,074 | |
| | | |
| 2014 | | Equity
Index | | | Mid Cap
Index | | | Small Cap
Index | |
| Distributions from net ordinary income1 | | $ | 14,752,139 | | | $ | 8,392,245 | | | $ | 2,374,684 | |
| Distributions from net long-term capital gains | | | 55,390,566 | | | | 18,308,173 | | | | 5,688,528 | |
| 1 | Net ordinary income consists of net taxable income derived from dividends, interest and net short-term capital gains, if any. |
As of October 31, 2015, the Funds’ tax year end, the Funds did not have any unused capital loss carryforwards available for federal income tax purposes to be applied against future capital gains, if any.
7. Management Fees and Other Transactions with Affiliates
Each Fund’s management fee compensates the Adviser for overall investment advisory and administrative services and general office facilities. The Sub-Adviser is compensated for its services to the Funds from the management fees paid to the Adviser.
Each Fund’s management fee consists of two components – a fund-level fee, based only on the amount of assets within each individual Fund, and a complex-level fee, based on the aggregate amount of all eligible fund assets managed by the Adviser. This pricing structure enables each Fund’s shareholders to benefit from growth in the assets within their respective Fund as well as from growth in the amount of complex-wide assets managed by the Adviser.
The annual Fund-level fee, payable monthly, for each Fund is calculated according to the following schedule:
| | | | | | | | | | | | |
| Average Daily Net Assets | | Equity
Index | | | Mid Cap
Index | | | Small Cap
Index | |
| For the first $125 million | | | 0.1000 | % | | | 0.1500 | % | | | 0.1500 | % |
| For the next $125 million | | | 0.0875 | | | | 0.1375 | | | | 0.1375 | |
| For the next $250 million | | | 0.0750 | | | | 0.1250 | | | | 0.1250 | |
| For the next $500 million | | | 0.0625 | | | | 0.1125 | | | | 0.1125 | |
| For the next $1 billion | | | 0.0500 | | | | 0.1000 | | | | 0.1000 | |
| For net assets over $2 billion | | | 0.0250 | | | | 0.0750 | | | | 0.0750 | |
The annual complex-level fee, payable monthly, for each Fund is determined by taking the complex-level fee rate, which is based on the aggregate amount of “eligible assets” of all Nuveen funds as set forth in the schedule below, and making, as appropriate, an upward adjustment to that rate based upon the percentage of the particular fund’s assets that are not “eligible assets.” The complex level fee schedule for each Fund is as follows:
| | | | |
| Complex-Level Asset Breakpoint Level* | | Effective Rate at Breakpoint Level | |
| $55 billion | | | 0.2000 | % |
| $56 billion | | | 0.1996 | |
| $57 billion | | | 0.1989 | |
| $60 billion | | | 0.1961 | |
| $63 billion | | | 0.1931 | |
| $66 billion | | | 0.1900 | |
| $71 billion | | | 0.1851 | |
| $76 billion | | | 0.1806 | |
| $80 billion | | | 0.1773 | |
| $91 billion | | | 0.1691 | |
| $125 billion | | | 0.1599 | |
| $200 billion | | | 0.1505 | |
| $250 billion | | | 0.1469 | |
| $300 billion | | | 0.1445 | |
| * | The complex-level fee is calculated based upon the aggregate daily “eligible assets” of all Nuveen funds. Eligible assets do not include assets attributable to investments in other Nuveen funds or assets in excess of $2 billion added to the Nuveen fund complex in connection with the Adviser’s assumption of the management of the former First American Funds effective January 1, 2011. Eligible assets include closed-end fund assets managed by the Adviser that are attributable to certain types of leverage. For these purposes, leverage includes the closed-end funds’ use of preferred stock and borrowings and certain investments in the residual interest certificates (also called inverse floating rate securities) in tender option bond (TOB) trusts, including the portion of assets held by the TOB trust that has been effectively financed by the trust’s issuance of floating rate securities, subject to an agreement by the Adviser as to certain funds to limit the amount of such assets for determining eligible assets in certain circumstances. As of October 31, 2015, the complex-level fee for each Fund was as follows: |
| | | | |
| Fund | | Complex-Level Fee | |
| Equity Index | | | 0.2000 | % |
| Mid Cap Index | | | 0.1770 | |
| Small Cap Index | | | 0.1814 | |
The Adviser has agreed to waive fees and/or reimburse expenses (“Expense Cap”) of each Fund so that total annual Fund operating expenses, (excluding 12b-1 distribution and/or service fees, interest expenses, taxes, acquired fund fees and expenses, fees incurred in acquiring and disposing of portfolio securities and extraordinary expenses) do not exceed the percentages of the average daily net assets of any class of Fund shares in the amounts and for the time period stated in the following table:
| | | | |
| Fund | | Expense Cap | | Expense Cap
Expiration Date |
| Equity Index | | 0.37% | | September 30, 2016 |
| Mid Cap Index | | 0.50% | | September 30, 2016 |
| Small Cap Index | �� | 0.58% | | September 30, 2016 |
The Trust pays no compensation directly to those of its directors who are affiliated with the Adviser or to its officers, all of whom receive remuneration for their services to the Trust from the Adviser or its affiliates. The Board has adopted a deferred compensation plan for independent directors that enables directors to elect to defer receipt of all or a portion of the annual compensation they are entitled to receive from certain Nuveen-advised funds. Under the plan, deferred amounts are treated as though equal dollar amounts had been invested in shares of select Nuveen-advised funds.
Class A Shares are offered at their NAV per share with no up-front sales charge. During the current fiscal period, Nuveen Securities, LLC (the “Distributor”), a wholly owned subsidiary of Nuveen, received 12b-1 service fees in Class A Shares, substantially all of which were paid to compensate financial intermediaries for providing services to shareholders relating to their investments.
During the current fiscal period, the Distributor compensated financial intermediaries directly with commission advances at the time of purchase as follows:
| | | | | | | | | | | | |
| | | Equity
Index | | | Mid Cap
Index | | | Small Cap
Index | |
| Commission advances (Unaudited) | | $ | 42,278 | | | $ | 56,636 | | | $ | 8,747 | |
To compensate for commissions advanced to financial intermediaries, all 12b-1 service and distribution fees collected on Class C Shares during the first year following a purchase are retained by the Distributor. During the current fiscal period, the Distributor retained such 12b-1 fees as follows:
| | | | | | | | | | | | |
| | | Equity
Index | | | Mid Cap
Index | | | Small Cap
Index | |
| 12b-1 fees retained (Unaudited) | | $ | 35,922 | | | $ | 43,705 | | | $ | 5,946 | |
Notes to Financial Statements (continued)
The remaining 12b-1 fees charged to the Funds were paid to compensate financial intermediaries for providing services to shareholders relating to their investments.
The Distributor also collected and retained CDSC on share redemptions during the current fiscal period as follows:
| | | | | | | | | | | | |
| | | Equity
Index | | | Mid Cap
Index | | | Small Cap
Index | |
| CDSC retained (Unaudited) | | $ | 1,721 | | | $ | 2,256 | | | $ | 2,997 | |
8. Borrowing Arrangements
The Funds, along with certain other funds managed by the Adviser (“Participating Funds”), established a 364-day, $2.53 billion standby credit facility with a group of lenders, under which the Participating Funds may borrow for various purposes other than leveraging for investment purposes. A large portion of this facility’s capacity (and its associated costs as described below) is currently dedicated for use by a small number of Participating Funds, which does not include any of the Funds covered by this shareholder report. The remaining capacity under the facility (and the corresponding portion of the facility’s annual costs) is separately dedicated to most of the other open-end funds in the Nuveen fund family, including all of the Funds covered by this shareholder report, along with a number of Nuveen closed-end funds. The credit facility expires in July 2016 unless extended or renewed.
The credit facility has the following terms: a fee of 0.15% per annum on unused commitment amounts, and interest at a rate equal to the higher of (a) one-month LIBOR (London Inter-Bank Offered Rate) plus 1.25% per annum or (b) the Fed Funds rate plus 1.25% per annum on amounts borrowed. Participating Funds paid administration, legal and arrangement fees, which are recognized as a component of “Other expenses” on the Statement of Operations, and along with commitment fees, have been allocated among such Participating Funds based upon the relative proportions of the facility’s aggregate capacity reserved for them and other factors deemed relevant by the Adviser and the Board of each Participating Fund.
During the current fiscal period, none of the Funds utilized this facility.
9. Subsequent Events
Change in Contingent Deferred Sales Charge (CDSC) Schedule
Effective November 1, 2015, shareholders purchasing $1 million or more of Class A Shares at NAV without an up-front sales charge will be assessed a CDSC of 1.00% on any shares redeemed within eighteen months of purchase, unless the redemption is eligible for a CDSC reduction or waiver as specified in the Funds’ statement of additional information.
Additional
Fund Information
| | | | | | | | | | |
| | | | | |
| | Fund Manager Nuveen Fund Advisors, LLC 333 West Wacker Drive Chicago, IL 60606 Sub-Adviser Nuveen Asset Management, LLC 333 West Wacker Drive Chicago, IL 60606 | | Independent Registered
Public Accounting Firm PricewaterhouseCoopers LLP Chicago, IL 60606 Custodian U.S. Bank National Association Milwaukee, WI 53202 | | Legal Counsel Chapman and Cutler LLP Chicago, IL 60603 | | Transfer Agent and
Shareholder Services
Boston Financial Data Services, Inc. Nuveen Investor Services P.O. Box 8530 Boston, MA 02266-8530 (800)257-8787 | | |
| | | | | | | | | | | | | | |
| | |
| | Distribution Information: The Funds hereby designate their percentages of dividends paid from net ordinary income as dividends qualifying for the 70% dividends received deduction (“DRD”) for corporations and their percentages as qualified dividend income (“QDI”) for individuals under Section 1(h)(11) of the Internal Revenue Code as shown in the accompanying table. The actual qualified dividend income distributions will be reported to shareholders on Form 1099-DIV which will be sent to shareholders shortly after calendar year end. | | |
| | | | | | | |
| | | | | | | | | Equity Index | | Mid Cap Index | | Small Cap Index | | |
| | % QDI | | | | | | 100% | | 49% | | 34% | | |
| | % DRD | | | | | | 100% | | 44% | | 30% | | |
| | |
| | Long-Term Capital Gain Distributions: The Funds hereby designate as long-term capital gain dividends, pursuant to Internal Revenue Code Section 852(b)(3), the amount shown in the accompanying table or, if greater, the amount necessary to reduce earnings and profits of the Funds related to net capital gain to zero for the tax year ended October 31, 2015: | | |
| | | | | | | |
| | | | | | | | | Equity Index | | Mid Cap Index | | Small Cap Index | | |
| | Long-term capital gain dividends | | | | $43,469,842 | | $32,554,318 | | $7,028,495 | | |
| | | | | |
| | | | | | | | | | |
| | |
| | Quarterly Form N-Q Portfolio of Investments Information: Each Fund is required to file its complete schedule of portfolio holdings with the Securities and Exchange Commission (SEC) for the first and third quarters of each fiscal year on Form N-Q. You may obtain this information directly from the SEC. Visit the SEC on-line at http://www.sec.gov or in person at the SEC’s Public Reference Room in Washington, D.C. Call the SEC toll-free at (800) SEC-0330 for room hours and operation. | | |
| | | |
| | | | | | |
| | |
| | Nuveen Funds’ Proxy Voting Information: You may obtain (i) information regarding how each fund voted proxies relating to portfolio securities held during the most recent twelve-month period ended June 30, without charge, upon request, by calling Nuveen Investments toll-free at (800) 257-8787 or on Nuveen’s website at www.nuveen.com and (ii) a description of the policies and procedures that each fund used to determine how to vote proxies relating to portfolio securities without charge, upon request, by calling Nuveen Investments toll-free at (800) 257-8787. You may also obtain this information directly from the SEC. Visit the SEC on-line at http://www.sec.gov. | | |
| | | |
| | | | | | |
| | |
| | FINRA BrokerCheck: The Financial Industry Regulatory Authority (FINRA) provides information regarding the disciplinary history of FINRA member firms and associated investment professionals. This information as well as an investor brochure describing FINRA BrokerCheck is available to the public by calling the FINRA BrokerCheck Hotline number at (800) 289-9999 or by visiting www.FINRA.org. | | |
Glossary of Terms
Used in this Report
Average Annual Total Return: This is a commonly used method to express an investment’s performance over a particular, usually multi-year time period. It expresses the return that would have been necessary each year to equal the investment’s actual cumulative performance (including change in NAV or offer price and reinvested distributions and capital gains, if any) over the time period being considered.
Gross Domestic Product (GDP): The total market value of all final goods and services produced in a country/region in a given year, equal to total consumer, investment and government spending, plus the value of exports, minus the value of imports.
Lipper Mid-Cap Core Funds Classification Average: Represents the average annualized total return for all reporting funds in the Lipper Mid-Cap Core Funds Classification. Lipper returns account for the effects of management fees and assume reinvestment of distributions but do not reflect any applicable sales charges.
Lipper S&P 500® Index Objective Funds Classification Average: Represents the average annualized total return for all reporting funds in the Lipper S&P 500® Index Objective Funds Classification. Lipper returns account for the effects of management fees and assume reinvestment of distributions but do not reflect any applicable sales charges.
Lipper Small-Cap Core Funds Classification Average: Represents the average annualized total return for all reporting funds in the Lipper Small-Cap Core Funds Classification. Lipper returns account for the effects of management fees and assume reinvestment of distributions but do not reflect any applicable sales charges.
MSCI EAFE Index: The MSCI (Morgan Stanley Capital International) EAFE (Europe, Australasia, Far East) Index is a free float-adjusted market capitalization weighted index designed to measure developed market equity performance, excluding the U.S. and Canada. The index returns assume reinvestment of distributions, but do not reflect any applicable sales charges or management fees.
Net Asset Value (NAV) Per Share: A fund’s Net Assets is equal to its total assets (securities, cash and accrued earnings) less its total liabilities. For funds with multiple classes, Net Assets are determined separately for each share class. NAV per share is equal to the fund’s (or share class’) Net Assets divided by its number of shares outstanding.
Russell 1000® Index: An unmanaged index, considered representative of large-cap stocks. The index returns assume reinvestment of distributions, but do not reflect any applicable sales charges or management fees.
Russell 2000® Index: An index that measures the performance of the small-cap segment of the U.S. equity universe. The Russell 2000 Index is a subset of the Russell 3000® Index representing approximately 10% of the total market capitalization of that index. It includes approximately 2,000 of the smallest securities based on a combination of their market cap and current index membership. The Russell 3000® Index measures the performance of the 3,000 largest companies based on total market capitalization, which represents approximately 98% of the investable U.S. equity market. The index returns assume reinvestment of distributions, but do not reflect any applicable sales charges or management fees.
S&P 500® Index: An unmanaged index generally considered representative of the U.S. stock market. The index returns assume reinvestment of distributions, but do not reflect any applicable sales charges or management fees.
S&P MidCap 400® Index: An unmanaged, market value-weighted index of 400 mid-cap companies. The index returns assume reinvestment of distributions, but do not reflect any applicable sales charges or management fees.
Tax Equalization: The practice of treating a portion of the distribution made to a redeeming shareholder, which represents his proportionate part of undistributed net investment income and capital gain as a distribution for tax purposes. Such amounts are referred to as the equalization debits (or payments) and will be considered a distribution to the shareholder of net investment income and capital gain for calculation of the fund’s dividends paid deduction.
Trustees
and Officers (Unaudited)
The management of the Funds, including general supervision of the duties performed for the Funds by the Adviser, is the responsibility of the Board of trustees of the Funds. The number of directors of the Funds is currently set at eleven. None of the trustees who are not “interested” persons of the Funds (referred to herein as “independent trustees”) has ever been a director or employee of, or consultant to, Nuveen or its affiliates. The names and business addresses of the trustees and officers of the Funds, their principal occupations and other affiliations during the past five years, the number of portfolios each oversees and other directorships they hold are set forth below.
The Funds’ Statement of Additional Information (“SAI”) includes more information about the trustees. To request a free copy, call Nuveen Investments at (800) 257-8787 or visit the Funds’ website at www.nuveen.com.
| | | | | | | | |
Name, Year of Birth & Address | | Position(s) Held with the Funds | | Year First Elected or Appointed (1) | | Principal Occupation(s) Including other Directorships During Past 5 Years | | Number of Portfolios in Fund Complex Overseen by Trustee |
| | | |
| Independent Trustee: | | | | |
William J. Schneider 1944 333 W. Wacker Drive Chicago, IL 60606 | | Chairman of the Board and Trustee | | 1996 | | Chairman of Miller-Valentine Partners, a real estate investment company; formerly, Senior Partner and Chief Operating Officer (retired 2004) of Miller-Valentine Group; owner in several other Miller-Valentine entities; Board Member of Med-America Health System, and WDPR Public Radio Station; formerly, member, Business Advisory Council, Cleveland Federal Reserve Bank and University of Dayton Business School Advisory Council. | | 196 |
Jack B. Evans 1948 333 W. Wacker Drive Chicago, IL 60606 | | Trustee | | 1999 | | President, The Hall-Perrine Foundation, a private philanthropic corporation (since 1996); Director and Chairman, United Fire Group, a publicly held company; formerly, President Pro-Tem of the Board of Regents for the State of Iowa University System; Director, Source Media Group; Life Trustee of Coe College; formerly, Director, Alliant Energy; formerly, Director, Federal Reserve Bank of Chicago; formerly, President and Chief Operating Officer, SCI Financial Group, Inc., a regional financial services firm. | | 196 |
William C. Hunter 1948 333 W. Wacker Drive Chicago, IL 60606 | | Trustee | | 2004 | | Dean Emeritus, formerly, Dean, Tippie College of Business, University of Iowa (2006-2012); Director (since 2004) of Xerox Corporation; Director (since 2005), and President (since 2012) Beta Gamma Sigma, Inc., The International Business Honor Society; Director of Wellmark, Inc. (since 2009); formerly, Dean and Distinguished Professor of Finance, School of Business at the University of Connecticut (2003-2006); previously, Senior Vice President and Director of Research at the Federal Reserve Bank of Chicago (1995-2003); formerly, Director (1997-2007), Credit Research Center at Georgetown University. | | 196 |
David J. Kundert 1942 333 W. Wacker Drive Chicago, IL 60606 | | Trustee | | 2005 | | Formerly, Director, Northwestern Mutual Wealth Management Company (2006-2013); retired (since 2004) as Chairman, JPMorgan Fleming Asset Management, President and CEO, Banc One Investment Advisors Corporation, and President, One Group Mutual Funds; prior thereto, Executive Vice President, Banc One Corporation and Chairman and CEO, Banc One Investment Management Group; Regent Emeritus, Member of Investment Committee, Luther College; member of the Wisconsin Bar Association; member of Board of Directors and Chair of Investment Committee, Greater Milwaukee Foundation; member of the Board of Directors (Milwaukee), College Possible. | | 196 |
Trustees and Officers (Unaudited) (continued)
| | | | | | | | |
Name, Year of Birth & Address | | Position(s) Held with the Funds | | Year First Elected or Appointed (1) | | Principal Occupation(s) Including other Directorships During Past 5 Years | | Number of Portfolios in Fund Complex Overseen by Trustee |
John K. Nelson 1962 333 West Wacker Drive Chicago, IL 60606 | | Trustee | | 2013 | | Member of Board of Directors of Core12 LLC (since 2008), a private firm which develops branding, marketing and communications strategies for clients; Director of The Curran Center for Catholic American Studies (since 2009) and The President’s Council, Fordham University (since 2010); formerly senior external advisor to the financial services practice of Deloitte Consulting LLP (2012-2014); formerly, Chairman of the Board of Trustees of Marian University (2010 as trustee, 2011-2014 as Chairman); formerly, Chief Executive Officer of ABN AMRO N.V. North America, and Global Head of its Financial Markets Division (2007-2008); prior senior positions held at ABN AMRO include Corporate Executive Vice President and Head of Global Markets—the Americas (2006-2007), CEO of Wholesale Banking—North America and Global Head of Foreign Exchange and Futures Markets (2001-2006), and Regional Commercial Treasurer and Senior Vice President Trading—North America (1996-2001); formerly, Trustee at St. Edmund Preparatory School in New York City. | | 196 |
Judith M. Stockdale 1947 333 W. Wacker Drive Chicago, IL 60606 | | Trustee | | 1997 | | Board Member, Land Trust Alliance (since 2013) and U.S. Endowment for Forestry and Communities (since 2013); formerly, Executive Director (1994-2012), Gaylord and Dorothy Donnelley Foundation; prior thereto, Executive Director, Great Lakes Protection Fund (1990-1994). | | 196 |
Carole E. Stone 1947 333 W. Wacker Drive Chicago, IL 60606 | | Trustee | | 2007 | | Director, Chicago Board Options Exchange (since 2006), C2 Options Exchange, Incorporated (since 2009) Director, CBOE Holdings, Inc. (since 2010); formerly, Commissioner, New York State Commission on Public Authority Reform (2005-2010). | | 196 |
Virginia L. Stringer 1944 333 W. Wacker Drive Chicago, IL 60606 | | Trustee | | 2011 | | Board Member, Mutual Fund Directors Forum; non-profit board member; former governance consultant; former Owner and President, Strategic Management Resources, Inc., a management consulting firm; former Member, Governing Board, Investment Company Institute’s Independent Directors Council; previously, held several executive positions in general management, marketing and human resources at IBM and The Pillsbury Company; Independent Director, First American Fund Complex (1987-2010) and Chair (1997-2010). | | 196 |
Terence J. Toth 1959 333 W. Wacker Drive Chicago, IL 60606 | | Trustee | | 2008 | | Managing Partner, Promus Capital (since 2008); Director, Fulcrum IT Service LLC (since 2010), Quality Control Corporation (since 2012) and LogicMark LLC (since 2012); formerly, Director, Legal & General Investment Management America, Inc. (2008-2013); formerly, CEO and President, Northern Trust Global Investments (2004-2007); Executive Vice President, Quantitative Management & Securities Lending (2000-2004); prior thereto, various positions with Northern Trust Company (since 1994); member: Chicago Fellowship Board (since 2005), Catalyst Schools of Chicago Board (since 2008) and Mather Foundation Board (since 2012), and a member of its investment committee; formerly, Member, Northern Trust Mutual Funds Board (2005-2007), Northern Trust Global Investments Board (2004-2007), Northern Trust Japan Board (2004-2007), Northern Trust Securities Inc. Board (2003-2007) and Northern Trust Hong Kong Board (1997-2004). | | 196 |
| | | | | | | | |
Name, Year of Birth & Address | | Position(s) Held with the Funds | | Year First Elected or Appointed (1) | | Principal Occupation(s) Including other Directorships During Past 5 Years | | Number of Portfolios in Fund Complex Overseen by Trustee |
| | | |
| Interested Trustee: | | | | |
William Adams IV(2) 1955 333 W. Wacker Drive Chicago, IL 60606 | | Trustee | | 2013 | | Senior Executive Vice President, Global Structured Products (since 2010); Co-President of Nuveen Fund Advisors, LLC (since 2011); Executive Vice President of Nuveen Securities, LLC; President (since 2011), formerly, Managing Director (2010-2011) of Nuveen Commodities Asset Management, LLC; Board Member of the Chicago Symphony Orchestra and of Gilda’s Club Chicago; formerly, Executive Vice President, U.S. Structured Products, of Nuveen Investments, Inc. (1999-2010). | | 196 |
Thomas S. Schreier, Jr.(2)
1962 333 W. Wacker Drive Chicago, IL 60606 | | Trustee | | 2013 | | Vice Chairman, Wealth Management of Nuveen Investments, Inc. (since 2011); Co-President of Nuveen Fund Advisors, LLC; Chairman of Nuveen Asset Management, LLC (since 2011); Co-Chief Executive Officer of Nuveen Securities, LLC (since 2011); Member of Board of Governors and Chairman’s Council of the Investment Company Institute; Director of Allina Health and a Member of its Finance, Audit and Investment Committees, formerly, Chief Executive Officer (2000-2010) and Chief Investment Officer (2007-2010) of FAF Advisors, Inc.; formerly, President of First American Funds (2001-2010). | | 196 |
| | | | | | | | |
Name,
Year of Birth & Address | | Position(s) Held with the Funds | | Year First Elected or Appointed (3) | | Principal Occupation(s) During Past 5 Years | | Number of Portfolios in Fund Complex Overseen by
Officer |
| | | |
| Officers of the Funds: | | | | |
Gifford R. Zimmerman 1956 333 W. Wacker Drive Chicago, IL 60606 | | Chief Administrative Officer | | 1988 | | Managing Director (since 2002), and Assistant Secretary of Nuveen Securities, LLC; Managing Director (since 2004) and Assistant Secretary (since 1994) of Nuveen Investments, Inc.; Managing Director (since 2002), Assistant Secretary (since 1997) and Co-General Counsel (since 2011) of Nuveen Fund Advisors, LLC; Managing Director, Assistant Secretary and Associate General Counsel of Nuveen Asset Management, LLC (since 2011); Managing Director and Assistant Secretary of Symphony Asset Management LLC (since 2003); Vice President and Assistant Secretary of NWQ Investment Management Company, LLC (since 2002), Nuveen Investments Advisers Inc. (since 2002), Santa Barbara Asset Management, LLC (since 2006) and of Winslow Capital Management, LLC, (since 2010); Vice President and Assistant Secretary (since 2013), formerly, Chief Administrative Officer and Chief Compliance Officer (2006-2013) of Nuveen Commodities Asset Management, LLC; Chartered Financial Analyst. | | 197 |
Margo L. Cook 1964 333 W. Wacker Drive Chicago, IL 60606 | | Vice President | | 2009 | | Senior Executive Vice President of Nuveen Investments, Inc.; Executive Vice President, Investment Services of Nuveen Fund Advisors, LLC (since 2011); Managing Director – Investment Services of Nuveen Commodities Asset Management, LLC (since 2011); Co-Chief Executive Officer (since 2015); previously, Executive Vice President (2013-2015) of Nuveen Securities, LLC; Chartered Financial Analyst. | | 197 |
Lorna C. Ferguson 1945 333 W. Wacker Drive Chicago, IL 60606 | | Vice President | | 1998 | | Managing Director (since 2005) of Nuveen Fund Advisors, LLC and Nuveen Securities, LLC (since 2004). | | 197 |
Trustees and Officers (Unaudited) (continued)
| | | | | | | | |
Name,
Year of Birth & Address | | Position(s) Held with the Funds | | Year First Elected or Appointed (3) | | Principal Occupation(s) During Past 5 Years | | Number of Portfolios in Fund Complex Overseen by
Officer |
Stephen D. Foy 1954 333 W. Wacker Drive Chicago, IL 60606 | | Vice President and Controller | | 1998 | | Managing Director (since 2014), formerly, Senior Vice President (2013-2014) and Vice President (2005-2013) of Nuveen Fund Advisors, LLC; Chief Financial Officer of Nuveen Commodities Asset Management, LLC (since 2010); Certified Public Accountant. | | 197 |
Sherri A. Hlavacek 1962 333 W. Wacker Drive Chicago, IL 60606 | | Vice President and Treasurer | | 2015 | | Executive Vice President (since May 2015, formerly, Managing Director) and Controller of Nuveen Fund Advisors, LLC; Managing Director and Controller of Nuveen Commodities Asset Management, LLC; Executive Vice President (since May 2015, formerly, Managing Director), Treasurer and Controller of Nuveen Asset Management, LLC; Executive Vice President, Principal Financial Officer (since July 2015, formerly, Managing Director), Treasurer and Corporate Controller of Nuveen Investments, Inc.; Executive Vice President (since May 2015, formerly, Managing Director), Treasurer and Corporate Controller of Nuveen Investments Advisers Inc. and Nuveen Investments Holdings, Inc.; Managing Director, Chief Financial Officer and Corporate Controller of Nuveen Securities, LLC; Vice President, Controller and Treasurer of NWQ Investment Management Company, LLC; Vice President and Controller of Santa Barbara Asset Management, LLC, Tradewinds Global Investors, LLC, Symphony Asset Management LLC and Winslow Capital Management, LLC; Certified Public Accountant. | | 197 |
Walter M. Kelly 1970 333 W. Wacker Drive Chicago, IL 60606 | | Chief Compliance Officer and Vice President | | 2003 | | Senior Vice President (since 2008) of Nuveen Investments Holdings, Inc. | | 197 |
Tina M. Lazar 1961 333 W. Wacker Drive Chicago, IL 60606 | | Vice President | | 2002 | | Senior Vice President of Nuveen Investments Holdings, Inc. and Nuveen Securities, LLC | | 197 |
Kevin J. McCarthy 1966 333 W. Wacker Drive Chicago, IL 60606 | | Vice President and Secretary | | 2007 | | Managing Director and Assistant Secretary (since 2008), Nuveen Securities, LLC; Managing Director (since 2008), Assistant Secretary (since 2007) and Co-General Counsel (since 2011) of Nuveen Fund Advisors, LLC; Managing Director, Assistant Secretary and Associate General Counsel (since 2011) of Nuveen Asset Management, LLC; Managing Director and Assistant Secretary, Nuveen Investments, Inc.; Vice President (since 2007) and Assistant Secretary of Nuveen Investments Advisers Inc., NWQ Investment Management Company, LLC, Tradewinds Global Investors LLC, Symphony Asset Management LLC, Santa Barbara Asset Management, LLC, and of Winslow Capital Management, LLC. (since 2010); Vice President and Secretary (since 2010) of Nuveen Commodities Asset Management, LLC. | | 197 |
Kathleen L. Prudhomme 1953 901 Marquette Avenue Minneapolis, MN 55402 | | Vice President and Assistant Secretary | | 2011 | | Managing Director, Assistant Secretary and Co-General Counsel (since 2011) of Nuveen Fund Advisors, LLC; Managing Director, Assistant Secretary and Associate General Counsel (since 2011) of Nuveen Asset Management, LLC; Managing Director and Assistant Secretary (since 2011) of Nuveen Securities, LLC; formerly, Deputy General Counsel, FAF Advisors, Inc. (2004-2010). | | 197 |
Joel T. Slager 1978 333 West Wacker Drive Chicago, IL 60606 | | Vice President and Assistant Secretary | | 2013 | | Fund Tax Director for Nuveen Funds (since 2013); previously, Vice President of Morgan Stanley Investment Management, Inc., Assistant Treasurer of the Morgan Stanley Funds (from 2010 to 2013). | | 197 |
| | | | | | | | |
Name,
Year of Birth & Address | | Position(s) Held with the Funds | | Year First Elected or Appointed (3) | | Principal Occupation(s) During Past 5 Years | | Number of Portfolios in Fund Complex Overseen by
Officer |
Jeffery M. Wilson 1956 333 West Wacker Drive Chicago, IL 60606 | | Vice President | | 2011 | | Senior Vice President of Nuveen Securities, LLC (since 2011); formerly, Senior Vice President of FAF Advisors, Inc. (2000-2010). | | 108 |
| (1) | Trustees serve an indefinite term until his/her successor is elected or appointed. Ms. Stringer will retire from the Board as of December 31, 2015. The year first elected or appointed represents the year in which the trustee was first elected or appointed to any fund in the Nuveen Fund Complex. |
| (2) | “Interested persons” of the Trust, as defined in the 1940 Act, by reason of their positions with Nuveen and certain of its subsidiaries. |
| (3) | Officers serve one year terms through August of each year. The year first elected or appointed represents the year in which the officer was first elected or appointed to any fund in the Nuveen Fund Complex. |
Annual Investment Management Agreement
Approval Process (Unaudited)
The Board of Directors of each Fund (each, a “Board” and each Director, a “Board Member”), including the Board Members who are not parties to the Funds’ advisory or sub-advisory agreements or “interested persons” of any such parties (the “Independent Board Members”), is responsible for overseeing the performance of the investment adviser and sub-adviser to the respective Fund and determining whether to continue such Fund’s advisory agreement (the “Investment Management Agreement”) between the Fund and Nuveen Fund Advisors, LLC (the “Adviser”) and the sub-advisory agreement (the “Sub-Advisory Agreement” and, together with the Investment Management Agreement, the “Advisory Agreements”) between the Adviser and Nuveen Asset Management, LLC (the “Sub-Adviser”). Following an initial term with respect to each Fund upon its commencement of operations, the Board is required to consider the continuation of the Advisory Agreements on an annual basis pursuant to the requirements of the Investment Company Act of 1940, as amended (the “1940 Act”). Accordingly, at an in-person meeting held on May 11-13, 2015 (the “May Meeting”), the Board, including a majority of the Independent Board Members, considered and approved the existing Advisory Agreements for the Funds.
In preparation for its considerations at the May Meeting, the Board received in advance of the meeting extensive materials prepared in connection with the review of the Advisory Agreements. The materials provided a broad range of information regarding the Funds, including, among other things, the nature, extent and quality of services provided by the Adviser and Sub-Adviser (the Adviser and Sub-Adviser are collectively, the “Fund Advisers” and each, a “Fund Adviser”); Fund performance including performance assessments against peers and the appropriate benchmark(s); fee and expense information of the Funds compared to peers; a description and assessment of shareholder service levels for the Funds; a summary of the performance of certain service providers; a review of product initiatives and shareholder communications; and profitability information of the Fund Advisers as described in further detail below. As part of its annual review, the Board also held a separate meeting on April 14-15, 2015 to review the Funds’ investment performance and consider an analysis by the Adviser of the Sub-Adviser which generally evaluated the Sub-Adviser’s investment team, investment mandate, organizational structure and history, investment philosophy and process, and the performance of the Funds, and any significant changes to the foregoing. During the review, the Independent Board Members asked questions of and requested additional information from management.
The Board considered that the evaluation process with respect to the Fund Advisers is an ongoing process that encompassed the information and knowledge gained throughout the year. The Board, acting directly or through its committees, met regularly during the course of the year and received information and considered factors at each meeting that would be relevant to its annual consideration of the Advisory Agreements, including information relating to Fund performance; Fund expenses; investment team evaluations; and valuation, compliance, regulatory and risk matters. In addition to regular reports, the Adviser provided special reports to the Board to enhance the Board’s understanding on topics that impact some or all of the Nuveen funds and the Adviser (such as presentations on risk and stress testing; the new governance, risk and compliance system; cybersecurity developments; Nuveen fund accounting and reporting matters; regulatory developments impacting the investment company industry and the business plans or other matters impacting the Adviser). The Board also met with key investment personnel managing certain Nuveen fund portfolios during the year.
The Board had created several standing committees including the Open-End Funds Committee and the Closed-End Funds Committee to assist the full Board in monitoring and gaining a deeper insight into the distinctive business practices of closed-end and open-end funds. These Committees met prior to each quarterly Board meeting, and the Adviser provided presentations to these Committees permitting them to delve further into specific matters or initiatives impacting the respective product line.
The Board also continued its program of seeking to have the Board Members or a subset thereof visit each sub-adviser to the Nuveen funds at least once over a multiple year rotation, meeting with key investment and business personnel. In this regard, the Independent Board Members made site visits to multiple equity and fixed-income investment teams of the Sub-Adviser in June 2014.
The Board considered the information provided and knowledge gained at these meetings and visits during the year when performing its annual review of the Advisory Agreements. The Independent Board Members also were assisted throughout the process by independent legal counsel. During the course of the year and during their deliberations regarding the review of advisory contracts, the Independent Board Members met with independent legal counsel in executive sessions without management present. The Independent Board Members also received a memorandum from independent legal counsel outlining the legal standards for their consideration of the proposed continuation of the Advisory Agreements. In addition, it is important to recognize that the management arrangements for the Nuveen funds are the result of many years of review and discussion between the Independent Board Members and Fund management and that the Board Members’ conclusions may be based, in part, on their consideration of fee arrangements and other factors developed in previous years.
The Board took into account all factors it believed relevant with respect to each Fund, including, among other things: (a) the nature, extent and quality of the services provided by the Fund Advisers; (b) the investment performance of the Funds and Fund Advisers; (c) the advisory fees and costs of the services to be provided to the Funds and the profitability of the Fund Advisers; (d) the extent of any economies of scale; (e) any benefits derived by the Fund Advisers from the relationship with the Funds; and (f) other factors. Each Board Member may have accorded different weight to the various
factors in reaching his or her conclusions with respect to the Advisory Agreements of each Fund. The Independent Board Members did not identify any single factor as all-important or controlling. The Independent Board Members’ considerations were instead based on a comprehensive consideration of all the information presented. The principal factors considered by the Board and its conclusions are described below.
A. Nature, Extent and Quality of Services
In evaluating the renewal of the Advisory Agreements, the Independent Board Members received and considered information regarding the nature, extent and quality of the applicable Fund Adviser’s services provided to each respective Fund. The Board reviewed information regarding, among other things, each Fund Adviser’s organization and business, the types of services that each Fund Adviser or its affiliates provided to the Funds, the performance record of the Funds (as described in further detail below), and any initiatives that had been undertaken on behalf of the open-end product line. The Board recognized the high quality of services the Adviser had provided to the Funds over the years and the conscientiousness with which the Adviser provided these services. The Board also considered the improved capital structure of Nuveen Investments, Inc. (“Nuveen”) (the parent of the Adviser) following the acquisition of Nuveen by TIAA-CREF in 2014 (the “TIAA-CREF Transaction”).
With respect to the services, the Board noted the Funds were registered investment companies that operated in a regulated industry and considered the myriad of investment management, administrative, compliance, oversight and other services the Adviser provided to manage and operate the Funds. Such services included, among other things: (a) product management (such as analyzing ways to better position a Nuveen fund in the marketplace, setting dividends; maintaining relationships to gain access to distribution platforms; and providing shareholder communications); (b) fund administration (such as preparing tax returns and other tax compliance services, preparing regulatory filings and shareholder reports; managing fund budgets and expenses; overseeing a fund’s various service providers and supporting and analyzing new and existing funds); (c) Board administration (such as supporting the Board and its committees, in relevant part, by organizing and administering the Board and committee meetings and preparing the necessary reports to assist the Board in its duties); (d) compliance (such as monitoring adherence to a fund’s investment policies and procedures and applicable law; reviewing the compliance program periodically and developing new policies or updating existing compliance policies and procedures as considered necessary or appropriate; responding to regulatory requests; and overseeing compliance testing of the funds’ sub-advisers); (e) legal support (such as preparing or reviewing fund registration statements, proxy statements and other necessary materials; interpreting regulatory requirements and compliance thereof; and maintaining applicable registrations); and (f) investment services (such as overseeing and reviewing the funds’ sub-advisers and their investment teams; analyzing performance of the funds; overseeing investment and risk management; evaluating brokerage transactions and securities lending, overseeing the daily valuation process for portfolio securities and developing and recommending valuation policies and methodologies and changes thereto; reporting to the Board on various matters including performance, risk and valuation; and participating in fund development, leverage management, and the developing or interpreting of investment policies and parameters).
In its review, the Board considered information highlighting the various initiatives that the Adviser had implemented or continued during the last year to enhance its services to the Nuveen funds. The Board recognized that some of these initiatives are a result of a multi-year process. In reviewing the activities of 2014, the Board recognized the Adviser’s continued focus on fund rationalization for open-end funds through mergers, fund closures or repositioning the funds in seeking to enhance shareholder value, reduce costs, improve performance, eliminate fund overlap and better meet shareholder needs. The Board noted the Adviser’s investment in additional staffing to strengthen and improve its services to the Nuveen funds, including with respect to risk management and valuation. The Board recognized that expanding the depth and range of its risk oversight activities had been a major priority for the Adviser in recent years, and the Adviser continued to add to the risk management team, develop additional risk management programs and create committees or other teams designated to oversee or evaluate certain risks, such as liquidity risk, enterprise risk, investment risk and cybersecurity risk. The Adviser had also continued to add to the valuation team, launched its centralized securities valuation system which is intended to provide for uniform pricing and reporting across the complex as the system continues to develop, continued to refine its valuation analysis and updated related policies and procedures and evaluated and assessed pricing services. The Board considered the Adviser’s ongoing investment in information technology and operations and the various projects of the information technology team to support the continued growth and complexity of the Nuveen funds and increase efficiencies in their operations. The Board also recognized the Adviser’s strong commitment to compliance and reviewed information reflecting the compliance group’s ongoing activities to enhance its compliance system and refine its compliance procedures as well as the Chief Compliance Officer’s report regarding the compliance team, the initiatives the team had undertaken in 2014 and proposed for 2015, the compliance functions and reporting process, the record of compliance with the policies and procedures and its supervision activities of other service providers.
With respect to the open-end fund product line, the Adviser had also, among other things: developed new funds in seeking to enhance the product line; enhanced the reporting to the Board and its committees regarding payments to intermediaries; and continued to explore opportunities for potential funds.
As noted, the Adviser also oversees the Sub-Adviser who primarily provides the portfolio advisory services to the Funds. The Board recognized the skill and competency of the Adviser in monitoring and analyzing the performance of the Sub-Adviser and managing the sub-advisory relationship. In considering the Sub-Advisory Agreements and supplementing its prior knowledge, the Board considered a current report provided by the Adviser analyzing, among other things, the Sub-Adviser’s investment team and changes thereto, investment approach, organization and history, and assets under management, and the investment performance of each Fund.
Annual Investment Management Agreement Approval Process (Unaudited) (continued)
Based on their review, the Independent Board Members found that, overall, the nature, extent and quality of services provided to the Funds under each respective Advisory Agreement were satisfactory.
B. The Investment Performance of the Funds and Fund Advisers
The Board, including the Independent Board Members, considered the performance history of each Fund over various time periods. The Board reviewed reports, including an analysis of the Funds’ performance and the investment team. The Board reviewed, among other things, each Fund’s investment performance both on an absolute basis and in comparison to peer funds (the “Performance Peer Group”) and to recognized and/or customized benchmarks (i.e., generally benchmarks derived from multiple recognized benchmarks) for the quarter, one-, three- and five-year periods ending December 31, 2014, as well as performance information reflecting the first quarter of 2015. In its review, the Board noted that it also reviewed Fund performance results at each of its quarterly meetings.
In evaluating performance, the Board recognized several factors that may impact the performance data as well as the consideration given to particular performance data.
| | • | | The performance data reflected a snapshot in time, in this case as of the end of the most recent calendar year or quarter. A different performance period, however, could generate significantly different results. |
| | • | | Long-term performance can be adversely affected by even one period of significant underperformance so that a single investment decision or theme had the ability to disproportionately affect long-term performance. |
| | • | | The investment experience of a particular shareholder in a fund would vary depending on when such shareholder invested in the fund, the class held (if multiple classes are offered in the fund) and the performance of the fund (or respective class) during that shareholder’s investment period. |
| | • | | Open-end funds offer multiple classes and the performance data provided for open-end funds was based on Class A shares. The performance of the other classes of a fund, however, should be substantially similar on a relative basis because all of the classes would be invested in the same portfolio of securities and differences in performance among classes could be principally attributed to the variations in distribution and servicing expenses of each class. |
| | • | | The Board recognized that the funds in the Performance Peer Group may differ somewhat from the Nuveen fund with which it is being compared and due to these differences, performance comparisons between certain of the Nuveen funds and their Performance Peer Groups may be inexact and the relevancy limited. The Board considered that management had classified the Performance Peer Group as low, medium and high in relevancy. The Board took the analysis of the relevancy of the Performance Peer Group into account when considering the comparative performance data. The Board also considered comparative performance of an applicable benchmark. While the Board was cognizant of the relative performance of a Fund’s peer set and/or benchmark(s), the Board evaluated Fund performance in light of the respective Fund’s investment objectives, investment parameters and guidelines and considered that the variations between the objectives and investment parameters or guidelines of the Fund with its peers and/or benchmarks result in differences in performance results. |
With respect to any Nuveen funds for which the Board has identified performance concerns, the Board monitors such funds closely until performance improves, discusses with the Adviser the reasons for such results, considers those steps necessary or appropriate to address such issues, and reviews the results of any efforts undertaken. The Board is aware, however, that shareholders chose to invest or remain invested in a fund knowing that the Adviser manages the fund and knowing the fund’s fee structure.
In considering the performance data, the Independent Board Members noted the following with respect to the Funds:
For Nuveen Equity Index Fund (the “Equity Index Fund”), the Board noted that the Fund ranked in its Performance Peer Group in the fourth quartile in the one-, three- and five-year periods and underperformed its benchmark for each of such periods. The Board, however, recognized that differences with the peer set limited the usefulness of the peer comparative data. The Board also noted that, given the Fund’s investment mandate, tracking error was a more appropriate measure of the Fund’s performance and therefore considered the Fund’s close tracking error for the one- and three-year periods. The Board also recognized the Fund’s positive absolute performance for the one-, three- and five-year periods.
For Nuveen Mid Cap Index Fund (the “Mid Cap Index Fund”), the Board noted that, although the Fund underperformed its benchmark in the one-, three- and five-year periods, the Fund ranked in its Performance Peer Group in the second quartile in the one- and five-year periods and the third quartile in the three-year period.
For Nuveen Small Cap Index Fund (the “Small Cap Index Fund”), the Board noted that, although the Fund underperformed its benchmark in the one-, three- and five-year periods, the Fund ranked in its Performance Peer Group in the second quartile in the one- and three-year periods and the third quartile in the five-year period.
Based on their review, the Independent Board Members determined that each Fund’s investment performance had been satisfactory.
C. Fees, Expenses and Profitability
1. Fees and Expenses
The Board evaluated the management fees and other fees and expenses of each Fund (expressed as a percentage of average net assets) in absolute terms and in comparison to the fee and expense levels of a comparable universe of funds (the “Peer Universe”) and, with respect to open-end funds, to a more focused subset in the Peer Universe (the “Peer Group”), each selected by an independent third-party fund data provider. The Independent Board Members reviewed the methodology regarding the construction of the Peer Universe and Peer Group for each Fund. The Board reviewed, among other things, such Fund’s gross management fees, net management fees and net expense ratios in absolute terms as well as compared to the average and median fee and expense levels of the Peer Universe and/or Peer Group. The Board noted that the net total expense ratios paid by investors in the Funds were the most representative of an investor’s net experience. The Board Members also considered any fee waivers and/or expense reimbursement arrangements currently in effect for the Funds.
In reviewing the comparative fee and expense information, the Independent Board Members recognized that various factors such as the limited size and particular composition of the Peer Universe or Peer Group (including the inclusion of other Nuveen funds in the peer set); expense anomalies; changes in the funds comprising the Peer Universe or Peer Group from year to year; levels of reimbursement or fee waivers; the timing of information used; and differences in services provided can impact the comparative data limiting the usefulness of the data to help make a conclusive assessment of the Funds’ fees and expenses.
In reviewing the fee schedule for a fund, the Independent Board Members also considered the fund-level and complex-wide breakpoint schedules (described in further detail below) and any fee waivers and reimbursements provided by Nuveen. In reviewing fees and expenses, the Board considered the expenses and fees to be higher if they were over 10 basis points higher, slightly higher if they were approximately 6 to 10 basis points higher, in line if they were within approximately 5 basis points higher than the peer average and below if they were below the peer average of the Peer Group. In reviewing the reports, the Board noted that the majority of the Nuveen funds had a net expense ratio near or below their peer average.
The Independent Board Members recognized that the Mid Cap Index Fund had a net expense ratio that was higher than the peer average, but a net management fee that was below the peer average and the Equity Index Fund and the Small Cap Index Fund each had a net management fee that was below the peer average and a net expense ratio that was below or in line with the peer average.
Based on their review of the fee and expense information provided, the Independent Board Members determined that each Fund’s management fees (as applicable) to a Fund Adviser were reasonable in light of the nature, extent and quality of services provided to the Fund.
2. Comparisons with the Fees of Other Clients
The Board considered information regarding the fees a Fund Adviser assessed to the Nuveen funds compared to that of other clients as described in further detail below. With respect to non-municipal funds, such other clients of the Adviser and/or its affiliated sub-advisers may include: separately managed accounts (such as retail, institutional or wrap accounts), hedge funds, other investment companies that are not offered by Nuveen but are sub-advised by one of Nuveen’s affiliated sub-advisers, foreign investment companies offered by Nuveen, and collective investment trusts.
The Board recognized that each Fund had an affiliated sub-adviser and therefore the overall Fund management fee can be divided into two components, the fee retained by the Adviser and the fee paid to the Sub-Adviser. In reviewing the nature of the services provided by the Adviser, including through its affiliated sub-advisers, the Board considered the range of advisory fee rates for retail and institutional managed accounts advised by Nuveen-affiliated sub-advisers. The Board also reviewed, among other things, the average fee the affiliated sub-advisers assessed such clients as well as the range of fee rates assessed to the different types of clients (such as retail, institutional and wrap accounts as well as non-Nuveen funds) applicable to such sub-advisers.
In reviewing the comparative information, the Board also reviewed information regarding the differences between the Funds and the other clients, including differences in services provided, investment policies, investor profiles, compliance and regulatory requirements and account sizes. The Board recognized the breadth of services necessary to operate a registered investment company (as described above) and that, in general terms, the Adviser provided the administrative and other support services to the Funds and, although the Sub-Adviser may provide some of these services, the Sub-Adviser essentially provided the portfolio management services. In general, the Board noted that higher fee levels reflected higher levels of service provided by the Fund Adviser, increased investment management complexity, greater product management requirements and higher levels of business risk or some combination of the foregoing. The Independent Board Members considered the differences in structure and operations of separately managed accounts and hedge funds from registered funds and noted that the range of day-to-day services was not generally of the breadth required for the registered funds. Many of the additional administrative services provided by the Adviser were not required for institutional clients or funds sub-advised by a Nuveen-affiliated sub-adviser that were offered by other fund groups. The Independent Board Members also recognized that the management fee rates of the foreign funds advised by the Adviser may vary due to, among other things, differences in the client base, governing bodies, operational complexities and services covered by the management fee. Given the inherent differences in the various products, particularly the extensive services provided to the Funds, the Independent Board Members believed such facts justify the different levels of fees.
Annual Investment Management Agreement Approval Process (Unaudited) (continued)
3. Profitability of Fund Advisers
In conjunction with their review of fees, the Independent Board Members also considered the profitability of Nuveen for its advisory activities and its financial condition. The Independent Board Members reviewed, among other things, the adjusted operating margins for Nuveen for the last two calendar years, the revenues, expenses, net income (pre-tax and after-tax) and net revenue margins (pre-tax and after-tax) of Nuveen’s managed fund advisory activities for the last two calendar years, the allocation methodology used by Nuveen in preparing the profitability data and a history of the adjustments to the methodology due to changes in the business over time. The Independent Board Members also reviewed the revenues, expenses, net income (pre-tax and after-tax) and revenue margin (pre-tax and post-tax) of the Adviser and, as described in further detail below, each affiliated sub-adviser for the 2014 calendar year. In reviewing the profitability data, the Independent Board Members noted the subjective nature of cost allocation methodologies used to determine profitability as other reasonable methods could also have been employed but yield different results. The Independent Board Members reviewed an analysis of the key drivers behind the changes in revenues and expenses that impacted profitability in 2014. The Independent Board Members recognized that Nuveen’s net revenue margin from advisory activities for 2014 was consistent with 2013. The Independent Board Members also considered the profitability of Nuveen in comparison to the adjusted operating margins of other investment advisers with publicly available data and with comparable assets under management (based on asset size and asset composition) to Nuveen. The Independent Board Members noted that Nuveen’s adjusted operating margins appeared to be reasonable in relation to such other advisers. The Independent Board Members, however, recognized the difficulty of making comparisons of profitability from fund investment advisory contracts as the information is not generally publicly available, the information for the investment advisers that was publicly available may not be representative of the industry and various other factors would impact the profitability data such as differences in services offered, business mix, expense methodology and allocations, capital structure and costs, complex size, and types of funds and other accounts managed.
The Independent Board Members noted this information supplemented the profitability information requested and received during the year and noted that two Independent Board Members served as point persons to review the profitability analysis and methodologies employed, and any changes thereto, and to keep the Board apprised of such changes during the year.
The Independent Board Members determined that Nuveen appeared to be sufficiently profitable to operate as a viable investment management firm and to honor its obligations as a sponsor of the Nuveen funds. The Independent Board Members noted the Adviser’s continued expenditures to upgrade its investment technology and increase personnel and recognized the Adviser’s continued commitment to its business to enhance the Adviser’s capacity and capabilities in providing the services necessary to meet the needs of the Nuveen funds as they grow or change over time. The Independent Board Members also noted that the sub-advisory fees for the Nuveen funds are paid by the Adviser, however, the Board recognized that many of the sub-advisers, including the Sub-Adviser, are affiliated with Nuveen. The Independent Board Members also noted the increased resources and support available to Nuveen as well as an improved capital structure as a result of the TIAA-CREF Transaction.
With respect to the Sub-Adviser, the Independent Board Members reviewed the Sub-Adviser’s revenues, expenses and revenue margins (pre- and post-tax) for its advisory activities for the calendar year ended December 31, 2014. The Independent Board Members also reviewed profitability analysis reflecting the revenues, expenses and the revenue margin (pre- and post-tax) by asset type for the Sub-Adviser for the calendar year ended December 31, 2014.
In evaluating the reasonableness of the compensation, the Independent Board Members also considered other amounts paid to a Fund Adviser by the Funds as well as indirect benefits (such as soft dollar arrangements), if any, the Fund Adviser and its affiliates received or were expected to receive that were directly attributable to the management of a Fund. See Section E below for additional information on indirect benefits a Fund Adviser may receive as a result of its relationship with the Funds.
Based on their review, the Independent Board Members determined that the Adviser’s and the Sub-Adviser’s level of profitability was reasonable in light of the respective services provided.
D. Economies of Scale and Whether Fee Levels Reflect These Economies of Scale
The Independent Board Members recognized that, as the assets of a particular fund or the Nuveen complex in the aggregate increase over time, economies of scale may be realized, and the Independent Board Members considered the extent to which the funds benefit from such economies of scale. Although the Independent Board Members recognized that economies of scale are difficult to measure, the Board recognized that one method to help ensure the shareholders share in these benefits is to include breakpoints in the management fee schedule reducing fee rates as asset levels grow. The Independent Board Members noted that, subject to certain exceptions, the management fees of the funds in the Nuveen complex are generally comprised of a fund-level component and complex-level component. Each component of the management fee for each Fund included breakpoints to reduce management fee rates of the Fund as the Fund grows and, as described below, as the Nuveen complex grows. In addition to fund-specific breakpoint schedules which reduce the fee rates of a particular fund as its assets increase, the Independent Board Members recognized that the Adviser also passed on the benefits of economies of scale through the complex-wide fee arrangement which reduced management fee rates as assets in the fund complex reached certain levels. The complex-wide fee arrangement seeks to provide the benefits of economies of scale to fund shareholders when total fund complex assets increase, even if assets of a particular fund are unchanged or have decreased. The approach reflected the
notion that some of Nuveen’s costs were attributable to services provided to all its funds in the complex, and therefore all funds benefit if these costs were spread over a larger asset base. The Independent Board Members reviewed the breakpoint and complex-wide schedules and the fee reductions achieved as a result of such structures for the 2014 calendar year.
The Independent Board Members also noted that additional economies of scale were shared with shareholders of the Funds through the adoption of temporary expense caps. The Independent Board Members further considered that as part of the TIAA-CREF Transaction, Nuveen agreed, for a period of two years from the date of the closing of the TIAA-CREF Transaction, not to increase contractual management fees for any Nuveen fund and, with respect to funds with expense caps, not to raise expense cap levels for such funds from levels in effect at that time or scheduled to go into effect prior to the closing of the TIAA-CREF Transaction. The commitment would not limit or otherwise affect mergers or liquidations of any funds in the ordinary course.
Based on their review, the Independent Board Members concluded that the current fee structure was acceptable and reflected economies of scale to be shared with shareholders when assets under management increase.
E. Indirect Benefits
The Independent Board Members received and considered information regarding potential “fall out” or ancillary benefits the respective Fund Adviser or its affiliates may receive as a result of its relationship with the Funds. In this regard, the Independent Board Members recognized that an affiliate of the Adviser served as the Funds’ principal underwriter and may receive compensation therefore from, among other things, sales charges, distribution fees and shareholder services fees (which included fees received pursuant to any 12b-1 plan). The Independent Board Members therefore took into account, among other things, the 12b-1 fees retained by Nuveen during the last calendar year.
In addition to the above, the Independent Board Members considered whether the Fund Adviser received any benefits from soft dollar arrangements whereby a portion of the commissions paid by a Fund for brokerage may be used to acquire research that may be useful to the Fund Adviser in managing the assets of the Fund and other clients. The Funds’ portfolio transactions are allocated by the Sub-Adviser. Accordingly, the Independent Board Members considered that the Sub-Adviser may benefit from research provided by broker-dealers executing portfolio transactions on behalf of the Funds. With respect to any fixed income securities, however, the Board recognized that such securities generally trade on a principal basis that does not generate soft dollar credits. Similarly, the Board recognized that any research received pursuant to soft dollar arrangements by the Sub-Adviser may also benefit the Funds and shareholders to the extent the research enhanced the ability of the Sub-Adviser to manage the Funds. The Independent Board Members noted that the Sub-Adviser’s profitability may be somewhat lower if it had to acquire any such research services directly.
Based on their review, the Independent Board Members concluded that any indirect benefits received by a Fund Adviser as a result of its relationship with the Funds were reasonable and within acceptable parameters.
F. Other Considerations
The Independent Board Members did not identify any single factor discussed previously as all-important or controlling. The Board Members, including the Independent Board Members, concluded that the terms of each Advisory Agreement were fair and reasonable, that the respective Fund Adviser’s fees were reasonable in light of the services provided to each Fund and that the Advisory Agreements be renewed.
| | | | | | | | | | | | | | |
| | | | | | | | |
| | | | |
| | | | | | | | |
| | | | | |
| | Nuveen Investments: | | | | | | | | |
| | | | Serving Investors for Generations | | |
| | |
| | | | |
| | | |
| | | | Since 1898, financial advisors and their clients have relied on Nuveen Investments to provide dependable investment solutions through continued adherence to proven, long-term investing principles. Today, we offer a range of high quality equity and fixed-income solutions designed to be integral components of a well-diversified core portfolio. | | |
| | | |
| | | | | | |
| | | | |
| | | | | | Focused on meeting investor needs. Nuveen Investments provides high-quality investment services designed to help secure the longterm goals of institutional and individual investors as well as the consultants and financial advisors who serve them. Nuveen Investments markets a wide range of specialized investment solutions which provide investors access to capabilities of its high-quality boutique investment affiliates-Nuveen Asset Management, Symphony Asset Management, NWQ Investment Management Company, Santa Barbara Asset Management, Tradewinds Global Investors, Winslow Capital Management, and Gresham Investment Management. In total, Nuveen Investments managed more than $220 billion as of September 30, 2015. | | |
| | | | | |
| | | | | | | | | | |
| | | | | | Find out how we can help you. To learn more about how the products and services of Nuveen Investments may be able to help you meet your financial goals, talk to your financial advisor, or call us at (800) 257-8787. Please read the information provided carefully before you invest. Investors should consider the investment objective and policies, risk considerations, charges and expenses of any investment carefully. Where applicable, be sure to obtain a prospectus, which contains this and other relevant information. To obtain a prospectus, please contact your securities representative or Nuveen Investments, 333 W. Wacker Dr., Chicago, IL 60606. Please read the prospectus carefully before you invest or send money. Learn more about Nuveen Funds at: www.nuveen.com/mf | | |
| | | | | | |
| | | | | | | | | | | | |
| | Distributed by Nuveen Securities, LLC | 333 West Wacker Drive Chicago, IL 60606 | www.nuveen.com | | | | |
MAN-FIDX-1015D 12546-INV-Y-12/16
| | |
| | |  |
| Mutual Funds | |
| | | | | | |
| | | | | | | Annual Report October 31, 2015 |
| | | | | | | | | | | | | | | | |
| | | | | | | Share Class / Ticker Symbol | | |
| | | Fund Name | | | | Class A | | Class C | | Class R3 | | Class R6 | | Class I | | |
|
| | Nuveen Dividend Value Fund | | | | FFEIX | | FFECX | | FEISX | | FFEFX | | FAQIX | | |
| | Nuveen Mid Cap Value Fund | | | | FASEX | | FACSX | | FMVSX | | — | | FSEIX | | |
| | Nuveen Small Cap Value Fund | | | | FSCAX | | FSCVX | | FSVSX | | — | | FSCCX | | |
| | | | | | | | | | | | |
| | | | | | |
| | | | |
| | | | | | | | |
| | |
| | Life is Complex. | | |
| | |
| | Nuveen makes things e-simple. | | |
| | |
| | It only takes a minute to sign up for e-Reports. Once enrolled, you’ll receive an e-mail as soon as your Nuveen Fund information is ready. No more waiting for delivery by regular mail. Just click on the link within the e-mail to see the report and save it on your computer if you wish. | | |
| | | | |
| | | | | | Free e-Reports right to your e-mail! | | |
| | | |
| | | | | | www.investordelivery.com If you receive your Nuveen Fund distributions and statements from your
financial advisor or brokerage account. |
| | | | |
| | | | or | | www.nuveen.com/accountaccess If you receive your Nuveen Fund distributions and statements directly from Nuveen. Must be preceded by or accompanied by a prospectus. NOT FDIC INSURED MAY LOSE VALUE
NO BANK GUARANTEE | | |
| | | | | | | | | | |
| | | | | | | | | | | | | |

Table
of Contents
Chairman’s Letter
to Shareholders

Dear Shareholders,
For better or for worse, the financial markets spent most of the past year waiting for the U.S. Federal Reserve (Fed) to end its accommodative monetary policy. The policy has propped up stock and bond markets since the Great Recession, but the question remains: how will markets behave without its influence? This uncertainty was a considerable source of volatility for stock and bond prices for much of 2015, despite the Fed carefully conveying its intention to raise rates slowly and only when the economy shows evidence of readiness.
As was widely expected, the long-awaited Fed rate hike materialized in mid-December. While the move was interpreted as a vote of confidence on the economy’s underlying strength, the Fed emphasized that future rate increases will be gradual and guided by its ongoing assessment of financial conditions. How efficiently the financial markets process the confluence of rising borrowing costs, softer commodity prices, stubbornly low U.S. inflation, and a strong U.S. dollar, against a backdrop of anemic global economic growth, remains to be seen.
Nevertheless, the global recovery continues to be led by the United States. Policy makers in Europe and Japan are deploying their available tools to try to bolster their economies’ fragile growth, while Chinese authorities have stepped up efforts to manage China’s slowdown. With sentiment regarding China growing increasingly bearish and the Fed now working toward normalizing its interest-rate policy, the actions of the world’s central banks remain under intense scrutiny.
In the meantime, asset prices could continue to churn as risks both known and unknown begin to emerge. In times like these, you can look to a professional investment manager with the experience and discipline to maintain the proper perspective on short-term events. And if the daily headlines do concern you, I encourage you to reach out to your financial advisor. Your financial advisor can help you evaluate your investment strategies in light of current events, your time horizon and risk tolerance.
On behalf of the other members of the Nuveen Fund Board, we look forward to continuing to earn your trust in the months and years ahead.
Sincerely,

William J. Schneider
Chairman of the Board
December 21, 2015
Portfolio Managers’
Comments
Nuveen Dividend Value Fund
Nuveen Mid Cap Value Fund
Nuveen Small Cap Value Fund
These Funds feature portfolio management by Nuveen Asset Management, LLC (NAM), an affiliate of Nuveen Investments, Inc.
Effective October 5, 2015, David Chalupnik, CFA, was named as a portfolio manager of the Nuveen Dividend Value Fund. David is the Head of Equities for NAM and has 31 years of financial industry experience. Cori Johnson, CFA, and Derek Sadowsky, CFA, also continue to serve as portfolio managers for the Fund. Cori assumed portfolio management responsibilities in 1996 while Derek became a co-manager on the management team in 2012.
Karen Bowie, CFA, will now solely lead the Nuveen Mid Cap Value Fund. David Chalupnik will no longer be a portfolio manager for this Fund. Karen assumed portfolio management responsibilities for the Nuveen Mid Cap Value Fund in 2012.
Karen Bowie is also the portfolio manager for the Nuveen Small Cap Value Fund. She assumed portfolio management responsibilities for the Fund in 2006.
On the following pages, the portfolio management teams for the Funds discuss economic and financial market conditions, key investment strategies and the Funds’ performance for the twelve-month reporting period ended October 31, 2015.
What factors affected the U.S. economy and the financial markets during the twelve-month reporting period ended October 31, 2015?
During this reporting period, the U.S. economy continued to expand at a moderate pace. The Federal Reserve (Fed) maintained efforts to bolster growth and promote progress toward its mandates of maximum employment and price stability by holding the benchmark fed funds rate at the record low level of zero to 0.25% that it established in December 2008, a level that remained in place until December 2015 when the Fed increased its benchmark rate to a range of 0.25% to 0.50% (subsequent to the close of this reporting period). At its October 2014 meeting, the Fed announced that it would end its bond-buying stimulus program as of November 1, 2014, after tapering its monthly asset purchases of mortgage-backed and longer-term Treasury securities from the original $85 billion per month to $15 billion per month over the course of seven consecutive meetings (December 2013 through September 2014). In making the announcement, the Fed cited substantial improvement in the labor market as well as sufficient underlying strength in the broader economy to support ongoing progress toward maximum employment in a context of price stability. The Fed also reiterated that it would continue to look at a wide range of factors, including labor market conditions, indicators of inflationary pressures and readings on financial developments, in determining future actions. Additionally, the Fed stated that it would likely maintain the current target range for the fed funds rate for a considerable time, especially if projected inflation continued to run below the Fed’s 2% longer run goal. However, if economic data shows faster progress, the Fed indicated that it could raise the fed funds rate sooner than expected.
The Fed changed its language slightly in December 2014, indicating it would be “patient” in normalizing monetary policy. This shift helped ease investors’ worries that the Fed might raise rates too soon. However, as employment data released early in 2015 continued to look strong, anticipation began building that the Fed could raise its main policy rate as soon as June. As widely expected, after its March meeting, the Fed eliminated “patient” from its statement, but also highlighted the policymakers’ less optimistic view of the economy’s overall health as well as downgraded their inflation projections. The Fed’s April meeting seemed to further signal
Certain statements in this report are forward-looking statements. Discussions of specific investments are for illustration only and are not intended as recommendations of individual investments. The forward-looking statements and other views expressed herein are those of the portfolio managers as of the date of this report. Actual future results or occurrences may differ significantly from those anticipated in any forward-looking statements and the views expressed herein are subject to change at any time, due to numerous market and other factors. The Funds disclaim any obligation to update publicly or revise any forward-looking statements or views expressed herein.
Refer to the Glossary of Terms Used in this Report for further definition of the terms used within this section.
Portfolio Managers’ Comments (continued)
that a June rate hike was off the table. While the Fed attributed the first quarter’s economic weakness to temporary factors, the meeting minutes from April revealed that many Committee members believed the economic data available in June would be insufficient to meet the Fed’s criteria for initiating a rate increase. The June meeting bore out that presumption and the Fed decided to keep the target rate near zero. But the Committee also continued to telegraph the likelihood of at least one rate increase in 2015, which many analysts forecasted for September.
During the September 2015 meeting, the Fed decided to keep the federal funds rate near zero despite broad speculation that it would increase rates. The Committee said it will keep the rate near zero until the economy has seen further improvement toward reaching the Fed’s goals of maximum employment and inflation approaching 2%. This assessment will take into account a wide range of information, including measures of labor market conditions, indicators of inflation pressures and inflation expectations, and readings on financial and international developments. At the Fed’s October 2015 meeting, the Committee again held steady, while opening the door for a potential December rate hike. (The Fed did raise rates at its December meeting, subsequent to the close of this reporting period).
The U.S. economy proved to be fairly resilient compared to other economies around the globe, boosted by an improving job market, declining gas prices and low mortgage rates. According to the government’s gross domestic product (GDP) “second” estimate, the U.S. economy increased at a 2.1% annualized rate in the third quarter of 2015, compared with increases of 3.9% in the second quarter, 0.6% in the first quarter of 2015 and 2.2% in the fourth quarter 2014. The deceleration in real GDP in the third quarter primarily reflected a downturn in private inventory investment and decelerations in exports, in nonresidential fixed investment, in state and local government spending and in residential fixed investment that were partly offset by a deceleration in imports. The Consumer Price Index (CPI) increased 0.2% essentially unchanged year-over-year as of October 2015. The core CPI (which excludes food and energy) increased 0.2% during the same period, below the Fed’s unofficial longer term inflation objective of 2.0%. As of October 2015, the U.S. unemployment rate was 5.0%, a figure that is also considered “full employment” by some Fed officials. The housing market continued to post consistent gains as of its most recent reading for September 2015. The average home price in the S&P/Case-Shiller Index of 20 major metropolitan areas rose 5.5% for the twelve months ended September 2015 (most recent data available at the time this report was prepared).
Meanwhile, a number of issues weighed on economies across the globe including geopolitical turmoil, weak growth overseas and sharply falling oil prices, which were caused by the faltering global economy and OPEC’s refusal to give up market share. Falling oil prices propelled significant appreciation in the U.S. dollar, which hit a multi-year high versus a basket of other major currencies, supported by the confident Fed and weaker data coming out of Europe, Japan and China. In an effort to improve their economic growth, countries across the globe maintained extraordinarily accommodative monetary policies. The European Central Bank (ECB) launched a massive quantitative easing program via a government bond-buying program that pumped more than 1 trillion euros into the weak eurozone economy, while other central banks around the world enacted more than 30 policy easing actions during the first few months of 2015.
Political drama also dominated the news partway through the reporting period, including the escalating tensions over Greece’s debt issues and aggressive policy intervention by the Chinese government to deflate the country’s stock market bubble. In late June, Greece took front and center in world market headlines with defaults on its payments to the International Monetary Fund and threats of a potential exit from the European Monetary Union (EMU). However, by mid-July, Greece had agreed to austerity measures in return for more bailout funds. Meanwhile, after skyrocketing for nearly a year, China’s stock market suddenly shifted gears in June and embarked on a massive sell-off that quickly spilled over to the rest of the world. Investors pulled money out of Chinese stocks despite efforts by China’s government to stem the tide, including further rate cuts, a 1 trillion yuan bond for infrastructure build-out, new regulations surrounding equity purchases and redemptions and the unexpected devaluation of the yuan currency in mid-August. A number of factors helped fuel the sell-off, including weak Chinese economic data and falling commodity prices. By August 2015, oil prices had fallen to their lowest levels of the reporting period with prices for West Texas Intermediate (WTI) crude dipping below the $40/barrel level for a short time. Following the drop, the price of WTI crude reversed course and ended the reporting period around $47/barrel.
With this backdrop, global volatility spiked across all asset classes during the reporting period. Oil and gas shares, other energy-related stocks and petrocurrencies were hit hard around the world due to dramatically falling commodity prices. In overseas stock markets, news of widespread monetary policy moves across the globe gave equities a boost through May however, in the summer
months renewed fears over China and uncertainty about the Fed’s next move hit markets, spurring a massive global sell-off in August. Overall for the reporting period, international equity markets were collectively much weaker than the U.S. market and ended with flat to negative returns. For example, the MSCI EAFE Index returned -0.07% for the twelve-month reporting period. Emerging market stocks experienced even greater headwinds from the strong U.S. dollar, weak Chinese data, the commodity sell-off and Fed uncertainty, significantly underperforming developed market peers. As measured by the MSCI Emerging Markets Index, this segment ended the period with a -14.53% return.
In the U.S., equities experienced a correction in August 2015 in connection with the above-mentioned factors and dipped again in late September, before rising back to mid-2015 levels in the final month of the reporting period. The S&P 500® Index ended up posting a return of 5.20% for the twelve-month reporting period. However, the positive overall index results masked the more than 40% spread between the return of the best performing sector, consumer discretionary and the worst performing sector, energy, which fell by more than 19%. Larger, more established companies outperformed riskier, smaller-cap stocks, which continued to be hampered by heightened risk aversion and the pending Fed rate tightening, which will remove liquidity from the market. The small-cap segment produced a 0.34% return as measured by the Russell 2000® Index versus a 4.86% return for the larger-cap Russell 1000® Index. Across the capitalization spectrum, growth stocks outperformed value stocks, particularly in the larger-cap area.
Nuveen Dividend Value Fund
How did the Fund perform during the twelve-month reporting period ended October 31, 2015?
The tables in the Fund Performance and Expense Ratios section of this report provide total returns for the Fund for the one-year, five-year and ten-year periods ended October 31, 2015. Comparative performance information is provided for the Fund’s Class A Shares at net asset value (NAV) only. The Fund’s Class A Shares at NAV underperformed the Russell 1000® Value Index and the Lipper Equity Income Funds Classification Average during the twelve-month reporting period.
What strategies were used to manage the Fund during the reporting period and how did these strategies influence performance?
During the reporting period, we continued to implement the Fund’s disciplined investment strategy. We seek to achieve consistent, long-term outperformance with lower volatility by building and managing a portfolio diversified between sustainable and opportunistic holdings with a focus on what we believe are attractively valued companies with above average current income or dividend growth. We use an integrated, multi-perspective research and analysis approach that involves a team of portfolio managers, fundamental research analysts and quantitative analysts. The Fund’s holdings exhibit attractive valuations and identifiable catalysts that we believe will drive future stock appreciation. The Fund is also actively managed in an effort to minimize distributed capital gains and maximize after-tax returns using a typical investment horizon of at least two to three years. We adhere to portfolio guidelines to manage volatility and maintain diversification, generally selling a security if it no longer is expected to meet our dividend growth or price appreciation expectations or if we find a better alternative in the marketplace.
The Fund underperformed the Russell 1000® Value Index and Lipper peer group during a period where volatility spiked in the equity market because of concerns over an economic slowdown in China and the emerging markets, which helped drive a significant drop in oil and other commodities prices. In the United States, however, the economy appeared to be on firmer footing due to steady gains in housing activity, consumer spending and employment. The Fund’s performance shortfall was primarily the result of stock selection in the information technology, energy, financial and telecommunications services sectors, which was only partially offset by strong security selection in the consumer discretionary, consumer staples, materials and utilities sectors. Performance was also aided by an overweight position in consumer discretionary, one of the strongest performing sectors in the benchmark during the reporting period. The sector was boosted by significantly lower energy prices as well as continued improvements in employment and wages.
The most significant detractor to the Fund’s relative performance was stock selection in the information technology sector. Shares of hardware and services firm Hewlett-Packard Company were under pressure for the majority of the reporting period. The stock traded down as the company experienced greater-than-expected headwinds from the strong dollar, while investors anticipated that slowing personal computer sales would continue to further pressure earnings. Hewlett-Packard’s CEO also detailed the anticipated costs for a massive restructuring to separate the firm’s printing and personal computer divisions from its hardware and services areas. The split into two companies took place on November 1st, after the reporting period ended.
Portfolio Managers’ Comments (continued)
Several holdings detracted in the energy sector where the steep decline in oil prices, driven by global supply growth that outpaced demand, pressured the Fund’s holdings during the reporting period. For example, shares of exploration and production company Anadarko Petroleum Corporation traded lower, particularly throughout the summer and fall months after the company reported significant declines in year-over-year earnings and revenue in its second-quarter results. The stock was further pressured by a Supreme Court decision to uphold a lower court ruling determining that both Anadarko Petroleum and BP plc are responsible for civil damages under the federal Clean Water Act related to the 2010 oil spill in the Gulf of Mexico. However, we continued to like and own this company because of its very attractive acreage and strong cash position, which should allow it to weather any sustained downturn in oil prices. Another significant laggard for the Fund was independent oil and natural gas company Linn Energy, LLC. Given its high dividend yield and declining production assets, Linn Energy was under additional pressure from falling oil prices, which more than offset the benefits of the company’s strong cash position and hedged oil positions. We decided to sell Linn Energy based on our opinion that the company would have trouble continuing to pay its dividend.
In the financial sector, the Fund’s average 5% underweight detracted from performance since the sector outperformed the overall benchmark return. Also, our underweight position in real estate investment trusts (REITs) detracted during a period where long-term bond yields generally declined. REITs typically move counter to interest rates because they tend to be more defensive and rely on debt to fund their businesses. However, we maintained the Fund’s REIT underweight because we believe the Fed is getting close to an increase in the federal funds rate, especially if we see signs of improvement in international markets and continued job growth in the United States. Additionally, the generally lower interest rates led to modest underperformance from bank and insurance names we held in the Fund such as Prudential Financial Inc. and Fifth Third Bancorp.
Performance was also negatively impacted by telecommunications provider CenturyLink Inc., which reported quarterly earnings that came in at the low end of the company’s guidance early in the Fund’s fiscal year. Investors were also disappointed that management did not offer more ways to realize value at its investor day in June. CenturyLink’s shares remained under pressure due to intensifying competition and deteriorating revenues from legacy voice services because users are switching over to wireless. Therefore, we decided to sell this position during the period.
Security selection within the two consumer sectors was the most significant positive contributor to the Fund’s relative performance. In the consumer discretionary sector, the Fund experienced strength from positions in theme park operator Six Flags Entertainment Corporation, toy and game maker Hasbro Inc. and cruise line operator Carnival Corporation. Six Flags performed well early in 2015 after the company reported guidance that was better than expected. Revenues increased year-over-year while international fees continued to see growth as the company expanded into markets like Dubai and China. Although Six Flags subsequently gave a weaker-than-expected second-quarter report, it shares continued to outperform, likely because investors anticipated that low gas prices and improving U.S. employment would drive increased park revenue and earnings going forward. Some of the weakness in the second quarter was due to weather-related conditions, which we believed would normalize going forward, while the company’s above-market dividend yield should add downside support. Hasbro’s shares advanced after the company delivered solid earnings and continued to see strong tailwinds for its business lines. In addition, Hasbro has entered into a partnership with Disney to develop and sell Playmation, which uses smart technology for interactive games. Playmation will be able to leverage Disney’s strong movie platform with its own manufacturing and distribution platform. Meanwhile, Carnival, the largest cruise line operator in the world, saw its stock surge during the reporting period as several catalysts came to fruition. First, the entire cruise line industry is a huge beneficiary of the materially lower fuel prices. Second, Carnival is seeing an improving supply-and-demand outlook in the Caribbean, where it controls about 50% of the market. The Caribbean market had previously been in a state of overcapacity for years. Third, the company is seeing improved traffic in Europe and has recently announced the transfer of two of its U.S.-based ships to China in an effort to expand into that growing market.
In the consumer staples sector, the Fund’s primary standout was tobacco and cigarette company Altria Group Inc., which was rewarded for its less cyclical business mix in an environment where investors were becoming more concerned with the global growth climate. In addition, Altria shares benefited from the expectation that Anheuser-Busch InBev, the largest brewing company in the world, would make a bid for Britain-based rival SABMiller. (Altria holds a nearly 27% stake in SABMiller.) In the final days of the reporting period, Altria’s shares surged after SABMiller accepted an offer worth more than $100 billion. If approved by regulators, the merger will be one of the largest in corporate history.
In the materials sector, our position in chemical producer LyondellBasell Industries NV boosted the Fund’s results. The company benefited from improving fundamentals in the petrochemical business where inventory levels remained low and price increases were announced and took hold, which should lead to higher margins and significant free cash flow generation. We continue to like this position because we believe demand will improve further, while new supply is still two years away from coming online.
Nuveen Mid Cap Value Fund
How did the Fund perform during the twelve-month reporting period ended October 31, 2015?
The tables in the Fund Performance and Expense Ratios section of this report provide total returns for the Fund for the one-year, five-year and ten-year periods ended October 31, 2015. Comparative performance information is provided for the Fund’s Class A Shares at net asset value (NAV). The Fund’s Class A Shares at NAV outperformed the Russell Midcap® Value Index and performed in line with the Lipper Mid-Cap Value Funds Classification Average during the twelve-month reporting period.
What strategies were used to manage the Fund during the reporting period and how did these strategies influence performance?
The Fund seeks to provide long-term capital appreciation by investing primarily in the common stocks of companies with market capitalizations at the time of purchase between approximately $2.4 billion and $28.7 billion. During the reporting period, we continued to implement the Fund’s investment process of selecting mid-cap companies that we believed were undervalued relative to other companies in the same industry or market. These companies demonstrated or are expected to demonstrate improving fundamentals and have an identifiable catalyst that could close the gap between market value and our perception of fair value. We look for companies that generate strong free cash flow, which allows them to pay down debt, increase dividends, repurchase shares or engage in merger and acquisition (M&A) activities. At the same time, we identify a short- or long-term catalyst we can track and monitor over time that could potentially propel each stock to realize its value. Generally, we sell a holding if the stock price reaches its target, the company’s fundamentals or competitive position significantly deteriorate or if a better alternative exists in the marketplace.
The Fund’s return outperformed the Russell benchmark and matched the Lipper average during a period of heighted volatility for mid-cap equities, especially in the second half of the reporting period, driven by concerns over growth in China and the emerging markets. The Fund benefited from strong security selection in the consumer discretionary, energy and information technology sectors, while overweight positions in consumer discretionary and health care were also helpful. Stock selection detracted in the industrials, materials and financial sectors.
In the consumer discretionary sector, cruise line operator Royal Caribbean Cruises Ltd. posted solid quarterly numbers, while also benefiting from management’s comments regarding future booking trends and other initiatives. Royal Caribbean also has several potential catalysts in play including the benefits of materially lower fuel prices, new ships being introduced in China, potential Cuban itineraries and a generally improving supply-and-demand outlook in the Caribbean, which has been in a state of overcapacity for years. Also, the Fund’s position in athletic footwear retailer Foot Locker Inc. performed well as the company exhibited strong execution across categories, banners, channels and geographies. Better-than-anticipated comparable store sales led to significant expense leverage. Foot Locker has demonstrated a pattern of positive earnings-per-share growth for the past two years.
In the energy sector, the Fund outperformed due to solid stock selection in a sector that was down more than 37% in the Russell Midcap® Value Index. For example, we owned Cameron International Corporation, which was able to outperform other North American-centric, rig-levered companies. With the company’s backlog tied to midstream, refining and offshore rigs, Cameron has been better insulated from the margin and revenue degradation experienced by many onshore, oil services-based companies. Likewise, exploration and production company Newfield Exploration Company was able to outperform its peers. The company successfully cut production costs, while its well-hedged oil positions protected it on the downside. Newfield is also seeing positive well results from the attractive acreage it continues to develop in Texas, which should lead to increases in both production guidance and the value of the assets heading into 2016.
The information technology sector was home to several of the Fund’s top contributors during the reporting period, including two leading developers and distributors of video games, Electronic Arts Inc. and Activision Blizzard Inc. Both companies continue to
Portfolio Managers’ Comments (continued)
benefit from a new generation of gaming consoles and the increasing shift toward the digital delivery of games over the internet, which is meaningfully raising their gross margins and free cash flow. Electronic Arts’ management team has done an exceptional job of expanding the reach and profit margin of popular games such as Madden NFL and FIFA, while Activision Blizzard is devoting considerable resources to developing new games that are well received. Both companies have produced stronger-than-expected earnings for several quarters in a row and raised full-year guidance. We believe the outlook for Electronic Arts and Activision Blizzard remains favorable, both in the short term due to their current line-ups, the console cycle and the holiday season, and long term based on the other above-mentioned trends.
Fund performance within the health care sector generated modestly positive results due to the Fund’s overweight position in the sector and individual stock selection. We saw strength from a position in global health benefits and insurance company Cigna Corporation, which provides a broad array of medical, dental, disability and life insurance. Cigna’s shares rose as the company benefited from the continuation of disciplined cost controls, revenues that grew faster than investors expected and upbeat guidance from company management for calendar year 2015. Then in June, Cigna’s stock surged after buyout rumors circulated and an eventual offer was announced from Anthem Inc., which will leave only three major players in the insurance industry if the deal passes regulatory approval. Although Cigna originally rejected the offer, the two parties have continued negotiations and the probability of a deal occurring has increased. Hologic Inc., the developer and supplier of digital imaging technology for general radiography and mammography applications, also performed well during the period. With new management firmly in place, Hologic continued to post solid quarterly results. This included a fiscal first-quarter pre-announcement that helped propel the stock price, followed by increased fiscal year guidance given its strong start. Offsetting some of the above-mentioned strength, an off-benchmark position in health care services company Tenet Healthcare Corporation was a drag on the Fund’s performance. We sold Tenet Healthcare during the reporting period because of the overhang that continued to linger from the Supreme Court hearing on the King v. Burwell case, which challenges the use of subsidies for enrollees in federal exchanges.
In terms of other detractors, the Fund’s position in industrial firm Joy Global Inc., which manufactures and services mining equipment used for the extraction of coal and other mineral and ores, underperformed. The environment has not been conducive to Joy Global as noted by the continued decline in bookings combined with currency-related headwinds and lack of end market demand. Although management eventually updated its guidance targets, we decided to exit this name because commodity prices stayed under pressure throughout the reporting period. In the materials sector, United States Steel Corporation was the most significant detractor in terms of the Fund’s relative performance due to its exposure to slumping oil prices. The company is one of the largest U.S.-based integrated steel mill manufacturers, which produces flat sheet carbon steel and tubular products in the United States, Canada and Europe. Oil country tubular good (OCTG) volumes are highly exposed to drops in exploration and production spending and represent a significant portion of U.S. Steel’s tubular segment shipments. With this headwind for the company, we sold the Fund’s position in U.S. Steel during the reporting period.
Results were also negative in the financial sector because the strength of one of our holdings was more than offset by weakness in several others. The Fund benefited from a position in West Coast regional bank Western Alliance Bancorporation, which posted good quarterly results marked by strong profitability, solid loan and deposit growth, and improving credit quality. Western Alliance is also in the process of an attractive synergistic merger that will lift its commercial lending pipeline in the attractive technology and health care verticals. On the other hand, a position in SLM Corp. (Sallie Mae), which engages in the origination, servicing and administration of educational loans, lagged significantly. While second-quarter results were generally in line, investors’ concerns over widening student loan securitization spreads came into play. However, this widening was driven by rating actions of Federal Family Education Loan Program loans and shouldn’t have a direct impact on private student loan performance. As such, we continue to hold a positon in SLM. Also, Host Hotels & Resorts Inc., a real estate investment trust (REIT), was a laggard during the reporting period. Hotel REITs’ metrics have continued to deteriorate, particularly revenue per available room (RevPAR), which is a performance metric used in the hotel industry. Host Hotels & Resorts’ management ultimately reduced its outlook, which put additional strain on the share price and caused us to sell the stock. In addition, the Fund’s position in investment management firm Invesco Ltd. underperformed on a relative basis as a result of the August global market sell-off, mixed product performance, fund flows and the strong dollar throughout the reporting period, which diminished assets under management. That being said, fund flows have turned positive in October and we continue to hold Invesco. We believe the company can continue to grow with its broad product set and global footprint, as well as potentially accelerate its share buybacks.
Despite the energy sector’s overall strength, it was also home to two of the Fund’s more significant detractors. Coal mining company Peabody Energy Corporation saw its shares suffer, particularly in March as the price of coal declined, causing investors and sell-side analysts to reduce forward earnings estimates despite management’s good efforts to contain and reduce operating costs. We have since sold the Fund’s position in Peabody Energy. We also experienced underperformance from a position in Nabors Industries Ltd., a leading provider of offshore platform workover and drilling rigs in U.S. and international markets. The company also manufacturers top drives for a broad range of applications and instrumentation related to drilling and data collection. Similar to Peabody, Nabors Industries fell victim to the broader downdraft in the energy sector from prolonged weakness in commodity prices, due to anticipation of a moderately lower growth in demand for domestic and international rigs. We ended up selling Nabors Industries, but eventually re-established a modest-sized position, given its quality management team and strong balance sheet. We also believe the company will be opportunistic acquirers and increase its broad product portfolio.
Nuveen Small Cap Value Fund
How did the Fund perform during the twelve-month reporting period ended October 31, 2015?
The tables in the Fund Performance and Expense Ratios section of this report provide total returns for the Fund for the one-year, five-year and ten-year periods ended October 31, 2015. Comparative performance information is provided for the Fund’s Class A Shares at net asset value (NAV). The Fund’s Class A Shares at NAV outperformed both the Russell 2000® Value Index and the Lipper Small-Cap Value Funds Classification Average during the twelve-month reporting period.
What strategies were used to manage the Fund during the reporting period and how did these strategies influence performance?
The Fund seeks to provide long-term capital appreciation by investing primarily in the common stocks of companies with market capitalizations of $176.7 million to $4.3 billion at the time of purchase. During the reporting period, we continued to focus on building a well-diversified portfolio of small-cap stocks from companies with strengthening balance sheets and free cash flow characteristics. We also continued to target companies with sound business models and strong competitive advantages that we believe can gain market share opportunistically in the current environment. We remained committed to our approach of investing in quality companies that are trading at a discount to both intrinsic and relative value metrics.
In the midst of volatile conditions for small-cap stocks and the broader markets, particularly in the final three months of the reporting period, the Fund was able to significantly outperform both its Russell benchmark and Lipper peer. Our bottom-up investment process was the primary driver of results, with the Fund benefiting from superior stock selection, particularly in the financial, energy and consumer discretionary sectors. A modest underweight position in the energy sector, which was down 46% in the index, was also helpful. The Fund outperformed in nine of the ten Russell benchmark sectors.
In the financial sector, strength was broad based as a result of industry weightings and individual security selection. Regarding industry weights, the Fund benefited from an overweight position in commercial banks and an underweight in real estate investment trusts (REITs). These weights were in place due to our outlook for an improving domestic economy and the potential for an increase in the federal funds rate by the Fed. In terms of individual holdings, a position in West Coast regional bank Western Alliance Bancorporation benefited the Fund. The company posted good quarterly results marked by strong profitability, solid loan and deposit growth, and improving credit quality. Western Alliance is also in the process of an attractive synergistic merger that will lift its commercial lending pipeline in the attractive technology and health care verticals. Also, regional bank Customers Bancorp Inc., which is focused in the Pennsylvania, New York and New Jersey markets, was one of the Fund’s top performers in financials. The bank produced strong earnings growth due to stronger-than-expected net interest margins and an improved outlook for lending and mobile banking opportunities. The Fund also benefited from a position in CubeSmart, a self-storage REIT with more than 425 properties throughout the United States. The firm continues to improve its client database and financial profile via higher net operating income growth and occupancy traction. Finally, a position in Associated Estates Realty Corporation, a multifamily property REIT, boosted the Fund’s results after the company was acquired by Brookfield Asset Management at a substantial premium in an all-cash deal.
The Fund’s energy sector exposure significantly outpaced the benchmark even with the substantial volatility in the underlying commodity. Exploration and production focused Callon Petroleum Company was our top performing stock in the energy sector
Portfolio Managers’ Comments (continued)
during this reporting period and one of the few stocks in the sector to turn in strongly positive returns. With operations located primarily in the sweet spot of the Permian Basin, the company guided toward double-digit production and cash flow growth, while cutting discretionary capital spending by a much greater amount. During the reporting period, Callon Petroleum was able to shore up its balance sheet capacity with a successful secondary equity offering, allowing for potential reserve additions and cash flow growth in 2016 and beyond. We added to the Fund’s position during the company’s secondary offering.
As concerns surrounding global growth intensified, two of our more domestically-leveraged names in the consumer discretionary space were positive contributors. Shares of pizza chain operator and franchisor Papa Murphy’s Holdings Inc. rose significantly after the company produced strong comparable store sales results across the franchise. Although Papa Murphy’s expects results to continue to improve based on increased store openings and an online ordering rollout, we sold our position after shares hit our price target. Shares of home décor and accessories retailer Kirkland’s Inc. also advanced strongly during the reporting period. The company continued to improve margins through its e-commerce build-out and store floorplan enhancements. We remain holders of Kirkland’s given its attractive valuation, strong balance sheet and management’s continued execution of its operating margin expansion plan.
In the industrials sector, shares of executive search company Korn/Ferry International surged back in 2015 after coming under significant pressure toward the end of 2014 due to concerns about the company’s European exposure and foreign currency headwinds. After the stock traded down, we added to the Fund’s Korn/Ferry exposure because we believed the market’s reaction was overblown. Subsequently, the stock rose throughout the remainder of the reporting period, driven by the company’s favorable quarterly results. Although we continue to be constructive on business fundamentals for Korn/Ferry, we trimmed this position based on valuation. Also, a position in Quality Distribution Inc., an “asset-light” bulk liquids trucking company was a standout for the Fund. We bought this stock in February 2015 at a significant discount when we believed the market was overly punishing the company for some small energy exposure, while its core business was doing well and showed potential for acceleration. We believed there was upside to both earnings estimates and multiple expansion with operational execution. In early May, Quality Distribution announced a definitive agreement to be acquired by Apax Partners for a significant premium.
The Fund also had standouts in several other sectors. In the health care sector, it benefited from a position in AMN Healthcare Services Inc., a service company that does temporary staffing primarily for hospitals. The company posted its fourth quarter in a row of an earnings beat and raise, while business fundamentals continued to be very strong. Also, behavioral health services company Civitas Solutions Inc., which came public in 2014, was an outperformer for the Fund. In the second quarter of 2015, the company reported a slight beat in terms of both topline and earnings. Civitas Solutions has shown solid execution with a tuck-in acquisition coming in better than expected. In addition, the company exited some businesses that had less attractive margins, which led to margin improvement. The stock would have performed even better had it not been for an overnight secondary offering that caused a sell-off at the end of September. In the materials sector, our position in diversified U.S. building materials and products supplier Headwaters Inc. outperformed because the company continued to deliver solid organic top-line results and margin expansion. Headwaters’ big growth driver is demand for its fly ash product, a by-product from burning coal that can be used instead of cement for construction projects. With the shortage in the supply of cement along with dramatic price increases, fly ash is increasingly being used as a substitute. Headwaters also benefited from refinancing its debt and significantly bringing down interest expenses. We continue to hold our position based on ongoing strength in fly ash as well as the company’s improved balance sheet, which should allow for additional small tuck-in acquisitions that have historically proven accretive. In telecommunications services, Premiere Global Services Inc., a provider of audio and video conferencing and collaboration services to primarily larger enterprises on a global scale, announced that it was being acquired by a private equity firm at a significant premium. The company has continued to demonstrate strong growth from its SaaS (software-as-a-service) based video conferencing and collaboration tools, while improving the overall margin profile of the entire business.
Detractors were few and far between during this reporting period. However, the industrial sector was home to several laggards, including Tutor Perini Corporation, a leading non-residential construction firm. The company’s second-quarter earnings plunged due to the loss of a large concrete project and delays in a large viaduct project, further reinforcing concerns about the company’s declining backlog. We continue to like and own Tutor Perini, but are closely monitoring the underlying fundamental conditions. We still believe Tutor Perini is undervalued relative to its potential earnings power, if the company can convert a portion of its project opportunity set to backlog. The Fund also experienced weak results from a position in NN Inc., a precision metal bearing and component
supplier to original equipment manufacturers. The company’s primary exposure is in the automobile market, although it is currently in the process of diversifying into medical and industrial applications. NN’s second-quarter report came in slightly below expectations on revenue, but beat handily on earnings per share with no change in guidance. However, negative sentiment related to the Volkswagen emissions scandal and Chinese growth concerns have weighed on the auto sector broadly. We maintained our positive bias toward NN because its recent acquisition further diversifies the company’s business away from autos and toward the higher-margin industrial and medical areas. Additionally, a position in Neff Corporation, an equipment rental company focused on the U.S. Sunbelt region, detracted during the period. The company reported revenues and earnings per share that came in light of expectations, while lowering full-year guidance. The disappointing results were primarily the result of excessive rain in the second quarter and lingering effects from Neff’s transition away from energy exposure. We have maintained the Fund’s position based on our belief that weather was a transient factor, while fundamentals should improve.
Elsewhere in the Fund’s portfolio, there was weakness from a position in Alphatec Holdings Inc., a spinal implant developer and manufacturer in the health care sector. The company reported revenue and earnings per share that were below expectations, while also lowering forward-looking top-line and earnings guidance. The lowered top-line guidance was the result of missed execution in expanding its U.S. sales force, while the lower earnings guidance was a combination of foreign currency impact, U.S. volume declines because of the sales force issue and product mix. In light of these headwinds, we exited our Alphatec position. In the consumer discretionary sector, a position in Deckers Outdoor Corporation lagged the group. The company is a leading designer and wholesaler of a number of footwear brands including UGG, which represent the majority of its revenues, and Teva sandals. Its shares underperformed after the company reported a sales miss, while also lowering next-quarter and full-year earnings-per-share guidance to below consensus. We believed some of the pressure on Deckers Outdoor was due to the strong dollar and milder weather in Europe; therefore, we maintained the Fund’s position because of potential offsets, which include expense reductions, share buybacks and price increases for its key UGG brand.
Risk Considerations
Nuveen Dividend Value Fund
Mutual fund investing involves risk; principal loss is possible. There is no guarantee the Fund’s investment objectives will be achieved. Dividends are not guaranteed. Prices of equity securities may decline significantly over short or extended periods of time. Non-U.S. investments involve risks such as currency fluctuation, political and economic instability, lack of liquidity and differing legal and accounting standards. These risks are magnified in emerging markets. These and other risk considerations, such as credit, derivatives, high yield securities, and interest rate risks, are described in detail in the Fund’s prospectus.
Nuveen Mid Cap Value Fund
Mutual fund investing involves risk; principal loss is possible. There is no guarantee the Fund’s investment objectives will be achieved. Prices of equity securities may decline significantly over short or extended periods of time. Investments in mid-cap companies are subject to greater volatility than those of larger companies, but may be less volatile than investments in smaller companies. Non-U.S. investments involve risks such as currency fluctuation, political and economic instability, lack of liquidity and differing legal and accounting standards. These risks are magnified in emerging markets. These and other risk considerations, such as derivatives risk, are described in detail in the Fund’s prospectus.
Nuveen Small Cap Value Fund
Mutual fund investing involves risk; principal loss is possible. There is no guarantee the Fund’s investment objectives will be achieved. Prices of equity securities may decline significantly over short or extended periods of time. Investments in smaller companies are subject to greater volatility than those of larger companies. Non-U.S. investments involve risks such as currency fluctuation, political and economic instability, lack of liquidity and differing legal and accounting standards. These risks are magnified in emerging markets. These and other risk considerations, such as derivatives risk, are described in detail in the Fund’s prospectus.
Fund Performance
and Expense Ratios
The Fund Performance and Expense Ratios for each Fund are shown within this section of the report.
Returns quoted represent past performance, which is no guarantee of future results. Current performance may be higher or lower than the performance shown. Investment returns and principal value will fluctuate so that when shares are redeemed, they may be worth more or less than their original cost. Returns without sales charges would be lower if the sales charge were included. Returns do not reflect the deduction of taxes that a shareholder would pay on Fund distributions or the redemption of Fund shares.
Returns may reflect fee waivers/expense reimbursements by the investment adviser during the periods presented. If any such waivers and/or reimbursements had not been in place, returns would have been reduced. See Notes to Financial Statements, Note 7—Management Fees and Other Transactions with Affiliates for more information. For the most recent month-end performance visit www.nuveen.com or call (800) 257-8787.
Returns reflect differences in sales charges and expenses, which are primarily differences in distribution and service fees, and assume reinvestment of dividends and capital gains.
Comparative index and Lipper return information is provided for Class A Shares at net asset value (NAV) only.
The expense ratios shown reflect total operating expenses (before fee waivers and/or expense reimbursements, if any) as shown in the most recent prospectus. The expense ratios include management fees and other fees and expenses.
Fund Performance and Expense Ratios (continued)
Nuveen Dividend Value Fund
Refer to the first page of this Fund Performance and Expense Ratios section for further explanation of the information included within this section. Refer to the Glossary of Terms Used in this Report for definitions of terms used within this section.
Fund Performance
Average Annual Total Returns as of October 31, 2015
| | | | | | | | | | | | |
| | | Average Annual | |
| | | 1-Year | | | 5-Year | | | 10-Year | |
Class A Shares at NAV | | | (0.87)% | | | | 11.46% | | | | 7.57% | |
Class A Shares at maximum Offering Price | | | (6.55)% | | | | 10.14% | | | | 6.94% | |
Russell 1000® Value Index | | | 0.53% | | | | 13.26% | | | | 6.75% | |
S&P 500® Index | | | 5.20% | | | | 14.33% | | | | 7.85% | |
Lipper Equity Income Funds Classification Average | | | 0.08% | | | | 10.95% | | | | 6.82% | |
| | | |
Class C Shares | | | (1.59)% | | | | 10.63% | | | | 6.77% | |
Class R3 Shares | | | (1.12)% | | | | 11.18% | | | | 7.30% | |
Class I Shares | | | (0.64)% | | | | 11.74% | | | | 7.84% | |
| | | | | | | | |
| | | Average Annual | |
| | | 1-Year | | | Since
Inception | |
Class R6 Shares | | | (0.51)% | | | | 10.69% | |
Average Annual Total Returns as of September 30, 2015 (Most Recent Calendar Quarter)
| | | | | | | | | | | | |
| | | Average Annual | |
| | | 1-Year | | | 5-Year | | | 10-Year | |
Class A Shares at NAV | | | (6.80)% | | | | 10.50% | | | | 6.60% | |
Class A Shares at maximum Offering Price | | | (12.16)% | | | | 9.21% | | | | 5.96% | |
Class C Shares | | | (7.49)% | | | | 9.68% | | | | 5.80% | |
Class R3 Shares | | | (7.05)% | | | | 10.23% | | | | 6.32% | |
Class I Shares | | | (6.54)% | | | | 10.80% | | | | 6.86% | |
| | | | | | | | |
| | | Average Annual | |
| | | 1-Year | | | Since
Inception | |
Class R6 Shares | | | (6.41)% | | | | 7.84% | |
Since inception returns for Class R6 Shares are from 2/28/13. Indexes and Lipper averages are not available for direct investment.
Class A Shares have a maximum 5.75% sales charge (Offering Price). Class A Share purchases of $1 million or more are sold at net asset value without an up-front sales charge but may be subject to a contingent deferred sales charge (CDSC), also known as a back-end sales charge, if redeemed within twelve months of purchase. Class C Shares have a 1% CDSC for redemptions within less than twelve months, which is not reflected in the one-year total return. Class R3 Shares have no sales charge and are only available for purchase by eligible retirement plans. Class R6 Shares have no sales charge and are available only to certain limited categories of investors as described in the prospectus. Class I Shares have no sales charge and may be purchased under limited circumstances or by specified classes of investors.
Expense Ratios as of Most Recent Prospectus
| | | | | | | | | | | | | | | | | | | | |
| | | Share Class | |
| | | Class A | | | Class C | | | Class R3 | | | Class R6 | | | Class I | |
Expense Ratios | | | 1.15% | | | | 1.90% | | | | 1.40% | | | | 0.81% | | | | 0.90% | |
Growth of an Assumed $10,000 Investment as of October 31, 2015 – Class A Shares
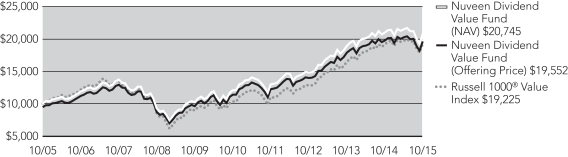
The graphs do not reflect the deduction of taxes that a shareholder may pay on Fund distributions or the redemption of Fund shares.
Fund Performance and Expense Ratios (continued)
Nuveen Mid Cap Value Fund
Refer to the first page of this Fund Performance and Expense Ratios section for further explanation of the information included within this section. Refer to the Glossary of Terms Used in this Report for definitions of terms used within this section.
Fund Performance
Average Annual Total Returns as of October 31, 2015
| | | | | | | | | | | | |
| | | Average Annual | |
| | | 1-Year | | | 5-Year | | | 10-Year | |
Class A Shares at NAV | | | 0.89% | | | | 10.66% | | | | 6.64% | |
Class A Shares at maximum Offering Price | | | (4.92)% | | | | 9.36% | | | | 6.01% | |
Russell Midcap® Value Index | | | 0.47% | | | | 13.64% | | | | 8.39% | |
Lipper Mid-Cap Value Funds Classification Average | | | 0.85% | | | | 12.26% | | | | 7.40% | |
| | | |
Class C Shares | | | 0.15% | | | | 9.84% | | | | 5.84% | |
Class R3 Shares | | | 0.65% | | | | 10.39% | | | | 6.37% | |
Class I Shares | | | 1.12% | | | | 10.92% | | | | 6.90% | |
Average Annual Total Returns as of September 30, 2015 (Most Recent Calendar Quarter)
| | | | | | | | | | | | |
| | | Average Annual | |
| | | 1-Year | | | 5-Year | | | 10-Year | |
Class A Shares at NAV | | | (3.17)% | | | | 9.90% | | | | 5.52% | |
Class A Shares at maximum Offering Price | | | (8.72)% | | | | 8.60% | | | | 4.90% | |
Class C Shares | | | (3.90)% | | | | 9.08% | | | | 4.74% | |
Class R3 Shares | | | (3.39)% | | | | 9.63% | | | | 5.27% | |
Class I Shares | | | (2.92)% | | | | 10.17% | | | | 5.78% | |
Indexes and Lipper averages are not available for direct investment.
Class A Shares have a maximum 5.75% sales charge (Offering Price). Class A Share purchases of $1 million or more are sold at net asset value without an up-front sales charge but may be subject to a contingent deferred sales charge (CDSC), also known as a back-end sales charge, if redeemed within twelve months of purchase. Class C Shares have a 1% CDSC for redemptions within less than twelve months, which is not reflected in the one-year total return. Class R3 Shares have no sales charge and are only available for purchase by eligible retirement plans. Class I Shares have no sales charge and may be purchased under limited circumstances or by specified classes of investors.
Expense Ratios as of Most Recent Prospectus
| | | | | | | | | | | | | | | | |
| | | Share Class | |
| | | Class A | | | Class C | | | Class R3 | | | Class I | |
Gross Expense Ratios | | | 1.42% | | | | 2.17% | | | | 1.67% | | | | 1.17% | |
Net Expense Ratios | | | 1.30% | | | | 2.05% | | | | 1.55% | | | | 1.05% | |
The Fund’s investment adviser has contractually agreed to waive fees and/or reimburse other Fund expenses through September 30, 2016, so that total annual Fund operating expenses (excluding 12b-1 distribution and/or service fees, interest expenses, taxes, acquired fund fees and expenses, fees incurred in acquiring and disposing of portfolio securities and extraordinary expenses) do not exceed 1.05% of the average daily net assets of any class of Fund shares. Fee waivers and/or expense reimbursements will not be terminated prior to that time without the approval of the Fund’s Board of Directors.
Growth of an Assumed $10,000 Investment as of October 31, 2015 – Class A Shares
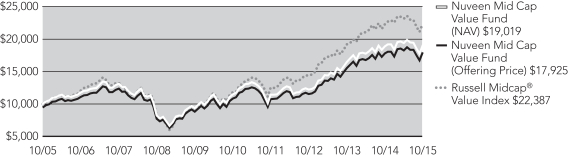
The graphs do not reflect the deduction of taxes that a shareholder may pay on Fund distributions or the redemption of Fund shares.
Fund Performance and Expense Ratios (continued)
Nuveen Small Cap Value Fund
Refer to the first page of this Fund Performance and Expense Ratios section for further explanation of the information included within this section. Refer to the Glossary of Terms Used in this Report for definitions of terms used within this section.
Fund Performance
Average Annual Total Returns as of October 31, 2015
| | | | | | | | | | | | |
| | | Average Annual | |
| | | 1-Year | | | 5-Year | | | 10-Year | |
Class A Shares at NAV | | | 7.95% | | | | 14.48% | | | | 8.02% | |
Class A Shares at maximum Offering Price | | | 1.75% | | | | 13.12% | | | | 7.38% | |
Russell 2000® Value Index | | | (2.88)% | | | | 10.53% | | | | 6.19% | |
Lipper Small-Cap Value Funds Classification Average | | | (1.86)% | | | | 10.71% | | | | 6.91% | |
| | | |
Class C Shares | | | 7.10% | | | | 13.63% | | | | 7.22% | |
Class R3 Shares | | | 7.62% | | | | 14.19% | | | | 7.76% | |
Class I Shares | | | 8.22% | | | | 14.76% | | | | 8.28% | |
Average Annual Total Returns as of September 30, 2015 (Most Recent Calendar Quarter)
| | | | | | | | | | | | |
| | | Average Annual | |
| | | 1-Year | | | 5-Year | | | 10-Year | |
Class A Shares at NAV | | | 6.88% | | | | 14.46% | | | | 7.06% | |
Class A Shares at maximum Offering Price | | | 0.75% | | | | 13.11% | | | | 6.43% | |
Class C Shares | | | 6.04% | | | | 13.60% | | | | 6.26% | |
Class R3 Shares | | | 6.63% | | | | 14.17% | | | | 6.80% | |
Class I Shares | | | 7.14% | | | | 14.73% | | | | 7.32% | |
Indexes and Lipper averages are not available for direct investment.
Class A Shares have a maximum 5.75% sales charge (Offering Price). Class A Share purchases of $1 million or more are sold at net asset value without an up-front sales charge but may be subject to a contingent deferred sales charge (CDSC), also known as a back-end sales charge, if redeemed within twelve months of purchase. Class C Shares have a 1% CDSC for redemptions within less than twelve months, which is not reflected in the one-year total return. Class R3 Shares have no sales charge and are only available for purchase by eligible retirement plans. Class I Shares have no sales charge and may be purchased under limited circumstances or by specified classes of investors.
Expense Ratios as of Most Recent Prospectus
| | | | | | | | | | | | | | | | |
| | | Share Class | |
| | | Class A | | | Class C | | | Class R3 | | | Class I | |
Gross Expense Ratios | | | 1.56% | | | | 2.30% | | | | 1.81% | | | | 1.31% | |
Net Expense Ratios | | | 1.48% | | | | 2.23% | | | | 1.73% | | | | 1.23% | |
The Fund’s investment adviser has contractually agreed to waive fees and/or reimburse other Fund expenses through September 30, 2016, so that total annual Fund operating expenses (excluding 12b-1 distribution and/or service fees, interest expenses, taxes, acquired fund fees and expenses, fees incurred in acquiring and disposing of portfolio securities and extraordinary expenses) do not exceed 1.15% of the average daily net assets of any class of Fund shares. Fee waivers and/or expense reimbursements will not be terminated prior to that time without the approval of the Fund’s Board of Directors.
Growth of an Assumed $10,000 Investment as of October 31, 2015 – Class A Shares
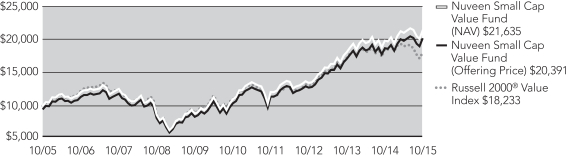
The graphs do not reflect the deduction of taxes that a shareholder may pay on Fund distributions or the redemption of Fund shares.
Holding
Summaries as of October 31, 2015
This data relates to the securities held in each Fund’s portfolio of investments as of the end of this reporting period. It should not be construed as a measure of performance for the Fund itself. Holdings are subject to change.
Nuveen Dividend Value Fund
Fund Allocation
(% of net assets)
| | | | |
Common Stocks | | | 99.8% | |
Investments Purchased with Collateral from Securities Lending | | | 14.8% | |
Money Market Funds | | | 0.6% | |
Other Assets Less Liabilities | | | (15.2)% | |
Net Assets | | | 100% | |
Portfolio Composition
(% of net assets)
| | | | |
Oil, Gas & Consumable Fuels | | | 11.8% | |
Banks | | | 11.6% | |
Pharmaceuticals | | | 9.7% | |
Insurance | | | 5.5% | |
Software | | | 4.3% | |
Chemicals | | | 3.7% | |
Real Estate Investment Trust | | | 3.7% | |
Aerospace & Defense | | | 3.3% | |
Industrial Conglomerates | | | 3.3% | |
Health Care Equipment & Supplies | | | 3.1% | |
Leisure Products | | | 3.1% | |
Health Care Providers & Services | | | 2.9% | |
Semiconductors & Semiconductor Equipment | | | 2.8% | |
Technology, Hardware, Storage & Peripherals | | | 2.5% | |
Diversified Telecommunication Services | | | 2.5% | |
Specialty Retail | | | 2.5% | |
Hotels, Restaurants & Leisure | | | 2.5% | |
Tobacco | | | 2.4% | |
Other | | | 18.6% | |
Investments Purchased with Collateral from Securities Lending | | | 14.8% | |
Money Market Funds | | | 0.6% | |
Other Assets Less Liabilities | | | (15.2)% | |
Net Assets | | | 100% | |
Top Five Common Stock Holdings
(% of net assets)
| | | | |
Pfizer Inc. | | | 3.8% | |
General Electric Company | | | 3.3% | |
Microsoft Corporation | | | 3.2% | |
Bank of America Corporation | | | 3.2% | |
Chevron Corporation | | | 2.8% | |
Nuveen Mid Cap Value Fund
Fund Allocation
(% of net assets)
| | | | |
Common Stocks | | | 99.0% | |
Investments Purchased with Collateral from Securities Lending | | | 30.9% | |
Money Market Funds | | | 0.8% | |
Other Assets Less Liabilities | | | (30.7)% | |
Net Assets | | | 100% | |
Portfolio Composition
(% of net assets)
| | | | |
Real Estate Investment Trust | | | 8.6% | |
Multi-Utilities | | | 7.7% | |
Oil, Gas & Consumable Fuels | | | 7.2% | |
Insurance | | | 6.5% | |
Capital Markets | | | 6.4% | |
Specialty Retail | | | 5.9% | |
Health Care Equipment & Supplies | | | 5.2% | |
Banks | | | 5.1% | |
Software | | | 4.8% | |
Hotels, Restaurants & Leisure | | | 4.4% | |
Health Care Providers & Services | | | 4.1% | |
Semiconductors & Semiconductor Equipment | | | 2.8% | |
Consumer Finance | | | 2.5% | |
Food Products | | | 2.5% | |
Leisure Products | | | 2.4% | |
Containers & Packaging | | | 2.3% | |
Aerospace & Defense | | | 2.2% | |
Other | | | 18.4% | |
Investments Purchased with Collateral from Securities Lending | | | 30.9% | |
Money Market Funds | | | 0.8% | |
Other Assets Less Liabilities | | | (30.7)% | |
Net Assets | | | 100% | |
Top Five Common Stock Holdings (% of net assets)
| | | | |
Hartford Financial Services Group, Inc. | | | 2.9% | |
Royal Caribbean Cruises Limited | | | 2.6% | |
Tyson Foods, Inc., Class A | | | 2.5% | |
E*Trade Group Inc. | | | 2.4% | |
Unum Group | | | 2.3% | |
Holding Summaries as of October 31, 2015 (continued)
Nuveen Small Cap Value Fund
Fund Allocation
(% of net assets)
| | | | |
Common Stocks | | | 96.3% | |
Investments Purchased with Collateral from Securities Lending | | | 21.1% | |
Money Market Funds | | | 5.6% | |
Other Assets Less Liabilities | | | (23.0)% | |
Net Assets | | | 100% | |
Portfolio Composition
(% of net assets)
| | | | |
Banks | | | 15.6% | |
Real Estate Investment Trust | | | 11.4% | |
Insurance | | | 7.2% | |
Electric Utilities | | | 4.1% | |
Specialty Retail | | | 3.4% | |
Oil, Gas & Consumable Fuels | | | 3.2% | |
Commercial Services & Supplies | | | 3.1% | |
Health Care Providers & Services | | | 3.0% | |
Electronic Equipment, Instruments & Components | | | 2.9% | |
Semiconductors & Semiconductor Equipment | | | 2.8% | |
Communications Equipment | | | 2.7% | |
Construction & Engineering | | | 2.6% | |
IT Services | | | 2.3% | |
Software | | | 2.2% | |
Health Care Equipment & Supplies | | | 2.2% | |
Machinery | | | 2.2% | |
Thrifts & Mortgage Finance | | | 2.2% | |
Household Durables | | | 2.2% | |
Professional Services | | | 2.1% | |
Other | | | 18.9% | |
Investments Purchased with Collateral from Securities Lending | | | 21.1% | |
Money Market Funds | | | 5.6% | |
Other Assets Less Liabilities | | | (23.0)% | |
Net Assets | | | 100% | |
Top Five Common Stock Holdings
(% of net assets)
| | | | |
MFA Mortgage Investments, Inc. | | | 2.2% | |
Laclede Group Inc. | | | 1.8% | |
Webster Financial Corporation | | | 1.8% | |
Renasant Corporation | | | 1.8% | |
CNO Financial Group Inc. | | | 1.8% | |
Expense
Examples
As a shareholder of one or more of the Funds, you incur two types of costs: (1) transaction costs, including up-front and back-end sales charges (loads) or redemption fees, where applicable; and (2) ongoing costs, including management fees; distribution and service (12b-1) fees, where applicable; and other Fund expenses. The Examples below are intended to help you understand your ongoing costs (in dollars) of investing in the Funds and to compare these costs with the ongoing costs of investing in other mutual funds.
The Examples below are based on an investment of $1,000 invested at the beginning of the period and held through the period ended October 31, 2015.
The beginning of the period is May 1, 2015.
The information under “Actual Performance,” together with the amount you invested, allows you to estimate actual expenses incurred over the reporting period. Simply divide your account value by $1,000 (for example, an $8,600 account value divided by $1,000 = 8.60) and multiply the result by the cost shown for your share class, in the row entitled “Expenses Incurred During Period” to estimate the expenses incurred on your account during this period.
The information under “Hypothetical Performance,” provides information about hypothetical account values and hypothetical expenses based on each Fund’s actual expense ratio and an assumed rate of return of 5% per year before expenses, which is not the Fund’s actual return. The hypothetical account values and expenses may not be used to estimate the actual ending account balance or expense you incurred for the period. You may use this information to compare the ongoing costs of investing in the Fund and other funds. To do so, compare this 5% hypothetical example with the 5% hypothetical examples that appear in the shareholder reports of the other funds.
Please note that the expenses shown in the following tables are meant to highlight your ongoing costs only and do not reflect any transaction costs. Therefore, the hypothetical information is useful in comparing ongoing costs only, and will not help you determine the relative total costs of owning different funds or share classes. In addition, if these transaction costs were included, your costs would have been higher.
Nuveen Dividend Value Fund
| | | | | | | | | | | | | | | | | | | | |
| | | Share Class | |
| | | Class A | | | Class C | | | Class R3 | | | Class R6 | | | Class I | |
Actual Performance | | | | | | | | | | | | | | | | | | | | |
Beginning Account Value | | $ | 1,000.00 | | | $ | 1,000.00 | | | $ | 1,000.00 | | | $ | 1,000.00 | | | $ | 1,000.00 | |
Ending Account Value | | $ | 967.00 | | | $ | 963.80 | | | $ | 965.60 | | | $ | 968.70 | | | $ | 968.10 | |
Expenses Incurred During Period | | $ | 5.70 | | | $ | 9.40 | | | $ | 6.94 | | | $ | 4.02 | | | $ | 4.46 | |
Hypothetical Performance (5% annualized return before expenses) | | | | | | | | | | | | | | | | | | | | |
Beginning Account Value | | $ | 1,000.00 | | | $ | 1,000.00 | | | $ | 1,000.00 | | | $ | 1,000.00 | | | $ | 1,000.00 | |
Ending Account Value | | $ | 1,019.41 | | | $ | 1,015.63 | | | $ | 1,018.15 | | | $ | 1021.12 | | | $ | 1,020.67 | |
Expenses Incurred During Period | | $ | 5.85 | | | $ | 9.65 | | | $ | 7.12 | | | $ | 4.13 | | | $ | 4.58 | |
For each class of the Fund, expenses are equal to the Fund’s annualized net expense ratio of 1.15%, 1.90%, 1.40%, 0.81% and 0.90% for Classes A, C, R3, R6 and I, respectively, multiplied by the average account value over the period, multiplied by 184/365 (to reflect the one-half year period).
Expense Examples (continued)
Nuveen Mid Cap Value Fund
| | | | | | | | | | | | | | | | |
| | | Share Class | |
| | | Class A | | | Class C | | | Class R3 | | | Class I | |
Actual Performance | | | | | | | | | | | | | | | | |
Beginning Account Value | | $ | 1,000.00 | | | $ | 1,000.00 | | | $ | 1,000.00 | | | $ | 1,000.00 | |
Ending Account Value | | $ | 983.10 | | | $ | 979.50 | | | $ | 981.90 | | | $ | 984.20 | |
Expenses Incurred During Period | | $ | 6.55 | | | $ | 10.28 | | | $ | 7.79 | | | $ | 5.30 | |
Hypothetical Performance (5% annualized return before expenses) | | | | | | | | | | | | | | | | |
Beginning Account Value | | $ | 1,000.00 | | | $ | 1,000.00 | | | $ | 1,000.00 | | | $ | 1,000.00 | |
Ending Account Value | | $ | 1,018.60 | | | $ | 1,014.82 | | | $ | 1,017.34 | | | $ | 1,019.86 | |
Expenses Incurred During Period | | $ | 6.67 | | | $ | 10.46 | | | $ | 7.93 | | | $ | 5.40 | |
For each class of the Fund, expenses are equal to the Fund’s annualized net expense ratio of 1.31%, 2.06%, 1.56% and 1.06% for Classes A, C, R3 and I, respectively, multiplied by the average account value over the period, multiplied by 184/365 (to reflect the one-half year period).
Nuveen Small Cap Value Fund
| | | | | | | | | | | | | | | | |
| | | Share Class | |
| | | Class A | | | Class C | | | Class R3 | | | Class I | |
Actual Performance | | | | | | | | | | | | | | | | |
Beginning Account Value | | $ | 1,000.00 | | | $ | 1,000.00 | | | $ | 1,000.00 | | | $ | 1,000.00 | |
Ending Account Value | | $ | 1,019.40 | | | $ | 1,015.90 | | | $ | 1,017.70 | | | $ | 1,020.80 | |
Expenses Incurred During Period | | $ | 7.08 | | | $ | 10.87 | | | $ | 8.34 | | | $ | 5.81 | |
Hypothetical Performance (5% annualized return before expenses) | | | | | | | | | | | | | | | | |
Beginning Account Value | | $ | 1,000.00 | | | $ | 1,000.00 | | | $ | 1,000.00 | | | $ | 1,000.00 | |
Ending Account Value | | $ | 1,018.20 | | | $ | 1,014.42 | | | $ | 1,016.94 | | | $ | 1,019.46 | |
Expenses Incurred During Period | | $ | 7.07 | | | $ | 10.87 | | | $ | 8.34 | | | $ | 5.80 | |
For each class of the Fund, expenses are equal to the Fund’s annualized net expense ratio of 1.39%, 2.14%, 1.64% and 1.14% for Classes A, C, R3 and I, respectively, multiplied by the average account value over the period, multiplied by 184/365 (to reflect the one-half year period).
Report of
Independent Registered Public Accounting Firm
To the Board of Directors and Shareholders of
Nuveen Investment Funds, Inc.:
In our opinion, the accompanying statements of assets and liabilities, including the portfolios of investments, and the related statements of operations and of changes in net assets and the financial highlights present fairly, in all material respects, the financial position of Nuveen Dividend Value Fund, Nuveen Mid Cap Value Fund and Nuveen Small Cap Value Fund (each a series of the Nuveen Investment Funds, Inc., hereinafter referred to as the “Funds”) at October 31, 2015, the results of each of their operations for the year then ended, the changes in each of their net assets for each of the two years in the period then ended and the financial highlights for each of the four years in the period then ended, in conformity with accounting principles generally accepted in the United States of America. These financial statements and financial highlights (hereafter referred to as “financial statements”) are the responsibility of the Funds’ management. Our responsibility is to express an opinion on these financial statements based on our audits. We conducted our audits of these financial statements in accordance with the standards of the Public Company Accounting Oversight Board (United States). Those standards require that we plan and perform the audit to obtain reasonable assurance about whether the financial statements are free of material misstatement. An audit includes examining, on a test basis, evidence supporting the amounts and disclosures in the financial statements, assessing the accounting principles used and significant estimates made by management, and evaluating the overall financial statement presentation. We believe that our audits, which included confirmation of securities at October 31, 2015 by correspondence with the custodian and brokers, provide a reasonable basis for our opinion. The financial statements of the Funds for the year ended October 31, 2011 were audited by other independent auditors whose report dated December 28, 2011 expressed an unqualified opinion on those statements.
PricewaterhouseCoopers LLP
Chicago, IL
December 28, 2015
Nuveen Dividend Value Fund
| | |
| Portfolio of Investments | | October 31, 2015 |
| | | | | | | | |
| Shares | | | Description (1) | | Value | |
| | |
| | | | LONG-TERM INVESTMENTS – 99.8% | | | | |
| | |
| | | | COMMON STOCKS – 99.8% | | | | |
| | |
| | | | Aerospace & Defense – 3.3% | | | |
| | |
| | 94,173 | | | Boeing Company | | $ | 13,944,196 | |
| | |
| | 120,690 | | | General Dynamics Corporation | | | 17,932,120 | |
| | |
| | 146,310 | | | United Technologies Corporation, (2) | | | 14,398,367 | |
| | | | Total Aerospace & Defense | | | 46,274,683 | |
| | |
| | | | Airlines – 0.6% | | | |
| | |
| | 159,850 | | | Delta Air Lines, Inc. | | | 8,126,774 | |
| | |
| | | | Banks – 11.6% | | | |
| | |
| | 2,643,105 | | | Bank of America Corporation | | | 44,351,302 | |
| | |
| | 248,430 | | | BankUnited Inc. | | | 9,236,627 | |
| | |
| | 553,799 | | | Citigroup Inc. | | | 29,445,493 | |
| | |
| | 131,531 | | | M&T Bank Corporation | | | 15,763,990 | |
| | |
| | 246,779 | | | Pacwest Bancorp., (2) | | | 11,114,926 | |
| | |
| | 192,900 | | | PNC Financial Services Group, Inc., (2) | | | 17,411,154 | |
| | |
| | 519,360 | | | SunTrust Banks, Inc. | | | 21,563,827 | |
| | |
| | 425,397 | | | Zions Bancorporation, (2) | | | 12,238,672 | |
| | | | Total Banks | | | 161,125,991 | |
| | |
| | | | Biotechnology – 1.1% | | | |
| | |
| | 255,225 | | | AbbVie Inc. | | | 15,198,649 | |
| | |
| | | | Capital Markets – 0.6% | | | |
| | |
| | 251,565 | | | Morgan Stanley | | | 8,294,098 | |
| | |
| | | | Chemicals – 3.7% | | | |
| | |
| | 327,649 | | | Dow Chemical Company | | | 16,929,624 | |
| | |
| | 107,392 | | | LyondellBasell Industries NV | | | 9,977,791 | |
| | |
| | 136,045 | | | PPG Industries, Inc. | | | 14,184,052 | |
| | |
| | 97,213 | | | Praxair, Inc., (2) | | | 10,799,392 | |
| | | | Total Chemicals | | | 51,890,859 | |
| | |
| | | | Commercial Services & Supplies – 1.0% | | | |
| | |
| | 663,716 | | | Pitney Bowes Inc., (2) | | | 13,705,735 | |
| | |
| | | | Consumer Finance – 2.0% | | | |
| | |
| | 346,963 | | | Capital One Financial Corporation | | | 27,375,381 | |
| | |
| | | | Diversified Financial Services – 1.2% | | | |
| | |
| | 170,414 | | | Moody’s Corporation, (2) | | | 16,387,010 | |
| | | | | | | | |
| Shares | | | Description (1) | | Value | |
| | |
| | | | Diversified Telecommunication Services – 2.5% | | | |
| | |
| | 363,593 | | | AT&T Inc., (2) | | $ | 12,184,001 | |
| | |
| | 2,397,322 | | | Frontier Communications Corporation, (2) | | | 12,322,235 | |
| | |
| | 232,305 | | | Verizon Communications Inc., (2) | | | 10,890,458 | |
| | | | Total Diversified Telecommunication Services | | | 35,396,694 | |
| | |
| | | | Electric Utilities – 1.9% | | | |
| | |
| | 216,519 | | | Pinnacle West Capital Corporation | | | 13,751,122 | |
| | |
| | 370,957 | | | PPL Corporation, (2) | | | 12,760,921 | |
| | | | Total Electric Utilities | | | 26,512,043 | |
| | |
| | | | Electrical Equipment – 1.2% | | | |
| | |
| | 306,924 | | | Eaton PLC | | | 17,160,121 | |
| | |
| | | | Energy Equipment & Services – 0.9% | | | |
| | |
| | 151,855 | | | Schlumberger Limited | | | 11,868,987 | |
| | |
| | | | Food & Staples Retailing – 1.3% | | | |
| | |
| | 183,371 | | | CVS Health Corporation | | | 18,113,387 | |
| | |
| | | | Food Products – 1.0% | | | |
| | |
| | 247,121 | | | General Mills, Inc., (2) | | | 14,360,201 | |
| | |
| | | | Health Care Equipment & Supplies – 3.1% | | | |
| | |
| | 408,876 | | | Abbott Laboratories | | | 18,317,645 | |
| | |
| | 343,455 | | | Medtronic, PLC | | | 25,388,194 | |
| | | | Total Health Care Equipment & Supplies | | | 43,705,839 | |
| | |
| | | | Health Care Providers & Services – 2.9% | | | |
| | |
| | 97,887 | | | CIGNA Corporation | | | 13,120,773 | |
| | |
| | 235,824 | | | UnitedHealth Group Incorporated, (2) | | | 27,775,351 | |
| | | | Total Health Care Providers & Services | | | 40,896,124 | |
| | |
| | | | Hotels, Restaurants & Leisure – 2.5% | | | |
| | |
| | 306,949 | | | Carnival Corporation | | | 16,599,802 | |
| | |
| | 349,083 | | | Six Flags Entertainment Corporation | | | 18,166,279 | |
| | | | Total Hotels, Restaurants & Leisure | | | 34,766,081 | |
| | |
| | | | Household Durables – 0.5% | | | |
| | |
| | 39,245 | | | Whirlpool Corporation | | | 6,284,694 | |
| | |
| | | | Industrial Conglomerates – 3.3% | | | |
| | |
| | 1,569,627 | | | General Electric Company | | | 45,393,613 | |
| | |
| | | | Insurance – 5.5% | | | |
| | |
| | 547,401 | | | Hartford Financial Services Group, Inc., (2) | | | 25,322,770 | |
| | |
| | 238,186 | | | Lincoln National Corporation | | | 12,745,333 | |
| | |
| | 615,855 | | | Old Republic International Corporation | | | 11,110,024 | |
| | |
| | 187,938 | | | Prudential Financial, Inc. | | | 15,504,885 | |
Nuveen Dividend Value Fund (continued)
| | |
| Portfolio of Investments | | October 31, 2015 |
| | | | | | | | |
| Shares | | | Description (1) | | Value | |
| | |
| | | | Insurance (continued) | | | |
| | |
| | 362,322 | | | Unum Group | | $ | 12,554,457 | |
| | | | Total Insurance | | | 77,237,469 | |
| | |
| | | | Leisure Products – 3.1% | | | |
| | |
| | 223,646 | | | Hasbro, Inc. | | | 17,182,722 | |
| | |
| | 452,930 | | | Mattel, Inc., (2) | | | 11,133,019 | |
| | |
| | 128,197 | | | Polaris Industries Inc., (2) | | | 14,401,651 | |
| | | | Total Leisure Products | | | 42,717,392 | |
| | |
| | | | Media – 1.1% | | | |
| | |
| | 230,745 | | | Cinemark Holdings Inc. | | | 8,177,603 | |
| | |
| | 34,367 | | | Time Warner Cable, Class A | | | 6,509,110 | |
| | | | Total Media | | | 14,686,713 | |
| | |
| | | | Multiline Retail – 0.8% | | | |
| | |
| | 179,311 | | | Nordstrom, Inc. | | | 11,692,870 | |
| | |
| | | | Multi-Utilities – 2.2% | | | |
| | |
| | 478,190 | | | CMS Energy Corporation | | | 17,248,313 | |
| | |
| | 708,807 | | | NiSource Inc. | | | 13,580,742 | |
| | | | Total Multi-Utilities | | | 30,829,055 | |
| | |
| | | | Oil, Gas & Consumable Fuels – 11.8% | | | |
| | |
| | 295,544 | | | Anadarko Petroleum Corporation, (2) | | | 19,765,983 | |
| | |
| | 422,895 | | | Chevron Corporation, (2) | | | 38,432,698 | |
| | |
| | 438,934 | | | ConocoPhillips, (2) | | | 23,417,129 | |
| | |
| | 398,027 | | | Occidental Petroleum Corporation, (2) | | | 29,668,933 | |
| | |
| | 406,981 | | | ONEOK, Inc. | | | 13,804,796 | |
| | |
| | 180,592 | | | Pioneer Natural Resources Company | | | 24,766,387 | |
| | |
| | 123,507 | | | Valero Energy Corporation | | | 8,141,581 | |
| | |
| | 197,625 | | | Williams Partners LP | | | 6,679,725 | |
| | | | Total Oil, Gas & Consumable Fuels | | | 164,677,232 | |
| | |
| | | | Personal Products – 1.2% | | | |
| | |
| | 356,742 | | | Unilever PLC | | | 16,046,255 | |
| | |
| | | | Pharmaceuticals – 9.7% | | | |
| | |
| | 172,831 | | | GlaxoSmithKline PLC, Sponsored ADR | | | 7,442,103 | |
| | |
| | 248,213 | | | Johnson & Johnson | | | 25,076,959 | |
| | |
| | 573,992 | | | Merck & Company Inc., (2) | | | 31,374,403 | |
| | |
| | 1,546,688 | | | Pfizer Inc. | | | 52,308,988 | |
| | |
| | 326,014 | | | Teva Pharmaceutical Industries Limited, Sponsored ADR | | | 19,296,769 | |
| | | | Total Pharmaceuticals | | | 135,499,222 | |
| | |
| | | | Real Estate Investment Trust – 3.7% | | | |
| | |
| | 216,584 | | | Crown Castle International Corporation | | | 18,509,269 | |
| | |
| | 314,116 | | | Lamar Advertising Company | | | 17,725,566 | |
| | | | | | | | |
| Shares | | | Description (1) | | Value | |
| | |
| | | | Real Estate Investment Trust (continued) | | | |
| | |
| | 97,627 | | | Mid-America Apartment Communities | | $ | 8,316,844 | |
| | |
| | 356,334 | | | Starwood Property Trust Inc. | | | 7,158,750 | |
| | | | Total Real Estate Investment Trust | | | 51,710,429 | |
| | |
| | | | Semiconductors & Semiconductor Equipment – 2.8% | | | |
| | |
| | 734,729 | | | Intel Corporation | | | 24,877,924 | |
| | |
| | 188,998 | | | Lam Research Corporation | | | 14,475,357 | |
| | | | Total Semiconductors & Semiconductor Equipment | | | 39,353,281 | |
| | |
| | | | Software – 4.3% | | | |
| | |
| | 547,731 | | | CA Technologies | | | 15,177,626 | |
| | |
| | 849,021 | | | Microsoft Corporation | | | 44,692,465 | |
| | | | Total Software | | | 59,870,091 | |
| | |
| | | | Specialty Retail – 2.5% | | | |
| | |
| | 388,934 | | | Best Buy Co., Inc., (2) | | | 13,624,358 | |
| | |
| | 64,238 | | | Signet Jewelers Limited | | | 9,696,084 | |
| | |
| | 891,532 | | | Staples, Inc. | | | 11,581,001 | |
| | | | Total Specialty Retail | | | 34,901,443 | |
| | |
| | | | Technology, Hardware, Storage & Peripherals – 2.5% | | | |
| | |
| | 143,108 | | | Apple, Inc. | | | 17,101,406 | |
| | |
| | 680,235 | | | HP Inc. | | | 18,339,136 | |
| | | | Total Technology, Hardware, Storage & Peripherals | | | 35,440,542 | |
| | |
| | | | Tobacco – 2.4% | | | |
| | |
| | 351,044 | | | Altria Group, Inc., (2) | | | 21,227,631 | |
| | |
| | 135,778 | | | Philip Morris International, (2) | | | 12,002,775 | |
| | | | Total Tobacco | | | 33,230,406 | |
| | | | Total Long-Term Investments (cost $1,027,812,095) | | | 1,390,729,364 | |
| | |
| Shares | | | Description (1) | | Value | |
| | |
| | | | INVESTMENTS PURCHASED WITH COLLATERAL FROM SECURITIES LENDING – 14.8% | | | | |
| | |
| | | | Money Market Funds – 14.8% | | | |
| | |
| | 206,759,602 | | | Mount Vernon Securities Lending Prime Portfolio, 0.256%, (3), (4) | | $ | 206,759,602 | |
| | | | Total Investments Purchased with Collateral from Securities Lending (cost $206,759,602) | | | 206,759,602 | |
| | |
| Shares | | | Description (1) | | Value | |
| | |
| | | | SHORT-TERM INVESTMENTS – 0.6% | | | | |
| | |
| | | | Money Market Funds – 0.6% | | | |
| | |
| | 7,948,804 | | | First American Treasury Obligations Fund, Class Z, 0.000%, (3) | | $ | 7,948,804 | |
| | | | Total Short-Term Investments (cost $7,948,804) | | | 7,948,804 | |
| | | | Total Investments (cost $1,242,520,501) – 115.2% | | | 1,605,437,770 | |
| | | | Other Assets Less Liabilities – (15.2)% | | | (212,285,184 | ) |
| | | | Net Assets – 100% | | $ | 1,393,152,586 | |
Nuveen Dividend Value Fund (continued)
| | |
| Portfolio of Investments | | October 31, 2015 |
For Fund portfolio compliance purposes, the Fund’s industry classifications refer to any one or more of the industry sub-classifications used by one or more widely recognized market indexes or ratings group indexes, and/or as defined by Fund management. This definition may not apply for purposes of this report which may combine industry sub-classifications into sectors for reporting ease.
| (1) | All percentages shown in the Portfolio of Investments are based on net assets. |
| (2) | Investment, or a portion of investment, is out on loan for securities lending. The total value of the securities out on loan as of the end of the reporting period was $198,557,778. |
| (3) | The rate shown is the annualized seven-day effective yield as of the end of the reporting period. |
| (4) | The Fund may loan securities representing up to one third of the fair value of its total assets (which includes collateral for securities on loan) to broker dealers, banks, and other institutions. The Fund maintains collateral equal to at least 100% of the fair value of the securities loaned. The cash collateral received by the Fund is invested in this money market fund. See Notes to Financial Statements, Note 3 – Portfolio Securities and Investments in Derivatives, Securities Lending for more information. |
| ADR | American Depositary Receipt |
See accompanying notes to financial statements.
Nuveen Mid Cap Value Fund
| | |
| Portfolio of Investments | | October 31, 2015 |
| | | | | | | | |
| Shares | | | Description (1) | | Value | |
| | |
| | | | LONG-TERM INVESTMENTS – 99.0% | | | | |
| | |
| | | | COMON STOCKS – 99.0% | | | | |
| | |
| | | | Aerospace & Defense – 2.2% | | | |
| | |
| | 9,370 | | | Huntington Ingalls Industries Inc. | | $ | 1,123,838 | |
| | |
| | 12,014 | | | L-3 Communications Holdings, Inc. | | | 1,518,570 | |
| | | | Total Aerospace & Defense | | | 2,642,408 | |
| | |
| | | | Banks – 5.1% | | | |
| | |
| | 55,599 | | | East West Bancorp Inc. | | | 2,245,644 | |
| | |
| | 65,895 | | | Western Alliance Bancorporation, (2) | | | 2,355,746 | |
| | |
| | 50,128 | | | Zions Bancorporation, (3) | | | 1,442,183 | |
| | | | Total Banks | | | 6,043,573 | |
| | |
| | | | Capital Markets – 6.4% | | | |
| | |
| | 99,486 | | | E*Trade Group Inc., (2), (3) | | | 2,836,346 | |
| | |
| | 73,953 | | | Invesco LTD | | | 2,453,021 | |
| | |
| | 40,685 | | | Raymond James Financial Inc. | | | 2,242,150 | |
| | | | Total Capital Markets | | | 7,531,517 | |
| | |
| | | | Chemicals – 2.1% | | | |
| | |
| | 23,023 | | | Albemarle Corporation | | | 1,232,191 | |
| | |
| | 18,148 | | | Eastman Chemical Company | | | 1,309,741 | |
| | | | Total Chemicals | | | 2,541,932 | |
| | |
| | | | Consumer Finance – 2.5% | | | |
| | |
| | 26,068 | | | Discover Financial Services | | | 1,465,543 | |
| | |
| | 213,339 | | | SLM Corporation | | | 1,506,173 | |
| | | | Total Consumer Finance | | | 2,971,716 | |
| | |
| | | | Containers & Packaging – 2.3% | | | |
| | |
| | 21,236 | | | Crown Holdings Inc., (2) | | | 1,126,357 | |
| | |
| | 29,533 | | | WestRock Company, (3) | | | 1,587,694 | |
| | | | Total Containers & Packaging | | | 2,714,051 | |
| | |
| | | | Diversified Telecommunication Services – 1.0% | | | |
| | |
| | 231,263 | | | Frontier Communications Corporation, (3) | | | 1,188,692 | |
| | |
| | | | Electrical Equipment – 1.2% | | | |
| | |
| | 14,111 | | | Hubbell Incorporated, Class B, (3) | | | 1,366,650 | |
| | |
| | | | Energy Equipment & Services – 1.5% | | | |
| | |
| | 16,570 | | | Cooper Cameron Corporation, (2), (3) | | | 1,126,926 | |
| | |
| | 66,542 | | | Nabors Industries Inc. | | | 668,082 | |
| | | | Total Energy Equipment & Services | | | 1,795,008 | |
Nuveen Mid Cap Value Fund (continued)
| | |
| Portfolio of Investments | | October 31, 2015 |
| | | | | | | | |
| Shares | | | Description (1) | | Value | |
| | |
| | | | Food Products – 2.5% | | | |
| | |
| | 66,891 | | | Tyson Foods, Inc., Class A, (3) | | $ | 2,967,285 | |
| | |
| | | | Health Care Equipment & Supplies – 5.2% | | | |
| | |
| | 123,250 | | | Boston Scientific Corporation, (2), (3) | | | 2,253,010 | |
| | |
| | 24,609 | | | Hill Rom Holdings Inc. | | | 1,296,648 | |
| | |
| | 10,444 | | | Teleflex Inc., (3) | | | 1,389,052 | |
| | |
| | 11,974 | | | Zimmer Holdings, Inc., (3) | | | 1,252,121 | |
| | | | Total Health Care Equipment & Supplies | | | 6,190,831 | |
| | |
| | | | Health Care Providers & Services – 4.1% | | | |
| | |
| | 23,534 | | | Centene Corporation, (2), (3) | | | 1,399,802 | |
| | |
| | 17,305 | | | CIGNA Corporation, (3) | | | 2,319,562 | |
| | |
| | 6,625 | | | Humana Inc. | | | 1,183,424 | |
| | | | Total Health Care Providers & Services | | | 4,902,788 | |
| | |
| | | | Hotels, Restaurants & Leisure – 4.4% | | | |
| | |
| | 94,744 | | | MGM Resorts International Inc., (2) | | | 2,197,113 | |
| | |
| | 30,901 | | | Royal Caribbean Cruises Limited, (3) | | | 3,039,113 | |
| | | | Total Hotels, Restaurants & Leisure | | | 5,236,226 | |
| | |
| | | | Household Durables – 1.5% | | | |
| | |
| | 9,324 | | | Mohawk Industries Inc., (2) | | | 1,822,842 | |
| | |
| | | | Industrial Conglomerates – 1.1% | | | |
| | |
| | 14,373 | | | Carlisle Companies Inc. | | | 1,250,451 | |
| | |
| | | | Insurance – 6.5% | | | |
| | |
| | 74,677 | | | Hartford Financial Services Group, Inc., (3) | | | 3,454,559 | |
| | |
| | 85,895 | | | Old Republic International Corporation | | | 1,549,546 | |
| | |
| | 78,532 | | | Unum Group, (3) | | | 2,721,134 | |
| | | | Total Insurance | | | 7,725,239 | |
| | |
| | | | IT Services – 1.5% | | | |
| | |
| | 24,575 | | | Fidelity National Information Services | | | 1,792,009 | |
| | |
| | | | Leisure Products – 2.4% | | | |
| | |
| | 29,778 | | | Brunswick Corporation | | | 1,602,354 | |
| | |
| | 16,080 | | | Hasbro, Inc., (3) | | | 1,235,426 | |
| | | | Total Leisure Products | | | 2,837,780 | |
| | |
| | | | Life Sciences Tools & Services – 0.5% | | | |
| | |
| | 16,407 | | | Agilent Technologies, Inc., (3) | | | 619,528 | |
| | |
| | | | Machinery – 1.5% | | | |
| | |
| | 16,606 | | | Stanley Black & Decker Inc. | | | 1,759,904 | |
| | |
| | | | Metals & Mining – 1.3% | | | |
| | |
| | 81,787 | | | Steel Dynamics Inc. | | | 1,510,606 | |
| | | | | | | | |
| Shares | | | Description (1) | | Value | |
| | |
| | | | Multiline Retail – 1.0% | | | |
| | |
| | 22,419 | | | Macy’s, Inc., (3) | | $ | 1,142,921 | |
| | |
| | | | Multi-Utilities – 7.7% | | | |
| | |
| | 27,455 | | | Alliant Energy Corporation | | | 1,620,394 | |
| | |
| | 48,143 | | | CMS Energy Corporation, (3) | | | 1,736,518 | |
| | |
| | 21,829 | | | DTE Energy Company | | | 1,781,028 | |
| | |
| | 84,295 | | | NiSource Inc., (3) | | | 1,615,092 | |
| | |
| | 23,072 | | | Sempra Energy, (3) | | | 2,362,804 | |
| | | | Total Multi-Utilities | | | 9,115,836 | |
| | |
| | | | Oil, Gas & Consumable Fuels – 7.2% | | | |
| | |
| | 10,987 | | | Cimarex Energy Company | | | 1,297,125 | |
| | |
| | 47,100 | | | Columbia Pipeline Group, Inc., (3) | | | 978,267 | |
| | |
| | 23,436 | | | Gulfport Energy Corporation, (2) | | | 714,095 | |
| | |
| | 17,464 | | | Hess Corporation, (3) | | | 981,651 | |
| | |
| | 46,617 | | | Marathon Oil Corporation, (3) | | | 856,820 | |
| | |
| | 46,068 | | | Newfield Exploration Company, (2) | | | 1,851,473 | |
| | |
| | 13,480 | | | Pioneer Natural Resources Company, (3) | | | 1,848,647 | |
| | | | Total Oil, Gas & Consumable Fuels | | | 8,528,078 | |
| | |
| | | | Pharmaceuticals – 1.0% | | | |
| | |
| | 21,196 | | | Medicines Company, (2), (3) | | | 725,751 | |
| | |
| | 3,224 | | | Perrigo Company | | | 508,554 | |
| | | | Total Pharmaceuticals | | | 1,234,305 | |
| | |
| | | | Real Estate Investment Trust – 8.6% | | | |
| | |
| | 9,419 | | | Boston Properties, Inc. | | | 1,185,381 | |
| | |
| | 118,665 | | | Developers Diversified Realty Corporation, (3) | | | 1,993,572 | |
| | |
| | 39,223 | | | Highwoods Properties, Inc. | | | 1,704,239 | |
| | |
| | 342,537 | | | MFA Mortgage Investments, Inc., (3) | | | 2,370,356 | |
| | |
| | 11,804 | | | Sovran Self Storage Inc. | | | 1,178,865 | |
| | |
| | 89,089 | | | Starwood Property Trust Inc., (3) | | | 1,789,798 | |
| | | | Total Real Estate Investment Trust | | | 10,222,211 | |
| | |
| | | | Real Estate Management & Development – 1.3% | | | |
| | |
| | 9,460 | | | Jones Lang LaSalle Inc. | | | 1,577,077 | |
| | |
| | | | Semiconductors & Semiconductor Equipment – 2.8% | | | |
| | |
| | 16,614 | | | Broadcom Corporation, Class A | | | 853,960 | |
| | |
| | 15,285 | | | Lam Research Corporation | | | 1,170,678 | |
| | |
| | 30,167 | | | Maxim Integrated Products, Inc., (3) | | | 1,236,244 | |
| | | | Total Semiconductors & Semiconductor Equipment | | | 3,260,882 | |
| | |
| | | | Software – 4.8% | | | |
| | |
| | 54,996 | | | Activision Blizzard Inc., (3) | | | 1,911,661 | |
Nuveen Mid Cap Value Fund (continued)
| | |
| Portfolio of Investments | | October 31, 2015 |
| | | | | | | | |
| Shares | | | Description (1) | | Value | |
| | |
| | | | Software (continued) | | | |
| | |
| | 40,983 | | | CA Technologies | | $ | 1,135,639 | |
| | |
| | 20,246 | | | Electronic Arts Inc., (2), (3) | | | 1,459,129 | |
| | |
| | 19,389 | | | Nice Systems Limited, Sponsored ADR | | | 1,198,628 | |
| | | | Total Software | | | 5,705,057 | |
| | |
| | | | Specialty Retail – 5.9% | | | |
| | |
| | 49,657 | | | Best Buy Co., Inc. | | | 1,739,485 | |
| | |
| | 27,196 | | | Foot Locker, Inc., (3) | | | 1,842,529 | |
| | |
| | 8,204 | | | Signet Jewelers Limited | | | 1,238,312 | |
| | |
| | 164,347 | | | Staples, Inc., (3) | | | 2,134,868 | |
| | | | Total Specialty Retail | | | 6,955,194 | |
| | |
| | | | Technology, Hardware, Storage & Peripherals – 1.2% | | | |
| | |
| | 19,100 | | | SanDisk Corporation, (3) | | | 1,470,700 | |
| | |
| | | | Wireless Telecommunication Services – 0.7% | | | |
| | |
| | 6,514 | | | SBA Communications Corporation, (2) | | | 775,296 | |
| | | | Total Long-Term Investments (cost $109,610,899) | | | 117,398,593 | |
| | |
| Shares | | | Description (1) | | Value | |
| | |
| | | | INVESTMENTS PURCHASED WITH COLLATERAL FROM SECURITIES LENDING – 30.9% | | | | |
| | |
| | | | Money Market Funds – 30.9% | | | |
| | |
| | 36,604,905 | | | Mount Vernon Securities Lending Prime Portfolio, 0.256%, (4), (5) | | $ | 36,604,905 | |
| | | | Total Investments Purchased with Collateral from Securities Lending (cost $36,604,905) | | | 36,604,905 | |
| | |
| Shares | | | Description (1) | | Value | |
| | |
| | | | SHORT-TERM INVESTMENTS – 0.8% | | | | |
| | |
| | | | Money Market Funds – 0.8% | | | |
| | |
| | 993,541 | | | First American Treasury Obligations Fund, Class Z, 0.000%, (4) | | $ | 993,541 | |
| | | | Total Short-Term Investments (cost $993,541) | | | 993,541 | |
| | | | Total Investments (cost $147,209,345) – 130.7% | | | 154,997,039 | |
| | | | Other Assets Less Liabilities – (30.7)% | | | (36,464,078 | ) |
| | | | Net Assets – 100% | | $ | 118,532,961 | |
For Fund portfolio compliance purposes, the Fund’s industry classifications refer to any one or more of the industry sub-classifications used by one or more widely recognized market indexes or ratings group indexes, and/or as defined by Fund management. This definition may not apply for purposes of this report which may combine industry sub-classifications into sectors for reporting ease.
| (1) | All percentages shown in the Portfolio of Investments are based on net assets. |
| (2) | Non-income producing; issuer has not declared a dividend within the past twelve months. |
| (3) | Investment, or a portion of investment, is out on loan for securities lending. The total value of the securities out on loan as of the end of the reporting period was $34,925,339. |
| (4) | The rate shown is the annualized seven-day effective yield as of the end of the reporting period. |
| (5) | The Fund may loan securities representing up to one third of the fair value of its total assets (which includes collateral for securities on loan) to broker dealers, banks, and other institutions. The Fund maintains collateral equal to at least 100% of the fair value of the securities loaned. The cash collateral received by the Fund is invested in this money market fund. See Notes to Financial Statements, Note 3 – Portfolio Securities and Investments in Derivatives, Securities Lending for more information. |
| ADR | American Depositary Receipt |
See accompanying notes to financial statements.
Nuveen Small Cap Value Fund
| | |
| Portfolio of Investments | | October 31, 2015 |
| | | | | | | | |
| Shares | | | Description (1) | | Value | |
| | |
| | | | LONG-TERM INVESTMENTS – 96.3% | | | | |
| | |
| | | | COMMON STOCKS – 96.3% | | | | |
| | |
| | | | Aerospace & Defense – 0.8% | | | |
| | |
| | 44,235 | | | BWX Technologies, Inc. | | $ | 1,251,851 | |
| | |
| | | | Auto Components – 0.9% | | | |
| | |
| | 82,001 | | | Dana Holding Corporation, (2) | | | 1,377,617 | |
| | |
| | | | Automobiles – 1.2% | | | |
| | |
| | 35,032 | | | Thor Industries, Inc. | | | 1,894,531 | |
| | |
| | | | Banks – 15.6% | | | |
| | |
| | 46,578 | | | Banner Corporation | | | 2,285,582 | |
| | |
| | 102,964 | | | Customers Bancorp Inc., (3) | | | 2,831,510 | |
| | |
| | 50,070 | | | East West Bancorp Inc. | | | 2,022,327 | |
| | |
| | 56,322 | | | Heartland Financial USA, Inc., (2) | | | 2,074,902 | |
| | |
| | 43,205 | | | Opus Bank, (2) | | | 1,609,386 | |
| | |
| | 43,559 | | | Privatebancorp, Inc. | | | 1,822,073 | |
| | |
| | 82,578 | | | Renasant Corporation | | | 2,859,676 | |
| | |
| | 149,774 | | | Sterling Bancorp. | | | 2,305,022 | |
| | |
| | 31,338 | | | Texas Capital BancShares, Inc., (3) | | | 1,729,858 | |
| | |
| | 77,856 | | | Webster Financial Corporation, (2) | | | 2,888,458 | |
| | |
| | 65,697 | | | Western Alliance Bancorporation, (3) | | | 2,348,668 | |
| | | | Total Banks | | | 24,777,462 | |
| | |
| | | | Capital Markets – 1.6% | | | |
| | |
| | 35,461 | | | Evercore Partners Inc., (2) | | | 1,914,894 | |
| | |
| | 78,246 | | | Manning & Napier Inc. | | | 586,845 | |
| | | | Total Capital Markets | | | 2,501,739 | |
| | |
| | | | Chemicals – 1.1% | | | |
| | |
| | 25,322 | | | Minerals Technologies Inc. | | | 1,492,479 | |
| | |
| | 19,000 | | | Orion Engineered Carbons SA | | | 248,140 | |
| | | | Total Chemicals | | | 1,740,619 | |
| | |
| | | | Commercial Services & Supplies – 3.1% | | | |
| | |
| | 19,744 | | | G&K Services, Inc. | | | 1,299,550 | |
| | |
| | 70,344 | | | SP Plus Corporation, (3) | | | 1,793,772 | |
| | |
| | 96,505 | | | Steelcase Inc., (2) | | | 1,873,162 | |
| | | | Total Commercial Services & Supplies | | | 4,966,484 | |
| | |
| | | | Communications Equipment – 2.7% | | | |
| | |
| | 43,794 | | | Netgear, Inc., (3) | | | 1,813,072 | |
| | |
| | 45,894 | | | Plantronics Inc. | | | 2,460,836 | |
| | | | Total Communications Equipment | | | 4,273,908 | |
Nuveen Small Cap Value Fund (continued)
| | |
| Portfolio of Investments | | October 31, 2015 |
| | | | | | | | |
| Shares | | | Description (1) | | Value | |
| | |
| | | | Construction & Engineering – 2.6% | | | |
| | |
| | 49,275 | | | Emcor Group Inc. | | $ | 2,378,997 | |
| | |
| | 102,765 | | | Tutor Perini Corporation, (3) | | | 1,724,397 | |
| | | | Total Construction & Engineering | | | 4,103,394 | |
| | |
| | | | Construction Materials – 0.7% | | | |
| | |
| | 53,835 | | | Headwater Inc., (3) | | | 1,106,309 | |
| | |
| | | | Electric Utilities – 4.1% | | | |
| | |
| | 59,908 | | | El Paso Electric Company | | | 2,316,642 | |
| | |
| | 66,766 | | | PNM Resources Inc. | | | 1,877,460 | |
| | |
| | 45,847 | | | UIL Holdings Corporation | | | 2,337,739 | |
| | | | Total Electric Utilities | | | 6,531,841 | |
| | |
| | | | Electrical Equipment – 1.0% | | | |
| | |
| | 24,270 | | | Regal-Beloit Corporation | | | 1,548,183 | |
| | |
| | | | Electronic Equipment, Instruments & Components – 2.9% | | | |
| | |
| | 30,368 | | | OSI Systems Inc., (3) | | | 2,617,114 | |
| | |
| | 185,968 | | | Vishay Intertechnology Inc., (2) | | | 1,971,261 | |
| | | | Total Electronic Equipment, Instruments & Components | | | 4,588,375 | |
| | |
| | | | Energy Equipment & Services – 0.9% | | | |
| | |
| | 66,110 | | | Matrix Service Company, (3) | | | 1,500,697 | |
| | |
| | | | Food & Staples Retailing – 1.1% | | | |
| | |
| | 65,177 | | | SpartanNash Co | | | 1,818,438 | |
| | |
| | | | Gas Utilities – 1.8% | | | |
| | |
| | 49,606 | | | Laclede Group Inc. | | | 2,905,423 | |
| | |
| | | | Health Care Equipment & Supplies – 2.2% | | | |
| | |
| | 34,345 | | | Halyard Health Inc., (3) | | | 1,019,360 | |
| | |
| | 83,639 | | | Nxstage Medical, Inc., (3) | | | 1,397,608 | |
| | |
| | 14,805 | | | Steris Corporation, (2) | | | 1,109,635 | |
| | | | Total Health Care Equipment & Supplies | | | 3,526,603 | |
| | |
| | | | Health Care Providers & Services – 3.0% | | | |
| | |
| | 54,663 | | | AMN Healthcare Services Inc., (3) | | | 1,550,789 | |
| | |
| | 77,535 | | | Civitas Solutions Inc., (3) | | | 1,994,976 | |
| | |
| | 30,902 | | | Landauer Inc., (2) | | | 1,220,320 | |
| | | | Total Health Care Providers & Services | | | 4,766,085 | |
| | |
| | | | Hotels, Restaurants & Leisure – 0.4% | | | |
| | |
| | 5,629 | | | Churchill Downs Inc. | | | 826,506 | |
| | |
| | | | Household Durables – 2.2% | | | |
| | |
| | 37,311 | | | CalAtlantic Group Inc., (2) | | | 1,421,176 | |
| | |
| | 69,864 | | | La Z Boy Inc. | | | 1,994,617 | |
| | | | Total Household Durables | | | 3,415,793 | |
| | | | | | | | |
| Shares | | | Description (1) | | Value | |
| | |
| | | | Insurance – 7.2% | | | |
| | |
| | 86,677 | | | American Equity Investment Life Holding Company, (2) | | $ | 2,225,865 | |
| | |
| | 37,652 | | | Amerisafe, Inc. | | | 2,060,694 | |
| | |
| | 24,706 | | | Argo Group International Holdings Inc. | | | 1,544,619 | |
| | |
| | 147,966 | | | CNO Financial Group Inc., (2) | | | 2,842,427 | |
| | |
| | 82,238 | | | Horace Mann Educators Corporation | | | 2,815,829 | |
| | | | Total Insurance | | | 11,489,434 | |
| | |
| | | | Internet Software & Services – 1.0% | | | |
| | |
| | 57,937 | | | Constant Contact Inc., (3) | | | 1,512,156 | |
| | |
| | | | IT Services – 2.3% | | | |
| | |
| | 58,289 | | | CSG Systems International Inc., (2) | | | 1,953,847 | |
| | |
| | 101,278 | | | Perficient, Inc., (3) | | | 1,693,368 | |
| | | | Total IT Services | | | 3,647,215 | |
| | |
| | | | Leisure Products – 1.0% | | | |
| | |
| | 28,964 | | | Brunswick Corporation | | | 1,558,553 | |
| | |
| | | | Machinery – 2.2% | | | |
| | |
| | 73,123 | | | Altra Industrial Motion, Inc., (2) | | | 1,934,835 | |
| | |
| | 115,273 | | | NN, Incorporated | | | 1,590,767 | |
| | | | Total Machinery | | | 3,525,602 | |
| | |
| | | | Media – 1.0% | | | |
| | |
| | 33,620 | | | Meredith Corporation | | | 1,580,812 | |
| | |
| | | | Metals & Mining – 1.4% | | | |
| | |
| | 149,990 | | | Commercial Metals Company | | | 2,155,356 | |
| | |
| | | | Oil, Gas & Consumable Fuels – 3.2% | | | |
| | |
| | 152,016 | | | Callon Petroleum Company Del, (3) | | | 1,319,499 | |
| | |
| | 20,259 | | | PDC Energy Inc., (2), (3) | | | 1,222,428 | |
| | |
| | 112,250 | | | Synergy Resources Corporation, (2), (3) | | | 1,256,078 | |
| | |
| | 176,816 | | | WPX Energy Inc., (3) | | | 1,212,958 | |
| | | | Total Oil, Gas & Consumable Fuels | | | 5,010,963 | |
| | |
| | | | Professional Services – 2.1% | | | |
| | |
| | 58,849 | | | Korn Ferry International | | | 2,140,338 | |
| | |
| | 39,804 | | | TrueBlue Inc., (3) | | | 1,153,122 | |
| | | | Total Professional Services | | | 3,293,460 | |
| | |
| | | | Real Estate Investment Trust – 11.4% | | | |
| | |
| | 157,855 | | | Brandywine Realty Trust | | | 2,131,043 | |
| | |
| | 35,125 | | | CubeSmart | | | 977,178 | |
| | |
| | 44,251 | | | Entertainment Properties Trust, (2) | | | 2,513,899 | |
| | |
| | 47,445 | | | Highwoods Properties, Inc., (2) | | | 2,061,485 | |
| | |
| | 102,334 | | | Investors Real Estate Trust, (2) | | | 830,952 | |
Nuveen Small Cap Value Fund (continued)
| | |
| Portfolio of Investments | | October 31, 2015 |
| | | | | | | | |
| Shares | | | Description (1) | | Value | |
| | |
| | | | Real Estate Investment Trust (continued) | | | |
| | |
| | 73,523 | | | Kite Realty Group Trust | | $ | 1,941,742 | |
| | |
| | 66,281 | | | LaSalle Hotel Properties, (2) | | | 1,949,324 | |
| | |
| | 494,350 | | | MFA Mortgage Investments, Inc. | | | 3,420,902 | |
| | |
| | 111,466 | | | STAG Industrial Inc., (2) | | | 2,287,282 | |
| | | | Total Real Estate Investment Trust | | | 18,113,807 | |
| | |
| | | | Semiconductors & Semiconductor Equipment – 2.8% | | | |
| | |
| | 234,303 | | | Cypress Semiconductor Corporation, (2) | | | 2,469,554 | |
| | |
| | 55,267 | | | MKS Instruments Inc., (2) | | | 1,947,609 | |
| | | | Total Semiconductors & Semiconductor Equipment | | | 4,417,163 | |
| | |
| | | | Software – 2.2% | | | |
| | |
| | 56,669 | | | Bottomline Technologies, Inc., (2), (3) | | | 1,568,598 | |
| | |
| | 72,422 | | | Mentor Graphics Corporation | | | 1,969,878 | |
| | | | Total Software | | | 3,538,476 | |
| | |
| | | | Specialty Retail – 3.4% | | | |
| | |
| | 26,710 | | | Childrens Place Retail Stores Inc., (2) | | | 1,433,526 | |
| | |
| | 97,207 | | | Express Inc., (2), (3) | | | 1,876,095 | |
| | |
| | 88,194 | | | Kirkland’s, Inc., (3) | | | 2,027,580 | |
| | | | Total Specialty Retail | | | 5,337,201 | |
| | |
| | | | Textiles Apparel & Luxury Goods – 0.7% | | | |
| | |
| | 20,610 | | | Deckers Outdoor Corporation, (3) | | | 1,147,153 | |
| | |
| | | | Thrifts & Mortgage Finance – 2.2% | | | |
| | |
| | 99,627 | | | Everbank Financial Corporation | | | 1,719,562 | |
| | |
| | 54,577 | | | WSFS Financial Corporation, (2) | | | 1,733,911 | |
| | | | Total Thrifts & Mortgage Finance | | | 3,453,473 | |
| | |
| | | | Trading Cos & Distributors – 0.7% | | | |
| | |
| | 188,445 | | | Neff Corporation, Class A Shares, (2), (3) | | | 1,104,288 | |
| | |
| | | | Water Utilities – 1.6% | | | |
| | |
| | 111,187 | | | California Water Service Group | | | 2,486,141 | |
| | | | Total Long-Term Investments (cost $133,940,049) | | | 152,793,111 | |
| | |
| Shares | | | Description (1) | | Value | |
| | |
| | | | INVESTMENTS PURCHASED WITH COLLATERAL FROM SECURITIES LENDING – 21.1% | | | | |
| | |
| | | | Money Market Funds – 21.1% | | | |
| | |
| | 33,567,177 | | | Mount Vernon Securities Lending Prime Portfolio, 0.256%, (4), (5) | | $ | 33,567,177 | |
| | | | Total Investments Purchased with Collateral from Securities Lending (cost $33,567,177) | | | 33,567,177 | |
| | | | | | | | |
| Shares | | | Description (1) | | Value | |
| | |
| | | | SHORT-TERM INVESTMENTS – 5.6% | | | | |
| | |
| | | | Money Market Funds – 5.6% | | | |
| | |
| | 8,891,955 | | | First American Treasury Obligations Fund, Class Z, 0.000%, (4) | | $ | 8,891,955 | |
| | | | Total Short-Term Investments (cost $8,891,955) | | | 8,891,955 | |
| | | | Total Investments (cost $176,399,181) – 123.0% | | | 195,252,243 | |
| | | | Other Assets Less Liabilities – (23.0)% | | | (36,529,356 | ) |
| | | | Net Assets – 100% | | $ | 158,722,887 | |
For Fund portfolio compliance purposes, the Fund’s industry classifications refer to any one or more of the industry sub-classifications used by one or more widely recognized market indexes or ratings group indexes, and/or as defined by Fund management. This definition may not apply for purposes of this report which may combine industry sub-classifications into sectors for reporting ease.
| (1) | All percentages shown in the Portfolio of Investments are based on net assets. |
| (2) | Investment, or a portion of investment, is out on loan for securities lending. The total value of the securities out on loan as of the end of the reporting period was $32,322,395. |
| (3) | Non-income producing; issuer has not declared a dividend within the past twelve months. |
| (4) | The rate shown is the annualized seven-day effective yield as of the end of the reporting period. |
| (5) | The Fund may loan securities representing up to one third of the fair value of its total assets (which includes collateral for securities on loan) to broker dealers, banks, and other institutions. The Fund maintains collateral equal to at least 100% of the fair value of the securities loaned. The cash collateral received by the Fund is invested in this money market fund. See Notes to Financial Statements, Note 3 – Portfolio Securities and Investments in Derivatives, Securities Lending for more information. |
See accompanying notes to financial statements.
Statement of
| | | | |
| | Assets and Liabilities | | October 31, 2015 |
| | | | | | | | | | | | |
| | | Dividend
Value | | | Mid Cap
Value | | | Small Cap
Value | |
Assets | | | | | | | | | | | | |
Long-term investments, at value (cost $1,027,812,095, $109,610,899 and $133,940,049, respectively) | | $ | 1,390,729,364 | | | $ | 117,398,593 | | | $ | 152,793,111 | |
Investments purchased with collateral from securities lending, at value (cost approximates value) | | | 206,759,602 | | | | 36,604,905 | | | | 33,567,177 | |
Short-term investments, at value (cost approximates value) | | | 7,948,804 | | | | 993,541 | | | | 8,891,955 | |
Receivable for: | | | | | | | | | | | | |
Dividends | | | 2,217,012 | | | | 69,123 | | | | 62,392 | |
Due from broker | | | 31,779 | | | | 3,385 | | | | 3,498 | |
Investments sold | | | — | | | | 1,323,411 | | | | 5,097,418 | |
Reclaims | | | 21,103 | | | | — | | | | — | |
Shares sold | | | 1,041,541 | | | | 36,493 | | | | 4,216,947 | |
Other assets | | | 77,183 | | | | 24,569 | | | | 19,875 | |
Total assets | | | 1,608,826,388 | | | | 156,454,020 | | | | 204,652,373 | |
Liabilities | | | | | | | | | | | | |
Payable for: | | | | | | | | | | | | |
Collateral from securities lending program | | | 206,759,602 | | | | 36,604,905 | | | | 33,567,177 | |
Investments purchased | | | — | | | | 1,138,760 | | | | 12,147,843 | |
Shares redeemed | | | 7,318,623 | | | | 4,196 | | | | 12,440 | |
Accrued expenses: | | | | | | | | | | | | |
12b-1 distribution and service fees | | | 128,095 | | | | 16,519 | | | | 19,142 | |
Management fees | | | 885,341 | | | | 78,860 | | | | 111,863 | |
Directors fees | | | 61,026 | | | | 6,279 | | | | 1,029 | |
Other | | | 521,115 | | | | 71,540 | | | | 69,992 | |
Total liabilities | | | 215,673,802 | | | | 37,921,059 | | | | 45,929,486 | |
Net assets | | $ | 1,393,152,586 | | | $ | 118,532,961 | | | $ | 158,722,887 | |
Class A Shares | | | | | | | | | | | | |
Net assets | | $ | 310,055,000 | | | $ | 36,377,643 | | | $ | 48,655,779 | |
Shares outstanding | | | 19,617,471 | | | | 1,027,837 | | | | 2,438,765 | |
Net asset value (“NAV”) per share | | $ | 15.81 | | | $ | 35.39 | | | $ | 19.95 | |
Offering price per share (NAV per share plus maximum sales charge of 5.75% of offering price) | | $ | 16.77 | | | $ | 37.55 | | | $ | 21.17 | |
Class C Shares | | | | | | | | | | | | |
Net assets | | $ | 53,506,647 | | | $ | 7,379,121 | | | $ | 4,506,516 | |
Shares outstanding | | | 3,430,301 | | | | 217,899 | | | | 261,952 | |
NAV and offering price per share | | $ | 15.60 | | | $ | 33.86 | | | $ | 17.20 | |
Class R3 Shares | | | | | | | | | | | | |
Net assets | | $ | 42,618,269 | | | $ | 6,941,746 | | | $ | 14,516,206 | |
Shares outstanding | | | 2,702,428 | | | | 197,379 | | | | 742,175 | |
NAV and offering price per share | | $ | 15.77 | | | $ | 35.17 | | | $ | 19.56 | |
Class R6 Shares | | | | | | | | | | | | |
Net assets | | $ | 56,122,763 | | | | — | | | | — | |
Shares outstanding | | | 3,510,300 | | | | — | | | | — | |
NAV and offering price per share | | $ | 15.99 | | | | — | | | | — | |
Class I Shares | | | | | | | | | | | | |
Net assets | | $ | 930,849,907 | | | $ | 67,834,451 | | | $ | 91,044,386 | |
Shares outstanding | | | 58,349,614 | | | | 1,909,561 | | | | 4,412,749 | |
NAV and offering price per share | | $ | 15.95 | | | $ | 35.52 | | | $ | 20.63 | |
Net assets consist of: | | | | | | | | | | | | |
Capital paid-in | | $ | 938,475,235 | | | $ | 106,980,053 | | | $ | 136,696,684 | |
Undistributed (Over-distribution of) net investment income | | | 4,748,083 | | | | 417,252 | | | | 345,424 | |
Accumulated net realized gain (loss) | | | 87,011,999 | | | | 3,347,962 | | | | 2,827,717 | |
Net unrealized appreciation (depreciation) | | | 362,917,269 | | | | 7,787,694 | | | | 18,853,062 | |
Net assets | | $ | 1,393,152,586 | | | $ | 118,532,961 | | | $ | 158,722,887 | |
Authorized shares – per class | | | 2 billion | | | | 2 billion | | | | 2 billion | |
Par value per share | | $ | 0.0001 | | | $ | 0.0001 | | | $ | 0.0001 | |
See accompanying notes to financial statements.
Statement of
| | | | |
| | Operations | | Year Ended October 31, 2015 |
| | | | | | | | | | | | |
| | | Dividend
Value | | | Mid Cap
Value | | | Small Cap
Value | |
Investment Income | | | | | | | | | | | | |
Dividend and interest income (net of foreign tax withheld of $267,057, $931 and $14,930, respectively) | | $ | 45,258,576 | | | $ | 2,011,100 | | | $ | 2,182,267 | |
Securities lending income, net | | | 264,401 | | | | 34,354 | | | | 124,823 | |
Total investment income | | | 45,522,977 | | | | 2,045,454 | | | | 2,307,090 | |
Expenses | | | | | | | | | | | | |
Management fees | | | 11,887,374 | | | | 1,136,417 | | | | 1,185,672 | |
12b-1 service fees – Class A Shares | | | 864,635 | | | | 96,975 | | | | 115,718 | |
12b-1 distribution and service fees – Class C Shares | | | 604,877 | | | | 77,368 | | | | 32,288 | |
12b-1 distribution and service fees – Class R3 Shares | | | 231,921 | | | | 37,488 | | | | 65,969 | |
Shareholder servicing agent fees | | | 1,662,335 | | | | 184,755 | | | | 201,722 | |
Custodian fees | | | 242,470 | | | | 28,450 | | | | 29,189 | |
Directors fees | | | 41,603 | | | | 3,341 | | | | 3,622 | |
Professional fees | | | 115,967 | | | | 25,736 | | | | 25,880 | |
Shareholder reporting expenses | | | 125,091 | | | | 29,611 | | | | 36,344 | |
Federal and state registration fees | | | 94,286 | | | | 55,121 | | | | 54,118 | |
Other | | | 26,860 | | | | 7,220 | | | | 3,887 | |
Total expenses before fee waiver/expense reimbursement | | | 15,897,419 | | | | 1,682,482 | | | | 1,754,409 | |
Fee waiver/expense reimbursement | | | — | | | | (113,480 | ) | | | (20,137 | ) |
Net expenses | | | 15,897,419 | | | | 1,569,002 | | | | 1,734,272 | |
Net investment income (loss) | | | 29,625,558 | | | | 476,452 | | | | 572,818 | |
Realized and Unrealized Gain (Loss) | | | | | | | | | | | | |
Net realized gain (loss) from investments and foreign currency | | | 113,532,620 | | | | 10,210,863 | | | | 10,440,246 | |
Change in net unrealized appreciation (depreciation) of investments and foreign currency | | | (154,434,094 | ) | | | (9,200,460 | ) | | | (433,839 | ) |
Net realized and unrealized gain (loss) | | | (40,901,474 | ) | | | 1,010,403 | | | | 10,006,407 | |
Net increase (decrease) in net assets from operations | | $ | (11,275,916 | ) | | $ | 1,486,855 | | | $ | 10,579,225 | |
See accompanying notes to financial statements.
Statement of
| | | | | | | | |
| | | Dividend Value | |
| | | Year Ended
10/31/15 | | | Year Ended
10/31/14 | |
Operations | | | | | | | | |
Net investment income (loss) | | $ | 29,625,558 | | | $ | 39,831,537 | |
Net realized gain (loss) from investments and foreign currency | | | 113,532,620 | | | | 116,419,104 | |
Change in net unrealized appreciation (depreciation) of investments and foreign currency | | | (154,434,094 | ) | | | 21,637,417 | |
Net increase (decrease) in net assets from operations | | | (11,275,916 | ) | | | 177,888,058 | |
Distributions to Shareholders | | | | | | | | |
From net investment income: | | | | | | | | |
Class A Shares | | | (7,171,529 | ) | | | (8,662,421 | ) |
Class C Shares | | | (795,215 | ) | | | (953,267 | ) |
Class R3 Shares | | | (845,243 | ) | | | (868,082 | ) |
Class R6 Shares | | | (1,370,813 | ) | | | (1,558,577 | ) |
Class I Shares | | | (24,645,360 | ) | | | (28,330,811 | ) |
From accumulated net realized gains: | | | | | | | | |
Class A Shares | | | (23,911,932 | ) | | | (37,144,807 | ) |
Class C Shares | | | (4,268,650 | ) | | | (5,985,814 | ) |
Class R3 Shares | | | (3,107,058 | ) | | | (3,817,556 | ) |
Class R6 Shares | | | (3,832,324 | ) | | | (6,011,872 | ) |
Class I Shares | | | (74,744,699 | ) | | | (108,753,346 | ) |
Decrease in net assets from distributions to shareholders | | | (144,692,823 | ) | | | (202,086,553 | ) |
Fund Share Transactions | | | | | | | | |
Proceeds from sale of shares | | | 176,433,011 | | | | 315,758,487 | |
Proceeds from shares issued to shareholders due to reinvestment of distributions | | | 97,550,897 | | | | 135,194,304 | |
| | | 273,983,908 | | | | 450,952,791 | |
Cost of shares redeemed | | | (451,688,334 | ) | | | (402,778,258 | ) |
Net increase (decrease) in net assets from Fund share transactions | | | (177,704,426 | ) | | | 48,174,533 | |
Net increase (decrease) in net assets | | | (333,673,165 | ) | | | 23,976,038 | |
Net assets at the beginning of period | | | 1,726,825,751 | | | | 1,702,849,713 | |
Net assets at the end of period | | $ | 1,393,152,586 | | | $ | 1,726,825,751 | |
Undistributed (Over-distribution of) net investment income at the end of period | | $ | 4,748,083 | | | $ | 2,412,037 | |
See accompanying notes to financial statements.
| | | | | | | | | | | | | | | | | | |
| | | Mid Cap Value | | | | | Small Cap Value | |
| | | Year Ended
10/31/15 | | | Year Ended
10/31/14 | | | | | Year Ended
10/31/15 | | | Year Ended
10/31/14 | |
Operations | | | | | | | | | | | | | | | | | | |
Net investment income (loss) | | $ | 476,452 | | | $ | 1,162,750 | | | | | $ | 572,818 | | | $ | 415,066 | |
Net realized gain (loss) from investments and foreign currency | | | 10,210,863 | | | | 25,020,395 | | | | | | 10,440,246 | | | | 13,358,953 | |
Change in net unrealized appreciation (depreciation) of investments and foreign currency | | | (9,200,460 | ) | | | (6,543,825 | ) | | | | | (433,839 | ) | | | (2,964,260 | ) |
Net increase (decrease) in net assets from operations | | | 1,486,855 | | | | 19,639,320 | | | | | | 10,579,225 | | | | 10,809,759 | |
Distributions to Shareholders | | | | | | | | | | | | | | | | | | |
From net investment income: | | | | | | | | | | | | | | | | | | |
Class A Shares | | | (332,351 | ) | | | (180,382 | ) | | | | | (170,384 | ) | | | (158,852 | ) |
Class C Shares | | | (9,811 | ) | | | — | | | | | | — | | | | — | |
Class R3 Shares | | | (50,129 | ) | | | (23,054 | ) | | | | | (16,250 | ) | | | (11,164 | ) |
Class R6 Shares | | | — | | | | — | | | | | | — | | | | — | |
Class I Shares | | | (797,785 | ) | | | (654,623 | ) | | | | | (438,364 | ) | | | (281,445 | ) |
From accumulated net realized gains: | | | | | | | | | | | | | | | | | | |
Class A Shares | | | — | | | | — | | | | | | — | | | | — | |
Class C Shares | | | — | | | | — | | | | | | — | | | | — | |
Class R3 Shares | | | — | | | | — | | | | | | — | | | | — | |
Class R6 Shares | | | — | | | | — | | | | | | — | | | | — | |
Class I Shares | | | — | | | | — | | | | | | — | | | | — | |
Decrease in net assets from distributions to shareholders | | | (1,190,076 | ) | | | (858,059 | ) | | | | | (624,998 | ) | | | (451,461 | ) |
Fund Share Transactions | | | | | | | | | | | | | | | | | | |
Proceeds from sale of shares | | | 8,431,067 | | | | 15,636,487 | | | | | | 46,357,629 | | | | 50,507,134 | |
Proceeds from shares issued to shareholders due to reinvestment of distributions | | | 644,548 | | | | 474,117 | | | | | | 549,545 | | | | 363,681 | |
| | | 9,075,615 | | | | 16,110,604 | | | | | | 46,907,174 | | | | 50,870,815 | |
Cost of shares redeemed | | | (23,144,338 | ) | | | (46,172,688 | ) | | | | | (28,935,630 | ) | | | (35,784,520 | ) |
Net increase (decrease) in net assets from Fund share transactions | | | (14,068,723 | ) | | | (30,062,084 | ) | | | | | 17,971,544 | | | | 15,086,295 | |
Net increase (decrease) in net assets | | | (13,771,944 | ) | | | (11,280,823 | ) | | | | | 27,925,771 | | | | 25,444,593 | |
Net assets at the beginning of period | | | 132,304,905 | | | | 143,585,728 | | | | | | 130,797,116 | | | | 105,352,523 | |
Net assets at the end of period | | $ | 118,532,961 | | | $ | 132,304,905 | | | | | $ | 158,722,887 | | | $ | 130,797,116 | |
Undistributed (Over-distribution of) net investment income at the end of period | | $ | 417,252 | | | $ | 1,130,877 | | | | | $ | 345,424 | | | $ | 397,464 | |
See accompanying notes to financial statements.
Financial
Highlights
Dividend Value
Selected data for a share outstanding throughout each period:
| | | | | | | | | | | | | | | | | | | | | | | | | | | | | | | | | | |
| | | | | |
| | | | | | Investment Operations | | | | | Less Distributions | | | | |
| | | | | | | | | |
Class (Commencement Date) Year Ended October 31, | | Beginning
NAV | | | Net
Investment
Income
(Loss)(a) | | | Net
Realized/
Unrealized
Gain (Loss) | | | Total | | | | | From Net
Investment
Income | | | From Accumulated Net Realized
Gains | | | Total | | | Ending
NAV | |
Class A (12/92) | | | | | | | | | | | | | | | | | | | | | | | | | | | | | | | |
2015 | | $ | 17.44 | | | $ | 0.28 | | | $ | (0.44 | ) | | $ | (0.16 | ) | | | | $ | (0.34 | ) | | $ | (1.13 | ) | | $ | (1.47 | ) | | $ | 15.81 | |
2014 | | | 17.79 | | | | 0.37 | | | | 1.36 | | | | 1.73 | | | | | | (0.38 | ) | | | (1.70 | ) | | | (2.08 | ) | | | 17.44 | |
2013 | | | 14.60 | | | | 0.30 | | | | 3.59 | | | | 3.89 | | | | | | (0.30 | ) | | | (0.40 | ) | | | (0.70 | ) | | | 17.79 | |
2012 | | | 13.05 | | | | 0.27 | | | | 1.59 | | | | 1.86 | | | | | | (0.31 | ) | | | — | | | | (0.31 | ) | | | 14.60 | |
2011 | | | 12.42 | | | | 0.27 | | | | 0.63 | | | | 0.90 | | | | | | (0.27 | ) | | | — | | | | (0.27 | ) | | | 13.05 | |
Class C (2/99) | | | | | | | | | | | | | | | | | | | | | | | | | | | | | | | |
2015 | | | 17.23 | | | | 0.16 | | | | (0.44 | ) | | | (0.28 | ) | | | | | (0.22 | ) | | | (1.13 | ) | | | (1.35 | ) | | | 15.60 | |
2014 | | | 17.59 | | | | 0.24 | | | | 1.34 | | | | 1.58 | | | | | | (0.24 | ) | | | (1.70 | ) | | | (1.94 | ) | | | 17.23 | |
2013 | | | 14.42 | | | | 0.18 | | | | 3.57 | | | | 3.75 | | | | | | (0.18 | ) | | | (0.40 | ) | | | (0.58 | ) | | | 17.59 | |
2012 | | | 12.92 | | | | 0.17 | | | | 1.54 | | | | 1.71 | | | | | | (0.21 | ) | | | — | | | | (0.21 | ) | | | 14.42 | |
2011 | | | 12.26 | | | | 0.17 | | | | 0.62 | | | | 0.79 | | | | | | (0.13 | ) | | | — | | | | (0.13 | ) | | | 12.92 | |
Class R3 (9/01) | | | | | | | | | | | | | | | | | | | | | | | | | | | | | | | |
2015 | | | 17.41 | | | | 0.24 | | | | (0.45 | ) | | | (0.21 | ) | | | | | (0.30 | ) | | | (1.13 | ) | | | (1.43 | ) | | | 15.77 | |
2014 | | | 17.75 | | | | 0.33 | | | | 1.36 | | | | 1.69 | | | | | | (0.33 | ) | | | (1.70 | ) | | | (2.03 | ) | | | 17.41 | |
2013 | | | 14.58 | | | | 0.26 | | | | 3.57 | | | | 3.83 | | | | | | (0.26 | ) | | | (0.40 | ) | | | (0.66 | ) | | | 17.75 | |
2012 | | | 13.03 | | | | 0.24 | | | | 1.59 | | | | 1.83 | | | | | | (0.28 | ) | | | — | | | | (0.28 | ) | | | 14.58 | |
2011 | | | 12.41 | | | | 0.23 | | | | 0.63 | | | | 0.86 | | | | | | (0.24 | ) | | | — | | | | (0.24 | ) | | | 13.03 | |
Class R6 (2/13) | | | | | | | | | | | | | | | | | | | | | | | | | | | | | | | |
2015 | | | 17.62 | | | | 0.34 | | | | (0.45 | ) | | | (0.11 | ) | | | | | (0.39 | ) | | | (1.13 | ) | | | (1.52 | ) | | | 15.99 | |
2014 | | | 17.93 | | | | 0.43 | | | | 1.38 | | | | 1.81 | | | | | | (0.42 | ) | | | (1.70 | ) | | | (2.12 | ) | | | 17.62 | |
2013(d) | | | 15.36 | | | | 0.22 | | | | 2.60 | | | | 2.82 | | | | | | (0.25 | ) | | | — | | | | (0.25 | ) | | | 17.93 | |
Class I (8/94) | | | | | | | | | | | | | | | | | | | | | | | | | | | | | | | |
2015 | | | 17.60 | | | | 0.33 | | | | (0.46 | ) | | | (0.13 | ) | | | | | (0.39 | ) | | | (1.13 | ) | | | (1.52 | ) | | | 15.95 | |
2014 | | | 17.93 | | | | 0.42 | | | | 1.37 | | | | 1.79 | | | | | | (0.42 | ) | | | (1.70 | ) | | | (2.12 | ) | | | 17.60 | |
2013 | | | 14.72 | | | | 0.35 | | | | 3.61 | | | | 3.96 | | | | | | (0.35 | ) | | | (0.40 | ) | | | (0.75 | ) | | | 17.93 | |
2012 | | | 13.16 | | | | 0.31 | | | | 1.60 | | | | 1.91 | | | | | | (0.35 | ) | | | — | | | | (0.35 | ) | | | 14.72 | |
2011 | | | 12.53 | | | | 0.31 | | | | 0.64 | | | | 0.95 | | | | | | (0.32 | ) | | | — | | | | (0.32 | ) | | | 13.16 | |
| | | | | | | | | | | | | | | | | | | | | | | | | | | | | | |
| | | | Ratios/Supplemental Data | |
| | | | | | | | | Ratios to Average
Net Assets Before Waiver/Reimbursement | | | | | Ratios to Average
Net Assets After
Waiver/Reimbursement(c) | | | | |
| | | | | | | | |
Total
Return(b) | | | Ending
Net
Assets
(000) | | | | | Expenses | | | Net
Investment
Income
(Loss) | | | | | Expenses | | | Net
Investment
Income
(Loss) | | | Portfolio
Turnover
Rate(e) | |
| | | | | | | | | | | | | | | | | | | | | | | | | | | | | | |
| | (0.87 | )% | | $ | 310,055 | | | | | | 1.15 | % | | | 1.72 | % | | | | | 1.15 | % | | | 1.72 | % | | | 53 | % |
| | 10.78 | | | | 371,703 | | | | | | 1.15 | | | | 2.19 | | | | | | 1.15 | | | | 2.19 | | | | 27 | |
| | 27.72 | | | | 384,226 | | | | | | 1.13 | | | | 1.88 | | | | | | 1.12 | | | | 1.89 | | | | 44 | |
| | 14.31 | | | | 273,317 | | | | | | 1.16 | | | | 1.95 | | | | | | 1.16 | | | | 1.95 | | | | 24 | |
| | 7.28 | | | | 176,954 | | | | | | 1.14 | | | | 2.05 | | | | | | 1.14 | | | | 2.05 | | | | 33 | |
| | | | | | | | | | | | | | | | | | | | | | | | | | | | | | |
| | (1.59 | ) | | | 53,507 | | | | | | 1.90 | | | | 0.98 | | | | | | 1.90 | | | | 0.98 | | | | 53 | |
| | 10.01 | | | | 65,366 | | | | | | 1.90 | | | | 1.43 | | | | | | 1.90 | | | | 1.43 | | | | 27 | |
| | 26.95 | | | | 59,753 | | | | | | 1.88 | | | | 1.09 | | | | | | 1.87 | | | | 1.10 | | | | 44 | |
| | 13.29 | | | | 29,234 | | | | | | 1.91 | | | | 1.21 | | | | | | 1.91 | | | | 1.21 | | | | 24 | |
| | 6.42 | | | | 18,714 | | | | | | 1.89 | | | | 1.31 | | | | | | 1.89 | | | | 1.31 | | | | 33 | |
| | | | | | | | | | | | | | | | | | | | | | | | | | | | | | |
| | (1.12 | ) | | | 42,618 | | | | | | 1.40 | | | | 1.45 | | | | | | 1.40 | | | | 1.45 | | | | 53 | |
| | 10.59 | | | | 48,476 | | | | | | 1.40 | | | | 1.92 | | | | | | 1.40 | | | | 1.92 | | | | 27 | |
| | 27.30 | | | | 38,589 | | | | | | 1.38 | | | | 1.61 | | | | | | 1.37 | | | | 1.62 | | | | 44 | |
| | 14.13 | | | | 21,649 | | | | | | 1.41 | | | | 1.70 | | | | | | 1.41 | | | | 1.70 | | | | 24 | |
| | 6.93 | | | | 12,092 | | | | | | 1.41 | | | | 1.75 | | | | | | 1.41 | | | | 1.75 | | | | 33 | |
| | | | | | | | | | | | | | | | | | | | | | | | | | | | | | |
| | (0.51 | ) | | | 56,123 | | | | | | 0.81 | | | | 2.03 | | | | | | 0.81 | | | | 2.03 | | | | 53 | |
| | 11.23 | | | | 62,309 | | | | | | 0.81 | | | | 2.52 | | | | | | 0.81 | | | | 2.52 | | | | 27 | |
| | 18.52 | | | | 67,620 | | | | | | 0.80 | * | | | 1.98 | * | | | | | 0.80 | * | | | 1.98 | * | | | 44 | |
| | | | | | | | | | | | | | | | | | | | | | | | | | | | | | |
| | (0.64 | ) | | | 930,850 | | | | | | 0.90 | | | | 1.99 | | | | | | 0.90 | | | | 1.99 | | | | 53 | |
| | 11.11 | | | | 1,178,972 | | | | | | 0.90 | | | | 2.42 | | | | | | 0.90 | | | | 2.42 | | | | 27 | |
| | 27.96 | | | | 1,151,408 | | | | | | 0.88 | | | | 2.16 | | | | | | 0.87 | | | | 2.16 | | | | 44 | |
| | 14.65 | | | | 1,072,335 | | | | | | 0.91 | | | | 2.23 | | | | | | 0.91 | | | | 2.23 | | | | 24 | |
| | 7.56 | | | | 861,754 | | | | | | 0.89 | | | | 2.30 | | | | | | 0.89 | | | | 2.31 | | | | 33 | |
| (a) | Per share Net Investment Income (Loss) is calculated using the average daily shares method. | |
| (b) | Total return is the combination of changes in NAV without any sales charge, reinvested dividend income at NAV and reinvested capital gains distributions at NAV, if any. Total returns are not annualized. | |
| (c) | After fee waiver and/or expense reimbursement from the Adviser, where applicable. | |
| (d) | For the period February 28, 2013 (commencement of operations) through October 31, 2013. | |
| (e) | Portfolio Turnover Rate is calculated based on the lesser of long-term purchases or sales (as disclosed in Note 5 – Investment Transactions) divided by the average long-term market value during the period. | |
See accompanying notes to financial statements.
Financial Highlights (continued)
Mid Cap Value
Selected data for a share outstanding throughout each period:
| | | | | | | | | | | | | | | | | | | | | | | | | | | | | | | | | | |
| | | | | |
| | | | | | Investment Operations | | | | | Less Distributions | | | | |
| | | | | | | | | |
Class (Commencement Date) Year Ended October 31, | | Beginning
NAV | | | Net
Investment
Income
(Loss)(a) | | | Net
Realized/
Unrealized
Gain (Loss) | | | Total | | | | | From
Net
Investment
Income | | | From
Accumulated
Net Realized
Gains | | | Total | | | Ending
NAV | |
Class A (12/87) | | | | | | | | | | | | | | | | | | | | | | | | | | | | | | | |
2015 | | $ | 35.37 | | | $ | 0.10 | | | $ | 0.22 | | | $ | 0.32 | | | | | $ | (0.30 | ) | | $ | — | | | $ | (0.30 | ) | | $ | 35.39 | |
2014 | | | 31.00 | | | | 0.23 | | | | 4.30 | | | | 4.53 | | | | | | (0.16 | ) | | | — | | | | (0.16 | ) | | | 35.37 | |
2013 | | | 23.22 | | | | 0.12 | | | | 7.91 | | | | 8.03 | | | | | | (0.25 | ) | | | — | | | | (0.25 | ) | | | 31.00 | |
2012 | | | 21.83 | | | | 0.18 | | | | 1.35 | | | | 1.53 | | | | | | (0.14 | ) | | | — | | | | (0.14 | ) | | | 23.22 | |
2011 | | | 22.20 | | | | 0.07 | | | | (0.19 | ) | | | (0.12 | ) | | | | | (0.25 | ) | | | — | | | | (0.25 | ) | | | 21.83 | |
Class C (2/99) | | | | | | | | | | | | | | | | | | | | | | | | | | | | | | | |
2015 | | | 33.86 | | | | (0.16 | ) | | | 0.20 | | | | 0.04 | | | | | | (0.04 | ) | | | — | | | | (0.04 | ) | | | 33.86 | |
2014 | | | 29.76 | | | | (0.02 | ) | | | 4.12 | | | | 4.10 | | | | | | — | | | | — | | | | — | | | | 33.86 | |
2013 | | | 22.29 | | | | (0.08 | ) | | | 7.62 | | | | 7.54 | | | | | | (0.07 | ) | | | — | | | | (0.07 | ) | | | 29.76 | |
2012 | | | 20.99 | | | | 0.01 | | | | 1.29 | | | | 1.30 | | | | | | — | | | | — | | | | — | | | | 22.29 | |
2011 | | | 21.36 | | | | (0.10 | ) | | | (0.18 | ) | | | (0.28 | ) | | | | | (0.09 | ) | | | — | | | | (0.09 | ) | | | 20.99 | |
Class R3 (9/01) | | | | | | | | | | | | | | | | | | | | | | | | | | | | | | | |
2015 | | | 35.15 | | | | 0.02 | | | | 0.21 | | | | 0.23 | | | | | | (0.21 | ) | | | — | | | | (0.21 | ) | | | 35.17 | |
2014 | | | 30.82 | | | | 0.15 | | | | 4.27 | | | | 4.42 | | | | | | (0.09 | ) | | | — | | | | (0.09 | ) | | | 35.15 | |
2013 | | | 23.08 | | | | 0.06 | | | | 7.87 | | | | 7.93 | | | | | | (0.19 | ) | | | — | | | | (0.19 | ) | | | 30.82 | |
2012 | | | 21.70 | | | | 0.12 | | | | 1.33 | | | | 1.45 | | | | | | (0.07 | ) | | | — | | | | (0.07 | ) | | | 23.08 | |
2011 | | | 22.05 | | | | 0.01 | | | | (0.19 | ) | | | (0.18 | ) | | | | | (0.17 | ) | | | — | | | | (0.17 | ) | | | 21.70 | |
Class I (2/94) | | | | | | | | | | | | | | | | | | | | | | | | | | | | | | | |
2015 | | | 35.50 | | | | 0.20 | | | | 0.20 | | | | 0.40 | | | | | | (0.38 | ) | | | — | | | | (0.38 | ) | | | 35.52 | |
2014 | | | 31.10 | | | | 0.32 | | | | 4.31 | | | | 4.63 | | | | | | (0.23 | ) | | | — | | | | (0.23 | ) | | | 35.50 | |
2013 | | | 23.29 | | | | 0.19 | | | | 7.93 | | | | 8.12 | | | | | | (0.31 | ) | | | — | | | | (0.31 | ) | | | 31.10 | |
2012 | | | 21.99 | | | | 0.24 | | | | 1.33 | | | | 1.57 | | | | | | (0.27 | ) | | | — | | | | (0.27 | ) | | | 23.29 | |
2011 | | | 22.37 | | | | 0.15 | | | | (0.22 | ) | | | (0.07 | ) | | | | | (0.31 | ) | | | — | | | | (0.31 | ) | | | 21.99 | |
| | | | | | | | | | | | | | | | | | | | | | | | | | | | | | |
| | | | Ratios/Supplemental Data | |
| | | | | | | | | Ratios to Average
Net Assets Before
Waiver/Reimbursement | | | | | Ratios to Average
Net Assets After
Waiver/Reimbursement(c) | | | | |
| | | | | | | | |
Total
Return(b) | | | Ending
Net
Assets
(000) | | | | | Expenses | | | Net
Investment
Income
(Loss) | | | | | Expenses | | | Net
Investment
Income
(Loss) | | | Portfolio
Turnover
Rate(d) | |
| | | | | | | | | | | | | | | | | | | | | | | | | | | | | | |
| | 0.89 | % | | $ | 36,378 | | | | | | 1.41 | % | | | 0.20 | % | | | | | 1.32 | % | | | 0.29 | % | | | 111 | % |
| | 14.65 | | | | 39,858 | | | | | | 1.42 | | | | 0.61 | | | | | | 1.34 | | | | 0.69 | | | | 127 | |
| | 34.93 | | | | 35,719 | | | | | | 1.39 | | | | 0.40 | | | | | | 1.33 | | | | 0.45 | | | | 118 | |
| | 7.03 | | | | 35,633 | | | | | | 1.49 | | | | 0.58 | | | | | | 1.28 | | | | 0.79 | | | | 140 | |
| | (0.64 | ) | | | 52,334 | | | | | | 1.33 | | | | 0.27 | | | | | | 1.31 | | | | 0.30 | | | | 123 | |
| | | | | | | | | | | | | | | | | | | | | | | | | | | | | | |
| | 0.15 | | | | 7,379 | | | | | | 2.16 | | | | (0.55 | ) | | | | | 2.07 | | | | (0.46 | ) | | | 111 | |
| | 13.78 | | | | 8,066 | | | | | | 2.17 | | | | (0.14 | ) | | | | | 2.09 | | | | (0.06 | ) | | | 127 | |
| | 33.94 | | | | 8,042 | | | | | | 2.14 | | | | (0.35 | ) | | | | | 2.08 | | | | (0.29 | ) | | | 118 | |
| | 6.19 | | | | 7,855 | | | | | | 2.24 | | | | (0.17 | ) | | | | | 2.02 | | | | 0.05 | | | | 140 | |
| | (1.35 | ) | | | 8,957 | | | | | | 2.08 | | | | (0.48 | ) | | | | | 2.06 | | | | (0.45 | ) | | | 123 | |
| | | | | | | | | | | | | | | | | | | | | | | | | | | | | | |
| | 0.65 | | | | 6,942 | | | | | | 1.66 | | | | (0.04 | ) | | | | | 1.57 | | | | 0.05 | | | | 111 | |
| | 14.35 | | | | 8,401 | | | | | | 1.67 | | | | 0.37 | | | | | | 1.59 | | | | 0.46 | | | | 127 | |
| | 34.63 | | | | 8,401 | | | | | | 1.64 | | | | 0.16 | | | | | | 1.58 | | | | 0.22 | | | | 118 | |
| | 6.70 | | | | 9,576 | | | | | | 1.74 | | | | 0.31 | | | | | | 1.53 | | | | 0.52 | | | | 140 | |
| | (0.87 | ) | | | 15,310 | | | | | | 1.58 | | | | 0.03 | | | | | | 1.56 | | | | 0.06 | | | | 123 | |
| | | | | | | | | | | | | | | | | | | | | | | | | | | | | | |
| | 1.12 | | | | 67,834 | | | | | | 1.16 | | | | 0.46 | | | | | | 1.07 | | | | 0.55 | | | | 111 | |
| | 14.95 | | | | 75,981 | | | | | | 1.17 | | | | 0.86 | | | | | | 1.09 | | | | 0.94 | | | | 127 | |
| | 35.29 | | | | 90,212 | | | | | | 1.13 | | | | 0.66 | | | | | | 1.08 | | | | 0.71 | | | | 118 | |
| | 7.23 | | | | 106,276 | | | | | | 1.24 | | | | 0.82 | | | | | | 1.03 | | | | 1.03 | | | | 140 | |
| | (0.42) | | | | 151,409 | | | | | | 1.07 | | | | 0.65 | | | | | | 1.06 | | | | 0.65 | | | | 123 | |
| (a) | Per share Net Investment Income (Loss) is calculated using the average daily shares method. | |
| (b) | Total return is the combination of changes in NAV without any sales charge, reinvested dividend income at NAV and reinvested capital gains distributions at NAV, if any. Total returns are not annualized. | |
| (c) | After fee waiver and/or expense reimbursement from the Adviser, where applicable. | |
| (d) | Portfolio Turnover Rate is calculated based on the lesser of long-term purchases or sales (as disclosed in Note 5 – Investment Transactions) divided by the average long-term market value during the period. | |
See accompanying notes to financial statements.
Financial Highlights (continued)
Small Cap Value
Selected data for a share outstanding throughout each period:
| | | | | | | | | | | | | | | | | | | | | | | | | | | | | | | | | | |
| | | | | |
| | | | | | Investment Operations | | | | | Less Distributions | | | | |
| | | | | | | | | |
Class (Commencement Date) Year Ended October 31, | | Beginning
NAV | | | Net
Investment
Income
(Loss)(a) | | | Net
Realized/
Unrealized
Gain (Loss) | | | Total | | | | | From
Net
Investment
Income | | | From
Accumulated
Net Realized
Gains | | | Total | | | Ending
NAV | |
Class A (8/94) | �� | | | | | | | | | | | | | | | | | | | | | | | | | | | | | | |
2015 | | $ | 18.55 | | | $ | 0.07 | | | $ | 1.40 | | | $ | 1.47 | | | | | $ | (0.07 | ) | | $ | — | | | $ | (0.07 | ) | | $ | 19.95 | |
2014 | | | 16.98 | | | | 0.05 | | | | 1.58 | | | | 1.63 | | | | | | (0.06 | ) | | | — | | | | (0.06 | ) | | | 18.55 | |
2013 | | | 12.63 | | | | 0.06 | | | | 4.34 | | | | 4.40 | | | | | | (0.05 | ) | | | — | | | | (0.05 | ) | | | 16.98 | |
2012 | | | 11.30 | | | | 0.05 | | | | 1.28 | | | | 1.33 | | | | | | — | | | | — | | | | — | | | | 12.63 | |
2011 | | | 10.26 | | | | (0.05 | ) | | | 1.09 | | | | 1.04 | | | | | | — | | | | — | | | | — | | | | 11.30 | |
Class C (2/99) | | | | | | | | | | | | | | | | | | | | | | | | | | | | | | | |
2015 | | | 16.06 | | | | (0.07 | ) | | | 1.21 | | | | 1.14 | | | | | | — | | | | — | | | | — | | | | 17.20 | |
2014 | | | 14.76 | | | | (0.07 | ) | | | 1.37 | | | | 1.30 | | | | | | — | | | | — | | | | — | | | | 16.06 | |
2013 | | | 11.02 | | | | (0.05 | ) | | | 3.79 | | | | 3.74 | | | | | | — | | | | — | | | | — | | | | 14.76 | |
2012 | | | 9.93 | | | | (0.04 | ) | | | 1.13 | | | | 1.09 | | | | | | — | | | | — | | | | — | | | | 11.02 | |
2011 | | | 9.08 | | | | (0.12 | ) | | | 0.97 | | | | 0.85 | | | | | | — | | | | — | | | | — | | | | 9.93 | |
Class R3 (9/01) | | | | | | | | | | | | | | | | | | | | | | | | | | | | | | | |
2015 | | | 18.19 | | | | 0.02 | | | | 1.38 | | | | 1.40 | | | | | | (0.03 | ) | | | — | | | | (0.03 | ) | | | 19.56 | |
2014 | | | 16.65 | | | | 0.01 | | | | 1.55 | | | | 1.56 | | | | | | (0.02 | ) | | | — | | | | (0.02 | ) | | | 18.19 | |
2013 | | | 12.39 | | | | 0.01 | | | | 4.27 | | | | 4.28 | | | | | | (0.02 | ) | | | — | | | | (0.02 | ) | | | 16.65 | |
2012 | | | 11.11 | | | | 0.02 | | | | 1.26 | | | | 1.28 | | | | | | — | | | | — | | | | — | | | | 12.39 | |
2011 | | | 10.11 | | | | (0.07 | ) | | | 1.07 | | | | 1.00 | | | | | | — | | | | — | | | | — | | | | 11.11 | |
Class I (8/94) | | | | | | | | | | | | | | | | | | | | | | | | | | | | | | | |
2015 | | | 19.18 | | | | 0.12 | | | | 1.45 | | | | 1.57 | | | | | | (0.12 | ) | | | — | | | | (0.12 | ) | | | 20.63 | |
2014 | | | 17.55 | | | | 0.10 | | | | 1.63 | | | | 1.73 | | | | | | (0.10 | ) | | | — | | | | (0.10 | ) | | | 19.18 | |
2013 | | | 13.06 | | | | 0.10 | | | | 4.48 | | | | 4.58 | | | | | | (0.09 | ) | | | — | | | | (0.09 | ) | | | 17.55 | |
2012 | | | 11.65 | | | | 0.08 | | | | 1.33 | | | | 1.41 | | | | | | — | | | | — | | | | — | | | | 13.06 | |
2011 | | | 10.55 | | | | (0.02 | ) | | | 1.12 | | | | 1.10 | | | | | | — | | | | — | | | | — | | | | 11.65 | |
| | | | | | | | | | | | | | | | | | | | | | | | | | | | | | |
| | | | Ratios/Supplemental Data | |
| | | | | | | | | Ratios to Average
Net Assets Before
Waiver/Reimbursement | | | | | Ratios to Average
Net Assets After
Waiver/Reimbursement(c) | | | | |
| | | | | | | | |
Total
Return(b) | | | Ending
Net
Assets
(000) | | | | | Expenses | | | Net
Investment
Income
(Loss) | | | | | Expenses | | | Net
Investment
Income
(Loss) | | | Portfolio
Turnover
Rate(d) | |
| | | | | | | | | | | | | | | | | | | | | | | | | | | | | | |
| | 7.95 | % | | $ | 48,656 | | | | | | 1.40 | % | | | 0.32 | % | | | | | 1.39 | % | | | 0.34 | % | | | 49 | % |
| | 9.61 | | | | 44,739 | | | | | | 1.47 | | | | 0.25 | | | | | | 1.43 | | | | 0.28 | | | | 55 | |
| | 34.98 | | | | 45,225 | | | | | | 1.47 | | | | 0.37 | | | | | | 1.46 | | | | 0.38 | | | | 56 | |
| | 11.77 | | | | 32,208 | | | | | | 1.58 | | | | 0.26 | | | | | | 1.46 | | | | 0.39 | | | | 46 | |
| | 10.14 | | | | 31,814 | | | | | | 1.48 | | | | (0.41 | ) | | | | | 1.46 | | | | (0.40 | ) | | | 41 | |
| | | | | | | | | | | | | | | | | | | | | | | | | | | | | | |
| | 7.10 | | | | 4,507 | | | | | | 2.15 | | | | (0.44 | ) | | | | | 2.14 | | | | (0.42 | ) | | | 49 | |
| | 8.81 | | | | 3,008 | | | | | | 2.21 | | | | (0.51 | ) | | | | | 2.18 | | | | (0.48 | ) | | | 55 | |
| | 33.94 | | | | 3,297 | | | | | | 2.22 | | | | (0.43 | ) | | | | | 2.20 | | | | (0.42 | ) | | | 56 | |
| | 10.98 | | | | 1,367 | | | | | | 2.34 | | | | (0.47 | ) | | | | | 2.21 | | | | (0.34 | ) | | | 46 | |
| | 9.36 | | | | 1,498 | | | | | | 2.23 | | | | (1.18 | ) | | | | | 2.21 | | | | (1.18 | ) | | | 41 | |
| | | | | | | | | | | | | | | | | | | | | | | | | | | | | | |
| | 7.62 | | | | 14,516 | | | | | | 1.65 | | | | 0.07 | | | | | | 1.64 | | | | 0.09 | | | | 49 | |
| | 9.38 | | | | 11,530 | | | | | | 1.72 | | | | 0.01 | | | | | | 1.68 | | | | 0.04 | | | | 55 | |
| | 34.59 | | | | 8,549 | | | | | | 1.72 | | | | 0.06 | | | | | | 1.71 | | | | 0.07 | | | | 56 | |
| | 11.52 | | | | 2,653 | | | | | | 1.83 | | | | 0.01 | | | | | | 1.71 | | | | 0.14 | | | | 46 | |
| | 9.89 | | | | 2,246 | | | | | | 1.73 | | | | (0.66 | ) | | | | | 1.71 | | | | (0.65 | ) | | | 41 | |
| | | | | | | | | | | | | | | | | | | | | | | | | | | | | | |
| | 8.22 | | | | 91,044 | | | | | | 1.15 | | | | 0.58 | | | | | | 1.14 | | | | 0.59 | | | | 49 | |
| | 9.89 | | | | 71,521 | | | | | | 1.22 | | | | 0.51 | | | | | | 1.18 | | | | 0.54 | | | | 55 | |
| | 35.34 | | | | 48,281 | | | | | | 1.22 | | | | 0.64 | | | | | | 1.21 | | | | 0.65 | | | | 56 | |
| | 12.02 | | | | 41,444 | | | | | | 1.34 | | | | 0.53 | | | | | | 1.21 | | | | 0.66 | | | | 46 | |
| | 10.43 | | | | 48,596 | | | | | | 1.21 | | | | (0.16 | ) | | | | | 1.21 | | | | (0.16 | ) | | | 41 | |
| (a) | Per share Net Investment Income (Loss) is calculated using the average daily shares method. | |
| (b) | Total return is the combination of changes in NAV without any sales charge, reinvested dividend income at NAV and reinvested capital gains distributions at NAV, if any. Total returns are not annualized. | |
| (c) | After fee waiver and/or expense reimbursement from the Adviser, where applicable. | |
| (d) | Portfolio Turnover Rate is calculated based on the lesser of long-term purchases or sales (as disclosed in Note 5 – Investment Transactions) divided by the average long-term market value during the period. | |
See accompanying notes to financial statements.
Notes to
Financial Statements
1. General Information and Significant Accounting Policies
General Information
Trust and Fund Information
Nuveen Investment Funds, Inc. (the “Trust”), is an open-end management investment company registered under the Investment Company Act of 1940, as amended. The Trust is comprised of Nuveen Dividend Value Fund (“Dividend Value”), Nuveen Mid Cap Value Fund (“Mid Cap Value”) and Nuveen Small Cap Value Fund (“Small Cap Value”), (each a “Fund” and collectively, the “Funds”), as diversified funds, among others. The Trust was incorporated in the State of Maryland on August 20, 1987.
The end of the reporting period for the Funds is October 31, 2015, and the period covered by these Notes to Financial Statements is the fiscal year ended October 31, 2015 (the “current fiscal period”).
Investment Adviser
The Funds’ investment adviser is Nuveen Fund Advisors, LLC (the “Adviser”), a wholly-owned subsidiary of Nuveen Investments, Inc. (“Nuveen”). The Adviser is responsible for each Fund’s overall investment strategy and asset allocation decisions. The Adviser has entered into sub-advisory agreements with Nuveen Asset Management, LLC (the “Sub-Adviser”), a subsidiary of the Adviser, under which the Sub-Adviser manages the investment portfolios of the Funds.
Investment Objectives and Principal Investment Strategies
Dividend Value’s investment objective is long-term growth of capital and income. Under normal market conditions, the Fund invests at least 80% of the sum of its net assets and the amount of any borrowings for investment purposes in equity securities. In selecting securities, the Sub-Adviser will invest in companies that it believes have the ability to pay above average dividends and finance expected growth and are trading at attractive valuations. The Fund will attempt to maintain a dividend that will grow over time. As a result, higher-yielding equity securities will generally represent the core holdings of the Fund. However, the Fund also may invest in lower-yielding, higher-growth equity securities if the Sub-Adviser believes they will help balance the portfolio. The Fund’s equity securities include common stocks, convertible preferred stocks, and corporate debt securities that are convertible into common stocks. All such equity securities will provide current income at the time of purchase. The Fund invests in convertible securities in pursuit of both long-term growth of capital and income. The securities’ conversion features provide long-term growth potential, while interest payments on the securities provide income. The Fund may invest in convertible securities without regard to their ratings, and therefore may hold convertible securities which are rated lower than investment grade.
Mid Cap Value’s investment objective is capital appreciation. Under normal market conditions, the Fund invests at least 80% of the sum of its net assets and the amount of any borrowings for investment purposes in common stocks of mid-capitalization companies. Mid-capitalization companies are defined as companies that have market capitalizations within the market capitalization range of the companies in the Russell Midcap® Index on the last business day of the month in which its most recent reconstitution was completed. Reconstitution of the index currently is completed in June of each year. On June 30, 2014, the range was $1.6 billion to $29.9 billion. In selecting stocks, the Sub-Adviser invests in companies that it believes are undervalued relative to other companies in the same industry or market, exhibit good or improving fundamentals, and exhibit an identifiable catalyst that could close the gap between market value and fair value over the next one to two years.
Small Cap Value’s investment objective is capital appreciation. Under normal market conditions, the Fund invests at least 80% of the sum of its net assets and the amount of any borrowings for investment purposes in common stocks of small-capitalization companies. Small capitalization companies are defined as companies that have market capitalizations within the market capitalization range of the companies in the Russell 2000® Index on the last business day of the month in which its most recent reconstitution was completed. Reconstitution of the index currently is completed in June of each year. On June 30, 2014, the range was $143 million to $4.51 billion.
Each Fund may invest up to 15% of its total assets in non-dollar denominated equity securities of non-U.S. issuers. In addition, each Fund may invest up to 25% of its assets, collectively, in non-dollar denominated equity securities of non-U.S. issuers and in dollar-denominated equity securities of non-U.S. issuers that are either listed on a U.S. stock exchange or represented by depositary receipts that may or may not be sponsored by a domestic bank. Up to 15% of the Fund’s total assets may be invested in equity securities of emerging market issuers. Each Fund may utilize options, futures contracts, options on futures contracts and forward foreign currency exchange contracts (“derivatives”). Each Fund may use these derivatives to manage market or business risk, enhance each Fund’s return, or hedge against adverse movements in currency exchange rates.
The Funds’ most recent prospectus provides further descriptions of each Fund’s investment objective, principal investment strategies and principal risks.
Significant Accounting Policies
Each Fund is an investment company and follows accounting and reporting guidance under Financial Accounting Standards Board (FASB) Accounting Standards Codification (ASC) Topic 946 “Financial Services-Investment Companies.” The following is a summary of significant accounting policies followed by the Funds in the preparation of their financial statements in accordance with accounting principles generally accepted in the United States of America (“U.S. GAAP”).
Investment Transactions
Investment transactions are recorded on a trade date basis. Realized gains and losses from investment transactions are determined on the specific identification method, which is the same basis used for federal income tax purposes.
Investment Income
Dividend income is recorded on the ex-dividend date or, for foreign securities, when information is available. Interest income is recorded on an accrual basis. Securities lending income is comprised of fees earned from borrowers and income earned on cash collateral investments, net of lending agent fees.
Professional Fees
Professional fees presented on the Statement of Operations consist of legal fees incurred in the normal course of operations, audit fees, tax consulting fees and, in some cases, workout expenditures. Workout expenditures are incurred in an attempt to protect or enhance an investment or to pursue other claims or legal actions on behalf of Fund shareholders. If a refund is received for workout expenditures paid in a prior reporting period, such amounts will be recognized as “Legal fee refund” on the Statement of Operations.
Dividends and Distributions to Shareholders
Dividends from net investment income are declared and distributed to shareholders annually (except for Dividend Value, which are declared and distributed to shareholders quarterly). Net realized gains from investment transactions, if any, are declared and distributed to shareholders at least annually. Furthermore, capital gains are distributed only to the extent they exceed available capital loss carryforwards.
Distributions to shareholders are recorded on the ex-dividend date. The amount and timing of distributions are determined in accordance with federal income tax regulations, which may differ from U.S. GAAP.
Share Classes and Sales Charges
Class A Shares are generally sold with an up-front sales charge and incur a 0.25% annual 12b-1 service fee. Class A Share purchases of $1 million or more are sold at net asset value (“NAV”) without an up-front sales charge but may be subject to a contingent deferred sales charge (“CDSC”) if redeemed within twelve months of purchase. Class C Shares are sold without an up-front sales charge but incur a 0.75% annual 12b-1 distribution fee and a 0.25% annual 12b-1 service fee. Class C Shares are subject to a CDSC of 1% if redeemed within twelve months of purchase. Class R3 Shares are sold without an up-front sales charge but incur a 0.25% annual 12b-1 distribution fee and a 0.25% annual 12b-1 service fee. Class R6 Shares and Class I Shares are not subject to any sales charge or 12b-1 distribution or service fees.
Multiclass Operations and Allocations
Income and expenses of the Funds that are not directly attributable to a specific class of shares are prorated among the classes based on the relative net assets of each class. Expenses directly attributable to a class of shares are recorded to the specific class. Currently, the only expenses that are allocated on a class-specific basis are 12b-1 distribution and service fees.
Sub-transfer agent fees, which are recognized as a component of “Shareholder servicing agent fees” on the Statement of Operations, are not charged to Class R6 Shares and are prorated among the other classes based on their relative net assets.
Realized and unrealized capital gains and losses of the Funds are prorated among the classes based on the relative net assets of each class.
Indemnifications
Under the Trust’s organizational documents, its officers and directors are indemnified against certain liabilities arising out of the performance of their duties to the Trust. In addition, in the normal course of business, the Trust enters into contracts that provide general indemnifications to other parties. The Trust’s maximum exposure under these arrangements is unknown as this would involve future claims that may be made against the Trust that have not yet occurred. However, the Trust has not had prior claims or losses pursuant to these contracts and expects the risk of loss to be remote.
Netting Agreements
In the ordinary course of business, the Funds may enter into transactions subject to enforceable International Swaps and Derivative Association, Inc. (“ISDA”) master agreements or other similar arrangements (“netting agreements”). Generally, the right to offset in netting agreements allows each Fund to offset certain securities and derivatives with a specific counterparty as well as any collateral received or delivered to that counterparty based on the terms of the agreements. Generally, each Fund manages its cash collateral and securities collateral on a counterparty basis.
Notes to Financial Statements (continued)
The Funds’ investments subject to netting agreements as of the end of the reporting period, if any, are further described in Note 3 – Portfolio Securities and Investments in Derivatives.
Use of Estimates
The preparation of financial statements in conformity with U.S. GAAP requires management to make estimates and assumptions that affect the reported amounts of assets and liabilities at the date of the financial statements and the reported amounts of increases and decreases in net assets from operations during the reporting period. Actual results may differ from those estimates.
2. Investment Valuation and Fair Value Measurements
The fair valuation input levels as described below are for fair value measurement purposes.
Fair value is defined as the price that would be received upon selling an investment or transferring a liability in an orderly transaction to an independent buyer in the principal or most advantageous market for the investment. A three-tier hierarchy is used to maximize the use of observable market data and minimize the use of unobservable inputs and to establish classification of fair value measurements for disclosure purposes. Observable inputs reflect the assumptions market participants would use in pricing the asset or liability. Observable inputs are based on market data obtained from sources independent of the reporting entity. Unobservable inputs reflect the reporting entity’s own assumptions about the assumptions market participants would use in pricing the asset or liability. Unobservable inputs are based on the best information available in the circumstances. The following is a summary of the three-tiered hierarchy of valuation input levels.
| | |
| Level 1 – | | Inputs are unadjusted and prices are determined using quoted prices in active markets for identical securities. |
| Level 2 – | | Prices are determined using other significant observable inputs (including quoted prices for similar securities, interest rates, prepayment speeds, credit risk, etc.). |
| Level 3 – | | Prices are determined using significant unobservable inputs (including management’s assumptions in determining the fair value of investments). |
Common stocks and other equity-type securities are valued at the last sales price on the securities exchange on which such securities are primarily traded and are generally classified as Level 1. Securities primarily traded on the NASDAQ National Market (“NASDAQ”) are valued at the NASDAQ Official Closing Price and are generally classified as Level 1. However, securities traded on a securities exchange or NASDAQ for which there were no transactions on a given day or securities not listed on a securities exchange or NASDAQ are valued at the quoted bid price and are generally classified as Level 2. Prices of certain American Depositary Receipts (“ADR”) held by the Funds that trade in the United States are valued based on the last traded price, official closing price or the most recent bid price of the underlying non-U.S.-traded stock, adjusted as appropriate for the underlying-to-ADR conversion ratio and foreign exchange rate, and from time-to-time may also be adjusted further to take into account material events that may take place after the close of the local non-U.S. market but before the close of the New York Stock Exchange (“NYSE”), which may represent a transfer from a Level 1 to a Level 2 security.
Investments in investment companies are valued at their respective NAVs on the valuation date and are generally classified as Level 1.
Investments initially valued in currencies other than the U.S. dollar are converted to the U.S. dollar using exchange rates obtained from pricing services. As a result, the NAV of the Funds’ shares may be affected by changes in the value of currencies in relation to the U.S. dollar. The value of securities traded in markets outside the United States or denominated in currencies other than the U.S. dollar may be affected significantly on a day that the NYSE is closed and an investor is not able to purchase, redeem or exchange shares. If significant market events occur between the time of determination of the closing price of a foreign security on an exchange and the time that the Funds’ NAV is determined, or if under the Funds’ procedures, the closing price of a foreign security is not deemed to be reliable, the security would be valued at fair value as determined in accordance with procedures established in good faith by the Funds’ Board of Directors (the “Board”). These securities are generally classified as Level 2 or Level 3 depending on the priority of the significant inputs.
Certain securities may not be able to be priced by the pre-established pricing methods as described above. Such securities may be valued by the Board and/or its appointee at fair value. These securities generally include, but are not limited to, restricted securities (securities which may not be publicly sold without registration under the Securities Act of 1933, as amended) for which a pricing service is unable to provide a market price; securities whose trading has been formally suspended; debt securities that have gone into default and for which there is no current market quotation; a security whose market price is not available from a pre-established pricing source; a security with respect to which an event has occurred that is likely to materially affect the value of the security after the market has closed but before the calculation of a Fund’s NAV (as may be the case in non-U.S. markets on which the security is primarily traded) or make it difficult or impossible to obtain a reliable market quotation; and a security whose price, as provided by the pricing service, is not deemed to reflect the security’s fair value. As a general principle, the fair value of a security would appear to be the amount that the owner might reasonably expect to receive for it in a current sale. A variety of factors may be considered in determining the fair value of such securities, which may include consideration of the following: yields or prices of investments of comparable quality, type of issue, coupon, maturity and rating, market quotes or indications of value from security dealers, evaluations of anticipated cash flows or collateral, general market
conditions and other information and analysis, including the obligor’s credit characteristics considered relevant. These securities are generally classified as Level 2 or Level 3 depending on the priority of the significant inputs. Regardless of the method employed to value a particular security, all valuations are subject to review by the Board and/or its appointee.
The inputs or methodologies used for valuing securities are not an indication of the risks associated with investing in those securities. The following is a summary of each Fund’s fair value measurements as of the end of the reporting period:
| | | | | | | | | | | | | | | | |
| Dividend Value | | Level 1 | | | Level 2 | | | Level 3 | | | Total | |
| Long-Term Investments*: | | | | | | | | | | | | | | | | |
Common Stocks | | $ | 1,390,729,364 | | | $ | — | | | $ | — | | | $ | 1,390,729,364 | |
| Investments Purchased with Collateral from Securities Lending | | | 206,759,602 | | | | — | | | | — | | | | 206,759,602 | |
| Short-Term Investments: | | | | | | | | | | | | | | | | |
Money Market Funds | | | 7,948,804 | | | | — | | | | — | | | | 7,948,804 | |
| Total | | $ | 1,605,437,770 | | | $ | — | | | $ | — | | | $ | 1,605,437,770 | |
| | | | |
| Mid Cap Value | | | | | | | | | | | | |
| Long-Term Investments*: | | | | | | | | | | | | | | | | |
Common Stocks | | $ | 117,398,593 | | | $ | — | | | $ | — | | | $ | 117,398,593 | |
| Investments Purchased with Collateral from Securities Lending | | | 36,604,905 | | | | — | | | | — | | | | 36,604,905 | |
| Short-Term Investments: | | | | | | | | | | | | | | | | |
Money Market Funds | | | 993,541 | | | | — | | | | — | | | | 993,541 | |
| Total | | $ | 154,997,039 | | | $ | — | | | $ | — | | | $ | 154,997,039 | |
| | | | |
| Small Cap Value | | | | | | | | | | | | |
| Long-Term Investments*: | | | | | | | | | | | | | | | | |
Common Stocks | | $ | 152,793,111 | | | $ | — | | | $ | — | | | $ | 152,793,111 | |
| Investments Purchased with Collateral from Securities Lending | | | 33,567,177 | | | | — | | | | — | | | | 33,567,177 | |
| Short-Term Investments: | | | | | | | | | | | | | | | | |
Money Market Funds | | | 8,891,955 | | | | — | | | | — | | | | 8,891,955 | |
| Total | | $ | 195,252,243 | | | $ | — | | | $ | — | | | $ | 195,252,243 | |
| * | Refer to the Fund’s Portfolio of Investments for industry classifications. |
The Board is responsible for the valuation process and has appointed the oversight of the daily valuation process to the Adviser’s Valuation Committee. The Valuation Committee, pursuant to the valuation policies and procedures adopted by the Board is responsible for making fair value determinations, evaluating the effectiveness of the Funds’ pricing policies and reporting to the Board. The Valuation Committee is aided in its efforts by the Adviser’s dedicated Securities Valuation Team, which is responsible for administering the daily valuation process and applying fair value methodologies as approved by the Valuation Committee. When determining the reliability of independent pricing services for investments owned by the Funds, the Valuation Committee, among other things, conducts due diligence reviews of the pricing services and monitors the quality of security prices received through various testing reports conducted by the Securities Valuation Team.
The Valuation Committee will consider pricing methodologies it deems relevant and appropriate when making a fair value determination, based on the facts and circumstances specific to the portfolio instrument. Fair value determinations generally will be derived as follows, using public or private market information:
| | (i) | If available, fair value determinations shall be derived by extrapolating from recent transactions or quoted prices for identical or comparable securities. |
| | (ii) | If such information is not available, an analytical valuation methodology may be used based on other available information including, but not limited to: analyst appraisals, research reports, corporate action information, issuer financial statements and shelf registration statements. Such analytical valuation methodologies may include, but are not limited to: multiple of earnings, discount from market value of a similar freely- traded security, discounted cash flow analysis, book value or a multiple thereof, risk premium/yield analysis, yield to maturity and/or fundamental investment analysis. |
The purchase price of a portfolio instrument will be used to fair value the instrument only if no other valuation methodology is available or deemed appropriate, and it is determined that the purchase price fairly reflects the instrument’s current value.
For each portfolio security that has been fair valued pursuant to the policies adopted by the Board, the fair value price is compared against the last available and next available market quotations. The Valuation Committee reviews the results of such testing and fair valuation occurrences are reported to the Board.
Notes to Financial Statements (continued)
3. Portfolio Securities and Investments in Derivatives
Portfolio Securities
Foreign Currency Transactions
To the extent that the Funds invest in securities and/or contracts that are denominated in a currency other than U.S. dollars, the Funds will be subject to currency risk, which is the risk that an increase in the U.S. dollar relative to the foreign currency will reduce returns or portfolio value. Generally, when the U.S. dollar rises in value against a foreign currency, the Funds’ investments denominated in that currency will lose value because their currency is worth fewer U.S. dollars; the opposite effect occurs if the U.S. dollar falls in relative value. Investments and other assets and liabilities denominated in foreign currencies are converted into U.S. dollars on a spot (i.e. cash) basis at the spot rate prevailing in the foreign currency exchange market at the time of valuation. Purchases and sales of investments and income denominated in foreign currencies are translated into U.S. dollars on the respective dates of such transactions.
The books and records of the Funds are maintained in U.S. dollars. Foreign currencies, assets and liabilities are translated into U.S. dollars at 4:00 p.m. Eastern Time. Investment transactions, income and expenses are translated on the respective dates of such transactions. Net realized foreign currency gains and losses resulting from changes in exchange rates include foreign currency gains and losses between trade date and settlement date of the transactions, foreign currency transactions and the difference between the amounts of interest and dividends recorded on the books of the Funds and the amounts actually received.
The realized gains and losses resulting from changes in foreign currency exchange rates and changes in foreign exchange rates associated with (i) foreign currency, (ii) investments, (iii) investments in derivatives and (iv) other assets and liabilities are recognized as a component of “Net realized gain (loss) from investments and foreign currency” on the Statement of Operations, when applicable.
The unrealized gains and losses resulting from changes in foreign currency exchange rates and changes in foreign exchange rates associated with (i) investments and (ii) other assets and liabilities are recognized as a component of “Change in unrealized appreciation (depreciation) of investments and foreign currency” on the Statement of Operations, when applicable. The unrealized gains and losses resulting from changes in foreign exchange rates associated with investments in derivatives are recognized as a component of the respective derivative’s related “Change in net unrealized appreciation (depreciation)” on the Statement of Operations, when applicable.
Securities Lending
In order to generate additional income, the Funds may lend securities representing up to one-third of the value of its total assets (which includes collateral for securities on loan) to broker-dealers, banks or other institutions. When loaning securities, the Funds retain the benefits of owning the securities, including the economic equivalent of dividends or interest generated by the security. The Funds also have the ability to recall the securities on loan at any time.
The Funds’ policy is to receive, at the inception of a loan, cash collateral equal to at least 102% of the value of securities loaned, which is recognized as “Payable for collateral from securities lending program” on the Statement of Assets and Liabilities. Collateral for securities on loan is invested in a money market fund, which is recognized as “Investments purchased with collateral from securities lending, at value” on the Statement of Assets and Liabilities. The market value of the securities loaned is determined at the close of each business day in order to determine the adequacy of the collateral. If the value of the securities on loan increases such that the level of collateralization falls below 100%, additional collateral is received from the borrower on the next business day, which is recognized as “Due from broker” on the Statement of Assets and Liabilities.
Securities out on loan are subject to termination at any time at the option of the borrower or the Funds. Upon termination, the borrower is required to return to the Funds securities identical to the securities loaned. Generally, in the event the borrower defaults on its obligation to return the loaned securities, the Funds have the right to use the collateral to acquire identical securities. In the event the Funds are delayed or prevented from exercising its right to dispose of the collateral, there may be a loss to the Funds. Under the Funds’ securities lending agreement, however, the securities lending agent has indemnified the Funds against losses resulting from borrower default, except to the extent that those losses result from a decrease in the value of the collateral due to its investment by the Funds. The Funds bear the risk of loss with respect to the investment of collateral.
The Funds’ custodian, U.S. Bank National Association, serves as their securities lending agent. Each Fund pays the custodian a fee based on its proportional share of the custodian’s expense of operating its securities lending program. Income earned from the securities lending program is paid to the Funds, net of any fees paid. Income from securities lending, net of fees paid, is recognized as “Securities lending income, net” on the Statement of Operations.
The following table presents the securities out on loan for the Funds, and the collateral delivered related to those securities, as of the end of the reporting period.
| | | | | | | | | | | | | | |
Fund | | Asset Class out on Loan | | Long-Term
Investments, at Value | | | Collateral
Pledged (From)
Counterparty* | | | Net
Exposure | |
Dividend Value | | Common Stocks | | $ | 198,557,778 | | | $ | (198,557,778 | ) | | $ | — | |
Mid Cap Value | | Common Stocks | | | 34,925,339 | | | | (34,925,339 | ) | | | — | |
Small Cap Value | | Common Stocks | | | 32,322,395 | | | | (32,322,395 | ) | | | — | |
| * | As of the end of the reporting period, the value of the collateral pledged from the counterparty exceeded the value of the securities out on loan. Refer to the Fund’s Portfolio of Investments for details on the securities out on loan. |
Securities lending fees paid by each Fund during the current fiscal period were as follows:
| | | | | | | | | | | | |
| | | Dividend
Value | | | Mid Cap
Value | | | Small Cap
Value | |
| Securities lending fees paid | | $ | 24,387 | | | $ | 4,425 | | | $ | 22,248 | |
Investments in Derivatives
Each Fund is authorized to invest in certain derivative instruments. The Funds record derivative instruments at fair value, with changes in fair value recognized on the Statement of Operations, when applicable. Even though the Funds’ investments in derivatives may represent economic hedges, they are not considered to be hedge transactions for financial reporting purposes.
Although the Funds are authorized to invest in derivative instruments, and may do so in the future, they did not make any such investments during the current fiscal period.
Market and Counterparty Credit Risk
In the normal course of business each Fund may invest in financial instruments and enter into financial transactions where risk of potential loss exists due to changes in the market (market risk) or failure of the other party to the transaction to perform (counterparty credit risk). The potential loss could exceed the value of the financial assets recorded on the financial statements. Financial assets, which potentially expose each Fund to counterparty credit risk, consist principally of cash due from counterparties on forward, option and swap transactions, when applicable. The extent of each Fund’s exposure to counterparty credit risk in respect to these financial assets approximates their carrying value as recorded on the Statement of Assets and Liabilities.
Each Fund helps manage counterparty credit risk by entering into agreements only with counterparties the Adviser believes have the financial resources to honor their obligations and by having the Adviser monitor the financial stability of the counterparties. Additionally, counterparties may be required to pledge collateral daily (based on the daily valuation of the financial asset) on behalf of each Fund with a value approximately equal to the amount of any unrealized gain above a pre-determined threshold. Reciprocally, when each Fund has an unrealized loss, the Funds have instructed the custodian to pledge assets of the Funds as collateral with a value approximately equal to the amount of the unrealized loss above a pre-determined threshold. Collateral pledges are monitored and subsequently adjusted if and when the valuations fluctuate, either up or down, by at least the pre-determined threshold amount.
4. Fund Shares
Transactions in Fund shares during the current and prior fiscal period were as follows:
| | | | | | | | | | | | | | | | |
| | | Year Ended
10/31/15 | | | Year Ended
10/31/14 | |
| Dividend Value | | Shares | | | Amount | | | Shares | | | Amount | |
| Shares sold: | | | | | | | | | | | | | | | | |
Class A | | | 2,424,656 | | | $ | 39,498,173 | | | | 4,089,137 | | | $ | 69,319,765 | |
Class A – automatic conversion of Class B Shares | | | — | | | | — | | | | 61,967 | | | | 1,087,081 | |
Class B – exchanges | | | — | | | | — | | | | 4,880 | | | | 81,167 | |
Class C | | | 309,435 | | | | 5,036,236 | | | | 892,598 | | | | 14,929,926 | |
Class R3 | | | 734,617 | | | | 11,943,772 | | | | 965,275 | | | | 16,345,358 | |
Class R6 | | | 315,607 | | | | 5,276,030 | | | | 124,270 | | | | 2,113,781 | |
Class I | | | 6,957,058 | | | | 114,678,800 | | | | 12,340,055 | | | | 211,881,409 | |
| Shares issued to shareholders due to reinvestment of distributions: | | | | | | | | | | | | | | | | |
Class A | | | 1,810,421 | | | | 28,853,242 | | | | 2,615,513 | | | | 42,679,523 | |
Class B | | | — | | | | — | | | | 6,727 | | | | 107,534 | |
Class C | | | 265,889 | | | | 4,176,547 | | | | 353,908 | | | | 5,682,790 | |
Class R3 | | | 232,274 | | | | 3,692,283 | | | | 274,621 | | | | 4,470,108 | |
Class R6 | | | 293,862 | | | | 4,731,582 | | | | 408,485 | | | | 6,732,902 | |
Class I | | | 3,487,027 | | | | 56,097,243 | | | | 4,592,206 | | | | 75,521,447 | |
| | | | 16,830,846 | | | | 273,983,908 | | | | 26,729,642 | | | | 450,952,791 | |
| Shares redeemed: | | | | | | | | | | | | | | | | |
Class A | | | (5,926,661 | ) | | | (96,466,967 | ) | | | (7,059,831 | ) | | | (120,561,840 | ) |
Class B | | | — | | | | — | | | | (20,202 | ) | | | (340,226 | ) |
Class B – automatic conversion to Class A Shares | | | — | | | | — | | | | (62,705 | ) | | | (1,087,081 | ) |
Class C | | | (939,209 | ) | | | (15,092,734 | ) | | | (849,312 | ) | | | (14,168,207 | ) |
Class R3 | | | (1,049,386 | ) | | | (17,076,854 | ) | | | (628,622 | ) | | | (10,608,118 | ) |
Class R6 | | | (635,972 | ) | | | (10,727,069 | ) | | | (767,079 | ) | | | (13,434,118 | ) |
Class I | | | (19,092,966 | ) | | | (312,324,710 | ) | | | (14,157,573 | ) | | | (242,578,668 | ) |
| | | | (27,644,194 | ) | | | (451,688,334 | ) | | | (23,545,324 | ) | | | (402,778,258 | ) |
| Net increase (decrease) | | | (10,813,348 | ) | | $ | (177,704,426 | ) | | | 3,184,318 | | | $ | 48,174,533 | |
Notes to Financial Statements (continued)
| | | | | | | | | | | | | | | | |
| | | Year Ended
10/31/15 | | | Year Ended
10/31/14 | |
| Mid Cap Value | | Shares | | | Amount | | | Shares | | | Amount | |
| Shares sold: | | | | | | | | | | | | | | | | |
Class A | | | 80,414 | | | $ | 2,851,498 | | | | 123,774 | | | | 4,118,093 | |
Class A – automatic conversion of Class B Shares | | | — | | | | — | | | | 31,025 | | | | 1,063,278 | |
Class B | | | — | | | | — | | | | — | | | | — | |
Class C | | | 13,059 | | | | 447,157 | | | | 19,422 | | | | 635,355 | |
Class R3 | | | 32,371 | | | | 1,151,229 | | | | 46,042 | | | | 1,520,496 | |
Class I | | | 111,344 | | | | 3,981,183 | | | | 250,328 | | | | 8,299,265 | |
| Shares issued to shareholders due to reinvestment of distributions: | | | | | | | | | | | | | | | | |
Class A | | | 9,129 | | | | 328,561 | | | | 5,453 | | | | 178,246 | |
Class B | | | — | | | | — | | | | — | | | | — | |
Class C | | | 261 | | | | 9,039 | | | | — | | | | — | |
Class R3 | | | 1,330 | | | | 47,658 | | | | 708 | | | | 23,054 | |
Class I | | | 7,192 | | | | 259,290 | | | | 8,333 | | | | 272,817 | |
| | | | 255,100 | | | | 9,075,615 | | | | 485,085 | | | | 16,110,604 | |
| Shares redeemed: | | | | | | | | | | | | | | | | |
Class A | | | (188,525 | ) | | | (6,729,568 | ) | | | (185,664 | ) | | | (6,166,307 | ) |
Class B | | | — | | | | — | | | | (8,608 | ) | | | (266,059 | ) |
Class B – automatic conversion to Class A Shares | | | — | | | | — | | | | (33,048 | ) | | | (1,063,278 | ) |
Class C | | | (33,626 | ) | | | (1,156,437 | ) | | | (51,490 | ) | | | (1,640,918 | ) |
Class R3 | | | (75,285 | ) | | | (2,671,845 | ) | | | (80,375 | ) | | | (2,654,259 | ) |
Class I | | | (349,402 | ) | | | (12,586,488 | ) | | | (1,018,843 | ) | | | (34,381,867 | ) |
| | | | (646,838 | ) | | | (23,144,338 | ) | | | (1,378,028 | ) | | | (46,172,688 | ) |
| Net increase (decrease) | | | (391,738 | ) | | $ | (14,068,723 | ) | | | (892,943 | ) | | $ | (30,062,084 | ) |
| | | | | | | | | | | | | | | | |
| | | Year Ended
10/31/15 | | | Year Ended
10/31/14 | |
| Small Cap Value | | Shares | | | Amount | | | Shares | | | Amount | |
| Shares sold: | | | | | | | | | | | | | | | | |
Class A | | | 463,591 | | | $ | 9,062,521 | | | | 340,128 | | | $ | 6,160,911 | |
Class C | | | 113,427 | | | | 1,912,427 | | | | 59,385 | | | | 939,639 | |
Class R3 | | | 318,020 | | | | 6,035,655 | | | | 343,394 | | | | 6,069,984 | |
Class I | | | 1,452,674 | | | | 29,347,026 | | | | 2,007,566 | | | | 37,336,600 | |
| Shares issued to shareholders due to reinvestment of distributions: | | | | | | | | | | | | | | | | |
Class A | | | 8,762 | | | | 167,348 | | | | 8,667 | | | | 156,692 | |
Class C | | | — | | | | — | | | | — | | | | — | |
Class R3 | | | 836 | | | | 15,678 | | | | 611 | | | | 10,859 | |
Class I | | | 18,596 | | | | 366,519 | | | | 10,516 | | | | 196,130 | |
| | | | 2,375,906 | | | | 46,907,174 | | | | 2,770,267 | | | | 50,870,815 | |
| Shares redeemed: | | | | | | | | | | | | | | | | |
Class A | | | (445,277 | ) | | | (8,535,603 | ) | | | (600,505 | ) | | | (10,828,978 | ) |
Class C | | | (38,815 | ) | | | (646,389 | ) | | | (95,436 | ) | | | (1,475,184 | ) |
Class R3 | | | (210,587 | ) | | | (3,994,821 | ) | | | (223,393 | ) | | | (3,965,698 | ) |
Class I | | | (787,140 | ) | | | (15,758,817 | ) | | | (1,040,269 | ) | | | (19,514,660 | ) |
| | | | (1,481,819 | ) | | | (28,935,630 | ) | | | (1,959,603 | ) | | | (35,784,520 | ) |
| Net increase (decrease) | | | 894,087 | | | $ | 17,971,544 | | | | 810,664 | | | $ | 15,086,295 | |
5. Investment Transactions
Long-term purchases and sales (excluding investments purchased with collateral from securities lending) during the current fiscal period were as follows:
| | | | | | | | | | | | |
| | | Dividend
Value | | | Mid Cap
Value | | | Small Cap
Value | |
| Purchases | | $ | 834,100,347 | | | $ | 138,340,795 | | | $ | 79,371,662 | |
| Sales | | | 1,101,757,211 | | | | 152,816,353 | | | | 64,830,172 | |
6. Income Tax Information
Each Fund is a separate taxpayer for federal income tax purposes. Each Fund intends to distribute substantially all of its net investment income and net capital gains to shareholders and to otherwise comply with the requirements of Subchapter M of the Internal Revenue Code applicable to regulated investment companies. Therefore, no federal income tax provision is required.
For all open tax years and all major taxing jurisdictions, management of the Funds has concluded that there are no significant uncertain tax positions that would require recognition in the financial statements. Open tax years are those that are open for examination by taxing authorities (i.e., generally the last four tax year ends and the interim tax period since then). Furthermore, management of the Funds is also not aware of any tax positions for which it is reasonably possible that the total amounts of unrecognized tax benefits will significantly change in the next twelve months.
The following information is presented on an income tax basis. Differences between amounts for financial statement and federal income tax purposes are primarily due to timing differences in recognizing certain gains and losses on investment transactions. To the extent that differences arise that are permanent in nature, such amounts are reclassified within the capital accounts as detailed below. Temporary differences do not require reclassification. Temporary and permanent differences do not impact the NAVs of the Funds.
As of October 31, 2015, the cost and unrealized appreciation (depreciation) of investments, as determined on a federal income tax basis, were as follows:
| | | | | | | | | | | | |
| | | Dividend
Value | | | Mid Cap
Value | | | Small Cap
Value | |
| Cost of investments | | $ | 1,244,457,807 | | | $ | 147,326,846 | | | $ | 176,433,068 | |
| Gross unrealized: | | | | | | | | | | | | |
Appreciation | | | 374,629,907 | | | | 13,093,525 | | | | 24,619,425 | |
Depreciation | | | (13,649,944 | ) | | | (5,423,332 | ) | | | (5,800,250 | ) |
| Net unrealized appreciation (depreciation) of investments | | $ | 360,979,963 | | | $ | 7,670,193 | | | $ | 18,819,175 | |
Permanent differences, primarily due to the federal taxes paid, foreign currency transactions, real estate investment trust adjustments, tax equalization, investments in partnerships, deemed dividend due to corporate actions and tax basis earnings and profits adjustments, resulted in reclassifications among the Funds’ components of net assets as of October 31, 2015, the Funds’ tax year end, as follows:
| | | | | | | | | | | | |
| | | Dividend
Value | | | Mid Cap
Value | | | Small Cap
Value | |
| Capital paid-in | | $ | 9,675,997 | | | $ | 122,987 | | | $ | 53,751 | |
| Undistributed (Over-distribution of) net investment income | | | 7,538,648 | | | | (1 | ) | | | 140 | |
| Accumulated net realized gain (loss) | | | (17,214,645 | ) | | | (122,986 | ) | | | (53,891 | ) |
The tax components of undistributed net ordinary income and net long-term capital gains as of October 31, 2015, the Funds’ tax year end, were as follows:
| | | | | | | | | | | | |
| | | Dividend
Value | | | Mid Cap
Value | | | Small Cap
Value | |
| Undistributed net ordinary income1 | | $ | 4,828,860 | | | $ | 435,441 | | | $ | 356,381 | |
| Undistributed net long-term capital gains | | | 93,084,750 | | | | 3,465,463 | | | | 2,861,604 | |
| 1 | Net ordinary income consists of net taxable income derived from dividends, interest and net short-term capital gains, if any. |
The tax character of distributions paid during the Funds’ tax years ended October 31, 2015 and October 31, 2014, was designated for purposes of the dividends paid deduction as follows:
| | | | | | | | | | | | |
| 2015 | | Dividend
Value | | | Mid Cap
Value | | | Small Cap
Value | |
| Distributions from net ordinary income2 | | $ | 34,828,160 | | | $ | 1,190,076 | | | $ | 624,998 | |
| Distributions from net long-term capital gains | | | 109,864,663 | | | | — | | | | — | |
| | | |
| 2014 | | Dividend
Value | | | Mid Cap
Value | | | Small Cap
Value | |
| Distributions from net ordinary income2 | | $ | 54,285,008 | | | $ | 858,059 | | | $ | 451,461 | |
| Distributions from net long-term capital gains | | | 147,801,544 | | | | — | | | | — | |
| 2 | Net ordinary income consists of net taxable income derived from dividends, interest, net short-term capital gains and current year earnings and profits attributable to realized gains, if any. |
Notes to Financial Statements (continued)
As of October 31, 2015, the Funds’ tax year end, the following Fund had unused capital loss carryforwards available for federal income tax purposes to be applied against future capital gains, if any. If not applied, the carryforwards will expire as shown in the following table. The losses not subject to expiration will be utilized first by the Fund.
| | | | |
| | | Dividend3 Value | |
| Expiration: | | | | |
October 31, 2016 | | $ | 4,135,445 | |
| Not subject to expiration | | | — | |
| Total | | $ | 4,135,445 | |
| 3 | A portion of Dividend Value’s capital loss carryforward is subject to an annual limitation under the Internal Revenue Code and related regulations. |
During the Funds’ tax year ended October 31, 2015, the Funds utilized capital loss carryforwards as follows:
| | | | | | | | | | | | |
| | | Dividend
Value | | | Mid Cap
Value | | | Small Cap
Value | |
| Utilized capital loss carryforwards | | $ | 4,135,445 | | | $ | 6,496,564 | | | $ | 7,516,774 | |
7. Management Fees and Other Transactions with Affiliates
Each Fund’s management fee compensates the Adviser for overall investment advisory and administrative services and general office facilities. The Sub-Adviser is compensated for its services to the Funds from the management fees paid to the Adviser.
Each Fund’s management fee consists of two components – a fund-level fee, based only on the amount of assets within each individual Fund, and a complex-level fee, based on the aggregate amount of all eligible fund assets managed by the Adviser. This pricing structure enables each Fund’s shareholders to benefit from growth in the assets within their respective Fund as well as from growth in the amount of complex-wide assets managed by the Adviser.
The annual Fund-level fee, payable monthly, for each Fund is calculated according to the following schedule:
| | | | | | | | | | | | |
| Average Daily Net Assets | | Dividend
Value | | | Mid Cap
Value | | | Small Cap
Value | |
| For the first $125 million | | | 0.6000 | % | | | 0.7000 | % | | | 0.7000 | % |
| For the next $125 million | | | 0.5875 | | | | 0.6875 | | | | 0.6875 | |
| For the next $250 million | | | 0.5750 | | | | 0.6750 | | | | 0.6750 | |
| For the next $500 million | | | 0.5625 | | | | 0.6625 | | | | 0.6625 | |
| For the next $1 billion | | | 0.5500 | | | | 0.6500 | | | | 0.6500 | |
| For net assets over $2 billion | | | 0.5250 | | | | 0.6250 | | | | 0.6250 | |
The annual complex-level fee, payable monthly, for each Fund is determined by taking the complex-level fee rate, which is based on the aggregate amount of “eligible assets” of all Nuveen funds as set forth in the schedule below, and making, as appropriate, an upward adjustment to that rate based upon the percentage of the particular fund’s assets that are not “eligible assets.” The complex level fee schedule for each Fund is as follows:
| | | | |
| Complex-Level Asset Breakpoint Level* | | Effective Rate at Breakpoint Level | |
| $55 billion | | | 0.2000 | % |
| $56 billion | | | 0.1996 | |
| $57 billion | | | 0.1989 | |
| $60 billion | | | 0.1961 | |
| $63 billion | | | 0.1931 | |
| $66 billion | | | 0.1900 | |
| $71 billion | | | 0.1851 | |
| $76 billion | | | 0.1806 | |
| $80 billion | | | 0.1773 | |
| $91 billion | | | 0.1691 | |
| $125 billion | | | 0.1599 | |
| $200 billion | | | 0.1505 | |
| $250 billion | | | 0.1469 | |
| $300 billion | | | 0.1445 | |
| * | The complex-level fee is calculated based upon the aggregate daily “eligible assets” of all Nuveen funds. Eligible assets do not include assets attributable to investments in other Nuveen funds or assets in excess of $2 billion added to the Nuveen fund complex in connection with the Adviser’s assumption of the management of the former First American Funds effective January 1, 2011. Eligible assets include closed-end fund assets managed by the Adviser that are attributable to certain types of leverage. For these purposes, leverage includes the closed-end funds’ use of preferred stock and borrowings and certain investments in the residual interest certificates (also called inverse floating rate securities) in tender option bond (TOB) trusts, including the portion of assets held by the TOB trust that has been effectively financed by the trust’s issuance of floating rate securities, subject to an agreement by the Adviser as to certain funds to limit the amount of such assets for determining eligible assets in certain circumstances. As of October 31, 2015, the complex-level fee rate for each Fund was as follows: |
| | | | |
| Fund | | Complex-Level Fee | |
Dividend Value | | | 0.1909 | % |
Mid Cap Value | | | 0.2000 | |
Small Cap Value | | | 0.1858 | |
The Adviser has agreed to waive fees and/or reimburse expenses (“Expense Cap”) of Mid Cap Value and Small Cap Value so that total annual Fund operating expenses (excluding 12b-1 distribution and/or service fees, interest expenses, taxes, acquired fund fees and expenses, fees incurred in acquiring and disposing of portfolio securities and extraordinary expenses) do not exceed the average daily net assets of any class of Fund shares in the amounts and for the time periods stated in the following table.
| | | | | | | | |
| Fund | | Expense Cap | | | Expense Cap
Expiration Date | |
Mid Cap Value | | | 1.05 | %* | | | September 30, 2016 | |
Small Cap Value | | | 1.15 | | | | September 30, 2016 | |
| * | Effective May 14, 2015, the Fund’s Expense Cap changed from 1.09% to 1.05%. |
The Trust pays no compensation directly to those of its directors who are affiliated with the Adviser or to its officers, all of whom receive remuneration for their services to the Trust from the Adviser or its affiliates. The Board has adopted a deferred compensation plan for independent directors that enables directors to elect to defer receipt of all or a portion of the annual compensation they are entitled to receive from certain Nuveen-advised funds. Under the plan, deferred amounts are treated as though equal dollar amounts had been invested in shares of select Nuveen-advised funds.
During the current fiscal period Nuveen Securities, LLC (the “Distributor”), a wholly-owned subsidiary of Nuveen, collected sales charges on purchases of Class A Shares, the majority of which were paid out as concessions to financial intermediaries as follows:
| | | | | | | | | | | | |
| | | Dividend
Value | | | Mid Cap
Value | | | Small Cap
Value | |
| Sales charges collected (Unaudited) | | $ | 228,784 | | | $ | 20,785 | | | $ | 54,910 | |
| Paid to financial intermediaries (Unaudited) | | | 203,392 | | | | 18,329 | | | | 48,886 | |
The Distributor also received 12b-1 service fees on Class A Shares, substantially all of which were paid to compensate financial intermediaries for providing services to shareholders relating to their investments.
During the current fiscal period, the Distributor compensated financial intermediaries directly with commission advances at the time of purchase as follows:
| | | | | | | | | | | | |
| | | Dividend
Value | | | Mid Cap
Value | | | Small Cap
Value | |
| Commission advances (Unaudited) | | $ | 58,049 | | | $ | 4,125 | | | $ | 19,004 | |
Notes to Financial Statements (continued)
To compensate for commissions advanced to financial intermediaries, all 12b-1 service and distribution fees collected on Class C Shares during the first year following a purchase are retained by the Distributor. During the current fiscal period, the Distributor retained such 12b-1 fees as follows:
| | | | | | | | | | | | |
| | | Dividend
Value | | | Mid Cap
Value | | | Small Cap
Value | |
| 12b-1 fees retained (Unaudited) | | $ | 57,544 | | | $ | 5,626 | | | $ | 8,845 | |
The remaining 12b-1 fees charged were paid to compensate financial intermediaries for providing services to shareholders relating to their investments.
The Distributor also collected and retained CDSC on share redemptions during the current fiscal period as follows:
| | | | | | | | | | | | |
| | | Dividend
Value | | | Mid Cap
Value | | | Small Cap
Value | |
| CDSC retained (Unaudited) | | $ | 5,546 | | | $ | 4,138 | | | $ | 824 | |
8. Borrowing Arrangements
The Funds, along with certain other funds managed by the Adviser (“Participating Funds”), established a 364-day, $2.53 billion standby credit facility with a group of lenders, under which the Participating Funds may borrow for various purposes other than leveraging for investment purposes. A large portion of this facility’s capacity (and its associated costs as described below) is currently dedicated for use by a small number of Participating Funds, which does not include any of the Funds covered by this shareholder report. The remaining capacity under the facility (and the corresponding portion of the facility’s annual costs) is separately dedicated to most of the other open-end funds in the Nuveen fund family, including all of the Funds covered by this shareholder report, along with a number of Nuveen closed-end funds. The credit facility expires in July 2016 unless extended or renewed.
The credit facility has the following terms: a fee of 0.15% per annum on unused commitment amounts, and interest at a rate equal to the higher of (a) one-month LIBOR (London Inter-Bank Offered Rate) plus 1.25% per annum or (b) the Fed Funds rate plus 1.25% per annum on amounts borrowed. Participating Funds paid administration, legal and arrangement fees, which are recognized as a component of “Other expenses” on the Statement of Operations, and along with commitment fees, have been allocated among such Participating Funds based upon the relative proportions of the facility’s aggregate capacity reserved for them and other factors deemed relevant by the Adviser and the Board of each Participating Fund.
During the current fiscal period, the Funds did not utilize this facility.
9. Subsequent Events
Change in Contingent Deferred Sales Charge (CDSC) Schedule
Effective November 1, 2015, shareholders purchasing $1 million or more of Class A Shares at NAV without an up-front sales charge will be assessed a CDSC of 1.00% on any shares redeemed within eighteen months of purchase, unless the redemption is eligible for a CDSC reduction or waiver as specified in the Funds’ statement of additional information.
Additional
Fund Information (Unaudited)
| | | | | | | | | | |
| | | | | |
| | Fund Manager Nuveen Fund Advisors, LLC 333 West Wacker Drive Chicago, IL 60606 Sub-Adviser Nuveen Asset Management, LLC 333 West Wacker Drive Chicago, IL 60606 | | Independent Registered
Public Accounting Firm PricewaterhouseCoopers LLP Chicago, IL 60606 Custodian U.S. Bank National Association Milwaukee, WI 53202 | | Legal Counsel Chapman and Cutler LLP Chicago, IL 60603 | | Transfer Agent and
Shareholder Services Boston Financial
Data Services, Inc. Nuveen Investor Services P.O. Box 8530 Boston, MA 02266-8530 (800) 257-8787 | | |
| | | | | | | | | | | | | | |
| | | | | |
| | | | | | | | | | |
| | |
| | Distribution Information: The Funds hereby designate their percentages of dividends paid from net ordinary income as dividends qualifying for the 70% dividends received deduction (“DRD”) for corporations and their percentages as qualified dividend income (“QDI”) for individuals under Section 1 (h)(11) of the Internal Revenue Code as shown in the accompanying table. The actual qualified dividend income distributions will be reported to shareholders on Form 1099-DIV which will be sent to shareholders shortly after calendar year end. | | |
| | | | | | | |
| | | | | | | | | Dividend Value | | Mid Cap Value | | Small Cap Value | | |
| | % QDI | | 100% | | 79% | | 100% | | |
| | % DRD | | 91% | | 67% | | 100% | | |
| | |
| | Long-Term Capital Gain Distributions: The Funds hereby designate as long-term capital gain dividends, pursuant to Internal Revenue Code Section 852 (b)(3), the amount shown in the accompanying table or, if greater, the amount necessary to reduce earnings and profits of the Funds related to net capital gain to zero for the tax year ended October 31, 2015: | | |
| | | | | | | |
| | | | | | | | | Dividend Value | | Mid Cap Value | | Small Cap Value | | |
| | Long-term capital gain dividends | | $121,423,994 | | $122,997 | | $53,763 | | |
| | | |
| | | | | | |
| | |
| | Quarterly Form N-Q Portfolio of Investments Information: Each Fund is required to file its complete schedule of portfolio holdings with the Securities and Exchange Commission (SEC) for the first and third quarters of each fiscal year on Form N-Q. You may obtain this information directly from the SEC. Visit the SEC on-line at http://www.sec.gov or in person at the SEC’s Public Reference Room in Washington, D.C. Call the SEC toll-free at (800) SEC-0330 for room hours and operation. | | |
| | | |
| | | | | | |
| | |
| | Nuveen Funds’ Proxy Voting Information: You may obtain (i) information regarding how each fund voted proxies relating to portfolio securities held during the most recent twelve-month period ended June 30, without charge, upon request, by calling Nuveen Investments toll-free at (800) 257-8787 or on Nuveen’s website at www.nuveen.com and (ii) a description of the policies and procedures that each fund used to determine how to vote proxies relating to portfolio securities without charge, upon request, by calling Nuveen Investments toll-free at (800) 257-8787. You may also obtain this information directly from the SEC. Visit the SEC on-line at http://www.sec.gov. | | |
| | | |
| | | | | | |
| | |
| | FINRA BrokerCheck: The Financial Industry Regulatory Authority (FINRA) provides information regarding the disciplinary history of FINRA member firms and associated investment professionals. This information as well as an investor brochure describing FINRA BrokerCheck is available to the public by calling the FINRA BrokerCheck Hotline number at (800) 289-9999 or by visiting www.FINRA.org. | | |
Glossary of Terms
Used in this Report
Average Annual Total Return: This is a commonly used method to express an investment’s performance over a particular, usually multi-year time period. It expresses the return that would have been necessary each year to equal the investment’s actual cumulative performance (including change in NAV or offer price and reinvested distributions and capital gains, if any) over the time period being considered.
Gross Domestic Product (GDP): The total market value of all final goods and services produced in a country/region in a given year, equal to total consumer, investment and government spending, plus the value of exports, minus the value of imports.
Lipper Equity Income Funds Classification Average: Represents the average annualized total return for all reporting funds in the Lipper Equity Income Funds Classification. Lipper returns account for the effects of management fees and assume reinvestment of distributions but do not reflect any applicable sales charges.
Lipper Mid-Cap Value Funds Classification Average: Represents the average annualized total return for all reporting funds in the Lipper Mid-Cap Value Funds Classification. Lipper returns account for the effects of management fees and assume reinvestment of distributions but do not reflect any applicable sales charges.
Lipper Small-Cap Value Funds Classification Average: Represents the average annualized total return for all reporting funds in the Lipper Small-Cap Value Funds Classification. Lipper returns account for the effects of management fees and assume reinvestment of distributions but do not reflect any applicable sales charges.
Market Capitalization: The market capitalization of a company is equal to the number of the company’s common shares outstanding multiplied by the current price of the company’s stock.
MSCI EAFE Index: The MSCI (Morgan Stanley Capital International) EAFE (Europe, Australasia, Far East) Index is a free float-adjusted market capitalization weighted index designed to measure developed market equity performance, excluding the U.S. and Canada. The index returns assume reinvestment of distributions, but do not reflect any applicable sales charges or management fees.
MSCI Emerging Markets Index: A free-float-adjusted market capitalization index that is designed to measure equity market performance in the global emerging markets. Index returns assume reinvestment of distributions, but do not reflect any applicable sales charges or management fees.
Net Asset Value (NAV) Per Share: A fund’s Net Assets is equal to its total assets (securities, cash and accrued earnings) less its total liabilities. For funds with multiple classes, Net Assets are determined separately for each share class. NAV per share is equal to the fund’s (or share class’) Net Assets divided by its number of shares outstanding.
Russell 1000® Index: An unmanaged index, considered representative of large-cap stocks. The index returns assume reinvestment of distributions, but do not reflect any applicable sales charges or management fees.
Russell 1000® Value Index: An index that measures the performance of those Russell 1000 companies with lower price-to-book ratios and lower forecasted growth values. The index returns assume reinvestment of distributions, but do not reflect any applicable sales charges or management fees.
Russell 2000® Index: An index that measures the performance of the small-cap segment of the U.S. equity universe. The Russell 2000® Index is a subset of the Russell 3000® Index representing approximately 10% of the total market capitalization of that index. It includes approximately 2,000 of the smallest securities based on a combination of their market cap and current index membership. The index returns assume reinvestment of distributions, but do not reflect any applicable sales charges or management fees.
Russell 2000® Value Index: An index that measures the performance of those Russell 2000 companies with lower price-to-book ratios and lower forecasted growth values. The index returns assume reinvestment of distributions, but do not reflect any applicable sales charges or management fees.
Russell Midcap® Value Index: An index that measures the performance of the mid-cap value segment of the U.S. equity universe. It includes those Russell Midcap Index companies with lower price-to-book ratios and lower forecasted growth values. The index returns assume reinvestment of distributions, but do not reflect any applicable sales charges or management fees.
S&P 500® Index: An unmanaged index generally considered representative of the U.S. stock market. Index returns assume reinvestment of distributions, but do not include the effects of any applicable sales charges or management fees.
Tax Equalization: The practice of treating a portion of the distribution made to a redeeming shareholder, which represents his proportionate part of undistributed net investment income and capital gain as a distribution for tax purposes. Such amounts are referred to as the equalization debits (or payments) and will be considered a distribution to the shareholder of net investment income and capital gain for calculation of the fund’s dividends paid deduction.
Trustees
and Officers (Unaudited)
The management of the Funds, including general supervision of the duties performed for the Funds by the Adviser, is the responsibility of the Board of trustees of the Funds. The number of directors of the Funds is currently set at eleven. None of the trustees who are not “interested” persons of the Funds (referred to herein as “independent trustees”) has ever been a director or employee of, or consultant to, Nuveen or its affiliates. The names and business addresses of the trustees and officers of the Funds, their principal occupations and other affiliations during the past five years, the number of portfolios each oversees and other directorships they hold are set forth below.
The Funds’ Statement of Additional Information (“SAI”) includes more information about the trustees. To request a free copy, call Nuveen Investments at (800) 257-8787 or visit the Funds’ website at www.nuveen.com.
| | | | | | | | |
Name, Year of Birth & Address | | Position(s) Held with the Funds | | Year First Elected or Appointed (1) | | Principal Occupation(s) Including other Directorships During Past 5 Years | | Number of Portfolios in Fund Complex Overseen by Trustee |
| | | |
| Independent Trustee: | | | | |
William J. Schneider 1944 333 W. Wacker Drive Chicago, IL 60606 | | Chairman of the Board and Trustee | | 1996 | | Chairman of Miller-Valentine Partners, a real estate investment company; formerly, Senior Partner and Chief Operating Officer (retired 2004) of Miller-Valentine Group; owner in several other Miller-Valentine entities; Board Member of Med-America Health System, and WDPR Public Radio Station; formerly, member, Business Advisory Council, Cleveland Federal Reserve Bank and University of Dayton Business School Advisory Council. | | 196 |
Jack B. Evans 1948 333 W. Wacker Drive Chicago, IL 60606 | | Trustee | | 1999 | | President, The Hall-Perrine Foundation, a private philanthropic corporation (since 1996); Director and Chairman, United Fire Group, a publicly held company; formerly, President Pro-Tem of the Board of Regents for the State of Iowa University System; Director, Source Media Group; Life Trustee of Coe College; formerly, Director, Alliant Energy; formerly, Director, Federal Reserve Bank of Chicago; formerly, President and Chief Operating Officer, SCI Financial Group, Inc., a regional financial services firm. | | 196 |
William C. Hunter 1948 333 W. Wacker Drive Chicago, IL 60606 | | Trustee | | 2004 | | Dean Emeritus, formerly, Dean, Tippie College of Business, University of Iowa (2006-2012); Director (since 2004) of Xerox Corporation; Director (since 2005), and President (since 2012) Beta Gamma Sigma, Inc., The International Business Honor Society; Director of Wellmark, Inc. (since 2009); formerly, Dean and Distinguished Professor of Finance, School of Business at the University of Connecticut (2003-2006); previously, Senior Vice President and Director of Research at the Federal Reserve Bank of Chicago (1995-2003); formerly, Director (1997-2007), Credit Research Center at Georgetown University. | | 196 |
David J. Kundert 1942 333 W. Wacker Drive Chicago, IL 60606 | | Trustee | | 2005 | | Formerly, Director, Northwestern Mutual Wealth Management Company (2006-2013); retired (since 2004) as Chairman, JPMorgan Fleming Asset Management, President and CEO, Banc One Investment Advisors Corporation, and President, One Group Mutual Funds; prior thereto, Executive Vice President, Banc One Corporation and Chairman and CEO, Banc One Investment Management Group; Regent Emeritus, Member of Investment Committee, Luther College; member of the Wisconsin Bar Association; member of Board of Directors and Chair of Investment Committee, Greater Milwaukee Foundation; member of the Board of Directors (Milwaukee), College Possible. | | 196 |
| | | | | | | | |
Name, Year of Birth & Address | | Position(s) Held with the Funds | | Year First Elected or Appointed (1) | | Principal Occupation(s) Including other Directorships During Past 5 Years | | Number of Portfolios in Fund Complex Overseen by Trustee |
John K. Nelson 1962 333 West Wacker Drive Chicago, IL 60606 | | Trustee | | 2013 | | Member of Board of Directors of Core12 LLC (since 2008), a private firm which develops branding, marketing and communications strategies for clients; Director of The Curran Center for Catholic American Studies (since 2009) and The President’s Council, Fordham University (since 2010); formerly senior external advisor to the financial services practice of Deloitte Consulting LLP (2012-2014); formerly, Chairman of the Board of Trustees of Marian University (2010 as trustee, 2011-2014 as Chairman); formerly, Chief Executive Officer of ABN AMRO N.V. North America, and Global Head of its Financial Markets Division (2007-2008); prior senior positions held at ABN AMRO include Corporate Executive Vice President and Head of Global Markets—the Americas (2006-2007), CEO of Wholesale Banking—North America and Global Head of Foreign Exchange and Futures Markets (2001-2006), and Regional Commercial Treasurer and Senior Vice President Trading—North America (1996-2001); formerly, Trustee at St. Edmund Preparatory School in New York City. | | 196 |
Judith M. Stockdale 1947 333 W. Wacker Drive Chicago, IL 60606 | | Trustee | | 1997 | | Board Member, Land Trust Alliance (since 2013) and U.S. Endowment for Forestry and Communities (since 2013); formerly, Executive Director (1994-2012), Gaylord and Dorothy Donnelley Foundation; prior thereto, Executive Director, Great Lakes Protection Fund (1990-1994). | | 196 |
Carole E. Stone 1947 333 W. Wacker Drive Chicago, IL 60606 | | Trustee | | 2007 | | Director, Chicago Board Options Exchange (since 2006), C2 Options Exchange, Incorporated (since 2009) Director, CBOE Holdings, Inc. (since 2010); formerly, Commissioner, New York State Commission on Public Authority Reform (2005-2010). | | 196 |
Virginia L. Stringer 1944 333 W. Wacker Drive Chicago, IL 60606 | | Trustee | | 2011 | | Board Member, Mutual Fund Directors Forum; non-profit board member; former governance consultant; former Owner and President, Strategic Management Resources, Inc., a management consulting firm; former Member, Governing Board, Investment Company Institute’s Independent Directors Council; previously, held several executive positions in general management, marketing and human resources at IBM and The Pillsbury Company; Independent Director, First American Fund Complex (1987-2010) and Chair (1997-2010). | | 196 |
Terence J. Toth 1959 333 W. Wacker Drive Chicago, IL 60606 | | Trustee | | 2008 | | Managing Partner, Promus Capital (since 2008); Director, Fulcrum IT Service LLC (since 2010), Quality Control Corporation (since 2012) and LogicMark LLC (since 2012); formerly, Director, Legal & General Investment Management America, Inc. (2008-2013); formerly, CEO and President, Northern Trust Global Investments (2004-2007); Executive Vice President, Quantitative Management & Securities Lending (2000-2004); prior thereto, various positions with Northern Trust Company (since 1994); member: Chicago Fellowship Board (since 2005), Catalyst Schools of Chicago Board (since 2008) and Mather Foundation Board (since 2012), and a member of its investment committee; formerly, Member, Northern Trust Mutual Funds Board (2005-2007), Northern Trust Global Investments Board (2004-2007), Northern Trust Japan Board (2004-2007), Northern Trust Securities Inc. Board (2003-2007) and Northern Trust Hong Kong Board (1997-2004). | | 196 |
Trustees and Officers (Unaudited) (continued)
| | | | | | | | |
Name, Year of Birth & Address | | Position(s) Held with the Funds | | Year First Elected or Appointed (1) | | Principal Occupation(s) Including other Directorships During Past 5 Years | | Number of Portfolios in Fund Complex Overseen by Trustee |
| | | |
| Interested Trustee: | | | | |
William Adams IV(2) 1955 333 W. Wacker Drive Chicago, IL 60606 | | Trustee | | 2013 | | Senior Executive Vice President, Global Structured Products (since 2010); Co-President of Nuveen Fund Advisors, LLC (since 2011); Executive Vice President of Nuveen Securities, LLC; President (since 2011), formerly, Managing Director (2010-2011) of Nuveen Commodities Asset Management, LLC; Board Member of the Chicago Symphony Orchestra and of Gilda’s Club Chicago; formerly, Executive Vice President, U.S. Structured Products, of Nuveen Investments, Inc. (1999-2010). | | 196 |
Thomas S. Schreier, Jr.(2)
1962 333 W. Wacker Drive Chicago, IL 60606 | | Trustee | | 2013 | | Vice Chairman, Wealth Management of Nuveen Investments, Inc. (since 2011); Co-President of Nuveen Fund Advisors, LLC; Chairman of Nuveen Asset Management, LLC (since 2011); Co-Chief Executive Officer of Nuveen Securities, LLC (since 2011); Member of Board of Governors and Chairman’s Council of the Investment Company Institute; Director of Allina Health and a Member of its Finance, Audit and Investment Committees, formerly, Chief Executive Officer (2000-2010) and Chief Investment Officer (2007-2010) of FAF Advisors, Inc.; formerly, President of First American Funds (2001-2010). | | 196 |
| | | | | | | | |
Name,
Year of Birth & Address | | Position(s) Held with the Funds | | Year First Elected or Appointed (3) | | Principal Occupation(s) During Past 5 Years | | Number of Portfolios in Fund Complex Overseen by
Officer |
| | | |
| Officers of the Funds: | | | | |
Gifford R. Zimmerman 1956 333 W. Wacker Drive Chicago, IL 60606 | | Chief Administrative Officer | | 1988 | | Managing Director (since 2002), and Assistant Secretary of Nuveen Securities, LLC; Managing Director (since 2004) and Assistant Secretary (since 1994) of Nuveen Investments, Inc.; Managing Director (since 2002), Assistant Secretary (since 1997) and Co-General Counsel (since 2011) of Nuveen Fund Advisors, LLC; Managing Director, Assistant Secretary and Associate General Counsel of Nuveen Asset Management, LLC (since 2011); Managing Director and Assistant Secretary of Symphony Asset Management LLC (since 2003); Vice President and Assistant Secretary of NWQ Investment Management Company, LLC (since 2002), Nuveen Investments Advisers Inc. (since 2002), Santa Barbara Asset Management, LLC (since 2006) and of Winslow Capital Management, LLC, (since 2010); Vice President and Assistant Secretary (since 2013), formerly, Chief Administrative Officer and Chief Compliance Officer (2006-2013) of Nuveen Commodities Asset Management, LLC; Chartered Financial Analyst. | | 197 |
Margo L. Cook 1964 333 W. Wacker Drive Chicago, IL 60606 | | Vice President | | 2009 | | Senior Executive Vice President of Nuveen Investments, Inc.; Executive Vice President, Investment Services of Nuveen Fund Advisors, LLC (since 2011); Managing Director – Investment Services of Nuveen Commodities Asset Management, LLC (since 2011); Co-Chief Executive Officer (since 2015); previously, Executive Vice President (2013-2015) of Nuveen Securities, LLC; Chartered Financial Analyst. | | 197 |
Lorna C. Ferguson 1945 333 W. Wacker Drive Chicago, IL 60606 | | Vice President | | 1998 | | Managing Director (since 2005) of Nuveen Fund Advisors, LLC and Nuveen Securities, LLC (since 2004). | | 197 |
| | | | | | | | |
Name,
Year of Birth & Address | | Position(s) Held with the Funds | | Year First Elected or Appointed (3) | | Principal Occupation(s) During Past 5 Years | | Number of Portfolios in Fund Complex Overseen by
Officer |
Stephen D. Foy 1954 333 W. Wacker Drive Chicago, IL 60606 | | Vice President and Controller | | 1998 | | Managing Director (since 2014), formerly, Senior Vice President (2013-2014) and Vice President (2005-2013) of Nuveen Fund Advisors, LLC; Chief Financial Officer of Nuveen Commodities Asset Management, LLC (since 2010); Certified Public Accountant. | | 197 |
Sherri A. Hlavacek 1962 333 W. Wacker Drive Chicago, IL 60606 | | Vice President and Treasurer | | 2015 | | Executive Vice President (since May 2015, formerly, Managing Director) and Controller of Nuveen Fund Advisors, LLC; Managing Director and Controller of Nuveen Commodities Asset Management, LLC; Executive Vice President (since May 2015, formerly, Managing Director), Treasurer and Controller of Nuveen Asset Management, LLC; Executive Vice President, Principal Financial Officer (since July 2015, formerly, Managing Director), Treasurer and Corporate Controller of Nuveen Investments, Inc.; Executive Vice President (since May 2015, formerly, Managing Director), Treasurer and Corporate Controller of Nuveen Investments Advisers Inc. and Nuveen Investments Holdings, Inc.; Managing Director, Chief Financial Officer and Corporate Controller of Nuveen Securities, LLC; Vice President, Controller and Treasurer of NWQ Investment Management Company, LLC; Vice President and Controller of Santa Barbara Asset Management, LLC, Tradewinds Global Investors, LLC, Symphony Asset Management LLC and Winslow Capital Management, LLC; Certified Public Accountant. | | 197 |
Walter M. Kelly 1970 333 W. Wacker Drive Chicago, IL 60606 | | Chief Compliance Officer and Vice President | | 2003 | | Senior Vice President (since 2008) of Nuveen Investments Holdings, Inc. | | 197 |
Tina M. Lazar 1961 333 W. Wacker Drive Chicago, IL 60606 | | Vice President | | 2002 | | Senior Vice President of Nuveen Investments Holdings, Inc. and Nuveen Securities, LLC | | 197 |
Kevin J. McCarthy 1966 333 W. Wacker Drive Chicago, IL 60606 | | Vice President and Secretary | | 2007 | | Managing Director and Assistant Secretary (since 2008), Nuveen Securities, LLC; Managing Director (since 2008), Assistant Secretary (since 2007) and Co-General Counsel (since 2011) of Nuveen Fund Advisors, LLC; Managing Director, Assistant Secretary and Associate General Counsel (since 2011) of Nuveen Asset Management, LLC; Managing Director and Assistant Secretary, Nuveen Investments, Inc.; Vice President (since 2007) and Assistant Secretary of Nuveen Investments Advisers Inc., NWQ Investment Management Company, LLC, Tradewinds Global Investors LLC, Symphony Asset Management LLC, Santa Barbara Asset Management, LLC, and of Winslow Capital Management, LLC. (since 2010); Vice President and Secretary (since 2010) of Nuveen Commodities Asset Management, LLC. | | 197 |
Kathleen L. Prudhomme 1953 901 Marquette Avenue Minneapolis, MN 55402 | | Vice President and Assistant Secretary | | 2011 | | Managing Director, Assistant Secretary and Co-General Counsel (since 2011) of Nuveen Fund Advisors, LLC; Managing Director, Assistant Secretary and Associate General Counsel (since 2011) of Nuveen Asset Management, LLC; Managing Director and Assistant Secretary (since 2011) of Nuveen Securities, LLC; formerly, Deputy General Counsel, FAF Advisors, Inc. (2004-2010). | | 197 |
Joel T. Slager 1978 333 West Wacker Drive Chicago, IL 60606 | | Vice President and Assistant Secretary | | 2013 | | Fund Tax Director for Nuveen Funds (since 2013); previously, Vice President of Morgan Stanley Investment Management, Inc., Assistant Treasurer of the Morgan Stanley Funds (from 2010 to 2013). | | 197 |
Trustees and Officers (Unaudited) (continued)
| | | | | | | | |
Name,
Year of Birth & Address | | Position(s) Held with the Funds | | Year First Elected or Appointed (3) | | Principal Occupation(s) During Past 5 Years | | Number of Portfolios in Fund Complex Overseen by
Officer |
Jeffery M. Wilson 1956 333 West Wacker Drive Chicago, IL 60606 | | Vice President | | 2011 | | Senior Vice President of Nuveen Securities, LLC (since 2011); formerly, Senior Vice President of FAF Advisors, Inc. (2000-2010). | | 108 |
| (1) | Trustees serve an indefinite term until his/her successor is elected or appointed. Ms. Stringer will retire from the Board as of December 31, 2015. The year first elected or appointed represents the year in which the trustee was first elected or appointed to any fund in the Nuveen Fund Complex. |
| (2) | “Interested persons” of the Trust, as defined in the 1940 Act, by reason of their positions with Nuveen and certain of its subsidiaries. |
| (3) | Officers serve one year terms through August of each year. The year first elected or appointed represents the year in which the officer was first elected or appointed to any fund in the Nuveen Fund Complex. |
Annual Investment Management Agreement
Approval Process (Unaudited)
The Board of Directors of each Fund (each, a “Board” and each Director, a “Board Member”), including the Board Members who are not parties to the Funds’ advisory or sub-advisory agreements or “interested persons” of any such parties (the “Independent Board Members”), is responsible for overseeing the performance of the investment adviser and sub-adviser to the respective Fund and determining whether to continue such Fund’s advisory agreement (the “Investment Management Agreement”) between the Fund and Nuveen Fund Advisors, LLC (the “Adviser”) and the sub-advisory agreement (the “Sub-Advisory Agreement” and, together with the Investment Management Agreement, the “Advisory Agreements”) between the Adviser and Nuveen Asset Management, LLC (the “Sub-Adviser”). Following an initial term with respect to each Fund upon its commencement of operations, the Board is required to consider the continuation of the Advisory Agreements on an annual basis pursuant to the requirements of the Investment Company Act of 1940, as amended (the “1940 Act”). Accordingly, at an in-person meeting held on May 11-13, 2015 (the “May Meeting”), the Board, including a majority of the Independent Board Members, considered and approved the existing Advisory Agreements for the Funds.
In preparation for its considerations at the May Meeting, the Board received in advance of the meeting extensive materials prepared in connection with the review of the Advisory Agreements. The materials provided a broad range of information regarding the Funds, including, among other things, the nature, extent and quality of services provided by the Adviser and Sub-Adviser (the Adviser and Sub-Adviser are collectively, the “Fund Advisers” and each, a “Fund Adviser”); Fund performance including performance assessments against peers and the appropriate benchmark(s); fee and expense information of the Funds compared to peers; a description and assessment of shareholder service levels for the Funds; a summary of the performance of certain service providers; a review of product initiatives and shareholder communications; and profitability information of the Fund Advisers as described in further detail below. As part of its annual review, the Board also held a separate meeting on April 14-15, 2015 to review the Funds’ investment performance and consider an analysis by the Adviser of the Sub-Adviser which generally evaluated the Sub-Adviser’s investment team, investment mandate, organizational structure and history, investment philosophy and process, and the performance of the Funds, and any significant changes to the foregoing. During the review, the Independent Board Members asked questions of and requested additional information from management.
The Board considered that the evaluation process with respect to the Fund Advisers is an ongoing process that encompassed the information and knowledge gained throughout the year. The Board, acting directly or through its committees, met regularly during the course of the year and received information and considered factors at each meeting that would be relevant to its annual consideration of the Advisory Agreements, including information relating to Fund performance; Fund expenses; investment team evaluations; and valuation, compliance, regulatory and risk matters. In addition to regular reports, the Adviser provided special reports to the Board to enhance the Board’s understanding on topics that impact some or all of the Nuveen funds and the Adviser (such as presentations on risk and stress testing; the new governance, risk and compliance system; cybersecurity developments; Nuveen fund accounting and reporting matters; regulatory developments impacting the investment company industry and the business plans or other matters impacting the Adviser). The Board also met with key investment personnel managing certain Nuveen fund portfolios during the year.
The Board had created several standing committees including the Open-End Funds Committee and the Closed-End Funds Committee to assist the full Board in monitoring and gaining a deeper insight into the distinctive business practices of closed-end and open-end funds. These Committees met prior to each quarterly Board meeting, and the Adviser provided presentations to these Committees permitting them to delve further into specific matters or initiatives impacting the respective product line.
The Board also continued its program of seeking to have the Board Members or a subset thereof visit each sub-adviser to the Nuveen funds at least once over a multiple year rotation, meeting with key investment and business personnel. In this regard, the Independent Board Members made site visits to multiple equity and fixed-income investment teams of the Sub-Adviser in June 2014.
The Board considered the information provided and knowledge gained at these meetings and visits during the year when performing its annual review of the Advisory Agreements. The Independent Board Members also were assisted throughout the process by independent legal counsel. During the course of the year and during their deliberations regarding the review of advisory contracts, the Independent Board Members met with independent legal counsel in executive sessions without management present. The Independent Board Members also received a memorandum from independent legal counsel outlining the legal standards for their consideration of the proposed continuation of the Advisory Agreements. In addition, it is important to recognize that the management arrangements for the Nuveen funds are the result of many years of review and discussion between the Independent Board Members and Fund management and that the Board Members’ conclusions may be based, in part, on their consideration of fee arrangements and other factors developed in previous years.
The Board took into account all factors it believed relevant with respect to each Fund, including, among other things: (a) the nature, extent and quality of the services provided by the Fund Advisers; (b) the investment performance of the Funds and Fund Advisers; (c) the advisory fees and costs of the
Annual Investment Management Agreement Approval Process (Unaudited) (continued)
services to be provided to the Funds and the profitability of the Fund Advisers; (d) the extent of any economies of scale; (e) any benefits derived by the Fund Advisers from the relationship with the Funds; and (f) other factors. Each Board Member may have accorded different weight to the various factors in reaching his or her conclusions with respect to the Advisory Agreements of each Fund. The Independent Board Members did not identify any single factor as all-important or controlling. The Independent Board Members’ considerations were instead based on a comprehensive consideration of all the information presented. The principal factors considered by the Board and its conclusions are described below.
A. Nature, Extent and Quality of Services
In evaluating the renewal of the Advisory Agreements, the Independent Board Members received and considered information regarding the nature, extent and quality of the applicable Fund Adviser’s services provided to each respective Fund. The Board reviewed information regarding, among other things, each Fund Adviser’s organization and business, the types of services that each Fund Adviser or its affiliates provided to the Funds, the performance record of the Funds (as described in further detail below), and any initiatives that had been undertaken on behalf of the open-end product line. The Board recognized the high quality of services the Adviser had provided to the Funds over the years and the conscientiousness with which the Adviser provided these services. The Board also considered the improved capital structure of Nuveen Investments, Inc. (“Nuveen”) (the parent of the Adviser) following the acquisition of Nuveen by TIAA-CREF in 2014 (the “TIAA-CREF Transaction”).
With respect to the services, the Board noted the Funds were registered investment companies that operated in a regulated industry and considered the myriad of investment management, administrative, compliance, oversight and other services the Adviser provided to manage and operate the Funds. Such services included, among other things: (a) product management (such as analyzing ways to better position a Nuveen fund in the marketplace, setting dividends; maintaining relationships to gain access to distribution platforms; and providing shareholder communications); (b) fund administration (such as preparing tax returns and other tax compliance services, preparing regulatory filings and shareholder reports; managing fund budgets and expenses; overseeing a fund’s various service providers and supporting and analyzing new and existing funds); (c) Board administration (such as supporting the Board and its committees, in relevant part, by organizing and administering the Board and committee meetings and preparing the necessary reports to assist the Board in its duties); (d) compliance (such as monitoring adherence to a fund’s investment policies and procedures and applicable law; reviewing the compliance program periodically and developing new policies or updating existing compliance policies and procedures as considered necessary or appropriate; responding to regulatory requests; and overseeing compliance testing of the funds’ sub-advisers); (e) legal support (such as preparing or reviewing fund registration statements, proxy statements and other necessary materials; interpreting regulatory requirements and compliance thereof; and maintaining applicable registrations); and (f) investment services (such as overseeing and reviewing the funds’ sub-advisers and their investment teams; analyzing performance of the funds; overseeing investment and risk management; evaluating brokerage transactions and securities lending, overseeing the daily valuation process for portfolio securities and developing and recommending valuation policies and methodologies and changes thereto; reporting to the Board on various matters including performance, risk and valuation; and participating in fund development, leverage management, and the developing or interpreting of investment policies and parameters).
In its review, the Board considered information highlighting the various initiatives that the Adviser had implemented or continued during the last year to enhance its services to the Nuveen funds. The Board recognized that some of these initiatives are a result of a multi-year process. In reviewing the activities of 2014, the Board recognized the Adviser’s continued focus on fund rationalization for open-end funds through mergers, fund closures or repositioning the funds in seeking to enhance shareholder value, reduce costs, improve performance, eliminate fund overlap and better meet shareholder needs. The Board noted the Adviser’s investment in additional staffing to strengthen and improve its services to the Nuveen funds, including with respect to risk management and valuation. The Board recognized that expanding the depth and range of its risk oversight activities had been a major priority for the Adviser in recent years, and the Adviser continued to add to the risk management team, develop additional risk management programs and create committees or other teams designated to oversee or evaluate certain risks, such as liquidity risk, enterprise risk, investment risk and cybersecurity risk. The Adviser had also continued to add to the valuation team, launched its centralized securities valuation system which is intended to provide for uniform pricing and reporting across the complex as the system continues to develop, continued to refine its valuation analysis and updated related policies and procedures and evaluated and assessed pricing services. The Board considered the Adviser’s ongoing investment in information technology and operations and the various projects of the information technology team to support the continued growth and complexity of the Nuveen funds and increase efficiencies in their operations. The Board also recognized the Adviser’s strong commitment to compliance and reviewed information reflecting the compliance group’s ongoing activities to enhance its compliance system and refine its compliance procedures as well as the Chief Compliance Officer’s report regarding the compliance team, the initiatives the team had undertaken in 2014 and proposed for 2015, the compliance functions and reporting process, the record of compliance with the policies and procedures and its supervision activities of other service providers.
With respect to the open-end fund product line, the Adviser had also, among other things: developed new funds in seeking to enhance the product line; enhanced the reporting to the Board and its committees regarding payments to intermediaries; and continued to explore opportunities for potential funds.
As noted, the Adviser also oversees the Sub-Adviser who primarily provides the portfolio advisory services to the Funds. The Board recognized the skill and competency of the Adviser in monitoring and analyzing the performance of the Sub-Adviser and managing the sub-advisory relationship. In considering the Sub-Advisory Agreements and supplementing its prior knowledge, the Board considered a current report provided by the Adviser
analyzing, among other things, the Sub-Adviser’s investment team and changes thereto, investment approach, organization and history, and assets under management, and the investment performance of each Fund.
Based on their review, the Independent Board Members found that, overall, the nature, extent and quality of services provided to the Funds under each respective Advisory Agreement were satisfactory.
B. The Investment Performance of the Funds and Fund Advisers
The Board, including the Independent Board Members, considered the performance history of each Fund over various time periods. The Board reviewed reports, including an analysis of the Funds’ performance and the applicable investment team. The Board reviewed, among other things, each Fund’s investment performance both on an absolute basis and in comparison to peer funds (the “Performance Peer Group”) and to recognized and/or customized benchmarks (i.e., generally benchmarks derived from multiple recognized benchmarks) for the quarter, one-, three- and five-year periods ending December 31, 2014, as well as performance information reflecting the first quarter of 2015. In its review, the Board noted that it also reviewed Fund performance results at each of its quarterly meetings.
In evaluating performance, the Board recognized several factors that may impact the performance data as well as the consideration given to particular performance data.
| | • | | The performance data reflected a snapshot in time, in this case as of the end of the most recent calendar year or quarter. A different performance period, however, could generate significantly different results. |
| | • | | Long-term performance can be adversely affected by even one period of significant underperformance so that a single investment decision or theme had the ability to disproportionately affect long-term performance. |
| | • | | The investment experience of a particular shareholder in a fund would vary depending on when such shareholder invested in the fund, the class held (if multiple classes are offered in the fund) and the performance of the fund (or respective class) during that shareholder’s investment period. |
| | • | | Open-end funds offer multiple classes and the performance data provided for open-end funds was based on Class A shares. The performance of the other classes of a fund, however, should be substantially similar on a relative basis because all of the classes would be invested in the same portfolio of securities and differences in performance among classes could be principally attributed to the variations in distribution and servicing expenses of each class. |
| | • | | The Board recognized that the funds in the Performance Peer Group may differ somewhat from the Nuveen fund with which it is being compared and due to these differences, performance comparisons between certain of the Nuveen funds and their Performance Peer Groups may be inexact and the relevancy limited. The Board considered that management had classified the Performance Peer Group as low, medium and high in relevancy. The Board took the analysis of the relevancy of the Performance Peer Group into account when considering the comparative performance data. The Board also considered comparative performance of an applicable benchmark. While the Board was cognizant of the relative performance of a Fund’s peer set and/or benchmark(s), the Board evaluated Fund performance in light of the respective Fund’s investment objectives, investment parameters and guidelines and considered that the variations between the objectives and investment parameters or guidelines of the Fund with its peers and/or benchmarks result in differences in performance results. |
With respect to any Nuveen funds for which the Board has identified performance concerns, the Board monitors such funds closely until performance improves, discusses with the Adviser the reasons for such results, considers those steps necessary or appropriate to address such issues, and reviews the results of any efforts undertaken. The Board is aware, however, that shareholders chose to invest or remain invested in a fund knowing that the Adviser manages the fund and knowing the fund’s fee structure.
In considering the performance data, the Independent Board Members noted the following with respect to the Funds:
For Nuveen Dividend Value Fund (the “Dividend Value Fund”), the Board noted that, although the Fund underperformed its benchmark in the one-, three- and five-year periods, the Fund ranked in its Performance Peer Group in the third quartile in the one-year period, the first quartile in the three-year period and the second quartile in the five-year period.
For Nuveen Mid Cap Value Fund (the “Mid Cap Value Fund”), the Board noted that, although the Fund ranked in its Performance Peer Group in the fourth quartile in the five-year period and underperformed its benchmark in the one-, three- and five-year periods, the Fund ranked in the third quartile in the one- and three-year periods.
For Nuveen Small Cap Value Fund (the “Small Cap Value Fund”), the Board noted that the Fund ranked in its Performance Peer Group in the second quartile in the one-year period, the third quartile in the three-year period and the first quartile in the five-year period. The Fund also outperformed its benchmark in the one-, three- and five-year periods.
Based on their review, the Independent Board Members determined that each Fund’s investment performance had been satisfactory.
Annual Investment Management Agreement Approval Process (Unaudited) (continued)
C. Fees, Expenses and Profitability
1. Fees and Expenses
The Board evaluated the management fees and other fees and expenses of each Fund (expressed as a percentage of average net assets) in absolute terms and in comparison to the fee and expense levels of a comparable universe of funds (the “Peer Universe”) and, with respect to open-end funds, to a more focused subset in the Peer Universe (the “Peer Group”), each selected by an independent third-party fund data provider. The Independent Board Members reviewed the methodology regarding the construction of the Peer Universe and Peer Group for each Fund. The Board reviewed, among other things, such Fund’s gross management fees, net management fees and net expense ratios in absolute terms as well as compared to the average and median fee and expense levels of the Peer Universe and/or Peer Group. The Board noted that the net total expense ratios paid by investors in the Funds were the most representative of an investor’s net experience. The Board Members also considered any fee waivers and/or expense reimbursement arrangements currently in effect for the Funds.
In reviewing the comparative fee and expense information, the Independent Board Members recognized that various factors such as the limited size and particular composition of the Peer Universe or Peer Group (including the inclusion of other Nuveen funds in the peer set); expense anomalies; changes in the funds comprising the Peer Universe or Peer Group from year to year; levels of reimbursement or fee waivers; the timing of information used; and differences in services provided can impact the comparative data limiting the usefulness of the data to help make a conclusive assessment of the Funds’ fees and expenses.
In reviewing the fee schedule for a fund, the Independent Board Members also considered the fund-level and complex-wide breakpoint schedules (described in further detail below) and any fee waivers and reimbursements provided by Nuveen. In reviewing fees and expenses, the Board considered the expenses and fees to be higher if they were over 10 basis points higher, slightly higher if they were approximately 6 to 10 basis points higher, in line if they were within approximately 5 basis points higher than the peer average and below if they were below the peer average of the Peer Group. In reviewing the reports, the Board noted that the majority of the Nuveen funds had a net expense ratio near or below their peer average.
The Independent Board Members recognized that the Dividend Value Fund had a slightly higher net management fee than its peer average but a net expense ratio that was in line with its peer average; the Mid Cap Value Fund had a net expense ratio slightly higher than its peer average, but a net management fee that was in line with its peer average; and the Small Cap Value Fund had a net management fee and a net expense ratio that were in line with its peer averages.
Based on their review of the fee and expense information provided, the Independent Board Members determined that each Fund’s management fees (as applicable) to a Fund Adviser were reasonable in light of the nature, extent and quality of services provided to the Fund.
2. Comparisons with the Fees of Other Clients
The Board considered information regarding the fees a Fund Adviser assessed to the Nuveen funds compared to that of other clients as described in further detail below. With respect to non-municipal funds, such other clients of the Adviser and/or its affiliated sub-advisers may include: separately managed accounts (such as retail, institutional or wrap accounts), hedge funds, other investment companies that are not offered by Nuveen but are sub-advised by one of Nuveen’s affiliated sub-advisers, foreign investment companies offered by Nuveen, and collective investment trusts.
The Board recognized that each Fund had an affiliated sub-adviser and therefore the overall Fund management fee can be divided into two components, the fee retained by the Adviser and the fee paid to the Sub-Adviser. In reviewing the nature of the services provided by the Adviser, including through its affiliated sub-advisers, the Board considered the range of advisory fee rates for retail and institutional managed accounts advised by Nuveen-affiliated sub-advisers. The Board also reviewed, among other things, the average fee the affiliated sub-advisers assessed such clients as well as the range of fee rates assessed to the different types of clients (such as retail, institutional and wrap accounts as well as non-Nuveen funds) applicable to such sub-advisers.
In reviewing the comparative information, the Board also reviewed information regarding the differences between the Funds and the other clients, including differences in services provided, investment policies, investor profiles, compliance and regulatory requirements and account sizes. The Board recognized the breadth of services necessary to operate a registered investment company (as described above) and that, in general terms, the Adviser provided the administrative and other support services to the Funds and, although the Sub-Adviser may provide some of these services, the Sub-Adviser essentially provided the portfolio management services. In general, the Board noted that higher fee levels reflected higher levels of service provided by the Fund Adviser, increased investment management complexity, greater product management requirements and higher levels of business risk or some combination of the foregoing. The Independent Board Members considered the differences in structure and operations of separately managed accounts and hedge funds from registered funds and noted that the range of day-to-day services was not generally of the breadth required for the registered funds. Many of the additional administrative services provided by the Adviser were not required for institutional clients or funds sub-advised by a Nuveen-affiliated sub-adviser that were offered by other fund groups. The Independent Board Members also recognized that the management fee rates of the foreign funds advised by the Adviser may vary due to, among other things, differences in the
client base, governing bodies, operational complexities and services covered by the management fee. Given the inherent differences in the various products, particularly the extensive services provided to the Funds, the Independent Board Members believed such facts justify the different levels of fees.
3. Profitability of Fund Advisers
In conjunction with their review of fees, the Independent Board Members also considered the profitability of Nuveen for its advisory activities and its financial condition. The Independent Board Members reviewed, among other things, the adjusted operating margins for Nuveen for the last two calendar years, the revenues, expenses, net income (pre-tax and after-tax) and net revenue margins (pre-tax and after-tax) of Nuveen’s managed fund advisory activities for the last two calendar years, the allocation methodology used by Nuveen in preparing the profitability data and a history of the adjustments to the methodology due to changes in the business over time. The Independent Board Members also reviewed the revenues, expenses, net income (pre-tax and after-tax) and revenue margin (pre-tax and post-tax) of the Adviser and, as described in further detail below, each affiliated sub-adviser for the 2014 calendar year. In reviewing the profitability data, the Independent Board Members noted the subjective nature of cost allocation methodologies used to determine profitability as other reasonable methods could also have been employed but yield different results. The Independent Board Members reviewed an analysis of the key drivers behind the changes in revenues and expenses that impacted profitability in 2014. The Independent Board Members recognized that Nuveen’s net revenue margin from advisory activities for 2014 was consistent with 2013. The Independent Board Members also considered the profitability of Nuveen in comparison to the adjusted operating margins of other investment advisers with publicly available data and with comparable assets under management (based on asset size and asset composition) to Nuveen. The Independent Board Members noted that Nuveen’s adjusted operating margins appeared to be reasonable in relation to such other advisers. The Independent Board Members, however, recognized the difficulty of making comparisons of profitability from fund investment advisory contracts as the information is not generally publicly available, the information for the investment advisers that was publicly available may not be representative of the industry and various other factors would impact the profitability data such as differences in services offered, business mix, expense methodology and allocations, capital structure and costs, complex size, and types of funds and other accounts managed.
The Independent Board Members noted this information supplemented the profitability information requested and received during the year and noted that two Independent Board Members served as point persons to review the profitability analysis and methodologies employed, and any changes thereto, and to keep the Board apprised of such changes during the year.
The Independent Board Members determined that Nuveen appeared to be sufficiently profitable to operate as a viable investment management firm and to honor its obligations as a sponsor of the Nuveen funds. The Independent Board Members noted the Adviser’s continued expenditures to upgrade its investment technology and increase personnel and recognized the Adviser’s continued commitment to its business to enhance the Adviser’s capacity and capabilities in providing the services necessary to meet the needs of the Nuveen funds as they grow or change over time. The Independent Board Members also noted that the sub-advisory fees for the Nuveen funds are paid by the Adviser, however, the Board recognized that many of the sub-advisers, including the Sub-Adviser, are affiliated with Nuveen. The Independent Board Members also noted the increased resources and support available to Nuveen as well as an improved capital structure as a result of the TIAA-CREF Transaction.
With respect to the Sub-Adviser, the Independent Board Members reviewed the Sub-Adviser’s revenues, expenses and revenue margins (pre- and post-tax) for its advisory activities for the calendar year ended December 31, 2014. The Independent Board Members also reviewed profitability analysis reflecting the revenues, expenses and the revenue margin (pre- and post-tax) by asset type for the Sub-Adviser for the calendar year ended December 31, 2014.
In evaluating the reasonableness of the compensation, the Independent Board Members also considered other amounts paid to a Fund Adviser by the Funds as well as indirect benefits (such as soft dollar arrangements), if any, the Fund Adviser and its affiliates received or were expected to receive that were directly attributable to the management of a Fund. See Section E below for additional information on indirect benefits a Fund Adviser may receive as a result of its relationship with the Funds.
Based on their review, the Independent Board Members determined that the Adviser’s and the Sub-Adviser’s level of profitability was reasonable in light of the respective services provided.
D. Economies of Scale and Whether Fee Levels Reflect These Economies of Scale
The Independent Board Members recognized that, as the assets of a particular fund or the Nuveen complex in the aggregate increase over time, economies of scale may be realized, and the Independent Board Members considered the extent to which the funds benefit from such economies of scale. Although the Independent Board Members recognized that economies of scale are difficult to measure, the Board recognized that one method to help ensure the shareholders share in these benefits is to include breakpoints in the management fee schedule reducing fee rates as asset levels grow. The Independent Board Members noted that, subject to certain exceptions, the management fees of the funds in the Nuveen complex are generally comprised of a fund-level component and complex-level component. Each component of the management fee for each Fund included breakpoints to reduce management fee rates of the Fund as the Fund grows and, as described below, as the Nuveen complex grows. In addition to fund-specific breakpoint schedules which reduce the fee rates of a particular fund as its assets increase, the Independent Board Members recognized
Annual Investment Management Agreement Approval Process (Unaudited) (continued)
that the Adviser also passed on the benefits of economies of scale through the complex-wide fee arrangement which reduced management fee rates as assets in the fund complex reached certain levels. The complex-wide fee arrangement seeks to provide the benefits of economies of scale to fund shareholders when total fund complex assets increase, even if assets of a particular fund are unchanged or have decreased. The approach reflected the notion that some of Nuveen’s costs were attributable to services provided to all its funds in the complex, and therefore all funds benefit if these costs were spread over a larger asset base. The Independent Board Members reviewed the breakpoint and complex-wide schedules and the fee reductions achieved as a result of such structures for the 2014 calendar year.
The Independent Board Members also noted that additional economies of scale were shared with shareholders of the Mid Cap Value Fund and the Small Cap Value Fund through the adoption of temporary expense caps. The Board further noted the proposed reduction in the temporary expense cap for the Mid Cap Value Fund. The Independent Board Members further considered that as part of the TIAA-CREF Transaction, Nuveen agreed, for a period of two years from the date of the closing of the TIAA-CREF Transaction, not to increase contractual management fees for any Nuveen fund and, with respect to funds with expense caps, not to raise expense cap levels for such funds from levels in effect at that time or scheduled to go into effect prior to the closing of the TIAA-CREF Transaction. The commitment would not limit or otherwise affect mergers or liquidations of any funds in the ordinary course.
Based on their review, the Independent Board Members concluded that the current fee structure was acceptable and reflected economies of scale to be shared with shareholders when assets under management increase.
E. Indirect Benefits
The Independent Board Members received and considered information regarding potential “fall out” or ancillary benefits the respective Fund Adviser or its affiliates may receive as a result of its relationship with the Funds. In this regard, the Independent Board Members recognized that an affiliate of the Adviser served as the Funds’ principal underwriter and may receive compensation therefore from, among other things, sales charges, distribution fees and shareholder services fees (which included fees received pursuant to any 12b-1 plan). The Independent Board Members therefore took into account, among other things, the 12b-1 fees retained by Nuveen during the last calendar year.
In addition to the above, the Independent Board Members considered whether the Fund Adviser received any benefits from soft dollar arrangements whereby a portion of the commissions paid by a Fund for brokerage may be used to acquire research that may be useful to the Fund Adviser in managing the assets of the Fund and other clients. The Funds’ portfolio transactions are allocated by the Sub-Adviser. Accordingly, the Independent Board Members considered that the Sub-Adviser may benefit from research provided by broker-dealers executing portfolio transactions on behalf of the Funds. With respect to any fixed income securities, however, the Board recognized that such securities generally trade on a principal basis that does not generate soft dollar credits. Similarly, the Board recognized that any research received pursuant to soft dollar arrangements by the Sub-Adviser may also benefit the Funds and shareholders to the extent the research enhanced the ability of the Sub-Adviser to manage the Funds. The Independent Board Members noted that the Sub-Adviser’s profitability may be somewhat lower if it had to acquire any such research services directly.
Based on their review, the Independent Board Members concluded that any indirect benefits received by a Fund Adviser as a result of its relationship with the Funds were reasonable and within acceptable parameters.
F. Other Considerations
The Independent Board Members did not identify any single factor discussed previously as all-important or controlling. The Board Members, including the Independent Board Members, concluded that the terms of each Advisory Agreement were fair and reasonable, that the respective Fund Adviser’s fees were reasonable in light of the services provided to each Fund and that the Advisory Agreements be renewed.
Notes
Notes
Notes
| | | | | | | | | | | | | | |
| | | | | | | | |
| | | | |
| | | | | | | | |
| | | | | |
| | Nuveen Investments: | | | | | | | | |
| | | | Serving Investors for Generations | | | | |
| | |
| | | | |
| | | |
| | | | Since 1898, financial advisors and their clients have relied on Nuveen Investments to provide dependable investment solutions through continued adherence to proven, long-term investing principles. Today, we offer a range of high quality equity and fixed-income solutions designed to be integral components of a well-diversified core portfolio. | | |
| | | |
| | | | | | |
| | | | |
| | | | | | Focused on meeting investor needs. Nuveen Investments provides high-quality investment services designed to help secure the longterm goals of institutional and individual investors as well as the consultants and financial advisors who serve them. Nuveen Investments markets a wide range of specialized investment solutions which provide investors access to capabilities of its high-quality boutique investment affiliates-Nuveen Asset Management, Symphony Asset Management, NWQ Investment Management Company, Santa Barbara Asset Management, Tradewinds Global Investors, Winslow Capital Management, and Gresham Investment Management. In total, Nuveen Investments managed more than $220 billion as of September 30, 2015. | | |
| | | | | |
| | | | | | | | | | |
| | | | | | Find out how we can help you. To learn more about how the products and services of Nuveen Investments may be able to help you meet your financial goals, talk to your financial advisor, or call us at (800) 257-8787. Please read the information provided carefully before you invest. Investors should consider the investment objective and policies, risk considerations, charges and expenses of any investment carefully. Where applicable, be sure to obtain a prospectus, which contains this and other relevant information. To obtain a prospectus, please contact your securities representative or Nuveen Investments, 333 W. Wacker Dr., Chicago, IL 60606. Please read the prospectus carefully before you invest or send money. Learn more about Nuveen Funds at: www.nuveen.com/mf | | |
| | | | | | |
| | | | | | | | | | | | |
| | Distributed by Nuveen Securities, LLC | 333 West Wacker Drive Chicago, IL 60606 | www.nuveen.com | | | | | | |
MAN-FSTK-1015P 12545-INV-Y-12/16
| | |
| | |  |
| Mutual Funds | |
| | | | | | |
| | | | | | | Annual Report October 31, 2015 |
| | | | | | | | | | | | | | | | |
| | | | | | | Share Class / Ticker Symbol |
| | | Fund Name | | | | Class A | | Class C | | Class R3 | | Class R6 | | Class I | | |
| | |
| | Nuveen Large Cap Growth Opportunities Fund | | | | FRGWX | | FAWCX | | FLCYX | | FLCFX | | FIGWX | | |
| | Nuveen Mid Cap Growth Opportunities Fund | | | | FRSLX | | FMECX | | FMEYX | | FMEFX | | FISGX | | |
| | Nuveen Small Cap Growth Opportunities Fund | | | | FRMPX | | FMPCX | | FMPYX | | — | | FIMPX | | |
| | | | | | | | | | | | |
| | | | | | |
| | | | |
| | | | | | | | |
| | |
| | Life is Complex. | | |
| | |
| | Nuveen makes things e-simple. | | |
| | |
| | It only takes a minute to sign up for e-Reports. Once enrolled, you’ll receive an e-mail as soon as your Nuveen Fund information is ready. No more waiting for delivery by regular mail. Just click on the link within the e-mail to see the report and save it on your computer if you wish. | | |
| | | | |
| | | | | | Free e-Reports right to your e-mail! | | |
| | | |
| | | | | | www.investordelivery.com If you receive your Nuveen Fund distributions and statements from your
financial advisor or brokerage account. |
| | | | |
| | | | or | | www.nuveen.com/accountaccess If you receive your Nuveen Fund distributions and statements directly from Nuveen. Must be preceded by or accompanied by a prospectus. NOT FDIC INSURED MAY LOSE VALUE
NO BANK GUARANTEE | | |
| | | | | | | | | | |
| | | | | | | | | | | | | |

Table
of Contents
Chairman’s Letter
to Shareholders

Dear Shareholders,
For better or for worse, the financial markets spent most of the past year waiting for the U.S. Federal Reserve (Fed) to end its accommodative monetary policy. The policy has propped up stock and bond markets since the Great Recession, but the question remains: how will markets behave without its influence? This uncertainty was a considerable source of volatility for stock and bond prices for much of 2015, despite the Fed carefully conveying its intention to raise rates slowly and only when the economy shows evidence of readiness.
As was widely expected, the long-awaited Fed rate hike materialized in mid-December. While the move was interpreted as a vote of confidence on the economy’s underlying strength, the Fed emphasized that future rate increases will be gradual and guided by its ongoing assessment of financial conditions. How efficiently the financial markets process the confluence of rising borrowing costs, softer commodity prices, stubbornly low U.S. inflation, and a strong U.S. dollar, against a backdrop of anemic global economic growth, remains to be seen.
Nevertheless, the global recovery continues to be led by the United States. Policy makers in Europe and Japan are deploying their available tools to try to bolster their economies’ fragile growth, while Chinese authorities have stepped up efforts to manage China’s slowdown. With sentiment regarding China growing increasingly bearish and the Fed now working toward normalizing its interest-rate policy, the actions of the world’s central banks remain under intense scrutiny.
In the meantime, asset prices could continue to churn as risks both known and unknown begin to emerge. In times like these, you can look to a professional investment manager with the experience and discipline to maintain the proper perspective on short-term events. And if the daily headlines do concern you, I encourage you to reach out to your financial advisor. Your financial advisor can help you evaluate your investment strategies in light of current events, your time horizon and risk tolerance.
On behalf of the other members of the Nuveen Fund Board, we look forward to continuing to earn your trust in the months and years ahead.
Sincerely,

William J. Schneider
Chairman of the Board
December 21, 2015
Portfolio Managers’
Comments
Nuveen Large Cap Growth Opportunities Fund
Nuveen Mid Cap Growth Opportunities Fund
Nuveen Small Cap Growth Opportunities Fund
These Funds feature portfolio management by Nuveen Asset Management, LLC (NAM), an affiliate of Nuveen Investments, Inc.
Effective October 5, 2015, David Chalupnik, CFA, was named as a portfolio manager of the Nuveen Large Cap Growth Opportunities Fund. David is the Head of Equities for NAM and has 31 years of financial industry experience. Harold (Hal) Goldstein, and Scott Mullinix, CFA, also continue to serve as portfolio managers for the Fund. Hal and Scott assumed portfolio management responsibilities in 2002 and 2006, respectively.
James (Jim) Diedrich, CFA, will now focus exclusively on leading the Nuveen Mid Cap Growth Opportunities Fund in conjunction with co-managers Hal and Scott. Jim assumed portfolio management responsibilities in 2006. Hal and Scott have been on the management team of the Fund since 2005 and 2006, respectively.
Rob McDougall, CFA, and Jon Loth, CFA, are the portfolio managers for the Nuveen Small Cap Growth Opportunities Fund. Rob assumed portfolio management responsibilities in 2004. Jon has been on the management team for the Fund since 2007.
On the following pages, the portfolio management teams for the Funds discuss economic and market conditions, key investment strategies and the Funds’ performance for the twelve-month reporting period ended October 31, 2015.
What factors affected the U.S. economy and the financial markets during the twelve-month reporting period ended October 31, 2015?
During this reporting period, the U.S. economy continued to expand at a moderate pace. The Federal Reserve (Fed) maintained efforts to bolster growth and promote progress toward its mandates of maximum employment and price stability by holding the benchmark fed funds rate at the record low level of zero to 0.25% that it established in December 2008, a level that remained in place until December 2015 when the Fed increased its benchmark rate to a range of 0.25% to 0.50% (subsequent to the close of this reporting period). At its October 2014 meeting, the Fed announced that it would end its bond-buying stimulus program as of November 1, 2014, after tapering its monthly asset purchases of mortgage-backed and longer-term Treasury securities from the original $85 billion per month to $15 billion per month over the course of seven consecutive meetings (December 2013 through September 2014). In making the announcement, the Fed cited substantial improvement in the labor market as well as sufficient underlying strength in the broader economy to support ongoing progress toward maximum employment in a context of price stability. The Fed also reiterated that it would continue to look at a wide range of factors, including labor market conditions, indicators of inflationary pressures and readings on financial developments, in determining future actions. Additionally, the Fed stated that it would likely maintain the current target range for the fed funds rate for a considerable time, especially if projected inflation continued to run below the Fed’s 2% longer run goal. However, if economic data shows faster progress, the Fed indicated that it could raise the fed funds rate sooner than expected.
The Fed changed its language slightly in December 2014, indicating it would be “patient” in normalizing monetary policy. This shift helped ease investors’ worries that the Fed might raise rates too soon. However, as employment data released early in 2015
Certain statements in this report are forward-looking statements. Discussions of specific investments are for illustration only and are not intended as recommendations of individual investments. The forward-looking statements and other views expressed herein are those of the portfolio managers as of the date of this report. Actual future results or occurrences may differ significantly from those anticipated in any forward-looking statements and the views expressed herein are subject to change at any time, due to numerous market and other factors. The Funds disclaim any obligation to update publicly or revise any forward-looking statements or views expressed herein.
Refer to the Glossary of Terms Used in this Report for further definition of the terms used within this section.
Portfolio Managers’ Comments (continued)
continued to look strong, anticipation began building that the Fed could raise its main policy rate as soon as June. As widely expected, after its March meeting the Fed eliminated “patient” from its statement, but also highlighted the policymakers’ less optimistic view of the economy’s overall health as well as downgraded their inflation projections. The Fed’s April meeting seemed to further signal that a June rate hike was off the table. While the Fed attributed the first quarter’s economic weakness to temporary factors, the meeting minutes from April revealed that many Committee members believed the economic data available in June would be insufficient to meet the Fed’s criteria for initiating a rate increase. The June meeting bore out that presumption and the Fed decided to keep the target rate near zero. But the Committee also continued to telegraph the likelihood of at least one rate increase in 2015, which many analysts forecasted for September.
During the September 2015 meeting, the Fed decided to keep the federal funds rate near zero despite broad speculation that it would increase rates. The Committee said it will keep the rate near zero until the economy has seen further improvement toward reaching the Fed’s goals of maximum employment and inflation approaching 2%. This assessment will take into account a wide range of information, including measures of labor market conditions, indicators of inflation pressures and inflation expectations, and readings on financial and international developments. At the Fed’s October 2015 meeting, the Committee again held steady, while opening the door for a potential December rate hike. (The Fed did raise rates at its December meeting, subsequent to the close of this reporting period.)
The U.S. economy proved to be fairly resilient compared to other economies around the globe, boosted by an improving job market, declining gas prices and low mortgage rates. According to the government’s gross domestic product (GDP) “second” estimate, the U.S. economy increased at a 2.1% annualized rate in the third quarter of 2015, compared with increases of 3.9% in the second quarter, 0.6% in the first quarter of 2015 and 2.2% in the fourth quarter 2014. The deceleration in real GDP in the third quarter primarily reflected a downturn in private inventory investment and decelerations in exports, in nonresidential fixed investment, in state and local government spending and in residential fixed investment that were partly offset by a deceleration in imports. The Consumer Price Index (CPI) increased 0.2% essentially unchanged year-over-year as of October 2015. The core CPI (which excludes food and energy) increased 0.2% during the same period, below the Fed’s unofficial longer term inflation objective of 2.0%. As of October 2015, the U.S. unemployment rate was 5.0%, a figure that is also considered “full employment” by some Fed officials. The housing market continued to post consistent gains as of its most recent reading for September 2015. The average home price in the S&P/Case-Shiller Index of 20 major metropolitan areas rose 5.5% for the twelve months ended September 2015 (most recent data available at the time this report was prepared).
Meanwhile, a number of issues weighed on economies across the globe including geopolitical turmoil, weak growth overseas and sharply falling oil prices, which were caused by the faltering global economy and OPEC’s refusal to give up market share. Falling oil prices propelled significant appreciation in the U.S. dollar, which hit a multi-year high versus a basket of other major currencies, supported by the confident Fed and weaker data coming out of Europe, Japan and China. In an effort to improve their economic growth, countries across the globe maintained extraordinarily accommodative monetary policies. The European Central Bank (ECB) launched a massive quantitative easing program via a government bond-buying program that pumped more than 1 trillion euros into the weak eurozone economy, while other central banks around the world enacted more than 30 policy easing actions during the first few months of 2015.
Political drama also dominated the news partway through the reporting period, including the escalating tensions over Greece’s debt issues and aggressive policy intervention by the Chinese government to deflate the country’s stock market bubble. In late June, Greece took front and center in world market headlines with defaults on its payments to the International Monetary Fund and threats of a potential exit from the European Monetary Union (EMU). However, by mid-July, Greece had agreed to austerity measures in return for more bailout funds. Meanwhile, after skyrocketing for nearly a year, China’s stock market suddenly shifted gears in June and embarked on a massive sell-off that quickly spilled over to the rest of the world. Investors pulled money out of Chinese stocks despite efforts by China’s government to stem the tide, including further rate cuts, a 1 trillion yuan bond for infrastructure build-out, new regulations surrounding equity purchases and redemptions and the unexpected devaluation of the yuan currency in mid-August. A number of factors helped fuel the sell-off, including weak Chinese economic data and falling commodity prices. By August 2015, oil prices had fallen to their lowest levels of the reporting period with prices for West Texas Intermediate (WTI) crude dipping below the $40/barrel level for a short time. Following the drop, the price of WTI crude reversed course and ended the reporting period around $47/barrel.
With this backdrop, global volatility spiked across all asset classes during the reporting period. Oil and gas shares, other energy-related stocks and petrocurrencies were hit hard around the world due to dramatically falling commodity prices. In overseas stock markets, news of widespread monetary policy moves across the globe gave equities a boost through May however, in the summer months, renewed fears over China and uncertainty about the Fed’s next move hit markets, spurring a massive global sell-off in August. Overall for the reporting period, international equity markets were collectively much weaker than the U.S. market and ended with flat to negative returns. For example, the MSCI EAFE Index returned -0.07% for the twelve-month reporting period. Emerging market stocks experienced even greater headwinds from the strong U.S. dollar, weak Chinese data, the commodity sell-off and Fed uncertainty, significantly underperforming developed market peers. As measured by the MSCI Emerging Markets Index, this segment ended the period with a -14.53% return.
In the U.S., equities experienced a correction in August 2015 in connection with the above-mentioned factors and dipped again in late September, before rising back to mid-2015 levels in the final month of the reporting period. The S&P 500® Index ended up posting a return of 5.20% for the twelve-month reporting period. However, the positive overall index results masked the more than 40% spread between the return of the best performing sector, consumer discretionary and the worst performing sector, energy, which fell by more than 19%. Larger, more established companies outperformed riskier, smaller-cap stocks, which continued to be hampered by heightened risk aversion and the pending Fed rate tightening, which will remove liquidity from the market. The small-cap segment produced a 0.34% return as measured by the Russell 2000® Index versus a 4.86% return for the larger-cap Russell 1000® Index. Across the capitalization spectrum, growth stocks outperformed value stocks, particularly in the larger-cap area.
Nuveen Large Cap Growth Opportunities Fund
How did the Fund perform during the twelve-month reporting period ended October 31, 2015?
The tables in the Fund Performance and Expense Ratios section of this report provide total returns for the Fund for the one-year, five-year and ten-year periods ended October 31, 2015. Comparative performance information is provided for the Fund’s Class A Shares at net asset value (NAV). The Fund’s Class A Shares at NAV outperformed both the Russell 1000® Growth Index and the Lipper Large-Cap Growth Funds Classification Average during the twelve-month reporting period.
What strategies were used to manage the Fund during the reporting period and how did these strategies influence performance?
The Fund seeks to provide long-term capital appreciation by investing primarily in the common stocks of companies that have market capitalizations of $5 billion or greater at the time of purchase. We start by identifying what we believe are exceptional growth companies with open-ended growth prospects, outstanding financial characteristics and solid management teams. From that highly selective group, we invest in companies where our expectations for earnings growth exceed consensus expectations. For each Fund holding, we develop a proprietary growth thesis. When the growth thesis is validated, we hold or buy more; however, when our growth thesis is not validated, we sell the holding. Although we made individual position changes during the reporting period, our underlying investment strategy remained consistent.
In the midst of volatile market conditions, particularly in the final three months of the reporting period, the Fund was able to outperform both its Russell benchmark and Lipper average. The Fund benefited from strong stock selection and an overweight position in the best-performing sector, consumer discretionary, as well as stock selection in information technology. An underweight position in the energy sector, the worst-performing sector in the index by a significant margin, was also helpful. The Fund had no sectors that detracted in any meaningful way during the reporting period.
With the positive tailwinds provided by significantly lower energy prices and continued improvements in employment and wages, several of the Fund’s consumer-related sector holdings turned in favorable results. For example, coffeehouse chain Starbucks Corporation continued to aid the Fund’s results, benefiting from robust comparable store sales in the United States and strong growth in China. The Starbucks brand continues to gain traction in China despite the overall slowdown in the country’s economy. Also, a position in online retail giant Amazon.com Inc. performed well for the Fund. Earlier in 2015, Amazon separated the quarterly reporting of its cloud-hosting business (Amazon Web Services) from its core e-commerce retail business. Since then, the company has surprised investors with exceptional results in terms of both growth and profitability for Amazon Web Services, and the company’s shares have
Portfolio Managers’ Comments (continued)
been bid up accordingly. Cruise line operator Royal Caribbean Cruises Ltd. also benefited the Fund’s performance. The company posted solid quarterly numbers, while also benefiting from management’s comments regarding future booking trends and other initiatives. Royal Caribbean has several potential catalysts in play including the benefits of materially lower fuel prices, new ships being introduced in China, potential Cuban itineraries and a generally improving supply-and-demand outlook in the Caribbean, which has been in a state of overcapacity for years.
Also in the consumer discretionary sector, the Fund benefited from a position in athletic footwear and apparel maker Nike Inc., which saw its shares surge to an all-time high later in the reporting period after reporting strong revenue growth and margin expansion during the most recent fiscal quarter. The company, one of the beneficiaries of a worldwide trend toward more leisure-wear clothing, continued to execute well and gain market share. The Nike brand is viewed as one of the strongest, especially among younger consumers across the globe. One of the most important metrics for Nike, future orders, trended much higher due to widespread strength coming from China, Japan, Western Europe and the United States. Rounding out the Fund’s strength in the discretionary sector was a position in Netflix Inc., which engages in the delivery of television shows and movies directly to TVs, computers and mobile devices via the Internet. Netflix reported a strong first-quarter earnings report in April, adding 4.9 million subscribers, which is well above the number added in the same quarter a year ago. The company is benefiting from the shift by millennials and other viewers to watching content on Netflix versus traditional TV. Nearly 40% of TV households in the United States now subscribe to its service, while the company’s subscriber growth overseas is also trending above plan. After its strong run, we trimmed some of our position and Netflix also underwent a seven-for-one stock split in July.
The information technology sector was home to several of the Fund’s top contributors, including two leading developers and distributors of video games, Electronic Arts Inc. and Activision Blizzard Inc. Both companies continue to benefit from a new generation of gaming consoles and the increasing shift toward the digital delivery of games over the internet, which is meaningfully raising their gross margins and free cash flow. Electronic Arts’ management team has done an exceptional job of expanding the reach and profit margin of popular games such as Madden NFL and FIFA, while Activision Blizzard is devoting considerable resources to developing new games that are well received. Both companies have produced stronger-than-expected earnings for several quarters in a row and raised full-year guidance. We believe the outlook for Electronic Arts and Activision Blizzard remains favorable, both in the short term due to their current line-ups, the console cycle and the holiday season, and long term based on the other above-mentioned trends. A position in Visa Inc. also aided results during the reporting period. The company continues to benefit from the secular trend toward plastic as a form of payment, while generating solid volumes and earnings. Shares were further propelled by evidence that both Visa and MasterCard may be allowed to increase their presence in China’s bankcard clearing market after the country’s cabinet issued a decision to open it. In addition, the Fund saw strong results from Palo Alto Networks Inc., which provides comprehensive next-generation firewall protection for enterprise networks covering all desktop, wireless and tablet devices. With the growing number of highly publicized security breaches on enterprise data, Palo Alto Networks is gaining profitable market share and becoming the top-of-mind choice for software security. The company reported strong first-quarter results and raised its guidance during the quarter. Palo Alto Networks is capable of addressing a large portion of the potentially $34 billion security market, which could further drive market share gains if companies continue to prefer its complete platform approach.
Although the Fund’s performance benefited from its underweight position in the energy sector, a sector that was down more than 30% in the Russell 1000® Growth Index, we had two individual holdings underperformed. Dramatically falling oil prices negatively affected our position in Whiting Petroleum Corporation, a company engaged in the exploration and development of crude oil, natural gas and natural gas liquids. Its stock declined even more than the overall sector during the reporting period because of investors’ keen focus on the impact of lower oil prices, capital expenditures and production. We sold out of the Fund’s position in Whiting Petroleum before the end of the reporting period. Shares of energy services company Halliburton Company lagged during the reporting period because of investor concerns over future drilling and completion activity, given the lower oil prices. Halliburton also announced an offer to acquire Baker Hughes Incorporated in a deal that was still subject to regulatory approvals as of the end of the reporting period. Based on the news, we sold Halliburton and established a position in Baker Hughes, which represented an opportunity to ultimately own Halliburton shares at a discounted price. Halliburton is well positioned for the long-term growth in advanced drilling techniques and should benefit from better pricing and synergies once the Baker Hughes acquisition closes, which we believe is likely to take place. We sold our position in Baker Hughes during the reporting period.
In the industrials sector, the Fund experienced weak results from Kirby Corporation, which operates domestic tank barges, transports bulk liquids and services diesel engines. Kirby’s management announced a downward revision to its outlook for both the fourth
quarter and full-year 2014 in January 2015. The revision was due primarily to headwinds within the company’s land-based diesel engine services segment as a result of the collapse in oil prices and, to a lesser extent, its inland barge business. We eliminated this position partway through the reporting period.
Although the Fund saw strength overall in the information technology sector, its underweight position in technology and software giant Microsoft Corporation, which carries a more than 2% weight in the Russell 1000® Growth Index, was detrimental. The company reported its March quarter in which it beat profit and sales expectations, causing the stock to rebound smartly. Generally speaking and under normal conditions, we tend to position the Fund’s portfolio with underweights to stable, mega-cap companies such as Microsoft which, in our opinion, don’t typically offer exceptional earnings growth prospects. We sold our position in Microsoft. Also, the Fund’s position in semiconductor equipment maker Applied Materials Inc. underperformed. During the reporting period, the market became increasingly worried about declines in future wafer and personal computer growth. However, we believe sentiment has become too negative on the semiconductor names and market share should grow. The company also has a strong cash position, and therefore anticipate dividend and share buyback growth to help support its stock price.
Nuveen Mid Cap Growth Opportunities Fund
How did the Fund perform during the twelve-month reporting period ended October 31, 2015?
The tables in the Fund Performance and Expense Ratios section of this report provide total returns for the Fund for the one-year, five-year and ten-year periods ended October 31, 2015. Comparative performance information is provided for the Fund’s Class A Shares at net asset value (NAV). The Fund’s Class A Shares at NAV underperformed both the Russell Midcap® Growth Index and the Lipper Multi-Cap Growth Funds Classification Average during the twelve-month reporting period.
What strategies were used to manage the Fund during the reporting period and how did these strategies influence performance?
The Fund pursues a long-term capital appreciation strategy by investing primarily in the common stocks of companies that have market capitalizations between approximately $2.4 billion and $28.7 billion at the time of purchase. We start by identifying what we believe are exceptional growth companies with open ended growth prospects, outstanding financial characteristics and solid management teams. From that highly selective group, we invest in companies where our expectations for earnings growth exceed consensus expectations. For each Fund holding, we develop a proprietary growth thesis. When the growth thesis is validated, we hold or buy more; however, when our growth thesis is not validated, we sell the holding. Although we made individual position changes during the reporting period, our underlying investment strategy remained consistent.
The Fund underperformed the Russell Midcap® Growth Index and Lipper average during a period of heighted volatility for mid-cap equities driven by concerns over global growth, particularly in China and the emerging markets. However, the economic backdrop domestically appeared relatively more favorable with continued positive yet moderate gains in housing activity, consumer spending and employment. The Fund’s performance shortfall was primarily the result of stock selection in the health care and industrials sectors, which was only partially offset by strong stock selection in the consumer discretionary sector and an underweight in the energy sector.
In the health care sector, the Fund’s position in Mallinckrodt Plc, an Irish-domiciled company that develops, manufactures and distributes specialty pharmaceutical products and medical imaging agents, was not immune to the sell-off in the sector caused by drug pricing concerns. Mallinckrodt saw a notable slowdown in sales of its largest drug, Acthar, while management struck a more cautious tone regarding future growth. In addition, its shares were negatively impacted by allegations of wrongdoing at industry peer Valeant Pharmaceuticals over its accounting practices. We continue to like and own Mallinckrodt because we believe the company is executing well, while the other forces weighing down its stock are temporary in nature. Specialty pharmaceutical firm Salix Pharmaceuticals, Ltd., which mainly develops treatments for gastrointestinal diseases, was also a laggard during the reporting period in which we owned it. After performing strongly in the previous performance period, Salix Pharmaceuticals was hurt by allegations that its management team significantly understated inventory levels and overstated earnings. As a result, the company’s chief financial officer resigned and we sold the Fund’s position due to the uncertainty. Shares of Jazz Pharmaceuticals Plc were also under pressure late in the period. The company’s flagship product for narcolepsy, Xyrem, has grown rapidly, while it also has a secondary growth
Portfolio Managers’ Comments (continued)
product, Erwinaze, for use in pediatric patients with acute lymphoblastic leukemia. Although Jazz Pharmaceuticals’ fundamentals remained solid and revenues and earnings announced during the most recent quarter were in line with consensus, some uncertainty surrounded the stock due to ongoing Xyrem patent litigation with generic competitors. We sold this position shortly after the reporting period ended.
In the industrials sector, the Fund experienced weak results from Kirby Corporation, which operates domestic tank barges, transports bulk liquids and services land-based diesel engines. Kirby’s management continued to make downward revisions to its forward-looking guidance as falling crude oil prices pressured earnings throughout the reporting period. Also, our position in Southwest Airlines Co. detracted after the company began adding to capacity at a much faster pace and to a greater degree than investors had anticipated. Given the historically volatile nature of the airline industry, investors questioned if Southwest’s move signaled an end to the recent era of industry capacity discipline, increased pricing and improved profitability. We decided to eliminate our positions in both Kirby and Southwest Airlines during the reporting period.
As concerns around global growth intensified during the final months of the reporting period, several of our more domestically leveraged names in the consumer discretionary space led to positive attribution. We benefited from a position in Advance Auto Parts Inc., the largest U.S. distributor of automotive parts with more than 5,300 retail stores that sell to consumers and professional installers. Its shares soared in September after activist investor Starboard Value revealed its increased stake in the company. We believe Advance Auto Parts is among a handful of distributors that is well positioned to consolidate the highly fragmented automotive aftermarket, where scale drives market share. We see ample room for the company to drive better margins and improved cash flow through integration synergies from its 2014 acquisition of General Parts, thereby creating additional value for shareholders. Also, a position in Ulta Salon, Cosmetics & Fragrance Inc. performed well. The company has been able to create a “one-stop shop” for beauty needs by combining the concept of a superstore offering a wide array of cosmetics, fragrance, haircare and skincare products with in-store salons. Ulta’s relatively new CEO has continued to successfully lead the company’s strong execution, which resulted in higher-than-expected earnings and impressive growth in comparable-store sales during the reporting period. The Fund also benefited from a position in arts and crafts supply store Michaels Companies Inc. The company, which we purchased when it went public in June 2014, is benefiting from solid earnings and increased forward-looking estimates. We continue to like the outlook for Michaels because the company is generating strong free cash flow and paying down debt, while its stock is still attractively valued. We also have confidence in Michaels’ CEO, who came on board after a successful stint at Ulta Salon.
In the consumer staples sector, Monster Beverage Corporation benefited the Fund’s performance during the reporting period. This marketer and distributor of a variety of energy drinks and alternative beverages remained in a strong position after Coca-Cola closed its transaction to buy a large equity stake in the company in June, with the option to increase its stake in the future. With this transaction, Monster gained Coke’s global energy drink business and access to its broad distribution network in countries like China, while it offloaded its non-energy drink business to Coke. Monster continued to generate strong volume growth, while the company’s underlying metrics also remained solid.
While our holdings in the health care sector generally detracted from performance during the reporting period, one of the Fund’s top performers, Abiomed Inc., was found in the sector. The company is the manufacturer of the Impella percutaneous ventricular assist device, which is used to provide circulatory support for patients experiencing severe cardiovascular issues. Abiomed received a boost from formal FDA approval in late March for its device’s use in high-risk percutaneous coronary intervention, which should drive a sequence of additional regulatory events. Shares also reacted positively to a second-quarter financial update that was well ahead of investor expectations and an annual analyst meeting that laid out the company’s substantial growth opportunity in a number of cardiovascular indications.
The information technology sector was home to several of the Fund’s top contributors, including two leading developers and distributors of video games, Electronic Arts Inc. and Activision Blizzard Inc. Both companies continue to benefit from a new generation of gaming consoles and the increasing shift toward the digital delivery of games over the internet, which is meaningfully raising their gross margins and free cash flow. Electronic Arts’ management team has done an exceptional job of expanding the reach and profit margin of the company’s popular games such as Madden NFL and FIFA, while Activision Blizzard is devoting considerable resources to developing new games that are being well received. Both companies have produced stronger-than-expected earnings for several quarters in a row and raised full-year guidance. We believe the outlook for both Electronic Arts and Activision Blizzard remains
favorable, both in the short term due to their current line-ups, the console cycle and the holiday season and long term based on the other above-mentioned trends. In addition, the Fund saw strong results from Palo Alto Networks Inc., which provides comprehensive next-generation firewall protection for enterprise networks covering all desktop, wireless and tablet devices. With the growing number of highly publicized security breaches on enterprise data, Palo Alto Networks is gaining profitable market share and becoming the top-of-mind choice for software security. The company reported strong first-quarter results and raised its guidance during the quarter. Palo Alto Networks is capable of addressing a large portion of the potentially $34 billion security market, which could further drive market share gains if companies continue to prefer its complete platform approach.
Several other positions in the information technology sector, however, offset this strength, including SolarWinds Inc., a designer, developer and marketer of enterprise-class IT infrastructure management software to organizations of all sizes. The company’s product offerings range from individual software tools to more comprehensive software products that enable IT professionals to more efficiently and effectively manage their network, systems and application infrastructure. SolarWinds’ shares declined after the company reported a sharp deceleration in year-over-year license growth during its quarterly earnings report. At issue was the failure to generate the necessary volume and quality of sales leads for the company’s network management and system management businesses. Because the company’s durability of future growth was called into question, we sold the stock. The Fund also experienced underperformance from a position in semiconductor firm Skyworks Solutions Inc., which manufactures chips used in radio frequency and mobile communications. The company, a major supplier for Apple iPhones, was caught in a bidding war for PMC-Sierra Inc., the maker of semiconductor devices for use in storage, optical and mobile networks. In addition, a position in LinkedIn Corporation, the leading on-line networking service for workplace professionals, detracted from performance during the reporting period. Although the company reported earnings that were almost exactly in line with analyst estimates, it disappointed with its projections for earnings and revenue for the coming quarter. LinkedIn made an acquisition of Lynda.com, an online software training company, and some of the accounting related to the acquisition was confusing to investors. The company also announced a sales force reorganization that had a sizeable impact on its main talent solutions business for enterprises. In addition, the pace of LinkedIn’s desktop display advertising showed a decline as people switched from desktops to mobile. With its growth thesis called into question, we sold our position in LinkedIn.
Nuveen Small Cap Growth Opportunities Fund
How did the Fund perform during the twelve-month reporting period ended October 31, 2015?
The tables in the Fund Performance and Expense Ratios section of this report provide total returns for the Fund for the one-year, five-year and ten-year periods ended October 31, 2015. Comparative performance information is provided for the Fund’s Class A Shares at net asset value (NAV). The Fund’s Class A Shares at NAV underperformed both the Russell 2000® Growth Index and the Lipper Small-Cap Growth Funds Classification Average during the twelve-month reporting period.
What strategies were used to manage the Fund during the reporting period and how did these strategies influence performance?
The Fund pursues a long-term capital appreciation strategy by investing primarily in equity securities of smaller-sized companies with market capitalizations within the market capitalization range of the companies in the Russell 2000® Index on the last business day of the month in which its most recent reconstitution was completed. As of June 30, 2015, the range was $176.7 million to $4.3 billion. The investment process employed in the management of the Fund seeks to exploit secular growth trends that we believe will provide an investment tailwind to above-average growth that should transcend the business cycle over the longer term. Importantly, our process also emphasizes a valuation discipline designed to find attractive investment opportunities that should benefit from multiple expansion when particular investment catalysts become evident in the marketplace. The Fund’s portfolio typically features investments in high quality companies with attractive or improving margin profiles, generally healthy balance sheets and prospects for above-average revenue and earnings growth.
The Fund underperformed the Russell 2000® Growth Index and Lipper average during a period of heighted volatility for small-cap equities driven by concerns over global growth, particularly in China and the emerging markets. The associated concerns regarding the profit and inventory impacts to companies with international exposure, as well as the timing and trajectory of a potential change in the Feds monetary policy, garnered the majority of investor attention toward the end of the reporting period. However, on the
Portfolio Managers’ Comments (continued)
domestic front, the economic backdrop appeared relatively more favorable with continued positive yet moderate gains in housing activity, consumer spending and employment. The Fund’s shortfall was primarily the result of stock selection in the industrial, consumer discretionary and information technology sectors, which was only partially offset by strong stock selection in the health care and energy sectors.
The most significant detractor to relative performance was stock selection in the industrial sector. The Fund experienced weak results from a position in Tutor Perini Corporation, a leading non-residential construction company. The company’s second-quarter earnings plunged due to the loss of a large concrete project and delays in a large viaduct project, further reinforcing concerns about the company’s declining backlog. We sold out of the Fund’s position in Tutor Perini during the reporting period. Also, we saw weak results from a position in NN Inc., a precision metal bearing and component supplier to original equipment manufacturers. The company’s primary exposure is in the automobile market, although it is currently in the process of diversifying into medical and industrial applications. NN’s second-quarter report came in slightly below expectations on revenue, but beat handily on earnings per share with no change in guidance. However, negative sentiment related to the Volkswagen emissions scandal and Chinese growth concerns have weighed on the auto sector broadly. We maintained our positive bias toward NN because its recent acquisition further diversifies the company’s business away from autos and toward the higher-margin industrial and medical areas. Elsewhere in industrials, the steep decline in oil prices led to investor anticipation of project deferrals and diminished capital spending by companies with leverage to the North American oil complex. Our position in MasTec Inc., which focuses on the build-out of energy and telecommunications infrastructure, was negatively impacted as the outlook for energy capital spending in 2015 brought uncertainty to its business outlook. We maintained a position in MasTec based on the belief that its energy exposure is mainly in midstream pipeline, which should be less impacted in the coming year. Offsetting some of the weakness in industrials, shares of leading carpet tile manufacturer Interface Inc. performed strongly. The company benefited from improving non-residential demand, which is driving double-digit growth globally, as well as lower nylon input costs on the heels of the recent decrease in oil prices. We sold our position in Interface, Inc. during the reporting period.
Despite the tailwinds provided by significantly lower energy prices and continued improvements in employment and wages, consumer-related holdings continued to negatively impact the Fund’s results during the reporting period. The Fund experienced sub-par results from its position in Capella Education Company, a for-profit online education company catering to working adults seeking mostly advanced degrees. Capella Education’s first-quarter results were somewhat disappointing with a modest earnings miss primarily due to increased marketing expenses. Although we believed the stock’s negative reaction was driven more by the company’s lowered expectations for new student enrollment for the second quarter and full year to the low single-digit level, we decided to eliminate our position in Capella Education. Also, shares of the teen apparel retailer Zumiez Inc. fell sharply. The company reported disappointing third-quarter comparable-store sales guidance that resulted from a lack of fashion trend, particularly among boys’ and men’s apparel, spring and summer assortments that were off target, foreign exchange headwinds and a calendar shift in the back-to-school season with the late timing of Labor Day. We sold our position in Zumiez. In the apparel and luxury goods category, women’s accessories manufacturer Vera Bradley, Inc. provided a disappointing outlook for 2015 with its fourth-quarter earnings report. The report included substantial weakness in comparable-store sales driven by soft traffic and increased spending on marketing, its e-commerce initiative and compensation, which led us to sell the position. On the other hand, the Fund experienced strong performance from a position in Pool Corporation, the nation’s largest distributor of pool-related supplies and equipment. Pool’s results have modestly exceeded expectations in four of the past five quarters, while the company’s long history of consistent execution has also led investors to gravitate toward the stock in volatile markets. However, we did trim our position in Pool because its valuation appeared full on a near-term basis.
Stock selection was negative overall in the information technology sector where several strong performers were offset by weakness in others. The top performing information technology stock overall was Gigamon Inc., a provider of visibility management tools and solutions for enterprise and service providers. Although not a security provider itself, the company has experienced a dramatic increase in demand for its products as the need for security solutions has risen, since its products enable technology managers to better address security vulnerabilities. Gigamon is also benefiting from other growth drivers such as virtualization, 4G mobile communications, voiceover LTE and network upgrade cycles. Marketing and consulting firm Sapient Corporation was also a substantially positive contributor in the technology group. In early November 2014, the company announced that it would be acquired by the international advertising conglomerate Publicis Groupe for a significant premium in an all-cash deal valued at $3.7 billion. We also saw strength from our position in SolarWinds Inc., a designer, developer and marketer of enterprise-class IT infrastructure
management software to organizations of all sizes. The company’s product offerings range from individual software tools to more comprehensive software products that enable IT professionals to more efficiently and effectively manage their network, systems and application infrastructure. SolarWinds’ shares soared in October 2015 after the company agreed to be acquired and taken private by two private equity firms for $4.5 billion in cash. We sold our positions in both Sapient Corporation and SolarWinds Inc. On the other hand, shares of Barracuda Networks Inc., a leading manufacturer of security and storage appliances sold primarily to small- and medium-sized businesses, fell sharply. The company posted disappointing billings growth in July, and we subsequently exited the position based on our belief that management’s revised guidance did not adequately forecast the continued challenges for billings growth. Also, Radware Ltd, a manufacturer of application delivery controllers and security appliances, posted slightly disappointing second-quarter results due to poor sales in Asia-Pacific regions, which are approximately 30% of the company’s revenues. Although management restructured its Asia-Pacific sales force and guided for a stronger second half of 2015, we decided to eliminate our position in Radware.
Security selection within the health care sector was the most significant positive contributor to the Fund’s relative performance, particularly among its medical device and biotechnology names. Shares of Synageva BioPharma Corporation (Synageva) more than doubled in price when the developer of therapies for rare diseases announced that it would be acquired by Alexion Pharmaceuticals in an $8.4 billion transaction. Another of the Fund’s top performers was Abiomed Inc., the manufacturer of the Impella percutaneous ventricular assist device used to provide circulatory support for patients experiencing severe cardiovascular issues. The company received a boost from formal FDA approval in late March for its device’s use in high-risk percutaneous coronary intervention, which should drive a sequence of additional regulatory events. Shares also reacted positively to several other factors: a second-quarter financial update that was well ahead of investor expectations; an annual analyst meeting that laid out the company’s substantial growth opportunity in a number of cardiovascular indications; and reaffirmation that reimbursement for the Impella device should remain stable through 2017. Shares of Inogen Inc., a leading manufacturer of portable oxygen concentrators, also advanced strongly during the reporting period. The company benefited from a strong first-quarter earnings report and a 2015 revenue guidance increase, combined with news that it had successfully concluded an internal accounting review that revealed no major reporting issues. Receptos Inc., a developer of drugs for the treatment of immune disorders, surged in mid-summer after the company announced that it agreed to a takeover deal with Celgene Corporation worth more than $7 billion that was completed in August. Through the acquisition, Celgene looks to expand its inflammation and immunology portfolio by bringing Receptos’ leading drug, Ozanimod, into its portfolio. The drug has shown promise in treating both ulcerative colitis and multiple sclerosis. We have sold our positions in Synageva and Receptos Inc.
The health care sector was also home to two significant detractors, including Pacira Pharmaceuticals Inc., the developer of an extended-release, non-opiate injection for surgical applications called Exparel. Pacira’s shares traded off sharply after management reduced 2015 revenue guidance in reaction to the FDA’s denial of the company’s nerve block application and another competitor emerged in the space. Lacking a catalyst to address these issues in the intermediate term, we sold this position. Also, shares of LDR Holding Corporation fell when this manufacturer of novel spinal implants pre-released third-quarter revenues that were modestly below consensus estimates. The timing of the release shortly after a secondary equity offering likely exacerbated the negative stock reaction. However, we believe LDR’s cervical disc product, Mobi-C, will continue to capture share and drive above-average growth.
The Fund’s energy holdings outperformed the benchmark during the reporting period even with the substantial volatility in the underlying commodity. Unfortunately, one of the Fund’s more significant laggards was also found in the energy sector. Oasis Petroleum Inc., a shale oil producer in the Williston Basin of North Dakota, saw its shares tumble as investors scrutinized the return potential of its acreage in a lower oil price environment. We sold our position in Oasis Petroleum Inc. during the reporting period.
Risk Considerations
Nuveen Large Cap Growth Opportunities Fund
Mutual fund investing involves risk; principal loss is possible. There is no guarantee that the Fund’s investment objectives will be achieved. Prices of equity securities may decline significantly over short or extended periods of time. These and other risk considerations, such as derivatives, investment focus (growth style), and non-U.S./emerging markets risks, are described in detail in the Fund’s prospectus.
Nuveen Mid Cap Growth Opportunities Fund
Mutual fund investing involves risk; principal loss is possible. There is no guarantee that the Fund’s investment objectives will be achieved. Prices of equity securities may decline significantly over short or extended periods of time. Investments in mid-cap companies are subject to greater volatility than those of larger companies, but may be less volatile than investments in smaller companies. These and other risk considerations, such as derivatives, investment focus (growth style), and non-U.S./emerging markets risks, are described in detail in the Fund’s prospectus.
Nuveen Small Cap Growth Opportunities Fund
Mutual fund investing involves risk; principal loss is possible. There is no guarantee that the Fund’s investment objectives will be achieved. Prices of equity securities may decline significantly over short or extended periods of time. Investments in smaller companies are subject to greater volatility than those of larger companies. These and other risk considerations, such as derivatives, investment focus (growth style), and non-U.S./emerging markets risks, are described in detail in the Fund’s prospectus.
Fund Performance
and Expense Ratios
The Fund Performance and Expense Ratios for each Fund are shown within this section of the report.
Returns quoted represent past performance, which is no guarantee of future results. Current performance may be higher or lower than the performance shown. Investment returns and principal value will fluctuate so that when shares are redeemed, they may be worth more or less than their original cost. Returns without sales charges would be lower if the sales charge were included. Returns do not reflect the deduction of taxes that a shareholder would pay on Fund distributions or the redemption of Fund shares.
Returns may reflect fee waivers and/or expense reimbursements by the investment adviser during the periods presented. If any such waivers and/or reimbursements had not been in place, returns would have been reduced. See Notes to Financial Statements, Note 7—Management Fees and Other Transactions with Affiliates for more information. For the most recent month-end performance visit www.nuveen.com or call (800) 257-8787.
Returns reflect differences in sales charges and expenses, which are primarily differences in distribution and service fees, and assume reinvestment of dividends and capital gains.
Comparative index and Lipper return information is provided for Class A Shares at net asset value (NAV) only.
The expense ratios shown reflect total operating expenses (before fee waivers and/or expense reimbursements, if any) as shown in the most recent prospectus. The expense ratios include management fees and other fees and expenses.
Fund Performance and Expense Ratios (continued)
Nuveen Large Cap Growth Opportunities Fund
Refer to the first page of this Fund Performance and Expense Ratios section for further explanation of the information included within this section. Refer to the Glossary of Terms Used in this Report for definitions of terms used within this section.
Fund Performance
Average Annual Total Returns as of October 31, 2015
| | | | | | | | | | | | |
| | | Average Annual | |
| | | 1-Year | | | 5-Year | | | 10-Year | |
Class A Shares at NAV | | | 11.75% | | | | 13.19% | | | | 8.44% | |
Class A Shares at maximum Offering Price | | | 5.33% | | | | 11.86% | | | | 7.80% | |
Russell 1000® Growth Index | | | 9.18% | | | | 15.30% | | | | 9.09% | |
Lipper Large-Cap Growth Funds Classification Average | | | 7.90% | | | | 13.81% | | | | 8.09% | |
| | | |
Class C Shares | | | 10.92% | | | | 12.36% | | | | 7.63% | |
Class R3 Shares | | | 11.47% | | | | 12.91% | | | | 8.16% | |
Class I Shares | | | 12.05% | | | | 13.48% | | | | 8.71% | |
| | | | | | | | |
| | | Average Annual | |
| | | 1-Year | | | Since
Inception | |
Class R6 Shares | | | 12.14% | | | | 16.46% | |
Average Annual Total Returns as of September 30, 2015 (Most Recent Calendar Quarter)
| | | | | | | | | | | | |
| | | Average Annual | |
| | | 1-Year | | | 5-Year | | | 10-Year | |
Class A Shares at NAV | | | 4.99% | | | | 12.39% | | | | 7.47% | |
Class A Shares at maximum Offering Price | | | (1.05)% | | | | 11.06% | | | | 6.83% | |
Class C Shares | | | 4.22% | | | | 11.56% | | | | 6.67% | |
Class R3 Shares | | | 4.71% | | | | 12.11% | | | | 7.20% | |
Class I Shares | | | 5.24% | | | | 12.67% | | | | 7.74% | |
| | | | | | | | |
| | | Average Annual | |
| | | 1-Year | | | Since
Inception | |
Class R6 Shares | | | 5.34% | | | | 13.29% | |
Since inception returns for Class R6 Shares are from 2/28/13. Indexes and Lipper averages are not available for direct investment.
Class A Shares have a maximum 5.75% sales charge (Offering Price). Class A Share purchases of $1 million or more are sold at net asset value without an up-front sales charge but may be subject to a contingent deferred sales charge (CDSC), also known as a back-end sales charge, if redeemed within twelve months of purchase. Class C Shares have a 1% CDSC for redemptions within less than twelve months, which is not reflected in the one-year total return. Class R3 Shares have no sales charge and are only available for purchase by eligible retirement plans. Class R6 Shares have no sales charge and are available only to certain limited categories of investors as described in the prospectus. Class I Shares have no sales charge and may be purchased under limited circumstances or by specified classes of investors.
Expense Ratios as of Most Recent Prospectus
| | | | | | | | | | | | | | | | | | | | |
| | | Share Class | |
| | | Class A | | | Class C | | | Class R3 | | | Class R6 | | | Class I | |
Expense Ratios | | | 1.25% | | | | 2.00% | | | | 1.50% | | | | 0.90% | | | | 1.00% | |
Growth of an Assumed $10,000 Investment as of October 31, 2015 – Class A Shares
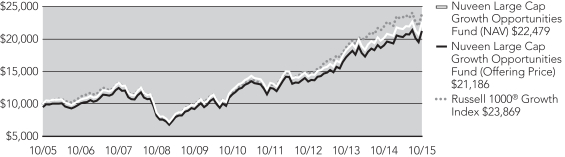
The graphs do not reflect the deduction of taxes that a shareholder may pay on Fund distributions or the redemption of Fund shares.
Fund Performance and Expense Ratios (continued)
Nuveen Mid Cap Growth Opportunities Fund
Refer to the first page of this Fund Performance and Expense Ratios section for further explanation of the information included within this section. Refer to the Glossary of Terms Used in this Report for definitions of terms used within this section.
Fund Performance
Average Annual Total Returns as of October 31, 2015
| | | | | | | | | | | | |
| | | Average Annual | |
| | | 1-Year | | | 5-Year | | | 10-Year | |
Class A Shares at NAV | | | 3.68% | | | | 12.59% | | | | 8.43% | |
Class A Shares at maximum Offering Price | | | (2.29)% | | | | 11.26% | | | | 7.79% | |
Russell Midcap® Growth Index | | | 4.94% | | | | 14.10% | | | | 9.08% | |
Lipper Multi-Cap Growth Funds Classification Average | | | 5.49% | | | | 12.99% | | | | 8.08% | |
| | | |
Class C Shares | | | 2.91% | | | | 11.74% | | | | 7.62% | |
Class R3 Shares | | | 3.43% | | | | 12.30% | | | | 8.16% | |
Class I Shares | | | 3.95% | | | | 12.87% | | | | 8.70% | |
| | | | | | | | |
| | | Average Annual | |
| | | 1-Year | | | Since
Inception | |
Class R6 Shares | | | 4.09% | | | | 13.93% | |
Average Annual Total Returns as of September 30, 2015 (Most Recent Calendar Quarter)
| | | | | | | | | | | | |
| | | Average Annual | |
| | | 1-Year | | | 5-Year | | | 10-Year | |
Class A Shares at NAV | | | 2.11% | | | | 12.90% | | | | 7.81% | |
Class A Shares at maximum Offering Price | | | (3.76)% | | | | 11.57% | | | | 7.17% | |
Class C Shares | | | 1.37% | | | | 12.06% | | | | 7.01% | |
Class R3 Shares | | | 1.87% | | | | 12.62% | | | | 7.54% | |
Class I Shares | | | 2.36% | | | | 13.18% | | | | 8.08% | |
| | | | | | | | |
| | | Average Annual | |
| | | 1-Year | | | Since
Inception | |
Class R6 Shares | | | 2.51% | | | | 12.72% | |
Since inception returns for Class R6 Shares are from 2/28/13. Indexes and Lipper averages are not available for direct investment.
Class A Shares have a maximum 5.75% sales charge (Offering Price). Class A Share purchases of $1 million or more are sold at net asset value without an up-front sales charge but may be subject to a contingent deferred sales charge (CDSC), also known as a back-end sales charge, if redeemed within twelve months of purchase. Class C Shares have a 1% CDSC for redemptions within less than twelve months, which is not reflected in the one-year total return. Class R3 Shares have no sales charge and are only available for purchase by eligible retirement plans. Class R6 Shares have no sales charge and are available only to certain limited categories of investors as described in the prospectus. Class I Shares have no sales charge and may be purchased under limited circumstances or by specified classes of investors.
Expense Ratios as of Most Recent Prospectus
| | | | | | | | | | | | | | | | | | | | |
| | | Share Class | |
| | | Class A | | | Class C | | | Class R3 | | | Class R6 | | | Class I | |
Expense Ratios | | | 1.30% | | | | 2.05% | | | | 1.55% | | | | 0.92% | | | | 1.05% | |
Growth of an Assumed $10,000 Investment as of October 31, 2015 – Class A Shares
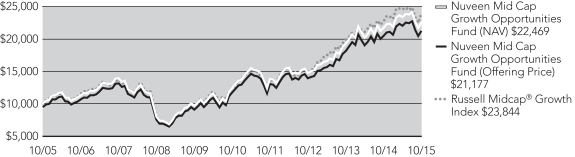
The graphs do not reflect the deduction of taxes that a shareholder may pay on Fund distributions or the redemption of Fund shares.
Fund Performance and Expense Ratios (continued)
Nuveen Small Cap Growth Opportunities Fund
Refer to the first page of this Fund Performance and Expense Ratios section for further explanation of the information included within this section. Refer to the Glossary of Terms Used in this Report for definitions of Terms used within this section.
Fund Performance
Average Annual Total Returns as of October 31, 2015
| | | | | | | | | | | | |
| | | Average Annual | |
| | | 1-Year | | | 5-Year | | | 10-Year | |
Class A Shares at NAV | | | 0.72% | | | | 11.63% | | | | 7.44% | |
Class A Shares at maximum Offering Price | | | (5.08)% | | | | 10.31% | | | | 6.81% | |
Russell 2000® Growth Index | | | 3.52% | | | | 13.56% | | | | 8.67% | |
Lipper Small-Cap Growth Funds Classification Average | | | 1.83% | | | | 12.30% | | | | 7.76% | |
| | | |
Class C Shares | | | (0.03)% | | | | 10.80% | | | | 6.65% | |
Class R3 Shares | | | 0.50% | | | | 11.36% | | | | 7.18% | |
Class I Shares | | | 1.00% | | | | 11.91% | | | | 7.71% | |
Average Annual Total Returns as of September 30, 2015 (Most Recent Calendar Quarter)
| | | | | | | | | | | | |
| | | Average Annual | |
| | | 1-Year | | | 5-Year | | | 10-Year | |
Class A Shares at NAV | | | 0.33% | | | | 11.49% | | | | 6.43% | |
Class A Shares at maximum Offering Price | | | (5.45)% | | | | 10.18% | | | | 5.80% | |
Class C Shares | | | (0.41)% | | | | 10.66% | | | | 5.63% | |
Class R3 Shares | | | 0.10% | | | | 11.22% | | | | 6.16% | |
Class I Shares | | | 0.59% | | | | 11.77% | | | | 6.69% | |
Indexes and Lipper averages are not available for direct investment.
Class A Shares have a maximum 5.75% sales charge (Offering Price). Class A Share purchases of $1 million or more are sold at net asset value without an up-front sales charge but may be subject to a contingent deferred sales charge (CDSC), also known as a back-end sales charge, if redeemed within twelve months of purchase. Class C Shares have a 1% CDSC for redemptions within less than twelve months, which is not reflected in the one-year total return. Class R3 Shares have no sales charge and are only available for purchase by eligible retirement plans. Class I Shares have no sales charge and may be purchased under limited circumstances or by specified classes of investors.
Expense Ratios as of Most Recent Prospectus
| | | | | | | | | | | | | | | | |
| | | Share Class | |
| | | Class A | | | Class C | | | Class R3 | | | Class I | |
Gross Expense Ratios | | | 1.57% | | | | 2.32% | | | | 1.82% | | | | 1.32% | |
Net Expense Ratios | | | 1.47% | | | | 2.22% | | | | 1.72% | | | | 1.22% | |
The Fund’s investment adviser has contractually agreed to waive fees and/or reimburse other Fund expenses through September 30, 2016, so that total annual fund operating expenses (excluding 12b-1 distribution and/or service fees, interest expenses, taxes, acquired fund fees and expenses, fees incurred in acquiring and disposing of portfolio securities and extraordinary expenses) do not exceed 1.22% of the average daily net assets of any class of Fund shares. Fee waivers and/or expense reimbursements will not be terminated prior to that time without the approval of the Fund’s Board of Directors.
Growth of an Assumed $10,000 Investment as of October 31, 2015 – Class A Shares
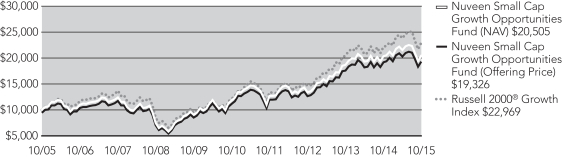
The graphs do not reflect the deduction of taxes that a shareholder may pay on Fund distributions or the redemption of Fund shares.
Holding
Summaries as of October 31, 2015
This data relates to the securities held in each Fund’s portfolio of investments as of the end of this reporting period. It should not be construed as a measure of performance for the Fund itself. Holdings are subject to change.
Nuveen Large Cap Growth Opportunities Fund
Fund Allocation
(% of net assets)
| | | | |
Common Stocks | | | 100.1% | |
Investments Purchased with Collateral from Securities Lending | | | 25.6% | |
Short-Term Investments | | | 0.1% | |
Other Assets Less Liabilities | | | (25.8)% | |
Net Assets | | | 100% | |
Portfolio Composition
(% of net assets)
| | | | |
Internet & Catalog Retail | | | 8.6% | |
Software | | | 8.5% | |
Biotechnology | | | 8.1% | |
Internet Software & Services | | | 8.1% | |
Technology Hardware, Storage & Peripherals | | | 6.7% | |
Specialty Retail | | | 6.3% | |
Hotels, Restaurants & Leisure | | | 6.2% | |
IT Services | | | 6.1% | |
Food & Staples Retailing | | | 5.5% | |
Media | | | 4.2% | |
Health Care Equipment & Supplies | | | 3.5% | |
Pharmaceuticals | | | 3.4% | |
Health Care Providers & Services | | | 3.2% | |
Industrial Conglomerates | | | 2.9% | |
Other | | | 18.8% | |
Investments Purchased with Collateral from Securities Lending | | | 25.6% | |
Short-Term Investments | | | 0.1% | |
Other Assets Less Liabilities | | | (25.8)% | |
Net Assets | | | 100.0% | |
Top Five Common Stock Holdings
(% of net assets)
| | | | |
Apple, Inc | | | 6.7% | |
Alphabet Inc. | | | 5.0% | |
Amazon.com, Inc. | | | 4.2% | |
Walt Disney Company | | | 3.5% | |
Facebook Inc. | | | 3.1% | |
Nuveen Mid Cap Growth Opportunities Fund
Fund Allocation
(% of net assets)
| | | | |
Common Stocks | | | 99.3% | |
Investments Purchased with Collateral from Securities Lending | | | 30.5% | |
Short-Term Investments | | | 0.7% | |
Other Assets Less Liabilities | | | (30.5)% | |
Net Assets | | | 100% | |
Portfolio Composition
(% of net assets)
| | | | |
Specialty Retail | | | 10.2% | |
Software | | | 9.2% | |
Diversified Financial Services | | | 6.5% | |
Health Care Providers & Services | | | 5.7% | |
Health Care Equipment & Supplies | | | 4.5% | |
IT Services | | | 4.1% | |
Chemicals | | | 4.0% | |
Hotels, Restaurants & Leisure | | | 3.8% | |
Household Durables | | | 3.7% | |
Media | | | 3.3% | |
Biotechnology | | | 3.2% | |
Internet & Catalog Retail | | | 2.9% | |
Airlines | | | 2.6% | |
Machinery | | | 2.6% | |
Electrical Equipment | | | 2.6% | |
Electronic Equipment, Instruments & Components | | | 2.4% | |
Multiline Retail | | | 2.3% | |
Commercial Services & Supplies | | | 2.3% | |
Beverages | | | 2.2% | |
Pharmaceuticals | | | 2.1% | |
Other | | | 19.1% | |
Investments Purchased with Collateral from Securities Lending | | | 30.5% | |
Short-Term Investments | | | 0.7% | |
Other Assets Less Liabilities | | | (30.5)% | |
Net Assets | | | 100.0% | |
Top Five Common Stock Holdings
(% of net assets)
| | | | |
Advance Auto Parts, Inc. | | | 2.3% | |
Monster Beverage Corporation | | | 2.2% | |
Electronic Arts Incorporated | | | 2.1% | |
SBA Communications Corporation | | | 2.0% | |
Amphenol Corporation | | | 2.0% | |
Holding Summaries October 31, 2015 (continued)
Nuveen Small Cap Growth Opportunities Fund
Fund Allocation
(% of net assets)
| | | | |
Common Stocks | | | 95.7% | |
Investments Purchased with Collateral from Securities Lending | | | 31.3% | |
Short-Term Investments | | | 3.2% | |
Other Assets Less Liabilities | | | (30.2)% | |
Net Assets | | | 100% | |
Portfolio Composition
(% of net assets)
| | | | |
Health Care Equipment & Supplies | | | 12.2% | |
Software | | | 11.6% | |
Biotechnology | | | 8.2% | |
Semiconductors & Semiconductor Equipment | | | 5.9% | |
IT Services | | | 4.6% | |
Hotels, Restaurants & Leisure | | | 4.6% | |
Internet Software & Services | | | 4.0% | |
Health Care Providers & Services | | | 3.9% | |
Real Estate Investment Trust | | | 3.7% | |
Machinery | | | 3.4% | |
Specialty Retail | | | 3.4% | |
Oil, Gas & Consumable Fuels | | | 2.7% | |
Banks | | | 2.6% | |
Capital Markets | | | 2.3% | |
Professional Services | | | 2.2% | |
Communications Equipment | | | 1.9% | |
Other | | | 18.5% | |
Investments Purchased with Collateral from Securities Lending | | | 31.3% | |
Short-Term Investments | | | 3.2% | |
Other Assets Less Liabilities | | | (30.2)% | |
Net Assets | | | 100.0% | |
Top Five Common Stock Holdings
(% of net assets)
| | | | |
Euronet Worldwide, Inc. | | | 2.0% | |
Plantronics Incorporated | | | 1.9% | |
Brunswick Corporation | | | 1.9% | |
Nxstage Medical, Inc. | | | 1.8% | |
Mellanox Technologies, Limited | | | 1.8% | |
Expense
Examples
As a shareholder of one or more of the Funds, you incur two types of costs: (1) transaction costs, including up-front and back-end sales charges (loads) or redemption fees, where applicable; and (2) ongoing costs, including management fees; distribution and service (12b-1) fees, where applicable; and other Fund expenses. The Examples below are intended to help you understand your ongoing costs (in dollars) of investing in the Funds and to compare these costs with the ongoing costs of investing in other mutual funds.
The Examples below are based on an investment of $1,000 invested at the beginning of the period and held through the period ended October 31, 2015.
The beginning of the period is May 1, 2015.
The information under “Actual Performance,” together with the amount you invested, allows you to estimate actual expenses incurred over the reporting period. Simply divide your account value by $1,000 (for example, an $8,600 account value divided by $1,000 = 8.60) and multiply the result by the cost shown for your share class, in the row entitled “Expenses Incurred During Period” to estimate the expenses incurred on your account during this period.
The information under “Hypothetical Performance,” provides information about hypothetical account values and hypothetical expenses based on the respective Fund’s actual expense ratio and an assumed rate of return of 5% per year before expenses, which is not the Fund’s actual return. The hypothetical account values and expenses may not be used to estimate the actual ending account balance or expense you incurred for the period. You may use this information to compare the ongoing costs of investing in the Fund and other funds. To do so, compare this 5% hypothetical example with the 5% hypothetical examples that appear in the shareholder reports of the other funds.
Please note that the expenses shown in the table are meant to highlight your ongoing costs only and do not reflect any transaction costs. Therefore, the hypothetical information is useful in comparing ongoing costs only, and will not help you determine the relative total costs of owning different funds or share classes. In addition, if these transaction costs were included, your costs would have been higher.
Nuveen Large Cap Growth Opportunities Fund
| | | | | | | | | | | | | | | | | | | | |
| | | Share Class | |
| | | Class A | | | Class C | | | Class R3 | | | Class R6 | | | Class I | |
Actual Performance | | | | | | | | | | | | | | | | | | | | |
Beginning Account Value | | $ | 1,000.00 | | | $ | 1,000.00 | | | $ | 1,000.00 | | | $ | 1,000.00 | | | $ | 1,000.00 | |
Ending Account Value | | $ | 1,046.80 | | | $ | 1,042.70 | | | $ | 1,045.40 | | | $ | 1,048.60 | | | $ | 1,048.20 | |
Expenses Incurred During the Period | | $ | 6.40 | | | $ | 10.25 | | | $ | 7.68 | | | $ | 4.70 | | | $ | 5.11 | |
Hypothetical Performance (5% annualized return before expenses) | | | | | | | | | | | | | | | | | | | | |
Beginning Account Value | | $ | 1,000.00 | | | $ | 1,000.00 | | | $ | 1,000.00 | | | $ | 1,000.00 | | | $ | 1,000.00 | |
Ending Account Value | | $ | 1,018.95 | | | $ | 1,015.17 | | | $ | 1,017.69 | | | $ | 1,020.62 | | | $ | 1,020.21 | |
Expenses Incurred During the Period | | $ | 6.31 | | | $ | 10.11 | | | $ | 7.58 | | | $ | 4.63 | | | $ | 5.04 | |
For each class of the Fund, expenses are equal to the Fund’s annualized net expense ratio of 1.24%, 1.99%, 1.49%, 0.91% and 0.99% for Classes A, C, R3, R6 and I, respectively, multiplied by the average account value over the period, multiplied by 184/365 (to reflect the one-half year period).
Expense Examples (continued)
Nuveen Mid Cap Growth Opportunities Fund
| | | | | | | | | | | | | | | | | | | | |
| | | Share Class | |
| | | Class A | | | Class C | | | Class R3 | | | Class R6 | | | Class I | |
Actual Performance | | | | | | | | | | | | | | | | | | | | |
Beginning Account Value | | $ | 1,000.00 | | | $ | 1,000.00 | | | $ | 1,000.00 | | | $ | 1,000.00 | | | $ | 1,000.00 | |
Ending Account Value | | $ | 963.50 | | | $ | 959.90 | | | $ | 962.20 | | | $ | 1,019.90 | | | $ | 964.80 | |
Expenses Incurred During the Period | | $ | 6.43 | | | $ | 10.13 | | | $ | 7.67 | | | $ | 4.63 | | | $ | 5.20 | |
Hypothetical Performance (5% annualized return before expenses) | | | | | | | | | | | | | | | | | | | | |
Beginning Account Value | | $ | 1,000.00 | | | $ | 1,000.00 | | | $ | 1,000.00 | | | $ | 1,000.00 | | | $ | 1,000.00 | |
Ending Account Value | | $ | 1,018.65 | | | $ | 1,014.87 | | | $ | 1,017.39 | | | $ | 1,020.62 | | | $ | 1,019.91 | |
Expenses Incurred During the Period | | $ | 6.61 | | | $ | 10.41 | | | $ | 7.88 | | | $ | 4.63 | | | $ | 5.35 | |
For each class of the Fund, expenses are equal to the Fund’s annualized net expense ratio of 1.30%, 2.05%, 1.55%, 0.91% and 1.05% for Classes A, C, R3, R6 and I, respectively, multiplied by the average account value over the period, multiplied by 184/365 (to reflect the one-half year period).
Nuveen Small Cap Growth Opportunities Fund
| | | | | | | | | | | | | | | | |
| | | Share Class | |
| | | Class A | | | Class C | | | Class R3 | | | Class I | |
Actual Performance | | | | | | | | | | | | | | | | |
Beginning Account Value | | $ | 1,000.00 | | | $ | 1,000.00 | | | $ | 1,000.00 | | | $ | 1,000.00 | |
Ending Account Value | | $ | 951.50 | | | $ | 948.10 | | | $ | 953.00 | | | $ | 950.40 | |
Expenses Incurred During the Period | | $ | 7.23 | | | $ | 10.90 | | | $ | 8.46 | | | $ | 6.01 | |
Hypothetical Performance (5% annualized return before expenses) | | | | | | | | | | | | | | | | |
Beginning Account Value | | $ | 1,000.00 | | | $ | 1,000.00 | | | $ | 1,000.00 | | | $ | 1,000.00 | |
Ending Account Value | | $ | 1,017.80 | | | $ | 1,013.84 | | | $ | 1,016.53 | | | $ | 1,019.06 | |
Expenses Incurred During the Period | | $ | 7.48 | | | $ | 11.27 | | | $ | 8.74 | | | $ | 6.21 | |
For each class of the Fund, expenses are equal to the Fund’s annualized net expense ratio of 1.47%, 2.22%, 1.72% and 1.22% for Classes A, C, R3 and I, respectively, multiplied by the average account value over the period, multiplied by 184/365 (to reflect the one-half year period).
Report of
Independent Registered Public Accounting Firm
To the Board of Directors and Shareholders of
Nuveen Investment Funds, Inc.:
In our opinion, the accompanying statements of assets and liabilities, including the portfolios of investments, and the related statements of operations and of changes in net assets and the financial highlights present fairly, in all material respects, the financial position of Nuveen Large Cap Growth Opportunities Fund, Nuveen Mid Cap Growth Opportunities Fund and Nuveen Small Cap Growth Opportunities Fund (each a series of the Nuveen Investment Funds, Inc., hereinafter referred to as the “Funds”) at October 31, 2015, the results of each of their operations for the year then ended and the changes in each of their net assets for each of the two years in the period then ended and the financial highlights for each of the four years in the period then ended, in conformity with accounting principles generally accepted in the United States of America. These financial statements and financial highlights (hereafter referred to as “financial statements”) are the responsibility of the Funds’ management. Our responsibility is to express an opinion on these financial statements based on our audits. We conducted our audits of these financial statements in accordance with the standards of the Public Company Accounting Oversight Board (United States). Those standards require that we plan and perform the audit to obtain reasonable assurance about whether the financial statements are free of material misstatement. An audit includes examining, on a test basis, evidence supporting the amounts and disclosures in the financial statements, assessing the accounting principles used and significant estimates made by management, and evaluating the overall financial statement presentation. We believe that our audits, which included confirmation of securities at October 31, 2015 by correspondence with the custodian and brokers, provide a reasonable basis for our opinion. The financial statements of the Funds for the year ended October 31, 2011 were audited by other independent auditors whose report dated December 28, 2011 expressed an unqualified opinion on those statements.
PricewaterhouseCoopers LLP
Chicago, IL
December 28, 2015
Nuveen Large Cap Growth Opportunities Fund
| | |
| Portfolio of Investments | | October 31, 2015 |
| | | | | | | | |
| Shares | | | Description (1) | | Value | |
| | |
| | | | LONG-TERM INVESTMENTS – 100.1% | | | | |
| | |
| | | | COMMON STOCKS – 100.1% | | | | |
| | |
| | | | Aerospace & Defense – 2.6% | | | |
| | |
| | 45,228 | | | Boeing Company | | $ | 6,696,910 | |
| | |
| | 23,837 | | | Lockheed Martin Corporation | | | 5,240,088 | |
| | | | Total Aerospace & Defense | | | 11,936,998 | |
| | |
| | | | Airlines – 2.6% | | | |
| | |
| | 175,148 | | | Delta Air Lines, Inc. | | | 8,904,524 | |
| | |
| | 66,984 | | | Southwest Airlines Co. | | | 3,100,689 | |
| | | | Total Airlines | | | 12,005,213 | |
| | |
| | | | Biotechnology – 8.1% | | | |
| | |
| | 118,462 | | | AbbVie Inc. | | | 7,054,412 | |
| | |
| | 31,667 | | | Alexion Pharmaceuticals Inc., (2), (3) | | | 5,573,392 | |
| | |
| | 20,518 | | | Amgen Inc. | | | 3,245,537 | |
| | |
| | 11,753 | | | Biogen Inc., (3) | | | 3,414,364 | |
| | |
| | 14,812 | | | Bluebird Bio Inc., (2), (3) | | | 1,142,450 | |
| | |
| | 29,112 | | | Celgene Corporation, (2), (3) | | | 3,572,334 | |
| | |
| | 47,710 | | | Gilead Sciences, Inc. | | | 5,158,882 | |
| | |
| | 30,696 | | | Incyte Pharmaceuticals Inc., (2), (3) | | | 3,607,701 | |
| | |
| | 9,020 | | | Regeneron Pharmaceuticals, Inc., (2), (3) | | | 5,027,658 | |
| | | | Total Biotechnology | | | 37,796,730 | |
| | |
| | | | Chemicals – 2.4% | | | |
| | |
| | 52,257 | | | Ecolab Inc., (2) | | | 6,289,130 | |
| | |
| | 18,282 | | | Sherwin-Williams Company | | | 4,878,186 | |
| | | | Total Chemicals | | | 11,167,316 | |
| | |
| | | | Communications Equipment – 0.6% | | | |
| | |
| | 17,214 | | | Palo Alto Networks, Incorporated, (3) | | | 2,771,454 | |
| | |
| | | | Diversified Financial Services – 1.1% | | | |
| | |
| | 51,458 | | | Moody’s Corporation, (2) | | | 4,948,201 | |
| | |
| | | | Food & Staples Retailing – 5.5% | | | |
| | |
| | 53,764 | | | Costco Wholesale Corporation | | | 8,501,164 | |
| | |
| | 116,840 | | | CVS Health Corporation | | | 11,541,455 | |
| | |
| | 153,743 | | | Kroger Co. | | | 5,811,485 | |
| | | | Total Food & Staples Retailing | | | 25,854,104 | |
| | |
| | | | Health Care Equipment & Supplies – 3.5% | | | |
| | |
| | 11,572 | | | Abiomed, Inc., (3) | | | 852,394 | |
| | |
| | 354,265 | | | Boston Scientific Corporation, (2), (3) | | | 6,475,964 | |
| | | | | | | | |
| Shares | | | Description (1) | | Value | |
| | |
| | | | Health Care Equipment & Supplies (continued) | | | |
| | |
| | 23,803 | | | DexCom, Inc., (3) | | $ | 1,983,266 | |
| | |
| | 92,754 | | | Medtronic, PLC | | | 6,856,376 | |
| | | | Total Health Care Equipment & Supplies | | | 16,168,000 | |
| | |
| | | | Health Care Providers & Services – 3.2% | | | |
| | |
| | 80,921 | | | Centene Corporation, (2), (3) | | | 4,813,181 | |
| | |
| | 39,063 | | | CIGNA Corporation | | | 5,236,005 | |
| | |
| | 28,266 | | | McKesson HBOC Inc. | | | 5,053,961 | |
| | | | Total Health Care Providers & Services | | | 15,103,147 | |
| | |
| | | | Hotels, Restaurants & Leisure – 6.2% | | | |
| | |
| | 7,891 | | | Chipotle Mexican Grill, (2), (3) | | | 5,052,055 | |
| | |
| | 73,096 | | | McDonald’s Corporation | | | 8,205,026 | |
| | |
| | 61,639 | | | Royal Caribbean Cruises Limited, (2) | | | 6,062,196 | |
| | |
| | 152,722 | | | Starbucks Corporation, (2) | | | 9,555,816 | |
| | | | Total Hotels, Restaurants & Leisure | | | 28,875,093 | |
| | |
| | | | Household Durables – 2.0% | | | |
| | |
| | 100,672 | | | Jarden Corporation | | | 4,510,106 | |
| | |
| | 25,598 | | | Mohawk Industries Inc., (3) | | | 5,004,409 | |
| | | | Total Household Durables | | | 9,514,515 | |
| | |
| | | | Industrial Conglomerates – 2.9% | | | |
| | |
| | 67,499 | | | 3M Co., (2) | | | 10,611,518 | |
| | |
| | 16,029 | | | Roper Technologies, Inc. | | | 2,987,004 | |
| | | | Total Industrial Conglomerates | | | 13,598,522 | |
| | |
| | | | Internet & Catalog Retail – 8.6% | | | |
| | |
| | 31,230 | | | Amazon.com, Inc., (3) | | | 19,546,857 | |
| | |
| | 73,775 | | | NetFlix.com Inc., (3) | | | 7,995,735 | |
| | |
| | 8,564 | | | priceline.com Incorporated, (3) | | | 12,454,111 | |
| | | | Total Internet & Catalog Retail | | | 39,996,703 | |
| | |
| | | | Internet Software & Services – 8.1% | | | |
| | |
| | 31,335 | | | Alphabet Inc., Class A, (3) | | | 23,106,116 | |
| | |
| | 143,649 | | | Facebook Inc., Class A Shares, (3) | | | 14,647,889 | |
| | | | Total Internet Software & Services | | | 37,754,005 | |
| | |
| | | | IT Services – 6.1% | | | |
| | |
| | 143,423 | | | MasterCard, Inc. | | | 14,197,443 | |
| | |
| | 181,505 | | | Visa Inc., (2) | | | 14,081,158 | |
| | | | Total IT Services | | | 28,278,601 | |
| | |
| | | | Media – 4.2% | | | |
| | |
| | 122,573 | | | Live Nation Inc., (3) | | | 3,343,791 | |
| | |
| | 142,688 | | | Walt Disney Company, (2) | | | 16,229,333 | |
| | | | Total Media | | | 19,573,124 | |
Nuveen Large Cap Growth Opportunities Fund (continued)
| | |
| Portfolio of Investments | | October 31, 2015 |
| | | | | | | | |
| Shares | | | Description (1) | | Value | |
| | |
| | | | Multiline Retail – 2.1% | | | |
| | |
| | 75,644 | | | Dollar Tree Stores Inc., (2), (3) | | $ | 4,953,926 | |
| | |
| | 77,894 | | | Nordstrom, Inc. | | | 5,079,468 | |
| | | | Total Multiline Retail | | | 10,033,394 | |
| | |
| | | | Oil, Gas & Consumable Fuels – 0.4% | | | |
| | |
| | 31,028 | | | Anadarko Petroleum Corporation | | | 2,075,153 | |
| | |
| | | | Personal Products – 0.8% | | | |
| | |
| | 47,887 | | | Estee Lauder Companies Inc., Class A, (2) | | | 3,852,988 | |
| | |
| | | | Pharmaceuticals – 3.4% | | | |
| | |
| | 30,651 | | | Allergan PLC, (3) | | | 9,454,914 | |
| | |
| | 37,419 | | | Bristol-Myers Squibb Company | | | 2,467,783 | |
| | |
| | 67,501 | | | Teva Pharmaceutical Industries Limited, Sponsored ADR | | | 3,995,384 | |
| | | | Total Pharmaceuticals | | | 15,918,081 | |
| | |
| | | | Semiconductors & Semiconductor Equipment – 0.7% | | | |
| | |
| | 182,921 | | | Applied Materials, Inc. | | | 3,067,585 | |
| | |
| | | | Software – 8.5% | | | |
| | |
| | 294,179 | | | Activision Blizzard Inc., (2) | | | 10,225,662 | |
| | |
| | 77,096 | | | Adobe Systems Incorporated, (2), (3) | | | 6,835,331 | |
| | |
| | 115,455 | | | Electronic Arts Inc., (3) | | | 8,320,842 | |
| | |
| | 29,123 | | | Mobileye NV, (2), (3) | | | 1,325,679 | |
| | |
| | 53,203 | | | Red Hat, Inc., (2), (3) | | | 4,208,889 | |
| | |
| | 72,741 | | | Salesforce.com, Inc., (3) | | | 5,652,703 | |
| | |
| | 38,211 | | | ServiceNow Inc., (2), (3) | | | 3,119,928 | |
| | | | Total Software | | | 39,689,034 | |
| | |
| | | | Specialty Retail – 6.3% | | | |
| | |
| | 60,312 | | | CarMax, Inc., (2), (3) | | | 3,559,011 | |
| | |
| | 102,805 | | | Home Depot, Inc., (2) | | | 12,710,810 | |
| | |
| | 25,587 | | | O’Reilly Automotive Inc., (2), (3) | | | 7,068,665 | |
| | |
| | 34,289 | | | Ulta Salon, Cosmetics & Fragrance, Inc., (3) | | | 5,964,914 | |
| | | | Total Specialty Retail | | | 29,303,400 | |
| | |
| | | | Technology Hardware, Storage & Peripherals – 6.7% | | | |
| | |
| | 263,440 | | | Apple, Inc. | | | 31,481,077 | |
| | |
| | | | Textiles, Apparel & Luxury Goods – 2.4% | | | |
| | |
| | 83,624 | | | Nike, Inc., Class B, (2) | | | 10,957,253 | |
| | |
| | | | Wireless Telecommunication Services – 1.1% | | | |
| | |
| | 43,885 | | | SBA Communications Corporation, (3) | | | 5,223,193 | |
| | | | Total Long-Term Investments (cost $320,704,554) | | | 466,942,884 | |
| | | | | | | | |
| Shares | | | Description (1) | | Value | |
| | |
| | | | INVESTMENTS PURCHASED WITH COLLATERAL FROM SECURITIES LENDING– 25.6% | | | | |
| | |
| | | | Money Market Funds – 25.6% | | | |
| | |
| | 119,637,888 | | | Mount Vernon Securities Lending Prime Portfolio, 0.256%, (4), (5) | | $ | 119,637,888 | |
| | | | Total Investments Purchased with Collateral from Securities Lending (cost $119,637,888) | | | 119,637,888 | |
| | |
| Shares | | | Description (1) | | Value | |
| | |
| | | | SHORT-TERM INVESTMENTS – 0.1% | | | | |
| | |
| | | | Money Mark Funds – 0.1% | | | |
| | |
| | 687,481 | | | First American Treasury Obligations Fund, Class Z, 0.000%, (4) | | $ | 687,481 | |
| | | | Total Short-Term Investments (cost $687,481) | | | 687,481 | |
| | | | Total Investments (cost $441,029,923) – 125.8% | | | 587,268,253 | |
| | | | Other Assets Less Liabilities – (25.8)% | | | (120,552,125 | ) |
| | | | Net Assets – 100% | | $ | 466,716,128 | |
For Fund portfolio compliance purposes, the Fund’s industry classifications refer to any one or more of the industry sub-classifications used by one or more widely recognized market indexes or ratings group indexes, and/or as defined by Fund management. This definition may not apply for purposes of this report which may combine industry sub-classifications into sectors for reporting ease.
| (1) | All percentages shown in the Portfolio of Investments are based on net assets. |
| (2) | Investment, or a portion of investment, is out on loan for securities lending. The total value of the securities out on loan as of the end of the reporting period was $115,998,419. |
| (3) | Non-income producing; issuer has not declared a dividend within the past twelve months. |
| (4) | The rate shown is the annualized seven-day effective yield as of the end of the reporting period. |
| (5) | The Fund may loan securities representing up to one third of the fair value of its total assets (which includes collateral for securities on loan) to broker dealers, banks, and other institutions. The Fund maintains collateral equal to at least 100% of the fair value of the securities loaned. The cash collateral received by the Fund is invested in this money market fund. See Notes to Financial Statements, Note 3 – Portfolio Securities and Investments in Derivatives, Securities Lending for more information. |
| ADR | American Depositary Receipt. |
See accompanying notes to financial statements.
Nuveen Mid Cap Growth Opportunities Fund
| | |
| Portfolio of Investments | | October 31, 2015 |
| | | | | | | | |
| Shares | | | Description (1) | | Value | |
| | |
| | | | LONG-TERM INVESTMENTS – 99.3% | | | | |
| | |
| | | | COMMON STOCKS – 99.3% | | | | |
| | |
| | | | Aerospace & Defense – 1.2% | | | |
| | |
| | 66,484 | | | TransDigm Group Inc., (2) | | $ | 14,616,507 | |
| | |
| | | | Airlines – 2.6% | | | |
| | |
| | 213,748 | | | Alaska Air Group, Inc. | | | 16,298,285 | |
| | |
| | 304,077 | | | Delta Air Lines, Inc., (3) | | | 15,459,275 | |
| | | | Total Airlines | | | 31,757,560 | |
| | |
| | | | Auto Components – 1.8% | | | |
| | |
| | 265,390 | | | Delphi Automotive PLC | | | 22,077,794 | |
| | |
| | | | Banks – 1.2% | | | |
| | |
| | 390,338 | | | Western Alliance Bancorporation, (2) | | | 13,954,584 | |
| | |
| | | | Beverages – 2.2% | | | |
| | |
| | 192,406 | | | Monster Beverage Corporation, (2), (3) | | | 26,228,786 | |
| | |
| | | | Biotechnology – 3.2% | | | |
| | |
| | 150,727 | | | Alkermes PLC | | | 10,840,286 | |
| | |
| | 74,118 | | | Alnylam Pharmaceuticals, Inc., (2), (3) | | | 6,370,442 | |
| | |
| | 88,426 | | | Bluebird Bio Inc., (2), (3) | | | 6,820,297 | |
| | |
| | 121,553 | | | Incyte Pharmaceuticals Inc., (2), (3) | | | 14,286,124 | |
| | | | Total Biotechnology | | | 38,317,149 | |
| | |
| | | | Building Products – 1.4% | | | |
| | |
| | 601,586 | | | Masco Corporation, (3) | | | 17,445,994 | |
| | |
| | | | Chemicals – 4.0% | | | |
| | |
| | 105,942 | | | PPG Industries, Inc. | | | 11,045,513 | |
| | |
| | 85,117 | | | Sherwin-Williams Company | | | 22,711,769 | |
| | |
| | 144,966 | | | WR Grace & Company, (2) | | | 14,540,090 | |
| | | | Total Chemicals | | | 48,297,372 | |
| | |
| | | | Commercial Services & Supplies – 2.3% | | | |
| | |
| | 399,655 | | | KAR Auction Services Inc. | | | 15,346,752 | |
| | |
| | 457,327 | | | Ritchie Bros. Auctioneers Incorporated, (3) | | | 11,876,782 | |
| | | | Total Commercial Services & Supplies | | | 27,223,534 | |
| | |
| | | | Communications Equipment – 1.2% | | | |
| | |
| | 88,260 | | | Palo Alto Networks, Incorporated, (2), (3) | | | 14,209,860 | |
| | |
| | | | Diversified Consumer Services – 0.9% | | | |
| | |
| | 805,682 | | | LifeLock, Incorporated, (2), (3) | | | 11,287,605 | |
| | | | | | | | |
| Shares | | | Description (1) | | Value | |
| | |
| | | | Diversified Financial Services – 6.5% | | | |
| | |
| | 283,177 | | | CBOE Holdings Inc. | | $ | 18,984,186 | |
| | |
| | 74,975 | | | Intercontinental Exchange Group, Inc. | | | 18,923,690 | |
| | |
| | 245,551 | | | McGraw-Hill Companies, Inc. | | | 22,747,845 | |
| | |
| | 188,987 | | | Moody's Corporation, (3) | | | 18,172,990 | |
| | | | Total Diversified Financial Services | | | 78,828,711 | |
| | |
| | | | Electrical Equipment – 2.6% | | | |
| | |
| | 85,635 | | | Acuity Brands Inc., (3) | | | 18,719,811 | |
| | |
| | 224,604 | | | Ametek Inc., (3) | | | 12,312,791 | |
| | | | Total Electrical Equipment | | | 31,032,602 | |
| | |
| | | | Electronic Equipment, Instruments & Components – 2.4% | | | |
| | |
| | 435,684 | | | Amphenol Corporation, Class A, (3) | | | 23,622,786 | |
| | |
| | 128,562 | | | Fitbit, Inc., Class A Shares, (2), (3) | | | 5,211,903 | |
| | | | Total Electronic Equipment, Instruments & Components | | | 28,834,689 | |
| | |
| | | | Energy Equipment & Services – 0.4% | | | |
| | |
| | 87,829 | | | Cooper Cameron Corporation, (2) | | | 5,973,250 | |
| | |
| | | | Food Products – 0.9% | | | |
| | |
| | 239,977 | | | Tyson Foods, Inc., Class A, (3) | | | 10,645,380 | |
| | |
| | | | Health Care Equipment & Supplies – 4.5% | | | |
| | |
| | 136,032 | | | Abiomed, Inc., (2) | | | 10,020,117 | |
| | |
| | 814,522 | | | Boston Scientific Corporation, (2) | | | 14,889,462 | |
| | |
| | 167,194 | | | DexCom, Inc., (2), (3) | | | 13,930,604 | |
| | |
| | 282,324 | | | Hill Rom Holdings Inc., (3) | | | 14,875,652 | |
| | | | Total Health Care Equipment & Supplies | | | 53,715,835 | |
| | |
| | | | Health Care Providers & Services – 5.7% | | | |
| | |
| | 153,297 | | | AmerisourceBergen Corporation | | | 14,794,693 | |
| | |
| | 352,180 | | | Centene Corporation, (2), (3) | | | 20,947,666 | |
| | |
| | 92,781 | | | CIGNA Corporation | | | 12,436,365 | |
| | |
| | 56,139 | | | Henry Schein Inc., (2), (3) | | | 8,516,848 | |
| | |
| | 97,237 | | | Universal Health Services, Inc., Class B | | | 11,871,665 | |
| | | | Total Health Care Providers & Services | | | 68,567,237 | |
| | |
| | | | Hotels, Restaurants & Leisure – 3.8% | | | |
| | |
| | 32,459 | | | Chipotle Mexican Grill, (2), (3) | | | 20,781,226 | |
| | |
| | 162,244 | | | Jack in the Box Inc., Term Loan | | | 12,092,045 | |
| | |
| | 196,056 | | | Norwegian Cruise Line Holdings Limited, (2) | | | 12,473,083 | |
| | | | Total Hotels, Restaurants & Leisure | | | 45,346,354 | |
| | |
| | | | Household Durables – 3.7% | | | |
| | |
| | 405,363 | | | D.R. Horton, Inc., (3) | | | 11,933,887 | |
| | |
| | 383,506 | | | Jarden Corporation | | | 17,181,069 | |
Nuveen Mid Cap Growth Opportunities Fund (continued)
| | |
| Portfolio of Investments | | October 31, 2015 |
| | | | | | | | |
| Shares | | | Description (1) | | Value | |
| | |
| | | | Household Durables (continued) | | | |
| | |
| | 80,765 | | | Mohawk Industries Inc., (2) | | $ | 15,789,558 | |
| | | | Total Household Durables | | | 44,904,514 | |
| | |
| | | | Industrial Conglomerates – 1.4% | | | |
| | |
| | 87,740 | | | Roper Technologies, Inc., (3) | | | 16,350,349 | |
| | |
| | | | Internet & Catalog Retail – 2.9% | | | |
| | |
| | 161,590 | | | Expedia, Inc. | | | 22,024,717 | |
| | |
| | 9,190 | | | priceline.com Incorporated, (2), (3) | | | 13,364,466 | |
| | | | Total Internet & Catalog Retail | | | 35,389,183 | |
| | |
| | | | IT Services – 4.1% | | | |
| | |
| | 318,596 | | | Fidelity National Information Services | | | 23,232,020 | |
| | |
| | 197,932 | | | Gartner Inc., (2) | | | 17,946,494 | |
| | |
| | 317,979 | | | Genpact Limited, (2) | | | 7,879,520 | |
| | | | Total IT Services | | | 49,058,034 | |
| | |
| | | | Life Sciences Tools & Services – 1.8% | | | |
| | |
| | 257,908 | | | Accelerate Diagnostics Inc., (2), (3) | | | 4,325,117 | |
| | |
| | 263,366 | | | Quintiles Transnational Corporation, (2) | | | 16,763,246 | |
| | | | Total Life Sciences Tools & Services | | | 21,088,363 | |
| | |
| | | | Machinery – 2.6% | | | |
| | |
| | 118,745 | | | Stanley Black & Decker Inc. | | | 12,584,595 | |
| | |
| | 224,216 | | | Wabtec Corporation, (3) | | | 18,580,780 | |
| | | | Total Machinery | | | 31,165,375 | |
| | |
| | | | Media – 3.3% | | | |
| | |
| | 197,156 | | | Liberty Broadband Corporation, Class A Shares, (2) | | | 10,756,831 | |
| | |
| | 357,290 | | | Lions Gate Entertainment Corporation, Equity, (3) | | | 13,923,591 | |
| | |
| | 552,767 | | | Live Nation Inc., (2) | | | 15,079,484 | |
| | | | Total Media | | | 39,759,906 | |
| | |
| | | | Multiline Retail – 2.3% | | | |
| | |
| | 218,629 | | | Dollar Tree Stores Inc., (2), (3) | | | 14,318,013 | |
| | |
| | 202,877 | | | Nordstrom, Inc. | | | 13,229,609 | |
| | | | Total Multiline Retail | | | 27,547,622 | |
| | |
| | | | Oil, Gas & Consumable Fuels – 0.3% | | | |
| | |
| | 200,620 | | | Cabot Oil & Gas Corporation, (3) | | | 4,355,460 | |
| | |
| | | | Pharmaceuticals – 2.1% | | | |
| | |
| | 85,606 | | | Jazz Pharmaceuticals, Inc., (2) | | | 11,751,992 | |
| | |
| | 103,634 | | | Mallinckrodt PLC, (2) | | | 6,805,645 | |
| | |
| | 199,433 | | | Medicines Company, (2), (3) | | | 6,828,586 | |
| | | | Total Pharmaceuticals | | | 25,386,223 | |
| | | | | | | | |
| Shares | | | Description (1) | | Value | |
| | |
| | | | Real Estate Investment Trust – 1.7% | | | |
| | |
| | 236,331 | | | Crown Castle International Corporation | | $ | 20,196,847 | |
| | |
| | | | Semiconductors & Semiconductor Equipment – 1.1% | | | |
| | |
| | 53,508 | | | NXP Semiconductors NV, (2), (3) | | | 4,192,352 | |
| | |
| | 118,948 | | | Skyworks Solutions Inc., (3) | | | 9,187,544 | |
| | | | Total Semiconductors & Semiconductor Equipment | | | 13,379,896 | |
| | |
| | | | Software – 9.2% | | | |
| | |
| | 594,624 | | | Activision Blizzard Inc., (3) | | | 20,669,130 | |
| | |
| | 135,754 | | | Cyberark Software Limited, (2), (3) | | | 6,738,829 | |
| | |
| | 348,030 | | | Electronic Arts Inc., (2), (3) | | | 25,082,522 | |
| | |
| | 140,971 | | | Intuit, Inc., (3) | | | 13,734,805 | |
| | |
| | 137,885 | | | Proofpoint, Incorporated, (2), (3) | | | 9,712,619 | |
| | |
| | 241,366 | | | Red Hat, Inc., (2), (3) | | | 19,094,464 | |
| | |
| | 187,389 | | | ServiceNow Inc., (2), (3) | | | 15,300,312 | |
| | | | Total Software | | | 110,332,681 | |
| | |
| | | | Specialty Retail – 10.2% | | | |
| | |
| | 141,627 | | | Advance Auto Parts, Inc., (3) | | | 28,103,046 | |
| | |
| | 311,949 | | | CarMax, Inc., (2), (3) | | | 18,408,110 | |
| | |
| | 204,482 | | | Foot Locker, Inc., (3) | | | 13,853,656 | |
| | |
| | 350,619 | | | Michaels Cos Inc., (2) | | | 8,197,472 | |
| | |
| | 65,112 | | | Restoration Hardware Holdings Incorporated, (2), (3) | | | 6,712,396 | |
| | |
| | 371,531 | | | Ross Stores, Inc., (3) | | | 18,792,038 | |
| | |
| | 83,974 | | | Signet Jewelers Limited | | | 12,675,036 | |
| | |
| | 94,366 | | | Ulta Salon, Cosmetics & Fragrance, Inc., (2) | | | 16,415,909 | |
| | | | Total Specialty Retail | | | 123,157,663 | |
| | |
| | | | Thrifts & Mortgage Finance – 1.8% | | | |
| | |
| | 132,657 | | | BofI Holdings, Inc., (2), (3) | | | 10,613,887 | |
| | |
| | 609,875 | | | Everbank Financial Corporation, (3) | | | 10,526,443 | |
| | | | Total Thrifts & Mortgage Finance | | | 21,140,330 | |
| | |
| | | | Wireless Telecommunication Services – 2.0% | | | |
| | |
| | 200,065 | | | SBA Communications Corporation, (2) | | | 23,811,736 | |
| | | | Total Long-Term Investments (cost $1,008,166,749) | | | 1,195,384,985 | |
| | |
| Shares | | | Description (1) | | Value | |
| | |
| | | | INVESTMENTS PURCHASE WITH COLLATERAL FROM SECURITIES LENDING – 30.5% | | | | |
| | |
| | | | Money Market Funds – 30.5% | | | |
| | |
| | 366,889,649 | | | Mount Vernon Securities Lending Prime Portfolio, 0.256%, (4), (5) | | $ | 366,889,649 | |
| | | | Total Investments Purchased with Collateral from Securities Lending (cost $366,889,649) | | | 366,889,649 | |
Nuveen Mid Cap Growth Opportunities Fund (continued)
| | |
| Portfolio of Investments | | October 31, 2015 |
| | | | | | | | |
| | |
| Shares | | | Description (1) | | Value | |
| | |
| | | | SHORT-TERM INVESTMENTS – 0.7% | | | | |
| | |
| | | | Money Market Funds – 0.7% | | | |
| | |
| | 8,891,795 | | | First American Treasury Obligations, Class Z, 0.000%, (4) | | $ | 8,891,795 | |
| | | | Total Short-Term Investments (cost $8,891,795) | | | 8,891,795 | |
| | | | Total Investments (cost $1,383,948,193) – 130.5% | | | 1,571,166,429 | |
| | | | Other Assets Less Liabilities – (30.5)% | | | (366,895,176 | ) |
| | | | Net Assets – 100% | | $ | 1,204,271,253 | |
For Fund portfolio compliance purposes, the Fund’s industry classifications refer to any one or more of the industry sub-classifications used by one or more widely recognized market indexes or ratings group indexes, and/or as defined by Fund management. This definition may not apply for purposes of this report which may combine industry sub-classifications into sectors for reporting ease.
| (1) | All percentages shown in the Portfolio of Investments are based on net assets. |
| (2) | Non-income producing; issuer has not declared a dividend within the past twelve months. |
| (3) | Investment, or a portion of investment, is out on loan for securities lending. The total value of the securities out on loan as of the end of the reporting period was $355,024,388. |
| (4) | The rate shown is the annualized seven-day effective yield as of the end of the reporting period. |
| (5) | The Fund may loan securities representing up to one third of the fair value of its total assets (which includes collateral for securities on loan) to broker dealers, banks, and other institutions. The Fund maintains collateral equal to at least 100% of the fair value of the securities loaned. The cash collateral received by the Fund is invested in this money market fund. See Notes to Financial Statements, Note 3 – Portfolio Securities and Investments in Derivatives, Securities Lending for more information. |
See accompanying notes to financial statements.
Nuveen Small Cap Growth Opportunities Fund
| | |
| Portfolio of Investments | | October 31, 2015 |
| | | | | | | | |
| Shares | | | Description (1) | | Value | |
| | |
| | | | LONG-TERM INVESTMENTS – 95.7% | | | | |
| | |
| | | | COMMON STOCKS – 95.7% | | | | |
| | |
| | | | Air Freight & Logistics – 1.1% | | | |
| | |
| | 27,389 | | | Hub Group, Inc., (2) | | $ | 1,095,012 | |
| | |
| | | | Auto Components – 1.7% | | | |
| | |
| | 30,409 | | | Tenneco Inc., (2) | | | 1,720,845 | |
| | |
| | | | Automobiles – 1.2% | | | |
| | |
| | 22,368 | | | Thor Industries, Inc. | | | 1,209,661 | |
| | |
| | | | Banks – 2.6% | | | |
| | |
| | 41,665 | | | Cathay General Bancorp., (3) | | | 1,304,115 | |
| | |
| | 35,754 | | | Western Alliance Bancorporation, (2) | | | 1,278,206 | |
| | | | Total Banks | | | 2,582,321 | |
| | |
| | | | Biotechnology – 8.2% | | | |
| | |
| | 13,789 | | | Acadia Pharmaceuticals, Inc., (2), (3) | | | 480,133 | |
| | |
| | 8,032 | | | Anacor Pharmaceuticals Inc., (2) | | | 902,877 | |
| | |
| | 31,684 | | | Cepheid, Inc., (2), (3) | | | 1,058,246 | |
| | |
| | 24,217 | | | Dyax Corporation, (2) | | | 666,694 | |
| | |
| | 21,108 | | | Emergent BioSolutions, Inc., (2) | | | 678,622 | |
| | |
| | 23,219 | | | Insmed Incorporated, (2) | | | 460,665 | |
| | |
| | 77,490 | | | Lion Biotechnologies Inc., (2) | | | 501,360 | |
| | |
| | 15,232 | | | Neurocrine Biosciences Inc., (2), (3) | | | 747,739 | |
| | |
| | 27,133 | | | Oncomed Pharmaceuticals Inc., (2), (3) | | | 542,931 | |
| | |
| | 4,645 | | | Radius Health Inc., (2), (3) | | | 298,348 | |
| | |
| | 9,952 | | | Sage Therapeutics, Inc., (2), (3) | | | 499,889 | |
| | |
| | 11,053 | | | Tesaro Inc., (2), (3) | | | 502,580 | |
| | |
| | 8,304 | | | Ultragenyx Pharmaceutical Inc., (2), (3) | | | 825,002 | |
| | | | Total Biotechnology | | | 8,165,086 | |
| | |
| | | | Building Products – 1.1% | | | |
| | |
| | 61,285 | | | Continental Building Products Inc., (2) | | | 1,076,777 | |
| | |
| | | | Capital Markets – 2.3% | | | |
| | |
| | 24,926 | | | Evercore Partners Inc. | | | 1,346,004 | |
| | |
| | 22,433 | | | Stifel Financial Corporation, (2) | | | 996,698 | |
| | | | Total Capital Markets | | | 2,342,702 | |
| | |
| | | | Chemicals – 1.3% | | | |
| | |
| | 37,852 | | | PolyOne Corporation, (3) | | | 1,265,771 | |
| | |
| | | | Commercial Services & Supplies – 1.2% | | | |
| | |
| | 27,654 | | | HNI Corporation, (3) | | | 1,187,463 | |
Nuveen Small Cap Growth Opportunities Fund (continued)
| | |
| Portfolio of Investments | | October 31, 2015 |
| | | | | | | | |
| Shares | | | Description (1) | | Value | |
| | |
| | | | Communications Equipment – 1.9% | | | |
| | |
| | 35,993 | | | Plantronics Inc., (3) | | $ | 1,929,945 | |
| | |
| | | | Construction & Engineering – 1.3% | | | |
| | |
| | 80,224 | | | MasTec Inc., (2) | | | 1,345,356 | |
| | |
| | | | Distributors – 1.7% | | | |
| | |
| | 21,027 | | | Pool Corporation, (3) | | | 1,714,542 | |
| | |
| | | | Electrical Equipment – 1.4% | | | |
| | |
| | 44,367 | | | Generac Holdings Inc., (2), (3) | | | 1,400,223 | |
| | |
| | | | Electronic Equipment, Instruments & Components – 1.2% | | | |
| | |
| | 13,538 | | | OSI Systems Inc., (2) | | | 1,166,705 | |
| | |
| | | | Food & Staples Retailing – 1.1% | | | |
| | |
| | 45,318 | | | Natural Grocers by Vitamin Cottage Incorporated, (2), (3) | | | 1,085,366 | |
| | |
| | | | Health Care Equipment & Supplies – 12.2% | | | |
| | |
| | 21,078 | | | Abiomed, Inc., (2), (3) | | | 1,552,605 | |
| | |
| | 51,782 | | | AtriCure, Inc., (2) | | | 959,262 | |
| | |
| | 69,502 | | | ConforMIS Inc., (2), (3) | | | 1,360,154 | |
| | |
| | 15,097 | | | DexCom, Inc., (2), (3) | | | 1,257,882 | |
| | |
| | 34,623 | | | Insulet Corporation, (2) | | | 1,035,228 | |
| | |
| | 54,377 | | | K2M Group Holdings Inc., (2) | | | 992,380 | |
| | |
| | 60,856 | | | LDR Holding Corporation, (2) | | | 1,539,657 | |
| | |
| | 108,334 | | | Nxstage Medical, Inc., (2), (3) | | | 1,810,261 | |
| | |
| | 50,994 | | | Zeltiq Aesthetics Inc., (2), (3) | | | 1,720,538 | |
| | | | Total Health Care Equipment & Supplies | | | 12,227,967 | |
| | |
| | | | Health Care Providers & Services – 3.9% | | | |
| | |
| | 29,976 | | | Amedisys, Inc., (2) | | | 1,186,450 | |
| | |
| | 28,573 | | | Team Health Holdings Inc., (2) | | | 1,704,951 | |
| | |
| | 50,461 | | | Teladoc, Inc., (2), (3) | | | 992,568 | |
| | | | Total Health Care Providers & Services | | | 3,883,969 | |
| | |
| | | | Hotels, Restaurants & Leisure – 4.6% | | | |
| | |
| | 35,315 | | | BJ’s Restaurants, Inc., (2), (3) | | | 1,516,073 | |
| | |
| | 20,267 | | | Jack in the Box Inc., Term Loan | | | 1,510,500 | |
| | |
| | 44,503 | | | Texas Roadhouse, Inc. | | | 1,528,678 | |
| | | | Total Hotels, Restaurants & Leisure | | | 4,555,251 | |
| | |
| | | | Internet Software & Services – 4.0% | | | |
| | |
| | 41,313 | | | Cornerstone OnDemand Inc., (2) | | | 1,301,360 | |
| | |
| | 23,227 | | | LogMeIn Inc., (2) | | | 1,564,571 | |
| | |
| | 46,950 | | | Q2 Holdings Inc., (2) | | | 1,157,318 | |
| | | | Total Internet Software & Services | | | 4,023,249 | |
| | | | | | | | |
| Shares | | | Description (1) | | Value | |
| | |
| | | | IT Services – 4.6% | | | |
| | |
| | 24,547 | | | Euronet Worldwide, Inc., (2) | | $ | 1,969,648 | |
| | |
| | 66,192 | | | Perficient, Inc., (2) | | | 1,106,730 | |
| | |
| | 43,982 | | | WNS Holdings Limited, (2) | | | 1,498,467 | |
| | | | Total IT Services | | | 4,574,845 | |
| | |
| | | | Leisure Products – 1.9% | | | |
| | |
| | 34,646 | | | Brunswick Corporation | | | 1,864,301 | |
| | |
| | | | Machinery – 3.4% | | | |
| | |
| | 41,150 | | | Altra Industrial Motion, Inc., (3) | | | 1,088,829 | |
| | |
| | 148,332 | | | Mueller Water Products Inc., (3) | | | 1,305,322 | |
| | |
| | 75,851 | | | NN, Incorporated, (3) | | | 1,046,744 | |
| | | | Total Machinery | | | 3,440,895 | |
| | |
| | | | Oil, Gas & Consumable Fuels – 2.7% | | | |
| | |
| | 16,888 | | | Diamondback Energy | | | 1,247,010 | |
| | |
| | 53,076 | | | RSP Permian Inc., (2), (3) | | | 1,455,344 | |
| | | | Total Oil, Gas & Consumable Fuels | | | 2,702,354 | |
| | |
| | | | Pharmaceuticals – 0.8% | | | |
| | |
| | 17,257 | | | Intra-Cellular Therapies Inc., (2), (3) | | | 825,747 | |
| | |
| | | | Professional Services – 2.2% | | | |
| | |
| | 39,428 | | | Korn Ferry International | | | 1,433,996 | |
| | |
| | 27,387 | | | TrueBlue Inc., (2) | | | 793,401 | |
| | | | Total Professional Services | | | 2,227,397 | |
| | |
| | | | Real Estate Investment Trust – 3.7% | | | |
| | |
| | 85,009 | | | DiamondRock Hospitality Company | | | 992,905 | |
| | |
| | 15,216 | | | PS Business Parks Inc. | | | 1,305,381 | |
| | |
| | 14,196 | | | Sovran Self Storage Inc. | | | 1,417,755 | |
| | | | Total Real Estate Investment Trust | | | 3,716,041 | |
| | |
| | | | Semiconductors & Semiconductor Equipment – 5.9% | | | |
| | |
| | 38,351 | | | Mellanox Technologies, Limited, (2) | | | 1,806,716 | |
| | |
| | 38,864 | | | MKS Instruments Inc., (3) | | | 1,369,567 | |
| | |
| | 81,759 | | | Semtech Corporation, (2) | | | 1,430,783 | |
| | |
| | 15,046 | | | Synaptics, Inc., (2), (3) | | | 1,280,264 | |
| | | | Total Semiconductors & Semiconductor Equipment | | | 5,887,330 | |
| | |
| | | | Software – 11.6% | | | |
| | |
| | 38,580 | | | Broadsoft Inc., (2) | | | 1,233,403 | |
| | |
| | 66,413 | | | Cadence Design Systems, Inc., (2), (3) | | | 1,475,697 | |
| | |
| | 40,324 | | | CommVault Systems, Inc., (2) | | | 1,633,928 | |
| | |
| | 61,557 | | | Gigamon Inc., (2) | | | 1,614,640 | |
| | |
| | 55,048 | | | Pegasystems, Inc. | | | 1,535,289 | |
Nuveen Small Cap Growth Opportunities Fund (continued)
| | |
| Portfolio of Investments | | October 31, 2015 |
| | | | | | | | |
| Shares | | | Description (1) | | Value | |
| | |
| | | | Software (continued) | | | |
| | |
| | 19,594 | | | Proofpoint, Incorporated, (2) | | $ | 1,380,201 | |
| | |
| | 38,934 | | | QLIK Technologies Inc., (2) | | | 1,221,360 | |
| | |
| | 8,696 | | | Tyler Technologies Inc., (2), (3) | | | 1,481,451 | |
| | |
| | 591,081 | | | VideoPropulsion Inc., (2), (4) | | | – | |
| | | | Total Software | | | 11,575,969 | |
| | |
| | | | Specialty Retail – 3.4% | | | |
| | |
| | 71,855 | | | Express Inc., (2), (3) | | | 1,386,802 | |
| | |
| | 10,001 | | | Restoration Hardware Holdings Incorporated, (2), (3) | | | 1,031,003 | |
| | |
| | 68,383 | | | Tile Shop Holdings Inc., (2) | | | 992,237 | |
| | | | Total Specialty Retail | | | 3,410,042 | |
| | |
| | | | Textiles, Apparel & Luxury Goods – 1.5% | | | |
| | |
| | 44,932 | | | Steven Madden Limited, (2), (3) | | | 1,565,880 | |
| | | | Total Long-Term Investments (cost $87,939,808) | | | 95,769,012 | |
| | |
| Shares | | | Description (1) | | Value | |
| | |
| | | | INVESTMENTS PURCHASED WITH COLLATERAL FROM SECURITIES LENDING – 31.3% | | | | |
| | |
| | | | Money Market Funds – 31.3% | | | |
| | |
| | 31,278,227 | | | Mount Vernon Lending Prime Portfolio, 0.256%, (5), (6) | | $ | 31,278,227 | |
| | | | Total Investments Purchased with Collateral from Securities Lending (cost $31,278,227) | | | 31,278,227 | |
| | |
| Shares | | | Description (1) | | Value | |
| | |
| | | | SHORT-TERM INVESTMENTS – 3.2% | | | | |
| | |
| | | | Money Market Funds – 3.2% | | | |
| | |
| | 3,174,488 | | | First American Treasury Obligations Fund, Class Z, 0.000%, (5) | | $ | 3,174,488 | |
| | | | Total Short-Term Investments (cost $3,174,488) | | | 3,174,488 | |
| | | | Total Investments (cost $122,392,523) – 130.2% | | | 130,221,727 | |
| | | | Other Assets Less Liabilities – (30.2)% | | | (30,178,998 | ) |
| | | | Net Assets – 100% | | $ | 100,042,729 | |
For Fund portfolio compliance purposes, the Fund’s industry classifications refer to any one or more of the industry sub-classifications used by one or more widely recognized market indexes or ratings group indexes, and/or as defined by Fund management. This definition may not apply for purposes of this report which may combine industry sub-classifications into sectors for reporting ease.
| (1) | All percentages shown in the Portfolio of Investments are based on net assets. |
| (2) | Non-income producing; issuer has not declared a dividend within the past twelve months. |
| (3) | Investment, or a portion of investment, is out on loan for securities lending. The total value of the securities out on loan as of the end of the reporting period was $30,044,611. |
| (4) | Investment valued at fair value using methods determined in good faith by, or at the discretion of, the Board. For fair value measurement disclosure purposes, investment classified as Level 3. See Notes to Financial Statements, Note 2 – Investment Valuation and Fair Value Measurements for more information. |
| (5) | The rate shown is the annualized seven-day effective yield as of the end of the reporting period. |
| (6) | The Fund may loan securities representing up to one third of the fair value of its total assets (which includes collateral for securities on loan) to broker dealers, banks, and other institutions. The Fund maintains collateral equal to at least 100% of the fair value of the securities loaned. The cash collateral received by the Fund is invested in this money market fund. See Notes to Financial Statements, Note 3 – Portfolio Securities and Investments in Derivatives, Securities Lending for more information. |
See accompanying notes to financial statements.
Statement of
| | | | |
| | Assets and Liabilities | | October 31, 2015 |
| | | | | | | | | | | | |
| | | Large Cap
Growth
Opportunities | | | Mid Cap
Growth
Opportunities | | | Small Cap
Growth
Opportunities | |
Assets | | | | | | | | | | | | |
Long-term investments, at value (cost $320,704,554, $1,008,166,749 and $87,939,808, respectively) | | $ | 466,942,884 | | | $ | 1,195,384,985 | | | $ | 95,769,012 | |
Investments purchased with collateral from securities lending, at value (cost approximates value) | | | 119,637,888 | | | | 366,889,649 | | | | 31,278,227 | |
Short-term investments, at value (cost approximates value) | | | 687,481 | | | | 8,891,795 | | | | 3,174,488 | |
Receivable for: | | | | | | | | | | | | |
Dividends | | | 138,102 | | | | 95,829 | | | | — | |
Due from broker | | | 12,118 | | | | 78,077 | | | | 35,069 | |
Investments sold | | | 3,060,209 | | | | 17,491,234 | | | | 3,368,716 | |
Reclaims | | | — | | | | 7,657 | | | | — | |
Shares sold | | | 408,830 | | | | 985,551 | | | | 20,583 | |
Other assets | | | 39,166 | | | | 65,326 | | | | 20,599 | |
Total assets | | | 590,926,678 | | | | 1,589,890,103 | | | | 133,666,694 | |
Liabilities | | | | | | | | | | | | |
Payable for: | | | | | | | | | | | | |
Collateral from securities lending program | | | 119,637,888 | | | | 366,889,649 | | | | 31,278,227 | |
Investments purchased | | | 3,096,120 | | | | 16,041,360 | | | | 2,037,935 | |
Shares redeemed | | | 930,801 | | | | 1,100,682 | | | | 164,955 | |
Accrued expenses: | | | | | | | | | | | | |
Directors fees | | | 22,453 | | | | 50,011 | | | | 809 | |
Management fees | | | 319,151 | | | | 874,977 | | | | 77,606 | |
12b-1 distribution and service fees | | | 39,084 | | | | 118,808 | | | | 9,594 | |
Other | | | 165,053 | | | | 543,363 | | | | 54,839 | |
Total liabilities | | | 124,210,550 | | | | 385,618,850 | | | | 33,623,965 | |
Net assets | | $ | 466,716,128 | | | $ | 1,204,271,253 | | | $ | 100,042,729 | |
Class A Shares | | | | | | | | | | | | |
Net assets | | $ | 117,687,548 | | | $ | 365,394,171 | | | $ | 33,922,460 | |
Shares outstanding | | | 3,133,978 | | | | 8,932,242 | | | | 1,572,318 | |
Net asset value (“NAV”) per share | | $ | 37.55 | | | $ | 40.91 | | | $ | 21.57 | |
Offering price per share (NAV per share plus maximum sales charge of 5.75% of offering price) | | $ | 39.84 | | | $ | 43.41 | | | $ | 22.89 | |
Class C Shares | | | | | | | | | | | | |
Net assets | | $ | 14,575,231 | | | $ | 22,284,265 | | | $ | 2,278,154 | |
Shares outstanding | | | 451,630 | | | | 665,157 | | | | 127,339 | |
NAV and offering price per share | | $ | 32.27 | | | $ | 33.50 | | | $ | 17.89 | |
Class R3 Shares | | | | | | | | | | | | |
Net assets | | $ | 7,995,505 | | | $ | 54,865,505 | | | $ | 1,438,960 | |
Shares outstanding | | | 220,969 | | | | 1,407,570 | | | | 69,496 | |
NAV and offering price per share | | $ | 36.18 | | | $ | 38.98 | | | $ | 20.71 | |
Class R6 Shares | | | | | | | | | | | | |
Net assets | | $ | 18,631,539 | | | $ | 31,167,046 | | | $ | — | |
Shares outstanding | | | 461,784 | | | | 663,195 | | | | — | |
NAV and offering price per share | | $ | 40.35 | | | $ | 47.00 | | | $ | — | |
Class I Shares | | | | | | | | | | | | |
Net assets | | $ | 307,826,305 | | | $ | 730,560,266 | | | $ | 62,403,155 | |
Shares outstanding | | | 7,652,364 | | | | 15,608,288 | | | | 2,546,084 | |
NAV and offering price per share | | $ | 40.23 | | | $ | 46.81 | | | $ | 24.51 | |
Net assets consist of: | | | | | | | | | | | | |
Capital paid-in | | $ | 240,489,669 | | | $ | 940,769,996 | | | $ | 84,015,229 | |
Undistributed (Over-distribution of) net investment income | | | 5,448,515 | | | | (6,726,087 | ) | | | — | |
Accumulated net realized gain (loss) | | | 74,539,614 | | | | 83,009,108 | | | | 8,198,296 | |
Net unrealized appreciation (depreciation) | | | 146,238,330 | | | | 187,218,236 | | | | 7,829,204 | |
Net assets | | $ | 466,716,128 | | | $ | 1,204,271,253 | | | $ | 100,042,729 | |
Authorized shares – per class | | | 2 billion | | | | 2 billion | | | | 2 billion | |
Par value per share | | $ | 0.0001 | | | $ | 0.0001 | | | $ | 0.0001 | |
See accompanying notes to financial statements.
Statement of
| | | | |
| | Operations | | Year Ended October 31, 2015 |
| | | | | | | | | | | | |
| | | Large Cap
Growth
Opportunities | | | Mid Cap
Growth
Opportunities | | | Small Cap
Growth
Opportunities | |
Investment Income | | | | | | | | | | | | |
Dividend and interest income (net of foreign tax withheld of $2,592, $15,344 and $—, respectively) | | $ | 5,183,408 | | | $ | 7,139,559 | | | $ | 435,350 | |
Securities lending income, net | | | 90,960 | | | | 419,918 | | | | 98,092 | |
Total investment income | | | 5,274,368 | | | | 7,559,477 | | | | 533,442 | |
Expenses | | | | | | | | | | | | |
Management fees | | | 4,105,099 | | | | 11,098,363 | | | | 1,058,692 | |
12b-1 service fees — Class A Shares | | | 320,038 | | | | 963,776 | | | | 93,198 | |
12b-1 distribution and service fees — Class C Shares | | | 138,387 | | | | 240,249 | | | | 24,088 | |
12b-1 distribution and service fees — Class R3 Shares | | | 41,454 | | | | 329,660 | | | | 9,183 | |
Shareholder servicing agent fees | | | 516,066 | | | | 1,903,035 | | | | 133,672 | |
Custodian fees | | | 77,680 | | | | 199,363 | | | | 26,128 | |
Directors Fees | | | 13,017 | | | | 34,331 | | | | 2,908 | |
Professional fees | | | 50,149 | | | | 98,133 | | | | 24,180 | |
Shareholder reporting expenses | | | 59,208 | | | | 124,177 | | | | 24,711 | |
Federal and state registration fees | | | 76,033 | | | | 91,986 | | | | 53,593 | |
Other | | | 31,123 | | | | 23,454 | | | | 3,591 | |
Total expenses before fee waiver/expense reimbursement | | | 5,428,254 | | | | 15,106,527 | | | | 1,453,944 | |
Fee waiver/expense reimbursement | | | — | | | | — | | | | (35,738 | ) |
Net expenses | | | 5,428,254 | | | | 15,106,527 | | | | 1,418,206 | |
Net investment income (loss) | | | (153,886 | ) | | | (7,547,050 | ) | | | (884,764 | ) |
Realized and Unrealized Gain (Loss) | | | | | | | | | | | | |
Net realized gain (loss) from investments | | | 81,224,898 | | | | 93,276,543 | | | | 9,729,822 | |
Change in net unrealized appreciation (depreciation) of investments | | | (25,402,229 | ) | | | (37,039,615 | ) | | | (8,261,028 | ) |
Net realized and unrealized gain (loss) | | | 55,822,669 | | | | 56,236,928 | | | | 1,468,794 | |
Net increase (decrease) in net assets from operations | | $ | 55,668,783 | | | $ | 48,689,878 | | | $ | 584,030 | |
See accompanying notes to financial statements.
Statement of
| | | | | | | | | | | | | | | | | | | | | | | | | | | | |
| | | Large Cap Growth Opportunities | | | | | Mid Cap Growth Opportunities | | | | | Small Cap Growth Opportunities | |
| | | Year Ended
10/31/15 | | | Year Ended
10/31/14 | | | | | Year Ended
10/31/15 | | | Year Ended
10/31/14 | | | | | Year Ended
10/31/15 | | | Year Ended
10/31/14 | |
Operations | | | | | | | | | | | | | | | | | | | | | | | | | | | | |
Net investment income (loss) | | $ | (153,886 | ) | | $ | (1,448,260 | ) | | | | $ | (7,547,050 | ) | | $ | (8,677,538 | ) | | | | $ | (884,764 | ) | | $ | (900,254 | ) |
Net realized gain (loss) from investments | | | 81,224,898 | | | | 91,580,047 | | | | | | 93,276,543 | | | | 231,344,771 | | | | | | 9,729,822 | | | | 12,730,722 | |
Change in net unrealized appreciation (depreciation) of investments | | | (25,402,229 | ) | | | (29,259,565 | ) | | | | | (37,039,615 | ) | | | (67,482,894 | ) | | | | | (8,261,028 | ) | | | (3,210,871 | ) |
Net increase (decrease) in net assets from operations | | | 55,668,783 | | | | 60,872,222 | | | | | | 48,689,878 | | | | 155,184,339 | | | | | | 584,030 | | | | 8,619,597 | |
Distributions to Shareholders | | | | | | | | | | | | | | | | | | | | | | | | | | | | |
From net investment income: | | | | | | | | | | | | | | | | | | | | | | | | | | | | |
Class A Shares | | | — | | | | — | | | | | | — | | | | — | | | | | | — | | | | — | |
Class C Shares | | | — | | | | — | | | | | | — | | | | — | | | | | | — | | | | — | |
Class R3 Shares | | | — | | | | — | | | | | | — | | | | — | | | | | | — | | | | — | |
Class R6 Shares | | | — | | | | — | | | | | | — | | | | — | | | | | | — | | | | — | |
Class I Shares | | | — | | | | — | | | | | | — | | | | — | | | | | | — | | | | — | |
From accumulated net realized gains: | | | | | | | | | | | | | | | | | | | | | | | | | | | | |
Class A Shares | | | (23,403,600 | ) | | | (24,236,445 | ) | | | | | (63,095,209 | ) | | | (63,349,741 | ) | | | | | (4,471,368 | ) | | | (7,268,048 | ) |
Class C Shares | | | (2,680,855 | ) | | | (2,511,114 | ) | | | | | (4,791,958 | ) | | | (4,481,915 | ) | | | | | (319,340 | ) | | | (475,333 | ) |
Class R3 Shares | | | (1,555,935 | ) | | | (1,764,930 | ) | | | | | (11,403,833 | ) | | | (8,738,211 | ) | | | | | (245,744 | ) | | | (356,350 | ) |
Class R6 Shares | | | (3,364,017 | ) | | | (4,240,519 | ) | | | | | (2,495,372 | ) | | | (4,324,392 | ) | | | | | — | | | | — | |
Class I Shares | | | (58,751,935 | ) | | | (61,056,809 | ) | | | | | (123,471,077 | ) | | | (126,230,200 | ) | | | | | (6,745,694 | ) | | | (7,704,173 | ) |
Decrease in net assets from distributions to shareholders | | | (89,756,342 | ) | | | (93,809,817 | ) | | | | | (205,257,449 | ) | | | (207,124,459 | ) | | | | | (11,782,146 | ) | | | (15,803,904 | ) |
Fund Share Transactions | | | | | | | | | | | | | | | | | | | | | | | | | | | | |
Proceeds from sale of shares | | | 43,245,242 | | | | 94,779,280 | | | | | | 219,634,570 | | | | 271,666,021 | | | | | | 16,031,783 | | | | 33,225,866 | |
Proceeds from shares issued to shareholders due to reinvestment of distributions | | | 63,521,406 | | | | 65,361,328 | | | | | | 180,877,868 | | | | 177,933,816 | | | | | | 9,392,517 | | | | 11,385,858 | |
| | | 106,766,648 | | | | 160,140,608 | | | | | | 400,512,438 | | | | 449,599,837 | | | | | | 25,424,300 | | | | 44,611,724 | |
Cost of shares redeemed | | | (171,182,954 | ) | | | (187,564,224 | ) | | | | | (330,668,906 | ) | | | (335,793,851 | ) | | | | | (20,387,721 | ) | | | (24,619,284 | ) |
Net increase (decrease) in net assets from Fund share transactions | | | (64,416,306 | ) | | | (27,423,616 | ) | | | | | 69,843,532 | | | | 113,805,986 | | | | | | 5,036,579 | | | | 19,992,440 | |
Net increase (decrease) in net assets | | | (98,503,865 | ) | | | (60,361,211 | ) | | | | | (86,724,039 | ) | | | 61,865,866 | | | | | | (6,161,537 | ) | | | 12,808,133 | |
Net assets at the beginning of period | | | 565,219,993 | | | | 625,581,204 | | | | | | 1,290,995,292 | | | | 1,229,129,426 | | | | | | 106,204,266 | | | | 93,396,133 | |
Net assets at the end of period | | $ | 466,716,128 | | | $ | 565,219,993 | | | | | $ | 1,204,271,253 | | | $ | 1,290,995,292 | | | | | $ | 100,042,729 | | | $ | 106,204,266 | |
Undistributed (Over-distribution of) net investment income at the end of period | | $ | 5,448,515 | | | $ | (29,339 | ) | | | | $ | (6,726,087 | ) | | $ | (48,492 | ) | | | | $ | — | | | $ | — | |
See accompanying notes to financial statements.
Financial
Highlights
Large Cap Growth Opportunities
Selected data for a share outstanding throughout each period:
| | | | | | | | | | | | | | | | | | | | | | | | | | | | | | | | | | |
| | | | | |
| | | | | | Investment Operations | | | | | Less Distributions | | | | |
| | | | | | | | | |
Class (Commencement Date) Year Ended October 31, | | Beginning
NAV | | | Net
Investment
Income
(Loss)(a) | | | Net
Realized/
Unrealized
Gain (Loss) | | | Total | | | | | From
Net
Investment
Income | | | From
Accumulated
Net Realized
Gains | | | Total | | | Ending
NAV | |
Class A (1/95) | | | | | | | | | | | | | | | | | | | | | | | | | | | | | | | | | | |
2015 | | $ | 40.48 | | | $ | (0.05 | ) | | $ | 3.99 | | | $ | 3.94 | | | | | $ | — | | | $ | (6.87 | ) | | $ | (6.87 | ) | | $ | 37.55 | |
2014 | | | 43.26 | | | | (0.16 | ) | | | 4.12 | | | | 3.96 | | | | | | — | | | | (6.74 | ) | | | (6.74 | ) | | | 40.48 | |
2013 | | | 34.09 | | | | (0.05 | ) | | | 9.63 | | | | 9.58 | | | | | | — | | | | (0.41 | ) | | | (0.41 | ) | | | 43.26 | |
2012 | | | 32.92 | | | | (0.13 | ) | | | 2.46 | | | | 2.33 | | | | | | — | | | | (1.16 | ) | | | (1.16 | ) | | | 34.09 | |
2011 | | | 30.24 | | | | (0.15 | ) | | | 2.83 | | | | 2.68 | | | | | | — | | | | — | | | | — | | | | 32.92 | |
Class C (9/01) | | | | | | | | | | | | | | | | | | | | | | | | | | | | | | | | | | |
2015 | | | 35.97 | | | | (0.30 | ) | | | 3.47 | | | | 3.17 | | | | | | — | | | | (6.87 | ) | | | (6.87 | ) | | | 32.27 | |
2014 | | | 39.42 | | | | (0.40 | ) | | | 3.69 | | | | 3.29 | | | | | | — | | | | (6.74 | ) | | | (6.74 | ) | | | 35.97 | |
2013 | | | 31.34 | | | | (0.31 | ) | | | 8.80 | | | | 8.49 | | | | | | — | | | | (0.41 | ) | | | (0.41 | ) | | | 39.42 | |
2012 | | | 30.57 | | | | (0.35 | ) | | | 2.28 | | | | 1.93 | | | | | | — | | | | (1.16 | ) | | | (1.16 | ) | | | 31.34 | |
2011 | | | 28.30 | | | | (0.37 | ) | | | 2.64 | | | | 2.27 | | | | | | — | | | | — | | | | — | | | | 30.57 | |
Class R3 (11/00) | | | | | | | | | | | | | | | | | | | | | | | | | | | | | | | | | | |
2015 | | | 39.33 | | | | (0.17 | ) | | | 3.89 | | | | 3.72 | | | | | | — | | | | (6.87 | ) | | | (6.87 | ) | | | 36.18 | |
2014 | | | 42.32 | | | | (0.25 | ) | | | 4.00 | | | | 3.75 | | | | | | — | | | | (6.74 | ) | | | (6.74 | ) | | | 39.33 | |
2013 | | | 33.44 | | | | (0.14 | ) | | | 9.43 | | | | 9.29 | | | | | | — | | | | (0.41 | ) | | | (0.41 | ) | | | 42.32 | |
2012 | | | 32.39 | | | | (0.22 | ) | | | 2.43 | | | | 2.21 | | | | | | — | | | | (1.16 | ) | | | (1.16 | ) | | | 33.44 | |
2011 | | | 29.83 | | | | (0.23 | ) | | | 2.79 | | | | 2.56 | | | | | | — | | | | — | | | | — | | | | 32.39 | |
Class R6 (2/13) | | | | | | | | | | | | | | | | | | | | | | | | | | | | | | | | | | |
2015 | | | 42.85 | | | | 0.07 | | | | 4.30 | | | | 4.37 | | | | | | — | | | | (6.87 | ) | | | (6.87 | ) | | | 40.35 | |
2014 | | | 45.27 | | | | (0.02 | ) | | | 4.34 | | | | 4.32 | | | | | | — | | | | (6.74 | ) | | | (6.74 | ) | | | 42.85 | |
2013(d) | | | 37.47 | | | | (0.02 | ) | | | 7.82 | | | | 7.80 | | | | | | — | | | | — | | | | — | | | | 45.27 | |
Class I (12/92) | | | | | | | | | | | | | | | | | | | | | | | | | | | | | | | | | | |
2015 | | | 42.78 | | | | 0.02 | | | | 4.30 | | | | 4.32 | | | | | | — | | | | (6.87 | ) | | | (6.87 | ) | | | 40.23 | |
2014 | | | 45.24 | | | | (0.06 | ) | | | 4.34 | | | | 4.28 | | | | | | — | | | | (6.74 | ) | | | (6.74 | ) | | | 42.78 | |
2013 | | | 35.55 | | | | 0.06 | | | | 10.04 | | | | 10.10 | | | | | | — | | | | (0.41 | ) | | | (0.41 | ) | | | 45.24 | |
2012 | | | 34.19 | | | | (0.04 | ) | | | 2.56 | | | | 2.52 | | | | | | — | | | | (1.16 | ) | | | (1.16 | ) | | | 35.55 | |
2011 | | | 31.33 | | | | (0.06 | ) | | | 2.92 | | | | 2.86 | | | | | | — | | | | — | | | | — | | | | 34.19 | |
| | | | | | | | | | | | | | | | | | | | | | | | | | | | | | |
| | | | Ratios/Supplemental Data | |
| | | | | | | | | Ratios to Average
Net Assets Before
Waiver/Reimbursement | | | | | Ratios to Average
Net Assets After
Waiver/Reimbursement(c) | | | | |
| | | | | | | | |
Total
Return(b) | | | Ending
Net
Assets
(000) | | | | | Expenses | | | Net
Investment
Income
(Loss) | | | | | Expenses | | | Net
Investment
Income
(Loss) | | | Portfolio
Turnover
Rate(e) | |
| | | | | | | | | | | | | | | | | | | | | | | | | | | | | | |
| | 11.75 | % | | $ | 117,688 | | | | | | 1.25 | % | | | (0.13 | )% | | | | | 1.25 | % | | | (0.13 | )% | | | 79 | % |
| | 10.50 | | | | 143,891 | | | | | | 1.25 | | | | (0.40 | ) | | | | | 1.25 | | | | (0.40 | ) | | | 66 | |
| | 28.39 | | | | 165,791 | | | | | | 1.24 | | | | (0.14 | ) | | | | | 1.24 | | | | (0.14 | ) | | | 72 | |
| | 7.66 | | | | 134,788 | | | | | | 1.26 | | | | (0.42 | ) | | | | | 1.23 | | | | (0.39 | ) | | | 73 | |
| | 8.86 | | | | 84,875 | | | | | | 1.20 | | | | (0.46 | ) | | | | | 1.20 | | | | (0.46 | ) | | | 88 | |
| | | | | | | | | | | | | | | | | | | | | | | | | | | | | | |
| | 10.92 | | | | 14,575 | | | | | | 2.00 | | | | (0.95 | ) | | | | | 2.00 | | | | (0.95 | ) | | | 79 | |
| | 9.73 | | | | 14,462 | | | | | | 2.00 | | | | (1.15 | ) | | | | | 2.00 | | | | (1.15 | ) | | | 66 | |
| | 27.43 | | | | 14,963 | | | | | | 1.99 | | | | (0.89 | ) | | | | | 1.99 | | | | (0.89 | ) | | | 72 | |
| | 6.88 | | | | 11,193 | | | | | | 2.01 | | | | (1.16 | ) | | | | | 1.98 | | | | (1.14 | ) | | | 73 | |
| | 8.02 | | | | 7,832 | | | | | | 1.95 | | | | (1.21 | ) | | | | | 1.95 | | | | (1.21 | ) | | | 88 | |
| | | | | | | | | | | | | | | | | | | | | | | | | | | | | | |
| | 11.47 | | | | 7,996 | | | | | | 1.50 | | | | (0.48 | ) | | | | | 1.50 | | | | (0.48 | ) | | | 79 | |
| | 10.22 | | | | 8,724 | | | | | | 1.50 | | | | (0.64 | ) | | | | | 1.50 | | | | (0.64 | ) | | | 66 | |
| | 28.07 | | | | 11,320 | | | | | | 1.49 | | | | (0.39 | ) | | | | | 1.49 | | | | (0.39 | ) | | | 72 | |
| | 7.40 | | | | 9,658 | | | | | | 1.51 | | | | (0.70 | ) | | | | | 1.48 | | | | (0.67 | ) | | | 73 | |
| | 8.58 | | | | 3,431 | | | | | | 1.45 | | | | (0.72 | ) | | | | | 1.45 | | | | (0.72 | ) | | | 88 | |
| | | | | | | | | | | | | | | | | | | | | | | | | | | | | | |
| | 12.14 | | | | 18,632 | | | | | | 0.91 | | | | 0.17 | | | | | | 0.91 | | | | 0.17 | | | | 79 | |
| | 10.90 | | | | 22,672 | | | | | | 0.90 | | | | (0.05 | ) | | | | | 0.90 | | | | (0.05 | ) | | | 66 | |
| | 20.82 | | | | 28,966 | | | | | | 0.91 | * | | | (0.06 | )* | | | | | 0.91 | * | | | (0.06 | )* | | | 72 | |
| | | | | | | | | | | | | | | | | | | | | | | | | | | | | | |
| | 12.05 | | | | 307,826 | | | | | | 1.00 | | | | 0.05 | | | | | | 1.00 | | | | 0.05 | | | | 79 | |
| | 10.78 | | | | 375,471 | | | | | | 1.00 | | | | (0.15 | ) | | | | | 1.00 | | | | (0.15 | ) | | | 66 | |
| | 28.69 | | | | 403,480 | | | | | | 0.99 | | | | 0.14 | | | | | | 0.99 | | | | 0.14 | | | | 72 | |
| | 7.94 | | | | 418,144 | | | | | | 1.01 | | | | (0.13 | ) | | | | | 0.98 | | | | (0.11 | ) | | | 73 | |
| | 9.13 | | | | 435,619 | | | | | | 0.95 | | | | (0.17 | ) | | | | | 0.95 | | | | (0.17 | ) | | | 88 | |
| (a) | Per share Net Investment Income (Loss) is calculated using the average daily shares method. | |
| (b) | Total return is the combination of changes in NAV without any sales charge, reinvested dividend income at NAV and reinvested capital gains distributions at NAV, if any. Total returns are not annualized. | |
| (c) | After fee waiver and/or expense reimbursement from the Adviser, where applicable. | |
| (d) | For the period February 28, 2013 (commencement of operations) through October 31, 2013. | |
| (e) | Portfolio Turnover Rate is calculated based on the lesser of long-term purchases or sales (as disclosed in Note 5 – Investment Transactions) divided by the average long-term market value during the period. | |
See accompanying notes to financial statements.
Financial Highlights (continued)
Mid Cap Growth Opportunities
Selected data for a share outstanding throughout each period:
| | | | | | | | | | | | | | | | | | | | | | | | | | | | | | | | | | |
| | | | | |
| | | | | | Investment Operations | | | | | Less Distributions | | | | |
| | | | | | | | | |
Class (Commencement Date) Year Ended October 31, | | Beginning
NAV | | | Net
Investment
Income
(Loss)(a) | | | Net
Realized/
Unrealized
Gain (Loss) | | | Total | | | | | From
Net
Investment
Income | | | From
Accumulated
Net Realized
Gains | | | Total | | | Ending
NAV | |
Class A (1/95) | | | | | | | | | | | | | | | | | | | | | | | | | | | | | | | | | | |
2015 | | $ | 47.67 | | | $ | (0.31 | ) | | $ | 1.72 | | | $ | 1.41 | | | | | $ | — | | | $ | (8.17 | ) | | $ | (8.17 | ) | | $ | 40.91 | |
2014 | | | 51.11 | | | | (0.38 | ) | | | 6.09 | | | | 5.71 | | | | | | — | | | | (9.15 | ) | | | (9.15 | ) | | | 47.67 | |
2013 | | | 42.38 | | | | (0.17 | ) | | | 12.05 | | | | 11.88 | | | | | | — | | | | (3.15 | ) | | | (3.15 | ) | | | 51.11 | |
2012 | | | 41.36 | | | | (0.16 | ) | | | 2.77 | | | | 2.61 | | | | | | — | | | | (1.59 | ) | | | (1.59 | ) | | | 42.38 | |
2011 | | | 37.26 | | | | (0.22 | ) | | | 4.32 | | | | 4.10 | | | | | | — | | | | — | | | | — | | | | 41.36 | |
Class C (9/01) | | | | | | | | | | | | | | | | | | | | | | | | | | | | | | | | | | |
2015 | | | 40.77 | | | | (0.52 | ) | | | 1.42 | | | | 0.90 | | | | | | — | | | | (8.17 | ) | | | (8.17 | ) | | | 33.50 | |
2014 | | | 45.29 | | | | (0.63 | ) | | | 5.26 | | | | 4.63 | | | | | | — | | | | (9.15 | ) | | | (9.15 | ) | | | 40.77 | |
2013 | | | 38.17 | | | | (0.45 | ) | | | 10.72 | | | | 10.27 | | | | | | — | | | | (3.15 | ) | | | (3.15 | ) | | | 45.29 | |
2012 | | | 37.70 | | | | (0.43 | ) | | | 2.49 | | | | 2.06 | | | | | | — | | | | (1.59 | ) | | | (1.59 | ) | | | 38.17 | |
2011 | | | 34.21 | | | | (0.49 | ) | | | 3.98 | | | | 3.49 | | | | | | — | | | | — | | | | — | | | | 37.70 | |
Class R3 (12/00) | | | | | | | | | | | | | | | | | | | | | | | | | | | | | | | | | | |
2015 | | | 45.90 | | | | (0.40 | ) | | | 1.65 | | | | 1.25 | | | | | | — | | | | (8.17 | ) | | | (8.17 | ) | | | 38.98 | |
2014 | | | 49.65 | | | | (0.49 | ) | | | 5.89 | | | | 5.40 | | | | | | — | | | | (9.15 | ) | | | (9.15 | ) | | | 45.90 | |
2013 | | | 41.35 | | | | (0.27 | ) | | | 11.72 | | | | 11.45 | | | | | | — | | | | (3.15 | ) | | | (3.15 | ) | | | 49.65 | |
2012 | | | 40.50 | | | | (0.27 | ) | | | 2.71 | | | | 2.44 | | | | | | — | | | | (1.59 | ) | | | (1.59 | ) | | | 41.35 | |
2011 | | | 36.58 | | | | (0.31 | ) | | | 4.23 | | | | 3.92 | | | | | | — | | | | — | | | | — | | | | 40.50 | |
Class R6 (2/13) | | | | | | | | | | | | | | | | | | | | | | | | | | | | | | | | | | |
2015 | | | 53.36 | | | | (0.16 | ) | | | 1.97 | | | | 1.81 | | | | | | — | | | | (8.17 | ) | | | (8.17 | ) | | | 47.00 | |
2014 | | | 55.97 | | | | (0.23 | ) | | | 6.77 | | | | 6.54 | | | | | | — | | | | (9.15 | ) | | | (9.15 | ) | | | 53.36 | |
2013(d) | | | 46.61 | | | | (0.05 | ) | | | 9.41 | | | | 9.36 | | | | | | — | | | | — | | | | — | | | | 55.97 | |
Class I (12/89) | | | | | | | | | | | | | | | | | | | | | | | | | | | | | | | | | | |
2015 | | | 53.24 | | | | (0.23 | ) | | | 1.97 | | | | 1.74 | | | | | | — | | | | (8.17 | ) | | | (8.17 | ) | | | 46.81 | |
2014 | | | 55.93 | | | | (0.29 | ) | | | 6.75 | | | | 6.46 | | | | | | — | | | | (9.15 | ) | | | (9.15 | ) | | | 53.24 | |
2013 | | | 45.97 | | | | (0.06 | ) | | | 13.17 | | | | 13.11 | | | | | | — | | | | (3.15 | ) | | | (3.15 | ) | | | 55.93 | |
2012 | | | 44.62 | | | | (0.06 | ) | | | 3.00 | | | | 2.94 | | | | | | — | | | | (1.59 | ) | | | (1.59 | ) | | | 45.97 | |
2011 | | | 40.09 | | | | (0.10 | ) | | | 4.63 | | | | 4.53 | | | | | | — | | | | — | | | | — | | | | 44.62 | |
| | | | | | | | | | | | | | | | | | | | | | | | | | | | | | |
| | | | Ratios/Supplemental Data | |
| | | | | | | | | Ratios to Average
Net Assets Before
Waiver/Reimbursement | | | | | Ratios to Average
Net Assets After
Waiver/Reimbursement(c) | | | | |
| | | | | | | | |
Total
Return(b) | | | Ending
Net
Assets
(000) | | | | | Expenses | | | Net
Investment
Income
(Loss) | | | | | Expenses | | | Net
Investment
Income
(Loss) | | | Portfolio
Turnover
Rate(e) | |
| | | | | | | | | | | | | | | | | | | | | | | | | | | | | | |
| | 3.68 | % | | $ | 365,394 | | | | | | 1.30 | % | | | (0.72 | )% | | | | | 1.30 | % | | | (0.72 | )% | | | 118 | % |
| | 12.89 | | | | 371,601 | | | | | | 1.30 | | | | (0.81 | ) | | | | | 1.30 | | | | (0.81 | ) | | | 106 | |
| | 30.27 | | | | 355,086 | | | | | | 1.30 | | | | (0.38 | ) | | | | | 1.29 | | | | (0.38 | ) | | | 108 | |
| | 6.88 | | | | 306,507 | | | | | | 1.30 | | | | (0.42 | ) | | | | | 1.27 | | | | (0.39 | ) | | | 113 | |
| | 11.00 | | | | 289,038 | | | | | | 1.26 | | | | (0.53 | ) | | | | | 1.26 | | | | (0.53 | ) | | | 114 | |
| | | | | | | | | | | | | | | | | | | | | | | | | | | | | | |
| | 2.91 | | | | 22,284 | | | | | | 2.05 | | | | (1.47 | ) | | | | | 2.05 | | | | (1.47 | ) | | | 118 | |
| | 12.01 | | | | 24,304 | | | | | | 2.05 | | | | (1.56 | ) | | | | | 2.05 | | | | (1.56 | ) | | | 106 | |
| | 29.33 | | | | 22,181 | | | | | | 2.05 | | | | (1.14 | ) | | | | | 2.04 | | | | (1.13 | ) | | | 108 | |
| | 6.06 | | | | 17,874 | | | | | | 2.05 | | | | (1.16 | ) | | | | | 2.02 | | | | (1.13 | ) | | | 113 | |
| | 10.20 | | | | 14,314 | | | | | | 2.01 | | | | (1.28 | ) | | | | | 2.01 | | | | (1.28 | ) | | | 114 | |
| | | | | | | | | | | | | | | | | | | | | | | | | | | | | | |
| | 3.43 | | | | 54,866 | | | | | | 1.55 | | | | (0.98 | ) | | | | | 1.55 | | | | (0.98 | ) | | | 118 | |
| | 12.59 | | | | 64,262 | | | | | | 1.55 | | | | (1.10 | ) | | | | | 1.55 | | | | (1.10 | ) | | | 106 | |
| | 29.97 | | | | 47,168 | | | | | | 1.55 | | | | (0.63 | ) | | | | | 1.54 | | | | (0.63 | ) | | | 108 | |
| | 6.59 | | | | 38,869 | | | | | | 1.55 | | | | (0.67 | ) | | | | | 1.52 | | | | (0.64 | ) | | | 113 | |
| | 10.72 | | | | 34,929 | | | | | | 1.51 | | | | (0.77 | ) | | | | | 1.51 | | | | (0.77 | ) | | | 114 | |
| | | | | | | | | | | | | | | | | | | | | | | | | | | | | | |
| | 4.09 | | | | 31,167 | | | | | | 0.92 | | | | (0.33 | ) | | | | | 0.92 | | | | (0.33 | ) | | | 118 | |
| | 13.31 | | | | 16,192 | | | | | | 0.92 | | | | (0.44 | ) | | | | | 0.92 | | | | (0.44 | ) | | | 106 | |
| | 20.12 | | | | 25,874 | | | | | | 0.92 | * | | | (0.14 | )* | | | | | 0.92 | * | | | (0.14 | )* | | | 108 | |
| | | | | | | | | | | | | | | | | | | | | | | | | | | | | | |
| | 3.95 | | | | 730,560 | | | | | | 1.05 | | | | (0.47 | ) | | | | | 1.05 | | | | (0.47 | ) | | | 118 | |
| | 13.15 | | | | 814,636 | | | | | | 1.05 | | | | (0.56 | ) | | | | | 1.05 | | | | (0.56 | ) | | | 106 | |
| | 30.60 | | | | 776,915 | | | | | | 1.05 | | | | (0.13 | ) | | | | | 1.04 | | | | (0.12 | ) | | | 108 | |
| | 7.13 | | | | 744,480 | | | | | | 1.05 | | | | (0.17 | ) | | | | | 1.02 | | | | (0.14 | ) | | | 113 | |
| | 11.30 | | | | 728,843 | | | | | | 1.01 | | | | (0.21 | ) | | | | | 1.01 | | | | (0.21 | ) | | | 114 | |
| (a) | Per share Net Investment Income (Loss) is calculated using the average daily shares method. | |
| (b) | Total return is the combination of changes in NAV without any sales charge, reinvested dividend income at NAV and reinvested capital gains distributions at NAV, if any. Total returns are not annualized. | |
| (c) | After fee waiver and/or expense reimbursement from the Adviser, where applicable. | |
| (d) | For the period February 28, 2013 (commencement of operations) through October 31, 2013. | |
| (e) | Portfolio Turnover Rate is calculated based on the lesser of long-term purchases or sales (as disclosed in Note 5 – Investment Transactions) divided by the average long-term market value during the period. | |
See accompanying notes to financial statements.
Financial Highlights (continued)
Small Cap Growth Opportunities
Selected data for a share outstanding throughout each period:
| | | | | | | | | | | | | | | | | | | | | | | | | | | | | | | | | | |
| | | | | |
| | | | | | Investment Operations | | | | | Less Distributions | | | | |
| | | | | | | | | |
Class (Commencement Date) Year Ended October 31, | | Beginning
NAV | | | Net
Investment
Income
(Loss)(a) | | | Net
Realized/
Unrealized
Gain (Loss) | | | Total | | | | | From
Net
Investment
Income | | | From
Accumulated
Net Realized
Gains | | | Total | | | Ending
NAV | |
Class A (8/95) | | | | | | | | | | | | | | | | | | | | | | | | | | | | | | | |
2015 | | $ | 24.41 | | | $ | (0.22 | ) | | $ | 0.33 | | | $ | 0.11 | | | | | $ | — | | | $ | (2.95 | ) | | $ | (2.95 | ) | | $ | 21.57 | |
2014 | | | 27.13 | | | | (0.26 | ) | | | 2.35 | | | | 2.09 | | | | | | — | | | | (4.81 | ) | | | (4.81 | ) | | | 24.41 | |
2013 | | | 21.25 | | | | (0.26 | ) | | | 7.93 | | | | 7.67 | | | | | | — | | | | (1.79 | ) | | | (1.79 | ) | | | 27.13 | |
2012 | | | 20.41 | | | | (0.21 | ) | | | 1.35 | | | | 1.14 | | | | | | — | | | | (0.30 | ) | | | (0.30 | ) | | | 21.25 | |
2011 | | | 19.04 | | | | (0.24 | ) | | | 1.61 | | | | 1.37 | | | | | | — | | | | — | | | | — | | | | 20.41 | |
Class C (9/01) | | | | | | | | | | | | | | | | | | | | | | | | | | | | | | | |
2015 | | | 20.89 | | | | (0.33 | ) | | | 0.28 | | | | (0.05 | ) | | | | | — | | | | (2.95 | ) | | | (2.95 | ) | | | 17.89 | |
2014 | | | 24.05 | | | | (0.38 | ) | | | 2.03 | | | | 1.65 | | | | | | — | | | | (4.81 | ) | | | (4.81 | ) | | | 20.89 | |
2013 | | | 19.17 | | | | (0.38 | ) | | | 7.05 | | | | 6.67 | | | | | | — | | | | (1.79 | ) | | | (1.79 | ) | | | 24.05 | |
2012 | | | 18.58 | | | | (0.34 | ) | | | 1.23 | | | | 0.89 | | | | | | — | | | | (0.30 | ) | | | (0.30 | ) | | | 19.17 | |
2011 | | | 17.46 | | | | (0.36 | ) | | | 1.48 | | | | 1.12 | | | | | | — | | | | — | | | | — | | | | 18.58 | |
Class R3 (12/00) | | | | | | | | | | | | | | | | | | | | | | | | | | | | | | | |
2015 | | | 23.60 | | | | (0.27 | ) | | | 0.33 | | | | 0.06 | | | | | | — | | | | (2.95 | ) | | | (2.95 | ) | | | 20.71 | |
2014 | | | 26.45 | | | | (0.31 | ) | | | 2.27 | | | | 1.96 | | | | | | — | | | | (4.81 | ) | | | (4.81 | ) | | | 23.60 | |
2013 | | | 20.81 | | | | (0.30 | ) | | | 7.73 | | | | 7.43 | | | | | | — | | | | (1.79 | ) | | | (1.79 | ) | | | 26.45 | |
2012 | | | 20.04 | | | | (0.26 | ) | | | 1.33 | | | | 1.07 | | | | | | — | | | | (0.30 | ) | | | (0.30 | ) | | | 20.81 | |
2011 | | | 18.74 | | | | (0.29 | ) | | | 1.59 | | | | 1.30 | | | | | | — | | | | — | | | | — | | | | 20.04 | |
Class I (8/95) | | | | | | | | | | | | | | | | | | | | | | | | | | | | | | | |
2015 | | | 27.26 | | | | (0.19 | ) | | | 0.39 | | | | 0.20 | | | | | | — | | | | (2.95 | ) | | | (2.95 | ) | | | 24.51 | |
2014 | | | 29.68 | | | | (0.23 | ) | | | 2.62 | | | | 2.39 | | | | | | — | | | | (4.81 | ) | | | (4.81 | ) | | | 27.26 | |
2013 | | | 23.03 | | | | (0.21 | ) | | | 8.65 | | | | 8.44 | | | | | | — | | | | (1.79 | ) | | | (1.79 | ) | | | 29.68 | |
2012 | | | 22.04 | | | | (0.17 | ) | | | 1.46 | | | | 1.29 | | | | | | — | | | | (0.30 | ) | | | (0.30 | ) | | | 23.03 | |
2011 | | | 20.51 | | | | (0.19 | ) | | | 1.72 | | | | 1.53 | | | | | | — | | | | — | | | | — | | | | 22.04 | |
| | | | | | | | | | | | | | | | | | | | | | | | | | | | | | |
| | | | Ratios/Supplemental Data | |
| | | | | | | | | Ratios to Average
Net Assets Before
Waiver/Reimbursement | | | | | Ratios to Average
Net Assets After
Waiver/Reimbursement(c) | | | | |
| | | | | | | | |
Total
Return(b) | | | Ending
Net
Assets
(000) | | | | | Expenses | | | Net
Investment
Income
(Loss) | | | | | Expenses | | | Net
Investment
Income
(Loss) | | | Portfolio
Turnover
Rate(d) | |
| | | | | | | | | | | | | | | | | | | | | | | | | | | | | | |
| | 0.72 | % | | $ | 33,922 | | | | | | 1.50 | % | | | (1.00 | )% | | | | | 1.47 | % | | | (0.97 | )% | | | 128 | % |
| | 9.07 | | | | 38,990 | | | | | | 1.57 | | | | (1.19 | ) | | | | | 1.47 | | | | (1.09 | ) | | | 125 | |
| | 39.22 | | | | 40,965 | | | | | | 1.55 | | | | (1.17 | ) | | | | | 1.46 | | | | (1.09 | ) | | | 119 | |
| | 5.73 | | | | 35,306 | | | | | | 1.72 | | | | (1.21 | ) | | | | | 1.47 | | | | (0.97 | ) | | | 118 | |
| | 7.20 | | | | 36,188 | | | | | | 1.54 | | | | (1.19 | ) | | | | | 1.47 | | | | (1.12 | ) | | | 118 | |
| | | | | | | | | | | | | | | | | | | | | | | | | | | | | | |
| | (0.03 | ) | | | 2,278 | | | | | | 2.25 | | | | (1.75 | ) | | | | | 2.22 | | | | (1.72 | ) | | | 128 | |
| | 8.26 | | | | 2,250 | | | | | | 2.32 | | | | (1.94 | ) | | | | | 2.22 | | | | (1.84 | ) | | | 125 | |
| | 38.17 | | | | 2,350 | | | | | | 2.30 | | | | (1.91 | ) | | | | | 2.22 | | | | (1.83 | ) | | | 119 | |
| | 4.93 | | | | 1,568 | | | | | | 2.46 | | �� | | (1.96 | ) | | | | | 2.22 | | | | (1.72 | ) | | | 118 | |
| | 6.41 | | | | 1,546 | | | | | | 2.29 | | | | (1.94 | ) | | | | | 2.22 | | | | (1.87 | ) | | | 118 | |
| | | | | | | | | | | | | | | | | | | | | | | | | | | | | | |
| | 0.50 | | | | 1,439 | | | | | | 1.75 | | | | (1.26 | ) | | | | | 1.72 | | | | (1.23 | ) | | | 128 | |
| | 8.77 | | | | 2,077 | | | | | | 1.82 | | | | (1.44 | ) | | | | | 1.72 | | | | (1.34 | ) | | | 125 | |
| | 38.86 | | | | 1,941 | | | | | | 1.80 | | | | (1.40 | ) | | | | | 1.72 | | | | (1.32 | ) | | | 119 | |
| | 5.48 | | | | 2,395 | | | | | | 1.96 | | | | (1.46 | ) | | | | | 1.72 | | | | (1.22 | ) | | | 118 | |
| | 6.94 | | | | 2,334 | | | | | | 1.79 | | | | (1.44 | ) | | | | | 1.72 | | | | (1.37 | ) | | | 118 | |
| | | | | | | | | | | | | | | | | | | | | | | | | | | | | | |
| | 1.00 | | | | 62,403 | | | | | | 1.25 | | | | (0.75 | ) | | | | | 1.22 | | | | (0.71 | ) | | | 128 | |
| | 9.34 | | | | 62,887 | | | | | | 1.32 | | | | (0.94 | ) | | | | | 1.22 | | | | (0.84 | ) | | | 125 | |
| | 39.55 | | | | 48,141 | | | | | | 1.30 | | | | (0.90 | ) | | | | | 1.22 | | | | (0.82 | ) | | | 119 | |
| | 5.99 | | | | 48,111 | | | | | | 1.47 | | | | (0.96 | ) | | | | | 1.22 | | | | (0.72 | ) | | | 118 | |
| | 7.46 | | | | 63,866 | | | | | | 1.31 | | | | (0.94 | ) | | | | | 1.22 | | | | (0.84 | ) | | | 118 | |
| (a) | Per share Net Investment Income (Loss) is calculated using the average daily shares method. | |
| (b) | Total return is the combination of changes in NAV without any sales charge, reinvested dividend income at NAV and reinvested capital gains distributions at NAV, if any. Total returns are not annualized. | |
| (c) | After fee waiver and/or expense reimbursement from the Adviser, where applicable. | |
| (d) | Portfolio Turnover Rate is calculated based on the lesser of long-term purchases or sales (as disclosed in Note 5 – Investment Transactions) divided by the average long-term market value during the period. | |
See accompanying notes to financial statements.
Notes to
Financial Statements
1. General Information and Significant Accounting Policies
General Information
Trust and Fund Information
Nuveen Investment Funds, Inc. (the “Trust”), is an open-end management investment company registered under the Investment Company Act of 1940, as amended. The Trust is comprised of Nuveen Large Cap Growth Opportunities Fund (“Large Cap Growth Opportunities”), Nuveen Mid Cap Growth Opportunities Fund (“Mid Cap Growth Opportunities”) and Nuveen Small Cap Growth Opportunities Fund (“Small Cap Growth Opportunities”), (each a “Fund” and collectively, the “Funds”), as diversified funds, among others. The Trust was incorporated in the State of Maryland on August 20, 1987.
The end of the reporting period for the Funds is October 31, 2015, and the period covered by these Notes to Financial Statements is the fiscal year ended October 31, 2015 (the “current fiscal period”).
Investment Adviser
The Funds’ investment adviser is Nuveen Fund Advisors, LLC (the “Adviser”), a wholly-owned subsidiary of Nuveen Investments, Inc. (“Nuveen”). The Adviser is responsible for each Fund’s overall investment strategy and asset allocation decisions. The Adviser has entered into sub-advisory agreements with Nuveen Asset Management, LLC (the “Sub-Adviser”), a subsidiary of the Adviser, under which the Sub-Adviser manages the investment portfolios of the Funds.
Investment Objectives and Principal Investment Strategies
Large Cap Growth Opportunities’ investment objective is long-term growth of capital. Under normal market conditions, the Fund invests at least 80% of the sum of its net assets and the amount of any borrowings for investment purposes, in common stocks of large-capitalization companies, defined as companies that have market capitalizations of $5 billion or greater.
Mid Cap Growth Opportunities’ investment objective is capital appreciation. Under normal market conditions, the Fund invests at least 80% of the sum of its net assets and the amount of any borrowings for investment purposes, in common stocks of mid-capitalization companies. Mid-capitalization companies are defined as companies that have market capitalizations within the market capitalization range of the companies in the Russell Midcap® Index on the last business day of the month in which its most recent reconstitution was completed. Reconstitution of the index currently is completed in June of each year. On June 30, 2014, the range was $1.6 billion to $29.9 billion.
Small Cap Growth Opportunities’ investment objective is growth of capital. Under normal market conditions, the Fund invests at least 80% of the sum of its net assets and the amount of any borrowings for investment purposes, in common stocks of small-capitalization companies. Small capitalization companies are defined as companies that have market capitalizations within the market capitalization range of the companies in the Russell 2000 Index on the last business day of the month in which its most recent reconstitution was completed. Reconstitution of the index currently is completed in June of each year. On June 30, 2014, the range was $143 million to $4.51 billion.
Each Fund may invest up to 15% of its total assets in non-dollar denominated equity securities of non-U.S. issuers. In addition, each Fund may invest up to 25% of its assets, collectively, in non-dollar denominated equity securities of non-U.S. issuers and in dollar-denominated equity securities of non-U.S. issuers that are either listed on a U.S. stock exchange or represented by depositary receipts that may or may not be sponsored by a domestic bank. Up to 15% of each Fund’s total assets may be invested in equity securities of emerging market issuers. Each Fund may utilize options, futures contracts, options on futures contracts and forward foreign currency exchanges contracts (“derivatives”). Each Fund may use these derivatives to manage market or business risk, enhance each Fund’s return, or hedge against adverse movements in currency exchange rates.
The Funds’ most recent prospectus provides further descriptions of each Fund’s investment objective, principal investment strategies and principal risks.
Significant Accounting Policies
Each Fund is an investment company and follows accounting and reporting guidance under Financial Accounting Standards Board (FASB) Accounting Standards Codification (ASC) Topic 946 “Financial Services-Investment Companies.” The following is a summary of significant accounting policies followed by the Funds in the preparation of their financial statements in accordance with accounting principles generally accepted in the United States of America (“U.S. GAAP”).
Investment Transactions
Investment transactions are recorded on a trade date basis. Realized gains and losses from investment transactions are determined on the specific identification method, which is the same basis used for federal income tax purposes.
Investment Income
Dividend income is recorded on the ex-dividend date or, for foreign securities, when information is available. Interest income is recorded on an accrual basis. Securities lending income is comprised of fees earned from borrowers and income earned on cash collateral investments, net of lending agent fees.
Professional Fees
Professional fees presented on the Statement of Operations consist of legal fees incurred in the normal course of operations, audit fees, tax consulting fees and, in some cases, workout expenditures. Workout expenditures are incurred in an attempt to protect or enhance an investment or to pursue other claims or legal actions on behalf of Fund shareholders. If a refund is received for workout expenditures paid in a prior reporting period, such amounts will be recognized as “Legal fee refund” on the Statement of Operations.
Dividends and Distributions to Shareholders
Dividends from net investment income are declared and distributed to shareholders annually. Net realized capital gains from investment transactions, if any, are declared and distributed to shareholders at least annually. Furthermore, capital gains are distributed only to the extent they exceed available capital loss carryforwards.
Distributions to shareholders are recorded on the ex-dividend date. The amount and timing of distributions are determined in accordance with federal income tax regulations, which may differ from U.S. GAAP.
Share Classes and Sales Charges
Class A Shares are generally sold with an up-front sales charge and incur a 0.25% annual 12b-1 service fee. Class A Share purchases of $1 million or more are sold at net asset value (“NAV”) without an up-front sales charge but may be subject to a contingent deferred sales charge (“CDSC”) if redeemed within twelve months of purchase. Class C Shares are sold without an up-front sales charge but incur a 0.75% annual 12b-1 distribution fee and a 0.25% annual 12b-1 service fee. Class C Shares are subject to a CDSC of 1% if redeemed within twelve months of purchase. Class R3 Shares are sold without an up-front sales charge but incur a 0.25% annual 12b-1 distribution fee and a 0.25% annual 12b-1 service fee. Class R6 Shares and Class I Shares are not subject to any sales charge or 12b-1 distribution or service fees.
Multiclass Operations and Allocations
Income and expenses of the Funds that are not directly attributable to a specific class of shares are prorated among the classes based on the relative net assets of each class. Expenses directly attributable to a class of shares are recorded to the specific class. Currently, the only expenses that are allocated on a class-specific basis are 12b-1 distribution and service fees.
Sub-transfer agent fees, which are recognized as a component of “Shareholder servicing agent fees” on the Statement of Operations, are not charged to Class R6 Shares and are prorated among the other classes based on their relative net assets.
Realized and unrealized capital gains and losses of the Funds are prorated among the classes based on the relative net assets of each class.
Indemnifications
Under the Trust’s organizational documents, its officers and directors are indemnified against certain liabilities arising out of the performance of their duties to the Trust. In addition, in the normal course of business, the Trust enters into contracts that provide general indemnifications to other parties. The Trust’s maximum exposure under these arrangements is unknown as this would involve future claims that may be made against the Trust that have not yet occurred. However, the Trust has not had prior claims or losses pursuant to these contracts and expects the risk of loss to be remote.
Netting Agreements
In the ordinary course of business, the Funds may enter into transactions subject to enforceable International Swaps and Derivative Association, Inc. (“ISDA”) master agreements or other similar arrangements (“netting agreements”). Generally, the right to offset in netting agreements allows each Fund to offset certain securities and derivatives with a specific counterparty with any collateral received or delivered to that counterparty based on the terms of the agreements. Generally, each Fund manages its cash collateral and securities collateral on a counterparty basis.
The Funds’ investments subject to netting agreements as of the end of the reporting period, if any, are further described in Note 3 – Portfolio Securities and Investments in Derivatives.
Use of Estimates
The preparation of financial statements in conformity with U.S. GAAP requires management to make estimates and assumptions that affect the reported amounts of assets and liabilities at the date of the financial statements and the reported amounts of increases and decreases in net assets from operations during the reporting period. Actual results may differ from those estimates.
Notes to Financial Statements (continued)
2. Investment Valuation and Fair Value Measurements
The fair valuation input levels as described below are for fair value measurement purposes.
Fair value is defined as the price that would be receive upon selling an investment or transferring a liability in an orderly transaction to an independent buyer in the principal or most advantageous market for the investment. A three-tier hierarchy is used to maximize the use of observable market data and minimize the use of unobservable inputs and to establish classification of fair value measurements for disclosure purposes. Observable inputs reflect the assumptions market participants would use in pricing the asset or liability. Observable inputs are based on market data obtained from sources independent of the reporting entity. Unobservable inputs reflect the reporting entity’s own assumptions about the assumptions market participants would use in pricing the asset or liability. Unobservable inputs are based on the best information available in the circumstances. The following is a summary of the three-tiered hierarchy of valuation input levels.
| | |
| Level 1 – | | Inputs are unadjusted and prices are determined using quoted prices in active markets for identical securities. |
| Level 2 – | | Prices are determined using other significant observable inputs (including quoted prices for similar securities, interest rates, prepayment speeds, credit risk, etc.). |
| Level 3 – | | Prices are determined using significant unobservable inputs (including management’s assumptions in determining the fair value of investments). |
Common stocks and other equity-type securities are valued at the last sales price on the securities exchange on which such securities are primarily traded and are generally classified as Level 1. Securities primarily traded on the NASDAQ National Market (“NASDAQ”) are valued at the NASDAQ Official Closing Price and are generally classified as Level 1. However, securities traded on a securities exchange or NASDAQ for which there were no transactions on a given day or securities not listed on a securities exchange or NASDAQ are valued at the quoted bid price and are generally classified as Level 2. Prices of certain American Depositary Receipts (“ADR”) held by the Funds that trade in the United States are valued based on the last traded price, official closing price or the most recent bid price of the underlying non-U.S.-traded stock, adjusted as appropriate for the underlying-to-ADR conversion ratio and foreign exchange rate, and from time-to-time may also be adjusted further to take into account material events that may take place after the close of the local non-U.S. market but before the close of the New York Stock Exchange, which may represent a transfer from a Level 1 to a Level 2 security.
Investments in investment companies are valued at their respective NAVs on the valuation date and are generally classified as Level 1.
Certain securities may not be able to be priced by the pre-established pricing methods as described above. Such securities may be valued by the Funds’ Board of Directors (the “Board”) and/or its appointee at fair value. These securities generally include, but are not limited to, restricted securities (securities which may not be publicly sold without registration under the Securities Act of 1933, as amended) for which a pricing service is unable to provide a market price; securities whose trading has been formally suspended; debt securities that have gone into default and for which there is no current market quotation; a security whose market price is not available from a pre-established pricing source; a security with respect to which an event has occurred that is likely to materially affect the value of the security after the market has closed but before the calculation of a Fund’s NAV (as may be the case in non-U.S. markets on which the security is primarily traded) or make it difficult or impossible to obtain a reliable market quotation; and a security whose price, as provided by the pricing service, is not deemed to reflect the security’s fair value. As a general principle, the fair value of a security would appear to be the amount that the owner might reasonably expect to receive for it in a current sale. A variety of factors may be considered in determining the fair value of such securities, which may include consideration of the following: yields or prices of investments of comparable quality, type of issue, coupon, maturity and rating, market quotes or indications of value from security dealers, evaluations of anticipated cash flows or collateral, general market conditions and other information and analysis, including the obligor’s credit characteristics considered relevant. These securities are generally classified as Level 2 or Level 3 depending on the priority of the significant inputs. Regardless of the method employed to value a particular security, all valuations are subject to review by the Board and/or its appointee.
The inputs or methodologies used for valuing securities are not an indication of the risks associated with investing in those securities. The following is a summary of each Fund’s fair value measurements as of the end of the reporting period:
| | | | | | | | | | | | | | | | |
| Large Cap Growth Opportunities | | Level 1 | | | Level 2 | | | Level 3 | | | Total | |
| Long-Term Investments*: | | | | | | | | | | | | | | | | |
Common Stocks | | $ | 466,942,884 | | | $ | — | | | $ | — | | | $ | 466,942,884 | |
| Investments Purchased with Collateral from Securities Lending | | | 119,637,888 | | | | — | | | | — | | | | 119,637,888 | |
| Short-Term Investments: | | | | | | | | | | | | | | | | |
Money Market Funds | | | 687,481 | | | | — | | | | — | | | | 687,481 | |
| Total | | $ | 587,268,253 | | | $ | — | | | $ | — | | | $ | 587,268,253 | |
| | | | |
| Mid Cap Growth Opportunities | | | | | | | | | | | | |
| Long-Term Investments*: | | | | | | | | | | | | | | | | |
Common Stocks | | $ | 1,195,384,985 | | | $ | — | | | $ | — | | | $ | 1,195,384,985 | |
| Investments Purchased with Collateral from Securities Lending | | | 366,889,649 | | | | — | | | | — | | | | 366,889,649 | |
| Short-Term Investments: | | | | | | | | | | | | | | | | |
Money Market Funds | | | 8,891,795 | | | | — | | | | — | | | | 8,891,795 | |
| Total | | $ | 1,571,166,429 | | | $ | — | | | $ | — | | | $ | 1,571,166,429 | |
| | | | | | | | | | | | | | | | |
| Small Cap Growth Opportunities | | Level 1 | | | Level 2 | | | Level 3 | | | Total | |
| Long-Term Investments*: | | | | | | | | | | | | | | | | |
Common Stocks | | $ | 95,769,012 | | | $ | — | | | $ | — | ** | | $ | 95,769,012 | |
| Investments Purchased with Collateral from Securities Lending | | | 31,278,227 | | | | — | | | | — | | | | 31,278,227 | |
| Short-Term Investments: | | | | | | | | | | | | | | | | |
Money Market Funds | | | 3,174,488 | | | | — | | | | — | | | | 3,174,488 | |
| Total | | $ | 130,221,727 | | | $ | — | | | $ | — | | | $ | 130,221,727 | |
| * | Refer to the Fund’s Portfolio of Investments for industry classifications. |
| ** | Value equals zero as of the end of the reporting period. Refer to the Fund’s Portfolio of Investments for security classified as Level 3. |
The Board is responsible for the valuation process and has appointed the oversight of the daily valuation process to the Adviser’s Valuation Committee. The Valuation Committee, pursuant to the valuation policies and procedures adopted by the Board is responsible for making fair value determinations, evaluating the effectiveness of the Funds’ pricing policies and reporting to the Board. The Valuation Committee is aided in its efforts by the Adviser’s dedicated Securities Valuation Team, which is responsible for administering the daily valuation process and applying fair value methodologies as approved by the Valuation Committee. When determining the reliability of independent pricing services for investments owned by the Funds, the Valuation Committee, among other things, conducts due diligence reviews of the pricing services and monitors the quality of security prices received through various testing reports conducted by the Securities Valuation Team.
The Valuation Committee will consider pricing methodologies it deems relevant and appropriate when making a fair value determination, based on the facts and circumstances specific to the portfolio instrument. Fair value determinations generally will be derived as follows, using public or private market information:
| | (i) | If available, fair value determinations shall be derived by extrapolating from recent transactions or quoted prices for identical or comparable securities. |
| | (ii) | If such information is not available, an analytical valuation methodology may be used based on other available information including, but not limited to: analyst appraisals, research reports, corporate action information, issuer financial statements and shelf registration statements. Such analytical valuation methodologies may include, but are not limited to: multiple of earnings, discount from market value of a similar freely- traded security, discounted cash flow analysis, book value or a multiple thereof, risk premium/yield analysis, yield to maturity and/or fundamental investment analysis. |
The purchase price of a portfolio instrument will be used to fair value the instrument only if no other valuation methodology is available or deemed appropriate, and it is determined that the purchase price fairly reflects the instrument’s current value.
For each portfolio security that has been fair valued pursuant to the policies adopted by the Board, the fair value price is compared against the last available and next available market quotations. The Valuation Committee reviews the results of such testing and fair valuation occurrences are reported to the Board.
3. Portfolio Securities and Investments in Derivatives
Portfolio Securities
Securities Lending
In order to generate additional income, each Fund may lend securities representing up to one-third of the value of its total assets (which includes collateral for securities on loan) to broker-dealers, banks or other institutions. When loaning securities, each Fund retains the benefits of owning the securities, including the economic equivalent of dividends or interest generated by the security. Each Fund also has the ability to recall the securities on loan at any time.
Each Fund’s policy is to receive, at the inception of a loan, cash collateral equal to at least 102% of the value of securities loaned, which is recognized as “Payable for collateral from securities lending program” on the Statement of Assets and Liabilities. Collateral for securities on loan is invested in a money market fund, which is recognized as “Investments purchased with collateral from securities lending, at value” on the Statement of Assets and Liabilities. The market value of the securities loaned is determined at the close of each business day in order to determine the adequacy of the collateral. If the value of the securities on loan increases such that the level of collateralization falls below 100%, additional collateral is received from the borrower on the next business day, which is recognized as “Due from broker” on the Statement of Assets and Liabilities.
Securities out on loan are subject to termination at any time at the option of the borrower or the Fund. Upon termination, the borrower is required to return to the Fund securities identical to the securities loaned. Generally, in the event the borrower defaults on its obligation to return the loaned securities, the Fund has the right to use the collateral to acquire identical securities. In the event the Fund is delayed or prevented from exercising its right to dispose of the collateral, there may be a loss to the Fund. Under each Fund’s securities lending agreement, however, the securities lending agent has indemnified the Fund against losses resulting from borrower default, except to the extent that those losses result from a decrease in the value of the collateral due to its investment by the Fund. The Fund bears the risk of loss with respect to the investment of collateral.
Notes to Financial Statements (continued)
The Funds’ custodian, U.S. Bank National Association, serves as its securities lending agent. Each Fund pays the custodian a fee based on its proportional share of the custodian’s expense of operating its securities lending program. Income earned from the securities lending program is paid to the Fund, net of any fees paid. Income from securities lending, net of fees paid, is recognized as “Securities lending income, net” on the Statement of Operations.
The following table presents the securities out on loan for the Funds, and the collateral delivered related to those securities, as of the end of the reporting period.
| | | | | | | | | | | | | | |
| Fund | | Asset Class out on Loan | | Long-Term
Investments, at Value | | | Collateral
Pledged (From)
Counterparty* | | | Net
Exposure | |
| Large Cap Growth Opportunities | | Common Stocks | | $ | 115,998,419 | | | $ | (115,998,419 | ) | | $ | — | |
| Mid Cap Growth Opportunities | | Common Stocks | | | 355,024,388 | | | | (355,024,388 | ) | | | — | |
| Small Cap Growth Opportunities | | Common Stocks | | | 30,044,611 | | | | (30,044,611 | ) | | | — | |
| * | As of the end of the reporting period, the value of the collateral pledged from the counterparty exceeded the value of the securities out on loan. Refer to the Fund’s Portfolio of Investments for details on securities out on loan. |
Securities lending fees paid by each Fund during the current fiscal period were as follows:
| | | | | | | | | | | | |
| | | Large Cap
Growth
Opportunities | | | Mid Cap
Growth
Opportunities | | | Small Cap
Growth
Opportunities | |
| Securities lending fees paid | | $ | 6,498 | | | $ | 48,567 | | | $ | 15,865 | |
Investments in Derivatives
Each Fund is authorized to invest in certain derivative instruments. The Funds record derivative instruments at fair value, with changes in fair value recognized on the Statement of Operations, when applicable. Even though the Funds’ investments in derivatives may represent economic hedges, they are not considered to be hedge transactions for financial reporting purposes.
Although the Funds are authorized to invest in derivative instruments, and may do so in the future, they did not make any such investments during the current fiscal period.
Market and Counterparty Credit Risk
In the normal course of business each Fund may invest in financial instruments and enter into financial transactions where risk of potential loss exists due to changes in the market (market risk) or failure of the other party to the transaction to perform (counterparty credit risk). The potential loss could exceed the value of the financial assets recorded on the financial statements. Financial assets, which potentially expose each Fund to counterparty credit risk, consist principally of cash due from counterparties on forward, option and swap transactions, when applicable. The extent of each Fund’s exposure to counterparty credit risk in respect to these financial assets approximates their carrying value as recorded on the Statement of Assets and Liabilities.
Each Fund helps manage counterparty credit risk by entering into agreements only with counterparties the Adviser believes have the financial resources to honor their obligations and by having the Adviser monitor the financial stability of the counterparties. Additionally, counterparties may be required to pledge collateral daily (based on the daily valuation of the financial asset) on behalf of each Fund with a value approximately equal to the amount of any unrealized gain above a pre-determined threshold. Reciprocally, when each Fund has an unrealized loss, the Funds have instructed the custodian to pledge assets of the Funds as collateral with a value approximately equal to the amount of the unrealized loss above a pre-determined threshold. Collateral pledges are monitored and subsequently adjusted if and when the valuations fluctuate, either up or down, by at least the pre-determined threshold amount.
4. Fund Shares
Transactions in Fund shares during the current and prior fiscal period were as follows:
| | | | | | | | | | | | | | | | |
| | | Year Ended
10/31/15 | | | Year Ended
10/31/14 | |
| Large Cap Growth Opportunities | | Shares | | | Amount | | | Shares | | | Amount | |
| Shares sold: | | | | | | | | | | | | | | | | |
Class A | | | 293,385 | | | $ | 10,733,704 | | | | 603,581 | | | $ | 23,531,392 | |
Class A – automatic conversion of Class B Shares | | | — | | | | — | | | | 20,354 | | | | 798,031 | |
Class B – exchanges | | | — | | | | — | | | | 122 | | | | 4,030 | |
Class C | | | 95,594 | | | | 2,942,818 | | | | 105,893 | | | | 3,662,076 | |
Class R3 | | | 62,194 | | | | 2,236,858 | | | | 42,545 | | | | 1,613,281 | |
Class R6 | | | 23,033 | | | | 865,090 | | | | 10,988 | | | | 448,404 | |
Class I | | | 687,823 | | | | 26,466,772 | | | | 1,527,478 | | | | 64,722,066 | |
| Shares issued to shareholders due to reinvestment of distributions: | | | | | | | | | | | | | | | | |
Class A | | | 686,565 | | | | 23,054,856 | | | | 630,386 | | | | 23,444,051 | |
Class B | | | — | | | | — | | | | 5,225 | | | | 169,119 | |
Class C | | | 63,421 | | | | 1,842,376 | | | | 49,147 | | | | 1,634,630 | |
Class R3 | | | 45,621 | | | | 1,479,480 | | | | 46,697 | | | | 1,691,378 | |
Class R6 | | | 87,371 | | | | 3,142,735 | | | | 99,034 | | | | 3,887,080 | |
Class I | | | 947,393 | | | | 34,001,959 | | | | 880,547 | | | | 34,535,070 | |
| | | | 2,992,400 | | | | 106,766,648 | | | | 4,021,997 | | | | 160,140,608 | |
| Shares redeemed: | | | | | | | | | | | | | | | | |
Class A | | | (1,400,857 | ) | | | (51,235,903 | )�� | | | (1,532,083 | ) | | | (61,260,778 | ) |
Class B | | | — | | | | — | | | | (9,425 | ) | | | (320,905 | ) |
Class B – automatic conversion of Class A Shares | | | — | | | | — | | | | (23,446 | ) | | | (798,031 | ) |
Class C | | | (109,400 | ) | | | (3,417,208 | ) | | | (132,577 | ) | | | (4,597,108 | ) |
Class R3 | | | (108,635 | ) | | | (3,786,733 | ) | | | (134,971 | ) | | | (5,146,614 | ) |
Class R6 | | | (177,680 | ) | | | (7,112,374 | ) | | | (220,804 | ) | | | (9,162,431 | ) |
Class I | | | (2,760,177 | ) | | | (105,630,736 | ) | | | (2,549,398 | ) | | | (106,278,357 | ) |
| | | | (4,556,749 | ) | | | (171,182,954 | ) | | | (4,602,704 | ) | | | (187,564,224 | ) |
| Net increase (decrease) | | | (1,564,349 | ) | | $ | (64,416,306 | ) | | | (580,707 | ) | | $ | (27,423,616 | ) |
| | | | | | | | | | | | | | | | |
| | | Year Ended
10/31/15 | | | Year Ended
10/31/14 | |
| Mid Cap Growth Opportunities | | Shares | | | Amount | | | Shares | | | Amount | |
| Shares sold: | | | | | | | | | | | | | | | | |
Class A | | | 1,685,601 | | | $ | 71,861,448 | | | | 1,725,590 | | | $ | 79,814,790 | |
Class A – automatic conversion of Class B Shares | | | — | | | | — | | | | 27,325 | | | | 1,292,511 | |
Class B – exchanges | | | — | | | | — | | | | 416 | | | | 15,180 | |
Class C | | | 96,491 | | | | 3,326,130 | | | | 117,355 | | | | 4,727,677 | |
Class R3 | | | 483,013 | | | | 19,544,907 | | | | 845,680 | | | | 36,738,635 | |
Class R6 | | | 714,512 | | | | 34,158,123 | | | | 231,584 | | | | 11,883,490 | |
Class I | | | 1,868,955 | | | | 90,743,962 | | | | 2,665,769 | | | | 137,193,738 | |
| Shares issued to shareholders due to reinvestment of distributions: | | | | | | | | | | | | | | | | |
Class A | | | 1,578,073 | | | | 61,923,572 | | | | 1,436,404 | | | | 62,339,930 | |
Class B | | | — | | | | — | | | | 9,968 | | | | 347,701 | |
Class C | | | 126,736 | | | | 4,099,904 | | | | 103,317 | | | | 3,860,963 | |
Class R3 | | | 302,689 | | | | 11,344,768 | | | | 208,302 | | | | 8,725,765 | |
Class R6 | | | 53,391 | | | | 2,398,848 | | | | 81,352 | | | | 3,939,057 | |
Class I | | | 2,256,936 | | | | 101,110,776 | | | | 2,040,943 | | | | 98,720,400 | |
| | | | 9,166,397 | | | | 400,512,438 | | | | 9,494,005 | | | | 449,599,837 | |
| Shares redeemed: | | | | | | | | | | | | | | | | |
Class A | | | (2,127,432 | ) | | | (89,836,493 | ) | | | (2,340,479 | ) | | | (108,208,270 | ) |
Class B | | | — | | | | — | | | | (20,766 | ) | | | (788,633 | ) |
Class B – automatic conversion of Class A Shares | | | — | | | | — | | | | (34,079 | ) | | | (1,292,511 | ) |
Class C | | | (154,133 | ) | | | (5,431,709 | ) | | | (114,363 | ) | | | (4,562,182 | ) |
Class R3 | | | (778,132 | ) | | | (30,838,598 | ) | | | (603,977 | ) | | | (26,215,601 | ) |
Class R6 | | | (408,175 | ) | | | (20,301,930 | ) | | | (471,756 | ) | | | (24,494,079 | ) |
Class I | | | (3,818,895 | ) | | | (184,260,176 | ) | | | (3,296,639 | ) | | | (170,232,575 | ) |
| | | | (7,286,767 | ) | | | (330,668,906 | ) | | | (6,882,059 | ) | | | (335,793,851 | ) |
| Net increase (decrease) | | | 1,879,630 | | | $ | 69,843,532 | | | | 2,611,946 | | | $ | 113,805,986 | |
Notes to Financial Statements (continued)
| | | | | | | | | | | | | | | | |
| | | Year Ended
10/31/15 | | | Year Ended
10/31/14 | |
| Small Cap Growth Opportunities | | Shares | | | Amount | | | Shares | | | Amount | |
| Shares sold: | | | | | | | | | | | | | | | | |
Class A | | | 74,804 | | | $ | 1,732,493 | | | | 123,036 | | | $ | 3,003,828 | |
Class C | | | 39,382 | | | | 746,413 | | | | 17,256 | | | | 366,709 | |
Class R3 | | | 31,859 | | | | 697,321 | | | | 52,706 | | | | 1,203,519 | |
Class I | | | 483,063 | | | | 12,855,556 | | | | 1,084,551 | | | | 28,651,810 | |
| Shares issued to shareholders due to reinvestment of distributions: | | | | | | | | | | | | | | | | |
Class A | | | 204,286 | | | | 4,310,437 | | | | 310,819 | | | | 7,052,473 | |
Class B | | | — | | | | — | | | | — | | | | — | |
Class C | | | 17,461 | | | | 307,657 | | | | 23,622 | | | | 461,582 | |
Class R3 | | | 12,106 | | | | 245,744 | | | | 16,212 | | | | 356,349 | |
Class I | | | 189,325 | | | | 4,528,679 | | | | 139,061 | | | | 3,515,454 | |
| | | | 1,052,286 | | | | 25,424,300 | | | | 1,767,263 | | | | 44,611,724 | |
| Shares redeemed: | | | | | | | | | | | | | | | | |
Class A | | | (303,868 | ) | | | (7,042,087 | ) | | | (346,545 | ) | | | (8,297,779 | ) |
Class C | | | (37,225 | ) | | | (712,570 | ) | | | (30,854 | ) | | | (633,117 | ) |
Class R3 | | | (62,478 | ) | | | (1,388,398 | ) | | | (54,292 | ) | | | (1,226,457 | ) |
Class I | | | (432,828 | ) | | | (11,244,666 | ) | | | (538,887 | ) | | | (14,461,931 | ) |
| | | | (836,399 | ) | | | (20,387,721 | ) | | | (970,578 | ) | | | (24,619,284 | ) |
| Net increase (decrease) | | | 215,887 | | | $ | 5,036,579 | | | | 796,685 | | | $ | 19,992,440 | |
5. Investment Transactions
Long-term purchases and sales (excluding investments purchased with collateral from securities lending) during the current fiscal period were as follows:
| | | | | | | | | | | | |
| | | Large Cap
Growth
Opportunities | | | Mid Cap
Growth
Opportunities | | | Small Cap
Growth
Opportunities | |
| Purchases | | $ | 387,587,704 | | | $ | 1,499,543,844 | | | $ | 131,184,275 | |
| Sales | | | 538,656,264 | | | | 1,642,704,192 | | | | 141,281,687 | |
6. Income Tax Information
Each Fund is a separate taxpayer for federal income tax purposes. Each Fund intends to distribute substantially all of its net investment income and net capital gains to shareholders and to otherwise comply with the requirements of Subchapter M of the Internal Revenue Code applicable to regulated investment companies. Therefore, no federal income tax provision is required.
For all open tax years and all major taxing jurisdictions, management of the Funds has concluded that there are no significant uncertain tax positions that would require recognition in the financial statements. Open tax years are those that are open for examination by taxing authorities (i.e., generally the last four tax year ends and the interim tax period since then). Furthermore, management of the Funds is also not aware of any tax positions for which it is reasonably possible that the total amounts of unrecognized tax benefits will significantly change in the next twelve months.
The following information is presented on an income tax basis. Differences between amounts for financial statement and federal income tax purposes are primarily due to timing differences in recognizing certain gains and losses on investment transactions. To the extent that differences arise that are permanent in nature, such amounts are reclassified within the capital accounts as detailed below. Temporary differences do not require reclassification. Temporary and permanent differences do not impact the NAVs of the Funds.
As of October 31, 2015, the cost and unrealized appreciation (depreciation) of investments, as determined on a federal income tax basis, were as follows:
| | | | | | | | | | | | |
| | | Large Cap
Growth
Opportunities | | | Mid Cap
Growth
Opportunities | | | Small Cap
Growth
Opportunities | |
| Cost of investments | | $ | 444,752,777 | | | $ | 1,391,101,873 | | | $ | 122,711,230 | |
| Gross unrealized: | | | | | | | | | | | | |
Appreciation | | $ | 151,575,564 | | | $ | 204,253,299 | | | $ | 12,848,631 | |
Depreciation | | | (9,060,088 | ) | | | (24,188,743 | ) | | | (5,338,134 | ) |
| Net unrealized appreciation (depreciation) of investments | | $ | 142,515,476 | | | $ | 180,064,556 | | | $ | 7,510,497 | |
Permanent differences, primarily due to net operating losses, tax equalization, deemed dividend due to corporate actions, investment from partnerships and investments in passive foreign investment companies, resulted in reclassifications among the Funds’ components of net assets as of October 31, 2015, the Funds’ tax year end, as follows:
| | | | | | | | | | | | |
| | | Large Cap
Growth
Opportunities | | | Mid Cap
Growth
Opportunities | | | Small Cap
Growth
Opportunities | |
| Capital paid-in | | $ | 518,465 | | | $ | 5,046,667 | | | $ | (11 | ) |
| Undistributed (Over-distribution of) net investment income | | | 5,631,740 | | | | 869,455 | | | | 884,764 | |
| Accumulated net realized gain (loss) | | | (6,150,205 | ) | | | (5,916,122 | ) | | | (884,753 | ) |
The tax components of undistributed net ordinary income and net long-term capital gains as of October 31, 2015, the Funds’ tax year end, were as follows:
| | | | | | | | | | | | |
| | | Large Cap
Growth
Opportunities | | | Mid Cap
Growth
Opportunities | | | Small Cap
Growth
Opportunities | |
| Undistributed net ordinary income1 | | $ | 5,482,108 | | | $ | — | | | $ | 1,802,696 | |
| Undistributed net long-term capital gains | | | 78,262,468 | | | | 89,825,330 | | | | 6,714,307 | |
| 1 | Net ordinary income consists of net taxable income derived from dividends, interest and net short-term capital gains, if any. |
The tax character of distributions paid during the Funds’ tax years ended October 31, 2015 and October 31, 2014 was designated for purposes of the dividends paid deduction as follows:
| | | | | | | | | | | | |
| 2015 | | Large Cap
Growth
Opportunities | | | Mid Cap
Growth
Opportunities | | | Small Cap
Growth
Opportunities | |
| Distributions from net ordinary income1 | | $ | 4,222,148 | | | $ | 39,080,850 | | | $ | 3,544,233 | |
| Distributions from net long-term capital gains | | | 85,534,194 | | | | 166,176,599 | | | | 8,237,913 | |
| 2014 | | | | | | | | | |
| Distributions from net ordinary income1 | | $ | 10,044,140 | | | $ | 15,404,436 | | | $ | 7,438,985 | |
| Distributions from net long-term capital gains | | | 83,765,677 | | | | 191,720,023 | | | | 8,364,919 | |
| 1 | Net ordinary income consists of net taxable income derived from dividends, interest and net short-term capital gains, if any. |
As of October 31, 2015, the Funds’ tax year end, the Funds did not have any unused capital loss carryforwards available for federal income tax purposes to be applied against future capital gains, if any.
7. Management Fees and Other Transactions with Affiliates
Each Fund’s management fee compensates the Adviser for overall investment advisory and administrative services and general office facilities. The Sub-Adviser is compensated for its services to the Funds from the management fees paid to the Adviser.
Each Fund’s management fee consists of two components – a fund-level fee, based only on the amount of assets within each individual Fund, and a complex-level fee, based on the aggregate amount of all eligible fund assets managed by the Adviser. This pricing structure enables each Fund’s shareholders to benefit from growth in the assets within their respective Fund as well as from growth in the amount of complex-wide assets managed by the Adviser.
The annual Fund-level fee, payable monthly, for each Fund is calculated according to the following schedule:
| | | | | | | | | | | | |
| Average Daily Net Assets | | Large Cap
Growth
Opportunities | | | Mid Cap
Growth
Opportunities | | | Small Cap
Growth
Opportunities | |
| For the first $125 million | | | 0.6500 | % | | | 0.7000 | % | | | 0.8000 | % |
| For the next $125 million | | | 0.6375 | | | | 0.6875 | | | | 0.7875 | |
| For the next $250 million | | | 0.6250 | | | | 0.6750 | | | | 0.7750 | |
| For the next $500 million | | | 0.6125 | | | | 0.6625 | | | | 0.7625 | |
| For the next $1 billion | | | 0.6000 | | | | 0.6500 | | | | 0.7500 | |
| For net assets over $2 billion | | | 0.5750 | | | | 0.6250 | | | | 0.7250 | |
Notes to Financial Statements (continued)
The annual complex-level fee for each Fund, payable monthly, is determined by taking the complex-level fee rate, which is based on the aggregate amount of “eligible assets” of all Nuveen funds as set forth in the schedule below, and making, as appropriate, an upward adjustment to that rate based upon the percentage of the particular fund’s assets that are not “eligible assets.” The complex level fee schedule for each Fund is as follows:
| | | | |
| Complex-Level Asset Breakpoint Level* | | Effective Rate at Breakpoint Level | |
| $55 billion | | | 0.2000 | % |
| $56 billion | | | 0.1996 | |
| $57 billion | | | 0.1989 | |
| $60 billion | | | 0.1961 | |
| $63 billion | | | 0.1931 | |
| $66 billion | | | 0.1900 | |
| $71 billion | | | 0.1851 | |
| $76 billion | | | 0.1806 | |
| $80 billion | | | 0.1773 | |
| $91 billion | | | 0.1691 | |
| $125 billion | | | 0.1599 | |
| $200 billion | | | 0.1505 | |
| $250 billion | | | 0.1469 | |
| $300 billion | | | 0.1445 | |
| * | The complex-level fee is calculated based upon the aggregate daily “eligible assets” of all Nuveen funds. Eligible assets do not include assets attributable to investments in other Nuveen funds or assets in excess of $2 billion added to the Nuveen fund complex in connection with the Adviser’s assumption of the management of the former First American Funds effective January 1, 2011. Eligible assets include closed-end fund assets managed by the Adviser that are attributable to certain types of leverage. For these purposes, leverage includes the closed-end funds’ use of preferred stock and borrowings and certain investments in the residual interest certificates (also called inverse floating rate securities) in tender option bond (TOB) trusts, including the portion of assets held by the TOB trust that has been effectively financed by the trust’s issuance of floating rate securities, subject to an agreement by the Adviser as to certain funds to limit the amount of such assets for determining eligible assets in certain circumstances. As of October 31, 2015, the complex-level fee for each Fund was as follows: |
| | | | |
| Fund | | Complex-Level Fee | |
Large Cap Growth Opportunities | | | 0.2000 | % |
Mid Cap Growth Opportunities | | | 0.1931 | |
Small Cap Growth Opportunities | | | 0.2000 | |
The Adviser has agreed to waive fees and/or reimburse expenses of Small Cap Growth Opportunities through September 30, 2016, so that total annual fund operating expenses (excluding 12b-1 distribution and/or service fees, interest expenses, taxes, acquired fund fees and expenses, fees incurred in acquiring and disposing of portfolio securities and extraordinary expenses) do not exceed 1.22% of the average daily net assets of any class of Fund shares.
The Trust pays no compensation directly to those of its directors who are affiliated with the Adviser or to its officers, all of whom receive remuneration for their services to the Trust from the Adviser or its affiliates. The Board has adopted a deferred compensation plan for independent directors that enables directors to elect to defer receipt of all or a portion of the annual compensation they are entitled to receive from certain Nuveen-advised funds. Under the plan, deferred amounts are treated as though equal dollar amounts had been invested in shares of select Nuveen-advised funds.
During the current fiscal period, Nuveen Securities, LLC (the “Distributor”), a wholly-owned subsidiary of Nuveen, collected sales charges on purchases of Class A Shares, the majority of which were paid out as concessions to financial intermediaries as follows:
| | | | | | | | | | | | |
| | | Large Cap
Growth
Opportunities | | | Mid Cap
Growth
Opportunities | | | Small Cap
Growth
Opportunities | |
| Sales charges collected (Unaudited) | | $ | 46,241 | | | $ | 125,677 | | | $ | 19,512 | |
| Paid to financial intermediaries (Unaudited) | | | 40,650 | | | | 110,751 | | | | 17,037 | |
The Distributor also received 12b-1 service fees on Class A Shares, substantially all of which were paid to compensate financial intermediaries for providing services to shareholders relating to their investments.
During the current fiscal period, the Distributor compensated financial intermediaries directly with commission advances at the time of purchase as follows:
| | | | | | | | | | | | |
| | | Large Cap
Growth
Opportunities | | | Mid Cap
Growth
Opportunities | | | Small Cap
Growth
Opportunities | |
| Commission advances (Unaudited) | | $ | 11,863 | | | $ | 22,061 | | | $ | 5,911 | |
To compensate for commissions advanced to financial intermediaries, all 12b-1 service and distribution fees collected on Class C Shares during the first year following a purchase are retained by the Distributor. During the current fiscal period, the Distributor retained such 12b-1 fees as follows:
| | | | | | | | | | | | |
| | | Large Cap
Growth
Opportunities | | | Mid Cap
Growth
Opportunities | | | Small Cap
Growth
Opportunities | |
| 12b-1 fees retained (Unaudited) | | $ | 11,267 | | | $ | 16,768 | | | $ | 2,739 | |
The remaining 12b-1 fees charged to the Funds were paid to compensate financial intermediaries for providing services to shareholders relating to their investments.
The Distributor also collected and retained CDSC on share redemptions during the current fiscal period as follows:
| | | | | | | | | | | | |
| | | Large Cap
Growth
Opportunities | | | Mid Cap
Growth
Opportunities | | | Small Cap
Growth
Opportunities | |
| CDSC retained (Unaudited) | | $ | 417 | | | $ | 411 | | | $ | — | |
8. Borrowing Arrangements
The Funds, along with certain other funds managed by the Adviser (“Participating Funds”), established a 364-day, $2.53 billion standby credit facility with a group of lenders, under which the Participating Funds may borrow for various purposes other than leveraging for investment purposes. A large portion of this facility’s capacity (and its associated costs as described below) is currently dedicated for use by a small number of Participating Funds, which does not include any of the Funds covered by this shareholder report. The remaining capacity under the facility (and the corresponding portion of the facility’s annual costs) is separately dedicated to most of the other open-end funds in the Nuveen fund family, including all of the Funds covered by this shareholder report, along with a number of Nuveen closed-end funds. The credit facility expires in July 2016 unless extended or renewed.
The credit facility has the following terms: a fee of 0.15% per annum on unused commitment amounts, and interest at a rate equal to the higher of (a) one-month LIBOR (London Inter-Bank Offered Rate) plus 1.25% per annum or (b) the Fed Funds rate plus 1.25% per annum on amounts borrowed. Participating Funds paid administration, legal and arrangement fees, which are recognized as a component of “Other expenses” on the Statement of Operations, and along with commitment fees, have been allocated among such Participating Funds based upon the relative proportions of the facility’s aggregate capacity reserved for them and other factors deemed relevant by the Adviser and the Board of each Participating Fund.
During the current fiscal period, none of the Funds utilized this facility.
9. Subsequent Events
Change in Contingent Deferred Sales Charge (CDSC) Schedule
Effective November 1, 2015, shareholders purchasing $1 million or more of Class A Shares at NAV without an up-front sales charge will be assessed a CDSC of 1.00% on any shares redeemed within eighteen months of purchase, unless the redemption is eligible for a CDSC reduction or waiver as specified in the Funds’ statement of additional information.
Additional
Fund Information (Unaudited)
| | | | | | | | | | |
| | | | | |
| | Fund Manager Nuveen Fund Advisors, LLC 333 West Wacker Drive Chicago, IL 60606 Sub-Adviser Nuveen Asset Management, LLC 333 West Wacker Drive Chicago, IL 60606 | | Independent Registered
Public Accounting Firm PricewaterhouseCoopers LLP Chicago, IL 60606 Custodian U.S. Bank National Association Milwaukee, WI 53202 | | Legal Counsel Chapman and Cutler LLP Chicago, IL 60603 | | Transfer Agent and
Shareholder Services Boston Financial
Data Services, Inc. Nuveen Investor Services P.O. Box 8530 Boston, MA 02266-8530 (800) 257-8787 | | |
| | | | | | | | | | | | | | |
| | | | | |
| | | | | | | | | | |
| | |
| | Distribution Information: The Funds hereby designate their percentages of dividends paid from net ordinary income as dividends qualifying for the 70% dividends received deduction (“DRD”) for corporations and their percentages as qualified dividend income (“QDI”) for individuals under Section 1(h)(11) of the Internal Revenue Code as shown in the accompanying table. The actual qualified dividend income distributions will be reported to shareholders on Form 1099-DIV which will be sent to shareholders shortly after calendar year end. | | |
| | | | | | | |
| | | | | | | | | Large Cap Growth
Opportunities | | Mid Cap Growth
Opportunities | | Small Cap Growth
Opportunities | | |
| | % of QDI | | | | 88% | | 8% | | 7% | | |
| | % of DRD | | | | 87% | | 7% | | 7% | | |
| | | | | |
| | | | | | | | | | |
| | |
| | Long-Term Capital Gain Distributions: The Funds hereby designate as long-term capital gain dividends, pursuant to Internal Revenue Code Section 852(b)(3), the amount shown in the accompanying table or, if greater, the amount necessary to reduce earnings and profits of the Funds related to net capital gain to zero for the tax year ended October 31, 2015: | | |
| | | | | | | |
| | | | | | | | | Large Cap Growth
Opportunities | | Mid Cap Growth
Opportunities | | Small Cap Growth
Opportunities | | |
| | Long-term capital gain dividends | | $86,052,670 | | $171,603,516 | | $8,237,913 | | |
| | | | | |
| | | | | | | | | | |
| | |
| | Quarterly Form N-Q Portfolio of Investments Information: Each Fund is required to file its complete schedule of portfolio holdings with the Securities and Exchange Commission (SEC) for the first and third quarters of each fiscal year on Form N-Q. You may obtain this information directly from the SEC. Visit the SEC on-line at http://www.sec.gov or in person at the SEC’s Public Reference Room in Washington, D.C. Call the SEC toll-free at (800) SEC-0330 for room hours and operation. | | |
| | | | | |
| | | | | | | | | | |
| | |
| | Nuveen Funds’ Proxy Voting Information: You may obtain (i) information regarding how each fund voted proxies relating to portfolio securities held during the most recent twelve-month period ended June 30, without charge, upon request, by calling Nuveen Investments toll-free at (800) 257-8787 or on Nuveen’s website at www.nuveen.com and (ii) a description of the policies and procedures that each fund used to determine how to vote proxies relating to portfolio securities without charge, upon request, by calling Nuveen Investments toll-free at (800) 257-8787. You may also obtain this information directly from the SEC. Visit the SEC on-line at http://www.sec.gov. | | |
| | | | | |
| | | | | | | | | | |
| | |
| | FINRA BrokerCheck: The Financial Industry Regulatory Authority (FINRA) provides information regarding the disciplinary history of FINRA member firms and associated investment professionals. This information as well as an investor brochure describing FINRA BrokerCheck is available to the public by calling the FINRA BrokerCheck Hotline number at (800) 289-9999 or by visiting www.FINRA.org. | | |
Glossary of Terms
Used in this Report
Average Annual Total Return: This is a commonly used method to express an investment’s performance over a particular, usually multi-year time period. It expresses the return that would have been necessary each year to equal the investment’s actual cumulative performance (including change in NAV or offer price and reinvested distributions and capital gains, if any) over the time period being considered.
Gross Domestic Product (GDP): The total market value of all final goods and services produced in a country/region in a given year, equal to total consumer, investment and government spending, plus the value of exports, minus the value of imports.
Lipper Large-Cap Growth Funds Classification Average: Represents the average annualized total return for all reporting funds in the Lipper Large-Cap Growth Funds Classification. Lipper returns account for the effects of management fees and assume reinvestment of distributions but do not reflect any applicable sales charges.
Lipper Mid-Cap Growth Funds Classification Average: Represents the average annualized total return for all reporting funds in the Lipper Mid-Cap Growth Funds Classification. Lipper returns account for the effects of management fees and assume reinvestment of distributions but do not reflect any applicable sales charges.
Lipper Small-Cap Growth Funds Classification Average: Represents the average annualized total return for all reporting funds in the Lipper Small-Cap Growth Funds Classification. Lipper returns account for the effects of management fees and assume reinvestment of distributions but do not reflect any applicable sales charges.
Market Capitalization: The market capitalization of a company is equal to the number of the company’s common shares outstanding multiplied by the current price of the company’s stock.
Net Asset Value (NAV) Per Share: A fund’s Net Assets is equal to its total assets (securities, cash and accrued earnings) less its total liabilities. For funds with multiple classes, Net Assets are determined separately for each share class. NAV per share is equal to the fund’s (or share class’) Net Assets divided by its number of shares outstanding.
Russell 1000® Growth Index: An index that measures the performance of those Russell 1000 companies with higher price-to-book ratios and higher forecasted growth values. The index returns assume reinvestment of distributions, but do not reflect any applicable sales charges or management fees.
Russell 2000® Growth Index: An index that measures the performance of those Russell 2000 companies with higher price-to-book ratios and higher forecasted growth values. The index returns assume reinvestment of distributions, but do not reflect any applicable sales charges or management fees.
Russell 1000® Index: An unmanaged index, considered representative of large-cap stocks. The index returns assume reinvestment of distributions, but do not reflect any applicable sales charges or management fees.
Russell 2000® Index: An index that measures the performance of the small-cap segment of the U.S. equity universe. The Russell 2000® Index is a subset of the Russell 3000® Index representing approximately 10% of the total market capitalization of that index. It includes approximately 2,000 of the smallest securities based on a combination of their market cap and current index membership. The Russell 3000® Index measures the performance of the 3,000 largest companies based on total market capitalization, which represents approximately 98% of the investable U.S. equity market. The index returns assume reinvestment of distributions, but do not reflect any applicable sales charges or management fees.
Glossary of Terms Used in this Report (continued)
Russell Midcap® Growth Index: An index that measures the performance of the mid-cap growth segment of the U.S. equity universe. It includes those Russell Midcap Index companies with higher price-to-book ratios and higher forecasted growth values. The index returns assume reinvestment of distributions, but do not reflect any applicable sales charges or management fees.
S&P 500® Index: An unmanaged index generally considered representative of the U.S. stock market. Index returns assume reinvestment of distributions, but do not include the effects of any applicable sales charges or management fees.
Tax Equalization: The practice of treating a portion of the distribution made to a redeeming shareholder, which represents his proportionate part of undistributed net investment income and capital gain as a distribution for tax purposes. Such amounts are referred to as the equalization debits (or payments) and will be considered a distribution to the shareholder of net investment income and capital gain for calculation of the fund’s dividends paid deduction.
Trustees
and Officers (Unaudited)
The management of the Funds, including general supervision of the duties performed for the Funds by the Adviser, is the responsibility of the Board of trustees of the Funds. The number of directors of the Funds is currently set at eleven. None of the trustees who are not “interested” persons of the Funds (referred to herein as “independent trustees”) has ever been a director or employee of, or consultant to, Nuveen or its affiliates. The names and business addresses of the trustees and officers of the Funds, their principal occupations and other affiliations during the past five years, the number of portfolios each oversees and other directorships they hold are set forth below.
The Funds’ Statement of Additional Information (“SAI”) includes more information about the trustees. To request a free copy, call Nuveen Investments at (800) 257-8787 or visit the Funds’ website at www.nuveen.com.
| | | | | | | | |
Name, Year of Birth & Address | | Position(s) Held with the Funds | | Year First Elected or Appointed (1) | | Principal Occupation(s) Including other Directorships During Past 5 Years | | Number of Portfolios in Fund Complex Overseen by Trustee |
| | | |
| Independent Trustee: | | | | |
William J. Schneider 1944 333 W. Wacker Drive Chicago, IL 60606 | | Chairman of the Board and Trustee | | 1996 | | Chairman of Miller-Valentine Partners, a real estate investment company; formerly, Senior Partner and Chief Operating Officer (retired 2004) of Miller-Valentine Group; owner in several other Miller-Valentine entities; Board Member of Med-America Health System, and WDPR Public Radio Station; formerly, member, Business Advisory Council, Cleveland Federal Reserve Bank and University of Dayton Business School Advisory Council. | | 196 |
Jack B. Evans 1948 333 W. Wacker Drive Chicago, IL 60606 | | Trustee | | 1999 | | President, The Hall-Perrine Foundation, a private philanthropic corporation (since 1996); Director and Chairman, United Fire Group, a publicly held company; formerly, President Pro-Tem of the Board of Regents for the State of Iowa University System; Director, Source Media Group; Life Trustee of Coe College; formerly, Director, Alliant Energy; formerly, Director, Federal Reserve Bank of Chicago; formerly, President and Chief Operating Officer, SCI Financial Group, Inc., a regional financial services firm. | | 196 |
William C. Hunter 1948 333 W. Wacker Drive Chicago, IL 60606 | | Trustee | | 2004 | | Dean Emeritus, formerly, Dean, Tippie College of Business, University of Iowa (2006-2012); Director (since 2004) of Xerox Corporation; Director (since 2005), and President (since 2012) Beta Gamma Sigma, Inc., The International Business Honor Society; Director of Wellmark, Inc. (since 2009); formerly, Dean and Distinguished Professor of Finance, School of Business at the University of Connecticut (2003-2006); previously, Senior Vice President and Director of Research at the Federal Reserve Bank of Chicago (1995-2003); formerly, Director (1997-2007), Credit Research Center at Georgetown University. | | 196 |
David J. Kundert 1942 333 W. Wacker Drive Chicago, IL 60606 | | Trustee | | 2005 | | Formerly, Director, Northwestern Mutual Wealth Management Company (2006-2013); retired (since 2004) as Chairman, JPMorgan Fleming Asset Management, President and CEO, Banc One Investment Advisors Corporation, and President, One Group Mutual Funds; prior thereto, Executive Vice President, Banc One Corporation and Chairman and CEO, Banc One Investment Management Group; Regent Emeritus, Member of Investment Committee, Luther College; member of the Wisconsin Bar Association; member of Board of Directors and Chair of Investment Committee, Greater Milwaukee Foundation; member of the Board of Directors (Milwaukee), College Possible. | | 196 |
Trustees and Officers (Unaudited) (continued)
| | | | | | | | |
Name, Year of Birth & Address | | Position(s) Held with the Funds | | Year First Elected or Appointed (1) | | Principal Occupation(s) Including other Directorships During Past 5 Years | | Number of Portfolios in Fund Complex Overseen by Trustee |
John K. Nelson 1962 333 West Wacker Drive Chicago, IL 60606 | | Trustee | | 2013 | | Member of Board of Directors of Core12 LLC (since 2008), a private firm which develops branding, marketing and communications strategies for clients; Director of The Curran Center for Catholic American Studies (since 2009) and The President’s Council, Fordham University (since 2010); formerly senior external advisor to the financial services practice of Deloitte Consulting LLP (2012-2014); formerly, Chairman of the Board of Trustees of Marian University (2010 as trustee, 2011-2014 as Chairman); formerly, Chief Executive Officer of ABN AMRO N.V. North America, and Global Head of its Financial Markets Division (2007-2008); prior senior positions held at ABN AMRO include Corporate Executive Vice President and Head of Global Markets—the Americas (2006-2007), CEO of Wholesale Banking—North America and Global Head of Foreign Exchange and Futures Markets (2001-2006), and Regional Commercial Treasurer and Senior Vice President Trading—North America (1996-2001); formerly, Trustee at St. Edmund Preparatory School in New York City. | | 196 |
Judith M. Stockdale 1947 333 W. Wacker Drive Chicago, IL 60606 | | Trustee | | 1997 | | Board Member, Land Trust Alliance (since 2013) and U.S. Endowment for Forestry and Communities (since 2013); formerly, Executive Director (1994-2012), Gaylord and Dorothy Donnelley Foundation; prior thereto, Executive Director, Great Lakes Protection Fund (1990-1994). | | 196 |
Carole E. Stone 1947 333 W. Wacker Drive Chicago, IL 60606 | | Trustee | | 2007 | | Director, Chicago Board Options Exchange (since 2006), C2 Options Exchange, Incorporated (since 2009) Director, CBOE Holdings, Inc. (since 2010); formerly, Commissioner, New York State Commission on Public Authority Reform (2005-2010). | | 196 |
Virginia L. Stringer 1944 333 W. Wacker Drive Chicago, IL 60606 | | Trustee | | 2011 | | Board Member, Mutual Fund Directors Forum; non-profit board member; former governance consultant; former Owner and President, Strategic Management Resources, Inc., a management consulting firm; former Member, Governing Board, Investment Company Institute’s Independent Directors Council; previously, held several executive positions in general management, marketing and human resources at IBM and The Pillsbury Company; Independent Director, First American Fund Complex (1987-2010) and Chair (1997-2010). | | 196 |
Terence J. Toth 1959 333 W. Wacker Drive Chicago, IL 60606 | | Trustee | | 2008 | | Managing Partner, Promus Capital (since 2008); Director, Fulcrum IT Service LLC (since 2010), Quality Control Corporation (since 2012) and LogicMark LLC (since 2012); formerly, Director, Legal & General Investment Management America, Inc. (2008-2013); formerly, CEO and President, Northern Trust Global Investments (2004-2007); Executive Vice President, Quantitative Management & Securities Lending (2000-2004); prior thereto, various positions with Northern Trust Company (since 1994); member: Chicago Fellowship Board (since 2005), Catalyst Schools of Chicago Board (since 2008) and Mather Foundation Board (since 2012), and a member of its investment committee; formerly, Member, Northern Trust Mutual Funds Board (2005-2007), Northern Trust Global Investments Board (2004-2007), Northern Trust Japan Board (2004-2007), Northern Trust Securities Inc. Board (2003-2007) and Northern Trust Hong Kong Board (1997-2004). | | 196 |
| | | | | | | | |
Name, Year of Birth & Address | | Position(s) Held with the Funds | | Year First Elected or Appointed (1) | | Principal Occupation(s) Including other Directorships During Past 5 Years | | Number of Portfolios in Fund Complex Overseen by Trustee |
| | | |
| Interested Trustee: | | | | |
William Adams IV(2) 1955 333 W. Wacker Drive Chicago, IL 60606 | | Trustee | | 2013 | | Senior Executive Vice President, Global Structured Products (since 2010); Co-President of Nuveen Fund Advisors, LLC (since 2011); Executive Vice President of Nuveen Securities, LLC; President (since 2011), formerly, Managing Director (2010-2011) of Nuveen Commodities Asset Management, LLC; Board Member of the Chicago Symphony Orchestra and of Gilda’s Club Chicago; formerly, Executive Vice President, U.S. Structured Products, of Nuveen Investments, Inc. (1999-2010). | | 196 |
Thomas S. Schreier, Jr.(2)
1962 333 W. Wacker Drive Chicago, IL 60606 | | Trustee | | 2013 | | Vice Chairman, Wealth Management of Nuveen Investments, Inc. (since 2011); Co-President of Nuveen Fund Advisors, LLC; Chairman of Nuveen Asset Management, LLC (since 2011); Co-Chief Executive Officer of Nuveen Securities, LLC (since 2011); Member of Board of Governors and Chairman’s Council of the Investment Company Institute; Director of Allina Health and a Member of its Finance, Audit and Investment Committees, formerly, Chief Executive Officer (2000-2010) and Chief Investment Officer (2007-2010) of FAF Advisors, Inc.; formerly, President of First American Funds (2001-2010). | | 196 |
| | | | | | | | |
Name,
Year of Birth & Address | | Position(s) Held with the Funds | | Year First Elected or Appointed (3) | | Principal Occupation(s) During Past 5 Years | | Number of Portfolios in Fund Complex Overseen by
Officer |
| | | |
| Officers of the Funds: | | | | |
Gifford R. Zimmerman 1956 333 W. Wacker Drive Chicago, IL 60606 | | Chief Administrative Officer | | 1988 | | Managing Director (since 2002), and Assistant Secretary of Nuveen Securities, LLC; Managing Director (since 2004) and Assistant Secretary (since 1994) of Nuveen Investments, Inc.; Managing Director (since 2002), Assistant Secretary (since 1997) and Co-General Counsel (since 2011) of Nuveen Fund Advisors, LLC; Managing Director, Assistant Secretary and Associate General Counsel of Nuveen Asset Management, LLC (since 2011); Managing Director and Assistant Secretary of Symphony Asset Management LLC (since 2003); Vice President and Assistant Secretary of NWQ Investment Management Company, LLC (since 2002), Nuveen Investments Advisers Inc. (since 2002), Santa Barbara Asset Management, LLC (since 2006) and of Winslow Capital Management, LLC, (since 2010); Vice President and Assistant Secretary (since 2013), formerly, Chief Administrative Officer and Chief Compliance Officer (2006-2013) of Nuveen Commodities Asset Management, LLC; Chartered Financial Analyst. | | 197 |
Margo L. Cook 1964 333 W. Wacker Drive Chicago, IL 60606 | | Vice President | | 2009 | | Senior Executive Vice President of Nuveen Investments, Inc.; Executive Vice President, Investment Services of Nuveen Fund Advisors, LLC (since 2011); Managing Director – Investment Services of Nuveen Commodities Asset Management, LLC (since 2011); Co-Chief Executive Officer (since 2015); previously, Executive Vice President (2013-2015) of Nuveen Securities, LLC; Chartered Financial Analyst. | | 197 |
Lorna C. Ferguson 1945 333 W. Wacker Drive Chicago, IL 60606 | | Vice President | | 1998 | | Managing Director (since 2005) of Nuveen Fund Advisors, LLC and Nuveen Securities, LLC (since 2004). | | 197 |
Trustees and Officers (Unaudited) (continued)
| | | | | | | | |
Name,
Year of Birth & Address | | Position(s) Held with the Funds | | Year First Elected or Appointed (3) | | Principal Occupation(s) During Past 5 Years | | Number of Portfolios in Fund Complex Overseen by
Officer |
Stephen D. Foy 1954 333 W. Wacker Drive Chicago, IL 60606 | | Vice President and Controller | | 1998 | | Managing Director (since 2014), formerly, Senior Vice President (2013-2014) and Vice President (2005-2013) of Nuveen Fund Advisors, LLC; Chief Financial Officer of Nuveen Commodities Asset Management, LLC (since 2010); Certified Public Accountant. | | 197 |
Sherri A. Hlavacek 1962 333 W. Wacker Drive Chicago, IL 60606 | | Vice President and Treasurer | | 2015 | | Executive Vice President (since May 2015, formerly, Managing Director) and Controller of Nuveen Fund Advisors, LLC; Managing Director and Controller of Nuveen Commodities Asset Management, LLC; Executive Vice President (since May 2015, formerly, Managing Director), Treasurer and Controller of Nuveen Asset Management, LLC; Executive Vice President, Principal Financial Officer (since July 2015, formerly, Managing Director), Treasurer and Corporate Controller of Nuveen Investments, Inc.; Executive Vice President (since May 2015, formerly, Managing Director), Treasurer and Corporate Controller of Nuveen Investments Advisers Inc. and Nuveen Investments Holdings, Inc.; Managing Director, Chief Financial Officer and Corporate Controller of Nuveen Securities, LLC; Vice President, Controller and Treasurer of NWQ Investment Management Company, LLC; Vice President and Controller of Santa Barbara Asset Management, LLC, Tradewinds Global Investors, LLC, Symphony Asset Management LLC and Winslow Capital Management, LLC; Certified Public Accountant. | | 197 |
Walter M. Kelly 1970 333 W. Wacker Drive Chicago, IL 60606 | | Chief Compliance Officer and Vice President | | 2003 | | Senior Vice President (since 2008) of Nuveen Investments Holdings, Inc. | | 197 |
Tina M. Lazar 1961 333 W. Wacker Drive Chicago, IL 60606 | | Vice President | | 2002 | | Senior Vice President of Nuveen Investments Holdings, Inc. and Nuveen Securities, LLC | | 197 |
Kevin J. McCarthy 1966 333 W. Wacker Drive Chicago, IL 60606 | | Vice President and Secretary | | 2007 | | Managing Director and Assistant Secretary (since 2008), Nuveen Securities, LLC; Managing Director (since 2008), Assistant Secretary (since 2007) and Co-General Counsel (since 2011) of Nuveen Fund Advisors, LLC; Managing Director, Assistant Secretary and Associate General Counsel (since 2011) of Nuveen Asset Management, LLC; Managing Director and Assistant Secretary, Nuveen Investments, Inc.; Vice President (since 2007) and Assistant Secretary of Nuveen Investments Advisers Inc., NWQ Investment Management Company, LLC, Tradewinds Global Investors LLC, Symphony Asset Management LLC, Santa Barbara Asset Management, LLC, and of Winslow Capital Management, LLC. (since 2010); Vice President and Secretary (since 2010) of Nuveen Commodities Asset Management, LLC. | | 197 |
Kathleen L. Prudhomme 1953 901 Marquette Avenue Minneapolis, MN 55402 | | Vice President and Assistant Secretary | | 2011 | | Managing Director, Assistant Secretary and Co-General Counsel (since 2011) of Nuveen Fund Advisors, LLC; Managing Director, Assistant Secretary and Associate General Counsel (since 2011) of Nuveen Asset Management, LLC; Managing Director and Assistant Secretary (since 2011) of Nuveen Securities, LLC; formerly, Deputy General Counsel, FAF Advisors, Inc. (2004-2010). | | 197 |
Joel T. Slager 1978 333 West Wacker Drive Chicago, IL 60606 | | Vice President and Assistant Secretary | | 2013 | | Fund Tax Director for Nuveen Funds (since 2013); previously, Vice President of Morgan Stanley Investment Management, Inc., Assistant Treasurer of the Morgan Stanley Funds (from 2010 to 2013). | | 197 |
| | | | | | | | |
Name,
Year of Birth & Address | | Position(s) Held with the Funds | | Year First Elected or Appointed (3) | | Principal Occupation(s) During Past 5 Years | | Number of Portfolios in Fund Complex Overseen by
Officer |
Jeffery M. Wilson 1956 333 West Wacker Drive Chicago, IL 60606 | | Vice President | | 2011 | | Senior Vice President of Nuveen Securities, LLC (since 2011); formerly, Senior Vice President of FAF Advisors, Inc. (2000-2010). | | 108 |
| (1) | Trustees serve an indefinite term until his/her successor is elected or appointed. Ms. Stringer will retire from the Board as of December 31, 2015. The year first elected or appointed represents the year in which the trustee was first elected or appointed to any fund in the Nuveen Fund Complex. |
| (2) | “Interested persons” of the Trust, as defined in the 1940 Act, by reason of their positions with Nuveen and certain of its subsidiaries. |
| (3) | Officers serve one year terms through August of each year. The year first elected or appointed represents the year in which the officer was first elected or appointed to any fund in the Nuveen Fund Complex. |
Annual Investment Management Agreement
Approval Process (Unaudited)
The Board of Directors of each Fund (each, a “Board” and each Director, a “Board Member”), including the Board Members who are not parties to the Funds’ advisory or sub-advisory agreements or “interested persons” of any such parties (the “Independent Board Members”), is responsible for overseeing the performance of the investment adviser and sub-adviser to the respective Fund and determining whether to continue such Fund’s advisory agreement (the “Investment Management Agreement”) between the Fund and Nuveen Fund Advisors, LLC (the “Adviser”) and the sub-advisory agreement (the “Sub-Advisory Agreement” and, together with the Investment Management Agreement, the “Advisory Agreements”) between the Adviser and Nuveen Asset Management, LLC (the “Sub-Adviser”). Following an initial term with respect to each Fund upon its commencement of operations, the Board is required to consider the continuation of the Advisory Agreements on an annual basis pursuant to the requirements of the Investment Company Act of 1940, as amended (the “1940 Act”). Accordingly, at an in-person meeting held on May 11-13, 2015 (the “May Meeting”), the Board, including a majority of the Independent Board Members, considered and approved the existing Advisory Agreements for the Funds.
In preparation for its considerations at the May Meeting, the Board received in advance of the meeting extensive materials prepared in connection with the review of the Advisory Agreements. The materials provided a broad range of information regarding the Funds, including, among other things, the nature, extent and quality of services provided by the Adviser and Sub-Adviser (the Adviser and Sub-Adviser are collectively, the “Fund Advisers” and each, a “Fund Adviser”); Fund performance including performance assessments against peers and the appropriate benchmark(s); fee and expense information of the Funds compared to peers; a description and assessment of shareholder service levels for the Funds; a summary of the performance of certain service providers; a review of product initiatives and shareholder communications; and profitability information of the Fund Advisers as described in further detail below. As part of its annual review, the Board also held a separate meeting on April 14-15, 2015 to review the Funds’ investment performance and consider an analysis by the Adviser of the Sub-Adviser which generally evaluated the Sub-Adviser’s investment team, investment mandate, organizational structure and history, investment philosophy and process, and the performance of the Funds, and any significant changes to the foregoing. During the review, the Independent Board Members asked questions of and requested additional information from management.
The Board considered that the evaluation process with respect to the Fund Advisers is an ongoing process that encompassed the information and knowledge gained throughout the year. The Board, acting directly or through its committees, met regularly during the course of the year and received information and considered factors at each meeting that would be relevant to its annual consideration of the Advisory Agreements, including information relating to Fund performance; Fund expenses; investment team evaluations; and valuation, compliance, regulatory and risk matters. In addition to regular reports, the Adviser provided special reports to the Board to enhance the Board’s understanding on topics that impact some or all of the Nuveen funds and the Adviser (such as presentations on risk and stress testing; the new governance, risk and compliance system; cybersecurity developments; Nuveen fund accounting and reporting matters; regulatory developments impacting the investment company industry and the business plans or other matters impacting the Adviser). The Board also met with key investment personnel managing certain Nuveen fund portfolios during the year.
The Board had created several standing committees including the Open-End Funds Committee and the Closed-End Funds Committee to assist the full Board in monitoring and gaining a deeper insight into the distinctive business practices of closed-end and open-end funds. These Committees met prior to each quarterly Board meeting, and the Adviser provided presentations to these Committees permitting them to delve further into specific matters or initiatives impacting the respective product line.
The Board also continued its program of seeking to have the Board Members or a subset thereof visit each sub-adviser to the Nuveen funds at least once over a multiple year rotation, meeting with key investment and business personnel. In this regard, the Independent Board Members made site visits to multiple equity and fixed-income investment teams of the Sub-Adviser in June 2014.
The Board considered the information provided and knowledge gained at these meetings and visits during the year when performing its annual review of the Advisory Agreements. The Independent Board Members also were assisted throughout the process by independent legal counsel. During the course of the year and during their deliberations regarding the review of advisory contracts, the Independent Board Members met with independent legal counsel in executive sessions without management present. The Independent Board Members also received a memorandum from independent legal counsel outlining the legal standards for their consideration of the proposed continuation of the Advisory Agreements. In addition, it is important to recognize that the management arrangements for the Nuveen funds are the result of many years of review and discussion between the Independent Board Members and Fund management and that the Board Members’ conclusions may be based, in part, on their consideration of fee arrangements and other factors developed in previous years.
The Board took into account all factors it believed relevant with respect to each Fund, including, among other things: (a) the nature, extent and quality of the services provided by the Fund Advisers; (b) the investment performance of the Funds and Fund Advisers; (c) the advisory fees and costs of the
services to be provided to the Funds and the profitability of the Fund Advisers; (d) the extent of any economies of scale; (e) any benefits derived by the Fund Advisers from the relationship with the Funds; and (f) other factors. Each Board Member may have accorded different weight to the various factors in reaching his or her conclusions with respect to the Advisory Agreements of each Fund. The Independent Board Members did not identify any single factor as all-important or controlling. The Independent Board Members’ considerations were instead based on a comprehensive consideration of all the information presented. The principal factors considered by the Board and its conclusions are described below.
A. Nature, Extent and Quality of Services
In evaluating the renewal of the Advisory Agreements, the Independent Board Members received and considered information regarding the nature, extent and quality of the applicable Fund Adviser’s services provided to each respective Fund. The Board reviewed information regarding, among other things, each Fund Adviser’s organization and business, the types of services that each Fund Adviser or its affiliates provided to the Funds, the performance record of the Funds (as described in further detail below), and any initiatives that had been undertaken on behalf of the open-end product line. The Board recognized the high quality of services the Adviser had provided to the Funds over the years and the conscientiousness with which the Adviser provided these services. The Board also considered the improved capital structure of Nuveen Investments, Inc. (“Nuveen”) (the parent of the Adviser) following the acquisition of Nuveen by TIAA-CREF in 2014 (the “TIAA-CREF Transaction”).
With respect to the services, the Board noted the Funds were registered investment companies that operated in a regulated industry and considered the myriad of investment management, administrative, compliance, oversight and other services the Adviser provided to manage and operate the Funds. Such services included, among other things: (a) product management (such as analyzing ways to better position a Nuveen fund in the marketplace, setting dividends; maintaining relationships to gain access to distribution platforms; and providing shareholder communications); (b) fund administration (such as preparing tax returns and other tax compliance services, preparing regulatory filings and shareholder reports; managing fund budgets and expenses; overseeing a fund’s various service providers and supporting and analyzing new and existing funds); (c) Board administration (such as supporting the Board and its committees, in relevant part, by organizing and administering the Board and committee meetings and preparing the necessary reports to assist the Board in its duties); (d) compliance (such as monitoring adherence to a fund’s investment policies and procedures and applicable law; reviewing the compliance program periodically and developing new policies or updating existing compliance policies and procedures as considered necessary or appropriate; responding to regulatory requests; and overseeing compliance testing of the funds’ sub-advisers); (e) legal support (such as preparing or reviewing fund registration statements, proxy statements and other necessary materials; interpreting regulatory requirements and compliance thereof; and maintaining applicable registrations); and (f) investment services (such as overseeing and reviewing the funds’ sub-advisers and their investment teams; analyzing performance of the funds; overseeing investment and risk management; evaluating brokerage transactions and securities lending, overseeing the daily valuation process for portfolio securities and developing and recommending valuation policies and methodologies and changes thereto; reporting to the Board on various matters including performance, risk and valuation; and participating in fund development, leverage management, and the developing or interpreting of investment policies and parameters).
In its review, the Board considered information highlighting the various initiatives that the Adviser had implemented or continued during the last year to enhance its services to the Nuveen funds. The Board recognized that some of these initiatives are a result of a multi-year process. In reviewing the activities of 2014, the Board recognized the Adviser’s continued focus on fund rationalization for open-end funds through mergers, fund closures or repositioning the funds in seeking to enhance shareholder value, reduce costs, improve performance, eliminate fund overlap and better meet shareholder needs. The Board noted the Adviser’s investment in additional staffing to strengthen and improve its services to the Nuveen funds, including with respect to risk management and valuation. The Board recognized that expanding the depth and range of its risk oversight activities had been a major priority for the Adviser in recent years, and the Adviser continued to add to the risk management team, develop additional risk management programs and create committees or other teams designated to oversee or evaluate certain risks, such as liquidity risk, enterprise risk, investment risk and cybersecurity risk. The Adviser had also continued to add to the valuation team, launched its centralized securities valuation system which is intended to provide for uniform pricing and reporting across the complex as the system continues to develop, continued to refine its valuation analysis and updated related policies and procedures and evaluated and assessed pricing services. The Board considered the Adviser’s ongoing investment in information technology and operations and the various projects of the information technology team to support the continued growth and complexity of the Nuveen funds and increase efficiencies in their operations. The Board also recognized the Adviser’s strong commitment to compliance and reviewed information reflecting the compliance group’s ongoing activities to enhance its compliance system and refine its compliance procedures as well as the Chief Compliance Officer’s report regarding the compliance team, the initiatives the team had undertaken in 2014 and proposed for 2015, the compliance functions and reporting process, the record of compliance with the policies and procedures and its supervision activities of other service providers.
With respect to the open-end fund product line, the Adviser had also, among other things: developed new funds in seeking to enhance the product line; enhanced the reporting to the Board and its committees regarding payments to intermediaries; and continued to explore opportunities for potential funds.
As noted, the Adviser also oversees the Sub-Adviser who primarily provides the portfolio advisory services to the Funds. The Board recognized the skill and competency of the Adviser in monitoring and analyzing the performance of the Sub-Adviser and managing the sub-advisory relationship. In considering the Sub-Advisory Agreements and supplementing its prior knowledge, the Board considered a current report provided by the Adviser
Annual Investment Management Agreement Approval Process (Unaudited) (continued)
analyzing, among other things, the Sub-Adviser’s investment team and changes thereto, investment approach, organization and history, and assets under management, and the investment performance of each Fund.
Based on their review, the Independent Board Members found that, overall, the nature, extent and quality of services provided to the Funds under each respective Advisory Agreement were satisfactory.
B. The Investment Performance of the Funds and Fund Advisers
The Board, including the Independent Board Members, considered the performance history of each Fund over various time periods. The Board reviewed reports, including an analysis of the Funds’ performance and the applicable investment team. The Board reviewed, among other things, each Fund’s investment performance both on an absolute basis and in comparison to peer funds (the “Performance Peer Group”) and to recognized and/or customized benchmarks (i.e., generally benchmarks derived from multiple recognized benchmarks) for the quarter, one-, three- and five-year periods ending December 31, 2014, as well as performance information reflecting the first quarter of 2015. In its review, the Board noted that it also reviewed Fund performance results at each of its quarterly meetings.
In evaluating performance, the Board recognized several factors that may impact the performance data as well as the consideration given to particular performance data.
| | • | | The performance data reflected a snapshot in time, in this case as of the end of the most recent calendar year or quarter. A different performance period, however, could generate significantly different results. |
| | • | | Long-term performance can be adversely affected by even one period of significant underperformance so that a single investment decision or theme had the ability to disproportionately affect long-term performance. |
| | • | | The investment experience of a particular shareholder in a fund would vary depending on when such shareholder invested in the fund, the class held (if multiple classes are offered in the fund) and the performance of the fund (or respective class) during that shareholder’s investment period. |
| | • | | Open-end funds offer multiple classes and the performance data provided for open-end funds was based on Class A shares. The performance of the other classes of a fund, however, should be substantially similar on a relative basis because all of the classes would be invested in the same portfolio of securities and differences in performance among classes could be principally attributed to the variations in distribution and servicing expenses of each class. |
| | • | | The Board recognized that the funds in the Performance Peer Group may differ somewhat from the Nuveen fund with which it is being compared and due to these differences, performance comparisons between certain of the Nuveen funds and their Performance Peer Groups may be inexact and the relevancy limited. The Board considered that management had classified the Performance Peer Group as low, medium and high in relevancy. The Board took the analysis of the relevancy of the Performance Peer Group into account when considering the comparative performance data. The Board also considered comparative performance of an applicable benchmark. While the Board was cognizant of the relative performance of a Fund’s peer set and/or benchmark(s), the Board evaluated Fund performance in light of the respective Fund’s investment objectives, investment parameters and guidelines and considered that the variations between the objectives and investment parameters or guidelines of the Fund with its peers and/or benchmarks result in differences in performance results. |
With respect to any Nuveen funds for which the Board has identified performance concerns, the Board monitors such funds closely until performance improves, discusses with the Adviser the reasons for such results, considers those steps necessary or appropriate to address such issues, and reviews the results of any efforts undertaken. The Board is aware, however, that shareholders chose to invest or remain invested in a fund knowing that the Adviser manages the fund and knowing the fund’s fee structure.
In considering the performance data, the Independent Board Members noted the following with respect to the Funds:
For Nuveen Large Cap Growth Opportunities Fund (the “Large Cap Growth Opportunities Fund”), the Board noted that, although the Fund ranked in its Performance Peer Group in the fourth quartile for the one- and three-year periods, the Fund was in the third quartile for the longer five-year period. The Fund also underperformed its benchmark for the one-, three- and five-year periods. The Board, however, recognized that the Fund provided positive absolute returns in the one-, three- and five-year periods and outperformed its benchmark in 2012 and 2013 on an annual basis before fees, but the market conditions in 2014 did not reward the Fund’s strategy, negatively impacting performance.
For Nuveen Mid Cap Growth Opportunities Fund (the “Mid Cap Growth Opportunities Fund”), the Board noted that, although the Fund underperformed its benchmark for the one-, three- and five-year periods, the Fund ranked in its Performance Peer Group in the second quartile for each of such periods.
For Nuveen Small Cap Growth Opportunities Fund (the “Small Cap Growth Opportunities Fund”), the Board noted that the Fund ranked in its Performance Peer Group in the first quartile in the one-year period, the second quartile in the three-year period and the third quartile in the five-year period. Further, although the Fund underperformed its benchmark in the three- and five-year periods, it outperformed its benchmark in the one-year period.
Based on their review, the Independent Board Members determined that each Fund’s investment performance had been satisfactory.
C. Fees, Expenses and Profitability
1. Fees and Expenses
The Board evaluated the management fees and other fees and expenses of each Fund (expressed as a percentage of average net assets) in absolute terms and in comparison to the fee and expense levels of a comparable universe of funds (the “Peer Universe”) and, with respect to open-end funds, to a more focused subset in the Peer Universe (the “Peer Group”), each selected by an independent third-party fund data provider. The Independent Board Members reviewed the methodology regarding the construction of the Peer Universe and Peer Group for each Fund. The Board reviewed, among other things, such Fund’s gross management fees, net management fees and net expense ratios in absolute terms as well as compared to the average and median fee and expense levels of the Peer Universe and/or Peer Group. The Board noted that the net total expense ratios paid by investors in the Funds were the most representative of an investor’s net experience. The Board Members also considered any fee waivers and/or expense reimbursement arrangements currently in effect for the Funds.
In reviewing the comparative fee and expense information, the Independent Board Members recognized that various factors such as the limited size and particular composition of the Peer Universe or Peer Group (including the inclusion of other Nuveen funds in the peer set); expense anomalies; changes in the funds comprising the Peer Universe or Peer Group from year to year; levels of reimbursement or fee waivers; the timing of information used; and differences in services provided can impact the comparative data limiting the usefulness of the data to help make a conclusive assessment of the Funds’ fees and expenses.
In reviewing the fee schedule for a fund, the Independent Board Members also considered the fund-level and complex-wide breakpoint schedules (described in further detail below) and any fee waivers and reimbursements provided by Nuveen. In reviewing fees and expenses, the Board considered the expenses and fees to be higher if they were over 10 basis points higher, slightly higher if they were approximately 6 to 10 basis points higher, in line if they were within approximately 5 basis points higher than the peer average and below if they were below the peer average of the Peer Group. In reviewing the reports, the Board noted that the majority of the Nuveen funds had a net expense ratio near or below their peer average.
The Independent Board Members recognized that the Large Cap Growth Opportunities Fund had a higher net management fee than the peer average but a net expense ratio that was in line with the peer average, and the Mid Cap Growth Opportunities Fund and the Small Cap Growth Opportunities Fund each had a net management fee and a net expense ratio that were below or in line with their peer averages.
Based on their review of the fee and expense information provided, the Independent Board Members determined that each Fund’s management fees (as applicable) to a Fund Adviser were reasonable in light of the nature, extent and quality of services provided to the Fund.
2. Comparisons with the Fees of Other Clients
The Board considered information regarding the fees a Fund Adviser assessed to the Nuveen funds compared to that of other clients as described in further detail below. With respect to non-municipal funds, such other clients of the Adviser and/or its affiliated sub-advisers may include: separately managed accounts (such as retail, institutional or wrap accounts), hedge funds, other investment companies that are not offered by Nuveen but are sub-advised by one of Nuveen’s affiliated sub-advisers, foreign investment companies offered by Nuveen, and collective investment trusts.
The Board recognized that each Fund had an affiliated sub-adviser and therefore the overall Fund management fee can be divided into two components, the fee retained by the Adviser and the fee paid to the Sub-Adviser. In reviewing the nature of the services provided by the Adviser, including through its affiliated sub-advisers, the Board considered the range of advisory fee rates for retail and institutional managed accounts advised by Nuveen-affiliated sub-advisers. The Board also reviewed, among other things, the average fee the affiliated sub-advisers assessed such clients as well as the range of fee rates assessed to the different types of clients (such as retail, institutional and wrap accounts as well as non-Nuveen funds) applicable to such sub-advisers.
In reviewing the comparative information, the Board also reviewed information regarding the differences between the Funds and the other clients, including differences in services provided, investment policies, investor profiles, compliance and regulatory requirements and account sizes. The Board recognized the breadth of services necessary to operate a registered investment company (as described above) and that, in general terms, the Adviser provided the administrative and other support services to the Funds and, although the Sub-Adviser may provide some of these services, the Sub-Adviser essentially provided the portfolio management services. In general, the Board noted that higher fee levels reflected higher levels of service provided by the Fund Adviser, increased investment management complexity, greater product management requirements and higher levels of business risk or some combination of the foregoing. The Independent Board Members considered the differences in structure and operations of separately managed accounts and hedge funds from registered funds and noted that the range of day-to-day services was not generally of the breadth required for the registered funds. Many of the additional administrative services provided by the Adviser were not required for institutional clients or funds sub-advised by a Nuveen-affiliated sub-adviser that were offered by other fund groups. The Independent Board Members also recognized that the management fee rates of the foreign funds advised by the Adviser may vary due to, among other things, differences in the client base, governing bodies, operational complexities and services covered by the management fee. Given the inherent differences in the various products, particularly the extensive services provided to the Funds, the Independent Board Members believed such facts justify the different levels of fees.
Annual Investment Management Agreement Approval Process (Unaudited) (continued)
3. Profitability of Fund Advisers
In conjunction with their review of fees, the Independent Board Members also considered the profitability of Nuveen for its advisory activities and its financial condition. The Independent Board Members reviewed, among other things, the adjusted operating margins for Nuveen for the last two calendar years, the revenues, expenses, net income (pre-tax and after-tax) and net revenue margins (pre-tax and after-tax) of Nuveen’s managed fund advisory activities for the last two calendar years, the allocation methodology used by Nuveen in preparing the profitability data and a history of the adjustments to the methodology due to changes in the business over time. The Independent Board Members also reviewed the revenues, expenses, net income (pre-tax and after-tax) and revenue margin (pre-tax and post-tax) of the Adviser and, as described in further detail below, each affiliated sub-adviser for the 2014 calendar year. In reviewing the profitability data, the Independent Board Members noted the subjective nature of cost allocation methodologies used to determine profitability as other reasonable methods could also have been employed but yield different results. The Independent Board Members reviewed an analysis of the key drivers behind the changes in revenues and expenses that impacted profitability in 2014. The Independent Board Members recognized that Nuveen’s net revenue margin from advisory activities for 2014 was consistent with 2013. The Independent Board Members also considered the profitability of Nuveen in comparison to the adjusted operating margins of other investment advisers with publicly available data and with comparable assets under management (based on asset size and asset composition) to Nuveen. The Independent Board Members noted that Nuveen’s adjusted operating margins appeared to be reasonable in relation to such other advisers. The Independent Board Members, however, recognized the difficulty of making comparisons of profitability from fund investment advisory contracts as the information is not generally publicly available, the information for the investment advisers that was publicly available may not be representative of the industry and various other factors would impact the profitability data such as differences in services offered, business mix, expense methodology and allocations, capital structure and costs, complex size, and types of funds and other accounts managed.
The Independent Board Members noted this information supplemented the profitability information requested and received during the year and noted that two Independent Board Members served as point persons to review the profitability analysis and methodologies employed, and any changes thereto, and to keep the Board apprised of such changes during the year.
The Independent Board Members determined that Nuveen appeared to be sufficiently profitable to operate as a viable investment management firm and to honor its obligations as a sponsor of the Nuveen funds. The Independent Board Members noted the Adviser’s continued expenditures to upgrade its investment technology and increase personnel and recognized the Adviser’s continued commitment to its business to enhance the Adviser’s capacity and capabilities in providing the services necessary to meet the needs of the Nuveen funds as they grow or change over time. The Independent Board Members also noted that the sub-advisory fees for the Nuveen funds are paid by the Adviser, however, the Board recognized that many of the sub-advisers, including the Sub-Adviser, are affiliated with Nuveen. The Independent Board Members also noted the increased resources and support available to Nuveen as well as an improved capital structure as a result of the TIAA-CREF Transaction.
With respect to the Sub-Adviser, the Independent Board Members reviewed the Sub-Adviser’s revenues, expenses and revenue margins (pre- and post-tax) for its advisory activities for the calendar year ended December 31, 2014. The Independent Board Members also reviewed profitability analysis reflecting the revenues, expenses and the revenue margin (pre- and post-tax) by asset type for the Sub-Adviser for the calendar year ended December 31, 2014.
In evaluating the reasonableness of the compensation, the Independent Board Members also considered other amounts paid to a Fund Adviser by the Funds as well as indirect benefits (such as soft dollar arrangements), if any, the Fund Adviser and its affiliates received or were expected to receive that were directly attributable to the management of a Fund. See Section E below for additional information on indirect benefits a Fund Adviser may receive as a result of its relationship with the Funds.
Based on their review, the Independent Board Members determined that the Adviser’s and the Sub-Adviser’s level of profitability was reasonable in light of the respective services provided.
D. Economies of Scale and Whether Fee Levels Reflect These Economies of Scale
The Independent Board Members recognized that, as the assets of a particular fund or the Nuveen complex in the aggregate increase over time, economies of scale may be realized, and the Independent Board Members considered the extent to which the funds benefit from such economies of scale. Although the Independent Board Members recognized that economies of scale are difficult to measure, the Board recognized that one method to help ensure the shareholders share in these benefits is to include breakpoints in the management fee schedule reducing fee rates as asset levels grow. The Independent Board Members noted that, subject to certain exceptions, the management fees of the funds in the Nuveen complex are generally comprised of a fund-level component and complex-level component. Each component of the management fee for each Fund included breakpoints to reduce management fee rates of the Fund as the Fund grows and, as described below, as the Nuveen complex grows. In addition to fund-specific breakpoint schedules which reduce the fee rates of a particular fund as its assets increase, the Independent Board Members recognized that the Adviser also passed on the benefits of economies of scale through the complex-wide fee arrangement which reduced management fee rates as assets in the fund complex reached certain levels. The complex-wide fee arrangement seeks to provide the benefits of economies of scale to fund shareholders when total fund complex assets increase, even if assets of a particular fund are unchanged or have decreased. The approach reflected the
notion that some of Nuveen’s costs were attributable to services provided to all its funds in the complex, and therefore all funds benefit if these costs were spread over a larger asset base. The Independent Board Members reviewed the breakpoint and complex-wide schedules and the fee reductions achieved as a result of such structures for the 2014 calendar year.
The Independent Board Members also noted that additional economies of scale were shared with shareholders of the Small Cap Growth Opportunities Fund through the adoption of a temporary expense cap. The Independent Board Members further considered that as part of the TIAA-CREF Transaction, Nuveen agreed, for a period of two years from the date of the closing of the TIAA-CREF Transaction, not to increase contractual management fees for any Nuveen fund and, with respect to funds with expense caps, not to raise expense cap levels for such funds from levels in effect at that time or scheduled to go into effect prior to the closing of the TIAA-CREF Transaction. The commitment would not limit or otherwise affect mergers or liquidations of any funds in the ordinary course.
Based on their review, the Independent Board Members concluded that the current fee structure was acceptable and reflected economies of scale to be shared with shareholders when assets under management increase.
E. Indirect Benefits
The Independent Board Members received and considered information regarding potential “fall out” or ancillary benefits the respective Fund Adviser or its affiliates may receive as a result of its relationship with the Funds. In this regard, the Independent Board Members recognized that an affiliate of the Adviser served as the Funds’ principal underwriter and may receive compensation therefore from, among other things, sales charges, distribution fees and shareholder services fees (which included fees received pursuant to any 12b-1 plan). The Independent Board Members therefore took into account, among other things, the 12b-1 fees retained by Nuveen during the last calendar year.
In addition to the above, the Independent Board Members considered whether the Fund Adviser received any benefits from soft dollar arrangements whereby a portion of the commissions paid by a Fund for brokerage may be used to acquire research that may be useful to the Fund Adviser in managing the assets of the Fund and other clients. The Funds’ portfolio transactions are allocated by the Sub-Adviser. Accordingly, the Independent Board Members considered that the Sub-Adviser may benefit from research provided by broker-dealers executing portfolio transactions on behalf of the Funds. With respect to any fixed income securities, however, the Board recognized that such securities generally trade on a principal basis that does not generate soft dollar credits. Similarly, the Board recognized that any research received pursuant to soft dollar arrangements by the Sub-Adviser may also benefit the Funds and shareholders to the extent the research enhanced the ability of the Sub-Adviser to manage the Funds. The Independent Board Members noted that the Sub-Adviser’s profitability may be somewhat lower if it had to acquire any such research services directly.
Based on their review, the Independent Board Members concluded that any indirect benefits received by a Fund Adviser as a result of its relationship with the Funds were reasonable and within acceptable parameters.
F. Other Considerations
The Independent Board Members did not identify any single factor discussed previously as all-important or controlling. The Board Members, including the Independent Board Members, concluded that the terms of each Advisory Agreement were fair and reasonable, that the respective Fund Adviser’s fees were reasonable in light of the services provided to each Fund and that the Advisory Agreements be renewed.
Notes
Notes
| | | | | | | | | | | | | | |
| | | | | | | | |
| | | | |
| | | | | | | | |
| | | | | |
| | Nuveen Investments: | | | | | | | | |
| | | | Serving Investors for Generations | | | | |
| | |
| | | | |
| | | |
| | | | Since 1898, financial advisors and their clients have relied on Nuveen Investments to provide dependable investment solutions through continued adherence to proven, long-term investing principles. Today, we offer a range of high quality equity and fixed-income solutions designed to be integral components of a well-diversified core portfolio. | | |
| | | |
| | | | | | |
| | | | |
| | | | | | Focused on meeting investor needs. Nuveen Investments provides high-quality investment services designed to help secure the longterm goals of institutional and individual investors as well as the consultants and financial advisors who serve them. Nuveen Investments markets a wide range of specialized investment solutions which provide investors access to capabilities of its high-quality boutique investment affiliates-Nuveen Asset Management, Symphony Asset Management, NWQ Investment Management Company, Santa Barbara Asset Management, Tradewinds Global Investors, Winslow Capital Management, and Gresham Investment Management. In total, Nuveen Investments managed more than $220 billion as of September 30, 2015. | | |
| | | | | |
| | | | | | | | | | |
| | | | | | Find out how we can help you. To learn more about how the products and services of Nuveen Investments may be able to help you meet your financial goals, talk to your financial advisor, or call us at (800) 257-8787. Please read the information provided carefully before you invest. Investors should consider the investment objective and policies, risk considerations, charges and expenses of any investment carefully. Where applicable, be sure to obtain a prospectus, which contains this and other relevant information. To obtain a prospectus, please contact your securities representative or Nuveen Investments, 333 W. Wacker Dr., Chicago, IL 60606. Please read the prospectus carefully before you invest or send money. Learn more about Nuveen Funds at: www.nuveen.com/mf | | |
| | | | | | |
| | | | | | | | | | | | |
| | Distributed by Nuveen Securities, LLC | 333 West Wacker Drive Chicago, IL 60606 | www.nuveen.com | | | | | | |
MAN-FCGO-1015P 12542-INV-Y-12/16
| | |
| | |  |
| Mutual Funds | |
| | | | | | |
| | | | | | | Annual Report October 31, 2015 |
| | | | | | | | | | | | | | |
| | | | | | | Share Class / Ticker Symbol |
| | | Fund Name | | | | Class A | | Class C | | Class R3 | | Class I | | |
| | |
| | Nuveen Large Cap Select Fund | | | | FLRAX | | FLYCX | | — | | FLRYX | | |
| | Nuveen Small Cap Select Fund | | | | EMGRX | | FHMCX | | ASEIX | | ARSTX | | |
| | | | | | | | | | | | |
| | | | | | |
| | | | |
| | | | | | | | |
| | |
| | Life is Complex. | | |
| | |
| | Nuveen makes things e-simple. | | |
| | |
| | It only takes a minute to sign up for e-Reports. Once enrolled, you’ll receive an e-mail as soon as your Nuveen Fund information is ready. No more waiting for delivery by regular mail. Just click on the link within the e-mail to see the report and save it on your computer if you wish. | | |
| | | | |
| | | | | | Free e-Reports right to your e-mail! | | |
| | | |
| | | | | | www.investordelivery.com If you receive your Nuveen Fund distributions and statements from your
financial advisor or brokerage account. |
| | | | |
| | | | or | | www.nuveen.com/accountaccess If you receive your Nuveen Fund distributions and statements directly from Nuveen. Must be preceded by or accompanied by a prospectus. NOT FDIC INSURED MAY LOSE VALUE
NO BANK GUARANTEE | | |
| | | | | | | | | | |
| | | | | | | | | | | | | |

Table
of Contents
Chairman’s Letter
to Shareholders

Dear Shareholders,
For better or for worse, the financial markets spent most of the past year waiting for the U.S. Federal Reserve (Fed) to end its accommodative monetary policy. The policy has propped up stock and bond markets since the Great Recession, but the question remains: how will markets behave without its influence? This uncertainty was a considerable source of volatility for stock and bond prices for much of 2015, despite the Fed carefully conveying its intention to raise rates slowly and only when the economy shows evidence of readiness.
As was widely expected, the long-awaited Fed rate hike materialized in mid-December. While the move was interpreted as a vote of confidence on the economy’s underlying strength, the Fed emphasized that future rate increases will be gradual and guided by its ongoing assessment of financial conditions. How efficiently the financial markets process the confluence of rising borrowing costs, softer commodity prices, stubbornly low U.S. inflation, and a strong U.S. dollar, against a backdrop of anemic global economic growth, remains to be seen.
Nevertheless, the global recovery continues to be led by the United States. Policy makers in Europe and Japan are deploying their available tools to try to bolster their economies’ fragile growth, while Chinese authorities have stepped up efforts to manage China’s slowdown. With sentiment regarding China growing increasingly bearish and the Fed now working toward normalizing its interest-rate policy, the actions of the world’s central banks remain under intense scrutiny.
In the meantime, asset prices could continue to churn as risks both known and unknown begin to emerge. In times like these, you can look to a professional investment manager with the experience and discipline to maintain the proper perspective on short-term events. And if the daily headlines do concern you, I encourage you to reach out to your financial advisor. Your financial advisor can help you evaluate your investment strategies in light of current events, your time horizon and risk tolerance.
On behalf of the other members of the Nuveen Fund Board, we look forward to continuing to earn your trust in the months and years ahead.
Sincerely,

William J. Schneider
Chairman of the Board
December 21, 2015
Portfolio Managers’
Comments
Nuveen Large Cap Select Fund
Nuveen Small Cap Select Fund
These Funds feature portfolio management by Nuveen Asset Management, LLC, an affiliate of Nuveen Investments, Inc.
David Chalupnik, CFA, and Tony Burger, CFA, are the portfolio managers for the Nuveen Large Cap Select Fund. David assumed portfolio management responsibilities in 2003 and Tony joined the management team for the Fund in 2004.
Mark Traster, CFA, and Gregory Ryan, CFA, are the portfolio managers for the Nuveen Small Cap Select Fund. Mark assumed portfolio manager responsibilities in 2008 and Greg joined the portfolio management team for the Fund in 2013.
On the following pages, the portfolio management teams for the Funds discuss economic and market conditions, key investment strategies and the Funds’ performance for the twelve-month reporting period ended October 31, 2015.
What factors affected the U.S. economy and the financial markets during the twelve-month reporting period ended October 31, 2015?
During this reporting period, the U.S. economy continued to expand at a moderate pace. The Federal Reserve (Fed) maintained efforts to bolster growth and promote progress toward its mandates of maximum employment and price stability by holding the benchmark fed funds rate at the record low level of zero to 0.25% that it established in December 2008, a level that remained in place until December 2015 when the Fed increased its benchmark rate to a range of 0.25% to 0.50% (subsequent to the close of this reporting period). At its October 2014 meeting, the Fed announced that it would end its bond-buying stimulus program as of November 1, 2014, after tapering its monthly asset purchases of mortgage-backed and longer-term Treasury securities from the original $85 billion per month to $15 billion per month over the course of seven consecutive meetings (December 2013 through September 2014). In making the announcement, the Fed cited substantial improvement in the labor market as well as sufficient underlying strength in the broader economy to support ongoing progress toward maximum employment in a context of price stability. The Fed also reiterated that it would continue to look at a wide range of factors, including labor market conditions, indicators of inflationary pressures and readings on financial developments, in determining future actions. Additionally, the Fed stated that it would likely maintain the current target range for the fed funds rate for a considerable time, especially if projected inflation continued to run below the Fed’s 2% longer run goal. However, if economic data shows faster progress, the Fed indicated that it could raise the fed funds rate sooner than expected.
The Fed changed its language slightly in December 2014, indicating it would be “patient” in normalizing monetary policy. This shift helped ease investors’ worries that the Fed might raise rates too soon. However, as employment data released early in 2015 continued to look strong, anticipation began building that the Fed could raise its main policy rate as soon as June. As widely expected, after its March meeting, the Fed eliminated “patient” from its statement, but also highlighted the policymakers’ less optimistic view of the economy’s overall health as well as downgraded their inflation projections. The Fed’s April meeting seemed to further signal that a June rate hike was off the table. While the Fed attributed the first quarter’s economic weakness to temporary factors, the meeting minutes from April revealed that many Committee members believed the economic data available in June would be insufficient to meet the Fed’s criteria for initiating a rate increase. The June meeting bore out that presumption and the Fed decided to keep the target rate near zero. But the Committee also continued to telegraph the likelihood of at least one rate increase in 2015, which many analysts forecasted for September.
Certain statements in this report are forward-looking statements. Discussions of specific investments are for illustration only and are not intended as recommendations of individual investments. The forward-looking statements and other views expressed herein are those of the portfolio managers as of the date of this report. Actual future results or occurrences may differ significantly from those anticipated in any forward-looking statements and the views expressed herein are subject to change at any time, due to numerous market and other factors. The Funds disclaim any obligation to update publicly or revise any forward-looking statements or views expressed herein.
Refer to the Glossary of Terms Used in this Report for further definition of the terms used within this section.
Portfolio Managers’ Comments (continued)
During the September 2015 meeting, the Fed decided to keep the federal funds rate near zero despite broad speculation that it would increase rates. The Committee said it will keep the rate near zero until the economy has seen further improvement toward reaching the Fed’s goals of maximum employment and inflation approaching 2%. This assessment will take into account a wide range of information, including measures of labor market conditions, indicators of inflation pressures and inflation expectations, and readings on financial and international developments. At the Fed’s October 2015 meeting, the Committee again held steady, while opening the door for a potential December rate hike. (The Fed did raise rates at its December meeting, subsequent to the close of this reporting period.)
The U.S. economy proved to be fairly resilient compared to other economies around the globe, boosted by an improving job market, declining gas prices and low mortgage rates. According to the government’s gross domestic product (GDP) “second” estimate, the U.S. economy increased at a 2.1% annualized rate in the third quarter of 2015, compared with increases of 3.9% in the second quarter, 0.6% in the first quarter of 2015 and 2.2% in the fourth quarter 2014. The deceleration in real GDP in the third quarter primarily reflected a downturn in private inventory investment and decelerations in exports, in nonresidential fixed investment, in state and local government spending and in residential fixed investment that were partly offset by a deceleration in imports. The Consumer Price Index (CPI) increased 0.2% essentially unchanged year-over-year as of October 2015. The core CPI (which excludes food and energy) increased 0.2% during the same period, below the Fed’s unofficial longer term inflation objective of 2.0%. As of October 2015, the U.S. unemployment rate was 5.0%, a figure that is also considered “full employment” by some Fed officials. The housing market continued to post consistent gains as of its most recent reading for September 2015. The average home price in the S&P/Case-Shiller Index of 20 major metropolitan areas rose 5.5% for the twelve months ended September 2015 (most recent data available at the time this report was prepared).
Meanwhile, a number of issues weighed on economies across the globe including geopolitical turmoil, weak growth overseas and sharply falling oil prices, which were caused by the faltering global economy and OPEC’s refusal to give up market share. Falling oil prices propelled significant appreciation in the U.S. dollar, which hit a multi-year high versus a basket of other major currencies, supported by the confident Fed and weaker data coming out of Europe, Japan and China. In an effort to improve their economic growth, countries across the globe maintained extraordinarily accommodative monetary policies. The European Central Bank (ECB) launched a massive quantitative easing program via a government bond-buying program that pumped more than 1 trillion euros into the weak eurozone economy, while other central banks around the world enacted more than 30 policy easing actions during the first few months of 2015.
Political drama also dominated the news partway through the reporting period, including the escalating tensions over Greece’s debt issues and aggressive policy intervention by the Chinese government to deflate the country’s stock market bubble. In late June, Greece took front and center in world market headlines with defaults on its payments to the International Monetary Fund and threats of a potential exit from the European Monetary Union (EMU). However, by mid-July, Greece had agreed to austerity measures in return for more bailout funds. Meanwhile, after skyrocketing for nearly a year, China’s stock market suddenly shifted gears in June and embarked on a massive sell-off that quickly spilled over to the rest of the world. Investors pulled money out of Chinese stocks despite efforts by China’s government to stem the tide, including further rate cuts, a 1 trillion yuan bond for infrastructure build-out, new regulations surrounding equity purchases and redemptions and the unexpected devaluation of the yuan currency in mid-August. A number of factors helped fuel the sell-off, including weak Chinese economic data and falling commodity prices. By August 2015, oil prices had fallen to their lowest levels of the reporting period with prices for West Texas Intermediate (WTI) crude dipping below the $40/barrel level for a short time. Following the drop, the price of WTI crude reversed course and ended the reporting period around $47/barrel.
With this backdrop, global volatility spiked across all asset classes during the reporting period. Oil and gas shares, other energy-related stocks and petrocurrencies were hit hard around the world due to dramatically falling commodity prices. In overseas stock markets, news of widespread monetary policy moves across the globe gave equities a boost through May. However, in the summer months renewed fears over China and uncertainty about the Fed’s next move hit markets, spurring a massive global sell-off in August. Overall for the reporting period, international equity markets were collectively much weaker than the U.S. market and ended with flat to negative returns. For example, the MSCI EAFE Index returned -0.07% for the twelve-month reporting period. Emerging market stocks experienced even greater headwinds from the strong U.S. dollar, weak Chinese data, the commodity sell-off and Fed uncertainty, significantly underperforming developed market peers. As measured by the MSCI Emerging Markets Index, this segment ended the period with a -14.53% return.
In the U.S., equities experienced a correction in August 2015 in connection with the above-mentioned factors and dipped again in late September, before rising back to mid-2015 levels in the final month of the reporting period. The S&P 500® Index ended up posting a return of 5.20% for the twelve-month reporting period. However, the positive overall index results masked the more than 40% spread between the return of the best performing sector, consumer discretionary and the worst performing sector, energy, which fell by more than 19%. Larger, more established companies outperformed riskier, smaller-cap stocks, which continued to be hampered by heightened risk aversion and the pending Fed rate tightening, which will remove liquidity from the market. The small-cap segment produced a 0.34% return as measured by the Russell 2000® Index versus a 4.86% return for the larger-cap Russell 1000® Index. Across the capitalization spectrum, growth stocks outperformed value stocks, particularly in the larger-cap area.
Nuveen Large Cap Select Fund
How did the Fund perform during the twelve-month reporting period ended October 31, 2015?
The tables in the Fund Performance and Expense Ratios section of this report provide total returns for the Fund for the one-year, five-year and ten-year periods ended October 31, 2015. Comparative performance information is provided for the Fund’s Class A Shares at net asset value (NAV). The Fund’s Class A Shares at NAV underperformed the S&P 500® Index and the Lipper Large-Cap Core Funds Classification Average during the twelve-month reporting period.
What strategies were used to manage the Fund during the reporting period and how did these strategies influence performance?
The Fund pursues long-term capital appreciation by investing primarily in the common stocks of companies that have market capitalizations of $5 billion or greater at the time of purchase. During the reporting period, we continued to employ our deep, rigorous research approach to find and invest in stocks that we believed had strong and/or improving fundamentals, attractive valuations and a catalyst to drive future performance. Our process focuses on constructing a portfolio that we believe offers the best opportunity to achieve superior, risk-adjusted returns over the long term. Throughout the reporting period, the Fund continued to reflect a cyclical tilt, primarily through a notable overweight in the consumer discretionary sector. The Fund’s exposure to the health care sector increased to an overweight due to price appreciation and the addition of new securities, while we moved to an underweight position in industrials.
The Fund underperformed the S&P 500® Index and Lipper average during a period of heighted volatility in the equity markets, particularly in the final months of the reporting period. The performance shortfall was primarily the result of stock selection in the industrial, financial and consumer discretionary sectors, which was only partially offset by strong stock selection in energy, a successful overweight in consumer discretionary and an underweight in energy, a sector that was down in the index.
In the industrial sector, the Fund experienced weak results from Kirby Corporation, which operates domestic tank barges, transports bulk liquids and services diesel engines. Kirby’s management announced a downward revision to its outlook for both the fourth quarter and full-year 2014 during the reporting period. The revision was due primarily to headwinds within the company’s land-based diesel engine services segment as a result of the collapse in oil prices and, to a lesser extent, its inland barge business. We eliminated this position early in the reporting period. Also, a position in large machinery and engine manufacturer Caterpillar Inc. was negatively impacted by the decline in crude oil prices and the global slowdown. Shares have been under pressure throughout the reporting period because a portion of the company’s revenues in the energy and transportation segment are tied to oil and gas prices. Toward the end of the reporting period, Caterpillar reported lower-than-expected third-quarter earnings, but more importantly, forecasted a drop in 2016 sales and profits, while trimming its full-year guidance due to a bleak outlook for global mining, drilling and construction activity. The company also announced it would eliminate as many as 10,000 jobs to cut costs. We exited our position in Caterpillar late in the reporting period. In addition, a position in American Airlines Group Inc. lagged. While the airline posted a “better than feared” first quarter with revenues mirroring consensus and earnings per share slightly exceeding, much of the underlying data was overshadowed by broader industry perceptions and macro fears. Our purchase of American Airlines was predicated on industry discipline surrounding new capacity. Since then, one of American Airlines’ largest competitors began bringing on capacity at a much quicker pace (and to a greater degree) than expected. Because we believed this would have an adverse impact on industry pricing and profitability in the near term, we exited the position.
Portfolio Managers’ Comments (continued)
In the financial sector, a position in SLM Corporation (Sallie Mae), which engages in the origination, servicing and administration of educational loans, lagged significantly. While second-quarter results were generally in line, investors’ concerns over student loan securitization spreads, which have widened, came into play. However, this widening was driven by rating actions of Federal Family Education Loan Program loans and shouldn’t have a direct impact on private student loan performance. As such, we maintained our position in SLM. Also, the Fund’s position in investment management firm Invesco LTD. underperformed on a relative basis as a result of the August global market sell-off, mixed product performance, fund flows and a strong dollar throughout the reporting period, which diminished assets under management. That being said, fund flows have turned positive in October and we continue to hold Invesco. We believe the company can continue to grow with its broad product set and global footprint, as well as potentially accelerate its share buybacks.
In the consumer discretionary area, the Fund’s underweight position in online retail giant Amazon.com, Inc. proved detrimental to performance. Earlier in 2015, Amazon.com separated the quarterly reporting of its cloud-hosting business (Amazon Web Services) from its core e-commerce retail business. Since then, the company has surprised investors with exceptional results in terms of both growth and profitability for Amazon Web Services, and the company’s shares have been bid up accordingly. Also, a position in retailer Macy’s Inc. detracted after its quarterly results fell short of expectations. Investors were particularly concerned with comparable store sales, which declined 2.1% to their lowest level in six years. Macy’s management also lowered guidance for the year, and we decided to exit this position.
The Fund benefited from pockets of strength in some of the underperforming sectors, such as consumer discretionary. For example, cruise line operator Royal Caribbean Cruises Limited posted solid quarterly numbers, while also benefiting from management’s comments regarding future booking trends and other initiatives. Royal Caribbean has several potential catalysts in play including the benefits of materially lower fuel prices, new ships being introduced in China, potential Cuban itineraries and a generally improving supply-and-demand outlook in the Caribbean, which had previously been in a state of overcapacity for years. Shares of one of the world’s largest home improvement retailers, Lowe’s Companies, Inc., also outperformed during the reporting period. Lowe’s posted solid quarterly results that were well ahead of consensus estimates, while giving upbeat forward guidance as the company targets continued improvement in its operating margins through 2017. We continue to like this stock because we expect the company to remain focused on merchandise improvement and differentiation. Also, offsetting some of the weakness discussed earlier in the industrial sector, Southwest Airlines Company topped consensus revenue and earnings-per-share estimates early in the reporting period. Southwest Airlines continued to generate strong free cash flow and return a portion back to shareholders through buybacks and dividends. Given the stock’s strong performance in 2014 and early 2015, we decided to harvest our gains and seek opportunities with greater upside potential.
Within consumer staples, grocery store chain Kroger Company continued to deliver solid quarterly results, exceeding consensus estimates on several metrics including sales, comparable store sales and earnings. Given Kroger’s price appreciation during the reporting period, we decided to sell the stock and harvest the gains.
In the health care sector, the Fund experienced favorable results from Boston Scientific Corporation, a medical device firm focused on cardiovascular treatments. The company announced that it had settled the Guidant litigation with Johnson & Johnson on very favorable terms. Boston Scientific is also benefiting from a multi-year margin improvement program, U.S. Food and Drug Administration approval for several new product innovations and an acquisition that was viewed positively. In the final days of the reporting period, shares of Boston Scientific jumped after the company released third-quarter results that showed revenue and earnings beating as well as increased revenue guidance for the full year. On the other hand, managed care company Humana Inc. was a relative underperformer. We purchased Humana in early June after the company put itself up for sale because we believed the Fund could benefit from an attractive deal premium. Subsequently, Aetna Inc. extended an acquisition offer to the company in early July. However, concerns over anti-trust scrutiny and the timing of when the deal would actually close have kept downward pressure on Humana’s stock price. Humana also posted mixed third-quarter results, and while the company did not offer specific guidance for 2016, the statements made were more cautionary in nature.
The information technology sector was home to several of the Fund’s top contributors, including two leading developers and distributors of video games, Electronic Arts Inc. and Activision Blizzard Inc. Both companies continue to benefit from a new generation of gaming consoles and the increasing shift toward the digital delivery of games over the internet, which is meaningfully raising their gross margins and free cash flow. Electronic Arts’ management team has done an exceptional job of expanding the reach and profit
margin of popular games such as Madden NFL and FIFA, while Activision Blizzard is devoting considerable resources to developing new games that are well received. Both companies have produced stronger-than-expected earnings for several quarters in a row and raised full-year guidance. We believe the outlook for Electronic Arts and Activision Blizzard remains favorable, both in the short term due to their current line-ups, the console cycle and the holiday season, and long term based on the other above-mentioned trends. A position in MasterCard, Inc. also aided results during the reporting period. The company continues to benefit from the secular trend toward plastic as a form of payment, while generating solid volumes and earnings. Shares were further propelled by evidence that both MasterCard and Visa may be allowed to increase their presence in China’s bankcard clearing market after the country’s cabinet issued a decision to open it. Offsetting some of the strength in the information technology sector was the Fund’s underweight position in technology and software giant Microsoft Corporation, which carries a more than 2% weight in the S&P 500® Index. The company reported its March quarter in which it beat profit and sales expectations, causing the stock to rebound smartly.
Nuveen Small Cap Select Fund
How did the Fund perform during the twelve-month reporting period ended October 31, 2015?
The tables in the Fund Performance and Expense Ratios section of this report provide total returns for the Fund for the one-year, five-year and ten-year periods ended October 31, 2015. Comparative performance information is provided for the Fund’s Class A Shares at net asset value (NAV). The Fund’s Class A Shares at NAV outperformed both the Russell 2000® Index and the Lipper Small-Cap Core Funds Classification Average during the twelve-month reporting period.
What strategies were used to manage the Fund during the reporting period and how did these strategies influence performance?
The Fund seeks to provide long-term capital appreciation by investing at least 80% of the sum of its net assets and the amount of any borrowings for investment purposes, primarily in the common stocks of small-capitalization companies with market capitalizations of $176.7 million to $4.3 billion at the time of purchase. During this reporting period, we continued to execute on our strategy of investing in well run small-cap companies that we believe offer good value in order to generate competitive returns for the Fund. We continued to tap into our firm’s strong fundamental research capabilities in order to find what we believe to be the best ideas within the small-cap universe. These companies exhibit strong cash flows and attractive valuations, plus have identifiable, near-term catalysts that could be realized over the next 12-24 months.
The Fund significantly outperformed the Russell benchmark and Lipper average during a period of heighted volatility for small-cap equities, particularly in the final three months of the reporting period, driven by concerns over growth in China and the emerging markets. Our focus on bottom-up stock selection was the primary driver of the Fund’s strong relative results. In eight of the ten benchmark sectors, the Fund outperformed or performed basically in line with the sector, showing the strongest relative results in the energy, health care, materials and consumer discretionary sectors. Stock selection detracted in the industrials and consumer staples sectors.
The Fund’s energy holdings bested the benchmark during the reporting period in the face of substantial volatility in the underlying commodity. Exploration and production (E&P) focused Callon Petroleum Company was our top-performing holding in the sector and one of the few stocks in energy to turn in strongly positive returns. With operations located primarily in the sweet spot of the Permian Basin, the company guided toward double-digit production and cash flow growth, while cutting discretionary capital spending by a much greater amount. During the reporting period, Callon Petroleum was able to shore up its balance sheet capacity with a successful secondary equity offering, allowing for potential reserve additions and cash flow growth in 2016 and beyond.
The Fund’s health care holdings also provided a strongly positive contribution, most notably among medical device companies. Our top performer was Abiomed, Inc., the manufacturer of the Impella percutaneous ventricular assist device used to provide circulatory support for patients experiencing severe cardiovascular issues. Abiomed received a boost from formal FDA approval in late March for its device’s use in high risk percutaneous coronary intervention, which should drive a sequence of additional regulatory events. Shares also reacted positively to several other factors: a second-quarter financial update that was well ahead of investor expectations; an annual analyst meeting that laid out the company’s substantial growth opportunity in a number of cardiovascular indications and reaffirmation that reimbursement for the Impella device should remain stable through 2017. Also, shares of Synageva
Portfolio Managers’ Comments (continued)
BioPharma Corporation (Synageva) more than doubled in price when the developer of therapies for rare diseases announced that it would be acquired by Alexion Pharmaceuticals in an $8.4 billion transaction. Alexion will gain access to Synageva’s drug Kanuma for LAL-deficiency as well as its proprietary egg white protein expression system. We sold our position in Synageva during the reporting period.
In the materials sector, our position in diversified U.S. building materials and products company Headwaters Inc. outperformed as it continued to deliver solid organic top-line results and margin expansion. Headwaters’ big growth driver is demand for its fly ash product, a by-product of burning coal that can be used instead of cement for construction projects. With the shortage in the supply of cement, along with dramatic price increases, fly ash is increasingly being used as a substitute. Headwaters also benefited from refinancing its debt and significantly bringing down interest expenses.
With the positive tailwinds provided by significantly lower energy prices and continued improvements in employment and wages, several of the Fund’s consumer-related holdings turned in strong results. For example, retailer Express Inc. was able to successfully navigate through a difficult retail environment in 2014 by managing down inventory. The company raised fourth-quarter sales and earnings guidance in early January and then posted even better results two months later. As the weak retail environment continued during 2015, Express continued to defy the odds, posting results that came in ahead of expectations over the following two quarters. Also, the Fund experienced favorable results from a position in Red Robin Gourmet Burgers, Inc., a casual dining restaurant chain. The company’s second-quarter earnings topped analysts’ estimates, plus earnings were up nearly 15% on a year-over-year basis due to strong margins and lower share count. Red Robin’s aggressive expansion strategy and popular loyalty program appear to be yielding results, leading to market share gains in the industry. Additionally, the Fund benefited from a position in Pool Corporation, the nation’s largest distributor of pool-related supplies and equipment. Pool’s results have modestly exceeded expectations in four of the past five quarters, but more importantly, the company’s long history of consistent execution has led investors to gravitate toward the stock in volatile markets. We eventually trimmed our position in Pool because its valuation appeared full on a near-term basis.
The financial sector was also a source of strength for the Fund, including a position in West Coast regional bank Western Alliance Bancorporation. The company posted favorable quarterly results marked by strong profitability, solid loan and deposit growth, and improving credit quality. Western Alliance is also in the process of an attractive synergistic merger that will lift its commercial lending pipeline in the attractive technology and health care verticals.
The most significant detractor to relative performance was stock selection in the industrials sector. The steep decline in oil prices led to investor anticipation of project deferrals and diminished capital spending by companies with leverage to the North American oil complex. Our position in MasTec Inc., which focuses on the build-out of energy and telecommunications infrastructure, was negatively impacted as the outlook for energy capital spending in 2015 brought uncertainty to its business outlook. However, we maintained a position in MasTec based on the backlog building within its oil and gas segment, which we believe sets the company up for a strong 2016. Away from energy-related issues, Tutor Perini Corporation, a leading non-residential construction company also detracted. The company’s second-quarter earnings plunged due to the loss of a large concrete project and delays in a large viaduct project, further reinforcing concerns about the company’s declining backlog. We sold out of the Fund’s position in Tutor Perini. The Fund also experienced weak results from a position in NN, Incorporated, a precision metal bearing and component supplier to original equipment manufacturers. The company’s primary exposure is in the automobile market, although it is currently in the process of diversifying into medical and industrial applications. NN’s second-quarter report came in slightly below expectations on revenue, but beat handily on earnings per share with no change in guidance. However, negative sentiment related to the Volkswagen emissions scandal and Chinese growth concerns have weighed on the auto sector broadly. We maintained our positive bias toward NN because its recent acquisition further diversifies the company’s business away from autos and toward the higher margin industrial and medical areas. Offsetting some of the weakness in industrials, shares of leading carpet tile manufacturer Interface Inc. performed strongly. The company benefited from improving non-residential demand, which is driving double-digit growth globally, as well as lower nylon input costs on the heels of the recent decrease in oil prices. We sold our position in Interface, Inc. during the reporting period.
In the consumer staples sector, organic food company SunOpta, Inc. reported disappointing second-quarter results and announced a material acquisition of Sunrise Holdings, the parent company of frozen fruit company Sunrise Growers. The market did not react favorably to this large deal, which required additional leverage and the issuance of more shares to fund the deal. However, we
believe the Sunrise transaction strategically positions Sunopta for accelerated growth and profitability. We continue to like and own this name and added to our position during the secondary offering. Also, several sectors that benefited performance overall were home to a few of the Fund’s laggards. In consumer discretionary, the Fund experienced sub-par results from its position in Capella Education Company, a for-profit online education company catering to working adults seeking mostly advanced degrees. Capella Education’s first-quarter results were somewhat disappointing with a modest earnings miss primarily due to increased marketing expenses. However, we believe the stock’s negative reaction was driven more by the company’s lowered expectations for new student enrollment for the second quarter and full year to the low single-digit level. We continue to like Capella Education and added to our position on weakness based on our expectations that the new marketing spend and program roll-outs will result in accelerating enrollment. In the apparel and luxury goods category, women’s accessories manufacturer Vera Bradley, Inc. provided a disappointing outlook for 2015 with its fourth-quarter earnings report. The report included substantial weakness in comparable-store sales driven by soft traffic and increased spending on marketing, its e-commerce initiative and compensation, which led us to sell the position. In the energy sector, our position in Rosetta Resources Inc. detracted from performance. This small-to-mid-cap E&P company has its primary operations centered in the cost-effective Eagle Ford Basin in Texas, with a second emerging play in the Delaware Basin of the Permian. Rosetta Resources delivered solid production and operating metrics, but the company was caught in the negative oil macro environment despite its willingness to cut capital spending by 20%. We exited out of the Fund’s position in Rosetta Resources.
The overall impact of the information technology sector was neutral during the reporting period, however, several of the Fund’s strongest performers were found in this sector. Our top contributor in the sector was Gigamon Inc., a provider of visibility management tools and solutions for enterprise and service providers. Although not a security provider itself, the company has experienced a dramatic increase in demand for its products as the need for security solutions has risen because its products enable technology managers to better address security vulnerabilities. Gigamon is also benefiting from other growth drivers such as virtualization, 4G mobile communications, voiceover LTE and network upgrade cycles. The Fund also experienced strong results from Spansion Inc., a semiconductor manufacturer specializing in memory and microcontroller products. The company was acquired by Cypress Semiconductor Corporation and we have maintained this position. We also saw strength from our position in SolarWinds Inc., a designer, developer and marketer of enterprise-class IT infrastructure management software to organizations of all sizes. The company’s product offerings range from individual software tools to more comprehensive software products that enable IT professionals to more efficiently and effectively manage their network, systems and application infrastructure. SolarWinds’ shares soared in October 2015 after the company agreed to be acquired and taken private by two private equity firms for $4.5 billion in cash. We have sold our positions in both Spansion, Inc. and SolarWinds Inc. On the other hand, we experienced weakness from our position in Synchronoss Technologies, Inc., the leading provider of activation and cloud storage solutions for telecommunications carriers and cable operators. Toward the end of the reporting period, an analyst floated a rumor that the company’s largest cloud customer, Verizon, was going to de-emphasize its cloud business due to a change in strategy. However, the rumor proved to be false and Verizon will continue its contract for four more years. We continued to like and own a position in Synchronoss because the company’s primary growth driver is the buildout of AT&T’s personal cloud platform, which should begin to produce revenue in 2016. Also, as its massive capital expenditures wind down, Synchronoss is poised to move from net-neutral free cash flow to generating in excess of $100 million in free cash flow.
Risk Considerations
Nuveen Large Cap Select Fund
Mutual fund investing involves risk; principal loss is possible. Equity investments, such as those held by the Fund, are subject to market risk, derivatives risk, and common stock risk. Foreign investments involve additional risks including currency fluctuations, political and economic instability, and lack of liquidity. These risks are magnified in emerging markets.
Nuveen Small Cap Select Fund
Mutual fund investing involves risk; principal loss is possible. Equity investments, such as those held by the Fund, are subject to market risk, derivatives risk, IPO risk, and common stock risk. Small-cap stocks are subject to greater volatility and liquidity risks. Foreign investments involve additional risks including currency fluctuations, political and economic instability, and lack of liquidity. These risks are magnified in emerging markets.
Fund Performance
and Expense Ratios
The Fund Performance and Expense Ratios for each Fund are shown within this section of the report.
Returns quoted represent past performance, which is no guarantee of future results. Current performance may be higher or lower than the performance shown. Investment returns and principal value will fluctuate so that when shares are redeemed, they may be worth more or less than their original cost. Returns without sales charges would be lower if the sales charge were included. Returns do not reflect the deduction of taxes that a shareholder would pay on Fund distributions or the redemption of Fund shares.
Returns may reflect fee waivers and/or expense reimbursements by the investment adviser during the periods presented. If any such waivers and/or reimbursements had not been in place, returns would have been reduced. See Notes to Financial Statements, Note 7—Management Fees and Other Transactions with Affiliates for more information. For the most recent month-end performance visit www.nuveen.com or call (800) 257-8787.
Returns reflect differences in sales charges and expenses, which are primarily differences in distribution and service fees, and assume reinvestment of dividends and capital gains.
Comparative index and Lipper return information is provided for Class A Shares at net asset value (NAV) only.
The expense ratios shown reflect total operating expenses (before fee waivers and/or expense reimbursements, if any) as shown in the most recent prospectus. The expense ratios include management fees and other fees and expense.
Fund Performance and Expense Ratios (continued)
Nuveen Large Cap Select Fund
Refer to the first page of this Fund Performance and Expense Ratios section for further explanation of the information included within this section. Refer to the Glossary of Terms Used in this Report for definitions of term used within this section.
Fund Performance
Average Annual Total Returns as of October 31, 2015
| | | | | | | | | | | | |
| | | Average Annual | |
| | | 1-Year | | | 5-Year | | | 10-Year | |
Class A Shares at NAV | | | 2.66% | | | | 12.31% | | | | 6.18% | |
Class A Shares at maximum Offering Price | | | (3.25)% | | | | 10.99% | | | | 5.55% | |
S&P 500® Index | | | 5.20% | | | | 14.33% | | | | 7.85% | |
Lipper Large-Cap Core Funds Classification Average | | | 3.33% | | | | 12.67% | | | | 7.01% | |
| | | |
Class C Shares | | | 1.85% | | | | 11.47% | | | | 5.36% | |
Class I Shares | | | 2.88% | | | | 12.59% | | | | 6.44% | |
Average Annual Total Returns as of September 30, 2015 (Most Recent Calendar Quarter)
| | | | | | | | | | | | |
| | | Average Annual | |
| | | 1-Year | | | 5-Year | | | 10-Year | |
Class A Shares at NAV | | | (2.29)% | | | | 11.58% | | | | 5.25% | |
Class A Shares at maximum Offering Price | | | (7.93)% | | | | 10.27% | | | | 4.63% | |
Class C Shares | | | (3.03)% | | | | 10.74% | | | | 4.44% | |
Class I Shares | | | (2.05)% | | | | 11.85% | | | | 5.53% | |
Indexes and Lipper averages are not available for direct investment.
Class A Shares have a maximum 5.75% sales charge (Offering Price). Class A Share purchases of $1 million or more are sold at net asset value without an up-front sales charge but may be subject to a contingent deferred sales charge (CDSC), also known as a back-end sales charge, if redeemed within twelve months of purchase. Class C Shares have a 1% CDSC for redemptions within less than twelve months, which is not reflected in the one-year total return. Class I Shares have no sales charge and may be purchased under limited circumstances or by specified classes of investors.
Expense Ratios as of Most Recent Prospectus
| | | | | | | | | | | | |
| | | Share Class | |
| | | Class A | | | Class C | | | Class I | |
Gross Expense Ratios | | | 1.31% | | | | 2.07% | | | | 1.06% | |
Net Expense Ratios | | | 1.30% | | | | 2.05% | | | | 1.05% | |
The Fund’s investment adviser has contractually agreed to waive fees and/or reimburse other Fund expenses through September 30, 2016, so that total annual Fund operating expenses (excluding 12b-1 distribution and/or service fees, interest expenses, taxes, acquired fund fees and expenses, fees incurred in acquiring and disposing of portfolio securities and extraordinary expenses) do not exceed 1.05% of the average daily net assets of any class of Fund shares. Fee waivers and/or expense reimbursements will not be terminated prior to that time without the approval of the Fund’s Board of Directors.
Growth of an Assumed $10,000 Investment as of October 31, 2015 – Class A Shares
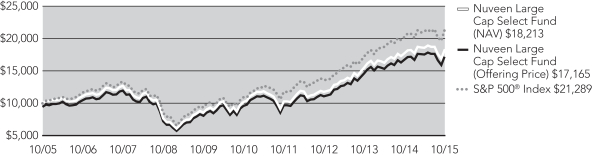
The graphs do not reflect the deduction of taxes that a shareholder may pay on Fund distributions or the redemption of Fund shares.
Nuveen Small Cap Select Fund
Refer to the first page of this Fund Performance and Expense Ratios section for further explanation of the information included within this section. Refer to the Glossary of Terms Used in this Report for definitions of term used within this section.
Fund Performance
Average Annual Total Returns as of October 31, 2015
| | | | | | | | | | | | |
| | | Average Annual | |
| | | 1-Year | | | 5-Year | | | 10-Year | |
Class A Shares at NAV | | | 4.08% | | | | 11.48% | | | | 7.29% | |
Class A Shares at maximum Offering Price | | | (1.88)% | | | | 10.16% | | | | 6.65% | |
Russell 2000® Index | | | 0.34% | | | | 12.06% | | | | 7.47% | |
Lipper Small-Cap Core Funds Classification Average | | | (0.32)% | | | | 11.30% | | | | 7.14% | |
| | | |
Class C Shares | | | 3.19% | | | | 10.63% | | | | 6.48% | |
Class R3 Shares | | | 3.75% | | | | 11.19% | | | | 7.02% | |
Class I Shares | | | 4.29% | | | | 11.75% | | | | 7.55% | |
Average Annual Total Returns as of September 30, 2015 (Most Recent Calendar Quarter)
| | | | | | | | | | | | |
| | | Average Annual | |
| | | 1-Year | | | 5-Year | | | 10-Year | |
Class A Shares at NAV | | | 3.85% | | | | 11.14% | | | | 6.22% | |
Class A Shares at maximum Offering Price | | | (2.15)% | | | | 9.83% | | | | 5.59% | |
Class C Shares | | | 3.14% | | | | 10.32% | | | | 5.43% | |
Class R3 Shares | | | 3.66% | | | | 10.88% | | | | 5.96% | |
Class I Shares | | | 4.21% | | | | 11.44% | | | | 6.49% | |
Indexes and Lipper averages are not available for direct investment.
Class A Shares have a maximum 5.75% sales charge (Offering Price). Class A Share purchases of $1 million or more are sold at net asset value without an up-front sales charge but may be subject to a contingent deferred sales charge (CDSC), also known as a back-end sales charge, if redeemed within twelve months of purchase. Class C Shares have a 1% CDSC for redemptions within less than twelve months, which is not reflected in the one-year total return. Class R3 Shares have no sales charge and are only available for purchase by eligible retirement plans. Class I Shares have no sales charge and may be purchased under limited circumstances or by specified classes of investors.
Expense Ratios as of Most Recent Prospectus
| | | | | | | | | | | | | | | | |
| | | Share Class | |
| | | Class A | | | Class C | | | Class R3 | | | Class I | |
Expense Ratios | | | 1.55% | | | | 2.31% | | | | 1.80% | | | | 1.30% | |
Growth of an Assumed $10,000 Investment as of October 31, 2015 – Class A Shares
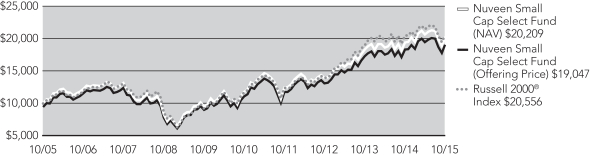
The graphs do not reflect the deduction of taxes that a shareholder may pay on Fund distributions or the redemption of Fund shares.
Holding
Summaries as of October 31, 2015
This data relates to the securities held in each Fund’s portfolio of investments as of the end of this reporting period. It should not be construed as a measure of performance for the Fund itself. Holdings are subject to change.
Nuveen Large Cap Select Fund
Fund Allocation
(% of net assets)
| | | | |
Common Stocks | | | 100.0% | |
Investments Purchased with Collateral from Securities Lending | | | 23.4% | |
Money Market Funds | | | 1.6% | |
Other Assets Less Liabilities | | | (25.0)% | |
Net Assets | | | 100% | |
Portfolio Composition
(% of net assets)
| | | | |
Software | | | 11.3% | |
Banks | | | 7.5% | |
Specialty Retail | | | 6.9% | |
Biotechnology | | | 6.4% | |
Technology Hardware, Storage & Peripherals | | | 5.6% | |
Pharmaceuticals | | | 5.5% | |
Capital Markets | | | 5.3% | |
Oil, Gas & Consumable Fuels | | | 4.9% | |
IT Services | | | 4.7% | |
Internet Software & Services | | | 4.3% | |
Health Care Providers & Services | | | 4.0% | |
Internet & Catalog Retail | | | 3.4% | |
Chemicals | | | 3.0% | |
Health Care Equipment & Supplies | | | 2.8% | |
Semiconductors & Semiconductor Equipment | | | 2.2% | |
Consumer Finance | | | 2.1% | |
Media | | | 2.0% | |
Other | | | 18.1% | |
Investments Purchased with Collateral from Securities Lending | | | 23.4% | |
Money Market Funds | | | 1.6% | |
Other Assets Less Liabilities | | | (25.0)% | |
Net Assets | | | 100% | |
Top Five Common Stock Holdings
(% of net assets)
| | | | |
Apple, Inc. | | | 5.6% | |
Microsoft Corporation | | | 3.8% | |
MasterCard, Inc. | | | 3.3% | |
JPMorgan Chase & Co. | | | 2.8% | |
Alphabet Inc., Class A | | | 2.8% | |
Nuveen Small Cap Select Fund
Fund Allocation
(% of net assets)
| | | | |
Common Stocks | | | 98.5% | |
Investments Purchased with Collateral from Securities Lending | | | 25.3% | |
Money Market Funds | | | 2.1% | |
Other Assets Less Liabilities | | | (25.9)% | |
Net Assets | | | 100% | |
Portfolio Composition
(% of net assets)
| | | | |
Banks | | | 10.1% | |
Real Estate Investment Trust | | | 7.0% | |
Health Care Equipment & Supplies | | | 6.9% | |
Software | | | 5.9% | |
Insurance | | | 5.4% | |
Semiconductors & Semiconductor Equipment | | | 3.9% | |
Hotels, Restaurants & Leisure | | | 3.9% | |
Machinery | | | 3.5% | |
Biotechnology | | | 3.3% | |
Electronic Equipment, Instruments & Components | | | 2.9% | |
Specialty Retail | | | 2.9% | |
Electrical Equipment | | | 2.8% | |
Internet Software & Services | | | 2.7% | |
Health Care Providers & Services | | | 2.7% | |
Communications Equipment | | | 2.7% | |
Professional Services | | | 2.1% | |
Oil, Gas & Consumable Fuels | | | 2.1% | |
Leisure Products | | | 2.1% | |
Gas Utilities | | | 1.7% | |
Construction & Engineering | | | 1.7% | |
Auto Components | | | 1.4% | |
Commercial Services & Supplies | | | 1.3% | |
Other | | | 19.5% | |
Investments Purchased with Collateral from Securities Lending | | | 25.3% | |
Money Market Funds | | | 2.1% | |
Other Assets Less Liabilities | | | (25.9)% | |
Net Assets | | | 100% | |
Top Five Common Stock Holdings
(% of net assets)
| | | | |
Brunswick Corporation | | | 2.1% | |
OSI Systems Inc. | | | 1.8% | |
Western Alliance Bancorporation | | | 1.7% | |
Laclede Group Inc. | | | 1.7% | |
MasTec Inc. | | | 1.7% | |
Expense
Examples
As a shareholder of one or more of the Funds, you incur two types of costs: (1) transaction costs, including up-front and back-end sales charges (loads) or redemption fees, where applicable; and (2) ongoing costs, including management fees; distribution and service (12b-1) fees, where applicable; and other Fund expenses. The Examples below are intended to help you understand your ongoing costs (in dollars) of investing in the Funds and to compare these costs with the ongoing costs of investing in other mutual funds.
The Examples below are based on an investment of $1,000 invested at the beginning of the period and held through the period ended October 31, 2015.
The beginning of the period is May 1, 2015.
The information under “Actual Performance,” together with the amount you invested, allows you to estimate actual expenses incurred over the reporting period. Simply divide your account value by $1,000 (for example, an $8,600 account value divided by $1,000 = 8.60) and multiply the result by the cost shown for your share class, in the row entitled “Expenses Incurred During Period” to estimate the expenses incurred on your account during this period.
The information under “Hypothetical Performance,” provides information about hypothetical account values and hypothetical expenses based on each respective Fund’s actual expense ratio and an assumed rate of return of 5% per year before expenses, which is not the Fund’s actual return. The hypothetical account values and expenses may not be used to estimate the actual ending account balance or expense you incurred for the period. You may use this information to compare the ongoing costs of investing in the Fund and other funds. To do so, compare this 5% hypothetical example with the 5% hypothetical examples that appear in the shareholder reports of the other funds.
Please note that the expenses shown in the table are meant to highlight your ongoing costs only and do not reflect any transaction costs. Therefore, the hypothetical information is useful in comparing ongoing costs only, and will not help you determine the relative total costs of owning different funds or share classes. In addition, if these transaction costs were included, your costs would have been higher.
Nuveen Large Cap Select Fund
| | | | | | | | | | | | |
| | | Share Class | |
| | | Class A | | | Class C | | | Class I | |
Actual Performance | | | | | | | | | | | | |
Beginning Account Value | | $ | 1,000.00 | | | $ | 1,000.00 | | | $ | 1,000.00 | |
Ending Account Value | | $ | 980.00 | | | $ | 976.20 | | | $ | 981.10 | |
Expenses Incurred During the Period | | $ | 6.04 | | | $ | 9.76 | | | $ | 4.79 | |
Hypothetical Performance (5% annualized return before expenses) | | | | | | | | | | | | |
Beginning Account Value | | $ | 1,000.00 | | | $ | 1,000.00 | | | $ | 1,000.00 | |
Ending Account Value | | $ | 1,019.11 | | | $ | 1,015.32 | | | $ | 1,020.37 | |
Expenses Incurred During the Period | | $ | 6.16 | | | $ | 9.96 | | | $ | 4.89 | |
For each class of the Fund, expenses are equal to the Fund’s annualized net expense ratio of 1.21%, 1.96% and 0.96% for Classes A, C and I, respectively, multiplied by the average account value over the period, multiplied by 184/365 (to reflect the one-half year period).
Nuveen Small Cap Select Fund
| | | | | | | | | | | | | | | | |
| | | Share Class | |
| | | Class A | | | Class C | | | Class R3 | | | Class I | |
Actual Performance | | | | | | | | | | | | | | | | |
Beginning Account Value | | $ | 1,000.00 | | | $ | 1,000.00 | | | $ | 1,000.00 | | | $ | 1,000.00 | |
Ending Account Value | | $ | 977.80 | | | $ | 973.00 | | | $ | 975.60 | | | $ | 978.10 | |
Expenses Incurred During the Period | | $ | 7.08 | | | $ | 10.79 | | | $ | 8.32 | | | $ | 5.83 | |
Hypothetical Performance (5% annualized return before expenses) | | | | | | | | | | | | | | | | |
Beginning Account Value | | $ | 1,000.00 | | | $ | 1,000.00 | | | $ | 1,000.00 | | | $ | 1,000.00 | |
Ending Account Value | | $ | 1,018.05 | | | $ | 1,014.27 | | | $ | 1,016.79 | | | $ | 1,019.31 | |
Expenses Incurred During the Period | | $ | 7.22 | | | $ | 11.02 | | | $ | 8.49 | | | $ | 5.96 | |
For each class of the Fund, expenses are equal to the Fund’s annualized net expense ratio of 1.42%, 2.17%, 1.67% and 1.17% for Classes A, C, R3 and I, respectively, multiplied by the average account value over the period, multiplied by 184/365 (to reflect the one-half year period).
Report of
Independent Registered Public Accounting Firm
To the Board of Directors and Shareholders of
Nuveen Investment Funds, Inc.:
In our opinion, the accompanying statements of assets and liabilities, including the portfolios of investments, and the related statements of operations and of changes in net assets and the financial highlights present fairly, in all material respects, the financial position of Nuveen Large Cap Select Fund and Nuveen Small Cap Select Fund (each a series of Nuveen Investment Funds, Inc., hereinafter referred to as the “Funds”) at October 31, 2015, the results of their operations for the year then ended, the changes in each of their net assets for each of the two years in the period then ended and the financial highlights for each of the four years in the period then ended, in conformity with accounting principles generally accepted in the United States of America. These financial statements and financial highlights (hereafter referred to as “financial statements”) are the responsibility of the Funds’ management. Our responsibility is to express an opinion on these financial statements based on our audits. We conducted our audits of these financial statements in accordance with the standards of the Public Company Accounting Oversight Board (United States). Those standards require that we plan and perform the audit to obtain reasonable assurance about whether the financial statements are free of material misstatement. An audit includes examining, on a test basis, evidence supporting the amounts and disclosures in the financial statements, assessing the accounting principles used and significant estimates made by management, and evaluating the overall financial statement presentation. We believe that our audits, which included confirmation of securities at October 31, 2015 by correspondence with the custodian and brokers, provide a reasonable basis for our opinion. The financial statements of the Funds for the year ended October 31, 2011 were audited by other independent auditors whose report dated December 28, 2011 expressed an unqualified opinion on those statements.
PricewaterhouseCoopers LLP
Chicago, IL
December 28, 2015
Nuveen Large Cap Select Fund
| | |
| Portfolio of Investments | | October 31, 2015 |
| | | | | | | | |
| Shares | | | Description (1) | | Value | |
| | |
| | | | LONG-TERM INVESTMENTS – 100.0% | | | | |
| | |
| | | | COMMON STOCKS – 100.0% | | | | |
| | |
| | | | Airlines – 1.7% | | | |
| | |
| | 14,396 | | | Delta Air Lines, Inc., (2) | | $ | 731,893 | |
| | |
| | | | Banks – 7.5% | | | |
| | |
| | 60,629 | | | Bank of America Corporation | | | 1,017,355 | |
| | |
| | 18,894 | | | Citigroup Inc. | | | 1,004,594 | |
| | |
| | 18,538 | | | JPMorgan Chase & Co. | | | 1,191,067 | |
| | | | Total Banks | | | 3,213,016 | |
| | |
| | | | Biotechnology – 6.4% | | | |
| | |
| | 15,124 | | | AbbVie Inc. | | | 900,634 | |
| | |
| | 2,493 | | | Alexion Pharmaceuticals Inc., (3) | | | 438,768 | |
| | |
| | 1,752 | | | Amgen Inc. | | | 277,131 | |
| | |
| | 1,067 | | | Biogen Inc., (3) | | | 309,974 | |
| | |
| | 1,156 | | | Bluebird Bio Inc., (2), (3) | | | 89,162 | |
| | |
| | 6,534 | | | Gilead Sciences, Inc. | | | 706,521 | |
| | | | Total Biotechnology | | | 2,722,190 | |
| | |
| | | | Capital Markets – 5.3% | | | |
| | |
| | 5,340 | | | Ameriprise Financial, Inc. | | | 616,022 | |
| | |
| | 26,465 | | | E*Trade Group Inc., (3) | | | 754,517 | |
| | |
| | 13,306 | | | Invesco LTD | | | 441,360 | |
| | |
| | 12,957 | | | TD Ameritrade Holding Corporation, (2) | | | 446,628 | |
| | | | Total Capital Markets | | | 2,258,527 | |
| | |
| | | | Chemicals – 3.0% | | | |
| | |
| | 12,549 | | | Dow Chemical Company | | | 648,407 | |
| | |
| | 5,924 | | | PPG Industries, Inc. | | | 617,636 | |
| | | | Total Chemicals | | | 1,266,043 | |
| | |
| | | | Consumer Finance – 2.1% | | | |
| | |
| | 10,390 | | | Discover Financial Services | | | 584,126 | |
| | |
| | 47,186 | | | SLM Corporation | | | 333,133 | |
| | | | Total Consumer Finance | | | 917,259 | |
| | |
| | | | Containers & Packaging – 0.5% | | | |
| | |
| | 4,031 | | | Crown Holdings Inc., (3) | | | 213,804 | |
| | |
| | | | Electric Utilities – 1.5% | | | |
| | |
| | 6,038 | | | NextEra Energy Inc. | | | 619,861 | |
| | |
| | | | Electrical Equipment – 1.0% | | | |
| | |
| | 4,605 | | | Hubbell Incorporated, Class B | | | 445,994 | |
Nuveen Large Cap Select Fund (continued)
| | |
| Portfolio of Investments | | October 31, 2015 |
| | | | | | | | |
| Shares | | | Description (1) | | Value | |
| | |
| | | | Food & Staples Retailing – 1.8% | | | |
| | |
| | 7,972 | | | CVS Health Corporation, (2) | | $ | 787,474 | |
| | |
| | | | Food Products – 1.7% | | | |
| | |
| | 16,133 | | | Tyson Foods, Inc., Class A, (2) | | | 715,660 | |
| | |
| | | | Health Care Equipment & Supplies – 2.8% | | | |
| | |
| | 28,500 | | | Boston Scientific Corporation, (2), (3) | | | 520,980 | |
| | |
| | 9,149 | | | Medtronic, PLC | | | 676,294 | |
| | | | Total Health Care Equipment & Supplies | | | 1,197,274 | |
| | |
| | | | Health Care Providers & Services – 4.0% | | | |
| | |
| | 4,769 | | | Aetna Inc. | | | 547,386 | |
| | |
| | 5,119 | | | CIGNA Corporation | | | 686,151 | |
| | |
| | 2,689 | | | Humana Inc. | | | 480,336 | |
| | | | Total Health Care Providers & Services | | | 1,713,873 | |
| | |
| | | | Hotels, Restaurants & Leisure – 1.6% | | | |
| | |
| | 7,038 | | | Royal Caribbean Cruises Limited, (2) | | | 692,187 | |
| | |
| | | | Household Durables – 2.0% | | | |
| | |
| | 8,527 | | | Jarden Corporation | | | 382,010 | |
| | |
| | 2,323 | | | Mohawk Industries Inc., (3) | | | 454,147 | |
| | | | Total Household Durables | | | 836,157 | |
| | |
| | | | Insurance – 1.9% | | | |
| | |
| | 17,518 | | | Hartford Financial Services Group, Inc. | | | 810,383 | |
| | |
| | | | Internet & Catalog Retail – 3.4% | | | |
| | |
| | 1,163 | | | Amazon.com, Inc., (3) | | | 727,922 | |
| | |
| | 491 | | | priceline.com Incorporated, (2), (3) | | | 714,032 | |
| | | | Total Internet & Catalog Retail | | | 1,441,954 | |
| | |
| | | | Internet Software & Services – 4.3% | | | |
| | |
| | 1,606 | | | Alphabet Inc., Class A, (3) | | | 1,184,248 | |
| | |
| | 6,268 | | | Facebook Inc., Class A Shares, (3) | | | 639,148 | |
| | | | Total Internet Software & Services | | | 1,823,396 | |
| | |
| | | | IT Services – 4.7% | | | |
| | |
| | 7,980 | | | Fidelity National Information Services | | | 581,902 | |
| | |
| | 14,351 | | | MasterCard, Inc., (2) | | | 1,420,605 | |
| | | | Total IT Services | | | 2,002,507 | |
| | |
| | | | Leisure Products – 1.1% | | | |
| | |
| | 6,268 | | | Hasbro, Inc., (2) | | | 481,570 | |
| | |
| | | | Machinery – 1.1% | | | |
| | |
| | 4,232 | | | Stanley Black & Decker Inc. | | | 448,507 | |
| | | | | | | | |
| Shares | | | Description (1) | | Value | |
| | |
| | | | Media – 2.0% | | | |
| | |
| | 13,473 | | | Comcast Corporation, Class A | | $ | 843,679 | |
| | |
| | | | Multiline Retail – 0.8% | | | |
| | |
| | 5,314 | | | Nordstrom, Inc. | | | 346,526 | |
| | |
| | | | Multi-Utilities – 1.4% | | | |
| | |
| | 5,668 | | | Sempra Energy | | | 580,460 | |
| | |
| | | | Oil, Gas & Consumable Fuels – 4.9% | | | |
| | |
| | 5,953 | | | Anadarko Petroleum Corporation | | | 398,137 | |
| | |
| | 11,640 | | | Newfield Exploration Company, (3) | | | 467,812 | |
| | |
| | 4,812 | | | Occidental Petroleum Corporation, (2) | | | 358,686 | |
| | |
| | 20,858 | | | Parsley Energy Inc. Class A Shares, (2), (3) | | | 369,812 | |
| | |
| | 3,610 | | | Pioneer Natural Resources Company | | | 495,075 | |
| | | | Total Oil, Gas & Consumable Fuels | | | 2,089,522 | |
| | |
| | | | Pharmaceuticals – 5.5% | | | |
| | |
| | 2,481 | | | Allergan PLC, (3) | | | 765,314 | |
| | |
| | 7,563 | | | Medicines Company, (2), (3) | | | 258,957 | |
| | |
| | 26,575 | | | Pfizer Inc. | | | 898,767 | |
| | |
| | 6,915 | | | Teva Pharmaceutical Industries Limited, Sponsored ADR | | | 409,299 | |
| | | | Total Pharmaceuticals | | | 2,332,337 | |
| | |
| | | | Semiconductors & Semiconductor Equipment – 2.2% | | | |
| | |
| | 28,330 | | | Applied Materials, Inc. | | | 475,094 | |
| | |
| | 9,327 | | | Broadcom Corporation, Class A | | | 479,408 | |
| | | | Total Semiconductors & Semiconductor Equipment | | | 954,502 | |
| | |
| | | | Software – 11.3% | | | |
| | |
| | 13,921 | | | Activision Blizzard Inc., (2) | | | 483,894 | |
| | |
| | 7,249 | | | Adobe Systems Incorporated, (2), (3) | | | 642,696 | |
| | |
| | 6,782 | | | Electronic Arts Inc., (2), (3) | | | 488,779 | |
| | |
| | 30,707 | | | Microsoft Corporation | | | 1,616,416 | |
| | |
| | 9,679 | | | Mobileye NV, (2), (3) | | | 440,588 | |
| | |
| | 5,912 | | | Red Hat, Inc., (2), (3) | | | 467,698 | |
| | |
| | 9,041 | | | Salesforce.com, Inc., (2), (3) | | | 702,576 | |
| | | | Total Software | | | 4,842,647 | |
| | |
| | | | Specialty Retail – 6.9% | | | |
| | |
| | 14,031 | | | Best Buy Co., Inc. | | | 491,506 | |
| | |
| | 8,472 | | | Foot Locker, Inc., (2) | | | 573,978 | |
| | |
| | 10,676 | | | Lowe’s Companies, Inc. | | | 788,209 | |
| | |
| | 3,723 | | | Signet Jewelers Limited | | | 561,950 | |
| | |
| | 41,751 | | | Staples, Inc., (2) | | | 542,345 | |
| | | | Total Specialty Retail | | | 2,957,988 | |
Nuveen Large Cap Select Fund (continued)
| | |
| Portfolio of Investments | | October 31, 2015 |
| | | | | | | | |
| Shares | | | Description (1) | | Value | |
| | |
| | | | Technology Hardware, Storage & Peripherals – 5.6% | | | |
| | |
| | 19,936 | | | Apple, Inc. | | $ | 2,382,354 | |
| | | | Total Long-Term Investments (cost $39,419,706) | | | 42,669,544 | |
| | |
| Shares | | | Description (1) | | Value | |
| | |
| | | | INVESTMENTS PURCHASED WITH COLLATERAL FROM SECURITIES LENDING – 23.4% | | | | |
| | |
| | | | Money Market Funds – 23.4% | | | |
| | |
| | 9,992,280 | | | Mount Vernon Securities Lending Prime Portfolio, 0.256%, (4), (5) | | $ | 9,992,280 | |
| | | | Total Investments Purchased with Collateral from Securities Lending (cost $9,992,280) | | | 9,992,280 | |
| | |
| Shares | | | Description (1) | | Value | |
| | |
| | | | SHORT-TERM INVESTMENTS – 1.6% | | | | |
| | |
| | | | Money Market Funds – 1.6% | | | |
| | |
| | 673,479 | | | First American Treasury Obligations Fund, Class Z, 0.000%, (4) | | $ | 673,479 | |
| | | | Total Short-Term Investments (cost $673,479) | | | 673,479 | |
| | | | Total Investments (cost $50,085,465) – 125.0% | | | 53,335,303 | |
| | | | Other Assets Less Liabilities – (25.0)% | | | (10,653,541 | ) |
| | | | Net Assets – 100% | | $ | 42,681,762 | |
For Fund portfolio compliance purposes, the Fund’s industry classifications refer to any one or more of the industry sub-classifications used by one or more widely recognized market indexes or ratings group indexes, and/or as defined by Fund management. This definition may not apply for purposes of this report which may combine industry sub-classifications into sectors for reporting ease.
| (1) | All percentages shown in the Portfolio of Investments are based on net assets. |
| (2) | Investment, or a portion of investment, is out on loan for securities lending. The total value of the securities out on loan as of the end of the reporting period was $9,665,038. |
| (3) | Non-income producing; issuer has not declared a dividend within the past twelve months. |
| (4) | The rate shown is the annualized seven-day effective yield as of the end of the reporting period. |
| (5) | The Fund may loan securities representing up to one third of the fair value of its total assets (which includes collateral for securities on loan) to broker dealers, banks, and other institutions. The Fund maintains collateral equal to at least 100% of the fair value of the securities loaned. The cash collateral received by the Fund is invested in this money market fund. See Notes to Financial Statements, Note 3 – Portfolio Securities and Investments in Derivatives, Securities Lending for more information. |
| ADR | American Depositary Receipt |
See accompanying notes to financial statements.
Nuveen Small Cap Select Fund
| | |
| Portfolio of Investments | | October 31, 2015 |
| | | | | | | | |
| Shares | | | Description (1) | | Value | |
| | |
| | | | LONG-TERM INVESTMENTS – 98.5% | | | | |
| | |
| | | | COMMON STOCKS – 98.5% | | | | |
| | |
| | | | Air Freight & Logistics – 1.1% | | | |
| | |
| | 50,817 | | | Hub Group, Inc., (2) | | $ | 2,031,664 | |
| | |
| | | | Auto Components – 1.4% | | | |
| | |
| | 48,657 | | | Tenneco Inc., (2) | | | 2,753,500 | |
| | |
| | | | Automobiles – 1.0% | | | |
| | |
| | 35,525 | | | Thor Industries, Inc. | | | 1,921,192 | |
| | |
| | | | Banks – 10.1% | | | |
| | |
| | 48,186 | | | Banner Corporation | | | 2,364,487 | |
| | |
| | 36,880 | | | Customers Bancorp Inc., (2) | | | 1,014,200 | |
| | |
| | 60,812 | | | East West Bancorp Inc. | | | 2,456,197 | |
| | |
| | 86,576 | | | Glacier Bancorp, Inc. | | | 2,368,719 | |
| | |
| | 46,883 | | | Privatebancorp, Inc. | | | 1,961,116 | |
| | |
| | 88,921 | | | Renasant Corporation, (3) | | | 3,079,334 | |
| | |
| | 78,894 | | | Webster Financial Corporation | | | 2,926,967 | |
| | |
| | 94,479 | | | Western Alliance Bancorporation, (2) | | | 3,377,624 | |
| | | | Total Banks | | | 19,548,644 | |
| | |
| | | | Biotechnology – 3.3% | | | |
| | |
| | 10,219 | | | Acadia Pharmaceuticals, Inc., (2), (3) | | | 355,826 | |
| | |
| | 5,414 | | | Anacor Pharmaceuticals Inc., (2) | | | 608,588 | |
| | |
| | 37,710 | | | Cepheid, Inc., (2), (3) | | | 1,259,514 | |
| | |
| | 24,123 | | | Dyax Corporation, (2) | | | 664,106 | |
| | |
| | 22,378 | | | Emergent BioSolutions, Inc., (2) | | | 719,453 | |
| | |
| | 24,455 | | | Insmed Incorporated, (2), (3) | | | 485,187 | |
| | |
| | 56,426 | | | Lion Biotechnologies Inc., (2) | | | 365,076 | |
| | |
| | 11,017 | | | Neurocrine Biosciences Inc., (2), (3) | | | 540,825 | |
| | |
| | 8,529 | | | Sage Therapeutics, Inc., (2), (3) | | | 428,412 | |
| | |
| | 9,155 | | | Ultragenyx Pharmaceutical Inc., (2), (3) | | | 909,549 | |
| | | | Total Biotechnology | | | 6,336,536 | |
| | |
| | | | Building Products – 1.0% | | | |
| | |
| | 110,673 | | | Continental Building Products Inc., (2) | | | 1,944,525 | |
| | |
| | | | Capital Markets – 1.1% | | | |
| | |
| | 40,733 | | | Evercore Partners Inc. | | | 2,199,582 | |
| | |
| | | | Chemicals – 1.2% | | | |
| | |
| | 69,783 | | | PolyOne Corporation | | | 2,333,544 | |
Nuveen Small Cap Select Fund (continued)
| | |
| Portfolio of Investments | | October 31, 2015 |
| | | | | | | | |
| Shares | | | Description (1) | | Value | |
| | |
| | | | Commercial Services & Supplies – 1.3% | | | |
| | |
| | 59,967 | | | HNI Corporation, (3) | | $ | 2,574,983 | |
| | |
| | | | Communications Equipment – 2.7% | | | |
| | |
| | 69,408 | | | Netgear, Inc., (2) | | | 2,873,491 | |
| | |
| | 43,665 | | | Plantronics Inc., (3) | | | 2,341,317 | |
| | | | Total Communications Equipment | | | 5,214,808 | |
| | |
| | | | Construction & Engineering – 1.7% | | | |
| | |
| | 193,591 | | | MasTec Inc., (2) | | | 3,246,521 | |
| | |
| | | | Construction Materials – 1.2% | | | |
| | |
| | 116,354 | | | Headwaters Inc., (2) | | | 2,391,075 | |
| | |
| | | | Consumer Finance – 0.6% | | | |
| | |
| | 167,913 | | | SLM Corporation | | | 1,185,466 | |
| | |
| | | | Containers & Packaging – 1.2% | | | |
| | |
| | 71,351 | | | Berry Plastics Corporation, (2) | | | 2,390,259 | |
| | |
| | | | Distributors – 1.0% | | | |
| | |
| | 23,707 | | | Pool Corporation, (3) | | | 1,933,069 | |
| | |
| | | | Diversified Consumer Services – 1.3% | | | |
| | |
| | 55,373 | | | Capella Education Company | | | 2,500,091 | |
| | |
| | | | Electric Utilities – 1.1% | | | |
| | |
| | 78,238 | | | PNM Resources Inc. | | | 2,200,053 | |
| | |
| | | | Electrical Equipment – 2.8% | | | |
| | |
| | 79,914 | | | Generac Holdings Inc., (2), (3) | | | 2,522,086 | |
| | |
| | 46,671 | | | Regal-Beloit Corporation | | | 2,977,143 | |
| | | | Total Electrical Equipment | | | 5,499,229 | |
| | |
| | | | Electronic Equipment, Instruments & Components – 2.9% | | | |
| | |
| | 40,167 | | | OSI Systems Inc., (2) | | | 3,461,592 | |
| | |
| | 210,641 | | | Vishay Intertechnology Inc., (3) | | | 2,232,795 | |
| | | | Total Electronic Equipment, Instruments & Components | | | 5,694,387 | |
| | |
| | | | Energy Equipment & Services – 1.1% | | | |
| | |
| | 95,833 | | | Matrix Service Company, (2) | | | 2,175,409 | |
| | |
| | | | Food & Staples Retailing – 1.1% | | | |
| | |
| | 85,495 | | | Natural Grocers by Vitamin Cottage Incorporated, (2), (3) | | | 2,047,605 | |
| | |
| | | | Food Products – 0.9% | | | |
| | |
| | 316,042 | | | SunOpta, Inc., (2), (3) | | | 1,700,306 | |
| | |
| | | | Gas Utilities – 1.7% | | | |
| | |
| | 57,466 | | | Laclede Group Inc., (3) | | | 3,365,784 | |
| | | | | | | | |
| Shares | | | Description (1) | | Value | |
| | |
| | | | Health Care Equipment & Supplies – 6.9% | | | |
| | |
| | 16,281 | | | Abiomed, Inc., (2), (3) | | $ | 1,199,258 | |
| | |
| | 76,969 | | | ConforMIS Inc., (2), (3) | | | 1,506,283 | |
| | |
| | 43,906 | | | Integra Lifesciences Holdings Corporation, (2) | | | 2,615,480 | |
| | |
| | 91,731 | | | K2M Group Holdings Inc., (2) | | | 1,674,091 | |
| | |
| | 48,845 | | | LDR Holding Corporation, (2), (3) | | | 1,235,779 | |
| | |
| | 191,987 | | | Nxstage Medical, Inc., (2), (3) | | | 3,208,103 | |
| | |
| | 55,296 | | | Zeltiq Aesthetics Inc., (2), (3) | | | 1,865,687 | |
| | | | Total Health Care Equipment & Supplies | | | 13,304,681 | |
| | |
| | | | Health Care Providers & Services – 2.7% | | | |
| | |
| | 63,127 | | | HealthSouth Corporation, (3) | | | 2,198,713 | |
| | |
| | 25,956 | | | Team Health Holdings Inc., (2) | | | 1,548,795 | |
| | |
| | 78,808 | | | Teladoc, Inc., (2), (3) | | | 1,550,153 | |
| | | | Total Health Care Providers & Services | | | 5,297,661 | |
| | |
| | | | Hotels, Restaurants & Leisure – 3.9% | | | |
| | |
| | 38,388 | | | Jack in the Box Inc., Term Loan | | | 2,861,058 | |
| | |
| | 32,385 | | | Red Robin Gourmet Burgers, Inc., (2) | | | 2,425,313 | |
| | |
| | 64,991 | | | Texas Roadhouse, Inc. | | | 2,232,441 | |
| | | | Total Hotels, Restaurants & Leisure | | | 7,518,812 | |
| | |
| | | | Household Durables – 1.1% | | | |
| | |
| | 74,509 | | | Ethan Allen Interiors Inc., (3) | | | 2,027,390 | |
| | |
| | | | Insurance – 5.4% | | | |
| | |
| | 108,112 | | | American Equity Investment Life Holding Company, (3) | | | 2,776,316 | |
| | |
| | 40,908 | | | Amerisafe, Inc. | | | 2,238,895 | |
| | |
| | 138,944 | | | CNO Financial Group Inc., (3) | | | 2,669,114 | |
| | |
| | 83,117 | | | Horace Mann Educators Corporation | | | 2,845,926 | |
| | | | Total Insurance | | | 10,530,251 | |
| | |
| | | | Internet Software & Services – 2.7% | | | |
| | |
| | 61,122 | | | Constant Contact Inc., (2) | | | 1,595,284 | |
| | |
| | 59,111 | | | Cornerstone OnDemand Inc., (2) | | | 1,861,997 | |
| | |
| | 84,164 | | | Wix.com Limited, (2), (3) | | | 1,861,708 | |
| | | | Total Internet Software & Services | | | 5,318,989 | |
| | |
| | | | IT Services – 1.3% | | | |
| | |
| | 72,232 | | | CSG Systems International Inc., (3) | | | 2,421,217 | |
| | |
| | | | Leisure Products – 2.1% | | | |
| | |
| | 73,925 | | | Brunswick Corporation | | | 3,977,900 | |
Nuveen Small Cap Select Fund (continued)
| | |
| Portfolio of Investments | | October 31, 2015 |
| | | | | | | | |
| Shares | | | Description (1) | | Value | |
| | |
| | | | Machinery – 3.5% | | | |
| | |
| | 85,572 | | | Altra Industrial Motion, Inc., (3) | | $ | 2,264,235 | |
| | |
| | 291,602 | | | Mueller Water Products Inc. | | | 2,566,098 | |
| | |
| | 142,759 | | | NN, Incorporated, (3) | | | 1,970,074 | |
| | | | Total Machinery | | | 6,800,407 | |
| | |
| | | | Oil, Gas & Consumable Fuels – 2.1% | | | |
| | |
| | 244,383 | | | Callon Petroleum Company, (2) | | | 2,121,244 | |
| | |
| | 12,841 | | | Diamondback Energy | | | 948,179 | |
| | |
| | 36,231 | | | RSP Permian Inc., (2), (3) | | | 993,454 | |
| | | | Total Oil, Gas & Consumable Fuels | | | 4,062,877 | |
| | |
| | | | Professional Services – 2.1% | | | |
| | |
| | 69,592 | | | Korn Ferry International | | | 2,531,061 | |
| | |
| | 53,183 | | | TrueBlue Inc., (2) | | | 1,540,712 | |
| | | | Total Professional Services | | | 4,071,773 | |
| | |
| | | | Real Estate Investment Trust – 7.0% | | | |
| | |
| | 143,917 | | | DiamondRock Hospitality Company | | | 1,680,951 | |
| | |
| | 43,931 | | | Entertainment Properties Trust | | | 2,495,720 | |
| | |
| | 60,079 | | | Highwoods Properties, Inc. | | | 2,610,433 | |
| | |
| | 79,556 | | | LaSalle Hotel Properties | | | 2,339,742 | |
| | |
| | 360,273 | | | MFA Mortgage Investments, Inc., (3) | | | 2,493,089 | |
| | |
| | 98,439 | | | STAG Industrial Inc. | | | 2,019,968 | |
| | | | Total Real Estate Investment Trust | | | 13,639,903 | |
| | |
| | | | Semiconductors & Semiconductor Equipment – 3.9% | | | |
| | |
| | 211,909 | | | Cypress Semiconductor Corporation, (3) | | | 2,233,521 | |
| | |
| | 54,397 | | | Mellanox Technologies, Limited, (2) | | | 2,562,643 | |
| | |
| | 78,026 | | | MKS Instruments Inc., (3) | | | 2,749,636 | |
| | | | Total Semiconductors & Semiconductor Equipment | | | 7,545,800 | |
| | |
| | | | Software – 5.9% | | | |
| | |
| | 69,304 | | | Broadsoft Inc., (2), (3) | | | 2,215,649 | |
| | |
| | 85,593 | | | Gigamon Inc., (2) | | | 2,245,104 | |
| | |
| | 27,301 | | | Proofpoint, Incorporated, (2), (3) | | | 1,923,082 | |
| | |
| | 71,075 | | | QLIK Technologies Inc., (2) | | | 2,229,623 | |
| | |
| | 80,736 | | | Synchronoss Technologies, Inc., (2), (3) | | | 2,840,292 | |
| | | | Total Software | | | 11,453,750 | |
| | |
| | | | Specialty Retail – 2.9% | | | |
| | |
| | 150,509 | | | Express Inc., (2), (3) | | | 2,904,824 | |
| | |
| | 114,708 | | | Kirkland’s, Inc., (2), (3) | | | 2,637,137 | |
| | | | Total Specialty Retail | | | 5,541,961 | |
| | | | | | | | |
| Shares | | | Description (1) | | Value | |
| | |
| | | | Textiles, Apparel & Luxury Goods – 1.1% | | | |
| | |
| | 61,609 | | | Steven Madden Limited, (2), (3) | | $ | 2,147,074 | |
| | |
| | | | Thrifts & Mortgage Finance – 1.1% | | | |
| | |
| | 128,259 | | | Everbank Financial Corporation | | | 2,213,750 | |
| | | | Total Long-Term Investments (cost $166,978,486) | | | 191,062,428 | |
| | |
| Shares | | | Description (1) | | Value | |
| | |
| | | | INVESTMENTS PURCHASED WITH COLLATERAL FROM SECURITIES LENDING – 25.3% | | | | |
| | |
| | | | Money Market Funds – 25.3% | | | |
| | |
| | 49,113,863 | | | Mount Vernon Securities Lending Prime Portfolio, 0.256%, (4), (5) | | $ | 49,113,863 | |
| | | | Total Investments Purchased with Collateral from Securities Lending (cost $49,113,863) | | | 49,113,863 | |
| | |
| Shares | | | Description (1) | | Value | |
| | |
| | | | SHORT-TERM INVESTMENTS – 2.1% | | | | |
| | |
| | | | Money Market Funds – 2.1% | | | |
| | |
| | 3,994,547 | | | First American Treasury Obligations Fund, Class Z, 0.000%, (4) | | $ | 3,994,547 | |
| | | | Total Short-Term Investments (cost $3,994,547) | | | 3,994,547 | |
| | | | Total Investments (cost $220,086,896) – 125.9% | | | 244,170,838 | |
| | | | Other Assets Less Liabilities – (25.9)% | | | (50,189,949 | ) |
| | | | Net Assets – 100% | | $ | 193,980,889 | |
For Fund portfolio compliance purposes, the Fund’s industry classifications refer to any one or more of the industry sub-classifications used by one or more widely recognized market indexes or ratings group indexes, and/or as defined by Fund management. This definition may not apply for purposes of this report which may combine industry sub-classifications into sectors for reporting ease.
| (1) | All percentages shown in the Portfolio of Investments are based on net assets. |
| (2) | Investment, or a portion of investment, is out on loan for securities lending. The total value of the securities out on loan as of the end of the reporting period was $46,968,228. |
| (3) | Non-income producing; issuer has not declared a dividend within the past twelve months. |
| (4) | The rate shown is the annualized seven-day effective yield as of the end of the reporting period. |
| (5) | The Fund may loan securities representing up to one third of the fair value of its total assets (which includes collateral for securities on loan) to broker dealers, banks, and other institutions. The Fund maintains collateral equal to at least 100% of the fair value of the securities loaned. The cash collateral received by the Fund is invested in this money market fund. See Notes to Financial Statements, Note 3 – Portfolio Securities and Investments in Derivatives, Securities Lending for more information. |
See accompanying notes to financial statements.
Statement of
| | | | |
| | Assets and Liabilities | | October 31, 2015 |
| | | | | | | | |
| | | Large Cap
Select | | | Small Cap
Select | |
Assets | | | | | | | | |
Long-term investments, at value (cost $39,419,706 and $166,978,486, respectively) | | $ | 42,669,544 | | | $ | 191,062,428 | |
Investments purchased with collateral from securities lending, at value (cost approximates value) | | | 9,992,280 | | | | 49,113,863 | |
Short-term investments, at value (cost approximates value) | | | 673,479 | | | | 3,994,547 | |
Receivables for: | | | | | | | | |
Dividends | | | 31,321 | | | | 52,420 | |
Due from broker | | | 1,374 | | | | 54,200 | |
Investments sold | | | 1,066,303 | | | | 3,733,610 | |
Reclaims | | | 1,717 | | | | — | |
Shares sold | | | 42,587 | | | | 214,141 | |
Other assets | | | 14,639 | | | | 33,532 | |
Total assets | | | 54,493,244 | | | | 248,258,741 | |
Liabilities | | | | | | | | |
Payables for: | | | | | | | | |
Collateral from securities lending program | | | 9,992,280 | | | | 49,113,863 | |
Investments purchased | | | 1,519,989 | | | | 4,500,335 | |
Shares redeemed | | | 250,498 | | | | 332,480 | |
Accrued expenses: | | | | | | | | |
Directors fees | | | 324 | | | | 15,603 | |
Management fees | | | 26,704 | | | | 145,517 | |
12b-1 distribution and service fees | | | 2,072 | | | | 27,204 | |
Other | | | 19,615 | | | | 142,850 | |
Total liabilities | | | 11,811,482 | | | | 54,277,852 | |
Net assets | | $ | 42,681,762 | | | $ | 193,980,889 | |
Class A Shares | | | | | | | | |
Net assets | | $ | 7,382,895 | | | $ | 82,079,967 | |
Shares outstanding | | | 358,559 | | | | 7,455,657 | |
Net asset value (“NAV”) per share | | $ | 20.59 | | | $ | 11.01 | |
Offering price per share (NAV per share plus maximum sales charge of 5.75% of offering price) | | $ | 21.85 | | | $ | 11.68 | |
Class C Shares | | | | | | | | |
Net assets | | $ | 683,748 | | | $ | 8,036,238 | |
Shares outstanding | | | 35,400 | | | | 929,765 | |
NAV and offering price per share | | $ | 19.31 | | | $ | 8.64 | |
Class R3 Shares | | | | | | | | |
Net assets | | $ | — | | | $ | 7,793,798 | |
Shares outstanding | | | — | | | | 750,760 | |
NAV and offering price per share | | $ | — | | | $ | 10.38 | |
Class I Shares | | | | | | | | |
Net assets | | $ | 34,615,119 | | | $ | 96,070,886 | |
Shares outstanding | | | 1,667,070 | | | | 7,428,085 | |
NAV and offering price per share | | $ | 20.76 | | | $ | 12.93 | |
Net assets consist of: | | | | | | | | |
Capital paid-in | | $ | 93,048,589 | | | $ | 142,375,145 | |
Undistributed (Over-distribution of) net investment income | | | 177,810 | | | | (28,198 | ) |
Accumulated net realized gain (loss) | | | (53,794,475 | ) | | | 27,550,000 | |
Net unrealized appreciation (depreciation) | | | 3,249,838 | | | | 24,083,942 | |
Net assets | | $ | 42,681,762 | | | $ | 193,980,889 | |
Authorized shares – per class | | | 2 billion | | | | 2 billion | |
Par value per share | | $ | 0.0001 | | | $ | 0.0001 | |
See accompanying notes to financial statements.
Statement of
| | | | |
| | Operations | | Year Ended October 31, 2015 |
| | | | | | | | |
| | | Large Cap
Select | | | Small Cap
Select | |
Investment Income | | | | | | | | |
Dividend and interest income (net of foreign tax withheld of $1,937 and $—, respectively) | | $ | 724,295 | | | $ | 2,820,474 | |
Securities lending income, net | | | 7,705 | | | | 131,199 | |
Total investment income | | | 732,000 | | | | 2,951,673 | |
Expenses | | | | | | | | |
Management fees | | | 338,047 | | | | 2,052,466 | |
12b-1 service fees – Class A Shares | | | 18,065 | | | | 234,875 | |
12b-1 distribution and service fees – Class C Shares | | | 8,436 | | | | 86,579 | |
12b-1 distribution and service fees – Class R3 Shares | | | — | | | | 43,512 | |
Shareholder servicing agent fees | | | 17,580 | | | | 415,726 | |
Custodian fees | | | 15,840 | | | | 42,262 | |
Directors fees | | | 1,189 | | | | 6,245 | |
Professional fees | | | 20,001 | | | | 35,614 | |
Shareholder reporting expenses | | | 6,658 | | | | 71,791 | |
Federal and state registration fees | | | 43,157 | | | | 57,793 | |
Other | | | 8,398 | | | | 6,855 | |
Total expenses | | | 477,371 | | | | 3,053,718 | |
Net investment income (loss) | | | 254,629 | | | | (102,045 | ) |
Realized and Unrealized Gain (Loss) | | | | | | | | |
Net realized gain (loss) from investments | | | 3,227,610 | | | | 35,032,905 | |
Change in net unrealized appreciation (depreciation) of investments | | | (2,149,683 | ) | | | (24,021,705 | ) |
Net realized and unrealized gain (loss) | | | 1,077,927 | | | | 11,011,200 | |
Net increase (decrease) in net assets from operations | | $ | 1,332,556 | | | $ | 10,909,155 | |
See accompanying notes to financial statements.
Statement of
| | | | | | | | | | | | | | | | | | |
| | | Large Cap Select | | | | | Small Cap Select | |
| | | Year Ended
10/31/15 | | | Year Ended
10/31/14 | | | | | Year Ended
10/31/15 | | | Year Ended
10/31/14 | |
Operations | | | | | | | | | | | | | | | | | | |
Net investment income (loss) | | $ | 254,629 | | | $ | 192,136 | | | | | $ | (102,045 | ) | | $ | (954,960 | ) |
Net realized gain (loss) from: | | | | | | | | | | | | | | | | | | |
Investments | | | 3,227,610 | | | | 7,100,517 | | | | | | 35,032,905 | | | | 87,405,895 | |
Futures contracts | | | — | | | | — | | | | | | — | | | | 564,302 | |
Change in net unrealized appreciation (depreciation) of investments | | | (2,149,683 | ) | | | (1,470,883 | ) | | | |
| (24,021,705
| )
| | | (64,802,560 | ) |
Net increase (decrease) in net assets from operations | | | 1,332,556 | | | | 5,821,770 | | | | | | 10,909,155 | | | | 22,212,677 | |
Distributions to Shareholders | | | | | | | | | | | | | | | | | | |
From net investment income: | | | | | | | | | | | | | | | | | | |
Class A Shares | | | (26,786 | ) | | | (14,541 | ) | | | | | — | | | | (244,437 | ) |
Class C Shares | | | — | | | | — | | | | | | — | | | | — | |
Class R3 Shares | | | — | | | | — | | | | | | — | | | | — | |
Class I Shares | | | (231,222 | ) | | | (174,566 | ) | | | | | — | | | | (1,067,494 | ) |
From accumulated net realized gains: | | | | | | | | | | | | | | | | | | |
Class A Shares | | | — | | | | — | | | | | | (25,790,799 | ) | | | (13,857,437 | ) |
Class C Shares | | | — | | | | — | | | | | | (2,732,315 | ) | | | (1,027,234 | ) |
Class R3 Shares | | | — | | | | — | | | | | | (2,665,298 | ) | | | (1,736,664 | ) |
Class I Shares | | | — | | | | — | | | | | | (30,829,009 | ) | | | (21,449,055 | ) |
Decrease in net assets from distributions to shareholders | | | (258,008 | ) | | | (189,107 | ) | | | | | (62,017,421 | ) | | | (39,382,321 | ) |
Fund Share Transactions | | | | | | | | | | | | | | | | | | |
Proceeds from sale of shares | | | 2,758,955 | | | | 9,935,926 | | | | | | 29,500,410 | | | | 58,154,693 | |
Proceeds from shares issued to shareholders due to reinvestment of distributions | | | 178,501 | | | | 113,474 | | | | | | 55,704,100 | | | | 36,227,694 | |
| | | 2,937,456 | | | | 10,049,400 | | | | | | 85,204,510 | | | | 94,382,387 | |
Cost of shares redeemed | | | (9,475,431 | ) | | | (7,124,667 | ) | | | | | (117,686,278 | ) | | | (275,782,690 | ) |
Net increase (decrease) in net assets from Fund share transactions | | | (6,537,975 | ) | | | 2,924,733 | | | | | | (32,481,768 | ) | | | (181,400,303 | ) |
Net increase (decrease) in net assets | | | (5,463,427 | ) | | | 8,557,396 | | | | | | (83,590,034 | ) | | | (198,569,947 | ) |
Net assets at the beginning of period | | | 48,145,189 | | | | 39,587,793 | | | | | | 277,570,923 | | | | 476,140,870 | |
Net assets at the end of period | | $ | 42,681,762 | | | $ | 48,145,189 | | | | | $ | 193,980,889 | | | $ | 277,570,923 | |
Undistributed (Over-distribution of) net investment income at the end of period | | $ | 177,810 | | | $ | 181,190 | | | | | $ | (28,198 | ) | | $ | (26,147 | ) |
See accompanying notes to financial statements.
THIS PAGE INTENTIONALLY LEFT BLANK
Financial
Highlights
Large Cap Select
Selected data for a share outstanding throughout the period:
| | | | | | | | | | | | | | | | | | | | | | | | | | | | | | | | | | |
| | | | | | | | | | | | | | | | | | | | | | | | | | | |
| | | | | | Investment Operations | | | | |
Less Distributions | | | | |
| | | | | | | | | |
Class (Commencement Date) Year Ended October 31, | | Beginning
NAV | | | Net
Investment
Income
(Loss)(a) | | | Net
Realized/
Unrealized
Gain (Loss) | | | Total | | | | | From
Net
Investment
Income | | | From
Accumulated
Net Realized
Gains | | | Total | | | Ending
NAV | |
Class A (1/03) | | | | | | | | | | | | | | | | | | | | | | | | | | | | | | | |
2015 | | $ | 20.13 | | | $ | 0.08 | | | $ | 0.46 | | | $ | 0.54 | | | | | $ | (0.08 | ) | | $ | — | | | $ | (0.08 | ) | | $ | 20.59 | |
2014 | | | 17.65 | | | | 0.05 | | | | 2.48 | | | | 2.53 | | | | | | (0.05 | ) | | | — | | | | (0.05 | ) | | | 20.13 | |
2013 | | | 13.42 | | | | 0.07 | | | | 4.22 | | | | 4.29 | | | | | | (0.06 | ) | | | — | | | | (0.06 | ) | | | 17.65 | |
2012 | | | 11.73 | | | | 0.03 | | | | 1.66 | | | | 1.69 | | | | | | — | | | | — | | | | — | | | | 13.42 | |
| 2011 | | | 11.65 | | | | (0.02 | ) | | | 0.10 | | | | 0.08 | | | | | | — | | | | — | | | | — | | | | 11.73 | |
Class C (1/03) | | | | | | | | | | | | | | | | | | | | | | | | | | | | | | | |
2015 | | | 18.96 | | | | (0.07 | ) | | | 0.42 | | | | 0.35 | | | | | | — | | | | — | | | | — | | | | 19.31 | |
2014 | | | 16.70 | | | | (0.09 | ) | | | 2.35 | | | | 2.26 | | | | | | — | | | | — | | | | — | | | | 18.96 | |
2013 | | | 12.73 | | | | (0.05 | ) | | | 4.02 | | | | 3.97 | | | | | | — | | | | — | | | | — | | | | 16.70 | |
2012 | | | 11.21 | | | | (0.06 | ) | | | 1.58 | | | | 1.52 | | | | | | — | | | | — | | | | — | | | | 12.73 | |
| 2011 | | | 11.22 | | | | (0.11 | ) | | | 0.10 | | | | (0.01 | ) | | | | | — | | | | — | | | | — | | | | 11.21 | |
Class I (1/03) | | | | | | | | | | | | | | | | | | | | | | | | | | | | | | | |
2015 | | | 20.30 | | | | 0.13 | | | | 0.46 | | | | 0.59 | | | | | | (0.13 | ) | | | — | | | | (0.13 | ) | | | 20.76 | |
2014 | | | 17.79 | | | | 0.09 | | | | 2.51 | | | | 2.60 | | | | | | (0.09 | ) | | | — | | | | (0.09 | ) | | | 20.30 | |
2013 | | | 13.52 | | | | 0.11 | | | | 4.26 | | | | 4.37 | | | | | | (0.10 | ) | | | — | | | | (0.10 | ) | | | 17.79 | |
2012 | | | 11.80 | | | | 0.07 | | | | 1.66 | | | | 1.73 | | | | | | (0.01 | ) | | | — | | | | (0.01 | ) | | | 13.52 | |
| 2011 | | | 11.71 | | | | 0.01 | | | | 0.10 | | | | 0.11 | | | | | | (0.02 | ) | | | — | | | | (0.02 | ) | | | 11.80 | |
| | | | | | | | | | | | | | | | | | | | | | | | | | | | | | |
| | | | Ratios/Supplemental Data | |
| | | | | | | | | Ratios to Average
Net Assets Before
Waiver/Reimbursement | | | | | Ratios to Average
Net Assets After
Waiver/Reimbursement(c) | | | | |
| | | | | | | | |
Total
Return(b) | | | Ending
Net
Assets
(000) | | | | | Expenses | | | Net
Investment
Income
(Loss) | | | | | Expenses | | | Net
Investment
Income
(Loss) | | | Portfolio
Turnover
Rate(d) | |
| | | | | | | | | | | | | | | | | | | | | | | | | | | | | | |
| | 2.66 | % | | $ | 7,383 | | | | | | 1.25 | % | | | 0.36 | % | | | | | 1.25 | % | | | 0.36 | % | | | 124 | % |
| | 14.35 | | | | 6,511 | | | | | | 1.31 | | | | 0.23 | | | | | | 1.30 | | | | 0.24 | | | | 154 | |
| | 32.14 | | | | 4,625 | | | | | | 1.33 | | | | 0.43 | | | | | | 1.33 | | | | 0.43 | | | | 117 | |
| | 14.41 | | | | 2,924 | | | | | | 1.43 | | | | 0.26 | | | | | | 1.43 | | | | 0.26 | | | | 127 | |
| | 0.69 | | | | 2,938 | | | | | | 1.20 | | | | (0.18 | ) | | | | | 1.20 | | | | (0.18 | ) | | | 139 | |
| | | | | | | | | | | | | | | | | | | | | | | | | | | | | | |
| | 1.85 | | | | 684 | | | | | | 2.00 | | | | (0.38 | ) | | | | | 2.00 | | | | (0.38 | ) | | | 124 | |
| | 13.53 | | | | 683 | | | | | | 2.07 | | | | (0.53 | ) | | | | | 2.05 | | | | (0.51 | ) | | | 154 | |
| | 31.08 | | | | 518 | | | | | | 2.07 | | | | (0.34 | ) | | | | | 2.07 | | | | (0.34 | ) | | | 117 | |
| | 13.65 | | | | 195 | | | | | | 2.18 | | | | (0.49 | ) | | | | | 2.18 | | | | (0.49 | ) | | | 127 | |
| | (0.09 | ) | | | 183 | | | | | | 1.95 | | | | (0.90 | ) | | | | | 1.95 | | | | (0.90 | ) | | | 139 | |
| | | | | | | | | | | | | | | | | | | | | | | | | | | | | | |
| | 2.88 | | | | 34,615 | | | | | | 1.00 | | | | 0.63 | | | | | | 1.00 | | | | 0.63 | | | | 124 | |
| | 14.66 | | | | 40,952 | | | | | | 1.06 | | | | 0.48 | | | | | | 1.05 | | | | 0.49 | | | | 154 | |
| | 32.43 | | | | 34,444 | | | | | | 1.08 | | | | 0.72 | | | | | | 1.08 | | | | 0.72 | | | | 117 | |
| | 14.79 | | | | 34,554 | | | | | | 1.18 | | | | 0.54 | | | | | | 1.18 | | | | 0.54 | | | | 127 | |
| | 0.89 | | | | 58,314 | | | | | | 0.95 | | | | 0.07 | | | | | | 0.95 | | | | 0.07 | | | | 139 | |
| (a) | Per share Net Investment Income (Loss) is calculated using the average daily shares method. | |
| (b) | Total return is the combination of changes in NAV without any sales charge, reinvested dividend income at NAV and reinvested capital gains distributions at NAV, if any. Total returns are not annualized. | |
| (c) | After fee waiver and/or expense reimbursement from the Adviser, where applicable. | |
| (d) | Portfolio Turnover Rate is calculated based on the lesser of long-term purchases or sales (as disclosed in Note 5 – Investment Transactions) divided by the average long-term market value during the period. | |
See accompanying notes to financial statements.
Financial Highlights (continued)
Small Cap Select
Selected data for a share outstanding throughout each period:
| | | | | | | | | | | | | | | | | | | | | | | | | | | | | | | | | | |
| | | | | |
| | | | | | Investment Operations | | | | | Less Distributions | | | | |
| | | | | | | | | |
Class (Commencement Date) Year Ended October 31, | | Beginning
NAV | | | Net
Investment
Income
(Loss)(a) | | | Net
Realized/
Unrealized
Gain (Loss) | | | Total | | | | | From
Net
Investment
Income | | | From
Accumulated
Net Realized
Gains | | | Total | | | Ending
NAV | |
Class A (5/92) | | | | | | | | | | | | | | | | | | | | | | | | | | | | | | | |
2015 | | $ | 14.48 | | | $ | (0.02 | ) | | $ | 0.37 | | | $ | 0.35 | | | | | $ | — | | | $ | (3.82 | ) | | $ | (3.82 | ) | | $ | 11.01 | |
2014 | | | 15.02 | | | | (0.05 | ) | | | 0.87 | | | | 0.82 | | | | | | (0.02 | ) | | | (1.34 | ) | | | (1.36 | ) | | | 14.48 | |
2013 | | | 13.54 | | | | — | * | | | 3.63 | | | | 3.63 | | | | | | — | | | | (2.15 | ) | | | (2.15 | ) | | | 15.02 | |
2012 | | | 12.44 | | | | (0.05 | ) | | | 1.45 | | | | 1.40 | | | | | | — | | | | (0.30 | ) | | | (0.30 | ) | | | 13.54 | |
2011 | | | 11.72 | | | | (0.09 | ) | | | 0.81 | | | | 0.72 | | | | | | — | | | | — | | | | — | | | | 12.44 | |
Class C (9/01) | | | | | | | | | | | | | | | | | | | | | | | | | | | | | | | |
2015 | | | 12.28 | | | | (0.08 | ) | | | 0.26 | | | | 0.18 | | | | | | — | | | | (3.82 | ) | | | (3.82 | ) | | | 8.64 | |
2014 | | | 13.00 | | | | (0.14 | ) | | | 0.76 | | | | 0.62 | | | | | | — | | | | (1.34 | ) | | | (1.34 | ) | | | 12.28 | |
2013 | | | 12.09 | | | | (0.09 | ) | | | 3.15 | | | | 3.06 | | | | | | — | | | | (2.15 | ) | | | (2.15 | ) | | | 13.00 | |
2012 | | | 11.22 | | | | (0.13 | ) | | | 1.30 | | | | 1.17 | | | | | | — | | | | (0.30 | ) | | | (0.30 | ) | | | 12.09 | |
2011 | | | 10.65 | | | | (0.17 | ) | | | 0.74 | | | | 0.57 | | | | | | — | | | | — | | | | — | | | | 11.22 | |
Class R3 (1/94) | | | | | | | | | | | | | | | | | | | | | | | | | | | | | | | |
2015 | | | 13.91 | | | | (0.04 | ) | | | 0.33 | | | | 0.29 | | | | | | — | | | | (3.82 | ) | | | (3.82 | ) | | | 10.38 | |
2014 | | | 14.49 | | | | (0.08 | ) | | | 0.84 | | | | 0.76 | | | | | | — | | | | (1.34 | ) | | | (1.34 | ) | | | 13.91 | |
2013 | | | 13.17 | | | | (0.03 | ) | | | 3.50 | | | | 3.47 | | | | | | — | | | | (2.15 | ) | | | (2.15 | ) | | | 14.49 | |
2012 | | | 12.13 | | | | (0.08 | ) | | | 1.42 | | | | 1.34 | | | | | | — | | | | (0.30 | ) | | | (0.30 | ) | | | 13.17 | |
2011 | | | 11.46 | | | | (0.12 | ) | | | 0.79 | | | | 0.67 | | | | | | — | | | | — | | | | — | | | | 12.13 | |
Class I (5/92) | | | | | | | | | | | | | | | | | | | | | | | | | | | | | | | |
2015 | | | 16.30 | | | | 0.02 | | | | 0.43 | | | | 0.45 | | | | | | — | | | | (3.82 | ) | | | (3.82 | ) | | | 12.93 | |
2014 | | | 16.73 | | | | (0.02 | ) | | | 0.99 | | | | 0.97 | | | | | | (0.06 | ) | | | (1.34 | ) | | | (1.40 | ) | | | 16.30 | |
2013 | | | 14.82 | | | | 0.04 | | | | 4.02 | | | | 4.06 | | | | | | — | | | | (2.15 | ) | | | (2.15 | ) | | | 16.73 | |
2012 | | | 13.54 | | | | (0.02 | ) | | | 1.60 | | | | 1.58 | | | | | | — | | | | (0.30 | ) | | | (0.30 | ) | | | 14.82 | |
2011 | | | 12.73 | | | | (0.06 | ) | | | 0.87 | | | | 0.81 | | | | | | — | | | | — | | | | — | | | | 13.54 | |
| | | | | | | | | | | | | | | | | | | | | | | | | | | | | | |
| | | | Ratios/Supplemental Data | |
| | | | | | | | | Ratios to Average
Net Assets Before
Waiver/Reimbursement | | | | | Ratios to Average
Net Assets After
Waiver/Reimbursement(c) | | | | |
| | | | | | | | |
Total
Return(b) | | | Ending
Net
Assets
(000) | | | | | Expenses | | | Net
Investment
Income
(Loss) | | | | | Expenses(e) | | | Net
Investment
Income
(Loss) | | | Portfolio
Turnover
Rate(d) | |
| | | | | | | | | | | | | | | | | | | | | | | | | | | | | | |
| | 4.08 | % | | $ | 82,080 | | | | | | 1.42 | % | | | (0.14 | )% | | | | | 1.42 | % | | | (0.14 | )% | | | 75 | % |
| | 5.98 | | | | 100,733 | | | | | | 1.43 | | | | (0.37 | ) | | | | | 1.43 | | | | (0.37 | ) | | | 90 | |
| | 31.74 | | | | 161,488 | | | | | | 1.34 | | | | (0.01 | ) | | | | | 1.33 | | | | — | ** | | | 78 | |
| | 11.62 | | | | 155,624 | | | | | | 1.36 | | | | (0.49 | ) | | | | | 1.28 | | | | (0.41 | ) | | | 71 | |
| | 6.14 | | | | 275,994 | | | | | | 1.34 | | | | (0.74 | ) | | | | | 1.30 | | | | (0.70 | ) | | | 69 | |
| | | | | | | | | | | | | | | | | | | | | | | | | | | | | | |
| | 3.19 | | | | 8,036 | | | | | | 2.17 | | | | (0.88 | ) | | | | | 2.17 | | | | (0.88 | ) | | | 75 | |
| | 5.28 | | | | 8,976 | | | | | | 2.19 | | | | (1.12 | ) | | | | | 2.19 | | | | (1.12 | ) | | | 90 | |
| | 30.67 | | | | 10,331 | | | | | | 2.09 | | | | (0.75 | ) | | | | | 2.08 | | | | (0.74 | ) | | | 78 | |
| | 10.81 | | | | 10,058 | | | | | | 2.11 | | | | (1.21 | ) | | | | | 2.03 | | | | (1.13 | ) | | | 71 | |
| | 5.35 | | | | 14,009 | | | | | | 2.09 | | | | (1.50 | ) | | | | | 2.05 | | | | (1.45 | ) | | | 69 | |
| | | | | | | | | | | | | | | | | | | | | | | | | | | | | | |
| | 3.75 | | | | 7,794 | | | | | | 1.67 | | | | (0.38 | ) | | | | | 1.67 | | | | (0.38 | ) | | | 75 | |
| | 5.75 | | | | 11,570 | | | | | | 1.68 | | | | (0.61 | ) | | | | | 1.68 | | | | (0.61 | ) | | | 90 | |
| | 31.37 | | | | 19,673 | | | | | | 1.59 | | | | (0.25 | ) | | | | | 1.58 | | | | (0.25 | ) | | | 78 | |
| | 11.42 | | | | 18,386 | | | | | | 1.61 | | | | (0.69 | ) | | | | | 1.53 | | | | (0.61 | ) | | | 71 | |
| | 5.85 | | | | 20,044 | | | | | | 1.60 | | | | (1.00 | ) | | | | | 1.55 | | | | (0.95 | ) | | | 69 | |
| | | | | | | | | | | | | | | | | | | | | | | | | | | | | | |
| | 4.29 | | | | 96,071 | | | | | | 1.17 | | | | 0.11 | | | | | | 1.17 | | | | 0.11 | | | | 75 | |
| | 6.23 | | | | 156,292 | | | | | | 1.18 | | | | (0.11 | ) | | | | | 1.18 | | | | (0.11 | ) | | | 90 | |
| | 32.02 | | | | 283,064 | | | | | | 1.09 | | | | 0.24 | | | | | | 1.08 | | | | 0.25 | | | | 78 | |
| | 12.01 | | | | 261,760 | | | | | | 1.11 | | | | (0.19 | ) | | | | | 1.03 | | | | (0.11 | ) | | | 71 | |
| | 6.36 | | | | 273,983 | | | | | | 1.09 | | | | (0.49 | ) | | | | | 1.05 | | | | (0.45 | ) | | | 69 | |
| (a) | Per share Net Investment Income (Loss) is calculated using the average daily shares method. | |
| (b) | Total return is the combination of changes in NAV without any sales charge, reinvested dividend income at NAV and reinvested capital gains distributions at NAV, if any. Total returns are not annualized. | |
| (c) | After fee waiver and/or expense reimbursement from the Adviser, where applicable. | |
| (d) | Portfolio Turnover Rate is calculated based on the lesser of long-term purchases or sales (as disclosed in Note 5 – Investment Transactions) divided by the average long-term market value during the period. | |
| * | Rounds to less than $0.01 per share. | |
| ** | Rounds to less than 0.01%. | |
See accompanying notes to financial statements.
Notes to
Financial Statements
1. General Information and Significant Accounting Policies
General Information
Trust and Fund Information
Nuveen Investment Funds, Inc. (the “Trust”), is an open-end management investment company registered under the Investment Company Act of 1940, as amended. The Trust is comprised of Nuveen Large Cap Select Fund (“Large Cap Select”) and Nuveen Small Cap Select Fund (“Small Cap Select”), (each a “Fund” and collectively, the “Funds”), as diversified funds, among others. The Trust was incorporated in the State of Maryland on August 20, 1987.
The end of the reporting period for the Funds is October 31, 2015, and the period covered by these Notes to Financial Statements is the fiscal year ended October 31, 2015 (the “current fiscal period”).
Investment Adviser
The Funds’ investment adviser is Nuveen Fund Advisors, LLC (the “Adviser”), a wholly-owned subsidiary of Nuveen Investments, Inc. (“Nuveen”). The Adviser is responsible for each Fund’s overall investment strategy and asset allocation decisions. The Adviser has entered into sub-advisory agreements with Nuveen Asset Management, LLC (the “Sub-Adviser”), a subsidiary of the Adviser, under which the Sub-Adviser manages the investment portfolios of the Funds.
Investment Objectives and Principal Investment Strategies
Large Cap Select’s investment objective is capital appreciation. Under normal market conditions, the Fund invests at least 80% of the sum of its net assets and the amount of any borrowings for investment purposes in common stocks of large-capitalization companies, defined as companies that have market capitalizations of $5 billion or greater.
Small Cap Select’s investment objective is capital appreciation. Under normal market conditions, the Fund invests at least 80% of the sum of its net assets and the amount of any borrowings for investment purposes in common stocks of small-capitalization companies. Small capitalization companies are defined as companies that have market capitalizations within the market capitalization range of the companies in the Russell 2000 Index on the last business day of the month in which its most recent reconstitution was completed. Reconstitution of the index currently is completed in June of each year. On June 30, 2014, the range was $143 million to $4.51 billion.
Each Fund may invest up to 15% of its total assets in non-dollar denominated equity securities of non-U.S. issuers. In addition, each Fund may invest up to 25% of its assets, collectively, in non-dollar denominated equity securities of non-U.S. issuers and in dollar-denominated equity securities of non-U.S. issuers that are either listed on a U.S. stock exchange or represented by depositary receipts that may or may not be sponsored by a domestic bank. Up to 15% of each Fund’s total assets may be invested in equity securities of emerging market issuers. Each Fund also may utilize options, futures contracts, options on futures contracts and forward foreign currency exchanges contracts (“derivatives”) to manage market or business risk, enhance its return or hedge against adverse movements in currency exchange rates.
The Funds’ most recent prospectus provides further descriptions of each Fund’s investment objective, principal investment strategies and principal risks.
Significant Accounting Policies
Each Fund is an investment company and follows accounting and reporting guidance under Financial Accounting Standards Board (FASB) Accounting Standards Codification (ASC) Topic 946 “Financial Services-Investment Companies.” The following is a summary of significant accounting policies followed by the Funds in the preparation of their financial statements in accordance with accounting principles generally accepted in the United States of America (“U.S. GAAP”).
Investment Transactions
Investment transactions are recorded on a trade date basis. Realized gains and losses from investment transactions are determined on the specific identification method, which is the same basis used for federal income tax purposes.
Investment Income
Dividend income is recorded on the ex-dividend date or, for foreign securities, when information is available. Interest income is recorded on an accrual basis. Securities lending income is comprised of fees earned from borrowers and income earned on cash collateral investments, net of lending agent fees.
Professional Fees
Professional fees presented on the Statement of Operations consist of legal fees incurred in the normal course of operations, audit fees, tax consulting fees and, in some cases, workout expenditures. Workout expenditures are incurred in an attempt to protect or enhance an investment or to pursue other claims or legal actions on behalf of Fund shareholders. If a refund is received for workout expenditures paid in a prior reporting period, such amounts will be recognized as “Legal fee refund” on the Statement of Operations.
Dividends and Distributions to Shareholders
Dividends from net investment income are declared and distributed to shareholders annually. Net realized capital gains from investment transactions, if any, are declared and distributed to shareholders at least annually. Furthermore, capital gains are distributed only to the extent they exceed available capital loss carryforwards.
Distributions to shareholders are recorded on the ex-dividend date. The amount and timing of distributions are determined in accordance with federal income tax regulations, which may differ from U.S. GAAP.
Share Classes and Sales Charges
Class A Shares are generally sold with an up-front sales charge and incur a 0.25% annual 12b-1 service fee. Class A Share purchases of $1 million or more are sold at net asset value (“NAV”) without an up-front sales charge but may be subject to a contingent deferred sales charge (“CDSC”) if redeemed within twelve months of purchase. Class C Shares are sold without an up-front sales charge but incur a 0.75% annual 12b-1 distribution fee and a 0.25% annual 12b-1 service fee. Class C Shares are subject to a CDSC of 1% if redeemed within twelve months of purchase. Class R3 Shares are sold without an up-front sales charge but incur a 0.25% annual 12b-1 distribution fee and a 0.25% annual 12b-1 service fee. Class I Shares are not subject to any sales charge or 12b-1 distribution or service fees.
Multiclass Operations and Allocations
Income and expenses of the Funds that are not directly attributable to a specific class of shares are prorated among the classes based on the relative net assets of each class. Expenses directly attributable to a class of shares are recorded to the specific class. Currently, the only expenses that are allocated on a class-specific basis are 12b-1 distribution and service fees.
Realized and unrealized capital gains and losses of the Funds are prorated among the classes based on the relative net assets of each class.
Indemnifications
Under the Trust’s organizational documents, its officers and directors are indemnified against certain liabilities arising out of the performance of their duties to the Trust. In addition, in the normal course of business, the Trust enters into contracts that provide general indemnifications to other parties. The Trust’s maximum exposure under these arrangements is unknown as this would involve future claims that may be made against the Trust that have not yet occurred. However, the Trust has not had prior claims or losses pursuant to these contracts and expects the risk of loss to be remote.
Netting Agreements
In the ordinary course of business, the Funds may enter into transactions subject to enforceable International Swaps and Derivative Association, Inc. (“ISDA”) master agreements or other similar arrangements (“netting agreements”). Generally, the right to offset in netting agreements allows each Fund to offset certain securities and derivatives with a specific counterparty as well as any collateral received or delivered to that counterparty based on the terms of the agreements. Generally, each Fund manages its cash collateral and securities collateral on a counterparty basis.
The Funds’ investments subject to netting agreements as of the end of the reporting period, if any, are further described in Note 3 – Portfolio Securities and Investments in Derivatives.
Use of Estimates
The preparation of financial statements in conformity with U.S. GAAP requires management to make estimates and assumptions that affect the reported amounts of assets and liabilities at the date of the financial statements and the reported amounts of increases and decreases in net assets from operations during the reporting period. Actual results may differ from those estimates.
2. Investment Valuation and Fair Value Measurements
The fair valuation input levels as described below are for fair value measurement purposes.
Fair value is defined as the price that would be received upon selling an investment or transferring a liability in an orderly transaction to an independent buyer in the principal or most advantageous market for the investment. A three-tier hierarchy is used to maximize the use of observable market data and minimize the use of unobservable inputs and to establish classification of fair value measurements for disclosure purposes. Observable inputs reflect the assumptions market participants would use in pricing the asset or liability. Observable inputs are based on market data obtained from sources independent of the reporting entity. Unobservable inputs reflect the reporting entity’s own assumptions about the assumptions market
Notes to Financial Statements (continued)
participants would use in pricing the asset or liability. Unobservable inputs are based on the best information available in the circumstances. The following is a summary of the three-tiered hierarchy of valuation input levels.
| | |
| Level 1 – | | Inputs are unadjusted and prices are determined using quoted prices in active markets for identical securities. |
| Level 2 – | | Prices are determined using other significant observable inputs (including quoted prices for similar securities, interest rates, prepayment speeds, credit risk, etc.). |
| Level 3 – | | Prices are determined using significant unobservable inputs (including management’s assumptions in determining the fair value of investments). |
Common stocks and other equity-type securities are valued at the last sales price on the securities exchange on which such securities are primarily traded and are generally classified as Level 1. Securities primarily traded on the NASDAQ National Market (“NASDAQ”) are valued at the NASDAQ Official Closing Price and are generally classified as Level 1. However, securities traded on a securities exchange or NASDAQ for which there were no transactions on a given day or securities not listed on a securities exchange or NASDAQ are valued at the quoted bid price and are generally classified as Level 2. Prices of certain American Depositary Receipts (“ADR”) held by the Funds that trade in the United States are valued based on the last traded price, official closing price, or the most recent bid price of the underlying non-U.S.-traded stock, adjusted as appropriate for the underlying-to-ADR conversion ratio and foreign exchange rate, and from time-to-time may also be adjusted further to take into account material events that may take place after the close of the local non-U.S. market but before the close of the New York Stock Exchange, which may represent a transfer from a Level 1 to a Level 2 security.
Investments in investment companies are valued at their respective NAVs on the valuation date and are generally classified as Level 1.
Certain securities may not be able to be priced by the pre-established pricing methods as described above. Such securities may be valued by the Funds’ Board of Directors (the “Board”) and/or its appointee at fair value. These securities generally include, but are not limited to, restricted securities (securities which may not be publicly sold without registration under the Securities Act of 1933, as amended) for which a pricing service is unable to provide a market price; securities whose trading has been formally suspended; debt securities that have gone into default and for which there is no current market quotation; a security whose market price is not available from a pre-established pricing source; a security with respect to which an event has occurred that is likely to materially affect the value of the security after the market has closed but before the calculation of a Fund’s NAV (as may be the case in non-U.S. markets on which the security is primarily traded) or make it difficult or impossible to obtain a reliable market quotation; and a security whose price, as provided by the pricing service, is not deemed to reflect the security’s fair value. As a general principle, the fair value of a security would appear to be the amount that the owner might reasonably expect to receive for it in a current sale. A variety of factors may be considered in determining the fair value of such securities, which may include consideration of the following: yields or prices of investments of comparable quality, type of issue, coupon, maturity and rating, market quotes or indications of value from security dealers, evaluations of anticipated cash flows or collateral, general market conditions and other information and analysis, including the obligor’s credit characteristics considered relevant. These securities are generally classified as Level 2 or Level 3 depending on the priority of the significant inputs. Regardless of the method employed to value a particular security, all valuations are subject to review by the Board and/or its appointee.
The inputs or methodologies used for valuing securities are not an indication of the risks associated with investing in those securities. The following is a summary of each Fund’s fair value measurements as of the end of the reporting period:
| | | | | | | | | | | | | | | | |
| Large Cap Select | | Level 1 | | | Level 2 | | | Level 3 | | | Total | |
| Long-Term Investments*: | | | | | | | | | | | | | | | | |
Common Stocks | | $ | 42,669,544 | | | $ | — | | | $ | — | | | $ | 42,669,544 | |
| Investments Purchased with Collateral from Securities Lending | | | 9,992,280 | | | | — | | | | — | | | | 9,992,280 | |
| Short-Term Investments: | | | | | | | | | | | | | | | | |
Money Market Funds | | | 673,479 | | | | — | | | | — | | | | 673,479 | |
| Total | | $ | 53,335,303 | | | $ | — | | | $ | — | | | $ | 53,335,303 | |
| | | | |
| Small Cap Select | | | | | | | | | | | | |
| Long-Term Investments*: | | | | | | | | | | | | | | | | |
Common Stocks | | $ | 191,062,428 | | | $ | — | | | $ | — | | | $ | 191,062,428 | |
| Investments Purchased with Collateral from Securities Lending | | | 49,113,863 | | | | — | | | | — | | | | 49,113,863 | |
| Short-Term Investments: | | | | | | | | | | | | | | | | |
Money Market Funds | | | 3,994,547 | | | | — | | | | — | | | | 3,994,547 | |
| Total | | $ | 244,170,838 | | | $ | — | | | $ | — | | | $ | 244,170,838 | |
| * | Refer to the Fund’s Portfolio of Investments for industry classifications. |
The Board is responsible for the valuation process and has appointed the oversight of the daily valuation process to the Adviser’s Valuation Committee. The Valuation Committee, pursuant to the valuation policies and procedures adopted by the Board is responsible for making fair value determinations, evaluating the effectiveness of the Funds’ pricing policies and reporting to the Board. The Valuation Committee is aided in its efforts by the Adviser’s dedicated Securities Valuation Team, which is responsible for administering the daily valuation process and applying fair value methodologies as
approved by the Valuation Committee. When determining the reliability of independent pricing services for investments owned by the Funds, the Valuation Committee, among other things, conducts due diligence reviews of the pricing services and monitors the quality of security prices received through various testing reports conducted by the Securities Valuation Team.
The Valuation Committee will consider pricing methodologies it deems relevant and appropriate when making a fair value determination, based on the facts and circumstances specific to the portfolio instrument. Fair value determinations generally will be derived as follows, using public or private market information:
(i) If available, fair value determinations shall be derived by extrapolating from recent transactions or quoted prices for identical or comparable securities.
(ii) If such information is not available, an analytical valuation methodology may be used based on other available information including, but not limited to: analyst appraisals, research reports, corporate action information, issuer financial statements and shelf registration statements. Such analytical valuation methodologies may include, but are not limited to: multiple of earnings, discount from market value of a similar freely- traded security, discounted cash flow analysis, book value or a multiple thereof, risk premium/yield analysis, yield to maturity and/or fundamental investment analysis.
The purchase price of a portfolio instrument will be used to fair value the instrument only if no other valuation methodology is available or deemed appropriate, and it is determined that the purchase price fairly reflects the instrument’s current value.
For each portfolio security that has been fair valued pursuant to the policies adopted by the Board, the fair value price is compared against the last available and next available market quotations. The Valuation Committee reviews the results of such testing and fair valuation occurrences are reported to the Board.
3. Portfolio Securities and Investments in Derivatives
Portfolio Securities
Securities Lending
In order to generate additional income, the Fund may lend securities representing up to one-third of the value of its total assets (which includes collateral for securities on loan) to broker-dealers, banks or other institutions. When loaning securities, the Fund retains the benefits of owning the securities, including the economic equivalent of dividends or interest generated by the security. The Fund also has the ability to recall the securities on loan at any time.
The Fund’s policy is to receive, at the inception of a loan, cash collateral equal to at least 102% of the value of securities loaned, which is recognized as “Payable for collateral from securities lending program” on the Statement of Assets and Liabilities. Collateral for securities on loan is invested in a money market fund, which is recognized as “Investments purchased with collateral from securities lending, at value” on the Statement of Assets and Liabilities. The market value of the securities loaned is determined at the close of each business day in order to determine the adequacy of the collateral. If the value of the securities on loan increases such that the level of collateralization falls below 100%, additional collateral is received from the borrower on the next business day, which is recognized as “Due from broker” on the Statement of Assets and Liabilities.
Securities out on loan are subject to termination at any time at the option of the borrower or the Fund. Upon termination, the borrower is required to return to the Fund securities identical to the securities loaned. Generally, in the event the borrower defaults on its obligation to return the loaned securities, the Fund has the right to use the collateral to acquire identical securities. In the event the Fund is delayed or prevented from exercising its right to dispose of the collateral, there may be a loss to the Fund. Under the Fund’s securities lending agreement, however, the securities lending agent has indemnified the Fund against losses resulting from borrower default, except to the extent that those losses result from a decrease in the value of the collateral due to its investment by the Fund. The Fund bears the risk of loss with respect to the investment of collateral.
The Fund’s custodian, U.S. Bank National Association, serves as its securities lending agent. The Fund pays the custodian a fee based on its proportional share of the custodian’s expense of operating its securities lending program. Income earned from the securities lending program is paid to the Fund, net of any fees paid. Income from securities lending, net of fees paid, is recognized as “Securities lending income, net” on the Statement of Operations.
The following table presents the securities out on loan for the Funds and the collateral delivered related to those securities as of the end of the reporting period.
| | | | | | | | | | | | | | |
| Fund | | Asset Class out on Loan | | Long-Term
Investments, at Value | | | Collateral
Pledged (From)
Counterparty* | | | Net
Exposure | |
| Large Cap Select | | Common Stocks | | $ | 9,665,038 | | | $ | (9,665,038 | ) | | $ | — | |
| Small Cap Select | | Common Stocks | | | 46,968,228 | | | | (46,968,228 | ) | | | — | |
| * | As of the end of the reporting period, the value of the collateral pledged from the counterparty exceeded the value of the securities out on loan. Refer to the Fund’s Portfolio of Investments for details on the investments purchased with collateral from securities lending and the securities out on loan. |
Securities lending fees paid by the Fund during the current fiscal period were as follows:
| | | | | | | | |
| | | Large Cap
Select | | | Small Cap
Select | |
| Securities lending fees paid | | $ | 700 | | | $ | 18,606 | |
Notes to Financial Statements (continued)
Investments in Derivatives
Each Fund is authorized to invest in certain derivative instruments. The Funds record derivative instruments at fair value, with changes in fair value recognized on the Statement of Operations, when applicable. Even though the Funds’ investments in derivatives may represent economic hedges, they are not considered to be hedge transactions for financial reporting purposes.
Although the Funds are authorized to invest in derivative instruments, and may do so in the future, they did not make any such investments during the current fiscal period.
Market and Counterparty Credit Risk
In the normal course of business each Fund may invest in financial instruments and enter into financial transactions where risk of potential loss exists due to changes in the market (market risk) or failure of the other party to the transaction to perform (counterparty credit risk). The potential loss could exceed the value of the financial assets recorded on the financial statements. Financial assets, which potentially expose each Fund to counterparty credit risk, consist principally of cash due from counterparties on forward, option and swap transactions, when applicable. The extent of each Fund’s exposure to counterparty credit risk in respect to these financial assets approximates their carrying value as recorded on the Statement of Assets and Liabilities.
Each Fund helps manage counterparty credit risk by entering into agreements only with counterparties the Adviser believes have the financial resources to honor their obligations and by having the Adviser monitor the financial stability of the counterparties. Additionally, counterparties may be required to pledge collateral daily (based on the daily valuation of the financial asset) on behalf of each Fund with a value approximately equal to the amount of any unrealized gain above a pre-determined threshold. Reciprocally, when each Fund has an unrealized loss, the Funds have instructed the custodian to pledge assets of the Funds as collateral with a value approximately equal to the amount of the unrealized loss above a pre-determined threshold. Collateral pledges are monitored and subsequently adjusted if and when the valuations fluctuate, either up or down, by at least the pre-determined threshold amount.
4. Fund Shares
Transactions in Fund shares during the current and prior fiscal period were as follows:
| | | | | | | | | | | | | | | | |
| | | Year Ended
10/31/15 | | | Year Ended
10/31/14 | |
| Large Cap Select | | Shares | | | Amount | | | Shares | | | Amount | |
| Shares sold: | | | | | | | | | | | | | | | | |
Class A | | | 81,389 | | | $ | 1,696,526 | | | | 94,464 | | | $ | 1,757,860 | |
Class C | | | 22,172 | | | | 431,699 | | | | 7,807 | | | | 138,030 | |
Class I | | | 29,957 | | | | 630,730 | | | | 412,329 | | | | 8,040,036 | |
| Shares issued to shareholders due to reinvestment of distributions: | | | | | | | | | | | | | | | | |
Class A | | | 1,196 | | | | 24,872 | | | | 773 | | | | 14,468 | |
Class C | | | — | | | | — | | | | — | | | | — | |
Class I | | | 7,340 | | | | 153,629 | | | | 5,258 | | | | 99,006 | |
| | | | 142,054 | | | | 2,937,456 | | | | 520,631 | | | | 10,049,400 | |
| Shares redeemed: | | | | | | | | | | | | | | | | |
Class A | | | (47,387 | ) | | | (994,200 | ) | | | (34,009 | ) | | | (641,238 | ) |
Class C | | | (22,793 | ) | | | (432,615 | ) | | | (2,830 | ) | | | (50,528 | ) |
Class I | | | (387,520 | ) | | | (8,048,616 | ) | | | (336,969 | ) | | | (6,432,901 | ) |
| | | | (457,700 | ) | | | (9,475,431 | ) | | | (373,808 | ) | | | (7,124,667 | ) |
| Net increase (decrease) | | | (315,646 | ) | | $ | (6,537,975 | ) | | | 146,823 | | | $ | 2,924,733 | |
| | | | |
| Small Cap Select | | | | | | | | | | | | |
| Shares sold: | | | | | | | | | | | | | | | | |
Class A | | | 1,193,375 | | | $ | 13,818,203 | | | | 1,661,141 | | | $ | 23,596,548 | |
Class A – automatic conversion of Class B Shares | | | — | | | | — | | | | 82,129 | | | | 1,187,668 | |
Class B – exchanges | | | — | | | | — | | | | 1,142 | | | | 11,203 | |
Class C | | | 53,958 | | | | 483,464 | | | | 20,462 | | | | 246,894 | |
Class R3 | | | 178,413 | | | | 1,929,280 | | | | 262,223 | | | | 3,587,199 | |
Class I | | | 978,280 | | | | 13,269,463 | | | | 1,855,955 | | | | 29,525,181 | |
| Shares issued to shareholders due to reinvestment of distributions: | | | | | | | | | | | | | | | | |
Class A | | | 2,472,811 | | | | 25,593,597 | | | | 1,010,359 | | | | 13,831,278 | |
Class B | | | — | | | | — | | | | 19,287 | | | | 184,391 | |
Class C | | | 318,086 | | | | 2,601,946 | | | | 83,475 | | | | 973,319 | |
Class R3 | | | 272,307 | | | | 2,663,158 | | | | 132,067 | | | | 1,736,664 | |
Class I | | | 2,048,260 | | | | 24,845,399 | | | | 1,264,294 | | | | 19,502,042 | |
| | | | 7,515,490 | | | | 85,204,510 | | | | 6,392,534 | | | | 94,382,387 | |
| Shares redeemed: | | | | | | | | | | | | | | | | |
Class A | | | (3,164,926 | ) | | | (36,453,448 | ) | | | (6,552,695 | ) | | | (93,123,753 | ) |
Class B | | | — | | | | — | | | | (48,119 | ) | | | (473,413 | ) |
Class B – automatic conversion to Class A Shares | | | | | | | | | | | (117,638 | ) | | | (1,187,668 | ) |
Class C | | | (173,411 | ) | | | (1,585,350 | ) | | | (167,307 | ) | | | (2,023,219 | ) |
Class R3 | | | (531,855 | ) | | | (6,042,343 | ) | | | (920,427 | ) | | | (12,512,379 | ) |
Class I | | | (5,184,892 | ) | | | (73,605,137 | ) | | | (10,448,756 | ) | | | (166,462,258 | ) |
| | | | (9,055,084 | ) | | | (117,686,278 | ) | | | (18,254,942 | ) | | | (275,782,690 | ) |
| Net increase (decrease) | | | (1,539,594 | ) | | $ | (32,481,768 | ) | | | (11,862,408 | ) | | $ | (181,400,303 | ) |
5. Investment Transactions
Long-term purchases and sales (excluding investments purchased with collateral from securities lending) during the current fiscal period were as follows:
| | | | | | | | |
| | | Large Cap
Select | | | Small Cap
Select | |
| Purchases | | $ | 55,118,669 | | | $ | 169,412,469 | |
| Sales | | | 61,078,765 | | | | 263,746,692 | |
6. Income Tax Information
Each Fund is a separate taxpayer for federal income tax purposes. Each Fund intends to distribute substantially all of its net investment income and net capital gains to shareholders and to otherwise comply with the requirements of Subchapter M of the Internal Revenue Code applicable to regulated investment companies. Therefore, no federal income tax provision is required.
For all open tax years and all major taxing jurisdictions, management of the Funds has concluded that there are no significant uncertain tax positions that would require recognition in the financial statements. Open tax years are those that are open for examination by taxing authorities (i.e., generally the last four tax year ends and the interim tax period since then). Furthermore, management of the Funds is also not aware of any tax positions for which it is reasonably possible that the total amounts of unrecognized tax benefits will significantly change in the next twelve months.
The following information is presented on an income tax basis. Differences between amounts for financial statement and federal income tax purposes are primarily due to timing differences in recognizing certain gains and losses on investment transactions. To the extent that differences arise that are permanent in nature, such amounts are reclassified within the capital accounts as detailed below. Temporary differences do not require reclassification. Temporary and permanent differences do not impact the NAVs of the Funds.
As of October 31, 2015, the cost and unrealized appreciation (depreciation) of investments, as determined on a federal income tax basis, were as follows:
| | | | | | | | |
| | | Large Cap
Select | | | Small Cap
Select | |
| Cost of investments | | $ | 50,090,205 | | | $ | 221,854,756 | |
| Gross unrealized: | | | | | | | | |
Appreciation | | $ | 4,263,193 | | | $ | 32,656,840 | |
Depreciation | | | (1,018,095 | ) | | | (10,340,758 | ) |
| Net unrealized appreciation (depreciation) of investments | | $ | 3,245,098 | | | $ | 22,316,082 | |
Permanent differences, primarily due to federal taxes paid, net operating losses, real estate investment trust adjustments and tax equalization, resulted in reclassifications among the Funds’ components of net assets as of October 31, 2015, the Funds’ tax year end, as follows:
| | | | | | | | |
| | | Large Cap
Select | | | Small Cap
Select | |
| Capital paid-in | | $ | (12 | ) | | $ | 5,346,378 | |
| Undistributed (Over-distribution of) net investment income | | | (1 | ) | | | 99,994 | |
| Accumulated net realized gain (loss) | | | 13 | | | | (5,446,372 | ) |
The tax components of undistributed net ordinary income and net long-term capital gains as of October 31, 2015, the Funds’ tax year end, were as follows:
| | | | | | | | |
| | | Large Cap
Select | | | Small Cap
Select | |
| Undistributed net ordinary income1 | | $ | 188,757 | | | $ | 7,983,746 | |
| Undistributed net long-term capital gains | | | — | | | | 21,334,114 | |
| 1 | Net ordinary income consists of net taxable income derived from dividends, interest and net short-term capital gains, if any. |
Notes to Financial Statements (continued)
The tax character of distributions paid during the Funds’ tax years ended October 31, 2015 and October 31, 2014, was designated for purposes of the dividends paid deduction as follows:
| | | | | | | | |
| 2015 | | Large Cap
Select | | | Small Cap
Select | |
| Distributions from net ordinary income1 | | $ | 258,008 | | | $ | 15,050,248 | |
| Distributions from net long-term capital gains | | | — | | | | 46,967,173 | |
| | |
| 2014 | | Large Cap
Select | | | Small Cap
Select | |
| Distributions from net ordinary income1 | | $ | 189,107 | | | $ | 8,894,272 | |
| Distributions from net long-term capital gains | | | — | | | | 30,488,049 | |
| 1 | Net ordinary income consists of net taxable income derived from dividends, interest and net short-term capital gains, if any. |
As of October 31, 2015, the Funds’ tax year end, the following Fund had unused capital loss carryforwards available for federal income tax purposes to be applied against future capital gains, if any. If not applied, the carryforwards will expire as shown in the following table. The losses not subject to expiration will be utilized first by the Fund.
| | | | |
| | | Large Cap
Select | |
| Expiration: | | | | |
October 31, 2017 | | $ | 53,789,735 | |
| Not subject to expiration | | | — | |
| Total | | $ | 53,789,735 | |
During the Funds’ tax year ended October 31, 2015, Large Cap Select utilized $3,211,284 of its capital loss carryforward.
7. Management Fees and Other Transactions with Affiliates
Each Fund’s management fee compensates the Adviser for overall investment advisory and administrative services and general office facilities. The Sub-Adviser is compensated for its services to the Funds from the management fees paid to the Adviser.
Each Fund’s management fee consists of two components – a fund-level fee, based only on the amount of assets within each individual Fund, and a complex-level fee, based on the aggregate amount of all eligible fund assets managed by the Adviser. This pricing structure enables each Fund’s shareholders to benefit from growth in the assets within their respective Fund as well as from growth in the amount of complex-wide assets managed by the Adviser.
The annual Fund-level fee, payable monthly, for each Fund is calculated according to the following schedule:
| | | | | | | | |
| Average Daily Net Assets | | Large Cap
Select | | | Small Cap
Select | |
| For the first $125 million | | | 0.5500 | % | | | 0.7000 | % |
| For the next $125 million | | | 0.5375 | | | | 0.6875 | |
| For the next $250 million | | | 0.5250 | | | | 0.6750 | |
| For the next $500 million | | | 0.5125 | | | | 0.6625 | |
| For the next $1 billion | | | 0.5000 | | | | 0.6500 | |
| For net assets over $2 billion | | | 0.4750 | | | | 0.6250 | |
The annual complex-level fee for each Fund, payable monthly, is determined by taking the complex-level fee rate, which is based on the aggregate amount of “eligible assets” of all Nuveen funds as set forth in the schedule below, and making, as appropriate, an upward adjustment to that rate based upon the percentage of the particular fund’s assets that are not “eligible assets.” The complex level fee schedule for each Fund is as follows:
| | | | |
| Complex-Level Asset Breakpoint Level* | | Effective Rate at Breakpoint Level | |
| $55 billion | | | 0.2000 | % |
| $56 billion | | | 0.1996 | |
| $57 billion | | | 0.1989 | |
| $60 billion | | | 0.1961 | |
| $63 billion | | | 0.1931 | |
| $66 billion | | | 0.1900 | |
| $71 billion | | | 0.1851 | |
| $76 billion | | | 0.1806 | |
| $80 billion | | | 0.1773 | |
| $91 billion | | | 0.1691 | |
| $125 billion | | | 0.1599 | |
| $200 billion | | | 0.1505 | |
| $250 billion | | | 0.1469 | |
| $300 billion | | | 0.1445 | |
| * | The complex-level fee is calculated based upon the aggregate daily “eligible assets” of all Nuveen funds. Eligible assets do not include assets attributable to investments in other Nuveen funds or assets in excess of $2 billion added to the Nuveen fund complex in connection with the Adviser’s assumption of the management of the former First American Funds effective January 1, 2011. Eligible assets include closed-end fund assets managed by the Adviser that are attributable to certain types of leverage. For these purposes, leverage includes the closed-end funds’ use of preferred stock and borrowings and certain investments in the residual interest certificates (also called inverse floating rate securities) in tender option bond (TOB) trusts, including the portion of assets held by the TOB trust that has been effectively financed by the trust’s issuance of floating rate securities, subject to an agreement by the Adviser as to certain funds to limit the amount of such assets for determining eligible assets in certain circumstances. As of October 31, 2015, the complex-level fee for each Fund was as follows: |
| | | | |
| Fund | | Complex-Level Fee | |
Large Cap Select | | | 0.2000 | % |
Small Cap Select | | | 0.2000 | |
The Adviser has agreed to waive fees and/or reimburse expenses of Large Cap Select through September 30, 2016 so that total annual fund operating expenses (excluding 12b-1 distribution and/or service fees, interest expenses, taxes, acquired fund fees and expenses, fees incurred in acquiring and disposing of portfolio securities and extraordinary expenses) do not exceed 1.05% of the average daily net assets of any class of Fund shares.
The Trust pays no compensation directly to those of its directors who are affiliated with the Adviser or to its officers, all of whom receive remuneration for their services to the Trust from the Adviser or its affiliates. The Board has adopted a deferred compensation plan for independent directors that enables directors to elect to defer receipt of all or a portion of the annual compensation they are entitled to receive from certain Nuveen-advised funds. Under the plan, deferred amounts are treated as though equal dollar amounts had been invested in shares of select Nuveen-advised funds.
During the current fiscal period, Nuveen Securities, LLC (the “Distributor”), a wholly-owned subsidiary of Nuveen, collected sales charges on purchases of Class A Shares, the majority of which were paid out as concessions to financial intermediaries as follows:
| | | | | | | | |
| | | Large Cap
Select | | | Small Cap
Select | |
| Sales charges collected (Unaudited) | | $ | 16,302 | | | $ | 22,621 | |
| Paid to financial intermediaries (Unaudited) | | | 14,746 | | | | 20,091 | |
The Distributor also received 12b-1 service fees on Class A Shares, substantially all of which were paid to compensate financial intermediaries for providing services to shareholders relating to their investments.
During the current fiscal period, the Distributor compensated financial intermediaries directly with commission advances at the time of purchase as follows:
| | | | | | | | |
| | | Large Cap
Select | | | Small Cap
Select | |
| Commission advances (Unaudited) | | $ | 6,935 | | | $ | 4,587 | |
To compensate for commissions advanced to financial intermediaries, all 12b-1 service and distribution fees collected on Class C Shares during the first year following a purchase are retained by the Distributor. During the current fiscal period, the Distributor retained such 12b-1 fees as follows:
| | | | | | | | |
| | | Large Cap
Select | | | Small Cap
Select | |
| 12b-1 fees retained (Unaudited) | | $ | 1,919 | | | $ | 2,171 | |
The remaining 12b-1 fees charged to the Funds were paid to compensate financial intermediaries for providing services to shareholders relating to their investments.
Notes to Financial Statements (continued)
The Distributor also collected and retained CDSC on share redemptions during the current fiscal period, as follows:
| | | | | | | | |
| | | Large Cap
Select | | | Small Cap
Select | |
| CDSC retained (Unaudited) | | $ | 6 | | | $ | 791 | |
8. Borrowing Arrangements
The Funds, along with certain other funds managed by the Adviser (“Participating Funds”), established a 364-day, $2.53 billion standby credit facility with a group of lenders, under which the Participating Funds may borrow for various purposes other than leveraging for investment purposes. A large portion of this facility’s capacity (and its associated costs as described below) is currently dedicated for use by a small number of Participating Funds, which does not include any of the Funds covered by this shareholder report. The remaining capacity under the facility (and the corresponding portion of the facility’s annual costs) is separately dedicated to most of the other open-end funds in the Nuveen fund family, including all of the Funds covered by this shareholder report, along with a number of Nuveen closed-end funds. The credit facility expires in July 2016 unless extended or renewed.
The credit facility has the following terms: a fee of 0.15% per annum on unused commitment amounts, and interest at a rate equal to the higher of (a) one-month LIBOR (London Inter-Bank Offered Rate) plus 1.25% per annum or (b) the Fed Funds rate plus 1.25% per annum on amounts borrowed. Participating Funds paid administration, legal and arrangement fees, which are recognized as a component of “Other expenses” on the Statement of Operations, and along with commitment fees, have been allocated among such Participating Funds based upon the relative proportions of the facility’s aggregate capacity reserved for them and other factors deemed relevant by the Adviser and the Board of each Participating Fund.
During the current fiscal period, the Funds did not utilize this facility.
9. Subsequent Events
Change in Contingent Deferred Sales Charge (CDSC) Schedule
Effective November 1, 2015, shareholders purchasing $1 million or more of Class A Shares at NAV without an up-front sales charge will be assessed a CDSC of 1.00% on any shares redeemed within eighteen months of purchase, unless the redemption is eligible for a CDSC reduction or waiver as specified in the Funds’ statement of additional information.
Additional
Fund Information (Unaudited)
| | | | | | | | | | |
| | | | | |
| | Fund Manager Nuveen Fund Advisors, LLC 333 West Wacker Drive Chicago, IL 60606 Sub-Adviser Nuveen Asset Management, LLC 333 West Wacker Drive Chicago, IL 60606 | | Independent Registered
Public Accounting Firm PricewaterhouseCoopers LLP Chicago, IL 60606 Custodian U.S. Bank National Association Milwaukee, WI 53202 | | Legal Counsel Chapman and Cutler LLP Chicago, IL 60603 | | Transfer Agent and
Shareholder Services Boston Financial
Data Services, Inc. Nuveen Investor Services P.O. Box 8530 Boston, MA 02266-8530 (800) 257-8787 | | |
| | | | | | | | | | | | | | |
| | | | | |
| | | | | | | | | | |
| | |
| | Long-Term Capital Gain Distributions: The following Fund hereby designates as long-term capital gain dividends, pursuant to Internal Revenue Code Section 852 (b)(3), the amount shown in the accompanying table or, if greater, the amount necessary to reduce earnings and profits of the Fund related to net capital gain to zero for the tax year ended October 31, 2015: | | |
| | | | |
| | | | | | | Small Cap
Select | | |
| | Long-term capital gain dividends | | | | $ 52,313,562 | | |
| | |
| | Distribution Information: The Funds hereby designate their percentages of dividends paid from net ordinary income as dividends qualifying for the 70% dividends received deduction (“DRD”) for corporations and their percentages as qualified dividend income (“QDI”) for individuals under Section 1 (h)(11) of the Internal Revenue Code as shown in the accompanying table. The actual qualified dividend income distributions will be reported to shareholders on Form 1099-DIV, which will be sent to shareholders shortly after calendar year end. | | |
| | | | |
| | | | | Large Cap
Select | | Small Cap
Select | | |
| | % QDI | | 100% | | 13% | | |
| | % DRD | | 100% | | 11% | | |
| | | | | |
| | | | | | | | | | |
| | |
| | Quarterly Form N-Q Portfolio of Investments Information: Each Fund is required to file its complete schedule of portfolio holdings with the Securities and Exchange Commission (SEC) for the first and third quarters of each fiscal year on Form N-Q. You may obtain this information directly from the SEC. Visit the SEC on-line at http://www.sec.gov or in person at the SEC’s Public Reference Room in Washington, D.C. Call the SEC toll-free at (800) SEC-0330 for room hours and operation. | | |
| | | | | |
| | | | | | | | | | |
| | |
| | Nuveen Funds’ Proxy Voting Information: You may obtain (i) information regarding how each fund voted proxies relating to portfolio securities held during the most recent twelve-month period ended June 30, without charge, upon request, by calling Nuveen Investments toll-free at (800) 257-8787 or on Nuveen’s website at www.nuveen.com and (ii) a description of the policies and procedures that each fund used to determine how to vote proxies relating to portfolio securities without charge, upon request, by calling Nuveen Investments toll-free at (800) 257-8787. You may also obtain this information directly from the SEC. Visit the SEC on-line at http://www.sec.gov. | | |
| | | | | |
| | | | | | | | | | |
| | |
| | FINRA BrokerCheck: The Financial Industry Regulatory Authority (FINRA) provides information regarding the disciplinary history of FINRA member firms and associated investment professionals. This information as well as an investor brochure describing FINRA BrokerCheck is available to the public by calling the FINRA BrokerCheck Hotline number at (800) 289-9999 or by visiting www.FINRA.org. | | |
Glossary of Terms
Used in this Report (Unaudited)
Average Annual Total Return: This is a commonly used method to express an investment’s performance over a particular, usually multi-year time period. It expresses the return that would have been necessary each year to equal the investment’s actual cumulative performance (including change in NAV or offer price and reinvested distributions and capital gains, if any) over the time period being considered.
Gross Domestic Product (GDP): The total market value of all final goods and services produced in a country/region in a given year, equal to total consumer, investment and government spending, plus the value of exports, minus the value of imports.
Lipper Large-Cap Core Funds Classification Average: Represents the average annualized total return for all reporting funds in the Lipper Large-Cap Core Funds Classification. Lipper returns account for the effects of management fees and assume reinvestment of distributions but do not reflect any applicable sales charges.
Lipper Small-Cap Core Funds Classification Average: Represents the average annualized total return for all reporting funds in the Lipper Small-Cap Core Funds Classification. Lipper returns account for the effects of management fees and assume reinvestment of distributions but do not reflect any applicable sales charges.
Market Capitalization: The market capitalization of a company is equal to the number of the company’s common shares outstanding multiplied by the current price of the company’s stock.
MSCI Emerging Markets Index: An unmanaged index considered representative of stocks of developing countries. The index returns assume reinvestment of distributions, but do not reflect any applicable sales charges or management fees.
Net Asset Value (NAV) Per Share: A fund’s Net Assets is equal to its total assets (securities, cash and accrued earnings) less its total liabilities. For funds with multiple classes, Net Assets are determined separately for each share class. NAV per share is equal to the fund’s (or share class’) Net Assets divided by its number of shares outstanding.
Russell 1000® Index: An unmanaged index, considered representative of large-cap stocks. The index returns assume reinvestment of distributions, but do not reflect any applicable sales charges or management fees.
Russell 2000® Index: An index that measures the performance of the small-cap segment of the U.S. equity universe. The Russell 2000 Index is a subset of the Russell 3000® Index representing approximately 10% of the total market capitalization of that index. It includes approximately 2,000 of the smallest securities based on a combination of their market cap and current index membership. The Russell 3000® Index measures the performance of the 3,000 largest companies based on total market capitalization, which represents approximately 98% of the investable U.S. equity market. The index returns assume reinvestment of distributions, but do not reflect any applicable sales charges or management fees.
S&P 500® Index: An unmanaged index generally considered representative of the U.S. stock market. The index returns assume reinvestment of distributions, but do not reflect any applicable sales charges or management fees.
Tax Equalization: The practice of treating a portion of the distribution made to a redeeming shareholder, which represents his proportionate part of undistributed net investment income and capital gain as a distribution for tax purposes. Such amounts are referred to as the equalization debits (or payments) and will be considered a distribution to the shareholder of net investment income and capital gain for calculation of the fund’s dividends paid deduction.
Trustees
and Officers (Unaudited)
The management of the Funds, including general supervision of the duties performed for the Funds by the Adviser, is the responsibility of the Board of trustees of the Funds. The number of directors of the Funds is currently set at eleven. None of the trustees who are not “interested” persons of the Funds (referred to herein as “independent trustees”) has ever been a director or employee of, or consultant to, Nuveen or its affiliates. The names and business addresses of the trustees and officers of the Funds, their principal occupations and other affiliations during the past five years, the number of portfolios each oversees and other directorships they hold are set forth below.
The Funds’ Statement of Additional Information (“SAI”) includes more information about the trustees. To request a free copy, call Nuveen Investments at (800) 257-8787 or visit the Funds’ website at www.nuveen.com.
| | | | | | | | |
Name, Year of Birth & Address | | Position(s) Held with the Funds | | Year First Elected or Appointed (1) | | Principal Occupation(s) Including other Directorships During Past 5 Years | | Number of Portfolios in Fund Complex Overseen by Trustee |
| | | |
| Independent Trustee: | | | | |
William J. Schneider 1944 333 W. Wacker Drive Chicago, IL 60606 | | Chairman of the Board and Trustee | | 1996 | | Chairman of Miller-Valentine Partners, a real estate investment company; formerly, Senior Partner and Chief Operating Officer (retired 2004) of Miller-Valentine Group; owner in several other Miller-Valentine entities; Board Member of Med-America Health System, and WDPR Public Radio Station; formerly, member, Business Advisory Council, Cleveland Federal Reserve Bank and University of Dayton Business School Advisory Council. | | 196 |
Jack B. Evans 1948 333 W. Wacker Drive Chicago, IL 60606 | | Trustee | | 1999 | | President, The Hall-Perrine Foundation, a private philanthropic corporation (since 1996); Director and Chairman, United Fire Group, a publicly held company; formerly, President Pro-Tem of the Board of Regents for the State of Iowa University System; Director, Source Media Group; Life Trustee of Coe College; formerly, Director, Alliant Energy; formerly, Director, Federal Reserve Bank of Chicago; formerly, President and Chief Operating Officer, SCI Financial Group, Inc., a regional financial services firm. | | 196 |
William C. Hunter 1948 333 W. Wacker Drive Chicago, IL 60606 | | Trustee | | 2004 | | Dean Emeritus, formerly, Dean, Tippie College of Business, University of Iowa (2006-2012); Director (since 2004) of Xerox Corporation; Director (since 2005), and President (since 2012) Beta Gamma Sigma, Inc., The International Business Honor Society; Director of Wellmark, Inc. (since 2009); formerly, Dean and Distinguished Professor of Finance, School of Business at the University of Connecticut (2003-2006); previously, Senior Vice President and Director of Research at the Federal Reserve Bank of Chicago (1995-2003); formerly, Director (1997-2007), Credit Research Center at Georgetown University. | | 196 |
David J. Kundert 1942 333 W. Wacker Drive Chicago, IL 60606 | | Trustee | | 2005 | | Formerly, Director, Northwestern Mutual Wealth Management Company (2006-2013); retired (since 2004) as Chairman, JPMorgan Fleming Asset Management, President and CEO, Banc One Investment Advisors Corporation, and President, One Group Mutual Funds; prior thereto, Executive Vice President, Banc One Corporation and Chairman and CEO, Banc One Investment Management Group; Regent Emeritus, Member of Investment Committee, Luther College; member of the Wisconsin Bar Association; member of Board of Directors and Chair of Investment Committee, Greater Milwaukee Foundation; member of the Board of Directors (Milwaukee), College Possible. | | 196 |
Trustees and Officers (Unaudited) (continued)
| | | | | | | | |
Name, Year of Birth & Address | | Position(s) Held with the Funds | | Year First Elected or Appointed (1) | | Principal Occupation(s) Including other Directorships During Past 5 Years | | Number of Portfolios in Fund Complex Overseen by Trustee |
John K. Nelson 1962 333 West Wacker Drive Chicago, IL 60606 | | Trustee | | 2013 | | Member of Board of Directors of Core12 LLC (since 2008), a private firm which develops branding, marketing and communications strategies for clients; Director of The Curran Center for Catholic American Studies (since 2009) and The President’s Council, Fordham University (since 2010); formerly senior external advisor to the financial services practice of Deloitte Consulting LLP (2012-2014); formerly, Chairman of the Board of Trustees of Marian University (2010 as trustee, 2011-2014 as Chairman); formerly, Chief Executive Officer of ABN AMRO N.V. North America, and Global Head of its Financial Markets Division (2007-2008); prior senior positions held at ABN AMRO include Corporate Executive Vice President and Head of Global Markets—the Americas (2006-2007), CEO of Wholesale Banking—North America and Global Head of Foreign Exchange and Futures Markets (2001-2006), and Regional Commercial Treasurer and Senior Vice President Trading—North America (1996-2001); formerly, Trustee at St. Edmund Preparatory School in New York City. | | 196 |
Judith M. Stockdale 1947 333 W. Wacker Drive Chicago, IL 60606 | | Trustee | | 1997 | | Board Member, Land Trust Alliance (since 2013) and U.S. Endowment for Forestry and Communities (since 2013); formerly, Executive Director (1994-2012), Gaylord and Dorothy Donnelley Foundation; prior thereto, Executive Director, Great Lakes Protection Fund (1990-1994). | | 196 |
Carole E. Stone 1947 333 W. Wacker Drive Chicago, IL 60606 | | Trustee | | 2007 | | Director, Chicago Board Options Exchange (since 2006), C2 Options Exchange, Incorporated (since 2009) Director, CBOE Holdings, Inc. (since 2010); formerly, Commissioner, New York State Commission on Public Authority Reform (2005-2010). | | 196 |
Virginia L. Stringer 1944 333 W. Wacker Drive Chicago, IL 60606 | | Trustee | | 2011 | | Board Member, Mutual Fund Directors Forum; non-profit board member; former governance consultant; former Owner and President, Strategic Management Resources, Inc., a management consulting firm; former Member, Governing Board, Investment Company Institute’s Independent Directors Council; previously, held several executive positions in general management, marketing and human resources at IBM and The Pillsbury Company; Independent Director, First American Fund Complex (1987-2010) and Chair (1997-2010). | | 196 |
Terence J. Toth 1959 333 W. Wacker Drive Chicago, IL 60606 | | Trustee | | 2008 | | Managing Partner, Promus Capital (since 2008); Director, Fulcrum IT Service LLC (since 2010), Quality Control Corporation (since 2012) and LogicMark LLC (since 2012); formerly, Director, Legal & General Investment Management America, Inc. (2008-2013); formerly, CEO and President, Northern Trust Global Investments (2004-2007); Executive Vice President, Quantitative Management & Securities Lending (2000-2004); prior thereto, various positions with Northern Trust Company (since 1994); member: Chicago Fellowship Board (since 2005), Catalyst Schools of Chicago Board (since 2008) and Mather Foundation Board (since 2012), and a member of its investment committee; formerly, Member, Northern Trust Mutual Funds Board (2005-2007), Northern Trust Global Investments Board (2004-2007), Northern Trust Japan Board (2004-2007), Northern Trust Securities Inc. Board (2003-2007) and Northern Trust Hong Kong Board (1997-2004). | | 196 |
| | | | | | | | |
Name, Year of Birth & Address | | Position(s) Held with the Funds | | Year First Elected or Appointed (1) | | Principal Occupation(s) Including other Directorships During Past 5 Years | | Number of Portfolios in Fund Complex Overseen by Trustee |
| | | |
| Interested Trustee: | | | | |
William Adams IV(2) 1955 333 W. Wacker Drive Chicago, IL 60606 | | Trustee | | 2013 | | Senior Executive Vice President, Global Structured Products (since 2010); Co-President of Nuveen Fund Advisors, LLC (since 2011); Executive Vice President of Nuveen Securities, LLC; President (since 2011), formerly, Managing Director (2010-2011) of Nuveen Commodities Asset Management, LLC; Board Member of the Chicago Symphony Orchestra and of Gilda’s Club Chicago; formerly, Executive Vice President, U.S. Structured Products, of Nuveen Investments, Inc. (1999-2010). | | 196 |
Thomas S. Schreier, Jr.(2)
1962 333 W. Wacker Drive Chicago, IL 60606 | | Trustee | | 2013 | | Vice Chairman, Wealth Management of Nuveen Investments, Inc. (since 2011); Co-President of Nuveen Fund Advisors, LLC; Chairman of Nuveen Asset Management, LLC (since 2011); Co-Chief Executive Officer of Nuveen Securities, LLC (since 2011); Member of Board of Governors and Chairman’s Council of the Investment Company Institute; Director of Allina Health and a Member of its Finance, Audit and Investment Committees, formerly, Chief Executive Officer (2000-2010) and Chief Investment Officer (2007-2010) of FAF Advisors, Inc.; formerly, President of First American Funds (2001-2010). | | 196 |
| | | | | | | | |
Name,
Year of Birth & Address | | Position(s) Held with the Funds | | Year First Elected or Appointed (3) | | Principal Occupation(s) During Past 5 Years | | Number of Portfolios in Fund Complex Overseen by
Officer |
| | | |
| Officers of the Funds: | | | | |
Gifford R. Zimmerman 1956 333 W. Wacker Drive Chicago, IL 60606 | | Chief Administrative Officer | | 1988 | | Managing Director (since 2002), and Assistant Secretary of Nuveen Securities, LLC; Managing Director (since 2004) and Assistant Secretary (since 1994) of Nuveen Investments, Inc.; Managing Director (since 2002), Assistant Secretary (since 1997) and Co-General Counsel (since 2011) of Nuveen Fund Advisors, LLC; Managing Director, Assistant Secretary and Associate General Counsel of Nuveen Asset Management, LLC (since 2011); Managing Director and Assistant Secretary of Symphony Asset Management LLC (since 2003); Vice President and Assistant Secretary of NWQ Investment Management Company, LLC (since 2002), Nuveen Investments Advisers Inc. (since 2002), Santa Barbara Asset Management, LLC (since 2006) and of Winslow Capital Management, LLC, (since 2010); Vice President and Assistant Secretary (since 2013), formerly, Chief Administrative Officer and Chief Compliance Officer (2006-2013) of Nuveen Commodities Asset Management, LLC; Chartered Financial Analyst. | | 197 |
Margo L. Cook 1964 333 W. Wacker Drive Chicago, IL 60606 | | Vice President | | 2009 | | Senior Executive Vice President of Nuveen Investments, Inc.; Executive Vice President, Investment Services of Nuveen Fund Advisors, LLC (since 2011); Managing Director – Investment Services of Nuveen Commodities Asset Management, LLC (since 2011); Co-Chief Executive Officer (since 2015); previously, Executive Vice President (2013-2015) of Nuveen Securities, LLC; Chartered Financial Analyst. | | 197 |
Lorna C. Ferguson 1945 333 W. Wacker Drive Chicago, IL 60606 | | Vice President | | 1998 | | Managing Director (since 2005) of Nuveen Fund Advisors, LLC and Nuveen Securities, LLC (since 2004). | | 197 |
Trustees and Officers (Unaudited) (continued)
| | | | | | | | |
Name,
Year of Birth & Address | | Position(s) Held with the Funds | | Year First Elected or Appointed (3) | | Principal Occupation(s) During Past 5 Years | | Number of Portfolios in Fund Complex Overseen by
Officer |
Stephen D. Foy 1954 333 W. Wacker Drive Chicago, IL 60606 | | Vice President and Controller | | 1998 | | Managing Director (since 2014), formerly, Senior Vice President (2013-2014) and Vice President (2005-2013) of Nuveen Fund Advisors, LLC; Chief Financial Officer of Nuveen Commodities Asset Management, LLC (since 2010); Certified Public Accountant. | | 197 |
Sherri A. Hlavacek 1962 333 W. Wacker Drive Chicago, IL 60606 | | Vice President and Treasurer | | 2015 | | Executive Vice President (since May 2015, formerly, Managing Director) and Controller of Nuveen Fund Advisors, LLC; Managing Director and Controller of Nuveen Commodities Asset Management, LLC; Executive Vice President (since May 2015, formerly, Managing Director), Treasurer and Controller of Nuveen Asset Management, LLC; Executive Vice President, Principal Financial Officer (since July 2015, formerly, Managing Director), Treasurer and Corporate Controller of Nuveen Investments, Inc.; Executive Vice President (since May 2015, formerly, Managing Director), Treasurer and Corporate Controller of Nuveen Investments Advisers Inc. and Nuveen Investments Holdings, Inc.; Managing Director, Chief Financial Officer and Corporate Controller of Nuveen Securities, LLC; Vice President, Controller and Treasurer of NWQ Investment Management Company, LLC; Vice President and Controller of Santa Barbara Asset Management, LLC, Tradewinds Global Investors, LLC, Symphony Asset Management LLC and Winslow Capital Management, LLC; Certified Public Accountant. | | 197 |
Walter M. Kelly 1970 333 W. Wacker Drive Chicago, IL 60606 | | Chief Compliance Officer and Vice President | | 2003 | | Senior Vice President (since 2008) of Nuveen Investments Holdings, Inc. | | 197 |
Tina M. Lazar 1961 333 W. Wacker Drive Chicago, IL 60606 | | Vice President | | 2002 | | Senior Vice President of Nuveen Investments Holdings, Inc. and Nuveen Securities, LLC | | 197 |
Kevin J. McCarthy 1966 333 W. Wacker Drive Chicago, IL 60606 | | Vice President and Secretary | | 2007 | | Managing Director and Assistant Secretary (since 2008), Nuveen Securities, LLC; Managing Director (since 2008), Assistant Secretary (since 2007) and Co-General Counsel (since 2011) of Nuveen Fund Advisors, LLC; Managing Director, Assistant Secretary and Associate General Counsel (since 2011) of Nuveen Asset Management, LLC; Managing Director and Assistant Secretary, Nuveen Investments, Inc.; Vice President (since 2007) and Assistant Secretary of Nuveen Investments Advisers Inc., NWQ Investment Management Company, LLC, Tradewinds Global Investors LLC, Symphony Asset Management LLC, Santa Barbara Asset Management, LLC, and of Winslow Capital Management, LLC. (since 2010); Vice President and Secretary (since 2010) of Nuveen Commodities Asset Management, LLC. | | 197 |
Kathleen L. Prudhomme 1953 901 Marquette Avenue Minneapolis, MN 55402 | | Vice President and Assistant Secretary | | 2011 | | Managing Director, Assistant Secretary and Co-General Counsel (since 2011) of Nuveen Fund Advisors, LLC; Managing Director, Assistant Secretary and Associate General Counsel (since 2011) of Nuveen Asset Management, LLC; Managing Director and Assistant Secretary (since 2011) of Nuveen Securities, LLC; formerly, Deputy General Counsel, FAF Advisors, Inc. (2004-2010). | | 197 |
Joel T. Slager 1978 333 West Wacker Drive Chicago, IL 60606 | | Vice President and Assistant Secretary | | 2013 | | Fund Tax Director for Nuveen Funds (since 2013); previously, Vice President of Morgan Stanley Investment Management, Inc., Assistant Treasurer of the Morgan Stanley Funds (from 2010 to 2013). | | 197 |
| | | | | | | | |
Name,
Year of Birth & Address | | Position(s) Held with the Funds | | Year First Elected or Appointed (3) | | Principal Occupation(s) During Past 5 Years | | Number of Portfolios in Fund Complex Overseen by
Officer |
Jeffery M. Wilson 1956 333 West Wacker Drive Chicago, IL 60606 | | Vice President | | 2011 | | Senior Vice President of Nuveen Securities, LLC (since 2011); formerly, Senior Vice President of FAF Advisors, Inc. (2000-2010). | | 108 |
| (1) | Trustees serve an indefinite term until his/her successor is elected or appointed. Ms. Stringer will retire from the Board as of December 31, 2015. The year first elected or appointed represents the year in which the trustee was first elected or appointed to any fund in the Nuveen Fund Complex. |
| (2) | “Interested persons” of the Trust, as defined in the 1940 Act, by reason of their positions with Nuveen and certain of its subsidiaries. |
| (3) | Officers serve one year terms through August of each year. The year first elected or appointed represents the year in which the officer was first elected or appointed to any fund in the Nuveen Fund Complex. |
Annual Investment Management Agreement
Approval Process (Unaudited)
The Board of Directors of each Fund (each, a “Board” and each Director, a “Board Member”), including the Board Members who are not parties to the Funds’ advisory or sub-advisory agreements or “interested persons” of any such parties (the “Independent Board Members”), is responsible for overseeing the performance of the investment adviser and sub-adviser to the respective Fund and determining whether to continue such Fund’s advisory agreement (the “Investment Management Agreement”) between the Fund and Nuveen Fund Advisors, LLC (the “Adviser”) and the sub-advisory agreement (the “Sub-Advisory Agreement” and, together with the Investment Management Agreement, the “Advisory Agreements”) between the Adviser and Nuveen Asset Management, LLC (the “Sub-Adviser”). Following an initial term with respect to each Fund upon its commencement of operations, the Board is required to consider the continuation of the Advisory Agreements on an annual basis pursuant to the requirements of the Investment Company Act of 1940, as amended (the “1940 Act”). Accordingly, at an in-person meeting held on May 11-13, 2015 (the “May Meeting”), the Board, including a majority of the Independent Board Members, considered and approved the existing Advisory Agreements for the Funds.
In preparation for its considerations at the May Meeting, the Board received in advance of the meeting extensive materials prepared in connection with the review of the Advisory Agreements. The materials provided a broad range of information regarding the Funds, including, among other things, the nature, extent and quality of services provided by the Adviser and Sub-Adviser (the Adviser and Sub-Adviser are collectively, the “Fund Advisers” and each, a “Fund Adviser”); Fund performance including performance assessments against peers and the appropriate benchmark(s); fee and expense information of the Funds compared to peers; a description and assessment of shareholder service levels for the Funds; a summary of the performance of certain service providers; a review of product initiatives and shareholder communications; and profitability information of the Fund Advisers as described in further detail below. As part of its annual review, the Board also held a separate meeting on April 14-15, 2015 to review the Funds’ investment performance and consider an analysis by the Adviser of the Sub-Adviser which generally evaluated the Sub-Adviser’s investment team, investment mandate, organizational structure and history, investment philosophy and process, and the performance of the Funds, and any significant changes to the foregoing. During the review, the Independent Board Members asked questions of and requested additional information from management.
The Board considered that the evaluation process with respect to the Fund Advisers is an ongoing process that encompassed the information and knowledge gained throughout the year. The Board, acting directly or through its committees, met regularly during the course of the year and received information and considered factors at each meeting that would be relevant to its annual consideration of the Advisory Agreements, including information relating to Fund performance; Fund expenses; investment team evaluations; and valuation, compliance, regulatory and risk matters. In addition to regular reports, the Adviser provided special reports to the Board to enhance the Board’s understanding on topics that impact some or all of the Nuveen funds and the Adviser (such as presentations on risk and stress testing; the new governance, risk and compliance system; cybersecurity developments; Nuveen fund accounting and reporting matters; regulatory developments impacting the investment company industry and the business plans or other matters impacting the Adviser). The Board also met with key investment personnel managing certain Nuveen fund portfolios during the year.
The Board had created several standing committees including the Open-End Funds Committee and the Closed-End Funds Committee to assist the full Board in monitoring and gaining a deeper insight into the distinctive business practices of closed-end and open-end funds. These Committees met prior to each quarterly Board meeting, and the Adviser provided presentations to these Committees permitting them to delve further into specific matters or initiatives impacting the respective product line.
The Board also continued its program of seeking to have the Board Members or a subset thereof visit each sub-adviser to the Nuveen funds at least once over a multiple year rotation, meeting with key investment and business personnel. In this regard, the Independent Board Members made site visits to multiple equity and fixed-income investment teams of the Sub-Adviser in June 2014.
The Board considered the information provided and knowledge gained at these meetings and visits during the year when performing its annual review of the Advisory Agreements. The Independent Board Members also were assisted throughout the process by independent legal counsel. During the course of the year and during their deliberations regarding the review of advisory contracts, the Independent Board Members met with independent legal counsel in executive sessions without management present. The Independent Board Members also received a memorandum from independent legal counsel outlining the legal standards for their consideration of the proposed continuation of the Advisory Agreements. In addition, it is important to recognize that the management arrangements for the Nuveen funds are the result of many years of review and discussion between the Independent Board Members and Fund management and that the Board Members’ conclusions may be based, in part, on their consideration of fee arrangements and other factors developed in previous years.
The Board took into account all factors it believed relevant with respect to each Fund, including, among other things: (a) the nature, extent and quality of the services provided by the Fund Advisers; (b) the investment performance of the Funds and Fund Advisers; (c) the advisory fees and costs of the
services to be provided to the Funds and the profitability of the Fund Advisers; (d) the extent of any economies of scale; (e) any benefits derived by the Fund Advisers from the relationship with the Funds; and (f) other factors. Each Board Member may have accorded different weight to the various factors in reaching his or her conclusions with respect to the Advisory Agreements of each Fund. The Independent Board Members did not identify any single factor as all-important or controlling. The Independent Board Members’ considerations were instead based on a comprehensive consideration of all the information presented. The principal factors considered by the Board and its conclusions are described below.
A. Nature, Extent and Quality of Services
In evaluating the renewal of the Advisory Agreements, the Independent Board Members received and considered information regarding the nature, extent and quality of the applicable Fund Adviser’s services provided to each respective Fund. The Board reviewed information regarding, among other things, each Fund Adviser’s organization and business, the types of services that each Fund Adviser or its affiliates provided to the Funds, the performance record of the Funds (as described in further detail below), and any initiatives that had been undertaken on behalf of the open-end product line. The Board recognized the high quality of services the Adviser had provided to the Funds over the years and the conscientiousness with which the Adviser provided these services. The Board also considered the improved capital structure of Nuveen Investments, Inc. (“Nuveen”) (the parent of the Adviser) following the acquisition of Nuveen by TIAA-CREF in 2014 (the “TIAA-CREF Transaction”).
With respect to the services, the Board noted the Funds were registered investment companies that operated in a regulated industry and considered the myriad of investment management, administrative, compliance, oversight and other services the Adviser provided to manage and operate the Funds. Such services included, among other things: (a) product management (such as analyzing ways to better position a Nuveen fund in the marketplace, setting dividends; maintaining relationships to gain access to distribution platforms; and providing shareholder communications); (b) fund administration (such as preparing tax returns and other tax compliance services, preparing regulatory filings and shareholder reports; managing fund budgets and expenses; overseeing a fund’s various service providers and supporting and analyzing new and existing funds); (c) Board administration (such as supporting the Board and its committees, in relevant part, by organizing and administering the Board and committee meetings and preparing the necessary reports to assist the Board in its duties); (d) compliance (such as monitoring adherence to a fund’s investment policies and procedures and applicable law; reviewing the compliance program periodically and developing new policies or updating existing compliance policies and procedures as considered necessary or appropriate; responding to regulatory requests; and overseeing compliance testing of the funds’ sub-advisers); (e) legal support (such as preparing or reviewing fund registration statements, proxy statements and other necessary materials; interpreting regulatory requirements and compliance thereof; and maintaining applicable registrations); and (f) investment services (such as overseeing and reviewing the funds’ sub-advisers and their investment teams; analyzing performance of the funds; overseeing investment and risk management; evaluating brokerage transactions and securities lending, overseeing the daily valuation process for portfolio securities and developing and recommending valuation policies and methodologies and changes thereto; reporting to the Board on various matters including performance, risk and valuation; and participating in fund development, leverage management, and the developing or interpreting of investment policies and parameters).
In its review, the Board considered information highlighting the various initiatives that the Adviser had implemented or continued during the last year to enhance its services to the Nuveen funds. The Board recognized that some of these initiatives are a result of a multi-year process. In reviewing the activities of 2014, the Board recognized the Adviser’s continued focus on fund rationalization for open-end funds through mergers, fund closures or repositioning the funds in seeking to enhance shareholder value, reduce costs, improve performance, eliminate fund overlap and better meet shareholder needs. The Board noted the Adviser’s investment in additional staffing to strengthen and improve its services to the Nuveen funds, including with respect to risk management and valuation. The Board recognized that expanding the depth and range of its risk oversight activities had been a major priority for the Adviser in recent years, and the Adviser continued to add to the risk management team, develop additional risk management programs and create committees or other teams designated to oversee or evaluate certain risks, such as liquidity risk, enterprise risk, investment risk and cybersecurity risk. The Adviser had also continued to add to the valuation team, launched its centralized securities valuation system which is intended to provide for uniform pricing and reporting across the complex as the system continues to develop, continued to refine its valuation analysis and updated related policies and procedures and evaluated and assessed pricing services. The Board considered the Adviser’s ongoing investment in information technology and operations and the various projects of the information technology team to support the continued growth and complexity of the Nuveen funds and increase efficiencies in their operations. The Board also recognized the Adviser’s strong commitment to compliance and reviewed information reflecting the compliance group’s ongoing activities to enhance its compliance system and refine its compliance procedures as well as the Chief Compliance Officer’s report regarding the compliance team, the initiatives the team had undertaken in 2014 and proposed for 2015, the compliance functions and reporting process, the record of compliance with the policies and procedures and its supervision activities of other service providers.
With respect to the open-end fund product line, the Adviser had also, among other things: developed new funds in seeking to enhance the product line; enhanced the reporting to the Board and its committees regarding payments to intermediaries; and continued to explore opportunities for potential funds.
As noted, the Adviser also oversees the Sub-Adviser who primarily provides the portfolio advisory services to the Funds. The Board recognized the skill and competency of the Adviser in monitoring and analyzing the performance of the Sub-Adviser and managing the sub-advisory relationship. In considering the Sub-Advisory Agreements and supplementing its prior knowledge, the Board considered a current report provided by the Adviser
Annual Investment Management Agreement Approval Process (Unaudited) (continued)
analyzing, among other things, the Sub-Adviser’s investment team and changes thereto, investment approach, organization and history, and assets under management, and the investment performance of each Fund.
Based on their review, the Independent Board Members found that, overall, the nature, extent and quality of services provided to the Funds under each respective Advisory Agreement were satisfactory.
B. The Investment Performance of the Funds and Fund Advisers
The Board, including the Independent Board Members, considered the performance history of each Fund over various time periods. The Board reviewed reports, including an analysis of the Funds’ performance and the applicable investment team. The Board reviewed, among other things, each Fund’s investment performance both on an absolute basis and in comparison to peer funds (the “Performance Peer Group”) and to recognized and/or customized benchmarks (i.e., generally benchmarks derived from multiple recognized benchmarks) for the quarter, one-, three- and five-year periods ending December 31, 2014, as well as performance information reflecting the first quarter of 2015. In its review, the Board noted that it also reviewed Fund performance results at each of its quarterly meetings.
In evaluating performance, the Board recognized several factors that may impact the performance data as well as the consideration given to particular performance data.
| | • | | The performance data reflected a snapshot in time, in this case as of the end of the most recent calendar year or quarter. A different performance period, however, could generate significantly different results. |
| | • | | Long-term performance can be adversely affected by even one period of significant underperformance so that a single investment decision or theme had the ability to disproportionately affect long-term performance. |
| | • | | The investment experience of a particular shareholder in a fund would vary depending on when such shareholder invested in the fund, the class held (if multiple classes are offered in the fund) and the performance of the fund (or respective class) during that shareholder’s investment period. |
| | • | | Open-end funds offer multiple classes and the performance data provided for open-end funds was based on Class A shares. The performance of the other classes of a fund, however, should be substantially similar on a relative basis because all of the classes would be invested in the same portfolio of securities and differences in performance among classes could be principally attributed to the variations in distribution and servicing expenses of each class. |
| | • | | The Board recognized that the funds in the Performance Peer Group may differ somewhat from the Nuveen fund with which it is being compared and due to these differences, performance comparisons between certain of the Nuveen funds and their Performance Peer Groups may be inexact and the relevancy limited. The Board considered that management had classified the Performance Peer Group as low, medium and high in relevancy. The Board took the analysis of the relevancy of the Performance Peer Group into account when considering the comparative performance data. The Board also considered comparative performance of an applicable benchmark. While the Board was cognizant of the relative performance of a Fund’s peer set and/or benchmark(s), the Board evaluated Fund performance in light of the respective Fund’s investment objectives, investment parameters and guidelines and considered that the variations between the objectives and investment parameters or guidelines of the Fund with its peers and/or benchmarks result in differences in performance results. |
With respect to any Nuveen funds for which the Board has identified performance concerns, the Board monitors such funds closely until performance improves, discusses with the Adviser the reasons for such results, considers those steps necessary or appropriate to address such issues, and reviews the results of any efforts undertaken. The Board is aware, however, that shareholders chose to invest or remain invested in a fund knowing that the Adviser manages the fund and knowing the fund’s fee structure.
In considering the performance data, the Independent Board Members noted the following with respect to the Funds:
For Nuveen Large Cap Select Fund (the “Large Cap Select Fund”), the Board noted that, although the Fund ranked in its Performance Peer Group in the third quartile for the one-year period, it ranked in the first quartile in the three-year period and the second quartile in the five-year period. Further, although the Fund underperformed its benchmark in the one- and five-year periods, it outperformed its benchmark in the three-year period.
For Nuveen Small Cap Select Fund (the “Small Cap Select Fund”), the Board noted that, although the Fund ranked in its Performance Peer Group in the fourth quartile in the three- and five-year periods and underperformed its benchmark in such periods, the Fund improved its ranking to the second quartile in the one-year period and outperformed its benchmark in the one-year period.
Based on their review, the Independent Board Members determined that each Fund’s investment performance had been satisfactory.
C. Fees, Expenses and Profitability
1. Fees and Expenses
The Board evaluated the management fees and other fees and expenses of each Fund (expressed as a percentage of average net assets) in absolute terms and in comparison to the fee and expense levels of a comparable universe of funds (the “Peer Universe”) and, with respect to
open-end funds, to a more focused subset in the Peer Universe (the “Peer Group”), each selected by an independent third-party fund data provider. The Independent Board Members reviewed the methodology regarding the construction of the Peer Universe and Peer Group for each Fund. The Board reviewed, among other things, such Fund’s gross management fees, net management fees and net expense ratios in absolute terms as well as compared to the average and median fee and expense levels of the Peer Universe and/or Peer Group. The Board noted that the net total expense ratios paid by investors in the Funds were the most representative of an investor’s net experience. The Board Members also considered any fee waivers and/or expense reimbursement arrangements currently in effect for the Funds.
In reviewing the comparative fee and expense information, the Independent Board Members recognized that various factors such as the limited size and particular composition of the Peer Universe or Peer Group (including the inclusion of other Nuveen funds in the peer set); expense anomalies; changes in the funds comprising the Peer Universe or Peer Group from year to year; levels of reimbursement or fee waivers; the timing of information used; and differences in services provided can impact the comparative data limiting the usefulness of the data to help make a conclusive assessment of the Funds’ fees and expenses.
In reviewing the fee schedule for a fund, the Independent Board Members also considered the fund-level and complex-wide breakpoint schedules (described in further detail below) and any fee waivers and reimbursements provided by Nuveen. In reviewing fees and expenses, the Board considered the expenses and fees to be higher if they were over 10 basis points higher, slightly higher if they were approximately 6 to 10 basis points higher, in line if they were within approximately 5 basis points higher than the peer average and below if they were below the peer average of the Peer Group. In reviewing the reports, the Board noted that the majority of the Nuveen funds had a net expense ratio near or below their peer average.
The Independent Board Members recognized that the Large Cap Select Fund had a slightly higher net management fee than the peer average but a net expense ratio that was below the peer average, and that the Small Cap Select Fund had a net expense ratio slightly higher than the peer average, but a net management fee that was in line with the peer average.
Based on their review of the fee and expense information provided, the Independent Board Members determined that each Fund’s management fees (as applicable) to a Fund Adviser were reasonable in light of the nature, extent and quality of services provided to the Fund.
2. Comparisons with the Fees of Other Clients
The Board considered information regarding the fees a Fund Adviser assessed to the Nuveen funds compared to that of other clients as described in further detail below. With respect to non-municipal funds, such other clients of the Adviser and/or its affiliated sub-advisers may include: separately managed accounts (such as retail, institutional or wrap accounts), hedge funds, other investment companies that are not offered by Nuveen but are sub-advised by one of Nuveen’s affiliated sub-advisers, foreign investment companies offered by Nuveen, and collective investment trusts.
The Board recognized that each Fund had an affiliated sub-adviser and therefore the overall Fund management fee can be divided into two components, the fee retained by the Adviser and the fee paid to the Sub-Adviser. In reviewing the nature of the services provided by the Adviser, including through its affiliated sub-advisers, the Board considered the range of advisory fee rates for retail and institutional managed accounts advised by Nuveen-affiliated sub-advisers. The Board also reviewed, among other things, the average fee the affiliated sub-advisers assessed such clients as well as the range of fee rates assessed to the different types of clients (such as retail, institutional and wrap accounts as well as non-Nuveen funds) applicable to such sub-advisers.
In reviewing the comparative information, the Board also reviewed information regarding the differences between the Funds and the other clients, including differences in services provided, investment policies, investor profiles, compliance and regulatory requirements and account sizes. The Board recognized the breadth of services necessary to operate a registered investment company (as described above) and that, in general terms, the Adviser provided the administrative and other support services to the Funds and, although the Sub-Adviser may provide some of these services, the Sub-Adviser essentially provided the portfolio management services. In general, the Board noted that higher fee levels reflected higher levels of service provided by the Fund Adviser, increased investment management complexity, greater product management requirements and higher levels of business risk or some combination of the foregoing. The Independent Board Members considered the differences in structure and operations of separately managed accounts and hedge funds from registered funds and noted that the range of day-to-day services was not generally of the breadth required for the registered funds. Many of the additional administrative services provided by the Adviser were not required for institutional clients or funds sub-advised by a Nuveen-affiliated sub-adviser that were offered by other fund groups. The Independent Board Members also recognized that the management fee rates of the foreign funds advised by the Adviser may vary due to, among other things, differences in the client base, governing bodies, operational complexities and services covered by the management fee. Given the inherent differences in the various products, particularly the extensive services provided to the Funds, the Independent Board Members believed such facts justify the different levels of fees.
3. Profitability of Fund Advisers
In conjunction with their review of fees, the Independent Board Members also considered the profitability of Nuveen for its advisory activities and its financial condition. The Independent Board Members reviewed, among other things, the adjusted operating margins for Nuveen for the last two
Annual Investment Management Agreement Approval Process (Unaudited) (continued)
calendar years, the revenues, expenses, net income (pre-tax and after-tax) and net revenue margins (pre-tax and after-tax) of Nuveen’s managed fund advisory activities for the last two calendar years, the allocation methodology used by Nuveen in preparing the profitability data and a history of the adjustments to the methodology due to changes in the business over time. The Independent Board Members also reviewed the revenues, expenses, net income (pre-tax and after-tax) and revenue margin (pre-tax and post-tax) of the Adviser and, as described in further detail below, each affiliated sub-adviser for the 2014 calendar year. In reviewing the profitability data, the Independent Board Members noted the subjective nature of cost allocation methodologies used to determine profitability as other reasonable methods could also have been employed but yield different results. The Independent Board Members reviewed an analysis of the key drivers behind the changes in revenues and expenses that impacted profitability in 2014. The Independent Board Members recognized that Nuveen’s net revenue margin from advisory activities for 2014 was consistent with 2013. The Independent Board Members also considered the profitability of Nuveen in comparison to the adjusted operating margins of other investment advisers with publicly available data and with comparable assets under management (based on asset size and asset composition) to Nuveen. The Independent Board Members noted that Nuveen’s adjusted operating margins appeared to be reasonable in relation to such other advisers. The Independent Board Members, however, recognized the difficulty of making comparisons of profitability from fund investment advisory contracts as the information is not generally publicly available, the information for the investment advisers that was publicly available may not be representative of the industry and various other factors would impact the profitability data such as differences in services offered, business mix, expense methodology and allocations, capital structure and costs, complex size, and types of funds and other accounts managed.
The Independent Board Members noted this information supplemented the profitability information requested and received during the year and noted that two Independent Board Members served as point persons to review the profitability analysis and methodologies employed, and any changes thereto, and to keep the Board apprised of such changes during the year.
The Independent Board Members determined that Nuveen appeared to be sufficiently profitable to operate as a viable investment management firm and to honor its obligations as a sponsor of the Nuveen funds. The Independent Board Members noted the Adviser’s continued expenditures to upgrade its investment technology and increase personnel and recognized the Adviser’s continued commitment to its business to enhance the Adviser’s capacity and capabilities in providing the services necessary to meet the needs of the Nuveen funds as they grow or change over time. The Independent Board Members also noted that the sub-advisory fees for the Nuveen funds are paid by the Adviser, however, the Board recognized that many of the sub-advisers, including the Sub-Adviser, are affiliated with Nuveen. The Independent Board Members also noted the increased resources and support available to Nuveen as well as an improved capital structure as a result of the TIAA-CREF Transaction.
With respect to the Sub-Adviser, the Independent Board Members reviewed the Sub-Adviser’s revenues, expenses and revenue margins (pre- and post-tax) for its advisory activities for the calendar year ended December 31, 2014. The Independent Board Members also reviewed profitability analysis reflecting the revenues, expenses and the revenue margin (pre- and post-tax) by asset type for the Sub-Adviser for the calendar year ended December 31, 2014.
In evaluating the reasonableness of the compensation, the Independent Board Members also considered other amounts paid to a Fund Adviser by the Funds as well as indirect benefits (such as soft dollar arrangements), if any, the Fund Adviser and its affiliates received or were expected to receive that were directly attributable to the management of a Fund. See Section E below for additional information on indirect benefits a Fund Adviser may receive as a result of its relationship with the Funds.
Based on their review, the Independent Board Members determined that the Adviser’s and the Sub-Adviser’s level of profitability was reasonable in light of the respective services provided.
D. Economies of Scale and Whether Fee Levels Reflect These Economies of Scale
The Independent Board Members recognized that, as the assets of a particular fund or the Nuveen complex in the aggregate increase over time, economies of scale may be realized, and the Independent Board Members considered the extent to which the funds benefit from such economies of scale. Although the Independent Board Members recognized that economies of scale are difficult to measure, the Board recognized that one method to help ensure the shareholders share in these benefits is to include breakpoints in the management fee schedule reducing fee rates as asset levels grow. The Independent Board Members noted that, subject to certain exceptions, the management fees of the funds in the Nuveen complex are generally comprised of a fund-level component and complex-level component. Each component of the management fee for each Fund included breakpoints to reduce management fee rates of the Fund as the Fund grows and, as described below, as the Nuveen complex grows. In addition to fund-specific breakpoint schedules which reduce the fee rates of a particular fund as its assets increase, the Independent Board Members recognized that the Adviser also passed on the benefits of economies of scale through the complex-wide fee arrangement which reduced management fee rates as assets in the fund complex reached certain levels. The complex-wide fee arrangement seeks to provide the benefits of economies of scale to fund shareholders when total fund complex assets increase, even if assets of a particular fund are unchanged or have decreased. The approach reflected the notion that some of Nuveen’s costs were attributable to services provided to all its funds in the complex, and therefore all funds benefit if these costs were spread over a larger asset base. The Independent Board Members reviewed the breakpoint and complex-wide schedules and the fee reductions achieved as a result of such structures for the 2014 calendar year.
The Independent Board Members also noted that additional economies of scale were shared with shareholders of the Large Cap Select Fund through the adoption of a temporary expense cap. The Independent Board Members further considered that as part of the TIAA-CREF Transaction, Nuveen agreed, for a period of two years from the date of the closing of the TIAA-CREF Transaction, not to increase contractual management fees for any Nuveen fund and, with respect to funds with expense caps, not to raise expense cap levels for such funds from levels in effect at that time or scheduled to go into effect prior to the closing of the TIAA-CREF Transaction. The commitment would not limit or otherwise affect mergers or liquidations of any funds in the ordinary course.
Based on their review, the Independent Board Members concluded that the current fee structure was acceptable and reflected economies of scale to be shared with shareholders when assets under management increase.
E. Indirect Benefits
The Independent Board Members received and considered information regarding potential “fall out” or ancillary benefits the respective Fund Adviser or its affiliates may receive as a result of its relationship with the Funds. In this regard, the Independent Board Members recognized that an affiliate of the Adviser served as the Funds’ principal underwriter and may receive compensation therefore from, among other things, sales charges, distribution fees and shareholder services fees (which included fees received pursuant to any 12b-1 plan). The Independent Board Members therefore took into account, among other things, the 12b-1 fees retained by Nuveen during the last calendar year.
In addition to the above, the Independent Board Members considered whether the Fund Adviser received any benefits from soft dollar arrangements whereby a portion of the commissions paid by a Fund for brokerage may be used to acquire research that may be useful to the Fund Adviser in managing the assets of the Fund and other clients. The Funds’ portfolio transactions are allocated by the Sub-Adviser. Accordingly, the Independent Board Members considered that the Sub-Adviser may benefit from research provided by broker-dealers executing portfolio transactions on behalf of the Funds. With respect to any fixed income securities, however, the Board recognized that such securities generally trade on a principal basis that does not generate soft dollar credits. Similarly, the Board recognized that any research received pursuant to soft dollar arrangements by the Sub-Adviser may also benefit the Funds and shareholders to the extent the research enhanced the ability of the Sub-Adviser to manage the Funds. The Independent Board Members noted that the Sub-Adviser’s profitability may be somewhat lower if it had to acquire any such research services directly.
Based on their review, the Independent Board Members concluded that any indirect benefits received by a Fund Adviser as a result of its relationship with the Funds were reasonable and within acceptable parameters.
F. Other Considerations
The Independent Board Members did not identify any single factor discussed previously as all-important or controlling. The Board Members, including the Independent Board Members, concluded that the terms of each Advisory Agreement were fair and reasonable, that the respective Fund Adviser’s fees were reasonable in light of the services provided to each Fund and that the Advisory Agreements be renewed.
Notes
Notes
| | | | | | | | | | | | | | |
| | | | | | | | |
| | | | |
| | | | | | | | |
| | |
| | Nuveen Investments: | | |
| | | | Serving Investors for Generations | | | | |
| | |
| | | | |
| | | |
| | | | Since 1898, financial advisors and their clients have relied on Nuveen Investments to provide dependable investment solutions through continued adherence to proven, long-term investing principles. Today, we offer a range of high quality equity and fixed-income solutions designed to be integral components of a well-diversified core portfolio. | | |
| | | |
| | | | | | |
| | | | |
| | | | | | Focused on meeting investor needs. Nuveen Investments provides high-quality investment services designed to help secure the longterm goals of institutional and individual investors as well as the consultants and financial advisors who serve them. Nuveen Investments markets a wide range of specialized investment solutions which provide investors access to capabilities of its high-quality boutique investment affiliates-Nuveen Asset Management, Symphony Asset Management, NWQ Investment Management Company, Santa Barbara Asset Management, Tradewinds Global Investors, Winslow Capital Management, and Gresham Investment Management. In total, Nuveen Investments managed more than $220 billion as of September 30, 2015. | | |
| | | | | |
| | | | | | | | | | |
| | | | | | Find out how we can help you. To learn more about how the products and services of Nuveen Investments may be able to help you meet your financial goals, talk to your financial advisor, or call us at (800) 257-8787. Please read the information provided carefully before you invest. Investors should consider the investment objective and policies, risk considerations, charges and expenses of any investment carefully. Where applicable, be sure to obtain a prospectus, which contains this and other relevant information. To obtain a prospectus, please contact your securities representative or Nuveen Investments, 333 W. Wacker Dr., Chicago, IL 60606. Please read the prospectus carefully before you invest or send money. | | |
| | | | | | Learn more about Nuveen Funds at: www.nuveen.com/mf | | |
| | | | | | | | | | | | |
| | Distributed by Nuveen Securities, LLC | 333 West Wacker Drive Chicago, IL 60606 | www.nuveen.com | | | | |
MAN-FSLCT-1015P 12544-INV-Y-12/16
ITEM 2. CODE OF ETHICS.
As of the end of the period covered by this report, the registrant has adopted a code of ethics that applies to the registrant’s principal executive officer, principal financial officer, principal accounting officer or controller, or persons performing similar functions. There were no amendments to or waivers from the code during the period covered by this report. The registrant has posted the code of ethics on its website at www.nuveen.com/MutualFunds/ShareholderResources/FundGovernance.aspx. (To view the code, click on Code of Conduct.)
ITEM 3. AUDIT COMMITTEE FINANCIAL EXPERT.
The registrant’s Board of Directors or Trustees (“Board”) determined that the registrant has at least one “audit committee financial expert” (as defined in Item 3 of Form N-CSR) serving on its Audit Committee. The registrant’s audit committee financial experts are Carole E. Stone and Jack B. Evans, who are “independent” for purposes of Item 3 of Form N-CSR.
Ms. Stone served for five years as Director of the New York State Division of the Budget. As part of her role as Director, Ms. Stone was actively involved in overseeing the development of the State’s operating, local assistance and capital budgets, its financial plan and related documents; overseeing the development of the State’s bond-related disclosure documents and certifying that they fairly presented the State’s financial position; reviewing audits of various State and local agencies and programs; and coordinating the State’s system of internal audit and control. Prior to serving as Director, Ms. Stone worked as a budget analyst/examiner with increasing levels of responsibility over a 30 year period, including approximately five years as Deputy Budget Director. Ms. Stone has also served as Chair of the New York State Racing Association Oversight Board, as Chair of the Public Authorities Control Board, as a Commissioner on the New York State Commission on Public Authority Reform and as a member of the Boards of Directors of several New York State public authorities. These positions have involved overseeing operations and finances of certain entities and assessing the adequacy of project/entity financing and financial reporting. Currently, Ms. Stone is on the Board of Directors of CBOE Holdings, Inc., of the Chicago Board Options Exchange, and of C2 Options Exchange. Ms. Stone’s position on the boards of these entities and as a member of both CBOE Holdings’ Audit Committee and its Finance Committee has involved, among other things, the oversight of audits, audit plans and preparation of financial statements.
Mr. Evans was formerly President and Chief Operating Officer of SCI Financial Group, Inc., a full service registered broker-dealer and registered investment adviser (“SCI”). As part of his role as President and Chief Operating Officer, Mr. Evans actively supervised the Chief Financial Officer (the “CFO”) and actively supervised the CFO’s preparation of financial statements and other filings with various regulatory authorities. In such capacity, Mr. Evans was actively involved in the preparation of SCI’s financial statements and the resolution of issues raised in connection therewith. Mr. Evans has also served on the audit committee of various reporting companies. At such companies, Mr. Evans was involved in the oversight of audits, audit plans, and the preparation of financial statements. Mr. Evans also formerly chaired the audit committee of the Federal Reserve Bank of Chicago.
ITEM 4. PRINCIPAL ACCOUNTANT FEES AND SERVICES.
The following tables show the amount of fees that PricewaterhouseCoopers LLP, the Funds’ auditor, billed to the Funds’ during the Funds’ last two full fiscal years. The Audit Committee approved in advance all audit services and non-audit services that PricewaterhouseCoopers LLP provided to the Funds, except for those non-audit services that were subject to the pre-approval exception under Rule 2-01 of Regulation S-X (the “pre-approval exception”). The preapproval exception for services provided directly to the Funds waives the pre-approval requirement for services other than audit, review or attest services if: (A) the aggregate amount of all such services provided constitutes no more than 5% of the total amount of revenues paid by the Funds during the fiscal year in which the services are provided; (B) the Funds did not recognize the services as non-audit services at the time of the engagement; and (C) the services are promptly brought to the Audit Committee’s attention, and the Committee (or its delegate) approves the services before the audit is completed.
The Audit Committee has delegated certain pre-approval responsibilities to its Chairman (or, in his absence, any other member of the Audit Committee).
SERVICES THAT THE AUDITOR BILLED TO THE FUND
| | | | | | | | | | | | | | | | |
Fiscal Year Ended October 31, 2015 | | Audit Fees Billed
to Funds 1 | | | Audit-Related Fees
Billed to Funds 2 | | | Tax Fees
Billed to Funds 3 | | | All Other Fees
Billed to Funds 4 | |
Fund Name | | | | | | | | | | | | | | | | |
Nuveen Dividend Value Fund | | | 19,329 | | | | 0 | | | | 3,856 | | | | 0 | |
Nuveen Equity Index Fund | | | 16,214 | | | | 0 | | | | 5,762 | | | | 0 | |
Nuveen Large Cap Growth Opportunities Fund | | | 14,832 | | | | 0 | | | | 2,739 | | | | 0 | |
Nuveen Large Cap Select Fund | | | 13,034 | | | | 0 | | | | 2,684 | | | | 0 | |
Nuveen Mid Cap Growth Opportunities Fund | | | 18,172 | | | | 0 | | | | 4,408 | | | | 0 | |
Nuveen Mid Cap Index Fund | | | 15,671 | | | | 0 | | | | 4,246 | | | | 0 | |
Nuveen Mid Cap Value Fund | | | 13,378 | | | | 0 | | | | 2,695 | | | | 0 | |
Nuveen Small Cap Growth Opportunities Fund | | | 13,281 | | | | 0 | | | | 2,689 | | | | 0 | |
Nuveen Small Cap Index Fund | | | 13,430 | | | | 0 | | | | 2,694 | | | | 0 | |
Nuveen Small Cap Select Fund | | | 13,810 | | | | 0 | | | | 5,718 | | | | 0 | |
Nuveen Small Cap Value Fund | | | 13,389 | | | | 0 | | | | 2,692 | | | | 0 | |
| | | | | | | | | | | | | | | | |
Total | | $ | 164,540 | | | $ | 0 | | | $ | 40,185 | | | $ | 0 | |
| 1 | | “Audit Fees” are the aggregate fees billed for professional services for the audit of the Fund’s annual financial statements and services provided in connection with statutory and regulatory filings or engagements. |
| 2 | | “Audit-Related Fees” are the aggregate fees billed for assurance and related services reasonably related to the performance of the audit or review of financial statements that are not reported under “Audit Fees”. These fees include offerings related to the Fund’s common shares and leverage. |
| 3 | | “Tax Fees” are the aggregate fees billed for professional services for tax advice, tax compliance, and tax planning. These fees include: all global withholding tax services; excise and state tax reviews; capital gain, tax equalization and taxable basis calculations performed by the principal accountant. |
| 4 | | “All Other Fees” are the aggregate fees billed for products and services other than “Audit Fees”, “Audit-Related Fees” and “Tax Fees”. These fees represent all “Agreed-Upon Procedures” engagements pertaining to the Fund’s use of leverage. |
| | | | | | | | | | | | | | | | |
| | | Percentage Approved Pursuant to Pre-approval Exception | |
| | | Audit Fees Billed
to Funds | | | Audit-Related Fees
Billed to Funds | | | Tax Fees
Billed to Funds | | | All Other Fees
Billed to Funds | |
Fund Name | | | | | | | | | | | | | | | | |
Nuveen Dividend Value Fund | | | 0 | % | | | 0 | % | | | 0 | % | | | 0 | % |
Nuveen Equity Index Fund | | | 0 | % | | | 0 | % | | | 0 | % | | | 0 | % |
Nuveen Large Cap Growth Opportunities Fund | | | 0 | % | | | 0 | % | | | 0 | % | | | 0 | % |
Nuveen Large Cap Select Fund | | | 0 | % | | | 0 | % | | | 0 | % | | | 0 | % |
Nuveen Mid Cap Growth Opportunities Fund | | | 0 | % | | | 0 | % | | | 0 | % | | | 0 | % |
Nuveen Mid Cap Index Fund | | | 0 | % | | | 0 | % | | | 0 | % | | | 0 | % |
Nuveen Mid Cap Value Fund | | | 0 | % | | | 0 | % | | | 0 | % | | | 0 | % |
Nuveen Small Cap Growth Opportunities Fund | | | 0 | % | | | 0 | % | | | 0 | % | | | 0 | % |
Nuveen Small Cap Index Fund | | | 0 | % | | | 0 | % | | | 0 | % | | | 0 | % |
Nuveen Small Cap Select Fund | | | 0 | % | | | 0 | % | | | 0 | % | | | 0 | % |
Nuveen Small Cap Value Fund | | | 0 | % | | | 0 | % | | | 0 | % | | | 0 | % |
| | | | |
October 31, 2014 | | Audit Fees Billed
to Funds 1 | | | Audit-Related Fees
Billed to Funds 2 | | | Tax Fees
Billed to Funds 3 | | | All Other Fees
Billed to Funds 4 | |
Fund Name | | | | | | | | | | | | | | | | |
Nuveen Dividend Value Fund | | | 19,891 | | | | 0 | | | | 2,575 | | | | 0 | |
Nuveen Equity Index Fund | | | 15,898 | | | | 0 | | | | 2,575 | | | | 0 | |
Nuveen Large Cap Growth Opportunities Fund | | | 15,043 | | | | 0 | | | | 2,575 | | | | 0 | |
Nuveen Large Cap Select Fund | | | 12,580 | | | | 0 | | | | 2,575 | | | | 0 | |
Nuveen Mid Cap Growth Opportunities Fund | | | 18,035 | | | | 0 | | | | 2,575 | | | | 0 | |
Nuveen Mid Cap Index Fund | | | 15,278 | | | | 0 | | | | 2,575 | | | | 0 | |
Nuveen Mid Cap Value Fund | | | 13,055 | | | | 0 | | | | 2,575 | | | | 0 | |
Nuveen Small Cap Growth Opportunities Fund | | | 12,811 | | | | 0 | | | | 2,575 | | | | 0 | |
Nuveen Small Cap Index Fund | | | 13,027 | | | | 0 | | | | 2,575 | | | | 0 | |
Nuveen Small Cap Select Fund | | | 14,263 | | | | 0 | | | | 2,575 | | | | 0 | |
Nuveen Small Cap Value Fund | | | 12,901 | | | | 0 | | | | 2,575 | | | | 0 | |
| | | | | | | | | | | | | | | | |
Total | | $ | 162,782 | | | $ | 0 | | | $ | 28,325 | | | $ | 0 | |
| 1 | | “Audit Fees” are the aggregate fees billed for professional services for the audit of the Fund’s annual financial statements and services provided in connection with statutory and regulatory filings or engagements. |
| 2 | | “Audit-Related Fees” are the aggregate fees billed for assurance and related services reasonably related to the performance of the audit or review of financial statements that are not reported under “Audit Fees”. These fees include offerings related to the Fund’s common shares and leverage. |
| 3 | | “Tax Fees” are the aggregate fees billed for professional services for tax advice, tax compliance, and tax planning. These fees include: all global withholding tax services; excise and state tax reviews; capital gain, tax equalization and taxable basis calculations performed by the principal accountant. |
| 4 | | “All Other Fees” are the aggregate fees billed for products and services other than “Audit Fees”, “Audit-Related Fees” and “Tax Fees”. These fees represent all “Agreed-Upon Procedures” engagements pertaining to the Fund’s use of leverage. |
| | | | | | | | | | | | | | | | |
| | | Percentage Approved Pursuant to Pre-approval Exception | |
| | | Audit Fees Billed
to Funds | | | Audit-Related Fees
Billed to Funds | | | Tax Fees
Billed to Funds | | | All Other Fees
Billed to Funds | |
Fund Name | | | | | | | | | | | | | | | | |
Nuveen Dividend Value Fund | | | 0 | % | | | 0 | % | | | 0 | % | | | 0 | % |
Nuveen Equity Index Fund | | | 0 | % | | | 0 | % | | | 0 | % | | | 0 | % |
Nuveen Large Cap Growth Opportunities Fund | | | 0 | % | | | 0 | % | | | 0 | % | | | 0 | % |
Nuveen Large Cap Select Fund | | | 0 | % | | | 0 | % | | | 0 | % | | | 0 | % |
Nuveen Mid Cap Growth Opportunities Fund | | | 0 | % | | | 0 | % | | | 0 | % | | | 0 | % |
Nuveen Mid Cap Index Fund | | | 0 | % | | | 0 | % | | | 0 | % | | | 0 | % |
Nuveen Mid Cap Value Fund | | | 0 | % | | | 0 | % | | | 0 | % | | | 0 | % |
Nuveen Small Cap Growth Opportunities Fund | | | 0 | % | | | 0 | % | | | 0 | % | | | 0 | % |
Nuveen Small Cap Index Fund | | | 0 | % | | | 0 | % | | | 0 | % | | | 0 | % |
Nuveen Small Cap Select Fund | | | 0 | % | | | 0 | % | | | 0 | % | | | 0 | % |
Nuveen Small Cap Value Fund | | | 0 | % | | | 0 | % | | | 0 | % | | | 0 | % |
| | | | | | | | | | | | |
Fiscal Year Ended October 31, 2015 | | Audit-Related Fees
Billed to Adviser and
Affiliated Fund
Service Providers | | | Tax Fees Billed to
Adviser and
Affiliated Fund
Service Providers | | | All Other Fees
Billed to Adviser
and Affiliated Fund
Service Providers | |
Nuveen Investment Funds, Inc. | | $ | 0 | | | $ | 0 | | | $ | 0 | |
| |
| | | Percentage Approved Pursuant to Pre-approval Exception | |
| | | Audit-Related Fees
Billed to Adviser and
Affiliated Fund
Service Providers | | | Tax Fees Billed to
Adviser and
Affiliated Fund
Service Providers | | | All Other Fees
Billed to Adviser
and Affiliated Fund
Service Providers | |
| | | 0 | % | | | 0 | % | | | 0 | % |
| | | |
Fiscal Year Ended October 31, 2014 | | Audit-Related Fees
Billed to Adviser and
Affiliated Fund
Service Providers | | | Tax Fees Billed to
Adviser and
Affiliated Fund
Service Providers | | | All Other Fees
Billed to Adviser
and Affiliated Fund
Service Providers | |
Nuveen Investment Funds, Inc. | | $ | 0 | | | $ | 0 | | | $ | 0 | |
| |
| | | Percentage Approved Pursuant to Pre-approval Exception | |
| | | Audit-Related Fees
Billed to Adviser and
Affiliated Fund
Service Providers | | | Tax Fees Billed to
Adviser and
Affiliated Fund
Service Providers | | | All Other Fees
Billed to Adviser
and Affiliated Fund
Service Providers | |
| | | 0 | % | | | 0 | % | | | 0 | % |
| | | | | | | | | | | | | | | | |
Fiscal Year Ended October 31, 2015 | | Total Non-Audit Fees
Billed to Trust | | | Total Non-Audit Fees
billed to Adviser and
Affiliated Fund Service
Providers (engagements
related directly to the
operations and financial
reporting of the Trust) | | | Total Non-Audit Fees
billed to Adviser and
Affiliated Fund Service
Providers (all other
engagements) | | | Total | |
Fund Name | | | | | | | | | | | | | | | | |
Nuveen Dividend Value Fund | | | 3,856 | | | | 0 | | | | 0 | | | | 3,856 | |
Nuveen Equity Index Fund | | | 5,762 | | | | 0 | | | | 0 | | | | 5,762 | |
Nuveen Large Cap Growth Opportunities Fund | | | 2,739 | | | | 0 | | | | 0 | | | | 2,739 | |
Nuveen Large Cap Select Fund | | | 2,684 | | | | 0 | | | | 0 | | | | 2,684 | |
Nuveen Mid Cap Growth Opportunities Fund | | | 4,408 | | | | 0 | | | | 0 | | | | 4,409 | |
Nuveen Mid Cap Index Fund | | | 4,246 | | | | 0 | | | | 0 | | | | 4,246 | |
Nuveen Mid Cap Value Fund | | | 2,695 | | | | 0 | | | | 0 | | | | 2,695 | |
Nuveen Small Cap Growth Opportunities Fund | | | 2,689 | | | | 0 | | | | 0 | | | | 2,689 | |
Nuveen Small Cap Index Fund | | | 2,694 | | | | 0 | | | | 0 | | | | 2,694 | |
Nuveen Small Cap Select Fund | | | 5,718 | | | | 0 | | | | 0 | | | | 5,719 | |
Nuveen Small Cap Value Fund | | | 2,692 | | | | 0 | | | | 0 | | | | 2,692 | |
| | | | | | | | | | | | | | | | |
Total | | $ | 40,185 | | | $ | 0 | | | $ | 0 | | | $ | 40,185 | |
“Non-Audit Fees billed to Fund” for both fiscal year ends represent “Tax Fees” and “All Other Fees” billed to Fund in their respective amounts from the previous table.
Less than 50 percent of the hours expended on the principal accountant’s engagement to audit the registrant’s financial statements for the most recent fiscal year were attributed to work performed by persons other than the principal accountant’s full-time, permanent employees.
| | | | | | | | | | | | | | | | |
Fiscal Year Ended October 31, 2014 | | Total Non-Audit Fees
Billed to Trust | | | Total Non-Audit Fees
billed to Adviser and
Affiliated Fund Service
Providers (engagements
related directly to the
operations and financial
reporting of the Trust) | | | Total Non-Audit Fees
billed to Adviser and
Affiliated Fund Service
Providers (all other
engagements) | | | Total | |
Fund Name | | | | | | | | | | | | | | | | |
Nuveen Dividend Value Fund | | | 2,575 | | | | 0 | | | | 0 | | | | 2,575 | |
Nuveen Equity Index Fund | | | 2,575 | | | | 0 | | | | 0 | | | | 2,575 | |
Nuveen Large Cap Growth Opportunities Fund | | | 2,575 | | | | 0 | | | | 0 | | | | 2,575 | |
Nuveen Large Cap Select Fund | | | 2,575 | | | | 0 | | | | 0 | | | | 2,575 | |
Nuveen Mid Cap Growth Opportunities Fund | | | 2,575 | | | | 0 | | | | 0 | | | | 2,575 | |
Nuveen Mid Cap Index Fund | | | 2,575 | | | | 0 | | | | 0 | | | | 2,575 | |
Nuveen Mid Cap Value Fund | | | 2,575 | | | | 0 | | | | 0 | | | | 2,575 | |
Nuveen Small Cap Growth Opportunities Fund | | | 2,575 | | | | 0 | | | | 0 | | | | 2,575 | |
Nuveen Small Cap Index Fund | | | 2,575 | | | | 0 | | | | 0 | | | | 2,575 | |
Nuveen Small Cap Select Fund | | | 2,575 | | | | 0 | | | | 0 | | | | 2,575 | |
Nuveen Small Cap Value Fund | | | 2,575 | | | | 0 | | | | 0 | | | | 2,575 | |
| | | | | | | | | | | | | | | | |
Total | | $ | 28,325 | | | $ | 0 | | | $ | 0 | | | $ | 28,325 | |
“Non-Audit Fees billed to Fund” for both fiscal year ends represent “Tax Fees” and “All Other Fees” billed to Fund in their respective amounts from the previous table.
Audit Committee Pre-Approval Policies and Procedures. Generally, the Audit Committee must approve (i) all non-audit services to be performed for the Funds by the Funds’ independent accountant and (ii) all audit and non-audit services to be performed by the Funds’ independent accountant for the Affiliated Fund Service Providers with respect to the operations and financial reporting of the Funds. Regarding tax and research projects conducted by the independent accountant for the Funds and Affiliated Fund Service Providers (with respect to operations and financial reports of the Trust), such engagements will be (i) pre-approved by the Audit Committee if they are expected to be for amounts greater than $10,000; (ii) reported to the Audit Committee Chairman for his verbal approval prior to engagement if they are expected to be for amounts under $10,000 but greater than $5,000; and (iii) reported to the Audit Committee at the next Audit Committee meeting if they are expected to be for an amount under $5,000.
ITEM 5. AUDIT COMMITTEE OF LISTED REGISTRANTS.
Not applicable to this registrant.
ITEM 6. SCHEDULE OF INVESTMENTS.
| a) | | See Portfolio of Investments in Item 1. |
ITEM 7. DISCLOSURE OF PROXY VOTING POLICIES AND PROCEDURES FOR CLOSED-END
MANAGEMENT INVESTMENT COMPANIES.
Not applicable to this registrant.
ITEM 8. PORTFOLIO MANAGERS OF CLOSED-END MANAGEMENT INVESTMENT COMPANIES.
Not applicable to this registrant.
ITEM 9. PURCHASES OF EQUITY SECURITIES BY CLOSED-END MANAGEMENT INVESTMENT COMPANY AND AFFILIATED PURCHASERS.
Not applicable to this registrant.
ITEM 10. SUBMISSION OF MATTERS TO A VOTE OF SECURITY HOLDERS.
There have been no material changes to the procedures by which shareholders may recommend nominees to the registrant’s Board of Trustees implemented after the registrant last provided disclosure in response to this Item.
ITEM 11. CONTROLS AND PROCEDURES.
| | (a) | | The registrant’s principal executive and principal financial officers, or persons performing similar functions, have concluded that the registrant’s disclosure controls and procedures (as defined in Rule 30a-3(c) under the Investment Company Act of 1940, as amended (the “1940 Act”) (17 CFR 270.30a-3(c))) are effective, as of a date within 90 days of the filing date of this report that includes the disclosure required by this paragraph, based on their evaluation of the controls and procedures required by Rule 30a-3(b) under the 1940 Act (17 CFR 270.30a-3(b)) and Rules 13a-15(b) or 15d-15(b) under the Securities Exchange Act of 1934, as amended (the “Exchange Act”) (17 CFR 240.13a-15(b) or 240.15d-15(b)). |
| | (b) | | There were no changes in the registrant’s internal control over financial reporting (as defined in Rule 30a-3(d) under the 1940 Act (17 CFR 270.30a-3(d)) that occurred during the second fiscal quarter of the period covered by this report that has materially affected, or is reasonably likely to materially affect, the registrant’s internal control over financial reporting. |
ITEM 12. EXHIBITS.
File the exhibits listed below as part of this Form.
| | |
| (a)(1) | | Any code of ethics, or amendment thereto, that is the subject of the disclosure required by Item 2, to the extent that the registrant intends to satisfy the Item 2 requirements through filing of an exhibit: Not applicable because the code is posted on registrant’s website at www.nuveen.com/MutualFunds/ShareholderResources/FundGovernance.aspx and there were no amendments during the period covered by this report. (To view the code, click on Code of Conduct.) |
| |
| (a)(2) | | A separate certification for each principal executive officer and principal financial officer of the registrant as required by Rule 30a-2(a) under the 1940 Act (17 CFR 270.30a-2(a)) in the exact form set forth below: See EX-99.CERT attached hereto. |
| |
| (a)(3) | | Any written solicitation to purchase securities under Rule 23c-1 under the 1940 Act (17 CFR 270.23c-1) sent or given during the period covered by the report by or on behalf of the registrant to 10 or more persons: Not applicable to this registrant. |
| |
| (b) | | If the report is filed under Section 13(a) or 15(d) of the Exchange Act, provide the certifications required by Rule 30a-2(b) under the 1940 Act (17 CFR 270.30a-2(b)), Rule 13a-14(b) or Rule 15d-14(b) under the Exchange Act (17 CFR 240.13a-14(b) or 240.15d-14(b)), and Section 1350 of Chapter 63 of Title 18 of the United States Code (18 U.S.C. 1350) as an Exhibit. A certification furnished pursuant to this paragraph will not be deemed “filed” for purposes of Section 18 of the Exchange Act (15 U.S.C. 78r), or otherwise subject to the liability of that section. Such certification will not be deemed to be incorporated by reference into any filing under the Securities Act of 1933 or the Exchange Act, except to the extent that the registration specifically incorporates it by reference: See EX-99.906 CERT attached hereto. |
SIGNATURES
Pursuant to the requirements of the Securities Exchange Act of 1934 and the Investment Company Act of 1940, the registrant has duly caused this report to be signed on its behalf by the undersigned, thereunto duly authorized.
(Registrant) Nuveen Investment Funds, Inc.
| | |
| |
| By (Signature and Title) | | /s/ Kevin J. McCarthy |
| | Kevin J. McCarthy |
| | Vice President and Secretary |
Date: January 7, 2016
Pursuant to the requirements of the Securities Exchange Act of 1934 and the Investment Company Act of 1940, this report has been signed below by the following persons on behalf of the registrant and in the capacities and on the dates indicated.
| | |
| |
| By (Signature and Title) | | /s/ Gifford R. Zimmerman |
| | Gifford R. Zimmerman |
| | Chief Administrative Officer |
| | (principal executive officer) |
Date: January 7, 2016
| | |
| |
| By (Signature and Title) | | /s/ Stephen D. Foy |
| | Stephen D. Foy |
| | Vice President and Controller |
| | (principal financial officer) |
Date: January 7, 2016