UNITED STATES
SECURITIES AND EXCHANGE COMMISSION
Washington, D.C. 20549
FORM N-CSR
CERTIFIED SHAREHOLDER REPORT OF REGISTERED MANAGEMENT
INVESTMENT COMPANIES
Investment Company Act file number 811-05309
Nuveen Investment Funds, Inc.
(Exact name of registrant as specified in charter)
Nuveen Investments
333 West Wacker Drive, Chicago, IL 60606
(Address of principal executive offices) (Zip code)
Kevin J. McCarthy
Nuveen Investments
333 West Wacker Drive
Chicago, IL 60606
(Name and address of agent for service)
Registrant’s telephone number, including area code: (312) 917-7700
Date of fiscal year end: April 30
Date of reporting period: April 30, 2016
Form N-CSR is to be used by management investment companies to file reports with the Commission not later than 10 days after the transmission to stockholders of any report that is required to be transmitted to stockholders under Rule 30e-1 under the Investment Company Act of 1940 (17 CFR 270.30e-1). The Commission may use the information provided on Form N-CSR in its regulatory, disclosure review, inspection, and policy making roles.
A registrant is required to disclose the information specified by Form N-CSR, and the Commission will make this information public. A registrant is not required to respond to the collection of information contained in Form N-CSR unless the Form displays a currently valid Office of Management and Budget (“OMB”) control number. Please direct comments concerning the accuracy of the information collection burden estimate and any suggestions for reducing the burden to Secretary, Securities and Exchange Commission, 450 Fifth Street, NW, Washington, DC 20549-0609. The OMB has reviewed this collection of information under the clearance requirements of 44 U.S.C. ss.3507.
ITEM 1. REPORTS TO STOCKHOLDERS.
| | |
| | |  |
| Mutual Funds | |
| | |
| | | |
| | | Nuveen Municipal Bond Funds |
| | |
| | | It’s not what you earn, it’s what you keep.® |
| | | | | | |
| | | | | | | Annual Report April 30, 2016 |
| | | | | | | | | | | | | | |
| | | | | | | Share Class / Ticker Symbol | | |
| | | Fund Name | | | | Class A | | Class C | | Class C2 | | Class I | | |
|
| | Nuveen All-American Municipal Bond Fund | | | | FLAAX | | FACCX | | FAACX | | FAARX | | |
| | Nuveen Inflation Protected Municipal Bond Fund | | | | NITAX | | NAADX | | NIPCX | | NIPIX | | |
| | Nuveen Intermediate Duration Municipal Bond Fund | | | | NMBAX | | NNCCX | | NNSCX | | NUVBX | | |
| | Nuveen Limited Term Municipal Bond Fund | | | | FLTDX | | FAFJX | | FLTCX | | FLTRX | | |
| | Nuveen Short Term Municipal Bond Fund | | | | FSHAX | | NAAEX | | NSVCX | | FSHYX | | |
| | | | | | | | | | | | |
| | | | | | |
| | | | |
| | | | | | | | |
| | |
| | Life is Complex. | | |
| | |
| | Nuveen makes things e-simple. | | |
| | |
| | It only takes a minute to sign up for e-Reports. Once enrolled, you’ll receive an e-mail as soon as your Nuveen Fund information is ready. No more waiting for delivery by regular mail. Just click on the link within the e-mail to see the report and save it on your computer if you wish. | | |
| | | | |
| | | | | | Free e-Reports right to your e-mail! | | |
| | | |
| | | | | | www.investordelivery.com If you receive your Nuveen Fund distributions and statements from your
financial advisor or brokerage account. |
| | | | |
| | | | or | | www.nuveen.com/accountaccess If you receive your Nuveen Fund distributions and statements directly from Nuveen. Must be preceded by or accompanied by a prospectus. NOT FDIC INSURED MAY LOSE VALUE
NO BANK GUARANTEE | | |
| | | | | | | | | | |
| | | | | | | | | | | | | |
Table
of Contents
Chairman’s Letter
to Shareholders

Dear Shareholders,
The U.S. economy is now seven years into the recovery, but its pace remains stubbornly subpar compared to past recoveries. Economic data continues to be a mixed bag, as it has been throughout this expansion period. While the unemployment rate fell below its pre-recession level, a surprisingly weak jobs growth report in May was a disappointing sign, although not necessarily indicative of a lasting downtrend. Wages have grown slightly but not nearly enough to reinvigorate Americans’ buying power. The housing market has improved markedly but its contribution to the recovery has been lackluster. Deflationary pressures, including the dramatic slide in commodity prices, have kept inflation much lower for longer than many expected.
Furthermore, frail economies across the rest of the world have continued to cast a shadow over the U.S. Although the European Central Bank and Bank of Japan have been providing aggressive monetary stimulus, including adopting negative interest rates in both Europe and Japan, their economies continue to lag the U.S.’s recovery. China’s policy makers have also continued to manage its slowdown but investors are still worried about where the world’s second-largest economy might ultimately land. Additionally, global markets were surprised by the U.K.’s June 23, 2016 referendum vote to leave the European Union, known as “Brexit.” Heightened price volatility and negative sentiment are to be expected in the near term as markets readjust and await clarity on the Brexit process and its impact on the U.K., Europe and across the world.
Many of these ambiguities – both domestic and international – have kept the U.S. Federal Reserve (Fed) from raising short-term interest rates any further since December’s first and only increase thus far. While markets rallied on the widely held expectation that the Fed would defer any increases until June, the unusually weak May jobs report and the Brexit concerns compelled the Fed to again hold rates steady.
With global economic growth still looking fairly fragile, financial markets have become more volatile over the past year. Although sentiment has improved and conditions have generally recovered from the intense volatility seen in early 2016, we expect that turbulence remains on the horizon for the time being. In this environment, Nuveen remains committed to both managing downside risks and seeking upside potential. If you’re concerned about how resilient your investment portfolio might be, we encourage you to talk to your financial advisor.
On behalf of the other members of the Nuveen Fund Board, we look forward to continuing to earn your trust in the months and years ahead.
Sincerely,

William J. Schneider
Chairman of the Board
June 24, 2016
Portfolio Managers’
Comments
Nuveen All-American Municipal Bond Fund
Nuveen Inflation Protected Municipal Bond Fund
Nuveen Intermediate Duration Municipal Bond Fund
Nuveen Limited Term Municipal Bond Fund
Nuveen Short Term Municipal Bond Fund
These Funds feature portfolio management by Nuveen Asset Management, LLC (NAM), an affiliate of Nuveen Investments, Inc. John V. Miller, CFA, and Douglas J. White, CFA, manage the Nuveen All-American Municipal Bond Fund. John began managing the Fund in 2010 and Doug joined him as co-manager of the Fund in 2011. Daniel J. Close, CFA, and Douglas M. Baker, CFA, have managed the Nuveen Inflation Protected Municipal Bond Fund since its inception in 2011. Paul L. Brennan, CFA, has managed the Nuveen Intermediate Duration Municipal Bond Fund since 2007 and the Nuveen Limited Term Municipal Bond Fund since 2006. Christopher L. Drahn, CFA, has managed the Nuveen Short Term Municipal Bond Fund since 2002.
Recently, the portfolio managers discussed economic and market conditions, key investment strategies, and the Funds’ performance for the twelve-month period ended April 30, 2016.
What factors affected the U.S. economy and the national municipal market during the twelve-month reporting period ended April 30, 2016?
Over the twelve-month reporting period, U.S. economic data continued to point to subdued growth, rising employment and tame inflation. Economic activity has continued to hover around a 2% annualized growth rate since the end of the Great Recession in 2009, as measured by real gross domestic product (GDP), which is the value of the goods and services produced by the nation’s economy less the value of the goods and services used up in production, adjusted for price changes. For the first quarter of 2016, real GDP increased at an annual rate of 0.8%, as reported by the “second” estimate of the Bureau of Economic Analysis, down from 1.4% in the fourth quarter of 2015.
The labor and housing markets were among the bright spots in the economy during the reporting period, as both showed steady improvement. As reported by the Bureau of Labor Statistics, the unemployment rate fell to 5.0% in April 2016 from 5.4% in April 2015, and job gains averaged slightly above 200,000 per month for the past twelve months. The S&P/Case-Shiller U.S. National Home Price Index, which covers all nine U.S. census divisions, recorded a 5.2% annual gain in March 2016 (most recent data available at the time this report was prepared). The 10-City and 20-City Composites reported year-over-year increases of 4.7% and 5.4%, respectively.
Consumers, whose purchases comprise the largest component of the U.S. economy, benefited from lower gasoline prices and an improving jobs market. Pessimism about the economy’s future and lackluster wage growth likely contributed to consumers’
Certain statements in this report are forward-looking statements. Discussions of specific investments are for illustration only and are not intended as recommendations of individual investments. The forward-looking statements and other views expressed herein are those of the portfolio managers as of the date of this report. Actual future results or occurrences may differ significantly from those anticipated in any forward-looking statements and the views expressed herein are subject to change at any time, due to numerous market and other factors. The Funds disclaim any obligation to update publicly or revise any forward-looking statements or views expressed herein.
Ratings shown are the highest rating given by one of the following national rating agencies: Standard & Poor’s (S&P), Moody’s Investors Service, Inc. (Moody’s) or Fitch, Inc. (Fitch). Credit ratings are subject to change. AAA, AA, A and BBB are investment grade ratings; BB, B, CCC, CC, C and D are below investment grade ratings. Certain bonds backed by U.S. Government or agency securities are regarded as having an implied rating equal to the rating of such securities. Holdings designated N/R are not rated by these national rating agencies.
Bond insurance guarantees only the payment of principal and interest on the bond when due, and not the value of the bonds themselves, which will fluctuate with the bond market and the financial success of the issuer and the insurer. Insurance relates specifically to the bonds in the portfolio and not to the share prices of a Fund. No representation is made as to the insurers’ ability to meet their commitments.
Refer to the Glossary of Terms Used in this Report for further definition of the terms used within this section.
Portfolio Managers’ Comments (continued)
somewhat muted spending. Lower energy prices and tepid wage growth also weighed on inflation during this reporting period. The Consumer Price Index CPI rose 1.1% over the twelve-month period ended April 2016 on a seasonally adjusted basis, as reported by the U.S. Bureau of Labor Statistics. The core CPI (which excludes food and energy) increased 2.1% during the same period, slightly above the Fed’s unofficial longer term inflation objective of 2.0%.
Business investment was also rather restrained. Corporate earnings growth slowed during 2015, reflecting an array of factors ranging from weakening demand amid sluggish U.S. and global growth to the impact of falling commodity prices and a strong U.S. dollar. Energy, materials and industrials companies were hit particularly hard by the downturn in natural resource prices, as well as the expectation of rising interest rates, which would make their debts more costly to service. With demand waning, companies, especially in the health care and technology sectors, looked to consolidations with rivals as a way to boost revenues. Merger and acquisition deals, both in the U.S. and globally, reached record levels in the calendar year 2015.
With the current expansion on solid footing, the U.S. Federal Reserve (Fed) prepared to raise one of its main interest rates, which had been held near zero since December 2008 to help stimulate the economy. After delaying the rate change for most of 2015 because of a weak global economic growth outlook, the Fed announced in December 2015 that it would raise the fed funds target rate by 0.25%. The news was widely expected and therefore had a relatively muted impact on the financial markets.
Although the Fed continued to emphasize future rate increases would be gradual, investors worried about the pace. This, along with uncertainties about the global macroeconomic backdrop, another downdraft in oil prices and a spike in stock market volatility triggered significant losses across assets that carry more risk and fueled demand for “safe haven” assets such as Treasury bonds and gold from January through mid-February. However, fear began to subside in March, propelling assets that carry more risk higher. The Fed held the rate steady at both the January and March policy meetings, as well as lowered its expectations to two rate increases in 2016 from four. Also boosting investor confidence were reassuring statements from the European Central Bank, some positive economic data in the U.S. and abroad, a retreat in the U.S. dollar and an oil price rally.
The broad municipal bond market performed well in the twelve-month reporting period, supported by falling interest rates, a favorable supply-demand balance and generally improving credit fundamentals. Early in the reporting period, interest rates rose on the expectation that the Fed would begin to raise short-term interest rates in the latter half of 2015. However, with the Fed’s first increase delayed until December and its indication of a more gradual path of increases in 2016, interest rates trended lower over the remainder of the reporting period. Municipal market yields moved in tandem with broader interest rates, ending the reporting period below where they started. However, while the yields on intermediate- and longer-dated bonds posted sizeable declines, the yields of short-dated bonds increased slightly over the reporting period. This caused the municipal yield curve to flatten over the reporting period.
The municipal market’s supply-demand balance was generally favorable over this reporting period. Over the twelve months ended April 30, 2016, municipal bond gross issuance nationwide totaled $379.4 billion, a 4.5% drop from the issuance for the twelve-month period ended April 30, 2015. Gross issuance remains elevated as issuers continue to actively and aggressively refund their outstanding debt given the very low interest rate environment. In these transactions the issuers are issuing new bonds and taking the bond proceeds and redeeming (calling) old bonds. These refunding transactions have ranged from 40%-60% of total issuance over the past few years. Thus, the net issuance (all bonds issued less bonds redeemed) is actually much lower than the gross issuance. In fact, the total municipal bonds outstanding has actually declined in each of the past four calendar years. So, the gap between gross and net issuance has been an overall positive technical factor on municipal bond investment performance.
While supply has tightened, investor demand for municipal bonds has risen. Municipal bond mutual funds reported net inflows in 2015, and the inflows for the first four months of 2016 had already exceeded 2015’s total volume for the year. The bouts of heightened volatility across other assets that carry more risk, uncertainty about the Fed’s rate increases and the low to negative yields of European and Asian bonds have bolstered the appeal of municipal bonds’ risk-adjusted returns and tax-equivalent yields. The municipal bond market is less directly influenced by the Fed’s rate adjustments and its demand base is largely comprised of U.S. investors, factors which have helped municipal bonds deliver relatively attractive returns with less volatility than other market segments.
The fundamental backdrop also remained supportive for municipal bonds. Despite the U.S. economy’s rather sluggish recovery, improving state and local balance sheets have contributed to generally good credit fundamentals. Higher tax revenue growth, better expense management and a more cautious approach to new debt issuance have led to credit upgrades and stable credit outlooks
for many state and local issuers. While some pockets of weakness continued to grab headlines, including Illinois, New Jersey and Puerto Rico, their problems were largely contained, with minimal spillover into the broader municipal market.
How did the Funds perform during the twelve-month reporting period ended April 30, 2016?
The tables in the Fund Performance, Expense Ratios and Effective Leverage Ratios section of this report provide each Fund’s total return performance information for the applicable one-year, five-year, ten-year and since-inception periods ended April 30, 2016. The returns for each Fund’s Class A Shares at net asset value (NAV) are compared to the performance of its corresponding market index and Lipper classification average. During this reporting period, the Nuveen All-American Municipal Bond Fund outpaced its benchmark, while the other Funds underperformed their respective benchmark. Meanwhile, four of the five Funds outperformed their respective peer group averages, while the Nuveen Inflation Protected Municipal Bond Fund underperformed its peer group average.
Nuveen All-American Municipal Bond Fund
For the twelve months ended April 30, 2016, the Nuveen All-American Municipal Bond Fund’s Class A Shares at NAV outperformed the S&P Municipal Bond Index and the Lipper General & Insured Municipal Debt Funds Classification Average.
Compared to the S&P Municipal Bond Index, the Fund benefited from strong security selection and, to a lesser extent, duration positioning. During the twelve-month reporting period, municipal bonds generally rallied. This provided a positive relative performance environment for the Fund, given our longer-than-benchmark duration, meaning the Fund was positioned to benefit more from declining interest rates. In fact, late in the reporting period, we increased portfolio duration even more, due to municipal bonds’ historically attractive yields relative to U.S. Treasuries. This turned out to be an opportune time to extend duration, as it added to the outperformance we had already generated.
In terms of yield curve positioning, the Fund benefited most from its overweighting in longer-dated issues and this more than compensated for the modestly negative performance impact seen from our holdings with maturities of nine to ten years, one of the few sources of negative security selection.
The Fund’s credit quality was well positioned, with our AA rated bonds outperforming comparable issues in the benchmark. An even bigger contribution came from our exposure to non-rated bonds and, especially from credits rated below investment grade. In the non-rated bond segment, our portfolio outperformed the non-rated category in the index by several percentage points. Among bonds rated below investment grade, much of the Fund’s substantial relative outperformance stemmed from our decision to avoid the debt of Puerto Rico, the credit challenged U.S. territory whose bonds struggled during the reporting period.
Another positive performance factor was the Fund’s modest allocation to general obligation (GO) debt of the City of Chicago and the Chicago Board of Education. We invested in these bonds when they were priced at historic lows. In our view, investors were noting the issuers’ genuine financial challenges but failing to take into account their legitimate strengths. In fact, shortly after our purchase and in the following weeks, these bonds enjoyed strong performance and ended up as some of the Fund’s top contributors to results for the reporting period.
Also adding relative value was the Fund’s overweighting in the tobacco sector, the market’s strongest performing group of the reporting period as well as in health care and education. Favorable security selection in the public power category also contributed.
Our allocation to tender-option bonds, or inverse floating rate securities, added to relative performance. They provided relatively high income during the reporting period. Also, the Fund benefited from their longer duration and resulting price appreciation as long-term interest rates fell.
Nuveen Inflation Protected Municipal Bond Fund
For the twelve months ended April 30, 2016, the Nuveen Inflation Protected Municipal Bond Fund’s Class A Shares at NAV underperformed the Barclays 1–10 Year Municipal Bond Index as well as the Lipper Intermediate Municipal Debt Funds Classification Average.
The Fund’s performance is shaped by its two portfolio components: intermediate duration municipal bonds and inflation-linked swaps. The latter are designed to hedge the Fund against changes in inflation expectations, which can influence municipal bond prices.
Portfolio Managers’ Comments (continued)
During the reporting period, the Fund’s municipal bond portfolio outperformed the benchmark, while its inflation protection component was a meaningful detractor from relative performance. In the municipal bond portfolio, the Fund’s duration had the biggest positive impact on relative performance. Longer dated bonds generally outperformed shorter maturity issues. Consequently, our underweighting of the shortest maturity credits, namely bonds with durations between zero and four years, proved helpful. Overweighting the longer end of the intermediate municipal yield curve, most notably bonds with durations between six to ten years, also added value.
In an environment in which lower rated bonds tended to outperform higher grade issues, the Fund’s exposure to the B credit rating tier of the market added to results. At the same time, the Fund was underweighted in the AAA credit rating tier, representing the highest rated bonds, which further added value.
Sector positioning also boosted relative performance. An overweighting in the strong performing transportation bond sector proved particularly helpful. Simultaneously, our underweighting in pre-refunded bonds further contributed to performance. These bonds were held back by their high credit quality and short maturities.
The main detractor in performance this reporting period came from the Fund’s inflation-linked swaps. These securities accomplished their objective of hedging against fluctuations in inflation expectations and realized inflation. However, as expectations for future inflation declined during the reporting period, the value of the swaps dropped accordingly.
Nuveen Intermediate Duration Municipal Bond Fund
For the twelve months ended April 30, 2016, the Nuveen Intermediate Duration Municipal Bond Fund’s Class A Shares at NAV underperformed the S&P Municipal Bond Intermediate Index but outperformed the Lipper Intermediate Municipal Debt Funds Classification Average.
Relative to the benchmark, the Fund was helped by its overweighting in bonds with more credit risk, particularly in the A and BBB rating categories, which performed well relative to the municipal market as a whole. Lower rated bonds continued to benefit from issuers’ stable and improving credit quality, as well as increased demand for these securities from investors seeking income.
The Fund’s yield curve allocation also contributed to the Fund’s results. In maintaining a relatively neutral duration (interest rate sensitivity) we balanced the portfolio’s overweighting in very short dated issues with a similar overweighting on longer dated issues. We maintained this positioning because of our expectation for a flattening yield curve. This situation came to pass this reporting period as rates fell on the curve’s long end, causing the Fund’s longer dated holdings to perform well.
At the same time, rates rising on the short end of the yield curve caused some of the Fund’s shorter-dated positions to lag, particularly the pre-refunded bonds in the portfolio. The Fund’s overweighting in the pre-refunded bond category detracted from relative performance this period, owing to the bonds’ high credit quality and short maturities, two factors out of favor with municipal investors during the reporting period.
On a sector basis, the Fund benefited from its exposure to tobacco bonds, the strongest performing category in the index by a wide margin. Tobacco bonds, with interest payments backed by industry revenues, benefited from a combination of strong demand on the part of investors and increased cigarette shipments that boosted the bonds’ perceived credit quality. The Fund also benefited from its exposure to the health care and transportation bond categories, both of which similarly outpaced the index.
Nuveen Limited Term Municipal Bond Fund
For the twelve months ended April 30, 2016, the Nuveen Limited Term Municipal Bond Fund’s Class A Shares at NAV underperformed the S&P Municipal Bond Short-Intermediate Index but surpassed the results of the Lipper Short-Intermediate Municipal Debt Funds Classification Average.
As with the Intermediate Duration Fund, the Fund benefited from having more exposure than the benchmark to lower investment grade rated bonds, especially in the A and BBB credit tiers, which outpaced the S&P Municipal Bond Short-Intermediate Index. As lower grade bonds outperformed their higher quality counterparts for the reporting period, the Fund’s ratings stance proved helpful.
The Fund’s yield curve positioning also proved positive for relative performance. During the reporting period, we kept the portfolio’s duration closely in line with the benchmark. To achieve that result, we adopted a “barbell” positioning, with an overweighting in very short maturity bonds balanced by an overweighting in issues at the longer end of the limited term universe. Although the Fund’s shortest holdings did not fare well as rates rose on the short end of the yield curve, our longer dated positions did benefit as rates on those securities fell.
The Fund’s sector selection was helped by its allocation to tobacco bonds, which benefited from strong investor demand and improved credit quality. The tobacco sector was the strongest performer in the municipal market. Allocations to the outperforming health care and transportation bond categories also contributed on a relative basis.
Nuveen Short Term Municipal Bond Fund
For the twelve months ended April 30, 2016, the Nuveen Short Term Municipal Bond Fund’s Class A Shares at NAV underperformed the S&P Municipal Bond Short Index but outperformed the Lipper Short Municipal Debt Funds Classification Average.
During the reporting period, investors saw yields increase on the shortest maturity bonds, while those securities on the longer end of the short-term municipal bond universe experienced a decline in yields and a corresponding increase in prices (a bond’s yield and price moves in opposite directions). In this environment, the Fund’s exposure to bonds with relatively longer maturities added value, while in hindsight, cash balances and exposure to shorter bonds were relative detractors.
Meanwhile, the Fund’s credit quality positioning was a clear positive for our results. We often overweight the lower investment grade tier of the market, and this reporting period was no exception. Overweights in bonds with credit ratings of A and BBB contributed notably, as bonds with more credit risk generally outperformed amid investors’ ongoing search for income in a low interest rate environment.
Sector allocation also added value. Relative overweightings in higher yielding sectors, such as health care and education, boosted results in light of those categories’ outperformance. Also, the Fund was substantially underweighted in pre-refunded bonds, which further added value, given that these bonds with high credit quality and short maturities lagged the index return.
What strategies were used to manage the Funds during the twelve-month reporting period ended April 30, 2016?
All of the Funds continued to employ the same fundamental investment strategies and tactics long relied upon by NAM. Our municipal bond portfolios are managed with a value-oriented approach and close input from NAM’s experienced research team. Below, we highlight the specific factors influencing each Fund’s investment strategy, as well as how we managed each portfolio in light of recent market conditions.
Nuveen All-American Municipal Bond Fund
We extended the Fund’s duration throughout the reporting period, especially in the first quarter of 2016, when tax-exempt bond prices struck us as very attractive. We found particular value among 25-year and longer bonds and focused a fair amount of our purchase activity in this maturity range.
During the reporting period, we received a healthy amount of new investment inflows. We applied these proceeds, as well as those of bond calls and maturities, to make new purchases across multiple sectors of the municipal bond market. Often, we emphasized bonds with varying degrees of economic sensitivity, including sales tax, airport and tollroad issues, all of which we believed could benefit from continued slow but steady U.S. economic growth. We also added selectively to the Fund’s holdings in the health care sector as well as in transportation and charter school bonds meeting our value-oriented investment criteria.
On the lower and below investment grade side of the portfolio, we added to the Fund’s exposure to tobacco and corporate-backed industrial development revenue debt. With respect to tobacco bonds, we continued to see value in this part of the market, even after their strong results this period. Meanwhile, among corporate-backed issuers, we focused on a handful of opportunities to buy bonds whose prices had fallen substantially along with commodity prices earlier in the year but that we continued to believe were sufficiently creditworthy to provide a good risk/reward balance.
Portfolio Managers’ Comments (continued)
Nuveen Inflation Protected Municipal Bond Fund
The Fund experienced investment outflows over the twelve-month reporting period, which meant we were not active buyers of municipal debt. Instead, our focus was on managing the outflows to maintain the Fund’s structure, as we believed the Fund was well positioned coming into the reporting period. We were pleased to accomplish this goal, avoiding large changes to the Fund’s duration and yield curve, credit quality and sector positioning.
New purchases, which were minimal, were highlighted by a shorter maturity health care bond issue as well as a corporate-backed industrial development revenue credit. In both cases, the purchases provided what we saw as good value while also fitting nicely into our overall goals for the portfolio.
The Fund’s exposure to inflation-linked swaps decreased during the reporting period. These inflation-linked swaps continued to be classified as so-called non-exchange-cleared derivatives, a beneficial situation for the Fund, given that it enables us to use the Fund’s municipal bond positions as collateral for the securities.
The Fund also invested in credit default swap contracts to manage credit risk. In the first half of the period, we eliminated these swap contracts, which had a negligible impact on the Fund’s performance.
Nuveen Intermediate Duration Municipal Bond Fund
Coming into the reporting period, our goal was to maintain the Fund’s basic sector, credit and duration characteristics, which we continued to find desirable in light of market conditions. We generally achieved this goal, keeping the Fund’s duration roughly neutral compared with the benchmark while preserving prior overweightings in lower investment grade credit rating categories.
We found good value in various municipal bond sectors. New purchases included several opportunities among public power bonds, including issues of Springfield Electric, an electricity provider in downstate Illinois; Entergy, a Louisiana-based investor-owned utility; the Indiana Municipal Power Authority; Florida Municipal Power Authority; and Santee Cooper, a South Carolina electric utility. We acquired these bonds after their prices had fallen in response to the sharp drop in commodity prices. After thoroughly researching the credits, we were comfortable with their underlying quality and believed their higher-than-normal yields compensated investors well for the credit risk.
We were also active in adding transportation bonds, specifically of airport and tollroad issuers, both of which have benefited from increased economic activity and lower fuel prices. In this category, we purchased AA rated debt of the Illinois State Toll Highway Authority, which is in the midst of a major capital improvement project and Cleveland Airport System bonds. Elsewhere, we purchased various general obligation (GO) bonds that we believed offered a good risk/reward tradeoff for our shareholders.
Meanwhile, we were not active sellers during this reporting period, a reflection of the large investment inflows coming into the portfolio. Our occasional sales emphasized highly rated bonds benefiting from good investor demand; when appropriate, we swapped out of these positions into attractive lower rated investments that we believed provided good value and also enabled us to better preserve our desired portfolio positioning.
The Fund also managed the duration of its portfolio by buying interest rate futures contracts. The interest rate futures had a negligible impact on performance during the reporting period.
Nuveen Limited Term Municipal Bond Fund
Our approach to managing the Limited Term Fund resembled that of the Intermediate Duration Fund. Namely, our purchases and sales were made with the goal of keeping the Fund’s basic positioning intact, a goal we accomplished, despite periodic stretches of market volatility during the reporting period.
New purchases took place across multiple market sectors and credit quality segments. We were especially active in the higher education sector, where we saw opportunities to add bonds we liked at prices we saw as attractive relative to the securities’ underlying credit risks. We added Yale University bonds, which we saw as priced attractively enough to provide good value, despite the issuer’s highest credit rating. Also in the sector, we took advantage of an opportunity to buy AA rated debt of the University of California system at a price we found very appealing.
Elsewhere, we invested in the water/sewer category, including for a San Diego sewer system project. In the public power sector, we added Springfield (Illinois) Electric bonds. And in the industrial development revenue category, we increased our position in A rated corporate-backed bonds issued by scrap hauler Waste Management, an active issuer of debt.
This position, with its lower investment grade credit rating, was more representative of the bonds we wanted to add during the reporting period, as we regularly find better opportunities to capture value in these tiers of the municipal bond market. While we did periodically invest in AAA rated bonds, this was not an area of emphasis during this reporting period.
To fund our purchases, we generally relied on the proceeds of new investment inflows as well as bond calls and maturities. We occasionally sold certain higher quality issues when we saw opportunities to put the proceeds to work more productively for shareholders.
Nuveen Short Term Municipal Bond Fund
The Fund’s structure remained relatively consistent with prior reporting periods. We continued to maintain the Fund’s duration positioning slightly longer than the index. To maintain this interest rate positioning, we most often focused new purchases on bonds with maturities ranging from three to four years.
Some changes to the portfolio did take place naturally as a result of bond maturities and calls, as well as our buying and selling activity. The Fund’s exposure to the AAA credit rating tier of the market actually increased (mainly at the expense of the AA credit weighting), while our allocation to other quality segments had little change. In sector terms, the Fund’s allocations were also little changed, although certain tax-backed obligation and miscellaneous revenue weightings grew slightly, while exposure to health care dropped. It’s worth noting, though, that all of these portfolio shifts resulted from bond-by-bond transactions, rather than a strategic decision to reshape the portfolio.
In the second half of the reporting period, we took advantage of an opportunity to add floating-rate securities, whose interest rates adjust in line with other short-term interest rate benchmarks. In our view, these bonds were priced attractively enough that they represented good value for shareholders even if the Federal Reserve continues to delay or proceed slowly with further increases in short-term rates.
We were not frequent sellers during this reporting period, but when we did sell bonds, we generally liquidated shorter maturity debt with lower yields that were not as supportive towards maintaining the Fund’s income streams.
A Note About Investment Valuations
The municipal securities held by the Funds are valued by the Funds’ pricing service using a range of market-based inputs and assumptions. A different municipal pricing service might incorporate different assumptions and inputs into its valuation methodology, potentially resulting in different values for the same securities. These differences could be significant, both as to such individual securities, and as to the value of a given Fund’s portfolio in its entirety. Thus, the current net asset value of a Fund’s shares may be impacted, higher or lower, if the Fund were to change pricing service, or if its pricing service were to materially change its valuation methodology. The Funds have received notification by their current municipal bond pricing service that such service has agreed to be acquired by the parent company of another pricing service, and that the transaction is under regulatory review. Thus there is an increased risk that each Fund’s pricing service may change, or that the Funds’ current pricing service may change its valuation methodology, either of which could have an impact on the net asset value of each Fund’s shares.
Risk Considerations
and Dividend Information
Risk Considerations
Nuveen All-American Municipal Bond Fund
Mutual fund investing involves risk; principal loss is possible. Debt or fixed income securities such as those held by the Fund, are subject to market risk, credit risk, interest rate risk, call risk, tax risk, political and economic risk, and income risk. As interest rates rise, bond prices fall. Credit risk refers to an issuers ability to make interest and principal payments when due. Below investment grade or high yield debt securities are subject to liquidity risk and heightened credit risk. In addition, the Fund periodically engages in a moderate amount of portfolio leverage and in doing so, assumes a higher level of risk in pursuit of its objectives. Leverage involves the risk that the Fund could lose more than its original investment and also increases the Fund’s exposure to volatility, interest rate risk and credit risk.
Nuveen Inflation Protected Municipal Bond Fund
Mutual fund investing involves risk; principal loss is possible. Debt or fixed income securities such as those held by the Fund are subject to market risk, credit risk, interest rate risk, non-diversification risk, call risk, tax risk, political and economic risk, and income risk. As interest rates rise, bond prices fall. Credit risk refers to an issuer’s ability to make interest and principal payments when due. Below investment grade or high yield debt securities are subject to liquidity risk and heightened credit risk. The Fund’s use of derivative instruments may involve a small amount of cash investment relative to the total notional principal amount of the transaction, the magnitude of losses from derivatives may be greater than the amount originally invested. There can be no assurance that the Fund’s inflation hedging strategy will be successful or perform as expected.
Nuveen Intermediate Duration Municipal Bond Fund
Mutual fund investing involves risk; principal loss is possible. Debt or fixed income securities such as those held by the Fund, are subject to market risk, credit risk, interest rate risk, call risk, tax risk, political and economic risk, and income risk. As interest rates rise, bond prices fall. Credit risk refers to an issuers ability to make interest and principal payments when due. Below investment grade or high yield debt securities are subject to liquidity risk and heightened credit risk. The Fund’s use of inverse floaters creates effective leverage. Leverage involves the risk that the Fund could lose more than its original investment and also increases the Fund’s exposure to volatility and interest rate risk.
Nuveen Limited Term Municipal Bond Fund
Mutual fund investing involves risk; principal loss is possible. Debt or fixed income securities such as those held by the Fund, are subject to market risk, credit risk, interest rate risk, call risk, tax risk, political and economic risk, and income risk. As interest rates rise, bond prices fall. Credit risk refers to an issuers ability to make interest and principal payments when due. Below investment grade or high yield debt securities are subject to liquidity risk and heightened credit risk. The Fund’s use of inverse floaters creates effective leverage. Leverage involves the risk that the Fund could lose more than its original investment and also increases the Fund’s exposure to volatility and interest rate risk.
Nuveen Short Term Municipal Bond Fund
Mutual fund investing involves risk; principal loss is possible. Debt or fixed income securities such as those held by the Fund, are subject to market risk, credit risk, interest rate risk, call risk, tax risk, political and economic risk, and income risk. As interest rates rise, bond prices fall. Credit risk refers to an issuers ability to make interest and principal payments when due. Below investment grade or high yield debt securities are subject to liquidity risk and heightened credit risk. The Fund’s use of inverse floaters creates effective leverage. Leverage involves the risk that the Fund could lose more than its original investment and also increases the Fund’s exposure to volatility and interest rate risk.
Dividend Information
Each Fund seeks to pay regular monthly dividends out of its net investment income at a rate that reflects its past and projected net income performance. To permit each Fund to maintain a more stable monthly dividend, the Fund may pay dividends at a rate that may be more or less than the amount of net income actually earned by the Fund during the period. If a Fund has cumulatively earned more than it has paid in dividends, it will hold the excess in reserve as undistributed net investment income (UNII) as part of the Fund’s net asset value. Conversely, if a Fund has cumulatively paid in dividends more than it has earned, the excess will constitute a negative UNII that will likewise be reflected in the Fund’s net asset value. Each Fund will, over time, pay all its net investment income as dividends to shareholders.
As of April 30, 2016, each Fund had a positive UNII balance for tax purposes and a positive UNII balance for financial reporting purposes.
All monthly dividends paid by each Fund during the current reporting period were paid from net investment income. If a portion of the Fund’s monthly distributions was sourced from or comprised of elements other than net investment income, including capital gains and/or a return of capital, shareholders would have received a notice to that effect. For financial reporting purposes, the composition and per share amounts of each Fund’s dividends for the reporting period are presented in this report’s Statement of Changes in Net Assets and Financial Highlights, respectively. For income tax purposes, distribution information for each Fund as of its most recent tax year end is presented in Note 6 – Income Tax Information within the Notes to Financial Statements of this report.
THIS PAGE INTENTIONALLY LEFT BLANK
Fund Performance, Expense Ratios
and Effective Leverage Ratios
The Fund Performance, Expense Ratios and Effective Leverage Ratios for each Fund are shown within this section of the report.
Returns quoted represent past performance, which is no guarantee of future results. Current performance may be higher or lower than the performance shown. Investment returns and principal value will fluctuate so that when shares are redeemed, they may be worth more or less than their original cost. Returns without sales charges would be lower if the sales charge were included. Returns do not reflect the deduction of taxes that a shareholder would pay on Fund distributions or the redemption of Fund shares. Income is generally exempt from regular federal income taxes. Some income may be subject to state and local income taxes and to the federal alternative minimum tax. Capital gains, if any, are subject to tax.
Returns may reflect fee waivers and/or expense reimbursements by the investment adviser during the periods presented. If any such waivers and/or reimbursements had not been in place, returns would have been reduced. See Notes to Financial Statements, Note 7—Management Fees and Other Transactions with Affiliates for more information. For the most recent month-end performance visit www.nuveen.com or call (800) 257-8787.
Returns reflect differences in sales charges and expenses, which are primarily differences in distribution and service fees. Fund returns assume reinvestment of dividends and capital gains.
Comparative index and Lipper return information is provided for Class A Shares at net asset value (NAV) only.
The expense ratios shown reflect total operating expenses (before fee waivers and/or expense reimbursements, if any) as shown in the most recent prospectus. The expense ratios include management fees and other fees and expenses.
Leverage is created whenever a Fund has investment exposure (both reward and/or risk) equivalent to more than 100% of the investment capital. The effective leverage ratio shown is the amount of investment exposure created either through borrowings or indirectly through inverse floaters, divided by the assets invested, including those assets that were purchased with the proceeds of the leverage, or referenced by the levered instrument.
Fund Performance, Expense Ratios and Effective Leverage Ratios (continued)
Nuveen All-American Municipal Bond Fund
Refer to the first page of this Fund Performance, Expense Ratios and Effective Leverage Ratios section for further explanation of the information included within this section. Refer to the Glossary of Terms Used in this Report for definitions of terms used within this section.
Fund Performance
Average Annual Total Returns as of April 30, 2016
| | | | | | | | | | | | |
| | | Average Annual | |
| | | 1-Year | | | 5-Year | | | 10-Year | |
Class A Shares at NAV | | | 5.85% | | | | 7.32% | | | | 5.55% | |
Class A Shares at maximum Offering Price | | | 1.38% | | | | 6.40% | | | | 5.10% | |
S&P Municipal Bond Index | | | 5.16% | | | | 5.56% | | | | 4.87% | |
Lipper General & Insured Municipal Debt Funds Classification Average | | | 4.88% | | | | 5.60% | | | | 4.27% | |
| | | |
Class C2 Shares | | | 5.22% | | | | 6.75% | | | | 4.97% | |
Class I Shares | | | 6.05% | | | | 7.50% | | | | 5.75% | |
| | | | | | | | |
| | | Average Annual | |
| | | 1-Year | | | Since
Inception | |
Class C Shares | | | 5.04% | | | | 6.64% | |
Average Annual Total Returns as of March 31, 2016 (Most Recent Calendar Quarter)
| | | | | | | | | | | | |
| | | Average Annual | |
| | | 1-Year | | | 5-Year | | | 10-Year | |
Class A Shares at NAV | | | 4.36% | | | | 7.50% | | | | 5.43% | |
Class A Shares at maximum Offering Price | | | (0.02)% | | | | 6.59% | | | | 4.98% | |
Class C2 Shares | | | 3.83% | | | | 6.93% | | | | 4.86% | |
Class I Shares | | | 4.56% | | | | 7.68% | | | | 5.63% | |
| | | | | | | | |
| | | Average Annual | |
| | | 1-Year | | | Since
Inception | |
Class C Shares | | | 3.56% | | | | 6.44% | |
Since inception returns for Class C Shares are from 2/10/14. Indexes and Lipper averages are not available for direct investment.
Class A Shares have a maximum 4.20% sales charge (Offering Price). Class A Share purchases of $1 million or more are sold at net asset value without an up-front sales charge but may be subject to a contingent deferred sales charge (CDSC), also known as a back-end sales charge, if redeemed within eighteen months of purchase. Such CDSC will be equal to 1.00% for any shares purchased on or after November 1, 2015. Class C and C2 Shares have a 1% CDSC for redemptions within less than twelve months, which is not reflected in the one-year total return. Class I Shares have no sales charge and may be purchased under limited circumstances or by specified classes of investors.
Expense Ratios as of Most Recent Prospectus
| | | | | | | | | | | | | | | | |
| | | Share Class | |
| | | Class A | | | Class C | | | Class C2 | | | Class I | |
Expense Ratios | | | 0.70% | | | | 1.50% | | | | 1.25% | | | | 0.50% | |
Effective Leverage Ratio as of April 30, 2016
| | | | |
Effective Leverage Ratio | | | 5.02% | |
Growth of an Assumed $10,000 Investment as of April 30, 2016 – Class A Shares
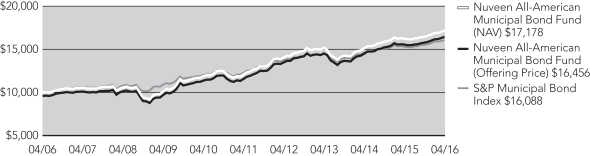
The graphs do not reflect the deduction of taxes that a shareholder may pay on Fund distributions or the redemption of Fund shares.
Fund Performance, Expense Ratios and Effective Leverage Ratios (continued)
Nuveen Inflation Protected Municipal Bond Fund
Refer to the first page of this Fund Performance, Expense Ratios and Effective Leverage Ratios section for further explanation of the information included within this section. Refer to the Glossary of Terms Used in this Report for definitions of terms used within this section.
Fund Performance
Average Annual Total Returns as of April 30, 2016
| | | | | | | | | | | | |
| | | Average Annual | |
| | | 1-Year | | | 5-Year | | | Since
Inception | |
Class A Shares at NAV | | | 2.83% | | | | 3.23% | | | | 3.89% | |
Class A Shares at maximum Offering Price | | | (0.26)% | | | | 2.60% | | | | 3.28% | |
Barclays 1-10 Year Municipal Bond Index | | | 3.65% | | | | 3.52% | | | | 3.65% | |
Lipper Intermediate Municipal Debt Funds Classification Average | | | 4.06% | | | | 4.06% | | | | 4.22% | |
| | | |
Class C2 Shares | | | 2.34% | | | | 2.66% | | | | 3.32% | |
Class I Shares | | | 3.19% | | | | 3.44% | | | | 4.11% | |
| | | | | | | | |
| | | Average Annual | |
| | | 1-Year | | | Since
Inception | |
Class C Shares | | | 2.05% | | | | 1.87% | |
Average Annual Total Returns as of March 31, 2016 (Most Recent Calendar Quarter)
| | | | | | | | | | | | |
| | | Average Annual | |
| | | 1-Year | | | 5-Year | | | Since
Inception | |
Class A Shares at NAV | | | 2.83% | | | | 3.54% | | | | 3.81% | |
Class A Shares at maximum Offering Price | | | (0.26)% | | | | 2.91% | | | | 3.19% | |
Class C2 Shares | | | 2.25% | | | | 2.99% | | | | 3.25% | |
Class I Shares | | | 3.00% | | | | 3.74% | | | | 4.02% | |
| | | | | | | | |
| | | Average Annual | |
| | | 1-Year | | | Since
Inception | |
Class C Shares | | | 1.96% | | | | 1.61% | |
Since inception returns for Class A, Class C2 and Class I Shares, and the index and Lipper average are from 3/08/11. Since inception returns for Class C Shares are from 2/10/14. Indexes and Lipper averages are not available for direct investment.
Class A Shares have a maximum 3.00% sales charge (Offering Price). Class A Share purchases of $1 million or more are sold at net asset value without an up-front sales charge but may be subject to a contingent deferred sales charge (CDSC), also known as a back-end sales charge, if redeemed within eighteen months of purchase. Such CDSC will be equal to 1.00% for any shares purchased on or after November 1, 2015. Class C and C2 Shares have a 1% CDSC for redemptions within less than twelve months, which is not reflected in the one-year total return. Class I Shares have no sales charge and may be purchased under limited circumstances or by specified classes of investors.
Expense Ratios as of Most Recent Prospectus
| | | | | | | | | | | | | | | | |
| | | Share Class | |
| | | Class A | | | Class C | | | Class C2 | | | Class I | |
Gross Expense Ratios | | | 1.00% | | | | 1.81% | | | | 1.55% | | | | 0.79% | |
Net Expense Ratios | | | 0.77% | | | | 1.57% | | | | 1.32% | | | | 0.57% | |
The Fund’s investment adviser has contractually agreed to waive fees and/or reimburse expenses through September 30, 2016 so that total annual Fund operating expenses (excluding 12b-1 distribution and service fees, interest expenses, taxes, acquired fund fees and expenses, fees incurred in acquiring and disposing of portfolio securities and extraordinary expenses) do not exceed 0.60% (1.05% after September 30, 2016) of the average daily net assets of any class of Fund shares. The expense limitation expiring September 30, 2016 may be terminated or modified prior to that date only with the approval of the Board of Trustees of the Fund. The expense limitation in effect thereafter may be terminated or modified only with the approval of shareholders of the Fund.
Growth of an Assumed $10,000 Investment as of April 30, 2016 – Class A Shares
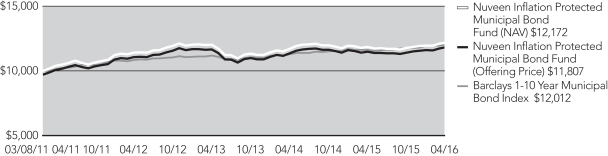
The graphs do not reflect the deduction of taxes that a shareholder may pay on Fund distributions or the redemption of Fund shares.
Fund Performance, Expense Ratios and Effective Leverage Ratios (continued)
Nuveen Intermediate Duration Municipal Bond Fund
Refer to the first page of this Fund Performance, Expense Ratios and Effective Leverage Ratios section for further explanation of the information included within this section. Refer to the Glossary of Terms Used in this Report for definitions of terms used within this section.
Fund Performance
Average Annual Total Returns as of April 30, 2016
| | | | | | | | | | | | |
| | | Average Annual | |
| | | 1-Year | | | 5-Year | | | 10-Year | |
Class A Shares at NAV | | | 4.83% | | | | 4.50% | | | | 4.18% | |
Class A Shares at maximum Offering Price | | | 1.63% | | | | 3.87% | | | | 3.87% | |
S&P Municipal Bond Intermediate Index | | | 5.02% | | | | 4.86% | | | | 5.10% | |
Lipper Intermediate Municipal Debt Funds Classification Average | | | 4.06% | | | | 4.06% | | | | 3.87% | |
| | | |
Class C2 Shares | | | 4.17% | | | | 3.90% | | | | 3.61% | |
Class I Shares | | | 4.91% | | | | 4.69% | | | | 4.38% | |
| | | | | | | | |
| | | Average Annual | |
| | | 1-Year | | | Since
Inception | |
Class C Shares | | | 3.91% | | | | 3.85% | |
Average Annual Total Returns as of March 31, 2016 (Most Recent Calendar Quarter)
| | | | | | | | | | | | |
| | | Average Annual | |
| | | 1-Year | | | 5-Year | | | 10-Year | |
Class A Shares at NAV | | | 3.60% | | | | 4.59% | | | | 4.10% | |
Class A Shares at maximum Offering Price | | | 0.46% | | | | 3.96% | | | | 3.77% | |
Class C2 Shares | | | 3.06% | | | | 4.02% | | | | 3.54% | |
Class I Shares | | | 3.90% | | | | 4.81% | | | | 4.31% | |
| | | | | | | | |
| | | Average Annual | |
| | | 1-Year | | | Since
Inception | |
Class C Shares | | | 2.80% | | | | 3.72% | |
Since inception returns for Class C Shares are from 2/10/14. Indexes and Lipper averages are not available for direct investment.
Class A Shares have a maximum 3.00% sales charge (Offering Price). Class A Share purchases of $1 million or more are sold at net asset value without an up-front sales charge but may be subject to a contingent deferred sales charge (CDSC), also known as a back-end sales charge, if redeemed within eighteen months of purchase. Such CDSC will be equal to 1.00% for any shares purchased on or after November 1, 2015. Class C and C2 Shares have a 1% CDSC for redemptions within less than twelve months, which is not reflected in the one-year total return. Class I Shares have no sales charge and may be purchased under limited circumstances or by specified classes of investors.
Expense Ratios as of Most Recent Prospectus
| | | | | | | | | | | | | | | | |
| | | Share Class | |
| | | Class A | | | Class C | | | Class C2 | | | Class I | |
Expense Ratios | | | 0.69% | | | | 1.49% | | | | 1.24% | | | | 0.49% | |
Effective Leverage Ratio as of April 30, 2016
| | | | |
Effective Leverage Ratio | | | 0.46% | |
Growth of an Assumed $10,000 Investment as of April 30, 2016 – Class A Shares
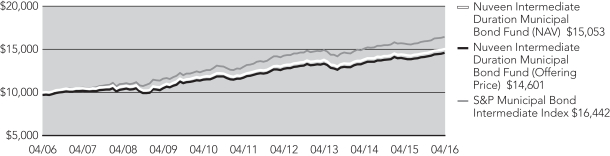
The graphs do not reflect the deduction of taxes that a shareholder may pay on Fund distributions or the redemption of Fund shares.
Fund Performance, Expense Ratios and Effective Leverage Ratios (continued)
Nuveen Limited Term Municipal Bond Fund
Refer to the first page of this Fund Performance, Expense Ratios and Effective Leverage Ratios section for further explanation of the information included within this section. Refer to the Glossary of Terms Used in this Report for definitions of terms used within this section.
Fund Performance
Average Annual Total Returns as of April 30, 2016
| | | | | | | | | | | | |
| | | Average Annual | |
| | | 1-Year | | | 5-Year | | | 10-Year | |
Class A Shares at NAV | | | 2.50% | | | | 2.67% | | | | 3.31% | |
Class A Shares at maximum Offering Price | | | (0.02)% | | | | 2.15% | | | | 3.05% | |
S&P Municipal Bond Short-Intermediate Index | | | 2.81% | | | | 2.80% | | | | 3.82% | |
Lipper Short-Intermediate Municipal Debt Funds Classification Average | | | 1.92% | | | | 2.28% | | | | 2.92% | |
| | | |
Class C2 Shares | | | 2.12% | | | | 2.30% | | | | 2.95% | |
Class I Shares | | | 2.68% | | | | 2.87% | | | | 3.51% | |
| | | | | | | | |
| | | Average Annual | |
| | | 1-Year | | | Since
Inception | |
Class C Shares | | | 1.71% | | | | 1.52% | |
Average Annual Total Returns as of March 31, 2016 (Most Recent Calendar Quarter)
| | | | | | | | | | | | |
| | | Average Annual | |
| | | 1-Year | | | 5-Year | | | 10-Year | |
Class A Shares at NAV | | | 2.04% | | | | 2.82% | | | | 3.29% | |
Class A Shares at maximum Offering Price | | | (0.55)% | | | | 2.29% | | | | 3.03% | |
Class C2 Shares | | | 1.57% | | | | 2.45% | | | | 2.92% | |
Class I Shares | | | 2.22% | | | | 3.02% | | | | 3.50% | |
| | | | | | | | |
| | | Average Annual | |
| | | 1-Year | | | Since
Inception | |
Class C Shares | | | 1.27% | | | | 1.46% | |
Since inception returns for Class C Shares are from 2/10/14. Indexes and Lipper averages are not available for direct investment.
Class A Shares have a maximum 2.50% sales charge (Offering Price). Class A Share purchases of $250,000 or more are sold at net asset value without an up-front sales charge but may be subject to a contingent deferred sales charge (CDSC), also known as a back-end sales charge, if redeemed within eighteen months of purchase. Such CDSC will be equal to 0.70% for any shares purchased on or after November 1, 2015. Class C and C2 Shares have a 1% CDSC for redemptions within less than twelve months, which is not reflected in the one-year total return. Class I Shares have no sales charge and may be purchased under limited circumstances or by specified classes of investors.
Expense Ratios as of Most Recent Prospectus
| | | | | | | | | | | | | | | | |
| | | Share Class | |
| | | Class A | | | Class C | | | Class C2 | | | Class I | |
Expense Ratios | | | 0.64% | | | | 1.43% | | | | 0.99% | | | | 0.44% | |
Effective Leverage Ratio as of April 30, 2016
| | | | |
Effective Leverage Ratio | | | 0.00% | |
Growth of an Assumed $10,000 Investment as of April 30, 2016 – Class A Shares
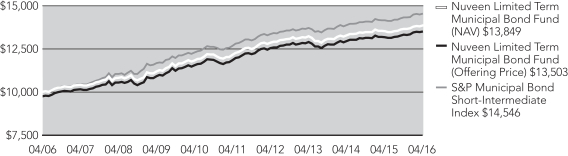
The graphs do not reflect the deduction of taxes that a shareholder may pay on Fund distributions or the redemption of Fund shares.
Fund Performance, Expense Ratios and Effective Leverage Ratios (continued)
Nuveen Short Term Municipal Bond Fund
Refer to the first page of this Fund Performance, Expense Ratios and Effective Leverage Ratios section for further explanation of the information included within this section. Refer to the Glossary of Terms Used in this Report for definitions of terms used within this section.
Fund Performance
Average Annual Total Returns as of April 30, 2016
| | | | | | | | | | | | |
| | | Average Annual | |
| | | 1-Year | | | 5-Year | | | 10-Year | |
Class A Shares at NAV | | | 1.01% | | | | 1.66% | | | | 2.38% | |
Class A Shares at maximum Offering Price | | | (1.52)% | | | | 1.14% | | | | 2.12% | |
S&P Municipal Bond Short Index | | | 1.37% | | | | 1.37% | | | | 2.67% | |
Lipper Short Municipal Debt Funds Classification Average | | | 0.78% | | | | 1.14% | | | | 1.86% | |
| | | |
Class I Shares | | | 1.29% | | | | 1.86% | | | | 2.56% | |
| | | | | | | | |
| | | Average Annual | |
| | | 1-Year | | | Since
Inception | |
Class C Shares | | | 0.41% | | | | 0.32% | |
Class C2 Shares | | | 0.65% | �� | | | 0.94% | |
Average Annual Total Returns as of March 31, 2016 (Most Recent Calendar Quarter)
| | | | | | | | | | | | |
| | | Average Annual | |
| | | 1-Year | | | 5-Year | | | 10-Year | |
Class A Shares at NAV | | | 0.90% | | | | 1.78% | | | | 2.40% | |
Class A Shares at maximum Offering Price | | | (1.62)% | | | | 1.27% | | | | 2.14% | |
Class I Shares | | | 0.98% | | | | 1.96% | | | | 2.56% | |
| | | | | | | | |
| | | Average Annual | |
| | | 1-Year | | | Since
Inception | |
Class C Shares | | | 0.24% | | | | 0.28% | |
Class C2 Shares | | | 0.55% | | | | 0.94% | |
Since inception returns for Class C and Class C2 Shares are from 2/10/14 and 8/31/11, respectively. Indexes and Lipper averages are not available for direct investment.
Class A Shares have a maximum 2.50% sales charge (Offering Price). Class A Share purchases of $250,000 or more are sold at net asset value without an up-front sales charge but may be subject to a contingent deferred sales charge (CDSC), also known as a back-end sales charge, if redeemed within eighteen months of purchase. Such CDSC will be equal to 0.70% for any shares purchased on or after November 1, 2015. Class C and C2 Shares have a 1% CDSC for redemptions within less than twelve months, which is not reflected in the one-year total return. Class I Shares have no sales charge and may be purchased under limited circumstances or by specified classes of investors.
Expense Ratios as of Most Recent Prospectus
| | | | | | | | | | | | | | | | |
| | | Share Class | |
| | | Class A | | | Class C | | | Class C2 | | | Class I | |
Expense Ratios | | | 0.71% | | | | 1.50% | | | | 1.06% | | | | 0.50% | |
Effective Leverage Ratio as of April 30, 2016
| | | | |
Effective Leverage Ratio | | | 0.00% | |
Growth of an Assumed $10,000 Investment as of April 30, 2016 – Class A Shares
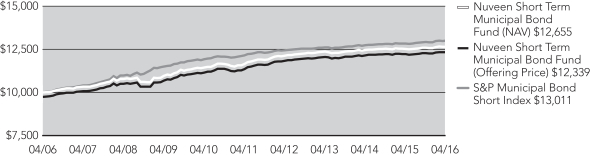
The graphs do not reflect the deduction of taxes that a shareholder may pay on Fund distributions or the redemption of Fund shares.
Yields as of April 30, 2016
Dividend Yield is the most recent dividend per share (annualized) divided by the offering price per share.
The SEC 30-Day Yield is a standardized measure of a fund’s yield that accounts for the future amortization of premiums or discounts of bonds held in the fund’s portfolio. The SEC 30-Day Yield is computed under an SEC standardized formula and is based on the maximum offer price per share. Subsidized yields reflect fee waivers and/or expense reimbursements from the investment adviser during the period. If any such waivers and/or reimbursements had not been in place, yields would have been reduced. Unsubsidized yields do not reflect waivers and/or reimbursements from the investment adviser during the period. Refer to the Notes to Financial Statements, Note 7 – Management Fees and Other Transactions with Affiliates for further details on the investment adviser’s most recent agreement with the Fund to waive fees and/or reimburse expenses, where applicable. Dividend Yield may differ from the SEC 30-Day Yield because the Fund may be paying out more or less than it is earning and it may not include the effect of amortization of bond premium.
The Taxable-Equivalent Yield represents the yield that must be earned on a fully taxable investment in order to equal the yield of the fund on an after-tax basis at a specified tax rate. If the comparison were instead to investments that generate qualified dividend income, which is taxable at a rate lower than an individual’s ordinary graduated tax rate, the fund’s Taxable-Equivalent Yield would be lower.
Nuveen All-American Municipal Bond Fund
| | | | | | | | | | | | | | | | |
| | | Share Class | |
| | | Class A1 | | | Class C | | | Class C2 | | | Class I | |
Dividend Yield | | | 3.46% | | | | 2.85% | | | | 3.10% | | | | 3.80% | |
SEC 30-Day Yield | | | 2.04% | | | | 1.33% | | | | 1.59% | | | | 2.33% | |
Taxable-Equivalent Yield (28.0%)2 | | | 2.83% | | | | 1.85% | | | | 2.21% | | | | 3.24% | |
Nuveen Inflation Protected Municipal Bond Fund
| | | | | | | | | | | | | | | | |
| | | Share Class | |
| | | Class A1 | | | Class C | | | Class C2 | | | Class I | |
Dividend Yield | | | 2.40% | | | | 1.63% | | | | 1.91% | | | | 2.64% | |
SEC 30-Day Yield-Subsidized | | | 1.40% | | | | 0.66% | | | | 0.91% | | | | 1.64% | |
SEC 30-Day Yield-Unsubsidized | | | 1.12% | | | | 0.37% | | | | 0.61% | | | | 1.35% | |
Taxable-Equivalent Yield-Subsidized (28.0%)2 | | | 1.94% | | | | 0.92% | | | | 1.26% | | | | 2.28% | |
Taxable-Equivalent Yield-Unsubsidized (28.0%)2 | | | 1.56% | | | | 0.51% | | | | 0.85% | | | | 1.88% | |
Nuveen Intermediate Duration Municipal Bond Fund
| | | | | | | | | | | | | | | | |
| | | Share Class | |
| | | Class A1 | | | Class C | | | Class C2 | | | Class I | |
Dividend Yield | | | 2.66% | | | | 1.98% | | | | 2.23% | | | | 2.93% | |
SEC 30-Day Yield-Subsidized | | | 1.34% | | | | 0.59% | | | | 0.84% | | | | 1.58% | |
SEC 30-Day Yield-Unsubsidized | | | 1.34% | | | | 0.59% | | | | 0.84% | | | | 1.58% | |
Taxable-Equivalent Yield-Subsidized (28.0%)2 | | | 1.86% | | | | 0.82% | | | | 1.17% | | | | 2.19% | |
Taxable-Equivalent Yield-Unsubsidized (28.0%)2 | | | 1.86% | | | | 0.82% | | | | 1.17% | | | | 2.19% | |
Nuveen Limited Term Municipal Bond Fund
| | | | | | | | | | | | | | | | |
| | | Share Class | |
| | | Class A1 | | | Class C | | | Class C2 | | | Class I | |
Dividend Yield | | | 1.78% | | | | 1.03% | | | | 1.46% | | | | 2.00% | |
SEC 30-Day Yield | | | 0.79% | | | | 0.02% | | | | 0.47% | | | | 1.01% | |
Taxable-Equivalent Yield (28.0%)2 | | | 1.10% | | | | 0.03% | | | | 0.65% | | | | 1.40% | |
Nuveen Short Term Municipal Bond Fund
| | | | | | | | | | | | | | | | |
| | | Share Class | |
| | | Class A1 | | | Class C | | | Class C2 | | | Class I | |
Dividend Yield | | | 0.92% | | | | 0.18% | | | | 0.59% | | | | 1.13% | |
SEC 30-Day Yield | | | 0.51% | | | | 0.18% | | | | (0.27)% | | | | 0.72% | |
Taxable-Equivalent Yield (28.0%)2 | | | 0.71% | | | | 0.25% | | | | (0.38)% | | | | 1.00% | |
| 1 | The SEC Yield for Class A shares quoted in the table reflects the maximum sales load. Investors paying a reduced load because of volume discounts, investors paying no load because they qualify for one of the several exclusions from the load, and existing shareholders who previously paid a load but would like to know the SEC Yield applicable to their shares on a going-forward basis, should understand that the SEC Yield effectively applicable to them would be higher than the figure quoted in the table. |
| 2 | The Taxable-Equivalent Yield is based on the Fund’s SEC 30-Day Yield on the indicated date and a federal income tax rate shown in the respective table above. |
Holding
Summaries as of April 30, 2016
This data relates to the securities held in each Fund’s portfolio of investments as of the end of the reporting period. It should not be construed as a measure of performance for the Fund itself. Holdings are subject to change.
Ratings shown are the highest rating given by one of the following national rating agencies: Standard & Poor’s, Moody’s Investors Service, Inc. or Fitch, Inc. Credit ratings are subject to change. AAA, AA, A and BBB are investment grade ratings; BB, B, CCC, CC, C and D are below investment grade ratings. Certain bonds backed by U.S. Government or agency securities are regarded as having an implied rating equal to the rating of such securities. Holdings designated N/R are not rated by these national rating agencies.
Refer to the Glossary of Terms Used in this Report for further definition of the terms used within this section.
Nuveen All-American Municipal Bond Fund
Fund Allocation
(% of net assets)
| | | | |
Long-Term Municipal Bonds | | | 99.5% | |
Corporate Bonds | | | 0.0% | |
Floating Rate Obligations | | | (2.2)% | |
Other Assets Less Liabilities | | | 2.7% | |
Net Assets | | | 100% | |
Bond Credit Quality
(% of total investment exposure)
| | | | |
AAA/U.S. Guaranteed | | | 13.5% | |
AA | | | 30.5% | |
A | | | 21.6% | |
BBB | | | 17.1% | |
BB or Lower | | | 10.1% | |
N/R (not rated) | | | 7.2% | |
Total | | | 100% | |
Portfolio Composition
(% of total investments)
| | | | |
Health Care | | | 15.9% | |
Tax Obligation/Limited | | | 13.5% | |
Tax Obligation/General | | | 12.4% | |
Transportation | | | 12.1% | |
Utilities | | | 11.1% | |
Education and Civic Organizations | | | 10.6% | |
U.S. Guaranteed | | | 7.6% | |
Other | | | 16.8% | |
Total | | | 100% | |
States and Territories
(% of total municipal bonds)
| | | | |
Texas | | | 12.1% | |
Illinois | | | 11.4% | |
California | | | 9.4% | |
Florida | | | 6.5% | |
Colorado | | | 4.2% | |
Pennsylvania | | | 4.2% | |
Wisconsin | | | 4.2% | |
Ohio | | | 4.1% | |
New York | | | 3.8% | |
Washington | | | 3.2% | |
Arizona | | | 3.2% | |
Indiana | | | 3.2% | |
Missouri | | | 2.3% | |
Louisiana | | | 2.2% | |
Minnesota | | | 2.2% | |
Nebraska | | | 2.1% | |
Georgia | | | 1.9% | |
Other | | | 19.8% | |
Total | | | 100% | |
Nuveen Inflation Protected Municipal Bond Fund
Fund Allocation
(% of net assets)
| | | | |
Long-Term Municipal Bonds | | | 105.3% | |
Other Assets Less Liabilities | | | (5.3)% | |
Net Assets | | | 100% | |
Bond Credit Quality
(% of total investments)1
| | | | |
AAA/U.S. Guaranteed | | | 3.3% | |
AA | | | 38.4% | |
A | | | 34.0% | |
BBB | | | 10.7% | |
BB or Lower | | | 5.1% | |
NR (not rated) | | | 8.5% | |
Total | | | 100% | |
Portfolio Composition
(% of total investments)1
| | | | |
Tax Obligation/Limited | | | 32.6% | |
Transportation | | | 25.6% | |
Tax Obligation/General | | | 11.6% | |
Health Care | | | 7.5% | |
Utilities | | | 6.3% | |
Education and Civic Organizations | | | 6.1% | |
Other | | | 10.3% | |
Total | | | 100% | |
States and Territories
(% of total municipal bonds)
| | | | |
Colorado | | | 14.0% | |
California | | | 13.7% | |
Illinois | | | 8.6% | |
Louisiana | | | 7.0% | |
Texas | | | 4.4% | |
Ohio | | | 4.2% | |
Indiana | | | 3.7% | |
New York | | | 3.4% | |
Wisconsin | | | 3.4% | |
Iowa | | | 3.1% | |
Pennslyvania | | | 3.1% | |
Kansas | | | 2.8% | |
Missouri | | | 2.7% | |
Oregon | | | 2.7% | |
Utah | | | 2.6% | |
Georgia | | | 2.5% | |
Other | | | 18.1% | |
Total | | | 100% | |
| 1 | Excluding investments in derivatives. |
Holding Summaries as of April 30, 2016 (continued)
Nuveen Intermediate Duration Municipal Bond Fund
Fund Allocation
(% of net assets)
| | | | |
Long-Term Municipal Bonds | | | 98.3% | |
Corporate Bonds | | | 0.0% | |
Investment Companies | | | 0.3% | |
Short-Term Municipal Bonds | | | 0.6% | |
Other Assets Less Liabilities | | | 0.8% | |
Net Assets | | | 100% | |
Bond Credit Quality
(% of total investment exposure)
| | | | |
AAA/U.S. Guaranteed | | | 14.2% | |
AA | | | 36.1% | |
A | | | 29.3% | |
BBB | | | 15.2% | |
BB or Lower | | | 3.9% | |
N/R (not rated) | | | 1.0% | |
N/A (not applicable) | | | 0.3% | |
Total | | | 100% | |
Portfolio Composition
(% of total investments)
| | | | |
Tax Obligation/Limited | | | 19.6% | |
Tax Obligation/General | | | 19.3% | |
Health Care | | | 16.5% | |
Transportation | | | 11.6% | |
Utilities | | | 10.7% | |
U.S. Guaranteed | | | 8.5% | |
Other | | | 13.8% | |
Total | | | 100% | |
States and Territories
(% of total municipal bonds)
| | | | |
Illinois | | | 11.5% | |
Texas | | | 8.5% | |
California | | | 7.3% | |
Florida | | | 7.0% | |
New York | | | 5.6% | |
Indiana | | | 4.5% | |
New Jersey | | | 4.4% | |
Ohio | | | 4.0% | |
Pennsylvania | | | 3.9% | |
Nevada | | | 3.4% | |
Arizona | | | 3.2% | |
Wisconsin | | | 3.2% | |
Michigan | | | 2.6% | |
Louisiana | | | 2.5% | |
Colorado | | | 2.1% | |
South Carolina | | | 1.7% | |
Kentucky | | | 1.6% | |
Missouri | | | 1.5% | |
Tennessee | | | 1.4% | |
Georgia | | | 1.4% | |
Other | | | 18.7% | |
Total | | | 100% | |
Nuveen Limited Term Municipal Bond Fund
Fund Allocation
(% of net assets)
| | | | |
Long-Term Municipal Bonds | | | 96.8% | |
Corporate Bonds | | | 0.0% | |
Investment Companies | | | 0.8% | |
Short-Term Municipal Bonds | | | 0.8% | |
Other Assets Less Liabilities | | | 1.6% | |
Net Assets | | | 100% | |
Bond Credit Quality
(% of total investment exposure)
| | | | |
AAA/U.S. Guaranteed | | | 13.4% | |
AA | | | 41.7% | |
A | | | 30.1% | |
BBB | | | 10.5% | |
BB or Lower | | | 2.5% | |
N/R (not rated) | | | 1.0% | |
N/A (not applicable) | | | 0.8% | |
Total | | | 100% | |
Portfolio Composition
(% of total investments)
| | | | |
Tax Obligation/Limited | | | 21.5% | |
Tax Obligation/General | | | 21.2% | |
Utilities | | | 15.6% | |
Health Care | | | 11.7% | |
Transportation | | | 8.2% | |
Education and Civic Organizations | | | 5.9% | |
Water and Sewer | | | 5.2% | |
Other | | | 10.7% | |
Total | | | 100% | |
States and Territories
(% of total municipal bonds)
| | | | |
Illinois | | | 10.5% | |
New York | | | 6.9% | |
Texas | | | 6.3% | |
Pennsylvania | | | 5.8% | |
Florida | | | 5.4% | |
California | | | 4.9% | |
Indiana | | | 4.5% | |
New Jersey | | | 4.3% | |
Louisiana | | | 3.9% | |
Ohio | | | 3.9% | |
Arizona | | | 3.7% | |
Maryland | | | 2.9% | |
Washington | | | 2.9% | |
Missouri | | | 2.1% | |
New Mexico | | | 2.1% | |
Oklahoma | | | 2.1% | |
Georgia | | | 2.0% | |
Kentucky | | | 2.0% | |
Michigan | | | 2.0% | |
Connecticut | | | 2.0% | |
Other | | | 19.8% | |
Total | | | 100% | |
Holding Summaries as of April 30, 2016 (continued)
Nuveen Short Term Municipal Bond Fund
Fund Allocation
(% of net assets)
| | | | |
Long-Term Municipal Bonds | | | 95.1% | |
Investment Companies | | | 1.9% | |
Money Market Funds | | | 0.4% | |
Short-Term Municipal Bonds | | | 1.6% | |
Other Assets Less Liabilities | | | 1.0% | |
Net Assets | | | 100% | |
Bond Credit Quality
(% of total investment exposure)
| | | | |
AAA/U.S. Guaranteed | | | 7.0% | |
AA | | | 35.7% | |
A | | | 35.3% | |
BBB | | | 14.9% | |
BB or Lower | | | 0.7% | |
NR (not rated) | | | 4.1% | |
N/A (not applicable) | | | 2.3% | |
Total | | | 100% | |
Portfolio Composition
(% of total investments)
| | | | |
Tax Obligation/Limited | | | 19.8% | |
Tax Obligation/General | | | 16.0% | |
Health Care | | | 15.6% | |
Transportation | | | 14.7% | |
Utilities | | | 12.2% | |
Education and Civic Organizations | | | 11.6% | |
Other | | | 9.7% | |
Money Market Funds | | | 0.4% | |
Total | | | 100% | |
States and Territories
(% of total municipal bonds)
| | | | |
New York | | | 10.3% | |
Minnesota | | | 6.5% | |
Illinois | | | 6.3% | |
Arizona | | | 5.2% | |
Texas | | | 5.1% | |
Missouri | | | 5.0% | |
Pennsylvania | | | 5.0% | |
California | | | 4.6% | |
Florida | | | 4.1% | |
Indiana | | | 3.7% | |
New Jersey | | | 3.6% | |
Michigan | | | 3.4% | |
Louisiana | | | 2.9% | |
Colorado | | | 2.7% | |
Ohio | | | 2.7% | |
Washington | | | 2.4% | |
Oklahoma | | | 2.3% | |
Nebraska | | | 1.9% | |
Kentucky | | | 1.9% | |
Nevada | | | 1.6% | |
Other | | | 18.8% | |
Total | | | 100% | |
Expense
Examples
As a shareholder of one or more of the Funds, you incur two types of costs: (1) transaction costs, including up-front and back-end sales charges (loads) or redemption fees, where applicable; and (2) ongoing costs, including management fees; distribution and service (12b-1) fees, where applicable; and other Fund expenses. The Examples below are intended to help you understand your ongoing costs (in dollars) of investing in the Funds and to compare these costs with the ongoing costs of investing in other mutual funds.
The Examples below are based on an investment of $1,000 invested at the beginning of the period and held through the period ended April 30, 2016.
The beginning of the period is November 1, 2015.
The information under “Actual Performance,” together with the amount you invested, allows you to estimate actual expenses incurred over the reporting period. Simply divide your account value by $1,000 (for example, an $8,600 account value divided by $1,000 = 8.60) and multiply the result by the cost shown for your share class, in the row entitled “Expenses Incurred During Period” to estimate the expenses incurred on your account during this period.
The information under “Hypothetical Performance,” provides information about hypothetical account values and hypothetical expenses based on each Fund’s actual expense ratio and an assumed rate of return of 5% per year before expenses, which is not the Fund’s actual return. The hypothetical account values and expenses may not be used to estimate the actual ending account balance or expense you incurred for the period. You may use this information to compare the ongoing costs of investing in the Fund and other funds. To do so, compare this 5% hypothetical example with the 5% hypothetical examples that appear in the shareholder reports of the other funds.
Please note that the expenses shown in the table are meant to highlight your ongoing costs only and do not reflect any transaction costs. Therefore, the hypothetical information is useful in comparing ongoing costs only, and will not help you determine the relative total costs of owning different funds or share classes. In addition, if these transaction costs were included, your costs would have been higher.
Nuveen All-American Municipal Bond Fund
| | | | | | | | | | | | | | | | |
| | | Share Class | |
| | | Class A | | | Class C | | | Class C2 | | | Class I | |
Actual Performance | | | | | | | | | | | | | | | | |
Beginning Account Value | | $ | 1,000.00 | | | $ | 1,000.00 | | | $ | 1,000.00 | | | $ | 1,000.00 | |
Ending Account Value | | $ | 1,043.30 | | | $ | 1,040.20 | | | $ | 1,040.60 | | | $ | 1,044.20 | |
Expenses Incurred During Period | | $ | 3.56 | | | $ | 7.61 | | | $ | 6.34 | | | $ | 2.54 | |
Hypothetical Performance (5% annualized return before expenses) | | | | | | | | | | | | | | | | |
Beginning Account Value | | $ | 1,000.00 | | | $ | 1,000.00 | | | $ | 1,000.00 | | | $ | 1,000.00 | |
Ending Account Value | | $ | 1,021.38 | | | $ | 1,017.40 | | | $ | 1,018.65 | | | $ | 1,022.38 | |
Expenses Incurred During Period | | $ | 3.52 | | | $ | 7.52 | | | $ | 6.27 | | | $ | 2.51 | |
For each class of the Fund, expenses are equal to the Fund’s annualized net expense ratio of 0.70%, 1.50%, 1.25% and 0.50% for Classes A, C, C2 and I, respectively, multiplied by the average account value over the period, multiplied by 182/366 (to reflect the one-half year period).
Expense Examples (continued)
Nuveen Inflation Protected Municipal Bond Fund
| | | | | | | | | | | | | | | | |
| | | Share Class | |
| | | Class A | | | Class C | | | Class C2 | | | Class I | |
Actual Performance | | | | | | | | | | | | | | | | |
Beginning Account Value | | $ | 1,000.00 | | | $ | 1,000.00 | | | $ | 1,000.00 | | | $ | 1,000.00 | |
Ending Account Value | | $ | 1,034.80 | | | $ | 1,031.50 | | | $ | 1,032.90 | | | $ | 1,037.60 | |
Expenses Incurred During Period | | $ | 3.90 | | | $ | 7.93 | | | $ | 6.67 | | | $ | 2.89 | |
Hypothetical Performance (5% annualized return before expenses) | | | | | | | | | | | | | | | | |
Beginning Account Value | | $ | 1,000.00 | | | $ | 1,000.00 | | | $ | 1,000.00 | | | $ | 1,000.00 | |
Ending Account Value | | $ | 1,021.03 | | | $ | 1,017.06 | | | $ | 1,018.30 | | | $ | 1,022.03 | |
Expenses Incurred During Period | | $ | 3.87 | | | $ | 7.87 | | | $ | 6.62 | | | $ | 2.87 | |
For each class of the Fund, expenses are equal to the Fund’s annualized net expense ratio of 0.77%, 1.57%, 1.32% and 0.57% for Classes A, C, C2 and I, respectively, multiplied by the average account value over the period, multiplied by 182/366 (to reflect the one-half year period).
Nuveen Intermediate Duration Municipal Bond Fund
| | | | | | | | | | | | | | | | |
| | | Share Class | |
| | | Class A | | | Class C | | | Class C2 | | | Class I | |
Actual Performance | | | | | | | | | | | | | | | | |
Beginning Account Value | | $ | 1,000.00 | | | $ | 1,000.00 | | | $ | 1,000.00 | | | $ | 1,000.00 | |
Ending Account Value | | $ | 1,033.70 | | | $ | 1,028.60 | | | $ | 1,029.90 | | | $ | 1,034.60 | |
Expenses Incurred During Period | | $ | 3.44 | | | $ | 7.46 | | | $ | 6.21 | | | $ | 2.43 | |
Hypothetical Performance (5% annualized return before expenses) | | | | | | | | | | | | | | | | |
Beginning Account Value | | $ | 1,000.00 | | | $ | 1,000.00 | | | $ | 1,000.00 | | | $ | 1,000.00 | |
Ending Account Value | | $ | 1,021.48 | | | $ | 1,017.50 | | | $ | 1,018.75 | | | $ | 1,022.48 | |
Expenses Incurred During Period | | $ | 3.42 | | | $ | 7.42 | | | $ | 6.17 | | | $ | 2.41 | |
For each class of the Fund, expenses are equal to the Fund’s annualized net expense ratio of 0.68%, 1.48%, 1.23% and 0.48% for Classes A, C, C2 and I, respectively, multiplied by the average account value over the period, multiplied by 182/366 (to reflect the one-half year period).
Nuveen Limited Term Municipal Bond Fund
| | | | | | | | | | | | | | | | |
| | | Share Class | |
| | | Class A | | | Class C | | | Class C2 | | | Class I | |
Actual Performance | | | | | | | | | | | | | | | | |
Beginning Account Value | | $ | 1,000.00 | | | $ | 1,000.00 | | | $ | 1,000.00 | | | $ | 1,000.00 | |
Ending Account Value | | $ | 1,014.70 | | | $ | 1,010.70 | | | $ | 1,012.80 | | | $ | 1,015.60 | |
Expenses Incurred During Period | | $ | 3.16 | | | $ | 6.55 | | | $ | 4.90 | | | $ | 2.15 | |
Hypothetical Performance (5% annualized return before expenses) | | | | | | | | | | | | | | | | |
Beginning Account Value | | $ | 1,000.00 | | | $ | 1,000.00 | | | $ | 1,000.00 | | | $ | 1,000.00 | |
Ending Account Value | | $ | 1,021.73 | | | $ | 1,018.35 | | | $ | 1,019.99 | | | $ | 1,022.33 | |
Expenses Incurred During Period | | $ | 3.17 | | | $ | 6.57 | | | $ | 4.92 | | | $ | 2.16 | |
For each class of the Fund, expenses are equal to the Fund’s annualized net expense ratio of 0.63%, 1.43%, 0.98% and 0.43% for Classes A, C, C2 and I, respectively, multiplied by the average account value over the period, multiplied by 182/366 (to reflect the one-half year period).
Nuveen Short Term Municipal Bond Fund
| | | | | | | | | | | | | | | | |
| | | Share Class | |
| | | Class A | | | Class C | | | Class C2 | | | Class I | |
Actual Performance | | | | | | | | | | | | | | | | |
Beginning Account Value | | $ | 1,000.00 | | | $ | 1,000.00 | | | $ | 1,000.00 | | | $ | 1,000.00 | |
Ending Account Value | | $ | 1,004.60 | | | $ | 1,000.70 | | | $ | 1,002.80 | | | $ | 1,005.50 | |
Expenses Incurred During Period | | $ | 3.54 | | | $ | 7.51 | | | $ | 5.28 | | | $ | 2.54 | |
Hypothetical Performance (5% annualized return before expenses) | | | | | | | | | | | | | | | | |
Beginning Account Value | | $ | 1,000.00 | | | $ | 1,000.00 | | | $ | 1,000.00 | | | $ | 1,000.00 | |
Ending Account Value | | $ | 1,021.33 | | | $ | 1,017.35 | | | $ | 1,019.59 | | | $ | 1,022.33 | |
Expenses Incurred During Period | | $ | 3.57 | | | $ | 7.57 | | | $ | 5.32 | | | $ | 2.56 | |
For each class of the Fund, expenses are equal to the Fund’s annualized net expense ratio of 0.71%, 1.51%, 1.06% and 0.51% for Classes A, C, C2 and I, respectively, multiplied by the average account value over the period, multiplied by 182/366 (to reflect the one-half year period).
Report of
Independent Registered Public Accounting Firm
To the Board of Directors/Trustees and Shareholders of
Nuveen Municipal Trust and Nuveen Investment Funds, Inc.:
In our opinion, the accompanying statements of assets and liabilities, including the portfolios of investments, and the related statements of operations and of changes in net assets and the financial highlights present fairly, in all material respects, the financial position of Nuveen All-American Municipal Bond Fund, Nuveen Inflation Protected Municipal Bond Fund, Nuveen Intermediate Duration Municipal Bond Fund and Nuveen Limited Term Municipal Bond Fund (each a series of the Nuveen Municipal Trust) and Nuveen Short Term Municipal Bond Fund (a series of Nuveen Investment Funds, Inc.) (hereinafter, collectively referred to as the “Funds”) at April 30, 2016, the results of each of their operations for the year then ended, the changes in each of their net assets for each of the two years in the period then ended and the financial highlights for each of the five years in the period then ended, in conformity with accounting principles generally accepted in the United States of America. These financial statements and financial highlights (hereafter referred to as “financial statements”) are the responsibility of the Funds’ management. Our responsibility is to express an opinion on these financial statements based on our audits. We conducted our audits of these financial statements in accordance with the standards of the Public Company Accounting Oversight Board (United States). Those standards require that we plan and perform the audit to obtain reasonable assurance about whether the financial statements are free of material misstatement. An audit includes examining, on a test basis, evidence supporting the amounts and disclosures in the financial statements, assessing the accounting principles used and significant estimates made by management, and evaluating the overall financial statement presentation. We believe that our audits, which included confirmation of securities at April 30, 2016 by correspondence with the custodian and brokers, provide a reasonable basis for our opinion.
PricewaterhouseCoopers LLP
Chicago, IL
June 27, 2016
Nuveen All-American Municipal Bond Fund
| | |
| Portfolio of Investments | | April 30, 2016 |
| | | | | | | | | | | | | | | | | | | | |
Principal
Amount (000) | | | Description (1) | | Optional Call
Provisions (2) | | | | | | | Ratings (3) | | | Value | |
| | | | | | |
| | | | LONG-TERM INVESTMENTS – 99.5% | | | | | | | | | | | | | | | | |
| | | | | | |
| | | | MUNICIPAL BONDS – 99.5% | | | | | | | | | | | | | | | | |
| | | | | | |
| | | | Alabama – 0.8% | | | | | | | | | | | | | |
| | | | | | |
| $ | 5,000 | | | Infirmary Health System Special Care Facilities Financing Authority of Mobile, Alabama, Revenue Bonds, Infirmary Health System, Inc., Series 2016A, 4.000%, 2/01/46 | | | 2/26 at 100.00 | | | | | | | | A– | | | $ | 5,169,350 | |
| | | | | | |
| | | | Jefferson County, Alabama, Limited Obligation School Warrants, Education Tax Revenue Bonds, Series 2004A: | | | | | | | | | | | | | | | | |
| | 1,000 | | | 5.500%, 1/01/21 – AGM Insured | | | No Opt. Call | | | | | | | | AA | | | | 1,006,000 | |
| | 1,000 | | | 5.500%, 1/01/22 | | | No Opt. Call | | | | | | | | A– | | | | 1,006,000 | |
| | | | | | |
| | 14,175 | | | Lower Alabama Gas District, Alabama, Gas Project Revenue Bonds, Series 2016A, 5.000%, 9/01/46 | | | No Opt. Call | | | | | | | | A3 | | | | 18,129,116 | |
| | | | | | |
| | 500 | | | Mobile Spring Hill College Educational Building Authority, Alabama, Revenue Bonds, Spring Hill College Project, Series 2015, 5.875%, 4/15/45 | | | 4/25 at 100.00 | | | | | | | | N/R | | | | 506,235 | |
| | | | | | |
| | 2,000 | | | Pell City, Alabama, Special Care Facilities Financing Authority, Revenue Bonds, Noland Health Services, Series 2007A, 5.250%, 12/01/34 (Pre-refunded 12/01/17) | | | 12/17 at 100.00 | | | | | | | | Aaa | | | | 2,144,680 | |
| | 23,675 | | | Total Alabama | | | | | | | | | | | | | | | 27,961,381 | |
| | | | | | |
| | | | Alaska – 0.1% | | | | | | | | | | | | | |
| | | | | | |
| | 2,000 | | | Northern Tobacco Securitization Corporation, Alaska, Tobacco Settlement Asset-Backed Bonds, Series 2006A, 5.000%, 6/01/32 | | | No Opt. Call | | | | | | | | B3 | | | | 1,902,240 | |
| | | | | | |
| | | | Arizona – 3.0% | | | | | | | | | | | | | |
| | | | | | |
| | 500 | | | Arizona School Facilities Board, Certificates of Participation, Series 2008, 5.250%, 9/01/23 (Pre-refunded 9/01/18) | | | 9/18 at 100.00 | | | | | | | | AA– (4) | | | | 552,330 | |
| | | | | | |
| | 5,000 | | | Arizona State Transportation Board, Highway Revenue Bonds, Refunding Subordinate Series 2011A, 5.000%, 7/01/16 | | | No Opt. Call | | | | | | | | AA+ | | | | 5,039,550 | |
| | | | | | |
| | 2,300 | | | Arizona State Transportation Board, Transportation Excise Tax Revenue Bonds, Maricopa County Regional Area Road Fund, Series 2009, 5.000%, 7/01/16 | | | No Opt. Call | | | | | | | | AA+ | | | | 2,318,193 | |
| | | | | | |
| | 200 | | | Arizona State University Nanotechnology LLC, Lease Revenue Refunding Bonds, Arizona State University Project, Series 2009A, 5.000%, 3/01/34 – AGC Insured | | | 3/19 at 100.00 | | | | | | | | AA | | | | 219,296 | |
| | | | | | |
| | 250 | | | Cottonwood, Arizona, Water Revenue Bonds, Series 2006, 5.000%, 7/01/17 – SYNCORA GTY Insured | | | 7/16 at 100.00 | | | | | | | | A | | | | 251,555 | |
| | | | | | |
| | 6,630 | | | Gila County Unified School District 10 Payson, Arizona, General Obligation Bonds, Project of 2006, Series 2007A, 5.250%, 7/01/22 (Pre-refunded 7/01/17) – AMBAC Insured | | | 7/17 at 100.00 | | | | | | | | Aa3 (4) | | | | 6,989,943 | |
| | | | | | |
| | 500 | | | Gilbert Public Facilities Municipal Property Corporation, Arizona, Revenue Bonds, Series 2009, 5.500%, 7/01/27 | | | 7/19 at 100.00 | | | | | | | | AA+ | | | | 561,725 | |
| | | | | | |
| | 3,430 | | | Glendale Industrial Development Authority, Arizona, Revenue Bonds, John C. Lincoln Health Network, Series 2007, 5.000%, 12/01/42 (Pre-refunded 12/01/17) | | | 12/17 at 100.00 | | | | | | | | N/R (4) | | | | 3,660,084 | |
| | | | | | |
| | 750 | | | Greater Arizona Development Authority, Infrastructure Revenue Bonds, Series 2004B, 5.250%, 8/01/26 | | | No Opt. Call | | | | | | | | A1 | | | | 752,790 | |
| | | | | | |
| | 750 | | | Greater Arizona Development Authority, Infrastructure Revenue Bonds, Series 2006-1, 4.500%, 8/01/25 (Pre-refunded 8/01/16) – NPFG Insured | | | 8/16 at 100.00 | | | | | | | | AA– (4) | | | | 757,598 | |
| | | | | | |
| | 245 | | | Maricopa County, Arizona, Hospital Revenue Bonds, Sun Health Corporation, Series 2005, 5.000%, 4/01/25 (Pre-refunded 4/01/24) | | | 4/24 at 100.00 | | | | | | | | N/R (4) | | | | 290,359 | |
Nuveen All-American Municipal Bond Fund (continued)
| | |
| Portfolio of Investments | | April 30, 2016 |
| | | | | | | | | | | | | | | | | | | | |
Principal
Amount (000) | | | Description (1) | | Optional Call
Provisions (2) | | | | | | | Ratings (3) | | | Value | |
| | | | | | |
| | | | Arizona (continued) | | | | | | | | | | | | | |
| | | | | | |
| $ | 465 | | | Peoria, Arizona, Improvement District 601, Improvement Bonds, Series 2007, 4.250%, 1/01/22 | | | 1/18 at 101.00 | | | | | | | | Aa2 | | | $ | 491,603 | |
| | | | | | |
| | 4,000 | | | Phoenix Civic Improvement Corporation, Arizona, Airport Revenue Bonds, Junior Lien Series 2010A, 5.000%, 7/01/31 | | | 7/20 at 100.00 | | | | | | | | A+ | | | | 4,523,400 | |
| | | | | | |
| | 1,000 | | | Phoenix Civic Improvement Corporation, Arizona, Airport Revenue Bonds, Junior Lien Series 2015A, 4.000%, 7/01/40 | | | 7/25 at 100.00 | | | | | | | | A+ | | | | 1,058,220 | |
| | | | | | |
| | | | Phoenix Civic Improvement Corporation, Arizona, Revenue Bonds, Civic Plaza Expansion Project, Series 2005B: | | | | | | | | | | | | | | | | |
| | 1,650 | | | 5.500%, 7/01/31 – FGIC Insured | | | No Opt. Call | | | | | | | | AA | | | | 2,166,335 | |
| | 6,000 | | | 5.500%, 7/01/39 – FGIC Insured | | | No Opt. Call | | | | | | | | AA | | | | 8,173,680 | |
| | | | | | |
| | 1,000 | | | Phoenix Industrial Development Authority, Arizona, Education Facility Revenue Bonds, Choice Academies Charter Schools Project, Series 2012, 4.875%, 9/01/22 | | | No Opt. Call | | | | | | | | BB+ | | | | 1,069,590 | |
| | | | | | |
| | 1,000 | | | Phoenix Industrial Development Authority, Arizona, Education Facility Revenue Bonds, Great Hearts Academies – Veritas Project, Series 2012, 6.400%, 7/01/47 | | | 7/21 at 100.00 | | | | | | | | BB | | | | 1,111,030 | |
| | | | | | |
| | | | Pima County Industrial Development Authority, Arizona, Education Facility Revenue and Refunding Bonds, Edkey Charter Schools Project, Series 2013: | | | | | | | | | | | | | | | | |
| | 1,885 | | | 6.000%, 7/01/33 | | | 7/20 at 102.00 | | | | | | | | BB | | | | 1,917,479 | |
| | 2,000 | | | 6.000%, 7/01/43 | | | 7/20 at 102.00 | | | | | | | | BB | | | | 2,007,380 | |
| | | | | | |
| | 400 | | | Pima County Industrial Development Authority, Arizona, Education Facility Revenue Bonds, San Tan Montessori School Project, Series 2016, 6.500%, 2/01/48 | | | 2/24 at 100.00 | | | | | | | | N/R | | | | 400,188 | |
| | | | | | |
| | 825 | | | Pima County Industrial Development Authority, Arizona, Education Revenue Bonds, Paradise Education Center Project, Series 2010, 6.000%, 6/01/40 | | | 6/19 at 100.00 | | | | | | | | BB+ | | | | 861,003 | |
| | | | | | |
| | 730 | | | Pima County Unified School District 1, Tucson, Arizona, School Improvement Bonds, Series 2007C, 5.000%, 7/01/27 – FGIC Insured | | | 7/17 at 100.00 | | | | | | | | Aa2 | | | | 764,639 | |
| | | | | | |
| | 270 | | | Pima County Unified School District 1, Tucson, Arizona, School Improvement Bonds, Series 2007C, 5.000%, 7/01/27 (Pre-refunded 7/01/17) – FGIC Insured | | | 7/17 at 100.00 | | | | | | | | Aa2 (4) | | | | 283,870 | |
| | | | | | |
| | 3,705 | | | Pinal County Electrical District 3, Arizona, Electric System Revenue Bonds, Refunding Series 2011, 5.250%, 7/01/41 | | | 7/21 at 100.00 | | | | | | | | A | | | | 4,293,799 | |
| | | | | | |
| | 1,000 | | | Pinal County Unified School District 1 Florence, Arizona, General Obligation Bonds, Series 2007A, 5.000%, 7/01/27 (Pre-refunded 7/01/17) – FGIC Insured | | | 7/17 at 100.00 | | | | | | | | AA– (4) | | | | 1,051,370 | |
| | | | | | |
| | 260 | | | Queen Creek, Arizona, Improvement District 1 Improvement Bonds, Series 2006, 5.000%, 1/01/20 | | | No Opt. Call | | | | | | | | A– | | | | 261,919 | |
| | | | | | |
| | | | Salt Verde Financial Corporation, Arizona, Senior Gas Revenue Bonds, Citigroup Energy Inc Prepay Contract Obligations, Series 2007: | | | | | | | | | | | | | | | | |
| | 1,000 | | | 5.250%, 12/01/28 | | | No Opt. Call | | | | | | | | BBB+ | | | | 1,230,890 | |
| | 13,155 | | | 5.000%, 12/01/32 | | | No Opt. Call | | | | | | | | BBB+ | | | | 16,145,921 | |
| | 7,675 | | | 5.000%, 12/01/37 | | | No Opt. Call | | | | | | | | BBB+ | | | | 9,596,283 | |
| | | | | | |
| | 1,000 | | | Scottsdale Industrial Development Authority, Arizona, Hospital Revenue Bonds, Scottsdale Healthcare, Series 2008A, 5.000%, 9/01/22 | | | 9/18 at 100.00 | | | | | | | | A2 | | | | 1,088,500 | |
| | | | | | |
| | 500 | | | Scottsdale Municipal Property Corporation, Arizona, Excise Tax Revenue Bonds, Convertible Capital Appreciation Series 2005C, 4.550%, 7/01/21 (Pre-refunded 7/01/17) – AMBAC Insured | | | 7/17 at 100.00 | | | | | | | | AAA | | | | 523,060 | |
| | | | | | |
| | 4,300 | | | Scottsdale Municipal Property Corporation, Arizona, Excise Tax Revenue Bonds, Series 2008A, 5.000%, 7/01/21 (Pre-refunded 7/01/18) | | | 7/18 at 100.00 | | | | | | | | AAA | | | | 4,696,417 | |
| | | | | | |
| | 2,220 | | | Scottsdale, Arizona, General Obligation Bonds, Refunding Series 2015, 4.000%, 7/01/16 | | | No Opt. Call | | | | | | | | AAA | | | | 2,233,764 | |
| | | | | | | | | | | | | | | | | | | | |
Principal
Amount (000) | | | Description (1) | | Optional Call
Provisions (2) | | | | | | | Ratings (3) | | | Value | |
| | | | | | |
| | | | Arizona (continued) | | | | | | | | | | | | | |
| | | | | | |
| | | | Tempe Industrial Development Authority, Arizona, Revenue Bonds, Friendship Village of Tempe Project, Refunding Series 2012A: | | | | | | | | | | | | | | | | |
| $ | 2,590 | | | 6.000%, 12/01/27 | | | 12/21 at 100.00 | | | | | | | | N/R | | | $ | 2,870,264 | |
| | 1,080 | | | 6.000%, 12/01/32 | | | 12/21 at 100.00 | | | | | | | | N/R | | | | 1,179,274 | |
| | 1,100 | | | 6.250%, 12/01/42 | | | 12/21 at 100.00 | | | | | | | | N/R | | | | 1,203,224 | |
| | | | | | |
| | 1,000 | | | University Medical Center Corporation, Tucson, Arizona, Hospital Revenue Bonds, Series 2011, 6.000%, 7/01/39 (Pre-refunded 7/01/21) | | | 7/21 at 100.00 | | | | | | | | N/R (4) | | | | 1,243,130 | |
| | | | | | |
| | 888 | | | Watson Road Community Facilities District, Arizona, Special Assessment Revenue Bonds, Series 2005, 6.000%, 7/01/30 | | | 7/16 at 100.00 | | | | | | | | N/R | | | | 890,327 | |
| | 83,253 | | | Total Arizona | | | | | | | | | | | | | | | 94,729,982 | |
| | | | | | |
| | | | Arkansas – 0.1% | | | | | | | | | | | | | |
| | | | | | |
| | | | Benton County Public Facilities Board, Arkansas, Charter School Lease Revenue Bonds, BCCSO Project, Series 2010A: | | | | | | | | | | | | | | | | |
| | 500 | | | 5.750%, 6/01/30 | | | 6/20 at 100.00 | | | | | | | | BBB– | | | | 547,085 | |
| | 1,020 | | | 6.000%, 6/01/40 | | | 6/20 at 100.00 | | | | | | | | BBB– | | | | 1,123,275 | |
| | 1,520 | | | Total Arkansas | | | | | | | | | | | | | | | 1,670,360 | |
| | | | | | |
| | | | California – 9.3% | | | | | | | | | | | | | |
| | | | | | |
| | 2,400 | | | Alameda Corridor Transportation Authority, California, Revenue Bonds, Refunding Subordinate Lien Series 2004A, 0.000%, 10/01/20 – AMBAC Insured | | | No Opt. Call | | | | | | | | BBB+ | | | | 2,232,264 | |
| | | | | | |
| | 1,000 | | | Bay Area Toll Authority, California, Revenue Bonds, San Francisco Bay Area Toll Bridge, Tender Option Bond Trust 2015-XF2179, 16.630%, 4/01/34 (IF) | | | 4/18 at 100.00 | | | | | | | | AA | | | | 1,329,840 | |
| | | | | | |
| | 1,715 | | | California Department of Water Resources, Water System Revenue Bonds, Central Valley Project, Series 2008AE, 5.000%, 12/01/21 (Pre-refunded 6/01/18) | | | 6/18 at 100.00 | | | | | | | | AA+ (4) | | | | 1,869,590 | |
| | | | | | |
| | 285 | | | California Department of Water Resources, Water System Revenue Bonds, Central Valley Project, Series 2008AE, 5.000%, 12/01/21 | | | 6/18 at 100.00 | | | | | | | | AAA | | | | 311,491 | |
| | | | | | |
| | | | California Health Facilities Financing Authority, Revenue Bonds, Cedars-Sinai Medical Center, Refunding Series 2015: | | | | | | | | | | | | | | | | |
| | 4,000 | | | 5.000%, 11/15/26 | | | 11/25 at 100.00 | | | | | | | | Aa3 | | | | 5,118,920 | |
| | 3,635 | | | 5.000%, 11/15/28 | | | 11/25 at 100.00 | | | | | | | | Aa3 | | | | 4,580,936 | |
| | | | | | |
| | 5,100 | | | California Health Facilities Financing Authority, Revenue Bonds, Providence Health & Services, Series 2009B, 5.500%, 10/01/39 | | | 10/19 at 100.00 | | | | | | | | AA | | | | 5,807,268 | |
| | | | | | |
| | 485 | | | California Health Facilities Financing Authority, Revenue Bonds, Providence Health & Services, Series 2014B, 5.000%, 10/01/44 | | | 10/24 at 100.00 | | | | | | | | AA | | | | 562,973 | |
| | | | | | |
| | 2,185 | | | California Health Facilities Financing Authority, Revenue Bonds, Saint Joseph Health System, Series 2013A, 5.000%, 7/01/37 | | | 7/23 at 100.00 | | | | | | | | AA– | | | | 2,555,620 | |
| | | | | | |
| | 330 | | | California Municipal Finance Authority, Charter School Revenue Bonds, Palmdale Aerospace Academy Project, Series 2016A, 5.000%, 7/01/46 | | | 7/26 at 100.00 | | | | | | | | BB | | | | 354,021 | |
| | | | | | |
| | 3,380 | | | California Municipal Finance Authority, Mobile Home Park Revenue Bonds, Caritas Projects Series 2010A, 6.400%, 8/15/45 | | | 8/20 at 100.00 | | | | | | | | BBB | | | | 3,753,220 | |
| | | | | | |
| | 6,480 | | | California State Public Works Board, Lease Revenue Bonds, Department of Corrections & Rehabilitation, Series 2015H, 3.000%, 12/01/29 | | | 12/25 at 100.00 | | | | | | | | A+ | | | | 6,718,399 | |
| | | | | | |
| | 1,000 | | | California State Public Works Board, Lease Revenue Bonds, Judicial Council of California, Various Projects Series 2011D, 5.000%, 12/01/20 | | | No Opt. Call | | | | | | | | A+ | | | | 1,176,990 | |
| | | | | | |
| | 1,000 | | | California State Public Works Board, Lease Revenue Bonds, Various Capital Projects, Series 2010A-1, 5.750%, 3/01/30 | | | 3/20 at 100.00 | | | | | | | | A+ | | | | 1,176,300 | |
Nuveen All-American Municipal Bond Fund (continued)
| | |
| Portfolio of Investments | | April 30, 2016 |
| | | | | | | | | | | | | | | | | | | | |
Principal
Amount (000) | | | Description (1) | | Optional Call
Provisions (2) | | | | | | | Ratings (3) | | | Value | |
| | | | | | |
| | | | California (continued) | | | | | | | | | | | | | |
| | | | | | |
| | | | California State University, Systemwide Revenue Bonds, Series 2016A: | | | | | | | | | | | | | | | | |
| $ | 1,500 | | | 5.000%, 11/01/24 | | | No Opt. Call | | | | | | | | Aa2 | | | $ | 1,921,185 | |
| | 1,250 | | | 5.000%, 11/01/25 | | | No Opt. Call | | | | | | | | Aa2 | | | | 1,624,650 | |
| | 2,000 | | | 5.000%, 11/01/26 | | | No Opt. Call | | | | | | | | Aa2 | | | | 2,598,820 | |
| | 2,400 | | | 5.000%, 11/01/27 | | | 5/26 at 100.00 | | | | | | | | Aa2 | | | | 3,086,376 | |
| | | | | | |
| | 700 | | | California State, General Obligation Bonds, Tender Option Bond Trust 3162, 18.840%, 3/01/40 – AGM Insured (IF) | | | 3/20 at 100.00 | | | | | | | | AA | | | | 1,172,164 | |
| | | | | | |
| | 7,280 | | | California State, General Obligation Bonds, Various Purpose Refunding Series 2015, 5.000%, 8/01/24 | | | No Opt. Call | | | | | | | | AA– | | | | 9,220,120 | |
| | | | | | |
| | 8,475 | | | California State, General Obligation Bonds, Various Purpose Series 2008, 5.000%, 4/01/38 | | | 4/18 at 100.00 | | | | | | | | AA– | | | | 9,111,981 | |
| | | | | | |
| | 1,400 | | | California State, General Obligation Bonds, Various Purpose Series 2010, 5.250%, 3/01/30 | | | 3/20 at 100.00 | | | | | | | | AA– | | | | 1,625,820 | |
| | | | | | |
| | 1,000 | | | California Statewide Communities Development Authority, California, Revenue Bonds, Loma Linda University Medical Center, Series 2014A, 5.500%, 12/01/54 | | | 12/24 at 100.00 | | | | | | | | BB+ | | | | 1,100,460 | |
| | | | | | |
| | 15,690 | | | California Statewide Communities Development Authority, California, Revenue Bonds, Loma Linda University Medical Center, Series 2016A, 5.250%, 12/01/56 (WI/DD, Settling 5/11/16) | | | 6/26 at 100.00 | | | | | | | | BB+ | | | | 17,123,752 | |
| | | | | | |
| | 1,725 | | | California Statewide Communities Development Authority, Revenue Bonds, American Baptist Homes of the West, Series 2010, 5.750%, 10/01/25 | | | 10/19 at 100.00 | | | | | | | | BBB+ | | | | 1,955,201 | |
| | | | | | |
| | 1,575 | | | California Statewide Communities Development Authority, Revenue Bonds, Saint Joseph Health System, Trust 2554, 17.512%, 7/01/47 – AGM Insured (IF) | | | 7/18 at 100.00 | | | | | | | | AA | | | | 1,998,423 | |
| | | | | | |
| | 850 | | | California Statewide Community Development Authority, Health Facility Revenue Bonds, Catholic Healthcare West, Series 2008E, 5.500%, 7/01/31 | | | 7/17 at 100.00 | | | | | | | | A | | | | 896,300 | |
| | | | | | |
| | | | California Statewide Community Development Authority, Revenue Bonds, Daughters of Charity Health System, Series 2005A: | | | | | | | | | | | | | | | | |
| | 825 | | | 5.500%, 7/01/30 (7) | | | No Opt. Call | | | | | | | | CCC | | | | 824,942 | |
| | 5,300 | | | 5.500%, 7/01/35 (7) | | | No Opt. Call | | | | | | | | CCC | | | | 5,306,943 | |
| | 2,000 | | | 5.250%, 7/01/39 (7) | | | No Opt. Call | | | | | | | | CCC | | | | 2,002,620 | |
| | | | | | |
| | 1,000 | | | California Statewide Community Development Authority, Revenue Bonds, St. Joseph Health System, Series 2007A, 5.750%, 7/01/47 – FGIC Insured | | | 7/18 at 100.00 | | | | | | | | AA– | | | | 1,101,350 | |
| | | | | | |
| | 1,050 | | | California Statewide Community Development Authority, Revenue Bonds, St. Joseph Health System, Series 2007B, 5.450%, 7/01/26 – FGIC Insured | | | 7/18 at 100.00 | | | | | | | | AA– | | | | 1,151,567 | |
| | | | | | |
| | 1,050 | | | California Statewide Community Development Authority, Revenue Bonds, St. Joseph Health System, Series 2007C, 5.450%, 7/01/26 – FGIC Insured | | | 7/18 at 100.00 | | | | | | | | AA– | | | | 1,151,567 | |
| | | | | | |
| | 675 | | | California Statewide Community Development Authority, Revenue Bonds, Sutter Health, Tender Option Bond Trust 2015-XF2186, 17.729%, 11/15/46 (IF) | | | 11/16 at 100.00 | | | | | | | | AA– | | | | 739,854 | |
| | | | | | |
| | 1,230 | | | Contra Costa Home Mortgage Finance Authority, California, Home Mortgage Revenue Bonds, Series 1984, 0.000%, 9/01/17 – NPFG Insured (ETM) | | | No Opt. Call | | | | | | | | Aaa | | | | 1,139,165 | |
| | | | | | |
| | 400 | | | Davis Redevelopment Agency, California, Tax Allocation Bonds, Davis Redevelopment Project, Subordinate Series 2011A, 7.000%, 12/01/36 | | | 12/21 at 100.00 | | | | | | | | A+ | | | | 508,040 | |
| | | | | | |
| | 1,960 | | | Elk Grove, California, Special Tax Bonds, Community Facilities District 2005-1, Series 2007, 5.250%, 9/01/37 | | | 9/16 at 101.00 | | | | | | | | N/R | | | | 1,985,637 | |
| | | | | | |
| | 510 | | | Etiwanda School District, California, Special Tax Bonds, Coyote Canyon Community Facilties District 2004-1 Improvement Area 2, Series 2009, 6.500%, 9/01/32 | | | 9/19 at 100.00 | | | | | | | | N/R | | | | 568,038 | |
| | | | | | |
| | | | Foothill/Eastern Transportation Corridor Agency, California, Toll Road Revenue Bonds, Refunding Senior Lien Series 2015A: | | | | | | | | | | | | | | | | |
| | 1,695 | | | 0.000%, 1/15/33 | | | No Opt. Call | | | | | | | | BBB– | | | | 870,874 | |
| | 10,000 | | | 0.000%, 1/15/35 – AGM Insured | | | No Opt. Call | | | | | | | | AA | | | | 4,994,500 | |
| | | | | | | | | | | | | | | | | | | | |
Principal
Amount (000) | | | Description (1) | | Optional Call
Provisions (2) | | | | | | | Ratings (3) | | | Value | |
| | | | | | |
| | | | California (continued) | | | | | | | | | | | | | |
| | | | | | |
| $ | 1,385 | | | Fullerton Public Financing Authority, California, Tax Allocation Revenue Bonds, Series 2005, 5.000%, 9/01/27 – AMBAC Insured | | | No Opt. Call | | | | | | | | A | | | $ | 1,404,958 | |
| | | | | | |
| | | | Golden State Tobacco Securitization Corporation, California, Tobacco Settlement Asset-Backed Bonds, Series 2007A-1: | | | | | | | | | | | | | | | | |
| | 10,050 | | | 4.500%, 6/01/27 | | | 6/17 at 100.00 | | | | | | | | B+ | | | | 10,214,318 | |
| | 3,480 | | | 5.000%, 6/01/33 | | | 6/17 at 100.00 | | | | | | | | B– | | | | 3,483,898 | |
| | 19,415 | | | 5.750%, 6/01/47 | | | 6/17 at 100.00 | | | | | | | | B– | | | | 19,471,692 | |
| | | | | | |
| | 1,000 | | | Jurupa Public Financing Authority, California, Special Tax Revenue Bonds, Superior Lien Series 2010A, 5.000%, 9/01/33 | | | 9/20 at 100.00 | | | | | | | | AA | | | | 1,133,840 | |
| | | | | | |
| | 1,980 | | | Kern Community College District, California, General Obligation Bonds, Safety, Repair & Improvement, Election 2002 Series 2006, 0.000%, 11/01/23 – AGM Insured | | | No Opt. Call | | | | | | | | AA | | | | 1,716,284 | |
| | | | | | |
| | 1,500 | | | Loma Linda, California, Hospital Revenue Bonds, Loma Linda University Medical Center, Series 2008A, 8.250%, 12/01/38 (Pre-refunded 12/01/17) | | | 12/17 at 100.00 | | | | | | | | BB (4) | | | | 1,680,705 | |
| | | | | | |
| | 1,000 | | | Los Angeles Harbors Department, California, Revenue Bonds, Series 2009B, 5.250%, 8/01/39 | | | 8/19 at 100.00 | | | | | | | | AA | | | | 1,131,060 | |
| | | | | | |
| | 500 | | | Lynwood Redevelopment Agency, California, Project A Revenue Bonds, Subordinate Lien Series 2011A, 7.000%, 9/01/31 | | | 9/21 at 100.00 | | | | | | | | A– | | | | 624,250 | |
| | | | | | |
| | 3,000 | | | Madera County, California, Certificates of Participation, Children’s Hospital Central California, Series 2010, 5.375%, 3/15/36 | | | 3/20 at 100.00 | | | | | | | | AA– | | | | 3,360,420 | |
| | | | | | |
| | 1,000 | | | Manteca Financing Authority, California, Sewer Revenue Bonds, Series 2009, 5.750%, 12/01/36 | | | 12/19 at 100.00 | | | | | | | | AA | | | | 1,153,720 | |
| | | | | | |
| | 1,000 | | | Modesto Irrigation District, California, Electric System Revenue Bonds, Refunding Series 2011A, 5.000%, 7/01/26 | | | 7/21 at 100.00 | | | | | | | | A+ | | | | 1,156,800 | |
| | | | | | |
| | | | M-S-R Energy Authority, California, Gas Revenue Bonds, Citigroup Prepay Contracts, Series 2009A: | | | | | | | | | | | | | | | | |
| | 2,800 | | | 7.000%, 11/01/34 | | | No Opt. Call | | | | | | | | A | | | | 4,206,076 | |
| | 2,500 | | | 6.500%, 11/01/39 | | | No Opt. Call | | | | | | | | A | | | | 3,587,700 | |
| | | | | | |
| | 13,750 | | | Ontario Redevelopment Financing Authority, San Bernardino County, California, Revenue Bonds, Redevelopment Project 1, Series 1993, 5.800%, 8/01/23 – NPFG Insured (ETM) | | | 8/16 at 100.00 | | | | | | | | AA– (4) | | | | 16,135,488 | |
| | | | | | |
| | 1,145 | | | Palm Drive Health Care District, Sonoma County, California, Certificates of Participation, Parcel Tax Secured Financing Program, Series 2010, 7.000%, 4/01/25 | | | No Opt. Call | | | | | | | | CCC+ | | | | 1,125,535 | |
| | | | | | |
| | 1,740 | | | Palmdale, California, Special Tax Bonds, Community Facilities District 2003-1, Anaverde Project, Series 2005A, 5.350%, 9/01/30 | | | 9/16 at 100.00 | | | | | | | | N/R | | | | 1,754,198 | |
| | | | | | |
| | 3,000 | | | Palomar Pomerado Health Care District, California, Certificates of Participation, Series 2009, 6.625%, 11/01/29 | | | 11/19 at 100.00 | | | | | | | | Ba1 | | | | 3,352,410 | |
| | | | | | |
| | 1,710 | | | Perris Public Financing Authority, California, Tax Allocation Revenue Bonds, Housing Loan Series 2010A, 6.125%, 10/01/40 | | | 10/20 at 100.00 | | | | | | | | A | | | | 2,006,292 | |
| | | | | | |
| | 3,775 | | | Poway Unified School District, San Diego County, California, General Obligation Bonds, School Facilities Improvement District 2007-1, Election 2008 Series 2009A, 0.000%, 8/01/23 | | | No Opt. Call | | | | | | | | AA– | | | | 3,212,034 | |
| | | | | | |
| | 5,500 | | | Poway Unified School District, San Diego County, California, General Obligation Bonds, School Facilities Improvement District 2007-1, Series 2011A, 0.000%, 8/01/41 | | | No Opt. Call | | | | | | | | AA– | | | | 2,211,055 | |
| | | | | | |
| | 15,000 | | | Rialto Unified School District, San Bernardino County, California, General Obligation Bonds, Series 2011A, 0.000%, 8/01/41 – AGM Insured (5) | | | 8/36 at 100.00 | | | | | | | | AA | | | | 12,977,250 | |
| | | | | | |
| | 4,000 | | | Ridgecrest Redevelopment Agency, California, Ridgecrest Redevelopment Project Tax Allocation Bonds, Refunding Series 2010, 6.125%, 6/30/37 | | | 6/20 at 100.00 | | | | | | | | A– | | | | 4,660,360 | |
| | | | | | |
| | 715 | | | Roseville, California, Special Tax Bonds, Community Facilities District 1 Hewlett Parkard Campus Oaks, Series 2016, 5.500%, 9/01/46 | | | 9/26 at 100.00 | | | | | | | | N/R | | | | 766,108 | |
Nuveen All-American Municipal Bond Fund (continued)
| | |
| Portfolio of Investments | | April 30, 2016 |
| | | | | | | | | | | | | | | | | | | | |
Principal
Amount (000) | | | Description (1) | | Optional Call
Provisions (2) | | | | | | | Ratings (3) | | | Value | |
| | | | | | |
| | | | California (continued) | | | | | | | | | | | | | |
| | | | | | |
| $ | 910 | | | Sacramento, California, Community Facilities District 05-1, College Square Special Tax Bonds, Series 2007, 5.900%, 9/01/37 | | | 9/17 at 100.00 | | | | | | | | N/R | | | $ | 944,016 | |
| | | | | | |
| | 2,000 | | | San Francisco Airports Commission, California, Revenue Bonds, San Francisco International Airport, Second Series A of 2009, 4.900%, 5/01/29 | | | 11/19 at 100.00 | | | | | | | | A+ | | | | 2,261,880 | |
| | | | | | |
| | 670 | | | San Francisco Redevelopment Finance Authority, California, Tax Allocation Revenue Bonds, Mission Bay North Redevelopment Project, Series 2009C, 6.500%, 8/01/39 (Pre-refunded 8/01/19) | | | 8/19 at 100.00 | | | | | | | | A– (4) | | | | 792,389 | |
| | | | | | |
| | 13,300 | | | San Joaquin Hills Transportation Corridor Agency, Orange County, California, Toll Road Revenue Bonds, Refunding Junior Lien Series 2014B, 5.250%, 1/15/44 | | | 1/25 at 100.00 | | | | | | | | BB+ | | | | 14,645,561 | |
| | | | | | |
| | 9,745 | | | San Joaquin Hills Transportation Corridor Agency, Orange County, California, Toll Road Revenue Bonds, Refunding Senior Lien Series 2014A, 5.000%, 1/15/44 | | | 1/25 at 100.00 | | | | | | | | BBB– | | | | 10,818,412 | |
| | | | | | |
| | 8,400 | | | San Jose Redevelopment Agency, California, Tax Allocation Bonds, Merged Area Redevelopment Project, Series 2006C, 4.250%, 8/01/30 – NPFG Insured | | | 8/17 at 100.00 | | | | | | | | AA– | | | | 8,591,268 | |
| | | | | | |
| | 440 | | | Santee Community Development Commission, California, Santee Redevelopment Project Tax Allocation Bonds, Series 2011A, 7.000%, 8/01/31 | | | 2/21 at 100.00 | | | | | | | | A | | | | 543,022 | |
| | | | | | |
| | 2,355 | | | Semitrophic Improvement District of Semitrophic Water Storage District, Kern County, California, Revenue Bonds, Refunding Series 2009A, 5.000%, 12/01/38 | | | 12/19 at 100.00 | | | | | | | | A+ | | | | 2,657,099 | |
| | | | | | |
| | 4,000 | | | Southern California Public Power Authority, Transmission Project Revenue Bonds, Southern Transmission Subordinate Lien Refunding Series 2008A, 5.000%, 7/01/20 | | | 7/18 at 100.00 | | | | | | | | AA– | | | | 4,386,560 | |
| | | | | | |
| | 500 | | | Temecula Redevelopment Agency, California, Redevelopment Project 1 Tax Allocation Housing Bonds Series 2011A, 6.750%, 8/01/31 | | | 8/21 at 100.00 | | | | | | | | BBB+ | | | | 624,560 | |
| | | | | | |
| | 4,750 | | | Tobacco Securitization Authority of Southern California, Tobacco Settlement Asset-Backed Bonds, San Diego County Tobacco Asset Securitization Corporation, Senior Series 2006A, 5.125%, 6/01/46 | | | No Opt. Call | | | | | | | | B+ | | | | 4,749,668 | |
| | | | | | |
| | 920 | | | Tustin Community Redevelopment Agency, California, Tax Allocation Housing Bonds Series 2010, 5.000%, 9/01/30 – AGM Insured | | | 9/20 at 100.00 | | | | | | | | AA | | | | 1,049,205 | |
| | | | | | |
| | 205 | | | Val Verde Unified School District, Riverside County, California, Certificates of Participation, Series 2009A, 5.125%, 3/01/36 – AGC Insured | | | 3/19 at 100.00 | | | | | | | | AA | | | | 225,256 | |
| | | | | | |
| | 895 | | | Ventura County Area Housing Authority, California, Multifamily Revenue Bonds, Mira Vista Senior Apartments Project, Series 2006A, 5.000%, 12/01/22 – AMBAC Insured (Alternative Minimum Tax) | | | 12/16 at 100.00 | | | | | | | | N/R | | | | 903,619 | |
| | | | | | |
| | 5,000 | | | Victor Valley Union High School District, San Bernardino County, California, General Obligation Bonds, Series 2009A, 0.000%, 8/01/31 – AGC Insured (5) | | | 8/26 at 100.00 | | | | | | | | AA | | | | 5,256,300 | |
| | | | | | |
| | 1,500 | | | Western Placer Unified School District, Placer County, California, Certificates of Participation, Refunding Series 2009, 5.250%, 8/01/35 – AGM Insured | | | 8/19 at 100.00 | | | | | | | | AA | | | | 1,678,170 | |
| | | | | | |
| | | | Westminster School District, Orange County, California, General Obligation Bonds, Series 2009-A1: | | | | | | | | | | | | | | | | |
| | 2,485 | | | 0.000%, 8/01/26 – AGC Insured | | | No Opt. Call | | | | | | | | AA | | | | 1,877,318 | |
| | 1,405 | | | 0.000%, 8/01/28 – AGC Insured | | | No Opt. Call | | | | | | | | AA | | | | 979,636 | |
| | 2,920 | | | 0.000%, 8/01/29 – AGC Insured | | | No Opt. Call | | | | | | | | AA | | | | 1,950,239 | |
| | 269,880 | | | Total California | | | | | | | | | | | | | | | 280,788,810 | |
| | | | | | |
| | | | Colorado – 4.2% | | | | | | | | | | | | | |
| | | | | | |
| | | | Baptist Road Rural Transportation Authority, Colorado, Sales and Use Tax Revenue Bonds, Series 2007: | | | | | | | | | | | | | | | | |
| | 270 | | | 4.800%, 12/01/17 (Pre-refunded 6/01/16) | | | 6/16 at 100.00 | | | | | | | | N/R (4) | | | | 271,037 | |
| | 905 | | | 5.000%, 12/01/26 (Pre-refunded 6/01/16) | | | 6/16 at 100.00 | | | | | | | | N/R (4) | | | | 908,638 | |
| | | | | | | | | | | | | | | | | | | | |
Principal
Amount (000) | | | Description (1) | | Optional Call
Provisions (2) | | | | | | | Ratings (3) | | | Value | |
| | | | | | |
| | | | Colorado (continued) | | | | | | | | | | | | | |
| | | | | | |
| $ | 1,075 | | | Brighton Crossing Metropolitan District 4, Colorado, General Obligation Bonds, Limited Tax Convertible to Unlimited Tax, Refunding Series 2013, 7.000%, 12/01/23 | | | 7/18 at 100.00 | | | | | | | | N/R | | | $ | 1,096,511 | |
| | | | | | |
| | 2,065 | | | Colorado Educational and Cultural Facilities Authority, Charter School Revenue Bonds, Community Leadership Academy Project, Series 2008, 6.500%, 7/01/38 | | | 7/18 at 100.00 | | | | | | | | BB | | | | 2,134,281 | |
| | | | | | |
| | 3,040 | | | Colorado Educational and Cultural Facilities Authority, Charter School Revenue Bonds, Community Leadership Academy, Inc. Second Campus Project, Series 2013, 7.350%, 8/01/43 | | | 8/23 at 100.00 | | | | | | | | BB | | | | 3,641,312 | |
| | | | | | |
| | 1,025 | | | Colorado Educational and Cultural Facilities Authority, Charter School Revenue Bonds, Crown Pointe Academy of Westminster Project, Chartered Through Adams County School District 50, Series 2009, 5.000%, 7/15/39 | | | 7/19 at 100.00 | | | | | | | | BBB | | | | 1,063,048 | |
| | | | | | |
| | 2,500 | | | Colorado Educational and Cultural Facilities Authority, Charter School Revenue Bonds, Pinnacle Charter School, Inc. High School Project, Series 2010, 5.125%, 12/01/39 | | | 12/19 at 100.00 | | | | | | | | BBB | | | | 2,656,000 | |
| | | | | | |
| | 915 | | | Colorado Educational and Cultural Facilities Authority, Revenue Bonds, Pikes Peak School of Expeditionary Learning Charter School, Series 2008, 6.625%, 6/01/38 (Pre-refunded 6/01/18) | | | 6/18 at 102.00 | | | | | | | | N/R (4) | | | | 1,015,815 | |
| | | | | | |
| | 3,000 | | | Colorado Health Facilities Authority, Colorado, Hospital Improvement Revenue Bonds, NCMC Inc., Series 2003A, 5.500%, 5/15/30 – AGM Insured | | | 5/19 at 100.00 | | | | | | | | AA | | | | 3,338,370 | |
| | | | | | |
| | 13,450 | | | Colorado Health Facilities Authority, Colorado, Hospital Revenue Bonds, NCMC Inc., Series 2016, 3.250%, 5/15/33 (WI/DD, Settling 5/12/16) | | | 5/26 at 100.00 | | | | | | | | A+ | | | | 13,512,946 | |
| | | | | | |
| | 1,500 | | | Colorado Health Facilities Authority, Colorado, Revenue Bonds, American Baptist Homes Project, Series 2009A, 7.750%, 8/01/29 | | | 8/19 at 100.00 | | | | | | | | N/R | | | | 1,654,020 | |
| | | | | | |
| | | | Colorado Health Facilities Authority, Colorado, Revenue Bonds, Colorado Senior Residences Project, Series 2012: | | | | | | | | | | | | | | | | |
| | 1,370 | | | 7.000%, 6/01/42 (8) | | | 6/22 at 100.00 | | | | | | | | N/R | | | | 1,101,138 | |
| | 1,375 | | | 7.125%, 6/01/47 (8) | | | 6/22 at 100.00 | | | | | | | | N/R | | | | 1,105,156 | |
| | | | | | |
| | 12,000 | | | Colorado Health Facilities Authority, Colorado, Revenue Bonds, Covenant Retirement Communities Inc., Refunding Series 2012A, 5.000%, 12/01/33 | | | 12/22 at 100.00 | | | | | | | | BBB+ | | | | 13,254,960 | |
| | | | | | |
| | 6,155 | | | Colorado Health Facilities Authority, Colorado, Revenue Bonds, Evangelical Lutheran Good Samaritan Society Project, Series 2013A, 5.000%, 6/01/45 | | | No Opt. Call | | | | | | | | A– | | | | 6,840,421 | |
| | | | | | |
| | 725 | | | Colorado Health Facilities Authority, Colorado, Revenue Bonds, Evangelical Lutheran Good Samaritan Society Project, Series 2013, 5.625%, 6/01/43 | | | 6/23 at 100.00 | | | | | | | | BBB+ | | | | 853,035 | |
| | | | | | |
| | 3,000 | | | Colorado Health Facilities Authority, Colorado, Revenue Bonds, Parkview Medical Center, Refunding Series 2015B, 4.000%, 9/01/34 | | | 9/25 at 100.00 | | | | | | | | A3 | | | | 3,158,850 | |
| | | | | | |
| | 100 | | | Colorado Health Facilities Authority, Colorado, Revenue Bonds, Poudre Valley Health System, Series 2005B, 5.250%, 3/01/36 – AGM Insured | | | 9/18 at 102.00 | | | | | | | | AA | | | | 109,200 | |
| | | | | | |
| | 3,000 | | | Colorado Health Facilities Authority, Colorado, Revenue Bonds, Sisters of Charity of Leavenworth Health Services Corporation, Refunding Composite Deal Series 2010B, 5.250%, 1/01/25 | | | 1/20 at 100.00 | | | | | | | | AA– | | | | 3,443,310 | |
| | | | | | |
| | 1,100 | | | Colorado Health Facilities Authority, Colorado, Revenue Bonds, Total Long-Term Care National Obligated Group Project, Series 2010A, 6.250%, 11/15/40 (Pre-refunded 11/15/20) | | | 11/20 at 100.00 | | | | | | | | N/R (4) | | | | 1,344,013 | |
| | | | | | |
| | 755 | | | Colorado Health Facilities Authority, Revenue Bonds, Evangelical Lutheran Good Samaritan Society, Series 2006, 5.250%, 6/01/36 | | | 6/16 at 100.00 | | | | | | | | BBB+ | | | | 756,933 | |
| | | | | | |
| | 1,855 | | | Colorado Health Facilities Authority, Revenue Bonds, Evangelical Lutheran Good Samaritan Society, Series 2006, 5.250%, 6/01/36 (Pre-refunded 6/01/16) | | | 6/16 at 100.00 | | | | | | | | N/R (4) | | | | 1,862,828 | |
| | | | | | |
| | 1,590 | | | Colorado Housing and Finance Authority, Solid Waste Disposal Revenue Bonds, Waste Management Inc. Project, Series 2004, 5.700%, 7/01/18 (Alternative Minimum Tax) | | | No Opt. Call | | | | | | | | A– | | | | 1,754,517 | |
| | | | | | |
| | 540 | | | Compark Business Campus Metropolitan District, Colorado, General Obligation Limited Tax Bonds, Series 2007A, 5.750%, 12/01/27 – RAAI Insured | | | 12/17 at 100.00 | | | | | | | | AA | | | | 555,644 | |
Nuveen All-American Municipal Bond Fund (continued)
| | |
| Portfolio of Investments | | April 30, 2016 |
| | | | | | | | | | | | | | | | | | | | |
Principal
Amount (000) | | | Description (1) | | Optional Call
Provisions (2) | | | | | | | Ratings (3) | | | Value | |
| | | | | | |
| | | | Colorado (continued) | | | | | | | | | | | | | |
| | | | | | |
| $ | 1,000 | | | Compark Business Campus Metropolitan District, Douglas County, Colorado, General Obligation Bonds, Series 2012A, 6.750%, 12/01/39 – RAAI Insured | | | 12/22 at 100.00 | | | | | | | | N/R | | | $ | 1,094,530 | |
| | | | | | |
| | 1,995 | | | Concord Metropolitan District, Douglas County, Colorado, General Obligation Bonds, Refunding Series 2010, 5.375%, 12/01/40 | | | 12/20 at 100.00 | | | | | | | | BBB+ | | | | 2,149,613 | |
| | | | | | |
| | 330 | | | Confluence Metropolitan District, Colorado, General Obligation Limited Tax Bonds, Series 2007, 5.250%, 12/01/17 | | | No Opt. Call | | | | | | | | N/R | | | | 330,432 | |
| | | | | | |
| | 1,730 | | | Denver City and County, Colorado, Airport System Revenue Bonds, Refunding Series 2010A, 5.000%, 11/15/21 | | | 11/20 at 100.00 | | | | | | | | A+ | | | | 2,017,284 | |
| | | | | | |
| | 5,000 | | | Denver City and County, Colorado, Airport System Revenue Bonds, Subordinate Lien Series 2013A, 5.250%, 11/15/43 (Alternative Minimum Tax) | | | 11/23 at 100.00 | | | | | | | | A | | | | 5,657,100 | |
| | | | | | |
| | 11,555 | | | E-470 Public Highway Authority, Colorado, Senior Revenue Bonds, Series 1997B, 0.000%, 9/01/24 – NPFG Insured | | | No Opt. Call | | | | | | | | AA– | | | | 9,332,165 | |
| | | | | | |
| | | | E-470 Public Highway Authority, Colorado, Senior Revenue Bonds, Series 2000B: | | | | | | | | | | | | | | | | |
| | 20 | | | 0.000%, 9/01/29 – NPFG Insured | | | No Opt. Call | | | | | | | | AA– | | | | 13,156 | |
| | 395 | | | 0.000%, 9/01/30 – NPFG Insured | | | No Opt. Call | | | | | | | | AA– | | | | 249,790 | |
| | 20 | | | 0.000%, 9/01/32 – NPFG Insured | | | No Opt. Call | | | | | | | | AA– | | | | 11,763 | |
| | 25 | | | 0.000%, 9/01/33 – NPFG Insured | | | No Opt. Call | | | | | | | | AA– | | | | 14,065 | |
| | | | | | |
| | 9,890 | | | E-470 Public Highway Authority, Colorado, Toll Revenue Bonds, Series 2004A, 0.000%, 9/01/27 – NPFG Insured | | | No Opt. Call | | | | | | | | AA– | | | | 7,165,898 | |
| | | | | | |
| | 1,035 | | | Erie Farm Metropolitan District, Colorado, General Obligation Limited Tax Bonds, Series 2016A, 5.500%, 12/01/45 | | | 12/21 at 103.00 | | | | | | | | N/R | | | | 1,048,672 | |
| | | | | | |
| | 1,991 | | | Fitzsimons Village Metropolitan District 1, Aurora, Arapahoe County, Colorado, Tax Increment Public Improvement Fee Supported Revenue Bonds, Series 2010A, 7.500%, 3/01/40 | | | 3/20 at 100.00 | | | | | | | | N/R | | | | 2,185,521 | |
| | | | | | |
| | 1,365 | | | Foothills Metropolitan District, Fort Collins, Colorado, Special Revenue Bonds, Series 2014, 6.000%, 12/01/38 | | | 12/24 at 100.00 | | | | | | | | N/R | | | | 1,478,773 | |
| | | | | | |
| | 760 | | | Fossil Ridge Metropolitan District 1, Lakewood, Colorado, Tax-Supported Revenue Bonds, Refunding Series 2010, 7.250%, 12/01/40 | | | 12/20 at 100.00 | | | | | | | | N/R | | | | 840,910 | |
| | | | | | |
| | 3,600 | | | Fossil Ridge Metropolitan District No. 3, In the City of Lakewood, Jefferson County, Colorado, General Obligation Limited Tax Bonds, Series 2014, 5.000%, 12/01/44 | | | 12/20 at 100.00 | | | | | | | | BBB | | | | 3,811,680 | |
| | | | | | |
| | 620 | | | Park Creek Metropolitan District, Colorado, Senior Limited Property Tax Supported Revenue Bonds, Refunding Series 2015A, 5.000%, 12/01/45 | | | 12/25 at 100.00 | | | | | | | | BBB | | | | 701,660 | |
| | | | | | |
| | 2,025 | | | Park Creek Metropolitan District, Colorado, Senior Property Tax Supported Revenue Bonds, Series 2009, 6.375%, 12/01/37 (Pre-refunded 12/01/19) – AGC Insured | | | 12/19 at 100.00 | | | | | | | | AA (4) | | | | 2,406,409 | |
| | | | | | |
| | 4,300 | | | Plaza Metropolitan District 1, Lakewood, Colorado, Tax Increment Revenue Bonds, Refunding Series 2013, 4.500%, 12/01/30 | | | 12/22 at 100.00 | | | | | | | | N/R | | | | 4,466,281 | |
| | | | | | |
| | | | Public Authority for Colorado Energy, Natural Gas Purchase Revenue Bonds, Colorado Springs Utilities, Series 2008: | | | | | | | | | | | | | | | | |
| | 2,170 | | | 6.250%, 11/15/28 | | | No Opt. Call | | | | | | | | A | | | | 2,810,193 | |
| | 3,580 | | | 6.500%, 11/15/38 | | | No Opt. Call | | | | | | | | A | | | | 5,117,538 | |
| | | | | | |
| | | | Regional Transportation District, Colorado, Denver Transit Partners Eagle P3 Project Private Activity Bonds, Series 2010: | | | | | | | | | | | | | | | | |
| | 1,025 | | | 5.250%, 7/15/24 | | | 7/20 at 100.00 | | | | | | | | BBB+ | | | | 1,155,544 | |
| | 4,265 | | | 6.000%, 1/15/41 | | | 7/20 at 100.00 | | | | | | | | BBB+ | | | | 4,943,988 | |
| | | | | | |
| | 815 | | | Three Springs Metropolitan District 3, Durango, La Plata County, Colorado, Property Tax Supported Revenue Bonds, Series 2010, 7.750%, 12/01/39 | | | 12/20 at 100.00 | | | | | | | | N/R | | | | 877,299 | |
| | 122,821 | | | Total Colorado | | | | | | | | | | | | | | | 127,312,247 | |
| | | | | | | | | | | | | | | | | | | | |
Principal
Amount (000) | | | Description (1) | | Optional Call
Provisions (2) | | | | | | | Ratings (3) | | | Value | |
| | | | | | |
| | | | Connecticut – 0.6% | | | | | | | | | | | | | |
| | | | | | |
| $ | 860 | | | Connecticut Health and Educational Facilities Authority, Revenue Bonds, Healthcare Facility Expansion Church Home of Hartford Inc. Project, Series 2016A, 5.000%, 9/01/53 | | | 9/26 at 100.00 | | | | | | | | BB | | | $ | 911,987 | |
| | | | | | |
| | 1,000 | | | Connecticut Health and Educational Facilities Authority, Revenue Bonds, Sacred Heart University, Series 2011G, 5.625%, 7/01/41 | | | 7/21 at 100.00 | | | | | | | | BBB+ | | | | 1,126,890 | |
| | | | | | |
| | 1,000 | | | Connecticut Health and Educational Facilities Authority, Revenue Bonds, Yale University, Tender Option Bond Trust 2015-XF0247, 17.144%, 7/01/42 (IF) (6) | | | 7/17 at 100.00 | | | | | | | | AAA | | | | 1,194,760 | |
| | | | | | |
| | 9,595 | | | Connecticut State, General Obligation Bonds, Series 2014F, 5.000%, 11/15/18 | | | No Opt. Call | | | | | | | | AA | | | | 10,586,835 | |
| | | | | | |
| | 750 | | | Harbor Point Infrastructure Improvement District, Connecticut, Special Obligation Revenue Bonds, Harbor Point Project, Series 2010A, 7.000%, 4/01/22 | | | 4/20 at 100.00 | | | | | | | | N/R | | | | 843,705 | |
| | | | | | |
| | 1,800 | | | Stamford, Connecticut, Special Obligation Revenue Bonds, Mill River Corridor Project, Series 2011aA, 7.000%, 4/01/41 (Pre-refunded 4/01/21) | | | 4/21 at 100.00 | | | | | | | | N/R (4) | | | | 2,287,170 | |
| | 15,005 | | | Total Connecticut | | | | | | | | | | | | | | | 16,951,347 | |
| | | | | | |
| | | | Delaware – 0.2% | | | | | | | | | | | | | |
| | | | | | |
| | 900 | | | Delaware Economic Development Authority, Exempt Facility Revenue Bonds, Indian River Power LLC Project, Series 2010, 5.375%, 10/01/45 | | | 10/20 at 100.00 | | | | | | | | Baa3 | | | | 947,061 | |
| | | | | | |
| | 5,000 | | | Delaware Transportation Authority, Transportation System Revenue Bonds, Senior Lien Series 2008, 5.000%, 7/01/19 | | | No Opt. Call | | | | | | | | AA+ | | | | 5,656,450 | |
| | | | | | |
| | 135 | | | Wilmington, Delaware, Replacement Housing Factor Fund Securitization Revenue Bonds, Wilmington Housing Authority-Lincoln Towers Project, Seies 2011, 5.750%, 7/15/16 | | | No Opt. Call | | | | | | | | N/R | | | | 135,097 | |
| | 6,035 | | | Total Delaware | | | | | | | | | | | | | | | 6,738,608 | |
| | | | | | |
| | | | District of Columbia – 0.2% | | | | | | | | | | | | | |
| | | | | | |
| | 4,000 | | | District of Columbia, General Obligation Bonds, Refunding Series 2014D, 5.000%, 6/01/17 | | | No Opt. Call | | | | | | | | Aa1 | | | | 4,192,120 | |
| | | | | | |
| | 1,000 | | | District of Columbia, Revenue Bonds, Friendship Public Charter School Inc., Series 2006, 5.000%, 6/01/26 (Pre-refunded 6/01/16) – ACA Insured | | | 6/16 at 100.00 | | | | | | | | BBB (4) | | | | 1,004,020 | |
| | 5,000 | | | Total District of Columbia | | | | | | | | | | | | | | | 5,196,140 | |
| | | | | | |
| | | | Florida – 6.5% | | | | | | | | | | | | | |
| | | | | | |
| | | | Atlantic Beach, Florida, Healthcare Facilities Revenue Refunding Bonds, Fleet Landing Project, Series 2013A: | | | | | | | | | | | | | | | | |
| | 300 | | | 5.000%, 11/15/23 | | | No Opt. Call | | | | | | | | BBB | | | | 348,951 | |
| | 2,300 | | | 5.000%, 11/15/28 | | | 11/23 at 100.00 | | | | | | | | BBB | | | | 2,576,529 | |
| | | | | | |
| | 1,250 | | | Bay County, Florida, Educational Facilities Revenue Refunding Bonds, Bay Haven Charter Academy, Inc. Project, Series 2010A, 6.000%, 9/01/40 | | | 9/20 at 100.00 | | | | | | | | BBB– | | | | 1,339,850 | |
| | | | | | |
| | 490 | | | Boynton Village Community Development District, Florida, Special Assessment Bonds, Series 2007-A1, 5.750%, 5/01/37 | | | 5/17 at 100.00 | | | | | | | | N/R | | | | 490,681 | |
| | | | | | |
| | 855 | | | Brevard County Health Facilities Authority, Florida, Health Facilities Revenue Bonds, Health First, Inc. Project, Series 2009B, 7.000%, 4/01/39 (Pre-refunded 4/01/19) | | | 4/19 at 100.00 | | | | | | | | A (4) | | | | 1,006,036 | |
| | | | | | |
| | 6,000 | | | Cape Coral, Florida, Water and Sewer Revenue Bonds, Refunding Series 2011, 5.000%, 10/01/41 – AGM Insured | | | 10/21 at 100.00 | | | | | | | | AA | | | | 6,958,980 | |
| | | | | | |
| | | | Capital Trust Agency, Florida, Multifamily Housing Revenue Bonds, The Gardens Apartments Project, Series 2015A: | | | | | | | | | | | | | | | | |
| | 1,500 | | | 4.750%, 7/04/40 | | | 7/25 at 100.00 | | | | | | | | A | | | | 1,544,895 | |
| | 1,380 | | | 5.000%, 7/04/50 | | | 7/25 at 100.00 | | | | | | | | A | | | | 1,430,246 | |
Nuveen All-American Municipal Bond Fund (continued)
| | |
| Portfolio of Investments | | April 30, 2016 |
| | | | | | | | | | | | | | | | | | | | |
Principal
Amount (000) | | | Description (1) | | Optional Call
Provisions (2) | | | | | | | Ratings (3) | | | Value | |
| | | | | | |
| | | | Florida (continued) | | | | | | | | | | | | | |
| | | | | | |
| $ | 4,710 | | | Citizens Property Insurance Corporation, Florida, Personal and Commercial Lines Account Bonds, Senior Secured Series 2012A-1, 5.000%, 6/01/19 | | | No Opt. Call | | | | | | | | AA– | | | $ | 5,275,200 | |
| | | | | | |
| | 1,025 | | | Cityplace Community Development District, Florida, Special Assessment and Revenue Bonds, Refunding Series 2012, 5.000%, 5/01/26 | | | No Opt. Call | | | | | | | | A | | | | 1,199,465 | |
| | | | | | |
| | 1,000 | | | Clearwater, Florida, Water and Sewer Revenue Bonds, Series 2009A, 5.250%, 12/01/39 – AGC Insured | | | 12/19 at 100.00 | | | | | | | | AA– | | | | 1,126,140 | |
| | | | | | |
| | 1,000 | | | Coco Palms Community Development District, Miami-Dade County, Florida, Special Assessment Bonds, Series 2016, 5.000%, 5/01/46 | | | 5/27 at 100.00 | | | | | | | | N/R | | | | 1,003,360 | |
| | | | | | |
| | 2,885 | | | Florida Development Finance Corporation, Educational Facilities Revenue Bonds, Bay Area Charter Foundation, LLC Projects, Series 2011A, 7.750%, 6/15/42 | | | 12/21 at 101.00 | | | | | | | | N/R | | | | 3,248,279 | |
| | | | | | |
| | 1,000 | | | Florida Development Finance Corporation, Educational Facilities Revenue Bonds, Renaissance Charter School, Inc. Projects, Series 2010A, 6.000%, 9/15/30 | | | 9/20 at 100.00 | | | | | | | | BB+ | | | | 1,056,100 | |
| | | | | | |
| | | | Florida Development Finance Corporation, Educational Facilities Revenue Bonds, Renaissance Charter School, Inc. Projects, Series 2012A: | | | | | | | | | | | | | | | | |
| | 1,000 | | | 5.500%, 6/15/22 | | | No Opt. Call | | | | | | | | N/R | | | | 1,107,080 | |
| | 500 | | | 6.000%, 6/15/32 | | | No Opt. Call | | | | | | | | N/R | | | | 549,285 | |
| | 1,100 | | | 6.125%, 6/15/43 | | | No Opt. Call | | | | | | | | N/R | | | | 1,206,447 | |
| | | | | | |
| | 2,000 | | | Florida Development Finance Corporation, Educational Facilities Revenue Bonds, Renaissance Charter School, Inc. Projects, Series 2013A, 8.500%, 6/15/44 | | | 6/23 at 100.00 | | | | | | | | N/R | | | | 2,341,940 | |
| | | | | | |
| | 1,520 | | | Florida Development Finance Corporation, Educational Facilities Revenue Bonds, Renaissance Charter School, Inc. Projects, Series 2014A, 6.125%, 6/15/44 | | | 6/24 at 100.00 | | | | | | | | N/R | | | | 1,571,984 | |
| | | | | | |
| | 1,440 | | | Florida Development Finance Corporation, Educational Facilities Revenue Bonds, Renaissance Charter School Income Projects, Series 2015A, 6.125%, 6/15/46 | | | 6/25 at 100.00 | | | | | | | | N/R | | | | 1,473,134 | |
| | | | | | |
| | 3,180 | | | Florida Development Finance Corporation, Revenue Bonds, Learning Gate Community Charter School Project, Series 2007A, 6.000%, 2/15/37 | | | 2/17 at 100.00 | | | | | | | | BB– | | | | 3,185,501 | |
| | | | | | |
| | 6,800 | | | Florida Higher Educational Facilities Financing Authority, Revenue Bonds, Nova Southeastern University Project, Refunding Series 2012A, 5.000%, 4/01/27 | | | 4/22 at 100.00 | | | | | | | | A– | | | | 7,802,932 | |
| | | | | | |
| | | | Florida Higher Educational Facilities Financing Authority, Revenue Bonds, Rollins College Project, Series 2012A: | | | | | | | | | | | | | | | | |
| | 1,210 | | | 5.000%, 12/01/30 | | | 12/22 at 100.00 | | | | | | | | A2 | | | | 1,424,097 | |
| | 1,000 | | | 5.000%, 12/01/31 | | | 12/22 at 100.00 | | | | | | | | A2 | | | | 1,174,870 | |
| | 3,000 | | | 5.000%, 12/01/37 | | | 12/22 at 100.00 | | | | | | | | A2 | | | | 3,460,830 | |
| | | | | | |
| | 1,000 | | | Florida Housing Finance Agency, Housing Revenue Bonds, Stoddert Arms Apartments, Series 1996O, 6.300%, 9/01/36 – AMBAC Insured (Alternative Minimum Tax) | | | 9/16 at 100.00 | | | | | | | | N/R | | | | 1,001,590 | |
| | | | | | |
| | 1,000 | | | Grand Bay at Doral Community Development District, Miami-Dade County, Florida, Special Assessment Bonds, South Parcel Assessment Area Project, Series 2016, 5.000%, 5/01/46 | | | 5/26 at 100.00 | | | | | | | | N/R | | | | 1,007,040 | |
| | | | | | |
| | | | Halifax Hospital Medical Center, Daytona Beach, Florida, Hospital Revenue Bonds, Series 2006: | | | | | | | | | | | | | | | | |
| | 1,595 | | | 5.250%, 6/01/26 (Pre-refunded 6/01/16) | | | 6/16 at 100.00 | | | | | | | | N/R (4) | | | | 1,601,763 | |
| | 655 | | | 5.250%, 6/01/26 (Pre-refunded 6/01/16) | | | 6/16 at 100.00 | | | | | | | | A– (4) | | | | 657,803 | |
| | 265 | | | 5.000%, 6/01/38 (Pre-refunded 6/01/16) | | | 6/16 at 100.00 | | | | | | | | N/R (4) | | | | 266,063 | |
| | 110 | | | 5.000%, 6/01/38 (Pre-refunded 6/01/16) | | | 6/16 at 100.00 | | | | | | | | A– (4) | | | | 110,447 | |
| | | | | | |
| | 1,900 | | | Hernando County, Florida, Revenue Bonds, Criminal Justice Complex Financing Program, Series 1986, 7.650%, 7/01/16 – FGIC Insured | | | No Opt. Call | | | | | | | | AA– | | | | 1,922,363 | |
| | | | | | |
| | 3,130 | | | Hillsborough County Aviation Authority, Florida, Revenue Bonds, Tampa International Airport, Senior Lien Series 2015A, 5.000%, 10/01/44 (Alternative Minimum Tax) | | | 10/24 at 100.00 | | | | | | | | AA– | | | | 3,538,058 | |
| | | | | | | | | | | | | | | | | | | | |
Principal
Amount (000) | | | Description (1) | | Optional Call
Provisions (2) | | | | | | | Ratings (3) | | | Value | |
| | | | | | |
| | | | Florida (continued) | | | | | | | | | | | | | |
| | | | | | |
| $ | 750 | | | Jacksonville Economic Development Commission, Florida, Industrial Development Revenue Bonds, Gerdau Ameristeel US Inc. Project, Series 2007, 5.300%, 5/01/37 (Alternative Minimum Tax) | | | No Opt. Call | | | | | | | | BBB– | | | $ | 699,630 | |
| | | | | | |
| | 14,725 | | | Jacksonville, Florida, Transportation Revenue Bonds, Refunding Series 2015, 3.000%, 10/01/30 | | | 10/25 at 100.00 | | | | | | | | AA– | | | | 15,114,918 | |
| | | | | | |
| | 925 | | | Lee County Industrial Development Authority, Florida, Charter School Revenue Bonds, Lee County Community Charter Schools, Series 2007A, 5.250%, 6/15/27 | | | 6/17 at 100.00 | | | | | | | | BB | | | | 940,244 | |
| | | | | | |
| | | | Lee County Industrial Development Authority, Florida, Charter School Revenue Bonds, Lee County Community Charter Schools, Series 2012A: | | | | | | | | | | | | | | | | |
| | 875 | | | 5.500%, 6/15/32 | | | 6/22 at 100.00 | | | | | | | | BB | | | | 942,218 | |
| | 1,375 | | | 5.750%, 6/15/42 | | | 6/22 at 100.00 | | | | | | | | BB | | | | 1,476,736 | |
| | | | | | |
| | 6,875 | | | Martin County Health Facilities Authority, Florida, Hospital Revenue Bonds, Martin Memorial Medical Center, Series 2015, 5.000%, 11/15/45 | | | 11/24 at 100.00 | | | | | | | | BBB+ | | | | 7,692,781 | |
| | | | | | |
| | | | Martin County Industrial Development Authority, Florida, Industrial Development Revenue Refunding Bonds, Indiantown Cogeneration LP, Series 2013: | | | | | | | | | | | | | | | | |
| | 885 | | | 3.950%, 12/15/21 (Alternative Minimum Tax) | | | 6/20 at 100.00 | | | | | | | | Ba1 | | | | 925,268 | |
| | 8,000 | | | 4.200%, 12/15/25 (Alternative Minimum Tax) | | | 6/20 at 100.00 | | | | | | | | Ba1 | | | | 8,220,960 | |
| | | | | | |
| | 2,000 | | | Miami Beach Health Facilities Authority, Florida, Hospital Revenue Bonds, Mount Sinai Medical Center of Florida Project, Refunding 2012, 5.000%, 11/15/29 | | | 11/22 at 100.00 | | | | | | | | Baa1 | | | | 2,283,900 | |
| | | | | | |
| | 6,340 | | | Miami Beach Redevelopment Agency, Florida, Tax Increment Revenue Bonds, City Center/Historic Convention Village, Series 2015A, 5.000%, 2/01/44 – AGM Insured | | | 2/24 at 100.00 | | | | | | | | AA | | | | 7,296,516 | |
| | | | | | |
| | 1,585 | | | Miami-Dade County, Florida, Aviation Revenue Bonds, Miami International Airport, Series 2010A-1, 5.375%, 10/01/35 | | | 10/20 at 100.00 | | | | | | | | A | | | | 1,826,808 | |
| | | | | | |
| | 12,195 | | | Miami-Dade County, Florida, Aviation Revenue Bonds, Refunding Series 2015A, 5.000%, 10/01/38 (Alternative Minimum Tax) | | | 10/25 at 100.00 | | | | | | | | A | | | | 13,989,494 | |
| | | | | | |
| | 2,000 | | | Miami-Dade County, Florida, Aviation Revenue Bonds, Series 2008A, 5.500%, 10/01/27 – AGC Insured (Alternative Minimum Tax) | | | 10/18 at 100.00 | | | | | | | | AA | | | | 2,203,040 | |
| | | | | | |
| | 1,040 | | | Miami-Dade County, Florida, Public Facilities Revenue Bonds, Jackson Health System, Series 2009, 5.625%, 6/01/34 – AGM Insured (UB) (6) | | | 6/19 at 100.00 | | | | | | | | AA | | | | 1,172,028 | |
| | | | | | |
| | 1,900 | | | Miami-Dade County, Florida, Transit System Sales Surtax Revenue Bonds, Refunding Series 2012, 4.000%, 7/01/16 | | | No Opt. Call | | | | | | | | AA | | | | 1,911,495 | |
| | | | | | |
| | 22,160 | | | Miami-Dade County, Florida, Water and Sewer System Revenue Bonds, Series 2013A, 5.000%, 10/01/42 | | | 10/22 at 100.00 | | | | | | | | Aa3 | | | | 25,584,163 | |
| | | | | | |
| | 1,000 | | | Northern Palm Beach County Improvement District, Florida, Water Control and Improvement Bonds, Development Unit 46B, Series 2007A, 5.350%, 8/01/41 | | | 8/17 at 100.00 | | | | | | | | N/R | | | | 1,014,530 | |
| | | | | | |
| | | | Orange County Health Facilities Authority, Florida, Revenue Bond, Mayflower Retirement Center, Refunding Series 2012: | | | | | | | | | | | | | | | | |
| | 550 | | | 4.500%, 6/01/27 | | | 6/21 at 100.00 | | | | | | | | A– | | | | 588,500 | |
| | 625 | | | 5.000%, 6/01/32 | | | 6/21 at 100.00 | | | | | | | | A– | | | | 679,113 | |
| | 750 | | | 5.000%, 6/01/36 | | | 6/21 at 100.00 | | | | | | | | A– | | | | 811,268 | |
| | 875 | | | 5.125%, 6/01/42 | | | 6/21 at 100.00 | | | | | | | | A– | | | | 951,571 | |
| | | | | | |
| | 145 | | | Orange County, Florida, Sales Tax Revenue Bonds, Series 1989, 6.125%, 1/01/19 – FGIC Insured (ETM) | | | 7/16 at 100.00 | | | | | | | | N/R (4) | | | | 161,526 | |
| | | | | | |
| | 2,725 | | | Palm Beach County Health Facilities Authority, Florida, Retirement Community Revenue Bonds, Adult Communities Total Services Retirement Life, Series 2006A, 4.500%, 11/15/36 | | | 11/16 at 100.00 | | | | | | | | A– | | | | 2,744,457 | |
| | | | | | |
| | 2,415 | | | Palm Beach County School Board, Florida, Certificates of Participation, Series 2007, 5.000%, 8/01/18 (Pre-refunded 8/01/17) – FGIC Insured | | | 8/17 at 100.00 | | | | | | | | AA– (4) | | | | 2,546,279 | |
Nuveen All-American Municipal Bond Fund (continued)
| | |
| Portfolio of Investments | | April 30, 2016 |
| | | | | | | | | | | | | | | | | | | | |
Principal
Amount (000) | | | Description (1) | | Optional Call
Provisions (2) | | | | | | | Ratings (3) | | | Value | |
| | | | | | |
| | | | Florida (continued) | | | | | | | | | | | | | |
| | | | | | |
| $ | 1,745 | | | Panther Trails Community Development District, Floridia, Special Assessment Bonds, Series 2005, 5.600%, 5/01/36 | | | No Opt. Call | | | | | | | | BBB– | | | $ | 1,755,522 | |
| | | | | | |
| | 1,795 | | | Port Saint Lucie. Florida, Special Assessment Revenue Bonds, Southwest Annexation District 1B, Series 2007, 5.000%, 7/01/33 – NPFG Insured | | | 7/17 at 100.00 | | | | | | | | AA– | | | | 1,878,988 | |
| | | | | | |
| | 1,010 | | | Riverbend West Community Development District, Florida, Special Assessment Bonds, Series 2016, 5.000%, 5/01/46 | | | 5/27 at 100.00 | | | | | | | | N/R | | | | 1,014,242 | |
| | | | | | |
| | 2,870 | | | Seminole Tribe of Florida, Special Obligation Bonds, Series 2007A, 144A, 5.250%, 10/01/27 | | | 10/17 at 100.00 | | | | | | | | BBB– | | | | 2,986,522 | |
| | | | | | |
| | 835 | | | Stoneybrook Venice Community Development District, Florida, Capital Improvement Revenue Bonds, Series 2007, 6.750%, 5/01/38 | | | 5/18 at 100.00 | | | | | | | | N/R | | | | 858,230 | |
| | | | | | |
| | 500 | | | Sumter County Industrial Development Authority, Florida, Hospital Revenue Bonds, Central Florida Health Alliance Projects, Series 2014A, 5.000%, 7/01/29 | | | 1/24 at 100.00 | | | | | | | | A– | | | | 576,010 | |
| | | | | | |
| | 535 | | | Sunrise, Florida, Utility System Revenue Refunding Bonds, Series 1998, 5.000%, 10/01/28 – AMBAC Insured | | | 10/18 at 100.00 | | | | | | | | AA– | | | | 584,702 | |
| | | | | | |
| | 35 | | | Tampa, Florida, Health System Revenue Bonds, Baycare Health System, Series 2012A, 5.000%, 11/15/33 | | | 5/22 at 100.00 | | | | | | | | Aa2 | | | | 40,513 | |
| | | | | | |
| | 165 | | | Tolomato Community Development District, Florida, Special Assessment Bonds, Convertible, Capital Appreciation, Series 2012A-2, 0.000%, 5/01/39 (5) | | | 5/17 at 100.00 | | | | | | | | N/R | | | | 132,543 | |
| | | | | | |
| | 290 | | | Tolomato Community Development District, Florida, Special Assessment Bonds, Convertible, Capital Appreciation, Series 2012A-3, 0.000%, 5/01/40 (5) | | | 5/19 at 100.00 | | | | | | | | N/R | | | | 174,238 | |
| | | | | | |
| | 210 | | | Tolomato Community Development District, Florida, Special Assessment Bonds, Convertible, Capital Appreciation, Series 2012A-4, 0.000%, 5/01/40 (5) | | | 5/22 at 100.00 | | | | | | | | N/R | | | | 93,545 | |
| | | | | | |
| | 170 | | | Tolomato Community Development District, Florida, Special Assessment Bonds, Hope Note, Series 2007-3, 6.650%, 5/01/40 (8) | | | 5/18 at 100.00 | | | | | | | | N/R | | | | 2 | |
| | | | | | |
| | 475 | | | Tolomato Community Development District, Florida, Special Assessment Bonds, Hope Note, Series 2007A-2, 5.250%, 5/01/39 (8) | | | 5/17 at 100.00 | | | | | | | | N/R | | | | 5 | |
| | | | | | |
| | 15 | | | Tolomato Community Development District, Florida, Special Assessment Bonds, Non Performing ParcelSeries 2007-1. RMKT, 6.650%, 5/01/40 (8) | | | 5/18 at 100.00 | | | | | | | | N/R | | | | 15,332 | |
| | | | | | |
| | 105 | | | Tolomato Community Development District, Florida, Special Assessment Bonds, Non Performing ParcelSeries 2007A-1. RMKT, 5.250%, 5/01/39 | | | 5/17 at 100.00 | | | | | | | | N/R | | | | 101,418 | |
| | | | | | |
| | | | Tolomato Community Development District, Florida, Special Assessment Bonds, Refunding Series 2012A-1: | | | | | | | | | | | | | | | | |
| | 90 | | | 5.250%, 5/01/39 | | | 5/17 at 100.00 | | | | | | | | N/R | | | | 90,403 | |
| | 305 | | | 6.650%, 5/01/40 | | | 5/17 at 100.00 | | | | | | | | N/R | | | | 308,611 | |
| | | | | | |
| | 435 | | | Tolomato Community Development District, Florida, Special Assessment Bonds, Refunding Series 2015-1, 0.000%, 5/01/40 (8) | | | 5/18 at 100.00 | | | | | | | | N/R | | | | 269,643 | |
| | | | | | |
| | 270 | | | Tolomato Community Development District, Florida, Special Assessment Bonds, Refunding Series 2015-2, 0.000%, 5/01/40 (8) | | | 5/18 at 100.00 | | | | | | | | N/R | | | | 141,661 | |
| | | | | | |
| | 290 | | | Tolomato Community Development District, Florida, Special Assessment Bonds, Refunding Series 2015-3, 6.610%, 5/01/40 (8) | | | 5/18 at 100.00 | | | | | | | | N/R | | | | 3 | |
| | | | | | |
| | 2,565 | | | Tolomato Community Development District, Florida, Special Assessment Bonds, Series 2006, 5.400%, 5/01/37 | | | No Opt. Call | | | | | | | | N/R | | | | 2,567,488 | |
| | | | | | |
| | 250 | | | Venetian Community Development District, Sarasota County, Florida, Capital Improvement Revenue Bonds, Series 2012-A1, 6.125%, 5/01/42 | | | 5/22 at 100.00 | | | | | | | | N/R | | | | 267,805 | |
| | | | | | |
| | 1,500 | | | Venetian Community Development District, Sarasota County, Florida, Capital Improvement Revenue Bonds, Series 2012-A2, 5.500%, 5/01/34 | | | 5/22 at 100.00 | | | | | | | | N/R | | | | 1,598,625 | |
| | | | | | | | | | | | | | | | | | | | |
Principal
Amount (000) | | | Description (1) | | Optional Call
Provisions (2) | | | | | | | Ratings (3) | | | Value | |
| | | | | | |
| | | | Florida (continued) | | | | | | | | | | | | | |
| | | | | | |
| $ | 13,000 | | | Volusia County Educational Facilities Authority, Florida, Revenue Bonds, Stetson University Inc. Project, Series 2015, 5.000%, 6/01/40 | | | 6/25 at 100.00 | | | | | | | | A– | | | $ | 14,744,730 | |
| | | | | | |
| | | | Wynnmere East Community Development District, Hillsborough County, Florida, Special Assessment Revenue Bonds, Series 2016: | | | | | | | | | | | | | | | | |
| | 500 | | | 5.125%, 5/01/36 | | | 5/28 at 100.00 | | | | | | | | N/R | | | | 504,240 | |
| | 1,000 | | | 5.500%, 5/01/46 | | | 5/28 at 100.00 | | | | | | | | N/R | | | | 1,010,510 | |
| | 181,775 | | | Total Florida | | | | | | | | | | | | | | | 197,500,913 | |
| | | | | | |
| | | | Georgia – 1.9% | | | | | | | | | | | | | |
| | | | | | |
| | 640 | | | Atlanta, Georgia, Tax Allocation Bonds, Beltline Project Series 2008A. Remarketed, 7.500%, 1/01/31 | | | 1/19 at 100.00 | | | | | | | | A2 | | | | 736,371 | |
| | | | | | |
| | 1,115 | | | Atlanta, Georgia, Tax Allocation Bonds, Beltline Project Series 2008B. Remarketed, 6.750%, 1/01/20 | | | 1/19 at 100.00 | | | | | | | | A2 | | | | 1,276,998 | |
| | | | | | |
| | 415 | | | Atlanta, Georgia, Tax Allocation Bonds, Eastside Project, Series 2005B, 5.400%, 1/01/20 | | | No Opt. Call | | | | | | | | A– | | | | 416,527 | |
| | | | | | |
| | 7,000 | | | Atlanta, Georgia, Water and Wastewater Revenue Bonds, Refunding Series 2009B, 5.375%, 11/01/39 – AGM Insured | | | 11/19 at 100.00 | | | | | | | | AA | | | | 7,906,220 | |
| | | | | | |
| | 10,000 | | | Fulton County Development Authority, Georgia, Revenue Bonds, Georgia Tech Athletic Association, Series 2011, 5.750%, 10/01/41 | | | 4/21 at 100.00 | | | | | | | | A+ | | | | 11,695,800 | |
| | | | | | |
| | 1,100 | | | Georgia Municipal Electric Authority, Senior Lien General Power Revenue Bonds, Series 1993BB, 5.250%, 1/01/25 – NPFG Insured | | | No Opt. Call | | | | | | | | AA– | | | | 1,319,835 | |
| | | | | | |
| | 1,000 | | | Lavonia Hospital Authority, Georgia, Revenue Anticpation Certificates, Ty Cobb Regional Medical Center, Series 2010, 6.000%, 12/01/40 – AGM Insured | | | 12/20 at 100.00 | | | | | | | | AA | | | | 1,140,580 | |
| | | | | | |
| | | | Main Street Natural Gas Inc., Georgia, Gas Project Revenue Bonds, Series 2007A: | | | | | | | | | | | | | | | | |
| | 960 | | | 5.000%, 3/15/22 | | | No Opt. Call | | | | | | | | A+ | | | | 1,116,048 | |
| | 1,000 | | | 5.500%, 9/15/28 | | | No Opt. Call | | | | | | | | A | | | | 1,275,940 | |
| | | | | | |
| | 22,045 | | | Metropolitan Atlanta Rapid Transit Authority, Georgia, Sales Tax Revenue Bonds, Third Indenture, Refunding Series 2015C, 5.000%, 7/01/27 | | | 7/26 at 100.00 | | | | | | | | AA+ | | | | 28,350,531 | |
| | | | | | |
| | 1,590 | | | Private Colleges and Universities Authority, Georgia, Revenue Bonds, Mercer University, Series 2012A, 5.250%, 10/01/27 | | | 10/21 at 100.00 | | | | | | | | Baa2 | | | | 1,845,163 | |
| | | | | | |
| | 1,000 | | | Savannah Economic Development Authority, Georgia, Revenue Bonds, Armstrong Atlantic State University, Windward Commons LLC Project, Series 2009, 5.000%, 6/15/39 (Pre-refunded 6/15/19) – AGC Insured | | | 6/19 at 100.00 | | | | | | | | AA (4) | | | | 1,128,370 | |
| | 47,865 | | | Total Georgia | | | | | | | | | | | | | | | 58,208,383 | |
| | | | | | |
| | | | Guam – 0.2% | | | | | | | | | | | | | |
| | | | | | |
| | 1,020 | | | Government of Guam, Business Privilege Tax Bonds, Series 2011A, 5.000%, 1/01/31 | | | 1/22 at 100.00 | | | | | | | | A | | | | 1,147,143 | |
| | | | | | |
| | 2,000 | | | Guam Government Department of Education, Certificates of Participation, John F. Kennedy High School Project, Series 2010A, 6.625%, 12/01/30 | | | 12/20 at 100.00 | | | | | | | | B+ | | | | 2,192,940 | |
| | | | | | |
| | 1,005 | | | Guam Government Waterworks Authority, Water and Wastewater System Revenue Bonds, Series 2010, 5.625%, 7/01/40 | | | 7/20 at 100.00 | | | | | | | | A– | | | | 1,123,580 | |
| | | | | | |
| | 1,610 | | | Guam International Airport Authority, Revenue Bonds, Series 2013C, 6.375%, 10/01/43 (Alternative Minimum Tax) | | | 10/23 at 100.00 | | | | | | | | BBB | | | | 1,896,725 | |
| | 5,635 | | | Total Guam | | | | | | | | | | | | | | | 6,360,388 | |
| | | | | | |
| | | | Hawaii – 0.9% | | | | | | | | | | | | | |
| | | | | | |
| | 1,500 | | | Hawaii Department of Budget and Finance, Special Purpose Revenue Bonds, Hawaii Pacific Health Obligated Group, Series 2013A, 5.500%, 7/01/43 | | | 7/23 at 100.00 | | | | | | | | A1 | | | | 1,779,120 | |
Nuveen All-American Municipal Bond Fund (continued)
| | |
| Portfolio of Investments | | April 30, 2016 |
| | | | | | | | | | | | | | | | | | | | |
Principal
Amount (000) | | | Description (1) | | Optional Call
Provisions (2) | | | | | | | Ratings (3) | | | Value | |
| | | | | | |
| | | | Hawaii (continued) | | | | | | | | | | | | | |
| | | | | | |
| $ | 1,000 | | | Hawaii Department of Budget and Finance, Special Purpose Revenue Bonds, Hawaii Pacific University, Series 2013A, 6.875%, 7/01/43 | | | 7/23 at 100.00 | | | | | | | | BB+ | | | $ | 1,139,360 | |
| | | | | | |
| | | | Hawaii Department of Budget and Finance, Special Purpose Senior Living Revenue Bonds, 15 Craigside Project, Series 2009A: | | | | | | | | | | | | | | | | |
| | 965 | | | 8.750%, 11/15/29 | | | 11/19 at 100.00 | | | | | | | | N/R | | | | 1,185,271 | |
| | 1,250 | | | 9.000%, 11/15/44 | | | 11/19 at 100.00 | | | | | | | | N/R | | | | 1,535,550 | |
| | | | | | |
| | 4,545 | | | Hawaii State, Airport System Revenue Bonds, Series 2015A, 5.000%, 7/01/45 (Alternative Minimum Tax) | | | 7/25 at 100.00 | | | | | | | | A+ | | | | 5,179,028 | |
| | | | | | |
| | | | Hawaii State, General Obligation Bonds, Series 2016FE: | | | | | | | | | | | | | | | | |
| | 6,220 | | | 5.000%, 10/01/23 | | | No Opt. Call | | | | | | | | AA | | | | 7,767,163 | |
| | 6,390 | | | 5.000%, 10/01/25 | | | No Opt. Call | | | | | | | | AA | | | | 8,215,431 | |
| | 21,870 | | | Total Hawaii | | | | | | | | | | | | | | | 26,800,923 | |
| | | | | | |
| | | | Idaho – 0.5% | | | | | | | | | | | | | |
| | | | | | |
| | 9,125 | | | Idaho Health Facilities Authority, Revenue Bonds, Saint Luke’s Health System Project, Series 2014A, 4.125%, 3/01/37 | | | 3/24 at 100.00 | | | | | | | | A– | | | | 9,573,311 | |
| | | | | | |
| | | | Idaho Health Facilities Authority, Revenue Bonds, Trinity Health Group, Refunding Series 2008B: | | | | | | | | | | | | | | | | |
| | 1,000 | | | 6.000%, 12/01/23 (Pre-refunded 12/01/18) | | | 12/18 at 100.00 | | | | | | | | AA– (4) | | | | 1,134,670 | |
| | 760 | | | 6.250%, 12/01/33 (Pre-refunded 12/01/18) | | | 12/18 at 100.00 | | | | | | | | AA– (4) | | | | 867,213 | |
| | | | | | |
| | | | Idaho Housing and Finance Association, Grant and Revenue Anticipation Bonds, Federal Highway Trust Funds, Series 2006: | | | | | | | | | | | | | | | | |
| | 1,000 | | | 5.000%, 7/15/23 (Pre-refunded 7/15/16) – NPFG Insured | | | 7/16 at 100.00 | | | | | | | | A+ (4) | | | | 1,009,560 | |
| | 1,065 | | | 5.000%, 7/15/24 (Pre-refunded 7/15/16) – NPFG Insured | | | 7/16 at 100.00 | | | | | | | | A+ (4) | | | | 1,075,181 | |
| | 12,950 | | | Total Idaho | | | | | | | | | | | | | | | 13,659,935 | |
| | | | | | |
| | | | Illinois – 11.4% | | | | | | | | | | | | | |
| | | | | | |
| | 2,000 | | | Bensenville, Illinois, General Obligation Bonds, Series 2011A, 5.000%, 12/15/30 – AGM Insured | | | 12/21 at 100.00 | | | | | | | | AA | | | | 2,219,960 | |
| | | | | | |
| | 971 | | | Cary, Illinois, Special Tax Bonds, Special Service Area 1, Series 2006, 5.000%, 3/01/30 – RAAI Insured | | | No Opt. Call | | | | | | | | AA | | | | 972,641 | |
| | | | | | |
| | | | Champaign, Illinois, General Obligation Sales Tax Bonds, Public Safety Series 1999: | | | | | | | | | | | | | | | | |
| | 1,140 | | | 8.250%, 1/01/21 – FGIC Insured | | | No Opt. Call | | | | | | | | AA– | | | | 1,484,132 | |
| | 1,275 | | | 8.250%, 1/01/22 – FGIC Insured | | | No Opt. Call | | | | | | | | AA– | | | | 1,708,360 | |
| | | | | | |
| | 25,900 | | | Chicago Board of Education, Illinois, General Obligation Bonds, Dedicated Revenues, Series 2016A, 7.000%, 12/01/44 | | | 12/25 at 100.00 | | | | | | | | B+ | | | | 24,614,065 | |
| | | | | | |
| | 10,000 | | | Chicago Greater Metropolitan Water Reclamation District, Illinois, General Obligation Bonds, Unlimited Tax Refunding Series 2006, 5.000%, 12/01/24 | | | 6/16 at 100.00 | | | | | | | | AAA | | | | 10,040,100 | |
| | | | | | |
| | 2,100 | | | Chicago Transit Authority, Illinois, Sales Tax Receipts Revenue Bonds, Series 2011, 5.250%, 12/01/40 | | | 12/21 at 100.00 | | | | | | | | AA | | | | 2,296,161 | |
| | | | | | |
| | 3,180 | | | Chicago, Illinois, General Airport Revenue Bonds, O’Hare International Airport, Senior Lien Series 2015C, 5.000%, 1/01/46 (Alternative Minimum Tax) | | | 1/25 at 100.00 | | | | | | | | A | | | | 3,549,103 | |
| | | | | | |
| | 13,760 | | | Chicago, Illinois, General Obligation Bonds, Project and Refunding Series 2005D, 5.500%, 1/01/40 | | | 1/25 at 100.00 | | | | | | | | BBB+ | | | | 13,710,051 | |
| | | | | | |
| | 7,545 | | | Chicago, Illinois, General Obligation Bonds, Refunding Series 2007E, 5.500%, 1/01/42 | | | 1/25 at 100.00 | | | | | | | | BBB+ | | | | 7,523,799 | |
| | | | | | |
| | 2,200 | | | Chicago, Illinois, General Obligation Bonds, Series 2015A, 5.500%, 1/01/39 | | | 1/25 at 100.00 | | | | | | | | BBB+ | | | | 2,194,170 | |
| | | | | | | | | | | | | | | | | | | | |
Principal
Amount (000) | | | Description (1) | | Optional Call
Provisions (2) | | | | | | | Ratings (3) | | | Value | |
| | | | | | |
| | | | Illinois (continued) | | | | | | | | | | | | | |
| | | | | | |
| | | | Community College District 523, Counties of DeKalb, Kane, LaSalle, Lee, Ogle, Winnebago, and Boone, Illinois, General Obligation Bonds, Kishwaukee Community College, Series 2011B: | | | | | | | | | | | | | | | | |
| $ | 1,000 | | | 0.000%, 2/01/35 | | | 2/21 at 100.00 | | | | | | | | AA | | | $ | 338,090 | |
| | 750 | | | 0.000%, 2/01/36 | | | 2/21 at 100.00 | | | | | | | | AA | | | | 235,463 | |
| | | | | | |
| | 4,440 | | | Cook County, Illinois, General Obligation Bonds, Refunding Series 2010A, 5.250%, 11/15/33 | | | 11/20 at 100.00 | | | | | | | | AA | | | | 4,792,802 | |
| | | | | | |
| | 2,000 | | | Cook County, Illinois, Recovery Zone Facility Revenue Bonds, Navistar International Corporation Project, Series 2010, 6.500%, 10/15/40 | | | 10/20 at 100.00 | | | | | | | | Caa1 | | | | 2,005,280 | |
| | | | | | |
| | 2,070 | | | Harvey, Cook County, Illinois, Tax Increment Allocation Revenue Bonds, Amended Center Street Redevelopment Project Area, Series 2010, 7.500%, 12/01/19 | | | No Opt. Call | | | | | | | | N/R | | | | 2,263,007 | |
| | | | | | |
| | 11,050 | | | Illinois Finance Authority, Charter School Revenue Bonds, Chicago Charter School Foundation, Series 2007, 5.000%, 12/01/36 | | | 12/16 at 100.00 | | | | | | | | BBB | | | | 11,146,025 | |
| | | | | | |
| | 1,000 | | | Illinois Finance Authority, Charter School Revenue Bonds, Uno Charter School Network, Refunding and Improvement Series 2011A, 7.125%, 10/01/41 | | | 10/21 at 100.00 | | | | | | | | BBB– | | | | 1,104,510 | |
| | | | | | |
| | 2,195 | | | Illinois Finance Authority, Revenue Bonds, Centegra Health System, Series 2014A, 5.000%, 9/01/34 | | | 9/24 at 100.00 | | | | | | | | BBB | | | | 2,469,243 | |
| | | | | | |
| | 1,255 | | | Illinois Finance Authority, Revenue Bonds, Central DuPage Health, Series 2009, 5.250%, 11/01/39 | | | 11/19 at 100.00 | | | | | | | | AA+ | | | | 1,396,024 | |
| | | | | | |
| | 850 | | | Illinois Finance Authority, Revenue Bonds, Christian Homes Inc. Obligated Group, Series 2007A, 5.750%, 5/15/31 | | | 5/17 at 100.00 | | | | | | | | BBB– | | | | 865,487 | |
| | | | | | |
| | 525 | | | Illinois Finance Authority, Revenue Bonds, Christian Homes Inc. Obligated Group, Series 2007A, 5.750%, 5/15/31 (Pre-refunded 5/15/17) | | | 5/17 at 100.00 | | | | | | | | N/R (4) | | | | 553,109 | |
| | | | | | |
| | 1,290 | | | Illinois Finance Authority, Revenue Bonds, Christian Homes Inc., Refunding Series 2010, 6.125%, 5/15/27 | | | 5/20 at 100.00 | | | | | | | | BBB– | | | | 1,441,549 | |
| | | | | | |
| | 710 | | | Illinois Finance Authority, Revenue Bonds, Christian Homes Inc., Refunding Series 2010, 6.125%, 5/15/27 (Pre-refunded 5/15/20) | | | 5/20 at 100.00 | | | | | | | | N/R (4) | | | | 853,101 | |
| | | | | | |
| | 1,000 | | | Illinois Finance Authority, Revenue Bonds, Edward Health Services Corporation, Series 2008A, 5.500%, 2/01/40 – AMBAC Insured | | | 2/18 at 100.00 | | | | | | | | A | | | | 1,061,840 | |
| | | | | | |
| | 4,050 | | | Illinois Finance Authority, Revenue Bonds, Illinois Institute of Technology, Series 2009, 7.125%, 2/01/34 | | | 2/19 at 100.00 | | | | | | | | Baa3 | | | | 4,294,904 | |
| | | | | | |
| | 3,895 | | | Illinois Finance Authority, Revenue Bonds, Ingalls Health System, Series 2013, 4.250%, 5/15/43 | | | 5/22 at 100.00 | | | | | | | | Baa1 | | | | 3,966,668 | |
| | | | | | |
| | 2,000 | | | Illinois Finance Authority, Revenue Bonds, Northwestern Memorial Hospital, Series 2009A, 5.375%, 8/15/24 | | | 8/19 at 100.00 | | | | | | | | AA+ | | | | 2,240,380 | |
| | | | | | |
| | 2,545 | | | Illinois Finance Authority, Revenue Bonds, OSF Healthcare System, Refunding Series 2010A, 6.000%, 5/15/39 | | | 5/20 at 100.00 | | | | | | | | A | | | | 2,943,954 | |
| | | | | | |
| | 500 | | | Illinois Finance Authority, Revenue Bonds, OSF Healthcare System, Series 2007A, 5.750%, 11/15/37 (Pre-refunded 11/15/17) | | | 11/17 at 100.00 | | | | | | | | A (4) | | | | 538,395 | |
| | | | | | |
| | 10,715 | | | Illinois Finance Authority, Revenue Bonds, OSF Healthcare System, Series 2015A, 5.000%, 11/15/45 | | | 11/25 at 100.00 | | | | | | | | A | | | | 12,276,176 | |
| | | | | | |
| | 1,545 | | | Illinois Finance Authority, Revenue Bonds, Palos Community Hospital, Series 2010C, 5.125%, 5/15/35 | | | 5/20 at 100.00 | | | | | | | | AA– | | | | 1,703,193 | |
| | | | | | |
| | 2,900 | | | Illinois Finance Authority, Revenue Bonds, Provena Health, Series 2009A, 7.750%, 8/15/34 | | | 8/19 at 100.00 | | | | | | | | Baa2 | | | | 3,463,296 | |
| | | | | | |
| | | | Illinois Finance Authority, Revenue Bonds, Rehabilitation Institute of Chicago, Series 2013A: | | | | | | | | | | | | | | | | |
| | 895 | | | 5.500%, 7/01/28 | | | 7/23 at 100.00 | | | | | | | | A– | | | | 1,056,100 | |
| | 3,000 | | | 6.500%, 7/01/34 | | | 7/18 at 100.00 | | | | | | | | A– | | | | 3,321,720 | |
| | | | | | |
| | 3,680 | | | Illinois Finance Authority, Revenue Bonds, Rush University Medical Center Obligated Group, Series 2009A, 7.250%, 11/01/30 (Pre-refunded 11/01/18) | | | 11/18 at 100.00 | | | | | | | | Aaa | | | | 4,272,112 | |
Nuveen All-American Municipal Bond Fund (continued)
| | |
| Portfolio of Investments | | April 30, 2016 |
| | | | | | | | | | | | | | | | | | | | |
Principal
Amount (000) | | | Description (1) | | Optional Call
Provisions (2) | | | | | | | Ratings (3) | | | Value | |
| | | | | | |
| | | | Illinois (continued) | | | | | | | | | | | | | |
| | | | | | |
| | | | Illinois Finance Authority, Revenue Bonds, Rush University Medical Center Obligated Group, Series 2009C: | | | | | | | | | | | | | | | | |
| $ | 1,335 | | | 6.625%, 11/01/39 (Pre-refunded 5/01/19) | | | 5/19 at 100.00 | | | | | | | | Aaa | | | $ | 1,565,114 | |
| | 1,665 | | | 6.625%, 11/01/39 (Pre-refunded 5/01/19) (UB) (6) | | | 5/19 at 100.00 | | | | | | | | Aaa | | | | 1,951,996 | |
| | | | | | |
| | 20 | | | Illinois Finance Authority, Revenue Bonds, Rush University Medical Center Obligated Group, Series 2015A, 4.000%, 11/15/39 | | | 5/25 at 100.00 | | | | | | | | A+ | | | | 21,063 | |
| | | | | | |
| | 6,255 | | | Illinois Finance Authority, Revenue Bonds, Sherman Health Systems, Series 2007A, 5.500%, 8/01/37 (Pre-refunded 8/01/17) | | | 8/17 at 100.00 | | | | | | | | N/R (4) | | | | 6,629,174 | |
| | | | | | |
| | 3,485 | | | Illinois Finance Authority, Revenue Bonds, Silver Cross Hospital and Medical Centers, Refunding Series 2008A, 5.500%, 8/15/30 | | | 8/18 at 100.00 | | | | | | | | BBB+ | | | | 3,701,732 | |
| | | | | | |
| | 1,105 | | | Illinois Finance Authority, Revenue Bonds, Silver Cross Hospital and Medical Centers, Refunding Series 2015C, 5.000%, 8/15/35 | | | 8/25 at 100.00 | | | | | | | | Baa1 | | | | 1,256,628 | |
| | | | | | |
| | 9,000 | | | Illinois Finance Authority, Revenue Bonds, Silver Cross Hospital and Medical Centers, Series 2009, 6.875%, 8/15/38 (Pre-refunded 8/15/19) | | | 8/19 at 100.00 | | | | | | | | N/R (4) | | | | 10,742,400 | |
| | | | | | |
| | 925 | | | Illinois Finance Authority, Revenue Bonds, Southern Illinois Healthcare Enterprises, Inc., Series 2005 Remarketed, 5.250%, 3/01/30 – AGM Insured | | | 3/20 at 100.00 | | | | | | | | AA | | | | 1,036,204 | |
| | | | | | |
| | 4,000 | | | Illinois Finance Authority, Revenue Bonds, The Carle Foundation, Series 2011A, 6.000%, 8/15/41 | | | 8/21 at 100.00 | | | | | | | | AA– | | | | 4,751,200 | |
| | | | | | |
| | 1,400 | | | Illinois Finance Authority, Revenue Bonds, The University of Chicago Medical Center, Series 2009B, 5.000%, 8/15/26 | | | 8/20 at 100.00 | | | | | | | | AA– | | | | 1,587,278 | |
| | | | | | |
| | 1,500 | | | Illinois Finance Authority, Revenue Bonds, The University of Chicago Medical Center, Series 2011C, 5.500%, 8/15/41 | | | 2/21 at 100.00 | | | | | | | | AA– | | | | 1,701,345 | |
| | | | | | |
| | 2,350 | | | Illinois Finance Authority, Revenue Bonds, Three Crowns Park Plaza, Series 2006A, 5.875%, 2/15/26 | | | No Opt. Call | | | | | | | | N/R | | | | 2,353,455 | |
| | | | | | |
| | 3,885 | | | Illinois Finance Authority, Student Housing Revenue Bonds, Educational Advancement Fund Inc., Refunding Series 2007A, 5.250%, 5/01/34 | | | 5/17 at 100.00 | | | | | | | | BBB+ | | | | 3,956,601 | |
| | | | | | |
| | 255 | | | Illinois Housing Development Authority, Housing Finance Bonds, Series 2006K, 4.600%, 7/01/23 | | | 7/16 at 100.00 | | | | | | | | AA | | | | 255,796 | |
| | | | | | |
| | 4,000 | | | Illinois Housing Development Authority, Multifamily Housing Revenue Bonds, GNMA Collateralized – Lifelink Developments, Series 2006, 4.850%, 4/20/41 (Alternative Minimum Tax) (UB) (6) | | | No Opt. Call | | | | | | | | AAA | | | | 4,003,800 | |
| | | | | | |
| | 7,335 | | | Illinois Sports Facility Authority, State Tax Supported Bonds, Refunding Series 2014, 5.250%, 6/15/31 – AGM Insured | | | 6/24 at 100.00 | | | | | | | | AA | | | | 8,386,472 | |
| | | | | | |
| | 10,000 | | | Illinois State, General Obligation Bonds, April Series 2014, 5.000%, 4/01/25 | | | 4/24 at 100.00 | | | | | | | | A– | | | | 11,245,100 | |
| | | | | | |
| | | | Illinois State, General Obligation Bonds, Series 2012A: | | | | | | | | | | | | | | | | |
| | 5,520 | | | 5.000%, 3/01/25 | | | 3/22 at 100.00 | | | | | | | | A– | | | | 6,044,731 | |
| | 5,910 | | | 5.000%, 3/01/26 | | | 3/22 at 100.00 | | | | | | | | A– | | | | 6,434,040 | |
| | 500 | | | 5.000%, 3/01/27 | | | 3/22 at 100.00 | | | | | | | | A– | | | | 540,335 | |
| | | | | | |
| | | | Illinois State, General Obligation Bonds, Series 2013: | | | | | | | | | | | | | | | | |
| | 1,440 | | | 5.250%, 7/01/28 | | | 7/23 at 100.00 | | | | | | | | A– | | | | 1,588,954 | |
| | 1,800 | | | 5.500%, 7/01/38 | | | 7/23 at 100.00 | | | | | | | | A– | | | | 1,969,146 | |
| | | | | | |
| | 5,000 | | | Illinois State, Sales Tax Revenue Bonds, Build Illinois Series 2011, 5.000%, 6/15/28 | | | 6/21 at 100.00 | | | | | | | | AAA | | | | 5,711,750 | |
| | | | | | |
| | 7,930 | | | Illinois Toll Highway Authority, Toll Highway Revenue Bonds, Senior Lien Series 2015B, 5.000%, 1/01/40 | | | 1/26 at 100.00 | | | | | | | | AA– | | | | 9,296,260 | |
| | | | | | |
| | 960 | | | Lombard Public Facilities Corporation, Illinois, First Tier Conference Center and Hotel Revenue Bonds, Series 2005A-1, 7.125%, 1/01/36 (9) | | | No Opt. Call | | | | | | | | N/R | | | | 431,914 | |
| | | | | | | | | | | | | | | | | | | | |
Principal
Amount (000) | | | Description (1) | | Optional Call
Provisions (2) | | | | | | | Ratings (3) | | | Value | |
| | | | | | |
| | | | Illinois (continued) | | | | | | | | | | | | | |
| | | | | | |
| $ | 3,000 | | | Lombard Public Facilities Corporation, Illinois, First Tier Conference Center and Hotel Revenue Bonds, Series 2005A-2, 5.500%, 1/01/30 – ACA Insured | | | No Opt. Call | | | | | | | | CC | | | $ | 2,610,630 | |
| | | | | | |
| | 1,630 | | | Lombard Public Facilities Corporation, Illinois, Second Tier Conference Center and Hotel Revenue Bonds, Series 2005B, 5.250%, 1/01/36 (10) | | | No Opt. Call | | | | | | | | D | | | | 501,078 | |
| | | | | | |
| | 875 | | | Metropolitan Pier and Exposition Authority, Illinois, McCormick Place Expansion Project Bonds, Refunding Series 2012A, 5.000%, 6/15/42 – NPFG Insured | | | 6/22 at 100.00 | | | | | | | | BBB+ | | | | 929,915 | |
| | | | | | |
| | 5,400 | | | Metropolitan Pier and Exposition Authority, Illinois, McCormick Place Expansion Project Bonds, Refunding Series 2015B, 5.000%, 6/15/52 | | | 12/25 at 100.00 | | | | | | | | BBB+ | | | | 5,904,198 | |
| | | | | | |
| | 1,225 | | | Metropolitan Pier and Exposition Authority, Illinois, McCormick Place Expansion Project Bonds, Series 2015A, 5.000%, 6/15/53 | | | 12/25 at 100.00 | | | | | | | | BBB+ | | | | 1,339,329 | |
| | | | | | |
| | 8,025 | | | Metropolitan Pier and Exposition Authority, Illinois, Revenue Bonds, McCormick Place Expansion Project, Refunding Series 1996A, 0.000%, 12/15/21 – NPFG Insured | | | No Opt. Call | | | | | | | | AA– | | | | 6,790,996 | |
| | | | | | |
| | 10,000 | | | Metropolitan Pier and Exposition Authority, Illinois, Revenue Bonds, McCormick Place Expansion Project, Series 2002A, 0.000%, 12/15/35 – AGM Insured | | | No Opt. Call | | | | | | | | AA | | | | 4,452,600 | |
| | | | | | |
| | 1,841 | | | Plano, Illinois, Special Tax Bonds, Special Service Area 1 & 2 Lakewood Springs Project, Refunding Series 2014, 5.000%, 3/01/34 – AGM Insured | | | 3/24 at 100.00 | | | | | | | | AA | | | | 2,071,788 | |
| | | | | | |
| | 845 | | | Quad Cities Regional Economic Development Authority, Illinois, Revenue Bonds, Augustana College, Series 2012, 4.750%, 10/01/29 | | | 10/22 at 100.00 | | | | | | | | Baa1 | | | | 914,856 | |
| | | | | | |
| | | | Railsplitter Tobacco Settlement Authority, Illinois, Tobacco Settlement Revenue Bonds, Series 2010: | | | | | | | | | | | | | | | | |
| | 3,890 | | | 5.250%, 6/01/21 | | | No Opt. Call | | | | | | | | A | | | | 4,582,926 | |
| | 3,000 | | | 6.250%, 6/01/24 | | | 6/16 at 100.00 | | | | | | | | A | | | | 3,015,330 | |
| | | | | | |
| | 4,450 | | | Regional Transportation Authority, Cook, DuPage, Kane, Lake, McHenry and Will Counties, Illinois, General Obligation Bonds, Series 2001A, 6.000%, 7/01/27 – FGIC Insured | | | No Opt. Call | | | | | | | | AA | | | | 5,811,789 | |
| | | | | | |
| | 15,000 | | | Regional Transportation Authority, Cook, DuPage, Kane, Lake, McHenry and Will Counties, Illinois, General Obligation Bonds, Series 2004A, 5.750%, 6/01/29 – AGM Insured | | | No Opt. Call | | | | | | | | AA | | | | 19,698,750 | |
| | | | | | |
| | | | Springfield, Illinois, Electric Revenue Bonds, Senior Lien Series 2015: | | | | | | | | | | | | | | | | |
| | 3,485 | | | 5.000%, 3/01/40 – AGM Insured | | | 3/25 at 100.00 | | | | | | | | AA | | | | 4,007,889 | |
| | 15,530 | | | 4.000%, 3/01/40 – AGM Insured | | | 3/25 at 100.00 | | | | | | | | AA | | | | 16,418,005 | |
| | | | | | |
| | 1,000 | | | Springfield, Sangamon County, Illinois, Special Service Area, Legacy Pointe Ad Valorem Tax Bonds, Series 2010, 7.500%, 3/01/32 | | | 3/17 at 102.00 | | | | | | | | N/R | | | | 1,033,700 | |
| | | | | | |
| | | | University of Illinois, Auxiliary Facilities System Revenue Bonds, Series 2013A: | | | | | | | | | | | | | | | | |
| | 10,000 | | | 4.000%, 4/01/30 | | | 4/23 at 100.00 | | | | | | | | AA– | | | | 10,820,600 | |
| | 5,000 | | | 4.000%, 4/01/32 | | | 4/23 at 100.00 | | | | | | | | AA– | | | | 5,326,450 | |
| | | | | | |
| | 7,405 | | | University of Illinois, Health Services Facilities System Revenue Bonds, Series 2013, 6.000%, 10/01/42 | | | 10/23 at 100.00 | | | | | | | | A | | | | 8,676,883 | |
| | 325,107 | | | Total Illinois | | | | | | | | | | | | | | | 342,985,170 | |
| | | | | | |
| | | | Indiana – 3.1% | | | | | | | | | | | | | |
| | | | | | |
| | 425 | | | Anderson, Indiana, Economic Development Revenue Bonds, Anderson University, Series 2007, 5.000%, 10/01/32 | | | No Opt. Call | | | | | | | | BB+ | | | | 413,385 | |
| | | | | | |
| | | | Delaware County Hospital Authority, Indiana, Hospital Revenue Bonds, Cardinal Health System, Series 2006: | | | | | | | | | | | | | | | | |
| | 1,000 | | | 5.125%, 8/01/29 (Pre-refunded 8/01/16) | | | 8/16 at 100.00 | | | | | | | | N/R (4) | | | | 1,011,890 | |
| | 500 | | | 5.250%, 8/01/36 (Pre-refunded 8/01/16) | | | 8/16 at 100.00 | | | | | | | | N/R (4) | | | | 506,105 | |
Nuveen All-American Municipal Bond Fund (continued)
| | |
| Portfolio of Investments | | April 30, 2016 |
| | | | | | | | | | | | | | | | | | | | |
Principal
Amount (000) | | | Description (1) | | Optional Call
Provisions (2) | | | | | | | Ratings (3) | | | Value | |
| | | | | | |
| | | | Indiana (continued) | | | | | | | | | | | | | |
| | | | | | |
| | | | Indiana Bond Bank, Special Program Gas Revenue Bonds, JP Morgan Ventures Energy Corporation Guaranteed, Series 2007A: | | | | | | | | | | | | | | | | |
| $ | 3,325 | | | 5.250%, 10/15/18 | | | No Opt. Call | | | | | | | | A | | | $ | 3,641,241 | |
| | 5,215 | | | 5.250%, 10/15/20 | | | No Opt. Call | | | | | | | | A | | | | 6,009,505 | |
| | | | | | |
| | | | Indiana Finance Authority, Educational Facilities Revenue Bonds, CFM-Northwest Indiana, LLC Project, Refunding Series 2013A: | | | | | | | | | | | | | | | | |
| | 3,420 | | | 7.000%, 7/01/33 | | | 7/23 at 100.00 | | | | | | | | B– | | | | 3,630,569 | |
| | 6,465 | | | 7.250%, 7/01/43 | | | 7/23 at 100.00 | | | | | | | | B– | | | | 6,890,332 | |
| | | | | | |
| | | | Indiana Finance Authority, Educational Facilities Revenue Bonds, Charter Facilities Management Indianapolis LLC Project, Series 2013A: | | | | | | | | | | | | | | | | |
| | 2,280 | | | 7.000%, 7/01/33 | | | 7/23 at 100.00 | | | | | | | | B– | | | | 2,420,380 | |
| | 5,240 | | | 7.250%, 7/01/43 | | | 7/23 at 100.00 | | | | | | | | B– | | | | 5,584,740 | |
| | | | | | |
| | 1,400 | | | Indiana Finance Authority, Educational Facilities Revenue Bonds, Drexel Foundation For Educational Excellence, Inc., Series 2009A, 6.625%, 10/01/29 | | | 10/19 at 100.00 | | | | | | | | B– | | | | 1,366,554 | |
| | | | | | |
| | 1,000 | | | Indiana Finance Authority, Hospital Revenue Bonds, Floyd Memorial Hospital and Health Services Project, Refunding Series 2010, 5.125%, 3/01/30 | | | 3/20 at 100.00 | | | | | | | | BBB– | | | | 1,060,990 | |
| | | | | | |
| | 3,000 | | | Indiana Finance Authority, Hospital Revenue Bonds, Marion General Hospital Project, Series 2012A, 5.000%, 7/01/36 | | | 7/21 at 100.00 | | | | | | | | A+ | | | | 3,364,770 | |
| | | | | | |
| | 9,000 | | | Indiana Finance Authority, Midwestern Disaster Relief Revenue Bonds, Ohio Valley Electric Corporation Project, Series 2012A, 5.000%, 6/01/32 – AGM Insured | | | 6/22 at 100.00 | | | | | | | | BBB– | | | | 9,657,180 | |
| | | | | | |
| | 9,215 | | | Indiana Finance Authority, Private Activity Bonds, Ohio River Bridges East End Crossing Project, Series 2013A, 5.000%, 7/01/48 (Alternative Minimum Tax) | | | 7/23 at 100.00 | | | | | | | | BBB+ | | | | 9,993,299 | |
| | | | | | |
| | 1,370 | | | Indiana Health Facility Financing Authority, Revenue Bonds, Community Foundation of Northwest Indiana, Series 2007, 5.500%, 3/01/37 | | | 3/17 at 100.00 | | | | | | | | A+ | | | | 1,412,566 | |
| | | | | | |
| | 1,460 | | | Indiana Health Facility Financing Authority, Revenue Bonds, Community Foundation of Northwest Indiana, Series 2007, 5.500%, 3/01/37 (Pre-refunded 3/01/17) | | | 3/17 at 100.00 | | | | | | | | N/R (4) | | | | 1,519,831 | |
| | | | | | |
| | 4,130 | | | Indiana Municipal Power Agency, Power Supply Revenue Bonds, Series 2007A, 5.000%, 1/01/42 (Pre-refunded 1/01/17) – NPFG Insured | | | 1/17 at 100.00 | | | | | | | | AA– (4) | | | | 4,251,835 | |
| | | | | | |
| | 175 | | | Indiana Transportation Finance Authority, Highway Revenue Bonds, Series 1992A, 6.800%, 12/01/16 | | | No Opt. Call | | | | | | | | AA+ | | | | 180,695 | |
| | | | | | |
| | 3,500 | | | Indianapolis Local Public Improvement Bond Bank, Indiana, Waterworks Project Series 2009A, 5.500%, 1/01/38 – AGC Insured | | | 1/19 at 100.00 | | | | | | | | AA | | | | 3,931,025 | |
| | | | | | |
| | 3,000 | | | Jasper County, Indiana Pollution Control (Northern Indiana Public Service) Commercial Paper, 5.600%, 11/01/16 – NPFG Insured | | | No Opt. Call | | | | | | | | AA– | | | | 3,067,140 | |
| | | | | | |
| | | | Knox County, Indiana, Economic Development Revenue and Refunding Bonds, Good Samaritan Hospital Project, Series 2012A: | | | | | | | | | | | | | | | | |
| | 1,530 | | | 5.000%, 4/01/26 | | | 4/22 at 100.00 | | | | | | | | Baa2 | | | | 1,681,378 | |
| | 1,400 | | | 5.000%, 4/01/27 | | | 4/22 at 100.00 | | | | | | | | Baa2 | | | | 1,532,776 | |
| | 1,560 | | | 5.000%, 4/01/29 | | | 4/22 at 100.00 | | | | | | �� | | Baa2 | | | | 1,695,876 | |
| | | | | | |
| | | | Portage, Indiana, Economic Development Revenue Bonds, Ameriplex Project, Series 2006: | | | | | | | | | | | | | | | | |
| | 1,000 | | | 5.000%, 7/15/23 (Pre-refunded 7/15/16) | | | 7/16 at 100.00 | | | | | | | | A (4) | | | | 1,009,580 | |
| | 775 | | | 5.000%, 1/15/27 (Pre-refunded 7/15/16) | | | 7/16 at 100.00 | | | | | | | | A (4) | | | | 782,425 | |
| | | | | | |
| | | | Valparaiso, Indiana, Exempt Facilities Revenue Bonds, Pratt Paper LLC Project, Series 2013: | | | | | | | | | | | | | | | | |
| | 500 | | | 5.875%, 1/01/24 (Alternative Minimum Tax) | | | No Opt. Call | | | | | | | | N/R | | | | 583,660 | |
| | 9,185 | | | 7.000%, 1/01/44 (Alternative Minimum Tax) | | | 1/24 at 100.00 | | | | | | | | N/R | | | | 11,365,978 | |
| | | | | | | | | | | | | | | | | | | | |
Principal
Amount (000) | | | Description (1) | | Optional Call
Provisions (2) | | | | | | | Ratings (3) | | | Value | |
| | | | | | |
| | | | Indiana (continued) | | | | | | | | | | | | | |
| | | | | | |
| $ | 5,000 | | | Vigo County Hospital Authority, Indiana, Hospital Revenue Bonds, Union Hospital, Inc., Series 2011, 8.000%, 9/01/41 | | | 9/21 at 100.00 | | | | | | | | N/R | | | $ | 5,987,050 | |
| | 86,070 | | | Total Indiana | | | | | | | | | | | | | | | 94,552,755 | |
| | | | | | |
| | | | Iowa – 0.5% | | | | | | | | | | | | | |
| | | | | | |
| | 2,275 | | | Ames, Iowa, Hospital Revenue Bonds, Mary Greeley Medical Center, Series 2011, 5.250%, 6/15/36 | | | 6/20 at 100.00 | | | | | | | | A2 | | | | 2,531,620 | |
| | | | | | |
| | 500 | | | Iowa Finance Authority, Health Facilities Revenue Bonds, Iowa Health System, Series 2008A, 5.250%, 8/15/29 – AGC Insured | | | 8/19 at 100.00 | | | | | | | | Aa3 | | | | 557,820 | |
| | | | | | |
| | 1,490 | | | Iowa Finance Authority, Health Facility Revenue Bonds, Care Initiatives Project, Series 2006A, 5.500%, 7/01/25 | | | 7/16 at 100.00 | | | | | | | | BB+ | | | | 1,496,794 | |
| | | | | | |
| | | | Iowa Higher Education Loan Authority, Private College Facility Revenue Bonds, Drake University Project, Refunding Series 2016: | | | | | | | | | | | | | | | | |
| | 1,670 | | | 3.000%, 4/01/34 | | | 4/26 at 100.00 | | | | | | | | A– | | | | 1,684,228 | |
| | 2,500 | | | 3.125%, 4/01/38 | | | 4/26 at 100.00 | | | | | | | | A– | | | | 2,498,300 | |
| | | | | | |
| | 1,000 | | | Iowa Student Loan Liquidity Corporation, Student Loan Revenue Bonds, Refunding Series 2009-2, 5.500%, 12/01/25 | | | 12/19 at 100.00 | | | | | | | | A1 | | | | 1,106,780 | |
| | | | | | |
| | 3,355 | | | Iowa Student Loan Liquidity Corporation, Student Loan Revenue Bonds, Senior Lien Series 2011A-2, 5.750%, 12/01/28 (Alternative Minimum Tax) | | | 12/19 at 102.00 | | | | | | | | A | | | | 3,597,835 | |
| | | | | | |
| | 2,045 | | | Iowa Tobacco Settlement Authority, Asset Backed Settlement Revenue Bonds, Series 2005C, 5.625%, 6/01/46 | | | No Opt. Call | | | | | | | | B+ | | | | 2,044,857 | |
| | 14,835 | | | Total Iowa | | | | | | | | | | | | | | | 15,518,234 | |
| | | | | | |
| | | | Kansas – 0.4% | | | | | | | | | | | | | |
| | | | | | |
| | 500 | | | Kansas Department of Transportation, Highway Revenue Bonds, Series 2004B, 5.000%, 9/01/22 (Pre-refunded 9/01/18) | | | 9/18 at 100.00 | | | | | | | | AAA | | | | 549,435 | |
| | | | | | |
| | 4,540 | | | Kansas Development Finance Authority, Hospital Revenue Bonds, Adventist Health System/Sunbelt Obligated Group, Series 2009C, 5.500%, 11/15/29 | | | 11/19 at 100.00 | | | | | | | | Aa2 | | | | 5,214,599 | |
| | | | | | |
| | 2,000 | | | Olathe, Kansas, Senior Living Facility Revenue Bonds, Catholic Care Campus Santa Marta, Series 2006A, 6.000%, 11/15/38 | | | 11/16 at 100.00 | | | | | | | | N/R | | | | 2,011,440 | |
| | | | | | |
| | 2,120 | | | Overland Park Development Corporation, Kansas, Second Tier Revenue Bonds, Overland Park Convention Center, Series 2007B, 5.125%, 1/01/22 – AMBAC Insured | | | 1/17 at 100.00 | | | | | | | | BB+ | | | | 2,135,603 | |
| | | | | | |
| | 1,110 | | | Overland Park Transportation Development District, Kansas, Sales Tax Revenue Bonds, Oak Park Mall Project, Series 2010, 5.900%, 4/01/32 | | | 4/20 at 100.00 | | | | | | | | BBB | | | | 1,211,487 | |
| | 10,270 | | | Total Kansas | | | | | | | | | | | | | | | 11,122,564 | |
| | | | | | |
| | | | Kentucky – 1.0% | | | | | | | | | | | | | |
| | | | | | |
| | | | Kentucky Economic Development Finance Authority, Hospital Facilities Revenue Bonds, Owensboro Medical Health System, Series 2010A: | | | | | | | | | | | | | | | | |
| | 2,500 | | | 5.750%, 6/01/25 | | | 6/20 at 100.00 | | | | | | | | BBB+ | | | | 2,883,925 | |
| | 2,480 | | | 6.000%, 6/01/30 | | | 6/20 at 100.00 | | | | | | | | BBB+ | | | | 2,843,915 | |
| | | | | | |
| | 1,500 | | | Kentucky Economic Development Finance Authority, Hospital Revenue Bonds, Baptist Healthcare System Obligated Group, Series 2009A, 5.375%, 8/15/24 | | | 8/19 at 100.00 | | | | | | | | A+ | | | | 1,633,560 | |
| | | | | | |
| | 5,655 | | | Kentucky Economic Development Finance Authority, Revenue Bonds, Next Generation Kentucky Information Highway Project, Senior Series 2015A, 5.000%, 7/01/37 | | | 7/25 at 100.00 | | | | | | | | BBB+ | | | | 6,379,632 | |
Nuveen All-American Municipal Bond Fund (continued)
| | |
| Portfolio of Investments | | April 30, 2016 |
| | | | | | | | | | | | | | | | | | | | |
Principal
Amount (000) | | | Description (1) | | Optional Call
Provisions (2) | | | | | | | Ratings (3) | | | Value | |
| | | | | | |
| | | | Kentucky (continued) | | | | | | | | | | | | | |
| | | | | | |
| | | | Louisville Regional Airport Authority, Kentucky, Airport System Revenue Bonds, Refunding Series 2014A: | | | | | | | | | | | | | | | | |
| $ | 2,685 | | | 4.000%, 7/01/18 (Alternative Minimum Tax) | | | No Opt. Call | | | | | | | | A+ | | | $ | 2,855,847 | |
| | 2,750 | | | 5.000%, 7/01/19 (Alternative Minimum Tax) | | | No Opt. Call | | | | | | | | A+ | | | | 3,076,095 | |
| | | | | | |
| | 1,405 | | | Louisville-Jefferson County Metropolitan Government, Kentucky, Health Facilities Revenue Bonds, Jewish Hospital & Saint Mary’s HealthCare Inc. Project, Series 2008, 6.125%, 2/01/37 (Pre-refunded 2/01/18) | | | 2/18 at 100.00 | | | | | | | | Aaa | | | | 1,538,208 | |
| | | | | | |
| | 1,600 | | | Paducah, Kentucky, Electric Plant Board Revenue Bonds, Series 2009A, 5.250%, 10/01/35 – AGC Insured | | | 4/19 at 100.00 | | | | | | | | A3 | | | | 1,758,496 | |
| | | | | | |
| | 5,000 | | | Pikeville, Kentucky, Hospital Revenue Bonds, Pikeville Medical Center, Inc. Project, Improvement and Refunding Series 2011, 6.500%, 3/01/41 | | | 3/21 at 100.00 | | | | | | | | A3 | | | | 5,832,750 | |
| | 25,575 | | | Total Kentucky | | | | | | | | | | | | | | | 28,802,428 | |
| | | | | | |
| | | | Louisiana – 2.2% | | | | | | | | | | | | | |
| | | | | | |
| | 1,250 | | | Lake Charles Harbor and Terminal District, Louisiana, Revenue Bonds, Series 2013B, 5.500%, 1/01/24 – AGM Insured (Alternative Minimum Tax) | | | No Opt. Call | | | | | | | | AA | | | | 1,520,988 | |
| | | | | | |
| | 3,605 | | | Louisiana Citizens Property Insurance Corporation, Assessment Revenue Bonds, Series 2006B, 5.000%, 6/01/21 (Pre-refunded 6/01/16) – AMBAC Insured | | | 6/16 at 100.00 | | | | | | | | A1 (4) | | | | 3,619,708 | |
| | | | | | |
| | 1,000 | | | Louisiana Local Government Environmental Facilities & Community Development Authority, Revenue Bonds, Westlake Chemical Corporation Project, Series 2007, 6.750%, 11/01/32 | | | 11/17 at 100.00 | | | | | | | | BBB+ | | | | 1,084,130 | |
| | | | | | |
| | | | Louisiana Local Government Environmental Facilities and Community Development Authority, Revenue Bonds, Southgate Suites Retail Project, Series 2007A: | | | | | | | | | | | | | | | | |
| | 5,000 | | | 6.750%, 12/15/37 (8) | | | 12/17 at 100.00 | | | | | | | | N/R | | | | 3,214,550 | |
| | 800 | | | 6.000%, 12/15/37 (8) | | | 12/37 at 100.00 | | | | | | | | N/R | | | | 439,200 | |
| | | | | | |
| | 65 | | | Louisiana Local Government Environmental Facilities and Community Development Authority, Revenue Bonds, Southgate Suites Retail Project, Series 2007B, 9.000%, 12/15/14 | | | No Opt. Call | | | | | | | | N/R | | | | 35,686 | |
| | | | | | |
| | 27,900 | | | Louisiana Public Facilities Authority, Dock and Wharf Revenue Bonds, Impala Warehousing (US) LLC Project, Series 2013, 6.500%, 7/01/36 (Alternative Minimum Tax) | | | 7/23 at 100.00 | | | | | | | | N/R | | | | 31,433,535 | |
| | | | | | |
| | 2,900 | | | Louisiana Public Facilities Authority, Hospital Revenue and Refunding Bonds, Lafayette General Medical Center Project, Series 2016A, 4.000%, 11/01/45 | | | 11/25 at 100.00 | | | | | | | | A– | | | | 2,979,721 | |
| | | | | | |
| | 4,500 | | | Louisiana Public Facilities Authority, Hospital Revenue Bonds, Franciscan Missionaries of Our Lady Health System, Refunding Series 2015A, 4.000%, 7/01/39 | | | 7/25 at 100.00 | | | | | | | | A+ | | | | 4,749,210 | |
| | | | | | |
| | 1,000 | | | Louisiana Public Facilities Authority, Revenue Bonds, Belle Chasse Educational Foundation Project, Series 2011, 6.750%, 5/01/41 | | | 5/21 at 100.00 | | | | | | | | BBB | | | | 1,148,780 | |
| | | | | | |
| | 2,000 | | | Louisiana Public Facilities Authority, Revenue Bonds, Christus Health, Refunding Series 2009A, 6.000%, 7/01/29 | | | 7/19 at 100.00 | | | | | | | | A+ | | | | 2,286,460 | |
| | | | | | |
| | 675 | | | Louisiana Public Facilities Authority, Revenue Bonds, Christus Health, Series 2008B, 5.750%, 7/01/18 – AGC Insured | | | No Opt. Call | | | | | | | | AA | | | | 707,272 | |
| | | | | | |
| | 1,085 | | | Louisiana Public Facilities Authority, Revenue Bonds, Ochsner Clinic Foundation Project, Series 2007A, 5.250%, 5/15/38 | | | 5/17 at 100.00 | | | | | | | | A– | | | | 1,124,353 | |
| | | | | | |
| | 415 | | | Louisiana Public Facilities Authority, Revenue Bonds, Ochsner Clinic Foundation Project, Series 2007A, 5.250%, 5/15/38 (Pre-refunded 5/15/17) | | | 5/17 at 100.00 | | | | | | | | N/R (4) | | | | 435,152 | |
| | | | | | |
| | 2,030 | | | Louisiana Public Facilities Authority, Revenue Bonds, Ochsner Clinic Foundation Project, Series 2015, 5.000%, 5/15/47 | | | 5/25 at 100.00 | | | | | | | | A– | | | | 2,263,267 | |
| | | | | | |
| | 1,050 | | | New Orleans, Louisiana, Sewerage Service Revenue Bonds, Refunding Series 2014, 5.000%, 6/01/44 | | | 6/24 at 100.00 | | | | | | | | A | | | | 1,196,570 | |
| | | | | | | | | | | | | | | | | | | | |
Principal
Amount (000) | | | Description (1) | | Optional Call
Provisions (2) | | | | | | | Ratings (3) | | | Value | |
| | | | | | |
| | | | Louisiana (continued) | | | | | | | | | | | | | |
| | | | | | |
| $ | 8,380 | | | St John Baptist Parish, Louisiana, Revenue Bonds, Marathon Oil Corporation, Series 2007A, 5.125%, 6/01/37 | | | 6/17 at 100.00 | | | | | | | | BBB | | | $ | 8,599,137 | |
| | 63,655 | | | Total Louisiana | | | | | | | | | | | | | | | 66,837,719 | |
| | | | | | |
| | | | Maine – 0.6% | | | | | | | | | | | | | |
| | | | | | |
| | | | Maine Health and Higher Educational Facilities Authority, Revenue Bonds, Maine General Medical Center, Series 2011: | | | | | | | | | | | | | | | | |
| | 2,000 | | | 6.750%, 7/01/36 | | | 7/21 at 100.00 | | | | | | | | BBB– | | | | 2,281,600 | |
| | 10,390 | | | 6.750%, 7/01/41 | | | 7/21 at 100.00 | | | | | | | | BBB– | | | | 11,837,223 | |
| | | | | | |
| | 1,665 | | | Maine Health and Higher Educational Facilities Authority, Revenue Bonds, Series 2010A, 5.000%, 7/01/40 | | | 7/20 at 100.00 | | | | | | | | AA | | | | 1,874,990 | |
| | | | | | |
| | | | Portland, Maine, General Airport Revenue Bonds, Refunding Series 2013: | | | | | | | | | | | | | | | | |
| | 460 | | | 5.000%, 7/01/26 | | | 7/23 at 100.00 | | | | | | | | BBB+ | | | | 528,393 | |
| | 1,000 | | | 5.000%, 7/01/27 | | | 7/23 at 100.00 | | | | | | | | BBB+ | | | | 1,139,250 | |
| | 15,515 | | | Total Maine | | | | | | | | | | | | | | | 17,661,456 | |
| | | | | | |
| | | | Maryland – 1.2% | | | | | | | | | | | | | |
| | | | | | |
| | 1,000 | | | Baltimore County, Maryland, General Obligation Bonds, Refunding Metropolitan District Series 2009, 5.000%, 8/01/16 | | | No Opt. Call | | | | | | | | AAA | | | | 1,011,720 | |
| | | | | | |
| | | | Baltimore, Maryland, Senior Lien Convention Center Hotel Revenue Bonds, Series 2006A: | | | | | | | | | | | | | | | | |
| | 1,050 | | | 5.250%, 9/01/27 – SYNCORA GTY Insured | | | 9/16 at 100.00 | | | | | | | | Ba1 | | | | 1,061,708 | |
| | 1,750 | | | 5.250%, 9/01/28 – SYNCORA GTY Insured | | | 9/16 at 100.00 | | | | | | | | Ba1 | | | | 1,769,513 | |
| | | | | | |
| | 1,000 | | | Harford County, Maryland, General Obligation Bonds, Consolidated Public Improvement Series 2009, 5.000%, 7/01/17 | | | No Opt. Call | | | | | | | | AAA | | | | 1,051,920 | |
| | | | | | |
| | 9,445 | | | Maryland Department of Transportation, Consolidated Transportation Revenue Bonds, Second Issue Series 2015, 5.000%, 6/01/22 | | | No Opt. Call | | | | | | | | AAA | | | | 11,587,409 | |
| | | | | | |
| | 14,350 | | | Maryland Health and Higher Educational Facilities Authority, Revenue Bonds, MedStar Health Issue, Series 2015, 5.000%, 8/15/42 (UB) (6) | | | 2/25 at 100.00 | | | | | | | | A2 | | | | 16,547,416 | |
| | | | | | |
| | 1,465 | | | Maryland Health and Higher Educational Facilities Authority, Revenue Bonds, Mercy Medical Center, Series 2016A, 4.000%, 7/01/42 | | | 7/26 at 100.00 | | | | | | | | BBB | | | | 1,516,378 | |
| | | | | | |
| | 1,000 | | | Maryland Health and Higher Educational Facilities Authority, Revenue Bonds, Patterson Park Public Charter School Issue, Series 2010, 5.750%, 7/01/30 | | | 7/20 at 100.00 | | | | | | | | BBB– | | | | 1,058,310 | |
| | 31,060 | | | Total Maryland | | | | | | | | | | | | | | | 35,604,374 | |
| | | | | | |
| | | | Massachusetts – 1.1% | | | | | | | | | | | | | |
| | | | | | |
| | 4,350 | | | Massachusetts Development Finance Agency, Health Care Facility Revenue Bonds, Adventcare Project, Series 2007A, 6.750%, 10/15/37 | | | 10/17 at 100.00 | | | | | | | | N/R | | | | 4,498,944 | |
| | | | | | |
| | 8,350 | | | Massachusetts Development Finance Agency, Resource Recovery Revenue Refunding Bonds, Covanta Energy Project, Series 2012C, 5.250%, 11/01/42 (Alternative Minimum Tax) | | | 11/17 at 100.00 | | | | | | | | BB+ | | | | 8,395,591 | |
| | | | | | |
| | 1,035 | | | Massachusetts Development Finance Agency, Revenue Bonds, Loomis Communities, Series 2013A, 4.875%, 1/01/24 | | | 1/23 at 100.00 | | | | | | | | BBB– | | | | 1,172,583 | |
| | | | | | |
| | 485 | | | Massachusetts Educational Financing Authority, Student Loan Revenue Bonds, Issue I Series 2010B, 5.500%, 1/01/23 (Alternative Minimum Tax) | | | 1/20 at 100.00 | | | | | | | | AA | | | | 525,789 | |
| | | | | | |
| | 6,665 | | | Massachusetts Health and Education Facilities Authority, Revenue Bonds, Partners HealthCare System, Tender Option Trust 2015-XF0047, 12.853%, 7/01/29 (IF) | | | 7/19 at 100.00 | | | | | | | | AA– | | | | 9,072,798 | |
| | | | | | |
| | 4,700 | | | Massachusetts Health and Educational Facilities Authority Revenue Bonds, Quincy Medical Center Issue, Series 2008A, 6.250%, 1/15/28 (8) | | | 1/18 at 100.00 | | | | | | | | N/R | | | | 11,468 | |
Nuveen All-American Municipal Bond Fund (continued)
| | |
| Portfolio of Investments | | April 30, 2016 |
| | | | | | | | | | | | | | | | | | | | |
Principal
Amount (000) | | | Description (1) | | Optional Call
Provisions (2) | | | | | | | Ratings (3) | | | Value | |
| | | | | | |
| | | | Massachusetts (continued) | | | | | | | | | | | | | |
| | | | | | |
| $ | 4,550 | | | Massachusetts Health and Educational Facilities Authority, Revenue Refunding Bonds, Suffolk University Issue, Series 2009A, 5.750%, 7/01/39 | | | 7/19 at 100.00 | | | | | | | | BBB | | | $ | 5,085,990 | |
| | | | | | |
| | | | Massachusetts Port Authority, Special Facilities Revenue Bonds, Delta Air Lines Inc., Series 2001A: | | | | | | | | | | | | | | | | |
| | 1,260 | | | 5.500%, 1/01/22 – AMBAC Insured (Alternative Minimum Tax) | | | No Opt. Call | | | | | | | | N/R | | | | 1,264,637 | |
| | 700 | | | 5.000%, 1/01/27 – AMBAC Insured (Alternative Minimum Tax) | | | 7/16 at 100.00 | | | | | | | | N/R | | | | 702,744 | |
| | | | | | |
| | 2,335 | | | Massachusetts Water Pollution Abatement Trust, Pooled Loan Program Bonds, Tender Option Bond Trust 2015-XF2181, 12.809%, 8/01/38 (IF) | | | 8/19 at 100.00 | | | | | | | | AAA | | | | 3,232,784 | |
| | 34,430 | | | Total Massachusetts | | | | | | | | | | | | | | | 33,963,328 | |
| | | | | | |
| | | | Michigan – 1.4% | | | | | | | | | | | | | |
| | | | | | |
| | 12,130 | | | Bay City, Bay County, Michigan, Unlimited Tax General Street Improvement Bonds, Series 1991, 0.000%, 6/01/21 – AMBAC Insured | | | No Opt. Call | | | | | | | | A+ | | | | 9,648,809 | |
| | | | | | |
| | 800 | | | Jackson County Hospital Finance Authority, Michigan, Hospital Revenue Bonds, W.A. Foote Memorial Hospital, Refunding Series 2006B-2, 5.000%, 6/01/27 – AGM Insured | | | 6/20 at 100.00 | | | | | | | | AA | | | | 900,840 | |
| | | | | | |
| | 7,665 | | | Kalamazoo Hospital Finance Authority, Michigan, Hospital Revenue Bonds, Bronson Methodist Hospital, Refunding Series 2003A, 5.000%, 5/15/26 – AGM Insured | | | 5/18 at 100.00 | | | | | | | | AA | | | | 8,255,205 | |
| | | | | | |
| | 1,065 | | | Kalkaska County Hospital Authority, Michigan, Hospital Revenue Bonds, Series 2007, 5.375%, 5/01/17 | | | No Opt. Call | | | | | | | | A– | | | | 1,102,073 | |
| | | | | | |
| | 620 | | | Michigan Finance Authority, Public School Academy Limited Obligation Revenue Bonds, Creative Montessori Academy Project, Series 2011, 6.125%, 5/01/21 | | | 5/18 at 100.00 | | | | | | | | BBB– | | | | 641,154 | |
| | | | | | |
| | | | Michigan Finance Authority, Public School Academy Revenue Bonds, Detroit Service Learning Academy Project, Refunding Series 2011: | | | | | | | | | | | | | | | | |
| | 545 | | | 6.000%, 10/01/21 | | | No Opt. Call | | | | | | | | BB– | | | | 550,074 | |
| | 500 | | | 7.000%, 10/01/31 | | | 10/21 at 100.00 | | | | | | | | BB– | | | | 510,180 | |
| | 1,000 | | | 7.000%, 10/01/36 | | | 10/21 at 100.00 | | | | | | | | BB– | | | | 1,015,360 | |
| | | | | | |
| | 1,550 | | | Michigan Housing Development Authority, Rental Housing Revenue Bonds, Series 2010A, 5.000%, 10/01/35 | | | 10/20 at 100.00 | | | | | | | | AA | | | | 1,676,124 | |
| | | | | | |
| | 1,250 | | | Michigan Public Educational Facilities Authority, Limited Obligation Revenue Bonds, Chandler Park Academy Project, Series 2008, 6.500%, 11/01/35 | | | 11/35 at 100.00 | | | | | | | | BBB | | | | 1,252,275 | |
| | | | | | |
| | 1,290 | | | Michigan Public Educational Facilities Authority, Limited Obligation Revenue Bonds, David Ellis Academy-West Charter School Project, Series 2007, 5.875%, 6/01/37 | | | 6/17 at 100.00 | | | | | | | | N/R | | | | 1,296,386 | |
| | | | | | |
| | | | Michigan State Building Authority, Revenue Bonds, Facilities Program, Refunding Series 2011-I-A: | | | | | | | | | | | | | | | | |
| | 750 | | | 5.375%, 10/15/41 | | | 10/21 at 100.00 | | | | | | | | Aa2 | | | | 873,225 | |
| | 2,000 | | | 5.500%, 10/15/45 | | | 10/21 at 100.00 | | | | | | | | Aa2 | | | | 2,339,180 | |
| | | | | | |
| | | | Michigan State Hospital Finance Authority, Hospital Revenue Bonds, Henry Ford Health System, Refunding Series 2009: | | | | | | | | | | | | | | | | |
| | 500 | | | 5.625%, 11/15/29 | | | 11/19 at 100.00 | | | | | | | | A– | | | | 574,015 | |
| | 1,480 | | | 5.750%, 11/15/39 | | | 11/19 at 100.00 | | | | | | | | A– | | | | 1,684,225 | |
| | | | | | |
| | 1,635 | | | Michigan State Hospital Finance Authority, Revenue Bonds, Trinity Health Care Group, Series 2006A, 5.000%, 12/01/31 | | | 12/16 at 100.00 | | | | | | | | AA | | | | 1,679,390 | |
| | | | | | |
| | 375 | | | Michigan State Hospital Finance Authority, Revenue Bonds, Trinity Health Care Group, Series 2006A, 5.000%, 12/01/31 (Pre-refunded 12/01/16) | | | 12/16 at 100.00 | | | | | | | | Aa2 (4) | | | | 384,758 | |
| | | | | | |
| | 1,200 | | | Royal Oak Hospital Finance Authority, Michigan, Hospital Revenue Bonds, William Beaumont Hospital Obligated Group, Refunding Series 2014D, 5.000%, 9/01/20 | | | No Opt. Call | | | | | | | | A1 | | | | 1,387,332 | |
| | | | | | |
| | 6,010 | | | Royal Oak Hospital Finance Authority, Michigan, Hospital Revenue Bonds, William Beaumont Hospital, Refunding Series 2009V, 8.000%, 9/01/29 (Pre-refunded 9/01/18) | | | 9/18 at 100.00 | | | | | | | | Aaa | | | | 7,020,041 | |
| | 42,365 | | | Total Michigan | | | | | | | | | | | | | | | 42,790,646 | |
| | | | | | | | | | | | | | | | | | | | |
Principal
Amount (000) | | | Description (1) | | Optional Call
Provisions (2) | | | | | | | Ratings (3) | | | Value | |
| | | | | | |
| | | | Minnesota – 2.2% | | | | | | | | | | | | | |
| | | | | | |
| | | | Columbus, Minnesota, Senior Housing Revenue Bonds, Richfield Senior Housing, Inc., Refunding Series 2015: | | | | | | | | | | | | | | | | |
| $ | 250 | | | 5.250%, 1/01/40 | | | 1/23 at 100.00 | | | | | | | | N/R | | | $ | 256,700 | |
| | 675 | | | 5.250%, 1/01/46 | | | 1/23 at 100.00 | | | | | | | | N/R | | | | 687,299 | |
| | | | | | |
| | 1,125 | | | Delano Independent School District 879, Minnesota, General Obligation Bonds, Refunding School Building Series 2016A, 3.000%, 2/01/32 | | | 2/26 at 100.00 | | | | | | | | Aa2 | | | | 1,143,101 | |
| | | | | | |
| | 1,000 | | | Duluth Housing & Redevelopment Authority, Minnesota, Lease Revenue Bonds, Duluth Public Schools Academy, Series 2010A, 5.875%, 11/01/40 | | | 11/20 at 100.00 | | | | | | | | BBB– | | | | 1,069,960 | |
| | | | | | |
| | 1,000 | | | Faribault, Minnesota, Housing Revenue Bonds, Faribault Senior Living LLC Project, Series 2010, 7.000%, 5/01/45 | | | 5/18 at 102.00 | | | | | | | | N/R | | | | 1,057,600 | |
| | | | | | |
| | 2,000 | | | Minneapolis, Minnesota, Health Care System Revenue Bonds, Fairview Health Services, Series 2015A, 5.000%, 11/15/44 | | | 11/25 at 100.00 | | | | | | | | A+ | | | | 2,307,380 | |
| | | | | | |
| | | | Minneapolis, Minnesota, Health Care System Revenue Bonds, Fairview Hospital and Healthcare Services, Series 2008A: | | | | | | | | | | | | | | | | |
| | 3,000 | | | 6.375%, 11/15/23 (Pre-refunded 11/15/18) | | | 11/18 at 100.00 | | | | | | | | A+ (4) | | | | 3,417,540 | |
| | 3,000 | | | 6.625%, 11/15/28 (Pre-refunded 11/15/18) | | | 11/18 at 100.00 | | | | | | | | A+ (4) | | | | 3,436,380 | |
| | | | | | |
| | 3,000 | | | Minneapolis, Minnesota, Recovery Zone Facility Revenue Bonds, Mozaic Parking, LLC Project, Series 2010A, 8.500%, 1/01/41 | | | 1/21 at 100.00 | �� | | | | | | | N/R | | | | 3,065,850 | |
| | | | | | |
| | 3,480 | | | Moorhead Independent School District 152, Clay County, Minnesota, General Obligation Bonds, Refunding School Building Series 2016A, 3.000%, 2/01/36 | | | 2/26 at 100.00 | | | | | | | | Aa2 | | | | 3,480,487 | |
| | | | | | |
| | 9,510 | | | Moorhead, Minnesota, Educational Facilities Revenue Bonds, The Concordia College Corporation Project, Series 2016, 5.000%, 12/01/25 | | | No Opt. Call | | | | | | | | Baa1 | | | | 11,678,851 | |
| | | | | | |
| | | | Saint Cloud, Minnesota, Health Care Revenue Bonds, CentraCare Health System, Series 2016A: | | | | | | | | | | | | | | | | |
| | 2,270 | | | 4.000%, 5/01/37 (WI/DD, Settling 5/12/16) | | | 5/26 at 100.00 | | | | | | | | A1 | | | | 2,441,022 | |
| | 780 | | | 3.250%, 5/01/39 (WI/DD, Settling 5/12/16) | | | 5/26 at 100.00 | | | | | | | | A1 | | | | 771,888 | |
| | | | | | |
| | 16,825 | | | Saint Paul Port Authority, Minnesota, Solid Waste Disposal Revenue Bonds, Gerdau Saint Paul Steel Mill Project, Series 2012-7, 4.500%, 10/01/37 (Alternative Minimum Tax) | | | 10/22 at 100.00 | | | | | | | | BBB– | | | | 14,350,379 | |
| | | | | | |
| | | | Shakopee, Minnesota, General Obligation Tax Abatement Revenue Bonds, Series 2016A: | | | | | | | | | | | | | | | | |
| | 1,890 | | | 3.000%, 2/01/33 | | | 2/25 at 100.00 | | | | | | | | Aa1 | | | | 1,940,142 | |
| | 1,950 | | | 3.000%, 2/01/34 | | | 2/25 at 100.00 | | | | | | | | Aa1 | | | | 1,989,800 | |
| | | | | | |
| | | | St. Paul Housing and Redevelopment Authority, Minnesota, Hospital Revenue Bonds, HealthEast Inc., Series 2015A: | | | | | | | | | | | | | | | | |
| | 2,500 | | | 5.000%, 11/15/27 | | | 11/25 at 100.00 | | | | | | | | BBB– | | | | 3,009,225 | |
| | 1,750 | | | 5.250%, 11/15/28 | | | 11/20 at 100.00 | | | | | | | | BBB– | | | | 1,984,168 | |
| | 535 | | | 5.250%, 11/15/35 | | | 11/20 at 100.00 | | | | | | | | BBB– | | | | 596,001 | |
| | 235 | | | 5.000%, 11/15/44 | | | 11/25 at 100.00 | | | | | | | | BBB– | | | | 270,071 | |
| | | | | | |
| | 2,240 | | | Wayzata, Minnesota, Senior Housing Revenue Bonds, Folkestone Senior Living Community, Series 2012A, 6.000%, 5/01/47 | | | 5/19 at 102.00 | | | | | | | | N/R | | | | 2,427,846 | |
| | | | | | |
| | 3,750 | | | Western Minnesota Municipal Power Agency, Power Supply Revenue Bonds, Series 2014A, 5.000%, 1/01/46 | | | 1/24 at 100.00 | | | | | | | | Aa3 | | | | 4,360,875 | |
| | 62,765 | | | Total Minnesota | | | | | | | | | | | | | | | 65,742,565 | |
| | | | | | |
| | | | Mississippi – 0.2% | | | | | | | | | | | | | |
| | | | | | |
| | 5,000 | | | Mississippi Development Bank, Special Obligation Bonds, Gulfport Water and Sewer System Project, Series 2005, 5.250%, 7/01/24 – AGM Insured | | | No Opt. Call | | | | | | | | AA | | | | 5,995,850 | |
Nuveen All-American Municipal Bond Fund (continued)
| | |
| Portfolio of Investments | | April 30, 2016 |
| | | | | | | | | | | | | | | | | | | | |
Principal
Amount (000) | | | Description (1) | | Optional Call
Provisions (2) | | | | | �� | | Ratings (3) | | | Value | |
| | | | | | |
| | | | Missouri – 2.3% | | | | | | | | | | | | | |
| | | | | | |
| $ | 3,185 | | | Bi-State Development Agency, Bi-State MetroLink District, Missouri, St Clair County Metrolink Extension Project Bonds, Refunding Series 2006, 5.250%, 7/01/27 – AGM Insured | | | No Opt. Call | | | | | | | | AA | | | $ | 4,144,386 | |
| | | | | | |
| | 320 | | | Chesterfield Valley Transportation Development District, Missouri, Transportation Sales Tax Revenue Bonds, Series 2015, 3.250%, 5/15/28 | | | 5/23 at 100.00 | | | | | | | | A– | | | | 330,438 | |
| | | | | | |
| | 2,470 | | | Hanley Road Corridor Transportation Development District, Brentwood and Maplewood, Missouri, Transportation Sales Revenue Bonds, Refunding Series 2009A, 5.875%, 10/01/36 | | | 10/19 at 100.00 | | | | | | | | A– | | | | 2,758,743 | |
| | | | | | |
| | 13,335 | | | Missouri Health and Educational Facilities Authority, Health Facilities Revenue Bonds, BJC Health System, Series 2015A, 4.000%, 1/01/45 | | | No Opt. Call | | | | | | | | AA | | | | 14,178,439 | |
| | | | | | |
| | 1,250 | | | Missouri Health and Educational Facilities Authority, Revenue Bonds, Lutheran Senior Services Projects, Series 2011, 6.000%, 2/01/41 | | | 2/21 at 100.00 | | | | | | | | BBB+ | | | | 1,395,888 | |
| | | | | | |
| | 4,455 | | | Missouri Health and Educational Facilities Authority, Revenue Bonds, Washington University, Tender Option Bond Trust 2015-XF0046, 12.857%, 5/15/17 (IF) | | | No Opt. Call | | | | | | | | AAA | | | | 6,187,327 | |
| | | | | | |
| | 2,250 | | | Missouri Joint Municipal Electric Utility Commission, Power Project Revenue Bonds, Plum Point Project, Refunding Series 2014A, 5.000%, 1/01/28 | | | 1/25 at 100.00 | | | | | | | | A | | | | 2,715,255 | |
| | | | | | |
| | 15,100 | | | Missouri Joint Municipal Electric Utility Commission, Power Project Revenue Bonds, Plum Point Project, Refunding Series 2015A, 4.000%, 1/01/35 | | | 1/26 at 100.00 | | | | | | | | A | | | | 16,491,767 | |
| | | | | | |
| | | | Saint Louis Municipal Finance Corporation, Missouri, Leasehold Revenue Bonds, Convention Center, Series 2010A: | | | | | | | | | | | | | | | | |
| | 5,000 | | | 0.000%, 7/15/31 – AGC Insured | | | No Opt. Call | | | | | | | | AA | | | | 2,903,650 | |
| | 7,000 | | | 0.000%, 7/15/32 – AGC Insured | | | No Opt. Call | | | | | | | | AA | | | | 3,891,300 | |
| | 6,250 | | | 0.000%, 7/15/33 – AGC Insured | | | No Opt. Call | | | | | | | | AA | | | | 3,322,563 | |
| | 7,000 | | | 0.000%, 7/15/34 – AGC Insured | | | No Opt. Call | | | | | | | | AA | | | | 3,567,970 | |
| | 6,000 | | | 0.000%, 7/15/35 – AGC Insured | | | No Opt. Call | | | | | | | | AA | | | | 2,936,040 | |
| | 2,000 | | | 0.000%, 7/15/36 – AGC Insured | | | No Opt. Call | | | | | | | | AA | | | | 937,360 | |
| | | | | | |
| | 1,505 | | | Saint Louis, Missouri, Tax Increment Financing Revenue Bonds, Fashion Square Redevelopment Project, Series 2008A, 6.300%, 8/22/26 | | | No Opt. Call | | | | | | | | N/R | | | | 1,488,009 | |
| | | | | | |
| | 1,437 | | | Saint Louis, Missouri, Tax Increment Financing Revenue Notes, Marquette Building Redevelopment Project, Series 2008-A, 6.500%, 1/23/28 | | | No Opt. Call | | | | | | | | N/R | | | | 1,135,575 | |
| | 78,557 | | | Total Missouri | | | | | | | | | | | | | | | 68,384,710 | |
| | | | | | |
| | | | Nebraska – 2.1% | | | | | | | | | | | | | |
| | | | | | |
| | 4,000 | | | Central Plains Energy Project, Nebraska, Gas Project 3 Revenue Bonds, Series 2012, 5.000%, 9/01/42 | | | 9/22 at 100.00 | | | | | | | | A | | | | 4,400,320 | |
| | | | | | |
| | 11,930 | | | Central Plains Energy Project, Nebraska, Gas Supply Revenue Bonds, Refunding Series 2014, 5.000%, 8/01/39 (Mandatory put 12/01/19) | | | No Opt. Call | | | | | | | | Aa3 | | | | 13,506,430 | |
| | | | | | |
| | | | Douglas County Hospital Authority 2, Nebraska, Health Facilities Revenue Bonds, Nebraska Methodist Health System, Refunding Series 2015: | | | | | | | | | | | | | | | | |
| | 1,740 | | | 5.000%, 11/01/45 | | | 11/25 at 100.00 | | | | | | | | A– | | | | 1,986,523 | |
| | 1,095 | | | 4.250%, 11/01/45 | | | 11/25 at 100.00 | | | | | | | | A– | | | | 1,154,119 | |
| | | | | | |
| | 2,000 | | | Douglas County Hospital Authority 3, Nebraska, Health Facilities Revenue Bonds, Nebraska Methodist Health System, Refunding Series 2015, 4.125%, 11/01/36 | | | 11/25 at 100.00 | | | | | | | | A– | | | | 2,102,820 | |
| | | | | | |
| | | | Douglas County School District 10 Elkhorn, Nebraska, General Obligation Bonds, Public Schools Series 2015: | | | | | | | | | | | | | | | | |
| | 1,000 | | | 4.000%, 12/15/33 | | | 12/24 at 100.00 | | | | | | | | AA– | | | | 1,107,550 | |
| | 1,710 | | | 4.000%, 12/15/34 | | | 12/24 at 100.00 | | | | | | | | AA– | | | | 1,886,968 | |
| | | | | | |
| | 2,750 | | | Nebraska Public Power District, General Revenue Bonds, Series 2008B, 5.000%, 1/01/20 (Pre-refunded 1/01/18) | | | 1/18 at 100.00 | | | | | | | | A+ (4) | | | | 2,945,993 | |
| | | | | | | | | | | | | | | | | | | | |
Principal
Amount (000) | | | Description (1) | | Optional Call
Provisions (2) | | | | | | | Ratings (3) | | | Value | |
| | | | | | |
| | | | Nebraska (continued) | | | | | | | | | | | | | |
| | | | | | |
| | | | Omaha Public Power District, Nebraska, Separate Electric System Revenue Bonds, Nebraska City 2, Refunding Series 2016A: | | | | | | | | | | | | | | | | |
| $ | 18,465 | | | 5.000%, 2/01/46 (UB) (6) | | | 2/26 at 100.00 | | | | | | | | A+ | | | $ | 21,499,538 | |
| | 10,000 | | | 5.000%, 2/01/49 (UB) (6) | | | 2/26 at 100.00 | | | | | | | | A+ | | | | 11,591,300 | |
| | 54,690 | | | Total Nebraska | | | | | | | | | | | | | | | 62,181,561 | |
| | | | | | |
| | | | Nevada – 1.3% | | | | | | | | | | | | | |
| | | | | | |
| | 90 | | | Clark County, Nevada, Industrial Development Revenue Bonds, Southwest Gas Corporation, Senior Lien Series 2006A, 4.750%, 9/01/36 – FGIC Insured (Alternative Minimum Tax) | | | 9/16 at 100.00 | | | | | | | | A | | | | 90,314 | |
| | | | | | |
| | 2,000 | | | Clark County, Nevada, Passenger Facility Charge Revenue Bonds, Las Vegas-McCarran International Airport, Series 2010A, 5.000%, 7/01/30 | | | 1/20 at 100.00 | | | | | | | | A+ | | | | 2,243,820 | |
| | | | | | |
| | | | Las Vegas Redevelopment Agency, Nevada, Tax Increment Revenue Bonds, Series 2009A: | | | | | | | | | | | | | | | | |
| | 2,000 | | | 7.500%, 6/15/23 (Pre-refunded 6/15/19) | | | 6/19 at 100.00 | | | | | | | | BBB+ (4) | | | | 2,396,340 | |
| | 1,500 | | | 8.000%, 6/15/30 (Pre-refunded 6/15/19) | | | 6/19 at 100.00 | | | | | | | | BBB+ (4) | | | | 1,819,755 | |
| | | | | | |
| | 20,000 | | | Las Vegas Valley Water District, Nevada, General Obligation Bonds, Refunding Water Improvement Series 2016A, 5.000%, 6/01/46 (UB) | | | 6/26 at 100.00 | | | | | | | | AA | | | | 23,689,000 | |
| | | | | | |
| | 2,500 | | | Las Vegas Valley Water District, Nevada, General Obligation Bonds, Water & Refunding Series 2011C, 5.000%, 6/01/38 | | | 6/21 at 100.00 | | | | | | | | Aa1 | | | | 2,874,850 | |
| | | | | | |
| | | | Las Vegas, Nevada, Local Improvement Bonds, Special Improvement District 607 Providence, Refunding Series 2013: | | | | | | | | | | | | | | | | |
| | 140 | | | 4.000%, 6/01/19 | | | No Opt. Call | | | | | | | | N/R | | | | 146,125 | |
| | 120 | | | 4.000%, 6/01/20 | | | No Opt. Call | | | | | | | | N/R | | | | 126,730 | |
| | 880 | | | 4.000%, 6/01/21 | | | No Opt. Call | | | | | | | | N/R | | | | 938,995 | |
| | 400 | | | 5.000%, 6/01/23 | | | No Opt. Call | | | | | | | | N/R | | | | 437,596 | |
| | 200 | | | 4.250%, 6/01/24 | | | 6/23 at 103.00 | | | | | | | | N/R | | | | 208,416 | |
| | | | | | |
| | 1,765 | | | Las Vegas, Nevada, Local Improvement Bonds, Special Improvement District 812 Summerlin Village 24, Series 2015, 5.000%, 12/01/31 | | | 12/25 at 100.00 | | | | | | | | N/R | | | | 1,840,207 | |
| | | | | | |
| | | | Sparks Local Improvement District 3, Legends at Sparks Marina, Nevada, Limited Obligation Improvement Bonds, Series 2008: | | | | | | | | | | | | | | | | |
| | 525 | | | 6.500%, 9/01/20 | | | 9/18 at 100.00 | | | | | | | | N/R | | | | 565,021 | |
| | 1,325 | | | 6.750%, 9/01/27 | | | 9/18 at 100.00 | | | | | | | | N/R | | | | 1,398,206 | |
| | | | | | |
| | 410 | | | Washoe County, Nevada, General Obligation Bonds, Reno-Sparks Convention & Visitors Authority, Refunding Series 2011, 5.000%, 7/01/32 | | | 7/21 at 100.00 | | | | | | | | AA | | | | 471,016 | |
| | 33,855 | | | Total Nevada | | | | | | | | | | | | | | | 39,246,391 | |
| | | | | | |
| | | | New Hampshire – 0.1% | | | | | | | | | | | | | |
| | | | | | |
| | 3,305 | | | New Hampshire Health and Education Facilities Authority, Revenue Bonds, Dartmouth College, Tender Option Bond Trust 09-7W, 13.457%, 6/01/39 (IF) (6) | | | 6/19 at 100.00 | | | | | | | | AA+ | | | | 4,595,239 | |
| | | | | | |
| | | | New Jersey – 1.7% | | | | | | | | | | | | | |
| | | | | | |
| | 4,510 | | | Camden County Improvement Authority, New Jersey, Health Care Redevelopment Revenue Bonds, Cooper Health System Obligated Group Issue, Series 2013A, 5.750%, 2/15/42 | | | 2/23 at 100.00 | | | | | | | | BBB+ | | | | 5,332,759 | |
| | | | | | |
| | 1,335 | | | Manalapan-Englishtown Regional Board of Education, New Jersey, General Obligation Bonds, Series 2004, 5.750%, 12/01/21 – FGIC Insured | | | No Opt. Call | | | | | | | | A2 | | | | 1,635,909 | |
| | | | | | |
| | | | New Jersey Economic Development Authority, Revenue Bonds, Motor Vehicle Surcharge, Series 2004A: | | | | | | | | | | | | | | | | |
| | 1,775 | | | 5.000%, 7/01/22 – NPFG Insured | | | No Opt. Call | | | | | | | | AA– | | | | 1,795,430 | |
| | 1,775 | | | 5.000%, 7/01/23 – NPFG Insured | | | No Opt. Call | | | | | | | | AA– | | | | 1,795,430 | |
Nuveen All-American Municipal Bond Fund (continued)
| | |
| Portfolio of Investments | | April 30, 2016 |
| | | | | | | | | | | | | | | | | | | | |
Principal
Amount (000) | | | Description (1) | | Optional Call
Provisions (2) | | | | | | | Ratings (3) | | | Value | |
| | | | | | |
| | | | New Jersey (continued) | | | | | | | | | | | | | |
| | | | | | |
| | | | New Jersey Economic Development Authority, Special Facilities Revenue Bonds, Continental Airlines Inc., Series 1999: | | | | | | | | | | | | | | | | |
| $ | 1,000 | | | 5.125%, 9/15/23 (Alternative Minimum Tax) | | | 9/16 at 100.00 | | | | | | | | BB– | | | $ | 1,117,920 | |
| | 1,650 | | | 5.250%, 9/15/29 (Alternative Minimum Tax) | | | 9/22 at 101.00 | | | | | | | | BB– | | | | 1,831,286 | |
| | | | | | |
| | 2,255 | | | New Jersey Economic Development Authority, Special Facilities Revenue Bonds, Continental Airlines Inc., Series 2000A & 2000B, 5.625%, 11/15/30 (Alternative Minimum Tax) | | | 3/24 at 101.00 | | | | | | | | BB– | | | | 2,591,784 | |
| | | | | | |
| | 835 | | | New Jersey Economic Development Authority, Student Housing Revenue Bonds, Provident Group-Montclair Properties LLC, Montclair State University Student Housing Project, Series 2010A, 5.750%, 6/01/31 | | | 6/20 at 100.00 | | | | | | | | Baa3 | | | | 942,957 | |
| | | | | | |
| | 2,015 | | | New Jersey Educational Facilities Authority, Revenue Bonds, University of Medicine and Dentistry of New Jersey, Refunding Series 2009B, 6.250%, 12/01/18 (ETM) | | | No Opt. Call | | | | | | | | N/R (4) | | | | 2,289,201 | |
| | | | | | |
| | 600 | | | New Jersey Educational Facilities Authority, Revenue Bonds, University of Medicine and Dentistry of New Jersey, Refunding Series 2009B, 7.500%, 12/01/32 (Pre-refunded 6/01/19) | | | 6/19 at 100.00 | | | | | | | | N/R (4) | | | | 719,514 | |
| | | | | | |
| | 1,000 | | | New Jersey Health Care Facilities Financing Authority, Revenue Bonds, Princeton HealthCare System, Series 2016A, 5.000%, 7/01/31 | | | 7/26 at 100.00 | | | | | | | | Baa2 | | | | 1,201,870 | |
| | | | | | |
| | 1,460 | | | New Jersey Health Care Facilities Financing Authority, Revenue Bonds, University Hospital Issue, Refunding Series 2015A, 5.000%, 7/01/46 – AGM Insured | | | 7/25 at 100.00 | | | | | | | | AA | | | | 1,669,276 | |
| | | | | | |
| | 1,335 | | | New Jersey Higher Education Assistance Authority, Student Loan Revenue Bonds, Tender Option Bond Trust 2016-XG0001, 18.578%, 6/01/30 (IF) (6) | | | 6/19 at 100.00 | | | | | | | | AA | | | | 1,922,240 | |
| | | | | | |
| | 7,280 | | | New Jersey Transportation Trust Fund Authority, Transportation System Bonds, Series 2015AA, 5.000%, 6/15/45 | | | 6/25 at 100.00 | | | | | | | | A– | | | | 7,740,169 | |
| | | | | | |
| | 3,175 | | | New Jersey Turnpike Authority, Revenue Bonds, Series 2005A, 5.250%, 1/01/26 – AGM Insured | | | No Opt. Call | | | | | | | | AA | | | | 4,104,132 | |
| | | | | | |
| | 1,000 | | | Newark Housing Authority, New Jersey, City-Secured Police Facility Revenue Bonds, South Ward Police Facility, Series 2009A, 5.750%, 12/01/30 – AGC Insured | | | 12/19 at 100.00 | | | | | | | | A3 | | | | 1,141,810 | |
| | | | | | |
| | 3,470 | | | North Hudson Sewerage Authority, New Jersey, Gross Revenue Senior Lien Lease Certificates, Series 2012A, 5.000%, 6/01/23 | | | 6/22 at 100.00 | | | | | | | | A | | | | 4,151,508 | |
| | | | | | |
| | 2,000 | | | Passaic Valley Water Commission, New Jersey, Water System Revenue Bonds, Series 2003, 5.000%, 12/15/19 – AGM Insured | | | No Opt. Call | | | | | | | | AA | | | | 2,270,200 | |
| | | | | | |
| | | | Tobacco Settlement Financing Corporation, New Jersey, Tobacco Settlement Asset-Backed Bonds, Series 2007-1A: | | | | | | | | | | | | | | | | |
| | 5,805 | | | 4.625%, 6/01/26 | | | 6/17 at 100.00 | | | | | | | | B+ | | | | 5,851,208 | |
| | 2,000 | | | 4.750%, 6/01/34 | | | 6/17 at 100.00 | | | | | | | | B– | | | | 1,888,720 | |
| | 46,275 | | | Total New Jersey | | | | | | | | | | | | | | | 51,993,323 | |
| | | | | | |
| | | | New Mexico – 0.4% | | | | | | | | | | | | | |
| | | | | | |
| | 4,790 | | | Clayton, New Mexico, Appropriation Debt, Jail Project, Series 2006, 4.650%, 11/01/29 (Pre-refunded 11/01/16) – CIFG Insured | | | 11/16 at 100.00 | | | | | | | | BBB+ (4) | | | | 4,889,440 | |
| | | | | | |
| | 3,000 | | | New Mexico Hospital Equipment Loan Council, First Mortgage Revenue Bonds, La Vida LLena Project, Series 2010A, 5.875%, 7/01/30 | | | 7/20 at 100.00 | | | | | | | | BBB– | | | | 3,214,590 | |
| | | | | | |
| | 3,070 | | | New Mexico Municipal Energy Acquisition Authority, Gas Supply Revenue Bonds, Refunding Sub-Series 2014A, 5.000%, 11/01/39 (Mandatory put 8/01/19) | | | 8/19 at 100.00 | | | | | | | | Aa3 | | | | 3,426,857 | |
| | | | | | |
| | 530 | | | The Trails Public Improvement District, Albuquerque, New Mexico, Special Levy Revenue Bonds, Series 2008, 7.500%, 10/01/18 | | | No Opt. Call | | | | | | | | N/R | | | | 531,383 | |
| | 11,390 | | | Total New Mexico | | | | | | | | | | | | | | | 12,062,270 | |
| | | | | | | | | | | | | | | | | | | | |
Principal
Amount (000) | | | Description (1) | | Optional Call
Provisions (2) | | | | | | | Ratings (3) | | | Value | |
| | | | | | |
| | | | New York – 3.8% | | | | | | | | | | | | | |
| | | | | | |
| | | | Brooklyn Arena Local Development Corporation, New York, Payment in Lieu of Taxes Revenue Bonds, Barclays Center Project, Series 2009: | | | | | | | | | | | | | | | | |
| $ | 1,100 | | | 6.000%, 7/15/30 | | | 1/20 at 100.00 | | | | | | | | BBB– | | | $ | 1,259,764 | |
| | 7,745 | | | 6.375%, 7/15/43 | | | 1/20 at 100.00 | | | | | | | | BBB– | | | | 8,943,306 | |
| | | | | | |
| | 520 | | | Buffalo and Erie County Industrial Land Development Corporation, New York, Revenue Bonds, Catholic Health System, Inc. Project, Series 2015, 4.000%, 7/01/45 | | | 7/25 at 100.00 | | | | | | | | BBB+ | | | | 546,692 | |
| | | | | | |
| | 1,880 | | | Dormitory Authority of the State of New York, FHA-Insured Mortgage Revenue Bonds, Montefiore Hospital, Series 2004, 5.000%, 8/01/23 – FGIC Insured | | | No Opt. Call | | | | | | | | AA– | | | | 1,887,238 | |
| | | | | | |
| | | | Dormitory Authority of the State of New York, Revenue Bonds, Icahn School of Medicine at Mount Sinai, Series 2015A: | | | | | | | | | | | | | | | | |
| | 1,600 | | | 4.000%, 7/01/40 | | | 7/25 at 100.00 | | | | | | | | A– | | | | 1,716,128 | |
| | 8,145 | | | 5.000%, 7/01/45 | | | 7/25 at 100.00 | | | | | | | | A– | | | | 9,467,259 | |
| | | | | | |
| | 4,955 | | | Dormitory Authority of the State of New York, Revenue Bonds, New School University, Series 2010, 5.500%, 7/01/43 – AGM Insured | | | 7/20 at 100.00 | | | | | | | | AA | | | | 5,778,769 | |
| | | | | | |
| | | | Dormitory Authority of the State of New York, State Personal Income Tax Revenue Bonds, Tender Option Bond Trust 3518: | | | | | | | | | | | | | | | | |
| | 2,000 | | | 12.994%, 2/15/33 (IF) | | | 2/19 at 100.00 | | | | | | | | AAA | | | | 2,655,120 | |
| | 2,335 | | | 12.983%, 2/15/33 (IF) | | | 2/19 at 100.00 | | | | | | | | AAA | | | | 3,098,125 | |
| | | | | | |
| | 400 | | | Hudson Yards Infrastructure Corporation, New York, Revenue Bonds, Senior Fiscal 2012 Series 2011A, 5.750%, 2/15/47 | | | 2/21 at 100.00 | | | | | | | | A | | | | 470,692 | |
| | | | | | |
| | 4,055 | | | Hudson Yards Infrastructure Corporation, New York, Revenue Bonds, Series 2006A, 4.500%, 2/15/47 – NPFG Insured | | | 2/17 at 100.00 | | | | | | | | AA– | | | | 4,154,266 | |
| | | | | | |
| | 3,000 | | | Long Island Power Authority, New York, Electric System Revenue Bonds, Series 2008A, 6.000%, 5/01/33 (Pre-refunded 5/01/19) | | | 5/19 at 100.00 | | | | | | | | A– (4) | | | | 3,456,720 | |
| | | | | | |
| | | | Long Island Power Authority, New York, Electric System Revenue Bonds, Series 2011A: | | | | | | | | | | | | | | | | |
| | 1,000 | | | 5.000%, 5/01/36 – AGM Insured | | | 5/21 at 100.00 | | | | | | | | AA | | | | 1,143,250 | |
| | 1,980 | | | 5.000%, 5/01/38 | | | 5/21 at 100.00 | | | | | | | | A– | | | | 2,212,531 | |
| | | | | | |
| | | | Nassau County Local Economic Assistance Corporation, New York, Revenue Bonds, Catholic Health Services of Long Island Obligated Group Project, Series 2014: | | | | | | | | | | | | | | | | |
| | 235 | | | 5.000%, 7/01/23 | | | No Opt. Call | | | | | | | | BBB+ | | | | 283,105 | |
| | 300 | | | 5.000%, 7/01/24 | | | No Opt. Call | | | | | | | | BBB+ | | | | 365,139 | |
| | 210 | | | 5.000%, 7/01/26 | | | 7/24 at 100.00 | | | | | | | | BBB+ | | | | 250,725 | |
| | | | | | |
| | | | New York City Industrial Development Agency, New York, Civic Facility Revenue Bonds, Bronx Parking Development Company, LLC Project, Series 2007: | | | | | | | | | | | | | | | | |
| | 3,000 | | | 5.750%, 10/01/37 (11) | | | 10/17 at 100.00 | | | | | | | | N/R | | | | 1,062,930 | |
| | 1,000 | | | 5.875%, 10/01/46 (12) | | | 10/17 at 102.00 | | | | | | | | N/R | | | | 354,310 | |
| | | | | | |
| | 715 | | | New York City Industrial Development Agency, New York, Revenue Bonds, Yankee Stadium Project PILOT, Series 2009A, 7.000%, 3/01/49 – AGC Insured | | | 3/19 at 100.00 | | | | | | | | AA | | | | 831,824 | |
| | | | | | |
| | 1,000 | | | New York City Municipal Water Finance Authority, New York, Water and Sewerage System Revenue Bonds, Tender Option Bond Trust 2015-XF0097, 16.688%, 6/15/33 (IF) | | | 6/19 at 100.00 | | | | | | | | AA+ | | | | 1,479,880 | |
| | | | | | |
| | 5 | | | New York City, New York, General Obligation Bonds, Series 1991B, 7.000%, 2/01/18 – AMBAC Insured | | | No Opt. Call | | | | | | | | AA | | | | 5,028 | |
| | | | | | |
| | 13,000 | | | New York Liberty Development Corporation, New York, Liberty Revenue Bonds, 3 World Trade Center Project, Class 1 Series 2014, 5.000%, 11/15/44 | | | 11/24 at 100.00 | | | | | | | | N/R | | | | 14,128,920 | |
| | | | | | |
| | 560 | | | New York State Tobacco Settlement Financing Corporation, Tobacco Settlement Asset-Backed and State Contingency Contract-Backed Bonds, Series 2011B, 5.000%, 6/01/18 | | | No Opt. Call | | | | | | | | AA | | | | 608,966 | |
Nuveen All-American Municipal Bond Fund (continued)
| | |
| Portfolio of Investments | | April 30, 2016 |
| | | | | | | | | | | | | | | | | | | | |
Principal
Amount (000) | | | Description (1) | | Optional Call
Provisions (2) | | | | | | | Ratings (3) | | | Value | |
| | | | | | |
| | | | New York (continued) | | | | | | | | | | | | | |
| | | | | | |
| $ | 1,635 | | | New York State Urban Development Corporation, Special Project Revenue Bonds, University Facilities Grants, Series 1995, 5.500%, 1/01/19 | | | No Opt. Call | | | | | | | | AA | | | $ | 1,765,604 | |
| | | | | | |
| | 3,500 | | | Niagara Area Development Corporation, New York, Solid Waste Disposal Facility Revenue Refunding Bonds, Covanta Energy Project, Series 2012A, 5.250%, 11/01/42 (Alternative Minimum Tax) | | | No Opt. Call | | | | | | | | BB+ | | | | 3,554,355 | |
| | | | | | |
| | 9,000 | | | Port Authority of New York and New Jersey, Consolidated Revenue Bonds, One Hundred Eighty-Sixth Series 2014, 4.000%, 10/15/16 (Alternative Minimum Tax) | | | No Opt. Call | | | | | | | | AA– | | | | 9,140,670 | |
| | | | | | |
| | 795 | | | Port Authority of New York and New Jersey, Special Project Bonds, JFK International Air Terminal LLC Project, Eighth Series 2010, 6.000%, 12/01/42 | | | 12/20 at 100.00 | | | | | | | | Baa1 | | | | 934,976 | |
| | | | | | |
| | 4,250 | | | Sales Tax Asset Receivable Corporation of New York City, New York, Sales Tax Asset Revenue Bonds, Fiscal 2015 Series A, 5.000%, 10/15/17 | | | No Opt. Call | | | | | | | | AAA | | | | 4,522,978 | |
| | | | | | |
| | 1,170 | | | Suffolk County Economic Development Corporation, New York, Revenue Bonds, Peconic Landing At Southold, Inc. Project, Refunding Series 2010, 5.875%, 12/01/30 | | | 12/20 at 100.00 | | | | | | | | BBB– | | | | 1,327,435 | |
| | | | | | |
| | 1,400 | | | Troy Capital Resource Corporation, New York, Revenue Bonds, Rensselaer Polytechnic Institute, Series 2010B, 5.000%, 9/01/20 | | | No Opt. Call | | | | | | | | A– | | | | 1,616,720 | |
| | | | | | |
| | 12,150 | | | TSASC Inc., New York, Tobacco Asset-Backed Bonds, Series 2006, 5.000%, 6/01/26 | | | 6/16 at 100.00 | | | | | | | | BB– | | | | 12,177,824 | |
| | | | | | |
| | 10,000 | | | Utility Debt Securitization Authority, New York, Restructuring Bonds, Refunding Series 2015, 5.000%, 12/15/37 | | | 12/25 at 100.00 | | | | | | | | AAA | | | | 12,213,300 | |
| | 104,640 | | | Total New York | | | | | | | | | | | | | | | 113,414,549 | |
| | | | | | |
| | | | North Carolina – 0.4% | | | | | | | | | | | | | |
| | | | | | |
| | 1,780 | | | Charlotte, North Carolina, Water and Sewer System Refunding Bonds, Tender Option Bond Trust 43W, 12.869%, 7/01/38 (IF) (6) | | | 7/20 at 100.00 | | | | | | | | AAA | | | | 2,557,308 | |
| | | | | | |
| | 1,000 | | | Columbus County Industrial Facilities and Pollution Control Financing Authority, North Carolina, Environmental Improvement Revenue Bonds, International Paper Company Project, Series 2007A, 4.625%, 3/01/27 (Alternative Minimum Tax) | | | 3/17 at 100.00 | | | | | | | | BBB | | | | 1,009,510 | |
| | | | | | |
| | 1,920 | | | North Carolina Capital Facilities Financing Agency, Revenue Bonds, Duke University, Series 2008, Tender Option Bond Trust 2015-XF0095, 25.118%, 10/01/36 (IF) | | | 10/16 at 100.00 | | | | | | | | AA+ | | | | 3,096,346 | |
| | | | | | |
| | 1,000 | | | North Carolina Eastern Municipal Power Agency, Power System Revenue Bonds, Refunding Series 1993B, 6.000%, 1/01/22 – FGIC Insured (ETM) | | | No Opt. Call | | | | | | | | A3 (4) | | | | 1,226,010 | |
| | | | | | |
| | 1,000 | | | North Carolina Eastern Municipal Power Agency, Power System Revenue Bonds, Series 2008C, 6.750%, 1/01/24 (Pre-refunded 1/01/19) | | | 1/19 at 100.00 | | | | | | | | AAA | | | | 1,158,000 | |
| | | | | | |
| | 1,580 | | | North Carolina Medical Care Commission, Health Care Facilities Revenue Bonds, Presbyterian Homes, Series 2006B, 5.200%, 10/01/21 | | | 10/16 at 100.00 | | | | | | | | N/R | | | | 1,601,109 | |
| | | | | | |
| | 2,000 | | | North Carolina Turnpike Authority, Triangle Expressway System Revenue Bonds, Series 2009A, 5.750%, 1/01/39 – AGC Insured | | | 1/19 at 100.00 | | | | | | | | AA | | | | 2,214,560 | |
| | 10,280 | | | Total North Carolina | | | | | | | | | | | | | | | 12,862,843 | |
| | | | | | |
| | | | North Dakota – 0.4% | | | | | | | | | | | | | |
| | | | | | |
| | 2,585 | | | Burleigh County, North Dakota, Health Care Revenue Bonds, Saint Alexius Medical Center Project, Refunding Series 2012A, 5.000%, 7/01/38 (Pre-refunded 7/01/22) | | | 7/22 at 100.00 | | | | | | | | N/R (4) | | | | 3,163,420 | |
| | | | | | |
| | 2,060 | | | Burleigh County, North Dakota, Multi-County Sales Tax Revenue Bonds, Series 2015A, 3.750%, 11/01/34 – AGM Insured | | | 11/22 at 100.00 | | | | | | | | AA | | | | 2,144,501 | |
| | | | | | | | | | | | | | | | | | | | |
Principal
Amount (000) | | | Description (1) | | Optional Call
Provisions (2) | | | | | | | Ratings (3) | | | Value | |
| | | | | | |
| | | | North Dakota (continued) | | | | | | | | | | | | | |
| | | | | | |
| | | | Grand Forks, North Dakota, Health Care System Revenue Bonds, Altru Health System Obligated Group, Series 2012: | | | | | | | | | | | | | | | | |
| $ | 2,100 | | | 4.000%, 12/01/27 | | | 12/21 at 100.00 | | | | | | | | A– | | | $ | 2,219,364 | |
| | 3,535 | | | 5.000%, 12/01/32 | | | 12/21 at 100.00 | | | | | | | | A– | | | | 3,912,503 | |
| | 10,280 | | | Total North Dakota | | | | | | | | | | | | | | | 11,439,788 | |
| | | | | | |
| | | | Ohio – 4.1% | | | | | | | | | | | | | |
| | | | | | |
| | | | Buckeye Tobacco Settlement Financing Authority, Ohio, Tobacco Settlement Asset-Backed Revenue Bonds, Senior Lien, Series 2007A-2: | | | | | | | | | | | | | | | | |
| | 8,670 | | | 5.125%, 6/01/24 | | | 6/17 at 100.00 | | | | | | | | B– | | | | 8,383,283 | |
| | 12,920 | | | 5.875%, 6/01/30 | | | 6/17 at 100.00 | | | | | | | | B– | | | | 12,624,390 | |
| | 3,990 | | | 5.750%, 6/01/34 | | | 6/17 at 100.00 | | | | | | | | B– | | | | 3,825,812 | |
| | 18,260 | | | 5.875%, 6/01/47 | | | 6/17 at 100.00 | | | | | | | | B– | | | | 17,791,083 | |
| | | | | | |
| | | | Butler County, Ohio, Hospital Facilities Revenue Bonds, UC Health, Series 2010: | | | | | | | | | | | | | | | | |
| | 3,000 | | | 5.250%, 11/01/29 | | | 11/20 at 100.00 | | | | | | | | A | | | | 3,500,460 | |
| | 2,000 | | | 5.750%, 11/01/40 | | | 11/20 at 100.00 | | | | | | | | A | | | | 2,360,840 | |
| | | | | | |
| | 7,200 | | | County of Lucas, Ohio, Hospital Revenue Bonds, ProMedica Healthcare Obligated Group, Series 2015B, 4.000%, 11/15/45 | | | 11/25 at 100.00 | | | | | | | | AA | | | | 7,579,512 | |
| | | | | | |
| | 3,040 | | | Franklin County, Ohio, Healthcare Facilities Revenue Bonds, Ohio Presbyterian Retirement Services, Improvement Series 2010A, 5.625%, 7/01/26 | | | 7/21 at 100.00 | | | | | | | | BBB– | | | | 3,340,018 | |
| | | | | | |
| | 8,505 | | | Hamilton County, Ohio, Sales Tax Bonds, Subordinate Lien, Series 2006A, 4.250%, 12/01/32 – AMBAC Insured | | | 12/16 at 100.00 | | | | | | | | A+ | | | | 8,580,865 | |
| | | | | | |
| | | | Lake County, Ohio, Hospital Facilities Revenue Bonds, Lake Hospital System, Inc., Refunding Series 2008C: | | | | | | | | | | | | | | | | |
| | 2,725 | | | 5.625%, 8/15/29 (Pre-refunded 8/15/18) | | | 8/18 at 100.00 | | | | | | | | N/R (4) | | | | 3,028,265 | |
| | 525 | | | 5.625%, 8/15/29 | | | 8/18 at 100.00 | | | | | | | | A3 | | | | 575,715 | |
| | | | | | |
| | 700 | | | Lorain County Port Authority, Ohio, Recovery Zone Facility Economic Development Revenue Bonds, United State Steel Corporation Project, Series 2010, 6.750%, 12/01/40 | | | 12/20 at 100.00 | | | | | | | | B+ | | | | 671,636 | |
| | | | | | |
| | 5,820 | | | Lucas County, Ohio, Hospital Revenue Bonds, ProMedica Healthcare Obligated Group, Series 2011A, 6.000%, 11/15/41 | | | 11/21 at 100.00 | | | | | | | | AA | | | | 7,042,724 | |
| | | | | | |
| | 1,000 | | | Miami County, Ohio, Hospital Facilities Revenue Bonds, Upper Valley Medical Center Inc., Refunding Series 2006, 5.250%, 5/15/26 | | | 5/16 at 100.00 | | | | | | | | A | | | | 1,003,540 | |
| | | | | | |
| | 1,500 | | | Middleburg Heights, Ohio, Hospital Facilities Revenue Bonds, Southwest General Health Center Project, Refunding Series 2011, 5.250%, 8/01/41 | | | 8/21 at 100.00 | | | | | | | | A2 | | | | 1,658,670 | |
| | | | | | |
| | 3,500 | | | Montgomery County, Ohio, Health Care and Multifamily Housing Revenue Bonds, Saint Leonard, Refunding & improvement Series 2010, 6.375%, 4/01/30 | | | 4/20 at 100.00 | | | | | | | | BBB– | | | | 3,894,835 | |
| | | | | | |
| | 2,730 | | | Ohio Air Quality Development Authority, Ohio, Revenue Bonds, Ohio Valley Electric Corporation Project, Series 2009E, 5.625%, 10/01/19 | | | No Opt. Call | | | | | | | | BBB– | | | | 3,041,793 | |
| | | | | | |
| | 5,700 | | | Ohio State, Hospital Revenue Bonds, University Hospitals Health System, Inc., Refunding Series 2016A, 4.000%, 1/15/46 | | | 1/26 at 100.00 | | | | | | | | A | | | | 5,954,220 | |
| | | | | | |
| | 4,000 | | | Ohio Water Development Authority, Pollution Control Revenue Refunding Bonds, FirstEnergy Nuclear Generating Corporation Project, Series 2008C, 3.950%, 11/01/32 (Mandatory put 5/01/20) (Alternative Minimum Tax) | | | No Opt. Call | | | | | | | | BBB– | | | | 4,160,520 | |
| | | | | | |
| | 5,000 | | | Ohio Water Development Authority, Water Pollution Control Loan Fund Revenue Bonds, Series 2014, 5.000%, 12/01/20 | | | No Opt. Call | | | | | | | | AAA | | | | 5,906,700 | |
Nuveen All-American Municipal Bond Fund (continued)
| | |
| Portfolio of Investments | | April 30, 2016 |
| | | | | | | | | | | | | | | | | | | | |
Principal
Amount (000) | | | Description (1) | | Optional Call
Provisions (2) | | | | | | | Ratings (3) | | | Value | |
| | | | | | |
| | | | Ohio (continued) | | | | | | | | | | | | | |
| | | | | | |
| | | | Southeastern Ohio Port Authority, Hospital Facilities Revenue Bonds, Memorial Health System Obligated Group Project, Refunding and Improvement Series 2012: | | | | | | | | | | | | | | | | |
| $ | 2,370 | | | 5.000%, 12/01/17 | | | No Opt. Call | | | | | | | | BB | | | $ | 2,475,299 | |
| | 1,250 | | | 5.000%, 12/01/22 | | | No Opt. Call | | | | | | | | BB | | | | 1,380,338 | |
| | 3,000 | | | 5.750%, 12/01/32 | | | 12/22 at 100.00 | | | | | | | | BB | | | | 3,422,430 | |
| | 2,000 | | | 6.000%, 12/01/42 | | | 12/22 at 100.00 | | | | | | | | BB | | | | 2,276,740 | |
| | | | | | |
| | 3,000 | | | Trumbull County, Ohio, Multifamily Housing Revenue Bonds, Royal Mall Apartments, Series 2007, 5.000%, 5/20/49 (Alternative Minimum Tax) | | | 11/17 at 102.00 | | | | | | | | Aa1 | | | | 3,117,690 | |
| | | | | | |
| | | | Wood County, Ohio, Hospital Facilities Refunding and Improvement Revenue Bonds, Wood County Hospital Project, Series 2012: | | | | | | | | | | | | | | | | |
| | 2,000 | | | 5.000%, 12/01/27 | | | No Opt. Call | | | | | | | | Baa2 | | | | 2,229,980 | |
| | 2,500 | | | 5.000%, 12/01/32 | | | No Opt. Call | | | | | | | | Baa2 | | | | 2,712,000 | |
| | 116,905 | | | Total Ohio | | | | | | | | | | | | | | | 122,539,358 | |
| | | | | | |
| | | | Oklahoma – 0.4% | | | | | | | | | | | | | |
| | | | | | |
| | 1,185 | | | Cleveland County Educational Facilities Authority, Oklahoma, Educational Facilities Lease Revenue Bonds, Norman Public Schools Project, Series 2014, 5.000%, 7/01/19 | | | No Opt. Call | | | | | | | | A+ | | | | 1,323,550 | |
| | | | | | |
| | 9,090 | | | Tulsa Municipal Airport Trust, Oklahoma, Revenue Bonds, American Airlines Inc., Refunding Series 2015, 5.000%, 6/01/35 (Mandatory put 6/01/25) (Alternative Minimum Tax) | | | No Opt. Call | | | | | | | | BB– | | | | 10,456,409 | |
| | 10,275 | | | Total Oklahoma | | | | | | | | | | | | | | | 11,779,959 | |
| | | | | | |
| | | | Oregon – 0.5% | | | | | | | | | | | | | |
| | | | | | |
| | | | Multnomah County Hospital Facilities Authority, Oregon, Revenue Bonds, Mirabella South Waterfront, Refunding Series 2014A: | | | | | | | | | | | | | | | | |
| | 1,855 | | | 5.400%, 10/01/44 | | | 10/24 at 100.00 | | | | | | | | N/R | | | | 2,061,499 | |
| | 1,600 | | | 5.500%, 10/01/49 | | | 10/24 at 100.00 | | | | | | | | N/R | | | | 1,763,744 | |
| | | | | | |
| | 945 | | | Oregon Housing and Community Services Department, Multifamily Housing Revenue Bonds, Refunding Series 2010A, 5.150%, 7/01/42 (Alternative Minimum Tax) | | | 1/20 at 100.00 | | | | | | | | Aaa | | | | 994,754 | |
| | | | | | |
| | 935 | | | Oregon State Facilities Authority, Revenue Bonds, Concordia University Project, Series 2010A, 6.125%, 9/01/30 | | | 9/20 at 100.00 | | | | | | | | BB+ | | | | 1,001,591 | |
| | | | | | |
| | 1,080 | | | Oregon State Facilities Authority, Revenue Bonds, University of Portland Projects, Series 2015A, 4.000%, 4/01/40 | | | 4/25 at 100.00 | | | | | | | | A– | | | | 1,137,143 | |
| | | | | | |
| | 7,155 | | | Port of Portland, Oregon, International Airport Revenue Bonds, Series 2010-20C, 5.000%, 7/01/27 (Alternative Minimum Tax) | | | 7/20 at 100.00 | | | | | | | | AA– | | | | 8,129,797 | |
| | 13,570 | | | Total Oregon | | | | | | | | | | | | | | | 15,088,528 | |
| | | | | | |
| | | | Pennsylvania – 4.2% | | | | | | | | | | | | | |
| | | | | | |
| | 1,125 | | | Allegheny County Higher Education Building Authority, Pennsylvania, Revenue Bonds, Carlow University, Series 2011, 6.750%, 11/01/31 | | | 11/21 at 100.00 | | | | | | | | BBB– | | | | 1,297,823 | |
| | | | | | |
| | 1,000 | | | Bucks County Industrial Development Authority, Pennsylvania, Charter School Revenue Bonds, School Lane Charter School, Series 2007A, 5.000%, 3/15/37 | | | 3/17 at 100.00 | | | | | | | | BBB– | | | | 1,005,660 | |
| | | | | | |
| | 100 | | | Cumberland County Municipal Authority Revenue Bonds, Pennsylvania, Diakon Lutheran Social Ministries Project, Series 2009, 6.125%, 1/01/29 | | | 1/19 at 100.00 | | | | | | | | BBB+ | | | | 112,348 | |
| | | | | | |
| | 900 | | | Cumberland County Municipal Authority Revenue Bonds, Pennsylvania, Diakon Lutheran Social Ministries Project, Series 2009, 6.125%, 1/01/29 (Pre-refunded 1/01/19) | | | 1/19 at 100.00 | | | | | | | | N/R (4) | | | | 1,023,741 | |
| | | | | | | | | | | | | | | | | | | | |
Principal
Amount (000) | | | Description (1) | | Optional Call
Provisions (2) | | | | | | | Ratings (3) | | | Value | |
| | | | | | |
| | | | Pennsylvania (continued) | | | | | | | | | | | | | |
| | | | | | |
| | | | Cumberland County Municipal Authority, Pennsylvania, Revenue Bonds, Diakon Lutheran Social Ministries Project, Series 2015: | | | | | | | | | | | | | | | | |
| $ | 300 | | | 5.000%, 1/01/30 | | | 1/25 at 100.00 | | | | | | | | BBB+ | | | $ | 339,024 | |
| | 1,545 | | | 5.000%, 1/01/38 | | | 1/25 at 100.00 | | | | | | | | BBB+ | | | | 1,712,710 | |
| | | | | | |
| | 2,000 | | | Delaware County Authority, Pennsylvania, Revenue Bonds, Neumann College, Series 2008, 6.125%, 10/01/34 (Pre-refunded 10/01/18) | | | 10/18 at 100.00 | | | | | | | | BBB (4) | | | | 2,256,240 | |
| | | | | | |
| | 705 | | | Montgomery County Industrial Development Authority, Pennsylvania, FHA Insured Mortgage Revenue Bonds, New Regional Medical Center Project, Series 2010, 5.375%, 8/01/38 (Pre-refunded 8/01/20) | | | 8/20 at 100.00 | | | | | | | | N/R (4) | | | | 834,248 | |
| | | | | | |
| | 910 | | | Montgomery County Industrial Development Authority, Pennsylvania, FHA Insured Mortgage Revenue Bonds, New Regional Medical Center Project, Tender Option Bond Trust 62B, 16.946%, 8/01/38 (IF) (6) | | | 8/20 at 100.00 | | | | | | | | N/R | | | | 1,519,418 | |
| | | | | | |
| | | | Montgomery County Industrial Development Authority, Pennsylvania, Health System Revenue Bonds, Albert Einstein Healthcare Network Issue, Series 2015A: | | | | | | | | | | | | | | | | |
| | 1,860 | | | 5.250%, 1/15/45 | | | 1/25 at 100.00 | | | | | | | | Baa2 | | | | 2,076,578 | |
| | 1,310 | | | 5.250%, 1/15/46 | | | 1/25 at 100.00 | | | | | | | | Baa2 | | | | 1,461,502 | |
| | | | | | |
| | 3,990 | | | Montgomery County Industrial Development Authority, Pennsylvania, Water Facilities Revenue Bonds, Aqua Pennsylvania, Inc. Project, Series 2007A, 5.250%, 7/01/42 (Alternative Minimum Tax) | | | 7/18 at 100.00 | | | | | | | | AA– | | | | 4,293,400 | |
| | | | | | |
| | 1,650 | | | Pennsylvania Economic Development Financing Authority, Exempt Facilities Revenue Bonds, National Gypsum Company, Refunding Series 2014, 5.500%, 11/01/44 (Alternative Minimum Tax) | | | 11/24 at 100.00 | | | | | | | | N/R | | | | 1,738,127 | |
| | | | | | |
| | 1,000 | | | Pennsylvania Economic Development Financing Authority, Exempt Facilities Revenue Refunding Bonds, PPL Energy Supply, LLC Project, Series 2009A, 6.400%, 12/01/38 | | | 9/25 at 100.00 | | | | | | | | B+ | | | | 969,200 | |
| | | | | | |
| | 3,115 | | | Pennsylvania Economic Development Financing Authority, Health System Revenue Bonds , Albert Einstein Healthcare, Series 2009A, 6.250%, 10/15/23 (Pre-refunded 10/15/19) | | | 10/19 at 100.00 | | | | | | | | Baa2 (4) | | | | 3,561,629 | |
| | | | | | |
| | | | Pennsylvania Economic Development Financing Authority, Private Activity Revenue Bonds, Pennsylvania Rapid Bridge Replacement Project, Series 2015: | | | | | | | | | | | | | | | | |
| | 5,555 | | | 5.000%, 12/31/38 (Alternative Minimum Tax) | | | 6/26 at 100.00 | | | | | | | | BBB | | | | 6,272,706 | |
| | 3,750 | | | 5.000%, 6/30/42 (Alternative Minimum Tax) | | | 6/26 at 100.00 | | | | | | | | BBB | | | | 4,213,988 | |
| | | | | | |
| | 1,200 | | | Pennsylvania Higher Educational Facilities Authority, Revenue Bonds, Edinboro University Foundation Student Housing Project, Series 2010, 5.800%, 7/01/30 | | | 7/20 at 100.00 | | | | | | | | Baa3 | | | | 1,293,816 | |
| | | | | | |
| | 3,750 | | | Pennsylvania Housing Finance Agency, Single Family Mortgage Revenue Bonds, Series 2015-118A, 4.000%, 10/01/33 (Alternative Minimum Tax) | | | 4/25 at 100.00 | | | | | | | | AA+ | | | | 3,914,475 | |
| | | | | | |
| | 7,000 | | | Pennsylvania State, General Obligation Bonds, First Series 2015, 5.000%, 3/15/24 | | | No Opt. Call | | | | | | | | AA– | | | | 8,570,100 | |
| | | | | | |
| | 1,050 | | | Pennsylvania Turnpike Commission, Turnpike Revenue Bonds, Series 2006A, 5.000%, 12/01/26 (Pre-refunded 6/01/16) – AMBAC Insured | | | 6/16 at 100.00 | | | | | | | | A1 (4) | | | | 1,054,284 | |
| | | | | | |
| | 7,405 | | | Pennsylvania Turnpike Commission, Turnpike Revenue Bonds, Series 2015A-1, 5.000%, 12/01/45 | | | 6/25 at 100.00 | | | | | | | | A1 | | | | 8,511,751 | |
| | | | | | |
| | 15,000 | | | Pennsylvania Turnpike Commission, Turnpike Revenue Bonds, Subordinate Series 2009C, 0.000%, 6/01/33 – AGM Insured (5) | | | 6/26 at 100.00 | | | | | | | | AA | | | | 19,216,650 | |
| | | | | | |
| | 5,000 | | | Pennsylvania Turnpike Commission, Turnpike Revenue Bonds, Subordinate Series 2015B-1, 5.000%, 12/01/45 | | | 12/25 at 100.00 | | | | | | | | A– | | | | 5,680,500 | |
| | | | | | |
| | 480 | | | Philadelphia Authority for Industrial Development, Pennsylvania, Revenue Bonds, Global Leadership Academy Project, Series 2010, 5.750%, 11/15/30 | | | 11/20 at 100.00 | | | | | | | | BBB– | | | | 505,810 | |
| | | | | | |
| | 2,000 | | | Philadelphia Gas Works, Pennsylvania, Revenue Bonds, Nineth Series, 2010, 5.000%, 8/01/30 | | | 8/20 at 100.00 | | | | | | | | A– | | | | 2,234,360 | |
Nuveen All-American Municipal Bond Fund (continued)
| | |
| Portfolio of Investments | | April 30, 2016 |
| | | | | | | | | | | | | | | | | | | | |
Principal
Amount (000) | | | Description (1) | | Optional Call
Provisions (2) | | | | | | | Ratings (3) | | | Value | |
| | | | | | |
| | | | Pennsylvania (continued) | | | | | | | | | | | | | |
| | | | | | |
| $ | 260 | | | Philadelphia, Pennsylvania, Airport Revenue Bonds, Series 2010A, 5.000%, 6/15/40 – AGM Insured | | | 6/20 at 100.00 | | | | | | | | AA | | | $ | 292,529 | |
| | | | | | |
| | 2,380 | | | Philadelphia, Pennsylvania, General Obligation Bonds, Refunding Series 2011, 6.500%, 8/01/41 | | | 8/20 at 100.00 | | | | | | | | A+ | | | | 2,866,829 | |
| | | | | | |
| | 8,875 | | | Philadelphia, Pennsylvania, Water and Wastewater Revenue Bonds, Refunding Series 2012, 5.000%, 11/01/28 | | | No Opt. Call | | | | | | | | A1 | | | | 10,568,084 | |
| | | | | | |
| | 2,400 | | | Pittsburgh and Allegheny County Sports and Exhibition Authority, Pennsylvania, Hotel Room Excise Tax Revenue Bonds, Refunding Series 2010, 5.000%, 2/01/30 – AGM Insured | | | 8/20 at 100.00 | | | | | | | | AA | | | | 2,710,656 | |
| | | | | | |
| | 3,000 | | | Southeastern Pennsylvania Transportation Authority, Capital Grant Receipts Bonds, Federal Transit Administration Section 5309 Fixed Guideway Modernization Formula Funds, Series 2011, 5.000%, 6/01/28 | | | 6/21 at 100.00 | | | | | | | | AA– | | | | 3,488,580 | |
| | | | | | |
| | 1,600 | | | State Public School Building Authority, Pennsylvania, College Revenue Bonds, Delaware County Community College, Series 2008, 5.000%, 10/01/24 (Pre-refunded 4/01/18) – AGM Insured | | | 4/18 at 100.00 | | | | | | | | A1 (4) | | | | 1,730,000 | |
| | | | | | |
| | 19,300 | | | Susquehanna Area Regional Airport Authority, Pennsylvania, Airport System Revenue Bonds, Series 2012B, 4.000%, 1/01/33 | | | No Opt. Call | | | | | | | | Baa3 | | | | 19,506,703 | |
| | 111,515 | | | Total Pennsylvania | | | | | | | | | | | | | | | 126,833,469 | |
| | | | | | |
| | | | South Carolina – 0.4% | | | | | | | | | | | | | |
| | | | | | |
| | 480 | | | Greenville, South Carolina, Hospital Facilities Revenue Bonds, Series 1990, 6.000%, 5/01/20 | | | No Opt. Call | | | | | | | | AA– | | | | 536,218 | |
| | | | | | |
| | 300 | | | South Carolina Housing Finance and Development Authority, Mortgage Revenue Bonds, Series 2006C-2, 5.500%, 7/01/37 – AGM Insured (Alternative Minimum Tax) | | | No Opt. Call | | | | | | | | Aa1 | | | | 303,915 | |
| | | | | | |
| | 70 | | | South Carolina Public Service Authority, Electric System Revenue Bonds, Santee Cooper, Series 2008A, 5.375%, 1/01/28 (Pre-refunded 1/01/19) | | | 1/19 at 100.00 | | | | | | | | AA– (4) | | | | 78,579 | |
| | | | | | |
| | 1,930 | | | South Carolina Public Service Authority, Electric System Revenue Bonds, Santee Cooper, Series 2008A, 5.375%, 1/01/28 (Pre-refunded 1/01/19) | | | 1/19 at 100.00 | | | | | | | | AAA | | | | 2,166,522 | |
| | | | | | |
| | 4,035 | | | South Carolina Public Service Authority, Santee Cooper Revenue Obligations, Refunding & Improvement Series 2015A, 3.000%, 12/01/16 | | | No Opt. Call | | | | | | | | AA– | | | | 4,093,144 | |
| | | | | | |
| | 4,165 | | | South Carolina Public Service Authority, Santee Cooper Revenue Obligations, Refunding Series 2016A, 5.000%, 12/01/31 | | | 6/26 at 100.00 | | | | | | | | AA– | | | | 5,080,009 | |
| | 10,980 | | | Total South Carolina | | | | | | | | | | | | | | | 12,258,387 | |
| | | | | | |
| | | | South Dakota – 0.5% | | | | | | | | | | | | | |
| | | | | | |
| | 2,500 | | | Rapid City, South Dakota, Airport Customer Facility Charge Revenue Bonds, Recovery Zone Facility Bond Series 2010B, 7.000%, 12/01/30 | | | 12/20 at 102.00 | | | | | | | | N/R | | | | 2,868,600 | |
| | | | | | |
| | 1,000 | | | Rapid City, South Dakota, Airport Revenue Bonds, Passenger Facility Charge Supported, Refunding Series 2011A, 7.000%, 12/01/35 | | | 12/19 at 100.00 | | | | | | | | Baa3 | | | | 1,129,280 | |
| | | | | | |
| | 1,890 | | | South Dakota Economic Development Finance Authority, Economic Development Revenue Bonds, Spearfish Products Project, Pooled Loan Program, Series 2008A, 5.875%, 4/01/28 (Pre-refunded 6/01/16) (Alternative Minimum Tax) | | | 6/16 at 100.00 | | | | | | | | AA (4) | | | | 1,899,053 | |
| | | | | | |
| | 910 | | | South Dakota Health and Educational Facilities Authority, Revenue Bonds, Sanford Health, Series 2015, 5.000%, 11/01/45 | | | 11/25 at 100.00 | | | | | | | | A+ | | | | 1,048,575 | |
| | | | | | |
| | 6,750 | | | South Dakota Health and Educational Facilities Authority, Revenue Bonds, Vocational Education Program, Series 2008, 5.500%, 8/01/38 (Pre-refunded 8/01/18) – AGC Insured | | | 8/18 at 100.00 | | | | | | | | AA (4) | | | | 7,455,780 | |
| | 13,050 | | | Total South Dakota | | | | | | | | | | | | | | | 14,401,288 | |
| | | | | | | | | | | | | | | | | | | | |
Principal
Amount (000) | | | Description (1) | | Optional Call
Provisions (2) | | | | | | | Ratings (3) | | | Value | |
| | | | | | |
| | | | Tennessee – 1.0% | | | | | | | | | | | | | |
| | | | | | |
| $ | 3,670 | | | Blount County Public Building Authority, Tennessee, Local Government Public Improvement Loan Bonds, Washington County, Series 2007B-12-A, 4.375%, 6/01/35 – SYNCORA GTY Insured | | | 6/19 at 100.00 | | | | | | | | Aa2 | | | $ | 3,871,006 | |
| | | | | | |
| | | | Chattanooga Health, Educational and Housing Facility Board, Tennessee, Hospital Revenue Bonds, Catholic Health Initiatives, Series 2008D: | | | | | | | | | | | | | | | | |
| | 510 | | | 6.000%, 10/01/23 | | | 10/18 at 100.00 | | | | | | | | A+ | | | | 568,211 | |
| | 1,500 | | | 6.125%, 10/01/28 | | | 10/18 at 100.00 | | | | | | | | A+ | | | | 1,671,840 | |
| | | | | | |
| | 3,000 | | | Claiborne County, Tennessee, Industrial Development Board, Revenue Refunding Bonds, Lincoln Memorial University Project, Series 2009, 6.625%, 10/01/39 | | | 10/19 at 100.00 | | | | | | | | N/R | | | | 3,246,420 | |
| | | | | | |
| | 1,000 | | | Clarksville Natural Gas Acquisition Corporation, Tennessee, Natural Gas Revenue Bonds, Series 2006, 5.000%, 12/15/17 – SYNCORA GTY Insured | | | No Opt. Call | | | | | | | | A | | | | 1,058,470 | |
| | | | | | |
| | | | Johnson City Health and Educational Facilities Board, Tennessee, Revenue Bonds, Mountain States Health Alliance, Series 2006A: | | | | | | | | | | | | | | | | |
| | 720 | | | 5.000%, 7/01/16 | | | No Opt. Call | | | | | | | | BBB+ | | | | 724,327 | |
| | 755 | | | 5.000%, 7/01/17 | | | 7/16 at 100.00 | | | | | | | | BBB+ | | | | 760,579 | |
| | 4,680 | | | 5.500%, 7/01/36 | | | 7/16 at 100.00 | | | | | | | | BBB+ | | | | 4,712,947 | |
| | | | | | |
| | 1,440 | | | Metropolitan Government of Nashville-Davidson County Health and Educational Facilities Board, Tennessee, Revenue Bonds, Belmont University Project, Series 2012, 5.000%, 11/01/26 | | | 11/21 at 100.00 | | | | | | | | BBB+ | | | | 1,637,179 | |
| | | | | | |
| | 5,240 | | | Metropolitan Government of Nashville-Davidson County Health and Educational Facilities Board, Tennessee, Revenue Bonds, Vanderbilt University Medical Center, Series 2016A, 5.000%, 7/01/46 (WI/DD, Settling 5/05/16) (UB) (6) | | | 5/26 at 100.00 | | | | | | | | A3 | | | | 6,060,584 | |
| | | | | | |
| | 1,000 | | | Metropolitan Government of Nashville-Davidson County Health and Educational Facilities Board, Tennessee, Revenue Bonds, Vanderbilt University, Series 2009A, 5.000%, 10/01/39 | | | 10/19 at 100.00 | | | | | | | | AA+ | | | | 1,129,450 | |
| | | | | | |
| | 2,000 | | | South Blount County Utility District, Tennessee, Waterworks Revenue Bonds, Improvement & Refunding Series 2009, 5.250%, 12/01/39 – AGM Insured | | | 12/19 at 100.00 | | | | | | | | AA | | | | 2,239,480 | |
| | | | | | |
| | 1,000 | | | The Tennessee Energy Acquisition Corporation, Gas Revenue Bonds, Series 2006A, 5.250%, 9/01/21 | | | No Opt. Call | | | | | | | | A | | | | 1,177,630 | |
| | 26,515 | | | Total Tennessee | | | | | | | | | | | | | | | 28,858,123 | |
| | | | | | |
| | | | Texas – 12.1% | | | | | | | | | | | | | |
| | | | | | |
| | 5,280 | | | Bexar County, Texas, Venue Project Revenue Bonds, Refunding Series 2010, 5.500%, 8/15/49 – AGM Insured | | | 8/19 at 100.00 | | | | | | | | AA | | | | 5,854,939 | |
| | | | | | |
| | 3,635 | | | Brazos County Health Facilities Development Corporation, Texas, Franciscan Services Corporation Obligated Group-St Joseph Regional, Revenue Bonds, Series 2008, 5.000%, 1/01/23 (Pre-refunded 7/01/18) | | | 7/18 at 100.00 | | | | | | | | A– (4) | | | | 3,968,439 | |
| | | | | | |
| | 2,315 | | | Brownsville, Texas, Utility System Revenue Bonds, Refunding Series 2008, 5.000%, 9/01/27 – AGM Insured | | | No Opt. Call | | | | | | | | AA | | | | 2,497,700 | |
| | | | | | |
| | 3,500 | | | Bryan, Brazos County, Texas, Electric System Revenue Bonds, Refunding Series 2010, 5.000%, 7/01/19 | | | 7/17 at 100.00 | | | | | | | | A+ | | | | 3,661,420 | |
| | | | | | |
| | 1,745 | | | Central Texas Regional Mobility Authority, Revenue Bonds, Senior Lien Series 2010, 5.750%, 1/01/25 | | | 1/20 at 100.00 | | | | | | | | BBB+ | | | | 2,009,786 | |
| | | | | | |
| | 3,400 | | | Central Texas Regional Mobility Authority, Revenue Bonds, Senior Lien Series 2011, 6.250%, 1/01/46 | | | 1/21 at 100.00 | | | | | | | | BBB+ | | | | 4,068,236 | |
| | | | | | |
| | 1,575 | | | Central Texas Regional Mobility Authority, Revenue Bonds, Senior Lien, Series 2015A, 5.000%, 1/01/45 | | | 7/25 at 100.00 | | | | | | | | BBB+ | | | | 1,802,777 | |
| | | | | | |
| | 2,745 | | | Clifton Higher Education Finance Corporation, Texas, Education Revenue Bonds, Idea Public Schools, Series 2012, 5.000%, 8/15/32 | | | 8/22 at 100.00 | | | | | | | | BBB | | | | 3,019,802 | |
Nuveen All-American Municipal Bond Fund (continued)
| | |
| Portfolio of Investments | | April 30, 2016 |
| | | | | | | | | | | | | | | | | | | | |
Principal
Amount (000) | | | Description (1) | | Optional Call
Provisions (2) | | | | | | | Ratings (3) | | | Value | |
| | | | | | |
| | | | Texas (continued) | | | | | | | | | | | | | |
| | | | | | |
| $ | 1,250 | | | Clifton Higher Education Finance Corporation, Texas, Education Revenue Bonds, Idea Public Schools, Series 2013, 6.000%, 8/15/33 | | | 8/23 at 100.00 | | | | | | | | BBB | | | $ | 1,502,888 | |
| | | | | | |
| | 2,100 | | | Clifton Higher Education Finance Corporation, Texas, Education Revenue Bonds, Tejano Center for Community Concerns, Inc.-Raul Yzaguirre School for Success, Refunding Series 2009A, 8.750%, 2/15/28 | | | 2/18 at 100.00 | | | | | | | | B+ | | | | 2,203,110 | |
| | | | | | |
| | 2,500 | | | Clifton Higher Education Finance Corporation, Texas, Education Revenue Bonds, Uplift Education Charter School, Series 2014A, 4.250%, 12/01/34 | | | 12/24 at 100.00 | | | | | | | | BBB– | | | | 2,567,725 | |
| | | | | | |
| | 9,700 | | | Clifton Higher Education Finance Corporation, Texas, Education Revenue Bonds, Uplift Education Charter School, Series 2015A, 5.000%, 12/01/50 | | | 6/25 at 100.00 | | | | | | | | BBB– | | | | 10,604,913 | |
| | | | | | |
| | 5,885 | | | Conroe Independent School District, Montgomery County, Texas, General Obligation Bonds, School Building & Refunding Series 2014A, 4.000%, 2/15/17 | | | No Opt. Call | | | | | | | | AAA | | | | 6,045,719 | |
| | | | | | |
| | 12,265 | | | Dallas Area Rapid Transit, Texas, Sales Tax Revenue Bonds, Refunding Series 2016A, 5.000%, 12/01/46 (UB) (6) | | | 12/25 at 100.00 | | | | | | | | AA+ | | | | 14,588,236 | |
| | | | | | |
| | | | Dallas-Fort Worth International Airport, Texas, Joint Revenue Bonds, Refunding Series 2011C: | | | | | | | | | | | | | | | | |
| | 3,500 | | | 5.000%, 11/01/24 | | | 11/20 at 100.00 | | | | | | | | A+ | | | | 4,078,550 | |
| | 1,500 | | | 5.000%, 11/01/25 | | | 11/20 at 100.00 | | | | | | | | A+ | | | | 1,746,150 | |
| | | | | | |
| | 20 | | | Dallas-Fort Worth International Airport, Texas, Joint Revenue Bonds, Refunding Series 2012B, 5.000%, 11/01/35 | | | 11/20 at 100.00 | | | | | | | | A+ | | | | 22,874 | |
| | | | | | |
| | 5,000 | | | Dallas-Fort Worth International Airport, Texas, Joint Revenue Bonds, Refunding Series 2012E, 5.000%, 11/01/42 (Alternative Minimum Tax) | | | No Opt. Call | | | | | | | | A+ | | | | 5,557,650 | |
| | | | | | |
| | 1,760 | | | Danbury Higher Education Authority Inc., Texas, Golden Rule Charter School Revenue Bonds, Series 2008A, 6.500%, 8/15/38 (Pre-refunded 2/15/18) | | | 2/18 at 100.00 | | | | | | | | BBB– (4) | | | | 1,923,170 | |
| | | | | | |
| | 1,750 | | | Fort Worth, Texas, Water and Sewerage Revenue Bonds, Refunding & Improvement Series 2014, 4.000%, 2/15/17 | | | No Opt. Call | | | | | | | | Aa1 | | | | 1,797,670 | |
| | | | | | |
| | 1,075 | | | Gulf Coast Industrial Development Authority, Texas, Solid Waste Disposal Revenue Bonds, Citgo Petroleum Corporation Project, Series 1995, 4.875%, 5/01/25 (Alternative Minimum Tax) | | | 10/22 at 100.00 | | | | | | | | BB | | | | 1,140,715 | |
| | | | | | |
| | 8,585 | | | Harris County Cultural Education Facilities Finance Corporation, Texas, Revenue Refunding Bonds, Young Men’s Christian Association of the Greater Houston Area, Series 2013A, 5.000%, 6/01/33 | | | 6/23 at 100.00 | | | | | | | | Baa3 | | | | 9,477,668 | |
| | | | | | |
| | 2,000 | | | Harris County Health Facilities Development Corporation, Texas, Hospital Revenue Bonds, Memorial Hermann Healthcare System, Series 2008B, 7.250%, 12/01/35 (Pre-refunded 12/01/18) | | | 12/18 at 100.00 | | | | | | | | N/R (4) | | | | 2,331,640 | |
| | | | | | |
| | 5,000 | | | Harris County Hospital District, Texas, Revenue Bonds, Series 2007A, 5.250%, 2/15/42 – NPFG Insured | | | 2/17 at 100.00 | | | | | | | | AA– | | | | 5,154,750 | |
| | | | | | |
| | 3,000 | | | Harrison County Health Facilities Development Corporation, Texas, Hospital Revenue Bonds, Good Shepherd Health System, Refunding Series 2010, 5.250%, 7/01/28 | | | 7/20 at 100.00 | | | | | | | | BB– | | | | 3,240,120 | |
| | | | | | |
| | | | Houston Independent School District, Harris County, Texas, General Obligation Bonds, Refunding Schoolhouse Series 2016A: | | | | | | | | | | | | | | | | |
| | 5,000 | | | 5.000%, 2/15/24 | | | No Opt. Call | | | | | | | | AAA | | | | 6,269,150 | |
| | 4,000 | | | 5.000%, 2/15/25 | | | No Opt. Call | | | | | | | | AAA | | | | 5,085,200 | |
| | | | | | |
| | 1,000 | | | Houston, Texas, Airport System Special Facilities Revenue Bonds, United Airlines Inc. Terminal Improvement Project, Refunding Series 2015B-1, 5.000%, 7/15/30 (Alternative Minimum Tax) | | | 7/25 at 100.00 | | | | | | | | BB– | | | | 1,130,300 | |
| | | | | | |
| | 1,500 | | | Houston, Texas, Airport System Special Facilities Revenue Bonds, United Airlines Inc. Terminal Improvement Project, Refunding Series 2015C, 5.000%, 7/15/20 (Alternative Minimum Tax) | | | No Opt. Call | | | | | | | | BB– | | | | 1,638,270 | |
| | | | | | |
| | 250 | | | Houston, Texas, Airport System Special Facilities Revenue Bonds, United Airlines, Inc. Terminal E Project, Refunding Series 2014, 5.000%, 7/01/29 (Alternative Minimum Tax) | | | 7/24 at 100.00 | | | | | | | | BB– | | | | 279,265 | |
| | | | | | | | | | | | | | | | | | | | |
Principal
Amount (000) | | | Description (1) | | Optional Call
Provisions (2) | | | | | | | Ratings (3) | | | Value | |
| | | | | | |
| | | | Texas (continued) | | | | | | | | | | | | | |
| | | | | | |
| $ | 1,955 | | | Houston, Texas, Hotel Occupancy Tax and Special Revenue Bonds, Convention and Entertainment Facilities Department, Refunding Series 2011A, 5.250%, 9/01/28 | | | 9/21 at 100.00 | | | | | | | | A2 | | | $ | 2,277,301 | |
| | | | | | |
| | 335 | | | Houston, Texas, Hotel Occupancy Tax and Special Revenue Bonds, Convention and Entertainment Facilities Department, Refunding Series 2014, 5.000%, 9/01/34 | | | No Opt. Call | | | | | | | | A2 | | | | 393,270 | |
| | | | | | |
| | | | Houston, Texas, Subordinate Lien Airport System Revenue Refunding Bonds, Series 2011A: | | | | | | | | | | | | | | | | |
| | 6,500 | | | 5.000%, 7/01/16 (Alternative Minimum Tax) | | | No Opt. Call | | | | | | | | A+ | | | | 6,549,790 | |
| | 1,270 | | | 5.000%, 7/01/25 (Alternative Minimum Tax) | | | 7/21 at 100.00 | | | | | | | | A+ | | | | 1,455,649 | |
| | | | | | |
| | 2,635 | | | Humble Independent School District, Harris County, Texas, General Obligation Bonds, Series 2008A, 5.250%, 2/15/22 – AGC Insured | | | 2/18 at 100.00 | | | | | | | | Aa1 | | | | 2,835,418 | |
| | | | | | |
| | | | Kerrville Health Facilities Development Corporation, Texas, Revenue Bonds, Sid Peterson Memorial Hospital Project, Series 2015: | | | | | | | | | | | | | | | | |
| | 1,360 | | | 5.000%, 8/15/30 | | | 8/25 at 100.00 | | | | | | | | BBB+ | | | | 1,570,188 | |
| | 1,280 | | | 5.000%, 8/15/35 | | | 8/25 at 100.00 | | | | | | | | BBB+ | | | | 1,445,786 | |
| | | | | | |
| | 4,720 | | | Love Field Airport Modernization Corporation, Texas, Special Facilities Revenue Bonds, Southwest Airlines Company – Love Field Modernization Program Project, Series 2012, 5.000%, 11/01/28 (Alternative Minimum Tax) | | | 11/22 at 100.00 | | | | | | | | Baa1 | | | | 5,378,818 | |
| | | | | | |
| | | | Lubbock Educational Facilities Authority, Texas, Revenue Bonds, Lubbock Christian University, Refunding & Improvement Series 2007: | | | | | | | | | | | | | | | | |
| | 1,000 | | | 5.125%, 11/01/27 | | | 11/17 at 100.00 | | | | | | | | BBB | | | | 1,036,490 | |
| | 2,500 | | | 5.250%, 11/01/37 | | | 11/17 at 100.00 | | | | | | | | BBB | | | | 2,579,400 | |
| | | | | | |
| | 1,315 | | | Mission Economic Development Corporation, Texas, Revenue Bonds, Natgasoline Project, Series 2016B, 5.750%, 10/01/31 (WI/DD, Settling 5/04/16) (Alternative Minimum Tax) | | | 10/18 at 103.00 | | | | | | | | BB– | | | | 1,371,216 | |
| | | | | | |
| | 4,590 | | | Mission Economic Development Corporation, Texas, Water Supply Revenue Bonds, Enviro Water Minerals Project, Green Bonds, Series 2015, 7.750%, 1/01/45 (Alternative Minimum Tax) | | | 1/26 at 102.00 | | | | | | | | N/R | | | | 4,672,115 | |
| | | | | | |
| | 755 | | | New Hope Cultural Education Facilities Finance Corporation, Texas, Retirement Facility Revenue Bonds, Wesleyan Homes, Inc. Project, Series 2014, 5.500%, 1/01/43 | | | 1/25 at 100.00 | | | | | | | | N/R | | | | 781,780 | |
| | | | | | |
| | 6,625 | | | New Hope Cultural Education Facilities Finance Corporation, Texas, Student Housing Revenue Bonds, CHF-Collegiate Housing Foundation – College Station I LLC – Texas A&M University Project, Series 2014A, 4.100%, 4/01/34 – AGM Insured | | | 4/24 at 100.00 | | | | | | | | AA | | | | 6,993,615 | |
| | | | | | |
| | 1,250 | | | New Hope Cultural Education Facilities Finance Corporation, Texas, Student Housing Revenue Bonds, CHF-Collegiate Housing Foundation – Stephenville II, L.L.C. – Tarleton State University Project, Series 2014A, 5.000%, 4/01/34 | | | 4/24 at 100.00 | | | | | | | | BBB– | | | | 1,377,463 | |
| | | | | | |
| | 3,000 | | | New Hope Cultural Education Facilities Finance Corporation, Texas, Student Housing Revenue Bonds, CHF-Collegiate Housing Galveston-Texas A&M University at Galveston Project, Series 2014A, 5.000%, 4/01/34 | | | 4/24 at 100.00 | | | | | | | | Baa3 | | | | 3,269,100 | |
| | | | | | |
| | 4,500 | | | New Hope Cultural Education Facilities Finance Corporation, Texas, Student Housing Revenue Bonds, CHF-Collegiate Housing NCCD College Station Properties-Texas A&M University, Series 2015A., 5.000%, 7/01/47 | | | 7/25 at 100.00 | | | | | | | | BBB– | | | | 4,915,575 | |
| | | | | | |
| | 1,200 | | | North Texas Municipal Water District, Water System Revenue Bonds, Series 2008, 5.000%, 9/01/16 | | | No Opt. Call | | | | | | | | AAA | | | | 1,218,636 | |
| | | | | | |
| | 2,000 | | | North Texas Tollway Authority, Second Tier System Revenue Refunding Bonds, Series 2008F, 5.750%, 1/01/33 (Pre-refunded 1/01/18) (UB) (6) | | | 1/18 at 100.00 | | | | | | | | A2 | | | | 2,165,320 | |
| | | | | | |
| | 10,880 | | | North Texas Tollway Authority, Special Projects System Revenue Bonds, Convertible Capital Appreciation Series 2011C, 0.000%, 9/01/45 (5) | | | 9/31 at 100.00 | | | | | | | | AA+ | | | | 12,002,272 | |
| | | | | | |
| | 2,000 | | | North Texas Tollway Authority, Special Projects System Revenue Bonds, Series 2011A, 5.500%, 9/01/41 | | | 9/21 at 100.00 | | | | | | | | AA+ | | | | 2,367,200 | |
Nuveen All-American Municipal Bond Fund (continued)
| | |
| Portfolio of Investments | | April 30, 2016 |
| | | | | | | | | | | | | | | | | | | | |
Principal
Amount (000) | | | Description (1) | | Optional Call
Provisions (2) | | | | | | | Ratings (3) | | | Value | |
| | | | | | |
| | | | Texas (continued) | | | | | | | | | | | | | |
| | | | | | |
| $ | 3,000 | | | North Texas Tollway Authority, System Revenue Bonds, First Tier Series 2009A, 6.000%, 1/01/28 | | | 1/19 at 100.00 | | | | | | | | A1 | | | $ | 3,394,500 | |
| | | | | | |
| | 4,410 | | | North Texas Tollway Authority, System Revenue Bonds, Refunding Second Tier, Series 2015A, 5.000%, 1/01/34 | | | 1/25 at 100.00 | | | | | | | | A2 | | | | 5,181,971 | |
| | | | | | |
| | 2,695 | | | Port of Houston Authority, Harris County, Texas, General Obligation Bonds, Series 2010D-1, 5.000%, 10/01/30 | | | 10/20 at 100.00 | | | | | | | | AAA | | | | 3,153,473 | |
| | | | | | |
| | | | Reagan Hospital District of Reagan County, Texas, Limited Tax Revenue Bonds, Series 2014A: | | | | | | | | | | | | | | | | |
| | 655 | | | 5.000%, 2/01/29 | | | 2/24 at 100.00 | | | | | | | | Baa2 | | | | 725,648 | |
| | 1,805 | | | 5.000%, 2/01/34 | | | 2/24 at 100.00 | | | | | | | | Baa2 | | | | 1,977,775 | |
| | 385 | | | 5.125%, 2/01/39 | | | 2/24 at 100.00 | | | | | | | | Baa2 | | | | 420,994 | |
| | | | | | |
| | 645 | | | SA Energy Acquisition Public Facilities Corporation, Texas, Gas Supply Revenue Bonds, Series 2007, 5.500%, 8/01/27 | | | No Opt. Call | | | | | | | | A | | | | 812,823 | |
| | | | | | |
| | 12,010 | | | San Antonio, Texas, Electric and Gas System Revenue Bonds, Refunding Junior Lien Series 2014, 5.000%, 2/01/17 | | | No Opt. Call | | | | | | | | AA+ | | | | 12,416,779 | |
| | | | | | |
| | 10,000 | | | San Antonio, Texas, Electric and Gas System Revenue Bonds, Refunding Series 2009A, 5.250%, 2/01/25 | | | 2/19 at 100.00 | | | | | | | | Aa1 | | | | 11,179,200 | |
| | | | | | |
| | 9,770 | | | San Antonio, Texas, Electric and Gas System Revenue Bonds, Refunding Series 2012, 5.000%, 2/01/23 | | | No Opt. Call | | | | | | | | Aa1 | | | | 12,065,364 | |
| | | | | | |
| | 4,000 | | | San Antonio, Texas, Electric and Gas System Revenue Bonds, Series 2008, 5.000%, 2/01/25 | | | 2/18 at 100.00 | | | | | | | | Aa1 | | | | 4,284,760 | |
| | | | | | |
| | | | San Marcos, Texas, General Obligation Bonds, Series 2008: | | | | | | | | | | | | | | | | |
| | 1,000 | | | 5.000%, 8/15/25 (Pre-refunded 8/15/17) – AGM Insured | | | 8/17 at 100.00 | | | | | | | | AA (4) | | | | 1,055,980 | |
| | 1,000 | | | 5.000%, 8/15/27 (Pre-refunded 8/15/17) – AGM Insured | | | 8/17 at 100.00 | | | | | | | | AA (4) | | | | 1,055,980 | |
| | | | | | |
| | 1,000 | | | San Marcos, Texas, Waterworks and Wastewater System Revenue Bonds, Series 2008, 5.000%, 8/15/26 (Pre-refunded 8/15/17) – AGM Insured | | | 8/17 at 100.00 | | | | | | | | AA (4) | | | | 1,055,980 | |
| | | | | | |
| | 9,030 | | | Southwest Higher Education Authority Inc, Texas, Revenue Bonds, Southern Methodist University, Refunding Series 2009, 5.000%, 10/01/36 | | | 10/19 at 100.00 | | | | | | | | AA– | | | | 10,095,630 | |
| | | | | | |
| | | | Tarrant County Cultural Education Facilities Finance Corporation, Texas, Hospital Revenue Bonds, Scott & White Healthcare Project, Series 2010: | | | | | | | | | | | | | | | | |
| | 70 | | | 5.500%, 8/15/45 (Pre-refunded 8/15/20) | | | 8/20 at 100.00 | | | | | | | | N/R (4) | | | | 83,201 | |
| | 870 | | | 5.500%, 8/15/45 (Pre-refunded 8/15/20) | | | 8/20 at 100.00 | | | | | | | | AA– (4) | | | | 1,035,274 | |
| | | | | | |
| | 1,600 | | | Tarrant County Cultural Education Facilities Finance Corporaton, Texas, Retirement Facility Revenue Bonds, Northwest Senior Housing-Edgemere Project, Series 2006A, 6.000%, 11/15/26 | | | 11/16 at 100.00 | | | | | | | | BBB | | | | 1,645,824 | |
| | | | | | |
| | 355 | | | Texas Municipal Gas Acquisition and Supply Corporation I, Gas Supply Revenue Bonds, Senior Lien Series 2008D, 5.625%, 12/15/17 | | | No Opt. Call | | | | | | | | BBB+ | | | | 370,687 | |
| | | | | | |
| | 3,670 | | | Texas Municipal Gas Acquisition and Supply Corporation III, Gas Supply Revenue Bonds, Series 2012, 5.000%, 12/15/27 | | | No Opt. Call | | | | | | | | A3 | | | | 4,224,684 | |
| | | | | | |
| | 4,650 | | | Texas Private Activity Bond Surface Transporation Corporation, Senior Lien Revenue Bonds, Blueridge Transportation Group, LLC SH 288 Toll Lanes Project, Series 2016, 5.000%, 12/31/45 (WI/DD, Settling 5/09/16) (Alternative Minimum Tax) | | | 12/25 at 100.00 | | | | | | | | Baa3 | | | | 5,128,299 | |
| | | | | | |
| | 845 | | | Texas Private Activity Bond Surface Transportation Corporation, Revenue Bonds, NTE Mobility Partners LLC North Tarrant Express Managed Lanes Project, Senior Lien Series 2009, 6.875%, 12/31/39 | | | 12/19 at 100.00 | | | | | | | | Baa2 | | | | 997,413 | |
| | | | | | |
| | 7,800 | | | Texas Private Activity Bond Surface Transportation Corporation, Senior Lien Revenue Bonds, LBJ Infrastructure Group LLC IH-635 Managed Lanes Project, Series 2010, 7.000%, 6/30/40 | | | 6/20 at 100.00 | | | | | | | | Baa3 | | | | 9,364,524 | |
| | | | | | |
| | 7,300 | | | Texas Private Activity Bond Surface Transportation Corporation, Senior Lien Revenue Bonds, NTE Mobility Partners Segments 3 Segments 3A & 3B Facility, Series 2013, 6.750%, 6/30/43 (Alternative Minimum Tax) | | | 9/23 at 100.00 | | | | | | | | BBB– | | | | 9,052,803 | |
| | | | | | | | | | | | | | | | | | | | |
Principal
Amount (000) | | | Description (1) | | Optional Call
Provisions (2) | | | | | | | Ratings (3) | | | Value | |
| | | | | | |
| | | | Texas (continued) | | | | | | | | | | | | | |
| | | | | | |
| $ | 1,000 | | | Texas Public Finance Authority, Charter School Finance Corporation Revenue Bonds, Idea Public School Project, Series 2007A, 5.000%, 8/15/37 (Pre-refunded 8/15/17) – ACA Insured | | | 8/17 at 100.00 | | | | | | | | BBB (4) | | | $ | 1,056,110 | |
| | | | | | |
| | 6,765 | | | Texas State Transportation Commission, Highway Fund Revenue Bonds, First Tier Series 2014A, 5.000%, 4/01/20 | | | No Opt. Call | | | | | | | | AAA | | | | 7,827,240 | |
| | | | | | |
| | 11,510 | | | Texas State, General Obligation Bonds, Transportation Commission Mobility Fund, Refunding Series 2014A, 5.000%, 10/01/24 | | | No Opt. Call | | | | | | | | AAA | | | | 14,667,653 | |
| | | | | | |
| | 1,750 | | | Texas State, General Obligation Bonds, Water Financial Assistance, Tender Option Bond Trust 2015-XF0075, 16.787%, 2/01/17 (IF) | | | 8/19 at 100.00 | | | | | | | | AAA | | | | 2,611,630 | |
| | | | | | |
| | | | Texas Transportation Commission, Central Texas Turnpike System Revenue Bonds, First Tier Refunding Series 2015B: | | | | | | | | | | | | | | | | |
| | 16,500 | | | 0.000%, 8/15/36 | | | 8/24 at 59.60 | | | | | | | | A– | | | | 7,421,865 | |
| | 7,000 | | | 0.000%, 8/15/37 | | | 8/24 at 56.94 | | | | | | | | A– | | | | 2,997,750 | |
| | | | | | |
| | 10,000 | | | Texas Transportation Commission, Central Texas Turnpike System Revenue Bonds, Second Tier Refunding Series 2015C, 5.000%, 8/15/42 | | | 8/24 at 100.00 | | | | | | | | BBB+ | | | | 11,294,000 | |
| | | | | | |
| | 5,315 | | | Texas Turnpike Authority, Central Texas Turnpike System Revenue Bonds, First Tier Series 2002A, 0.000%, 8/15/17 – AMBAC Insured | | | No Opt. Call | | | | | | | | A– | | | | 5,253,931 | |
| | | | | | |
| | 14,685 | | | Texas Turnpike Authority, Central Texas Turnpike System Revenue Bonds, First Tier Series 2002A, 0.000%, 8/15/17 – AMBAC Insured (ETM) | | | No Opt. Call | | | | | | | | A3 (3) | | | | 14,510,689 | |
| | | | | | |
| | 750 | | | Travis County Health Facilities Development Corporation, Texas, Revenue Bonds, Westminster Manor, Series 2010, 7.000%, 11/01/30 | | | 11/20 at 100.00 | | | | | | | | BBB– | | | | 868,020 | |
| | | | | | |
| | 2,000 | | | Tyler Health Facilities Development Corporation, Texas, Hospital Revenue Bonds, Mother Frances Hospital Regional Healthcare Center, Series 2007, 5.000%, 7/01/33 | | | 7/17 at 100.00 | | | | | | | | Baa1 | | | | 2,053,240 | |
| | | | | | |
| | 500 | | | Uptown Development Authority, Houston, Texas, Tax Increment Revenue Bonds, Infrastructure Improvement Facilities, Series 2009, 5.250%, 9/01/24 | | | 9/19 at 100.00 | | | | | | | | BBB | | | | 553,470 | |
| | | | | | |
| | 1,030 | | | Viridian Municipal Management District, Texas, Reinvest Zone 6 Tax Increment Revenue Bonds, Refunding Road Improvement Series 2015, 6.000%, 12/01/32 – BAM Insured | | | 12/24 at 100.00 | | | | | | | | AA | | | | 1,326,393 | |
| | | | | | |
| | 1,135 | | | Viridian Municipal Management District, Texas, Reinvest Zone 6 Tax Increment Revenue Bonds, Refunding Utility Improvement Series 2015, 6.000%, 12/01/31 – BAM Insured | | | 12/24 at 100.00 | | | | | | | | AA | | | | 1,465,705 | |
| | | | | | |
| | 6,140 | | | Ysleta Independent School District, El Paso County, Texas, General Obligation Bonds, Refunding Series 2014, 5.000%, 8/15/24 | | | No Opt. Call | | | | | | | | AAA | | | | 7,765,074 | |
| | 339,150 | | | Total Texas | | | | | | | | | | | | | | | 364,377,570 | |
| | | | | | |
| | | | Utah – 0.5% | | | | | | | | | | | | | |
| | | | | | |
| | | | Utah State Charter School Finance Authority Charter School Revenue Bonds, Vista at Entrada School of Performing Arts and Technology) Series 2012: | | | | | | | | | | | | | | | | |
| | 765 | | | 5.600%, 7/15/22 | | | No Opt. Call | | | | | | | | BB+ | | | | 833,873 | |
| | 850 | | | 6.300%, 7/15/32 | | | 7/22 at 100.00 | | | | | | | | BB+ | | | | 936,675 | |
| | | | | | |
| | 1,000 | | | Utah State Charter School Finance Authority, Charter School Revenue Bonds, Navigator Pointe Academy Project, Series 2010A, 5.625%, 7/15/40 | | | 7/20 at 100.00 | | | | | | | | BBB | | | | 1,070,340 | |
| | | | | | |
| | | | Utah State Charter School Finance Authority, Charter School Revenue Bonds, Noah Webster Academy, Series 2008A: | | | | | | | | | | | | | | | | |
| | 425 | | | 6.250%, 6/15/28 | | | 6/17 at 100.00 | | | | | | | | N/R | | | | 433,815 | |
| | 950 | | | 6.500%, 6/15/38 | | | 6/17 at 100.00 | | | | | | | | N/R | | | | 967,984 | |
| | | | | | |
| | 1,250 | | | Utah State Charter School Finance Authority, Charter School Revenue Bonds, North Davis Preparatory Academy, Series 2010, 6.250%, 7/15/30 | | | 7/20 at 100.00 | | | | | | | | BBB– | | | | 1,373,925 | |
Nuveen All-American Municipal Bond Fund (continued)
| | |
| Portfolio of Investments | | April 30, 2016 |
| | | | | | | | | | | | | | | | | | | | |
Principal
Amount (000) | | | Description (1) | | Optional Call
Provisions (2) | | | | | | | Ratings (3) | | | Value | |
| | | | | | |
| | | | Utah (continued) | | | | | | | | | | | | | |
| | | | | | |
| $ | 1,135 | | | Utah State Charter School Finance Authority, Charter School Revenue Bonds, Paradigm High School, Series 2010A, 6.375%, 7/15/40 | | | 7/20 at 100.00 | | | | | | | | BB– | | | $ | 1,176,235 | |
| | | | | | |
| | | | Utah State Charter School Finance Authority, Revenue Bonds, George Washington Academy Project, Series 2011A: | | | | | | | | | | | | | | | | |
| | 2,135 | | | 7.750%, 7/15/31 (Pre-refunded 7/15/21) | | | 7/21 at 100.00 | | | | | | | | BBB– (4) | | | | 2,691,232 | |
| | 3,520 | | | 8.000%, 7/15/41 (Pre-refunded 7/15/21) | | | 7/21 at 100.00 | | | | | | | | BBB– (4) | | | | 4,630,102 | |
| | 12,030 | | | Total Utah | | | | | | | | | | | | | | | 14,114,181 | |
| | | | | | |
| | | | Vermont – 0.1% | | | | | | | | | | | | | |
| | | | | | |
| | | | Vermont Educational and Health Buildings FInancing Agency, Revenue Bonds, Vermont Law School Project, Series 2011A: | | | | | | | | | | | | | | | | |
| | 1,815 | | | 6.125%, 1/01/28 | | | 1/21 at 100.00 | | | | | | | | N/R | | | | 1,919,453 | |
| | 1,000 | | | 6.250%, 1/01/33 | | | 1/21 at 100.00 | | | | | | | | N/R | | | | 1,053,320 | |
| | 2,815 | | | Total Vermont | | | | | | | | | | | | | | | 2,972,773 | |
| | | | | | |
| | | | Virgin Islands – 0.1% | | | | | | | | | | | | | |
| | | | | | |
| | 2,480 | | | Virgin Islands Public Finance Authority, Matching Fund Revenue Loan Note – Diageo Project, Series 2009A, 6.750%, 10/01/37 | | | 10/19 at 100.00 | | | | | | | | Baa3 | | | | 2,788,090 | |
| | | | | | |
| | | | Virginia – 1.3% | | | | | | | | | | | | | |
| | | | | | |
| | 580 | | | Arlington County Industrial Development Authority, Virginia, Multifamily Housing Mortgage Revenue Bonds, Berkeley Apartments, Series 2000, 5.850%, 12/01/20 (Alternative Minimum Tax) | | | 5/16 at 100.00 | | | | | | | | AA | | | | 581,989 | |
| | | | | | |
| | 11,370 | | | Fairfax County, Virginia, General Obligation Bonds, Public Improvement Series 2015A, 5.000%, 10/01/16 | | | No Opt. Call | | | | | | | | AAA | | | | 11,588,645 | |
| | | | | | |
| | 2,000 | | | Metropolitan Washington Airports Authority, Virginia, Airport System Revenue Bonds, Refunding Series 2011C, 5.000%, 10/01/26 (Alternative Minimum Tax) | | | 10/21 at 100.00 | | | | | | | | AA– | | | | 2,314,060 | |
| | | | | | |
| | 3,745 | | | Metropolitan Washington Airports Authority, Virginia, Dulles Toll Road Second Senior Lien Revenue Bonds, Series 2009B, 0.000%, 10/01/31 – AGC Insured | | | No Opt. Call | | | | | | | | AA | | | | 2,155,210 | |
| | | | | | |
| | 4,000 | | | Tobacco Settlement Financing Corporation of Virginia, Tobacco Settlement Asset Backed Bonds, Series 2007B1, 5.000%, 6/01/47 | | | 6/17 at 100.00 | | | | | | | | B– | | | | 3,520,560 | |
| | | | | | |
| | 1,000 | | | Virginia College Building Authority, Educational Facilities Revenue Bonds, Marymount University Project, Green Series 2015B, 5.000%, 7/01/45 | | | 7/25 at 100.00 | | | | | | | | BB+ | | | | 1,035,840 | |
| | | | | | |
| | 5,500 | | | Virginia Small Business Financing Authority, Senior Lien Revenue Bonds, 95 Express Lanes LLC Project, Series 2012, 5.000%, 1/01/40 (Alternative Minimum Tax) | | | 1/22 at 100.00 | | | | | | | | BBB– | | | | 6,018,540 | |
| | | | | | |
| | | | Virginia Small Business Financing Authority, Senior Lien Revenue Bonds, Elizabeth River Crossing, Opco LLC Project, Series 2012: | | | | | | | | | | | | | | | | |
| | 3,515 | | | 5.250%, 1/01/32 (Alternative Minimum Tax) | | | 7/22 at 100.00 | | | | | | | | BBB– | | | | 3,972,231 | |
| | 6,515 | | | 5.500%, 1/01/42 (Alternative Minimum Tax) | | | 7/22 at 100.00 | | | | | | | | BBB– | | | | 7,449,903 | |
| | 38,225 | | | Total Virginia | | | | | | | | | | | | | | | 38,636,978 | |
| | | | | | |
| | | | Washington – 3.2% | | | | | | | | | | | | | |
| | | | | | |
| | 6,220 | | | Clark County Public Utility District 1, Washington, Electric System Revenue Bonds, Refunding Series 2011, 5.250%, 1/01/31 | | | 1/21 at 100.00 | | | | | | | | A1 | | | | 7,096,336 | |
| | | | | | |
| | 960 | | | FYI Properties, Washington, Lease Revenue Bonds, Washington State Department of Information Services Project, Tender Option Bond Trust 2009-14A&B, 18.283%, 7/01/32 (IF) (6) | | | 6/19 at 100.00 | | | | | | | | AA+ | | | | 1,437,734 | |
| | | | | | |
| | 2,450 | | | King County Public Hospital District 4, Washington, General Obligation Bonds, Snoqualmie Valley Hospital, Refunding Improvement Series 2011, 7.000%, 12/01/40 | | | 12/21 at 100.00 | | | | | | | | N/R | | | | 2,703,771 | |
| | | | | | | | | | | | | | | | | | | | |
Principal
Amount (000) | | | Description (1) | | Optional Call
Provisions (2) | | | | | | | Ratings (3) | | | Value | |
| | | | | | |
| | | | Washington (continued) | | | | | | | | | | | | | |
| | | | | | |
| $ | 2,335 | | | King County, Washington, Sewer Revenue Bonds, Tender Option Bond Trust 3090, 12.670%, 1/01/39 – AGM Insured (IF) (6) | | | 7/17 at 100.00 | | | | | | | | AA+ | | | $ | 2,694,847 | |
| | | | | | |
| | 1,050 | | | Ocean Shores, Washington, Local Improvement District 2007-01 Bonds, 2011, 7.250%, 2/01/31 | | | No Opt. Call | | | | | | | | BBB+ | | | | 1,404,564 | |
| | | | | | |
| | 3,000 | | | Snohomish County School District 15, Edmonds, Washington, General Obligation Bonds, Series 2006, 5.000%, 12/01/19 (Pre-refunded 6/01/16) – NPFG Insured | | | 6/16 at 100.00 | | | | | | | | AA+ (4) | | | | 3,012,180 | |
| | | | | | |
| | 5,660 | | | Spokane, Washington, General Obligation Bonds, Series 2015, 3.000%, 12/01/32 | | | 12/24 at 100.00 | | | | | | | | AA | | | | 5,802,406 | |
| | | | | | |
| | 2,000 | | | Washington Health Care Facilities Authority, Revenue Bonds, Fred Hutchinson Cancer Research Center, Series 2011A, 5.625%, 1/01/35 | | | 1/21 at 100.00 | | | | | | | | A | | | | 2,251,820 | |
| | | | | | |
| | 3,535 | | | Washington Health Care Facilities Authority, Revenue Bonds, Kadlec Regional Medical Center, Series 2010, 5.250%, 12/01/30 (Pre-refunded 12/01/20) | | | 12/20 at 100.00 | | | | | | | | N/R (4) | | | | 4,203,044 | |
| | | | | | |
| | | | Washington Health Care Facilities Authority, Revenue Bonds, Kadlec Regional Medical Center, Series 2012: | | | | | | | | | | | | | | | | |
| | 2,775 | | | 5.000%, 12/01/27 (Pre-refunded 12/01/21) | | | 12/21 at 100.00 | | | | | | | | N/R (4) | | | | 3,351,673 | |
| | 2,435 | | | 5.000%, 12/01/42 (Pre-refunded 12/01/21) | | | 12/21 at 100.00 | | | | | | | | N/R (4) | | | | 2,941,017 | |
| | | | | | |
| | 1,600 | | | Washington Health Care Facilities Authority, Revenue Bonds, PeaceHealth, Refunding Series 2014A, 5.000%, 11/15/28 | | | 5/24 at 100.00 | | | | | | | | A+ | | | | 1,899,616 | |
| | | | | | |
| | 600 | | | Washington Public Power Supply System, Revenue Refunding Bonds, Nuclear Project 3, Series 1989B, 7.125%, 7/01/16 (ETM) | | | No Opt. Call | | | | | | | | Aa1 (4) | | | | 606,900 | |
| | | | | | |
| | 845 | | | Washington State Health Care Facilities Authority, Revenue Bonds, Central Washington Health Services Association, Series 2009, 6.250%, 7/01/24 | | | 7/19 at 100.00 | | | | | | | | Baa1 | | | | 956,920 | |
| | | | | | |
| | | | Washington State Health Care Facilities Authority, Revenue Bonds, Central Washington Health Services Association, Series 2009: | | | | | | | | | | | | | | | | |
| | 1,155 | | | 6.250%, 7/01/24 (Pre-refunded 7/01/19) | | | 7/19 at 100.00 | | | | | | | | N/R (4) | | | | 1,349,583 | |
| | 2,000 | | | 7.000%, 7/01/39 (Pre-refunded 7/01/19) | | | 7/19 at 100.00 | | | | | | | | Baa1 (4) | | | | 2,385,180 | |
| | | | | | |
| | 3,000 | | | Washington State Higher Education Facilities Authority, Revenue Bonds, Whitworth University, Series 2009, 5.375%, 10/01/29 | | | 10/19 at 100.00 | | | | | | | | Baa1 | | | | 3,300,570 | |
| | | | | | |
| | 1,100 | | | Washington State Housing Finance Commission, Non-Profit Revenue Bonds, Emerald Heights Project, Refunding 2013, 5.000%, 7/01/28 | | | 7/23 at 100.00 | | | | | | | | A– | | | | 1,235,696 | |
| | | | | | |
| | 2,340 | | | Washington State Housing Finance Commission, Revenue Bonds, Riverview Retirement Community, Refunding Series 2012, 5.000%, 1/01/48 | | | No Opt. Call | | | | | | | | BBB– | | | | 2,430,558 | |
| | | | | | |
| | 2,250 | | | Washington State Housing Finance Commission, Single Family Program Bonds, Series 2015-1N, 3.700%, 12/01/34 | | | 6/25 at 100.00 | | | | | | | | Aaa | | | | 2,365,290 | |
| | | | | | |
| | 10,000 | | | Washington State, General Obligation Bonds, 2007A Series 2006, 5.000%, 7/01/29 (Pre-refunded 7/01/16) – AGM Insured | | | 7/16 at 100.00 | | | | | | | | AA+ (4) | | | | 10,078,300 | |
| | | | | | |
| | 10,885 | | | Washington State, General Obligation Bonds, Motor Vehicle Fuel Tax, Series 2006B, 5.000%, 7/01/29 (Pre-refunded 7/01/16) – AGM Insured | | | 7/16 at 100.00 | | | | | | | | AA+ (4) | | | | 10,970,230 | |
| | | | | | |
| | 6,545 | | | Washington State, General Obligation Bonds, Various Purpose Series 2013D, 5.000%, 2/01/23 | | | No Opt. Call | | | | | | | | AA+ | | | | 8,068,414 | |
| | | | | | |
| | 10,000 | | | Washington State, General Obligation Bonds, Various Purpose, Refunding Series R-2015A, 5.000%, 7/01/23 | | | No Opt. Call | | | | | | | | AA+ | | | | 12,429,200 | |
| | 84,740 | | | Total Washington | | | | | | | | | | | | | | | 94,975,849 | |
| | | | | | |
| | | | West Virginia – 0.1% | | | | | | | | | | | | | |
| | | | | | |
| | 500 | | | Ohio County Commission, West Virginia, Tax Increment Revenue Bonds, Fort Henry Centre Financing District, Series 2007A, 5.850%, 6/01/34 | | | 6/17 at 100.00 | | | | | | | | N/R | | | | 509,684 | |
| | | | | | |
| | 1,020 | | | West Virginia Hospital Finance Authority, Hospital Revenue Bonds, Charleston Area Medical Center, Series 2009A, 5.625%, 9/01/32 | | | 9/19 at 100.00 | | | | | | | | A3 | | | | 1,134,270 | |
Nuveen All-American Municipal Bond Fund (continued)
| | |
| Portfolio of Investments | | April 30, 2016 |
| | | | | | | | | | | | | | | | | | | | |
Principal
Amount (000) | | | Description (1) | | Optional Call
Provisions (2) | | | | | | | Ratings (3) | | | Value | |
| | | | | | |
| | | | West Virginia (continued) | | | | | | | | | | | | | |
| | | | | | |
| $ | 1,000 | | | West Virginia Hospital Finance Authority, Hospital Revenue Bonds, Thomas Health System, Inc., Series 2008, 6.500%, 10/01/28 | | | 10/18 at 100.00 | | | | | | | | N/R | | | $ | 1,058,549 | |
| | 2,520 | | | Total West Virginia | | | | | | | | | | | | | | | 2,702,503 | |
| | | | | | |
| | | | Wisconsin – 4.2% | | | | | | | | | | | | | |
| | | | | | |
| | 5,000 | | | Oneida Tribe of Indians of Wisconsin, Retail Sales Revenue Bonds, Series 2011-144A, 6.500%, 2/01/31 | | | 2/19 at 102.00 | | | | | | | | AA– | | | | 5,721,399 | |
| | | | | | |
| | 1,250 | | | Public Finance Authority of Wisconsin, Charter School Revenue Bonds, Cornerstone Charter Academy, North Carolina, Series 2016A, 5.000%, 2/01/36 | | | 2/26 at 100.00 | | | | | | | | N/R | | | | 1,253,737 | |
| | | | | | |
| | | | Public Finance Authority of Wisconsin, Charter School Revenue Bonds, Voyager Foundation Inc. of North Carolina, Series 2012A: | | | | | | | | | | | | | | | | |
| | 320 | | | 5.500%, 10/01/22 | | | No Opt. Call | | | | | | | | BB+ | | | | 358,665 | |
| | 375 | | | 6.000%, 10/01/32 | | | 10/22 at 100.00 | | | | | | | | BB+ | | | | 410,208 | |
| | | | | | |
| | | | Public Finance Authority of Wisconsin, Charter School Revenue Bonds, Voyager Foundation, Inc. of North Carolina Project, Series 2014A: | | | | | | | | | | | | | | | | |
| | 1,080 | | | 5.000%, 10/01/34 | | | 10/22 at 100.00 | | | | | | | | BB+ | | | | 1,119,538 | |
| | 500 | | | 5.125%, 10/01/45 | | | 10/22 at 100.00 | | | | | | | | BB+ | | | | 514,294 | |
| | | | | | |
| | | | Public Finance Authority of Wisconsin, Educational Facility Revenue Bonds, Cottonwood Classical Preparatory School in Albuquerque, New Mexico, Series 2012A: | | | | | | | | | | | | | | | | |
| | 1,610 | | | 6.000%, 12/01/32 | | | No Opt. Call | | | | | | | | N/R | | | | 1,670,084 | |
| | 5,000 | | | 6.250%, 12/01/42 | | | No Opt. Call | | | | | | | | N/R | | | | 5,201,849 | |
| | | | | | |
| | 1,940 | | | Public Finance Authority of Wisconsin, Exempt Facilities Revenue Bonds, National Gypsum Company Project, Refunding Series 2014, 5.250%, 4/01/30 (Alternative Minimum Tax) | | | 11/24 at 100.00 | | | | | | | | N/R | | | | 2,075,838 | |
| | | | | | |
| | 1,575 | | | Public Finance Authority of Wisconsin, Revenue Bonds, Carolina International School, Series 2013A, 7.000%, 8/01/43 | | | 8/23 at 100.00 | | | | | | | | BB+ | | | | 1,793,310 | |
| | | | | | |
| | 5,000 | | | Public Finance Authority, Wisconsin, Exempt Facilities Revenue Bonds, Celanese Project, Refunding Series 2016C, 4.300%, 11/01/30 (Alternative Minimum Tax) | | | 5/26 at 100.00 | | | | | | | | BB+ | | | | 5,176,949 | |
| | | | | | |
| | 2,550 | | | Superior, Wisconsin, Limited Obligation Revenue Refunding Bonds, Midwest Energy Resources Company, Series 1991E, 6.900%, 8/01/21 – FGIC Insured | | | No Opt. Call | | | | | | | | AA– | | | | 3,247,246 | |
| | | | | | |
| | 1,455 | | | Wisconsin Health and Educational Facilities Authority, Revenue Bonds, Aurora Health Care, Inc., Series 2010A, 5.250%, 4/15/24 | | | 4/20 at 100.00 | | | | | | | | A2 | | | | 1,647,976 | |
| | | | | | |
| | 1,225 | | | Wisconsin Health and Educational Facilities Authority, Revenue Bonds, Beloit College, Series 2010A, 6.125%, 6/01/39 | | | 6/20 at 100.00 | | | | | | | | Baa2 | | | | 1,365,249 | |
| | | | | | |
| | 13,950 | | | Wisconsin Health and Educational Facilities Authority, Revenue Bonds, Gundersen Lutheran, Series 2011A, 5.250%, 10/15/39 | | | 10/21 at 100.00 | | | | | | | | A+ | | | | 15,896,861 | |
| | | | | | |
| | | | Wisconsin Health and Educational Facilities Authority, Revenue Bonds, Marshfield Clinic, Series 2012B: | | | | | | | | | | | | | | | | |
| | 1,000 | | | 5.000%, 2/15/40 | | | 2/22 at 100.00 | | | | | | | | A– | | | | 1,112,069 | |
| | 35 | | | 4.500%, 2/15/40 | | | 2/22 at 100.00 | | | | | | | | A– | | | | 37,434 | |
| | | | | | |
| | 18,000 | | | Wisconsin Health and Educational Facilities Authority, Revenue Bonds, Mercy Alliance, Inc., Series 2012, 5.000%, 6/01/32 | | | 6/22 at 100.00 | | | | | | | | A3 | | | | 20,250,539 | |
| | | | | | |
| | 7,000 | | | Wisconsin Health and Educational Facilities Authority, Revenue Bonds, Ministry Health Care, Inc., Refunding 2012C, 5.000%, 8/15/32 | | | 8/22 at 100.00 | | | | | | | | AA | | | | 7,965,019 | |
| | | | | | |
| | 435 | | | Wisconsin Health and Educational Facilities Authority, Revenue Bonds, ProHealth Care, Inc. Obligated Group, Refunding Series 2015, 5.000%, 8/15/39 | | | 8/24 at 100.00 | | | | | | | | A+ | | | | 496,217 | |
| | | | | | | | | | | | | | | | | | | | |
Principal
Amount (000) | | | Description (1) | | Optional Call
Provisions (2) | | | | | | | Ratings (3) | | | Value | |
| | | | | | |
| | | | Wisconsin (continued) | | | | | | | | | | | | | |
| | | | | | |
| $ | 595 | | | Wisconsin Health and Educational Facilities Authority, Revenue Bonds, ProHealth Care, Inc. Obligated Group, Series 2009, 6.625%, 2/15/39 (Pre-refunded 2/15/19) | | | 2/19 at 100.00 | | | | | | | | A1 (4) | | | $ | 690,401 | |
| | | | | | |
| | | | Wisconsin Health and Educational Facilities Authority, Revenue Bonds, Rogers Memorial Hospital, Inc., Series 2014A: | | | | | | | | | | | | | | | | |
| | 2,980 | | | 5.000%, 7/01/34 | | | 7/24 at 100.00 | | | | | | | | BBB+ | | | | 3,359,502 | |
| | 2,100 | | | 4.350%, 7/01/36 | | | 7/21 at 100.00 | | | | | | | | BBB+ | | | | 2,168,732 | |
| | | | | | |
| | 3,450 | | | Wisconsin Health and Educational Facilities Authority, Revenue Bonds, Three Pillars Senior Living Communities, Refunding Series 2013, 5.000%, 8/15/43 | | | 8/23 at 100.00 | | | | | | | | A– | | | | 3,756,118 | |
| | | | | | |
| | 2,535 | | | Wisconsin Health and Educational Facilities Authority, Revenue Bonds, Wheaton Franciscan Services Inc., Series 2006B, 5.125%, 8/15/30 (Pre-refunded 8/15/16) | | | 8/16 at 100.00 | | | | | | | | N/R (4) | | | | 2,569,424 | |
| | | | | | |
| | | | Wisconsin Health and Educational Facilities Authority, Revenue Bonds, Woodland Hills Senior Housing Project, Series 2014: | | | | | | | | | | | | | | | | |
| | 5,000 | | | 5.000%, 12/01/34 | | | 12/22 at 102.00 | | | | | | | | N/R | | | | 5,187,099 | |
| | 4,435 | | | 5.000%, 12/01/44 | | | 12/22 at 102.00 | | | | | | | | N/R | | | | 4,549,999 | |
| | 4,225 | | | 5.250%, 12/01/49 | | | 12/22 at 102.00 | | | | | | | | N/R | | | | 4,361,931 | |
| | | | | | |
| | | | Wisconsin Health and Educational Facilities Authority, Wisconsin, Revenue Bonds, Dickson Hollow Project. Series 2014: | | | | | | | | | | | | | | | | |
| | 1,880 | | | 5.250%, 10/01/39 | | | 10/22 at 102.00 | | | | | | | | N/R | | | | 1,955,801 | |
| | 1,000 | | | 5.375%, 10/01/44 | | | 10/22 at 102.00 | | | | | | | | N/R | | | | 1,042,399 | |
| | 3,500 | | | 5.500%, 10/01/49 | | | 10/22 at 102.00 | | | | | | | | N/R | | | | 3,650,849 | |
| | | | | | |
| | 11,750 | | | Wisconsin State, General Obligation Bonds, Refunding Series 2016-1, 5.000%, 11/01/24 | | | No Opt. Call | | | | | | | | AA | | | | 14,995,349 | |
| | 112,750 | | | Total Wisconsin | | | | | | | | | | | | | | | 125,602,085 | |
| | | | | | |
| | | | Wyoming – 0.5% | | | | | | | | | | | | | |
| | | | | | |
| | 2,000 | | | Campbell County, Wyoming Solid Waste Facilities Revenue Bonds, Basin Electric Power Cooperative – Dry Fork Station Facilities, Series 2009A, 5.750%, 7/15/39 | | | 7/19 at 100.00 | | | | | | | | A1 | | | | 2,265,419 | |
| | | | | | |
| | 4,500 | | | Natrona County, Wyoming, Hospital Revenue Bonds, Wyoming Medical Center Project, Series 2011, 6.350%, 9/15/31 | | | 3/21 at 100.00 | | | | | | | | A3 | | | | 5,197,904 | |
| | | | | | |
| | | | Teton County Hospital District, Wyoming, Hospital Revenue Bonds, St. John’s Medical Center Project, Series 2011B: | | | | | | | | | | | | | | | | |
| | 800 | | | 5.500%, 12/01/27 | | | 12/21 at 100.00 | | | | | | | | BBB+ | | | | 917,207 | |
| | 2,500 | | | 6.000%, 12/01/36 | | | 12/21 at 100.00 | | | | | | | | BBB+ | | | | 2,883,899 | |
| | | | | | |
| | 3,650 | | | West Park Hospital District, Wyoming, Hospital Revenue Bonds, Series 2011A, 7.000%, 6/01/40 | | | 6/21 at 100.00 | | | | | | | | BBB | | | | 4,316,197 | |
| | 13,450 | | | Total Wyoming | | | | | | | | | | | | | | | 15,580,626 | |
| $ | 2,780,173 | | | Total Municipal Bonds (cost $2,733,965,681) | | | | | | | | | | | | | | | 2,997,049,187 | |
Nuveen All-American Municipal Bond Fund (continued)
| | |
| Portfolio of Investments | | April 30, 2016 |
| | | | | | | | | | | | | | | | | | | | |
Principal
Amount (000) | | | Description (1) | | Coupon | | | Maturity | | | Ratings (3) | | | Value | |
| | | | | |
| | | | CORPORATE BONDS – 0.0% | | | | | | | | | | | | | | | | |
| | | | | |
| | | | Transportation – 0.0% | | | | | | | | | | | | |
| | | | | |
| $ | 139 | | | Las Vegas Monorail Company, Senior Interest Bonds (13), (14) | | | 5.500% | | | | 7/15/19 | | | | N/R | | | $ | 4,158 | |
| | | | | |
| | 37 | | | Las Vegas Monorail Company, Senior Interest Bonds (13), (14) | | | 5.500% | | | | 7/15/55 | | | | N/R | | | | 1,106 | |
| $ | 176 | | | Total Corporate Bonds (cost $15,730) | | | | | | | | | | | | | | | 5,264 | |
| | | | Total Long-Term Investments (cost $2,733,981,411) | | | | | | | | | | | | | | | 2,997,054,451 | |
| | | | Floating Rate Obligations – (2.2)% | | | | | | | | | | | | | | | (67,370,000 | ) |
| | | | Other Assets Less Liabilities – 2.7% | | | | | | | | | | | | | | | 82,881,858 | |
| | | | Net Assets – 100% | | | | | | | | | | | | | | $ | 3,012,566,309 | |
| (1) | All percentages shown in the Portfolio of Investments are based on net assets. |
| (2) | Optional Call Provisions (not covered by the report of independent registered public accounting firm): Dates (month and year) and prices of the earliest optional call or redemption. There may be other call provisions at varying prices at later dates. Certain mortgage-backed securities may be subject to periodic principal paydowns. |
| (3) | Ratings (not covered by the report of independent registered public accounting firm): Using the highest of Standard & Poor’s Group (“Standard & Poor’s”), Moody’s Investors Service, Inc. (“Moody’s”) or Fitch, Inc. (“Fitch”) rating. Ratings below BBB by Standard & Poor’s, Baa by Moody’s or BBB by Fitch are considered to be below investment grade. Holdings designated N/R are not rated by any of these national rating agencies. |
| (4) | Backed by an escrow or trust containing sufficient U.S. Government or U.S. Government agency securities, which ensure the timely payment of principal and interest. Certain bonds backed by U.S. Government or agency securities are regarded as having an implied rating equal to the rating of such securities. |
| (5) | Step-up coupon. The rate shown is the coupon as of the end of the reporting period. |
| (6) | Investment, or portion of investment, has been pledged to collateralize the net payment obligations for investments in inverse floating rate transactions. |
| (7) | The coupon for this security increased 0.25% effective January 1, 2016 and will increase an additional 0.25% effective May 11, 2016. |
| (8) | As of, or subsequent to, the end of the reporting period, this security is non-income producing. Non-income producing, in the case of a fixed-income security, generally denotes that the issuer has (1) defaulted on the payment of principal or interest, (2) is under the protection of the Federal Bankruptcy Court or (3) the Fund’s Adviser has concluded that the issue is not likely to meet its future interest payment obligations and has ceased accruing additional income on the Fund’s records. |
| (9) | On January 7, 2015, the Fund’s Adviser determined it was unlikely that this borrower would fulfill its entire obligation on this security, and therefore reduced the security’s interest rate of accrual from 7.125% to 5.700% and again on November 11, 2015, further reduced the security’s interest rate of accrual from 5.700% to 4.275%. |
| (10) | On May 7, 2015, the Fund’s Adviser determined it was unlikely that this borrower would fulfill its entire obligation on this security, and therefore reduced the security’s interest rate of accrual from 5.250% to 2.100%. |
| (11) | On April 1, 2013, the Fund’s Adviser determined it was unlikely that this borrower would fulfill its entire obligation on this security, and therefore reduced the security’s interest rate of accrual from 5.750% to 2.300%. |
| (12) | On April 1, 2013, the Fund’s Adviser determined it was unlikely that this borrower would fulfill its entire obligation on this security, and therefore reduced the security’s interest rate of accrual from 5.875% to 2.350%. |
| (13) | During January 2010, Las Vegas Monorail Company (“Las Vegas Monorail”) filed for federal bankruptcy protection. During March 2012, Las Vegas Monorail emerged from federal bankruptcy with the acceptance of a reorganization plan assigned by the Federal Bankruptcy Court. Under the reorganization plan, the Fund surrendered its Las Vegas Monorail Project Revenue Bonds, First Tier, Series 2000 and in turn received two senior interest corporate bonds: the first with an annual coupon rate of 5.500% maturing on July 15, 2019 and the second with an annual coupon rate of 3.000% (5.500% after December 31, 2015) maturing on July 15, 2055. The Fund is not accruing income for either senior interest corporate bond. |
| (14) | Investment valued at fair value using methods determined in good faith by, or at the discretion of, the Board. For fair value measurement disclosure purposes, investment classified as Level 3. See Notes to Financial Statements, Note 2 – Investment Valuation and Fair Value Measurements for more information. |
| (ETM) | Escrowed to maturity. |
| (IF) | Inverse floating rate investment. |
| (UB) | Underlying bond of an inverse floating rate trust reflected as a financing transaction. See Notes to Financial Statements, Note 3 – Portfolio Securities and Investments in Derivatives, Inverse Floating Rate Securities for more information. |
| (WI/DD) | Investment, or portion of investment purchased on a when-issued or delayed delivery basis. |
See accompanying notes to financial statements.
Nuveen Inflation Protected Municipal Bond Fund
| | |
| Portfolio of Investments | | April 30, 2016 |
| | | | | | | | | | | | | | | | |
Principal
Amount (000) | | | Description (1) | | Optional Call
Provisions (2) | | | Ratings (3) | | | Value | |
| | | | |
| | | | LONG-TERM INVESTMENTS – 105.3% | | | | | | | | | | | | |
| | | | |
| | | | MUNICIPAL BONDS – 105.3% | | | | | | | | | | | | |
| | | | |
| | | | Arizona – 1.0% | | | | | | | | | |
| | | | |
| $ | 390 | | | Arizona Health Facilities Authority, Hospital System Revenue Bonds, Phoenix Children’s Hospital, Refunding Series 2012A, 5.000%, 2/01/19 | | | No Opt. Call | | | | BBB+ | | | $ | 431,726 | |
| | | | |
| | | | California – 14.4% | | | | | | | | | |
| | | | |
| | 1,000 | | | Alameda Corridor Transportation Authority, California, Revenue Bonds, Refunding Senior Lien Series 2013A, 5.000%, 10/01/27 – AGM Insured (4) | | | 10/23 at 100.00 | | | | AA | | | | 1,221,970 | |
| | | | |
| | 305 | | | Alameda Corridor Transportation Authority, California, Revenue Bonds, Refunding Subordinate Lien Series 2004A, 5.300%, 10/01/23 – AMBAC Insured | | | No Opt. Call | | | | BBB+ | | | | 323,404 | |
| | | | |
| | 850 | | | California Municipal Finance Authority, Revenue Bonds, University of San Diego, Refunding Series 2012A, 5.000%, 10/01/31 | | | No Opt. Call | | | | A1 | | | | 996,243 | |
| | | | |
| | 470 | | | El Camino Community College District, California, General Obligation Bonds, Election of 2002 Series 2012C, 0.000%, 8/01/21 | | | No Opt. Call | | | | Aa1 | | | | 435,060 | |
| | | | |
| | 555 | | | Golden State Tobacco Securitization Corporation, California, Enhanced Tobacco Settlement Asset-Backed Revenue Bonds, Series 2013A, 5.000%, 6/01/21 | | | No Opt. Call | | | | A+ | | | | 655,993 | |
| | | | |
| | 920 | | | Inland Empire Tobacco Securitization Authority, California, Tobacco Settlement Asset-Backed Bonds, Series 2007, 5.000%, 6/01/21 | | | 6/17 at 100.00 | | | | CC | | | | 927,461 | |
| | | | |
| | 130 | | | Los Angeles Regional Airports Improvement Corporation, California, Lease Revenue Refunding Bonds, LAXFUEL Corporation at Los Angeles International Airport, Series 2012, 5.000%, 1/01/21 (Alternative Minimum Tax) | | | No Opt. Call | | | | A | | | | 151,798 | |
| | | | |
| | 800 | | | San Francisco, California, Community Facilities District 6, Mission Bay South Public Improvements, Special Tax Refunding Bonds, Series 2013A, 5.000%, 8/01/25 | | | 8/22 at 100.00 | | | | N/R | | | | 932,040 | |
| | | | |
| | 475 | | | San Joaquin Hills Transportation Corridor Agency, Orange County, California, Toll Road Revenue Bonds, Refunding Senior Lien Series 2014A, 5.000%, 1/15/17 | | | No Opt. Call | | | | BBB– | | | | 488,870 | |
| | 5,505 | | | Total California | | | | | | | | | | | 6,132,839 | |
| | | | |
| | | | Colorado – 14.8% | | | | | | | | | |
| | | | |
| | 555 | | | Denver City and County, Colorado, Airport System Revenue Bonds, Series 2012A, 5.000%, 11/15/22 (Alternative Minimum Tax) | | | No Opt. Call | | | | A+ | | | | 667,937 | |
| | | | |
| | 1,000 | | | Denver Urban Renewal Authority, Colorado, Tax Increment Revenue Bonds, Stapleton Senior Refunding Series 2013A-1, 5.000%, 12/01/23 | | | 12/22 at 100.00 | | | | A– | | | | 1,205,370 | |
| | | | |
| | 1,000 | | | Denver West Metropolitan District, Jefferson County, Colorado, General Obligation Refunding Bonds, Series 2012A, 4.000%, 12/01/20 – AGM Insured | | | No Opt. Call | | | | AA | | | | 1,118,220 | |
| | | | |
| | 525 | | | E-470 Public Highway Authority, Colorado, Senior Revenue Bonds, Series 1997B, 0.000%, 9/01/21 – NPFG Insured | | | No Opt. Call | | | | AA– | | | | 473,114 | |
| | | | |
| | 1,000 | | | E-470 Public Highway Authority, Colorado, Senior Revenue Bonds, Series 2000B, 0.000%, 9/01/20 – NPFG Insured | | | No Opt. Call | | | | AA– | | | | 923,130 | |
| | | | |
| | 1,250 | | | Plaza Metropolitan District 1, Lakewood, Colorado, Tax Increment Revenue Bonds, Refunding Series 2013, 5.000%, 12/01/19 | | | No Opt. Call | | | | N/R | | | | 1,338,500 | |
| | | | |
| | 500 | | | Regional Transportation District, Colorado, Denver Transit Partners Eagle P3 Project Private Activity Bonds, Series 2010, 5.250%, 7/15/24 | | | 7/20 at 100.00 | | | | BBB+ | | | | 563,680 | |
| | 5,830 | | | Total Colorado | | | | | | | | | | | 6,289,951 | |
Nuveen Inflation Protected Municipal Bond Fund (continued)
| | |
| Portfolio of Investments | | April 30, 2016 |
| | | | | | | | | | | | | | | | |
Principal
Amount (000) | | | Description (1) | | Optional Call
Provisions (2) | | | Ratings (3) | | | Value | |
| | | | |
| | | | District of Columbia – 0.7% | | | | | | | | | |
| | | | |
| $ | 260 | | | District of Columbia, Revenue Bonds, Association of American Medical Colleges, Series 2011A, 5.000%, 10/01/24 | | | 10/23 at 100.00 | | | | A+ | | | $ | 319,129 | |
| | | | |
| | | | Florida – 1.8% | | | | | | | | | |
| | | | |
| | 620 | | | Miami-Dade County, Florida, Transit System Sales Surtax Revenue Bonds, Refunding Series 2012, 5.000%, 7/01/22 (4) | | | No Opt. Call | | | | AA | | | | 748,080 | |
| | | | |
| | | | Georgia – 2.7% | | | | | | | | | |
| | | | |
| | | | Liberty County Industrial Authority, Georgia, Revenue Bonds, Series 2014: | | | | | | | | | | | | |
| | 188 | | | 5.500%, 7/15/23 | | | 7/21 at 100.00 | | | | N/R | | | | 193,381 | |
| | 374 | | | 5.500%, 7/15/30 | | | 7/21 at 100.00 | | | | N/R | | | | 384,248 | |
| | 410 | | | 5.500%, 1/15/36 | | | 7/21 at 100.00 | | | | N/R | | | | 421,710 | |
| | | | |
| | 110 | | | Main Street Natural Gas Inc., Georgia, Gas Project Revenue Bonds, Series 2007A, 5.500%, 9/15/26 | | | No Opt. Call | | | | A | | | | 137,823 | |
| | 1,082 | | | Total Georgia | | | | | | | | | | | 1,137,162 | |
| | | | |
| | | | Illinois – 9.0% | | | | | | | | | |
| | | | |
| | 305 | | | Chicago, Illinois, Wastewater Transmission Revenue Bonds, Second Lien Series 2001A, 5.500%, 1/01/30 – NPFG Insured | | | No Opt. Call | | | | AA– | | | | 367,211 | |
| | | | |
| | 335 | | | Illinois Finance Authority, Revenue Bonds, Alexian Brothers Health System, Refunding Series 2005B, 5.250%, 1/01/22 (Pre-refunded 4/14/18) – AGM Insured | | | 4/18 at 100.00 | | | | A2 (5) | | | | 364,266 | |
| | | | |
| | 325 | | | Illinois Finance Authority, Revenue Bonds, Art Institute of Chicago, Series 2012A, 5.000%, 3/01/22 | | | No Opt. Call | | | | AA– | | | | 388,876 | |
| | | | |
| | 545 | | | Illinois Finance Authority, Revenue Bonds, Lake Forest College, Series 2012A, 5.000%, 10/01/22 | | | No Opt. Call | | | | BBB– | | | | 590,033 | |
| | | | |
| | 600 | | | Illinois Toll Highway Authority, Toll Highway Revenue Bonds, Refunding Senior Lien Series 2014A, 5.000%, 12/01/19 (4) | | | No Opt. Call | | | | AA– | | | | 682,830 | |
| | | | |
| | 535 | | | Railsplitter Tobacco Settlement Authority, Illinois, Tobacco Settlement Revenue Bonds, Series 2010, 5.000%, 6/01/19 | | | No Opt. Call | | | | A | | | | 594,679 | |
| | | | |
| | 1,000 | | | Southwestern Illinois Development Authority, Local Government Revenue Bonds, Edwardsville Community Unit School District 7 Project, Series 2007, 0.000%, 12/01/22 – AGM Insured | | | No Opt. Call | | | | AA | | | | 848,670 | |
| | 3,645 | | | Total Illinois | | | | | | | | | | | 3,836,565 | |
| | | | |
| | | | Indiana – 3.9% | | | | | | | | | |
| | | | |
| | 500 | | | Indiana Finance Authority, Hospital Revenue Bonds, Community Health Network Project, Series 2012A, 5.000%, 5/01/24 | | | 5/23 at 100.00 | | | | A | | | | 599,350 | |
| | | | |
| | 490 | | | Indiana Finance Authority, Hospital Revenue Bonds, Parkview Health System Obligated Group, Refunding Series 2012A, 5.000%, 5/01/22 | | | No Opt. Call | | | | A+ | | | | 590,283 | |
| | | | |
| | 460 | | | Indiana Finance Authority, Private Activity Bonds, Ohio River Bridges East End Crossing Project, Series 2013B, 5.000%, 1/01/19 (Alternative Minimum Tax) | | | 1/17 at 100.00 | | | | BBB+ | | | | 472,020 | |
| | 1,450 | | | Total Indiana | | | | | | | | | | | 1,661,653 | |
| | | | |
| | | | Iowa – 3.3% | | | | | | | | | |
| | | | |
| | 1,125 | | | Dubuque, Iowa, General Obligation Bonds, Sales Tax Increment, Second Lien Series 2014, 5.000%, 6/01/25 | | | 6/24 at 100.00 | | | | Aa3 | | | | 1,390,568 | |
| | | | | | | | | | | | | | | | |
Principal
Amount (000) | | | Description (1) | | Optional Call
Provisions (2) | | | Ratings (3) | | | Value | |
| | | | |
| | | | Kansas – 2.9% | | | | | | | | | |
| | | | |
| $ | 1,025 | | | Wyandotte County/Kansas City Unified Government, Kansas, Utility System Revenue Bonds, Improvement Series 2012B, 5.000%, 9/01/23 | | | No Opt. Call | | | | A+ | | | $ | 1,237,226 | |
| | | | |
| | | | Kentucky – 2.5% | | | | | | | | | |
| | | | |
| | 65 | | | Kentucky Economic Development Finance Authority, Hospital Facilities Revenue Bonds, Owensboro Medical Health System, Series 2010A, 5.500%, 6/01/21 | | | 6/20 at 100.00 | | | | BBB+ | | | | 75,648 | |
| | | | |
| | | | Kentucky Economic Development Finance Authority, Louisville Arena Project Revenue Bonds, Louisville Arena Authority, Inc., Series 2008-A1: | | | | | | | | | | | | |
| | 380 | | | 5.750%, 12/01/28 – AGC Insured | | | 6/18 at 100.00 | | | | AA | | | | 407,755 | |
| | 525 | | | 6.000%, 12/01/33 – AGC Insured | | | 6/18 at 100.00 | | | | AA | | | | 568,811 | |
| | 970 | | | Total Kentucky | | | | | | | | | | | 1,052,214 | |
| | | | |
| | | | Louisiana – 7.4% | | | | | | | | | |
| | | | |
| | 200 | | | Louisiana Offshore Terminal Authority, Deepwater Port Revenue Refunding Bonds, LOOP Inc. Project, Series 2007B-1A, 1.375%, 10/01/37 (Mandatory put 10/01/16) | | | No Opt. Call | | | | A3 | | | | 200,238 | |
| | | | |
| | 1,000 | | | Louisiana Stadium and Exposition District, Revenue Refunding Bonds, Senior Lien Series 2013A, 5.000%, 7/01/23 | | | No Opt. Call | | | | A | | | | 1,225,720 | |
| | | | |
| | 500 | | | New Orleans, Louisiana, General Obligation Bonds, Refunding Series 2012, 5.000%, 12/01/27 – AGM Insured | | | 12/22 at 100.00 | | | | AA | | | | 584,670 | |
| | | | |
| | 1,015 | | | Regional Transit Authority, Louisiana, Sales Tax Revenue Bonds, Series 2010, 5.000%, 12/01/19 – AGM Insured (4) | | | No Opt. Call | | | | AA | | | | 1,150,898 | |
| | 2,715 | | | Total Louisiana | | | | | | | | | | | 3,161,526 | |
| | | | |
| | | | Maine – 0.8% | | | | | | | | | |
| | | | |
| | 185 | | | Maine Health and Higher Educational Facilities Authority Revenue Bonds, Eastern Maine Medical Center Obligated Group Issue, Series 2013, 5.000%, 7/01/25 | | | 7/23 at 100.00 | | | | BBB | | | | 213,484 | |
| | | | |
| | 120 | | | Portland, Maine, General Airport Revenue Bonds, Refunding Series 2013, 5.000%, 7/01/23 | | | No Opt. Call | | | | BBB+ | | | | 141,136 | |
| | 305 | | | Total Maine | | | | | | | | | | | 354,620 | |
| | | | |
| | | | Massachusetts – 1.2% | | | | | | | | | |
| | | | |
| | 530 | | | Massachusetts Port Authority, Special Facilities Revenue Bonds, Delta Air Lines Inc., Series 2001A, 5.000%, 1/01/21 – AMBAC Insured (Alternative Minimum Tax) | | | 7/16 at 100.00 | | | | N/R | | | | 532,078 | |
| | | | |
| | | | Michigan – 2.0% | | | | | | | | | |
| | | | |
| | 190 | | | Detroit-Wayne County Stadium Authority, Michigan, Wayne County Limited Tax General Obligation Bonds, Building Authority Stadium Refunding Series 2012, 5.000%, 10/01/20 – AGM Insured | | | No Opt. Call | | | | AA | | | | 212,169 | |
| | | | |
| | 65 | | | Michigan Finance Authority, Public School Academy Revenue Bonds, Detroit Service Learning Academy Project, Refunding Series 2011, 6.000%, 10/01/21 | | | No Opt. Call | | | | BB– | | | | 65,605 | |
| | | | |
| | 500 | | | Michigan Municipal Bond Authority, Clean Water Revolving Fund Revenue Bonds, Series 2010, 5.000%, 10/01/27 | | | No Opt. Call | | | | AAA | | | | 581,120 | |
| | 755 | | | Total Michigan | | | | | | | | | | | 858,894 | |
| | | | |
| | | | Missouri – 2.9% | | | | | | | | | |
| | | | |
| | 1,000 | | | Missouri Joint Municipal Electric Utility Commission, Power Project Revenue Bonds, Plum Point Project, Refunding Series 2014A, 5.000%, 1/01/24 | | | No Opt. Call | | | | A | | | | 1,224,320 | |
Nuveen Inflation Protected Municipal Bond Fund (continued)
| | |
| Portfolio of Investments | | April 30, 2016 |
| | | | | | | | | | | | | | | | |
Principal
Amount (000) | | | Description (1) | | Optional Call
Provisions (2) | | | Ratings (3) | | | Value | |
| | | | |
| | | | Nevada – 1.0% | | | | | | | | | |
| | | | |
| $ | 390 | | | Clark County, Nevada, Airport Revenue Bonds, Subordinate Lien Series 2009C, 5.000%, 7/01/23 – AGM Insured | | | 7/19 at 100.00 | | | | AA | | | $ | 437,221 | |
| | | | |
| | | | New Jersey – 0.8% | | | | | | | | | |
| | | | |
| | 310 | | | New Jersey Economic Development Authority, Special Facilities Revenue Bonds, Continental Airlines Inc., Series 1999, 4.875%, 9/15/19 (Alternative Minimum Tax) | | | No Opt. Call | | | | BB– | | | | 328,991 | |
| | | | |
| | | | New York – 3.5% | | | | | | | | | |
| | | | |
| | 1,250 | | | Port Authority of New York and New Jersey, Consolidated Revenue Bonds, One Hundred Seventy Eighth Series 2013, 5.000%, 12/01/22 (Alternative Minimum Tax) (4) | | | No Opt. Call | | | | AA– | | | | 1,510,538 | |
| | | | |
| | | | North Carolina – 2.6% | | | | | | | | | |
| | | | |
| | 160 | | | North Carolina Capital Facilities Finance Agency, Revenue Bonds, The Methodist University, Series 2012, 5.000%, 3/01/19 | | | No Opt. Call | | | | BBB | | | | 177,237 | |
| | | | |
| | 795 | | | North Carolina Turnpike Authority, Monroe Connector System State Appropriation Bonds, Series 2011, 5.000%, 7/01/21 (4) | | | No Opt. Call | | | | AA | | | | 946,050 | |
| | 955 | | | Total North Carolina | | | | | | | | | | | 1,123,287 | |
| | | | |
| | | | Ohio – 4.5% | | | | | | | | | |
| | | | |
| | 230 | | | Cleveland, Ohio, Waterworks First Mortgage Revenue Refunding and Improvement Bonds, Series 1993G, 5.500%, 1/01/21 – NPFG Insured | | | No Opt. Call | | | | Aa1 | | | | 256,287 | |
| | | | |
| | 1,000 | | | New Albany Community Authority, Ohio, Community Facilities Revenue Refunding Bonds, Series 2012C, 5.000%, 10/01/22 | | | No Opt. Call | | | | A1 | | | | 1,187,740 | |
| | | | |
| | 200 | | | Southeastern Ohio Port Authority, Hospital Facilities Revenue Bonds, Memorial Health System Obligated Group Project, Refunding and Improvement Series 2012, 5.000%, 12/01/16 | | | No Opt. Call | | | | BB | | | | 203,830 | |
| | | | |
| | 200 | | | Toledo-Lucas County Port Authority, Ohio, Revenue Refunding Bonds, CSX Transportation Inc., Series 1992, 6.450%, 12/15/21 | | | No Opt. Call | | | | Baa1 | | | | 251,564 | |
| | 1,630 | | | Total Ohio | | | | | | | | | | | 1,899,421 | |
| | | | |
| | | | Oregon – 2.9% | | | | | | | | | |
| | | | |
| | 1,000 | | | Port of Portland, Oregon, International Airport Revenue Bonds, Series 2014-22, 5.000%, 7/01/24 (Alternative Minimum Tax) | | | No Opt. Call | | | | AA– | | | | 1,231,490 | |
| | | | |
| | | | Pennsylvania – 3.3% | | | | | | | | | |
| | | | |
| | 840 | | | Delaware River Port Authority, Pennsylvania and New Jersey, Revenue Refunding Bonds, Port District Project, Series 2012, 5.000%, 1/01/24 | | | No Opt. Call | | | | A– | | | | 965,454 | |
| | | | |
| | 170 | | | Pennsylvania Higher Educational Facilities Authority, Philadelphia University Refunding Revenue Bonds, Refunding Series 2013, 5.000%, 6/01/21 | | | No Opt. Call | | | | BBB | | | | 193,203 | |
| | | | |
| | 220 | | | Pennsylvania, General Obligation Bonds, Refunding 3rd Series 2004, 5.375%, 7/01/16 – NPFG Insured | | | No Opt. Call | | | | AA– | | | | 221,872 | |
| | | | |
| | 5 | | | Pittsburgh, Pennsylvania, General Obligation Bonds, Series 2012B, 5.000%, 9/01/24 – AGM Insured | | | 9/22 at 100.00 | | | | A+ | | | | 6,032 | |
| | 1,235 | | | Total Pennsylvania | | | | | | | | | | | 1,386,561 | |
| | | | |
| | | | Texas – 4.6% | | | | | | | | | |
| | | | |
| | 365 | | | Central Texas Regional Mobility Authority, Revenue Bonds, Subordinate Lien Refunding Series 2013, 5.000%, 1/01/23 | | | No Opt. Call | | | | BBB | | | | 428,583 | |
| | | | | | | | | | | | | | | | |
Principal
Amount (000) | | | Description (1) | | Optional Call
Provisions (2) | | | Ratings (3) | | | Value | |
| | | | |
| | | | Texas (continued) | | | | | | | | | |
| | | | |
| $ | 215 | | | Gulf Coast Industrial Development Authority, Texas, Solid Waste Disposal Revenue Bonds, Citgo Petroleum Corporation Project, Series 1995, 4.875%, 5/01/25 (Alternative Minimum Tax) | | | 10/22 at 100.00 | | | | BB | | | $ | 228,143 | |
| | | | |
| | 855 | | | Harris County-Houston Sports Authority, Texas, Revenue Bonds, Junior Lien Series 2001H, 0.000%, 11/15/23 – NPFG Insured | | | No Opt. Call | | | | AA– | | | | 667,917 | |
| | | | |
| | 230 | | | Harris County-Houston Sports Authority, Texas, Revenue Bonds, Third Lien Series 2004A-3, 0.000%, 11/15/31 – NPFG Insured | | | 11/24 at 66.52 | | | | AA– | | | | 110,911 | |
| | | | |
| | 500 | | | McCamey County Hospital District, Texas, General Obligation Bonds, Series 2013, 4.000%, 12/01/21 | | | No Opt. Call | | | | Ba2 | | | | 517,710 | |
| | 2,165 | | | Total Texas | | | | | | | | | | | 1,953,264 | |
| | | | |
| | | | Utah – 2.7% | | | | | | | | | |
| | | | |
| | 25 | | | Utah County, Utah, Hospital Revenue Bonds, IHC Health Services Inc., Series 2012, 5.000%, 5/15/23 | | | 5/21 at 100.00 | | | | AA+ | | | | 29,857 | |
| | | | |
| | 935 | | | Utah Transit Authority, Sales Tax Revenue Bonds, Refunding Series 2012, 5.000%, 6/15/22 | | | No Opt. Call | | | | A+ | | | | 1,126,011 | |
| | 960 | | | Total Utah | | | | | | | | | | | 1,155,868 | |
| | | | |
| | | | Virginia – 0.4% | | | | | | | | | |
| | | | |
| | 185 | | | Virginia Small Business Financing Authority, Senior Lien Revenue Bonds, Elizabeth River Crossing, Opco LLC Project, Series 2012, 5.250%, 1/01/32 (Alternative Minimum Tax) | | | 7/22 at 100.00 | | | | BBB– | | | | 209,065 | |
| | | | |
| | | | Washington – 1.3% | | | | | | | | | |
| | | | |
| | 500 | | | Washington Health Care Facilities Authority, Revenue Bonds, Kadlec Regional Medical Center, Series 2012, 4.000%, 12/01/19 (ETM) | | | No Opt. Call | | | | N/R (5) | | | | 554,115 | |
| | | | |
| | | | West Virginia – 0.6% | | | | | | | | | |
| | | | |
| | 235 | | | Mason County, West Virginia, Pollution Control Revenue Bonds, Appalachian Power Company, Series 2003L, 1.625%, 10/01/22 (Mandatory put 10/01/18) | | | No Opt. Call | | | | Baa1 | | | | 236,702 | |
| | | | |
| | | | Wisconsin – 3.6% | | | | | | | | | |
| | | | |
| | 1,015 | | | Wisconsin Health and Educational Facilities Authority, Revenue Bonds, Agnesian HealthCare, Inc., Series 2013B, 5.000%, 7/01/24 | | | 7/23 at 100.00 | | | | A | | | | 1,220,121 | |
| | | | |
| | 260 | | | Wisconsin State, General Fund Annual Appropriation Revenue Bonds, Refunding Series 2009A, 5.250%, 5/01/20 | | | 5/19 at 100.00 | | | | AA– | | | | 294,986 | |
| | 1,275 | | | Total Wisconsin | | | | | | | | | | | 1,515,107 | |
| | | | |
| | | | Wyoming – 2.2% | | | | | | | | | |
| | | | |
| | 755 | | | Consolidated Wyoming Municipalities Electric Power System Joint Powers Board, Wyoming, Electric Facilities Improvement Lease Revenue Bonds, Gillette Electrical System Project, Series 2014A, 5.000%, 6/01/24 | | | No Opt. Call | | | | A+ | | | | 942,806 | |
| $ | 40,052 | | | Total Long-Term Investments (cost $42,543,696) | | | | | | | | | | | 44,852,987 | |
| | | | Other Assets Less Liabilities – (5.3)% (6) | | | | | | | | | | | (2,262,188 | ) |
| | | | Net Assets – 100% | | | | | | | | | | $ | 42,590,799 | |
Nuveen Inflation Protected Municipal Bond Fund (continued)
| | |
| Portfolio of Investments | | April 30, 2016 |
Investments in Derivatives as of April 30, 2016
Consumer Price Index Swaps outstanding:
| | | | | | | | | | | | | | | | | | | | | | | | | | | | |
| Counterparty | | Notional
Amount | | | Fund
Pay/Receive
Floating Rate | | | Floating Rate Index | | | Fixed Rate
(Annualized) | | | Fixed Rate
Payment
Date (7) | | | Termination
Date | | | Unrealized
Appreciation
(Depreciation) | |
Barclays Bank PLC | | $ | 5,000,000 | | | | Receive | | | | CPURNSA | | | | 2.600 | % | | | 2/06/18 | | | | 2/05/18 | | | $ | (377,504 | ) |
Barclays Bank PLC | | | 4,000,000 | | | | Receive | | | | CPURNSA | | | | 2.560 | | | | 12/31/18 | | | | 12/28/18 | | | | (346,973 | ) |
Barclays Bank PLC | | | 3,500,000 | | | | Receive | | | | CPURNSA | | | | 2.509 | | | | 2/11/19 | | | | 2/08/19 | | | | (277,039 | ) |
Barclays Bank PLC | | | 4,500,000 | | | | Receive | | | | CPURNSA | | | | 2.645 | | | | 12/30/19 | | | | 12/28/19 | | | | (463,375 | ) |
Barclays Bank PLC | | | 5,500,000 | | | | Receive | | | | CPURNSA | | | | 2.645 | | | | 10/01/21 | | | | 9/30/21 | | | | (578,305 | ) |
Barclays Bank PLC | | | 8,000,000 | | | | Receive | | | | CPURNSA | | | | 2.777 | | | | 2/21/22 | | | | 2/19/22 | | | | (1,048,722 | ) |
Morgan Stanley & Co. LLC | | | 3,800,000 | | | | Receive | | | | CPURNSA | | | | 2.595 | | | | 11/06/18 | | | | 11/05/18 | | | | (276,481 | ) |
Morgan Stanley & Co. LLC | | | 6,000,000 | | | | Receive | | | | CPURNSA | | | | 2.714 | | | | 3/01/21 | | | | 2/27/21 | | | | (684,950 | ) |
Morgan Stanley & Co. LLC | | | 3,000,000 | | | | Receive | | | | CPURNSA | | | | 2.283 | | | | 9/16/21 | | | | 9/15/21 | | | | (206,016 | ) |
Morgan Stanley & Co. LLC | | | 3,000,000 | | | | Receive | | | | CPURNSA | | | | 2.650 | | | | 8/08/24 | | | | 8/07/24 | | | | (383,402 | ) |
| | | $ | 46,300,000 | | | | | | | | | | | | | | | | | | | | | | | $ | (4,642,767 | ) |
| (1) | All percentages shown in the Portfolio of Investments are based on net assets. |
| (2) | Optional Call Provisions (not covered by the report of independent registered public accounting firm): Dates (month and year) and prices of the earliest optional call or redemption. There may be other call provisions at varying prices at later dates. Certain mortgage backed securities may be subject to periodic principal paydowns. |
| (3) | Ratings (not covered by the report of independent registered public accounting firm): Using the highest of Standard & Poor’s Group (“Standard & Poor’s”), Moody’s Investors Service, Inc. (“Moody’s”) or Fitch, Inc. (“Fitch”) rating. Ratings below BBB by Standard & Poor’s, Baa by Moody’s or BBB by Fitch are considered to be below investment grade. Holdings designated N/R are not rated by any of these national rating agencies. |
| (4) | Investment, or portion of investment, has been pledged to collateralize the net payment obligations for investments in derivatives. |
| (5) | Backed by an escrow or trust containing sufficient U.S. Government or U.S. Government agency securities, which ensure the timely payment of principal and interest. Certain bonds backed by U.S. Government or agency securities are regarded as having an implied rating equal to the rating of such securities. |
| (6) | Other assets less liabilities includes the unrealized appreciation (depreciation) of certain over-the-counter (“OTC”) derivatives as presented on the Statement of Assets and Liabilities. The unrealized appreciation (depreciation) of OTC-cleared and exchange-traded derivatives is recognized as part of the cash collateral at brokers and/or the receivable or payable for variation margin as presented on the Statement of Assets and Liabilities, when applicable. |
| (7) | Fixed Rate Payment Date is one business day after contract Termination Date. |
| (ETM) | Escrowed to maturity. |
| CPURNSA | US CPI Urban Consumers Non-Seasonally Adjusted |
See accompanying notes to financial statements.
Nuveen Intermediate Duration Municipal Bond Fund
| | |
| Portfolio of Investments | | April 30, 2016 |
| | | | | | | | | | | | | | | | | | | | |
Principal
Amount (000) | | | Description (1) | | Optional Call
Provisions (2) | | | | | | | Ratings (3) | | | Value | |
| | | | | | |
| | | | LONG-TERM INVESTMENT – 98.6% | | | | | | | | | | | | | | | | |
| | | | | | |
| | | | MUNICIPAL BONDS – 98.3% | | | | | | | | | | | | | | | | |
| | | | | | |
| | | | Alabama – 0.6% | | | | | | | | | | | | | |
| | | | | | |
| $ | 2,935 | | | Health Care Authority for Baptist Health, Alabama, Revenue Bonds, Baptist Health, Series 2006D, 5.000%, 11/15/16 | | | No Opt. Call | | | | | | | | A3 | | | $ | 2,946,652 | |
| | | | | | |
| | 1,130 | | | Huntsville, Alabama, Electric System Revenue Warrants, Refunding Series 2007, 4.000%, 12/01/18 – AGM Insured | | | 12/17 at 100.00 | | | | | | | | AA+ | | | | 1,184,489 | |
| | | | | | |
| | 2,685 | | | Mobile Spring Hill College Educational Building Authority, Alabama, Revenue Bonds, Spring Hill College Project, Series 2015, 5.000%, 4/15/27 | | | 4/25 at 100.00 | | | | | | | | N/R | | | | 2,706,158 | |
| | | | | | |
| | 2,000 | | | Mobile, Alabama, General Obligation Warrants, Improvement and Refunding Series 2008B, 5.000%, 2/15/20 | | | 2/18 at 100.00 | | | | | | | | Aa2 | | | | 2,147,700 | |
| | | | | | |
| | | | Montgomery Medical Clinic Board, Alabama, Health Care Facility Revenue Bonds, Jackson Hospital & Clinic, Series 2015: | | | | | | | | | | | | | | | | |
| | 2,080 | | | 5.000%, 3/01/23 | | | No Opt. Call | | | | | | | | BBB | | | | 2,427,776 | |
| | 3,555 | | | 5.000%, 3/01/24 | | | No Opt. Call | | | | | | | | BBB | | | | 4,192,803 | |
| | 2,235 | | | 5.000%, 3/01/25 | | | No Opt. Call | | | | | | | | BBB | | | | 2,647,089 | |
| | 1,725 | | | 5.000%, 3/01/26 | | | No Opt. Call | | | | | | | | BBB | | | | 2,049,662 | |
| | 2,175 | | | 4.000%, 3/01/36 | | | 3/26 at 100.00 | | | | | | | | BBB | | | | 2,227,418 | |
| | | | | | |
| | | | University of Alabama, Birmingham, Hospital Revenue Bonds, Birmingham Hospital, Series 2008A: | | | | | | | | | | | | | | | | |
| | 1,500 | | | 5.000%, 9/01/18 | | | No Opt. Call | | | | | | | | A+ | | | | 1,636,680 | |
| | 4,000 | | | 5.750%, 9/01/22 | | | 9/18 at 100.00 | | | | | | | | A+ | | | | 4,452,880 | |
| | 26,020 | | | Total Alabama | | | | | | | | | | | | | | | 28,619,307 | |
| | | | | | |
| | | | Alaska – 0.2% | | | | | | | | | | | | | |
| | | | | | |
| | 3,000 | | | Alaska State, Sport Fishing Revenue Bonds, Refunding Series 2011, 5.000%, 4/01/21 | | | 4/20 at 100.00 | | | | | | | | A1 | | | | 3,391,140 | |
| | | | | | |
| | 6,000 | | | Northern Tobacco Securitization Corporation, Alaska, Tobacco Settlement Asset-Backed Bonds, Series 2006A, 5.000%, 6/01/32 | | | 7/16 at 100.00 | | | | | | | | B3 | | | | 5,706,720 | |
| | | | | | |
| | 2,015 | | | Valdez, Alaska, Marine Terminal Revenue Bonds, BP Pipelines Inc. Project, Refunding Series 2003B, 5.000%, 1/01/21 | | | No Opt. Call | | | | | | | | A2 | | | | 2,304,596 | |
| | 11,015 | | | Total Alaska | | | | | | | | | | | | | | | 11,402,456 | |
| | | | | | |
| | | | Arizona – 3.1% | | | | | | | | | | | | | |
| | | | | | |
| | 4,120 | | | Arizona Board of Regents, Certificates of Participation, University of Arizona Projects, Refunding Series 2007B, 4.500%, 6/01/18 – AMBAC Insured | | | 6/17 at 100.00 | | | | | | | | Aa3 | | | | 4,276,107 | |
| | | | | | |
| | | | Arizona Health Facilities Authority, Hospital System Revenue Bonds, Phoenix Children’s Hospital, Refunding Series 2012A: | | | | | | | | | | | | | | | | |
| | 1,235 | | | 5.000%, 2/01/20 | | | No Opt. Call | | | | | | | | BBB+ | | | | 1,407,208 | |
| | 6,255 | | | 5.000%, 2/01/27 | | | 2/22 at 100.00 | | | | | | | | BBB+ | | | | 7,074,155 | |
| | | | | | |
| | 1,445 | | | Arizona Health Facilities Authority, Revenue Bonds, Scottsdale Lincoln Hospitals Project, Series 2014A, 5.000%, 12/01/24 | | | No Opt. Call | | | | | | | | A2 | | | | 1,806,409 | |
| | | | | | |
| | | | Arizona Sports and Tourism Authority, Tax Revenue Bonds, Multipurpose Stadium Facility Project, Refunding Senior Series 2012A: | | | | | | | | | | | | | | | | |
| | 10,270 | | | 5.000%, 7/01/25 | | | 7/22 at 100.00 | | | | | | | | A1 | | | | 11,818,613 | |
| | 16,235 | | | 5.000%, 7/01/26 | | | 7/22 at 100.00 | | | | | | | | A1 | | | | 18,557,741 | |
| | 16,760 | | | 5.000%, 7/01/27 | | | 7/22 at 100.00 | | | | | | | | A1 | | | | 19,111,428 | |
Nuveen Intermediate Duration Municipal Bond Fund (continued)
| | |
| Portfolio of Investments | | April 30, 2016 |
| | | | | | | | | | | | | | | | | | | | |
Principal
Amount (000) | | | Description (1) | | Optional Call
Provisions (2) | | | | | | | Ratings (3) | | | Value | |
| | | | | | |
| | | | Arizona (continued) | | | | | | | | | | | | | |
| | | | | | |
| $ | 2,000 | | | Arizona State, Certificates of Participation, Series 2008A, 4.000%, 9/01/17 – AGM Insured | | | No Opt. Call | | | | | | | | AA | | | $ | 2,087,040 | |
| | | | | | |
| | | | Arizona State, State Lottery Revenue Bonds, Series 2010A: | | | | | | | | | | | | | | | | |
| | 45 | | | 5.000%, 7/01/17 – AGM Insured | | | No Opt. Call | | | | | | | | AA | | | | 47,255 | |
| | 55 | | | 5.000%, 7/01/18 – AGM Insured | | | No Opt. Call | | | | | | | | AA | | | | 59,839 | |
| | 5,165 | | | 5.000%, 7/01/19 – AGM Insured | | | No Opt. Call | | | | | | | | AA | | | | 5,806,700 | |
| | 5,015 | | | 5.000%, 7/01/20 – AGM Insured | | | No Opt. Call | | | | | | | | AA | | | | 5,798,142 | |
| | 6,130 | | | 5.000%, 7/01/21 – AGM Insured | | | 1/20 at 100.00 | | | | | | | | AA | | | | 7,010,636 | |
| | 7,500 | | | 5.000%, 7/01/22 – AGM Insured | | | 1/20 at 100.00 | | | | | | | | AA | | | | 8,546,850 | |
| | | | | | |
| | | | Gila County Unified School District 10 Payson, Arizona, General Obligation Bonds, Project of 2006, Series 2007A: | | | | | | | | | | | | | | | | |
| | 1,000 | | | 5.000%, 7/01/16 – AMBAC Insured | | | No Opt. Call | | | | | | | | Aa3 | | | | 1,007,610 | |
| | 1,050 | | | 5.000%, 7/01/17 – AMBAC Insured | | | No Opt. Call | | | | | | | | Aa3 | | | | 1,102,227 | |
| | | | | | |
| | 6,000 | | | Gilbert Public Facilities Municipal Property Corporation, Arizona, Revenue Bonds, Series 2009, 5.500%, 7/01/27 | | | 7/19 at 100.00 | | | | | | | | AA+ | | | | 6,740,700 | |
| | | | | | |
| | 2,000 | | | Glendale Industrial Development Authority, Arizona, Revenue Bonds, Midwestern University, Refunding Series 2007, 5.000%, 5/15/26 | | | 5/22 at 100.00 | | | | | | | | A– | | | | 2,301,480 | |
| | | | | | |
| | 1,355 | | | Glendale Industrial Development Authority, Arizona, Revenue Bonds, Midwestern University, Refunding Series 2010, 5.000%, 5/15/21 | | | 5/20 at 100.00 | | | | | | | | A+ | | | | 1,526,800 | |
| | | | | | |
| | | | Maricopa County Unified School District 48, Scottsdale, Arizona, General Obligation Bonds, Project 2004, Series 2006B: | | | | | | | | | | | | | | | | |
| | 295 | | | 4.750%, 7/01/18 (Pre-refunded 7/01/16) – AGM Insured | | | 7/16 at 100.00 | | | | | | | | Aa1 (4) | | | | 297,183 | |
| | 290 | | | 4.750%, 7/01/18 (Pre-refunded 7/01/16) – AGM Insured | | | 7/16 at 100.00 | | | | | | | | Aa1 (4) | | | | 292,146 | |
| | 565 | | | 4.750%, 7/01/18 (Pre-refunded 7/01/16) – AGM Insured | | | 7/16 at 100.00 | | | | | | | | Aa1 (4) | | | | 569,187 | |
| | | | | | |
| | 2,500 | | | Maricopa County Unified School District 89, Dysart, Arizona, General Obligation Bonds, Refunding Series 2016, 4.000%, 7/01/26 (WI/DD, Settling 5/03/16) – BAM Insured | | | No Opt. Call | | | | | | | | AA | | | | 2,920,150 | |
| | | | | | |
| | 3,670 | | | Mesa, Arizona, Excise Tax Revenue Bonds, Series 2013, 5.000%, 7/01/27 | | | 7/17 at 100.00 | | | | | | | | AA+ | | | | 3,844,142 | |
| | | | | | |
| | | | Northern Arizona University, System Revenue Bonds, Refunding Series 2014: | | | | | | | | | | | | | | | | |
| | 385 | | | 5.000%, 6/01/22 | | | No Opt. Call | | | | | | | | A+ | | | | 463,817 | |
| | 500 | | | 5.000%, 6/01/23 | | | No Opt. Call | | | | | | | | A+ | | | | 613,215 | |
| | | | | | |
| | | | Phoenix Civic Improvement Corporation, Arizona, Airport Revenue Bonds, Junior Lien Series 2010A: | | | | | | | | | | | | | | | | |
| | 2,015 | | | 5.000%, 7/01/22 | | | 7/20 at 100.00 | | | | | | | | A+ | | | | 2,337,259 | |
| | 10,370 | | | 5.000%, 7/01/40 | | | 7/20 at 100.00 | | | | | | | | A+ | | | | 11,673,405 | |
| | | | | | |
| | 500 | | | Phoenix Civic Improvement Corporation, Arizona, Water System Revenue Bonds, Junior Lien Series 2014A, 5.000%, 7/01/23 | | | No Opt. Call | | | | | | | | AAA | | | | 622,620 | |
| | | | | | |
| | 8,855 | | | Phoenix Civic Improvement Corporation, Arizona, Water System Revenue Bonds, Refunding Junior Lien Series 2014B, 5.000%, 7/01/23 | | | No Opt. Call | | | | | | | | AAA | | | | 11,026,600 | |
| | | | | | |
| | 2,650 | | | Pima County Industrial Development Authority, Arizona, Revenue Bonds, Tucson Electric Power Company Project, Series 2013A, 4.000%, 9/01/29 | | | 3/23 at 100.00 | | | | | | | | A3 | | | | 2,907,130 | |
| | | | | | |
| | | | Pima County Unified School District 1, Tucson, Arizona, School Improvement Bonds, Series 2007C: | | | | | | | | | | | | | | | | |
| | 1,000 | | | 4.375%, 7/01/18 – FGIC Insured | | | 7/17 at 100.00 | | | | | | | | Aa2 | | | | 1,039,340 | |
| | 1,000 | | | 4.500%, 7/01/19 – FGIC Insured | | | 7/17 at 100.00 | | | | | | | | Aa2 | | | | 1,042,350 | |
| | | | | | |
| | 2,670 | | | Pima County, Arizona, Sewer Revenue Bonds, Series 2010, 5.000%, 7/01/24 – AGM Insured | | | 7/20 at 100.00 | | | | | | | | AA | | | | 3,097,013 | |
| | | | | | |
| | 645 | | | Regional Public Transportation Authority, Arizona, Transportation Excise Tax Revenue Bonds, Maricopa County Public Transportation Fund Series 2014, 5.250%, 7/01/23 | | | No Opt. Call | | | | | | | | AA+ | | | | 811,636 | |
| | | | | | | | | | | | | | | | | | | | |
Principal
Amount (000) | | | Description (1) | | Optional Call
Provisions (2) | | | | | | | Ratings (3) | | | Value | |
| | | | | | |
| | | | Arizona (continued) | | | | | | | | | | | | | |
| | | | | | |
| $ | 3,000 | | | Salt River Project Agricultural Improvement and Power District, Arizona, Electric System Revenue Bonds, Series 2009A, 5.000%, 1/01/25 | | | No Opt. Call | | | | | | | | Aa1 | | | $ | 3,329,070 | |
| | | | | | |
| | 3,925 | | | Salt River Project Agricultural Improvement and Power District, Arizona, Electric System Revenue Bonds, Tender Option Bond Trust 2015-XF2192. Formerly Tender Option Bond Trust 3284, 12.734%, 6/01/19 (IF) | | | No Opt. Call | | | | | | | | Aa1 | | | | 6,339,699 | |
| | | | | | |
| | 1,000 | | | Scottsdale Industrial Development Authority, Arizona, Hospital Revenue Bonds, Scottsdale Healthcare, Series 2008A, 5.000%, 9/01/20 | | | 9/18 at 100.00 | | | | | | | | A2 | | | | 1,093,850 | |
| | | | | | |
| | 1,350 | | | Sedona-Oak Creek Joint Unified School District 9, Coconino and Yavapi Counties, Arizona, General Obligation Bonds, School Improvement Project 2007, Series 2009B, 5.375%, 7/01/28 (Pre-refunded 7/01/19) | | | 7/19 at 100.00 | | | | | | | | Aa2 (4) | | | | 1,541,916 | |
| | 140,820 | | | Total Arizona | | | | | | | | | | | | | | | 161,948,668 | |
| | | | | | |
| | | | Arkansas – 1.0% | | | | | | | | | | | | | |
| | | | | | |
| | 1,000 | | | Arkansas State University, Student Fee Revenue Bonds, Jonesboro Campus, Series 2013, 5.000%, 12/01/33 | | | 12/23 at 100.00 | | | | | | | | A1 | | | | 1,172,570 | |
| | | | | | |
| | 1,490 | | | Conway, Arkansas, Restaurant Gross Receipts Tax Revenue Bonds, Series 2007, 5.000%, 12/01/22 – AGM Insured | | | No Opt. Call | | | | | | | | AA | | | | 1,495,841 | |
| | | | | | |
| | | | Fayetteville, Arkansas, Sales and Use Tax Revenue Bonds, Series 2006A: | | | | | | | | | | | | | | | | |
| | 6,730 | | | 5.000%, 11/01/17 – AGM Insured | | | 11/16 at 100.00 | | | | | | | | AA | | | | 6,872,070 | |
| | 6,740 | | | 4.500%, 11/01/19 – AGM Insured | | | 11/16 at 100.00 | | | | | | | | AA | | | | 6,875,474 | |
| | | | | | |
| | | | Fort Smith, Arkansas, Water and Sewer Revenue Bonds, Series 2007: | | | | | | | | | | | | | | | | |
| | 1,235 | | | 5.000%, 10/01/19 – FGIC Insured | | | 10/17 at 100.00 | | | | | | | | AA– | | | | 1,307,198 | |
| | 1,000 | | | 5.000%, 10/01/21 – FGIC Insured | | | 10/17 at 100.00 | | | | | | | | AA– | | | | 1,059,560 | |
| | | | | | |
| | 4,495 | | | Independence County, Arkansas, Pollution Control Revenue Bonds, Arkansas Power and Light Company Project, Series 2013, 2.375%, 1/01/21 | | | No Opt. Call | | | | | | | | A2 | | | | 4,721,143 | |
| | | | | | |
| | | | Little Rock, Arkansas, Hotel and Restaurant Gross Receipts Tax Bonds, Series 2014: | | | | | | | | | | | | | | | | |
| | 500 | | | 5.000%, 7/01/22 | | | No Opt. Call | | | | | | | | A+ | | | | 605,260 | |
| | 800 | | | 5.000%, 7/01/23 | | | No Opt. Call | | | | | | | | A+ | | | | 977,848 | |
| | 1,610 | | | 5.000%, 7/01/26 | | | 7/24 at 100.00 | | | | | | | | A+ | | | | 1,964,329 | |
| | 1,485 | | | 5.000%, 7/01/28 | | | 7/24 at 100.00 | | | | | | | | A+ | | | | 1,783,351 | |
| | 1,935 | | | 5.000%, 7/01/29 | | | 7/24 at 100.00 | | | | | | | | A+ | | | | 2,311,029 | |
| | 1,000 | | | 5.000%, 7/01/30 | | | 7/24 at 100.00 | | | | | | | | A+ | | | | 1,186,560 | |
| | 4,585 | | | 5.000%, 7/01/34 | | | 7/24 at 100.00 | | | | | | | | A+ | | | | 5,375,546 | |
| | | | | | |
| | | | Magnolia, Arkansas, Sales and Use Tax Revenue Bonds, Series 2007: | | | | | | | | | | | | | | | | |
| | 575 | | | 5.000%, 8/01/21 – CIFG Insured | | | 8/17 at 100.00 | | | | | | | | N/R | | | | 598,581 | |
| | 1,130 | | | 5.000%, 8/01/22 – CIFG Insured | | | 8/17 at 100.00 | | | | | | | | N/R | | | | 1,174,319 | |
| | 1,185 | | | 5.000%, 8/01/23 – CIFG Insured | | | 8/17 at 100.00 | | | | | | | | N/R | | | | 1,229,817 | |
| | 1,245 | | | 5.000%, 8/01/24 – CIFG Insured | | | 8/17 at 100.00 | | | | | | | | N/R | | | | 1,290,380 | |
| | | | | | |
| | 1,000 | | | North Little Rock Health Facilities Board, Arkansas, Healthcare Revenue Bonds, Baptist Health, Series 1996B, 5.750%, 12/01/21 (Pre-refunded 12/01/18) | | | 12/18 at 100.00 | | | | | | | | A+ (4) | | | | 1,121,670 | |
| | | | | | |
| | | | Pulaski County Public Facilities Board, Arkansas, Healthcare Revenue Bonds, Baptist Health, Series 2014: | | | | | | | | | | | | | | | | |
| | 1,950 | | | 5.000%, 12/01/25 | | | 12/24 at 100.00 | | | | | | | | A+ | | | | 2,373,579 | |
| | 1,780 | | | 5.000%, 12/01/27 | | | 12/24 at 100.00 | | | | | | | | A+ | | | | 2,124,911 | |
| | | | | | |
| | | | University of Arkansas, Various Facilities Revenue Bonds, UAMS Campus, Series 2014A: | | | | | | | | | | | | | | | | |
| | 1,000 | | | 5.000%, 3/01/21 | | | No Opt. Call | | | | | | | | Aa2 | | | | 1,179,250 | |
| | 1,000 | | | 3.750%, 3/01/36 | | | 3/25 at 100.00 | | | | | | | | Aa2 | | | | 1,061,940 | |
| | 45,470 | | | Total Arkansas | | | | | | | | | | | | | | | 49,862,226 | |
Nuveen Intermediate Duration Municipal Bond Fund (continued)
| | |
| Portfolio of Investments | | April 30, 2016 |
| | | | | | | | | | | | | | | | | | | | |
Principal
Amount (000) | | | Description (1) | | Optional Call
Provisions (2) | | | | | | | Ratings (3) | | | Value | |
| | | | | | |
| | | | California – 6.9% | | | | | | | | | | | | | |
| | | | | | |
| $ | 3,040 | | | Western California Municipal Water District Facilities Authority Adjustable Rate Water Revenue Refunding Bonds Series 2016A, 1.500%, 10/01/39 (Mandatory put 10/01/20) | | | 7/20 at 100.00 | | | | | | | | AA+ | | | $ | 3,057,784 | |
| | | | | | |
| | 1,525 | | | ABAG Finance Authority for Non-Profit Corporations, California, Revenue Bonds, Childrens Hospital & Research Center at Oakland, Refunding Series 2007A, 4.500%, 12/01/18 (Pre-refunded 12/01/17) | | | 12/17 at 100.00 | | | | | | | | N/R (4) | | | | 1,619,199 | |
| | | | | | |
| | 1,565 | | | ABC Unified School District, Los Angeles County, California, General Obligation Bonds, Refunding Series 2003A, 4.900%, 2/01/20 – NPFG Insured | | | No Opt. Call | | | | | | | | AA– | | | | 1,776,056 | |
| | | | | | |
| | 1,860 | | | Alameda Corridor Transportation Authority, California, Revenue Bonds, Refunding Senior Lien Series 2013A, 5.000%, 10/01/23 | | | No Opt. Call | | | | | | | | A | | | | 2,319,327 | |
| | | | | | |
| | 920 | | | Apple Valley Redevelopment Agency, California, Tax Allocation Bonds, Project Area 2 Series 2007, 4.500%, 6/01/18 – AMBAC Insured | | | 6/17 at 100.00 | | | | | | | | BBB+ | | | | 953,313 | |
| | | | | | |
| | 1,270 | | | California Department of Water Resources, Power Supply Revenue Bonds, Refunding Series 2008H, 5.000%, 5/01/22 (Pre-refunded 5/01/18) – AGM Insured | | | 5/18 at 100.00 | | | | | | | | AA (4) | | | | 1,380,122 | |
| | | | | | |
| | 580 | | | California Department of Water Resources, Power Supply Revenue Bonds, Refunding Series 2008H, 5.000%, 5/01/22 – AGM Insured | | | 5/18 at 100.00 | | | | | | | | AA+ | | | | 628,853 | |
| | | | | | |
| | 6,895 | | | California Department of Water Resources, Power Supply Revenue Bonds, Series 2010L, 5.000%, 5/01/17 | | | No Opt. Call | | | | | | | | AA+ | | | | 7,197,277 | |
| | | | | | |
| | 7,250 | | | California Educational Facilities Authority, Revenue Bonds, University of Southern California, Series 2007A, 4.500%, 10/01/33 | | | 10/17 at 100.00 | | | | | | | | Aa1 | | | | 7,600,538 | |
| | | | | | |
| | 500 | | | California Health Facilities Financing Authority, Revenue Bonds, Adventist Health System/West, Series 2009C, 5.125%, 3/01/20 | | | 3/19 at 100.00 | | | | | | | | A | | | | 562,160 | |
| | | | | | |
| | 3,400 | | | California Health Facilities Financing Authority, Revenue Bonds, Childrens Hospital of Orange County, Series 2009A, 5.750%, 11/01/18 | | | No Opt. Call | | | | | | | | A | | | | 3,650,920 | |
| | | | | | |
| | 1,210 | | | California Health Facilities Financing Authority, Revenue Bonds, Lucile Salter Packard Children’s Hospital, Series 2008B, 1.450%, 8/15/33 (Pre-refunded 3/15/17) | | | 3/17 at 100.00 | | | | | | | | AA (4) | | | | 1,218,869 | |
| | | | | | |
| | 1,300 | | | California Health Facilities Financing Authority, Revenue Bonds, Lucile Salter Packard Children’s Hospital, Series 2008C, 1.450%, 8/15/23 (Pre-refunded 3/15/17) | | | 3/17 at 100.00 | | | | | | | | AA (4) | | | | 1,309,529 | |
| | | | | | |
| | 16,835 | | | California Pollution Control Financing Authority, Solid Waste Disposal Revenue Bonds, Waste Management Inc., Series 2015A-1, 3.375%, 7/01/25 (Alternative Minimum Tax) | | | No Opt. Call | | | | | | | | A– | | | | 18,234,999 | |
| | | | | | |
| | 2,245 | | | California State Public Works Board, Lease Revenue Bonds, California State University Monterey Bay Campus Library Project, Series 2009D, 6.000%, 4/01/25 (Pre-refunded 4/01/19) | | | 4/19 at 100.00 | | | | | | | | Aa3 (4) | | | | 2,586,083 | |
| | | | | | |
| | 1,400 | | | California State Public Works Board, Lease Revenue Bonds, California State University, Various University Projects, Series 2010B-1, 5.375%, 3/01/25 | | | 3/20 at 100.00 | | | | | | | | Aa3 | | | | 1,624,280 | |
| | | | | | |
| | 5,000 | | | California State Public Works Board, Lease Revenue Bonds, Various Capital Projects, Series 2009G-1, 5.250%, 10/01/24 | | | 10/19 at 100.00 | | | | | | | | A+ | | | | 5,767,500 | |
| | | | | | |
| | | | California State, Economic Recovery Revenue Bonds, Refunding Series 2009A: | | | | | | | | | | | | | | | | |
| | 2,060 | | | 5.000%, 7/01/20 (Pre-refunded 7/01/19) | | | 7/19 at 100.00 | | | | | | | | Aaa | | | | 2,334,268 | |
| | 3,830 | | | 5.250%, 7/01/21 (Pre-refunded 7/01/19) | | | 7/19 at 100.00 | | | | | | | | Aaa | | | | 4,369,877 | |
| | 2,195 | | | 5.250%, 7/01/21 (Pre-refunded 7/01/19) | | | 7/19 at 100.00 | | | | | | | | Aaa | | | | 2,504,407 | |
| | | | | | |
| | 520 | | | California State, General Obligation Bonds, Refunding Series 2007, 5.000%, 8/01/19 | | | 2/17 at 100.00 | | | | | | | | AA– | | | | 537,566 | |
| | | | | | |
| | 15 | | | California State, General Obligation Bonds, Various Purpose Series 2001, 5.000%, 11/01/18 | | | No Opt. Call | | | | | | | | AA– | | | | 15,060 | |
| | | | | | |
| | 1,000 | | | California State, General Obligation Bonds, Various Purpose Series 2007, 5.000%, 12/01/23 | | | 12/17 at 100.00 | | | | | | | | AA– | | | | 1,069,370 | |
| | | | | | |
| | 1,450 | | | California Statewide Communities Development Authority, California, Revenue Bonds, Loma Linda University Medical Center, Series 2014A, 5.250%, 12/01/29 | | | 12/24 at 100.00 | | | | | | | | BB+ | | | | 1,643,691 | |
| | | | | | | | | | | | | | | | | | | | |
Principal
Amount (000) | | | Description (1) | | Optional Call
Provisions (2) | | | | | | | Ratings (3) | | | Value | |
| | | | | | |
| | | | California (continued) | | | | | | | | | | | | | |
| | | | | | |
| $ | 800 | | | California Statewide Communities Development Authority, Revenue Bonds, Huntington Memorial Hospital, Refunding Series 2014B, 5.000%, 7/01/25 | | | 7/24 at 100.00 | | | | | | | | A | | | $ | 968,696 | |
| | | | | | |
| | 1,000 | | | California Statewide Community Development Authority, Insured Health Facility Revenue Bonds, Henry Mayo Newhall Memorial Hospital, Series 2007B, 5.200%, 10/01/37 (Pre-refunded 10/01/18) – AMBAC Insured | | | 10/18 at 100.00 | | | | | | | | AA– (4) | | | | 1,104,700 | |
| | | | | | |
| | 960 | | | California Statewide Community Development Authority, Revenue Bonds, Daughters of Charity Health System, Series 2005G, 5.250%, 7/01/22 (12) | | | 7/16 at 100.00 | | | | | | | | CCC | | | | 961,258 | |
| | | | | | |
| | 10,000 | | | California Statewide Community Development Authority, Revenue Bonds, Sutter Health, Series 2003A, 5.000%, 8/15/38 – AMBAC Insured | | | 8/17 at 100.00 | | | | | | | | AA– | | | | 10,513,000 | |
| | | | | | |
| | 1,120 | | | Contra Costa County Public Financing Authority, California, Tax Allocation Revenue Bonds, Series 2003A, 5.500%, 8/01/23 – RAAI Insured | | | 8/23 at 100.00 | | | | | | | | AA | | | | 1,123,360 | |
| | | | | | |
| | | | Culver City Redevelopment Agency, California, Tax Allocation Revenue Bonds, Redevelopment Project, Capital Appreciation Series 2011A: | | | | | | | | | | | | | | | | |
| | 7,475 | | | 0.000%, 11/01/26 | | | 11/21 at 66.91 | | | | | | | | BBB– | | | | 4,117,305 | |
| | 4,095 | | | 0.000%, 11/01/28 | | | 11/21 at 56.33 | | | | | | | | BBB– | | | | 1,877,230 | |
| | | | | | |
| | | | Delano, California, Certificates of Participation, Delano Regional Medical Center, Series 2012: | | | | | | | | | | | | | | | | |
| | 2,725 | | | 5.000%, 1/01/22 | | | No Opt. Call | | | | | | | | BBB– | | | | 3,054,752 | |
| | 2,860 | | | 5.000%, 1/01/23 | | | No Opt. Call | | | | | | | | BBB– | | | | 3,237,606 | |
| | 1,635 | | | 5.000%, 1/01/24 | | | No Opt. Call | | | | | | | | BBB– | | | | 1,838,165 | |
| | 1,325 | | | 5.000%, 1/01/25 | | | No Opt. Call | | | | | | | | BBB– | | | | 1,476,898 | |
| | | | | | |
| | | | Desert Sands Unified School District, Riverside County, California, General Obligation Bonds, Election 2001, Series 2008: | | | | | | | | | | | | | | | | |
| | 510 | | | 5.250%, 8/01/23 (Pre-refunded 8/01/18) | | | 8/18 at 100.00 | | | | | | | | Aa2 (4) | | | | 562,295 | |
| | 2,025 | | | 5.000%, 8/01/24 (Pre-refunded 8/01/18) | | | 8/18 at 100.00 | | | | | | | | Aa2 (4) | | | | 2,221,324 | |
| | | | | | |
| | 2,100 | | | Golden State Tobacco Securitization Corporation, California, Enhanced Tobacco Settlement Asset-Backed Revenue Bonds, Series 2005A, 4.550%, 6/01/22 – AGM Insured | | | 6/18 at 100.00 | | | | | | | | AA | | | | 2,242,653 | |
| | | | | | |
| | | | Golden State Tobacco Securitization Corporation, California, Tobacco Settlement Asset-Backed Bonds, Series 2007A-1: | | | | | | | | | | | | | | | | |
| | 7,795 | | | 5.000%, 6/01/17 | | | No Opt. Call | | | | | | | | Aaa | | | | 8,164,951 | |
| | 13,370 | | | 4.500%, 6/01/27 | | | 6/17 at 100.00 | | | | | | | | B+ | | | | 13,588,600 | |
| | 6,270 | | | 5.000%, 6/01/33 | | | 6/17 at 100.00 | | | | | | | | B– | | | | 6,277,022 | |
| | | | | | |
| | 1,300 | | | Grant Joint Union High School District, Sacramento County, California, General Obligation Bonds, Capital Appreciation Election 2006 Series 2008, 0.000%, 8/01/26 – AGM Insured | | | No Opt. Call | | | | | | | | A1 | | | | 955,643 | |
| | | | | | |
| | | | Lake Elsinore Public Financing Authority, California, Local Agency Revenue Bonds, Canyon Hills Improvement Area A & C, Series 2014C: | | | | | | | | | | | | | | | | |
| | 1,000 | | | 5.000%, 9/01/30 | | | 9/24 at 100.00 | | | | | | | | N/R | | | | 1,139,680 | |
| | 1,015 | | | 5.000%, 9/01/32 | | | 9/24 at 100.00 | | | | | | | | N/R | | | | 1,141,682 | |
| | 465 | | | 5.000%, 9/01/34 | | | No Opt. Call | | | | | | | | N/R | | | | 519,800 | |
| | | | | | |
| | 6,425 | | | Lake Elsinore Redevelopment Agency, California, Special Tax Bonds, Community Facilities District 90-2, Series 2007A, 4.500%, 10/01/24 – AGM Insured | | | 10/17 at 100.00 | | | | | | | | AA | | | | 6,718,623 | |
| | | | | | |
| | 2,015 | | | Las Virgenes Unified School District, Los Angeles County, California, General Obligation Bonds, 2006 Election, Series 2009B, 0.000%, 8/01/27 | | | No Opt. Call | | | | | | | | Aa2 | | | | 1,397,282 | |
| | | | | | |
| | 1,640 | | | Long Beach Financing Authority, California, Revenue Bonds, Series 1992, 6.000%, 11/01/17 – AMBAC Insured | | | No Opt. Call | | | | | | | | N/R | | | | 1,683,640 | |
| | | | | | |
| | | | Los Angeles Department of Water and Power, California, Power System Revenue Bonds, Series 2014B: | | | | | | | | | | | | | | | | |
| | 1,015 | | | 5.000%, 7/01/25 | | | 1/24 at 100.00 | | | | | | | | Aa2 | | | | 1,279,083 | |
| | 5,000 | | | 5.000%, 7/01/43 | | | 1/24 at 100.00 | | | | | | | | Aa2 | | | | 5,905,850 | |
Nuveen Intermediate Duration Municipal Bond Fund (continued)
| | |
| Portfolio of Investments | | April 30, 2016 |
| | | | | | | | | | | | | | | | | | | | |
Principal
Amount (000) | | | Description (1) | | Optional Call
Provisions (2) | | | | | | | Ratings (3) | | | Value | |
| | | | | | |
| | | | California (continued) | | | | | | | | | | | | | |
| | | | | | |
| | | | Los Angeles, California, Special Tax Bonds, Community Facilities District 4, Playa Vista Phase I, Series 2014: | | | | | | | | | | | | | | | | |
| $ | 800 | | | 5.000%, 9/01/23 | | | No Opt. Call | | | | | | | | BBB+ | | | $ | 974,416 | |
| | 1,075 | | | 5.000%, 9/01/24 | | | No Opt. Call | | | | | | | | BBB+ | | | | 1,325,239 | |
| | 1,250 | | | 5.000%, 9/01/25 | | | 9/24 at 100.00 | | | | | | | | BBB+ | | | | 1,524,150 | |
| | 1,000 | | | 5.000%, 9/01/26 | | | 9/24 at 100.00 | | | | | | | | BBB+ | | | | 1,208,840 | |
| | | | | | |
| | | | Menifee Union School District Public Financing Authority, California, Special Tax Revenue Bonds, Series 2016A: | | | | | | | | | | | | | | | | |
| | 400 | | | 5.000%, 9/01/29 – BAM Insured | | | 9/25 at 100.00 | | | | | | | | AA | | | | 479,252 | |
| | 630 | | | 5.000%, 9/01/30 – BAM Insured | | | 9/25 at 100.00 | | | | | | | | AA | | | | 751,363 | |
| | | | | | |
| | | | Moulton Niguel Water District, California, Certificates of Participation, Refunding Series 2003: | | | | | | | | | | | | | | | | |
| | 2,220 | | | 5.000%, 9/01/21 (Pre-refunded 9/01/16) – AMBAC Insured | | | 9/16 at 100.00 | | | | | | | | AAA | | | | 2,254,388 | |
| | 2,145 | | | 5.000%, 9/01/22 (Pre-refunded 9/01/16) – AMBAC Insured | | | 9/16 at 100.00 | | | | | | | | AAA | | | | 2,178,226 | |
| | 2,000 | | | 5.000%, 9/01/23 (Pre-refunded 9/01/16) – AMBAC Insured | | | 9/16 at 100.00 | | | | | | | | AAA | | | | 2,030,980 | |
| | | | | | |
| | 4,770 | | | Mount San Antonio Community College District, Los Angeles County, California, General Obligation Bonds, Election of 2008, Series 2013A, 0.000%, 8/01/28 (13) | | | 2/28 at 100.00 | | | | | | | | AA | | | | 4,434,764 | |
| | | | | | |
| | 1,075 | | | Mountain View Whisman School District, Santa Clara County, California, General Obligation Bonds, Election 2012 Series 2016B, 3.000%, 9/01/38 (WI/DD, Settling 5/19/16) | | | 9/26 at 100.00 | | | | | | | | Aaa | | | | 1,062,552 | |
| | | | | | |
| | 12,105 | | | M-S-R Energy Authority, California, Gas Revenue Bonds, Citigroup Prepay Contracts, Series 2009A, 6.125%, 11/01/29 | | | No Opt. Call | | | | | | | | A | | | | 16,010,073 | |
| | | | | | |
| | 10,045 | | | M-S-R Energy Authority, California, Gas Revenue Bonds, Citigroup Prepay Contracts, Series 2009C, 6.125%, 11/01/29 | | | No Opt. Call | | | | | | | | A | | | | 13,285,517 | |
| | | | | | |
| | | | New Haven Unified School District, California, General Obligation Bonds, Refunding Series 2014A: | | | | | | | | | | | | | | | | |
| | 4,400 | | | 5.000%, 8/01/26 – BAM Insured | | | 8/24 at 100.00 | | | | | | | | AA | | | | 5,463,172 | |
| | 3,000 | | | 5.000%, 8/01/27 – BAM Insured | | | 8/24 at 100.00 | | | | | | | | AA | | | | 3,693,240 | |
| | 2,070 | | | 5.000%, 8/01/28 – BAM Insured | | | 8/24 at 100.00 | | | | | | | | AA | | | | 2,532,417 | |
| | | | | | |
| | 2,000 | | | North Monterey County Unified School District, California, General Obligation Bonds, Election of 2013, Series 2014A, 4.000%, 5/01/44 | | | 5/24 at 100.00 | | | | | | | | A+ | | | | 2,123,720 | |
| | | | | | |
| | | | Northern California Transmission Agency, California-Oregon Transmission Project Revenue Bonds, Refunding Series 2016A: | | | | | | | | | | | | | | | | |
| | 3,095 | | | 5.000%, 5/01/34 | | | 5/26 at 100.00 | | | | | | | | A+ | | | | 3,797,720 | |
| | 2,500 | | | 5.000%, 5/01/36 | | | 5/26 at 100.00 | | | | | | | | A+ | | | | 3,032,975 | |
| | | | | | |
| | 1,000 | | | Northern Inyo County Local Hospital District, Inyo County, California, Revenue Bonds, Series 2010, 6.000%, 12/01/21 | | | 12/20 at 100.00 | | | | | | | | BB | | | | 1,117,140 | |
| | | | | | |
| | 8,000 | | | Palomar Pomerado Health, California, General Obligation Bonds, Convertible Capital Appreciation, Election 2004 Series 2010A, 0.000%, 8/01/40 (13) | | | 8/30 at 100.00 | | | | | | | | A+ | | | | 8,741,040 | |
| | | | | | |
| | | | Palomar Pomerado Health, California, General Obligation Bonds, Series 2009A: | | | | | | | | | | | | | | | | |
| | 1,815 | | | 0.000%, 8/01/21 – AGC Insured | | | No Opt. Call | | | | | | | | AA | | | | 1,639,072 | |
| | 2,095 | | | 0.000%, 8/01/22 – AGC Insured | | | No Opt. Call | | | | | | | | AA | | | | 1,824,577 | |
| | 4,085 | | | 0.000%, 8/01/23 – AGC Insured | | | No Opt. Call | | | | | | | | AA | | | | 3,404,276 | |
| | | | | | |
| | 7,000 | | | Placentia-Yorba Linda Unified School District, Orange County, California, Certificates of Participation, Refunding Series 2011, 0.000%, 10/01/25 – AGM Insured (13) | | | 10/21 at 100.00 | | | | | | | | AA | | | | 8,090,600 | |
| | | | | | |
| | | | Port of Oakland, California, Revenue Bonds, Refunding Inter Lien Series 2007B: | | | | | | | | | | | | | | | | |
| | 2,530 | | | 5.000%, 11/01/18 – NPFG Insured | | | 11/17 at 100.00 | | | | | | | | AA– | | | | 2,699,687 | |
| | 1,230 | | | 5.000%, 11/01/19 – NPFG Insured | | | 11/17 at 100.00 | | | | | | | | AA– | | | | 1,311,918 | |
| | | | | | |
| | 5,350 | | | Poway Unified School District, San Diego County, California, General Obligation Bonds, School Facilities Improvement District 2007-1, Series 2011A, 0.000%, 8/01/34 | | | No Opt. Call | | | | | | | | AA– | | | | 2,888,465 | |
| | | | | | | | | | | | | | | | | | | | |
Principal
Amount (000) | | | Description (1) | | Optional Call
Provisions (2) | | | | | | | Ratings (3) | | | Value | |
| | | | | | |
| | | | California (continued) | | | | | | | | | | | | | |
| | | | | | |
| $ | 2,910 | | | Rancho Cucamonga Redevelopment Agency Successor Agency, California, Tax Allocation Bonds, Rancho Redevelopment Project, Series 2014, 5.000%, 9/01/24 | | | No Opt. Call | | | | | | | | AA | | | $ | 3,686,301 | |
| | | | | | |
| | 2,410 | | | Riverside County Redevelopment Agency Successor Agency, California, Tax Allocation Bonds, Refunding Series 2014A, 4.000%, 10/01/37 – AGM Insured | | | 10/24 at 100.00 | | | | | | | | AA | | | | 2,578,266 | |
| | | | | | |
| | | | Riverside County Redevelopment Agency, California, Tax Allocation Bonds, Jurupa Valley Project Area, Series 2011B: | | | | | | | | | | | | | | | | |
| | 2,115 | | | 0.000%, 10/01/34 | | | No Opt. Call | | | | | | | | A | | | | 1,046,671 | |
| | 2,000 | | | 0.000%, 10/01/36 | | | No Opt. Call | | | | | | | | A | | | | 899,020 | |
| | | | | | |
| | 5,000 | | | Sacramento County, California, Airport System Revenue Bonds, Senior Lien Series 2010, 5.000%, 7/01/40 | | | 7/20 at 100.00 | | | | | | | | A | | | | 5,662,850 | |
| | | | | | |
| | 1,000 | | | San Bernardino Community College District, California, General Obligation Bonds, Election 2002 Series 2008A, 6.500%, 8/01/27 (Pre-refunded 8/01/18) | | | 8/18 at 100.00 | | | | | | | | Aa2 (4) | | | | 1,129,510 | |
| | | | | | |
| | | | San Joaquin Hills Transportation Corridor Agency, Orange County, California, Toll Road Revenue Bonds, Refunding Senior Lien Series 2014A: | | | | | | | | | | | | | | | | |
| | 5,000 | | | 5.000%, 1/15/29 | | | 1/25 at 100.00 | | | | | | | | BBB– | | | | 5,644,800 | |
| | 26,000 | | | 5.000%, 1/15/34 | | | 1/25 at 100.00 | | | | | | | | BBB– | | | | 29,277,300 | |
| | | | | | |
| | 2,770 | | | San Jose Redevelopment Agency, California, Tax Allocation Bonds, Merged Area Redevelopment Project, Refunding Series 2006D, 5.000%, 8/01/23 – AMBAC Insured | | | 8/17 at 100.00 | | | | | | | | BBB+ | | | | 2,897,198 | |
| | | | | | |
| | 1,000 | | | San Mateo Union High School District, San Mateo County, California, General Obligation Bonds, Election of 2000, Series 2002B, 0.000%, 9/01/17 – FGIC Insured | | | No Opt. Call | | | | | | | | Aaa | | | | 991,010 | |
| | | | | | |
| | 2,250 | | | Santa Ana Financing Authority, California, Lease Revenue Bonds, Police Administration and Housing Facility, Series 1994A, 6.250%, 7/01/24 | | | No Opt. Call | | | | | | | | AA– | | | | 2,866,343 | |
| | | | | | |
| | 2,255 | | | Santa Ana Financing Authority, California, Lease Revenue Bonds, Police Administration and Housing Facility, Series 1994A, 6.250%, 7/01/24 (ETM) | | | No Opt. Call | | | | | | | | AA– (4) | | | | 2,871,156 | |
| | | | | | |
| | 1,000 | | | Santa Ana Unified School District, Orange County, California, General Obligation Bonds, Series 2008A, 5.250%, 8/01/28 | | | 8/18 at 100.00 | | | | | | | | Aa3 | | | | 1,098,790 | |
| | | | | | |
| | | | Santa Paula Utility Authority, California, Water Enterprise Revenue Bonds, Refunding Series 2010: | | | | | | | | | | | | | | | | |
| | 2,510 | | | 5.000%, 2/01/28 | | | 2/20 at 100.00 | | | | | | | | A+ | | | | 2,824,177 | |
| | 2,630 | | | 5.000%, 2/01/29 | | | 2/20 at 100.00 | | | | | | | | A+ | | | | 2,951,018 | |
| | 2,765 | | | 5.000%, 2/01/30 | | | 2/20 at 100.00 | | | | | | | | A+ | | | | 3,122,515 | |
| | | | | | |
| | | | South Bayside Waste Management Authority, California, Solida Waste Enterprise Revenue Bonds, Shoreway Environmental Center, Series 2009A: | | | | | | | | | | | | | | | | |
| | 2,500 | | | 5.250%, 9/01/24 | | | 9/19 at 100.00 | | | | | | | | A1 | | | | 2,831,250 | |
| | 1,200 | | | 6.250%, 9/01/29 | | | 9/19 at 100.00 | | | | | | | | A1 | | | | 1,402,032 | |
| | | | | | |
| | | | Tulare Local Health Care District, California, General Obligation Bonds, Series 2009B-1: | | | | | | | | | | | | | | | | |
| | 1,180 | | | 6.000%, 8/01/22 | | | 8/19 at 100.00 | | | | | | | | Baa3 | | | | 1,353,283 | |
| | 1,410 | | | 6.125%, 8/01/23 | | | 8/19 at 100.00 | | | | | | | | Baa3 | | | | 1,613,632 | |
| | 1,585 | | | 6.250%, 8/01/24 | | | 8/19 at 100.00 | | | | | | | | Baa3 | | | | 1,812,321 | |
| | 1,265 | | | 6.375%, 8/01/25 | | | 8/19 at 100.00 | | | | | | | | Baa3 | | | | 1,446,047 | |
| | 500 | | | 6.500%, 8/01/26 | | | 8/19 at 100.00 | | | | | | | | Baa3 | | | | 571,720 | |
| | | | | | |
| | 1,100 | | | Upland Community Redevelopment Agency, California, Tax Allocation Refunding Bonds, A Merged Project, Series 2006, 4.250%, 9/01/26 – AMBAC Insured | | | 9/16 at 100.00 | | | | | | | | A | | | | 1,112,727 | |
| | | | | | |
| | 2,030 | | | Victor Elementary School District, San Bernardino County, California, General Obligation Bonds, Series 2002A, 0.000%, 8/01/23 – FGIC Insured | | | No Opt. Call | | | | | | | | AA– | | | | 1,744,704 | |
| | | | | | |
| | 3,000 | | | Victor Valley Union High School District, San Bernardino County, California, General Obligation Bonds, Series 2009A, 0.000%, 8/01/31 – AGC Insured (13) | | | 8/26 at 100.00 | | | | | | | | AA | | | | 3,153,780 | |
Nuveen Intermediate Duration Municipal Bond Fund (continued)
| | |
| Portfolio of Investments | | April 30, 2016 |
| | | | | | | | | | | | | | | | | | | | |
Principal
Amount (000) | | | Description (1) | | Optional Call
Provisions (2) | | | | | | | Ratings (3) | | | Value | |
| | | | | | |
| | | | California (continued) | | | | | | | | | | | | | |
| | | | | | |
| | | | Washington Township Health Care District, California, Revenue Bonds, Refunding Series 2015A: | | | | | | | | | | | | | | | | |
| $ | 1,540 | | | 5.000%, 7/01/24 | | | No Opt. Call | | | | | | | | Baa1 | | | $ | 1,833,601 | |
| | 1,415 | | | 5.000%, 7/01/25 | | | No Opt. Call | | | | | | | | Baa1 | | | | 1,693,076 | |
| | 1,450 | | | 3.250%, 7/01/27 | | | No Opt. Call | | �� | | | | | | Baa1 | | | | 1,471,866 | |
| | 1,435 | | | 3.500%, 7/01/28 | | | No Opt. Call | | | | | | | | Baa1 | | | | 1,474,692 | |
| | 1,355 | | | 3.750%, 7/01/29 | | | No Opt. Call | | | | | | | | Baa1 | | | | 1,400,162 | |
| | | | | | |
| | 2,500 | | | West Contra Costa Unified School District, Contra Costa County, California, General Obligation Bonds, Series 2008B, 6.000%, 8/01/25 | | | No Opt. Call | | | | | | | | Baa2 | | | | 3,413,775 | |
| | | | | | |
| | 995 | | | Whittier Public Financing Authority, California, Tax Allocation Revenue Bonds, Whittier Redevelopment Agency, Series 2007A, 5.000%, 11/01/21 (Pre-refunded 11/01/17) – AMBAC Insured | | | 11/17 at 100.00 | | | | | | | | Baa2 (4) | | | | 1,060,332 | |
| | 333,565 | | | Total California | | | | | | | | | | | | | | | 356,847,850 | |
| | | | | | |
| | | | Colorado – 2.0% | | | | | | | | | | | | | |
| | | | | | |
| | 1,125 | | | Adams and Arapahoe Counties Joint School District 28J, Aurora, Colorado, General Obligation Bonds, Series 2008, 5.500%, 12/01/21 (Pre-refunded 12/01/18) | | | 12/18 at 100.00 | | | | | | | | Aa2 (4) | | | | 1,261,800 | |
| | | | | | |
| | 5,050 | | | Adams County, Colorado, Pollution Control Refunding Revenue Bonds, Public Service Company of Colorado Projects, Senior Lien Series 2005A, 4.375%, 9/01/17 – NPFG Insured | | | No Opt. Call | | | | | | | | AA– | | | | 5,066,968 | |
| | | | | | |
| | 2,250 | | | Boulder Larimer & Weld Counties School District RE-1J Saint Vain Valley, Colorado, General Obligation Bonds, Refunding Series 2016A, 4.000%, 12/15/17 | | | No Opt. Call | | | | | | | | AA | | | | 2,370,938 | |
| | | | | | |
| | 175 | | | Colorado Educational and Cultural Facilities Authority, Charter School Revenue Bonds, Cheyenne Mountain Charter Academy, Series 2007A, 4.750%, 6/15/22 (Pre-refunded 6/15/17) | | | 6/17 at 100.00 | | | | | | | | A (4) | | | | 183,089 | |
| | | | | | |
| | | | Colorado Educational and Cultural Facilities Authority, Revenue Bonds, Regis University Project, Refunding Series 2016: | | | | | | | | | | | | | | | | |
| | 2,000 | | | 3.125%, 10/01/31 (WI/DD, Settling 5/11/16) | | | 10/25 at 100.00 | | | | | | | | Baa2 | | | | 1,970,820 | |
| | 1,000 | | | 3.375%, 10/01/35 (WI/DD, Settling 5/11/16) | | | 10/25 at 100.00 | | | | | | | | Baa2 | | | | 991,730 | |
| | | | | | |
| | 1,000 | | | Colorado Health Facilities Authority, Colorado, Hospital Improvement Revenue Bonds, NCMC Inc., Series 2003B, 6.000%, 5/15/26 – AGM Insured | | | 5/19 at 100.00 | | | | | | | | AA | | | | 1,114,010 | |
| | | | | | |
| | 16,830 | | | Colorado Health Facilities Authority, Colorado, Revenue Bonds, Catholic Health Initiatives, Series 2006A, 5.000%, 9/01/26 | | | 9/16 at 100.00 | | | | | | | | A+ | | | | 17,076,055 | |
| | | | | | |
| | 725 | | | Colorado Health Facilities Authority, Colorado, Revenue Bonds, Catholic Health Initiatives, Series 2006C-7, 4.350%, 9/01/20 (Pre-refunded 5/01/18) – AGM Insured | | | 5/18 at 100.00 | | | | | | | | AA (4) | | | | 777,584 | |
| | | | | | |
| | 1,525 | | | Colorado Health Facilities Authority, Colorado, Revenue Bonds, Catholic Health Initiatives, Series 2008D, 5.125%, 10/01/17 | | | No Opt. Call | | | | | | | | A+ | | | | 1,619,764 | |
| | | | | | |
| | 310 | | | Colorado Health Facilities Authority, Colorado, Revenue Bonds, Evangelical Lutheran Good Samaritan Society Project, Series 2013, 5.500%, 6/01/33 | | | 6/23 at 100.00 | | | | | | | | BBB+ | | | | 362,275 | |
| | | | | | |
| | 1,400 | | | Colorado Health Facilities Authority, Colorado, Revenue Bonds, Total Long-Term Care National Obligated Group Project, Series 2010A, 5.250%, 11/15/20 (ETM) | | | No Opt. Call | | | | | | | | N/R (4) | | | | 1,537,452 | |
| | | | | | |
| | 6,725 | | | Colorado Health Facilities Authority, Colorado, Revenue Bonds, Yampa Valley Medical Center, Series 2007, 5.000%, 9/15/22 | | | 9/17 at 100.00 | | | | | | | | BBB+ | | | | 7,006,912 | |
| | | | | | |
| | 10,000 | | | Colorado Health Facilities Authority, Retirement Facilities Revenue Bonds, Liberty Heights, Series 1990B, 0.000%, 7/15/20 (ETM) | | | No Opt. Call | | | | | | | | AA+ (4) | | | | 9,469,100 | |
| | | | | | |
| | | | Colorado Health Facilities Authority, Revenue Bonds, Evangelical Lutheran Good Samaritan Society, Series 2006: | | | | | | | | | | | | | | | | |
| | 1,000 | | | 5.000%, 6/01/16 | | | No Opt. Call | | | | | | | | BBB+ | | | | 1,003,710 | |
| | 290 | | | 5.250%, 6/01/18 | | | 6/16 at 100.00 | | | | | | | | BBB+ | | | | 291,137 | |
| | | | | | | | | | | | | | | | | | | | |
Principal
Amount (000) | | | Description (1) | | Optional Call
Provisions (2) | | | | | | | Ratings (3) | | | Value | |
| | | | | | |
| | | | Colorado (continued) | | | | | | | | | | | | | |
| | | | | | |
| $ | 710 | | | Colorado Health Facilities Authority, Revenue Bonds, Evangelical Lutheran Good Samaritan Society, Series 2006, 5.250%, 6/01/18 (Pre-refunded 6/01/16) | | | 6/16 at 100.00 | | | | | | | | N/R (4) | | | $ | 712,996 | |
| | | | | | |
| | 1,510 | | | Colorado State Higher Education Capital Construction Lease Purchase Financing Program Certificates of Participation, Series 2008, 5.250%, 11/01/23 (Pre-refunded 11/01/18) | | | 11/18 at 100.00 | | | | | | | | Aa2 (4) | | | | 1,677,082 | |
| | | | | | |
| | 1,500 | | | Delta County Memorial Hospital District, Colorado, Enterprise Revenue Bonds, Refunding Series 2010, 5.500%, 9/01/25 | | | 3/20 at 100.00 | | | | | | | | BBB– | | | | 1,590,210 | |
| | | | | | |
| | 11,000 | | | Denver City and County, Colorado, Airport System Revenue Bonds, Series 2012B, 5.000%, 11/15/32 | | | 11/22 at 100.00 | | | | | | | | A+ | | | | 13,055,680 | |
| | | | | | |
| | 6,050 | | | Denver, Colorado, Airport System Revenue Bonds, Refunding Series 2006A, 5.000%, 11/15/19 – FGIC Insured | | | 11/16 at 100.00 | | | | | | | | AA– | | | | 6,203,852 | |
| | | | | | |
| | 4,025 | | | Denver, Colorado, Airport System Revenue Bonds, Refunding Series 2006A, 5.000%, 11/15/19 (Pre-refunded 11/15/16) – FGIC Insured | | | 11/16 at 100.00 | | | | | | | | AA– (4) | | | | 4,122,888 | |
| | | | | | |
| | 10,000 | | | E-470 Public Highway Authority, Colorado, Toll Revenue Bonds, Series 2004B, 0.000%, 3/01/36 – NPFG Insured | | | 9/20 at 41.72 | | | | | | | | AA– | | | | 3,544,200 | |
| | | | | | |
| | 1,500 | | | E-470 Public Highway Authority, Colorado, Toll Revenue Bonds, Series 2004C, 5.000%, 9/01/17 – NPFG Insured | | | No Opt. Call | | | | | | | | AA– | | | | 1,577,160 | |
| | | | | | |
| | | | El Paso County School District 20, Academy, Colorado, General Obligation Bonds, Refunding Series 2010: | | | | | | | | | | | | | | | | |
| | 1,520 | | | 5.000%, 12/15/20 | | | No Opt. Call | | | | | | | | Aa2 | | | | 1,790,074 | |
| | 2,215 | | | 5.000%, 12/15/21 | | | No Opt. Call | | | | | | | | Aa2 | | | | 2,672,043 | |
| | 1,530 | | | 5.000%, 12/15/22 | | | 12/21 at 100.00 | | | | | | | | Aa2 | | | | 1,829,253 | |
| | | | | | |
| | 1,485 | | | Montrose, Colorado, Enterprise Revenue Bonds, Montrose Memorial Hospital, Series 2003, 5.700%, 12/01/17 | | | No Opt. Call | | | | | | | | BBB– | | | | 1,490,955 | |
| | | | | | |
| | 1,000 | | | North Range Metropolitan District 1, Adams County, Colorado, Limited Tax General Obligation Bonds, Refunding Series 2007, 4.300%, 12/15/19 – ACA Insured | | | 12/16 at 100.00 | | | | | | | | N/R | | | | 1,004,580 | |
| | | | | | |
| | 775 | | | Platte River Power Authority, Colorado, Power Revenue Bonds, Refunding Series 2007GG, 4.500%, 6/01/17 – AGM Insured | | | No Opt. Call | | | | | | | | AA | | | | 808,286 | |
| | | | | | |
| | | | Plaza Metropolitan District 1, Lakewood, Colorado, Tax Increment Revenue Bonds, Refunding Series 2013: | | | | | | | | | | | | | | | | |
| | 1,335 | | | 5.000%, 12/01/19 | | | No Opt. Call | | | | | | | | N/R | | | | 1,429,518 | |
| | 500 | | | 5.000%, 12/01/20 | | | No Opt. Call | | | | | | | | N/R | | | | 541,315 | |
| | | | | | |
| | 1,000 | | | Pueblo County School District 60, Pueblo, Colorado, General Obligation Bonds, Refunding Series 2009, 5.000%, 12/15/22 | | | No Opt. Call | | | | | | | | Aa2 | | | | 1,228,790 | |
| | | | | | |
| | 1,325 | | | Rangeview Library District, Adams County, Colorado, Certificates of Participation, Rangeview Library Projects, Series 2008, 4.500%, 12/15/20 (Pre-refunded 12/15/18) – AGC Insured | | | 12/18 at 100.00 | | | | | | | | AA (4) | | | | 1,453,260 | |
| | | | | | |
| | 975 | | | Regional Transportation District, Colorado, Denver Transit Partners Eagle P3 Project Private Activity Bonds, Series 2010, 6.000%, 1/15/41 | | | 7/20 at 100.00 | | | | | | | | BBB+ | | | | 1,130,220 | |
| | | | | | |
| | | | Sand Creek Metropolitan District, Colorado, General Obligation Bonds, Refunding Series 2010A: | | | | | | | | | | | | | | | | |
| | 2,190 | | | 4.250%, 12/01/23 | | | 12/20 at 100.00 | | | | | | | | A | | | | 2,464,188 | |
| | 2,030 | | | 4.000%, 12/01/24 | | | 12/20 at 100.00 | | | | | | | | A | | | | 2,251,270 | |
| | | | | | |
| | 1,000 | | | Spring Mesa Metropolitan District, Jefferson County, Colorado, General Obligation Bonds, Refunding Series 2015, 3.750%, 12/01/44 – AGM Insured | | | 12/25 at 100.00 | | | | | | | | AA | | | | 999,420 | |
| | | | | | |
| | 1,000 | | | Walker Field Public Airport Authority, Colorado, Airport Revenue Bonds, Series 2007, 5.000%, 12/01/22 | | | 12/17 at 100.00 | | | | | | | | Baa2 | | | | 1,053,930 | |
Nuveen Intermediate Duration Municipal Bond Fund (continued)
| | |
| Portfolio of Investments | | April 30, 2016 |
| | | | | | | | | | | | | | | | | | | | |
Principal
Amount (000) | | | Description (1) | | Optional Call
Provisions (2) | | | | | | | Ratings (3) | | | Value | |
| | | | | | |
| | | | Colorado (continued) | | | | | | | | | | | | | |
| | | | | | |
| $ | 1,240 | | | Westminster, Colorado, Special Purpose Sales and Use Tax Revenue Bonds, Series 2007D, 5.000%, 12/01/23 (Pre-refunded 12/01/17) – AGM Insured | | | 12/17 at 100.00 | | | | | | | | AA (4) | | | $ | 1,324,605 | |
| | 108,820 | | | Total Colorado | | | | | | | | | | | | | | | 108,059,119 | |
| | | | | | |
| | | | Connecticut – 0.7% | | | | | | | | | | | | | |
| | | | | | |
| | 500 | | | Connecticut Health and Educational Facilities Authority, Revenue Bonds, Healthcare Facility Expansion Church Home of Hartford Inc. Project, TEMPS-50 Series 2016B-2, 2.875%, 9/01/20 | | | 9/17 at 100.00 | | | | | | | | N/R | | | | 501,460 | |
| | | | | | |
| | 14,140 | | | Connecticut Health and Educational Facilities Authority, Revenue Bonds, Yale University, Variable Rate Demand Obligations, Series 1999-U1, 1.000%, 7/01/33 | | | No Opt. Call | | | | | | | | AAA | | | | 14,134,627 | |
| | | | | | |
| | 12,070 | | | Connecticut Health and Educational Facilities Authority, Revenue Bonds, Yale University, Variable Rate Demand Obligations, Series 1999-U2, 1.000%, 7/01/33 | | | No Opt. Call | | | | | | | | AAA | | | | 12,065,413 | |
| | | | | | |
| | 2,645 | | | Eastern Connecticut Resource Recovery Authority, Solid Waste Revenue Bonds, Wheelabrator Lisbon Project, Series 1993A, 5.500%, 1/01/20 (Alternative Minimum Tax) | | | 7/16 at 100.00 | | | | | | | | A– | | | | 2,662,907 | |
| | | | | | |
| | | | Milford, Connecticut, General Obligation Bonds, Refunding Series 2016: | | | | | | | | | | | | | | | | |
| | 1,035 | | | 5.000%, 11/01/20 | | | No Opt. Call | | | | | | | | Aa1 | | | | 1,220,772 | |
| | 1,580 | | | 5.000%, 11/01/21 | | | No Opt. Call | | | | | | | | Aa1 | | | | 1,911,089 | |
| | | | | | |
| | 1,000 | | | New Britain, Connecticut, General Obligation Bonds, Refunding Series 2016A, 5.000%, 3/01/19 – BAM Insured | | | No Opt. Call | | | | | | | | Baa1 | | | | 1,109,500 | |
| | | | | | |
| | | | Stratford, Connecticut, General Obligation Bonds, Series 2014: | | | | | | | | | | | Baa1 | | | | | |
| | 350 | | | 5.000%, 12/15/24 | | | 12/22 at 100.00 | | | | | | | | Aa3 | | | | 432,313 | |
| | 495 | | | 5.000%, 12/15/26 | | | 12/22 at 100.00 | | | | | | | | Aa3 | | | | 608,207 | |
| | 33,815 | | | Total Connecticut | | | | | | | | | | | Aa3 | | | | 34,646,288 | |
| | | | | | |
| | | | Delaware – 0.1% | | | | | | | | | | | | | |
| | | | | | |
| | | | Delaware Health Facilities Authority, Revenue Bonds, Nanticoke Memorial Hospital, Series 2013: | | | | | | | | | | | | | | | | |
| | 1,000 | | | 4.000%, 7/01/22 | | | No Opt. Call | | | | | | | | BBB | | | | 1,070,790 | |
| | 3,995 | | | 5.000%, 7/01/28 | | | 7/23 at 100.00 | | | | | | | | BBB | | | | 4,387,948 | |
| | 4,995 | | | Total Delaware | | | | | | | | | | | | | | | 5,458,738 | |
| | | | | | |
| | | | District of Columbia – 0.6% | | | | | | | | | | | | | |
| | | | | | |
| | 3,880 | | | District of Columbia Student Dormitory Revenue Bonds, Provident Group – Howard Properties LLC Issue, Series 2013, 5.000%, 10/01/30 | | | 10/22 at 100.00 | | | | | | | | BB+ | | | | 3,967,649 | |
| | | | | | |
| | 7,045 | | | District of Columbia Tobacco Settlement Corporation, Tobacco Settlement Asset-Backed Bonds, Series 2001, 6.500%, 5/15/33 | | | No Opt. Call | | | | | | | | Baa1 | | | | 8,668,309 | |
| | | | | | |
| | 10,165 | | | District of Columbia Water and Sewer Authority, Public Utility Revenue Bonds, Series 1998, 5.500%, 10/01/18 – AGM Insured | | | No Opt. Call | | | | | | | | AAA | | | | 11,317,813 | |
| | | | | | |
| | | | District of Columbia, Hospital Revenue Bonds, Sibley Memorial Hospital, Series 2009: | | | | | | | | | | | | | | | | |
| | 420 | | | 6.500%, 10/01/20 (Pre-refunded 10/01/19) | | | 10/19 at 100.00 | | | | | | | | AA– (4) | | | | 499,708 | |
| | 1,715 | | | 6.500%, 10/01/23 (Pre-refunded 10/01/19) | | | 10/19 at 100.00 | | | | | | | | AA– (4) | | | | 2,040,473 | |
| | 825 | | | 6.500%, 10/01/24 (Pre-refunded 10/01/19) | | | 10/19 at 100.00 | | | | | | | | AA– (4) | | | | 981,569 | |
| | | | | | |
| | 3,740 | | | District of Columbia, Revenue Bonds, The Catholic University of America, Series 2010, 5.000%, 10/01/23 | | | 10/18 at 100.00 | | | | | | | | A | | | | 4,094,028 | |
| | 27,790 | | | Total District of Columbia | | | | | | | | | | | | | | | 31,569,549 | |
| | | | | | |
| | | | Florida – 6.9% | | | | | | | | | | | | | |
| | | | | | |
| | 12,500 | | | Broward County School Board, Florida, Certificates of Participation, Series 2015A, 5.000%, 7/01/25 | | | No Opt. Call | | | | | | | | Aa3 | | | | 15,675,875 | |
| | | | | | | | | | | | | | | | | | | | |
Principal
Amount (000) | | | Description (1) | | Optional Call
Provisions (2) | | | | | | | Ratings (3) | | | Value | |
| | | | | | |
| | | | Florida (continued) | | | | | | | | | | | | | |
| | | | | | |
| | | | Broward County, Florida, Airport System Revenue Bonds, Series 2015A: | | | | | | | | | | | | | | | | |
| $ | 10,000 | | | 5.000%, 10/01/34 (Alternative Minimum Tax) | | | 10/25 at 100.00 | | | | | | | | A+ | | | $ | 11,720,300 | |
| | 15,135 | | | 5.000%, 10/01/35 (Alternative Minimum Tax) | | | 10/25 at 100.00 | | | | | | | | A+ | | | | 17,670,718 | |
| | | | | | |
| | | | Cape Coral, Florida, Water and Sewer Revenue Bonds, Refunding Series 2015: | | | | | | | | | | | | | | | | |
| | 9,685 | | | 5.000%, 10/01/32 | | | 10/25 at 100.00 | | | | | | | | A1 | | | | 11,643,113 | |
| | 7,325 | | | 5.000%, 10/01/33 | | | 10/25 at 100.00 | | | | | | | | A1 | | | | 8,785,605 | |
| | | | | | |
| | | | Citizens Property Insurance Corporation, Florida, Coastal Account Senior Secured Bonds, Series 2015A-1: | | | | | | | | | | | | | | | | |
| | 16,420 | | | 5.000%, 6/01/22 | | | 12/21 at 100.00 | | | | | | | | AA– | | | | 19,546,532 | |
| | 14,635 | | | 5.000%, 6/01/25 | | | 12/24 at 100.00 | | | | | | | | AA– | | | | 18,147,107 | |
| | | | | | |
| | 33,155 | | | Citizens Property Insurance Corporation, Florida, High Risk Account Revenue Bonds, Series 2007A, 5.000%, 3/01/17 – NPFG Insured (ETM) | | | No Opt. Call | | | | | | | | AA– (4) | | | | 34,358,195 | |
| | | | | | |
| | 2,305 | | | Citizens Property Insurance Corporation, Florida, High Risk Assessment Revenue, Senior Secured Bonds, Series 2009A-1, 5.500%, 6/01/17 | | | No Opt. Call | | | | | | | | A+ | | | | 2,422,163 | |
| | | | | | |
| | | | Citizens Property Insurance Corporation, Florida, High-Risk Account Revenue Bonds, Coastal Account Senior Secured Series 2011A-1: | | | | | | | | | | | | | | | | |
| | 3,600 | | | 5.000%, 6/01/18 | | | No Opt. Call | | | | | | | | AA– | | | | 3,905,388 | |
| | 275 | | | 5.000%, 6/01/19 | | | No Opt. Call | | | | | | | | AA– | | | | 308,000 | |
| | | | | | |
| | | | Citizens Property Insurance Corporation, Florida, High-Risk Account Senior Secured Bonds Series 2010A-1: | | | | | | | | | | | | | | | | |
| | 305 | | | 5.250%, 6/01/17 | | | No Opt. Call | | | | | | | | A+ | | | | 319,677 | |
| | 1,375 | | | 4.250%, 6/01/17 | | | No Opt. Call | | | | | | | | A+ | �� | | | 1,426,288 | |
| | 1,195 | | | 4.000%, 6/01/17 – AGM Insured | | | No Opt. Call | | | | | | | | AA | | | | 1,237,004 | |
| | | | | | |
| | | | Citizens Property Insurance Corporation, Florida, Personal and Commercial Lines Account Bonds, Senior Secured Series 2012A-1: | | | | | | | | | | | | | | | | |
| | 85 | | | 5.000%, 6/01/16 | | | No Opt. Call | | | | | | | | AA– | | | | 85,348 | |
| | 85 | | | 5.000%, 6/01/18 | | | No Opt. Call | | | | | | | | AA– | | | | 92,211 | |
| | 480 | | | 5.000%, 6/01/19 | | | No Opt. Call | | | | | | | | AA– | | | | 537,600 | |
| | 4,545 | | | 5.000%, 6/01/20 | | | No Opt. Call | | | | | | | | AA– | | | | 5,235,658 | |
| | 1,600 | | | 5.000%, 6/01/21 | | | No Opt. Call | | | | | | | | AA– | | | | 1,885,104 | |
| | | | | | |
| | 2,205 | | | Clay County School Board, Florida, Certificates of Participation, Refunding Series 2005B, 5.000%, 7/01/18 – NPFG Insured | | | 7/16 at 100.00 | | | | | | | | A2 | | | | 2,213,489 | |
| | | | | | |
| | | | Collier County Educational Facilities Authority, Florida, Revenue Bonds, Hodges University, Refunding Series 2013: | | | | | | | | | | | | | | | | |
| | 3,190 | | | 4.750%, 11/01/23 | | | No Opt. Call | | | | | | | | BBB– | | | | 3,453,941 | |
| | 1,860 | | | 6.000%, 11/01/33 | | | 11/23 at 100.00 | | | | | | | | BBB– | | | | 2,093,690 | |
| | | | | | |
| | | | Dade County Housing Finance Authority, Florida, Multifamily Mortgage Revenue Bonds, Siesta Pointe Apartments Project, Series 1997A: | | | | | | | | | | | | | | | | |
| | 410 | | | 5.650%, 9/01/17 – AGM Insured (Alternative Minimum Tax) | | | 9/16 at 100.00 | | | | | | | | AA+ | | | | 411,304 | |
| | 1,890 | | | 5.750%, 9/01/29 – AGM Insured (Alternative Minimum Tax) | | | 9/16 at 100.00 | | | | | | | | AA+ | | | | 1,894,442 | |
| | | | | | |
| | 840 | | | Escambia County, Florida, Pollution Control Revenue Bonds, Gulf Power Company, Refunding Series 1997, 2.100%, 7/01/22 (Mandatory put 4/11/19) | | | No Opt. Call | | | | | | | | A2 | | | | 861,218 | |
| | | | | | |
| | 3,275 | | | Florida Governmental Utility Authority, Utility Revenue Bonds, Lake Aqua Utility System, Series 2013A, 4.250%, 10/01/33 | | | 10/22 at 100.00 | | | | | | | | A– | | | | 3,457,549 | |
| | | | | | |
| | 2,700 | | | Florida Governmental Utility Authority, Utility Revenue Bonds, Pasco Aqua Utility System, Series 2013A, 4.250%, 10/01/33 | | | 10/22 at 100.00 | | | | | | | | Baa1 | | | | 2,832,948 | |
Nuveen Intermediate Duration Municipal Bond Fund (continued)
| | |
| Portfolio of Investments | | April 30, 2016 |
| | | | | | | | | | | | | | | | | | | | |
Principal
Amount (000) | | | Description (1) | | Optional Call
Provisions (2) | | | | | | | Ratings (3) | | | Value | |
| | | | | | |
| | | | Florida (continued) | | | | | | | | | | | | | |
| | | | | | |
| | | | Florida Higher Educational Facilities Financing Authority, Revenue Bonds, Nova Southeastern University Project, Refunding Series 2016: | | | | | | | | | | | | | | | | |
| $ | 1,250 | | | 5.000%, 4/01/32 (WI/DD, Settling 5/12/16) | | | 4/26 at 100.00 | | | | | | | | A– | | | $ | 1,493,163 | |
| | 1,750 | | | 5.000%, 4/01/33 (WI/DD, Settling 5/12/16) | | | 4/26 at 100.00 | | | | | | | | A– | | | | 2,082,080 | |
| | 1,500 | | | 5.000%, 4/01/34 (WI/DD, Settling 5/12/16) | | | 4/26 at 100.00 | | | | | | | | A– | | | | 1,778,940 | |
| | 1,500 | | | 5.000%, 4/01/35 (WI/DD, Settling 5/12/16) | | | 4/26 at 100.00 | | | | | | | | A– | | | | 1,769,025 | |
| | | | | | |
| | | | Florida Municipal Power Agency, Power Supply Revenue Bonds, All Requirements Project, Refunding Series 2016A: | | | | | | | | | | | | | | | | |
| | 5,500 | | | 5.000%, 10/01/21 | | | No Opt. Call | | | | | | | | A+ | | | | 6,523,165 | |
| | 12,000 | | | 5.000%, 10/01/30 | | | 10/26 at 100.00 | | | | | | | | A+ | | | | 14,802,480 | |
| | 8,000 | | | 5.000%, 10/01/31 | | | 10/26 at 100.00 | | | | | | | | A+ | | | | 9,824,880 | |
| | | | | | |
| | 1,500 | | | Florida State Department of Children and Families, Certificates of Participation, South Florida Evaluation Treatment Project, Series 2005, 5.000%, 10/01/25 | | | No Opt. Call | | | | | | | | AA+ | | | | 1,505,775 | |
| | | | | | |
| | 4,270 | | | Florida State Turnpike Authority, Turnpike Revenue Bonds, Department of Transportation, Refunding Series 2006A, 5.000%, 7/01/16 – NPFG Insured | | | No Opt. Call | | | | | | | | AA | | | | 4,303,605 | |
| | | | | | |
| | | | Halifax Hospital Medical Center, Daytona Beach, Florida, Hospital Revenue Bonds, Series 2006: | | | | | | | | | | | | | | | | |
| | 1,695 | | | 5.250%, 6/01/26 (Pre-refunded 6/01/16) | | | 6/16 at 100.00 | | | | | | | | N/R (4) | | | | 1,702,187 | |
| | 690 | | | 5.250%, 6/01/26 (Pre-refunded 6/01/16) | | | 6/16 at 100.00 | | | | | | | | A– (4) | | | | 692,953 | |
| | | | | | |
| | 2,240 | | | Jacksonville, Florida, Capital Improvement Revenue Bonds, Refunding Series 2012, 5.000%, 10/01/20 | | | No Opt. Call | | | | | | | | AA | | | | 2,611,549 | |
| | | | | | |
| | 1,940 | | | Jacksonville, Florida, Special Revenue Bonds, Series 20120C, 5.000%, 10/01/24 | | | No Opt. Call | | | | | | | | AA– | | | | 2,346,624 | |
| | | | | | |
| | 7,000 | | | Lee County, Florida, Airport Revenue Bonds, Refunding Series 2011A, 5.375%, 10/01/32 – AGM Insured (Alternative Minimum Tax) | | | 8/21 at 100.00 | | | | | | | | AA | | | | 8,094,450 | |
| | | | | | |
| | 6,000 | | | Miami-Dade County Educational Facilities Authority, Florida, Revenue Bonds, University of Miami, Series 2015A, 5.000%, 4/01/35 | | | 4/25 at 100.00 | | | | | | | | A– | | | | 7,087,560 | |
| | | | | | |
| | | | Miami-Dade County Expressway Authority, Florida, Toll System Revenue Bonds, Refunding Series 2014B: | | | | | | | | | | | | | | | | |
| | 2,415 | | | 5.000%, 7/01/24 | | | No Opt. Call | | | | | | | | A | | | | 2,989,480 | |
| | 1,250 | | | 5.000%, 7/01/27 | | | 7/24 at 100.00 | | | | | | | | A | | | | 1,514,625 | |
| | | | | | |
| | | | Miami-Dade County, Florida, Aviation Revenue Bonds, Miami International Airport, Refunding Series 2012A: | | | | | | | | | | | | | | | | |
| | 925 | | | 5.000%, 10/01/20 (Alternative Minimum Tax) | | | No Opt. Call | | | | | | | | A | | | | 1,074,850 | |
| | 5,000 | | | 5.000%, 10/01/22 (Alternative Minimum Tax) | | | No Opt. Call | | | | | | | | A | | | | 6,005,700 | |
| | | | | | |
| | 6,290 | | | Miami-Dade County, Florida, Aviation Revenue Bonds, Miami International Airport, Series 2010B, 5.000%, 10/01/41 | | | 10/20 at 100.00 | | | | | | | | A | | | | 7,030,962 | |
| | | | | | |
| | | | Miami-Dade County, Florida, Special Obligation Bonds, Capital Asset Acquisition, Series 2010E: | | | | | | | | | | | | | | | | |
| | 1,975 | | | 5.000%, 4/01/21 | | | 4/20 at 100.00 | | | | | | | | AA– | | | | 2,256,398 | |
| | 5,015 | | | 5.250%, 4/01/30 | | | 4/20 at 100.00 | | | | | | | | AA– | | | | 5,723,018 | |
| | | | | | |
| | 5,000 | | | Miami-Dade County, Florida, Water and Sewer System Revenue Bonds, Series 2010, 5.000%, 10/01/29 – AGM Insured | | | 10/20 at 100.00 | | | | | | | | AA | | | | 5,743,400 | |
| | | | | | |
| | 605 | | | North Brevard County Hospital District, Florida, Revenue Bonds, Parrish Medical Center Project, Refunding Series 2008, 5.500%, 10/01/28 | | | 10/18 at 100.00 | | | | | | | | BBB+ | | | | 663,370 | |
| | | | | | |
| | 1,495 | | | North Brevard County Hospital District, Florida, Revenue Bonds, Parrish Medical Center Project, Refunding Series 2008, 5.500%, 10/01/28 (Pre-refunded 10/01/18) | | | 10/18 at 100.00 | | | | | | | | BBB (4) | | | | 1,666,088 | |
| | | | | | |
| | 2,525 | | | Palm Beach County Health Facilities Authority, Florida, Hospital Revenue Bonds, BRCH Corporation Obligated Group, Refunding Series 2014, 5.000%, 12/01/31 | | | 12/24 at 100.00 | | | | | | | | BBB+ | | | | 2,907,891 | |
| | | | | | | | | | | | | | | | | | | | |
Principal
Amount (000) | | | Description (1) | | Optional Call
Provisions (2) | | | | | | | Ratings (3) | | | Value | |
| | | | | | |
| | | | Florida (continued) | | | | | | | | | | | | | |
| | | | | | |
| $ | 4,235 | | | Palm Beach County School Board, Florida, Certificates of Participation, Series 2014B, 5.000%, 8/01/22 | | | No Opt. Call | | | | | | | | Aa3 | | | $ | 5,133,286 | |
| | | | | | |
| | 10,000 | | | Palm Beach County Solid Waste Authority, Florida, Refunding Revenue Bonds, Refunding Series 2011, 5.000%, 10/01/25 | | | 10/21 at 100.00 | | | | | | | | AA+ | | | | 11,905,000 | |
| | | | | | |
| | 10,300 | | | Port St. Lucie, Florida, Utility System Revenue Bonds, Series 2006A, 5.000%, 9/01/26 – NPFG Insured | | | 9/16 at 100.00 | | | | | | | | A1 | | | | 10,457,178 | |
| | | | | | |
| | | | South Florida Water Management District, Certificates of Participation, Series 2015: | | | | | | | | | | | | | | | | |
| | 3,000 | | | 5.000%, 10/01/23 | | | No Opt. Call | | | | | | | | AA | | | | 3,714,690 | |
| | 2,250 | | | 5.000%, 10/01/24 | | | No Opt. Call | | | | | | | | AA | | | | 2,820,285 | |
| | | | | | |
| | 23,190 | | | South Miami Health Facilities Authority, Florida, Hospital Revenue, Baptist Health System Obligation Group, Refunding Series 2007, 5.000%, 8/15/27 | | | 8/17 at 100.00 | | | | | | | | AA– | | | | 24,381,270 | |
| | | | | | |
| | | | Tallahassee, Florida, Capital Improvement Revenue Bonds, Series 2014: | | | | | | | | | | | | | | | | |
| | 2,880 | | | 5.000%, 10/01/32 | | | 10/22 at 100.00 | | | | | | | | Aa2 | | | | 3,451,997 | |
| | 3,025 | | | 5.000%, 10/01/33 | | | 10/22 at 100.00 | | | | | | | | Aa2 | | | | 3,613,605 | |
| | | | | | |
| | | | Tampa, Florida, Cigarette Tax Allocation Bonds, H. Lee Moffitt Cancer Center Project, Refunding & Capital Improvement Series 2012A: | | | | | | | | | | | | | | | | |
| | 585 | | | 5.000%, 9/01/22 | | | No Opt. Call | | | | | | | | A+ | | | | 699,362 | |
| | 2,600 | | | 5.000%, 9/01/23 | | | 9/22 at 100.00 | | | | | | | | A+ | | | | 3,080,844 | |
| | 1,240 | | | 3.125%, 9/01/24 | | | 9/22 at 100.00 | | | | | | | | A+ | | | | 1,312,515 | |
| | 1,260 | | | 5.000%, 9/01/25 | | | 9/22 at 100.00 | | | | | | | | A+ | | | | 1,509,946 | |
| | 1,500 | | | 5.000%, 9/01/27 | | | 9/22 at 100.00 | | | | | | | | A+ | | | | 1,774,455 | |
| | 1,965 | | | 5.000%, 9/01/28 | | | No Opt. Call | | | | | | | | A+ | | | | 2,312,982 | |
| | 5,760 | | | 4.000%, 9/01/33 | | | No Opt. Call | | | | | | | | A+ | | | | 6,134,630 | |
| | | | | | |
| | 350 | | | Vero Beach, Florida, Electric Refunding Revenue Bonds, Series 2003A, 4.000%, 12/01/19 – AGM Insured | | | 12/18 at 100.00 | | | | | | | | A1 | | | | 374,997 | |
| | 314,545 | | | Total Florida | | | | | | | | | | | | | | | 359,091,727 | |
| | | | | | |
| | | | Georgia – 1.4% | | | | | | | | | | | | | |
| | | | | | |
| | | | Atlanta, Georgia, Airport General Revenue Bonds, Refunding Series 2012B: | | | | | | | | | | | | | | | | |
| | 2,010 | | | 5.000%, 1/01/23 | | | No Opt. Call | | | | | | | | AA– | | | | 2,401,990 | |
| | 1,500 | | | 5.000%, 1/01/28 | | | No Opt. Call | | | | | | | | AA– | | | | 1,755,045 | |
| | | | | | |
| | | | Atlanta, Georgia, Airport Passenger Facilities Charge and General Revenue Bonds, Refunding Subordinate Lien Series 2014A: | | | | | | | | | | | | | | | | |
| | 11,010 | | | 5.000%, 1/01/27 | | | 1/24 at 100.00 | | | | | | | | AA– | | | | 13,409,409 | |
| | 4,275 | | | 5.000%, 1/01/29 | | | 1/24 at 100.00 | | | | | | | | AA– | | | | 5,139,063 | |
| | 6,750 | | | 5.000%, 1/01/30 | | | 1/24 at 100.00 | | | | | | | | AA– | | | | 8,066,858 | |
| | | | | | |
| | 2,000 | | | Atlanta, Georgia, Tax Allocation Bonds Atlanta Station Project, Refunding Series 2007, 4.375%, 12/01/18 – AGC Insured | | | 12/17 at 100.00 | | | | | | | | AA | | | | 2,094,160 | |
| | | | | | |
| | 1,940 | | | Atlanta, Georgia, Tax Allocation Bonds, Beltline Project Series 2008A. Remarketed, 7.500%, 1/01/31 | | | 1/19 at 100.00 | | | | | | | | A2 | | | | 2,232,125 | |
| | | | | | |
| | | | Chatham County Hospital Authority, Georgia, Seven Mill Tax Pledge Refunding and Improvement Revenue Bonds, Memorial Health University Medical Center, Inc., Series 2012A: | | | | | | | | | | | | | | | | |
| | 2,000 | | | 5.000%, 1/01/18 | | | No Opt. Call | | | | | | | | AA | | | | 2,140,960 | |
| | 3,325 | | | 5.000%, 1/01/23 | | | 1/22 at 100.00 | | | | | | | | AA | | | | 4,030,000 | |
| | 5,560 | | | 5.000%, 1/01/24 | | | 1/22 at 100.00 | | | | | | | | AA | | | | 6,701,579 | |
| | 8,990 | | | 5.000%, 1/01/25 | | | 1/22 at 100.00 | | | | | | | | AA | | | | 10,759,502 | |
| | | | | | |
| | 1,250 | | | DeKalb County Hospital Authority, Georgia, Anticipation Certificates Revenue Bonds, DeKalb Medical Center, Inc. Project, Series 2010, 6.000%, 9/01/30 | | | 9/20 at 100.00 | | | | | | | | BBB– | | | | 1,444,100 | |
Nuveen Intermediate Duration Municipal Bond Fund (continued)
| | |
| Portfolio of Investments | | April 30, 2016 |
| | | | | | | | | | | | | | | | | | | | |
Principal
Amount (000) | | | Description (1) | | Optional Call
Provisions (2) | | | | | | | Ratings (3) | | | Value | |
| | | | | | |
| | | | Georgia (continued) | | | | | | | | | | | | | |
| | | | | | |
| | | | Forsyth County School District, Georgia, General Obligation Bonds, Series 2014: | | | | | | | | | | | | | | | | |
| $ | 1,000 | | | 5.000%, 2/01/27 | | | No Opt. Call | | | | | | | | AA+ | | | $ | 1,234,510 | |
| | 1,250 | | | 5.000%, 2/01/28 | | | No Opt. Call | | | | | | | | AA+ | | | | 1,533,050 | |
| | | | | | |
| | 3,025 | | | Georgia State, General Obligation Bonds, Refunding Series 2009I, 5.000%, 7/01/19 | | | No Opt. Call | | | | | | | | AAA | | | | 3,426,206 | |
| | | | | | |
| | 200 | | | Glynn-Brunswick Memorial Hospital Authority, Georgia, Revenue Bonds, Southeast Georgia Health Systems, Anticipation Certificates Series 2008A, 5.250%, 8/01/23 | | | 8/18 at 100.00 | | | | | | | | A2 | | | | 218,168 | |
| | | | | | |
| | 1,805 | | | Glynn-Brunswick Memorial Hospital Authority, Georgia, Revenue Bonds, Southeast Georgia Health Systems, Anticipation Certificates Series 2008A, 5.250%, 8/01/23 (Pre-refunded 8/01/18) | | | 8/18 at 100.00 | | | | | | | | N/R (4) | | | | 1,985,807 | |
| | | | | | |
| | 2,770 | | | Municipal Gas Authority of Georgia, Gas Revenue Bonds, Gas Portfolio III Project, Series 2014U, 5.000%, 10/01/21 | | | No Opt. Call | | | | | | | | AA– | | | | 3,310,067 | |
| | 60,660 | | | Total Georgia | | | | | | | | | | | | | | | 71,882,599 | |
| | | | | | |
| | | | Guam – 0.1% | | | | | | | | | | | | | |
| | | | | | |
| | 4,060 | | | Guam Government Waterworks Authority, Water and Wastewater System Revenue Bonds, Series 2013, 5.500%, 7/01/43 | | | 7/23 at 100.00 | | | | | | | | A– | | | | 4,730,387 | |
| | | | | | |
| | | | Hawaii – 1.1% | | | | | | | | | | | | | |
| | | | | | |
| | 5,005 | | | Hawaii Department of Budget and Finance, Special Purpose Revenue Bonds, Hawaii Pacific Health Obligated Group, Series 2010A, 5.250%, 7/01/30 | | | 7/20 at 100.00 | | | | | | | | A1 | | | | 5,636,831 | |
| | | | | | |
| | 1,025 | | | Hawaii Department of Budget and Finance, Special Purpose Revenue Bonds, Hawaii Pacific Health Obligated Group, Series 2010B, 5.625%, 7/01/30 | | | 7/20 at 100.00 | | | | | | | | A1 | | | | 1,175,429 | |
| | | | | | |
| | | | Hawaii Department of Budget and Finance, Special Purpose Revenue Bonds, Queens Health Systems, Series 2015A: | | | | | | | | | | | | | | | | |
| | 5,500 | | | 5.000%, 7/01/26 | | | 7/25 at 100.00 | | | | | | | | AA– | | | | 6,881,655 | |
| | 4,510 | | | 5.000%, 7/01/27 | | | 7/25 at 100.00 | | | | | | | | AA– | | | | 5,593,843 | |
| | 7,825 | | | 5.000%, 7/01/28 | | | 7/25 at 100.00 | | | | | | | | AA– | | | | 9,672,326 | |
| | 9,180 | | | 5.000%, 7/01/29 | | | 7/25 at 100.00 | | | | | | | | AA– | | | | 11,270,011 | |
| | 8,195 | | | 5.000%, 7/01/30 | | | 7/25 at 100.00 | | | | | | | | AA– | | | | 10,003,718 | |
| | | | | | |
| | 8,600 | | | Hawaiian Electric Company Inc. and Its Subsidiaries, Special Purpose Revenue Bonds, Department of Budget and Finance of the State of Hawaii, Series 2015, 3.250%, 1/01/25 (Alternative Minimum Tax) | | | No Opt. Call | | | | | | | | A– | | | | 9,182,994 | |
| | 49,840 | | | Total Hawaii | | | | | | | | | | | | | | | 59,416,807 | |
| | | | | | |
| | | | Idaho – 0.3% | | | | | | | | | | | | | |
| | | | | | |
| | 560 | | | Boise City, Idaho, Airport Revenue Bonds, Aircraft Maintenance Facilities Project, Subordinate Series 2015, 3.750%, 9/01/32 (Alternative Minimum Tax) | | | 9/25 at 100.00 | | | | | | | | A2 | | | | 593,970 | |
| | | | | | |
| | 3,205 | | | Boise State University, Idaho, General Revenue Bonds, Refunding Series 2016A, 3.000%, 4/01/36 | | | 4/26 at 100.00 | | | | | | | | A+ | | | | 3,195,417 | |
| | | | | | |
| | 3,095 | | | Idaho Health Facilities Authority, Revenue Bonds, Trinity Health Group, Refunding Series 2008B, 6.000%, 12/01/23 (Pre-refunded 12/01/18) | | | 12/18 at 100.00 | | | | | | | | AA– (4) | | | | 3,511,804 | |
| | | | | | |
| | | | Madison County School District 321, Idaho, General Obligation Bonds, Sales Tax and Credit Enhancement Guaranty, Refunding Series 2014BX: | | | | | | | | | | | | | | | | |
| | 2,595 | | | 5.000%, 8/15/21 | | | No Opt. Call | | | | | | | | Aaa | | | | 3,118,931 | |
| | 2,710 | | | 5.000%, 8/15/22 | | | No Opt. Call | | | | | | | | Aaa | | | | 3,333,246 | |
| | | | | | |
| | | | Madison County, Idaho, Hospital Revenue Certificates of Participation, Madison Memorial Hospital, Series 2006: | | | | | | | | | | | | | | | | |
| | 450 | | | 5.250%, 9/01/16 | | | No Opt. Call | | | | | | | | BB+ | | | | 455,616 | |
| | 1,300 | | | 5.250%, 9/01/20 | | | 9/16 at 100.00 | | | | | | | | BB+ | | | | 1,311,050 | |
| | | | | | | | | | | | | | | | | | | | |
Principal
Amount (000) | | | Description (1) | | Optional Call
Provisions (2) | | | | | | | Ratings (3) | | | Value | |
| | | | | | |
| | | | Idaho (continued) | | | | | | | | | | | | | |
| | | | | | |
| $ | 1,000 | | | University of Idaho, General Revenue Bonds, Series 2007B, 4.500%, 4/01/41 (Mandatory put 4/01/18) – AGM Insured | | | No Opt. Call | | | | | | | | AA | | | $ | 1,059,860 | |
| | 14,915 | | | Total Idaho | | | | | | | | | | | | | | | 16,579,894 | |
| | | | | | |
| | | | Illinois – 11.4% | | | | | | | | | | | | | |
| | | | | | |
| | 1,840 | | | Bolingbrook Park District, Illinois, General Obligation Bonds, Series 2007A, 4.500%, 1/01/17 – CIFG Insured | | | No Opt. Call | | | | | | | | Aa2 | | | | 1,885,154 | |
| | | | | | |
| | | | Bolingbrook, Illinois, General Obligation Bonds, Refunding Series 2013A: | | | | | | | | | | | | | | | | |
| | 2,800 | | | 0.000%, 1/01/30 | | | 7/23 at 72.73 | | | | | | | | A1 | | | | 1,532,244 | |
| | 2,550 | | | 0.000%, 1/01/31 | | | 7/23 at 68.94 | | | | | | | | A1 | | | | 1,321,971 | |
| | 2,750 | | | 0.000%, 1/01/32 | | | 7/23 at 65.28 | | | | | | | | A1 | | | | 1,349,013 | |
| | 4,000 | | | 0.000%, 1/01/33 | | | 7/23 at 61.69 | | | | | | | | A1 | | | | 1,850,240 | |
| | | | | | |
| | 19,635 | | | Chicago Board of Education, Illinois, General Obligation Bonds, Dedicated Revenues, Series 2016A, 7.000%, 12/01/44 | | | 12/25 at 100.00 | | | | | | | | B+ | | | | 18,660,122 | |
| | | | | | |
| | 13,235 | | | Chicago Greater Metropolitan Water Reclamation District, Illinois, General Obligation Bonds, Unlimited Tax Refunding Series 2006, 5.000%, 12/01/24 | | | 6/16 at 100.00 | | | | | | | | AAA | | | | 13,288,072 | |
| | | | | | |
| | | | Chicago Transit Authority, Illinois, Sales Tax Receipts Revenue Bonds, Series 2011: | | | | | | | | | | | | | | | | |
| | 3,530 | | | 5.250%, 12/01/25 | | | 12/21 at 100.00 | | | | | | | | AA | | | | 4,032,990 | |
| | 3,235 | | | 5.250%, 12/01/26 | | | 12/21 at 100.00 | | | | | | | | AA | | | | 3,673,666 | |
| | | | | | |
| | | | Chicago, Illinois, General Airport Revenue Bonds, O’Hare International Airport, Senior Lien Refunding Series 2015A: | | | | | | | | | | | | | | | | |
| | 5,700 | | | 5.000%, 1/01/33 (Alternative Minimum Tax) | | | 1/25 at 100.00 | | | | | | | | A | | | | 6,517,779 | |
| | 4,225 | | | 5.000%, 1/01/34 (Alternative Minimum Tax) | | | 1/25 at 100.00 | | | | | | | | A | | | | 4,813,923 | |
| | | | | | |
| | | | Chicago, Illinois, General Obligation Bonds, Project and Refunding Series 2009C: | | | | | | | | | | | | | | | | |
| | 1,745 | | | 5.000%, 1/01/26 | | | 1/19 at 100.00 | | | | | | | | A– | | | | 1,746,605 | |
| | 2,530 | | | 5.000%, 1/01/27 | | | No Opt. Call | | | | | | | | AA– | | | | 2,523,624 | |
| | | | | | |
| | | | Chicago, Illinois, General Obligation Bonds, Refunding Series 2016C: | | | | | | | | | | | | | | | | |
| | 6,570 | | | 5.000%, 1/01/23 | | | No Opt. Call | | | | | | | | BBB+ | | | | 6,818,477 | |
| | 7,580 | | | 5.000%, 1/01/24 | | | No Opt. Call | | | | | | | | BBB+ | | | | 7,753,961 | |
| | 4,440 | | | 5.000%, 1/01/25 | | | No Opt. Call | | | | | | | | BBB+ | | | | 4,492,658 | |
| | 1,940 | | | 5.000%, 1/01/26 | | | No Opt. Call | | | | | | | | BBB+ | | | | 1,945,762 | |
| | | | | | |
| | 1,500 | | | Cook County Community College District 508, Illinois, General Obligation Bonds, Chicago City Colleges, Series 2013, 5.000%, 12/01/24 | | | 12/23 at 100.00 | | | | | | | | AA | | | | 1,737,480 | |
| | | | | | |
| | 1,410 | | | Cook County Community High School District 219, Niles Township, Illinois, General Obligation Bonds, Refunding Series 2007A, 5.000%, 12/01/26 – AGM Insured | | | No Opt. Call | | | | | | | | AA+ | | | | 1,496,306 | |
| | | | | | |
| | 3,465 | | | Cook County High School District 205 Thornton Township, Illinois, General Obligation Bonds, Series 2008, 5.250%, 12/01/21 – AGC Insured | | | 12/18 at 100.00 | | | | | | | | AA | | | | 3,817,183 | |
| | | | | | |
| | 1,000 | | | Cook County High School District 209, Proviso Township, Illinois, General Obligation Bonds, Series 2004, 5.000%, 12/01/16 – AGM Insured | | | No Opt. Call | | | | | | | | AA | | | | 1,021,690 | |
| | | | | | |
| | 1,175 | | | Cook County School District 88, Bellwood, Illinois, General Obligation Bonds, Refunding Series 2004B, 5.000%, 12/01/17 – AGM Insured | | | No Opt. Call | | | | | | | | A2 | | | | 1,179,418 | |
| | | | | | |
| | | | Cook County, Illinois, General Obligation Bonds, Refunding Series 2012C: | | | | | | | | | | | | | | | | |
| | 2,600 | | | 5.000%, 11/15/20 | | | No Opt. Call | | | | | | | | AA | | | | 2,900,378 | |
| | 2,770 | | | 5.000%, 11/15/21 | | | No Opt. Call | | | | | | | | AA | | | | 3,135,640 | |
| | 2,400 | | | 5.000%, 11/15/22 | | | No Opt. Call | | | | | | | | AA | | | | 2,752,536 | |
Nuveen Intermediate Duration Municipal Bond Fund (continued)
| | |
| Portfolio of Investments | | April 30, 2016 |
| | | | | | | | | | | | | | | | | | | | |
Principal
Amount (000) | | | Description (1) | | Optional Call
Provisions (2) | | | | | | | Ratings (3) | | | Value | |
| | | | | | |
| | | | Illinois (continued) | | | | | | | | | | | | | |
| | | | | | |
| | | | Grundy and Will Counties Community Unit School District 1 Coal City, Illinois, General Obligation Bonds, Series 2008: | | | | | | | | | | | | | | | | |
| $ | 1,550 | | | 5.875%, 2/01/19 | | | 8/18 at 100.00 | | | | | | | | Aa3 | | | $ | 1,714,517 | |
| | 2,100 | | | 5.875%, 2/01/22 | | | 8/18 at 100.00 | | | | | | | | Aa3 | | | | 2,319,387 | |
| | 2,545 | | | 5.875%, 2/01/24 | | | 8/18 at 100.00 | | | | | | | | Aa3 | | | | 2,809,069 | |
| | | | | | |
| | 1,515 | | | Illinois Development Finance Authority, Local Government Program Revenue Bonds, Kane, Cook and DuPage Counties School District U46 – Elgin, Series 2002, 0.000%, 1/01/18 – AGC Insured | | | No Opt. Call | | | | | | | | Aa3 | | | | 1,469,186 | |
| | | | | | |
| | 1,245 | | | Illinois Development Finance Authority, Local Government Program Revenue Bonds, Kane, Cook and DuPage Counties School District U46 – Elgin, Series 2002, 0.000%, 1/01/18 – AGM Insured (ETM) | | | No Opt. Call | | | | | | | | Aa3 (4) | | | | 1,226,549 | |
| | | | | | |
| | 1,000 | | | Illinois Educational Facilities Authority, Revenue Bonds, Art Institute of Chicago, Series 1998A, 4.750%, 3/01/30 (Mandatory put 3/01/17) | | | No Opt. Call | | | | | | | | AA– | | | | 1,026,410 | |
| | | | | | |
| | 1,555 | | | Illinois Finance Authority, Gas Supply Revenue Refunding Bonds, Peoples Gas, Light and Coke Company, Senior Lien Series 2005A, 4.300%, 6/01/35 (Pre-refunded 6/01/16) – AMBAC Insured | | | 6/16 at 100.00 | | | | | | | | Aa3 (4) | | | | 1,560,334 | |
| | | | | | |
| | 1,000 | | | Illinois Finance Authority, Revenue Bonds, Advocate Health Care Network, Refunding Series 2014, 5.000%, 8/01/23 | | | No Opt. Call | | | | | | | | AA | | | | 1,231,370 | |
| | | | | | |
| | 3,000 | | | Illinois Finance Authority, Revenue Bonds, Advocate Health Care Network, Series 2012, 5.000%, 6/01/42 | | | No Opt. Call | | | | | | �� | | AA | | | | 3,363,480 | |
| | | | | | |
| | 13,685 | | | Illinois Finance Authority, Revenue Bonds, Centegra Health System, Series 2012, 5.000%, 9/01/27 | | | 9/22 at 100.00 | | | | | | | | BBB | | | | 15,185,560 | |
| | | | | | |
| | | | Illinois Finance Authority, Revenue Bonds, Centegra Health System, Series 2014A: | | | | | | | | | | | | | | | | |
| | 475 | | | 5.000%, 9/01/26 | | | 9/24 at 100.00 | | | | | | | | BBB | | | | 550,364 | |
| | 1,205 | | | 5.000%, 9/01/27 | | | 9/24 at 100.00 | | | | | | | | BBB | | | | 1,387,497 | |
| | 775 | | | 5.000%, 9/01/29 | | | 9/24 at 100.00 | | | | | | | | BBB | | | | 880,919 | |
| | 2,450 | | | 5.000%, 9/01/34 | | | 9/24 at 100.00 | | | | | | | | BBB | | | | 2,756,103 | |
| | 2,080 | | | 4.625%, 9/01/39 | | | 9/24 at 100.00 | | | | | | | | BBB | | | | 2,227,680 | |
| | 7,000 | | | 5.000%, 9/01/42 | | | 9/24 at 100.00 | | | | | | | | BBB | | | | 7,804,300 | |
| | | | | | |
| | | | Illinois Finance Authority, Revenue Bonds, Edward Health Services Corporation, Series 2008A: | | | | | | | | | | | | | | | | |
| | 1,200 | | | 6.000%, 2/01/25 – AMBAC Insured | | | 2/18 at 100.00 | | | | | | | | A | | | | 1,300,644 | |
| | 1,280 | | | 6.000%, 2/01/26 – AMBAC Insured | | | 2/18 at 100.00 | | | | | | | | A | | | | 1,385,024 | |
| | 500 | | | 6.000%, 2/01/28 – AMBAC Insured | | | 2/18 at 100.00 | | | | | | | | A | | | | 540,260 | |
| | | | | | |
| | 1,000 | | | Illinois Finance Authority, Revenue Bonds, Franciscan Communities Inc., Refunding Series 2007A, 5.500%, 5/15/27 | | | 5/17 at 100.00 | | | | | | | | BBB– | | | | 1,030,130 | |
| | | | | | |
| | 1,000 | | | Illinois Finance Authority, Revenue Bonds, Illinois Institute of Technology, Series 2009, 6.500%, 2/01/23 | | | 2/19 at 100.00 | | | | | | | | Baa3 | | | | 1,058,950 | |
| | | | | | |
| | | | Illinois Finance Authority, Revenue Bonds, Ingalls Health System, Series 2013: | | | | | | | | | | | | | | | | |
| | 1,390 | | | 5.000%, 5/15/23 | | | 5/22 at 100.00 | | | | | | | | Baa1 | | | | 1,575,621 | |
| | 1,120 | | | 5.000%, 5/15/25 | | | 5/22 at 100.00 | | | | | | | | Baa1 | | | | 1,254,086 | |
| | 1,175 | | | 5.000%, 5/15/26 | | | 5/22 at 100.00 | | | | | | | | Baa1 | | | | 1,307,387 | |
| | | | | | |
| | 15 | | | Illinois Finance Authority, Revenue Bonds, Northwest Community Hospital, Series 2008A, 5.500%, 7/01/38 | | | 7/18 at 100.00 | | | | | | | | A+ | | | | 16,170 | |
| | | | | | |
| | 4,235 | | | Illinois Finance Authority, Revenue Bonds, OSF Healthcare System, Series 2009A, 7.000%, 11/15/29 (Pre-refunded 5/15/19) | | | 5/19 at 100.00 | | | | | | | | A (4) | | | | 5,021,778 | |
| | | | | | |
| | | | Illinois Finance Authority, Revenue Bonds, OSF Healthcare System, Series 2015A: | | | | | | | | | | | | | | | | |
| | 1,000 | | | 5.000%, 11/15/27 | | | 11/25 at 100.00 | | | | | | | | A | | | | 1,204,630 | |
| | 1,885 | | | 5.000%, 11/15/28 | | | 11/25 at 100.00 | | | | | | | | A | | | | 2,248,711 | |
| | 2,000 | | | 5.000%, 11/15/29 | | | 11/25 at 100.00 | | | | | | | | A | | | | 2,370,860 | |
| | | | | | | | | | | | | | | | | | | | |
Principal
Amount (000) | | | Description (1) | | Optional Call
Provisions (2) | | | | | | | Ratings (3) | | | Value | |
| | | | | | |
| | | | Illinois (continued) | | | | | | | | | | | | | |
| | | | | | |
| $ | 2,000 | | | Illinois Finance Authority, Revenue Bonds, Palos Community Hospital, Series 2007A, 5.000%, 5/15/21 (Pre-refunded 5/15/17) – NPFG Insured | | | 5/17 at 100.00 | | | | | | | | AA– (4) | | | $ | 2,089,780 | |
| | | | | | |
| | 9,570 | | | Illinois Finance Authority, Revenue Bonds, Proctor Hospital, Series 2006, 5.125%, 1/01/25 | | | No Opt. Call | | | | | | | | Aa3 | | | | 9,605,122 | |
| | | | | | |
| | 4,000 | | | Illinois Finance Authority, Revenue Bonds, Roosevelt University Project, Refunding Series 2009, 5.750%, 4/01/24 | | | 10/19 at 100.00 | | | | | | | | Baa3 | | | | 4,363,600 | |
| | | | | | |
| | | | Illinois Finance Authority, Revenue Bonds, Roosevelt University, Series 2007: | | | | | | | | | | | | | | | | |
| | 500 | | | 5.250%, 4/01/22 | | | 4/17 at 100.00 | | | | | | | | Baa3 | | | | 511,065 | |
| | 3,600 | | | 5.400%, 4/01/27 | | | 4/17 at 100.00 | | | | | | | | Baa3 | | | | 3,665,376 | |
| | | | | | |
| | 2,030 | | | Illinois Finance Authority, Revenue Bonds, Rush University Medical Center Obligated Group, Series 2009A, 6.750%, 11/01/24 (Pre-refunded 11/01/18) | | | 11/18 at 100.00 | | | | | | | | Aaa | | | | 2,331,475 | |
| | | | | | |
| | 1,505 | | | Illinois Finance Authority, Revenue Bonds, Rush University Medical Center Obligated Group, Series 2009C, 6.375%, 11/01/29 (Pre-refunded 5/01/19) | | | 5/19 at 100.00 | | | | | | | | Aaa | | | | 1,753,280 | |
| | | | | | |
| | | | Illinois Finance Authority, Revenue Bonds, Silver Cross Hospital and Medical Centers, Refunding Series 2015C: | | | | | | | | | | | | | | | | |
| | 2,215 | | | 5.000%, 8/15/35 | | | 8/25 at 100.00 | | | | | | | | Baa1 | | | | 2,518,942 | |
| | 5,000 | | | 5.000%, 8/15/44 | | | 8/25 at 100.00 | | | | | | | | Baa1 | | | | 5,609,400 | |
| | | | | | |
| | 5,000 | | | Illinois Finance Authority, Revenue Bonds, Silver Cross Hospital and Medical Centers, Series 2009, 6.875%, 8/15/38 (Pre-refunded 8/15/19) | | | 8/19 at 100.00 | | | | | | | | N/R (4) | | | | 5,968,000 | |
| | | | | | |
| | 2,000 | | | Illinois Finance Authority, Revenue Bonds, The Carle Foundation, Series 2009A, 5.500%, 2/15/17 | | | No Opt. Call | | | | | | | | AA | | | | 2,073,940 | |
| | | | | | |
| | 600 | | | Illinois Finance Authority, Revenue Bonds, The Clare at Water Tower Project, Capitol Appreciation Series 2010B, 0.000%, 5/15/50 (5), (6) | | | No Opt. Call | | | | | | | | N/R | | | | 6 | |
| | | | | | |
| | | | Illinois Finance Authority, Revenue Bonds, The Clare at Water Tower Project, Refunding Series 2010A: | | | | | | | | | | | | | | | | |
| | 700 | | | 5.400%, 5/15/17 (5) | | | No Opt. Call | | | | | | | | N/R | | | | 7 | |
| | 700 | | | 5.500%, 5/15/18 (6) | | | No Opt. Call | | | | | | | | N/R | | | | 7 | |
| | | | | | |
| | 3,510 | | | Illinois Finance Authority, Student Housing Revenue Bonds, Educational Advancement Fund Inc., University Center Project, Series 2006B, 5.000%, 5/01/25 | | | 11/16 at 100.00 | | | | | | | | BBB+ | | | | 3,555,841 | |
| | | | | | |
| | | | Illinois State Department of Employment Security, Unemployment Insurance Fund Building Receipts Revenue Bonds, Series 2012B: | | | | | | | | | | | | | | | | |
| | 2,900 | | | 5.000%, 12/15/17 | | | 12/16 at 100.00 | | | | | | | | AA+ | | | | 2,981,577 | |
| | 2,530 | | | 5.000%, 6/15/18 | | | 12/16 at 100.00 | | | | | | | | AA+ | | | | 2,599,170 | |
| | | | | | |
| | 9,955 | | | Illinois State, General Obligation Bonds, April Series 2014, 5.000%, 4/01/23 | | | No Opt. Call | | | | | | | | A– | | | | 11,240,887 | |
| | | | | | |
| | | | Illinois State, General Obligation Bonds, February Series 2014: | | | | | | | | | | | | | | | | |
| | 4,000 | | | 5.000%, 2/01/23 | | | No Opt. Call | | | | | | | | A– | | | | 4,509,560 | |
| | 3,000 | | | 5.000%, 2/01/24 | | | No Opt. Call | | | | | | | | A– | | | | 3,405,780 | |
| | 4,630 | | | 5.000%, 2/01/25 | | | 2/24 at 100.00 | | | | | | | | A– | | | | 5,199,536 | |
| | 4,675 | | | 5.000%, 2/01/26 | | | 2/24 at 100.00 | | | | | | | | A– | | | | 5,211,784 | |
| | 6,000 | | | 5.000%, 2/01/27 | | | 2/24 at 100.00 | | | | | | | | A– | | | | 6,625,260 | |
| | | | | | |
| | | | Illinois State, General Obligation Bonds, Refunding Series 2010: | | | | | | | | | | | | | | | | |
| | 520 | | | 5.000%, 1/01/17 | | | No Opt. Call | | | | | | | | A– | | | | 532,615 | |
| | 1,785 | | | 5.000%, 1/01/18 | | | No Opt. Call | | | | | | | | A– | | | | 1,884,710 | |
| | 6,040 | | | 5.000%, 1/01/19 – AGM Insured | | | No Opt. Call | | | | | | | | AA | | | | 6,551,830 | |
| | 5,000 | | | 5.000%, 1/01/19 | | | No Opt. Call | | | | | | | | A– | | | | 5,396,450 | |
Nuveen Intermediate Duration Municipal Bond Fund (continued)
| | |
| Portfolio of Investments | | April 30, 2016 |
| | | | | | | | | | | | | | | | | | | | |
Principal
Amount (000) | | | Description (1) | | Optional Call
Provisions (2) | | | | | | | Ratings (3) | | | Value | |
| | | | | | |
| | | | Illinois (continued) | | | | | | | | | | | | | |
| | | | | | |
| | | | Illinois State, General Obligation Bonds, Refunding Series 2012: | | | | | | | | | | | | | | | | |
| $ | 7,750 | | | 5.000%, 8/01/20 | | | No Opt. Call | | | | | | | | A– | | | $ | 8,605,445 | |
| | 6,385 | | | 5.000%, 8/01/21 | | | No Opt. Call | | | | | | | | A– | | | | 7,119,083 | |
| | 15,265 | | | 5.000%, 8/01/22 | | | No Opt. Call | | | | | | | | A– | | | | 17,164,577 | |
| | 2,730 | | | 5.000%, 8/01/23 | | | No Opt. Call | | | | | | | | A– | | | | 3,091,452 | |
| | 270 | | | 5.000%, 8/01/25 | | | 8/22 at 100.00 | | | | | | | | A– | | | | 296,846 | |
| | | | | | |
| | | | Illinois State, General Obligation Bonds, Series 2004A: | | | | | | | | | | | | | | | | |
| | 2,590 | | | 5.000%, 3/01/18 | | | 7/16 at 100.00 | | | | | | | | A– | | | | 2,597,848 | |
| | 815 | | | 5.000%, 3/01/22 | | | 7/16 at 100.00 | | | | | | | | A– | | | | 817,469 | |
| | | | | | |
| | | | Illinois State, General Obligation Bonds, Series 2006A: | | | | | | | | | | | | | | | | |
| | 1,075 | | | 5.000%, 6/01/17 | | | No Opt. Call | | | | | | | | A– | | | | 1,115,947 | |
| | 10,000 | | | 5.000%, 6/01/18 | | | No Opt. Call | | | | | | | | A– | | | | 10,683,100 | |
| | 350 | | | 5.000%, 6/01/22 | | | No Opt. Call | | | | | | | | A– | | | | 357,235 | |
| | 135 | | | 5.000%, 6/01/26 | | | 12/16 at 100.00 | | | | | | | | A– | | | | 137,614 | |
| | | | | | |
| | 1,455 | | | Illinois State, General Obligation Bonds, Series 2006, 5.000%, 1/01/27 | | | 7/16 at 100.00 | | | | | | | | A– | | | | 1,463,104 | |
| | | | | | |
| | 1,000 | | | Illinois State, General Obligation Bonds, Series 2009A, 5.000%, 9/01/34 | | | 9/18 at 100.00 | | | | | | | | A– | | | | 1,045,500 | |
| | | | | | |
| | | | Illinois State, General Obligation Bonds, Series 2012A: | | | | | | | | | | | | | | | | |
| | 7,790 | | | 4.000%, 1/01/20 | | | No Opt. Call | | | | | | | | A– | | | | 8,267,683 | |
| | 12,110 | | | 4.000%, 1/01/22 | | | No Opt. Call | | | | | | | | A– | | | | 12,906,233 | |
| | | | | | |
| | | | Illinois State, General Obligation Bonds, Series 2013: | | | | | | | | | | | | | | | | |
| | 4,200 | | | 5.500%, 7/01/25 | | | 7/23 at 100.00 | | | | | | | | A– | | | | 4,807,320 | |
| | 2,760 | | | 5.500%, 7/01/26 | | | 7/23 at 100.00 | | | | | | | | A– | | | | 3,144,854 | |
| | 1,000 | | | 5.500%, 7/01/27 | | | 7/23 at 100.00 | | | | | | | | A– | | | | 1,131,930 | |
| | | | | | |
| | | | Illinois Toll Highway Authority, Toll Highway Revenue Bonds, Refunding Senior Lien Series 2014A: | | | | | | | | | | | | | | | | |
| | 1,715 | | | 5.000%, 12/01/21 | | | No Opt. Call | | | | | | | | AA– | | | | 2,051,963 | |
| | 3,335 | | | 5.000%, 12/01/22 | | | No Opt. Call | | | | | | | | AA– | | | | 4,062,864 | |
| | 4,110 | | | 5.000%, 1/01/33 | | | 1/23 at 100.00 | | | | | | | | AA– | | | | 4,748,612 | |
| | | | | | |
| | 6,780 | | | Illinois Toll Highway Authority, Toll Highway Revenue Bonds, Refunding Senior Lien Series 2016A, 5.000%, 12/01/31 | | | 1/26 at 100.00 | | | | | | | | AA– | | | | 8,234,581 | |
| | | | | | |
| | | | Illinois Toll Highway Authority, Toll Highway Revenue Bonds, Senior Lien Series 2014B: | | | | | | | | | | | | | | | | |
| | 11,000 | | | 5.000%, 1/01/36 | | | 1/24 at 100.00 | | | | | | | | AA– | | | | 12,791,900 | |
| | 6,000 | | | 5.000%, 1/01/37 | | | 1/24 at 100.00 | | | | | | | | AA– | | | | 6,959,340 | |
| | | | | | |
| | 11,470 | | | Illinois Toll Highway Authority, Toll Highway Revenue Bonds, Senior Lien Series 2014D, 5.000%, 1/01/24 | | | No Opt. Call | | | | | | | | AA– | | | | 14,209,495 | |
| | | | | | |
| | 10,550 | | | Illinois Toll Highway Authority, Toll Highway Revenue Bonds, Senior Lien Series 2015B, 5.000%, 1/01/37 | | | 1/26 at 100.00 | | | | | | | | AA– | | | | 12,435,813 | |
| | | | | | |
| | | | Kane County Community Unit School District 304 Geneva, Illinois, General Obligation Bonds, Series 2007A: | | | | | | | | | | | | | | | | |
| | 8,570 | | | 9.000%, 1/01/22 – AGM Insured | | | No Opt. Call | | | | | | | | AA+ | | | | 11,888,304 | |
| | 1,200 | | | 9.000%, 1/01/23 – AGM Insured | | | No Opt. Call | | | | | | | | AA+ | | | | 1,731,492 | |
| | 5,150 | | | 9.000%, 1/01/25 – AGM Insured | | | No Opt. Call | | | | | | | | AA+ | | | | 7,980,234 | |
| | | | | | |
| | 3,270 | | | Kendall County Forest Preserve District, Illinois, General Obligation Bonds, Series 2007, 5.250%, 1/01/24 – FGIC Insured | | | 1/18 at 100.00 | | | | | | | | AA– | | | | 3,481,242 | |
| | | | | | |
| | | | Kendall, Kane, and Will Counties Community Unit School District 308 Oswego, Illinois, General Obligation Bonds, Refunding Series 2016: | | | | | | | | | | | | | | | | |
| | 5,000 | | | 5.000%, 2/01/34 | | | 2/26 at 100.00 | | | | | | | | Aa2 | | | | 5,826,300 | |
| | 3,465 | | | 5.000%, 2/01/35 | | | 2/26 at 100.00 | | | | | | | | Aa2 | | | | 4,018,603 | |
| | | | | | | | | | | | | | | | | | | | |
Principal
Amount (000) | | | Description (1) | | Optional Call
Provisions (2) | | | | | | | Ratings (3) | | | Value | |
| | | | | | |
| | | | Illinois (continued) | | | | | | | | | | | | | |
| | | | | | |
| $ | 2,100 | | | Madison and Jersey Counties Community Unit School District 11, Alton, Illinois, General Obligation Bonds, Series 2002, 0.000%, 12/01/19 – AGM Insured | | | No Opt. Call | | | | | | | | AA | | | $ | 1,962,660 | |
| | | | | | |
| | | | McCook, Illinois, General Obligation Bonds, Series 2008: | | | | | | | | | | | | | | | | |
| | 500 | | | 5.000%, 12/01/26 | | | 12/18 at 100.00 | | | | | | | | BBB | | | | 531,425 | |
| | 1,000 | | | 5.100%, 12/01/28 | | | 12/18 at 100.00 | | | | | | | | BBB | | | | 1,065,350 | |
| | | | | | |
| | 1,000 | | | Metropolitan Pier and Exposition Authority, Illinois, Revenue Bonds, McCormick Place Expansion Project, Refunding Series 2002B, 5.200%, 6/15/17 – NPFG Insured | | | No Opt. Call | | | | | | | | AA– | | | | 1,041,720 | |
| | | | | | |
| | 2,270 | | | Peoria Public Building Commission, Illinois, School District Facility Revenue Bonds, Peoria County School District 150 Project, Series 2011., 0.000%, 12/01/24 | | | No Opt. Call | | | | | | | | A | | | | 1,750,057 | |
| | | | | | |
| | 1,494 | | | Plano, Illinois, Special Tax Bonds, Special Service Area 1 & 2 Lakewood Springs Project, Refunding Series 2014, 5.000%, 3/01/29 – AGM Insured | | | No Opt. Call | | | | | | | | AA | | | | 1,705,042 | |
| | | | | | |
| | | | Quad Cities Regional Economic Development Authority, Illinois, Revenue Bonds, Augustana College, Series 2012: | | | | | | | | | | | | | | | | |
| | 295 | | | 5.000%, 10/01/23 | | | 10/22 at 100.00 | | | | | | | | Baa1 | | | | 343,445 | |
| | 275 | | | 5.000%, 10/01/24 | | | 10/22 at 100.00 | | | | | | | | Baa1 | | | | 317,977 | |
| | | | | | |
| | | | Railsplitter Tobacco Settlement Authority, Illinois, Tobacco Settlement Revenue Bonds, Series 2010: | | | | | | | | | | | | | | | | |
| | 7,610 | | | 5.250%, 6/01/21 | | | No Opt. Call | | | | | | | | A | | | | 8,965,569 | |
| | 11,150 | | | 5.500%, 6/01/23 | | | 6/21 at 100.00 | | | | | | | | A | | | | 13,158,338 | |
| | | | | | |
| | | | Saint Clair County, Illinois, General Obligation Bonds, Alternative Revenue Source Refunding Series 2009: | | | | | | | | | | | | | | | | |
| | 360 | | | 4.500%, 10/01/20 | | | 10/19 at 100.00 | | | | | | | | AA | | | | 399,168 | |
| | 370 | | | 5.000%, 10/01/22 | | | 10/19 at 100.00 | | | | | | | | AA | | | | 410,389 | |
| | | | | | |
| | | | Saint Clair County, Illinois, General Obligation Bonds, Alternative Revenue Source Refunding Series 2009: | | | | | | | | | | | | | | | | |
| | 640 | | | 4.500%, 10/01/20 (Pre-refunded 10/01/19) | | | 10/19 at 100.00 | | | | | | | | N/R (4) | | | | 718,387 | |
| | 730 | | | 5.000%, 10/01/22 (Pre-refunded 10/01/19) | | | 10/19 at 100.00 | | | | | | | | N/R (4) | | | | 831,696 | |
| | | | | | |
| | 1,680 | | | School District 122, Winnebago County, Illinois, Capital Appreciation Bonds, Series 1998, 0.000%, 1/01/17 – AGM Insured | | | No Opt. Call | | | | | | | | A2 | | | | 1,666,493 | |
| | | | | | |
| | 1,320 | | | School District 122, Winnebago County, Illinois, Capital Appreciation Bonds, Series 1998, 0.000%, 1/01/17 – AGM Insured (ETM) | | | No Opt. Call | | | | | | | | A2 (4) | | | | 1,314,298 | |
| | | | | | |
| | | | Southwestern Illinois Development Authority, Health Facility Revenue Bonds, Memorial Group, Inc., Series 2013: | | | | | | | | | | | | | | | | |
| | 2,520 | | | 7.125%, 11/01/43 | | | 11/23 at 100.00 | | | | | | | | AA | | | | 3,399,228 | |
| | 2,400 | | | 7.625%, 11/01/48 | | | 11/23 at 100.00 | | | | | | | | AA | | | | 3,312,312 | |
| | | | | | |
| | 7,285 | | | Southwestern Illinois Development Authority, Local Government Program Revenue Bonds, Southwestern Illinois Flood District Council Project, Series 2016B, 4.000%, 10/15/40 | | | 10/25 at 100.00 | | | | | | | | A | | | | 7,481,476 | |
| | | | | | |
| | 1,000 | | | Southwestern Illinois Development Authority, Local Government Revenue Bonds, Edwardsville Community Unit School District 7 Project, Series 2007, 5.000%, 12/01/17 – AGM Insured | | | No Opt. Call | | | | | | | | AA | | | | 1,059,430 | |
| | | | | | |
| | 2,000 | | | Southwestern Illinois Development Authority, Revenue Bonds, Anderson Hospital, Series 2006, 5.125%, 8/15/26 | | | 2/17 at 100.00 | | | | | | | | BBB+ | | | | 2,022,400 | |
| | | | | | |
| | 1,000 | | | Southwestern Illinois Development Authority, School Revenue Bonds, Triad School District 2, Madison County, Illinois, Series 2006, 5.000%, 10/01/18 (Pre-refunded 10/01/16) – NPFG Insured | | | 10/16 at 100.00 | | | | | | | | AA– (4) | | | | 1,019,040 | |
| | | | | | |
| | | | Springfield, Illinois, Electric Revenue Bonds, Senior Lien Series 2015: | | | | | | | | | | | | | | | | |
| | 7,770 | | | 5.000%, 3/01/33 | | | 3/25 at 100.00 | | | | | | | | A | | | | 9,047,077 | |
| | 13,960 | | | 5.000%, 3/01/34 – AGM Insured | | | 3/25 at 100.00 | | | | | | | | AA | | | | 16,337,667 | |
Nuveen Intermediate Duration Municipal Bond Fund (continued)
| | |
| Portfolio of Investments | | April 30, 2016 |
| | | | | | | | | | | | | | | | | | | | |
Principal
Amount (000) | | | Description (1) | | Optional Call
Provisions (2) | | | | | | | Ratings (3) | | | Value | |
| | | | | | |
| | | | Illinois (continued) | | | | | | | | | | | | | |
| | | | | | |
| | | | Sterling, Whiteside County, Illinois, General Obligation Bonds, Alternate Revenue Source, Series 2012: | | | | | | | | | | | | | | | | |
| $ | 3,205 | | | 4.000%, 11/01/21 | | | No Opt. Call | | | | | | | | A+ | | | $ | 3,605,753 | |
| | 2,830 | | | 4.000%, 11/01/22 | | | No Opt. Call | | | | | | | | A+ | | | | 3,211,484 | |
| | | | | | |
| | | | Will and Kendall Counties Community Consolidated School District 202 Plainfield, Illinois, General Obligation Bonds, Series 2016C: | | | | | | | | | | | | | | | | |
| | 9,760 | | | 5.000%, 1/01/22 | | | No Opt. Call | | | | | | | | Aa3 | | | | 11,581,411 | |
| | 3,355 | | | 5.000%, 1/01/23 | | | No Opt. Call | | | | | | | | Aa3 | | | | 4,057,537 | |
| | 3,295 | | | 5.000%, 1/01/24 | | | No Opt. Call | | | | | | | | Aa3 | | | | 4,042,042 | |
| | 4,215 | | | 5.000%, 1/01/25 | | | No Opt. Call | | | | | | | | Aa3 | | | | 5,217,074 | |
| | | | | | |
| | 5,675 | | | Will County Community High School District 210 Lincoln-Way, Illinois, General Obligation Bonds, Series 2013B, 0.000%, 1/01/30 | | | No Opt. Call | | | | | | | | Baa3 | | | | 3,357,954 | |
| | | | | | |
| | 3,870 | | | Will County School District 86, Joliet, Illinois, General Obligation Bonds, Series 2002, 0.000%, 11/01/17 – AGM Insured | | | No Opt. Call | | | | | | | | AA | | | | 3,789,040 | |
| | | | | | |
| | | | Will, Grundy, Kendall, LaSalle, Kankakee, Livingston and Cook Counties Community College District 525 Joliet Junior College, Illinois, General Obligation Bond, Series 2008: | | | | | | | | | | | | | | | | |
| | 535 | | | 6.250%, 6/01/24 | | | 6/18 at 100.00 | | | | | | | | AA | | | | 591,400 | |
| | 1,005 | | | 5.750%, 6/01/25 | | | 6/18 at 100.00 | | | | | | | | AA | | | | 1,099,209 | |
| | 335 | | | 5.750%, 6/01/26 | | | 6/18 at 100.00 | | | | | | | | AA | | | | 366,111 | |
| | | | | | |
| | | | Will, Grundy, Kendall, LaSalle, Kankakee, Livingston and Cook Counties Community College District 525 Joliet Junior College, Illinois, General Obligation Bond, Series 2008: | | | | | | | | | | | | | | | | |
| | 325 | | | 5.750%, 6/01/25 (Pre-refunded 6/01/18) | | | 6/18 at 100.00 | | | | | | | | N/R (4) | | | | 358,556 | |
| | 85 | | | 5.750%, 6/01/26 (Pre-refunded 6/01/18) | | | 6/18 at 100.00 | | | | | | | | N/R (4) | | | | 93,776 | |
| | | | | | |
| | 7,755 | | | Williamson & Johnson Counties Community Unit School District 2, Marion, Illinois, Limited Tax General Obligation Lease Certificates, Series 2011, 7.000%, 10/15/22 | | | 10/19 at 103.00 | | | | | | | | BBB | | | | 8,759,273 | |
| | | | | | |
| | | | Winnebago-Boone Counties School District 205 Rockford, Illinois, General Obligation Bonds, Series 2013: | | | | | | | | | | | | | | | | |
| | 4,070 | | | 0.000%, 2/01/25 | | | No Opt. Call | | | | | | | | AA– | | | | 3,256,407 | |
| | 3,340 | | | 0.000%, 2/01/26 | | | No Opt. Call | | | | | | | | AA– | | | | 2,560,344 | |
| | 543,249 | | | Total Illinois | | | | | | | | | | | | | | | 591,240,866 | |
| | | | | | |
| | | | Indiana – 4.5% | | | | | | | | | | | | | |
| | | | | | |
| | 710 | | | Anderson, Indiana, Economic Development Revenue Bonds, Anderson University, Series 2007, 5.000%, 10/01/17 | | | No Opt. Call | | | | | | | | BB+ | | | | 720,082 | |
| | | | | | |
| | 1,000 | | | Avon Community School Building Corporation, Hendricks County, Indiana, First Mortgage Bonds, Refunding Series 2007, 4.500%, 7/15/20 – AMBAC Insured | | | 7/17 at 100.00 | | | | | | | | AA+ | | | | 1,043,200 | |
| | | | | | |
| | | | Carmel Local Public Improvement Bond Bank, Indiana, Multipurpose Revenue Bonds, Series 2016: | | | | | | | | | | | | | | | | |
| | 1,980 | | | 5.000%, 7/15/29 (WI/DD, Settling 5/05/16) | | | 7/26 at 100.00 | | | | | | | | AA+ | | | | 2,479,495 | |
| | 13,695 | | | 5.000%, 7/15/30 (WI/DD, Settling 5/05/16) | | | 7/26 at 100.00 | | | | | | | | AA+ | | | | 17,037,676 | |
| | 6,010 | | | 5.000%, 7/15/31 (WI/DD, Settling 5/05/16) | | | 7/26 at 100.00 | | | | | | | | AA+ | | | | 7,439,959 | |
| | 8,110 | | | 5.000%, 7/15/32 (WI/DD, Settling 5/05/16) | | | 7/26 at 100.00 | | | | | | | | AA+ | | | | 9,989,979 | |
| | | | | | |
| | 540 | | | Carmel Redevelopment Authority, Indiana, County Option Income Tax Lease Rental Revenue Bonds, Refunding Series 2014A, 4.000%, 1/01/18 | | | No Opt. Call | | | | | | | | AA | | | | 569,014 | |
| | | | | | | | | | | | | | | | | | | | |
Principal
Amount (000) | | | Description (1) | | Optional Call
Provisions (2) | | | | | | | Ratings (3) | | | Value | |
| | | | | | |
| | | | Indiana (continued) | | | | | | | | | | | | | |
| | | | | | |
| | | | Carmel Redevelopment Authority, Indiana, County Option Income Tax Lease Rental Revenue Bonds, Refunding Series 2014B: | | | | | | | | | | | | | | | | |
| $ | 545 | | | 5.000%, 7/01/17 | | | No Opt. Call | | | | | | | | AA | | | $ | 572,435 | |
| | 500 | | | 4.000%, 1/01/18 | | | No Opt. Call | | | | | | | | AA | | | | 526,865 | |
| | 1,000 | | | 4.000%, 1/01/19 | | | No Opt. Call | | | | | | | | AA | | | | 1,081,660 | |
| | 435 | | | 5.000%, 1/01/20 | | | No Opt. Call | | | | | | | | AA | | | | 496,901 | |
| | 1,000 | | | 5.000%, 7/01/20 | | | No Opt. Call | | | | | | | | AA | | | | 1,159,260 | |
| | 500 | | | 5.000%, 1/01/21 | | | No Opt. Call | | | | | | | | AA | | | | 586,570 | |
| | | | | | |
| | | | Indiana Finance Authority, Hospital Revenue Bonds, Indiana University Health Obligation Group, Refunding 2016A: | | | | | | | | | | | | | | | | |
| | 6,940 | | | 5.000%, 12/01/22 | | | No Opt. Call | | | | | | | | AA | | | | 8,506,774 | |
| | 5,350 | | | 5.000%, 12/01/23 | | | No Opt. Call | | | | | | | | AA | | | | 6,661,499 | |
| | 1,895 | | | 5.000%, 12/01/24 | | | No Opt. Call | | | | | | | | AA | | | | 2,389,121 | |
| | | | | | |
| | | | Indiana Finance Authority, Hospital Revenue Bonds, Major Hospital Project, Series 2014A: | | | | | | | | | | | | | | | | |
| | 1,130 | | | 3.500%, 10/01/26 | | | 10/23 at 100.00 | | | | | | | | BBB+ | | | | 1,157,674 | |
| | 500 | | | 5.000%, 10/01/29 | | | 10/23 at 100.00 | | | | | | | | BBB+ | | | | 559,205 | |
| | | | | | |
| | 4,000 | | | Indiana Finance Authority, Lease Appropriation Bonds, Stadium Project, Refunding Series 2015A, 5.250%, 2/01/37 | | | 8/25 at 100.00 | | | | | | | | AA+ | | | | 4,758,080 | |
| | | | | | |
| | 11,020 | | | Indiana Finance Authority, Private Activity Bonds, Ohio River Bridges East End Crossing Project, Series 2013B, 5.000%, 1/01/19 (Alternative Minimum Tax) | | | 1/17 at 100.00 | | | | | | | | BBB+ | | | | 11,307,953 | |
| | | | | | |
| | | | Indiana Finance Authority, Tax-Exempt Private Activity Revenue Bonds, I-69 Section 5 Project, Series 2014: | | | | | | | | | | | | | | | | |
| | 1,300 | | | 5.250%, 9/01/27 (Alternative Minimum Tax) | | | 9/24 at 100.00 | | | | | | | | BBB– | | | | 1,516,411 | |
| | 6,275 | | | 5.250%, 9/01/34 (Alternative Minimum Tax) | | | 9/24 at 100.00 | | | | | | | | BBB– | | | | 7,101,731 | |
| | 6,830 | | | 5.250%, 9/01/40 (Alternative Minimum Tax) | | | 9/24 at 100.00 | | | | | | | | BBB– | | | | 7,572,967 | |
| | | | | | |
| | 5,300 | | | Indiana Finance Authority, Wastewater Utility Revenue Bonds, CWA Authority Project, Series 2011B, 5.250%, 10/01/24 – AGM Insured | | | 10/21 at 100.00 | | | | | | | | AA | | | | 6,332,758 | |
| | | | | | |
| | | | Indiana Finance Authority, Wastewater Utility Revenue Bonds, CWA Authority Project, Series 2014A: | | | | | | | | | | | | | | | | |
| | 885 | | | 5.000%, 10/01/21 | | | No Opt. Call | | | | | | | | AA | | | | 1,055,504 | |
| | 675 | | | 5.000%, 10/01/22 | | | No Opt. Call | | | | | | | | AA | | | | 819,929 | |
| | 620 | | | 5.000%, 10/01/23 | | | No Opt. Call | | | | | | | | AA | | | | 766,109 | |
| | 600 | | | 5.000%, 10/01/24 | | | No Opt. Call | | | | | | | | AA | | | | 752,472 | |
| | 1,215 | | | 5.000%, 10/01/25 | | | 10/24 at 100.00 | | | | | | | | AA | | | | 1,510,853 | |
| | 1,710 | | | 5.000%, 10/01/26 | | | 10/24 at 100.00 | | | | | | | | AA | | | | 2,103,933 | |
| | | | | | |
| | 8,000 | | | Indiana Finance Authority, Water Utility Revenue Bonds, Citizens Energy Group Project, First Lien Series 2014A, 2.950%, 10/01/22 | | | 7/22 at 100.00 | | | | | | | | A | | | | 8,537,680 | |
| | | | | | |
| | | | Indiana Health Facility Financing Authority, Revenue Bonds, Ascension Health, Series 2011A-1: | | | | | | | | | | | | | | | | |
| | 7,000 | | | 5.000%, 11/15/34 | | | 11/25 at 100.00 | | | | | | | | AA+ | | | | 8,418,410 | |
| | 9,710 | | | 5.000%, 11/15/35 | | | 11/25 at 100.00 | | | | | | | | AA+ | | | | 11,623,064 | |
| | | | | | |
| | | | Indiana Municipal Power Agency, Power Supply System Revenue Bonds, Series 2013A: | | | | | | | | | | | | | | | | |
| | 2,750 | | | 5.250%, 1/01/33 | | | 7/23 at 100.00 | | | | | | | | A+ | | | | 3,253,553 | |
| | 2,500 | | | 5.250%, 1/01/34 | | | 7/23 at 100.00 | | | | | | | | A+ | | | | 2,948,775 | |
| | | | | | |
| | 2,800 | | | Indianapolis Local Public Improvement Bond Bank, Indiana, Waterworks Project, Refunding Series 2006, 5.500%, 7/01/21 – NPFG Insured | | | No Opt. Call | | | | | | | | AA– | | | | 3,346,084 | |
| | | | | | |
| | 5,000 | | | Indianapolis Local Public Improvement Bond Bank, Indiana, Waterworks Project, Series 2007B, 5.250%, 7/01/23 – NPFG Insured | | | No Opt. Call | | | | | | | | AA– | | | | 6,127,500 | |
Nuveen Intermediate Duration Municipal Bond Fund (continued)
| | |
| Portfolio of Investments | | April 30, 2016 |
| | | | | | | | | | | | | | | | | | | | |
Principal
Amount (000) | | | Description (1) | | Optional Call
Provisions (2) | | | | | | | Ratings (3) | | | Value | |
| | | | | | |
| | | | Indiana (continued) | | | | | | | | | | | | | |
| | | | | | |
| | | | Indianapolis, Indiana, Gas Utility Distribution System Revenue Bonds, Refunding 2nd Lien Series 2013A: | | | | | | | | | | | | | | | | |
| $ | 7,900 | | | 5.250%, 8/15/28 | | | 8/23 at 100.00 | | | | | | | | AA– | | | $ | 9,462,620 | |
| | 10,000 | | | 5.250%, 8/15/29 | | | 8/23 at 100.00 | | | | | | | | AA– | | | | 11,923,300 | |
| | | | | | |
| | | | Indianapolis, Indiana, Thermal Energy System Revenue Bonds, Refunding First Lien Series 2014A: | | | | | | | | | | | | | | | | |
| | 500 | | | 5.000%, 10/01/27 | | | 10/24 at 100.00 | | | | | | | | A | | | | 603,885 | |
| | 720 | | | 5.000%, 10/01/28 | | | 10/24 at 100.00 | | | | | | | | A | | | | 863,338 | |
| | 1,000 | | | 5.000%, 10/01/29 | | | 10/24 at 100.00 | | | | | | | | A | | | | 1,192,980 | |
| | 1,360 | | | 5.000%, 10/01/31 | | | 10/24 at 100.00 | | | | | | | | A | | | | 1,606,554 | |
| | 1,215 | | | 5.000%, 10/01/33 | | | 10/24 at 100.00 | | | | | | | | A | | | | 1,425,231 | |
| | | | | | |
| | 2,985 | | | Jasper County, Indiana, Pollution Control Revenue Refunding Bonds, Northern Indiana Public Service Company Project, Series 1994A Remarketed, 5.850%, 4/01/19 – NPFG Insured | | | No Opt. Call | | | | | | | | AA– | | | | 3,337,290 | |
| | | | | | |
| | | | Knox County, Indiana, Economic Development Revenue and Refunding Bonds, Good Samaritan Hospital Project, Series 2012A: | | | | | | | | | | | | | | | | |
| | 1,675 | | | 5.000%, 4/01/21 | | | No Opt. Call | | | | | | | | Baa2 | | | | 1,895,145 | |
| | 940 | | | 5.000%, 4/01/22 | | | No Opt. Call | | | | | | | | Baa2 | | | | 1,075,567 | |
| | 2,015 | | | 5.000%, 4/01/24 | | | 4/22 at 100.00 | | | | | | | | Baa2 | | | | 2,243,118 | |
| | | | | | |
| | | | Lake County Building Corporation, Indiana, First Mortgage Bonds, Series 2012: | | | | | | | | | | | | | | | | |
| | 500 | | | 4.000%, 2/01/17 | | | No Opt. Call | | | | | | | | N/R | | | | 505,330 | |
| | 500 | | | 4.000%, 8/01/17 | | | No Opt. Call | | | | | | | | N/R | | | | 508,390 | |
| | 500 | | | 4.250%, 2/01/18 | | | No Opt. Call | | | | | | | | N/R | | | | 513,325 | |
| | 500 | | | 4.250%, 8/01/18 | | | No Opt. Call | | | | | | | | N/R | | | | 516,775 | |
| | 500 | | | 4.500%, 2/01/19 | | | No Opt. Call | | | | | | | | N/R | | | | 521,625 | |
| | 500 | | | 4.500%, 8/01/19 | | | No Opt. Call | | | | | | | | N/R | | | | 524,765 | |
| | 500 | | | 4.750%, 2/01/20 | | | No Opt. Call | | | | | | | | N/R | | | | 530,590 | |
| | 500 | | | 4.750%, 8/01/20 | | | No Opt. Call | | | | | | | | N/R | | | | 532,800 | |
| | 250 | | | 4.750%, 2/01/21 | | | No Opt. Call | | | | | | | | N/R | | | | 266,198 | |
| | 500 | | | 4.750%, 8/01/21 | | | No Opt. Call | | | | | | | | N/R | | | | 534,360 | |
| | 500 | | | 5.000%, 2/01/22 | | | No Opt. Call | | | | | | | | N/R | | | | 541,765 | |
| | 500 | | | 5.000%, 8/01/22 | | | 2/22 at 100.00 | | | | | | | | N/R | | | | 540,280 | |
| | 500 | | | 5.000%, 8/01/23 | | | 2/22 at 100.00 | | | | | | | | N/R | | | | 537,080 | |
| | 500 | | | 5.000%, 2/01/24 | | | 2/22 at 100.00 | | | | | | | | N/R | | | | 534,770 | |
| | | | | | |
| | 1,300 | | | Portage Township Multi-School Building Corporation, Porter County, Indiana, First Mortgage Bonds, Series 2007, 4.000%, 7/15/18 – NPFG Insured | | | 7/17 at 100.00 | | | | | | | | AA+ | | | | 1,352,663 | |
| | | | | | |
| | 1,105 | | | Southwind Housing Inc., Evansville, Indiana, First Mortgage Revenue Bonds, Series 1978A, 7.125%, 11/15/21 (ETM) | | | 5/16 at 100.00 | | | | | | | | N/R (4) | | | | 1,314,221 | |
| | | | | | |
| | 450 | | | St. Joseph County, Indiana, Economic Development Revenue Bonds, Holy Cross Village at Notre Dame, Series 2006A, 5.750%, 5/15/16 (ETM) | | | No Opt. Call | | | | | | | | N/R (4) | | | | 451,031 | |
| | | | | | |
| | | | Vanderburgh County, Indiana, Redevelopment District Tax Increment Revenue bonds, Refunding Series 2014: | | | | | | | | | | | | | | | | |
| | 1,000 | | | 5.000%, 2/01/25 | | | 8/24 at 100.00 | | | | | | | | A | | | | 1,219,770 | |
| | 1,000 | | | 5.000%, 2/01/26 | | | 8/24 at 100.00 | | | | | | | | A | | | | 1,205,530 | |
| | 1,805 | | | 5.000%, 2/01/27 | | | 8/24 at 100.00 | | | | | | | | A | | | | 2,162,589 | |
| | 1,750 | | | 5.000%, 2/01/29 | | | 8/24 at 100.00 | | | | | | | | A | | | | 2,066,820 | |
| | 2,700 | | | 5.000%, 2/01/31 | | | 8/24 at 100.00 | | | | | | | | A | | | | 3,165,426 | |
| | | | | | |
| | 19,905 | | | Whiting, Indiana, Environmental Facilities Revenue Bonds, BP Products North America Inc. Project, Series 2015, 5.000%, 11/01/45 (Mandatory put 11/01/22) (Alternative Minimum Tax) | | | No Opt. Call | | | | | | | | A– | | | | 23,284,869 | |
| | 198,105 | | | Total Indiana | | | | | | | | | | | | | | | 231,791,135 | |
| | | | | | | | | | | | | | | | | | | | |
Principal
Amount (000) | | | Description (1) | | Optional Call
Provisions (2) | | | | | | | Ratings (3) | | | Value | |
| | | | | | |
| | | | Iowa – 1.3% | | | | | | | | | | | | | |
| | | | | | |
| | | | Ames, Iowa, Hospital Revenue Bonds, Mary Greeley Medical Center, Series 2011: | | | | | | | | | | | | | | | | |
| $ | 1,000 | | | 5.250%, 6/15/25 | | | 6/20 at 100.00 | | | | | | | | A2 | | | $ | 1,129,110 | |
| | 2,000 | | | 5.250%, 6/15/26 | | | 6/20 at 100.00 | | | | | | | | A2 | | | | 2,251,080 | |
| | 3,135 | | | 5.250%, 6/15/27 | | | 6/20 at 100.00 | | | | | | | | A2 | | | | 3,515,808 | |
| | 2,000 | | | 5.375%, 6/15/28 | | | 6/20 at 100.00 | | | | | | | | A2 | | | | 2,254,300 | |
| | 2,035 | | | 5.500%, 6/15/29 | | | 6/20 at 100.00 | | | | | | | | A2 | | | | 2,298,980 | |
| | 1,000 | | | 5.500%, 6/15/30 | | | No Opt. Call | | | | | | | | A2 | | | | 1,127,190 | |
| | | | | | |
| | | | Fort Dodge Community School District, Webster County, Iowa, School Infrastructure Sales, Services, and Use Tax Revenue Bonds, Series 2011: | | | | | | | | | | | | | | | | |
| | 1,830 | | | 5.000%, 1/01/23 – AGM Insured | | | 1/21 at 100.00 | | | | | | | | AA | | | | 2,127,814 | |
| | 1,890 | | | 5.000%, 1/01/24 – AGM Insured | | | 1/21 at 100.00 | | | | | | | | AA | | | | 2,187,373 | |
| | 1,520 | | | 5.000%, 1/01/25 – AGM Insured | | | 1/21 at 100.00 | | | | | | | | AA | | | | 1,749,505 | |
| | 1,000 | | | 5.000%, 1/01/26 – AGM Insured | | | 1/21 at 100.00 | | | | | | | | AA | | | | 1,144,690 | |
| | | | | | |
| | 10,000 | | | Iowa Finance Authority, Health Facilities Revenue Bonds, UnityPoint Health Project, Series 2013A, 5.250%, 2/15/44 | | | 2/23 at 100.00 | | | | | | | | Aa3 | | | | 11,452,600 | |
| | | | | | |
| | | | Iowa Finance Authority, Health Facility Revenue Bonds, Care Initiatives Project, Series 2006A: | | | | | | | | | | | | | | | | |
| | 2,000 | | | 5.250%, 7/01/16 | | | No Opt. Call | | | | | | | | BB+ | | | | 2,012,400 | |
| | 820 | | | 5.000%, 7/01/19 | | | 7/16 at 100.00 | | | | | | | | BB+ | | | | 823,682 | |
| | | | | | |
| | | | Iowa Finance Authority, Healthcare Revenue Bonds, Genesis Health System, Series 2013: | | | | | | | | | | | | | | | | |
| | 8,655 | | | 5.000%, 7/01/27 | | | 7/23 at 100.00 | | | | | | | | A1 | | | | 10,267,253 | |
| | 6,820 | | | 5.000%, 7/01/28 | | | 7/23 at 100.00 | | | | | | | | A1 | | | | 8,045,690 | |
| | | | | | |
| | 11,140 | | | Iowa Finance Authority, Iowa, Midwestern Disaster Area Revenue Bonds, Iowa Fertilizer Company Project, Series 2013, 5.000%, 12/01/19 | | | No Opt. Call | | | | | | | | BB– | | | | 11,525,555 | |
| | | | | | |
| | 1,250 | | | Iowa Higher Education Loan Authority, Private College Facility Revenue Bonds, Upper Iowa University Project, Refunding Series 2010, 5.500%, 9/01/25 | | | 9/20 at 100.00 | | | | | | | | BB | | | | 1,330,800 | |
| | | | | | |
| | 2,000 | | | Iowa State, Special Obligation Bonds, Prison Infrastructure Fund, Refunding Series 2010, 4.500%, 6/15/22 | | | 6/20 at 100.00 | | | | | | | | AA | | | | 2,251,500 | |
| | 60,095 | | | Total Iowa | | | | | | | | | | | | | | | 67,495,330 | |
| | | | | | |
| | | | Kansas – 1.1% | | | | | | | | | | | | | |
| | | | | | |
| | 14,655 | | | Burlington, Kansas, Environmental Improvement Revenue Bonds, Kansas City Power and Light Company Project, Refunding Series 1993A, 2.950%, 12/01/23 | | | 4/23 at 101.00 | | | | | | | | A | | | | 15,792,814 | |
| | | | | | |
| | 10,000 | | | Burlington, Kansas, Environmental Improvement Revenue Bonds, Kansas City Power and Light Company Project, Refunding Series 1993B, 2.950%, 12/01/23 | | | 4/23 at 101.00 | | | | | | | | A | | | | 10,776,400 | |
| | | | | | |
| | 1,510 | | | Johnson County Unified School District 512, Shawnee Mission, Kansas, General Obligation Bonds, Refunding Series 1996, 4.875%, 10/01/19 | | | No Opt. Call | | | | | | | | Aaa | | | | 1,627,101 | |
| | | | | | |
| | 1,405 | | | Kansas Development Finance Authority, Health Facilities Revenue Bonds, Hays Medical Center Inc., Series 2005L, 4.500%, 11/15/17 | | | No Opt. Call | | | | | | | | A2 | | | | 1,409,805 | |
| | | | | | |
| | 2,200 | | | Kansas Development Finance Authority, Hospital Revenue Bonds, Adventist Health System/Sunbelt Obligated Group, Series 2009C, 5.500%, 11/15/23 | | | 11/19 at 100.00 | | | | | | | | Aa2 | | | | 2,513,302 | |
| | | | | | |
| | 3,175 | | | Kansas Development Finance Authority, Hospital Revenue Bonds, Adventist Health System/Sunbelt Obligated Group, Series 2009D, 5.000%, 11/15/29 | | | 11/17 at 100.00 | | | | | | | | Aa2 | | | | 3,356,801 | |
| | | | | | |
| | 1,850 | | | Kansas Development Finance Authority, Revenue Bonds, Kansas State Projects, Series 2007K, 4.500%, 11/01/19 – NPFG Insured | | | 11/17 at 100.00 | | | | | | | | AA– | | | | 1,953,656 | |
| | | | | | |
| | 1,000 | | | Olathe, Kansas, Health Facilities Revenue Bonds, Olathe Medical Center, Series 2008, 5.125%, 9/01/21 | | | 9/17 at 100.00 | | | | | | | | A+ | | | | 1,056,180 | |
Nuveen Intermediate Duration Municipal Bond Fund (continued)
| | |
| Portfolio of Investments | | April 30, 2016 |
| | | | | | | | | | | | | | | | | | | | |
Principal
Amount (000) | | | Description (1) | | Optional Call
Provisions (2) | | | | | | | Ratings (3) | | | Value | |
| | | | | | |
| | | | Kansas (continued) | | | | | | | | | | | | | |
| | | | | | |
| $ | 50 | | | Sedgwick and Shawnee Counties, Kansas, GNMA Mortgage-Backed Securities Program Single Family Revenue Bonds, Series 1997A-2, 6.700%, 6/01/29 | | | No Opt. Call | | | | | | | | Aaa | | | $ | 50,537 | |
| | | | | | |
| | 10,150 | | | Wichita, Kansas, Hospital Facilities Revenue Refunding and Improvement Bonds, Via Christi Health System Inc., Series 2011A-IV, 5.000%, 11/15/29 (Pre-refunded 11/15/21) | | | 11/21 at 100.00 | | | | | | | | N/R (4) | | | | 12,232,577 | |
| | | | | | |
| | | | Wyandotte County/Kansas City Unified Government, Kansas, Utility System Revenue Bonds, Refunding & Improvement Series 2014A: | | | | | | | | | | | | | | | | |
| | 1,900 | | | 5.000%, 9/01/21 | | | No Opt. Call | | | | | | | | A+ | | | | 2,266,073 | |
| | 660 | | | 5.000%, 9/01/22 | | | No Opt. Call | | | | | | | | A+ | | | | 798,719 | |
| | 1,505 | | | 5.000%, 9/01/23 | | | No Opt. Call | | | | | | | | A+ | | | | 1,854,431 | |
| | | | | | |
| | 60 | | | Wyandotte County-Kansas City Unified Government, Kansas, Sales Tax Special Obligation Capital Appreciation Revenue Bonds Redevelopment Project Area B – Major Multi-Sport Athletic Complex Project, Subordinate Lien Series 2010B, 0.000%, 6/01/21 | | | No Opt. Call | | | | | | | | A– | | | | 45,400 | |
| | 50,120 | | | Total Kansas | | | | | | | | | | | | | | | 55,733,796 | |
| | | | | | |
| | | | Kentucky – 1.5% | | | | | | | | | | | | | |
| | | | | | |
| | 1,795 | | | Kentucky Economic Development Finance Authority, Hospital Facilities Revenue Bonds, Owensboro Medical Health System, Series 2015A, 4.500%, 6/01/46 | | | 6/25 at 100.00 | | | | | | | | BBB+ | | | | 1,878,809 | |
| | | | | | |
| | 2,450 | | | Kentucky Economic Development Finance Authority, Hospital Revenue Bonds, Baptist Healthcare System Obligated Group, Series 2009A, 5.625%, 8/15/27 | | | 8/19 at 100.00 | | | | | | | | A+ | | | | 2,674,371 | |
| | | | | | |
| | 8,175 | | | Kentucky Economic Development Finance Authority, Louisville Arena Project Revenue Bonds, Louisville Arena Authority, Inc., Series 2008-A1, 5.750%, 12/01/28 – AGC Insured | | | 6/18 at 100.00 | | | | | | | | AA | | | | 8,772,102 | |
| | | | | | |
| | 5,870 | | | Kentucky Public Transportation Infrastructure Authority, First Tier Toll Revenue Bonds, Downtown Crossing Project, Series 2013A, 5.000%, 7/01/17 | | | No Opt. Call | | | | | | | | Baa3 | | | | 6,123,173 | |
| | | | | | |
| | 20,700 | | | Kentucky State Property and Buildings Commission, Revenue Bonds, Project 83, Series 2004, 5.000%, 10/01/18 – AMBAC Insured | | | No Opt. Call | | | | | | | | Aa3 | | | | 22,684,302 | |
| | | | | | |
| | 460 | | | Laurel County School District Finance Corporation, Kentucky, School Building Revenue Bonds, Series 2006, 4.500%, 8/01/24 (Pre-refunded 8/01/16) – AMBAC Insured | | | 8/16 at 100.00 | | | | | | | | Aa3 (4) | | | | 464,710 | |
| | | | | | |
| | 7,000 | | | Lexington-Fayette Urban County Government Public Facilities Corporation, Kentucky State Lease Revenue Bonds, Eastern State Hospital Project, Series 2011A, 5.250%, 6/01/28 | | | 6/21 at 100.00 | | | | | | | | Aa3 | | | | 8,108,310 | |
| | | | | | |
| | | | Louisville Regional Airport Authority, Kentucky, Airport System Revenue Bonds, Refunding Series 2014A: | | | | | | | | | | | | | | | | |
| | 1,320 | | | 5.000%, 7/01/26 (Alternative Minimum Tax) | | | 7/24 at 100.00 | | | | | | | | A+ | | | | 1,581,413 | |
| | 3,280 | | | 5.000%, 7/01/28 (Alternative Minimum Tax) | | | 7/24 at 100.00 | | | | | | | | A+ | | | | 3,860,068 | |
| | | | | | |
| | 1,135 | | | Louisville-Jefferson County Metro Government, Kentucky, Revenue Bonds, Bellarmine University Inc Project, Refunding & Improvement Series 2008A, 6.000%, 5/01/28 | | | 5/18 at 100.00 | | | | | | | | Baa3 | | | | 1,213,939 | |
| | | | | | |
| | 4,420 | | | Louisville-Jefferson County Metropolitan Government, Kentucky, Environmental Facilities Revenue, Louisville Gas & Electric Company Project, Series 2007B, 1.600%, 6/01/33 (Mandatory put 6/01/17) | | | No Opt. Call | | | | | | | | A | | | | 4,446,387 | |
| | | | | | |
| | 10,200 | | | Louisville-Jefferson County Metropolitan Government, Kentucky, Pollution Control Revenue Bonds, Louisville Gas and Electric Company Project, Series 2003A, 1.650%, 10/01/33 (Mandatory put 4/03/17) | | | No Opt. Call | | | | | | | | A1 | | | | 10,248,756 | |
| | | | | | |
| | 2,055 | | | Louisville-Jefferson County Metropolitan Government, Kentucky, Pollution Control Revenue Bonds, Louisville Gas and Electric Company Project, Series 2005A, 2.200%, 2/01/35 (Mandatory put 8/01/19) | | | No Opt. Call | | | | | | | | A1 | | | | 2,102,594 | |
| | | | | | | | | | | | | | | | | | | | |
Principal
Amount (000) | | | Description (1) | | Optional Call
Provisions (2) | | | | | | | Ratings (3) | | | Value | |
| | | | | | |
| | | | Kentucky (continued) | | | | | | | | | | | | | |
| | | | | | |
| | | | Pikeville, Kentucky, Hospital Revenue Bonds, Pikeville Medical Center, Inc. Project, Improvement and Refunding Series 2011: | | | | | | | | | | | | | | | | |
| $ | 1,255 | | | 6.000%, 3/01/22 | | | No Opt. Call | | | | | | | | A3 | | | $ | 1,474,751 | |
| | 1,320 | | | 6.250%, 3/01/23 | | | No Opt. Call | | | | | | | | A3 | | | | 1,557,455 | |
| | 1,285 | | | 6.250%, 3/01/24 | | | 3/21 at 100.00 | | | | | | | | A3 | | | | 1,507,883 | |
| | | | | | |
| | 1,435 | | | University of Kentucky, General Receipts Bonds, Series 2014B, 5.000%, 4/01/17 | | | No Opt. Call | | | | | | | | AA | | | | 1,493,591 | |
| | 74,155 | | | Total Kentucky | | | | | | | | | | | | | | | 80,192,614 | |
| | | | | | |
| | | | Louisiana – 2.5% | | | | | | | | | | | | | |
| | | | | | |
| | 5,035 | | | De Soto Parrish, Louisiana, Pollution Control Revenue Bonds, Southwestern Electric Power Company Project, Refunding Series 2010, 1.600%, 1/01/19 | | | No Opt. Call | | | | | | | | BBB | | | | 5,063,397 | |
| | | | | | |
| | | | East Baton Rouge Sewerage Commission, Louisiana, Revenue Bonds, Refunding Series 2014B: | | | | | | | | | | | | | | | | |
| | 970 | | | 5.000%, 2/01/23 | | | No Opt. Call | | | | | | | | AA | | | | 1,188,822 | |
| | 515 | | | 5.000%, 2/01/24 | | | No Opt. Call | | | | | | | | AA | | | | 641,824 | |
| | 800 | | | 5.000%, 2/01/25 | | | No Opt. Call | | | | | | | | AA | | | | 1,008,016 | |
| | | | | | |
| | 475 | | | Louisiana Citizens Property Insurance Corporation, Assessment Revenue Bonds, Refunding Series 2012, 5.000%, 6/01/24 – AGM Insured | | | 6/22 at 100.00 | | | | | | | | AA | | | | 566,257 | |
| | | | | | |
| | | | Louisiana Citizens Property Insurance Corporation, Assessment Revenue Bonds, Series 2006B: | | | | | | | | | | | | | | | | |
| | 1,330 | | | 5.000%, 6/01/17 (Pre-refunded 6/01/16) – AMBAC Insured | | | 6/16 at 100.00 | | | | | | | | A1 (4) | | | | 1,335,426 | |
| | 40 | | | 5.000%, 6/01/21 (Pre-refunded 6/01/16) – AMBAC Insured | | | 6/16 at 100.00 | | | | | | | | A1 (4) | | | | 40,163 | |
| | 865 | | | 5.000%, 6/01/22 (Pre-refunded 6/01/16) – AMBAC Insured | | | 6/16 at 100.00 | | | | | | | | A1 (4) | | | | 868,529 | |
| | | | | | |
| | 245 | | | Louisiana Citizens Property Insurance Corporation, Assessment Revenue Bonds, Series 2006-C1, 5.875%, 6/01/23 | | | 6/18 at 100.00 | | | | | | | | AA | | | | 269,400 | |
| | | | | | |
| | 5 | | | Louisiana Citizens Property Insurance Corporation, Assessment Revenue Bonds, Series 2006C-3, 6.125%, 6/01/25 – AGC Insured | | | 6/18 at 100.00 | | | | | | | | AA | | | | 5,527 | |
| | | | | | |
| | | | Louisiana Local Government Environmental Facilities and Community Development Authority, Revenue Bonds, East Baton Rouge Sewerage Commission Projects, Subordinate Lien Series 2014A: | | | | | | | | | | | | | | | | |
| | 2,275 | | | 5.000%, 2/01/28 | | | 2/24 at 100.00 | | | | | | | | AA– | | | | 2,704,657 | |
| | 2,850 | | | 5.000%, 2/01/29 | | | 2/24 at 100.00 | | | | | | | | AA– | | | | 3,370,667 | |
| | 2,000 | | | 5.000%, 2/01/30 | | | 2/24 at 100.00 | | | | | | | | AA– | | | | 2,351,860 | |
| | | | | | |
| | | | Louisiana Local Government Environmental Facilities and Community Development Authority, Revenue Bonds, Southgate Suites Retail Project, Series 2007A: | | | | | | | | | | | | | | | | |
| | 2,000 | | | 6.750%, 12/15/37 (7) | | | 12/17 at 100.00 | | | | | | | | N/R | | | | 1,285,820 | |
| | 320 | | | 6.000%, 12/15/37 (7) | | | No Opt. Call | | | | | | | | N/R | | | | 175,680 | |
| | | | | | |
| | 30 | | | Louisiana Local Government Environmental Facilities and Community Development Authority, Revenue Bonds, Southgate Suites Retail Project, Series 2007B, 9.000%, 12/15/14 | | | No Opt. Call | | | | | | | | N/R | | | | 16,470 | |
| | | | | | |
| | 960 | | | Louisiana Public Facilities Authority, Revenue Bonds, Entergy Louisiana, LLC Project, Refunding Series 2016A, 3.375%, 9/01/28 | | | 3/21 at 100.00 | | | | | | | | A– | | | | 978,614 | |
| | | | | | |
| | 24,340 | | | Louisiana Public Facilities Authority, Revenue Bonds, Entergy Louisiana, LLC Project, Refunding Series 2016B, 3.500%, 6/01/30 | | | 6/21 at 100.00 | | | | | | | | A– | | | | 24,840,430 | |
| | | | | | |
| | | | Louisiana Public Facilities Authority, Revenue Bonds, Ochsner Clinic Foundation Project, Series 2007A: | | | | | | | | | | | | | | | | |
| | 1,465 | | | 5.000%, 5/15/16 | | | No Opt. Call | | | | | | | | A– | | | | 1,467,740 | |
| | 3,735 | | | 5.000%, 5/15/20 | | | 5/17 at 100.00 | | | | | | | | A– | | | | 3,907,744 | |
| | | | | | |
| | 550 | | | Louisiana Public Facilities Authority, Revenue Bonds, Ochsner Clinic Foundation Project, Series 2007A, 5.000%, 5/15/16 (ETM) | | | No Opt. Call | | | | | | | | N/R (4) | | | | 551,122 | |
Nuveen Intermediate Duration Municipal Bond Fund (continued)
| | |
| Portfolio of Investments | | April 30, 2016 |
| | | | | | | | | | | | | | | | | | | | |
Principal
Amount (000) | | | Description (1) | | Optional Call
Provisions (2) | | | | | | | Ratings (3) | | | Value | |
| | | | | | |
| | | | Louisiana (continued) | | | | | | | | | | | | | |
| | | | | | |
| $ | 1,420 | | | Louisiana Public Facilities Authority, Revenue Bonds, Ochsner Clinic Foundation Project, Series 2007A, 5.000%, 5/15/20 (Pre-refunded 5/15/17) | | | 5/17 at 100.00 | | | | | | | | N/R (4) | | | $ | 1,485,263 | |
| | | | | | |
| | | | Louisiana Stadium and Exposition District, Revenue Refunding Bonds, Senior Lien Series 2013A: | | | | | | | | | | | | | | | | |
| | 1,050 | | | 5.000%, 7/01/22 | | | No Opt. Call | | | | | | | | A | | | | 1,267,938 | |
| | 2,750 | | | 5.000%, 7/01/29 | | | 7/23 at 100.00 | | | | | | | | A | | | | 3,202,705 | |
| | 5,000 | | | 5.000%, 7/01/31 | | | 7/23 at 100.00 | | | | | | | | A | | | | 5,780,400 | |
| | 3,835 | | | 5.000%, 7/01/32 | | | 7/23 at 100.00 | | | | | | | | A | | | | 4,417,306 | |
| | | | | | |
| | | | Louisiana State, Unclaimed Property Special Revenue Bonds, Interstate 49 North Project, Series 2013: | | | | | | | | | | | | | | | | |
| | 1,165 | | | 5.000%, 9/01/29 | | | 9/23 at 100.00 | | | | | | | | AA– | | | | 1,355,454 | |
| | 5,070 | | | 5.000%, 9/01/31 | | | 9/23 at 100.00 | | | | | | | | AA– | | | | 5,848,752 | |
| | 4,000 | | | 5.000%, 9/01/32 | | | 9/23 at 100.00 | | | | | | | | AA– | | | | 4,597,160 | |
| | | | | | |
| | | | New Orleans, Louisiana, General Obligation Bonds, Refunding Series 2012: | | | | | | | | | | | | | | | | |
| | 4,140 | | | 5.000%, 12/01/19 | | | No Opt. Call | | | | | | | | A+ | | | | 4,684,162 | |
| | 3,940 | | | 5.000%, 12/01/20 | | | No Opt. Call | | | | | | | | A+ | | | | 4,563,150 | |
| | 5,400 | | | 5.000%, 12/01/21 | | | No Opt. Call | | | | | | | | A+ | | | | 6,359,796 | |
| | | | | | |
| | | | New Orleans, Louisiana, General Obligation Bonds, Refunding Series 2015: | | | | | | | | | | | | | | | | |
| | 1,000 | | | 5.000%, 12/01/22 | | | No Opt. Call | | | | | | | | A+ | | | | 1,199,280 | |
| | 870 | | | 5.000%, 12/01/23 | | | No Opt. Call | | | | | | | | A+ | | | | 1,060,373 | |
| | 1,010 | | | 5.000%, 12/01/24 | | | No Opt. Call | | | | | | | | A+ | | | | 1,246,956 | |
| | 470 | | | 5.000%, 12/01/25 | | | No Opt. Call | | | | | | | | A+ | | | | 585,418 | |
| | 255 | | | 5.000%, 12/01/26 | | | 12/25 at 100.00 | | | | | | | | A+ | | | | 314,616 | |
| | 730 | | | 5.000%, 12/01/27 | | | 12/25 at 100.00 | | | | | | | | A+ | | | | 892,856 | |
| | | | | | |
| | | | New Orleans, Louisiana, Sewerage Service Revenue Bonds, Refunding Series 2014: | | | | | | | | | | | | | | | | |
| | 1,200 | | | 5.000%, 6/01/20 | | | No Opt. Call | | | | | | | | A | | | | 1,376,748 | |
| | 100 | | | 5.000%, 6/01/24 | | | No Opt. Call | | | | | | | | A | | | | 122,322 | |
| | 500 | | | 5.000%, 6/01/25 | | | 6/24 at 100.00 | | | | | | | | A | | | | 605,210 | |
| | 500 | | | 5.000%, 6/01/26 | | | 6/24 at 100.00 | | | | | | | | A | | | | 600,040 | |
| | 500 | | | 5.000%, 6/01/27 | | | 6/24 at 100.00 | | | | | | | | A | | | | 594,920 | |
| | 330 | | | 5.000%, 6/01/28 | | | 6/24 at 100.00 | | | | | | | | A | | | | 388,928 | |
| | 570 | | | 5.000%, 6/01/29 | | | 6/24 at 100.00 | | | | | | | | A | | | | 668,450 | |
| | | | | | |
| | | | New Orleans, Louisiana, Sewerage Service Revenue Bonds, Series 2015: | | | | | | | | | | | | | | | | |
| | 385 | | | 5.000%, 6/01/30 | | | 6/25 at 100.00 | | | | | | | | A | | | | 456,337 | |
| | 775 | | | 5.000%, 6/01/32 | | | 6/25 at 100.00 | | | | | | | | A | | | | 911,648 | |
| | 1,000 | | | 5.000%, 6/01/33 | | | 6/25 at 100.00 | | | | | | | | A | | | | 1,171,060 | |
| | 650 | | | 5.000%, 6/01/35 | | | 6/25 at 100.00 | | | | | | | | A | | | | 755,541 | |
| | | | | | |
| | 500 | | | Port New Orleans Board of Commissioners, Louisiana, Revenue Bonds, Port Facilities, Refunding Series 2013B, 5.000%, 4/01/30 (Alternative Minimum Tax) | | | 4/23 at 100.00 | | | | | | | | A3 | | | | 562,580 | |
| | | | | | |
| | 6,585 | | | Saint Charles Parish, Louisiana, Gulf Opportunity Zone Revenue Bonds, Valero Project, Series 2010, 4.000%, 12/01/40 (Mandatory put 6/01/22) | | | No Opt. Call | | | | | | | | BBB | | | | 7,201,093 | |
| | | | | | |
| | 9,930 | | | Shreveport, Louisiana, Water and Sewer Revenue Bonds, Refunding Series 2015, 5.000%, 12/01/40 | | | 12/25 at 100.00 | | | | | | | | BBB+ | | | | 11,493,379 | |
| | 116,435 | | | Total Louisiana | | | | | | | | | | | | | | | 128,408,006 | |
| | | | | | |
| | | | Maine – 0.1% | | | | | | | | | | | | | |
| | | | | | |
| | | | Maine Health and Higher Educational Facilities Authority, Revenue Bonds, Maine General Medical Center, Series 2011: | | | | | | | | | | | | | | | | |
| | 1,000 | | | 6.750%, 7/01/36 | | | 7/21 at 100.00 | | | | | | | | BBB– | | | | 1,140,800 | |
| | 3,850 | | | 6.750%, 7/01/41 | | | 7/21 at 100.00 | | | | | | | | BBB– | | | | 4,386,267 | |
| | | | | | | | | | | | | | | | | | | | |
Principal
Amount (000) | | | Description (1) | | Optional Call
Provisions (2) | | | | | | | Ratings (3) | | | Value | |
| | | | | | |
| | | | Maine (continued) | | | | | | | | | | | | | |
| | | | | | |
| $ | 630 | | | Maine Health and Higher Educational Facilities Authority, Revenue Bonds, Series 2007B, 4.125%, 7/01/18 – FGIC Insured | | | 1/18 at 100.00 | | | | | | | | AA | | | $ | 664,398 | |
| | | | | | |
| | 110 | | | Maine Health and Higher Educational Facilities Authority, Revenue Bonds, Series 2007B, 4.125%, 7/01/18 (Pre-refunded 1/01/18) – FGIC Insured | | | 1/18 at 100.00 | | | | | | | | A1 (4) | | | | 116,233 | |
| | | | | | |
| | | | Portland, Maine, General Airport Revenue Bonds, Refunding Series 2013: | | | | | | | | | | | | | | | | |
| | 500 | | | 4.000%, 7/01/18 | | | No Opt. Call | | | | | | | | BBB+ | | | | 527,710 | |
| | 225 | | | 4.000%, 7/01/20 | | | No Opt. Call | | | | | | | | BBB+ | | | | 244,145 | |
| | 290 | | | 5.000%, 7/01/22 | | | No Opt. Call | | | | | | | | BBB+ | | | | 336,168 | |
| | 6,605 | | | Total Maine | | | | | | | | | | | | | | | 7,415,721 | |
| | | | | | |
| | | | Maryland – 0.7% | | | | | | | | | | | | | |
| | | | | | |
| | | | Baltimore, Maryland, Revenue Bonds, Water Projects, Series 2013A: | | | | | | | | | | | | | | | | |
| | 500 | | | 5.000%, 7/01/21 | | | No Opt. Call | | | | | | | | AA | | | | 595,275 | |
| | 1,000 | | | 5.000%, 7/01/26 | | | 1/24 at 100.00 | | | | | | | | AA | | | | 1,236,820 | |
| | 1,715 | | | 5.000%, 7/01/27 | | | 1/24 at 100.00 | | | | | | | | AA | | | | 2,105,917 | |
| | | | | | |
| | 30 | | | Maryland Community Development Administration, Housing Revenue Bonds, Series 1996A, 5.875%, 7/01/16 | | | No Opt. Call | | | | | | | | Aa2 | | | | 30,101 | |
| | | | | | |
| | 250 | | | Maryland Economic Development Corporation, Economic Development Revenue Bonds, Transportation Facilities Project, Series 2010A, 5.750%, 6/01/35 | | | 6/20 at 100.00 | | | | | | | | Baa3 | | | | 274,063 | |
| | | | | | |
| | | | Maryland Economic Development Corporation, Student Housing Revenue Bonds, University of Maryland, College Park Project, Refunding Series 2016: | | | | | | | | | | | | | | | | |
| | 700 | | | 5.000%, 6/01/27 – AGM Insured | | | 6/26 at 100.00 | | | | | | | | AA | | | | 874,069 | |
| | 1,000 | | | 5.000%, 6/01/28 – AGM Insured | | | 6/26 at 100.00 | | | | | | | | AA | | | | 1,238,890 | |
| | 1,000 | | | 5.000%, 6/01/29 – AGM Insured | | | 6/26 at 100.00 | | | | | | | | AA | | | | 1,231,060 | |
| | 875 | | | 5.000%, 6/01/30 – AGM Insured | | | 6/26 at 100.00 | | | | | | | | AA | | | | 1,070,878 | |
| | 695 | | | 5.000%, 6/01/31 – AGM Insured | | | 6/26 at 100.00 | | | | | | | | AA | | | | 846,997 | |
| | 1,870 | | | 5.000%, 6/01/35 – AGM Insured | | | 6/26 at 100.00 | | | | | | | | AA | | | | 2,243,925 | |
| | | | | | |
| | | | Maryland Health and Higher Educational Facilities Authority, Revenue Bonds, Mercy Medical Center, Series 2016A: | | | | | | | | | | | | | | | | |
| | 750 | | | 5.000%, 7/01/32 | | | 7/26 at 100.00 | | | | | | | | BBB | | | | 894,780 | |
| | 2,250 | | | 5.000%, 7/01/33 | | | 7/26 at 100.00 | | | | | | | | BBB | | | | 2,671,200 | |
| | 1,650 | | | 5.000%, 7/01/34 | | | 7/26 at 100.00 | | | | | | | | BBB | | | | 1,949,294 | |
| | 2,000 | | | 5.000%, 7/01/35 | | | 7/26 at 100.00 | | | | | | | | BBB | | | | 2,351,220 | |
| | 1,570 | | | 5.000%, 7/01/36 | | | 7/26 at 100.00 | | | | | | | | BBB | | | | 1,839,695 | |
| | | | | | |
| | 2,000 | | | Maryland Health and Higher Educational Facilities Authority, Revenue Bonds, University of Maryland Medical System, Series 2010, 5.250%, 7/01/24 | | | 7/19 at 100.00 | | | | | | | | A2 | | | | 2,239,720 | |
| | | | | | |
| | 7,825 | | | Maryland Health and Higher Educational Facilities Authority, Revenue Bonds, Western Maryland Health, Series 2014, 5.250%, 7/01/25 | | | 7/24 at 100.00 | | | | | | | | BBB | | | | 9,653,781 | |
| | | | | | |
| | 2,475 | | | Maryland State, General Obligation Bonds, State & Local Facilities Loan, First Series 2011A, 5.000%, 3/15/19 | | | No Opt. Call | | | | | | | | AAA | | | | 2,774,475 | |
| | 30,155 | | | Total Maryland | | | | | | | | | | | | | | | 36,122,160 | |
| | | | | | |
| | | | Massachusetts – 1.4% | | | | | | | | | | | | | |
| | | | | | |
| | 2,045 | | | Massachusetts Bay Transportation Authority, General Obligation Transportation System Bonds, Series 1991A, 7.000%, 3/01/21 – FGIC Insured | | | No Opt. Call | | | | | | | | AA+ | | | | 2,374,061 | |
| | | | | | |
| | 10,000 | | | Massachusetts Bay Transportation Authority, Sales Tax Revenue Bonds, Refunding Senior Lien Series 2004B, 5.250%, 7/01/20 | | | No Opt. Call | | | | | | | | AA+ | | | | 11,763,700 | |
Nuveen Intermediate Duration Municipal Bond Fund (continued)
| | |
| Portfolio of Investments | | April 30, 2016 |
| | | | | | | | | | | | | | | | | | | | |
Principal
Amount (000) | | | Description (1) | | Optional Call
Provisions (2) | | | | | | | Ratings (3) | | | Value | |
| | | | | | |
| | | | Massachusetts (continued) | | | | | | | | | | | | | |
| | | | | | |
| | | | Massachusetts Development Finance Agency Revenue Bonds, Lawrence General Hospital Issue, Series 2014A: | | | | | | | | | | | | | | | | |
| $ | 835 | | | 5.000%, 7/01/26 | | | 7/24 at 100.00 | | | | | | | | BBB– | | | $ | 934,975 | |
| | 680 | | | 5.000%, 7/01/27 | | | 7/24 at 100.00 | | | | | | | | BBB– | | | | 758,581 | |
| | 925 | | | 5.000%, 7/01/28 | | | 7/24 at 100.00 | | | | | | | | BBB– | | | | 1,027,000 | |
| | 960 | | | 5.000%, 7/01/29 | | | 7/24 at 100.00 | | | | | | | | BBB– | | | | 1,061,894 | |
| | | | | | |
| | 2,500 | | | Massachusetts Development Finance Agency, Health Care Facility Revenue Bonds, Adventcare Project, Series 2007A, 6.650%, 10/15/28 | | | 10/17 at 100.00 | | | | | | | | N/R | | | | 2,582,750 | |
| | | | | | |
| | | | Massachusetts Development Finance Agency, Revenue Bonds, Orchard Cove, Series 2007: | | | | | | | | | | | | | | | | |
| | 710 | | | 5.000%, 10/01/17 | | | No Opt. Call | | | | | | | | N/R | | | | 735,851 | |
| | 515 | | | 5.000%, 10/01/18 | | | 10/17 at 100.00 | | | | | | | | N/R | | | | 532,577 | |
| | 450 | | | 5.250%, 10/01/37 | | | 10/16 at 101.00 | | | | | | | | N/R | | | | 454,784 | |
| | | | | | |
| | 30 | | | Massachusetts Development Finance Agency, Revenue Bonds, Roxbury Latin School, Series 2014A, 3.250%, 7/01/33 | | | 7/25 at 100.00 | | | | | | | | AA– | | | | 31,402 | |
| | | | | | |
| | | | Massachusetts Development Finance Authority, Revenue Bonds, Suffolk University, Series 2010: | | | | | | | | | | | | | | | | |
| | 915 | | | 4.500%, 7/01/21 | | | 7/20 at 100.00 | | | | | | | | Baa2 | | | | 996,902 | |
| | 1,765 | | | 4.500%, 7/01/22 | | | 7/20 at 100.00 | | | | | | | | Baa2 | | | | 1,913,119 | |
| | 1,705 | | | 4.625%, 7/01/23 | | | 7/20 at 100.00 | | | | | | | | Baa2 | | | | 1,874,307 | |
| | | | | | |
| | 745 | | | Massachusetts Educational Financing Authority, Student Loan Revenue Bonds, Issue I Series 2010B, 4.800%, 1/01/17 (Alternative Minimum Tax) | | | No Opt. Call | | | | | | | | AA | | | | 760,898 | |
| | | | | | |
| | | | Massachusetts Health and Educational Facilities Authority, Revenue Bonds, Springfield College, Series 2010: | | | | | | | | | | | | | | | | |
| | 500 | | | 5.125%, 10/15/22 | | | 10/19 at 100.00 | | | | | | | | Baa1 | | | | 553,645 | |
| | 2,595 | | | 5.500%, 10/15/26 | | | 10/19 at 100.00 | | | | | | | | Baa1 | | | | 2,890,960 | |
| | | | | | |
| | 3,020 | | | Massachusetts Health and Educational Facilities Authority, Revenue Refunding Bonds, Suffolk University Issue, Series 2009A, 6.000%, 7/01/24 | | | 7/19 at 100.00 | | | | | | | | BBB | | | | 3,440,928 | |
| | | | | | |
| | | | Massachusetts Port Authority, Special Facilities Revenue Bonds, Delta Air Lines Inc., Series 2001A: | | | | | | | | | | | | | | | | |
| | 140 | | | 5.500%, 1/01/17 – AMBAC Insured (Alternative Minimum Tax) | | | 7/16 at 100.00 | | | | | | | | N/R | | | | 140,549 | |
| | 50 | | | 5.200%, 1/01/20 – AMBAC Insured (Alternative Minimum Tax) | | | 7/16 at 100.00 | | | | | | | | N/R | | | | 50,196 | |
| | 1,465 | | | 5.000%, 1/01/27 – AMBAC Insured (Alternative Minimum Tax) | | | 7/16 at 100.00 | | | | | | | | N/R | | | | 1,470,743 | |
| | | | | | |
| | 27,360 | | | Massachusetts State, General Obligation Bonds, Series 2004C, 5.500%, 12/01/16 – AGM Insured | | | No Opt. Call | | | | | | | | AA+ | | | | 28,173,960 | |
| | | | | | |
| | 5,000 | | | Massachusetts Water Resources Authority, General Revenue Bonds, Refunding Series 2013A, 4.000%, 8/01/17 | | | No Opt. Call | | | | | | | | AA+ | | | | 5,215,400 | |
| | | | | | |
| | 915 | | | Springfield, Massachusetts, General Obligation Bonds, Refunding Series 2007, 4.500%, 8/01/20 – AGM Insured | | | 2/17 at 100.00 | | | | | | | | AA | | | | 940,931 | |
| | | | | | |
| | 530 | | | Springfield, Massachusetts, General Obligation Bonds, Refunding Series 2007, 4.500%, 8/01/20 (Pre-refunded 2/01/17) – AGM Insured | | | 2/17 at 100.00 | | | | | | | | AA (4) | | | | 545,831 | |
| | 66,355 | | | Total Massachusetts | | | | | | | | | | | | | | | 71,225,944 | |
| | | | | | |
| | | | Michigan – 2.5% | | | | | | | | | | | | | |
| | | | | | |
| | 790 | | | Algonac Community Schools, Saint Clair County, Michigan, General Obligation Bonds, School Building & Site Series 2008-I, 4.000%, 5/01/19 – AGM Insured | | | 5/18 at 100.00 | | | | | | | | Aa1 | | | | 837,487 | |
| | | | | | |
| | | | Detroit Downtown Development Authority, Michigan, Tax Increment Refunding Bonds, Development Area 1 Projects, Series 1996B: | | | | | | | | | | | | | | | | |
| | 3,050 | | | 0.000%, 7/01/22 | | | No Opt. Call | | | | | | | | BB | | | | 2,176,785 | |
| | 2,650 | | | 0.000%, 7/01/23 | | | No Opt. Call | | | | | | | | BB | | | | 1,784,484 | |
| | 2,880 | | | 0.000%, 7/01/24 | | | No Opt. Call | | | | | | | | BB | | | | 1,823,126 | |
| | | | | | | | | | | | | | | | | | | | |
Principal
Amount (000) | | | Description (1) | | Optional Call
Provisions (2) | | | | | | | Ratings (3) | | | Value | |
| | | | | | |
| | | | Michigan (continued) | | | | | | | | | | | | | |
| | | | | | |
| $ | 1,206 | | | Detroit, Michigan, General Obligation Bonds, Series 2004B-1, 5.250%, 4/01/17 – AMBAC Insured | | | 7/16 at 100.00 | | | | | | | | N/R | | | $ | 1,208,119 | |
| | | | | | |
| | 1,020 | | | Grand Valley State University, Michigan, General Revenue Bonds, Refunding Series 2014B, 3.625%, 12/01/32 | | | 12/24 at 100.00 | | | | | | | | A+ | | | | 1,079,986 | |
| | | | | | |
| | 2,675 | | | Kalamazoo Hospital Finance Authority, Michigan, Hospital Revenue Bonds, Bronson Methodist Hospital, Refunding Series 2003A, 5.000%, 5/15/20 – AGM Insured | | | 5/18 at 100.00 | | | | | | | | AA | | | | 2,905,077 | |
| | | | | | |
| | | | Marquette, Michigan, Electric Utility System Revenue Bonds, Refunding Series 2016A: | | | | | | | | | | | | | | | | |
| | 1,000 | | | 5.000%, 7/01/29 (WI/DD, Settling 5/12/16) | | | 7/26 at 100.00 | | | | | | | | A | | | | 1,222,600 | |
| | 355 | | | 5.000%, 7/01/30 (WI/DD, Settling 5/12/16) | | | 7/26 at 100.00 | | | | | | | | A | | | | 431,538 | |
| | 1,750 | | | 3.125%, 7/01/36 (WI/DD, Settling 5/12/16) | | | 7/26 at 100.00 | | | | | | | | A | | | | 1,729,455 | |
| | | | | | |
| | 6,574 | | | Michigan Finance Authority, Detroit, Michigan, Local Government Loan Program, Unlimited Tax General Obligation Bonds, Series 2014G-6A, 5.250%, 4/01/17 – AMBAC Insured | | | 7/16 at 100.00 | | | | | | | | A– | | | | 6,586,196 | |
| | | | | | |
| | 4,850 | | | Michigan Finance Authority, Local Government Loan Program Revenue Bonds, Detroit Water & Sewerage Department Sewage Disposal System Local Project, Second Lien Series 2015C, 5.000%, 7/01/34 | | | 7/25 at 100.00 | | | | | | | | BBB+ | | | | 5,609,947 | |
| | | | | | |
| | 3,540 | | | Michigan Hospital Finance Authority, Revenue Bonds, Ascension Health Group, Series 2010B, 5.000%, 11/15/23 | | | 11/19 at 100.00 | | | | | | | | AA+ | | | | 4,014,997 | |
| | | | | | |
| | 10,115 | | | Michigan Hospital Finance Authority, Revenue Bonds, Ascension Health Senior Credit Group, Refunding and Project Series 2010F-5, 1.500%, 11/15/47 (Mandatory put 3/15/17) | | | No Opt. Call | | | | | | | | AA+ | | | | 10,176,398 | |
| | | | | | |
| | | | Michigan Hospital Financing Authority, Revenue Bonds, Oakwood Obligated Group, Series 2007A: | | | | | | | | | | | | | | | | |
| | 2,000 | | | 5.000%, 7/15/18 (Pre-refunded 7/15/17) | | | 7/17 at 100.00 | | | | | | | | A1 (4) | | | | 2,106,020 | |
| | 3,530 | | | 5.000%, 7/15/19 (Pre-refunded 7/15/17) | | | 7/17 at 100.00 | | | | | | | | A1 (4) | | | | 3,717,125 | |
| | | | | | |
| | 1,850 | | | Michigan Municipal Bond Authority, AMBAC Insured Bonds, Series 2007B-A, 5.000%, 12/01/18 – AMBAC Insured | | | 6/17 at 100.00 | | | | | | | | N/R | | | | 1,899,969 | |
| | | | | | |
| | 5,000 | | | Michigan State Building Authority, Revenue Bonds, Facilities Program, Refunding Series 2011-I-A, 5.000%, 10/15/28 | | | 10/21 at 100.00 | | | | | | | | Aa2 | | | | 5,808,850 | |
| | | | | | |
| | 5,425 | | | Michigan State Building Authority, Revenue Bonds, Facilities Program, Refunding Series 2011-II-A, 5.000%, 10/15/28 | | | 10/21 at 100.00 | | | | | | | | Aa2 | | | | 6,302,602 | |
| | | | | | |
| | 1,600 | | | Michigan State Trunk Line Fund Refunding Bonds, Series 2009, 5.000%, 11/01/23 | | | 11/19 at 100.00 | | | | | | | | AA+ | | | | 1,798,416 | |
| | | | | | |
| | | | Monroe County Hospital Finance Authority, Michigan, Mercy Memorial Hospital Corporation Revenue Bonds, Series 2006: | | | | | | | | | | | | | | | | |
| | 1,260 | | | 5.500%, 6/01/17 (Pre-refunded 6/01/16) | | | 6/16 at 100.00 | | | | | | | | AA– (4) | | | | 1,265,468 | |
| | 1,330 | | | 5.500%, 6/01/18 (Pre-refunded 6/01/16) | | | 6/16 at 100.00 | | | | | | | | AA– (4) | | | | 1,335,772 | |
| | | | | | |
| | 4,750 | | | Romulus Community Schools, Wayne County, Michigan, General Obligation Bonds, Refunding Series 2013, 5.000%, 5/01/22 | | | No Opt. Call | | | | | | | | Aa1 | | | | 5,693,445 | |
| | | | | | |
| | | | Royal Oak Hospital Finance Authority, Michigan, Hospital Revenue Bonds, William Beaumont Hospital Obligated Group, Refunding Series 2014D: | | | | | | | | | | | | | | | | |
| | 1,000 | | | 5.000%, 9/01/26 | | | 3/24 at 100.00 | | | | | | | | A1 | | | | 1,201,490 | |
| | 2,000 | | | 5.000%, 9/01/27 | | | 3/24 at 100.00 | | | | | | | | A1 | | | | 2,380,760 | |
| | 2,555 | | | 5.000%, 9/01/28 | | | 3/24 at 100.00 | | | | | | | | A1 | | | | 3,024,686 | |
| | 3,770 | | | 5.000%, 9/01/29 | | | 3/24 at 100.00 | | | | | | | | A1 | | | | 4,425,792 | |
| | 5,000 | | | 5.000%, 9/01/30 | | | 3/24 at 100.00 | | | | | | | | A1 | | | | 5,847,800 | |
| | 2,270 | | | 5.000%, 9/01/31 | | | 3/24 at 100.00 | | | | | | | | A1 | | | | 2,628,751 | |
Nuveen Intermediate Duration Municipal Bond Fund (continued)
| | |
| Portfolio of Investments | | April 30, 2016 |
| | | | | | | | | | | | | | | | | | | | |
Principal
Amount (000) | | | Description (1) | | Optional Call
Provisions (2) | | | | | | | Ratings (3) | | | Value | |
| | | | | | |
| | | | Michigan (continued) | | | | | | | | | | | | | |
| | | | | | |
| | | | Walled Lake Consolidated School District, Oakland County, Michigan, General Obligation Bonds, Refunding Series 2011: | | | | | | | | | | | | | | | | |
| $ | 4,885 | | | 5.000%, 5/01/20 | | | No Opt. Call | | | | | | | | Aa1 | | | $ | 5,605,440 | |
| | 4,845 | | | 5.000%, 5/01/21 | | | 11/20 at 100.00 | | | | | | | | Aa1 | | | | 5,620,878 | |
| | 3,845 | | | 5.000%, 5/01/22 | | | 11/20 at 100.00 | | | | | | | | Aa1 | | | | 4,435,284 | |
| | | | | | |
| | 8,000 | | | Wayne County Airport Authority, Michigan, Revenue Bonds, Detroit Metropolitan Airport, Refunding Series 2010C, 5.000%, 12/01/16 | | | No Opt. Call | | | | | | | | A | | | | 8,200,800 | |
| | | | | | |
| | | | Wayne County Airport Authority, Michigan, Revenue Bonds, Detroit Metropolitan Wayne County Airport, Refunding Series 2015F: | | | | | | | | | | | | | | | | |
| | 3,750 | | | 5.000%, 12/01/32 (Alternative Minimum Tax) | | | 12/25 at 100.00 | | | | | | | | A | | | | 4,263,675 | |
| | 5,295 | | | 5.000%, 12/01/33 (Alternative Minimum Tax) | | | 12/25 at 100.00 | | | | | | | | A | | | | 5,997,011 | |
| | 5,000 | | | 5.000%, 12/01/34 (Alternative Minimum Tax) | | | 12/25 at 100.00 | | | | | | | | A | | | | 5,649,800 | |
| | | | | | |
| | 1,300 | | | Western Michigan University, General Revenue Bonds, Refunding Series 2008, 5.000%, 11/15/23 (Pre-refunded 5/15/18) – AGM Insured | | | 5/18 at 100.00 | | | | | | | | AA (4) | | | | 1,413,139 | |
| | 122,715 | | | Total Michigan | | | | | | | | | | | | | | | 132,209,168 | |
| | | | | | |
| | | | Minnesota – 0.7% | | | | | | | | | | | | | |
| | | | | | |
| | 1,710 | | | Cass Lake Independent School District 115, Minnesota, General Obligation Bonds, School Building Refunding Series 2010A, 5.000%, 2/01/27 | | | 2/20 at 100.00 | | | | | | | | AA+ | | | | 1,934,865 | |
| | | | | | |
| | 500 | | | Center City, Minnesota, Health Care Facilities Revenue Bonds, Hazelden Betty Ford Foundation Project, Series 2014, 5.000%, 11/01/29 | | | 11/24 at 100.00 | | | | | | | | A3 | | | | 597,145 | |
| | | | | | |
| | 2,155 | | | Minneapolis, Minnesota, Health Care System Revenue Bonds, Fairview Hospital and Healthcare Services, Series 2008A, 6.375%, 11/15/23 (Pre-refunded 11/15/18) | | | 11/18 at 100.00 | | | | | | | | A+ (4) | | | | 2,454,933 | |
| | | | | | |
| | 2,650 | | | Minneapolis, Minnesota, Revenue Bonds, National Marrow Donor Program Project, Series 2010, 5.000%, 8/01/18 (ETM) | | | No Opt. Call | | | | | | | | BBB+ (4) | | | | 2,900,664 | |
| | | | | | |
| | 1,240 | | | Minneapolis, Minnesota, Revenue Bonds, National Marrow Donor Program Project, Series 2010, 4.250%, 8/01/20 (Pre-refunded 8/01/18) | | | 8/18 at 100.00 | | | | | | | | BBB+ (4) | | | | 1,336,534 | |
| | | | | | |
| | | | Minneapolis-St. Paul Metropolitan Airports Commission, Minnesota, Airport Revenue Bonds, Subordinate Lien, Refunding Series 2014A: | | | | | | | | | | | | | | | | |
| | 2,500 | | | 5.000%, 1/01/25 | | | 1/24 at 100.00 | | | | | | | | A+ | | | | 3,091,000 | |
| | 3,000 | | | 5.000%, 1/01/32 | | | 1/24 at 100.00 | | | | | | | | A+ | | | | 3,564,300 | |
| | | | | | |
| | | | Minnesota Higher Education Facilities Authority, Revenue Bonds, Bethel University, Refunding Series 2007-6-R: | | | | | | | | | | | | | | | | |
| | 1,255 | | | 5.500%, 5/01/20 | | | 5/17 at 100.00 | | | | | | | | N/R | | | | 1,286,601 | |
| | 815 | | | 5.500%, 5/01/21 | | | 5/17 at 100.00 | | | | | | | | N/R | | | | 835,196 | |
| | | | | | |
| | 7,465 | | | Minnesota Public Facilities Authority, State Clean Water Revolving Fund Revenue Bonds, Series 2016A, 5.000%, 3/01/17 | | | No Opt. Call | | | | | | | | AAA | | | | 7,745,161 | |
| | | | | | |
| | 425 | | | Northern Municipal Power Agency, Minnesota, Electric System Revenue Bonds, Series 2013A, 4.000%, 1/01/28 | | | 1/23 at 100.00 | | | | | | | | A– | | | | 469,719 | |
| | | | | | |
| | 650 | | | Rochester, Minnesota, Health Care Facilities Revenue Bonds, Olmsted Medical Center Project, Series 2013, 5.000%, 7/01/33 | | | 7/23 at 100.00 | | | | | | | | A– | | | | 745,271 | |
| | | | | | |
| | | | Saint Cloud, Minnesota, Health Care Revenue Bonds, CentraCare Health System, Refunding Series 2014B: | | | | | | | | | | | | | | | | |
| | 2,000 | | | 5.000%, 5/01/23 | | | No Opt. Call | | | | | | | | A1 | | | | 2,454,200 | |
| | 1,500 | | | 5.000%, 5/01/24 | | | No Opt. Call | | | | | | | | A1 | | | | 1,857,435 | |
| | | | | | | | | | | | | | | | | | | | |
Principal
Amount (000) | | | Description (1) | | Optional Call
Provisions (2) | | | | | | | Ratings (3) | | | Value | |
| | | | | | |
| | | | Minnesota (continued) | | | | | | | | | | | | | |
| | | | | | |
| $ | 1,000 | | | Saint Paul Housing and Redevelopment Authority, Minnesota, Health Care Facility Revenue Bonds, HealthPartners Obligated Group, Series 2006, 5.250%, 5/15/21 (Pre-refunded 11/15/16) | | | 11/16 at 100.00 | | | | | | | | Aaa | | | $ | 1,025,780 | |
| | | | | | |
| | 1,000 | | | Saint Paul Housing and Redevelopment Authority, Minnesota, Health Care Revenue Bonds, Allina Health System, Series 2009A-1, 5.000%, 11/15/24 | | | 11/19 at 100.00 | | | | | | | | AA– | | | | 1,116,330 | |
| | | | | | |
| | 475 | | | Saint Paul Port Authority, Minnesota, Lease Revenue Bonds, Regions Hospital Parking Ramp Project, Series 2007-1, 5.000%, 8/01/21 | | | 8/16 at 100.00 | | | | | | | | N/R | | | | 477,484 | |
| | 30,340 | | | Total Minnesota | | | | | | | | | | | | | | | 33,892,618 | |
| | | | | | |
| | | | Mississippi – 0.5% | | | | | | | | | | | | | |
| | | | | | |
| | 5,370 | | | Mississippi Business Finance Corporation, Pollution Control Revenue Refunding Bonds, System Energy Resources Inc. Project, Series 1998, 5.875%, 4/01/22 | | | 10/16 at 100.00 | | | | | | | | BBB | | | | 5,542,216 | |
| | | | | | |
| | 10,000 | | | Mississippi Business Finance Corporation, Revenue Bonds, Mississippi Power Company Project, First Series 2010, 1.625%, 12/01/40 (Mandatory put 1/12/18) | | | No Opt. Call | | | | | | | | BBB+ | | | | 10,070,600 | |
| | | | | | |
| | 1,440 | | | Mississippi Hospital Equipment and Facilities Authority, Revenue Refunding and Improvement Bonds, Mississippi Baptist Health System Inc., Series 2007A, 5.000%, 8/15/16 | | | No Opt. Call | | | | | | | | BBB+ | | | | 1,456,589 | |
| | | | | | |
| | 8,860 | | | Mississippi State, General Obligation Bonds, Series 2013B, 5.000%, 12/01/28 | | | 12/23 at 100.00 | | | | | | | | AA+ | | | | 10,906,128 | |
| | 25,670 | | | Total Mississippi | | | | | | | | | | | | | | | 27,975,533 | |
| | | | | | |
| | | | Missouri – 1.5% | | | | | | | | | | | | | |
| | | | | | |
| | | | Cape Girardeau County Industrial Development Authority, Missouri, Health Facilities Revenue Bonds, Southeast Missouri Hospital Association, Series 2007: | | | | | | | | | | | | | | | | |
| | 1,245 | | | 5.000%, 6/01/18 | | | 6/17 at 100.00 | | | | | | | | B | | | | 1,248,474 | |
| | 3,030 | | | 5.000%, 6/01/20 | | | 6/17 at 100.00 | | | | | | | | B | | | | 3,038,636 | |
| | | | | | |
| | 1,555 | | | Cape Girardeau County Industrial Development Authority, Missouri, Health Facilities Revenue Bonds, Southeast health, Series 2016A, 6.000%, 3/01/33 | | | 3/23 at 103.00 | | | | | | | | N/R | | | | 1,573,271 | |
| | | | | | |
| | | | Great Rivers Greenway Metropolitan Park & Recreation District, Missouri, Sales Tax Appropriation Bonds, Gateway Arch Project, Series 2014: | | | | | | | | | | | | | | | | |
| | 1,100 | | | 3.000%, 12/30/24 | | | 12/23 at 100.00 | | | | | | | | A+ | | | | 1,204,082 | |
| | 2,000 | | | 4.125%, 12/30/33 | | | 12/23 at 100.00 | | | | | | | | A+ | | | | 2,186,760 | |
| | | | | | |
| | 1,000 | | | Grundy County Industrial Development Authority, Missouri, Health Facility Revenue Bonds, Wright Memorial Hospital, Series 2009, 5.600%, 9/01/21 | | | 9/19 at 100.00 | | | | | | | | BBB– | | | | 1,069,750 | |
| | | | | | |
| | 505 | | | Kansas City, Missouri, Special Obligation Bonds, East Village Project, Series 2008B, 5.000%, 4/15/22 (Pre-refunded 4/15/18) – AGC Insured | | | 4/18 at 100.00 | | | | | | | | AA (4) | | | | 546,930 | |
| | | | | | |
| | 2,000 | | | Missouri Development Finance Board, Infrastructure Facilities Revenue Bonds, City of Independence, Crackerneck Creek Project, Series 2008B, 5.125%, 3/01/22 (Pre-refunded 3/01/18) | | | 3/18 at 100.00 | | | | | | | | A– (4) | | | | 2,160,700 | |
| | | | | | |
| | 1,130 | | | Missouri Development Finance Board, Research Facility Revenue Bonds, Midwest Research Institute Project, Series 2007, 5.000%, 11/01/16 (ETM) | | | No Opt. Call | | | | | | | | N/R (4) | | | | 1,155,606 | |
| | | | | | |
| | 1,400 | | | Missouri Health and Educational Facilities Authority, Educational Facilities Revenue Bonds, Saint Louis College of Pharmacy, Series 2013, 5.250%, 5/01/33 | | | 5/23 at 100.00 | | | | | | | | BBB+ | | | | 1,576,974 | |
| | | | | | |
| | 220 | | | Missouri Health and Educational Facilities Authority, Educational Facilities Revenue Bonds, Saint Louis College of Pharmacy, Series 2015B, 4.000%, 5/01/32 | | | 11/23 at 100.00 | | | | | | | | BBB | | | | 227,500 | |
| | | | | | |
| | 1,250 | | | Missouri Health and Educational Facilities Authority, Health Facilities Revenue Bonds, SSM Health Care, Series 2014A, 4.000%, 6/01/33 | | | 6/24 at 100.00 | | | | | | | | AA– | | | | 1,336,838 | |
| | | | | | |
| | 1,390 | | | Missouri Health and Educational Facilities Authority, Revenue Bonds, A.T. Still University of Health Sciences, Series 2014, 4.250%, 10/01/32 | | | 10/23 at 100.00 | | | | | | | | A– | | | | 1,522,245 | |
Nuveen Intermediate Duration Municipal Bond Fund (continued)
| | |
| Portfolio of Investments | | April 30, 2016 |
| | | | | | | | | | | | | | | | | | | | |
Principal
Amount (000) | | | Description (1) | | Optional Call
Provisions (2) | | | | | | | Ratings (3) | | | Value | |
| | | | | | |
| | | | Missouri (continued) | | | | | | | | | | | | | |
| | | | | | |
| $ | 430 | | | Missouri Health and Educational Facilities Authority, Revenue Bonds, Lutheran Senior Services Projects, Series 2011, 4.400%, 2/01/19 | | | No Opt. Call | | | | | | | | BBB+ | | | $ | 462,680 | |
| | | | | | |
| | | | Missouri Joint Municipal Electric Utility Commission, Power Project Revenue Bonds, Iatan 2 Project, Refunding Series 2014A: | | | | | | | | | | | | | | | | |
| | 1,320 | | | 5.000%, 1/01/25 | | | 1/24 at 100.00 | | | | | | | | A2 | | | | 1,617,158 | |
| | 2,525 | | | 5.000%, 1/01/26 | | | 1/24 at 100.00 | | | | | | | | A2 | | | | 3,065,224 | |
| | 1,000 | | | 5.000%, 1/01/32 | | | 1/24 at 100.00 | | | | | | | | A2 | | | | 1,171,990 | |
| | | | | | |
| | 4,150 | | | Missouri Joint Municipal Electric Utility Commission, Power Project Revenue Bonds, Plum Point Project, Refunding Series 2014A, 5.000%, 1/01/23 | | | No Opt. Call | | | | | | | | A | | | | 5,010,295 | |
| | | | | | |
| | 4,330 | | | Missouri Joint Municipal Electric Utility Commission, Prairie State Power Project Revenue Bonds, Series 2007A, 5.000%, 1/01/18 (Pre-refunded 1/01/17) – AMBAC Insured | | | 1/17 at 100.00 | | | | | | | | A2 (4) | | | | 4,460,117 | |
| | | | | | |
| | 370 | | | Osage Beach, Missouri, Tax Increment Revenue Bonds, Prewitts Point Transportation Development District, Series 2006, 4.800%, 5/01/16 | | | No Opt. Call | | | | | | | | N/R | | | | 370,011 | |
| | | | | | |
| | | | Saint Louis, Missouri, Airport Revenue Bonds, Lambert-St. Louis International Airport, Series 2005: | | | | | | | | | | | | | | | | |
| | 11,500 | | | 5.500%, 7/01/17 – NPFG Insured | | | No Opt. Call | | | | | | | | AA– | | | | 12,137,560 | |
| | 17,305 | | | 5.500%, 7/01/19 – NPFG Insured | | | No Opt. Call | | | | | | | | AA– | | | | 19,683,745 | |
| | | | | | |
| | 1,200 | | | Saint Louis, Missouri, Airport Revenue Bonds, Lambert-St. Louis International Airport, Series 2007A, 5.000%, 7/01/25 – AGM Insured | | | No Opt. Call | | | | | | | | AA | | | | 1,254,060 | |
| | | | | | |
| | 7,370 | | | Sikeston, Missouri, Electric System Revenue Refunding Bonds, Series 2012, 5.000%, 6/01/18 | | | No Opt. Call | | | | | | | | BBB+ | | | | 7,893,196 | |
| | | | | | |
| | 500 | | | St. Joseph Industrial Development Authority, Missouri, Tax Increment Bonds, Shoppes at North Village Project, Series 2005A, 5.100%, 11/01/19 | | | No Opt. Call | | | | | | | | N/R | | | | 500,490 | |
| | | | | | |
| | 1,195 | | | Stoddard County Industrial Development Authority, Missouri, Health Facility Revenue Bonds, Southeast health, Series 2016B, 6.000%, 3/01/37 | | | 3/23 at 103.00 | | | | | | | | N/R | | | | 1,209,041 | |
| | 71,020 | | | Total Missouri | | | | | | | | | | | | | | | 77,683,333 | |
| | | | | | |
| | | | Montana – 0.1% | | | | | | | | | | | | | |
| | | | | | |
| | 490 | | | Montana Facilities Finance Authority, Revenue Bonds, Saint John’s Lutheran Ministries Project, Series 2006A, 5.750%, 5/15/16 | | | No Opt. Call | | | | | | | | N/R | | | | 491,049 | |
| | | | | | |
| | 2,500 | | | Montana Facilities Finance Authority, Revenue Bonds, Sisters of Charity of Leavenworth Health Services Corporation, Camposite Deal Series 2010B, 5.000%, 1/01/24 | | | 1/20 at 100.00 | | | | | | | | AA– | | | | 2,843,150 | |
| | 2,990 | | | Total Montana | | | | | | | | | | | | | | | 3,334,199 | |
| | | | | | |
| | | | Nebraska – 0.8% | | | | | | | | | | | | | |
| | | | | | |
| | 1,130 | | | Douglas County Hospital Authority 2, Nebraska, Health Facilities Revenue Bonds, Immanuel Obligated Group, Refunding Series 2010, 5.125%, 1/01/23 | | | 1/20 at 100.00 | | | | | | | | AA | | | | 1,236,955 | |
| | | | | | |
| | 9,350 | | | Douglas County Hospital Authority 2, Nebraska, Hospital Revenue Bonds, Madonna Rehabilitation Hospital Project, Series 2014, 5.000%, 5/15/44 | | | 5/24 at 100.00 | | | | | | | | BBB+ | | | | 10,384,578 | |
| | | | | | |
| | 645 | | | Douglas County Hospital Authority 3, Nebraska, Health Facilities Revenue Bonds, Nebraska Methodist Health System, Refunding Series 2008, 5.750%, 11/01/28 (Pre-refunded 11/01/18) | | | 11/18 at 100.00 | | | | | | | | A– (4) | | | | 724,354 | |
| | | | | | |
| | 665 | | | Douglas County School District 10 Elkhorn, Nebraska, General Obligation Bonds, Public Schools Series 2012, 4.000%, 6/15/23 | | | 6/22 at 100.00 | | | | | | | | AA– | | | | 764,504 | |
| | | | | | |
| | | | Douglas County School District 10 Elkhorn, Nebraska, General Obligation Bonds, Public Schools Series 2015: | | | | | | | | | | | | | | | | |
| | 890 | | | 5.000%, 12/15/21 | | | No Opt. Call | | | | | | | | AA– | | | | 1,069,887 | |
| | 370 | | | 5.000%, 12/15/22 | | | No Opt. Call | | | | | | | | AA– | | | | 452,029 | |
| | | | | | | | | | | | | | | | | | | | |
Principal
Amount (000) | | | Description (1) | | Optional Call
Provisions (2) | | | | | | | Ratings (3) | | | Value | |
| | | | | | |
| | | | Nebraska (continued) | | | | | | | | | | | | | |
| | | | | | |
| | | | Lancaster County Hospital Authority 1, Nebraska, Health Facilities Revenue Bonds, Immanuel Obligated Group, Refunding Series 2010: | | | | | | | | | | | | | | | | |
| $ | 735 | | | 4.750%, 1/01/19 | | | No Opt. Call | | | | | | | | AA | | | $ | 807,081 | |
| | 1,000 | | | 5.125%, 1/01/23 | | | 1/20 at 100.00 | | | | | | | | AA | | | | 1,132,860 | |
| | | | | | |
| | 2,000 | | | Lancaster County Hospital Authority 1, Nebraska, Hospital Revenue Bonds, BryanLGH Medical Center Project, Refunding Series 2006, 4.000%, 6/01/18 | | | 6/16 at 100.00 | | | | | | | | AA– | | | | 2,005,020 | |
| | | | | | |
| | 5,910 | | | Lincoln County Hospital Authority 1, Nebraska, Hospital Revenue and Refunding Bonds, Great Plains Regional Medical Center Project, Series 2012, 5.000%, 11/01/32 | | | No Opt. Call | | | | | | | | A– | | | | 6,625,169 | |
| | | | | | |
| | | | Nebraska Public Power District, General Revenue Bonds, Series 2012A: | | | | | | | | | | | | | | | | |
| | 1,465 | | | 5.000%, 1/01/23 | | | 1/22 at 100.00 | | | | | | | | A+ | | | | 1,767,566 | |
| | 1,500 | | | 5.000%, 1/01/24 | | | 1/22 at 100.00 | | | | | | | | A+ | | | | 1,805,235 | |
| | 950 | | | 5.000%, 1/01/25 | | | 1/22 at 100.00 | | | | | | | | A+ | | | | 1,139,288 | |
| | | | | | |
| | 600 | | | Papillion-LaVista School District 27, Sarpy County, Nebraska, General Obligation Bonds, Series 2014, 5.000%, 12/01/22 | | | No Opt. Call | | | | | | | | Aa2 | | | | 736,656 | |
| | | | | | |
| | | | Public Power Generation Agency, Nebraska, Whelan Energy Center Unit 2 Revenue Bonds, Refunding Series 2016A: | | | | | | | | | | | | | | | | |
| | 8,000 | | | 5.000%, 1/01/32 (WI/DD, Settling 5/25/16) | | | 7/26 at 100.00 | | | | | | | | A2 | | | | 9,577,680 | |
| | 1,310 | | | 3.250%, 1/01/36 (WI/DD, Settling 5/25/16) | | | 7/26 at 100.00 | | | | | | | | A2 | | | | 1,285,700 | |
| | 36,520 | | | Total Nebraska | | | | | | | | | | | | | | | 41,514,562 | |
| | | | | | |
| | | | Nevada – 3.4% | | | | | | | | | | | | | |
| | | | | | |
| | 3,130 | | | Clark County School District, Nevada, General Obligation Bonds, Series 2008A, 5.000%, 6/15/24 | | | 6/18 at 100.00 | | | | | | | | Ba1 | | | | 3,399,900 | |
| | | | | | |
| | | | Clark County, Nevada, Airport Revenue Bonds, Jet Aviation Fuel Tax, Refunding Series 2013A: | | | | | | | | | | | Ba1 | | | | | |
| | 2,000 | | | 5.000%, 7/01/22 (Alternative Minimum Tax) | | | No Opt. Call | | | | | | | | Ba1 | | | | 2,369,080 | |
| | 1,015 | | | 5.000%, 7/01/23 (Alternative Minimum Tax) | | | 1/23 at 100.00 | | | | | | | | A3 | | | | 1,210,601 | |
| | 1,905 | | | 5.000%, 7/01/24 (Alternative Minimum Tax) | | | 1/23 at 100.00 | | | | | | | | Baa3 | | | | 2,251,805 | |
| | | | | | |
| | 21,000 | | | Clark County, Nevada, Airport Revenue Bonds, Subordinate Lien Series 2010B, 5.750%, 7/01/42 | | | 1/20 at 100.00 | | | | | | | | Baa1 | | | | 24,389,190 | |
| | | | | | |
| | 25,495 | | | Clark County, Nevada, General Obligation Bank Bonds, Southern Nevada Water Authority Loan, Series 2008, 5.000%, 6/01/38 | | | No Opt. Call | | | | | | | | Baa1 | | | | 27,501,202 | |
| | | | | | |
| | 24,505 | | | Clark County, Nevada, General Obligation Bonds, Bond Bank Refunding Series 2016A, 5.000%, 11/01/18 | | | No Opt. Call | | | | | | | | Baa1 | | | | 27,072,144 | |
| | | | | | |
| | 13,125 | | | Las Vegas Valley Water District, Nevada, General Obligation Bonds, Refunding Series 2015B, 5.000%, 12/01/26 | | | 6/25 at 100.00 | | | | | | | | Aa1 | | | | 16,563,619 | |
| | | | | | |
| | | | Las Vegas Valley Water District, Nevada, General Obligation Bonds, Water & Refunding Series 2011C: | | | | | | | | | | | | | | | | |
| | 1,550 | | | 5.000%, 6/01/23 | | | 6/21 at 100.00 | | | | | | | | Aa1 | | | | 1,842,935 | |
| | 1,000 | | | 5.000%, 6/01/24 | | | 6/21 at 100.00 | | | | | | | | Aa1 | | | | 1,186,270 | |
| | 12,450 | | | 5.000%, 6/01/25 | | | 6/21 at 100.00 | | | | | | | | Aa1 | | | | 14,721,752 | |
| | | | | | |
| | 5,685 | | | Las Vegas Valley Water District, Nevada, General Obligation Bonds, Water Improvement Series 2006A, 5.000%, 6/01/25 (Pre-refunded 6/01/16) – AGM Insured | | | 6/16 at 100.00 | | | | | | | | Aa1 (4) | | | | 5,708,138 | |
| | | | | | |
| | | | Las Vegas Valley Water District, Nevada, General Obligation Bonds, Water Series 2012B: | | | | | | | | | | | | | | | | |
| | 2,035 | | | 5.000%, 6/01/24 | | | 6/22 at 100.00 | | | | | | | | Aa1 | | | | 2,478,732 | |
| | 1,500 | | | 5.000%, 6/01/25 | | | 6/22 at 100.00 | | | | | | | | Aa1 | | | | 1,826,415 | |
| | 2,000 | | | 5.000%, 6/01/26 | | | 6/22 at 100.00 | | | | | | | | Aa1 | | | | 2,425,980 | |
| | | | | | |
| | | | Las Vegas, Nevada, Local Improvement Bonds, Special Improvement District 607 Providence, Refunding Series 2013: | | | | | | | | | | | | | | | | |
| | 95 | | | 4.000%, 6/01/19 | | | No Opt. Call | | | | | | | | N/R | | | | 99,156 | |
Nuveen Intermediate Duration Municipal Bond Fund (continued)
| | |
| Portfolio of Investments | | April 30, 2016 |
| | | | | | | | | | | | | | | | | | | | |
Principal
Amount (000) | | | Description (1) | | Optional Call
Provisions (2) | | | | | | | Ratings (3) | | | Value | |
| | | | | | |
| | | | Nevada (continued) | | | | | | | | | | | | | |
| $ | 50 | | | 4.000%, 6/01/20 | | | No Opt. Call | | | | | | | | N/R | | | $ | 52,804 | |
| | 400 | | | 5.000%, 6/01/22 | | | No Opt. Call | | | | | | | | N/R | | | | 435,192 | |
| | | | | | |
| | 4,660 | | | Nevada State, General Obligation Bonds, Capital Improvement & Cultural Affairs, Refunding Series 2012B, 5.000%, 8/01/22 | | | No Opt. Call | | | | | | | | AA+ | | | | 5,698,108 | |
| | | | | | |
| | 11,130 | | | Nevada State, General Obligation Bonds, Capital Improvement & Cultural Affairs, Refunding Series 2013D-1, 5.000%, 3/01/22 | | | No Opt. Call | | | | | | | | AA+ | | | | 13,476,761 | |
| | | | | | |
| | | | Nevada State, Motor Vehicle Fuel Tax Highway Improvement Revenue Bonds, Refunding Series 2016: | | | | | | | | | | | | | | | | |
| | 5,905 | | | 5.000%, 12/01/17 | | | No Opt. Call | | | | | | | | AAA | | | | 6,307,544 | |
| | 3,100 | | | 5.000%, 12/01/18 | | | No Opt. Call | | | | | | | | AAA | | | | 3,434,180 | |
| | | | | | |
| | | | Washoe County, Nevada, General Obligation Bonds, Reno-Sparks Convention & Visitors Authority, Refunding Series 2011: | | | | | | | | | | | | | | | | |
| | 2,265 | | | 5.000%, 7/01/22 | | | 7/21 at 100.00 | | | | | | | | AA | | | | 2,678,521 | |
| | 4,710 | | | 5.000%, 7/01/23 | | | 7/21 at 100.00 | | | | | | | | AA | | | | 5,512,019 | |
| | | | | | |
| | 1,510 | | | Washoe County, Nevada, Highway Revenue, Motor Vehicle Fuel Tax Bonds, Series 2013, 5.000%, 2/01/43 | | | 2/19 at 100.00 | | | | | | | | A+ | | | | 1,654,990 | |
| | 152,220 | | | Total Nevada | | | | | | | | | | | | | | | 174,297,038 | |
| | | | | | |
| | | | New Hampshire – 0.2% | | | | | | | | | | | | | |
| | | | | | |
| | 895 | | | Business Finance Authority of the State of New Hampshire, Water Facility Revenue Bonds, Pennichuck Water Works, Inc. Project ,Series 2015A, 4.250%, 1/01/36 (Alternative Minimum Tax) | | | 1/26 at 100.00 | | | | | | | | A+ | | | | 935,418 | |
| | | | | | |
| | 140 | | | New Hampshire Health and Education Facilities Authority, Hospital Revenue Bonds, Catholic Medical Center, Series 2006, 5.000%, 7/01/16 | | | No Opt. Call | | | | | | | | A– | | | | 140,993 | |
| | | | | | |
| | 305 | | | New Hampshire Health and Education Facilities Authority, Hospital Revenue Bonds, Catholic Medical Center, Series 2006, 5.000%, 7/01/16 (ETM) | | | No Opt. Call | | | | | | | | N/R–4 | | | | 307,382 | |
| | | | | | |
| | 5,660 | | | New Hampshire Health and Education Facilities Authority, Revenue Bonds, Dartmouth College, Series 2009, 5.250%, 6/01/39 | | | 6/19 at 100.00 | | | | | | | | AA+ | | | | 6,396,819 | |
| | | | | | |
| | 1,000 | | | New Hampshire Health and Education Facilities Authority, Revenue Bonds, The Memorial Hospital, Series 2006, 5.250%, 6/01/21 | | | 6/16 at 100.00 | | | | | | | | BBB | | | | 1,003,110 | |
| | | | | | |
| | 1,300 | | | New Hampshire Municipal Bond Bank, Non-State Guaranteed Bonds, Refunding Series 2007A, 4.500%, 2/15/20 – NPFG Insured | | | 8/17 at 100.00 | | | | | | | | AA+ | | | | 1,360,346 | |
| | 9,300 | | | Total New Hampshire | | | | | | | | | | | | | | | 10,144,068 | |
| | | | | | |
| | | | New Jersey – 4.3% | | | | | | | | | | | | | |
| | | | | | |
| | 8,535 | | | Gloucester County Pollution Control Financing Authority, New Jersey, Pollution Control Revenue Bonds, Logan Project, Refunding Series 2014A, 5.000%, 12/01/24 (Alternative Minimum Tax) | | | No Opt. Call | | | | | | | | BBB– | | | | 9,754,225 | |
| | | | | | |
| | | | New Jersey Economic Development Authority, Cigarette Tax Revenue Bonds, Series 2004: | | | | | | | | | | | | | | | | |
| | 2,135 | | | 5.500%, 6/15/16 (ETM) | | | No Opt. Call | | | | | | | | Aaa | | | | 2,148,856 | |
| | 4,320 | | | 5.500%, 6/15/16 – RAAI Insured (ETM) | | | No Opt. Call | | | | | | | | Aaa | | | | 4,348,037 | |
| | | | | | |
| | | | New Jersey Economic Development Authority, Cigarette Tax Revenue Refunding Bonds, Series 2012: | | | | | | | | | | | | | | | | |
| | 1,100 | | | 5.000%, 6/15/17 | | | No Opt. Call | | | | | | | | BBB+ | | | | 1,139,347 | |
| | 5,155 | | | 5.000%, 6/15/19 | | | No Opt. Call | | | | | | | | BBB+ | | | | 5,589,257 | |
| | 5,905 | | | 5.000%, 6/15/20 | | | No Opt. Call | | | | | | | | BBB+ | | | | 6,495,618 | |
| | 13,995 | | | 5.000%, 6/15/21 | | | No Opt. Call | | | | | | | | BBB+ | | | | 15,617,300 | |
| | 2,430 | | | 5.000%, 6/15/22 | | | No Opt. Call | | | | | | | | BBB+ | | | | 2,727,335 | |
| | 1,000 | | | 5.000%, 6/15/22 | | | No Opt. Call | | | | | | | | AA | | | | 1,162,730 | |
| | | | | | | | | | | | | | | | | | | | |
Principal
Amount (000) | | | Description (1) | | Optional Call
Provisions (2) | | | | | | | Ratings (3) | | | Value | |
| | | | | | |
| | | | New Jersey (continued) | | | | | | | | | | | | | |
| $ | 7,180 | | | 5.000%, 6/15/23 | | | 6/22 at 100.00 | | | | | | | | BBB+ | | | $ | 8,001,392 | |
| | 2,965 | | | 5.000%, 6/15/24 | | | 6/22 at 100.00 | | | | | | | | BBB+ | | | | 3,283,293 | |
| | 7,580 | | | 5.000%, 6/15/25 | | | 6/22 at 100.00 | | | | | | | | BBB+ | | | | 8,291,383 | |
| | 4,950 | | | 5.000%, 6/15/26 | | | 6/22 at 100.00 | | | | | | | | BBB+ | | | | 5,378,670 | |
| | 900 | | | 4.250%, 6/15/27 | | | 6/22 at 100.00 | | | | | | | | BBB+ | | | | 929,070 | |
| | 4,625 | | | 5.000%, 6/15/28 | | | No Opt. Call | | | | | | | | BBB+ | | | | 4,989,543 | |
| | | | | | |
| | | | New Jersey Economic Development Authority, Private Activity Bonds, The Goethals Bridge Replacement Project, Series 2013: | | | | | | | | | | | | | | | | |
| | 1,350 | | | 5.000%, 1/01/28 (Alternative Minimum Tax) | | | 1/24 at 100.00 | | | | | | | | BBB | | | | 1,525,865 | |
| | 2,215 | | | 5.000%, 1/01/31 – AGM Insured (Alternative Minimum Tax) | | | 1/24 at 100.00 | | | | | | | | AA | | | | 2,504,190 | |
| | | | | | |
| | 25,000 | | | New Jersey Economic Development Authority, School Facilities Construction Financing Program Bonds, Refunding Series 2015XX, 5.000%, 6/15/27 | | | 6/25 at 100.00 | | | | | | | | A– | | | | 27,471,250 | |
| | | | | | |
| | 1,340 | | | New Jersey Transportation Trust Fund Authority, Transportation System Bonds, Refunding Series 2006C, 0.000%, 12/15/31 – FGIC Insured | | | No Opt. Call | | | | | | | | AA– | | | | 716,645 | |
| | | | | | |
| | 10,050 | | | New Jersey Transportation Trust Fund Authority, Transportation System Bonds, Series 2010D, 5.000%, 12/15/23 | | | No Opt. Call | | | | | | | | A– | | | | 11,290,271 | |
| | | | | | |
| | 3,670 | | | New Jersey Transportation Trust Fund Authority, Transportation System Bonds, Series 2011B, 5.500%, 6/15/31 | | | 6/21 at 100.00 | | | | | | | | A– | | | | 4,091,867 | |
| | | | | | |
| | | | New Jersey Transportation Trust Fund Authority, Transportation System Bonds, Series 2012AA: | | | | | | | | | | | | | | | | |
| | 20,200 | | | 5.000%, 6/15/21 | | | No Opt. Call | | | | | | | | A– | | | | 22,334,130 | |
| | 14,000 | | | 5.000%, 6/15/22 | | | No Opt. Call | | | | | | | | A– | | | | 15,590,960 | |
| | | | | | |
| | | | New Jersey Transportation Trust Fund Authority, Transportation System Bonds, Series 2015AA: | | | | | | | | | | | | | | | | |
| | 1,810 | | | 5.250%, 6/15/33 | | | 6/25 at 100.00 | | | | | | | | A– | | | | 2,000,448 | |
| | 1,850 | | | 5.250%, 6/15/34 | | | 6/25 at 100.00 | | | | | | | | A– | | | | 2,038,682 | |
| | | | | | |
| | 5,615 | | | Salem County Pollution Control Financing Authority, New Jersey, Pollution Control Revenue Bonds, Chambers Project, Refunding Series 2014A, 5.000%, 12/01/23 (Alternative Minimum Tax) | | | No Opt. Call | | | | | | | | BBB– | | | | 6,288,800 | |
| | | | | | |
| | | | South Jersey Port Corporation, New Jersey, Marine Terminal Revenue Bonds, Refunding Series 2012Q: | | | | | | | | | | | | | | | | |
| | 4,505 | | | 3.000%, 1/01/20 | | | No Opt. Call | | | | | | | | A3 | | | | 4,572,395 | |
| | 2,950 | | | 3.000%, 1/01/21 | | | No Opt. Call | | | | | | | | A3 | | | | 2,978,173 | |
| | | | | | |
| | | | Tobacco Settlement Financing Corporation, New Jersey, Tobacco Settlement Asset-Backed Bonds, Series 2007-1A: | | | | | | | | | | | | | | | | |
| | 9,600 | | | 4.500%, 6/01/23 | | | 6/17 at 100.00 | | | | | | | | BB | | | | 9,768,384 | |
| | 11,380 | | | 4.625%, 6/01/26 | | | 6/17 at 100.00 | | | | | | | | B+ | | | | 11,470,585 | |
| | 20,570 | | | 5.000%, 6/01/29 | | | 6/17 at 100.00 | | | | | | | | B | | | | 20,579,257 | |
| | 208,880 | | | Total New Jersey | | | | | | | | | | | | | | | 225,077,958 | |
| | | | | | |
| | | | New Mexico – 0.7% | | | | | | | | | | | | | |
| | | | | | |
| | | | Albuquerque, New Mexico, General Obligation Bonds, General Purpose Series 2016A: | | | | | | | | | | | | | | | | |
| | 6,023 | | | 5.000%, 7/01/17 | | | No Opt. Call | | | | | | | | AAA | | | | 6,333,486 | |
| | 6,000 | | | 5.000%, 7/01/18 | | | No Opt. Call | | | | | | | | AAA | | | | 6,559,260 | |
| | | | | | |
| | 3,990 | | | New Mexico Finance Authority, Public Project Revolving Fund Revenue Bonds, Senior Lien Series 2016A, 5.000%, 6/01/20 | | | No Opt. Call | | | | | | | | AAA | | | | 4,634,505 | |
| | | | | | |
| | 14,850 | | | New Mexico Municipal Energy Acquisition Authority, Gas Supply Revenue Bonds, Refunding Sub-Series 2014A, 5.000%, 11/01/39 (Mandatory put 8/01/19) | | | 8/19 at 100.00 | | | | | | | | Aa3 | | | | 16,576,164 | |
| | 30,863 | | | Total New Mexico | | | | | | | | | | | | | | | 34,103,415 | |
Nuveen Intermediate Duration Municipal Bond Fund (continued)
| | |
| Portfolio of Investments | | April 30, 2016 |
| | | | | | | | | | | | | | | | | | | | |
Principal
Amount (000) | | | Description (1) | | Optional Call
Provisions (2) | | | | | | | Ratings (3) | | | Value | |
| | | | | | |
| | | | New York – 5.3% | | | | | | | | | | | | | |
| | | | | | |
| $ | 4,055 | | | Brooklyn Arena Local Development Corporation, New York, Payment in Lieu of Taxes Revenue Bonds, Barclays Center Project, Series 2009, 6.000%, 7/15/30 | | | 1/20 at 100.00 | | | | | | | | BBB– | | | $ | 4,643,948 | |
| | | | | | |
| | | | Buffalo and Fort Erie Public Bridge Authority, New York, Toll Bridge System Revenue Bonds, Refunding Series 2014: | | | | | | | | | | | | | | | | |
| | 300 | | | 5.000%, 1/01/24 | | | No Opt. Call | | | | | | | | A+ | | | | 372,384 | |
| | 500 | | | 5.000%, 1/01/25 | | | No Opt. Call | | | | | | | | A+ | | | | 627,010 | |
| | | | | | |
| | 5,125 | | | Dormitory Authority of the State of New York, Revenue Bonds, Marymount Manhattan College, Series 2009, 5.000%, 7/01/24 | | | 7/19 at 100.00 | | | | | | | | Baa2 | | | | 5,655,079 | |
| | | | | | |
| | 7,050 | | | Dormitory Authority of the State of New York, State and Local Appropriation Lease Bonds, Upstate Community Colleges, Series 2005A, 5.500%, 7/01/20 – FGIC Insured | | | No Opt. Call | | | | | | | | AA | | | | 8,338,388 | |
| | | | | | |
| | 6,665 | | | Dormitory Authority of the State of New York, State Personal Income Tax Revenue Bonds, General Purpose Series 2014A, 5.000%, 2/15/21 | | | No Opt. Call | | | | | | | | AAA | | | | 7,896,159 | |
| | | | | | |
| | | | Dormitory Authority of the State of New York, Third General Resolution Revenue Bonds, State University Educational Facilities Issue, Series 2012A: | | | | | | | | | | | | | | | | |
| | 10,000 | | | 5.000%, 5/15/24 | | | 5/22 at 100.00 | | | | | | | | AA | | | | 12,108,000 | |
| | 9,230 | | | 5.000%, 5/15/25 | | | 5/22 at 100.00 | | | | | | | | AA | | | | 11,175,684 | |
| | | | | | |
| | | | Long Island Power Authority, New York, Electric System General Revenue Bonds, Series 2000A: | | | | | | | | | | | | | | | | |
| | 160 | | | 0.000%, 6/01/17 – AGM Insured | | | No Opt. Call | | | | | | | | AA | | | | 158,160 | |
| | 110 | | | 0.000%, 6/01/22 – AGM Insured | | | No Opt. Call | | | | | | | | AA | | | | 99,463 | |
| | 540 | | | 0.000%, 6/01/23 – AGM Insured | | | No Opt. Call | | | | | | | | AA | | | | 474,779 | |
| | | | | | |
| | 1,800 | | | Long Island Power Authority, New York, Electric System General Revenue Bonds, Series 2006A, 5.000%, 12/01/19 (Pre-refunded 6/01/16) – FGIC Insured | | | 6/16 at 100.00 | | | | | | | | AA– (4) | | | | 1,807,236 | |
| | | | | | |
| | 355 | | | Long Island Power Authority, New York, Electric System General Revenue Bonds, Series 2006B, 5.000%, 12/01/35 (Pre-refunded 6/01/16) | | | 6/16 at 100.00 | | | | | | | | A– (4) | | | | 356,427 | |
| | | | | | |
| | | | Long Island Power Authority, New York, Electric System General Revenue Bonds, Series 2006C: | | | | | | | | | | | | | | | | |
| | 35 | | | 5.000%, 9/01/35 (Pre-refunded 9/01/16) – AGC Insured | | | 9/16 at 100.00 | | | | | | | | AA (4) | | | | 35,525 | |
| | 460 | | | 5.000%, 9/01/35 (Pre-refunded 9/01/16) | | | 9/16 at 100.00 | | | | | | | | A– (4) | | | | 466,900 | |
| | | | | | |
| | | | Long Island Power Authority, New York, Electric System General Revenue Bonds, Series 2006E: | | | | | | | | | | | | | | | | |
| | 1,385 | | | 5.000%, 12/01/17 | | | 12/16 at 100.00 | | | | | | | | A– | | | | 1,421,439 | |
| | 1,645 | | | 5.000%, 12/01/18 – FGIC Insured | | | 12/16 at 100.00 | | | | | | | | AA– | | | | 1,688,675 | |
| | 1,060 | | | 5.000%, 12/01/22 | | | 12/16 at 100.00 | | | | | | | | A– | | | | 1,086,309 | |
| | | | | | |
| | 5,400 | | | Long Island Power Authority, New York, Electric System General Revenue Bonds, Series 2014A, 5.000%, 9/01/34 | | | 9/24 at 100.00 | | | | | | | | A– | | | | 6,374,646 | |
| | | | | | |
| | 160 | | | Long Island Power Authority, New York, Electric System Revenue Bonds, Refunding Series 2009A, 5.000%, 4/01/19 (ETM) | | | No Opt. Call | | | | | | | | A– (4) | | | | 179,445 | |
| | | | | | |
| | 415 | | | Long Island Power Authority, New York, Electric System Revenue Bonds, Refunding Series 2009A, 6.250%, 4/01/33 (Pre-refunded 4/01/19) | | | 4/19 at 100.00 | | | | | | | | A– (4) | | | | 479,479 | |
| | | | | | |
| | | | Long Island Power Authority, New York, Electric System Revenue Bonds, Refunding Series 2009A: | | | | | | | | | | | | | | | | |
| | 135 | | | 5.250%, 4/01/20 | | | 4/19 at 100.00 | | | | | | | | A– | | | | 149,584 | |
| | 545 | | | 5.250%, 4/01/21 | | | 4/19 at 100.00 | | | | | | | | A– | | | | 602,557 | |
| | 1,745 | | | 5.500%, 4/01/22 | | | 4/19 at 100.00 | | | | | | | | A– | | | | 1,937,474 | |
| | 260 | | | 5.000%, 4/01/23 | | | 4/19 at 100.00 | | | | | | | | A– | | | | 283,423 | |
| | | | | | |
| | 90 | | | Long Island Power Authority, New York, Electric System Revenue Bonds, Refunding Series 2009A, 5.250%, 4/01/20 (Pre-refunded 4/01/19) | | | 4/19 at 100.00 | | | | | | | | N/R (4) | | | | 101,391 | |
| | | | | | |
| | | | Long Island Power Authority, New York, Electric System Revenue Bonds, Series 2006F: | | | | | | | | | | | | | | | | |
| | 850 | | | 5.000%, 5/01/16 – NPFG Insured | | | No Opt. Call | | | | | | | | AA– | | | | 850,221 | |
| | 1,025 | | | 5.000%, 5/01/17 – NPFG Insured | | | No Opt. Call | | | | | | | | AA– | | | | 1,068,839 | |
| | | | | | | | | | | | | | | | | | | | |
Principal
Amount (000) | | | Description (1) | | Optional Call
Provisions (2) | | | | | | | Ratings (3) | | | Value | |
| | | | | | |
| | | | New York (continued) | | | | | | | | | | | | | |
| $ | 8,935 | | | 5.000%, 5/01/18 – NPFG Insured | | | 11/16 at 100.00 | | | | | | | | AA– | | | $ | 9,140,148 | |
| | | | | | |
| | 1,200 | | | Long Island Power Authority, New York, Electric System Revenue Bonds, Series 2011A, 5.000%, 5/01/16 (ETM) | | | No Opt. Call | | | | | | | | A– (4) | | | | 1,200,300 | |
| | | | | | |
| | 1,235 | | | Long Island Power Authority, New York, Electric System Revenue Bonds, Series 2012B, 5.000%, 9/01/26 | | | 9/22 at 100.00 | | | | | | | | A– | | | | 1,469,082 | |
| | | | | | |
| | | | Nassau County Local Economic Assistance Corporation, New York, Revenue Bonds, Catholic Health Services of Long Island Obligated Group Project, Series 2014B: | | | | | | | | | | | | | | | | |
| | 655 | | | 5.000%, 7/01/30 | | | 7/24 at 100.00 | | | | | | | | BBB+ | | | | 759,066 | |
| | 2,455 | | | 5.000%, 7/01/32 | | | 7/24 at 100.00 | | | | | | | | BBB+ | | | | 2,830,517 | |
| | | | | | |
| | | | Nassau County Local Economic Assistance Corporation, New York, Revenue Bonds, Catholic Health Services of Long Island Obligated Group Project, Series 2014: | | | | | | | | | | | | | | | | |
| | 1,500 | | | 5.000%, 7/01/28 | | | 7/24 at 100.00 | | | | | | | | BBB+ | | | | 1,768,290 | |
| | 1,000 | | | 5.000%, 7/01/29 | | | 7/24 at 100.00 | | | | | | | | BBB+ | | | | 1,172,020 | |
| | | | | | |
| | 2,000 | | | New York City Industrial Development Agency, New York, American Airlines-JFK International Airport Special Facility Revenue Bonds, Series 2005, 7.750%, 8/01/31 (Alternative Minimum Tax) | | | 8/16 at 101.00 | | | | | | | | N/R | | | | 2,055,860 | |
| | | | | | |
| | 10,205 | | | New York City Transitional Finance Authority, New York, Future Tax Secured Bonds, Refunding Fiscal Series 2007C-1, 5.000%, 11/01/16 (ETM) | | | No Opt. Call | | | | | | | | AAA | | | | 10,437,368 | |
| | | | | | |
| | 10,000 | | | New York City, New York, General Obligation Bonds, Fiscal 2003 Series C-A. RMKT, 5.000%, 8/01/19 | | | No Opt. Call | | | | | | | | AA | | | | 11,318,600 | |
| | | | | | |
| | 20,000 | | | New York City, New York, General Obligation Bonds, Fiscal 2015 Series A, 5.000%, 8/01/20 | | | No Opt. Call | | | | | | | | AA | | | | 23,322,800 | |
| | | | | | |
| | 15,440 | | | New York City, New York, General Obligation Bonds, Fiscal 2016 Series C, 5.000%, 8/01/19 | | | No Opt. Call | | | | | | | | AA | | | | 17,475,918 | |
| | | | | | |
| | 980 | | | New York City, New York, General Obligation Bonds, Fiscal Series 2007C-1, 5.000%, 10/01/18 | | | 10/17 at 100.00 | | | | | | | | AA | | | | 1,041,407 | |
| | | | | | |
| | 20,255 | | | New York City, New York, General Obligation Bonds, Fiscal Series 2007C-1, 5.000%, 10/01/18 (Pre-refunded 10/01/17) | | | 10/17 at 100.00 | | | | | | | | Aa2 (4) | | | | 21,516,684 | |
| | | | | | |
| | 10,000 | | | New York City, New York, General Obligation Bonds, Refunding Fiscal 2015 Series A, 5.000%, 8/01/17 | | | No Opt. Call | | | | | | | | AA | | | | 10,545,500 | |
| | | | | | |
| | 30,610 | | | New York State Thruway Authority, General Revenue Junior Indebtedness Obligations, Series 2013A, 5.000%, 5/01/19 | | | No Opt. Call | | | | | | | | A– | | | | 34,313,810 | |
| | | | | | |
| | 9,115 | | | New York State Tobacco Settlement Financing Corporation, Tobacco Settlement Asset-Backed and State Contingency Contract-Backed Bonds, Series 2011B, 5.000%, 6/01/18 | | | No Opt. Call | | | | | | | | AA | | | | 9,912,016 | |
| | | | | | |
| | 1,535 | | | New York State Tobacco Settlement Financing Corporation, Tobacco Settlement Asset-Backed and State Contingency Contract-Backed Bonds, Series 2013B, 5.000%, 6/01/21 | | | 6/17 at 100.00 | | | | | | | | AA | | | | 1,604,658 | |
| | | | | | |
| | | | New York Transportation Development Corporation, New York, Special Facility Revenue Refunding Bonds, Terminal One Group Association, L.P. Project, Series 2015: | | | | | | | | | | | | | | | | |
| | 2,005 | | | 5.000%, 1/01/22 (Alternative Minimum Tax) | | | No Opt. Call | | | | | | | | A– | | | | 2,387,574 | |
| | 2,065 | | | 5.000%, 1/01/23 (Alternative Minimum Tax) | | | No Opt. Call | | | | | | | | A– | | | | 2,501,768 | |
| | | | | | |
| | 1,000 | | | Onondaga Civic Development Corporation, New York, Revenue Bonds, Saint Josephus Hospital Health Center Project, Series 2014A, 5.125%, 7/01/31 (Pre-refunded 7/01/19) | | | 7/19 at 100.00 | | | | | | | | N/R (4) | | | | 1,133,000 | |
| | | | | | |
| | 10,000 | | | Port Authority of New York and New Jersey, Consolidated Revenue Bonds, One Hundred Seventy Ninth Series 2013, 5.000%, 12/01/25 | | | 12/23 at 100.00 | | | | | | | | AA– | | | | 12,475,700 | |
| | | | | | |
| | 795 | | | Port Authority of New York and New Jersey, Special Project Bonds, JFK International Air Terminal LLC Project, Eighth Series 2010, 6.000%, 12/01/42 | | | 12/20 at 100.00 | | | | | | | | Baa1 | | | | 934,976 | |
Nuveen Intermediate Duration Municipal Bond Fund (continued)
| | |
| Portfolio of Investments | | April 30, 2016 |
| | | | | | | | | | | | | | | | | | | | |
Principal
Amount (000) | | | Description (1) | | Optional Call
Provisions (2) | | | | | | | Ratings (3) | | | Value | |
| | | | | | |
| | | | New York (continued) | | | | | | | | | | | | | |
| | | | | | |
| | | | Suffolk County Economic Development Corporation, New York, Revenue Bonds, Catholic Health Services of Long Island Obligated Group Project, Series 2014: | | | | | | | | | | | | | | | | |
| $ | 2,435 | | | 5.000%, 7/01/28 | | | 7/24 at 100.00 | | | | | | | | BBB+ | | | $ | 2,819,949 | |
| | 2,695 | | | 5.000%, 7/01/29 | | | 7/24 at 100.00 | | | | | | | | BBB+ | | | | 3,102,996 | |
| | 4,200 | | | 5.000%, 7/01/30 | | | 7/24 at 100.00 | | | | | | | | BBB+ | | | | 4,834,200 | |
| | 2,100 | | | 5.000%, 7/01/31 | | | 7/24 at 100.00 | | | | | | | | BBB+ | | | | 2,408,049 | |
| | 1,335 | | | 5.000%, 7/01/32 | | | 7/24 at 100.00 | | | | | | | | BBB+ | | | | 1,529,790 | |
| | 3,080 | | | 5.000%, 7/01/33 | | | 7/24 at 100.00 | | | | | | | | BBB+ | | | | 3,519,793 | |
| | | | | | |
| | 5,000 | | | Utility Debt Securitization Authority, New York, Restructuring Bonds, Series 2016A, 5.000%, 6/15/25 | | | 6/23 at 100.00 | | | | | | | | AAA | | | | 6,225,000 | |
| | 244,930 | | | Total New York | | | | | | | | | | | | | | | 276,195,463 | |
| | | | | | |
| | | | North Carolina – 1.1% | | | | | | | | | | | | | |
| | | | | | |
| | | | Charlotte, North Carolina, Airport Revenue Bonds, Charlotte Douglas International, Refunding Series 2014A: | | | | | | | | | | | | | | | | |
| | 215 | | | 5.000%, 7/01/23 | | | No Opt. Call | | | | | | | | Aa3 | | | | 267,310 | |
| | 1,250 | | | 5.000%, 7/01/26 | | | 7/24 at 100.00 | | | | | | | | Aa3 | | | | 1,550,038 | |
| | 950 | | | 5.000%, 7/01/27 | | | 7/24 at 100.00 | | | | | | | | Aa3 | | | | 1,164,681 | |
| | | | | | |
| | 610 | | | North Carolina Capital Facilities Finance Agency, Revenue Bonds, The Methodist University, Series 2012, 3.750%, 3/01/24 | | | 3/22 at 100.00 | | | | | | | | BBB | | | | 662,228 | |
| | | | | | |
| | 900 | | | North Carolina Capital Facilities Financing Agency, Educational Facilities Revenue Bond, Meredith College, Series 2008A, 5.250%, 6/01/20 | | | 6/18 at 100.00 | | | | | | | | BBB | | | | 965,376 | |
| | | | | | |
| | 1,700 | | | North Carolina Eastern Municipal Power Agency, Power System Revenue Bonds, Refunding Series 2008A, 5.250%, 1/01/22 (Pre-refunded 1/01/18) – AGC Insured | | | 1/18 at 100.00 | | | | | | | | AAA | | | | 1,829,098 | |
| | | | | | |
| | 2,010 | | | North Carolina Eastern Municipal Power Agency, Power System Revenue Bonds, Series 2009A, 5.500%, 1/01/26 (Pre-refunded 1/01/19) | | | 1/19 at 100.00 | | | | | | | | AAA | | | | 2,261,250 | |
| | | | | | |
| | | | North Carolina Eastern Municipal Power Agency, Power System Revenue Bonds, Series 2012B: | | | | | | | | | | | | | | | | |
| | 5,000 | | | 5.000%, 1/01/20 (ETM) | | | No Opt. Call | | | | | | | | AAA | | | | 5,735,850 | |
| | 10,000 | | | 5.000%, 1/01/21 (ETM) | | | No Opt. Call | | | | | | | | AAA | | | | 11,793,700 | |
| | | | | | |
| | 3,570 | | | North Carolina Municipal Power Agency 1, Catawba Electric Revenue Bonds, Refunding Series 2009A, 5.000%, 1/01/26 (Pre-refunded 1/01/19) | | | 1/19 at 100.00 | | | | | | | | AAA | | | | 3,969,126 | |
| | | | | | |
| | 1,430 | | | North Carolina Municipal Power Agency 1, Catawba Electric Revenue Bonds, Refunding Series 2009A, 5.000%, 1/01/26 | | | 1/19 at 100.00 | | | | | | | | A | | | | 1,577,233 | |
| | | | | | |
| | 1,545 | | | North Carolina Municipal Power Agency 1, Catawba Electric Revenue Bonds, Refunding Series 2015A, 5.000%, 1/01/28 | | | 1/26 at 100.00 | | | | | | | | A | | | | 1,933,753 | |
| | | | | | |
| | | | North Carolina Municipal Power Agency 1, Catawba Electric Revenue Bonds, Refunding Series 2016A: | | | | | | | | | | | | | | | | |
| | 4,000 | | | 5.000%, 1/01/28 | | | 7/26 at 100.00 | | | | | | | | A | | | | 5,053,200 | |
| | 3,000 | | | 5.000%, 1/01/29 | | | 7/26 at 100.00 | | | | | | | | A | | | | 3,761,790 | |
| | | | | | |
| | 11,600 | | | North Carolina Municipal Power Agency 1, Catawba Electric Revenue Bonds, Series 2015C, 5.000%, 1/01/29 | | | 1/26 at 100.00 | | | | | | | | A | | | | 14,415,552 | |
| | | | | | |
| | 200 | | | University of North Carolina, Greensboro, General Revenue Bonds, Series 2014, 4.000%, 4/01/19 | | | No Opt. Call | | | | | | | | Aa3 | | | | 217,266 | |
| | 47,980 | | | Total North Carolina | | | | | | | | | | | | | | | 57,157,451 | |
| | | | | | | | | | | | | | | | | | | | |
Principal
Amount (000) | | | Description (1) | | Optional Call
Provisions (2) | | | | | | | Ratings (3) | | | Value | |
| | | | | | |
| | | | North Dakota – 0.3% | | | | | | | | | | | | | |
| | | | | | |
| | | | Burleigh County, North Dakota, Health Care Revenue Bonds, Saint Alexius Medical Center Project, Series 2014A: | | | | | | | | | | | | | | | | |
| $ | 120 | | | 5.000%, 7/01/23 (Pre-refunded 7/01/21) | | | 7/21 at 100.00 | | | | | | | | N/R (4) | | | $ | 143,166 | |
| | 1,240 | | | 5.000%, 7/01/26 (Pre-refunded 7/01/21) | | | 7/21 at 100.00 | | | | | | | | N/R (4) | | | | 1,479,382 | |
| | 2,835 | | | 5.000%, 7/01/27 (Pre-refunded 7/01/21) | | | 7/21 at 100.00 | | | | | | | | N/R (4) | | | | 3,382,297 | |
| | 1,485 | | | 5.000%, 7/01/28 (Pre-refunded 7/01/21) | | | 7/21 at 100.00 | | | | | | | | N/R (4) | | | | 1,771,679 | |
| | 1,000 | | | 5.000%, 7/01/31 (Pre-refunded 7/01/21) | | | 7/21 at 100.00 | | | | | | | | N/R (4) | | | | 1,193,050 | |
| | 2,955 | | | 5.000%, 7/01/35 (Pre-refunded 7/01/21) | | | 7/21 at 100.00 | | | | | | | | N/R (4) | | | | 3,525,463 | |
| | | | | | |
| | 2,750 | | | Fargo, North Dakota, Health System Revenue Bonds, Sanford Health, Refunding Series 2011, 6.250%, 11/01/31 | | | 11/21 at 100.00 | | | | | | | | A+ | | | | 3,377,358 | |
| | | | | | |
| | 2,410 | | | Ward County Health Care, North Dakota, Revenue Bonds, Trinity Obligated Group, Series 2006, 5.125%, 7/01/20 | | | 7/16 at 100.00 | | | | | | | | BBB– | | | | 2,426,653 | |
| | 14,795 | | | Total North Dakota | | | | | | | | | | | | | | | 17,299,048 | |
| | | | | | |
| | | | Ohio – 4.0% | | | | | | | | | | | | | |
| | | | | | |
| | 1,900 | | | Allen County, Ohio, Hospital Facilities Revenue Bonds, Catholic Health Partners, Refunding and Improvement Series 2012A, 5.000%, 5/01/33 | | | 5/22 at 100.00 | | | | | | | | AA– | | | | 2,169,040 | |
| | | | | | |
| | 1,260 | | | Barberton City School District, Summit County, Ohio, General Obligation Bonds, School Improvement Series 2008, 4.750%, 12/01/21 (Pre-refunded 6/01/18) | | | 6/18 at 100.00 | | | | | | | | AA (4) | | | | 1,365,399 | |
| | | | | | |
| | | | Buckeye Tobacco Settlement Financing Authority, Ohio, Tobacco Settlement Asset-Backed Revenue Bonds, Senior Lien, Series 2007A-1: | | | | | | | | | | | | | | | | |
| | 1,875 | | | 5.000%, 6/01/16 | | | No Opt. Call | | | | | | | | Aaa | | | | 1,881,675 | |
| | 135 | | | 5.000%, 6/01/17 | | | No Opt. Call | | | | | | | | Aa1 | | | | 140,577 | |
| | | | | | |
| | | | Buckeye Tobacco Settlement Financing Authority, Ohio, Tobacco Settlement Asset-Backed Revenue Bonds, Senior Lien, Series 2007A-2: | | | | | | | | | | | | | | | | |
| | 3,200 | | | 5.375%, 6/01/24 | | | 6/17 at 100.00 | | | | | | | | B– | | | | 3,109,984 | |
| | 45,540 | | | 5.125%, 6/01/24 | | | 6/17 at 100.00 | | | | | | | | B– | | | | 44,033,992 | |
| | 665 | | | 5.875%, 6/01/30 | | | 6/17 at 100.00 | | | | | | | | B– | | | | 649,785 | |
| | 685 | | | 5.750%, 6/01/34 | | | 6/17 at 100.00 | | | | | | | | B– | | | | 656,812 | |
| | | | | | |
| | 5,450 | | | Cincinnati, Ohio, General Obligation Bonds, Various Purpose, Refunding & Improvement Series 2016A, 4.000%, 12/01/19 | | | No Opt. Call | | | | | | | | AA– | | | | 6,032,714 | |
| | | | | | |
| | | | Cleveland, Ohio, Airport System Revenue Bonds, Refunding Series 2016A: | | | | | | | | | | | | | | | | |
| | 1,250 | | | 5.000%, 1/01/25 – AGM Insured | | | No Opt. Call | | | | | | | | AA | | | | 1,540,463 | |
| | 1,525 | | | 5.000%, 1/01/28 – AGM Insured | | | 1/25 at 100.00 | | | | | | | | AA | | | | 1,829,756 | |
| | 2,230 | | | 5.000%, 1/01/29 – AGM Insured | | | 1/25 at 100.00 | | | | | | | | AA | | | | 2,652,585 | |
| | 2,000 | | | 5.000%, 1/01/30 – AGM Insured | | | 1/25 at 100.00 | | | | | | | | AA | | | | 2,365,340 | |
| | 1,000 | | | 5.000%, 1/01/31 – AGM Insured | | | 1/25 at 100.00 | | | | | | | | AA | | | | 1,178,430 | |
| | | | | | |
| | 3,240 | | | Cleveland, Ohio, Airport System Revenue Bonds, Series 2009C, 5.000%, 1/01/21 – AGM Insured | | | 1/19 at 100.00 | | | | | | | | AA | | | | 3,532,313 | |
| | | | | | |
| | | | Cleveland, Ohio, General Obligation Bonds, Series 2011: | | | | | | | | | | | | | | | | |
| | 1,700 | | | 5.000%, 12/01/22 | | | 12/19 at 100.00 | | | | | | | | AA | | | | 1,915,152 | |
| | 1,780 | | | 5.000%, 12/01/23 | | | 12/19 at 100.00 | | | | | | | | AA | | | | 1,999,955 | |
| | | | | | |
| | 18,950 | | | Columbus, Ohio, Sewerage System Revenue Bonds, Series 2008A, 5.000%, 6/01/26 (Pre-refunded 12/01/17) | | | 12/17 at 100.00 | | | | | | | | AA+ (4) | | | | 20,252,244 | |
| | | | | | |
| | 470 | | | Lake County, Ohio, Hospital Facilities Revenue Bonds, Lake Hospital System, Inc., Refunding Series 2008C, 5.500%, 8/15/24 | | | 8/18 at 100.00 | | | | | | | | A3 | | | | 517,075 | |
| | | | | | |
| | 2,435 | | | Lake County, Ohio, Hospital Facilities Revenue Bonds, Lake Hospital System, Inc., Refunding Series 2008C, 5.500%, 8/15/24 (Pre-refunded 8/15/18) | | | 8/18 at 100.00 | | | | | | | | N/R (4) | | | | 2,699,076 | |
Nuveen Intermediate Duration Municipal Bond Fund (continued)
| | |
| Portfolio of Investments | | April 30, 2016 |
| | | | | | | | | | | | | | | | | | | | |
Principal
Amount (000) | | | Description (1) | | Optional Call
Provisions (2) | | | | | | | Ratings (3) | | | Value | |
| | | | | | |
| | | | Ohio (continued) | | | | | | | | | | | | | |
| | | | | | |
| $ | 1,095 | | | Mason City School District, Warren and Butler Counties, Ohio, General Obligation Bonds, Refunding Series 2007, 4.375%, 12/01/19 – AGM Insured | | | 12/16 at 100.00 | | | | | | | | Aa1 | | | $ | 1,120,240 | |
| | | | | | |
| | 750 | | | Miami County, Ohio, Hospital Facilities Revenue Bonds, Upper Valley Medical Center Inc., Refunding Series 2006, 5.250%, 5/15/16 | | | No Opt. Call | | | | | | | | A | | | | 751,613 | |
| | | | | | |
| | 7,450 | | | Muskingum County, Ohio, Hospital Facilities Revenue Bonds, Genesis HealthCare System Obligated Group Project, Series 2013, 5.000%, 2/15/27 | | | 2/23 at 100.00 | | | | | | | | BB+ | | | | 8,106,047 | |
| | | | | | |
| | | | New Albany Community Authority, Ohio, Community Facilities Revenue Refunding Bonds, Series 2012C: | | | | | | | | | | | | | | | | |
| | 775 | | | 4.000%, 10/01/18 | | | No Opt. Call | | | | | | | | A1 | | | | 825,778 | |
| | 870 | | | 4.000%, 10/01/19 | | | No Opt. Call | | | | | | | | A1 | | | | 946,377 | |
| | 1,150 | | | 4.000%, 10/01/20 | | | No Opt. Call | | | | | | | | A1 | | | | 1,268,393 | |
| | 1,205 | | | 5.000%, 10/01/21 | | | No Opt. Call | | | | | | | | A1 | | | | 1,406,717 | |
| | 965 | | | 5.000%, 10/01/22 | | | No Opt. Call | | | | | | | | A1 | | | | 1,146,169 | |
| | | | | | |
| | 6,625 | | | Ohio Air Quality Development Authority, Ohio, Pollution Control Revenue Refunding Bonds, FirstEnergy Generation Corp. Project, Series 2006A, 3.750%, 12/01/23 (Mandatory put 12/03/18) | | | No Opt. Call | | | | | | | | BBB– | | | | 6,848,528 | |
| | | | | | |
| | 1,715 | | | Ohio Air Quality Development Authority, Ohio, Pollution Control Revenue Refunding Bonds, FirstEnergy Generation Corp. Project, Series 2009B, 3.100%, 3/01/23 (Mandatory put 3/01/19) | | | No Opt. Call | | | | | | | | BBB– | | | | 1,754,411 | |
| | | | | | |
| | 7,500 | | | Ohio State, General Obligation Bonds, Highway Capital Improvement Series 2012Q, 5.000%, 5/01/21 | | | No Opt. Call | | | | | | | | AAA | | | | 8,947,800 | |
| | | | | | |
| | 6,960 | | | Ohio State, General Obligation Bonds, Refunding Common Schools Series 2011B, 4.000%, 9/15/21 | | | No Opt. Call | | | | | | | | AA+ | | | | 7,998,362 | |
| | | | | | |
| | 24,230 | | | Ohio State, General Obligation Bonds, Refunding Common Schools Series 2014A, 5.000%, 9/15/19 | | | No Opt. Call | | | | | | | | AA+ | | | | 27,587,793 | |
| | | | | | |
| | 8,160 | | | Ohio State, General Obligation Bonds, Refunding Higher Education Series 2012C, 5.000%, 8/01/21 | | | No Opt. Call | | | | | | | | AA+ | | | | 9,769,070 | |
| | | | | | |
| | 5,170 | | | Ohio State, Hospital Revenue Bonds, University Hospitals Health System, Inc., Refunding Series 2016A, 5.000%, 1/15/41 | | | 1/26 at 100.00 | | | | | | | | A | | | | 6,013,951 | |
| | | | | | |
| | 12,000 | | | Ohio Water Development Authority, Water Pollution Control Loan Fund Revenue Bonds, Series 2014, 5.000%, 6/01/21 | | | No Opt. Call | | | | | | | | AAA | | | | 14,344,920 | |
| | | | | | |
| | 500 | | | Richland County, Ohio, General Obligation Bonds, Correctional Facilities Improvement Refunding Series 2008, 5.875%, 12/01/24 (Pre-refunded 12/01/18) – AGC Insured | | | 12/18 at 100.00 | | | | | | | | A2 (4) | | | | 565,595 | |
| | | | | | |
| | 805 | | | Richland County, Ohio, Hospital Revenue Bonds, MidCentral Health System Group, Series 2006, 5.000%, 11/15/16 (ETM) | | | No Opt. Call | | | | | | | | N/R (4) | | | | 824,578 | |
| | | | | | |
| | 1,980 | | | Scioto County, Ohio, Hospital Facilities Revenue Bonds, Southern Ohio Medical Center, Refunding Series 2016, 3.375%, 2/15/35 (WI/DD, Settling 5/10/16) | | | 2/26 at 100.00 | | | | | | | | A2 | | | | 1,960,893 | |
| | | | | | |
| | 2,935 | | | Tuscarawas County Economic Development and Finance Alliance, Ohio, Higher Education Facilities Revenue Bonds, Ashland University, Refunding & Improvement Series 2015, 5.375%, 3/01/27 | | | 3/25 at 100.00 | | | | | | | | N/R | | | | 3,032,765 | |
| | 190,130 | | | Total Ohio | | | | | | | | | | | | | | | 205,742,367 | |
| | | | | | |
| | | | Oklahoma – 1.2% | | | | | | | | | | | | | |
| | | | | | |
| | | | Canadian County Educational Facilities Authority, Oklahoma, Educational Facilities Lease Revenue Bonds, Mustang Public Schools Project, Series 2012: | | | | | | | | | | | | | | | | |
| | 2,290 | | | 4.500%, 9/01/21 | | | No Opt. Call | | | | | | | | A+ | | | | 2,628,027 | |
| | 2,810 | | | 4.000%, 9/01/22 | | | 9/21 at 100.00 | | | | | | | | A+ | | | | 3,106,680 | |
| | 1,415 | | | 4.000%, 9/01/23 | | | 9/21 at 100.00 | | | | | | | | A+ | | | | 1,555,326 | |
| | | | | | | | | | | | | | | | | | | | |
Principal
Amount (000) | | | Description (1) | | Optional Call
Provisions (2) | | | | | | | Ratings (3) | | | Value | |
| | | | | | |
| | | | Oklahoma (continued) | | | | | | | | | | | | | |
| | | | | | |
| | | | Cleveland County Educational Facilities Authority, Oklahoma, Educational Facilities Lease Revenue Bonds, Moore Public Schools Project, Series 2016: | | | | | | | | | | | | | | | | |
| $ | 2,940 | | | 5.000%, 6/01/21 | | | No Opt. Call | | | | | | | | A+ | | | $ | 3,429,216 | |
| | 7,445 | | | 5.000%, 6/01/22 | | | No Opt. Call | | | | | | | | A+ | | | | 8,829,249 | |
| | 3,005 | | | 5.000%, 6/01/23 | | | No Opt. Call | | | | | | | | A+ | | | | 3,616,608 | |
| | | | | | |
| | 2,495 | | | Norman Regional Hospital Authority, Oklahoma, Hospital Revenue Bonds, Series 2005, 5.500%, 9/01/23 | | | 9/16 at 100.00 | | | | | | | | BBB– | | | | 2,528,109 | |
| | | | | | |
| | | | Pontotoc County Educational Facilities Authority, Oklahoma, Facilities Lease Revenue Bonds, Ada Public Schools Project, Series 2014: | | | | | | | | | | | | | | | | |
| | 750 | | | 5.000%, 9/01/22 | | | No Opt. Call | | | | | | | | A– | | | | 885,263 | |
| | 500 | | | 3.000%, 9/01/23 | | | No Opt. Call | | | | | | | | A– | | | | 528,815 | |
| | 600 | | | 5.000%, 9/01/24 | | | No Opt. Call | | | | | | | | A– | | | | 725,976 | |
| | 1,505 | | | 5.000%, 9/01/25 | | | No Opt. Call | | | | | | | | A– | | | | 1,840,449 | |
| | | | | | |
| | | | Tulsa County Industrial Authority, Oklahoma, Educational Facilities Lease Revenue Bonds, Broken Arrow Public Schools Project, Series 2016: | | | | | | | | | | | | | | | | |
| | 3,350 | | | 5.000%, 9/01/25 | | | 9/23 at 100.00 | | | | | | | | AA– | | | | 4,059,865 | |
| | 10,675 | | | 5.000%, 9/01/26 | | | 9/23 at 100.00 | | | | | | | | AA– | | | | 12,904,474 | |
| | | | | | |
| | | | Tulsa County Industrial Authority, Oklahoma, Educational Facilities Lease Revenue Bonds, Jenks Public Schools Project, Series 2015: | | | | | | | | | | | | | | | | |
| | 6,150 | | | 5.000%, 9/01/25 | | | No Opt. Call | | | | | | | | AA– | | | | 7,660,994 | |
| | 7,845 | | | 5.000%, 9/01/26 | | | 9/25 at 100.00 | | | | | | | | AA– | | | | 9,737,292 | |
| | 53,775 | | | Total Oklahoma | | | | | | | | | | | | | | | 64,036,343 | |
| | | | | | |
| | | | Oregon – 1.0% | | | | | | | | | | | | | |
| | | | | | |
| | 4,145 | | | Clackamas Community College District, Oregon, General Obligation Bonds, Series 2007, 5.000%, 6/15/20 – FGIC Insured | | | No Opt. Call | | | | | | | | AA | | | | 4,787,268 | |
| | | | | | |
| | 7,500 | | | Oregon Department of Administrative Services, State Lottery Revenue Bonds, Refunding Series 2015D, 5.000%, 4/01/21 | | | No Opt. Call | | | | | | | | AAA | | | | 8,921,550 | |
| | | | | | |
| | | | Oregon Health and Science University, Revenue Bonds, Refunding Series 2016B: | | | | | | | | | | | | | | | | |
| | 8,000 | | | 5.000%, 7/01/36 | | | 7/26 at 100.00 | | | | | | | | AA– | | | | 9,682,320 | |
| | 10,000 | | | 5.000%, 7/01/37 | | | 7/26 at 100.00 | | | | | | | | AA– | | | | 12,063,200 | |
| | | | | | |
| | 11,120 | | | Oregon State Department of Transportation, Highway User Tax Revenue Bonds, Senior Lien Series 2013A, 5.000%, 11/15/38 | | | 11/23 at 100.00 | | | | | | | | AAA | | | | 13,341,887 | |
| | | | | | |
| | 4,000 | | | Oregon State Department of Transportation, Highway User Tax Revenue Bonds, Series 2009A, 5.000%, 11/15/22 (Pre-refunded 5/15/19) | | | 5/19 at 100.00 | | | | | | | | AAA | | | | 4,500,440 | |
| | 44,765 | | | Total Oregon | | | | | | | | | | | | | | | 53,296,665 | |
| | | | | | |
| | | | Pennsylvania – 3.8% | | | | | | | | | | | | | |
| | | | | | |
| | 2,245 | | | Allegheny County Hospital Development Authority, Pennsylvania, Revenue Bonds, University of Pittsburgh Medical Center System, Series 2008B, 5.000%, 6/15/18 | | | No Opt. Call | | | | | | | | Aa3 | | | | 2,444,199 | |
| | | | | | |
| | 1,000 | | | Allegheny County, Pennsylvania, General Obligation Bonds, Series C69-C70 of 2012, 5.000%, 12/01/25 | | | 12/22 at 100.00 | | | | | | | | AA– | | | | 1,193,680 | |
| | | | | | |
| | | | Beaver County Industrial Development Authority, Pennsylvania, Pollution Control Revenue Refunding Bonds, FirstEnergy Nuclear Generation Project, Series 2006B: | | | | | | | | | | | | | | | | |
| | 1,750 | | | 3.500%, 12/01/35 (Mandatory put 6/01/20) | | | No Opt. Call | | | | | | | | BBB– | | | | 1,817,935 | |
| | 20,815 | | | 2.500%, 12/01/41 (Mandatory put 6/01/17) | | | No Opt. Call | | | | | | | | BBB– | | | | 21,009,412 | |
| | | | | | |
| | 1,315 | | | Bethel Park School District, Allegheny County, Pennsylvania, General Obligation Bonds, Series 2009, 4.125%, 8/01/20 | | | 8/19 at 100.00 | | | | | | | | Aa2 | | | | 1,440,622 | |
Nuveen Intermediate Duration Municipal Bond Fund (continued)
| | |
| Portfolio of Investments | | April 30, 2016 |
| | | | | | | | | | | | | | | | | | | | |
Principal
Amount (000) | | | Description (1) | | Optional Call
Provisions (2) | | | | | | | Ratings (3) | | | Value | |
| | | | | | |
| | | | Pennsylvania (continued) | | | | | | | | | | | | | |
| | | | | | |
| $ | 1,405 | | | Delaware County Authority, Pennsylvania, Hospital Revenue Bonds, Crozer-Chester Medical Center, Refunding Series 2005, 5.000%, 12/15/17 – RAAI Insured | | | No Opt. Call | | | | | | | | AA | | | $ | 1,409,566 | |
| | | | | | |
| | | | Delaware County Authority, Pennsylvania, Revenue Bonds, Neumann College, Series 2008: | | | | | | | | | | | | | | | | |
| | 535 | | | 5.250%, 10/01/20 (Pre-refunded 10/01/18) | | | 10/18 at 100.00 | | | | | | | | BBB (4) | | | | 592,336 | |
| | 565 | | | 5.375%, 10/01/21 (Pre-refunded 10/01/18) | | | 10/18 at 100.00 | | | | | | | | BBB (4) | | | | 627,240 | |
| | | | | | |
| | | | Delaware County Authority, Pennsylvania, Revenue Bonds, Neumann University, Series 2010: | | | | | | | | | | | | | | | | |
| | 1,000 | | | 5.000%, 10/01/21 | | | 10/20 at 100.00 | | | | | | | | BBB | | | | 1,118,690 | |
| | 1,050 | | | 5.000%, 10/01/25 | | | 10/20 at 100.00 | | | | | | | | BBB | | | | 1,151,504 | |
| | | | | | |
| | | | Indiana County Hospital Authority, Pennsylvania, Hospital Revenue Bonds, Indiana Regional Medical Center, Series 2014A: | | | | | | | | | | | | | | | | |
| | 180 | | | 4.000%, 6/01/17 | | | No Opt. Call | | | | | | | | Ba1 | | | | 184,023 | |
| | 200 | | | 4.000%, 6/01/19 | | | No Opt. Call | | | | | | | | Ba1 | | | | 210,874 | |
| | 410 | | | 5.000%, 6/01/22 | | | No Opt. Call | | | | | | | | Ba1 | | | | 464,624 | |
| | 790 | | | 5.000%, 6/01/24 | | | 6/23 at 100.00 | | | | | | | | Ba1 | | | | 898,396 | |
| | 500 | | | 5.000%, 6/01/25 | | | 6/23 at 100.00 | | | | | | | | Ba1 | | | | 563,960 | |
| | 370 | | | 5.125%, 6/01/26 | | | 6/23 at 100.00 | | | | | | | | Ba1 | | | | 417,138 | |
| | 460 | | | 5.375%, 6/01/28 | | | 6/23 at 100.00 | | | | | | | | Ba1 | | | | 518,668 | |
| | | | | | |
| | 3,760 | | | Lehigh County Industrial Development Authority, Pennsylvania, Pollution Control Revenue Bonds, Pennsylvania Power and Light Company, Series 2016A, 0.900%, 9/01/29 (Mandatory put 9/01/17) | | | No Opt. Call | | | | | | | | A | | | | 3,756,428 | |
| | | | | | |
| | 6,440 | | | Lehigh County Industrial Development Authority, Pennsylvania, Pollution Control Revenue Bonds, Pennsylvania Power and Light Company, Series 2016B, 0.900%, 2/15/27 (Mandatory put 8/15/17) | | | No Opt. Call | | | | | | | | A | | | | 6,434,719 | |
| | | | | | |
| | 3,140 | | | Luzerne County Industrial Development Authority, Pennsylvania, Guaranteed Lease Revenue Bonds, Series 2009, 7.750%, 12/15/27 | | | 12/19 at 100.00 | | | | | | | | N/R | | | | 3,291,474 | |
| | | | | | |
| | 1,300 | | | Monroe County Hospital Authority, Pennsylvania, Hospital Revenue Bonds, Pocono Medical Center, Series 2007, 5.000%, 1/01/27 | | | 1/17 at 100.00 | | | | | | | | A | | | | 1,333,306 | |
| | | | | | |
| | 5,900 | | | Montgomery County Industrial Development Authority, Pennsylvania, Pollution Control Revenue Bonds, PECO Energy Company Project, Refunding Series 1996A, 2.600%, 3/01/34 (Mandatory put 9/01/20) | | | No Opt. Call | | | | | | | | BBB | | | | 6,038,945 | |
| | | | | | |
| | 5,355 | | | Pennsylvania Economic Development Financing Authority, Exempt Facilities Revenue Bonds, Shippingport Project, First Energy Guarantor., Series 2005A, 3.750%, 12/01/40 | | | No Opt. Call | | | | | | | | Baa3 | | | | 5,619,591 | |
| | | | | | |
| | 3,325 | | | Pennsylvania Economic Development Financing Authority, Health System Revenue Bonds , Albert Einstein Healthcare, Series 2009A, 6.250%, 10/15/23 (Pre-refunded 10/15/19) | | | 10/19 at 100.00 | | | | | | | | Baa2 (4) | | | | 3,801,739 | |
| | | | | | |
| | | | Pennsylvania Economic Development Financing Authority, Parking System Revenue Bonds, Capitol Region Parking System, Junior Guaranteed Series 2013B: | | | | | | | | | | | | | | | | |
| | 1,975 | | | 5.500%, 1/01/25 | | | 1/24 at 100.00 | | | | | | | | AA | | | | 2,480,324 | |
| | 2,265 | | | 5.500%, 1/01/26 | | | 1/24 at 100.00 | | | | | | | | AA | | | | 2,835,327 | |
| | 2,260 | | | 5.500%, 1/01/27 | | | 1/24 at 100.00 | | | | | | | | AA | | | | 2,798,196 | |
| | | | | | |
| | | | Pennsylvania Economic Development Financing Authority, Parking System Revenue Bonds, Capitol Region Parking System, Junior Insured Series 2013C: | | | | | | | | | | | | | | | | |
| | 500 | | | 5.500%, 1/01/25 – AGM Insured | | | No Opt. Call | | | | | | | | AA | | | | 627,930 | |
| | 1,095 | | | 5.500%, 1/01/26 – AGM Insured | | | 1/24 at 100.00 | | | | | | | | AA | | | | 1,370,721 | |
| | 2,505 | | | 5.500%, 1/01/28 – AGM Insured | | | 1/24 at 100.00 | | | | | | | | AA | | | | 3,079,622 | |
| | 2,050 | | | 5.500%, 1/01/29 – AGM Insured | | | 1/24 at 100.00 | | | | | | | | AA | | | | 2,513,772 | |
| | 1,255 | | | 5.500%, 1/01/31 – AGM Insured | | | 1/24 at 100.00 | | | | | | | | AA | | | | 1,528,063 | |
| | | | | | | | | | | | | | | | | | | | |
Principal
Amount (000) | | | Description (1) | | Optional Call
Provisions (2) | | | | | | | Ratings (3) | | | Value | |
| | | | | | |
| | | | Pennsylvania (continued) | | | | | | | | | | | | | |
| | | | | | |
| | | | Pennsylvania Economic Development Financing Authority, Unemployment Compensation Revenue Bonds, Series 2012B: | | | | | | | | | | | | | | | | |
| $ | 2,240 | | | 5.000%, 1/01/21 | | | 1/19 at 100.00 | | | | | | | | Aaa | | | $ | 2,486,960 | |
| | 9,575 | | | 5.000%, 7/01/21 | | | 1/18 at 100.00 | | | | | | | | Aaa | | | | 10,246,591 | |
| | 7,800 | | | 5.000%, 1/01/22 | | | 7/17 at 100.00 | | | | | | | | Aaa | | | | 8,207,784 | |
| | 11,820 | | | 5.000%, 7/01/22 | | | 7/16 at 100.00 | | | | | | | | Aaa | | | | 12,071,175 | |
| | | | | | |
| | 8,680 | | | Pennsylvania Public School Building Authority, Lease Revenue Bonds, School District of Philadelphia, Series 2006B, 4.500%, 6/01/32 – AGM Insured | | | 12/16 at 100.00 | | | | | | | | AA | | | | 8,819,835 | |
| | | | | | |
| | 2,000 | | | Pennsylvania Turnpike Commission, Motor License Fund-Enhanced Turnpike Subordinate Special Revenue Bonds, Series 2014A, 0.000%, 12/01/34 (13) | | | No Opt. Call | | | | | | | | AA– | | | | 1,749,620 | |
| | | | | | |
| | 16,020 | | | Pennsylvania Turnpike Commission, Turnpike Revenue Bonds, Capital Appreciation Series 2009E, 0.000%, 12/01/38 (13) | | | 12/27 at 100.00 | | | | | | | | A– | | | | 19,366,898 | |
| | | | | | |
| | 12,000 | | | Pennsylvania Turnpike Commission, Turnpike Revenue Bonds, Series 2015A-1, 5.000%, 12/01/24 | | | No Opt. Call | | | | | | | | A1 | | | | 15,031,080 | |
| | | | | | |
| | 7,445 | | | Philadelphia Authority For Industrial Development, Pennsylvania, Revenue Bonds, Cultural and Commercial Corridors Program, Refunding Series 2016A, 5.000%, 12/01/29 | | | 12/25 at 100.00 | | | | | | | | A+ | | | | 8,836,768 | |
| | | | | | |
| | 3,000 | | | Philadelphia Gas Works, Pennsylvania, Revenue Bonds, Nineth Series, 2010, 5.000%, 8/01/30 | | | 8/20 at 100.00 | | | | | | | | A– | | | | 3,351,540 | |
| | | | | | |
| | 4,270 | | | Philadelphia School District, Pennsylvania, General Obligation Bonds, Series 2010A, 5.000%, 6/01/16 | | | No Opt. Call | | | | | | | | A+ | | | | 4,286,354 | |
| | | | | | |
| | 11,050 | | | Sayre Healthcare Facility Authority, Pennsylvania, Revenue Bonds, Guthrie Healthcare System, Series 2007, 1.206%, 12/01/24 | | | 12/17 at 100.00 | | | | | | | | AA– | | | | 10,773,529 | |
| | | | | | |
| | | | Southcentral Pennsylvania General Authority, Revenue Bonds, Hanover Hospital Inc., Series 2013: | | | | | | | | | | | | | | | | |
| | 1,400 | | | 5.000%, 12/01/19 | | | No Opt. Call | | | | | | | | BBB | | | | 1,564,318 | |
| | 730 | | | 5.000%, 12/01/20 | | | No Opt. Call | | | | | | | | BBB | | | | 830,076 | |
| | 1,105 | | | 5.000%, 12/01/21 | | | No Opt. Call | | | | | | | | BBB | | | | 1,270,186 | |
| | 1,625 | | | 5.000%, 12/01/22 | | | No Opt. Call | | | | | | | | BBB | | | | 1,887,649 | |
| | 1,705 | | | 5.000%, 12/01/23 | | | 6/23 at 100.00 | | | | | | | | BBB | | | | 1,984,194 | |
| | 1,795 | | | 5.000%, 12/01/24 | | | 6/23 at 100.00 | | | | | | | | BBB | | | | 2,068,648 | |
| | | | | | |
| | 50 | | | Trinity Area School District, Washington County, Pennsylvania, General Obligation Bonds, Series 2012, 4.000%, 11/01/19 – AGM Insured | | | No Opt. Call | | | | | | | | A2 | | | | 54,816 | |
| | | | | | |
| | 45 | | | Trinity Area School District, Washington County, Pennsylvania, General Obligation Bonds, Series 2012, 4.000%, 11/01/19 – AGM Insured (ETM) | | | No Opt. Call | | | | | | | | A2 (4) | | | | 49,855 | |
| | 182,070 | | | Total Pennsylvania | | | | | | | | | | | | | | | 198,510,900 | |
| | | | | | |
| | | | Rhode Island – 0.1% | | | | | | | | | | | | | |
| | | | | | |
| | 4,335 | | | Rhode Island Health and Educational Building Corporation, Revenue Bonds, Care New England Health System, Series 2013A, 5.500%, 9/01/28 | | | 9/23 at 100.00 | | | | | | | | BBB | | | | 4,838,163 | |
| | | | | | |
| | | | South Carolina – 1.7% | | | | | | | | | | | | | |
| | | | | | |
| | 2,015 | | | Anderson County School District 5, South Carolina, General Obligation Bonds, Refunding Series 2016, 5.000%, 3/01/20 | | | No Opt. Call | | | | | | | | AA | | | | 2,323,013 | |
| | | | | | |
| | 12,700 | | | Greenville County School District, South Carolina, Installment Purchase Revenue Bonds, Series 2006, 5.000%, 12/01/24 | | | 12/16 at 100.00 | | | | | | | | AA | | | | 13,035,788 | |
| | | | | | |
| | 5,770 | | | Greenville Hospital System Board of Trustees, South Carolina, Hospital Revenue Bonds, Series 2014B, 5.000%, 5/01/34 | | | 5/24 at 100.00 | | | | | | | | AA– | | | | 6,719,684 | |
Nuveen Intermediate Duration Municipal Bond Fund (continued)
| | |
| Portfolio of Investments | | April 30, 2016 |
| | | | | | | | | | | | | | | | | | | | |
Principal
Amount (000) | | | Description (1) | | Optional Call
Provisions (2) | | | | | | | Ratings (3) | | | Value | |
| | | | | | |
| | | | South Carolina (continued) | | | | | | | | | | | | | |
| | | | | | |
| | | | South Carolina JOBS Economic Development Authority, Hospital Revenue Bonds, Bon Secours Health System Obligated Group, Series 2012: | | | | | | | | | | | | | | | | |
| $ | 1,850 | | | 5.000%, 11/01/20 | | | No Opt. Call | | | | | | | | A2 | | | $ | 2,152,845 | |
| | 7,500 | | | 5.000%, 11/01/27 | | | 11/22 at 100.00 | | | | | | | | A2 | | | | 8,802,750 | |
| | 13,190 | | | 5.000%, 11/01/28 | | | 11/22 at 100.00 | | | | | | | | A2 | | | | 15,414,362 | |
| | 1,225 | | | 5.000%, 11/01/29 | | | 11/22 at 100.00 | | | | | | | | A2 | | | | 1,426,598 | |
| | | | | | |
| | | | South Carolina JOBS Economic Development Authority, Economic Development Revenue Bonds, FMU Student Housing LLC – Francis Marion University Project, Series 2014A: | | | | | | | | | | | | | | | | |
| | 1,910 | | | 5.000%, 8/01/27 | | | 8/24 at 100.00 | | | | | | | | Baa3 | | | | 2,148,062 | |
| | 3,925 | | | 5.000%, 8/01/32 | | | No Opt. Call | | | | | | | | Baa3 | | | | 4,327,548 | |
| | | | | | |
| | 1,000 | | | South Carolina Jobs-Economic Development Authority, Hospital Revenue Bonds, Palmetto Health, Refunding & Improvement Series 2009, 5.000%, 8/01/18 | | | No Opt. Call | | | | | | | | BBB+ | | | | 1,081,380 | |
| | | | | | |
| | | | South Carolina Public Service Authority, Santee Cooper Revenue Obligations, Refunding Series 2016A: | | | | | | | | | | | | | | | | |
| | 2,095 | | | 5.000%, 12/01/27 | | | 6/26 at 100.00 | | | | | | | | AA– | | | | 2,632,263 | |
| | 3,000 | | | 5.000%, 12/01/28 | | | 6/26 at 100.00 | | | | | | | | AA– | | | | 3,738,300 | |
| | 7,000 | | | 5.000%, 12/01/29 | | | 6/26 at 100.00 | | | | | | | | AA– | | | | 8,637,370 | |
| | 2,750 | | | 5.000%, 12/01/30 | | | 6/26 at 100.00 | | | | | | | | AA– | | | | 3,373,398 | |
| | 1,835 | | | 5.000%, 12/01/31 | | | 6/26 at 100.00 | | | | | | | | AA– | | | | 2,238,131 | |
| | | | | | |
| | 6,835 | | | South Carolina Transportation Infrastructure Bank, Revenue Bonds, Series 2004B, 5.250%, 10/01/16 – AMBAC Insured | | | No Opt. Call | | | | | | | | A1 | | | | 6,971,905 | |
| | | | | | |
| | 500 | | | Spartanburg Regional Health Services District Inc., Hospital Revenue Bonds, Refunding Series 2008D, 5.250%, 4/15/20 | | | 4/18 at 100.00 | | | | | | | | AA | | | | 542,925 | |
| | | | | | |
| | 1,450 | | | Spartanburg Regional Health Services District, Inc., South Carolina, Hospital Revenue Refunding Bonds, Series 2012A, 5.000%, 4/15/32 | | | 4/22 at 100.00 | | | | | | | | A+ | | | | 1,638,877 | |
| | 76,550 | | | Total South Carolina | | | | | | | | | | | | | | | 87,205,199 | |
| | | | | | |
| | | | South Dakota – 0.2% | | | | | | | | | | | | | |
| | | | | | |
| | | | South Dakota Building Authority, Revenue Bonds, Series 2013B: | | | | | | | | | | | | | | | | |
| | 525 | | | 5.000%, 6/01/22 | | | No Opt. Call | | | | | | | | AA+ | | | | 636,027 | |
| | 1,000 | | | 5.000%, 6/01/24 | | | 6/23 at 100.00 | | | | | | | | AA+ | | | | 1,229,120 | |
| | | | | | |
| | 1,000 | | | South Dakota Health and Educational Facilities Authority, Revenue Bonds, Sanford Health, Series 2007, 5.000%, 11/01/19 (Pre-refunded 5/01/17) | | | 5/17 at 100.00 | | | | | | | | A+ (4) | | | | 1,043,270 | |
| | | | | | |
| | 1,000 | | | South Dakota Health and Educational Facilities Authority, Revenue Bonds, Sanford Health, Series 2009, 5.000%, 11/01/24 | | | 11/19 at 100.00 | | | | | | | | A+ | | | | 1,124,490 | |
| | | | | | |
| | 4,125 | | | South Dakota Health and Educational Facilities Authority, Revenue Bonds, Sanford Health, Series 2014B, 5.000%, 11/01/34 | | | 11/24 at 100.00 | | | | | | | | A+ | | | | 4,785,619 | |
| | | | | | |
| | 1,500 | | | South Dakota Health and Educational Facilities Authority, Revenue Bonds, Vocational Education Program, Series 2008, 5.125%, 8/01/28 (Pre-refunded 8/01/18) – AGC Insured | | | 8/18 at 100.00 | | | | | | | | AA (4) | | | | 1,644,300 | |
| | 9,150 | | | Total South Dakota | | | | | | | | | | | | | | | 10,462,826 | |
| | | | | | |
| | | | Tennessee – 1.4% | | | | | | | | | | | | | |
| | | | | | |
| | 2,265 | | | Chattanooga Health, Educational and Housing Facility Board, Tennessee, Hospital Revenue Bonds, Catholic Health Initiatives, Series 2008D, 6.125%, 10/01/28 | | | 10/18 at 100.00 | | | | | | | | A+ | | | | 2,524,478 | |
| | | | | | |
| | 2,265 | | | Chattanooga-Hamilton County Hospital Authority, Tennessee, Hospital Revenue Bonds, Erlanger Health System, Refunding Series 2014A, 5.000%, 10/01/28 | | | 10/24 at 100.00 | | | | | | | | BBB+ | | | | 2,610,345 | |
| | | | | | |
| | 3,460 | | | Claiborne County, Tennessee, Industrial Development Board, Revenue Refunding Bonds, Lincoln Memorial University Project, Series 2009, 6.125%, 10/01/29 | | | 10/19 at 100.00 | | | | | | | | N/R | | | | 3,723,790 | |
| | | | | | | | | | | | | | | | | | | | |
Principal
Amount (000) | | | Description (1) | | Optional Call
Provisions (2) | | | | | | | Ratings (3) | | | Value | |
| | | | | | |
| | | | Tennessee (continued) | | | | | | | | | | | | | |
| | | | | | |
| $ | 1,200 | | | Harpeth Valley Utilities District of Davidson and Williamson Counties, Tennessee Utilities Revenue Bonds, Series 2014, 4.000%, 9/01/39 | | | 9/24 at 100.00 | | | | | | | | AA | | | $ | 1,278,792 | |
| | | | | | |
| | 985 | | | Jackson, Tennessee, Hospital Revenue Bonds, Jackson-Madison County General Hospital Project, Refunding Series 2008, 5.250%, 4/01/23 | | | 4/18 at 100.00 | | | | | | | | A+ | | | | 1,065,189 | |
| | | | | | |
| | 2,665 | | | Jackson, Tennessee, Hospital Revenue Bonds, Jackson-Madison County General Hospital Project, Refunding Series 2008, 5.250%, 4/01/23 (Pre-refunded 4/01/18) | | | 4/18 at 100.00 | | | | | | | | N/R (4) | | | | 2,894,776 | |
| | | | | | |
| | 750 | | | Johnson City Health and Educational Facilities Board, Tennessee, Revenue Bonds, Mountain States Health Alliance, Series 2006A, 5.000%, 7/01/18 | | | 7/16 at 100.00 | | | | | | | | BBB+ | | | | 755,370 | |
| | | | | | |
| | 5,000 | | | Knox County Health, Educational and Housing Facilities Board, Tennessee, Revenue Bonds, University Health System, Inc., Series 2007, 5.250%, 4/01/27 | | | 4/17 at 100.00 | | | | | | | | BBB+ | | | | 5,136,200 | |
| | | | | | |
| | | | Knox County Health, Educational and Housing Facility Board, Tennessee, Hospital Revenue Refunding Bonds, Covenant Health, Series 2012A: | | | | | | | | | | | | | | | | |
| | 1,400 | | | 4.000%, 1/01/22 | | | No Opt. Call | | | | | | | | A | | | | 1,581,076 | |
| | 3,180 | | | 5.000%, 1/01/23 | | | No Opt. Call | | | | | | | | A | | | | 3,847,037 | |
| | 1,300 | | | 4.000%, 1/01/23 | | | No Opt. Call | | | | | | | | A | | | | 1,483,859 | |
| | 1,760 | | | 5.000%, 1/01/24 | | | No Opt. Call | | | | | | | | A | | | | 2,110,715 | |
| | | | | | |
| | | | Memphis and Shelby County Port Commission, Tennessee, Port Development Revenue Bonds, Series 2011: | | | | | | | | | | | | | | | | |
| | 1,480 | | | 5.250%, 4/01/23 | | | 4/21 at 100.00 | | | | | | | | AA– | | | | 1,732,399 | |
| | 1,560 | | | 5.250%, 4/01/24 | | | 4/21 at 100.00 | | | | | | | | AA– | | | | 1,819,615 | |
| | 1,240 | | | 5.250%, 4/01/25 | | | 4/21 at 100.00 | | | | | | | | AA– | | | | 1,446,361 | |
| | | | | | |
| | 1,085 | | | Memphis, Tennessee, General Improvement Bonds, Series 2005, 5.000%, 10/01/16 – NPFG Insured | | | No Opt. Call | | | | | | | | AA | | | | 1,105,745 | |
| | | | | | |
| | 3,175 | | | Memphis-Shelby County Sports Authority, Tennessee, Revenue Bonds, Memphis Arena, Refunding Series 2007C, 5.000%, 11/01/17 – NPFG Insured | | | No Opt. Call | | | | | | | | AA– | | | | 3,370,358 | |
| | | | | | |
| | 4,430 | | | Memphis-Shelby County Sports Authority, Tennessee, Revenue Bonds, Memphis Arena, Refunding Series 2009A, 5.125%, 11/01/24 | | | 11/19 at 100.00 | | | | | | | | AA– | | | | 4,986,630 | |
| | | | | | |
| | | | Memphis-Shelby County Sports Authority, Tennessee, Revenue Bonds, Memphis Arena, Refunding Series 2009B: | | | | | | | | | | | | | | | | |
| | 1,000 | | | 5.500%, 11/01/20 | | | 11/19 at 100.00 | | | | | | | | AA– | | | | 1,148,040 | |
| | 1,860 | | | 5.250%, 11/01/25 | | | 11/19 at 100.00 | | | | | | | | AA– | | | | 2,107,082 | |
| | | | | | |
| | 8,255 | | | Metropolitan Government of Nashville-Davidson County Health and Educational Facilities Board, Tennessee, Revenue Bonds, Vanderbilt University Medical Center, Series 2016A, 5.000%, 7/01/35 | | | 7/26 at 100.00 | | | | | | | | A3 | | | | 9,720,593 | |
| | | | | | |
| | 1,285 | | | Metropolitan Government of Nashville-Davidson County, Tennessee, General Obligation Bonds, Series 2007A, 5.000%, 5/15/23 (Pre-refunded 5/15/17) | | | 5/17 at 100.00 | | | | | | | | AA (4) | | | | 1,344,059 | |
| | | | | | |
| | 1,400 | | | Sullivan County Health Educational and Housing Facilities Board, Tennessee, Revenue Bonds, Wellmont Health System, Series 2006C, 5.000%, 9/01/19 (Pre-refunded 9/01/16) | | | 9/16 at 100.00 | | | | | | | | BBB+ (4) | | | | 1,419,950 | |
| | | | | | |
| | 11,910 | | | The Tennessee Energy Acquisition Corporation, Gas Revenue Bonds, Series 2006A, 5.250%, 9/01/20 | | | No Opt. Call | | | | | | | | A | | | | 13,730,324 | |
| | 64,910 | | | Total Tennessee | | | | | | | | | | | | | | | 72,942,783 | |
| | | | | | |
| | | | Texas – 8.3% | | | | | | | | | | | | | |
| | | | | | |
| | 3,370 | | | Central Texas Regional Mobility Authority, Revenue Bonds, Senior Lien Refunding Series 2013A, 5.000%, 1/01/33 | | | 1/23 at 100.00 | | | | | | | | BBB+ | | | | 3,798,563 | |
| | | | | | |
| | 3,380 | | | Central Texas Regional Mobility Authority, Revenue Bonds, Senior Lien Series 2011, 6.250%, 1/01/46 | | | 1/21 at 100.00 | | | | | | | | BBB+ | | | | 4,044,305 | |
Nuveen Intermediate Duration Municipal Bond Fund (continued)
| | |
| Portfolio of Investments | | April 30, 2016 |
| | | | | | | | | | | | | | | | | | | | |
Principal
Amount (000) | | | Description (1) | | Optional Call
Provisions (2) | | | | | | | Ratings (3) | | | Value | |
| | | | | | |
| | | | Texas (continued) | | | | | | | | | | | | | |
| | | | | | |
| | | | Central Texas Regional Mobility Authority, Revenue Bonds, Senior Lien, Series 2015A: | | | | | | | | | | | | | | | | |
| $ | 1,945 | | | 5.000%, 1/01/32 | | | 7/25 at 100.00 | | | | | | | | BBB+ | | | $ | 2,275,222 | |
| | 1,390 | | | 5.000%, 1/01/33 | | | 7/25 at 100.00 | | | | | | | | BBB+ | | | | 1,624,771 | |
| | 1,165 | | | 5.000%, 1/01/34 | | | 7/25 at 100.00 | | | | | | | | BBB+ | | | | 1,355,652 | |
| | | | | | |
| | 8,000 | | | Conroe Independent School District, Montgomery County, Texas, General Obligation Bonds, Refunding School Building Series 2012, 5.000%, 2/15/26 | | | 2/21 at 100.00 | | | | | | | | AAA | | | | 9,448,480 | |
| | | | | | |
| | 1,180 | | | Corinth, Texas, Certificates of Obligation, Series 2007, 4.500%, 2/15/19 – NPFG Insured | | | 2/17 at 100.00 | | | | | | | | AA | | | | 1,214,208 | |
| | | | | | |
| | 5,715 | | | Dallas County Utility and Reclamation District, Texas, General Obligation Bonds, Refunding Series 2005A, 5.150%, 2/15/22 – AMBAC Insured | | | 2/17 at 100.00 | | | | | | | | A– | | | | 5,885,936 | |
| | | | | | |
| | 975 | | | Dallas, Texas, General Obligation Bonds, Refunding & Improvements Series 2007, 4.500%, 2/15/27 – NPFG Insured | | | 2/17 at 100.00 | | | | | | | | AA | | | | 1,002,593 | |
| | | | | | |
| | | | Dallas, Texas, General Obligation Bonds, Refunding & Improvements Series 2007: | | | | | | | | | | | | | | | | |
| | 5 | | | 4.500%, 2/15/27 (Pre-refunded 2/15/17) | | | 2/17 at 100.00 | | | | | | | | Aa2 (4) | | | | 5,154 | |
| | 4,225 | | | 4.500%, 2/15/27 (Pre-refunded 2/15/17) – NPFG Insured | | | 2/17 at 100.00 | | | | | | | | Aa2 (4) | | | | 4,355,003 | |
| | | | | | |
| | 2,440 | | | El Paso County, Texas, General Obligation Bonds, Refunding Series 2007, 5.000%, 2/15/18 – NPFG Insured (ETM) | | | No Opt. Call | | | | | | | | AA (4) | | | | 2,627,441 | |
| | | | | | |
| | 1,120 | | | Elgin Independent School District, Bastrop County, Texas, General Obligation Bonds, School Building Series 2007, 4.375%, 8/01/19 | | | 8/17 at 100.00 | | | | | | | | AAA | | | | 1,168,496 | |
| | | | | | |
| | 2,000 | | | Fort Bend Independent School District, Fort Bend County, Texas, General Obligation Bonds, School Building Series 2009, 4.550%, 2/15/25 | | | 8/19 at 100.00 | | | | | | | | AA+ | | | | 2,218,100 | |
| | | | | | |
| | 875 | | | Giddings Independent School District, Fayette, Lee, and Washington Counties, Texas, General Obligation Bonds, School Building Series 2007A, 4.250%, 2/15/19 | | | 2/17 at 100.00 | | | | | | | | Aaa | | | | 898,476 | |
| | | | | | |
| | 7,300 | | | Grand Parkway Transportation Corporation, Texas, System Toll Revenue Bonds, Subordinate Lien Series 2013B, 5.000%, 4/01/53 | | | 10/23 at 100.00 | | | | | | | | AA+ | | | | 8,254,475 | |
| | | | | | |
| | 635 | | | Grand Prairie Independent School District, Dallas County, Texas, General Obligation Bonds, Series 2007A, 4.500%, 2/15/18 (Pre-refunded 2/15/17) | | | 2/17 at 100.00 | | | | | | | | AAA | | | | 654,539 | |
| | | | | | |
| | | | Hale Center Education Facilities Corporation, Texas, Revenue Bonds, Wayland Baptist University Project, Improvement and Refunding Series 2010: | | | | | | | | | | | | | | | | |
| | 875 | | | 4.000%, 3/01/21 | | | No Opt. Call | | | | | | | | A– | | | | 956,454 | |
| | 500 | | | 4.000%, 3/01/22 | | | 3/21 at 100.00 | | | | | | | | A– | | | | 543,375 | |
| | 800 | | | 4.000%, 3/01/23 | | | 3/21 at 100.00 | | | | | | | | A– | | | | 865,760 | |
| | 440 | | | 4.250%, 3/01/25 | | | 3/21 at 100.00 | | | | | | | | A– | | | | 474,747 | |
| | | | | | |
| | 1,820 | | | Harris County Cultural Education Facilities Finance Corporation, Texas, Hospital Revenue Bonds, Memorial Hermann Healthcare System, Refunding Series 2013A, 5.000%, 12/01/23 | | | No Opt. Call | | | | | | | | A+ | | | | 2,203,256 | |
| | | | | | |
| | | | Harris County Cultural Education Facilities Finance Corporation, Texas, Hospital Revenue Bonds, Memorial Hermann Healthcare System, Series 2014A: | | | | | | | | | | | | | | | | |
| | 3,165 | | | 5.000%, 12/01/26 | | | 12/24 at 100.00 | | | | | | | | A+ | | | | 3,877,695 | |
| | 3,735 | | | 5.000%, 12/01/27 | | | 12/24 at 100.00 | | | | | | | | A+ | | | | 4,549,043 | |
| | 3,000 | | | 5.000%, 12/01/28 | | | 12/24 at 100.00 | | | | | | | | A+ | | | | 3,634,680 | |
| | 6,115 | | | 5.000%, 12/01/29 | | | 12/24 at 100.00 | | | | | | | | A+ | | | | 7,371,204 | |
| | | | | | |
| | 5,000 | | | Harris County Flood Control District, Texas, General Obligation Bonds, Refunding Contract Tax Series 2014A, 5.000%, 10/01/25 | | | 10/24 at 100.00 | | | | | | | | Aaa | | | | 6,309,750 | |
| | | | | | |
| | 1,950 | | | Harris County Health Facilities Development Corporation, Texas, Hospital Revenue Bonds, Memorial Hermann Healthcare System, Series 2008B, 7.125%, 12/01/31 (Pre-refunded 12/01/18) | | | 12/18 at 100.00 | | | | | | | | N/R (4) | | | | 2,267,109 | |
| | | | | | | | | | | | | | | | | | | | |
Principal
Amount (000) | | | Description (1) | | Optional Call
Provisions (2) | | | | | | | Ratings (3) | | | Value | |
| | | | | | |
| | | | Texas (continued) | | | | | | | | | | | | | |
| | | | | | |
| $ | 6,845 | | | Harris County Health Facilities Development Corporation, Texas, Hospital Revenue Bonds, St. Luke’s Episcopal Hospital, Series 1991A, 6.750%, 2/15/21 (ETM) | | | 8/16 at 100.00 | | | | | | | | AA+ (4) | | | $ | 7,484,255 | |
| | | | | | |
| | | | Harris County Metropolitan Transit Authority, Texas, Sales and Use Tax Revenue Bonds, Series 2009A: | | | | | | | | | | | | | | | | |
| | 5,120 | | | 5.000%, 11/01/22 (Pre-refunded 11/01/19) | | | 11/19 at 100.00 | | | | | | | | AA+ (4) | | | | 5,848,781 | |
| | 5,385 | | | 5.000%, 11/01/23 (Pre-refunded 11/01/19) | | | 11/19 at 100.00 | | | | | | | | AA+ (4) | | | | 6,151,501 | |
| | 5,660 | | | 5.000%, 11/01/24 (Pre-refunded 11/01/19) | | | 11/19 at 100.00 | | | | | | | | AA+ (4) | | | | 6,465,644 | |
| | | | | | |
| | 2,320 | | | Harris County Metropolitan Transit Authority, Texas, Sales and Use Tax Revenue Bonds, Tender Option Bond Trust 1014, 12.974%, 11/01/41 (IF) (8) | | | 11/21 at 100.00 | | | | | | | | Aa2 | | | | 3,460,048 | |
| | | | | | |
| | | | Harris County-Houston Sports Authority, Texas, Revenue Bonds, Refunding Second Lien Series 2014C: | | | | | | | | | | | | | | | | |
| | 285 | | | 5.000%, 11/15/22 | | | No Opt. Call | | | | | | | | A3 | | | | 338,429 | |
| | 425 | | | 5.000%, 11/15/23 | | | No Opt. Call | | | | | | | | A3 | | | | 512,924 | |
| | | | | | |
| | | | Harris County-Houston Sports Authority, Texas, Revenue Bonds, Refunding Senior Lien Series 2014A: | | | | | | | | | | | | | | | | |
| | 4,795 | | | 5.000%, 11/15/24 – AGM Insured | | | No Opt. Call | | | | | | | | AA | | | | 5,977,255 | |
| | 4,460 | | | 5.000%, 11/15/25 – AGM Insured | | | 11/24 at 100.00 | | | | | | | | AA | | | | 5,507,119 | |
| | 4,095 | | | 5.000%, 11/15/26 – AGM Insured | | | 11/24 at 100.00 | | | | | | | | AA | | | | 5,006,015 | |
| | 11,525 | | | 5.000%, 11/15/27 – AGM Insured | | | 11/24 at 100.00 | | | | | | | | AA | | | | 13,996,075 | |
| | | | | | |
| | | | Harrison County Health Facilities Development Corporation, Texas, Hospital Revenue Bonds, Good Shepherd Health System, Refunding Series 2010: | | | | | | | | | | | | | | | | |
| | 2,270 | | | 5.000%, 7/01/19 | | | No Opt. Call | | | | | | | | BB– | | | | 2,392,921 | |
| | 2,380 | | | 5.000%, 7/01/20 | | | No Opt. Call | | | | | | | | BB– | | | | 2,547,409 | |
| | | | | | |
| | 1,955 | | | Houston, Texas, Airport System Special Facilities Revenue Bonds, United Airlines, Inc. Terminal E Project, Refunding Series 2014, 5.000%, 7/01/29 (Alternative Minimum Tax) | | | 7/24 at 100.00 | | | | | | | | BB– | | | | 2,183,852 | |
| | | | | | |
| | | | Houston, Texas, Hotel Occupancy Tax and Special Revenue Bonds, Convention and Entertainment Facilities Department, Refunding Series 2011B: | | | | | | | | | | | | | | | | |
| | 905 | | | 5.250%, 9/01/24 | | | 9/16 at 100.00 | | | | | | | | A2 | | | | 919,607 | |
| | 985 | | | 5.250%, 9/01/25 | | | 9/16 at 100.00 | | | | | | | | A2 | | | | 999,923 | |
| | 610 | | | 5.250%, 9/01/26 | | | 9/16 at 100.00 | | | | | | | | A2 | | | | 618,839 | |
| | | | | | |
| | | | Houston, Texas, Hotel Occupancy Tax and Special Revenue Bonds, Convention and Entertainment Facilities Department, Refunding Series 2011B: | | | | | | | | | | | | | | | | |
| | 5,450 | | | 5.250%, 9/01/24 (Pre-refunded 9/01/16) | | | 9/16 at 100.00 | | | | | | | | N/R (4) | | | | 5,537,527 | |
| | 5,935 | | | 5.250%, 9/01/25 (Pre-refunded 9/01/16) | | | 9/16 at 100.00 | | | | | | | | N/R (4) | | | | 6,030,316 | |
| | 3,685 | | | 5.250%, 9/01/26 (Pre-refunded 9/01/16) | | | 9/16 at 100.00 | | | | | | | | N/R (4) | | | | 3,744,181 | |
| | | | | | |
| | | | Houston, Texas, Hotel Occupancy Tax and Special Revenue Bonds, Convention and Entertainment Project, Series 2001B: | | | | | | | | | | | | | | | | |
| | 8,000 | | | 0.000%, 9/01/22 – AMBAC Insured | | | No Opt. Call | | | | | | | | A2 | | | | 6,728,880 | |
| | 3,815 | | | 0.000%, 9/01/23 – AMBAC Insured | | | No Opt. Call | | | | | | | | A2 | | | | 3,090,951 | |
| | | | | | |
| | | | Houston, Texas, Subordinate Lien Airport System Revenue Refunding Bonds, Series 2011B: | | | | | | | | | | | | | | | | |
| | 1,900 | | | 5.000%, 7/01/25 | | | 7/21 at 100.00 | | | | | | | | A+ | | | | 2,236,452 | |
| | 2,025 | | | 5.000%, 7/01/26 | | | 7/21 at 100.00 | | | | | | | | A+ | | | | 2,383,587 | |
| | | | | | |
| | | | Houston, Texas, Subordinate Lien Airport System Revenue Refunding Bonds, Series 2012B: | | | | | | | | | | | | | | | | |
| | 18,675 | | | 5.000%, 7/01/31 | | | 7/22 at 100.00 | | | | | | | | A+ | | | | 21,747,224 | |
| | 5,000 | | | 5.000%, 7/01/32 | | | 7/22 at 100.00 | | | | | | | | A+ | | | | 5,803,750 | |
| | | | | | |
| | 715 | | | Howard County Junior College District, Texas, General Obligation Bonds, Series 2007, 4.250%, 2/15/18 – AMBAC Insured | | | 2/17 at 100.00 | | | | | | | | AA– | | | | 733,897 | |
Nuveen Intermediate Duration Municipal Bond Fund (continued)
| | |
| Portfolio of Investments | | April 30, 2016 |
| | | | | | | | | | | | | | | | | | | | |
Principal
Amount (000) | | | Description (1) | | Optional Call
Provisions (2) | | | | | | | Ratings (3) | | | Value | |
| | | | | | |
| | | | Texas (continued) | | | | | | | | | | | | | |
| | | | | | |
| $ | 2,000 | | | Laredo Community College District, Webb County, Texas, General Obligation Bonds, Series 2014, 5.000%, 8/01/32 | | | 8/24 at 100.00 | | | | | | | | AA– | | | $ | 2,367,540 | |
| | | | | | |
| | 6,075 | | | Laredo, Texas, International Toll Bridge Revenue Bonds, Series 2005B, 5.000%, 10/01/18 – AGM Insured | | | No Opt. Call | | | | | | | | AA | | | | 6,099,179 | |
| | | | | | |
| | 1,315 | | | League City, Texas, Waterworks and Sewer System Revenue Bonds, Series 2008, 4.375%, 2/15/23 (Pre-refunded 2/15/17) – AGM Insured | | | 2/17 at 100.00 | | | | | | | | AA (4) | | | | 1,354,805 | |
| | | | | | |
| | 1,245 | | | League City, Texas, Waterworks and Sewer System Revenue Bonds, Series 2008, 4.000%, 2/15/18 – AGM Insured | | | 2/17 at 100.00 | | | | | | | | AA | | | | 1,278,254 | |
| | | | | | |
| | | | Love Field Airport Modernization Corporation, Texas, General Airport Revenue Bonds Series 2015: | | | | | | | | | | | | | | | | |
| | 1,000 | | | 5.000%, 11/01/26 (Alternative Minimum Tax) | | | 11/25 at 100.00 | | | | | | | | A1 | | | | 1,224,080 | |
| | 2,025 | | | 5.000%, 11/01/27 (Alternative Minimum Tax) | | | 11/25 at 100.00 | | | | | | | | A1 | | | | 2,449,967 | |
| | 1,570 | | | 5.000%, 11/01/28 (Alternative Minimum Tax) | | | 11/25 at 100.00 | | | | | | | | A1 | | | | 1,884,298 | |
| | 2,000 | | | 5.000%, 11/01/29 (Alternative Minimum Tax) | | | 11/25 at 100.00 | | | | | | | | A1 | | | | 2,388,300 | |
| | 2,000 | | | 5.000%, 11/01/30 (Alternative Minimum Tax) | | | 11/25 at 100.00 | | | | | | | | A1 | | | | 2,380,300 | |
| | | | | | |
| | 2,200 | | | Love Field Airport Modernization Corporation, Texas, Special Facilities Revenue Bonds, Southwest Airlines Company, Series 2010, 5.250%, 11/01/40 | | | 11/20 at 100.00 | | | | | | | | Baa1 | | | | 2,465,452 | |
| | | | | | |
| | 510 | | | Lubbock Educational Facilities Authority, Texas, Revenue Bonds, Lubbock Christian University, Refunding & Improvement Series 2007, 5.000%, 11/01/16 | | | No Opt. Call | | | | | | | | BBB | | | | 520,312 | |
| | | | | | |
| | | | McCamey County Hospital District, Texas, General Obligation Bonds, Series 2013: | | | | | | | | | | | | | | | | |
| | 3,045 | | | 5.000%, 12/01/25 | | | No Opt. Call | | | | | | | | Ba2 | | | | 3,361,832 | |
| | 2,720 | | | 5.250%, 12/01/28 | | | 12/25 at 100.00 | | | | | | | | Ba2 | | | | 3,057,634 | |
| | | | | | |
| | 1,310 | | | Mission Economic Development Corporation, Texas, Revenue Bonds, Natgasoline Project, Series 2016B, 5.750%, 10/01/31 (WI/DD, Settling 5/04/16) (Alternative Minimum Tax) | | | 10/18 at 103.00 | | | | | | | | BB– | | | | 1,366,003 | |
| | | | | | |
| | | | North Central Texas Health Facilities Development Corporation, Texas, Revenue Bonds, Children’s Medical Center Dallas Project, Series 2012: | | | | | | | | | | | | | | | | |
| | 4,340 | | | 5.000%, 8/15/24 | | | 8/22 at 100.00 | | | | | | | | Aa2 | | | | 5,255,306 | |
| | 4,710 | | | 5.000%, 8/15/25 | | | 8/22 at 100.00 | | | | | | | | Aa2 | | | | 5,658,264 | |
| | 3,920 | | | 5.000%, 8/15/26 | | | 8/22 at 100.00 | | | | | | | | Aa2 | | | | 4,672,993 | |
| | 7,025 | | | 5.000%, 8/15/27 | | | 8/22 at 100.00 | | | | | | | | Aa2 | | | | 8,332,353 | |
| | | | | | |
| | | | North Texas Tollway Authority, Special Projects System Revenue Bonds, Convertible Capital Appreciation Series 2011C: | | | | | | | | | | | | | | | | |
| | 2,370 | | | 0.000%, 9/01/43 (13) | | | 9/31 at 100.00 | | | | | | | | AA+ | | | | 2,426,762 | |
| | 9,130 | | | 0.000%, 9/01/45 (13) | | | 9/31 at 100.00 | | | | | | | | AA+ | | | | 10,071,760 | |
| | | | | | |
| | | | North Texas Tollway Authority, Special Projects System Revenue Bonds, Current Interest Series 2011D: | | | | | | | | | | | | | | | | |
| | 8,000 | | | 5.000%, 9/01/24 | | | 9/21 at 100.00 | | | | | | | | AA+ | | | | 9,582,720 | |
| | 8,600 | | | 5.250%, 9/01/25 | | | 9/21 at 100.00 | | | | | | | | AA+ | | | | 10,412,364 | |
| | 5,005 | | | 5.250%, 9/01/26 | | | 9/21 at 100.00 | | | | | | | | AA+ | | | | 6,059,754 | |
| | | | | | |
| | 305 | | | North Texas Tollway Authority, System Revenue Bonds, Refunding First Tier, Series 2008A, 6.000%, 1/01/24 | | | 1/18 at 100.00 | | | | | | | | A1 | | | | 327,680 | |
| | | | | | |
| | 2,200 | | | North Texas Tollway Authority, System Revenue Bonds, Refunding First Tier, Series 2008A, 6.000%, 1/01/24 (Pre-refunded 1/01/18) | | | 1/18 at 100.00 | | | | | | | | N/R (4) | | | | 2,390,982 | |
| | | | | | |
| | 1,000 | | | Plano Independent School District, Collin County, Texas, General Obligation Bonds, Series 2008A, 5.000%, 2/15/25 (Pre-refunded 2/15/18) | | | 2/18 at 100.00 | | | | | | | | Aaa | | | | 1,076,820 | |
| | | | | | |
| | 875 | | | San Angelo, Texas, Certificates of Obligation Bonds, Tom Green County Series 2007A, 4.400%, 2/15/19 – NPFG Insured | | | 2/17 at 100.00 | | | | | | | | AA+ | | | | 901,005 | |
| | | | | | | | | | | | | | | | | | | | |
Principal
Amount (000) | | | Description (1) | | Optional Call
Provisions (2) | | | | | | | Ratings (3) | | | Value | |
| | | | | | |
| | | | Texas (continued) | | | | | | | | | | | | | |
| | | | | | |
| $ | 565 | | | San Antonio, Texas, Electric and Gas System Revenue Bonds, Refunding Series 1992, 5.000%, 2/01/17 (ETM) | | | No Opt. Call | | | | | | | | AA+ (4) | | | $ | 583,860 | |
| | | | | | |
| | | | San Antonio, Texas, General Obligation Bonds, Series 2006: | | | | | | | | | | | | | | | | |
| | 400 | | | 4.125%, 2/01/19 | | | 7/16 at 100.00 | | | | | | | | AAA | | | | 401,260 | |
| | 460 | | | 4.250%, 2/01/20 | | | 7/16 at 100.00 | | | | | | | | AAA | | | | 461,500 | |
| | | | | | |
| | 575 | | | San Leanna Education Facilities Corporation, Texas, Higher Education Revenue Bonds, Saint Edward’s University Project, Series 2007, 5.000%, 6/01/19 | | | 6/17 at 100.00 | | | | | | | | BBB+ | | | | 597,868 | |
| | | | | | |
| | 870 | | | Sunnyvale School District, Texas, General Obligation Bonds, School Building Series 2007, 4.400%, 2/15/20 | | | 2/17 at 100.00 | | | | | | | | AAA | | | | 895,856 | |
| | | | | | |
| | 4,830 | | | Tarrant County Cultural Education Facilities Finance Corporation, Texas, Hospital Revenue Bonds, Baylor Health Care System, Series 2011A, 5.000%, 11/15/30 | | | 11/21 at 100.00 | | | | | | | | AA– | | | | 5,554,355 | |
| | | | | | |
| | 1,285 | | | Tarrant County Cultural Education Facilities Finance Corporation, Texas, Hospital Revenue Bonds, Hendrick Medical Center, Refunding Series 2013, 5.125%, 9/01/33 | | | 9/23 at 100.00 | | | | | | | | A | | | | 1,460,454 | |
| | | | | | |
| | 5,030 | | | Tarrant County Cultural Education Facilities Finance Corporation, Texas, Revenue Bonds, Texas Health Resources, Refunding Series 2007A, 5.000%, 2/15/19 | | | 2/17 at 100.00 | | | | | | | | AA | | | | 5,209,018 | |
| | | | | | |
| | 2,210 | | | Teague Independent School District, Freestone County, Texas, Unlimited Tax General Obligation Bonds, School Building Series 2008, 5.000%, 2/15/19 | | | 2/18 at 100.00 | | | | | | | | AAA | | | | 2,381,209 | |
| | | | | | |
| | 5,000 | | | Texas Municipal Gas Acquisition and Supply Corporation III, Gas Supply Revenue Bonds, Series 2012, 5.000%, 12/15/21 | | | No Opt. Call | | | | | | | | A3 | | | | 5,855,500 | |
| | | | | | |
| | 3,000 | | | Texas Private Activity Bond Surface Transpiration Corporation, Senior Lien Revenue Bonds, Blueridge Transportation Group, LLC SH 288 Toll Lanes Project, Series 2016,
5.000%, 12/31/40 (WI/DD, Settling 5/09/16) (Alternative Minimum Tax) | | | 12/25 at 100.00 | | | | | | | | Baa3 | | | | 3,329,130 | |
| | | | | | |
| | 2,095 | | | Texas State Transportation Commission, Highway Fund Revenue Bonds, First Tier Series 2007, 5.000%, 4/01/17 | | | No Opt. Call | | | | | | | | Baa1 | | | | 2,181,125 | |
| | | | | | |
| | 3,250 | | | Texas State, General Obligation Bonds, Transportation Commission Mobility Fund, Refunding Series 2014A, 5.000%, 10/01/22 | | | No Opt. Call | | | | | | | | Baa1 | | | | 4,004,910 | |
| | | | | | |
| | | | Texas State, General Obligation Bonds, Transportation Commission Mobility Fund, Series 2008: | | | | | | | | | | | Baa1 | | | | | |
| | 1,660 | | | 5.000%, 4/01/25 (Pre-refunded 4/01/18) | | | 4/18 at 100.00 | | | | | | | | Baa1 (4) | | | | 1,796,220 | |
| | 16,905 | | | 5.000%, 4/01/25 (Pre-refunded 4/01/18) | | | 4/18 at 100.00 | | | | | | | | Baa1 (4) | | | | 18,292,224 | |
| | | | | | |
| | 1,500 | | | Texas State, General Obligation Bonds, Water Financial Assistance, Refunding Series 2007A, 5.000%, 8/01/17 | | | No Opt. Call | | | | | | | | AAA | | | | 1,582,965 | |
| | | | | | |
| | 7,580 | | | Texas Transportation Commission, Central Texas Turnpike System Revenue Bonds, First Tier Refunding Series 2015B, 5.000%, 8/15/37 | | | 8/24 at 100.00 | | | | | | | | A– | | | | 8,812,508 | |
| | | | | | |
| | 16,250 | | | Texas Transportation Commission, Central Texas Turnpike System Revenue Bonds, Second Tier Refunding Series 2015C, 5.000%, 8/15/31 | | | 8/24 at 100.00 | | | | | | | | BBB+ | | | | 18,905,250 | |
| | | | | | |
| | | | Tyler Health Facilities Development Corporation, Texas, Hospital Revenue Bonds, Mother Frances Hospital Regional Healthcare Center, Series 2007: | | | | | | | | | | | | | | | | |
| | 5,000 | | | 5.250%, 7/01/26 | | | 7/17 at 100.00 | | | | | | | | Baa1 | | | | 5,174,500 | |
| | 11,300 | | | 5.250%, 7/01/28 | | | 7/17 at 100.00 | | | | | | | | Baa1 | | | | 11,676,290 | |
| | | | | | |
| | | | Val Verde County, Texas, Pass-Through Toll Revenue and Limited Tax Bonds, Series 2011: | | | | | | | | | | | | | | | | |
| | 2,675 | | | 3.500%, 8/15/18 | | | No Opt. Call | | | | | | | | A | | | | 2,793,663 | |
| | 2,900 | | | 4.000%, 8/15/19 | | | No Opt. Call | | | | | | | | A | | | | 3,118,834 | |
| | 3,015 | | | 4.000%, 8/15/20 | | | No Opt. Call | | | | | | | | A | | | | 3,276,189 | |
| | 3,135 | | | 4.000%, 8/15/21 | | | No Opt. Call | | | | | | | | A | | | | 3,445,177 | |
| | | | | | |
| | 500 | | | Victoria Independent School District, Victoria County, Texas, General Obligation Bonds, School Building Series 2007, 5.000%, 2/15/18 | | | 2/17 at 100.00 | | | | | | | | AAA | | | | 518,120 | |
Nuveen Intermediate Duration Municipal Bond Fund (continued)
| | |
| Portfolio of Investments | | April 30, 2016 |
| | | | | | | | | | | | | | | | | | | | |
Principal
Amount (000) | | | Description (1) | | Optional Call
Provisions (2) | | | | | | | Ratings (3) | | | Value | |
| | | | | | |
| | | | Texas (continued) | | | | | | | | | | | | | |
| | | | | | |
| $ | 1,000 | | | Victoria, Texas, Utility System Revenue Refunding Bonds, Series 2007, 4.400%, 12/01/19 – AMBAC Insured | | | 12/17 at 100.00 | | | | | | | | AA– | | | $ | 1,054,780 | |
| | | | | | |
| | 8,830 | | | Williamson County, Texas, General Obligation Bonds, Limited Tax Refunding Series 2012, 5.000%, 2/15/26 | | | 2/22 at 100.00 | | | | | | | | AAA | | | | 10,670,349 | |
| | 386,655 | | | Total Texas | | | | | | | | | | | | | | | 435,731,682 | |
| | | | | | |
| | | | Utah – 0.4% | | | | | | | | | | | | | |
| | | | | | |
| | 6,345 | | | Riverton, Utah, Hospital Revenue Bonds, IHC Health Services, Inc., Series 2009, 5.000%, 8/15/41 | | | 8/19 at 100.00 | | | | | | | | AA+ | | | | 6,942,382 | |
| | | | | | |
| | | | Utah Associated Municipal Power Systems, Revenue Bonds, Horse Butte Wind Project, Series 2012A: | | | | | | | | | | | | | | | | |
| | 3,340 | | | 5.000%, 9/01/23 | | | 9/22 at 100.00 | | | | | | | | A | | | | 3,964,279 | |
| | 2,000 | | | 5.000%, 9/01/25 | | | 9/22 at 100.00 | | | | | | | | A | | | | 2,396,740 | |
| | 2,265 | | | 5.000%, 9/01/26 | | | 9/22 at 100.00 | | | | | | | | A | | | | 2,697,298 | |
| | | | | | |
| | | | Utah State, General Obligation Bonds, Series 2009, Tender Option Bond Trust 2015-XF2180. Formerly Tender Option Bond Trust 2987: | | | | | | | | | | | | | | | | |
| | 1,250 | | | 16.729%, 7/01/21 (IF) | | | 7/18 at 100.00 | | | | | | | | AAA | | | | 1,710,950 | |
| | 2,500 | | | 16.729%, 7/01/22 (IF) | | | 7/18 at 100.00 | | | | | | | | AAA | | | | 3,421,900 | |
| | 17,700 | | | Total Utah | | | | | | | | | | | | | | | 21,133,549 | |
| | | | | | |
| | | | Virgin Islands – 0.1% | | | | | | | | | | | | | |
| | | | | | |
| | 6,000 | | | Virgin Islands Public Finance Authority, Matching Fund Loan Notes Revenue Bonds, Series 2009B, 5.000%, 10/01/25 | | | 10/19 at 100.00 | | | | | | | | BBB | | | | 6,663,960 | |
| | | | | | |
| | | | Virginia – 0.6% | | | | | | | | | | | | | |
| | | | | | |
| | 10,755 | | | Fairfax County, Virginia, General Obligation Bonds, Refunding Public Improvement Series 2016A, 4.000%, 10/01/19 | | | No Opt. Call | | | | | | | | AAA | | | | 11,908,581 | |
| | | | | | |
| | 750 | | | Roanoke Economic Development Authority, Virginia, Residential Care Facility Mortgage Revenue Refunding Bonds, Virginia Lutheran Homes Brandon Oaks Project, Series 2012, 5.000%, 12/01/32 | | | No Opt. Call | | | | | | | | N/R | | | | 767,280 | |
| | | | | | |
| | | | Stafford County Economic Development Authority, Virginia, Hospital Facilities Revenue Bonds, Mary Washington Healthcare Obligated Group, Refunding Series 2016: | | | | | | | | | | | | | | | | |
| | 1,000 | | | 5.000%, 6/15/30 (WI/DD, Settling 5/05/16) | | | 6/26 at 100.00 | | | | | | | | Baa1 | | | | 1,193,990 | |
| | 1,290 | | | 3.125%, 6/15/31 (WI/DD, Settling 5/05/16) | | | 6/26 at 100.00 | | | | | | | | Baa1 | | | | 1,278,455 | |
| | 2,000 | | | 5.000%, 6/15/32 (WI/DD, Settling 5/05/16) | | | 6/26 at 100.00 | | | | | | | | Baa1 | | | | 2,366,700 | |
| | 1,000 | | | 5.000%, 6/15/33 (WI/DD, Settling 5/05/16) | | | 6/26 at 100.00 | | | | | | | | Baa1 | | | | 1,177,590 | |
| | 195 | | | 5.000%, 6/15/34 (WI/DD, Settling 5/05/16) | | | 6/26 at 100.00 | | | | | | | | Baa1 | | | | 229,256 | |
| | | | | | |
| | 6,325 | | | Virginia Small Business Financing Authority, Senior Lien Revenue Bonds, Elizabeth River Crossing, Opco LLC Project, Series 2012, 5.500%, 1/01/42 (Alternative Minimum Tax) | | | 7/22 at 100.00 | | | | | | | | BBB– | | | | 7,232,638 | |
| | | | | | |
| | 3,650 | | | Wise County Industrial Development Authority, Virginia, Solid Waste and Sewage Disposal Revenue Bonds, Virginia Electric and Power Company, Series 2009A, 2.150%, 10/01/40 (Mandatory put 9/01/20) | | | No Opt. Call | | | | | | | | BBB+ | | | | 3,764,537 | |
| | 26,965 | | | Total Virginia | | | | | | | | | | | | | | | 29,919,027 | |
| | | | | | |
| | | | Washington – 1.3% | | | | | | | | | | | | | |
| | | | | | |
| | 2,950 | | | Clark County Public Utility District 1, Washington, Electric System Revenue Bonds, Series 2007, 5.000%, 1/01/19 – NPFG Insured | | | 1/17 at 100.00 | | | | | | | | AA– | | | | 3,035,107 | |
| | | | | | |
| | 1,990 | | | Clark County Public Utility District 1, Washington, Electric System Revenue Bonds, Series 2007, 5.000%, 1/01/19 (Pre-refunded 1/01/17) | | | 1/17 at 100.00 | | | | | | | | AA– (4) | | | | 2,049,659 | |
| | | | | | | | | | | | | | | | | | | | |
Principal
Amount (000) | | | Description (1) | | Optional Call
Provisions (2) | | | | | | | Ratings (3) | | | Value | |
| | | | | | |
| | | | Washington (continued) | | | | | | | | | | | | | |
| | | | | | |
| $ | 1,595 | | | Douglas County Public Utility District 1, Washington, Revenue Bonds, Wells Hydroelectric, Series 1963, 4.000%, 9/01/18 (ETM) | | | No Opt. Call | | | | | | | | AA (4) | | | $ | 1,652,579 | |
| | | | | | |
| | 9,685 | | | Energy Northwest, Washington, Electric Revenue Bonds, Nuclear Project 1, Refunding Series 2016A, 5.000%, 7/01/26 | | | 7/21 at 100.00 | | | | | | | | Aa1 | | | | 11,466,458 | |
| | | | | | |
| | 555 | | | King County School District 401, Highline, Washington, General Obligation Bonds, Series 2006, 5.250%, 12/01/25 (Pre-refunded 12/01/16) – AGM Insured | | | 12/16 at 100.00 | | | | | | | | AA+ (4) | | | | 570,478 | |
| | | | | | |
| | 265 | | | King County School District 412 Shoreline, Washington, General Obligation Bonds, Series 2008, 5.750%, 12/01/21 | | | 12/18 at 100.00 | | | | | | | | AA+ | | | | 298,779 | |
| | | | | | |
| | 1,175 | | | Skagit County Public Hospital District 1, Washington, Revenue Bonds, Skagit Valley Hospital, Series 2005, 5.375%, 12/01/22 | | | No Opt. Call | | | | | | | | Baa2 | | | | 1,178,900 | |
| | | | | | |
| | 6,000 | | | Washington Health Care Facilities Authority, Revenue Bonds, Fred Hutchinson Cancer Research Center, Series 2011A, 5.375%, 1/01/31 | | | 1/21 at 100.00 | | | | | | | | A | | | | 6,723,659 | |
| | | | | | |
| | | | Washington Health Care Facilities Authority, Revenue Bonds, Fred Hutchinson Cancer Research Center, Series 2015: | | | | | | | | | | | | | | | | |
| | 1,435 | | | 5.000%, 1/01/26 | | | 7/25 at 100.00 | | | | | | | | A | | | | 1,743,782 | |
| | 1,250 | | | 5.000%, 1/01/27 | | | 7/25 at 100.00 | | | | | | | | A | | | | 1,500,712 | |
| | | | | | |
| | | | Washington Health Care Facilities Authority, Revenue Bonds, PeaceHealth, Refunding Series 2014A: | | | | | | | | | | | | | | | | |
| | 1,250 | | | 5.000%, 11/15/22 | | | No Opt. Call | | | | | | | | A+ | | | | 1,518,699 | |
| | 2,000 | | | 5.000%, 11/15/24 | | | 5/24 at 100.00 | | | | | | | | A+ | | | | 2,500,019 | |
| | | | | | |
| | 1,330 | | | Washington State Health Care Facilities Authority, Revenue Bonds, Central Washington Health Services Association, Series 2009, 6.250%, 7/01/24 | | | 7/19 at 100.00 | | | | | | | | Baa1 | | | | 1,506,158 | |
| | | | | | |
| | | | Washington State Health Care Facilities Authority, Revenue Bonds, Central Washington Health Services Association, Series 2009: | | | | | | | | | | | | | | | | |
| | 1,825 | | | 6.250%, 7/01/24 (Pre-refunded 7/01/19) | | | 7/19 at 100.00 | | | | | | | | N/R (4) | | | | 2,132,457 | |
| | 2,000 | | | 6.750%, 7/01/29 (Pre-refunded 7/01/19) | | | 7/19 at 100.00 | | | | | | | | Baa1 (4) | | | | 2,369,559 | |
| | | | | | |
| | 3,250 | | | Washington State Higher Education Facilities Authority, Revenue Bonds, Whitworth University, Series 2009, 5.125%, 10/01/24 | | | 10/19 at 100.00 | | | | | | | | Baa1 | | | | 3,576,624 | |
| | | | | | |
| | 12,015 | | | Washington State, General Obligation Motor Vehicle Fuel Tax Bonds, Series 2008D, 5.000%, 1/01/23 (Pre-refunded 1/01/18) | | | 1/18 at 100.00 | | | | | | | | AA+ (4) | | | | 12,875,393 | |
| | | | | | |
| | 3,330 | | | Washington, General Obligation Bonds, Series 1992B and Series 1992AT-7, 6.400%, 6/01/17 – NPFG Insured | | | No Opt. Call | | | | | | | | AA+ | | | | 3,429,499 | |
| | | | | | |
| | 4,415 | | | Whidbey Island Public Hospital District, Island County, Washington, General Obligation Bonds, Whidbey General Hospital, Series 2013, 5.500%, 12/01/33 | | | 12/22 at 100.00 | | | | | | | | Baa2 | | | | 4,860,870 | |
| | 58,315 | | | Total Washington | | | | | | | | | | | | | | | 64,989,391 | |
| | | | | | |
| | | | West Virginia – 0.1% | | | | | | | | | | | | | |
| | | | | | |
| | 1,000 | | | West Virginia Hospital Finance Authority, Hospital Revenue Bonds, Charleston Area Medical Center, Series 2014A, 5.000%, 9/01/25 | | | No Opt. Call | | | | | | | | A3 | | | | 1,199,439 | |
| | | | | | |
| | 1,645 | | | West Virginia Hospital Finance Authority, Hospital Revenue Bonds, West Virginia United Health System Obligated Group, Refunding Series 2008E, 5.375%, 6/01/28 | | | 12/18 at 100.00 | | | | | | | | A | | | | 1,798,116 | |
| | 2,645 | | | Total West Virginia | | | | | | | | | | | | | | | 2,997,555 | |
| | | | | | |
| | | | Wisconsin – 3.1% | | | | | | | | | | | | | |
| | | | | | |
| | | | University of Wisconsin Hospitals and Clinics Authority, Revenue Bonds, Refunding Series 2013A: | | | | | | | | | | | | | | | | |
| | 335 | | | 5.000%, 4/01/20 | | | No Opt. Call | | | | | | | | Aa3 | | | | 385,678 | |
| | 460 | | | 5.000%, 4/01/22 | | | No Opt. Call | | | | | | | | Aa3 | | | | 555,040 | |
Nuveen Intermediate Duration Municipal Bond Fund (continued)
| | |
| Portfolio of Investments | | April 30, 2016 |
| | | | | | | | | | | | | | | | | | | | |
Principal
Amount (000) | | | Description (1) | | Optional Call
Provisions (2) | | | | | | | Ratings (3) | | | Value | |
| | | | | | |
| | | | Wisconsin (continued) | | | | | | | | | | | | | |
| | | | | | |
| | | | Wisconsin Health & Educational Facs Authority, Health Facilities Revenue Bonds, UnityPoint Health Project, Series 2014A: | | | | | | | | | | | | | | | | |
| $ | 590 | | | 5.000%, 12/01/26 | | | 11/24 at 100.00 | | | | | | | | Aa3 | | | $ | 721,003 | |
| | 3,855 | | | 5.000%, 12/01/27 | | | 11/24 at 100.00 | | | | | | | | Aa3 | | | | 4,673,416 | |
| | | | | | |
| | | | Wisconsin Health and Educational Facilities Authority, Revenue Bonds, Aurora Health Care, Inc., Series 2012A: | | | | | | | | | | | | | | | | |
| | 1,020 | | | 5.000%, 7/15/25 | | | 7/21 at 100.00 | | | | | | | | A2 | | | | 1,186,953 | |
| | 14,395 | | | 5.000%, 7/15/27 – AGM Insured | | | 7/21 at 100.00 | | | | | | | | A2 | | | | 16,562,022 | |
| | | | | | |
| | 2,060 | | | Wisconsin Health and Educational Facilities Authority, Revenue Bonds, Beloit College, Series 2010A, 6.000%, 6/01/30 | | | 6/20 at 100.00 | | | | | | | | Baa2 | | | | 2,323,638 | |
| | | | | | |
| | | | Wisconsin Health and Educational Facilities Authority, Revenue Bonds, Childrens Hospital of Wisconsin Inc., Series 2008B: | | | | | | | | | | | | | | | | |
| | 1,400 | | | 4.350%, 8/15/19 | | | No Opt. Call | | | | | | | | AA | | | | 1,553,663 | |
| | 8,670 | | | 5.500%, 8/15/29 | | | 2/20 at 100.00 | | | | | | | | AA | | | | 9,887,527 | |
| | | | | | |
| | 2,000 | | | Wisconsin Health and Educational Facilities Authority, Revenue Bonds, Divine Savior Healthcare, Series 2006, 5.000%, 5/01/23 | | | 5/16 at 100.00 | | | | | | | | BBB– | | | | 2,006,799 | |
| | | | | | |
| | | | Wisconsin Health and Educational Facilities Authority, Revenue Bonds, Franciscan Sisters of Christian Charity HealthCare Ministry, Series 2007: | | | | | | | | | | | | | | | | |
| | 2,275 | | | 5.000%, 9/01/20 | | | 9/17 at 100.00 | | | | | | | | BBB+ | | | | 2,369,321 | |
| | 2,505 | | | 5.000%, 9/01/22 | | | 9/17 at 100.00 | | | | | | | | BBB+ | | | | 2,607,178 | |
| | | | | | |
| | 1,750 | | | Wisconsin Health and Educational Facilities Authority, Revenue Bonds, Mercy Alliance, Inc., Series 2010A, 5.000%, 6/01/19 | | | No Opt. Call | | | | | | | | A3 | | | | 1,814,102 | |
| | | | | | |
| | 4,370 | | | Wisconsin Health and Educational Facilities Authority, Revenue Bonds, Meriter Hospital Inc., Series 1992A, 6.000%, 12/01/22 – FGIC Insured | | | No Opt. Call | | | | | | | | Aa3 | | | | 4,843,401 | |
| | | | | | |
| | 1,750 | | | Wisconsin Health and Educational Facilities Authority, Revenue Bonds, Ministry Health Care, Inc., Refunding 2012C, 5.000%, 8/15/24 | | | 8/22 at 100.00 | | | | | | | | AA | | | | 2,080,837 | |
| | | | | | |
| | 4,365 | | | Wisconsin Health and Educational Facilities Authority, Revenue Bonds, ProHealth Care, Inc. Obligated Group, Refunding Series 2015, 5.000%, 8/15/39 | | | 8/24 at 100.00 | | | | | | | | A+ | | | | 4,979,285 | |
| | | | | | |
| | | | Wisconsin Health and Educational Facilities Authority, Revenue Bonds, Wheaton Franciscan Healthcare System, Series 2006A: | | | | | | | | | | | | | | | | |
| | 2,455 | | | 5.250%, 8/15/19 (Pre-refunded 8/15/16) | | | 8/16 at 100.00 | | | | | | | | N/R (4) | | | | 2,489,222 | |
| | 11,955 | | | 5.250%, 8/15/20 (Pre-refunded 8/15/16) | | | 8/16 at 100.00 | | | | | | | | N/R (4) | | | | 12,121,652 | |
| | | | | | |
| | 10,050 | | | Wisconsin Health and Educational Facilities Authority, Revenue Bonds, Wheaton Franciscan Services Inc., Series 2006B, 5.125%, 8/15/21 (Pre-refunded 8/15/16) | | | 8/16 at 100.00 | | | | | | | | N/R (4) | | | | 10,186,478 | |
| | | | | | |
| | | | Wisconsin Health and Educational Facilities Authority, Wisconsin, Revenue Bonds, ThedaCare Inc, Series 2015: | | | | | | | | | | | | | | | | |
| | 815 | | | 5.000%, 12/15/23 | | | No Opt. Call | | | | | | | | AA– | | | | 1,006,557 | |
| | 1,200 | | | 5.000%, 12/15/25 | | | 12/24 at 100.00 | | | | | | | | AA– | | | | 1,468,835 | |
| | | | | | |
| | 450 | | | Wisconsin Housing and Economic Development Authority, Insured Mortgage Revenue Refunding Bonds, Series 1977A, 5.800%, 6/01/17 (ETM) | | | 6/17 at 100.00 | | | | | | | | Aa (4) | | | | 462,014 | |
| | | | | | |
| | | | Wisconsin State, General Fund Annual Appropriation Revenue Bonds, Refunding Series 2009A: | | | | | | | | | | | | | | | | |
| | 9,000 | | | 6.000%, 5/01/27 | | | 5/19 at 100.00 | | | | | | | | AA– | | | | 10,332,089 | |
| | 1,920 | | | 6.000%, 5/01/33 | | | 5/19 at 100.00 | | | | | | | | AA– | | | | 2,209,132 | |
| | 5,235 | | | 5.750%, 5/01/33 | | | 5/19 at 100.00 | | | | | | | | AA– | | | | 5,979,573 | |
| | 35,170 | | | 6.000%, 5/01/36 | | | 5/19 at 100.00 | | | | | | | | AA– | | | | 40,466,249 | |
| | | | | | |
| | 5,800 | | | Wisconsin State, General Obligation Bonds, Refunding Series 2014-2, 5.000%, 5/01/24 | | | 5/22 at 100.00 | | | | | | | | AA | | | | 7,055,989 | |
| | | | | | | | | | | | | | | | | | | | | | |
Principal
Amount (000) | | | Description (1) | | | | | | | Optional Call
Provisions (2) | | | Ratings (3) | | | Value | |
| | | | | | |
| | | | Wisconsin (continued) | | | | | | | | | | | | | | |
| | | | | | |
| | | | Wisconsin State, Transportation Revenue Bonds, Series 2014-1: | | | | | | | | | | | | | | | | | | |
| $ | 1,100 | | | 5.000%, 7/01/24 (Pre-refunded 7/01/19) | | | | | | | | | 7/19 at 100.00 | | | | AA+ (4) | | | $ | 1,242,383 | |
| | 3,340 | | | 5.000%, 7/01/25 (Pre-refunded 7/01/19) | | | | | | | | | 7/19 at 100.00 | | | | AA+ (4) | | | | 3,772,329 | |
| | 4,000 | | | 5.000%, 7/01/26 (Pre-refunded 7/01/19) | | | | | | | | | 7/19 at 100.00 | | | | AA+ (4) | | | | 4,517,759 | |
| | 144,290 | | | Total Wisconsin | | | | | | | | | | | | | | | | | 161,860,124 | |
| | | | | | |
| | | | Wyoming – 0.1% | | | | | | | | | | | | | | |
| | | | | | |
| | 5,500 | | | Sweetwater County, Wyoming, Hospital Revenue Bonds, Memorial Hospital Project, Refunding Series 2013A, 5.000%, 9/01/30 | | | | | | | | | 9/23 at 100.00 | | | | BBB– | | | | 6,087,785 | |
| $ | 4,593,582 | | | Total Municipal Bonds (cost $4,815,167,101) | | | | | | | | | | | | | | | | | 5,107,043,360 | |
| | | | | | |
Principal
Amount (000) | | | Description (1) | | | | Coupon | | | Maturity | | | Ratings (3) | | | Value | |
| | | | | | |
| | | | CORPORATE BONDS – 0.0% | | | | | | | | | | | | | | | | | | |
| | | | | | |
| | | | Transportation – 0.0% | | | | | | | | | | | | | | |
| | | | | | |
| $ | 214 | | | Las Vegas Monorail Company, Senior Interest Bonds (9), (10) | | | | | 5.500% | | | | 7/15/19 | | | | N/R | | | $ | 6,406 | |
| | | | | | |
| | 57 | | | Las Vegas Monorail Company, Senior Interest Bonds (9), (10) | | | | | 5.500% | | | | 7/15/55 | | | | N/R | | | | 1,704 | |
| $ | 271 | | | Total Corporate Bonds (cost $24,234) | | | | | | | | | | | | | | | | | 8,110 | |
| | | | | | |
| Shares | | | Description (1), (14) | | | | | | | | | | | | | Value | |
| | | | | | |
| | | | INVESTMENT COMPANIES – 0.3% | | | | | | | | | | | | | | |
| | | | | | |
| | 15,000,000 | | | Eaton Vance Municipal Income Trust | | | | | | | | | | | | | | | | $ | 14,995,050 | |
| | | | Total Investment Companies (cost $15,000,000) | | | | | | | | | | | | | | | 14,995,050 | |
| | | | Total Long-Term Investments (cost $4,830,191,335) | | | | | | | | | | | | | | | 5,122,046,520 | |
| | | | | | |
Principal
Amount (000) | | | Description (1) | | | | | | | Optional Call
Provisions (2) | | | Ratings (3) | | | Value | |
| | | | | | |
| | | | SHORT-TERM INVESTMENTS – 0.6% | | | | | | | | | | | | | | | | | | |
| | | | | | |
| | | | MUNICIPAL BONDS – 0.6% | | | | | | | | | | | | | | | | | | |
| | | | | | |
| | | | California – 0.3% | | | | | | | | | | | | | | |
| | | | | | |
| $ | 12,305 | | | California Pollution Control Financing Authority, Solid Waste Disposal Revenue Bonds, Waste Management, Inc. Project, Refunding Series 2015B-1, 3.000%, 11/01/25 (Alternative Minimum Tax) (11) | | | | | | | | | No Opt. Call | | | | A– | | | $ | 13,014,014 | |
| | | | | | |
| | 3,530 | | | California Pollution Control Financing Authority, Solid Waste Disposal Revenue Bonds, Waste Management Inc., Refunding Series 2015B-2, 3.125%, 11/01/40 (Mandatory put 11/03/25) (Alternative Minimum Tax) (11) | | | | | | | | | No Opt. Call | | | | A– | | | | 3,724,927 | |
| | 15,835 | | | Total California | | | | | | | | | | | | | | | | | 16,738,941 | |
Nuveen Intermediate Duration Municipal Bond Fund (continued)
| | |
| Portfolio of Investments | | April 30, 2016 |
| | | | | | | | | | | | | | | | | | | | |
Principal
Amount (000) | | | Description (1) | | Optional Call
Provisions (2) | | | | | | | Ratings (3) | | | Value | |
| | | | | | |
| | | | New York – 0.3% | | | | | | | | | | | | | |
| | | | | | |
| $ | 8,465 | | | New York City Transitional Finance Authority, New York, Building Aid Revenue Bonds, Tender Option Bond Floater 1075X, Variable Rate Demand Obligation, 0.500%, 1/15/39 (11) | | | 1/19 at 100.00 | | | | | | | | AA | | | $ | 8,465,000 | |
| | | | | | |
| | 4,695 | | | New York Liberty Development Corporation, New York, Liberty Revenue Bonds, 7 World Trade Center Project, Tender Option Bond Floater 1091, Variable Rate Demand Obligation, 0.790%, 9/15/40 (11) | | | 3/22 at 100.00 | | | | | | | | AAA | | | | 4,695,000 | |
| | 13,160 | | | Total New York | | | | | | | | | | | | | | | 13,160,000 | |
| | | | | | |
| | | | Utah – 0.0% | | | | | | | | | | | | | |
| | | | | | |
| | 1,000 | | | Utah Transit Authority, Sales Tax Revenue Bonds, Tender Option Bond Floater 1050, Variable Rate Demand Obligation, 0.510%, 6/15/36 (11) | | | 6/18 at 100.00 | | | | | | | | Aa2 | | | | 1,000,000 | |
| $ | 29,995 | | | Total Short-Term Investments (cost $30,180,675) | | | | | | | 30,898,941 | |
| | | | Total Investments (cost $4,860,372,010) – 99.2% | | | | | | | | | | | | | | | 5,152,945,461 | |
| | | | Other Assets Less Liabilities – 0.8% | | | | | | | | | | | | | | | 39,938,666 | |
| | | | Net Assets – 100% | | | | | | | | | | | | | | $ | 5,192,884,127 | |
| (1) | All percentages shown in the Portfolio of Investments are based on net assets. |
| (2) | Optional Call Provisions (not covered by the report of independent registered public accounting firm): Dates (month and year) and prices of the earliest optional call or redemption. There may be other call provisions at varying prices at later dates. Certain mortgage backed securities may be subject to periodic principal paydowns. |
| (3) | Ratings (not covered by the report of independent registered public accounting firm): Using the highest of Standard & Poor’s Group (“Standard & Poor’s”), Moody’s Investors Service, Inc. (“Moody’s”) or Fitch, Inc. (“Fitch”) rating. Ratings below BBB by Standard & Poor’s, Baa by Moody’s or BBB by Fitch are considered to be below investment grade. Holdings designated N/R are not rated by any of these national rating agencies. |
| (4) | Backed by an escrow or trust containing sufficient U.S. Government or U.S. Government agency securities, which ensure the timely payment of principal and interest. Certain bonds backed by U.S. Government or agency securities are regarded as having an implied rating equal to the rating of such securities. |
| (5) | During July 2010, the original issue for this security (1,000,000 par, 5.40% coupon and May, 15, 2014 maturity) was restructured into two new securities. The first security, which is 30% of the original issue, has 300,000 par, 0.000% coupon and May 15, 2050 maturity. The second security, which is the remaining 70% of the issue, has a 700,000 par, 5.400% coupon and May 15, 2017 maturity. During September 2011, the Adviser concluded this issue is not likely to meet its future interest payment obligations and has cease accruing additional income on the Fund’s records. |
| (6) | During July 2010, the original issue for this security (1,000,000 par, 5.50% coupon and May, 15, 2015 maturity) was restructured into two new securities. The first security, which is 30% of the original issue, has 300,000 par, 0.000% coupon and May 15, 2050 maturity. The second security, which is the remaining 70% of the issue, has a 700,000 par, 5.500% coupon and May 15, 2018 maturity. During September 2011, the Adviser concluded this issue is not likely to meet its future interest payment obligations and has cease accruing additional income on the Fund’s records. |
| (7) | As of, or subsequent to, the end of the reporting period, this security is non-income producing. Non-income producing, in the case of a fixed-income security, generally denotes that the issuer has (1) defaulted on the payment of principal or interest, (2) is under the protection of the Federal Bankruptcy Court or (3) the Fund’s Adviser has concluded that the issue is not likely to meet its future interest payment obligations and has ceased accruing additional income on the Fund’s records. |
| (8) | Investment, or portion of investment, has been pledged to collateralize the net payment obligations for investments in inverse floating rate transactions. |
| (9) | During January 2010, Las Vegas Monorail Company (“Las Vegas Monorail”) filed for federal bankruptcy protection. During March 2012, Las Vegas Monorail emerged from federal bankruptcy with the acceptance of a reorganization plan assigned by the Federal Bankruptcy Court. Under the reorganization plan, the Fund surrendered its Las Vegas Monorail Project Revenue Bonds, First Tier, Series 2000 and in turn received two senior interest corporate bonds: the first with an annual coupon rate of 5.500% maturing on July 15, 2019 and the second with an annual coupon rate of 3.000% (5.500% after December 31, 2015) maturing on July 15, 2055. The Fund is not accruing income for either senior interest corporate bond. |
| (10) | Investment valued at fair value using methods determined in good faith by, or at the discretion of, the Board. For fair value measurement disclosure purposes, investment classified as Level 3. See Notes to Financial Statements, Note 2 – Investment Valuation and Fair Value Measurements for more information. |
| (11) | Investment has a maturity of more than one year, but has variable rate and/or demand features which qualify it as a short-term investment. The rate disclosed is that in effect as of the end of the reporting period. This rate changes periodically based on market conditions or a specified market index. |
| (12) | The coupon for this security increased 0.25% effective January 1, 2016 and will increase an additional 0.25% effective May 11, 2016. |
| (13) | Step-up coupon. The rate shown is the coupon as of the end of the reporting period. |
| (14) | A copy of the most recent financial statements for these investment companies can be obtained directly from the Securities and Exchange Commission (SEC) on its website at http://www.sec.gov. |
| (ETM) | Escrowed to maturity. |
| (IF) | Inverse floating rate investment. |
| (WI/DD) | Investment, or portion of investment purchased on a when-issued or delayed delivery basis. |
See accompanying notes to financial statements.
Nuveen Limited Term Municipal Bond Fund
| | |
| Portfolio of Investments | | April 30, 2016 |
| | | | | | | | | | | | | | | | | | | | |
Principal
Amount (000) | | | Description (1) | | Optional Call
Provisions (2) | | | | | | | Ratings (3) | | | Value | |
| | | | | | |
| | | | LONG-TERM INVESTMENTS – 97.6% | | | | | | | | | | | | | | | | |
| | | | | | |
| | | | MUNICIPAL BONDS – 96.8% | | | | | | | | | | | | | | | | |
| | | | | | |
| | | | Alabama – 0.4% | | | | | | | | | | | | | |
| | | | | | |
| $ | 6,315 | | | Mobile Industrial Development Board, Alabama, Pollution Control Revenue Refunding Bonds, Alabama Power Company Barry Plan, Series 2007A, 1.650%, 6/01/34 (Mandatory put 3/20/17) | | | No Opt. Call | | | | | | | | A1 | | | $ | 6,351,627 | |
| | | | | | |
| | 11,700 | | | Mobile Industrial Development Board, Alabama, Pollution Control Revenue Refunding Bonds, Alabama Power Company Barry Plan, Series 2008, 1.625%, 7/15/34 (Mandatory put 10/02/18) | | | No Opt. Call | | | | | | | | A1 | | | | 11,812,671 | |
| | 18,015 | | | Total Alabama | | | | | | | | | | | | | | | 18,164,298 | |
| | | | | | |
| | | | Alaska – 0.3% | | | | | | | | | | | | | |
| | | | | | |
| | | | Alaska Industrial Development and Export Authority, Power Revenue Bonds, Snettisham Hydroelectric Project, Refunding Series 2015: | | | | | | | | | | | | | | | | |
| | 1,655 | | | 5.000%, 1/01/24 (Alternative Minimum Tax) | | | No Opt. Call | | | | | | | | Baa2 | | | | 1,946,594 | |
| | 3,565 | | | 5.000%, 1/01/26 (Alternative Minimum Tax) | | | 7/25 at 100.00 | | | | | | | | Baa2 | | | | 4,184,383 | |
| | | | | | |
| | | | Alaska State, Sport Fishing Revenue Bonds, Refunding Series 2011: | | | | | | | | | | | | | | | | |
| | 2,680 | | | 5.000%, 4/01/18 | | | No Opt. Call | | | | | | | | A1 | | | | 2,875,050 | |
| | 1,360 | | | 5.000%, 4/01/19 | | | No Opt. Call | | | | | | | | A1 | | | | 1,505,479 | |
| | | | | | |
| | 4,315 | | | Northern Tobacco Securitization Corporation, Alaska, Tobacco Settlement Asset-Backed Bonds, Series 2006A, 4.625%, 6/01/23 | | | No Opt. Call | | | | | | | | Ba1 | | | | 4,339,164 | |
| | 13,575 | | | Total Alaska | | | | | | | | | | | | | | | 14,850,670 | |
| | | | | | |
| | | | Arizona – 3.6% | | | | | | | | | | | | | |
| | | | | | |
| | 3,355 | | | Arizona Board of Regents, Arizona State University System Revenue Bonds, Refunding Series 2015B, 5.000%, 7/01/20 | | | No Opt. Call | | | | | | | | AA | | | | 3,901,999 | |
| | | | | | |
| | 55 | | | Arizona Board of Regents, University of Arizona, System Revenue Refunding Bonds, Series 1992A, 6.200%, 6/01/16 | | | No Opt. Call | | | | | | | | Aa2 | | | | 55,262 | |
| | | | | | |
| | | | Arizona Health Facilities Authority, Hospital System Revenue Bonds, Phoenix Children’s Hospital, Refunding Series 2012A: | | | | | | | | | | | | | | | | |
| | 1,000 | | | 4.000%, 2/01/17 | | | No Opt. Call | | | | | | | | BBB+ | | | | 1,023,780 | |
| | 2,000 | | | 5.000%, 2/01/18 | | | No Opt. Call | | | | | | | | BBB+ | | | | 2,142,280 | |
| | | | | | |
| | 2,980 | | | Arizona School Facilities Board, Certificates of Participation, Series 2008, 5.500%, 9/01/16 | | | No Opt. Call | | | | | | | | AA– | | | | 3,030,392 | |
| | | | | | |
| | | | Arizona State, Certificates of Participation, Department of Administration Series 2010B: | | | | | | | | | | | | | | | | |
| | 11,950 | | | 5.000%, 10/01/16 – AGC Insured | | | No Opt. Call | | | | | | | | AA | | | | 12,172,629 | |
| | 810 | | | 5.000%, 10/01/17 – AGM Insured | | | No Opt. Call | | | | | | | | AA | | | | 858,900 | |
| | | | | | |
| | 7,785 | | | Arizona State, Certificates of Participation, Series 2008A, 5.000%, 9/01/21 (Pre-refunded 3/01/18) – AGM Insured | | | 3/18 at 100.00 | | | | | | | | AA (4) | | | | 8,392,775 | |
| | | | | | |
| | | | Arizona State, Certificates of Participation, Series 2010A: | | | | | | | | | | | | | | | | |
| | 4,700 | | | 5.000%, 10/01/16 – AGM Insured | | | No Opt. Call | | | | | | | | AA | | | | 4,787,561 | |
| | 11,935 | | | 5.000%, 10/01/17 – AGM Insured | | | No Opt. Call | | | | | | | | AA | | | | 12,655,516 | |
| | 2,970 | | | 5.000%, 10/01/19 – AGM Insured | | | No Opt. Call | | | | | | | | AA | | | | 3,369,198 | |
| | | | | | |
| | | | Arizona State, State Lottery Revenue Bonds, Series 2010A: | | | | | | | | | | | | | | | | |
| | 1,945 | | | 5.000%, 7/01/16 – AGM Insured | | | No Opt. Call | | | | | | | | AA | | | | 1,959,899 | |
| | 2,480 | | | 5.000%, 7/01/17 – AGM Insured | | | No Opt. Call | | | | | | | | AA | | | | 2,604,248 | |
| | 5,140 | | | 5.000%, 7/01/18 – AGM Insured | | | No Opt. Call | | | | | | | | AA | | | | 5,592,269 | |
| | 95 | | | 5.000%, 7/01/20 – AGM Insured | | | No Opt. Call | | | | | | | | AA | | | | 109,835 | |
Nuveen Limited Term Municipal Bond Fund (continued)
| | |
| Portfolio of Investments | | April 30, 2016 |
| | | | | | | | | | | | | | | | | | | | |
Principal
Amount (000) | | | Description (1) | | Optional Call
Provisions (2) | | | | | | | Ratings (3) | | | Value | |
| | | | | | |
| | | | Arizona (continued) | | | | | | | | | | | | | |
| | | | | | |
| | | | Chandler, Arizona, General Obligation Bonds, Refunding Series 2014: | | | | | | | | | | | | | | | | |
| $ | 4,000 | | | 5.000%, 7/01/23 | | | No Opt. Call | | | | | | | | AAA | | | $ | 5,016,600 | |
| | 1,500 | | | 5.000%, 7/01/24 | | | No Opt. Call | | | | | | | | AAA | | | | 1,916,280 | |
| | | | | | |
| | | | Dysart Unified School District Number 89, Maricopa County, Arizona, General Obligation Bonds, Refunding Series 2014: | | | | | | | | | | | | | | | | |
| | 675 | | | 5.000%, 7/01/18 | | | No Opt. Call | | | | | | | | AA– | | | | 733,779 | |
| | 335 | | | 5.000%, 7/01/19 | | | No Opt. Call | | | | | | | | AA– | | | | 376,061 | |
| | 575 | | | 5.000%, 7/01/20 | | | No Opt. Call | | | | | | | | AA– | | | | 664,286 | |
| | 765 | | | 5.000%, 7/01/21 | | | No Opt. Call | | | | | | | | AA– | | | | 905,286 | |
| | | | | | |
| | 2,205 | | | Greater Arizona Development Authority, Infrastructure Revenue Bonds, Series 2006A, 5.000%, 8/01/19 – NPFG Insured | | | 8/16 at 100.00 | | | | | | | | AA– | | | | 2,231,416 | |
| | | | | | |
| | 11,000 | | | Maricopa County Pollution Control Corporation, Arizona, Pollution Control Revenue Refunding Bonds, Public Service Company of New Mexico Palo Verde Project, Series 2010A, 2.400%, 6/01/43 (Mandatory put 6/01/20) | | | No Opt. Call | | | | | | | | BBB+ | | | | 11,213,070 | |
| | | | | | |
| | | | Maricopa County Unified School District 60 Higley, Arizona, General Obligation Bonds, Refunding School Improvement Series 2015: | | | | | | | | | | | | | | | | |
| | 500 | | | 4.000%, 7/01/19 – AGM Insured | | | No Opt. Call | | | | | | | | AA | | | | 549,685 | |
| | 575 | | | 4.000%, 7/01/20 – AGM Insured | | | No Opt. Call | | | | | | | | AA | | | | 646,317 | |
| | 1,565 | | | 4.000%, 7/01/21 – AGM Insured | | | No Opt. Call | | | | | | | | AA | | | | 1,789,593 | |
| | 750 | | | 4.000%, 7/01/22 – AGC Insured | | | No Opt. Call | | | | | | | | AA | | | | 864,930 | |
| | | | | | |
| | 1,270 | | | Maricopa County Unified School District 60 Higley, Arizona, General Obligation Bonds, School Improvement Project of 2013, Series 2014A, 4.000%, 7/01/24 | | | No Opt. Call | | | | | | | | A+ | | | | 1,481,963 | |
| | | | | | |
| | 1,250 | | | Maricopa County Unified School District 90 Saddle Mountain, Arizona, General Obligation Bonds, School Improvement Project 2013, Series 2014, 5.000%, 7/01/18 – MAC Insured | | | No Opt. Call | | | | | | | | AA | | | | 1,361,113 | |
| | | | | | |
| | 3,800 | | | Mesa, Arizona, Excise Tax Revenue Bonds, Series 2013, 5.000%, 7/01/27 | | | 7/17 at 100.00 | | | | | | | | AA+ | | | | 3,980,310 | |
| | | | | | |
| | | | Mesa, Arizona, General Obligation Bonds, Refunding Series 2012: | | | | | | | | | | | | | | | | |
| | 1,425 | | | 4.000%, 7/01/20 | | | No Opt. Call | | | | | | | | Aa2 | | | | 1,595,530 | |
| | 2,225 | | | 4.000%, 7/01/21 | | | No Opt. Call | | | | | | | | Aa2 | | | | 2,535,299 | |
| | 2,055 | | | 4.000%, 7/01/22 | | | No Opt. Call | | | | | | | | Aa2 | | | | 2,378,436 | |
| | | | | | |
| | | | Mesa, Arizona, Street and Highway User Revenue Bonds, Refunding Series 2012: | | | | | | | | | | | | | | | | |
| | 2,020 | | | 5.000%, 7/01/16 | | | No Opt. Call | | | | | | | | AA | | | | 2,035,756 | |
| | 2,100 | | | 5.000%, 7/01/21 | | | No Opt. Call | | | | | | | | AA | | | | 2,497,845 | |
| | 4,015 | | | 5.000%, 7/01/22 | | | No Opt. Call | | | | | | | | AA | | | | 4,884,047 | |
| | | | | | |
| | 3,615 | | | Mesa, Arizona, Street and Highway User Revenue Bonds, Refunding Series 2015, 5.000%, 7/01/26 | | | 7/25 at 100.00 | | | | | | | | AA | | | | 4,500,820 | |
| | | | | | |
| | | | Mesa, Arizona, Utility System Revenue Bonds, Refunding Series 2012: | | | | | | | | | | | | | | | | |
| | 5,370 | | | 5.000%, 7/01/20 | | | No Opt. Call | | | | | | | | Aa2 | | | | 6,247,941 | |
| | 6,115 | | | 5.000%, 7/01/21 | | | No Opt. Call | | | | | | | | Aa2 | | | | 7,292,076 | |
| | | | | | |
| | 10 | | | Pima County Industrial Development Authority, Arizona, Revenue Bonds, Tucson Electric Power Company Project, Series 2013A, 4.000%, 9/01/29 | | | 3/23 at 100.00 | | | | | | | | A3 | | | | 10,970 | |
| | | | | | |
| | | | Pinal County, Arizona, Pledged Revenue Obligations, Refunding Series 2014: | | | | | | | | | | | | | | | | |
| | 1,285 | | | 5.000%, 8/01/22 | | | No Opt. Call | | | | | | | | AA– | | | | 1,552,781 | |
| | 2,000 | | | 5.000%, 8/01/23 | | | No Opt. Call | | | | | | | | AA– | | | | 2,460,560 | |
| | 2,000 | | | 5.000%, 8/01/24 | | | No Opt. Call | | | | | | | | AA– | | | | 2,501,060 | |
| | | | | | |
| | 1,000 | | | Pinal County, Arizona, Pledged Revenue Obligations, Series 2014, 5.000%, 8/01/24 | | | No Opt. Call | | | | | | | | AA– | | | | 1,250,530 | |
| | | | | | |
| | 19,780 | | | Salt River Project Agricultural Improvement and Power District, Arizona, Electric System Revenue Bonds, Series 2009B, 4.000%, 1/01/18 | | | No Opt. Call | | | | | | | | Aa1 | | | | 20,876,801 | |
| | | | | | | | | | | | | | | | | | | | |
Principal
Amount (000) | | | Description (1) | | Optional Call
Provisions (2) | | | | | | | Ratings (3) | | | Value | |
| | | | | | |
| | | | Arizona (continued) | | | | | | | | | | | | | |
| | | | | | |
| $ | 755 | | | Salt Verde Financial Corporation, Arizona, Senior Gas Revenue Bonds, Citigroup Energy Inc Prepay Contract Obligations, Series 2007, 5.000%, 12/01/16 | | | No Opt. Call | | | | | | | | BBB+ | | | $ | 772,909 | |
| | | | | | |
| | 2,500 | | | Tucson, Arizona, Water System Revenue Bonds, Refunding Series 2016A, 5.000%, 7/01/19 | | | No Opt. Call | | | | | | | | AA | | | | 2,819,825 | |
| | | | | | |
| | 840 | | | Yuma County Industrial Development Authority, Arizona, Exempt Revenue Bonds, Far West Water & Sewer Inc. Refunding, Series 2007A, 6.500%, 12/01/17 (Alternative Minimum Tax) | | | No Opt. Call | | | | | | | | N/R | | | | 818,815 | |
| | 149,075 | | | Total Arizona | | | | | | | | | | | | | | | 163,419,233 | |
| | | | | | |
| | | | Arkansas – 0.4% | | | | | | | | | | | | | |
| | | | | | |
| | 3,010 | | | Jefferson County, Arkansas, Pollution Control Revenue Refunding Bonds, Entergy Arkansas, Inc. Project, Series 2013, 1.550%, 10/01/17 | | | No Opt. Call | | | | | | | | A2 | | | | 3,040,612 | |
| | | | | | |
| | | | Little Rock, Arkansas, Hotel and Restaurant Gross Receipts Tax Bonds, Series 2014: | | | | | | | | | | | | | | | | |
| | 500 | | | 3.000%, 7/01/17 | | | No Opt. Call | | | | | | | | A+ | | | | 513,340 | |
| | 500 | | | 5.000%, 7/01/19 | | | No Opt. Call | | | | | | | | A+ | | | | 562,625 | |
| | 670 | | | 5.000%, 7/01/21 | | | No Opt. Call | | | | | | | | A+ | | | | 796,188 | |
| | | | | | |
| | | | Pulaski County Public Facilities Board, Arkansas, Health Facilities Revenue Bonds, CARTI Project, Series 2013: | | | | | | | | | | | | | | | | |
| | 630 | | | 4.000%, 7/01/18 | | | No Opt. Call | | | | | | | | BBB+ | | | | 658,489 | |
| | 890 | | | 4.000%, 7/01/19 | | | No Opt. Call | | | | | | | | BBB+ | | | | 937,268 | |
| | 995 | | | 4.000%, 7/01/20 | | | No Opt. Call | | | | | | | | BBB+ | | | | 1,058,431 | |
| | 1,020 | | | 4.000%, 7/01/21 | | | No Opt. Call | | | | | | | | BBB+ | | | | 1,090,451 | |
| | 1,075 | | | 4.000%, 7/01/22 | | | No Opt. Call | | | | | | | | BBB+ | | | | 1,152,991 | |
| | 1,180 | | | 5.250%, 7/01/27 | | | 7/23 at 100.00 | | | | | | | | BBB+ | | | | 1,337,931 | |
| | 470 | | | 5.250%, 7/01/28 | | | 7/23 at 100.00 | | | | | | | | BBB+ | | | | 530,329 | |
| | | | | | |
| | | | Pulaski County Public Facilities Board, Arkansas, Healthcare Revenue Bonds, Baptist Health, Series 2014: | | | | | | | | | | | | | | | | |
| | 500 | | | 5.000%, 12/01/22 | | | No Opt. Call | | | | | | | | A+ | | | | 603,525 | |
| | 1,740 | | | 5.000%, 12/01/23 | | | No Opt. Call | | | | | | | | A+ | | | | 2,130,856 | |
| | 2,000 | | | 5.000%, 12/01/24 | | | No Opt. Call | | | | | | | | A+ | | | | 2,471,580 | |
| | | | | | |
| | 1,265 | | | University of Arkansas, Fayetteville, Various Facilities Revenue Bonds, Refunding Series 2015A, 5.000%, 11/01/20 | | | No Opt. Call | | | | | | | | Aa2 | | | | 1,480,948 | |
| | 16,445 | | | Total Arkansas | | | | | | | | | | | | | | | 18,365,564 | |
| | | | | | |
| | | | California – 4.6% | | | | | | | | | | | | | |
| | | | | | |
| | 2,595 | | | California Department of Water Resources, Power Supply Revenue Bonds, Series 2010L, 5.000%, 5/01/17 | | | No Opt. Call | | | | | | | | AA+ | | | | 2,708,765 | |
| | | | | | |
| | 4,000 | | | California Health Facilities Financing Authority, Revenue Bonds, Saint Joseph Health System, Series 2013C, 5.000%, 7/01/43 (Mandatory put 10/15/19) | | | No Opt. Call | | | | | | | | AA– | | | | 4,525,960 | |
| | | | | | |
| | 5,875 | | | California Pollution Control Financing Authority, Solid Waste Disposal Revenue Bonds, Waste Management Inc., Series 2015A-1, 3.375%, 7/01/25 (Alternative Minimum Tax) | | | No Opt. Call | | | | | | | | A– | | | | 6,363,565 | |
| | | | | | |
| | | | California State Public Works Board, Lease Revenue Bonds, Various Capital Projects, Series 2009-I: | | | | | | | | | | | | | | | | |
| | 4,440 | | | 5.000%, 11/01/16 | | | No Opt. Call | | | | | | | | A+ | | | | 4,541,188 | |
| | 3,675 | | | 5.000%, 11/01/17 | | | No Opt. Call | | | | | | | | A+ | | | | 3,914,316 | |
| | | | | | |
| | 1,865 | | | California State, Economic Recovery Revenue Bonds, Refunding Series 2009A, 5.000%, 7/01/16 (ETM) | | | No Opt. Call | | | | | | | | Aaa | | | | 1,879,789 | |
| | | | | | |
| | | | California State, Economic Recovery Revenue Bonds, Refunding Series 2009A: | | | | | | | | | | | | | | | | |
| | 235 | | | 5.250%, 7/01/21 (Pre-refunded 7/01/19) | | | 7/19 at 100.00 | | | | | | | | Aaa | | | | 268,126 | |
| | 125 | | | 5.250%, 7/01/21 (Pre-refunded 7/01/19) | | | 7/19 at 100.00 | | | | | | | | Aaa | | | | 142,620 | |
Nuveen Limited Term Municipal Bond Fund (continued)
| | |
| Portfolio of Investments | | April 30, 2016 |
| | | | | | | | | | | | | | | | | | | | |
Principal
Amount (000) | | | Description (1) | | Optional Call
Provisions (2) | | | | | | | Ratings (3) | | | Value | |
| | | | | | |
| | | | California (continued) | | | | | | | | | | | | | |
| | | | | | |
| $ | 27,780 | | | California Statewide Communities Development Authority, Health Facility Revenue Bonds, Community Hospital of the Monterey Peninsula, Series 2012A, 1.870%, 6/01/23 | | | 5/16 at 103.00 | | | | | | | | N/R | | | $ | 28,011,130 | |
| | | | | | |
| | 750 | | | California Statewide Communities Development Authority, Revenue Bonds, Huntington Memorial Hospital, Refunding Series 2014B, 5.000%, 7/01/24 | | | No Opt. Call | | | | | | | | A | | | | 924,885 | |
| | | | | | |
| | | | California Statewide Communities Development Authority, Student Housing Revenue Bonds, University of California, Irvine East Campus Apartments, CHF-Irvine, LLC, Refunding Series 2016: | | | | | | | | | | | | | | | | |
| | 2,050 | | | 5.000%, 5/15/18 | | | No Opt. Call | | | | | | | | Baa1 | | | | 2,220,765 | |
| | 1,000 | | | 5.000%, 5/15/19 | | | No Opt. Call | | | | | | | | Baa1 | | | | 1,117,970 | |
| | 1,000 | | | 5.000%, 5/15/20 | | | No Opt. Call | | | | | | | | Baa1 | | | | 1,146,730 | |
| | | | | | |
| | 2,310 | | | California Statewide Community Development Authority, Revenue Bonds, Los Angeles Jewish Home for the Aging-Fountainview Gonda, Series 2014B, 3.000%, 8/01/21 | | | 11/16 at 100.00 | | | | | | | | AA– | | | | 2,332,268 | |
| | | | | | |
| | 650 | | | California Statewide Community Development Authority, Revenue Bonds, Los Angeles Jewish Home for the Aging-Fountainview Gonda, Series 2014D, 4.750%, 8/01/20 | | | 11/16 at 100.00 | | | | | | | | N/R | | | | 653,744 | |
| | | | | | |
| | | | Delano, California, Certificates of Participation, Delano Regional Medical Center, Series 2012: | | | | | | | | | | | | | | | | |
| | 2,260 | | | 4.000%, 1/01/18 | | | No Opt. Call | | | | | | | | BBB– | | | | 2,348,163 | |
| | 2,350 | | | 5.000%, 1/01/19 | | | No Opt. Call | | | | | | | | BBB– | | | | 2,523,900 | |
| | 2,470 | | | 5.000%, 1/01/20 | | | No Opt. Call | | | | | | | | BBB– | | | | 2,701,192 | |
| | 2,590 | | | 5.000%, 1/01/21 | | | No Opt. Call | | | | | | | | BBB– | | | | 2,876,791 | |
| | | | | | |
| | 2,150 | | | East Bay Municipal Utility District, Alameda and Contra Costa Counties, California, Water System Revenue Bonds, Refunding Series 2015A, 5.000%, 6/01/24 | | | No Opt. Call | | | | | | | | AAA | | | | 2,759,697 | |
| | | | | | |
| | | | Golden State Tobacco Securitization Corporation, California, Tobacco Settlement Asset-Backed Bonds, Series 2007A-1: | | | | | | | | | | | | | | | | |
| | 2,665 | | | 5.000%, 6/01/16 | | | No Opt. Call | | | | | | | | Aaa | | | | 2,675,687 | |
| | 27,865 | | | 4.500%, 6/01/27 | | | 6/17 at 100.00 | | | | | | | | B+ | | | | 28,320,593 | |
| | 1,000 | | | 5.000%, 6/01/33 | | | 6/17 at 100.00 | | | | | | | | B– | | | | 1,001,120 | |
| | | | | | |
| | 500 | | | Lake Elsinore Public Financing Authority, California, Local Agency Revenue Bonds, Canyon Hills Improvement Area A & C, Series 2014C, 5.000%, 9/01/21 | | | No Opt. Call | | | | | | | | N/R | | | | 576,765 | |
| | | | | | |
| | 2,730 | | | Los Angeles Department of Water and Power, California, Waterworks Revenue Bonds, Series 2013B, 5.000%, 7/01/22 | | | No Opt. Call | | | | | | | | AA+ | | | | 3,360,903 | |
| | | | | | |
| | 530 | | | Los Angeles Harbors Department, California, Revenue Bonds, Series 1988, 7.600%, 10/01/18 (ETM) | | | No Opt. Call | | | | | | | | AA+ (4) | | | | 578,813 | |
| | | | | | |
| | 13,020 | | | Metropolitan Water District of Southern California, Water Revenue Refunding Bonds, Series 2014A, 3.000%, 7/01/25 (Mandatory put 10/01/20) | | | 7/20 at 100.00 | | | | | | | | AAA | | | | 14,050,793 | |
| | | | | | |
| | | | Moulton Niguel Water District, California, Certificates of Participation, Refunding Series 2003: | | | | | | | | | | | | | | | | |
| | 1,850 | | | 5.000%, 9/01/19 (Pre-refunded 9/01/16) – AMBAC Insured | | | 9/16 at 100.00 | | | | | | | | AAA | | | | 1,878,657 | |
| | 2,255 | | | 5.000%, 9/01/20 (Pre-refunded 9/01/16) – AMBAC Insured | | | 9/16 at 100.00 | | | | | | | | AAA | | | | 2,289,930 | |
| | | | | | |
| | 2,640 | | | New Haven Unified School District, California, General Obligation Bonds, Refunding Series 2014A, 5.000%, 8/01/25 – BAM Insured | | | 8/24 at 100.00 | | | | | | | | AA | | | | 3,322,625 | |
| | | | | | |
| | 5,500 | | | Palomar Pomerado Health Care District, California, Certificates of Participation, Series 2010, 5.250%, 11/01/21 | | | 11/20 at 100.00 | | | | | | | | Ba1 | | | | 5,976,795 | |
| | | | | | |
| | 140 | | | San Bernardino, California, GNMA Mortgage-Backed Securities Program Single Family Mortgage Revenue Refunding Bonds, Series 1990A, 7.500%, 5/01/23 (ETM) | | | No Opt. Call | | | | | | | | Aaa | | | | 171,632 | |
| | | | | | |
| | 22,285 | | | San Diego Public Facilities Financing Authority, California, Sewerage Revenue Bonds, Refunding Senior Lien Series 2016A, 4.000%, 5/15/20 | | | No Opt. Call | | | | | | | | AA+ | | | | 25,039,426 | |
| | | | | | | | | | | | | | | | | | | | |
Principal
Amount (000) | | | Description (1) | | Optional Call
Provisions (2) | | | | | | | Ratings (3) | | | Value | |
| | | | | | |
| | | | California (continued) | | | | | | | | | | | | | |
| | | | | | |
| | | | San Diego Redevelopment Agency Successor Agency, California, Tax Allocation Bonds, Refunding Series 2016A: | | | | | | | | | | | | | | | | |
| $ | 11,340 | | | 3.000%, 9/01/17 | | | No Opt. Call | | | | | | | | AA– | | | $ | 11,698,231 | |
| | 2,785 | | | 4.000%, 9/01/18 | | | No Opt. Call | | | | | | | | AA– | | | | 2,995,992 | |
| | 920 | | | 5.000%, 9/01/19 | | | No Opt. Call | | | | | | | | AA– | | | | 1,045,948 | |
| | | | | | |
| | | | Sierra View Local Health Care District, California, Revenue Bonds, Refunding Series 2010: | | | | | | | | | | | | | | | | |
| | 500 | | | 3.500%, 7/01/16 | | | No Opt. Call | | | | | | | | A | | | | 501,905 | |
| | 500 | | | 3.800%, 7/01/17 | | | No Opt. Call | | | | | | | | A | | | | 513,365 | |
| | | | | | |
| | 3,500 | | | Southern California Public Power Authority, Transmission Project Revenue Bonds, Southern Transmission Project, Subordinate Refunding Series 2015C, 5.000%, 7/01/24 | | | No Opt. Call | | | | | | | | AA– | | | | 4,479,090 | |
| | | | | | |
| | 15,000 | | | University of California, General Revenue Bonds, Series 2016AT, 1.400%, 5/15/46 (Mandatory put 5/15/21) | | | 11/20 at 100.00 | | | | | | | | AA | | | | 15,048,750 | |
| | | | | | |
| | | | Washington Township Health Care District, California, Revenue Bonds, Refunding Series 2015A: | | | | | | | | | | | | | | | | |
| | 565 | | | 4.000%, 7/01/18 | | | No Opt. Call | | | | | | | | Baa1 | | | | 595,131 | |
| | 1,315 | | | 5.000%, 7/01/19 | | | No Opt. Call | | | | | | | | Baa1 | | | | 1,452,510 | |
| | 1,225 | | | 4.000%, 7/01/20 | | | No Opt. Call | | | | | | | | Baa1 | | | | 1,332,065 | |
| | 1,130 | | | 5.000%, 7/01/22 | | | No Opt. Call | | | | | | | | Baa1 | | | | 1,314,145 | |
| | 980 | | | 5.000%, 7/01/23 | | | No Opt. Call | | | | | | | | Baa1 | | | | 1,153,313 | |
| | | | | | |
| | 1,935 | | | Western California Municipal Water District Facilities Authority Adjustable Rate Water Revenue Refunding Bonds Series 2016A, 1.500%, 10/01/39 (Mandatory put 10/01/20) | | | 7/20 at 100.00 | | | | | | | | AA+ | | | | 1,946,320 | |
| | 194,845 | | | Total California | | | | | | | | | | | | | | | 207,282,068 | |
| | | | | | |
| | | | Colorado – 1.5% | | | | | | | | | | | | | |
| | | | | | |
| | 2,750 | | | Broomfield, Colorado, Sewer Activity Enterprise, Sewer and Wastewater Reclamation Revenue Bonds, Refunding Series 2012, 4.000%, 12/01/20 | | | No Opt. Call | | | | | | | | A2 | | | | 3,068,395 | |
| | | | | | |
| | 7,245 | | | Colorado Health Facilities Authority, Colorado, Revenue Bonds, Adventist Health, Sunbelt Obligated Group, Series 2014E, 5.000%, 11/15/24 | | | No Opt. Call | | | | | | | | Aa2 | | | | 8,988,582 | |
| | | | | | |
| | 12,320 | | | Colorado Health Facilities Authority, Colorado, Revenue Bonds, Catholic Health Initiatives, Series 2008D-3, 5.000%, 10/01/38 (Mandatory put 11/12/21) | | | No Opt. Call | | | | | | | | A+ | | | | 14,467,499 | |
| | | | | | |
| | | | Colorado Health Facilities Authority, Colorado, Revenue Bonds, Evangelical Lutheran Good Samaritan Society Project, Series 2013A: | | | | | | | | | | | | | | | | |
| | 500 | | | 3.000%, 6/01/17 | | | No Opt. Call | | | | | | | | A– | | | | 510,390 | |
| | 300 | | | 3.000%, 6/01/18 | | | No Opt. Call | | | | | | | | A– | | | | 310,746 | |
| | 500 | | | 4.000%, 6/01/19 | | | No Opt. Call | | | | | | | | A– | | | | 536,175 | |
| | 1,000 | | | 4.000%, 6/01/20 | | | No Opt. Call | | | | | | | | A– | | | | 1,083,350 | |
| | 2,000 | | | 5.000%, 6/01/21 | | | No Opt. Call | | | | | | | | A– | | | | 2,286,120 | |
| | 2,300 | | | 5.000%, 6/01/22 | | | No Opt. Call | | | | | | | | A– | | | | 2,656,822 | |
| | 500 | | | 5.000%, 6/01/23 | | | No Opt. Call | | | | | | | | A– | | | | 584,540 | |
| | | | | | |
| | 670 | | | Colorado Health Facilities Authority, Revenue Bonds, Evangelical Lutheran Good Samaritan Society, Series 2006, 5.250%, 6/01/17 | | | 6/16 at 100.00 | | | | | | | | BBB+ | | | | 672,626 | |
| | | | | | |
| | 1,650 | | | Colorado Health Facilities Authority, Revenue Bonds, Evangelical Lutheran Good Samaritan Society, Series 2006, 5.250%, 6/01/17 (Pre-refunded 6/01/16) | | | 6/16 at 100.00 | | | | | | | | N/R (4) | | | | 1,656,963 | |
| | | | | | |
| | | | Commerce City, Colorado, Sales and Use Tax Revenue Bonds, Series 2014: | | | | | | | | | | | | | | | | |
| | 240 | | | 4.000%, 8/01/16 – AGM Insured | | | No Opt. Call | | | | | | | | AA | | | | 242,117 | |
| | 275 | | | 1.750%, 8/01/17 – AGM Insured | | | No Opt. Call | | | | | | | | AA | | | | 278,383 | |
| | 250 | | | 2.000%, 8/01/19 – AGM Insured | | | No Opt. Call | | | | | | | | AA | | | | 258,283 | |
| | | | | | |
| | 1,500 | | | Denver City and County, Colorado, Airport System Revenue Bonds, Subordinate Lien Series 2013B, 5.000%, 11/15/19 | | | No Opt. Call | | | | | | | | A | | | | 1,707,870 | |
Nuveen Limited Term Municipal Bond Fund (continued)
| | |
| Portfolio of Investments | | April 30, 2016 |
| | | | | | | | | | | | | | | | | | | | |
Principal
Amount (000) | | | Description (1) | | Optional Call
Provisions (2) | | | | | | | Ratings (3) | | | Value | |
| | | | | | |
| | | | Colorado (continued) | | | | | | | | | | | | | |
| | | | | | |
| $ | 6,560 | | | Denver, Colorado, Airport System Revenue Bonds, Refunding Series 2006A, 5.000%, 11/15/21 – FGIC Insured | | | 11/16 at 100.00 | | | | | | | | AA– | | | $ | 6,725,312 | |
| | | | | | |
| | | | E-470 Public Highway Authority, Colorado, Senior Revenue Bonds, Refunding Series 2015A: | | | | | | | | | | | | | | | | |
| | 1,000 | | | 5.000%, 9/01/19 | | | No Opt. Call | | | | | | | | BBB+ | | | | 1,128,420 | |
| | 1,175 | | | 5.000%, 9/01/20 | | | No Opt. Call | | | | | | | | BBB+ | | | | 1,359,228 | |
| | | | | | |
| | 4,500 | | | E-470 Public Highway Authority, Colorado, Toll Revenue Bonds, Series 2004C, 5.000%, 9/01/17 – NPFG Insured | | | No Opt. Call | | | | | | | | AA– | | | | 4,731,480 | |
| | | | | | |
| | 265 | | | Kit Carson County Health Service District, Colorado, Health Care Facility Revenue Bonds, Series 2007, 6.100%, 1/01/17 | | | No Opt. Call | | | | | | | | N/R | | | | 271,312 | |
| | | | | | |
| | 10,000 | | | Northwest Parkway Public Highway Authority, Colorado, Revenue Bonds, Senior Series 2001C, 5.800%, 6/15/25 (Pre-refunded 6/15/16) – AGM Insured | | | 6/16 at 100.00 | | | | | | | | AA (4) | | | | 10,067,800 | |
| | | | | | |
| | | | Plaza Metropolitan District 1, Lakewood, Colorado, Tax Increment Revenue Bonds, Refunding Series 2013: | | | | | | | | | | | | | | | | |
| | 1,000 | | | 5.000%, 12/01/17 | | | No Opt. Call | | | | | | | | N/R | | | | 1,036,940 | |
| | 1,000 | | | 5.000%, 12/01/18 | | | No Opt. Call | | | | | | | | N/R | | | | 1,055,600 | |
| | 59,500 | | | Total Colorado | | | | | | | | | | | | | | | 65,684,953 | |
| | | | | | |
| | | | Connecticut – 1.9% | | | | | | | | | | | | | |
| | | | | | |
| | 3,900 | | | Connecticut Health and Educational Facilities Authority, Revenue Bonds, Ascension Health, Series 1999B, 1.550%, 11/15/29 (Mandatory put 2/01/17) | | | No Opt. Call | | | | | | | | AA+ | | | | 3,921,957 | |
| | | | | | |
| | 1,230 | | | Connecticut Health and Educational Facilities Authority, Revenue Bonds, Yale University, Series 2014A, 0.800%, 7/01/48 (Mandatory put 7/26/17) | | | No Opt. Call | | | | | | | | AAA | | | | 1,230,467 | |
| | | | | | |
| | 14,725 | | | Connecticut Health and Educational Facilities Authority, Revenue Bonds, Yale University, Series 2015A, 1.375%, 7/01/35 (Mandatory put 7/11/18) | | | No Opt. Call | | | | | | | | AAA | | | | 14,882,852 | |
| | | | | | |
| | 21,210 | | | Connecticut Health and Educational Facilities Authority, Revenue Bonds, Yale University, Variable Rate Demand Obligations, Series 1999-U1, 1.000%, 7/01/33 | | | No Opt. Call | | | | | | | | AAA | | | | 21,201,940 | |
| | | | | | |
| | 18,100 | | | Connecticut Health and Educational Facilities Authority, Revenue Bonds, Yale University, Variable Rate Demand Obligations, Series 1999-U2, 1.000%, 7/01/33 | | | No Opt. Call | | | | | | | | AAA | | | | 18,093,122 | |
| | | | | | |
| | 320 | | | Connecticut State Development Authority, Health Facilities Revenue Bonds, Alzheimer’s Resource Center of Connecticut, Inc., Series 2007, 5.200%, 8/15/17 (ETM) | | | No Opt. Call | | | | | | | | N/R (4) | | | | 329,818 | |
| | | | | | |
| | 5,000 | | | Connecticut State, Special Tax Obligation Transportation Infrastructure Purposes Bonds, Series 2013A, 5.000%, 10/01/20 | | | No Opt. Call | | | | | | | | AA | | | | 5,831,150 | |
| | | | | | |
| | 835 | | | Eastern Connecticut Resource Recovery Authority, Solid Waste Revenue Bonds, Wheelabrator Lisbon Project, Series 1993A, 5.500%, 1/01/20 (Alternative Minimum Tax) | | | 7/16 at 100.00 | | | | | | | | A– | | | | 840,653 | |
| | | | | | |
| | 2,670 | | | New Britain, Connecticut, General Obligation Bonds, Series 2012, 3.000%, 3/15/17 – AGM Insured (ETM) | | | No Opt. Call | | | | | | | | A2 (4) | | | | 2,726,497 | |
| | | | | | |
| | | | New Haven, Connecticut, General Obligation Bonds, Refunding Series 2014B: | | | | | | | | | | | | | | | | |
| | 1,915 | | | 4.000%, 8/01/19 – AGM Insured | | | No Opt. Call | | | | | | | | AA | | | | 2,093,478 | |
| | 2,000 | | | 5.000%, 8/01/20 – AGM Insured | | | No Opt. Call | | | | | | | | AA | | | | 2,308,620 | |
| | | | | | |
| | 775 | | | South Central Connecticut Regional Water Authority, Water System Revenue Bonds, Twenty-Ninth Series 2014, 5.000%, 8/01/22 | | | No Opt. Call | | | | | | | | Aa3 | | | | 936,502 | |
| | | | | | |
| | | | Stratford, Connecticut, General Obligation Bonds, Series 2014: | | | | | | | | | | | | | | | | |
| | 350 | | | 3.000%, 12/15/19 | | | No Opt. Call | | | | | | | | AA | | | | 373,510 | |
| | 525 | | | 5.000%, 12/15/21 | | | No Opt. Call | | | | | | | | AA | | | | 627,013 | |
| | | | | | | | | | | | | | | | | | | | |
Principal
Amount (000) | | | Description (1) | | Optional Call
Provisions (2) | | | | | | | Ratings (3) | | | Value | |
| | | | | | |
| | | | Connecticut (continued) | | | | | | | | | | | | | |
| | | | | | |
| | | | West Haven, Connecticut, General Obligation Bonds, Series 2012: | | | | | | | | | | | | | | | | |
| $ | 2,500 | | | 5.000%, 8/01/16 – AGM Insured | | | No Opt. Call | | | | | | | | AA | | | $ | 2,526,850 | |
| | 2,095 | | | 5.000%, 8/01/22 – AGM Insured | | | No Opt. Call | | | | | | | | AA | | | | 2,475,745 | |
| | 2,000 | | | 5.000%, 8/01/23 – AGM Insured | | | 8/22 at 100.00 | | | | | | | | AA | | | | 2,339,780 | |
| | 1,000 | | | 5.000%, 8/01/25 – AGM Insured | | | 8/22 at 100.00 | | | | | | | | AA | | | | 1,152,150 | |
| | 81,150 | | | Total Connecticut | | | | | | | | | | | | | | | 83,892,104 | |
| | | | | | |
| | | | Delaware – 0.5% | | | | | | | | | | | | | |
| | | | | | |
| | | | Delaware Health Facilities Authority, Revenue Bonds, Nanticoke Memorial Hospital, Series 2013: | | | | | | | | | | | | | | | | |
| | 600 | | | 4.000%, 7/01/16 | | | No Opt. Call | | | | | | | | BBB | | | | 602,334 | |
| | 1,810 | | | 5.000%, 7/01/18 | | | No Opt. Call | | | | | | | | BBB | | | | 1,918,256 | |
| | 1,905 | | | 5.000%, 7/01/19 | | | No Opt. Call | | | | | | | | BBB | | | | 2,062,334 | |
| | 2,000 | | | 5.000%, 7/01/20 | | | No Opt. Call | | | | | | | | BBB | | | | 2,203,960 | |
| | 275 | | | 5.000%, 7/01/21 | | | No Opt. Call | | | | | | | | BBB | | | | 306,950 | |
| | | | | | |
| | | | New Castle County, Delaware, General Obligation Bonds, Series 2015: | | | | | | | | | | | | | | | | |
| | 6,465 | | | 5.000%, 10/01/19 | | | No Opt. Call | | | | | | | | AAA | | | | 7,383,289 | |
| | 7,470 | | | 5.000%, 10/01/20 | | | No Opt. Call | | | | | | | | AAA | | | | 8,796,523 | |
| | 20,525 | | | Total Delaware | | | | | | | | | | | | | | | 23,273,646 | |
| | | | | | |
| | | | District of Columbia – 0.3% | | | | | | | | | | | | | |
| | | | | | |
| | | | District of Columbia, Income Tax Secured Revenue Bonds, Series 2009D: | | | | | | | | | | | | | | | | |
| | 1,150 | | | 5.000%, 12/01/16 | | | No Opt. Call | | | | | | | | AAA | | | | 1,180,682 | |
| | 1,115 | | | 5.000%, 12/01/17 | | | No Opt. Call | | | | | | | | AAA | | | | 1,191,935 | |
| | | | | | |
| | 10,025 | | | District of Columbia, Revenue Bonds, Georgetown University, Series 2001C, 5.250%, 4/01/34 (Mandatory put 4/01/23) | | | 10/18 at 100.00 | | | | | | | | A | | | | 10,978,077 | |
| | 12,290 | | | Total District of Columbia | | | | | | | | | | | | | | | 13,350,694 | |
| | | | | | |
| | | | Florida – 5.3% | | | | | | | | | | | | | |
| | | | | | |
| | | | Broward County School Board, Florida, Certificates of Participation, Series 2015A: | | | | | | | | | | | | | | | | |
| | 2,500 | | | 5.000%, 7/01/19 | | | No Opt. Call | | | | | | | | Aa3 | | | | 2,811,450 | |
| | 4,000 | | | 5.000%, 7/01/20 | | | No Opt. Call | | | | | | | | Aa3 | | | | 4,625,520 | |
| | | | | | |
| | | | Broward County, Florida, Airport System Revenue Bonds, Series 2015A: | | | | | | | | | | | | | | | | |
| | 5,000 | | | 5.000%, 10/01/24 (Alternative Minimum Tax) | | | No Opt. Call | | | | | | | | A+ | | | | 6,157,250 | |
| | 5,000 | | | 5.000%, 10/01/25 (Alternative Minimum Tax) | | | No Opt. Call | | | | | | | | A+ | | | | 6,204,650 | |
| | 2,295 | | | 5.000%, 10/01/26 (Alternative Minimum Tax) | | | 10/25 at 100.00 | | | | | | | | A+ | | | | 2,806,854 | |
| | 4,100 | | | 5.000%, 10/01/27 (Alternative Minimum Tax) | | | 10/25 at 100.00 | | | | | | | | A+ | | | | 5,016,350 | |
| | | | | | |
| | | | Citizens Property Insurance Corporation, Florida, Coastal Account Senior Secured Bonds, Series 2015A-1: | | | | | | | | | | | | | | | | |
| | 3,250 | | | 5.000%, 6/01/18 | | | 12/17 at 100.00 | | | | | | | | AA– | | | | 3,455,790 | |
| | 5,010 | | | 5.000%, 6/01/20 | | | 12/19 at 100.00 | | | | | | | | AA– | | | | 5,687,152 | |
| | 18,050 | | | 5.000%, 6/01/22 | | | 12/21 at 100.00 | | | | | | | | AA– | | | | 21,486,901 | |
| | 3,775 | | | 5.000%, 6/01/25 | | | 12/24 at 100.00 | | | | | | | | AA– | | | | 4,680,925 | |
| | | | | | |
| | 4,120 | | | Citizens Property Insurance Corporation, Florida, High Risk Account Revenue Bonds, Series 2007A, 5.000%, 3/01/17 – NPFG Insured (ETM) | | | No Opt. Call | | | | | | | | AA– (4) | | | | 4,269,515 | |
| | | | | | |
| | 2,865 | | | Citizens Property Insurance Corporation, Florida, High Risk Assessment Revenue, Senior Secured Bonds, Series 2009A-1, 5.500%, 6/01/17 | | | No Opt. Call | | | | | | | | A+ | | | | 3,010,628 | |
Nuveen Limited Term Municipal Bond Fund (continued)
| | |
| Portfolio of Investments | | April 30, 2016 |
| | | | | | | | | | | | | | | | | | | | |
Principal
Amount (000) | | | Description (1) | | Optional Call
Provisions (2) | | | | | | | Ratings (3) | | | Value | |
| | | | | | |
| | | | Florida (continued) | | | | | | | | | | | | | |
| | | | | | |
| | | | Citizens Property Insurance Corporation, Florida, High-Risk Account Revenue Bonds, Coastal Account Senior Secured Series 2011A-1: | | | | | | | | | | | | | | | | |
| $ | 3,840 | | | 5.000%, 6/01/18 | | | No Opt. Call | | | | | | | | AA– | | | $ | 4,165,747 | |
| | 190 | | | 5.000%, 6/01/19 | | | No Opt. Call | | | | | | | | AA– | | | | 212,800 | |
| | | | | | |
| | | | Citizens Property Insurance Corporation, Florida, High-Risk Account Senior Secured Bonds Series 2010A-1: | | | | | | | | | | | | | | | | |
| | 160 | | | 4.000%, 6/01/16 | | | No Opt. Call | | | | | | | | A+ | | | | 160,512 | |
| | 665 | | | 5.250%, 6/01/17 | | | No Opt. Call | | | | | | | | A+ | | | | 697,000 | |
| | 150 | | | 4.250%, 6/01/17 | | | No Opt. Call | | | | | | | | A+ | | | | 155,595 | |
| | 580 | | | 4.250%, 6/01/17 – AGM Insured | | | No Opt. Call | | | | | | | | AA | | | | 601,959 | |
| | | | | | |
| | | | Citizens Property Insurance Corporation, Florida, Personal and Commercial Lines Account Bonds, Senior Secured Series 2012A-1: | | | | | | | | | | | | | | | | |
| | 100 | | | 3.000%, 6/01/16 | | | No Opt. Call | | | | | | | | AA– | | | | 100,231 | |
| | 7,605 | | | 5.000%, 6/01/17 | | | No Opt. Call | | | | | | | | AA– | | | | 7,953,841 | |
| | | | | | |
| | 6,100 | | | Escambia County, Florida, Pollution Control Revenue Bonds, Gulf Power Company Project, Refunding Series 2003, 1.550%, 6/01/23 (Mandatory put 6/15/16) | | | No Opt. Call | | | | | | | | A2 | | | | 6,105,734 | |
| | | | | | |
| | 1,690 | | | Escambia County, Florida, Pollution Control Revenue Bonds, Gulf Power Company, Refunding Series 1997, 2.100%, 7/01/22 (Mandatory put 4/11/19) | | | No Opt. Call | | | | | | | | A2 | | | | 1,732,689 | |
| | | | | | |
| | | | Florida Department of Environmental Protection, Florida Forever Revenue Bonds, Series 2007B: | | | | | | | | | | | | | | | | |
| | 4,480 | | | 5.000%, 7/01/17 – NPFG Insured | | | No Opt. Call | | | | | | | | AA– | | | | 4,709,331 | |
| | 6,575 | | | 5.000%, 7/01/19 – NPFG Insured | | | 7/17 at 101.00 | | | | | | | | AA– | | | | 6,974,497 | |
| | | | | | |
| | 5,880 | | | Florida Municipal Power Agency, Power Supply Revenue Bonds, All Requirements Project, Refunding Series 2016A, 5.000%, 10/01/20 | | | No Opt. Call | | | | | | | | A+ | | | | 6,831,149 | |
| | | | | | |
| | 2,655 | | | Florida Municipal Power Agency, Revenue Bonds, Saint Lucie Project, Refunding Series 2011A, 5.000%, 10/01/20 | | | No Opt. Call | | | | | | | | A2 | | | | 3,084,473 | |
| | | | | | |
| | | | Florida State Board of Education, Lottery Revenue Bonds, Series 2010A: | | | | | | | | | | | | | | | | |
| | 2,830 | | | 5.000%, 7/01/16 | | | No Opt. Call | | | | | | | | AAA | | | | 2,852,272 | |
| | 1,300 | | | 5.000%, 7/01/17 | | | No Opt. Call | | | | | | | | AAA | | | | 1,366,547 | |
| | | | | | |
| | 1,500 | | | Florida State Department of General Services, Division of Facilities Management, Florida Facilities Pool Revenue Bonds, Series 2005A, 5.000%, 9/01/18 – AMBAC Insured | | | No Opt. Call | | | | | | | | AA+ | | | | 1,520,985 | |
| | | | | | |
| | 7,220 | | | Florida State Turnpike Authority, Turnpike Revenue Bonds, Department of Transportation, Refunding Series 2016A, 5.000%, 7/01/19 | | | No Opt. Call | | | | | | | | Aa2 | | | | 8,150,875 | |
| | | | | | |
| | | | Halifax Hospital Medical Center, Daytona Beach, Florida, Hospital Revenue Bonds, Series 2006: | | | | | | | | | | | | | | | | |
| | 715 | | | 5.250%, 6/01/26 (Pre-refunded 6/01/16) | | | 6/16 at 100.00 | | | | | | | | N/R (4) | | | | 718,032 | |
| | 290 | | | 5.250%, 6/01/26 (Pre-refunded 6/01/16) | | | 6/16 at 100.00 | | | | | | | | A– (4) | | | | 291,241 | |
| | | | | | |
| | 4,625 | | | Hernando County, Florida, Revenue Bonds, Criminal Justice Complex Financing Program, Series 1986, 7.650%, 7/01/16 – FGIC Insured | | | No Opt. Call | | | | | | | | AA– | | | | 4,679,436 | |
| | | | | | |
| | 2,200 | | | Hillsborough County School District, Florida, Sales Tax Revenue Refunding Bonds, Series 2015B, 5.000%, 10/01/20 – AGM Insured | | | No Opt. Call | | | | | | | | AA | | | | 2,554,838 | |
| | | | | | |
| | 2,500 | | | Manatee County, Florida, Revenue Bonds, Refunding & Improvement Series 2013, 5.000%, 10/01/20 | | | No Opt. Call | | | | | | | | AA+ | | | | 2,919,100 | |
| | | | | | |
| | 1,540 | | | Marion County School Board, Florida, Certificates of Participation, Series 2007B, 5.000%, 6/01/18 (Pre-refunded 6/01/17) – AMBAC Insured | | | 6/17 at 100.00 | | | | | | | | A2 (4) | | | | 1,613,165 | |
| | | | | | |
| | 355 | | | Martin County Industrial Development Authority, Florida, Industrial Development Revenue Refunding Bonds, Indiantown Cogeneration LP, Series 2013, 3.950%, 12/15/21 (Alternative Minimum Tax) | | | 6/20 at 100.00 | | | | | | | | Ba1 | | | | 371,153 | |
| | | | | | | | | | | | | | | | | | | | |
Principal
Amount (000) | | | Description (1) | | Optional Call
Provisions (2) | | | | | | | Ratings (3) | | | Value | |
| | | | | | |
| | | | Florida (continued) | | | | | | | | | | | | | |
| | | | | | |
| | | | Miami-Dade County Expressway Authority, Florida, Toll System Revenue Bonds, Refunding Series 2014B: | | | | | | | | | | | | | | | | |
| $ | 3,000 | | | 5.000%, 7/01/20 | | | No Opt. Call | | | | | | | | A | | | $ | 3,469,800 | |
| | 2,250 | | | 5.000%, 7/01/21 | | | No Opt. Call | | | | | | | | A | | | | 2,662,605 | |
| | 1,750 | | | 5.000%, 7/01/22 | | | No Opt. Call | | | | | | | | A | | | | 2,100,088 | |
| | 4,000 | | | 5.000%, 7/01/23 | | | No Opt. Call | | | | | | | | A | | | | 4,878,680 | |
| | | | | | |
| | | | Miami-Dade County Industrial Development Authority, Florida, Solid Waste Revenue Bonds, Waste Management Inc. of Florida Projects 1 & 2, Series 2004: | | | | | | | | | | | | | | | | |
| | 3,725 | | | 3.750%, 12/01/18 | | | No Opt. Call | | | | | | | | A– | | | | 3,961,463 | |
| | 4,000 | | | 3.750%, 12/01/18 | | | No Opt. Call | | | | | | | | A– | | | | 4,253,920 | |
| | | | | | |
| | 2,740 | | | Miami-Dade County School Board, Florida, Certificates of Participation, Series 2015D, 5.000%, 2/01/20 | | | No Opt. Call | | | | | | | | A | | | | 3,126,778 | |
| | | | | | |
| | | | Miami-Dade County, Florida, Special Obligation Bonds, Capital Asset Acquisition, Series 2010E: | | | | | | | | | | | | | | | | |
| | 1,640 | | | 4.000%, 4/01/17 | | | No Opt. Call | | | | | | | | AA– | | | | 1,687,117 | |
| | 1,705 | | | 5.000%, 4/01/18 | | | No Opt. Call | | | | | | | | AA– | | | | 1,835,876 | |
| | 1,790 | | | 5.000%, 4/01/19 | | | No Opt. Call | | | | | | | | AA– | | | | 1,985,558 | |
| | 1,880 | | | 5.000%, 4/01/20 | | | No Opt. Call | | | | | | | | AA– | | | | 2,133,161 | |
| | | | | | |
| | 1,415 | | | Miami-Dade County, Florida, Transit System Sales Surtax Revenue Bonds, Series 2009A, 5.000%, 7/01/16 – AGC Insured | | | No Opt. Call | | | | | | | | AA | | | | 1,426,037 | |
| | | | | | |
| | 3,615 | | | Miami-Dade County, Florida, Water and Sewer System Revenue Bonds, Refunding Series 2008B, 5.250%, 10/01/17 – AGM Insured | | | No Opt. Call | | | | | | | | AA | | | | 3,852,939 | |
| | | | | | |
| | 1,145 | | | North Brevard County Hospital District, Florida, Revenue Bonds, Parrish Medical Center Project, Refunding Series 2008, 5.125%, 10/01/16 | | | No Opt. Call | | | | | | | | BBB+ | | | | 1,163,240 | |
| | | | | | |
| | 12,035 | | | North Sumter County Utility Dependent District, Florida, Utility Revenue Bonds, Series 2010, 5.000%, 10/01/20 | | | No Opt. Call | | | | | | | | A | | | | 13,222,132 | |
| | | | | | |
| | 1,910 | | | Orlando-Orange County Expressway Authority, Florida, Senior Lien Revenue Bonds, Series 1988, 7.625%, 7/01/18 – AMBAC Insured (ETM) | | | No Opt. Call | | | | | | | | A (4) | | | | 2,101,439 | |
| | | | | | |
| | 5,000 | | | Palm Beach County Solid Waste Authority, Florida, Refunding Revenue Bonds, Refunding Series 2011, 5.000%, 10/01/25 | | | 10/21 at 100.00 | | | | | | | | AA+ | | | | 5,952,500 | |
| | | | | | |
| | 2,050 | | | Port Everglades Authority, Florida, Port Facilities Revenue Bonds, Series 1986, 7.125%, 11/01/16 (ETM) | | | No Opt. Call | | | | | | | | Aaa | | | | 2,113,058 | |
| | | | | | |
| | | | Port St. Lucie, Florida, Utility System Revenue Bonds, Refunding Series 2014: | | | | | | | | | | | | | | | | |
| | 550 | | | 5.000%, 9/01/20 | | | No Opt. Call | | | | | | | | A+ | | | | 631,631 | |
| | 500 | | | 5.000%, 9/01/22 | | | No Opt. Call | | | | | | | | A+ | | | | 594,330 | |
| | 500 | | | 5.000%, 9/01/23 | | | No Opt. Call | | | | | | | | A+ | | | | 602,780 | |
| | | | | | |
| | 2,275 | | | Putnam County Development Authority, Florida, Pollution Control Revenue Bonds, Seminole Electric Cooperative, Series 2007A, 5.350%, 3/15/42 (Mandatory put 5/01/18) – AMBAC Insured | | | No Opt. Call | | | | | | | | A– | | | | 2,458,866 | |
| | | | | | |
| | 3,060 | | | South Broward Hospital District, Florida, Hospital Revenue Bonds, Refunding Series 2015, 5.000%, 5/01/19 | | | No Opt. Call | | | | | | | | AA | | | | 3,427,353 | |
| | | | | | |
| | | | South Florida Water Management District, Certificates of Participation, Series 2015: | | | | | | | | | | | | | | | | |
| | 2,240 | | | 5.000%, 10/01/17 | | | No Opt. Call | | | | | | | | AA | | | | 2,380,179 | |
| | 2,825 | | | 5.000%, 10/01/18 | | | No Opt. Call | | | | | | | | AA | | | | 3,118,037 | |
| | 1,605 | | | 5.000%, 10/01/19 | | | No Opt. Call | | | | | | | | AA | | | | 1,826,843 | |
| | | | | | |
| | 5,730 | | | Tampa Bay, Florida, Regional Water Supply Authority, Utility System Revenue Bonds, Series 2015A, 5.000%, 10/01/26 | | | 10/25 at 100.00 | | | | | | | | AA+ | | | | 7,328,212 | |
Nuveen Limited Term Municipal Bond Fund (continued)
| | |
| Portfolio of Investments | | April 30, 2016 |
| | | | | | | | | | | | | | | | | | | | |
Principal
Amount (000) | | | Description (1) | | Optional Call
Provisions (2) | | | | | | | Ratings (3) | | | Value | |
| | | | | | |
| | | | Florida (continued) | | | | | | | | | | | | | |
| | | | | | |
| | | | Tampa, Florida, Cigarette Tax Allocation Bonds, H. Lee Moffitt Cancer Center Project, Refunding & Capital Improvement Series 2012A: | | | | | | | | | | | | | | | | |
| $ | 550 | | | 4.000%, 9/01/17 | | | No Opt. Call | | | | | | | | A+ | | | $ | 572,506 | |
| | 1,045 | | | 5.000%, 9/01/18 | | | No Opt. Call | | | | | | | | A+ | | | | 1,140,440 | |
| | 3,475 | | | 5.000%, 9/01/19 | | | No Opt. Call | | | | | | | | A+ | | | | 3,914,344 | |
| | 865 | | | 5.000%, 9/01/20 | | | No Opt. Call | | | | | | | | A+ | | | | 997,717 | |
| | 765 | | | 5.000%, 9/01/21 | | | No Opt. Call | | | | | | | | A+ | | | | 899,984 | |
| | | | | | |
| | 545 | | | Tampa, Florida, Revenue Bonds, University of Tampa, Refunding Series 2015, 5.000%, 4/01/21 | | | No Opt. Call | | | | | | | | BBB+ | | | | 632,091 | |
| | | | | | |
| | 110 | | | Tolomato Community Development District, Florida, Special Assessment Bonds, Convertible, Capital Appreciation, Series 2012A-2, 0.000%, 5/01/39 (9) | | | 5/17 at 100.00 | | | | | | | | N/R | | | | 88,362 | |
| | | | | | |
| | 340 | | | Tolomato Community Development District, Florida, Special Assessment Bonds, Convertible, Capital Appreciation, Series 2012A-3, 0.000%, 5/01/40 (9) | | | 5/19 at 100.00 | | | | | | | | N/R | | | | 204,279 | |
| | | | | | |
| | 115 | | | Tolomato Community Development District, Florida, Special Assessment Bonds, Convertible, Capital Appreciation, Series 2012A-4, 0.000%, 5/01/40 (9) | | | 5/22 at 100.00 | | | | | | | | N/R | | | | 51,227 | |
| | | | | | |
| | 165 | | | Tolomato Community Development District, Florida, Special Assessment Bonds, Hope Note, Series 2007-3, 6.375%, 5/01/17 (5) | | | No Opt. Call | | | | | | | | N/R | | | | 2 | |
| | | | | | |
| | 60 | | | Tolomato Community Development District, Florida, Special Assessment Bonds, Refunding Series 2012A-1, 6.375%, 5/01/17 | | | No Opt. Call | | | | | | | | N/R | | | | 60,014 | |
| | | | | | |
| | 460 | | | Tolomato Community Development District, Florida, Special Assessment Bonds, Refunding Series 2015-1, 0.000%, 5/01/40 (5) | | | 5/18 at 100.00 | | | | | | | | N/R | | | | 285,140 | |
| | | | | | |
| | 280 | | | Tolomato Community Development District, Florida, Special Assessment Bonds, Refunding Series 2015-2, 0.000%, 5/01/40 (5) | | | 5/18 at 100.00 | | | | | | | | N/R | | | | 146,908 | |
| | | | | | |
| | 305 | | | Tolomato Community Development District, Florida, Special Assessment Bonds, Refunding Series 2015-3, 6.610%, 5/01/40 (5) | | | 5/18 at 100.00 | | | | | | | | N/R | | | | 3 | |
| | | | | | |
| | 3,110 | | | Volusia County School Board, Florida, Sales Tax Revenue Bonds, Series 2004, 5.250%, 10/01/16 – AGM Insured | | | No Opt. Call | | | | | | | | AA | | | | 3,160,662 | |
| | 212,835 | | | Total Florida | | | | | | | | | | | | | | | 237,184,488 | |
| | | | | | |
| | | | Georgia – 2.0% | | | | | | | | | | | | | |
| | | | | | |
| | 2,580 | | | Atlanta, Georgia, Airport Passenger Facilities Charge Revenue Bonds, Subordinate Lien Series 2010B, 5.000%, 1/01/19 | | | No Opt. Call | | | | | | | | Aa3 | | | | 2,863,723 | |
| | | | | | |
| | 2,780 | | | Buford, Georgia, General Obligation Bonds, Series 2015, 4.000%, 1/01/19 | | | No Opt. Call | | | | | | | | Aa2 | | | | 3,001,649 | |
| | | | | | |
| | 8,910 | | | Burke County Development Authority, Georgia, Pollution Control Revenue Bonds, Georgia Power Company – Vogtle Plant, First Series 2012, 1.750%, 12/01/49 (Mandatory put 6/01/17) | | | No Opt. Call | | | | | | | | A+ | | | | 8,974,776 | |
| | | | | | |
| | 17,000 | | | Burke County Development Authority, Georgia, Pollution Control Revenue Bonds, Georgia Power Company – Vogtle Plant, Second Series 2012, 1.750%, 12/01/49 (Mandatory put 6/01/17) | | | No Opt. Call | | | | | | | | A+ | | | | 17,123,590 | |
| | | | | | |
| | 3,000 | | | Burke County Development Authority, Georgia, Pollution Control Revenue Bonds, Georgia Power Company, Fourth Series 1994, 2.200%, 10/01/32 (Mandatory put 4/02/19) | | | No Opt. Call | | | | | | | | A+ | | | | 3,075,060 | |
| | | | | | |
| | 3,000 | | | Cobb County Development Authority, Georgia, Solid Waste Disposal Revenue Bonds, Georgia Waste Management Project, Series 2004A, 1.875%, 4/01/33 (Mandatory put 10/01/19) | | | No Opt. Call | | | | | | | | A– | | | | 3,029,850 | |
| | | | | | |
| | 1,450 | | | Columbia County, Georgia, General Obligation Sales Tax Bonds, Series 2009, 5.000%, 4/01/17 | | | No Opt. Call | | | | | | | | AAA | | | | 1,509,334 | |
| | | | | | |
| | 1,500 | | | DeKalb County, Georgia, Water and Sewerage Revenue Bonds, Refunding Second Resolution Series 2013, 5.000%, 10/01/22 | | | No Opt. Call | | | | | | | | Aa3 | | | | 1,834,665 | |
| | | | | | |
| | 8,000 | | | Floyd County Development Authority, Georgia, Pollution Control Revenue Bonds, Georgia Power Company Plant Hammond Project, First Series 2010, 2.350%, 7/01/22 | | | No Opt. Call | | | | | | | | A+ | | | | 8,223,280 | |
| | | | | | | | | | | | | | | | | | | | |
Principal
Amount (000) | | | Description (1) | | Optional Call
Provisions (2) | | | | | | | Ratings (3) | | | Value | |
| | | | | | |
| | | | Georgia (continued) | | | | | | | | | | | | | |
| | | | | | |
| $ | 90 | | | Georgia Municipal Electric Authority, General Power Revenue Bonds, Series 1991V, 6.600%, 1/01/18 – NPFG Insured | | | No Opt. Call | | | | | | | | AA– | | | $ | 95,084 | |
| | | | | | |
| | 2,105 | | | Georgia State, General Obligation Bonds, Series 2009B, 4.000%, 1/01/21 | | | 1/19 at 100.00 | | | | | | | | AAA | | | | 2,276,305 | |
| | | | | | |
| | 11,440 | | | Georgia State, General Obligation Bonds, Series 2009D, 5.000%, 5/01/20 | | | 5/19 at 100.00 | | | | | | | | AAA | | | | 12,878,580 | |
| | | | | | |
| | 100 | | | Metropolitan Atlanta Rapid Transit Authority, Georgia, Sales Tax Revenue Bonds, Refunding Series 1992N, 6.250%, 7/01/18 – NPFG Insured | | | No Opt. Call | | | | | | | | Aa1 | | | | 106,166 | |
| | | | | | |
| | 2,000 | | | Monroe County Development Authority, Georgia, Pollution Control Revenue Bonds, Georgia Power Company – Scherer Plant, Series 2009-2, 2.350%, 10/01/48 | | | No Opt. Call | | | | | | | | A+ | | | | 2,053,120 | |
| | | | | | |
| | 7,630 | | | Municipal Electric Authority of Georgia, Project One Subordinate Lien Revenue Bonds, Series 2008A, 5.250%, 1/01/18 | | | No Opt. Call | | | | | | | | A+ | | | | 8,196,756 | |
| | | | | | |
| | | | Municipal Gas Authority of Georgia, Gas Revenue Bonds, Gas Portfolio III Project, Series 2014U: | | | | | | | | | | | | | | | | |
| | 3,810 | | | 5.000%, 10/01/18 | | | No Opt. Call | | | | | | | | AA– | | | | 4,188,714 | |
| | 2,905 | | | 5.000%, 10/01/19 | | | No Opt. Call | | | | | | | | AA– | | | | 3,296,507 | |
| | | | | | |
| | 5,240 | | | Private Colleges and Universities Authority, Georgia, Revenue Bonds, Agnes Scott College, Refunding Series 2015B, 2.500%, 6/01/30 (Mandatory put 6/01/19) | | | 3/19 at 100.00 | | | | | | | | AA– | | | | 5,375,454 | |
| | | | | | |
| | | | Private Colleges and Universities Authority, Georgia, Revenue Bonds, Mercer University, Refunding Series 2012C: | | | | | | | | | | | | | | | | |
| | 500 | | | 5.000%, 10/01/17 | | | No Opt. Call | | | | | | | | Baa2 | | | | 527,435 | |
| | 580 | | | 5.000%, 10/01/20 | | | No Opt. Call | | | | | | | | Baa2 | | | | 665,997 | |
| | 84,620 | | | Total Georgia | | | | | | | | | | | | | | | 89,296,045 | |
| | | | | | |
| | | | Hawaii – 1.0% | | | | | | | | | | | | | |
| | | | | | |
| | | | Hawaii County, Hawaii, General Obligation Bonds, Series 2016C: | | | | | | | | | | | | | | | | |
| | 750 | | | 5.000%, 9/01/18 | | | No Opt. Call | | | | | | | | Aa2 | | | | 824,483 | |
| | 2,850 | | | 5.000%, 9/01/20 | | | No Opt. Call | | | | | | | | Aa2 | | | | 3,334,557 | |
| | | | | | |
| | | | Hawaii County, Hawaii, General Obligation Bonds, Series 2016D: | | | | | | | | | | | | | | | | |
| | 2,280 | | | 5.000%, 9/01/19 | | | No Opt. Call | | | | | | | | Aa2 | | | | 2,590,240 | |
| | 1,650 | | | 5.000%, 9/01/20 | | | No Opt. Call | | | | | | | | Aa2 | | | | 1,930,533 | |
| | | | | | |
| | 6,415 | | | Hawaii State, General Obligation Bonds, Series 2011DZ, 5.000%, 12/01/18 | | | No Opt. Call | | | | | | | | AA | | | | 7,111,733 | |
| | | | | | |
| | 8,290 | | | Hawaii State, General Obligation Bonds, Series 2012EF, 5.000%, 11/01/20 | | | No Opt. Call | | | | | | | | AA | | | | 9,745,890 | |
| | | | | | |
| | 10,070 | | | Hawaii State, General Obligation Bonds, Series 2013EH, 5.000%, 8/01/21 | | | No Opt. Call | | | | | | | | AA | | | | 12,055,703 | |
| | | | | | |
| | 2,600 | | | Hawaii State, General Obligation Bonds, Series 2016FE, 5.000%, 10/01/20 | | | No Opt. Call | | | | | | | | AA | | | | 3,045,692 | |
| | | | | | |
| | 2,150 | | | Honolulu City and County, Hawaii, Wastewater System Revenue Bonds, First Bond Resolution, Refunding Senior Series 2015B, 5.000%, 7/01/26 | | | 7/25 at 100.00 | | | | | | | | Aa2 | | | | 2,732,414 | |
| | 37,055 | | | Total Hawaii | | | | | | | | | | | | | | | 43,371,245 | |
| | | | | | |
| | | | Illinois – 10.2% | | | | | | | | | | | | | |
| | | | | | |
| | 1,240 | | | Bourbonnais, Illinois, Industrial Project Revenue Bonds, Olivet Nazarene University Project, Series 2010, 5.000%, 11/01/20 | | | No Opt. Call | | | | | | | | BBB | | | | 1,356,287 | |
| | | | | | |
| | 1,405 | | | Chicago Board of Education, Illinois, General Obligation Bonds, Series 1999A, 0.000%, 12/01/17 – FGIC Insured | | | No Opt. Call | | | | | | | | AA– | | | | 1,330,395 | |
| | | | | | |
| | 5,000 | | | Chicago, Illinois, General Airport Revenue Bonds, O’Hare International Airport, Senior Lien Refunding Series 2013A, 5.000%, 1/01/21 (Alternative Minimum Tax) | | | No Opt. Call | | | | | | | | A | | | | 5,786,700 | |
Nuveen Limited Term Municipal Bond Fund (continued)
| | |
| Portfolio of Investments | | April 30, 2016 |
| | | | | | | | | | | | | | | | | | | | |
Principal
Amount (000) | | | Description (1) | | Optional Call
Provisions (2) | | | | | | | Ratings (3) | | | Value | |
| | | | | | |
| | | | Illinois (continued) | | | | | | | | | | | | | |
| | | | | | |
| | | | Chicago, Illinois, General Airport Revenue Bonds, O’Hare International Airport, Senior Lien Series 2015B: | | | | | | | | | | | | | | | | |
| $ | 2,755 | | | 5.000%, 1/01/20 | | | No Opt. Call | | | | | | | | A | | | $ | 3,136,347 | |
| | 1,600 | | | 5.000%, 1/01/21 | | | No Opt. Call | | | | | | | | A | | | | 1,869,072 | |
| | | | | | |
| | 4,020 | | | Chicago, Illinois, General Obligation Bonds, Modern Schools Arcos Chicago Program, Series 2007J, 5.000%, 12/01/21 – AMBAC Insured | | | 12/16 at 100.00 | | | | | | | | BBB+ | | | | 4,090,430 | |
| | | | | | |
| | | | Chicago, Illinois, General Obligation Bonds, Project and Refunding Series 2009C: | | | | | | | | | | | | | | | | |
| | 1,655 | | | 5.000%, 1/01/26 | | | 1/19 at 100.00 | | | | | | | | A– | | | | 1,656,523 | |
| | 2,395 | | | 5.000%, 1/01/27 | | | No Opt. Call | | | | | | | | AA– | | | | 2,388,965 | |
| | | | | | |
| | | | Chicago, Illinois, General Obligation Bonds, Refunding Series 2016C: | | | | | | | | | | | | | | | | |
| | 6,230 | | | 5.000%, 1/01/23 | | | No Opt. Call | | | | | | | | BBB+ | | | | 6,465,619 | |
| | 7,195 | | | 5.000%, 1/01/24 | | | No Opt. Call | | | | | | | | BBB+ | | | | 7,360,125 | |
| | 4,190 | | | 5.000%, 1/01/25 | | | No Opt. Call | | | | | | | | BBB+ | | | | 4,239,693 | |
| | 1,840 | | | 5.000%, 1/01/26 | | | No Opt. Call | | | | | | | | BBB+ | | | | 1,845,465 | |
| | | | | | |
| | 2,000 | | | Cook County Community College District 508, Illinois, General Obligation Bonds, Chicago City Colleges, Series 2013, 5.000%, 12/01/20 | | | No Opt. Call | | | | | | | | AA | | | | 2,287,580 | |
| | | | | | |
| | 7,195 | | | Cook County, Illinois, General Obligation Bonds, Refunding Series 2009A, 5.000%, 11/15/17 | | | No Opt. Call | | | | | | | | AA | | | | 7,541,295 | |
| | | | | | |
| | 4,750 | | | Cook County, Illinois, General Obligation Bonds, Refunding Series 2010A, 5.250%, 11/15/22 | | | 11/20 at 100.00 | | | | | | | | AA | | | | 5,314,585 | |
| | | | | | |
| | 3,315 | | | Cook County, Illinois, General Obligation Bonds, Refunding Series 2011A, 5.000%, 11/15/18 | | | No Opt. Call | | | | | | | | AA | | | | 3,571,647 | |
| | | | | | |
| | | | Cook County, Illinois, General Obligation Bonds, Refunding Series 2012C: | | | | | | | | | | | | | | | | |
| | 3,445 | | | 5.000%, 11/15/27 | | | 11/22 at 100.00 | | | | | | | | AA | | | | 3,814,924 | |
| | 3,000 | | | 5.000%, 11/15/33 | | | 11/22 at 100.00 | | | | | | | | AA | | | | 3,246,540 | |
| | | | | | |
| | 262 | | | Huntley, Illinois, Special Service Area 10, Special Tax Bonds, Series 2007, 4.600%, 3/01/17 – AGC Insured | | | No Opt. Call | | | | | | | | AA | | | | 266,027 | |
| | | | | | |
| | 10,630 | | | Illinois Development Finance Authority, Revenue Bonds, St Vincent de Paul Center Project, Series 2000A, 1.875%, 11/15/39 (Mandatory put 3/01/19) | | | No Opt. Call | | | | | | | | AA+ | | | | 10,827,931 | |
| | | | | | |
| | 1,175 | | | Illinois Educational Facilities Authority, Revenue Bonds, Art Institute of Chicago, Series 1998A, 5.000%, 3/01/30 (Mandatory put 3/01/17) | | | No Opt. Call | | | | | | | | A1 | | | | 1,208,476 | |
| | | | | | |
| | 10,000 | | | Illinois Educational Facilities Authority, Revenue Bonds, University of Chicago, Series 1998B, 1.650%, 7/01/25 (Mandatory put 2/01/19) | | | No Opt. Call | | | | | | | | AA+ | | | | 10,114,600 | |
| | | | | | |
| | 13,220 | | | Illinois Educational Facilities Authority, Revenue Bonds, University of Chicago, Series 2001B, 1.100%, 7/01/36 (Mandatory put 2/15/18) | | | No Opt. Call | | | | | | | | AA+ | | | | 13,258,602 | |
| | | | | | |
| | 19,375 | | | Illinois Finance Authority, Gas Supply Refunding Revenue Bonds, The Peoples Gas Light and Coke Company Project, Series 2010B, 1.875%, 2/01/33 (Mandatory put 8/01/20) | | | No Opt. Call | | | | | | | | Aa3 | | | | 19,703,988 | |
| | | | | | |
| | 11,300 | | | Illinois Finance Authority, Midwestern Disaster Area Industrial Development Revenue Bonds, Cargill, Incorporated Project, Series 2012, 1.550%, 11/01/38 (Mandatory put 11/01/17) | | | No Opt. Call | | | | | | | | A | | | | 11,330,736 | |
| | | | | | |
| | 1,000 | | | Illinois Finance Authority, Revenue Bonds, Advocate Health Care Network, Refunding Series 2014, 5.000%, 8/01/20 | | | No Opt. Call | | | | | | | | AA | | | | 1,159,990 | |
| | | | | | |
| | 975 | | | Illinois Finance Authority, Revenue Bonds, Alexian Brothers Health System, Refunding Series 2005B, 5.000%, 1/01/20 (Pre-refunded 4/14/18) – AGM Insured | | | 4/18 at 100.00 | | | | | | | | A2 (4) | | | | 1,055,447 | |
| | | | | | |
| | 950 | | | Illinois Finance Authority, Revenue Bonds, Alexian Brothers Health System, Series 2010, 5.000%, 2/15/21 | | | 2/20 at 100.00 | | | | | | | | A2 | | | | 1,076,787 | |
| | | | | | |
| | 10,000 | | | Illinois Finance Authority, Revenue Bonds, Ascension Health Alliance Senior Credit Group, Series 2012E-1, 2.250%, 11/15/42 (Mandatory put 4/29/22) | | | No Opt. Call | | | | | | | | AA+ | | | | 10,342,800 | |
| | | | | | | | | | | | | | | | | | | | |
Principal
Amount (000) | | | Description (1) | | Optional Call
Provisions (2) | | | | | | | Ratings (3) | | | Value | |
| | | | | | |
| | | | Illinois (continued) | | | | | | | | | | | | | |
| | | | | | |
| | | | Illinois Finance Authority, Revenue Bonds, Centegra Health System, Series 2012: | | | | | | | | | | | | | | | | |
| $ | 1,090 | | | 5.000%, 9/01/18 | | | No Opt. Call | | | | | | | | BBB | | | $ | 1,167,379 | |
| | 905 | | | 5.000%, 9/01/19 | | | No Opt. Call | | | | | | | | BBB | | | | 989,627 | |
| | 8,665 | | | 5.000%, 9/01/27 | | | 9/22 at 100.00 | | | | | | | | BBB | | | | 9,615,117 | |
| | | | | | |
| | | | Illinois Finance Authority, Revenue Bonds, Centegra Health System, Series 2014A: | | | | | | | | | | | | | | | | |
| | 325 | | | 5.000%, 9/01/19 | | | No Opt. Call | | | | | | | | BBB | | | | 357,601 | |
| | 770 | | | 5.000%, 9/01/20 | | | No Opt. Call | | | | | | | | BBB | | | | 865,234 | |
| | 350 | | | 5.000%, 9/01/21 | | | No Opt. Call | | | | | | | | BBB | | | | 399,823 | |
| | 625 | | | 5.000%, 9/01/22 | | | No Opt. Call | | | | | | | | BBB | | | | 723,256 | |
| | 620 | | | 5.000%, 9/01/23 | | | No Opt. Call | | | | | | | | BBB | | | | 726,714 | |
| | 2,240 | | | 5.000%, 9/01/24 | | | No Opt. Call | | | | | | | | BBB | | | | 2,650,122 | |
| | 865 | | | 5.000%, 9/01/25 | | | 9/24 at 100.00 | | | | | | | | BBB | | | | 1,011,107 | |
| | | | | | |
| | 2,000 | | | Illinois Finance Authority, Revenue Bonds, Children’s Memorial Hospital, Series 2008B, 5.500%, 8/15/21 | | | 8/18 at 100.00 | | | | | | | | AA– | | | | 2,211,100 | |
| | | | | | |
| | | | Illinois Finance Authority, Revenue Bonds, Northwest Community Hospital, Series 2008A: | | | | | | | | | | | | | | | | |
| | 1,580 | | | 5.000%, 7/01/17 | | | No Opt. Call | | | | | | | | A+ | | | | 1,654,781 | |
| | 1,175 | | | 5.000%, 7/01/18 | | | No Opt. Call | | | | | | | | A+ | | | | 1,274,934 | |
| | | | | | |
| | 15,000 | | | Illinois Finance Authority, Revenue Bonds, OSF Healthcare System, Series 2007A, 5.250%, 11/15/22 (Pre-refunded 11/15/17) | | | 11/17 at 100.00 | | | | | | | | A (4) | | | | 16,036,950 | |
| | | | | | |
| | | | Illinois Finance Authority, Revenue Bonds, OSF Healthcare System, Series 2015A: | | | | | | | | | | | | | | | | |
| | 1,665 | | | 5.000%, 11/15/20 | | | No Opt. Call | | | | | | | | A | | | | 1,925,223 | |
| | 1,100 | | | 5.000%, 11/15/21 | | | No Opt. Call | | | | | | | | A | | | | 1,297,516 | |
| | | | | | |
| | 1,200 | | | Illinois Finance Authority, Revenue Bonds, Palos Community Hospital, Series 2010C, 5.000%, 5/15/17 | | | No Opt. Call | | | | | | | | AA– | | | | 1,251,168 | |
| | | | | | |
| | | | Illinois Finance Authority, Revenue Bonds, Rush University Medical Center Obligated Group, Series 2015A: | | | | | | | | | | | | | | | | |
| | 1,185 | | | 5.000%, 11/15/17 | | | No Opt. Call | | | | | | | | A+ | | | | 1,259,157 | |
| | 1,000 | | | 5.000%, 11/15/18 | | | No Opt. Call | | | | | | | | A+ | | | | 1,099,380 | |
| | 1,065 | | | 5.000%, 11/15/20 | | | No Opt. Call | | | | | | | | A+ | | | | 1,238,595 | |
| | | | | | |
| | | | Illinois Finance Authority, Revenue Bonds, Silver Cross Hospital and Medical Centers, Series 2005: | | | | | | | | | | | | | | | | |
| | 1,000 | | | 5.000%, 8/15/16 – AGC Insured (ETM) | | | No Opt. Call | | | | | | | | AA (4) | | | | 1,013,250 | |
| | 875 | | | 5.000%, 8/15/18 – AGC Insured (ETM) | | | No Opt. Call | | | | | | | | AA (4) | | | | 958,746 | |
| | 405 | | | 5.250%, 8/15/19 – AGC Insured (ETM) | | | No Opt. Call | | | | | | | | AA (4) | | | | 462,093 | |
| | | | | | |
| | | | Illinois Finance Authority, Revenue Bonds, University of Chicago, Refunding Series 2014A: | | | | | | | | | | | | | | | | |
| | 1,035 | | | 5.000%, 10/01/19 | | | No Opt. Call | | | | | | | | AA+ | | | | 1,174,870 | |
| | 2,075 | | | 5.000%, 10/01/20 | | | No Opt. Call | | | | | | | | AA+ | | | | 2,419,927 | |
| | | | | | |
| | 5,000 | | | Illinois Finance Authority, Revenue Bonds, University of Chicago, Series 2012A, 5.000%, 10/01/20 | | | No Opt. Call | | | | | | | | AA+ | | | | 5,831,150 | |
| | | | | | |
| | 2,510 | | | Illinois Finance Authority, Student Housing Revenue Bonds, Educational Advancement Fund Inc., University Center Project, Series 2006B, 5.000%, 5/01/25 | | | 11/16 at 100.00 | | | | | | | | BBB+ | | | | 2,542,781 | |
| | | | | | |
| | | | Illinois Municipal Electric Agency, Power Supply System Revenue Bonds, Refunding Series 2015A: | | | | | | | | | | | | | | | | |
| | 3,000 | | | 5.000%, 2/01/18 | | | No Opt. Call | | | | | | | | A1 | | | | 3,214,440 | |
| | 3,000 | | | 5.000%, 2/01/19 | | | No Opt. Call | | | | | | | | A1 | | | | 3,320,370 | |
| | 4,000 | | | 5.000%, 2/01/20 | | | No Opt. Call | | | | | | | | A1 | | | | 4,552,240 | |
| | 10,820 | | | 5.000%, 2/01/21 | | | No Opt. Call | | | | | | | | A1 | | | | 12,620,989 | |
| | 5,000 | | | 5.000%, 2/01/22 | | | No Opt. Call | | | | | | | | A1 | | | | 5,948,400 | |
| | 2,600 | | | 5.000%, 2/01/25 | | | No Opt. Call | | | | | | | | A1 | | | | 3,223,896 | |
Nuveen Limited Term Municipal Bond Fund (continued)
| | |
| Portfolio of Investments | | April 30, 2016 |
| | | | | | | | | | | | | | | | | | | | |
Principal
Amount (000) | | | Description (1) | | Optional Call
Provisions (2) | | | | | | | Ratings (3) | | | Value | |
| | | | | | |
| | | | Illinois (continued) | | | | | | | | | | | | | |
| | | | | | |
| | | | Illinois State Department of Employment Security, Unemployment Insurance Fund Building Receipts Revenue Bonds, Series 2012B: | | | | | | | | | | | | | | | | |
| $ | 2,555 | | | 5.000%, 6/15/18 | | | 12/16 at 100.00 | | | | | | | | AA+ | | | $ | 2,624,854 | |
| | 3,085 | | | 5.000%, 12/15/18 | | | 6/16 at 100.00 | | | | | | | | AA+ | | | | 3,102,739 | |
| | | | | | |
| | | | Illinois State, General Obligation Bonds, February Series 2014: | | | | | | | | | | | | | | | | |
| | 655 | | | 5.000%, 2/01/19 | | | No Opt. Call | | | | | | | | A– | | | | 708,160 | |
| | 1,350 | | | 5.000%, 2/01/20 | | | No Opt. Call | | | | | | | | A– | | | | 1,488,119 | |
| | 3,500 | | | 5.000%, 2/01/21 | | | No Opt. Call | | | | | | | | A– | | | | 3,882,095 | |
| | 4,050 | | | 5.000%, 2/01/22 | | | No Opt. Call | | | | | | | | A– | | | | 4,531,586 | |
| | | | | | |
| | 1,115 | | | Illinois State, General Obligation Bonds, Refunding Series 2007B, 5.250%, 1/01/20 | | | No Opt. Call | | | | | | | | A– | | | | 1,237,226 | |
| | | | | | |
| | | | Illinois State, General Obligation Bonds, Refunding Series 2010: | | | | | | | | | | | | | | | | |
| | 5,055 | | | 5.000%, 1/01/17 – AGM Insured | | | No Opt. Call | | | | | | | | AA | | | | 5,187,643 | |
| | 560 | | | 5.000%, 1/01/17 | | | No Opt. Call | | | | | | | | A– | | | | 573,586 | |
| | 4,995 | | | 5.000%, 1/01/18 – AGM Insured | | | No Opt. Call | | | | | | | | AA | | | | 5,279,116 | |
| | 22,045 | | | 5.000%, 1/01/18 | | | No Opt. Call | | | | | | | | A– | | | | 23,276,434 | |
| | 6,745 | | | 5.000%, 1/01/24 | | | 1/20 at 100.00 | | | | | | | | A– | | | | 7,205,616 | |
| | | | | | |
| | | | Illinois State, General Obligation Bonds, Refunding Series 2012: | | | | | | | | | | | | | | | | |
| | 5,000 | | | 5.000%, 8/01/16 | | | No Opt. Call | | | | | | | | A– | | | | 5,051,050 | |
| | 5,170 | | | 5.000%, 8/01/19 | | | No Opt. Call | | | | | | | | A– | | | | 5,645,175 | |
| | 4,055 | | | 5.000%, 8/01/20 | | | No Opt. Call | | | | | | | | A– | | | | 4,502,591 | |
| | | | | | |
| | 6,975 | | | Illinois State, General Obligation Bonds, Series 2003A, 5.000%, 10/01/19 | | | 7/16 at 100.00 | | | | | | | | A– | | | | 6,996,134 | |
| | | | | | |
| | 560 | | | Illinois State, General Obligation Bonds, Series 2003, 5.000%, 6/01/19 – NPFG Insured | | | No Opt. Call | | | | | | | | AA– | | | | 561,949 | |
| | | | | | |
| | 10 | | | Illinois State, General Obligation Bonds, Series 2004A, 5.000%, 3/01/22 | | | No Opt. Call | | | | | | | | A– | | | | 10,030 | |
| | | | | | |
| | 2,000 | | | Illinois State, General Obligation Bonds, Series 2005, 5.000%, 9/01/16 – AGM Insured | | | No Opt. Call | | | | | | | | AA | | | | 2,007,740 | |
| | | | | | |
| | | | Illinois State, General Obligation Bonds, Series 2006A: | | | | | | | | | | | | | | | | |
| | 1,060 | | | 5.000%, 6/01/17 | | | No Opt. Call | | | | | | | | A– | | | | 1,100,375 | |
| | 6,400 | | | 5.000%, 6/01/23 | | | 12/16 at 100.00 | | | | | | | | A– | | | | 6,539,136 | |
| | | | | | |
| | | | Illinois State, General Obligation Bonds, Series 2006: | | | | | | | | | | | | | | | | |
| | 1,005 | | | 5.000%, 1/01/17 | | | N | | | | | | | | A– | | | | 1,010,598 | |
| | 2,550 | | | 5.000%, 1/01/19 – NPFG Insured | | | N | | | | | | | | AA– | | | | 2,564,204 | |
| | | | | | |
| | 1,000 | | | Illinois State, General Obligation Bonds, Series 2007A, 5.000%, 6/01/22 – AGM Insured | | | 6/17 at 100.00 | | | | | | | | AA | | | | 1,035,470 | |
| | | | | | |
| | | | Illinois State, General Obligation Bonds, Series 2013: | | | | | | | | | | | | | | | | |
| | 1,500 | | | 5.000%, 7/01/17 | | | No Opt. Call | | | | | | | | A– | | | | 1,561,110 | |
| | 3,640 | | | 5.000%, 7/01/21 | | | No Opt. Call | | | | | | | | A– | | | | 4,054,523 | |
| | 2,520 | | | 5.500%, 7/01/25 | | | 7/23 at 100.00 | | | | | | | | A– | | | | 2,884,392 | |
| | | | | | |
| | 2,030 | | | Illinois State, Sales Tax Revenue Bonds, Build Illinois Series 2010, 5.000%, 6/15/16 | | | No Opt. Call | | | | | | | | AAA | | | | 2,041,936 | |
| | | | | | |
| | | | Illinois State, Sales Tax Revenue Bonds, Build Illinois, Junior Lien Series 2013: | | | | | | | | | | | | | | | | |
| | 4,395 | | | 5.000%, 6/15/18 | | | No Opt. Call | | | | | | | | AAA | | | | 4,773,234 | |
| | 6,000 | | | 5.000%, 6/15/19 | | | No Opt. Call | | | | | | | | AAA | | | | 6,720,120 | |
| | | | | | |
| | | | Illinois Toll Highway Authority, Toll Highway Revenue Bonds, Refunding Senior Lien Series 2014A: | | | | | | | | | | | | | | | | |
| | 1,555 | | | 5.000%, 12/01/20 | | | No Opt. Call | | | | | | | | AA– | | | | 1,818,215 | |
| | 1,675 | | | 5.000%, 12/01/21 | | | No Opt. Call | | | | | | | | AA– | | | | 2,004,104 | |
| | 1,805 | | | 5.000%, 12/01/22 | | | No Opt. Call | | | | | | | | AA– | | | | 2,198,941 | |
| | | | | | |
| | 11,645 | | | Illinois Toll Highway Authority, Toll Highway Revenue Bonds, Senior Lien Series 2014D, 5.000%, 1/01/24 | | | No Opt. Call | | | | | | | | AA– | | | | 14,426,292 | |
| | | | | | | | | | | | | | | | | | | | |
Principal
Amount (000) | | | Description (1) | | Optional Call
Provisions (2) | | | | | | | Ratings (3) | | | Value | |
| | | | | | |
| | | | Illinois (continued) | | | | | | | | | | | | | |
| | | | | | |
| | | | Kane, Cook and DuPage Counties School District 46, Elgin, Illinois, General Obligation Bonds, Refunding Series 2015C: | | | | | | | | | | | | | | | | |
| $ | 1,000 | | | 4.000%, 1/01/18 | | | No Opt. Call | | | | | | | | AA– | | | $ | 1,052,530 | |
| | 1,250 | | | 5.000%, 1/01/19 | | | No Opt. Call | | | | | | | | AA– | | | | 1,381,850 | |
| | | | | | |
| | 695 | | | Lake County Forest Preserve District, Illinois, General Obligation Bonds, Series 2007A, 0.875%, 12/15/16 | | | No Opt. Call | | | | | | | | AAA | | | | 694,576 | |
| | | | | | |
| | 1,900 | | | Peoria Public Building Commission, Illinois, School District Facility Revenue Bonds, Peoria County School District 150 Project, Series 2009A, 0.000%, 12/01/22 – AGC Insured | | | 12/18 at 79.62 | | | | | | | | AA | | | | 1,444,684 | |
| | | | | | |
| | | | Railsplitter Tobacco Settlement Authority, Illinois, Tobacco Settlement Revenue Bonds, Series 2010: | | | | | | | | | | | | | | | | |
| | 5,115 | | | 5.000%, 6/01/16 | | | No Opt. Call | | | | | | | | A | | | | 5,134,897 | |
| | 7,605 | | | 5.000%, 6/01/17 | | | No Opt. Call | | | | | | | | A | | | | 7,941,065 | |
| | 5,425 | | | 5.000%, 6/01/18 | | | No Opt. Call | | | | | | | | A | | | | 5,852,653 | |
| | 10,105 | | | 5.000%, 6/01/19 | | | No Opt. Call | | | | | | | | A | | | | 11,232,213 | |
| | 5,215 | | | 5.250%, 6/01/20 | | | No Opt. Call | | | | | | | | A | | | | 6,002,256 | |
| | 20 | | | 5.250%, 6/01/21 | | | No Opt. Call | | | | | | | | A | | | | 23,563 | |
| | | | | | |
| | 4,290 | | | Regional Transportation Authority, Cook, DuPage, Kane, Lake, McHenry and Will Counties, Illinois, General Obligation Bonds, Series 1990A, 7.200%, 11/01/20 – AMBAC Insured | | | No Opt. Call | | | | | | | | AA | | | | 4,922,174 | |
| | | | | | |
| | 5,515 | | | Regional Transportation Authority, Cook, DuPage, Kane, Lake, McHenry and Will Counties, Illinois, General Obligation Bonds, Series 1994D, 7.750%, 6/01/19 – FGIC Insured | | | No Opt. Call | | | | | | | | AA | | | | 6,095,730 | |
| | | | | | |
| | | | Springfield, Illinois, Electric Revenue Bonds, Senior Lien Series 2015: | | | | | | | | | | | | | | | | |
| | 2,635 | | | 5.000%, 3/01/19 | | | No Opt. Call | | | | | | | | A | | | | 2,924,824 | |
| | 2,260 | | | 5.000%, 3/01/20 | | | No Opt. Call | | | | | | | | A | | | | 2,570,908 | |
| | 1,565 | | | 5.000%, 3/01/21 | | | No Opt. Call | | | | | | | | A | | | | 1,821,848 | |
| | 2,500 | | | 5.000%, 3/01/22 | | | No Opt. Call | | | | | | | | A | | | | 2,970,775 | |
| | | | | | |
| | 2,365 | | | Sterling, Whiteside County, Illinois, General Obligation Bonds, Alternate Revenue Source, Series 2012, 4.000%, 11/01/19 | | | No Opt. Call | | | | | | | | A+ | | | | 2,585,087 | |
| | | | | | |
| | | | Will, Grundy, Kendall, LaSalle, Kankakee, Livingston and Cook Counties Community College District 525 Joliet Junior College, Illinois, General Obligation Bond, Series 2008: | | | | | | | | | | | | | | | | |
| | 1,090 | | | 5.750%, 6/01/26 | | | 6/18 at 100.00 | | | | | | | | AA | | | | 1,191,228 | |
| | 1,035 | | | 5.750%, 6/01/27 | | | 6/18 at 100.00 | | | | | | | | AA | | | | 1,129,992 | |
| | | | | | |
| | | | Winnebago-Boone Counties School District 205 Rockford, Illinois, General Obligation Bonds, Series 2013: | | | | | | | | | | | | | | | | |
| | 1,435 | | | 0.000%, 2/01/21 | | | No Opt. Call | | | | | | | | AA– | | | | 1,301,014 | |
| | 6,200 | | | 0.000%, 2/01/22 | | | No Opt. Call | | | | | | | | AA– | | | | 5,455,690 | |
| | 6,655 | | | 0.000%, 2/01/23 | | | No Opt. Call | | | | | | | | AA– | | | | 5,675,384 | |
| | 430,997 | | | Total Illinois | | | | | | | | | | | | | | | 460,694,946 | |
| | | | | | |
| | | | Indiana – 4.4% | | | | | | | | | | | | | |
| | | | | | |
| | | | Carmel Local Public Improvement Bond Bank, Indiana, Multipurpose Revenue Bonds, Series 2016: | | | | | | | | | | | | | | | | |
| | 700 | | | 4.000%, 7/15/18 (WI/DD, Settling 5/05/16) | | | No Opt. Call | | | | | | | | AA+ | | | | 748,832 | |
| | 750 | | | 5.000%, 1/15/19 (WI/DD, Settling 5/05/16) | | | No Opt. Call | | | | | | | | AA+ | | | | 832,860 | |
| | 1,215 | | | 5.000%, 7/15/19 (WI/DD, Settling 5/05/16) | | | No Opt. Call | | | | | | | | AA+ | | | | 1,371,759 | |
| | 1,000 | | | 5.000%, 1/15/20 (WI/DD, Settling 5/05/16) | | | No Opt. Call | | | | | | | | AA+ | | | | 1,145,740 | |
| | 800 | | | 5.000%, 7/15/20 (WI/DD, Settling 5/05/16) | | | No Opt. Call | | | | | | | | AA+ | | | | 930,264 | |
Nuveen Limited Term Municipal Bond Fund (continued)
| | |
| Portfolio of Investments | | April 30, 2016 |
| | | | | | | | | | | | | | | | | | | | |
Principal
Amount (000) | | | Description (1) | | Optional Call
Provisions (2) | | | | | | | Ratings (3) | | | Value | |
| | | | | | |
| | | | Indiana (continued) | | | | | | | | | | | | | |
| | | | | | |
| | | | Hamilton Southeastern Consolidated School Building Corporation, Hamilton County, Indiana, First Mortgage Bonds, Refunding Series 2015D: | | | | | | | | | | | | | | | | |
| $ | 1,035 | | | 5.000%, 1/15/17 | | | No Opt. Call | | | | | | | | AA+ | | | $ | 1,066,505 | |
| | 1,190 | | | 5.000%, 1/15/18 | | | No Opt. Call | | | | | | | | AA+ | | | | 1,272,776 | |
| | 1,250 | | | 5.000%, 7/15/18 | | | No Opt. Call | | | | | | | | AA+ | | | | 1,360,675 | |
| | 2,250 | | | 5.000%, 1/15/19 | | | No Opt. Call | | | | | | | | AA+ | | | | 2,486,700 | |
| | 2,000 | | | 5.000%, 1/15/20 | | | No Opt. Call | | | | | | | | AA+ | | | | 2,275,560 | |
| | 1,000 | | | 5.000%, 7/15/20 | | | No Opt. Call | | | | | | | | AA+ | | | | 1,153,930 | |
| | | | | | |
| | 1,800 | | | Indiana Development Finance Authority, Solid Waste Disposal Revenue Refunding Bonds, Waste Management Inc. Project, Series 2001, 1.750%, 10/01/31 (Mandatory put 10/01/18) (Alternative Minimum Tax) | | | No Opt. Call | | | | | | | | A– | | | | 1,816,236 | |
| | | | | | |
| | 505 | | | Indiana Finance Authority, Educational Facilities Revenue Bonds, Drexel Foundation For Educational Excellence, Inc., Series 2009A, 6.000%, 10/01/21 | | | 10/19 at 100.00 | | | | | | | | B– | | | | 495,471 | |
| | | | | | |
| | 6,800 | | | Indiana Finance Authority, Environmental Improvement Revenue Bonds, Southern Indiana Gas & Electric Company, Refunding Series 2013D, 1.950%, 3/01/24 (Mandatory put 9/14/17) | | | No Opt. Call | | | | | | | | Aa3 | | | | 6,862,764 | |
| | | | | | |
| | | | Indiana Finance Authority, Hospital Revenue Bonds, Beacon Health System Obligated Group, Series 2013A: | | | | | | | | | | | | | | | | |
| | 500 | | | 5.000%, 8/15/16 | | | No Opt. Call | | | | | | | | AA– | | | | 506,485 | |
| | 635 | | | 5.000%, 8/15/18 | | | No Opt. Call | | | | | | | | AA– | | | | 695,014 | |
| | | | | | |
| | | | Indiana Finance Authority, Hospital Revenue Bonds, Floyd Memorial Hospital and Health Services Project, Refunding Series 2010: | | | | | | | | | | | | | | | | |
| | 1,495 | | | 5.000%, 3/01/19 | | | No Opt. Call | | | | | | | | BBB– | | | | 1,597,826 | |
| | 2,115 | | | 5.000%, 3/01/20 | | | No Opt. Call | | | | | | | | BBB– | | | | 2,306,661 | |
| | | | | | |
| | | | Indiana Finance Authority, Hospital Revenue Bonds, Major Hospital Project, Series 2014A: | | | | | | | | | | | | | | | | |
| | 1,025 | | | 4.000%, 10/01/20 | | | No Opt. Call | | | | | | | | BBB+ | | | | 1,117,916 | |
| | 435 | | | 4.000%, 10/01/21 | | | No Opt. Call | | | | | | | | BBB+ | | | | 477,843 | |
| | 130 | | | 5.000%, 10/01/23 | | | No Opt. Call | | | | | | | | BBB+ | | | | 153,215 | |
| | | | | | |
| | | | Indiana Finance Authority, Hospital Revenue Bonds, Parkview Health System Obligated Group, Refunding Series 2012A: | | | | | | | | | | | | | | | | |
| | 850 | | | 5.000%, 5/01/19 | | | No Opt. Call | | | | | | | | A+ | | | | 950,292 | |
| | 750 | | | 5.000%, 5/01/20 | | | No Opt. Call | | | | | | | | A+ | | | | 862,673 | |
| | 2,000 | | | 5.000%, 5/01/21 | | | No Opt. Call | | | | | | | | A+ | | | | 2,364,080 | |
| | | | | | |
| | 12,310 | | | Indiana Finance Authority, Private Activity Bonds, Ohio River Bridges East End Crossing Project, Series 2013B, 5.000%, 1/01/19 (Alternative Minimum Tax) | | | 1/17 at 100.00 | | | | | | | | BBB+ | | | | 12,631,660 | |
| | | | | | |
| | 2,260 | | | Indiana Finance Authority, Tax-Exempt Private Activity Revenue Bonds, I-69 Section 5 Project, Series 2014, 5.250%, 9/01/26 (Alternative Minimum Tax) | | | 9/24 at 100.00 | | | | | | | | BBB– | | | | 2,645,330 | |
| | | | | | |
| | 12,020 | | | Indiana Finance Authority, Wastewater Utility Revenue Bonds, CWA Authority Project, Series 2011C, 3.000%, 10/01/16 | | | No Opt. Call | | | | | | | | AA– | | | | 12,136,594 | |
| | | | | | |
| | | | Indiana Finance Authority, Wastewater Utility Revenue Bonds, CWA Authority Project, Series 2014A: | | | | | | | | | | | | | | | | |
| | 750 | | | 4.000%, 10/01/16 | | | No Opt. Call | | | | | | | | AA | | | | 760,815 | |
| | 370 | | | 5.000%, 10/01/17 | | | No Opt. Call | | | | | | | | AA | | | | 392,337 | |
| | 410 | | | 5.000%, 10/01/18 | | | No Opt. Call | | | | | | | | AA | | | | 450,442 | |
| | 350 | | | 5.000%, 10/01/19 | | | No Opt. Call | | | | | | | | AA | | | | 396,536 | |
| | 750 | | | 5.000%, 10/01/20 | | | No Opt. Call | | | | | | | | AA | | | | 873,698 | |
| | | | | | | | | | | | | | | | | | | | |
Principal
Amount (000) | | | Description (1) | | Optional Call
Provisions (2) | | | | | | | Ratings (3) | | | Value | |
| | | | | | |
| | | | Indiana (continued) | | | | | | | | | | | | | |
| | | | | | |
| | | | Indiana Finance Authority, Wastewater Utility Revenue Bonds, CWA Authority Project, Series 2015A: | | | | | | | | | | | | | | | | |
| $ | 1,400 | | | 5.000%, 10/01/18 | | | No Opt. Call | | | | | | | | AA | | | $ | 1,538,096 | |
| | 1,400 | | | 5.000%, 10/01/19 | | | No Opt. Call | | | | | | | | AA | | | | 1,586,144 | |
| | 680 | | | 5.000%, 10/01/20 | | | No Opt. Call | | | | | | | | AA | | | | 792,152 | |
| | 550 | | | 5.000%, 10/01/23 | | | No Opt. Call | | | | | | | | AA | | | | 679,613 | |
| | 1,000 | | | 5.000%, 10/01/24 | | | No Opt. Call | | | | | | | | AA | | | | 1,254,120 | |
| | 1,800 | | | 5.000%, 10/01/25 | | | 10/24 at 100.00 | | | | | | | | AA | | | | 2,230,398 | |
| | 1,240 | | | 5.000%, 10/01/26 | | | 10/24 at 100.00 | | | | | | | | AA | | | | 1,520,004 | |
| | 800 | | | 5.000%, 10/01/27 | | | 10/24 at 100.00 | | | | | | | | AA | | | | 973,744 | |
| | | | | | |
| | 11,170 | | | Indiana Health and Educational Facilities Financing Authority, Revenue Bonds, Ascension Health, Series 2006B-7, 4.100%, 11/15/46 (Mandatory put 11/03/16) | | | No Opt. Call | | | | | | | | AA+ | | | | 11,366,815 | |
| | | | | | |
| | 5,245 | | | Indiana Health Facility Financing Authority, Revenue Bonds, Ascension Health, Series 2001A-2, 1.600%, 11/15/36 (Mandatory put 2/01/17) | | | No Opt. Call | | | | | | | | AA+ | | | | 5,275,736 | |
| | | | | | |
| | 260 | | | Indiana State University Board of Trustees, Indiana State University, Housing and Dining System Revenue Bonds, Series 2014, 4.000%, 4/01/22 | | | No Opt. Call | | | | | | | | AA– | | | | 294,382 | |
| | | | | | |
| | | | Indianapolis Local Public Improvement Bond Bank, Indiana, Waterworks Project, Refunding Series 2006: | | | | | | | | | | | | | | | | |
| | 1,630 | | | 5.500%, 7/01/19 – NPFG Insured | | | No Opt. Call | | | | | | | | AA– | | | | 1,845,307 | |
| | 3,690 | | | 5.500%, 1/01/20 – NPFG Insured | | | No Opt. Call | | | | | | | | AA– | | | | 4,231,028 | |
| | | | | | |
| | 8,000 | | | Indianapolis Local Public Improvement Bond Bank, Indiana, Waterworks Project, Series 2007B, 5.250%, 7/01/24 – NPFG Insured | | | No Opt. Call | | | | | | | | AA– | | | | 9,964,800 | |
| | | | | | |
| | | | Indianapolis, Indiana, Thermal Energy System Revenue Bonds, Refunding First Lien Series 2014A: | | | | | | | | | | | | | | | | |
| | 275 | | | 3.000%, 10/01/16 | | | No Opt. Call | | | | | | | | A | | | | 277,668 | |
| | 250 | | | 4.000%, 10/01/17 | | | No Opt. Call | | | | | | | | A | | | | 260,963 | |
| | 300 | | | 4.000%, 10/01/18 | | | No Opt. Call | | | | | | | | A | | | | 320,997 | |
| | 285 | | | 5.000%, 10/01/19 | | | No Opt. Call | | | | | | | | A | | | | 321,457 | |
| | 350 | | | 5.000%, 10/01/20 | | | No Opt. Call | | | | | | | | A | | | | 404,492 | |
| | 450 | | | 5.000%, 10/01/21 | | | No Opt. Call | | | | | | | | A | | | | 530,942 | |
| | 450 | | | 5.000%, 10/01/22 | | | No Opt. Call | | | | | | | | A | | | | 540,207 | |
| | 600 | | | 5.000%, 10/01/23 | | | No Opt. Call | | | | | | | | A | | | | 731,082 | |
| | 420 | | | 5.000%, 10/01/24 | | | No Opt. Call | | | | | | | | A | | | | 518,125 | |
| | 500 | | | 5.000%, 10/01/25 | | | 10/24 at 100.00 | | | | | | | | A | | | | 614,530 | |
| | 725 | | | 5.000%, 10/01/26 | | | 10/24 at 100.00 | | | | | | | | A | | | | 882,456 | |
| | | | | | |
| | 4,080 | | | Jasper County, Indiana, Pollution Control Revenue Refunding Bonds, Northern Indiana Public Service Company Project, Series 1988A Remarketed, 5.600%, 11/01/16 – NPFG Insured | | | No Opt. Call | | | | | | | | AA– | | | | 4,171,310 | |
| | | | | | |
| | 6,290 | | | Jasper County, Indiana, Pollution Control Revenue Refunding Bonds, Northern Indiana Public Service Company Project, Series 2003 Remarketed, 5.700%, 7/01/17 – AMBAC Insured | | | No Opt. Call | | | | | | | | BBB+ | | | | 6,569,339 | |
| | | | | | |
| | | | Knox County, Indiana, Economic Development Revenue and Refunding Bonds, Good Samaritan Hospital Project, Series 2012A: | | | | | | | | | | | | | | | | |
| | 880 | | | 4.000%, 4/01/17 | | | No Opt. Call | | | | | | | | Baa2 | | | | 899,043 | |
| | 400 | | | 4.000%, 4/01/18 | | | No Opt. Call | | | | | | | | Baa2 | | | | 416,976 | |
| | 550 | | | 3.000%, 4/01/19 | | | No Opt. Call | | | | | | | | Baa2 | | | | 567,430 | |
| | | | | | |
| | 915 | | | Lake County Building Corporation, Indiana, First Mortgage Bonds, Series 2012, 4.000%, 8/01/16 | | | No Opt. Call | | | | | | | | N/R | | | | 918,852 | |
| | | | | | |
| | 11,500 | | | Mount Vernon, Indiana, Environmental Improvement Revenue Bonds, Southern Indiana Gas and Electric Company Project, Refunding Series 2015, 2.375%, 9/01/55 (Mandatory put 9/01/20) (Alternative Minimum Tax) | | | No Opt. Call | | | | | | | | Aa3 | | | | 11,751,045 | |
Nuveen Limited Term Municipal Bond Fund (continued)
| | |
| Portfolio of Investments | | April 30, 2016 |
| | | | | | | | | | | | | | | | | | | | |
Principal
Amount (000) | | | Description (1) | | Optional Call
Provisions (2) | | | | | | | Ratings (3) | | | Value | |
| | | | | | |
| | | | Indiana (continued) | | | | | | | | | | | | | |
| | | | | | |
| $ | 1,000 | | | Richmond Hospital Authority, Indiana, Revenue Bonds, Reid Hospital Project, Refunding Series 2015A, 5.000%, 1/01/22 | | | No Opt. Call | | | | | | | | A | | | $ | 1,179,770 | |
| | | | | | |
| | | | Vanderburgh County, Indiana, Redevelopment District Tax Increment Revenue bonds, Refunding Series 2014: | | | | | | | | | | | | | | | | |
| | 250 | | | 4.000%, 2/01/18 | | | No Opt. Call | | | | | | | | A | | | | 262,850 | |
| | 520 | | | 4.000%, 2/01/19 | | | No Opt. Call | | | | | | | | A | | | | 559,827 | |
| | 700 | | | 5.000%, 2/01/20 | | | No Opt. Call | | | | | | | | A | | | | 793,079 | |
| | 640 | | | 5.000%, 2/01/21 | | | No Opt. Call | | | | | | | | A | | | | 742,739 | |
| | 1,595 | | | 4.000%, 2/01/24 | | | No Opt. Call | | | | | | | | A | | | | 1,830,677 | |
| | | | | | |
| | 7,500 | | | Warrick County, Indiana, Environmental Improvement Revenue Bonds, Southern Indiana Gas and Electric Company, Series 2015, 2.375%, 9/01/55 (Mandatory put 9/01/20) (Alternative Minimum Tax) | | | No Opt. Call | | | | | | | | Aa3 | | | | 7,663,725 | |
| | | | | | |
| | 32,285 | | | Whiting, Indiana, Environmental Facilities Revenue Bonds, BP Products North America Inc. Project, Series 2008, 1.850%, 6/01/44 (Mandatory put 10/01/19) | | | No Opt. Call | | | | | | | | A2 | | | | 32,487,427 | |
| | | | | | |
| | 10,000 | | | Whiting, Indiana, Environmental Facilities Revenue Bonds, BP Products North America Inc. Project, Series 2015, 5.000%, 11/01/45 (Mandatory put 11/01/22) (Alternative Minimum Tax) | | | No Opt. Call | | | | | | | | A2 | | | | 11,698,000 | |
| | | | | | |
| | | | Zionsville Community Schools Building Corporation, Indiana, First Mortgage Bonds, Refunding Series 2014B: | | | | | | | | | | | | | | | | |
| | 2,020 | | | 3.000%, 7/15/19 | | | No Opt.��Call | | | | | | | | AA– | | | | 2,155,582 | |
| | 1,215 | | | 4.000%, 1/15/20 | | | No Opt. Call | | | | | | | | AA– | | | | 1,346,366 | |
| | 187,260 | | | Total Indiana | | | | | | | | | | | | | | | 200,108,784 | |
| | | | | | |
| | | | Iowa – 0.4% | | | | | | | | | | | | | |
| | | | | | |
| | | | Fort Dodge Community School District, Webster County, Iowa, School Infrastructure Sales, Services, and Use Tax Revenue Bonds, Series 2011: | | | | | | | | | | | | | | | | |
| | 1,150 | | | 4.000%, 1/01/18 – AGM Insured | | | No Opt. Call | | | | | | | | AA | | | | 1,205,488 | |
| | 1,330 | | | 5.000%, 1/01/19 – AGM Insured | | | No Opt. Call | | | | | | | | AA | | | | 1,461,763 | |
| | 1,380 | | | 5.000%, 1/01/20 – AGM Insured | | | No Opt. Call | | | | | | | | AA | | | | 1,555,081 | |
| | 1,245 | | | 5.000%, 1/01/22 – AGM Insured | | | 1/21 at 100.00 | | | | | | | | AA | | | | 1,447,001 | |
| | | | | | |
| | 7,645 | | | Iowa Finance Authority, Iowa, Midwestern Disaster Area Revenue Bonds, Iowa Fertilizer Company Project, Series 2013, 5.000%, 12/01/19 | | | No Opt. Call | | | | | | | | BB– | | | | 7,909,593 | |
| | | | | | |
| | | | Iowa State, Special Obligation Bonds, I-Jobs Program, Series 2009A: | | | | | | | | | | | | | | | | |
| | 1,985 | | | 5.000%, 6/01/17 | | | No Opt. Call | | | | | | | | AA | | | | 2,080,340 | |
| | 3,290 | | | 5.000%, 6/01/18 | | | No Opt. Call | | | | | | | | AA | | | | 3,585,245 | |
| | 18,025 | | | Total Iowa | | | | | | | | | | | | | | | 19,244,511 | |
| | | | | | |
| | | | Kansas – 0.4% | | | | | | | | | | | | | |
| | | | | | |
| | 6,050 | | | Kansas Department of Transportation, Highway Revenue Bonds, Refunding Series 2009A, 5.000%, 9/01/17 | | | No Opt. Call | | | | | | | | AAA | | | | 6,407,192 | |
| | | | | | |
| | | | Kansas Development Finance Authority, Revenue Bonds, Sisters of Charity of Leavenworth Health Services Corporation, Series 2010A: | | | | | | | | | | | | | | | | |
| | 1,245 | | | 5.000%, 1/01/20 | | | No Opt. Call | | | | | | | | AA– | | | | 1,421,678 | |
| | 1,475 | | | 5.000%, 1/01/23 | | | 1/20 at 100.00 | | | | | | | | AA– | | | | 1,685,468 | |
| | | | | | |
| | | | Topeka Public Building Commission, Kansas, Revenue Bonds, Kansas Department of Administration – 10th and Jackson Projects, Series 2007A: | | | | | | | | | | | | | | | | |
| | 2,245 | | | 5.000%, 6/01/25 – NPFG Insured | | | 6/18 at 102.00 | | | | | | | | AA– | | | | 2,466,582 | |
| | 2,945 | | | 5.000%, 6/01/26 – NPFG Insured | | | 6/18 at 102.00 | | | | | | | | AA– | | | | 3,235,672 | |
| | | | | | | | | | | | | | | | | | | | |
Principal
Amount (000) | | | Description (1) | | Optional Call
Provisions (2) | | | | | | | Ratings (3) | | | Value | |
| | | | | | |
| | | | Kansas (continued) | | | | | | | | | | | | | |
| | | | | | |
| | | | Wyandotte County/Kansas City Unified Government, Kansas, Utility System Revenue Bonds, Refunding & Improvement Series 2014A: | | | | | | | | | | | | | | | | |
| $ | 610 | | | 4.000%, 9/01/18 | | | No Opt. Call | | | | | | | | A+ | | | $ | 653,121 | |
| | 2,000 | | | 5.000%, 9/01/20 | | | No Opt. Call | | | | | | | | A+ | | | | 2,323,080 | |
| | | | | | |
| | 30 | | | Wyandotte County-Kansas City Unified Government, Kansas, Sales Tax Special Obligation Capital Appreciation Revenue Bonds Redevelopment Project Area B – Major Multi-Sport Athletic Complex Project, Subordinate Lien Series 2010B, 0.000%, 6/01/21 | | | No Opt. Call | | | | | | | | A– | | | | 22,700 | |
| | 16,600 | | | Total Kansas | | | | | | | | | | | | | | | 18,215,493 | |
| | | | | | |
| | | | Kentucky – 2.0% | | | | | | | | | | | | | |
| | | | | | |
| | 9,260 | | | Kentucky Public Transportation Infrastructure Authority, First Tier Toll Revenue Bonds, Downtown Crossing Project, Series 2013A, 5.000%, 7/01/17 | | | No Opt. Call | | | | | | | | Baa3 | | | | 9,659,384 | |
| | | | | | |
| | 6,000 | | | Kentucky State Property and Buildings Commission, Revenue Bonds, Project 112, Refunding Series 2016B, 5.000%, 11/01/19 | | | No Opt. Call | | | | | | | | Aa3 | | | | 6,772,200 | |
| | | | | | |
| | 3,750 | | | Lexington-Fayette Urban County Government Public Facilities Corporation, Kentucky State Lease Revenue Bonds, Eastern State Hospital Project, Series 2011A, 5.000%, 6/01/18 | | | No Opt. Call | | | | | | | | Aa3 | | | | 4,070,025 | |
| | | | | | |
| | 15,325 | | | Louisville and Jefferson County Metropolitan Sewer District, Kentucky, Sewer and Drainage System Revenue Bonds, Series 2009B, 5.000%, 5/15/17 | | | No Opt. Call | | | | | | | | AA | | | | 16,019,069 | |
| | | | | | |
| | 3,580 | | | Louisville-Jefferson County Metropolitan Government, Kentucky, Environmental Facilities Revenue, Louisville Gas & Electric Company Project, Series 2007B, 1.600%, 6/01/33 (Mandatory put 6/01/17) | | | No Opt. Call | | | | | | | | A+ | | | | 3,601,373 | |
| | | | | | |
| | 13,500 | | | Louisville-Jefferson County Metropolitan Government, Kentucky, Pollution Control Revenue Bonds, Louisville Gas and Electric Company Project, Series 2001B, 1.350%, 11/01/27 (Mandatory put 5/01/18) (Alternative Minimum Tax) | | | No Opt. Call | | | | | | | | A1 | | | | 13,524,435 | |
| | | | | | |
| | 15,410 | | | Louisville-Jefferson County Metropolitan Government, Kentucky, Pollution Control Revenue Bonds, Louisville Gas and Electric Company Project, Series 2003A, 1.650%, 10/01/33 (Mandatory put 4/03/17) | | | No Opt. Call | | | | | | | | A1 | | | | 15,483,660 | |
| | | | | | |
| | 2,015 | | | Louisville-Jefferson County Metropolitan Government, Kentucky, Pollution Control Revenue Bonds, Louisville Gas and Electric Company Project, Series 2005A, 2.200%, 2/01/35 (Mandatory put 8/01/19) | | | No Opt. Call | | | | | | | | A1 | | | | 2,061,667 | |
| | | | | | |
| | | | Pikeville, Kentucky, Hospital Revenue Bonds, Pikeville Medical Center, Inc. Project, Improvement and Refunding Series 2011: | | | | | | | | | | | | | | | | |
| | 1,025 | | | 5.000%, 3/01/18 | | | No Opt. Call | | | | | | | | A3 | | | | 1,090,621 | |
| | 2,670 | | | 5.250%, 3/01/19 | | | No Opt. Call | | | | | | | | A3 | | | | 2,937,427 | |
| | 1,135 | | | 6.000%, 3/01/20 | | | No Opt. Call | | | | | | | | A3 | | | | 1,309,200 | |
| | 1,095 | | | 6.000%, 3/01/21 | | | No Opt. Call | | | | | | | | A3 | | | | 1,294,279 | |
| | | | | | |
| | 3,090 | | | Trimble County, Kentucky, Pollution Control Revenue Bonds, Louisville Gas and Electric Company Project, Series 2001B, 1.350%, 11/01/27 (Mandatory put 5/01/18) (Alternative Minimum Tax) | | | No Opt. Call | | | | | | | | A1 | | | | 3,095,593 | |
| | | | | | |
| | 3,250 | | | Trimble County, Kentucky, Pollution Control Revenue Bonds, Louisville Gas and Electric Company Project, Series 2002A, 1.050%, 9/01/26 (Mandatory put 3/01/18) | | | No Opt. Call | | | | | | | | A1 | | | | 3,251,365 | |
| | | | | | |
| | 3,535 | | | Warren County, Kentucky, Hospital Refunding Revenue Bonds, Bowling Green-Warren County Community Hospital Corporation, Series 2013, 5.000%, 4/01/23 | | | No Opt. Call | | | | | | | | A+ | | | | 4,140,015 | |
| | 84,640 | | | Total Kentucky | | | | | | | | | | | | | | | 88,310,313 | |
| | | | | | |
| | | | Louisiana – 3.8% | | | | | | | | | | | | | |
| | | | | | |
| | 1,000 | | | Bossier City, Louisiana, Utility Revenue Bonds, Refunding Series 2014, 4.000%, 10/01/20 | | | No Opt. Call | | | | | | | | AA– | | | | 1,123,330 | |
Nuveen Limited Term Municipal Bond Fund (continued)
| | |
| Portfolio of Investments | | April 30, 2016 |
| | | | | | | | | | | | | | | | | | | | |
Principal
Amount (000) | | | Description (1) | | Optional Call
Provisions (2) | | | | | | | Ratings (3) | | | Value | |
| | | | | | |
| | | | Louisiana (continued) | | | | | | | | | | | | | |
| | | | | | |
| $ | 14,025 | | | De Soto Parrish, Louisiana, Pollution Control Revenue Bonds, Southwestern Electric Power Company Project, Refunding Series 2010, 1.600%, 1/01/19 | | | No Opt. Call | | | | | | | | BBB | | | $ | 14,104,101 | |
| | | | | | |
| | 2,140 | | | East Baton Rouge Parish, Louisiana, Sales Tax Revenue Bonds, Road & Street Improvement, Refunding Series 2015, 5.000%, 8/01/22 | | | No Opt. Call | | | | | | | | AA– | | | | 2,580,284 | |
| | | | | | |
| | 9,600 | | | East Baton Rouge Sewerage Commission, Louisiana, Revenue Bonds, Variable Rate Demand Obligation Series 2011A, 0.819%, 2/01/46 (Mandatory put 8/01/18) | | | 2/18 at 100.00 | | | | | | | | AA | | | | 9,527,136 | |
| | | | | | |
| | | | Ernest N. Morial-New Orleans Exhibition Hall Authority, Louisiana, Special Tax Bonds, Refunding Series 2014: | | | | | | | | | | | | | | | | |
| | 2,500 | | | 5.000%, 7/15/19 | | | No Opt. Call | | | | | | | | A1 | | | | 2,809,675 | |
| | 2,070 | | | 5.000%, 7/15/20 | | | No Opt. Call | | | | | | | | A1 | | | | 2,392,403 | |
| | | | | | |
| | | | Louisiana Citizens Property Insurance Corporation, Assessment Revenue Bonds, Refunding Series 2015: | | | | | | | | | | | | | | | | |
| | 3,000 | | | 5.000%, 6/01/17 | | | No Opt. Call | | | | | | | | A1 | | | | 3,134,970 | |
| | 1,745 | | | 5.000%, 6/01/18 | | | No Opt. Call | | | | | | | | A1 | | | | 1,889,922 | |
| | 2,325 | | | 5.000%, 6/01/19 | | | No Opt. Call | | | | | | | | A1 | | | | 2,595,467 | |
| | 2,095 | | | 5.000%, 6/01/20 | | | No Opt. Call | | | | | | | | A1 | | | | 2,398,314 | |
| | 2,000 | | | 5.000%, 6/01/21 – AGM Insured | | | No Opt. Call | | | | | | | | AA | | | | 2,362,680 | |
| | 1,800 | | | 5.000%, 6/01/22 – AGM Insured | | | No Opt. Call | | | | | | | | AA | | | | 2,169,756 | |
| | | | | | |
| | 315 | | | Louisiana Citizens Property Insurance Corporation, Assessment Revenue Bonds, Series 2006B, 5.000%, 6/01/16 – AMBAC Insured (ETM) | | | No Opt. Call | | | | | | | | A1 (4) | | | | 316,285 | |
| | | | | | |
| | | | Louisiana Citizens Property Insurance Corporation, Assessment Revenue Bonds, Series 2006B: | | | | | | | | | | | | | | | | |
| | 455 | | | 5.000%, 6/01/17 (Pre-refunded 6/01/16) – AMBAC Insured | | | 6/16 at 100.00 | | | | | | | | A1 (4) | | | | 456,856 | |
| | 810 | | | 5.000%, 6/01/18 (Pre-refunded 6/01/16) – AMBAC Insured | | | 6/16 at 100.00 | | | | | | | | A1 (4) | | | | 813,305 | |
| | | | | | |
| | | | Louisiana Local Government Environmental Facilities and Community Development Authority, Revenue Bonds, East Baton Rouge Parish Road Improvements Project, Series 2015: | | | | | | | | | | | | | | | | |
| | 1,545 | | | 5.000%, 8/01/19 | | | No Opt. Call | | | | | | | | AA | | | | 1,737,584 | |
| | 2,235 | | | 5.000%, 8/01/24 | | | No Opt. Call | | | | | | | | AA | | | | 2,778,574 | |
| | | | | | |
| | 660 | | | Louisiana Local Government Environmental Facilities and Community Development Authority, Revenue Bonds, Livingston Parish North Park Project, Series 2008, 6.100%, 10/01/19 | | | 10/18 at 100.00 | | | | | | | | A+ | | | | 730,290 | |
| | | | | | |
| | | | Louisiana Local Government Environmental Facilities and Community Development Authority, Revenue Bonds, Southgate Suites Retail Project, Series 2007A: | | | | | | | | | | | | | | | | |
| | 2,700 | | | 6.500%, 12/15/15 (5) | | | No Opt. Call | | | | | | | | N/R | | | | 1,735,884 | |
| | 435 | | | 6.000%, 12/15/37 (5) | | | 7/16 at 100.00 | | | | | | | | N/R | | | | 238,815 | |
| | | | | | |
| | | | Louisiana Public Facilities Authority, Revenue Bonds, Hurricane Recovery Program, Refunding Series 2014: | | | | | | | | | | | | | | | | |
| | 1,775 | | | 5.000%, 6/01/19 | | | No Opt. Call | | | | | | | | A1 | | | | 1,985,036 | |
| | 5,015 | | | 5.000%, 6/01/20 | | | No Opt. Call | | | | | | | | A1 | | | | 5,750,801 | |
| | | | | | |
| | 25 | | | Louisiana Public Facilities Authority, Revenue Bonds, Ochsner Clinic Foundation Project, Series 2007A, 5.250%, 5/15/38 | | | 5/17 at 100.00 | | | | | | | | A– | | | | 25,907 | |
| | | | | | |
| | | | Louisiana Public Facilities Authority, Revenue Bonds, University of New Orleans Research and Technology Foundation, Inc.- Student Housing Project, Refunding Series 2014: | | | | | | | | | | | | | | | | |
| | 585 | | | 5.000%, 9/01/21 – AGM Insured | | | No Opt. Call | | | | | | | | AA | | | | 688,223 | |
| | 580 | | | 5.000%, 9/01/22 – AGM Insured | | | No Opt. Call | | | | | | | | AA | | | | 692,230 | |
| | 1,445 | | | 5.000%, 9/01/23 – AGM Insured | | | No Opt. Call | | | | | | | | AA | | | | 1,747,150 | |
| | 1,565 | | | 5.000%, 9/01/24 – AGM Insured | | | No Opt. Call | | | | | | | | AA | | | | 1,914,918 | |
| | | | | | | | | | | | | | | | | | | | |
Principal
Amount (000) | | | Description (1) | | Optional Call
Provisions (2) | | | | | | | Ratings (3) | | | Value | |
| | | | | | |
| | | | Louisiana (continued) | | | | | | | | | | | | | |
| | | | | | |
| | | | Louisiana Stadium and Exposition District, Revenue Refunding Bonds, Senior Lien Series 2013A: | | | | | | | | | | | | | | | | |
| $ | 585 | | | 5.000%, 7/01/18 | | | No Opt. Call | | | | | | | | A | | | $ | 636,474 | |
| | 1,570 | | | 5.000%, 7/01/19 | | | No Opt. Call | | | | | | | | A | | | | 1,762,969 | |
| | 1,100 | | | 5.000%, 7/01/20 | | | No Opt. Call | | | | | | | | A | | | | 1,270,071 | |
| | 7,245 | | | 5.000%, 7/01/26 | | | 7/23 at 100.00 | | | | | | | | A | | | | 8,605,249 | |
| | | | | | |
| | | | Louisiana State, Gasoline and Fuels Tax Revenue Bonds, Refunding Series 2012A-1: | | | | | | | | | | | | | | | | |
| | 20 | | | 5.000%, 5/01/19 | | | No Opt. Call | | | | | | | | AA | | | | 22,456 | |
| | 2,530 | | | 5.000%, 5/01/20 | | | No Opt. Call | | | | | | | | AA | | | | 2,928,197 | |
| | 3,635 | | | 5.000%, 5/01/21 | | | No Opt. Call | | | | | | | | AA | | | | 4,319,107 | |
| | | | | | |
| | 7,000 | | | Louisiana State, General Obligation Bonds, Refunding Series 2014C, 5.000%, 8/01/22 | | | No Opt. Call | | | | | | | | AA | | | | 8,396,220 | |
| | | | | | |
| | 12,325 | | | Louisiana State, General Obligation Bonds, Series 2012A, 5.000%, 8/01/19 | | | No Opt. Call | | | | | | | | Aa3 | | | | 13,883,866 | |
| | | | | | |
| | 6,000 | | | Louisiana State, General Obligation Bonds, Series 2014A, 5.000%, 2/01/20 | | | No Opt. Call | | | | | | | | AA | | | | 6,846,960 | |
| | | | | | |
| | 6,245 | | | Louisiana State, General Obligation Bonds, Series 2015A, 5.000%, 5/01/23 | | | No Opt. Call | | | | | | | | AA | | | | 7,565,630 | |
| | | | | | |
| | | | New Orleans, Louisiana, General Obligation Bonds, Refunding Series 2012: | | | | | | | | | | | | | | | | |
| | 2,860 | | | 5.000%, 12/01/19 | | | No Opt. Call | | | | | | | | A+ | | | | 3,235,918 | |
| | 2,500 | | | 5.000%, 12/01/20 | | | No Opt. Call | | | | | | | | A+ | | | | 2,895,400 | |
| | 3,600 | | | 5.000%, 12/01/21 | | | No Opt. Call | | | | | | | | A+ | | | | 4,239,864 | |
| | | | | | |
| | | | New Orleans, Louisiana, General Obligation Bonds, Refunding Series 2015: | | | | | | | | | | | | | | | | |
| | 750 | | | 4.000%, 12/01/17 | | | No Opt. Call | | | | | | | | A+ | | | | 786,488 | |
| | 875 | | | 4.000%, 12/01/18 | | | No Opt. Call | | | | | | | | A+ | | | | 941,404 | |
| | 1,000 | | | 4.000%, 12/01/19 | | | No Opt. Call | | | | | | | | A+ | | | | 1,097,990 | |
| | 1,500 | | | 5.000%, 12/01/20 | | | No Opt. Call | | | | | | | | A+ | | | | 1,737,240 | |
| | 1,500 | | | 5.000%, 12/01/21 | | | No Opt. Call | | | | | | | | A+ | | | | 1,766,610 | |
| | | | | | |
| | 7,130 | | | New Orleans, Louisiana, General Obligation Bonds, Series 1998, 5.500%, 12/01/21 – FGIC Insured | | | No Opt. Call | | | | | | | | A3 | | | | 8,075,224 | |
| | | | | | |
| | | | New Orleans, Louisiana, Sewerage Service Revenue Bonds, Refunding Series 2014: | | | | | | | | | | | | | | | | |
| | 500 | | | 4.000%, 6/01/16 | | | No Opt. Call | | | | | | | | A | | | | 501,565 | |
| | 1,850 | | | 5.000%, 6/01/17 | | | No Opt. Call | | | | | | | | A | | | | 1,933,232 | |
| | 1,000 | | | 5.000%, 6/01/18 | | | No Opt. Call | | | | | | | | A | | | | 1,083,050 | |
| | | | | | |
| | | | New Orleans, Louisiana, Sewerage Service Revenue Bonds, Series 2015: | | | | | | | | | | | | | | | | |
| | 1,000 | | | 5.000%, 6/01/24 | | | No Opt. Call | | | | | | | | A | | | | 1,223,220 | |
| | 500 | | | 5.000%, 6/01/26 | | | 6/25 at 100.00 | | | | | | | | A | | | | 611,185 | |
| | | | | | |
| | 1,100 | | | New Orleans, Louisiana, Water Revenue Bonds, Refunding Series 2014, 5.000%, 12/01/19 | | | No Opt. Call | | | | | | | | A– | | | | 1,242,923 | |
| | | | | | |
| | 40 | | | Saint Bernard Parish, Louisiana, Sales and Use Tax Revenue Bonds, Series 2004, 5.000%, 3/01/17 – AGM Insured | | | No Opt. Call | | | | | | | | AA | | | | 40,159 | |
| | | | | | |
| | 4,700 | | | Saint Charles Parish, Louisiana, Gulf Opportunity Zone Revenue Bonds, Valero Project, Series 2010, 4.000%, 12/01/40 (Mandatory put 6/01/22) | | | No Opt. Call | | | | | | | | BBB | | | | 5,139,732 | |
| | | | | | |
| | 2,295 | | | Shreveport, Louisiana, General Obligation Bonds, Series 2014, 5.000%, 9/01/21 | | | No Opt. Call | | | | | | | | A+ | | | | 2,721,962 | |
| | | | | | |
| | | | Terrebonne Levee and Conservation District, Louisiana, Public Improvement Sales Tax Bonds, Series 2013: | | | | | | | | | | | | | | | | |
| | 1,710 | | | 5.000%, 7/01/21 | | | No Opt. Call | | | | | | | | A+ | | | | 1,987,311 | |
| | 1,680 | | | 5.000%, 7/01/22 | | | No Opt. Call | | | | | | | | A+ | | | | 1,978,200 | |
| | | | | | |
| | 1,930 | | | Tobacco Settlement Financing Corporation, Louisiana, Tobacco Settlement Asset-Backed Refunding Bonds, Series 2013A, 5.000%, 5/15/25 | | | 5/16 at 100.00 | | | | | | | | A | | | | 1,934,709 | |
| | 152,720 | | | Total Louisiana | | | | | | | | | | | | | | | 170,110,481 | |
Nuveen Limited Term Municipal Bond Fund (continued)
| | |
| Portfolio of Investments | | April 30, 2016 |
| | | | | | | | | | | | | | | | | | | | |
Principal
Amount (000) | | | Description (1) | | Optional Call
Provisions (2) | | | | | | | Ratings (3) | | | Value | |
| | | | | | |
| | | | Maine – 0.0% | | | | | | | | | | | | | |
| | | | | | |
| $ | 615 | | | Augusta, Maine, General Obligation Bonds, Refunding Series 2015A, 5.000%, 12/01/18 | | | No Opt. Call | | | | | | | | AA | | | $ | 681,125 | |
| | | | | | |
| | | | Maryland – 2.8% | | | | | | | | | | | | | |
| | | | | | |
| | | | Baltimore County, Maryland, General Obligation Bonds, Metropolitan District 77th Issue, Series 2014: | | | | | | | | | | | | | | | | |
| | 2,800 | | | 5.000%, 8/01/17 | | | No Opt. Call | | | | | | | | AAA | | | | 2,955,344 | |
| | 2,800 | | | 5.000%, 8/01/18 | | | No Opt. Call | | | | | | | | AAA | | | | 3,071,040 | |
| | | | | | |
| | 6,240 | | | Baltimore County, Maryland, General Obligation Bonds, Refunding Consolidated Public Improvement Series 2009, 5.000%, 8/01/18 | | | No Opt. Call | | | | | | | | AAA | | | | 6,844,032 | |
| | | | | | |
| | 1,880 | | | Maryland Department of Transportation, Consolidated Transportation Revenue Bonds, Second Series 2003, 5.000%, 6/01/18 | | | No Opt. Call | | | | | | | | AAA | | | | 2,049,256 | |
| | | | | | |
| | 5,000 | | | Maryland Economic Development Corporation, Revenue Bonds, Constellation Energy Group, Inc. Projects, Adjustable Mode, Refunding Series 2006B, 2.550%, 12/01/25 (Mandatory put 6/01/20) | | | No Opt. Call | | | | | | | | BBB | | | | 5,085,700 | |
| | | | | | |
| | | | Maryland Economic Development Corporation, Student Housing Revenue Bonds, University of Maryland, College Park Project, Refunding Series 2016: | | | | | | | | | | | | | | | | |
| | 815 | | | 4.000%, 6/01/18 – AGM Insured | | | No Opt. Call | | | | | | | | AA | | | | 867,339 | |
| | 675 | | | 4.000%, 6/01/19 – AGM Insured | | | No Opt. Call | | | | | | | | AA | | | | 733,961 | |
| | 640 | | | 4.000%, 6/01/20 – AGM Insured | | | No Opt. Call | | | | | | | | AA | | | | 708,090 | |
| | 725 | | | 4.000%, 6/01/21 – AGM Insured | | | No Opt. Call | | | | | | | | AA | | | | 814,487 | |
| | | | | | |
| | | | Maryland Health and Higher Educational Facilities Authority, Maryland, Hospital Revenue Bonds, Meritus Medical Center, Series 2015: | | | | | | | | | | | | | | | | |
| | 530 | | | 5.000%, 7/01/21 | | | No Opt. Call | | | | | | | | BBB | | | | 622,119 | |
| | 1,000 | | | 5.000%, 7/01/22 | | | No Opt. Call | | | | | | | | BBB | | | | 1,187,100 | |
| | 250 | | | 5.000%, 7/01/23 | | | No Opt. Call | | | | | | | | BBB | | | | 298,770 | |
| | 500 | | | 5.000%, 7/01/24 | | | No Opt. Call | | | | | | | | BBB | | | | 601,490 | |
| | | | | | |
| | | | Maryland Health and Higher Educational Facilities Authority, Revenue Bonds, Western Maryland Health, Series 2014: | | | | | | | | | | | | | | | | |
| | 6,190 | | | 5.000%, 7/01/18 | | | No Opt. Call | | | | | | | | BBB | | | | 6,740,972 | |
| | 4,000 | | | 5.000%, 7/01/19 | | | No Opt. Call | | | | | | | | BBB | | | | 4,501,640 | |
| | | | | | |
| | | | Maryland State, General Obligation Bonds, State & Local Facilities Loan, Second Series 2008: | | | | | | | | | | | | | | | | |
| | 5,120 | | | 5.000%, 7/15/16 | | | No Opt. Call | | | | | | | | AAA | | | | 5,169,664 | |
| | 5,790 | | | 5.000%, 7/15/17 | | | No Opt. Call | | | | | | | | AAA | | | | 6,100,286 | |
| | 5,155 | | | 5.000%, 7/15/18 | | | No Opt. Call | | | | | | | | AAA | | | | 5,644,777 | |
| | | | | | |
| | 14,345 | | | Maryland State, General Obligation Bonds, State & Local Facilities Loan, Third Series 2009C, 5.000%, 11/01/17 | | | No Opt. Call | | | | | | | | AAA | | | | 15,293,205 | |
| | | | | | |
| | | | Maryland State, General Obligation Bonds, State and Local Facilities Loan, Second Series 2015A-2: | | | | | | | | | | | | | | | | |
| | 6,835 | | | 5.000%, 8/01/19 | | | No Opt. Call | | | | | | | | AAA | | | | 7,762,236 | |
| | 27,740 | | | 5.000%, 8/01/20 | | | No Opt. Call | | | | | | | | AAA | | | | 32,492,417 | |
| | | | | | |
| | 100 | | | Maryland Transportation Authority, Revenue Refunding Bonds, Transportation Facilities Projects, First Series 1978, 6.800%, 7/01/16 (ETM) | | | No Opt. Call | | | | | | | | Aaa | | | | 100,963 | |
| | | | | | |
| | 9,985 | | | Montgomery County, Maryland, General Obligation Bonds, Consolidated Public Improvement Series 2014A, 5.000%, 11/01/18 | | | No Opt. Call | | | | | | | | AAA | | | | 11,051,198 | |
| | | | | | |
| | 5,000 | | | Montgomery County, Maryland, General Obligation Bonds, Refunding Consolidated Public Improvement Series 2011A, 5.000%, 7/01/19 | | | No Opt. Call | | | | | | | | AAA | | | | 5,663,150 | |
| | 114,115 | | | Total Maryland | | | | | | | | | | | | | | | 126,359,236 | |
| | | | | | | | | | | | | | | | | | | | |
Principal
Amount (000) | | | Description (1) | | Optional Call
Provisions (2) | | | | | | | Ratings (3) | | | Value | |
| | | | | | |
| | | | Massachusetts – 1.7% | | | | | | | | | | | | | |
| | | | | | |
| | | | Massachusetts Development Finance Agency Revenue Bonds, Lawrence General Hospital Issue, Series 2014A: | | | | | | | | | | | | | | | | |
| $ | 595 | | | 5.000%, 7/01/19 | | | No Opt. Call | | | | | | | | BBB– | | | $ | 644,141 | |
| | 375 | | | 5.000%, 7/01/20 | | | No Opt. Call | | | | | | | | BBB– | | | | 411,368 | |
| | 555 | | | 5.000%, 7/01/21 | | | No Opt. Call | | | | | | | | BBB– | | | | 614,096 | |
| | 690 | | | 5.000%, 7/01/22 | | | No Opt. Call | | | | | | | | BBB– | | | | 770,302 | |
| | 625 | | | 5.000%, 7/01/23 | | | No Opt. Call | | | | | | | | BBB– | | | | 704,681 | |
| | 735 | | | 5.000%, 7/01/24 | | | No Opt. Call | | | | | | | | BBB– | | | | 833,688 | |
| | 795 | | | 5.000%, 7/01/25 | | | 7/24 at 100.00 | | | | | | | | BBB– | | | | 896,553 | |
| | | | | | |
| | | | Massachusetts Health and Educational Facilities Authority, Revenue Bonds, Harvard University, Series 2009A: | | | | | | | | | | | | | | | | |
| | 2,175 | | | 5.000%, 11/15/16 | | | No Opt. Call | | | | | | | | AAA | | | | 2,229,114 | |
| | 1,535 | | | 5.000%, 11/15/17 | | | No Opt. Call | | | | | | | | AAA | | | | 1,639,963 | |
| | 1,000 | | | 5.000%, 11/15/18 | | | No Opt. Call | | | | | | | | AAA | | | | 1,109,390 | |
| | | | | | |
| | | | Massachusetts Health and Educational Facilities Authority, Revenue Bonds, Massachusetts Eye and Ear Infirmary, Series 2010C: | | | | | | | | | | | | | | | | |
| | 1,815 | | | 5.000%, 7/01/18 | | | No Opt. Call | | | | | | | | BBB– | | | | 1,950,835 | |
| | 1,000 | | | 5.000%, 7/01/19 | | | No Opt. Call | | | | | | | | BBB– | | | | 1,104,900 | |
| | 1,000 | | | 5.000%, 7/01/20 | | | No Opt. Call | | | | | | | | BBB– | | | | 1,131,700 | |
| | | | | | |
| | 4,000 | | | Massachusetts Health and Educational Facilities Authority, Variable Rate Demand Revenue Bonds, University of Massachusetts Issue, Series 2000A, 1.150%, 11/01/30 (Mandatory put 4/01/19) | | | No Opt. Call | | | | | | | | Aa2 | | | | 4,005,720 | |
| | | | | | |
| | 12,900 | | | Massachusetts State, General Obligation Bonds, Consolidated Loan, Series 2002C, 5.500%, 11/01/17 – AGM Insured | | | No Opt. Call | | | | | | | | AA+ | | | | 13,853,310 | |
| | | | | | |
| | 3,200 | | | Massachusetts State, General Obligation Bonds, Consolidated Loan, Series 2015C, 5.000%, 7/01/19 | | | No Opt. Call | | | | | | | | AA+ | | | | 3,619,040 | |
| | | | | | |
| | | | Massachusetts State, General Obligation Bonds, Refunding Series 2015A: | | | | | | | | | | | | | | | | |
| | 13,965 | | | 3.000%, 7/01/17 | | | No Opt. Call | | | | | | | | AA+ | | | | 14,367,471 | |
| | 14,000 | | | 5.000%, 7/01/23 | | | No Opt. Call | | | | | | | | AA+ | | | | 17,520,160 | |
| | | | | | |
| | | | Norwood, Massachusetts, General Obligation Bonds, Municipal Purpose Loan Series 2009A: | | | | | | | | | | | | | | | | |
| | 2,420 | | | 4.000%, 8/15/16 | | | No Opt. Call | | | | | | | | AA+ | | | | 2,445,144 | |
| | 2,420 | | | 4.000%, 8/15/17 | | | No Opt. Call | | | | | | | | AA+ | | | | 2,525,512 | |
| | 2,420 | | | 4.000%, 8/15/18 | | | No Opt. Call | | | | | | | | AA+ | | | | 2,600,145 | |
| | 68,220 | | | Total Massachusetts | | | | | | | | | | | | | | | 74,977,233 | |
| | | | | | |
| | | | Michigan – 1.9% | | | | | | | | | | | | | |
| | | | | | |
| | 1,500 | | | Detroit-Wayne County Stadium Authority, Michigan, Wayne County Limited Tax General Obligation Bonds, Building Authority Stadium Refunding Series 2012, 5.000%, 10/01/19 – AGM Insured | | | No Opt. Call | | | | | | | | AA | | | | 1,648,620 | |
| | | | | | |
| | | | Lake Orion Community School District, Oakland County, Michigan, General Obligation Bonds, Refunding Series 2012: | | | | | | | | | | | | | | | | |
| | 1,000 | | | 5.000%, 5/01/16 | | | No Opt. Call | | | | | | | | AA– | | | | 1,000,250 | |
| | 1,000 | | | 4.000%, 5/01/17 | | | No Opt. Call | | | | | | | | AA– | | | | 1,032,630 | |
| | 1,780 | | | 4.000%, 5/01/18 | | | No Opt. Call | | | | | | | | AA– | | | | 1,889,203 | |
| | | | | | |
| | | | Marquette, Michigan, Electric Utility System Revenue Bonds, Refunding Series 2016A: | | | | | | | | | | | | | | | | |
| | 1,100 | | | 5.000%, 7/01/20 (WI/DD, Settling 5/12/16) | | | No Opt. Call | | | | | | | | A | | | | 1,265,275 | |
| | 850 | | | 5.000%, 7/01/21 (WI/DD, Settling 5/12/16) | | | No Opt. Call | | | | | | | | A | | | | 1,002,048 | |
| | | | | | |
| | 4,575 | | | Michigan Finance Authority, Revenue Bonds, Ascension Senior Credit Group, Refunding Series 2016E-1, 1.100%, 11/15/46 (Mandatory put 8/15/19) (WI/DD, Settling 5/11/16) | | | No Opt. Call | | | | | | | | AA+ | | | | 4,575,686 | |
Nuveen Limited Term Municipal Bond Fund (continued)
| | |
| Portfolio of Investments | | April 30, 2016 |
| | | | | | | | | | | | | | | | | | | | |
Principal
Amount (000) | | | Description (1) | | Optional Call
Provisions (2) | | | | | | | Ratings (3) | | | Value | |
| | | | | | |
| | | | Michigan (continued) | | | | | | | | | | | | | |
| | | | | | |
| $ | 8,790 | | | Michigan Finance Authority, Unemployment Obligation Assessment Revenue Bonds, Series 2012B, 5.000%, 7/01/21 | | | 7/18 at 100.00 | | | | | | | | AAA | | | $ | 9,604,394 | |
| | | | | | |
| | 3,195 | | | Michigan Hospital Finance Authority, Revenue Bonds, Ascension Health Group, Series 2010B, 5.000%, 11/15/17 | | | No Opt. Call | | | | | | | | AA+ | | | | 3,404,528 | |
| | | | | | |
| | 10,010 | | | Michigan Hospital Finance Authority, Revenue Bonds, Ascension Health Senior Credit Group, Refunding and Project Series 2010F-5, 1.500%, 11/15/47 (Mandatory put 3/15/17) | | | No Opt. Call | | | | | | | | AA+ | | | | 10,070,761 | |
| | | | | | |
| | 18,555 | | | Michigan Hospital Finance Authority, Revenue Bonds, Ascension Health Senior Credit Group, Refunding Series 2010F-1, 2.000%, 11/15/47 (Mandatory put 5/30/18) | | | No Opt. Call | | | | | | | | AA+ | | | | 18,926,286 | |
| | | | | | |
| | 1,440 | | | Michigan Housing Development Authority, Rental Housing Revenue Bonds, Series 2009B, 4.375%, 10/01/19 | | | 10/18 at 100.00 | | | | | | | | AA | | | | 1,470,067 | |
| | | | | | |
| | 6,030 | | | Michigan State Trunk Line Fund Refunding Bonds, Series 2009, 5.000%, 11/01/20 | | | 11/19 at 100.00 | | | | | | | | AA+ | | | | 6,873,778 | |
| | | | | | |
| | 1,605 | | | Michigan State, General Obligation Bonds, Environmental Program, Series 2009A, 5.500%, 11/01/21 | | | 5/19 at 100.00 | | | | | | | | Aa1 | | | | 1,815,335 | |
| | | | | | |
| | | | Plymouth-Canton Community School District, Wayne and Washtenaw Counties, Michigan, General Obligation Bonds, Refunding Series 2012A: | | | | | | | | | | | | | | | | |
| | 1,100 | | | 4.000%, 5/01/19 | | | No Opt. Call | | | | | | | | Aa1 | | | | 1,195,194 | |
| | 1,000 | | | 5.000%, 5/01/21 | | | No Opt. Call | | | | | | | | Aa1 | | | | 1,176,630 | |
| | | | | | |
| | | | Plymouth-Canton Community School District, Wayne and Washtenaw Counties, Michigan, General Obligation Bonds, School Building & Site Series 2013A: | | | | | | | | | | | | | | | | |
| | 765 | | | 5.000%, 5/01/19 | | | No Opt. Call | | | | | | | | Aa3 | | | | 853,771 | |
| | 1,000 | | | 5.000%, 5/01/20 | | | No Opt. Call | | | | | | | | Aa3 | | | | 1,147,480 | |
| | | | | | |
| | 2,500 | | | Royal Oak Hospital Finance Authority, Michigan, Hospital Revenue Bonds, William Beaumont Hospital Obligated Group, Refunding Series 2014D, 5.000%, 9/01/22 | | | No Opt. Call | | | | | | | | A1 | | | | 3,005,650 | |
| | | | | | |
| | 4,975 | | | Walled Lake Consolidated School District, Oakland County, Michigan, General Obligation Bonds, Refunding Series 2011, 5.000%, 5/01/19 | | | No Opt. Call | | | | | | | | Aa1 | | | | 5,552,299 | |
| | | | | | |
| | 8,150 | | | Wayne County Airport Authority, Michigan, Revenue Bonds, Detroit Metropolitan Airport, Refunding Series 2010C, 5.000%, 12/01/16 | | | No Opt. Call | | | | | | | | A | | | | 8,354,565 | |
| | 80,920 | | | Total Michigan | | | | | | | | | | | | | | | 85,864,450 | |
| | | | | | |
| | | | Minnesota – 0.8% | | | | | | | | | | | | | |
| | | | | | |
| | | | Cass Lake Independent School District 115, Minnesota, General Obligation Bonds, School Building Refunding Series 2010A: | | | | | | | | | | | | | | | | |
| | 745 | | | 4.000%, 2/01/23 | | | 2/20 at 100.00 | | | | | | | | AA+ | | | | 813,913 | |
| | 1,615 | | | 5.000%, 2/01/25 | | | 2/20 at 100.00 | | | | | | | | AA+ | | | | 1,831,749 | |
| | 1,690 | | | 5.000%, 2/01/26 | | | 2/20 at 100.00 | | | | | | | | AA+ | | | | 1,912,235 | |
| | | | | | |
| | | | Minneapolis-St. Paul Metropolitan Airports Commission, Minnesota, Airport Revenue Bonds, Subordinate Lien, Refunding Series 2014A: | | | | | | | | | | | | | | | | |
| | 1,350 | | | 4.000%, 1/01/17 | | | No Opt. Call | | | | | | | | A+ | | | | 1,381,482 | |
| | 1,670 | | | 5.000%, 1/01/24 | | | No Opt. Call | | | | | | | | A+ | | | | 2,089,320 | |
| | | | | | |
| | 1,375 | | | Minnesota Higher Education Facilities Authority, Revenue Bonds, University of Saint Thomas, Series 2016-8M, 4.000%, 4/01/18 | | | No Opt. Call | | | | | | | | A2 | | | | 1,458,628 | |
| | | | | | |
| | | | Minnesota Public Facilities Authority, State Clean Water Revolving Fund Revenue Bonds, Series 2016A: | | | | | | | | | | | | | | | | |
| | 4,130 | | | 5.000%, 3/01/19 | | | No Opt. Call | | | | | | | | AAA | | | | 4,620,851 | |
| | 8,665 | | | 5.000%, 3/01/20 | | | No Opt. Call | | | | | | | | AAA | | | | 9,997,764 | |
| | | | | | | | | | | | | | | | | | | | |
Principal
Amount (000) | | | Description (1) | | Optional Call
Provisions (2) | | | | | | | Ratings (3) | | | Value | |
| | | | | | |
| | | | Minnesota (continued) | | | | | | | | | | | | | |
| | | | | | |
| | | | Minnesota State, General Obligation Bonds, State Trunk Highway Series 2009E: | | | | | | | | | | | | | | | | |
| $ | 4,000 | | | 4.500%, 8/01/17 | | | No Opt. Call | | | | | | | | AA+ | | | $ | 4,195,920 | |
| | 4,000 | | | 4.500%, 8/01/18 | | | No Opt. Call | | | | | | | | AA+ | | | | 4,340,600 | |
| | | | | | |
| | 895 | | | Northern Municipal Power Agency, Minnesota, Electric System Revenue Bonds, Series 2013A, 5.000%, 1/01/23 | | | No Opt. Call | | | | | | | | A– | | | | 1,089,994 | |
| | | | | | |
| | 2,815 | | | Saint Cloud, Minnesota, Health Care Revenue Bonds, CentraCare Health System, Refunding Series 2014B, 5.000%, 5/01/22 | | | No Opt. Call | | | | | | | | A1 | | | | 3,391,118 | |
| | 32,950 | | | Total Minnesota | | | | | | | | | | | | | | | 37,123,574 | |
| | | | | | |
| | | | Mississippi – 0.6% | | | | | | | | | | | | | |
| | | | | | |
| | 20,820 | | | Mississippi Business Finance Corporation, Revenue Bonds, Mississippi Power Company Project, First Series 2010, 1.625%, 12/01/40 (Mandatory put 1/01/18) | | | No Opt. Call | | | | | | | | BBB+ | | | | 20,966,989 | |
| | | | | | |
| | 3,670 | | | Mississippi Hospital Equipment and Facilities Authority, Revenue Bonds, Baptist Memorial Healthcare, Series 2015A, 5.000%, 9/01/24 | | | No Opt. Call | | | | | | | | A– | | | | 4,366,236 | |
| | 24,490 | | | Total Mississippi | | | | | | | | | | | | | | | 25,333,225 | |
| | | | | | |
| | | | Missouri – 1.7% | | | | | | | | | | | | | |
| | | | | | |
| | 860 | | | Kansas City Tax Increment Financing Commission, Missouri, Tax Increment Revenue Bonds, Shoal Creek Parkway Project, Series 2011, 6.500%, 6/01/25 | | | No Opt. Call | | | | | | | | N/R | | | | 861,023 | |
| | | | | | |
| | | | Metropolitan St. Louis Sewerage District, Missouri, Wastewater System Revenue Bonds, Series 2011B: | | | | | | | | | | | | | | | | |
| | 2,520 | | | 4.000%, 5/01/23 | | | 5/21 at 100.00 | | | | | | | | AAA | | | | 2,882,930 | |
| | 2,695 | | | 4.000%, 5/01/24 | | | 5/21 at 100.00 | | | | | | | | AAA | | | | 3,066,641 | |
| | | | | | |
| | | | Missouri Health and Educational Facilities Authority, Educational Facilities Revenue Bonds, Saint Louis College of Pharmacy, Series 2013: | | | | | | | | | | | | | | | | |
| | 550 | | | 5.000%, 5/01/19 | | | No Opt. Call | | | | | | | | BBB+ | | | | 606,084 | |
| | 440 | | | 5.000%, 5/01/20 | | | No Opt. Call | | | | | | | | BBB+ | | | | 493,095 | |
| | 1,000 | | | 5.000%, 5/01/21 | | | No Opt. Call | | | | | | | | BBB+ | | | | 1,139,840 | |
| | 2,545 | | | 4.000%, 5/01/22 | | | No Opt. Call | | | | | | | | BBB+ | | | | 2,790,923 | |
| | 1,320 | | | 5.000%, 5/01/23 | | | No Opt. Call | | | | | | | | BBB+ | | | | 1,536,427 | |
| | | | | | |
| | 1,000 | | | Missouri Health and Educational Facilities Authority, Revenue Bonds, Lutheran Senior Services, Series 2007A, 4.875%, 2/01/19 | | | 2/17 at 100.00 | | | | | | | | BBB+ | | | | 1,024,700 | |
| | | | | | |
| | 10,000 | | | Missouri Highways and Transportation Commission, State Road Revenue Bonds, Refunding Second Lien Series 2014B, 5.000%, 5/01/18 | | | No Opt. Call | | | | | | | | AAA | | | | 10,866,100 | |
| | | | | | |
| | | | Missouri Joint Municipal Electric Utility Commission, Power Project Revenue Bonds, Plum Point Project, Refunding Series 2014A: | | | | | | | | | | | | | | | | |
| | 2,285 | | | 5.000%, 1/01/25 | | | No Opt. Call | | | | | | | | A | | | | 2,832,349 | |
| | 5,000 | | | 5.000%, 1/01/26 | | | 1/25 at 100.00 | | | | | | | | A | | | | 6,139,550 | |
| | | | | | |
| | | | Saint Louis, Missouri, Airport Revenue Bonds, Lambert-St. Louis International Airport, Refunding Series 2013: | | | | | | | | | | | | | | | | |
| | 530 | | | 5.000%, 7/01/16 | | | No Opt. Call | | | | | | | | A– | | | | 534,060 | |
| | 815 | | | 5.000%, 7/01/17 | | | No Opt. Call | | | | | | | | A– | | | | 855,440 | |
| | 765 | | | 5.000%, 7/01/18 | | | No Opt. Call | | | | | | | | A– | | | | 833,001 | |
| | | | | | |
| | | | Saint Louis, Missouri, Airport Revenue Bonds, Lambert-St. Louis International Airport, Refunding Series 2015: | | | | | | | | | | | | | | | | |
| | 1,700 | | | 5.000%, 7/01/20 | | | No Opt. Call | | | | | | | | A– | | | | 1,952,365 | |
| | 1,575 | | | 5.000%, 7/01/21 | | | No Opt. Call | | | | | | | | A– | | | | 1,845,758 | |
| | 1,000 | | | 5.000%, 7/01/22 | | | No Opt. Call | | | | | | | | A– | | | | 1,191,610 | |
| | 1,085 | | | 5.000%, 7/01/23 | | | No Opt. Call | | | | | | | | A– | | | | 1,312,351 | |
Nuveen Limited Term Municipal Bond Fund (continued)
| | |
| Portfolio of Investments | | April 30, 2016 |
| | | | | | | | | | | | | | | | | | | | |
Principal
Amount (000) | | | Description (1) | | Optional Call
Provisions (2) | | | | | | | Ratings (3) | | | Value | |
| | | | | | |
| | | | Missouri (continued) | | | | | | | | | | | | | |
| | | | | | |
| | | | Saint Louis, Missouri, Airport Revenue Bonds, Lambert-St. Louis International Airport, Series 2005: | | | | | | | | | | | | | | | | |
| $ | 8,185 | | | 5.500%, 7/01/17 – NPFG Insured | | | No Opt. Call | | | | | | | | AA– | | | $ | 8,638,776 | |
| | 12,005 | | | 5.500%, 7/01/18 – NPFG Insured | | | No Opt. Call | | | | | | | | AA– | | | | 13,201,058 | |
| | | | | | |
| | 1,750 | | | Saint Louis, Missouri, Airport Revenue Bonds, Lambert-St. Louis International Airport, Series 2007A, 5.000%, 7/01/17 – AGM Insured | | | No Opt. Call | | | | | | | | AA | | | | 1,838,095 | |
| | | | | | |
| | 8,825 | | | Sikeston, Missouri, Electric System Revenue Refunding Bonds, Series 2012, 5.000%, 6/01/17 | | | No Opt. Call | | | | | | | | BBB+ | | | | 9,160,527 | |
| | | | | | |
| | 775 | | | Springfield School District R12, Greene County, Missouri, General Obligation Bonds, Crossover Refunding Series 2014B, 4.000%, 3/01/18 | | | No Opt. Call | | | | | | | | AA+ | | | | 821,105 | |
| | 69,225 | | | Total Missouri | | | | | | | | | | | | | | | 76,423,808 | |
| | | | | | |
| | | | Nebraska – 1.2% | | | | | | | | | | | | | |
| | | | | | |
| | 4,390 | | | Douglas County Hospital Authority 2, Nebraska, Hospital Revenue Bonds, Madonna Rehabilitation Hospital Project, Series 2014, 5.000%, 5/15/21 | | | No Opt. Call | | | | | | | | BBB+ | | | | 5,073,216 | |
| | | | | | |
| | | | Douglas County Hospital Authority 3, Nebraska, Health Facilities Revenue Bonds, Nebraska Methodist Health System, Refunding Series 2015: | | | | | | | | | | | | | | | | |
| | 925 | | | 4.000%, 11/01/18 | | | No Opt. Call | | | | | | | | A– | | | | 986,559 | |
| | 1,000 | | | 5.000%, 11/01/22 | | | No Opt. Call | | | | | | | | A– | | | | 1,178,690 | |
| | | | | | |
| | | | Douglas County School District 10 Elkhorn, Nebraska, General Obligation Bonds, Public Schools Series 2012: | | | | | | | | | | | | | | | | |
| | 500 | | | 4.000%, 6/15/16 | | | No Opt. Call | | | | | | | | AA– | | | | 502,230 | |
| | 750 | | | 4.000%, 6/15/17 | | | No Opt. Call | | | | | | | | AA– | | | | 777,368 | |
| | 600 | | | 4.000%, 6/15/18 | | | No Opt. Call | | | | | | | | AA– | | | | 640,446 | |
| | 800 | | | 5.000%, 6/15/19 | | | No Opt. Call | | | | | | | | AA– | | | | 899,456 | |
| | | | | | |
| | | | Lancaster County School District 1, Lincoln, Nebraska, General Obligation Bonds, Refunding Series 2009: | | | | | | | | | | | | | | | | |
| | 3,475 | | | 3.000%, 1/15/17 | | | No Opt. Call | | | | | | | | AAA | | | | 3,535,952 | |
| | 3,220 | | | 3.000%, 1/15/18 | | | No Opt. Call | | | | | | | | AAA | | | | 3,348,349 | |
| | 2,520 | | | 3.000%, 1/15/19 | | | No Opt. Call | | | | | | | | AAA | | | | 2,670,998 | |
| | | | | | |
| | 1,000 | | | Lincoln County Hospital Authority 1, Nebraska, Hospital Revenue and Refunding Bonds, Great Plains Regional Medical Center Project, Series 2012, 3.500%, 11/01/27 | | | No Opt. Call | | | | | | | | A– | | | | 1,021,280 | |
| | | | | | |
| | 1,700 | | | Nebraska Public Power District, General Revenue Bonds, Series 2015A-2, 5.000%, 1/01/24 | | | 1/22 at 100.00 | | | | | | | | A+ | | | | 2,038,725 | |
| | | | | | |
| | | | Public Power Generation Agency, Nebraska, Whelan Energy Center Unit 2 Revenue Bonds, Refunding Series 2015A: | | | | | | | | | | | | | | | | |
| | 6,245 | | | 5.000%, 1/01/18 | | | No Opt. Call | | | | | | | | A2 | | | | 6,674,344 | |
| | 2,125 | | | 5.000%, 1/01/19 | | | No Opt. Call | | | | | | | | A2 | | | | 2,343,216 | |
| | 2,500 | | | 5.000%, 1/01/20 | | | No Opt. Call | | | | | | | | A2 | | | | 2,823,875 | |
| | | | | | |
| | 3,050 | | | University of Nebraska Facilities Corporation, UNMC Cancer Center Bonds, Series 2014A, 5.000%, 2/15/21 | | | No Opt. Call | | | | | | | | Aa1 | | | | 3,610,285 | |
| | | | | | |
| | 17,560 | | | Washington County, Nebraska, Wastewater and Solid Waste Disposal Facilities Revenue Bonds, Cargill Inc. Project, Variable Rate Demand Series 2012, 2.375%, 9/01/30 (Mandatory put 9/01/20) (Alternative Minimum Tax) | | | No Opt. Call | | | | | | | | A | | | | 18,067,660 | |
| | 52,360 | | | Total Nebraska | | | | | | | | | | | | | | | 56,192,649 | |
| | | | | | |
| | | | Nevada – 0.9% | | | | | | | | | | | | | |
| | | | | | |
| | | | Clark County, Nevada, Airport Revenue Bonds, Jet Aviation Fuel Tax, Refunding Series 2013A: | | | | | | | | | | | | | | | | |
| | 1,000 | | | 5.000%, 7/01/20 (Alternative Minimum Tax) | | | No Opt. Call | | | | | | | | A+ | | | | 1,146,700 | |
| | 2,000 | | | 5.000%, 7/01/21 (Alternative Minimum Tax) | | | No Opt. Call | | | | | | | | A+ | | | | 2,337,840 | |
| | | | | | | | | | | | | | | | | | | | |
Principal
Amount (000) | | | Description (1) | | Optional Call
Provisions (2) | | | | | | | Ratings (3) | | | Value | |
| | | | | | |
| | | | Nevada (continued) | | | | | | | | | | | | | |
| | | | | | |
| $ | 25,755 | | | Clark County, Nevada, General Obligation Bonds, Bond Bank Refunding Series 2016A, 5.000%, 11/01/19 | | | No Opt. Call | | | | | | | | Aa1 | | | $ | 29,387,485 | |
| | | | | | |
| | 665 | | | Clark County, Nevada, Limited Tax General Obligation Bank Bonds, Refunding Series 2006, 5.000%, 11/01/21 – AMBAC Insured | | | 11/16 at 100.00 | | | | | | | | Aa1 | | | | 680,654 | |
| | | | | | |
| | 1,050 | | | Clark County, Nevada, Limited Tax General Obligation Bank Bonds, Refunding Series 2006, 5.000%, 11/01/21 (Pre-refunded 11/01/16) – AMBAC Insured | | | 11/16 at 100.00 | | | | | | | | Aa1 (4) | | | | 1,073,856 | |
| | | | | | |
| | 5,000 | | | Las Vegas Valley Water District, Nevada, General Obligation Bonds, Water & Refunding Series 2011C, 5.000%, 6/01/24 | | | 6/21 at 100.00 | | | | | | | | Aa1 | | | | 5,931,350 | |
| | | | | | |
| | | | Las Vegas, Nevada, Local Improvement Bonds, Special Improvement District 607 Providence, Refunding Series 2013: | | | | | | | | | | | | | | | | |
| | 295 | | | 3.000%, 6/01/16 | | | No Opt. Call | | | | | | | | N/R | | | | 295,389 | |
| | 895 | | | 3.000%, 6/01/17 | | | No Opt. Call | | | | | | | | N/R | | | | 904,201 | |
| | 170 | | | 4.000%, 6/01/18 | | | No Opt. Call | | | | | | | | N/R | | | | 175,367 | |
| | 36,830 | | | Total Nevada | | | | | | | | | | | | | | | 41,932,842 | |
| | | | | | |
| | | | New Jersey – 4.2% | | | | | | | | | | | | | |
| | | | | | |
| | 260 | | | Bayonne Redevelopment Agency, New Jersey, Revenue Bonds, Royal Caribbean Cruises Project, Series 2006A, 4.750%, 11/01/16 (Alternative Minimum Tax) | | | No Opt. Call | | | | | | | | BB+ | | | | 261,095 | |
| | | | | | |
| | 245 | | | Bergen County Improvement Authority, New Jersey, Governmental Loan Revenue Bonds, Bergen County Guaranteed, Series 2014B, 5.000%, 2/15/19 | | | No Opt. Call | | | | | | | | Aaa | | | | 273,322 | |
| | | | | | |
| | 3,890 | | | Casino Reinvestment Development Authority, New Jersey, Parking Revenue Bonds, Series 2005A, 5.250%, 6/01/20 – NPFG Insured | | | No Opt. Call | | | | | | | | AA– | | | | 3,903,109 | |
| | | | | | |
| | | | Millville, New Jersey, General Obligation Bonds, Improvement Series 2011: | | | | | | | | | | | | | | | | |
| | 1,000 | | | 5.000%, 11/01/16 – AGM Insured | | | No Opt. Call | | | | | | | | AA | | | | 1,021,150 | |
| | 1,445 | | | 5.000%, 11/01/19 – AGM Insured | | | No Opt. Call | | | | | | | | AA | | | | 1,618,992 | |
| | 920 | | | 5.000%, 11/01/20 – AGM Insured | | | No Opt. Call | | | | | | | | AA | | | | 1,052,140 | |
| | | | | | |
| | 345 | | | Monmouth County Improvement Authority, New Jersey, Governmental Loan Revenue Bonds, Series 2007, 5.000%, 12/01/16 – AMBAC Insured | | | No Opt. Call | | | | | | | | N/R | | | | 352,952 | |
| | | | | | |
| | 5 | | | Monmouth County Improvement Authority, New Jersey, Governmental Loan Revenue Bonds, Series 2007, 5.000%, 12/01/16 – AMBAC Insured (ETM) | | | No Opt. Call | | | | | | | | N/R (4) | | | | 5,132 | |
| | | | | | |
| | | | New Jersey Economic Development Authority, Cigarette Tax Revenue Refunding Bonds, Series 2012: | | | | | | | | | | | | | | | | |
| | 4,250 | | | 5.000%, 6/15/16 | | | No Opt. Call | | | | | | | | BBB+ | | | | 4,270,060 | |
| | 6,565 | | | 5.000%, 6/15/17 | | | No Opt. Call | | | | | | | | BBB+ | | | | 6,799,830 | |
| | 8,510 | | | 5.000%, 6/15/18 | | | No Opt. Call | | | | | | | | BBB+ | | | | 9,040,003 | |
| | 5,000 | | | 5.000%, 6/15/19 | | | No Opt. Call | | | | | | | | BBB+ | | | | 5,421,200 | |
| | 245 | | | 4.000%, 6/15/19 | | | No Opt. Call | | | | | | | | BBB+ | | | | 259,112 | |
| | 10,990 | | | 5.000%, 6/15/20 | | | No Opt. Call | | | | | | | | BBB+ | | | | 12,089,220 | |
| | 2,810 | | | 5.000%, 6/15/21 | | | No Opt. Call | | | | | | | | BBB+ | | | | 3,135,735 | |
| | 1,370 | | | 5.000%, 6/15/22 | | | No Opt. Call | | | | | | | | BBB+ | | | | 1,537,633 | |
| | 520 | | | 5.000%, 6/15/22 | | | No Opt. Call | | | | | | | | AA | | | | 604,620 | |
| | 6,565 | | | 5.000%, 6/15/23 | | | 6/22 at 100.00 | | | | | | | | BBB+ | | | | 7,316,036 | |
| | 4,500 | | | 5.000%, 6/15/24 | | | 6/22 at 100.00 | | | | | | | | BBB+ | | | | 4,983,075 | |
| | 8,570 | | | 5.000%, 6/15/25 | | | 6/22 at 100.00 | | | | | | | | BBB+ | | | | 9,374,295 | |
| | 6,000 | | | 5.000%, 6/15/26 | | | 6/22 at 100.00 | | | | | | | | BBB+ | | | | 6,519,600 | |
| | 685 | | | 4.250%, 6/15/27 | | | 6/22 at 100.00 | | | | | | | | BBB+ | | | | 707,126 | |
| | | | | | |
| | 25,000 | | | New Jersey Economic Development Authority, School Facilities Construction Financing Program Bonds, Refunding Series 2015XX, 5.000%, 6/15/21 | | | No Opt. Call | | | | | | | | A– | | | | 27,651,500 | |
Nuveen Limited Term Municipal Bond Fund (continued)
| | |
| Portfolio of Investments | | April 30, 2016 |
| | | | | | | | | | | | | | | | | | | | |
Principal
Amount (000) | | | Description (1) | | Optional Call
Provisions (2) | | | | | | | Ratings (3) | | | Value | |
| | | | | | |
| | | | New Jersey (continued) | | | | | | | | | | | | | |
| | | | | | |
| $ | 2,865 | | | New Jersey Educational Facilities Authority, Revenue Bonds, Montclair State University Issue, Series 2007A, 5.250%, 7/01/21 – NPFG Insured | | | No Opt. Call | | | | | | | | AA | | | $ | 3,085,376 | |
| | | | | | |
| | 340 | | | New Jersey Educational Facilities Authority, Revenue Bonds, University of Medicine and Dentistry of New Jersey, Refunding Series 2009B, 7.500%, 12/01/32 (Pre-refunded 6/01/19) | | | 6/19 at 100.00 | | | | | | | | N/R (4) | | | | 407,725 | |
| | | | | | |
| | | | New Jersey Health Care Facilities Financing Authority, New Jersey, Revenue Bonds, Saint Peters University Hospital, Refunding Series 2011: | | | | | | | | | | | | | | | | |
| | 4,060 | | | 5.000%, 7/01/18 | | | No Opt. Call | | | | | | | | BB+ | | | | 4,260,848 | |
| | 4,260 | | | 5.000%, 7/01/19 | | | No Opt. Call | | | | | | | | BB+ | | | | 4,538,434 | |
| | | | | | |
| | 410 | | | New Jersey Highway Authority, Senior Revenue Bonds, Garden State Parkway, Series 1989, 6.000%, 1/01/19 – NPFG Insured (ETM) | | | No Opt. Call | | | | | | | | Aaa | | | | 446,060 | |
| | | | | | |
| | 10,000 | | | New Jersey Transit Corporation, Grant Anticipation Notes, Federal Transit Administration Section 5307 Urbanized Area Formula Funds, Series 2014A, 5.000%, 9/15/18 | | | No Opt. Call | | | | | | | | A | | | | 10,749,500 | |
| | | | | | |
| | | | New Jersey Transportation Trust Fund Authority, Transportation System Bonds, Series 2010D: | | | | | | | | | | | | | | | | |
| | 5,070 | | | 5.000%, 12/15/17 | | | No Opt. Call | | | | | | | | A– | | | | 5,356,404 | |
| | 9,750 | | | 5.000%, 12/15/18 | | | No Opt. Call | | | | | | | | A– | | | | 10,479,008 | |
| | | | | | |
| | 6,005 | | | New Jersey Turnpike Authority, Revenue Bonds, Series 2012B, 5.000%, 1/01/19 | | | No Opt. Call | | | | | | | | A+ | | | | 6,643,452 | |
| | | | | | |
| | 1,125 | | | Parsippany-Troy Hills Township, New Jersey, General Obligation Bonds, Refunding Series 2012, 4.000%, 7/15/20 | | | No Opt. Call | | | | | | | | AA | | | | 1,255,286 | |
| | | | | | |
| | 1,700 | | | Passaic Valley Sewer Commissioners, New Jersey, Sewer Revenue Bonds, Series 2010G, 5.750%, 12/01/22 | | | No Opt. Call | | | | | | | | A3 | | | | 2,078,641 | |
| | | | | | |
| | 4,215 | | | Salem County Pollution Control Financing Authority, New Jersey, Pollution Control Revenue Bonds, Chambers Project, Refunding Series 2014A, 5.000%, 12/01/23 (Alternative Minimum Tax) | | | No Opt. Call | | | | | | | | BBB– | | | | 4,720,800 | |
| | | | | | |
| | | | South Jersey Port Corporation, New Jersey, Marine Terminal Revenue Bonds, Refunding Series 2012Q: | | | | | | | | | | | | | | | | |
| | 3,405 | | | 3.000%, 1/01/18 | | | No Opt. Call | | | | | | | | A3 | | | | 3,468,571 | |
| | 4,850 | | | 3.000%, 1/01/19 | | | No Opt. Call | | | | | | | | A3 | | | | 4,947,534 | |
| | | | | | |
| | | | Tobacco Settlement Financing Corporation, New Jersey, Tobacco Settlement Asset-Backed Bonds, Series 2007-1A: | | | | | | | | | | | | | | | | |
| | 140 | | | 5.000%, 6/01/17 | | | No Opt. Call | | | | | | | | Aaa | | | | 146,467 | |
| | 6,710 | | | 5.000%, 6/01/18 | | | 6/17 at 100.00 | | | | | | | | Aa3 | | | | 7,013,896 | |
| | 4,290 | | | 4.500%, 6/01/23 | | | 6/17 at 100.00 | | | | | | | | BB | | | | 4,365,247 | |
| | 7,870 | | | 4.625%, 6/01/26 | | | 6/17 at 100.00 | | | | | | | | B+ | | | | 7,932,645 | |
| | 176,755 | | | Total New Jersey | | | | | | | | | | | | | | | 190,092,831 | |
| | | | | | |
| | | | New Mexico – 2.1% | | | | | | | | | | | | | |
| | | | | | |
| | 1,100 | | | Albuquerque Bernalillo County Water Utility Authority, New Mexico, Joint Water and Sewer System Revenue Bonds, Refunding Subordinate Lien Series 2014B, 5.000%, 7/01/19 | | | No Opt. Call | | | | | | | | AA | | | | 1,239,986 | |
| | | | | | |
| | | | Albuquerque, New Mexico, General Obligation Bonds, General Purpose Series 2016A: | | | | | | | | | | | | | | | | |
| | 6,000 | | | 5.000%, 7/01/19 | | | No Opt. Call | | | | | | | | AAA | | | | 6,785,700 | |
| | 6,000 | | | 5.000%, 7/01/20 | | | No Opt. Call | | | | | | | | AAA | | | | 6,994,320 | |
| | | | | | |
| | 10,050 | | | Farmington, New Mexico, Pollution Control Revenue Bonds, Southern California Edison Company, Four Corners Project, Refunding Series 2005B, 1.875%, 4/01/29 (Mandatory put 4/01/20) | | | No Opt. Call | | | | | | | | Aa3 | | | | 10,245,071 | |
| | | | | | |
| | 7,285 | | | Farmington, New Mexico, Pollution Control Revenue Refunding Bonds, Southern California Edison Company, Four Corners Project, Series 2005A, 1.875%, 4/01/29 (Mandatory put 4/01/20) | | | No Opt. Call | | | | | | | | Aa3 | | | | 7,415,183 | |
| | | | | | | | | | | | | | | | | | | | |
Principal
Amount (000) | | | Description (1) | | Optional Call
Provisions (2) | | | | | | | Ratings (3) | | | Value | |
| | | | | | |
| | | | New Mexico (continued) | | | | | | | | | | | | | |
| | | | | | |
| | | | New Mexico Finance Authority, Public Project Revolving Fund Revenue Bonds, Senior Lien Series 2016A: | | | | | | | | | | | | | | | | |
| $ | 3,880 | | | 3.000%, 6/01/17 | | | No Opt. Call | | | | | | | | AAA | | | $ | 3,981,811 | |
| | 3,395 | | | 4.000%, 6/01/18 | | | No Opt. Call | | | | | | | | AAA | | | | 3,628,610 | |
| | 3,275 | | | 5.000%, 6/01/19 | | | No Opt. Call | | | | | | | | AAA | | | | 3,690,434 | |
| | | | | | |
| | 15,340 | | | New Mexico Municipal Energy Acquisition Authority, Gas Supply Revenue Bonds, Refunding Sub-Series 2014A, 5.000%, 11/01/39 (Mandatory put 8/01/19) | | | 8/19 at 100.00 | | | | | | | | Aa3 | | | | 17,123,122 | |
| | | | | | |
| | | | San Juan County, New Mexico, Gross Receipts Tax Revenue Bonds, Refunding Series 2015A: | | | | | | | | | | | | | | | | |
| | 845 | | | 4.000%, 6/15/18 | | | No Opt. Call | | | | | | | | A+ | | | | 898,311 | |
| | 1,340 | | | 5.000%, 6/15/19 | | | No Opt. Call | | | | | | | | A+ | | | | 1,499,500 | |
| | 1,305 | | | 5.000%, 6/15/20 | | | No Opt. Call | | | | | | | | A+ | | | | 1,499,197 | |
| | 1,455 | | | 5.000%, 6/15/21 | | | No Opt. Call | | | | | | | | A+ | | | | 1,712,200 | |
| | 1,510 | | | 5.000%, 6/15/22 | | | No Opt. Call | | | | | | | | A+ | | | | 1,800,917 | |
| | 1,565 | | | 5.000%, 6/15/23 | | | No Opt. Call | | | | | | | | A+ | | | | 1,897,312 | |
| | 1,625 | | | 5.000%, 6/15/24 | | | No Opt. Call | | | | | | | | A+ | | | | 1,996,443 | |
| | 1,690 | | | 5.000%, 6/15/25 | | | No Opt. Call | | | | | | | | A+ | | | | 2,098,169 | |
| | 1,760 | | | 5.000%, 6/15/26 | | | 6/25 at 100.00 | | | | | | | | A+ | | | | 2,164,448 | |
| | | | | | |
| | 14,955 | | | State of New Mexico, State Severance Tax Revenue Bonds, Series 2014A, 5.000%, 7/01/23 | | | 7/19 at 100.00 | | | | | | | | Aa1 | | | | 16,878,213 | |
| | 84,375 | | | Total New Mexico | | | | | | | | | | | | | | | 93,548,947 | |
| | | | | | |
| | | | New York – 6.7% | | | | | | | | | | | | | |
| | | | | | |
| | 500 | | | Buffalo and Fort Erie Public Bridge Authority, New York, Toll Bridge System Revenue Bonds, Refunding Series 2014, 5.000%, 1/01/22 | | | No Opt. Call | | | | | | | | A+ | | | | 599,320 | |
| | | | | | |
| | 500 | | | Dormitory Authority of the State of New York, FHA-Insured Mortgage Revenue Bonds, Montefiore Hospital, Series 2004, 5.000%, 2/01/19 – FGIC Insured | | | No Opt. Call | | | | | | | | AA– | | | | 501,950 | |
| | | | | | |
| | 1,595 | | | Dormitory Authority of the State of New York, Mental Health Services Facilities Improvement Revenue Bonds, Series 2010A, 5.000%, 8/15/19 | | | No Opt. Call | | | | | | | | AA | | | | 1,805,827 | |
| | | | | | |
| | 5 | | | Dormitory Authority of the State of New York, Mental Health Services Facilities Improvement Revenue Bonds, Series 2010A, 5.000%, 8/15/19 (ETM) | | | No Opt. Call | | | | | | | | N/R (4) | | | | 5,684 | |
| | | | | | |
| | 1,250 | | | Dormitory Authority of the State of New York, Revenue Bonds, Memorial Sloan-Kettering Cancer Center, Series 2012-1, 5.000%, 7/01/23 | | | 1/22 at 100.00 | | | | | | | | AA | | | | 1,515,063 | |
| | | | | | |
| | 325 | | | Dormitory Authority of the State of New York, Revenue Bonds, NYU Hospitals Center, Series 2014, 5.000%, 7/01/23 | | | No Opt. Call | | | | | | | | A– | | | | 397,865 | |
| | | | | | |
| | 12,195 | | | Dormitory Authority of the State of New York, State Personal Income Tax Revenue Bonds, General Purpose Series 2012A, 5.000%, 12/15/21 | | | No Opt. Call | | | | | | | | AAA | | | | 14,758,267 | |
| | | | | | |
| | 5 | | | Dormitory Authority of the State of New York, State Personal Income Tax Revenue Bonds, General Purpose Series 2012A, 5.000%, 12/15/21 (ETM) | | | No Opt. Call | | | | | | | | N/R (4) | | | | 6,067 | |
| | | | | | |
| | 3,335 | | | Dormitory Authority of the State of New York, State Personal Income Tax Revenue Bonds, General Purpose Series 2014A, 5.000%, 2/15/21 | | | No Opt. Call | | | | | | | | AAA | | | | 3,951,041 | |
| | | | | | |
| | | | Long Island Power Authority, New York, Electric System General Revenue Bonds, Series 2000A: | | | | | | | | | | | | | | | | |
| | 890 | | | 0.000%, 6/01/16 – AGM Insured | | | No Opt. Call | | | | | | | | AA | | | | 889,591 | |
| | 400 | | | 0.000%, 6/01/19 – AGM Insured | | | No Opt. Call | | | | | | | | AA | | | | 383,620 | |
| | 515 | | | 0.000%, 6/01/21 – AGM Insured | | | No Opt. Call | | | | | | | | AA | | | | 476,602 | |
| | 450 | | | 0.000%, 6/01/22 – AGM Insured | | | No Opt. Call | | | | | | | | AA | | | | 406,895 | |
| | 1,305 | | | 0.000%, 6/01/23 – AGM Insured | | | No Opt. Call | | | | | | | | AA | | | | 1,147,382 | |
Nuveen Limited Term Municipal Bond Fund (continued)
| | |
| Portfolio of Investments | | April 30, 2016 |
| | | | | | | | | | | | | | | | | | | | |
Principal
Amount (000) | | | Description (1) | | Optional Call
Provisions (2) | | | | | | | Ratings (3) | | | Value | |
| | | | | | |
| | | | New York (continued) | | | | | | | | | | | | | |
| | | | | | |
| | | | Long Island Power Authority, New York, Electric System General Revenue Bonds, Series 2006E: | | | | | | | | | | | | | | | | |
| $ | 365 | | | 5.000%, 12/01/17 – FGIC Insured | | | 12/16 at 100.00 | | | | | | | | AA– | | | $ | 374,789 | |
| | 3,910 | | | 5.000%, 12/01/17 | | | 12/16 at 100.00 | | | | | | | | A– | | | | 4,012,872 | |
| | 2,280 | | | 5.000%, 12/01/18 – FGIC Insured | | | 12/16 at 100.00 | | | | | | | | AA– | | | | 2,340,534 | |
| | 200 | | | 5.000%, 12/01/22 | �� | | 12/16 at 100.00 | | | | | | | | A– | | | | 204,964 | |
| | | | | | |
| | | | Long Island Power Authority, New York, Electric System Revenue Bonds, Refunding Series 2009A: | | | | | | | | | | | | | | | | |
| | 610 | | | 5.000%, 4/01/18 (ETM) | | | No Opt. Call | | | | | | | | A– (4) | | | | 659,685 | |
| | 3,715 | | | 5.000%, 4/01/19 (ETM) | | | No Opt. Call | | | | | | | | A– (4) | | | | 4,166,484 | |
| | | | | | |
| | 1,250 | | | Long Island Power Authority, New York, Electric System Revenue Bonds, Refunding Series 2009A, 5.500%, 4/01/22 | | | 4/19 at 100.00 | | | | | | | | A– | | | | 1,387,875 | |
| | | | | | |
| | | | Long Island Power Authority, New York, Electric System Revenue Bonds, Series 2006F: | | | | | | | | | | | | | | | | |
| | 885 | | | 5.000%, 5/01/16 – NPFG Insured | | | No Opt. Call | | | | | | | | AA– | | | | 885,230 | |
| | 8,865 | | | 5.000%, 5/01/17 – NPFG Insured | | | No Opt. Call | | | | | | | | AA– | | | | 9,244,156 | |
| | 3,000 | | | 5.000%, 5/01/18 – NPFG Insured | | | 11/16 at 100.00 | | | | | | | | AA– | | | | 3,068,880 | |
| | | | | | |
| | 100 | | | Long Island Power Authority, New York, Electric System Revenue Bonds, Series 2011A, 5.000%, 5/01/16 (ETM) | | | No Opt. Call | | | | | | | | A– (4) | | | | 100,025 | |
| | | | | | |
| | 1,000 | | | Long Island Power Authority, New York, Electric System Revenue Bonds, Series 2012B, 5.000%, 9/01/21 | | | No Opt. Call | | | | | | | | A– | | | | 1,186,420 | |
| | | | | | |
| | 5,135 | | | Metropolitan Transportation Authority, New York, Transportation Revenue Bonds, Refunding Series 2012H, 5.000%, 11/15/20 | | | No Opt. Call | | | | | | | | AA– | | | | 6,007,591 | |
| | | | | | |
| | | | Nassau County Local Economic Assistance Corporation, New York, Revenue Bonds, Catholic Health Services of Long Island Obligated Group Project, Series 2014B: | | | | | | | | | | | | | | | | |
| | 2,000 | | | 5.000%, 7/01/23 | | | No Opt. Call | | | | | | | | BBB+ | | | | 2,409,400 | |
| | 1,000 | | | 5.000%, 7/01/24 | | | No Opt. Call | | | | | | | | BBB+ | | | | 1,217,130 | |
| | 625 | | | 5.000%, 7/01/25 | | | 7/24 at 100.00 | | | | | | | | BBB+ | | | | 750,056 | |
| | 1,000 | | | 5.000%, 7/01/26 | | | 7/24 at 100.00 | | | | | | | | BBB+ | | | | 1,184,950 | |
| | 1,500 | | | 5.000%, 7/01/27 | | | 7/24 at 100.00 | | | | | | | | BBB+ | | | | 1,765,890 | |
| | | | | | |
| | 10,295 | | | New York City, New York, General Obligation Bonds, Fiscal 2010 Series C, 5.000%, 8/01/17 | | | No Opt. Call | | | | | | | | AA | | | | 10,856,592 | |
| | | | | | |
| | 16,720 | | | New York City, New York, General Obligation Bonds, Fiscal 2014 Series J, 5.000%, 8/01/19 | | | No Opt. Call | | | | | | | | AA | | | | 18,924,699 | |
| | | | | | |
| | 30,510 | | | New York City, New York, General Obligation Bonds, Fiscal 2015 Series A, 5.000%, 8/01/18 | | | No Opt. Call | | | | | | | | AA | | | | 33,398,382 | |
| | | | | | |
| | 12,180 | | | New York City, New York, General Obligation Bonds, Fiscal 2016 Series C, 5.000%, 8/01/21 | | | No Opt. Call | | | | | | | | AA | | | | 14,556,440 | |
| | | | | | |
| | 12,980 | | | New York State Energy Research and Development Authority, Pollution Control Revenue Bonds, New York State Electric and Gas Corporation, Series 2005A, 2.375%, 7/01/26 (Mandatory put 5/01/20) (Alternative Minimum Tax) | | | No Opt. Call | | | | | | | | AA– | | | | 13,201,698 | |
| | | | | | |
| | 7,200 | | | New York State Energy Research and Development Authority, Pollution Control Revenue Bonds, Rochester Gas and Electric Corporation, Series 1997C, 5.000%, 8/01/32 (Mandatory put 8/01/16) – NPFG Insured | | | No Opt. Call | | | | | | | | AA– | | | | 7,271,064 | |
| | | | | | |
| | 2,000 | | | New York State Energy Research and Development Authority, Pollution Control Revenue Bonds, Rochester Gas and Electric Corporation, Series 2004A, 4.750%, 5/15/32 (Mandatory put 7/01/16) – NPFG Insured | | | No Opt. Call | | | | | | | | AA– | | | | 2,012,520 | |
| | | | | | |
| | 2,190 | | | New York State Environmental Facilities Corporation, Solid Waste Disposal Revenue Bonds, Waste Management Inc. Project, Refunding Series 2013, 2.750%, 7/01/17 | | | No Opt. Call | | | | | | | | A– | | | | 2,229,814 | |
| | | | | | |
| | 47,480 | | | New York State Thruway Authority, General Revenue Junior Indebtedness Obligations, Series 2013A, 5.000%, 5/01/19 | | | No Opt. Call | | | | | | | | A– | | | | 53,225,080 | |
| | | | | | | | | | | | | | | | | | | | |
Principal
Amount (000) | | | Description (1) | | Optional Call
Provisions (2) | | | | | | | Ratings (3) | | | Value | |
| | | | | | |
| | | | New York (continued) | | | | | | | | | | | | | |
| | | | | | |
| | | | New York State Thruway Authority, Local Highway and Bridge Service Contract Bonds, Series 2009: | | | | | | | | | | | | | | | | |
| $ | 5,000 | | | 4.000%, 4/01/17 | | | No Opt. Call | | | | | | | | AA | | | $ | 5,157,250 | |
| | 6,845 | | | 5.000%, 4/01/18 | | | No Opt. Call | | | | | | | | AA | | | | 7,414,230 | |
| | | | | | |
| | | | New York State Tobacco Settlement Financing Corporation, Tobacco Settlement Asset-Backed and State Contingency Contract-Backed Bonds, Series 2011B: | | | | | | | | | | | | | | | | |
| | 1,600 | | | 5.000%, 6/01/17 | | | No Opt. Call | | | | | | | | AA | | | | 1,675,872 | |
| | 2,835 | | | 5.000%, 6/01/18 | | | No Opt. Call | | | | | | | | AA | | | | 3,082,892 | |
| | | | | | |
| | | | New York State Tobacco Settlement Financing Corporation, Tobacco Settlement Asset-Backed and State Contingency Contract-Backed Bonds, Series 2013B: | | | | | | | | | | | | | | | | |
| | 1,545 | | | 5.000%, 6/01/21 | | | 6/17 at 100.00 | | | | | | | | AA | | | | 1,615,112 | |
| | 6,230 | | | 5.000%, 6/01/22 | | | 6/17 at 100.00 | | | | | | | | AA | | | | 6,511,721 | |
| | | | | | |
| | 10,000 | | | New York State Urban Development Corporation, Service Contract Revenue Bonds, Refunding Series 2010A-1, 5.000%, 1/01/17 | | | No Opt. Call | | | | | | | | AA | | | | 10,301,500 | |
| | | | | | |
| | 3,145 | | | New York State Urban Development Corporation, State Personal Income Tax Revenue Bonds, Series 2009A-1, 5.000%, 12/15/16 | | | No Opt. Call | | | | | | | | AAA | | | | 3,234,349 | |
| | | | | | |
| | 8,085 | | | New York State Urban Development Corporation, State Personal Income Tax Revenue Bonds, Series 2009C, 5.000%, 12/15/18 | | | No Opt. Call | | | | | | | | AAA | | | | 8,980,575 | |
| | | | | | |
| | | | Suffolk County Economic Development Corporation, New York, Revenue Bonds, Catholic Health Services of Long Island Obligated Group Project, Series 2014: | | | | | | | | | | | | | | | | |
| | 500 | | | 5.000%, 7/01/25 | | | 7/24 at 100.00 | | | | | | | | BBB+ | | | | 593,490 | |
| | 500 | | | 5.000%, 7/01/27 | | | 7/24 at 100.00 | | | | | | | | BBB+ | | | | 582,620 | |
| | | | | | |
| | 16,120 | | | Triborough Bridge and Tunnel Authority, New York, General Purpose Revenue Bonds, Refunding Series 2012B, 4.000%, 11/15/20 | | | No Opt. Call | | | | | | | | AA– | | | | 18,276,695 | |
| | | | | | |
| | | | TSASC Inc., New York, Tobacco Asset-Backed Bonds, Series 2006: | | | | | | | | | | | | | | | | |
| | 1,510 | | | 4.750%, 6/01/22 | | | 6/16 at 100.00 | | | | | | | | BBB– | | | | 1,511,344 | |
| | 3,640 | | | 5.000%, 6/01/26 | | | 6/16 at 100.00 | | | | | | | | BB– | | | | 3,648,336 | |
| | | | | | |
| | | | Yonkers, New York, General Obligation Bonds, Refunding Series 2012C: | | | | | | | | | | | | | | | | |
| | 2,440 | | | 3.000%, 8/15/22 | | | No Opt. Call | | | | | | | | A | | | | 2,613,728 | |
| | 2,510 | | | 3.000%, 8/15/23 | | | No Opt. Call | | | | | | | | A | | | | 2,654,651 | |
| | 274,770 | | | Total New York | | | | | | | | | | | | | | | 301,342,759 | |
| | | | | | |
| | | | North Carolina – 0.7% | | | | | | | | | | | | | |
| | | | | | |
| | | | Fayetteville Public Works Commission, North Carolina, Revenue Bonds, Refunding Series 2009A: | | | | | | | | | | | | | | | | |
| | 2,035 | | | 5.000%, 3/01/17 | | | No Opt. Call | | | | | | | | AA | | | | 2,110,967 | |
| | 2,125 | | | 5.000%, 3/01/18 | | | No Opt. Call | | | | | | | | AA | | | | 2,293,406 | |
| | | | | | |
| | 3,050 | | | Mecklenburg County Public Facilities Corporation, North Carolina, Limited Obligation Bonds, Refunding Series 2009, 5.000%, 3/01/18 | | | No Opt. Call | | | | | | | | AA+ | | | | 3,282,959 | |
| | | | | | |
| | 765 | | | New Hanover County, North Carolina, General Obligation Bonds, School Series 2009, 3.000%, 6/01/17 | | | No Opt. Call | | | | | | | | AAA | | | | 784,982 | |
| | | | | | |
| | 2,920 | | | North Carolina Medical Care Commission, Hospital Revenue Bonds, CaroMont Health, Series 2008, 4.000%, 2/15/17 – AGC Insured | | | No Opt. Call | | | | | | | | AA | | | | 2,997,380 | |
| | | | | | |
| | | | North Carolina Municipal Power Agency 1, Catawba Electric Revenue Bonds, Refunding Series 2015A: | | | | | | | | | | | | | | | | |
| | 2,030 | | | 5.000%, 1/01/25 | | | No Opt. Call | | | | | | | | A | | | | 2,545,661 | |
| | 3,000 | | | 5.000%, 1/01/26 | | | No Opt. Call | | | | | | | | A | | | | 3,793,860 | |
| | 2,755 | | | 5.000%, 1/01/27 | | | 1/26 at 100.00 | | | | | | | | A | | | | 3,472,953 | |
Nuveen Limited Term Municipal Bond Fund (continued)
| | |
| Portfolio of Investments | | April 30, 2016 |
| | | | | | | | | | | | | | | | | | | | |
Principal
Amount (000) | | | Description (1) | | Optional Call
Provisions (2) | | | | | | | Ratings (3) | | | Value | |
| | | | | | |
| | | | North Carolina (continued) | | | | | | | | | | | | | |
| | | | | | |
| $ | 615 | | | North Carolina Municipal Power Agency 1, Catawba Electric Revenue Bonds, Refunding Series 2015B, 5.000%, 1/01/23 | | | No Opt. Call | | | | | | | | A | | | $ | 752,483 | |
| | | | | | |
| | | | North Carolina State, Capital Improvement Limited Obligation Bonds, Series 2009A: | | | | | | | | | | | | | | | | |
| | 1,000 | | | 5.000%, 5/01/19 | | | No Opt. Call | | | | | | | | AA+ | | | | 1,123,750 | |
| | 5,195 | | | 5.000%, 5/01/20 | | | 5/19 at 100.00 | | | | | | | | AA+ | | | | 5,832,894 | |
| | | | | | |
| | 3,565 | | | North Carolina State, Capital Improvement Limited Obligation Bonds, Series 2009A, 5.000%, 5/01/21 (Pre-refunded 5/01/19) | | | 5/19 at 100.00 | | | | | | | | AA+ (4) | | | | 4,005,563 | |
| | | | | | |
| | 235 | | | Wilmington, North Carolina, Limited Obligation Bonds, Refunding Series 2014A, 5.000%, 6/01/20 | | | No Opt. Call | | | | | | | | AA+ | | | | 272,266 | |
| | 29,290 | | | Total North Carolina | | | | | | | | | | | | | | | 33,269,124 | |
| | | | | | |
| | | | North Dakota – 0.9% | | | | | | | | | | | | | |
| | | | | | |
| | 300 | | | Burleigh County, North Dakota, Health Care Revenue Bonds, Saint Alexius Medical Center Project, Series 2014A, 5.000%, 7/01/21 (ETM) | | | No Opt. Call | | | | | | | | N/R (4) | | | | 355,923 | |
| | | | | | |
| | 100 | | | Burleigh County, North Dakota, Health Care Revenue Bonds, Saint Alexius Medical Center Project, Series 2014A, 5.000%, 7/01/22 (Pre-refunded 7/01/21) | | | 7/21 at 100.00 | | | | | | | | N/R (4) | | | | 119,305 | |
| | | | | | |
| | 3,145 | | | Grand Forks, North Dakota, Health Care System Revenue Bonds, Altru Health System, Series 2007, 5.500%, 12/01/17 | | | No Opt. Call | | | | | | | | A– | | | | 3,325,366 | |
| | | | | | |
| | 1,000 | | | Ward County Health Care, North Dakota, Revenue Bonds, Trinity Obligated Group, Series 2006, 5.125%, 7/01/18 | | | 7/16 at 100.00 | | | | | | | | BBB– | | | | 1,006,980 | |
| | | | | | |
| | 1,130 | | | West Fargo, North Dakota, General Obligation Bonds, Refunding & Improvement Series 2012C, 3.000%, 5/01/17 | | | No Opt. Call | | | | | | | | A1 | | | | 1,154,126 | |
| | | | | | |
| | | | Williston, North Dakota, County-Wide Public Safety Sales Tax Revenue Bonds, Series 2015A: | | | | | | | | | | | | | | | | |
| | 900 | | | 4.000%, 7/15/16 | | | No Opt. Call | | | | | | | | A+ | | | | 906,192 | |
| | 1,795 | | | 4.000%, 7/15/18 | | | No Opt. Call | | | | | | | | A+ | | | | 1,909,000 | |
| | 1,000 | | | 4.000%, 7/15/19 | | | No Opt. Call | | | | | | | | A+ | | | | 1,087,680 | |
| | 2,105 | | | 4.000%, 7/15/20 | | | No Opt. Call | | | | | | | | A+ | | | | 2,324,741 | |
| | 2,185 | | | 4.000%, 7/15/21 | | | No Opt. Call | | | | | | | | A+ | | | | 2,437,324 | |
| | 2,275 | | | 4.000%, 7/15/22 | | | No Opt. Call | | | | | | | | A+ | | | | 2,559,421 | |
| | 2,365 | | | 5.000%, 7/15/23 | | | 7/22 at 100.00 | | | | | | | | A+ | | | | 2,782,896 | |
| | 2,485 | | | 5.000%, 7/15/24 | | | 7/22 at 100.00 | | | | | | | | A+ | | | | 2,894,801 | |
| | 5,485 | | | 5.000%, 7/15/25 | | | 7/22 at 100.00 | | | | | | | | A+ | | | | 6,360,296 | |
| | | | | | |
| | | | Williston, North Dakota, General Obligation Bonds, Refunding Improvement Series 2014: | | | | | | | | | | | | | | | | |
| | 800 | | | 4.000%, 5/01/16 | | | No Opt. Call | | | | | | | | A | | | | 800,152 | |
| | 800 | | | 4.000%, 5/01/17 | | | No Opt. Call | | | | | | | | A | | | | 824,040 | |
| | 800 | | | 4.000%, 5/01/18 | | | No Opt. Call | | | | | | | | A | | | | 843,336 | |
| | 725 | | | 4.000%, 5/01/19 | | | No Opt. Call | | | | | | | | A | | | | 781,035 | |
| | 800 | | | 4.000%, 5/01/20 | | | No Opt. Call | | | | | | | | A | | | | 876,488 | |
| | 800 | | | 4.000%, 5/01/21 | | | No Opt. Call | | | | | | | | A | | | | 889,296 | |
| | | | | | |
| | 6,035 | | | Williston, North Dakota, Sales Tax Revenue Bonds, Series 2013A, 4.000%, 5/01/20 – AGM Insured | | | 5/17 at 100.00 | | | | | | | | AA | | | | 6,227,456 | |
| | 37,030 | | | Total North Dakota | | | | | | | | | | | | | | | 40,465,854 | |
| | | | | | |
| | | | Ohio – 3.8% | | | | | | | | | | | | | |
| | | | | | |
| | | | Akron, Bath and Copley Joint Township Hospital District, Ohio, Hospital Revenue Bonds, Children’s Hospital Medical Center, Improvement & Refunding Series 2012: | | | | | | | | | | | | | | | | |
| | 2,000 | | | 5.000%, 11/15/21 | | | No Opt. Call | | | | | | | | A1 | | | | 2,371,940 | |
| | 2,655 | | | 5.000%, 11/15/22 | | | No Opt. Call | | | | | | | | A1 | | | | 3,162,132 | |
| | | | | | |
| | 2,650 | | | Akron, Ohio, Waterworks System Mortgage Revenue Bonds, Refunding & Improvement Series 2009, 5.000%, 3/01/17 – AGC Insured | | | No Opt. Call | | | | | | | | A3 | | | | 2,742,777 | |
| | | | | | | | | | | | | | | | | | | | |
Principal
Amount (000) | | | Description (1) | | Optional Call
Provisions (2) | | | | | | | Ratings (3) | | | Value | |
| | | | | | |
| | | | Ohio (continued) | | | | | | | | | | | | | |
| | | | | | |
| | | | Buckeye Tobacco Settlement Financing Authority, Ohio, Tobacco Settlement Asset-Backed Revenue Bonds, Senior Lien, Series 2007A-1: | | | | | | | | | | | | | | | | |
| $ | 6,680 | | | 5.000%, 6/01/16 | | | No Opt. Call | | | | | | | | Aaa | | | $ | 6,703,781 | |
| | 3,495 | | | 5.000%, 6/01/17 | | | No Opt. Call | | | | | | | | Aa1 | | | | 3,639,378 | |
| | | | | | |
| | | | Buckeye Tobacco Settlement Financing Authority, Ohio, Tobacco Settlement Asset-Backed Revenue Bonds, Senior Lien, Series 2007A-2: | | | | | | | | | | | | | | | | |
| | 3,800 | | | 5.375%, 6/01/24 | | | 6/17 at 100.00 | | | | | | | | B– | | | | 3,693,106 | |
| | 23,360 | | | 5.125%, 6/01/24 | | | 6/17 at 100.00 | | | | | | | | B– | | | | 22,587,485 | |
| | | | | | |
| | | | Cincinnati, Ohio, General Obligation Bonds, Various Purpose, Refunding & Improvement Series 2016A: | | | | | | | | | | | | | | | | |
| | 2,475 | | | 4.000%, 12/01/17 | | | No Opt. Call | | | | | | | | Aa2 | | | | 2,603,057 | |
| | 2,500 | | | 4.000%, 12/01/18 | | | No Opt. Call | | | | | | | | Aa2 | | | | 2,702,200 | |
| | | | | | |
| | | | Cleveland, Ohio, Airport System Revenue Bonds, Refunding Series 2016A: | | | | | | | | | | | | | | | | |
| | 350 | | | 5.000%, 1/01/18 – AGM Insured | | | No Opt. Call | | | | | | | | AA | | | | 374,063 | |
| | 400 | | | 5.000%, 1/01/19 – AGM Insured | | | No Opt. Call | | | | | | | | AA | | | | 442,080 | |
| | 425 | | | 5.000%, 1/01/20 – AGM Insured | | | No Opt. Call | | | | | | | | AA | | | | 482,184 | |
| | 950 | | | 5.000%, 1/01/21 – AGM Insured | | | No Opt. Call | | | | | | | | AA | | | | 1,104,138 | |
| | | | | | |
| | 3,220 | | | Cleveland, Ohio, Airport System Revenue Bonds, Series 2009C, 5.000%, 1/01/18 – AGM Insured | | | No Opt. Call | | | | | | | | AA | | | | 3,430,781 | |
| | | | | | |
| | | | Cleveland, Ohio, General Obligation Bonds, Series 2011: | | | | | | | | | | | | | | | | |
| | 1,470 | | | 5.000%, 12/01/19 | | | No Opt. Call | | | | | | | | AA | | | | 1,669,420 | |
| | 1,540 | | | 5.000%, 12/01/20 | | | 12/19 at 100.00 | | | | | | | | AA | | | | 1,744,835 | |
| | 1,620 | | | 5.000%, 12/01/21 | | | 12/19 at 100.00 | | | | | | | | AA | | | | 1,829,887 | |
| | | | | | |
| | | | Cuyahoga County, Ohio, Certificates of Participation, Convention Hotel Project, Series 2014: | | | | | | | | | | | | | | | | |
| | 4,650 | | | 5.000%, 12/01/17 | | | No Opt. Call | | | | | | | | AA– | | | | 4,955,505 | |
| | 5,515 | | | 5.000%, 12/01/20 | | | No Opt. Call | | | | | | | | AA– | | | | 6,368,612 | |
| | | | | | |
| | | | Fairfield County, Ohio, Hospital Facilities Revenue Bonds, Fairfield Medical Center Project, Series 2013: | | | | | | | | | | | | | | | | |
| | 500 | | | 4.000%, 6/15/17 | | | No Opt. Call | | | | | | | | Baa2 | | | | 513,070 | |
| | 1,015 | | | 5.000%, 6/15/19 | | | No Opt. Call | | | | | | | | Baa2 | | | | 1,102,919 | |
| | 1,000 | | | 5.000%, 6/15/21 | | | No Opt. Call | | | | | | | | Baa2 | | | | 1,122,120 | |
| | | | | | |
| | 1,000 | | | Franklin County Convention Facilities Authority, Ohio, Tax and Lease Revenue Anticipation and Refunding Bonds, Columbus City & Franklin County Lessees, Series 2014, 5.000%, 12/01/23 | | | No Opt. Call | | | | | | | | Aaa | | | | 1,238,750 | |
| | | | | | |
| | | | Hamilton County, Ohio, Hospital Facilities Revenue Bonds, Cincinnati Children’s Hospital Medical Center, Refunding Series 2014S: | | | | | | | | | | | | | | | | |
| | 1,150 | | | 5.000%, 5/15/21 | | | No Opt. Call | | | | | | | | AA | | | | 1,367,028 | |
| | 275 | | | 5.000%, 5/15/22 | | | No Opt. Call | | | | | | | | AA | | | | 333,242 | |
| | 1,000 | | | 5.000%, 5/15/23 | | | No Opt. Call | | | | | | | | AA | | | | 1,231,130 | |
| | | | | | |
| | 1,600 | | | Hamilton County, Ohio, Hospital Facilities Revenue Bonds, UC Health, Series 2014, 5.000%, 2/01/20 | | | No Opt. Call | | | | | | | | A | | | | 1,801,728 | |
| | | | | | |
| | 1,595 | | | Hamilton County, Ohio, Sewer System Revenue Bonds, Metropolitan Sewer District of Greater Cincinnati, Refunding Series 2014A, 5.000%, 12/01/19 | | | No Opt. Call | | | | | | | | AA+ | | | | 1,824,712 | |
| | | | | | |
| | | | JobsOhio Beverage System, Ohio, Statewide Liquor Profits Revenue Bonds, Senior Lien Series 2013A: | | | | | | | | | | | | | | | | |
| | 2,490 | | | 5.000%, 1/01/20 | | | No Opt. Call | | | | | | | | AA | | | | 2,841,414 | |
| | 1,700 | | | 5.000%, 1/01/23 | | | No Opt. Call | | | | | | | | AA | | | | 2,069,172 | |
| | | | | | |
| | 2,175 | | | Marysville, Union County, Ohio, General Obligation Bonds, Refunding Series 2007, 5.000%, 12/01/20 – AMBAC Insured | | | No Opt. Call | | | | | | | | Aa3 | | | | 2,445,788 | |
Nuveen Limited Term Municipal Bond Fund (continued)
| | |
| Portfolio of Investments | | April 30, 2016 |
| | | | | | | | | | | | | | | | | | | | |
Principal
Amount (000) | | | Description (1) | | Optional Call
Provisions (2) | | | | | | | Ratings (3) | | | Value | |
| | | | | | |
| | | | Ohio (continued) | | | | | | | | | | | | | |
| | | | | | |
| | | | Muskingum County, Ohio, Hospital Facilities Revenue Bonds, Genesis HealthCare System Obligated Group Project, Series 2013: | | | | | | | | | | | | | | | | |
| $ | 2,000 | | | 5.000%, 2/15/17 | | | No Opt. Call | | | | | | | | BB+ | | | $ | 2,047,640 | |
| | 1,630 | | | 5.000%, 2/15/18 | | | No Opt. Call | | | | | | | | BB+ | | | | 1,712,185 | |
| | 1,000 | | | 5.000%, 2/15/19 | | | No Opt. Call | | | | | | | | BB+ | | | | 1,072,360 | |
| | 270 | | | 5.000%, 2/15/20 | | | No Opt. Call | | | | | | | | BB+ | | | | 294,062 | |
| | 2,000 | | | 5.000%, 2/15/21 | | | No Opt. Call | | | | | | | | BB+ | | | | 2,203,600 | |
| | | | | | |
| | | | New Albany Community Authority, Ohio, Community Facilities Revenue Refunding Bonds, Series 2012C: | | | | | | | | | | | | | | | | |
| | 870 | | | 3.000%, 10/01/16 | | | No Opt. Call | | | | | | | | A1 | | | | 878,013 | |
| | 1,100 | | | 4.000%, 10/01/17 | | | No Opt. Call | | | | | | | | A1 | | | | 1,143,692 | |
| | | | | | |
| | 11,085 | | | Ohio Air Quality Development Authority, Ohio, Pollution Control Revenue Refunding Bonds, FirstEnergy Generation Corp. Project, Series 2006A, 3.750%, 12/01/23 (Mandatory put 12/03/18) | | | No Opt. Call | | | | | | | | BBB– | | | | 11,459,008 | |
| | | | | | |
| | 2,440 | | | Ohio Air Quality Development Authority, Ohio, Pollution Control Revenue Refunding Bonds, FirstEnergy Generation Corp. Project, Series 2009B, 3.100%, 3/01/23 (Mandatory put 3/01/19) | | | No Opt. Call | | | | | | | | BBB– | | | | 2,496,071 | |
| | | | | | |
| | 4,000 | | | Ohio Air Quality Development Authority, Ohio, Revenue Bonds, Ohio Valley Electric Corporation Project, Series 2009E, 5.625%, 10/01/19 | | | No Opt. Call | | | | | | | | BBB– | | | | 4,456,840 | |
| | | | | | |
| | 1,645 | | | Ohio Higher Education Facilities Commission, Revenue Bonds, John Carroll University, Series 2014, 2.250%, 9/01/33 (Mandatory put 9/01/18) | | | No Opt. Call | | | | | | | | A3 | | | | 1,678,558 | |
| | | | | | |
| | 4,540 | | | Ohio State, Capital Facilities Lease Appropriation Bonds, Mental Health Facilities Improvement Fund Project, Series 2012A, 5.000%, 6/01/17 – NPFG Insured | | | No Opt. Call | | | | | | | | AA | | | | 4,753,743 | |
| | | | | | |
| | 6,685 | | | Ohio State, General Obligation Bonds, Infrastructure Improvement Series 2013B, 5.000%, 8/01/21 | | | No Opt. Call | | | | | | | | AA+ | | | | 8,003,215 | |
| | | | | | |
| | 6,450 | | | Ohio State, General Obligation Bonds, Refunding Common Schools Series 2011A, 5.000%, 9/15/21 | | | No Opt. Call | | | | | | | | AA+ | | | | 7,747,869 | |
| | | | | | |
| | 12,625 | | | Ohio State, General Obligation Bonds, Refunding Common Schools Series 2011C, 5.000%, 9/15/20 | | | No Opt. Call | | | | | | | | AA+ | | | | 14,788,168 | |
| | | | | | |
| | | | Ohio State, Hospital Facility Revenue Bonds, Cleveland Clinic Health System Obligated Group, Refunding Series 2009B: | | | | | | | | | | | | | | | | |
| | 820 | | | 5.000%, 1/01/17 | | | No Opt. Call | | | | | | | | Aa2 | | | | 843,878 | |
| | 500 | | | 5.000%, 1/01/18 | | | No Opt. Call | | | | | | | | Aa2 | | | | 535,500 | |
| | | | | | |
| | 20 | | | Ohio Water Development Authority, Loan Revenue Bonds, Pure Water Development, Series 1990I, 6.000%, 12/01/16 – AMBAC Insured (ETM) | | | No Opt. Call | | | | | | | | Aaa | | | | 20,247 | |
| | | | | | |
| | 10,715 | | | Ohio Water Development Authority, Pollution Control Revenue Refunding Bonds, FirstEnergy Nuclear Generating Corporation Project, Series 2010B, 2.200%, 6/01/33 | | | No Opt. Call | | | | | | | | BBB– | | | | 10,723,786 | |
| | | | | | |
| | 2,000 | | | Ohio Water Development Authority, Solid Waste Disposal Revenue Bonds, Waste Management Inc., Series 2004, 2.250%, 7/01/21 (Mandatory put 7/01/16) | | | No Opt. Call | | | | | | | | A– | | | | 2,005,740 | |
| | | | | | |
| | 2,230 | | | University of Toledo, Ohio, General Receipts Bonds, Series 2009, 4.000%, 6/01/18 | | | No Opt. Call | | | | | | | | A1 | | | | 2,367,948 | |
| | | | | | |
| | 1,000 | | | Western Reserve Port Authority, Ohio, Solid Waste Facility Revenue Bonds, Central Waste Inc., Series 2007A, 6.100%, 7/01/17 (Alternative Minimum Tax) (5) | | | No Opt. Call | | | | | | | | N/R | | | | 4,800 | |
| | 160,880 | | | Total Ohio | | | | | | | | | | | | | | | 171,735,357 | |
| | | | | | |
| | | | Oklahoma – 2.1% | | | | | | | | | | | | | |
| | | | | | |
| | | | Canadian County Educational Facilities Authority, Oklahoma, Educational Facilities Lease Revenue Bonds, Mustang Public Schools Project, Series 2012: | | | | | | | | | | | | | | | | |
| | 1,420 | | | 4.000%, 9/01/18 | | | No Opt. Call | | | | | | | | A+ | | | | 1,515,935 | |
| | 1,435 | | | 4.000%, 9/01/19 | | | No Opt. Call | | | | | | | | A+ | | | | 1,565,427 | |
| | 2,685 | | | 4.500%, 9/01/20 | | | No Opt. Call | | | | | | | | A+ | | | | 3,034,131 | |
| | | | | | | | | | | | | | | | | | | | |
Principal
Amount (000) | | | Description (1) | | Optional Call
Provisions (2) | | | | | | | Ratings (3) | | | Value | |
| | | | | | |
| | | | Oklahoma (continued) | | | | | | | | | | | | | |
| | | | | | |
| $ | 6,330 | | | Cleveland County Educational Facilities Authority, Oklahoma, Educational Facilities Lease Revenue Bonds, Moore Public Schools Project, Series 2013, 5.000%, 6/01/18 | | | No Opt. Call | | | | | | | | A+ | | | $ | 6,848,870 | |
| | | | | | |
| | 5,980 | | | Cleveland County Educational Facilities Authority, Oklahoma, Educational Facilities Lease Revenue Bonds, Moore Public Schools Project, Series 2016, 5.000%, 6/01/19 | | | No Opt. Call | | | | | | | | A+ | | | | 6,661,840 | |
| | | | | | |
| | | | Cleveland County Educational Facilities Authority, Oklahoma, Educational Facilities Lease Revenue Bonds, Norman Public Schools Project, Series 2014: | | | | | | | | | | | | | | | | |
| | 2,645 | | | 5.000%, 7/01/16 | | | No Opt. Call | | | | | | | | A+ | | | | 2,665,340 | |
| | 675 | | | 5.000%, 7/01/17 | | | No Opt. Call | | | | | | | | A+ | | | | 707,191 | |
| | 1,820 | | | 5.000%, 7/01/18 | | | No Opt. Call | | | | | | | | A+ | | | | 1,974,791 | |
| | 2,395 | | | 5.000%, 7/01/19 | | | No Opt. Call | | | | | | | | A+ | | | | 2,675,023 | |
| | | | | | |
| | | | Creek County Educational Facilities Authority, Oklahoma, Lease Revenue Bonds, Sapulpa Public Schools Project, Series 2015: | | | | | | | | | | | | | | | | |
| | 1,955 | | | 4.000%, 9/01/18 | | | No Opt. Call | | | | | | | | A+ | | | | 2,087,080 | |
| | 2,150 | | | 5.000%, 9/01/20 | | | No Opt. Call | | | | | | | | A+ | | | | 2,479,230 | |
| | | | | | |
| | | | Kay County Public Buildings Authority, Oklahoma, Educational Facilities Lease Revenue Bonds, Ponca City Public Schools Project, Series 2016: | | | | | | | | | | | | | | | | |
| | 3,820 | | | 5.000%, 9/01/17 | | | No Opt. Call | | | | | | | | A– | | | | 4,028,075 | |
| | 7,860 | | | 5.000%, 9/01/18 | | | No Opt. Call | | | | | | | | A– | | | | 8,572,116 | |
| | 2,500 | | | 5.000%, 9/01/20 | | | No Opt. Call | | | | | | | | A– | | | | 2,882,825 | |
| | 4,395 | | | 5.000%, 9/01/21 | | | No Opt. Call | | | | | | | | A– | | | | 5,155,731 | |
| | | | | | |
| | | | Oklahoma County Finance Authority, Oklahoma, Educational Facilities Lease Revenue Bonds, Midwest City-Del City Public Schools Project, Series 2012: | | | | | | | | | | | | | | | | |
| | 5,000 | | | 3.000%, 3/01/17 | | | No Opt. Call | | | | | | | | A+ | | | | 5,089,550 | |
| | 2,920 | | | 4.000%, 3/01/18 | | | No Opt. Call | | | | | | | | A+ | | | | 3,076,833 | |
| | | | | | |
| | 1,850 | | | Oklahoma Development Finance Authority, Solid Waste Disposal Revenue Bonds, Series 2004A, 2.375%, 12/01/21 | | | No Opt. Call | | | | | | | | A– | | | | 1,934,157 | |
| | | | | | |
| | | | Pontotoc County Educational Facilities Authority, Oklahoma, Facilities Lease Revenue Bonds, Ada Public Schools Project, Series 2014: | | | | | | | | | | | | | | | | |
| | 310 | | | 4.000%, 9/01/17 | | | No Opt. Call | | | | | | | | A– | | | | 322,772 | |
| | 475 | | | 4.000%, 9/01/18 | | | No Opt. Call | | | | | | | | A– | | | | 506,070 | |
| | 525 | | | 5.000%, 9/01/19 | | | No Opt. Call | | | | | | | | A– | | | | 588,373 | |
| | 685 | | | 5.000%, 9/01/20 | | | No Opt. Call | | | | | | | | A– | | | | 786,257 | |
| | 745 | | | 5.000%, 9/01/21 | | | No Opt. Call | | | | | | | | A– | | | | 870,078 | |
| | | | | | |
| | | | Stillwater Utilities Authority, Oklahoma, Utility System and Sales Tax Revenue Bonds, Series 2014A: | | | | | | | | | | | | | | | | |
| | 225 | | | 4.000%, 10/01/18 | | | No Opt. Call | | | | | | | | AA– | | | | 242,377 | |
| | 165 | | | 4.000%, 10/01/19 | | | No Opt. Call | | | | | | | | AA– | | | | 182,168 | |
| | 250 | | | 5.000%, 10/01/20 | | | No Opt. Call | | | | | | | | AA– | | | | 292,645 | |
| | 645 | | | 5.000%, 10/01/21 | | | No Opt. Call | | | | | | | | AA– | | | | 773,374 | |
| | | | | | |
| | 1,235 | | | Tulsa (Oklahoma), Industrial Authority, Revenue and Refunding Bonds (The University of Tulsa), Series 1996A, 6.000%, 10/01/16 – NPFG Insured (ETM) | | | No Opt. Call | | | | | | | | AA– (4) | | | | 1,263,578 | |
| | | | | | |
| | 1,385 | | | Tulsa Airports Improvement Trust, Oklahoma, General Airport Revenue Bonds, Tulsa International Airport, Series 1997B, 7.050%, 6/01/17 – NPFG Insured (ETM) | | | No Opt. Call | | | | | | | | AA– (4) | | | | 1,416,010 | |
| | | | | | |
| | 7,450 | | | Tulsa County Industrial Authority, Oklahoma, Educational Facilities Lease Revenue Bonds, Broken Arrow Public Schools Project, Series 2011, 5.000%, 9/01/19 | | | No Opt. Call | | | | | | | | AA– | | | | 8,388,402 | |
| | | | | | |
| | 1,425 | | | Tulsa County Industrial Authority, Oklahoma, Educational Facilities Lease Revenue Bonds, Broken Arrow Public Schools Project, Series 2012, 4.000%, 9/01/22 | | | No Opt. Call | | | | | | | | AA– | | | | 1,621,123 | |
Nuveen Limited Term Municipal Bond Fund (continued)
| | |
| Portfolio of Investments | | April 30, 2016 |
| | | | | | | | | | | | | | | | | | | | |
Principal
Amount (000) | | | Description (1) | | Optional Call
Provisions (2) | | | | | | | Ratings (3) | | | Value | |
| | | | | | |
| | | | Oklahoma (continued) | | | | | | | | | | | | | |
| | | | | | |
| | | | Tulsa County Industrial Authority, Oklahoma, Educational Facilities Lease Revenue Bonds, Broken Arrow Public Schools Project, Series 2016: | | | | | | | | | | | | | | | | |
| $ | 1,000 | | | 5.000%, 9/01/22 | | | No Opt. Call | | | | | | | | AA– | | | $ | 1,197,480 | |
| | 6,085 | | | 5.000%, 9/01/23 | | | No Opt. Call | | | | | | | | AA– | | | | 7,394,553 | |
| | | | | | |
| | | | Tulsa County Industrial Authority, Oklahoma, Educational Facilities Lease Revenue Bonds, Jenks Public Schools Project, Series 2015: | | | | | | | | | | | | | | | | |
| | 2,100 | | | 5.000%, 9/01/21 | | | No Opt. Call | | | | | | | | AA– | | | | 2,476,047 | |
| | 2,000 | | | 5.000%, 9/01/22 | | | No Opt. Call | | | | | | | | AA– | | | | 2,394,960 | |
| | 84,540 | | | Total Oklahoma | | | | | | | | | | | | | | | 93,670,412 | |
| | | | | | |
| | | | Oregon – 0.8% | | | | | | | | | | | | | |
| | | | | | |
| | | | Clackamas and Washington Counties School District 3JT, Oregon, General Obligation Bonds, Refunding Series 2015: | | | | | | | | | | | | | | | | |
| | 11,045 | | | 5.000%, 6/15/25 | | | No Opt. Call | | | | | | | | AA+ | | | | 14,128,101 | |
| | 5,000 | | | 5.000%, 6/15/26 | | | 6/25 at 100.00 | | | | | | | | AA+ | | | | 6,354,750 | |
| | | | | | |
| | 1,770 | | | Gilliam County, Oregon, Solid Waste Disposal Revenue Bonds, Waste Management Inc. Project, Series 2007, 1.500%, 10/01/18 | | | No Opt. Call | | | | | | | | A– | | | | 1,788,567 | |
| | | | | | |
| | 1,000 | | | Oregon State Department of Transportation, Highway User Tax Revenue Bonds, Series 2009A, 5.000%, 11/15/22 (Pre-refunded 5/15/19) | | | 5/19 at 100.00 | | | | | | | | AAA | | | | 1,125,110 | |
| | | | | | |
| | 10,450 | | | Tri-County Metropolitan Transportation District, Oregon, Payroll Tax and Grant Receipt Revenue Bonds, Series 2013, 3.000%, 11/01/16 | | | 7/16 at 100.00 | | | | | | | | Aa3 | | | | 10,472,468 | |
| | 29,265 | | | Total Oregon | | | | | | | | | | | | | | | 33,868,996 | |
| | | | | | |
| | | | Pennsylvania – 5.4% | | | | | | | | | | | | | |
| | | | | | |
| | | | Allegheny County Hospital Development Authority, Pennsylvania, Revenue Bonds, Jefferson Regional Medical Center, Series 2006B: | | | | | | | | | | | | | | | | |
| | 1,620 | | | 5.000%, 5/01/16 | | | No Opt. Call | | | | | | | | Baa3 | | | | 1,620,292 | |
| | 1,285 | | | 5.000%, 5/01/18 | | | 5/16 at 100.00 | | | | | | | | Baa3 | | | | 1,287,673 | |
| | | | | | |
| | 6,485 | | | Allegheny County Hospital Development Authority, Pennsylvania, Revenue Bonds, University of Pittsburgh Medical Center System, Series 2008B, 5.000%, 6/15/18 | | | No Opt. Call | | | | | | | | Aa3 | | | | 7,060,414 | |
| | | | | | |
| | | | Allegheny County Sanitary Authority, Pennsylvania, Sewer Revenue Bonds, Refunding Series 2011: | | | | | | | | | | | | | | | | |
| | 6,550 | | | 5.000%, 12/01/17 – AGM Insured | | | No Opt. Call | | | | | | | | AA | | | | 6,988,654 | |
| | 4,400 | | | 5.000%, 12/01/18 – AGM Insured | | | No Opt. Call | | | | | | | | AA | | | | 4,861,560 | |
| | | | | | |
| | 5,785 | | | Allegheny County, Pennsylvania, General Obligation Bonds, Series 2014C-73, 5.000%, 12/01/19 | | | No Opt. Call | | | | | | | | AA– | | | | 6,586,223 | |
| | | | | | |
| | 1,925 | | | Berks County, Pennsylvania, General Obligation Bonds, Series 2008, 5.000%, 11/15/21 (Pre-refunded 11/15/18) | | | 11/18 at 100.00 | | | | | | | | Aa1 (4) | | | | 2,129,512 | |
| | | | | | |
| | 1,120 | | | Centre County, Pennsylvania, General Obligation Bonds, Series 2012A, 3.000%, 7/01/19 | | | No Opt. Call | | | | | | | | AA | | | | 1,185,430 | |
| | | | | | |
| | 7,910 | | | Coatesville Area School District, Chester County, Pennsylvania, General Obligation Bonds, Series 2014A, 4.000%, 8/15/19 – BAM Insured | | | No Opt. Call | | | | | | | | AA | | | | 8,571,197 | |
| | | | | | |
| | | | Dallas Area Municipal Authority, Pennsylvania, Revenue Bonds, Misericordia University, Series 2014: | | | | | | | | | | | | | | | | |
| | 450 | | | 4.000%, 5/01/18 | | | No Opt. Call | | | | | | | | Baa3 | | | | 467,879 | |
| | 450 | | | 5.000%, 5/01/19 | | | No Opt. Call | | | | | | | | Baa3 | | | | 486,473 | |
| | | | | | |
| | | | Delaware County Authority, Pennsylvania, Revenue Bonds, Villanova University, Series 2010: | | | | | | | | | | | | | | | | |
| | 1,010 | | | 4.000%, 12/01/16 | | | No Opt. Call | | | | | | | | A+ | | | | 1,030,665 | |
| | 500 | | | 5.000%, 12/01/18 | | | No Opt. Call | | | | | | | | A+ | | | | 553,675 | |
| | | | | | | | | | | | | | | | | | | | |
Principal
Amount (000) | | | Description (1) | | Optional Call
Provisions (2) | | | | | | | Ratings (3) | | | Value | |
| | | | | | |
| | | | Pennsylvania (continued) | | | | | | | | | | | | | |
| | | | | | |
| $ | 3,435 | | | Lancaster County, Pennsylvania, General Obligation Bonds, Series 2009A, 5.000%, 11/01/18 – AGM Insured | | | No Opt. Call | | | | | | | | A1 | | | $ | 3,779,221 | |
| | | | | | |
| | 3,240 | | | Lehigh County Industrial Development Authority, Pennsylvania, Pollution Control Revenue Bonds, Pennsylvania Power and Light Company, Series 2016A, 0.900%, 9/01/29 (Mandatory put 9/01/17) | | | No Opt. Call | | | | | | | | A | | | | 3,236,922 | |
| | | | | | |
| | 5,560 | | | Lehigh County Industrial Development Authority, Pennsylvania, Pollution Control Revenue Bonds, Pennsylvania Power and Light Company, Series 2016B, 0.900%, 2/15/27 (Mandatory put 8/15/17) | | | No Opt. Call | | | | | | | | A | | | | 5,555,441 | |
| | | | | | |
| | 1,465 | | | Luzerne County Industrial Development Authority, Pennsylvania, Guaranteed Lease Revenue Bonds, Series 2009, 7.500%, 12/15/19 | | | No Opt. Call | | | | | | | | N/R | | | | 1,543,671 | |
| | | | | | |
| | 2,165 | | | Lycoming County Authority, Pennsylvania, Health System Revenue Bonds, Susquehanna Health System Project, Series 2009A, 5.000%, 7/01/17 | | | No Opt. Call | | | | | | | | A– | | | | 2,267,080 | |
| | | | | | |
| | 1,080 | | | Lycoming County Authority, Pennsylvania, Revenue Bonds, Pennsylvania College of Technology, Series 2012, 4.000%, 5/01/19 | | | No Opt. Call | | | | | | | | A | | | | 1,168,560 | |
| | | | | | |
| | 3,450 | | | Montgomery County Higher Education and Health Authority, Pennsylvania, Hospital Revenue Bonds, Abington Memorial Hospital Obligated Group, Series 2012A, 5.000%, 6/01/23 | | | No Opt. Call | | | | | | | | A | | | | 4,089,975 | |
| | | | | | |
| | | | Montgomery County Industrial Development Authority, Pennsylvania, Health System Revenue Bonds, Albert Einstein Healthcare Network Issue, Series 2015A: | | | | | | | | | | | | | | | | |
| | 1,665 | | | 5.000%, 1/15/18 | | | No Opt. Call | | | | | | | | Baa2 | | | | 1,761,354 | |
| | 1,310 | | | 5.000%, 1/15/19 | | | No Opt. Call | | | | | | | | Baa2 | | | | 1,420,132 | |
| | 1,235 | | | 5.000%, 1/15/20 | | | No Opt. Call | | | | | | | | Baa2 | | | | 1,365,070 | |
| | | | | | |
| | 5,000 | | | Montgomery County Industrial Development Authority, Pennsylvania, Pollution Control Revenue Bonds, Exelon Generation Company, LLC Project, Refunding Series 2001B, 2.500%, 10/01/30 (Mandatory put 4/01/20) | | | No Opt. Call | | | | | | | | BBB | | | | 5,060,750 | |
| | | | | | |
| | 6,000 | | | Montgomery County Industrial Development Authority, Pennsylvania, Pollution Control Revenue Bonds, PECO Energy Company Project, Refunding Series 1994A, 2.550%, 6/01/29 (Mandatory put 6/01/20) | | | No Opt. Call | | | | | | | | BBB | | | | 6,119,880 | |
| | | | | | |
| | 5,000 | | | Montgomery County Industrial Development Authority, Pennsylvania, Pollution Control Revenue Bonds, PECO Energy Company Project, Refunding Series 1996A, 2.600%, 3/01/34 (Mandatory put 9/01/20) | | | No Opt. Call | | | | | | | | BBB | | | | 5,117,750 | |
| | | | | | |
| | 7,500 | | | Montgomery County Industrial Development Authority, Pennsylvania, Pollution Control Revenue Bonds, PECO Energy Company Project, Refunding Series 1999A, 2.500%, 10/01/30 (Mandatory put 4/01/20) | | | No Opt. Call | | | | | | | | BBB | | | | 7,591,125 | |
| | | | | | |
| | 504 | | | Northampton County Industrial Development Authority, Pennsylvania, Recovery Revenue Bonds, Northampton Generating Project, Senior Lien Series 2013A0 & AE2, 5.000%, 12/01/23 | | | 7/16 at 100.00 | | | | | | | | N/R | | | | 221,551 | |
| | | | | | |
| | 335 | | | Pennsylvania Convention Center Authority, Revenue Bonds, Series 1989A, 6.700%, 9/01/16 – FGIC Insured (ETM) | | | No Opt. Call | | | | | | | | AA+ (4) | | | | 341,888 | |
| | | | | | |
| | 7,145 | | | Pennsylvania Economic Development Financing Authority, Exempt Facilities Revenue Bonds, Shippingport Project, First Energy Guarantor., Series 2005A, 3.750%, 12/01/40 | | | No Opt. Call | | | | | | | | Baa3 | | | | 7,498,034 | |
| | | | | | |
| | 37,800 | | | Pennsylvania Economic Development Financing Authority, Solid Waste Disposal Revenue Bonds, Waste Management Inc., Project, Series 2009, 1.550%, 12/01/33 (Mandatory put 12/03/18) | | | No Opt. Call | | | | | | | | A– | | | | 38,000,718 | |
Nuveen Limited Term Municipal Bond Fund (continued)
| | |
| Portfolio of Investments | | April 30, 2016 |
| | | | | | | | | | | | | | | | | | | | |
Principal
Amount (000) | | | Description (1) | | Optional Call
Provisions (2) | | | | | | | Ratings (3) | | | Value | |
| | | | | | |
| | | | Pennsylvania (continued) | | | | | | | | | | | | | |
| | | | | | |
| | | | Pennsylvania Economic Development Financing Authority, Unemployment Compensation Revenue Bonds, Series 2012B: | | | | | | | | | | | | | | | | |
| $ | 100 | | | 5.000%, 1/01/20 | | | No Opt. Call | | | | | | | | Aaa | | | $ | 113,263 | |
| | 225 | | | 5.000%, 7/01/20 | | | 7/19 at 100.00 | | | | | | | | Aaa | | | | 254,842 | |
| | 5,750 | | | 5.000%, 7/01/21 | | | 1/18 at 100.00 | | | | | | | | Aaa | | | | 6,153,305 | |
| | 23,940 | | | 5.000%, 1/01/22 | | | 7/17 at 100.00 | | | | | | | | Aaa | | | | 25,191,583 | |
| | 4,795 | | | 5.000%, 1/01/23 | | | No Opt. Call | | | | | | | | Aaa | | | | 4,813,796 | |
| | | | | | |
| | 1,900 | | | Pennsylvania Economic Development Financing Authority, Water Facilities Revenue Bonds, Aqua Pennsylvania, Inc. Project, Series 2008A, 6.750%, 10/01/18 (Alternative Minimum Tax) | | | No Opt. Call | | | | | | | | AA– | | | | 2,148,045 | |
| | | | | | |
| | 7,540 | | | Pennsylvania Public School Building Authority, Lease Revenue Bonds, School District of Philadelphia, Series 2006B, 4.500%, 6/01/32 – AGM Insured | | | 12/16 at 100.00 | | | | | | | | AA | | | | 7,661,469 | |
| | | | | | |
| | 17,500 | | | Pennsylvania Turnpike Commission, Turnpike Revenue Bonds, Refunding Subordinate Series 2016, 5.000%, 6/01/20 | | | No Opt. Call | | | | | | | | A3 | | | | 20,121,500 | |
| | | | | | |
| | 1,510 | | | Pennsylvania Turnpike Commission, Turnpike Revenue Bonds, Subordinate Lien Series 2009A, 5.000%, 6/01/17 | | | No Opt. Call | | | | | | | | AA | | | | 1,579,430 | |
| | | | | | |
| | 4,325 | | | Pennsylvania Turnpike Commission, Turnpike Revenue Bonds, Subordinate Series 2009B, 5.000%, 6/01/16 | | | No Opt. Call | | | | | | | | A– | | | | 4,342,516 | |
| | | | | | |
| | 1,805 | | | Philadelphia Gas Works, Pennsylvania, Revenue Bonds, Twelfth Series 1990B, 7.000%, 5/15/20 – NPFG Insured (ETM) | | | No Opt. Call | | | | | | | | AA– (4) | | | | 2,028,098 | |
| | | | | | |
| | 10,000 | | | Philadelphia School District, Pennsylvania, General Obligation Bonds, Refunding Series 2010C, 5.000%, 9/01/16 | | | No Opt. Call | | | | | | | | A+ | | | | 10,140,600 | |
| | | | | | |
| | | | Philadelphia School District, Pennsylvania, General Obligation Bonds, Series 2011D: | | | | | | | | | | | | | | | | |
| | 1,795 | | | 5.000%, 9/01/17 | | | No Opt. Call | | | | | | | | A+ | | | | 1,877,624 | |
| | 1,525 | | | 5.000%, 9/01/18 | | | No Opt. Call | | | | | | | | A+ | | | | 1,637,393 | |
| | | | | | |
| | | | Pittsburgh Public Parking Authority, Pennsylvania, Parking System Revenue Bonds, Refunding Series 2015A: | | | | | | | | | | | | | | | | |
| | 1,120 | | | 4.000%, 12/01/18 | | | No Opt. Call | | | | | | | | A+ | | | | 1,205,299 | |
| | 2,300 | | | 5.000%, 12/01/19 | | | No Opt. Call | | | | | | | | A+ | | | | 2,596,401 | |
| | 3,295 | | | 5.000%, 12/01/20 | | | No Opt. Call | | | | | | | | A+ | | | | 3,801,837 | |
| | 1,440 | | | 5.000%, 12/01/21 | | | No Opt. Call | | | | | | | | A+ | | | | 1,696,781 | |
| | 1,500 | | | 5.000%, 12/01/22 | | | No Opt. Call | | | | | | | | A+ | | | | 1,798,920 | |
| | | | | | |
| | 320 | | | Pittsburgh Water and Sewer Authority, Pennsylvania, Water and Sewer System Revenue Bonds, Refunding Series 1986, 6.000%, 9/01/16 – FGIC Insured (ETM) | | | No Opt. Call | | | | | | | | Aaa | | | | 325,293 | |
| | | | | | |
| | 1,205 | | | Southcentral Pennsylvania General Authority, Revenue Bonds, Hanover Hospital Inc., Series 2013, 4.000%, 12/01/16 | | | No Opt. Call | | | | | | | | BBB | | | | 1,227,425 | |
| | | | | | |
| | 1,250 | | | Union County Hospital Authority, Pennsylvania, Hospital Revenue Bonds, Evangelical Community Hospital Project, Refunding and Improvement Series 2011, 4.625%, 8/01/17 | | | No Opt. Call | | | | | | | | A– | | | | 1,285,400 | |
| | | | | | |
| | 2,500 | | | University of Pittsburgh of the Commonwealth System of Higher Education, PennsyIvania, University Capital Project Bonds, Series 2009B, 5.500%, 9/15/21 | | | 3/19 at 100.00 | | | | | | | | AA+ | | | | 2,841,100 | |
| | 231,019 | | | Total Pennsylvania | | | | | | | | | | | | | | | 243,810,689 | |
| | | | | | | | | | | | | | | | | | | | |
Principal
Amount (000) | | | Description (1) | | Optional Call
Provisions (2) | | | | | | | Ratings (3) | | | Value | |
| | | | | | |
| | | | Rhode Island – 0.1% | | | | | | | | | | | | | |
| | | | | | |
| | | | Rhode Island Economic Development Corporation, Airport Revenue Bonds, Refunding Series 2013B: | | | | | | | | | | | | | | | | |
| $ | 700 | | | 5.000%, 7/01/19 | | | No Opt. Call | | | | | | | | A3 | | | $ | 770,112 | |
| | 1,165 | | | 5.000%, 7/01/20 | | | No Opt. Call | | | | | | | | A3 | | | | 1,306,932 | |
| | 1,360 | | | 5.000%, 7/01/21 | | | No Opt. Call | | | | | | | | A3 | | | | 1,554,466 | |
| | | | | | |
| | | | Rhode Island Health and Educational Building Corporation, Higher Education Facility Revenue Bonds, University of Rhode Island Auxiliary Enterprise, Refunding Series 2013C: | | | | | | | | | | | | | | | | |
| | 450 | | | 4.000%, 9/15/16 | | | No Opt. Call | | | | | | | | A+ | | | | 455,472 | |
| | 520 | | | 4.000%, 9/15/18 | | | No Opt. Call | | | | | | | | A+ | | | | 555,662 | |
| | 4,195 | | | Total Rhode Island | | | | | | | | | | | | | | | 4,642,644 | |
| | | | | | |
| | | | South Carolina – 1.1% | | | | | | | | | | | | | |
| | | | | | |
| | 1,815 | | | Anderson County School District 5, South Carolina, General Obligation Bonds, Refunding Series 2016, 5.000%, 3/01/19 | | | No Opt. Call | | | | | | | | Aa1 | | | | 2,028,190 | |
| | | | | | |
| | | | Greenville County School District, South Carolina, Installment Purchase Revenue Bonds, Building Equity Sooner Series 2012: | | | | | | | | | | | | | | | | |
| | 3,365 | | | 5.000%, 12/01/21 | | | No Opt. Call | | | | | | | | AA | | | | 4,032,145 | |
| | 4,910 | | | 5.000%, 12/01/22 | | | No Opt. Call | | | | | | | | AA | | | | 5,995,405 | |
| | | | | | |
| | 5,245 | | | Greenville County School District, South Carolina, Installment Purchase Revenue Bonds, Series 2006, 5.000%, 12/01/24 | | | 12/16 at 100.00 | | | | | | | | AA | | | | 5,383,678 | |
| | | | | | |
| | | | Greenwood Fifty School Facilities, Inc., South Carolina, Installment Purchase Revenue Refunding Bonds, Greenwood School District 50 Project, Series 2016: | | | | | | | | | | | | | | | | |
| | 1,000 | | | 4.000%, 12/01/18 – BAM Insured | | | No Opt. Call | | | | | | | | AA | | | | 1,075,890 | |
| | 1,745 | | | 5.000%, 12/01/19 – BAM Insured | | | No Opt. Call | | | | | | | | AA | | | | 1,975,357 | |
| | | | | | |
| | | | Kershaw County Public Schools Foundation, South Carolina, Installment Purchase Revenue Bonds, Kershaw County School District, Refunding Series 2015: | | | | | | | | | | | | | | | | |
| | 900 | | | 5.000%, 12/01/18 | | | No Opt. Call | | | | | | | | A1 | | | | 986,382 | |
| | 1,050 | | | 5.000%, 12/01/19 | | | No Opt. Call | | | | | | | | A1 | | | | 1,182,300 | |
| | 600 | | | 5.000%, 12/01/20 | | | No Opt. Call | | | | | | | | A1 | | | | 692,268 | |
| | | | | | |
| | 1,060 | | | McCormick County, South Carolina, Hospital Facilities Revenue Refunding and Improvement Bonds, McCormick Health Care Center Project, Series 2006, 8.000%, 3/01/21 (ETM) | | | No Opt. Call | | | | | | | | N/R (4) | | | | 1,299,507 | |
| | | | | | |
| | | | South Carolina JOBS Economic Development Authority, Economic Development Revenue Bonds, FMU Student Housing LLC – Francis Marion University Project, Series 2014A: | | | | | | | | | | | | | | | | |
| | 1,020 | | | 5.000%, 8/01/22 | | | No Opt. Call | | | | | | | | Baa3 | | | | 1,153,610 | |
| | 1,035 | | | 5.000%, 8/01/24 | | | No Opt. Call | | | | | | | | Baa3 | | | | 1,189,846 | |
| | | | | | |
| | | | South Carolina Jobs-Economic Development Authority, Hospital Revenue Bonds, Palmetto Health, Refunding Series 2013A: | | | | | | | | | | | | | | | | |
| | 1,450 | | | 5.250%, 8/01/24 | | | 8/23 at 100.00 | | | | | | | | BBB+ | | | | 1,758,923 | |
| | 2,850 | | | 5.250%, 8/01/25 | | | 8/23 at 100.00 | | | | | | | | BBB+ | | | | 3,424,446 | |
| | 3,500 | | | 5.250%, 8/01/26 | | | 8/23 at 100.00 | | | | | | | | BBB+ | | | | 4,172,910 | |
| | 2,000 | | | 5.000%, 8/01/27 | | | 8/23 at 100.00 | | | | | | | | BBB+ | | | | 2,327,780 | |
| | | | | | |
| | 1,000 | | | South Carolina Public Service Authority, Santee Cooper Revenue Obligations, Refunding Series 2014C, 5.000%, 12/01/21 | | | No Opt. Call | | | | | | | | AA– | | | | 1,198,520 | |
| | | | | | |
| | 1,125 | | | South Carolina Public Service Authority, Santee Cooper Revenue Obligations, Refunding Series 2016A, 5.000%, 12/01/22 | | | No Opt. Call | | | | | | | | AA– | | | | 1,373,299 | |
| | | | | | |
| | 5,250 | | | Spartanburg County School District 2, South Carolina, General Obligation Bonds, Series 2015, 5.000%, 4/01/17 | | | No Opt. Call | | | | | | | | Aa1 | | | | 5,464,830 | |
Nuveen Limited Term Municipal Bond Fund (continued)
| | |
| Portfolio of Investments | | April 30, 2016 |
| | | | | | | | | | | | | | | | | | | | |
Principal
Amount (000) | | | Description (1) | | Optional Call
Provisions (2) | | | | | | | Ratings (3) | | | Value | |
| | | | | | |
| | | | South Carolina (continued) | | | | | | | | | | | | | |
| | | | | | |
| | | | Sumter Two School Facilities, Inc., South Carolina, Installment Purchase Revenue Refunding Bonds, Sumter County School District 2 Project, Series 2016: | | | | | | | | | | | | | | | | |
| $ | 850 | | | 4.000%, 12/01/17 – BAM Insured | | | No Opt. Call | | | | | | | | AA | | | $ | 890,154 | |
| | 1,500 | | | 5.000%, 12/01/19 – BAM Insured | | | No Opt. Call | | | | | | | | AA | | | | 1,690,485 | |
| | 1,000 | | | 5.000%, 12/01/20 – BAM Insured | | | No Opt. Call | | | | | | | | AA | | | | 1,155,270 | |
| | 44,270 | | | Total South Carolina | | | | | | | | | | | | | | | 50,451,195 | |
| | | | | | |
| | | | South Dakota – 0.2% | | | | | | | | | | | | | |
| | | | | | |
| | | | Deadwood, South Dakota, Certificates of Participation, Refunding Series 2012: | | | | | | | | | | | | | | | | |
| | 1,580 | | | 3.000%, 11/01/17 | | | No Opt. Call | | | | | | | | A | | | | 1,631,919 | |
| | 770 | | | 3.000%, 11/01/18 | | | No Opt. Call | | | | | | | | A | | | | 808,531 | |
| | | | | | |
| | 400 | | | South Dakota Building Authority, Revenue Bonds, Series 2013B, 5.000%, 6/01/20 | | | No Opt. Call | | | | | | | | AA+ | | | | 462,564 | |
| | | | | | |
| | | | South Dakota Health and Educational Facilities Authority, Revenue Bonds, Sanford Health, Series 2014B: | | | | | | | | | | | | | | | | |
| | 400 | | | 4.000%, 11/01/19 | | | No Opt. Call | | | | | | | | A+ | | | | 441,452 | |
| | 320 | | | 4.000%, 11/01/20 | | | No Opt. Call | | | | | | | | A+ | | | | 359,155 | |
| | 500 | | | 4.000%, 11/01/21 | | | No Opt. Call | | | | | | | | A+ | | | | 563,320 | |
| | 650 | | | 5.000%, 11/01/24 | | | No Opt. Call | | | | | | | | A+ | | | | 805,155 | |
| | | | | | |
| | | | South Dakota Health and Educational Facilities Authority, Revenue Bonds, Sanford Health, Series 2015: | | | | | | | | | | | | | | | | |
| | 650 | | | 5.000%, 11/01/20 | | | No Opt. Call | | | | | | | | A+ | | | | 755,476 | |
| | 550 | | | 5.000%, 11/01/21 | | | No Opt. Call | | | | | | | | A+ | | | | 653,323 | |
| | 535 | | | 5.000%, 11/01/22 | | | No Opt. Call | | | | | | | | A+ | | | | 646,526 | |
| | 6,355 | | | Total South Dakota | | | | | | | | | | | | | | | 7,127,421 | |
| | | | | | |
| | | | Tennessee – 1.0% | | | | | | | | | | | | | |
| | | | | | |
| | | | First Utility District of Knox County, Tennessee, Water and Sewer Revenue Bonds, Series 2012A: | | | | | | | | | | | | | | | | |
| | 225 | | | 2.000%, 12/01/16 | | | No Opt. Call | | | | | | | | AA+ | | | | 226,865 | |
| | 710 | | | 4.000%, 12/01/20 | | | No Opt. Call | | | | | | | | AA+ | | | | 799,112 | |
| | 740 | | | 4.000%, 12/01/21 | | | No Opt. Call | | | | | | | | AA+ | | | | 846,715 | |
| | | | | | |
| | | | Harpeth Valley Utilities District, Davidson and Williamson Counties, Tennessee, Utilities Revenue Bonds, Refunding Series 2015: | | | | | | | | | | | | | | | | |
| | 2,190 | | | 4.000%, 9/01/19 | | | No Opt. Call | | | | | | | | AA | | | | 2,403,153 | |
| | 1,510 | | | 4.000%, 9/01/20 | | | No Opt. Call | | | | | | | | AA | | | | 1,691,140 | |
| | | | | | |
| | | | Knox County Health, Educational and Housing Facility Board, Tennessee, Hospital Revenue Refunding Bonds, Covenant Health, Series 2012A: | | | | | | | | | | | | | | | | |
| | 1,030 | | | 5.000%, 1/01/19 | | | No Opt. Call | | | | | | | | A | | | | 1,137,058 | |
| | 2,500 | | | 5.000%, 1/01/20 | | | No Opt. Call | | | | | | | | A | | | | 2,841,700 | |
| | 1,500 | | | 4.000%, 1/01/21 | | | No Opt. Call | | | | | | | | A | | | | 1,680,465 | |
| | | | | | |
| | | | Metropolitan Government of Nashville-Davidson County Health and Educational Facilities Board, Tennessee, Revenue Bonds, Belmont University Project, Series 2012: | | | | | | | | | | | | | | | | |
| | 1,335 | | | 3.000%, 11/01/17 | | | No Opt. Call | | | | | | | | BBB+ | | | | 1,366,239 | |
| | 250 | | | 3.000%, 11/01/18 | | | No Opt. Call | | | | | | | | BBB+ | | | | 259,248 | |
| | 1,070 | | | 4.000%, 11/01/19 | | | No Opt. Call | | | | | | | | BBB+ | | | | 1,155,418 | |
| | 810 | | | 4.000%, 11/01/20 | | | No Opt. Call | | | | | | | | BBB+ | | | | 885,176 | |
| | 500 | | | 4.000%, 11/01/21 | | | No Opt. Call | | | | | | | | BBB+ | | | | 552,335 | |
| | 1,030 | | | 5.000%, 11/01/22 | | | 11/21 at 100.00 | | | | | | | | BBB+ | | | | 1,191,288 | |
| | | | | | | | | | | | | | | | | | | | |
Principal
Amount (000) | | | Description (1) | | Optional Call
Provisions (2) | | | | | | | Ratings (3) | | | Value | |
| | | | | | |
| | | | Tennessee (continued) | | | | | | | | | | | | | |
| | | | | | |
| | | | Metropolitan Government of Nashville-Davidson County, Tennessee, Water and Sewerage Revenue Bonds, Subordinate Lien Refunding Series 2012: | | | | | | | | | | | | | | | | |
| $ | 2,570 | | | 5.000%, 7/01/21 | | | No Opt. Call | | | | | | | | A+ | | | $ | 3,063,286 | |
| | 1,870 | | | 5.000%, 7/01/22 | | | No Opt. Call | | | | | | | | A+ | | | | 2,272,910 | |
| | | | | | |
| | | | Shelby County Health, Educational and Housing Facilities Board, Tennessee, Revenue Bonds, Baptist Memorial Healthcare, Series 2004A: | | | | | | | | | | | | | | | | |
| | 5,000 | | | 5.000%, 9/01/16 | | | No Opt. Call | | | | | | | | A– | | | | 5,074,750 | |
| | 2,500 | | | 5.000%, 9/01/18 | | | No Opt. Call | | | | | | | | A– | | | | 2,723,550 | |
| | | | | | |
| | 7,560 | | | Tennessee State, General Obligation Bonds, Series 2009A, 5.000%, 5/01/17 | | | No Opt. Call | | | | | | | | Aaa | | | | 7,899,293 | |
| | | | | | |
| | 1,000 | | | Tennessee State, General Obligation Bonds, Series 2009A, 5.000%, 5/01/19 (Pre-refunded 5/01/17) | | | 5/17 at 100.00 | | | | | | | | AAA | | | | 1,044,310 | |
| | | | | | |
| | 230 | | | The Tennessee Energy Acquisition Corporation, Gas Revenue Bonds, Series 2006A, 5.250%, 9/01/18 | | | No Opt. Call | | | | | | | | A | | | | 251,082 | |
| | | | | | |
| | 1,400 | | | The Tennessee Energy Acquisition Corporation, Gas Revenue Bonds, Series 2006C, 5.000%, 2/01/17 | | | No Opt. Call | | | | | | | | A | | | | 1,443,540 | |
| | | | | | |
| | | | West Wilson Utility District, Wilson County, Tennessee, Water Revenue Bonds, Refunding & Improvement Series 2015: | | | | | | | | | | | | | | | | |
| | 1,680 | | | 3.000%, 6/01/18 | | | No Opt. Call | | | | | | | | AA– | | | | 1,750,291 | |
| | 1,100 | | | 4.000%, 6/01/19 | | | No Opt. Call | | | | | | | | AA– | | | | 1,198,241 | |
| | 1,260 | | | 4.000%, 6/01/20 | | | No Opt. Call | | | | | | | | AA– | | | | 1,404,131 | |
| | 41,570 | | | Total Tennessee | | | | | | | | | | | | | | | 45,161,296 | |
| | | | | | |
| | | | Texas – 6.1% | | | | | | | | | | | | | |
| | | | | | |
| | 20,405 | | | Board of Regents, University of Texas System, Financing System Revenue Bonds, Refunding Series 2012A, 5.000%, 8/15/23 | | | No Opt. Call | | | | | | | | AAA | | | | 25,542,367 | |
| | | | | | |
| | | | Corpus Christi Business and Job Development Corporation, Texas, Sales Tax Revenue Bonds, Arena Project, Refunding Series 2014: | | | | | | | | | | | | | | | | |
| | 1,000 | | | 5.000%, 9/01/21 | | | No Opt. Call | | | | | | | | AA– | | | | 1,176,450 | |
| | 650 | | | 5.000%, 9/01/22 | | | No Opt. Call | | | | | | | | AA– | | | | 777,933 | |
| | | | | | |
| | | | Dallas-Fort Worth International Airport, Texas, Joint Revenue Bonds, Refunding Series 2012B: | | | | | | | | | | | | | | | | |
| | 2,595 | | | 5.000%, 11/01/20 | | | No Opt. Call | | | | | | | | A+ | | | | 3,026,600 | |
| | 5,000 | | | 5.000%, 11/01/21 | | | 11/20 at 100.00 | | | | | | | | A+ | | | | 5,864,900 | |
| | | | | | |
| | 3,020 | | | Harris County Cultural Education Facilities Finance Corporation, Texas, Hospital Revenue Bonds, Memorial Hermann Healthcare System, Series 2014A, 5.000%, 12/01/24 | | | No Opt. Call | | | | | | | | A+ | | | | 3,775,332 | |
| | | | | | |
| | 9,000 | | | Harris County Metropolitan Transit Authority, Texas, Sales and Use Tax Revenue Bonds, Refunding Series 2015A, 5.000%, 8/15/19 | | | No Opt. Call | | | | | | | | AA+ | | | | 10,191,150 | |
| | | | | | |
| | 6,055 | | | Harris County, Texas, General Obligation Bonds, Refunding Road Series 2009A, 5.250%, 10/01/18 | | | No Opt. Call | | | | | | | | AAA | | | | 6,711,604 | |
| | | | | | |
| | | | Harris County-Houston Sports Authority, Texas, Revenue Bonds, Refunding Second Lien Series 2014C: | | | | | | | | | | | | | | | | |
| | 700 | | | 5.000%, 11/15/19 | | | No Opt. Call | | | | | | | | A3 | | | | 787,038 | |
| | 575 | | | 5.000%, 11/15/20 | | | No Opt. Call | | | | | | | | A3 | | | | 660,359 | |
| | 450 | | | 5.000%, 11/15/21 | | | No Opt. Call | | | | | | | | A3 | | | | 525,402 | |
| | | | | | |
| | | | Harris County-Houston Sports Authority, Texas, Revenue Bonds, Refunding Senior Lien Series 2014A: | | | | | | | | | | | | | | | | |
| | 11,635 | | | 5.000%, 11/15/22 – AGM Insured | | | No Opt. Call | | | | | | | | AA | | | | 14,118,956 | |
| | 8,630 | | | 5.000%, 11/15/23 – AGM Insured | | | No Opt. Call | | | | | | | | AA | | | | 10,647,090 | |
| | 5,205 | | | 5.000%, 11/15/24 – AGM Insured | | | No Opt. Call | | | | | | | | AA | | | | 6,488,345 | |
Nuveen Limited Term Municipal Bond Fund (continued)
| | |
| Portfolio of Investments | | April 30, 2016 |
| | | | | | | | | | | | | | | | | | | | |
Principal
Amount (000) | | | Description (1) | | Optional Call
Provisions (2) | | | | | | | Ratings (3) | | | Value | |
| | | | | | |
| | | | Texas (continued) | | | | | | | | | | | | | |
| | | | | | |
| $ | 1,110 | | | Houston, Texas, Airport System Revenue Bonds, Refunding Senior Lien Series 2009A, 5.000%, 7/01/16 | | | No Opt. Call | | | | | | | | AA– | | | $ | 1,118,425 | |
| | | | | | |
| | 2,900 | | | Houston, Texas, First Lien Combined Utility System Revenue Bonds, Refunding Series 2014C, 5.000%, 5/15/20 | | | No Opt. Call | | | | | | | | AA | | | | 3,355,271 | |
| | | | | | |
| | 11,520 | | | Houston, Texas, General Obligation Bonds, Public Improvement Refunding Series 2009A, 5.000%, 3/01/20 | | | 3/19 at 100.00 | | | | | | | | AA | | | | 12,878,208 | |
| | | | | | |
| | 10,000 | | | Houston, Texas, General Obligation Bonds, Public Improvement Refunding Series 2016A, 5.000%, 3/01/19 | | | No Opt. Call | | | | | | | | AA | | | | 11,135,700 | |
| | | | | | |
| | 2,250 | | | Houston, Texas, Subordinate Lien Airport System Revenue Refunding Bonds, Series 2011B, 5.000%, 7/01/20 | | | No Opt. Call | | | | | | | | A+ | | | | 2,590,943 | |
| | | | | | |
| | | | Love Field Airport Modernization Corporation, Texas, General Airport Revenue Bonds Series 2015: | | | | | | | | | | | | | | | | |
| | 500 | | | 5.000%, 11/01/18 (Alternative Minimum Tax) | | | No Opt. Call | | | | | | | | A1 | | | | 548,100 | |
| | 1,000 | | | 5.000%, 11/01/19 (Alternative Minimum Tax) | | | No Opt. Call | | | | | | | | A1 | | | | 1,127,470 | |
| | 1,000 | | | 5.000%, 11/01/20 (Alternative Minimum Tax) | | | No Opt. Call | | | | | | | | A1 | | | | 1,157,910 | |
| | 1,000 | | | 5.000%, 11/01/21 (Alternative Minimum Tax) | | | No Opt. Call | | | | | | | | A1 | | | | 1,181,170 | |
| | 1,000 | | | 5.000%, 11/01/22 (Alternative Minimum Tax) | | | No Opt. Call | | | | | | | | A1 | | | | 1,198,550 | |
| | 1,455 | | | 5.000%, 11/01/23 (Alternative Minimum Tax) | | | No Opt. Call | | | | | | | | A1 | | | | 1,764,188 | |
| | 1,500 | | | 5.000%, 11/01/24 (Alternative Minimum Tax) | | | No Opt. Call | | | | | | | | A1 | | | | 1,835,205 | |
| | | | | | |
| | 3,055 | | | Lubbock Health Facilities Development Corporation, Texas, Revenue Bonds, St. Joseph Health System, Refunding Series 2008B, 5.000%, 7/01/18 | | | No Opt. Call | | | | | | | | AA– | | | | 3,325,184 | |
| | | | | | |
| | 2,000 | | | Lubbock, Texas, General Obligation Bonds, Tax & Waterworks System Surplus Revenue Certificates of Obligation, Series 2016, 5.000%, 2/15/19 | | | No Opt. Call | | | | | | | | AA+ | | | | 2,223,260 | |
| | | | | | |
| | | | McCamey County Hospital District, Texas, General Obligation Bonds, Series 2013: | | | | | | | | | | | | | | | | |
| | 1,245 | | | 3.000%, 12/01/18 | | | No Opt. Call | | | | | | | | Ba2 | | | | 1,248,050 | |
| | 1,510 | | | 4.000%, 12/01/21 | | | No Opt. Call | | | | | | | | Ba2 | | | | 1,563,484 | |
| | | | | | |
| | | | North Central Texas Health Facilities Development Corporation, Texas, Revenue Bonds, Children’s Medical Center Dallas Project, Series 2012: | | | | | | | | | | | | | | | | |
| | 1,715 | | | 5.000%, 8/15/19 | | | No Opt. Call | | | | | | | | Aa2 | | | | 1,938,705 | |
| | 2,785 | | | 5.000%, 8/15/21 | | | No Opt. Call | | | | | | | | Aa2 | | | | 3,325,123 | |
| | 2,000 | | | 5.000%, 8/15/22 | | | No Opt. Call | | | | | | | | Aa2 | | | | 2,433,900 | |
| | 5,480 | | | 5.000%, 8/15/23 | | | 8/22 at 100.00 | | | | | | | | Aa2 | | | | 6,678,531 | |
| | | | | | |
| | 7,625 | | | North Texas Tollway Authority, Special Projects System Revenue Bonds, Current Interest Series 2011D, 5.000%, 9/01/24 | | | 9/21 at 100.00 | | | | | | | | AA+ | | | | 9,133,530 | |
| | | | | | |
| | | | North Texas Tollway Authority, System Revenue Bonds, Refunding First Tier, Series 2014A: | | | | | | | | | | | | | | | | |
| | 4,000 | | | 5.000%, 1/01/22 | | | No Opt. Call | | | | | | | | A1 | | | | 4,770,480 | |
| | 4,945 | | | 5.000%, 1/01/23 | | | No Opt. Call | | | | | | | | A1 | | | | 6,018,856 | |
| | 7,000 | | | 5.000%, 1/01/24 | | | No Opt. Call | | | | | | | | A1 | | | | 8,660,470 | |
| | | | | | |
| | 575 | | | San Antonio, Texas, Electric and Gas System Revenue Bonds, Refunding Series 1992, 5.000%, 2/01/17 (ETM) | | | No Opt. Call | | | | | | | | AA+ (4) | | | | 594,194 | |
| | | | | | |
| | 15,000 | | | San Antonio, Texas, Electric and Gas System Revenue Bonds, Refunding Series 2012, 5.000%, 2/01/21 | | | No Opt. Call | | | | | | | | Aa1 | | | | 17,761,350 | |
| | | | | | |
| | 5,000 | | | San Antonio, Texas, General Obligation Bonds, General Improvement & Refunding Series 2015, 4.000%, 2/01/17 | | | No Opt. Call | | | | | | | | AAA | | | | 5,131,700 | |
| | | | | | |
| | 5,500 | | | Texas Municipal Gas Acquisition and Supply Corporation III, Gas Supply Revenue Bonds, Series 2012, 5.000%, 12/15/20 | | | No Opt. Call | | | | | | | | A3 | | | | 6,307,015 | |
| | | | | | | | | | | | | | | | | | | | |
Principal
Amount (000) | | | Description (1) | | Optional Call
Provisions (2) | | | | | | | Ratings (3) | | | Value | |
| | | | | | |
| | | | Texas (continued) | | | | | | | | | | | | | |
| | | | | | |
| | | | Texas Southmost College District, Texas, General Obligation Bonds, Limited Tax Refunding Series 2014A: | | | | | | | | | | | | | | | | |
| $ | 1,460 | | | 4.000%, 2/15/17 | | | No Opt. Call | | | | | | | | AA– | | | $ | 1,497,084 | |
| | 2,485 | | | 5.000%, 2/15/18 | | | No Opt. Call | | | | | | | | AA– | | | | 2,665,809 | |
| | 2,560 | | | 5.000%, 2/15/19 | | | No Opt. Call | | | | | | | | AA– | | | | 2,839,219 | |
| | 2,745 | | | 5.000%, 2/15/20 | | | No Opt. Call | | | | | | | | AA– | | | | 3,136,382 | |
| | | | | | |
| | 10,060 | | | Texas State Transportation Commission, Highway Fund Revenue Bonds, First Tier Series 2014A, 5.000%, 4/01/18 | | | No Opt. Call | | | | | | | | AAA | | | | 10,898,602 | |
| | | | | | |
| | | | Texas State Transportation Commission, Highway Fund Revenue Bonds, Refunding First Tier Series 2015: | | | | | | | | | | | | | | | | |
| | 8,520 | | | 4.000%, 10/01/18 | | | No Opt. Call | | | | | | | | AAA | | | | 9,197,255 | |
| | 5,000 | | | 5.000%, 10/01/19 | | | No Opt. Call | | | | | | | | AAA | | | | 5,701,100 | |
| | | | | | |
| | 2,695 | | | Texas State, Public Financing Authority, General Obligation Bonds, Refunding Series 2009A, 5.000%, 10/01/17 | | | No Opt. Call | | | | | | | | AAA | | | | 2,863,249 | |
| | | | | | |
| | | | Tyler Health Facilities Development Corporation, Texas, Hospital Revenue Bonds, East Texas Medical Center Regional Healthcare System, Series 2007A: | | | | | | | | | | | | | | | | |
| | 4,475 | | | 5.250%, 11/01/17 | | | No Opt. Call | | | | | | | | Baa3 | | | | 4,744,261 | |
| �� | 6,815 | | | 5.250%, 11/01/18 | | | 11/17 at 100.00 | | | | | | | | Baa3 | | | | 7,209,248 | |
| | 7,550 | | | 5.250%, 11/01/20 | | | 11/17 at 100.00 | | | | | | | | Baa3 | | | | 7,960,418 | |
| | | | | | |
| | | | Val Verde County, Texas, Pass-Through Toll Revenue and Limited Tax Bonds, Series 2011: | | | | | | | | | | | | | | | | |
| | 2,640 | | | 3.000%, 8/15/16 | | | No Opt. Call | | | | | | | | A | | | | 2,654,282 | |
| | 2,720 | | | 3.000%, 8/15/17 | | | No Opt. Call | | | | | | | | A | | | | 2,773,747 | |
| | 239,315 | | | Total Texas | | | | | | | | | | | | | | | 275,439,154 | |
| | | | | | |
| | | | Utah – 0.2% | | | | | | | | | | | | | |
| | | | | | |
| | 2,000 | | | Salt Lake County, Utah, Research Facility Revenue Bonds, Huntsman Cancer Foundation, Series 2013A-1, 5.000%, 12/01/33 (Mandatory put 12/15/20) | | | 12/18 at 100.00 | | | | | | | | N/R | | | | 2,116,520 | |
| | | | | | |
| | | | Utah Associated Municipal Power Systems, Revenue Bonds, Horse Butte Wind Project, Series 2012A: | | | | | | | | | | | | | | | | |
| | 875 | | | 5.000%, 9/01/16 | | | No Opt. Call | | | | | | | | A | | | | 887,399 | |
| | 500 | | | 5.000%, 9/01/17 | | | No Opt. Call | | | | | | | | A | | | | 526,205 | |
| | 515 | | | 5.000%, 9/01/18 | | | No Opt. Call | | | | | | | | A | | | | 560,531 | |
| | 1,250 | | | 5.000%, 9/01/19 | | | No Opt. Call | | | | | | | | A | | | | 1,402,200 | |
| | 1,090 | | | 5.000%, 9/01/20 | | | No Opt. Call | | | | | | | | A | | | | 1,248,650 | |
| | 2,065 | | | 5.000%, 9/01/21 | | | No Opt. Call | | | | | | | | A | | | | 2,416,670 | |
| | 8,295 | | | Total Utah | | | | | | | | | | | | | | | 9,158,175 | |
| | | | | | |
| | | | Vermont – 0.0% | | | | | | | | | | | | | |
| | | | | | |
| | | | Vermont Educational and Health Buildings Financing Agency, Revenue Bonds, University of Vermont Medical Center Project, Series 2016A: | | | | | | | | | | | | | | | | |
| | 500 | | | 3.000%, 12/01/17 | | | No Opt. Call | | | | | | | | A– | | | | 517,775 | |
| | 700 | | | 3.000%, 12/01/18 | | | No Opt. Call | | | | | | | | A– | | | | 736,883 | |
| | 720 | | | 4.000%, 12/01/19 | | | No Opt. Call | | | | | | | | A– | | | | 793,267 | |
| | 1,920 | | | Total Vermont | | | | | | | | | | | | | | | 2,047,925 | |
| | | | | | |
| | | | Virgin Islands – 0.2% | | | | | | | | | | | | | |
| | | | | | |
| | | | Virgin Islands Public Finance Authority, Matching Fund Loan Notes Revenue Bonds, Series 2009B: | | | | | | | | | | | | | | | | |
| | 4,375 | | | 5.000%, 10/01/16 | | | No Opt. Call | | | | | | | | BBB | | | | 4,445,700 | |
| | 4,000 | | | 5.000%, 10/01/17 | | | No Opt. Call | | | | | | | | BBB | | | | 4,202,320 | |
| | 8,375 | | | Total Virgin Islands | | | | | | | | | | | | | | | 8,648,020 | |
Nuveen Limited Term Municipal Bond Fund (continued)
| | |
| Portfolio of Investments | | April 30, 2016 |
| | | | | | | | | | | | | | | | | | | | |
Principal
Amount (000) | | | Description (1) | | Optional Call
Provisions (2) | | | | | | | Ratings (3) | | | Value | |
| | | | | | |
| | | | Virginia – 1.3% | | | | | | | | | | | | | |
| | | | | | |
| $ | 10,855 | | | Fairfax County, Virginia, General Obligation Bonds, Refunding Public Improvement Series 2016A, 3.000%, 10/01/18 | | | No Opt. Call | | | | | | | | AAA | | | $ | 11,457,561 | |
| | | | | | |
| | 10,520 | | | Halifax County Industrial Development Authority, Virginia, Recovery Zone Facility Revenue Bonds, Virginia Electric & Power Company Project, Series 2010A, 2.150%, 12/01/41 | | | No Opt. Call | | | | | | | | A2 | | | | 10,850,118 | |
| | | | | | |
| | 1,000 | | | Hanover County, Virginia, General Obligation Bonds, Refunding & Public Improvement Series 2009, 5.000%, 7/15/19 | | | No Opt. Call | | | | | | | | AAA | | | | 1,134,060 | |
| | | | | | |
| | 6,000 | | | Louisa Industrial Development Authority, Virginia, Pollution Control Revenue Bonds, Virginia Electric and Power Company, Refunding Series 2008A, 1.750%, 11/01/35 (Mandatory put 5/16/19) | | | No Opt. Call | | | | | | | | A2 | | | | 6,097,080 | |
| | | | | | |
| | 1,025 | | | Virginia College Building Authority, Educational Facilities Revenue Bonds, 21st Century College Program, Refunding Series 2014B, 5.000%, 2/01/19 | | | No Opt. Call | | | | | | | | AA+ | | | | 1,142,127 | |
| | | | | | |
| | | | Virginia Small Business Financing Authority, Revenue Bonds, Hampton University, Refunding Series 2014: | | | | | | | | | | | | | | | | |
| | 1,000 | | | 5.000%, 10/01/17 | | | No Opt. Call | | | | | | | | A | | | | 1,055,900 | |
| | 1,000 | | | 5.000%, 10/01/18 | | | No Opt. Call | | | | | | | | A | | | | 1,092,200 | |
| | 1,000 | | | 5.000%, 10/01/19 | | | No Opt. Call | | | | | | | | A | | | | 1,125,040 | |
| | | | | | |
| | 10,000 | | | Wise County Industrial Development Authority, Virginia, Solid Waste and Sewage Disposal Revenue Bonds, Virginia Electric and Power Company, Series 2009A, 2.150%, 10/01/40 (Mandatory put 9/01/20) | | | No Opt. Call | | | | | | | | A2 | | | | 10,313,800 | |
| | | | | | |
| | 11,840 | | | Wise County Industrial Development Authority, Virginia, Solid Waste and Sewage Disposal Revenue Bonds, Virginia Electric and Power Company, Series 2010A, 1.875%, 11/01/40 (Mandatory put 6/01/20) | | | No Opt. Call | | | | | | | | A2 | | | | 12,095,034 | |
| | | | | | |
| | 2,765 | | | York County Economic Development Authority, Virginia, Pollution Control Revenue Bonds, Virginia Electric and Power Company Project, Refunding Series 2009A, 1.875%, 5/01/33 (Mandatory put 5/16/19) | | | No Opt. Call | | | | | | | | A2 | | | | 2,820,881 | |
| | 57,005 | | | Total Virginia | | | | | | | | | | | | | | | 59,183,801 | |
| | | | | | |
| | | | Washington – 2.9% | | | | | | | | | | | | | |
| | | | | | |
| | 10,000 | | | Energy Northwest, Washington, Electric Revenue Bonds, Columbia Generating Station, Refunding Series 2015A, 5.000%, 7/01/23 | | | No Opt. Call | | | | | | | | Aa1 | | | | 12,429,200 | |
| | | | | | |
| | 5,000 | | | Energy Northwest, Washington, Electric Revenue Bonds, Nuclear Project 1, Refunding Series 2015C, 5.000%, 7/01/25 | | | No Opt. Call | | | | | | | | Aa1 | | | | 6,410,500 | |
| | | | | | |
| | | | Port of Seattle, Washington, Revenue Bonds, Refunding Intermediate Lien Series 2015B: | | | | | | | | | | | | | | | | |
| | 1,280 | | | 5.000%, 3/01/18 | | | No Opt. Call | | | | | | | | A+ | | | | 1,380,787 | |
| | 2,000 | | | 5.000%, 3/01/19 | | | No Opt. Call | | | | | | | | A+ | | | | 2,235,700 | |
| | 1,000 | | | 5.000%, 3/01/20 | | | No Opt. Call | | | | | | | | A+ | | | | 1,152,720 | |
| | | | | | |
| | 4,265 | | | Seattle, Washington, Municipal Light and Power Revenue Bonds, Refunding & Improvement Series 2010B, 5.000%, 2/01/17 | | | No Opt. Call | | | | | | | | AA | | | | 4,407,792 | |
| | | | | | |
| | | | Spokane Public Facilities District, Washington, Hotel, Motel, and Sales Use Tax Revenue Bonds, Refunding Series 2013B: | | | | | | | | | | | | | | | | |
| | 1,100 | | | 5.000%, 12/01/18 | | | No Opt. Call | | | | | | | | A+ | | | | 1,213,651 | |
| | 1,500 | | | 5.000%, 12/01/20 | | | No Opt. Call | | | | | | | | A+ | | | | 1,745,819 | |
| | 2,095 | | | 5.000%, 12/01/21 | | | No Opt. Call | | | | | | | | A+ | | | | 2,494,474 | |
| | | | | | |
| | 3,000 | | | Washington Health Care Facilities Authority, Revenue Bonds, Fred Hutchinson Cancer Research Center, Series 2011A, 5.375%, 1/01/31 | | | 1/21 at 100.00 | | | | | | | | A | | | | 3,361,829 | |
| | | | | | | | | | | | | | | | | | | | |
Principal
Amount (000) | | | Description (1) | | Optional Call
Provisions (2) | | | | | | | Ratings (3) | | | Value | |
| | | | | | |
| | | | Washington (continued) | | | | | | | | | | | | | |
| | | | | | |
| | | | Washington Health Care Facilities Authority, Revenue Bonds, Fred Hutchinson Cancer Research Center, Series 2015: | | | | | | | | | | | | | | | | |
| $ | 1,500 | | | 5.000%, 1/01/21 | | | No Opt. Call | | | | | | | | A | | | $ | 1,723,934 | |
| | 3,730 | | | 5.000%, 1/01/22 | | | No Opt. Call | | | | | | | | A | | | | 4,360,929 | |
| | 1,950 | | | 5.000%, 1/01/24 | | | No Opt. Call | | | | | | | | A | | | | 2,349,496 | |
| | 1,310 | | | 5.000%, 1/01/25 | | | No Opt. Call | | | | | | | | A | | | | 1,591,767 | |
| | | | | | |
| | 1,020 | | | Washington Health Care Facilities Authority, Revenue Bonds, PeaceHealth, Refunding Series 2014A, 5.000%, 11/15/21 | | | No Opt. Call | | | | | | | | A+ | | | | 1,218,083 | |
| | | | | | |
| | 10,000 | | | Washington Health Care Facilities Authority, Revenue Bonds, Providence Health & Services, Series 2012B, 4.000%, 10/01/42 (Mandatory put 10/01/21) | | | No Opt. Call | | | | | | | | AA | | | | 11,327,699 | |
| | | | | | |
| | 10,675 | | | Washington Health Care Facilities Authority, Revenue Bonds, Seattle Children’s Hospital, Refunding Series 2012B, 5.000%, 10/01/42 (Mandatory put 10/01/21) | | | No Opt. Call | | | | | | | | AA | | | | 12,665,460 | |
| | | | | | |
| | 2,600 | | | Washington State Economic Development Finance Authority, Solid Waste Disposal Revenue Bonds, Waste Management Inc., Series 2005D, 1.250%, 11/01/17 | | | No Opt. Call | | | | | | | | A– | | | | 2,612,453 | |
| | | | | | |
| | 6,000 | | | Washington State Economic Development Finance Authority, Solid Waste Disposal Revenue Bonds, Waste Management Inc., Series 2008, 2.125%, 6/01/20 | | | 6/19 at 100.00 | | | | | | | | A– | | | | 6,118,979 | |
| | | | | | |
| | 4,820 | | | Washington State, General Obligation Bonds, Motor Vehicle Fuel Tax, Series 2016D, 5.000%, 2/01/20 | | | No Opt. Call | | | | | | | | AA+ | | | | 5,548,397 | |
| | | | | | |
| | 20,070 | | | Washington State, General Obligation Bonds, Refunding Various Purpose Series 2013R-13C, 5.000%, 7/01/21 | | | No Opt. Call | | | | | | | | AA+ | | | | 23,972,410 | |
| | | | | | |
| | 7,725 | | | Washington State, General Obligation Bonds, Various Purpose, Refunding Series 2016C, 5.000%, 2/01/20 | | | No Opt. Call | | | | | | | | AA+ | | | | 8,892,401 | |
| | | | | | |
| | 8,715 | | | Washington State, General Obligation Motor Vehicle Fuel Tax Bonds, Series 2008B, 5.000%, 7/01/19 (Pre-refunded 7/01/18) | | | 7/18 at 100.00 | | | | | | | | AA+ (4) | | | | 9,516,430 | |
| | 111,355 | | | Total Washington | | | | | | | | | | | | | | | 128,730,910 | |
| | | | | | |
| | | | West Virginia – 0.6% | | | | | | | | | | | | | |
| | | | | | |
| | 6,210 | | | Mason County, West Virginia, Pollution Control Revenue Bonds, Appalachian Power Company, Series 2003L, 1.625%, 10/01/22 (Mandatory put 10/01/18) | | | No Opt. Call | | | | | | | | Baa1 | | | | 6,254,960 | |
| | | | | | |
| | 10,570 | | | West Virginia Economic Development Authority, Solid Waste Disposal Facilities Revenue Bonds, Appalachian Power Company – Amos Project, Refunding Series 2015A, 1.900%, 3/01/40 | | | No Opt. Call | | | | | | | | Baa1 | | | | 10,638,071 | |
| | | | | | |
| | 5,000 | | | West Virginia Economic Development Authority, Solid Waste Disposal Facilities Revenue Bonds, Appalachian Power Company – Amos Project, Series 2011A, 2.250%, 1/01/41 (Mandatory put 9/01/16) (Alternative Minimum Tax) | | | No Opt. Call | | | | | | | | Baa1 | | | | 5,014,000 | |
| | | | | | |
| | 1,020 | | | West Virginia Hospital Finance Authority, Hospital Revenue Bonds, Charleston Area Medical Center, Series 2014A, 5.000%, 9/01/24 | | | No Opt. Call | | | | | | | | A3 | | | | 1,236,607 | |
| | | | | | |
| | 375 | | | West Virginia State Building Commission, Lease Revenue Refunding Bonds, Regional Jail and Corrections Facility, Series 1998A, 5.375%, 7/01/18 – AMBAC Insured | | | No Opt. Call | | | | | | | | N/R | | | | 401,760 | |
| | | | | | |
| | 2,480 | | | West Virginia University, Revenue Bonds, West Virginia University Projects, Series 2000A, 0.000%, 4/01/17 – AMBAC Insured | | | No Opt. Call | | | | | | | | Aa3 | | | | 2,461,350 | |
| | 25,655 | | | Total West Virginia | | | | | | | | | | | | | | | 26,006,748 | |
| | | | | | |
| | | | Wisconsin – 1.8% | | | | | | | | | | | | | |
| | | | | | |
| | 950 | | | Wisconsin Health & Educational Facs Authority, Health Facilities Revenue Bonds, UnityPoint Health Project, Series 2014A, 5.000%, 12/01/19 | | | No Opt. Call | | | | | | | | Aa3 | | | | 1,080,548 | |
| | | | | | |
| | 3,000 | | | Wisconsin Health and Educational Facilities Authority, Revenue Bonds, Ascension Health Alliance Senior Credit Group, Series 2013B, 4.000%, 11/15/43 (Mandatory put 3/01/18) | | | No Opt. Call | | | | | | | | AA+ | | | | 3,174,329 | |
Nuveen Limited Term Municipal Bond Fund (continued)
| | |
| Portfolio of Investments | | April 30, 2016 |
| | | | | | | | | | | | | | | | | | | | |
Principal
Amount (000) | | | Description (1) | | Optional Call
Provisions (2) | | | | | | | Ratings (3) | | | Value | |
| | | | | | |
| | | | Wisconsin (continued) | | | | | | | | | | | | | |
| | | | | | |
| | | | Wisconsin Health and Educational Facilities Authority, Revenue Bonds, Aurora Health Care, Inc., Series 2010B: | | | | | | | | | | | | | | | | |
| $ | 5,000 | | | 5.000%, 7/15/17 | | | No Opt. Call | | | | | | | | A2 | | | $ | 5,219,049 | |
| | 5,000 | | | 5.000%, 7/15/18 | | | No Opt. Call | | | | | | | | A2 | | | | 5,380,349 | |
| | 5,680 | | | 5.000%, 7/15/19 | | | No Opt. Call | | | | | | | | A2 | | | | 6,282,477 | |
| | | | | | |
| | 2,845 | | | Wisconsin Health and Educational Facilities Authority, Revenue Bonds, Aurora Health Care, Inc., Series 2012A, 5.000%, 7/15/27 – AGM Insured | | | 7/21 at 100.00 | | | | | | | | A2 | | | | 3,273,285 | |
| | | | | | |
| | | | Wisconsin Health and Educational Facilities Authority, Revenue Bonds, Hospital Sisters Services, Inc., Refunding Series 2012B: | | | | | | | | | | | | | | | | |
| | 615 | | | 4.000%, 8/15/17 | | | No Opt. Call | | | | | | | | AA– | | | | 640,798 | |
| | 1,465 | | | 5.000%, 8/15/18 | | | No Opt. Call | | | | | | | | AA– | | | | 1,602,753 | |
| | | | | | |
| | 6,000 | | | Wisconsin Health and Educational Facilities Authority, Revenue Bonds, Hospital Sisters Services, Inc., Refunding Series 2014A, 5.000%, 11/15/22 | | | No Opt. Call | | | | | | | | AA– | | | | 7,335,299 | |
| | | | | | |
| | | | Wisconsin Health and Educational Facilities Authority, Revenue Bonds, Medical College of Wisconsin, Inc., Series 2010: | | | | | | | | | | | | | | | | |
| | 1,475 | | | 5.000%, 12/01/16 | | | No Opt. Call | | | | | | | | AA– | | | | 1,508,614 | |
| | 1,555 | | | 5.000%, 12/01/17 | | | No Opt. Call | | | | | | | | AA– | | | | 1,643,105 | |
| | 1,635 | | | 5.000%, 12/01/18 | | | No Opt. Call | | | | | | | | AA– | | | | 1,781,920 | |
| | 1,710 | | | 5.000%, 12/01/19 | | | No Opt. Call | | | | | | | | AA– | | | | 1,911,437 | |
| | | | | | |
| | 3,500 | | | Wisconsin Health and Educational Facilities Authority, Revenue Bonds, Mercy Alliance, Inc., Series 2010A, 5.000%, 6/01/19 | | | No Opt. Call | | | | | | | | A3 | | | | 3,628,204 | |
| | | | | | |
| | | | Wisconsin Health and Educational Facilities Authority, Revenue Bonds, Ministry Health Care, Inc., Refunding 2012C: | | | | | | | | | | | | | | | | |
| | 500 | | | 5.000%, 8/15/16 | | | No Opt. Call | | | | | | | | AA | | | | 506,499 | |
| | 750 | | | 5.000%, 8/15/18 | | | No Opt. Call | | | | | | | | AA | | | | 820,342 | |
| | 315 | | | 5.000%, 8/15/20 | | | No Opt. Call | | | | | | | | AA | | | | 365,008 | |
| | 1,480 | | | 5.000%, 8/15/21 | | | No Opt. Call | | | | | | | | AA | | | | 1,755,323 | |
| | 55 | | | 5.000%, 8/15/23 | | | 8/22 at 100.00 | | | | | | | | AA | | | | 65,963 | |
| | | | | | |
| | 2,050 | | | Wisconsin Health and Educational Facilities Authority, Revenue Bonds, Wheaton Franciscan Healthcare System, Series 2006A, 5.250%, 8/15/18 (Pre-refunded 8/15/16) | | | 8/16 at 100.00 | | | | | | | | N/R (4) | | | | 2,078,576 | |
| | | | | | |
| | | | Wisconsin State, General Fund Annual Appropriation Revenue Bonds, Refunding Series 2009A: | | | | | | | | | | | | | | | | |
| | 7,115 | | | 5.250%, 5/01/20 | | | 5/19 at 100.00 | | | | | | | | AA– | | | | 8,072,393 | |
| | 5 | | | 5.375%, 5/01/25 | | | 5/19 at 100.00 | | | | | | | | AA– | | | | 5,657 | |
| | 2,820 | | | 5.750%, 5/01/29 | | | 5/19 at 100.00 | | | | | | | | AA– | | | | 3,214,150 | |
| | | | | | |
| | 9,815 | | | Wisconsin State, Transportation Revenue Bonds, Refunding Series 2015-1, 5.000%, 7/01/18 | | | No Opt. Call | | | | | | | | AA+ | | | | 10,736,628 | |
| | | | | | |
| | | | Wisconsin State, Transportation Revenue Bonds, Series 2014-1: | | | | | | | | | | | | | | | | |
| | 5,000 | | | 5.000%, 7/01/21 (Pre-refunded 7/01/19) | | | 7/19 at 100.00 | | | | | | | | AA+ (4) | | | | 5,647,199 | |
| | 595 | | | 5.000%, 7/01/22 (Pre-refunded 7/01/19) | | | 7/19 at 100.00 | | | | | | | | AA+ (4) | | | | 672,016 | |
| | 1,770 | | | 5.000%, 7/01/23 (Pre-refunded 7/01/19) | | | 7/19 at 100.00 | | | | | | | | AA+ (4) | | | | 1,999,109 | |
| | | | | | |
| | | | WPPI Energy, Wisconsin, Power Supply System Revenue Bonds, Refunding Series 2014A: | | | | | | | | | | | | | | | | |
| | 670 | | | 5.000%, 7/01/25 | | | 7/24 at 100.00 | | | | | | | | A1 | | | | 833,125 | |
| | 1,000 | | | 5.000%, 7/01/26 | | | 7/24 at 100.00 | | | | | | | | A1 | | | | 1,234,050 | |
| | 700 | | | 5.000%, 7/01/27 | | | 7/24 at 100.00 | | | | | | | | A1 | | | | 856,709 | |
| | 75,070 | | | Total Wisconsin | | | | | | | | | | | | | | | 83,324,914 | |
| $ | 4,001,201 | | | Total Municipal Bonds (cost $4,243,883,878) | | | | | | | | | | | | | | | 4,361,434,850 | |
| | | | | | | | | | | | | | | | | | | | | | |
Principal
Amount (000) | | | Description (1) | | | | Coupon | | | Maturity | | | Ratings (3) | | | Value | |
| | | | | | |
| | | | CORPORATE BONDS – 0.0% | | | | | | | | | | | | | | | | | | |
| | | | | | |
| | | | Transportation – 0.0% | | | | | | | | | | | | | | |
| | | | | | |
| $ | 132 | | | Las Vegas Monorail Company, Senior Interest Bonds (6), (7) | | | | | 5.500% | | | | 7/15/19 | | | | N/R | | | $ | 3,950 | |
| | | | | | |
| | 35 | | | Las Vegas Monorail Company, Senior Interest Bonds (6), (7) | | | | | 5.500% | | | | 7/15/55 | | | | N/R | | | | 1,051 | |
| $ | 167 | | | Total Corporate Bonds (cost $14,944) | | | | | | | | | | | | | | �� | | | 5,001 | |
| | | | | | |
| Shares | | | Description (1), (10) | | | | | | | | | | | | | Value | |
| | | | | | |
| | | | INVESTMENT COMPANIES – 0.8% | | | | | | | | | | | | | | |
| | | | | | |
| | 5,150,000 | | | Eaton Vance Municipal Bond Fund II Institutional Munifund Term Perferred Shares iMTPs | | | | | | | | | | | | | | | | $ | 5,148,404 | |
| | | | | | |
| | 15,000,000 | | | Eaton Vance Municipal Income Trust | | | | | | | | | | | | | | | | | 14,995,050 | |
| | | | | | |
| | 14,450,000 | | | Eaton Vance Pennsylvania Municipal Bond Fund Institutional Munifund Term Perferred Shares iMTPs | | | | | | | | | | | | | | | | | 14,445,520 | |
| | | | Total Investment Companies (cost $34,600,000) | | | | | | | | | | | | 34,588,974 | |
| | | | Total Long-Term Investments (cost $4,278,498,822) | | | | | | | | | | | | 4,396,028,825 | |
| | | | | | | | | | | | | | | | | | | | |
| | | | | | |
Principal
Amount (000) | | | Description (1) | | Optional Call
Provisions (2) | | | | | | | Ratings (3) | | | Value | |
| | | | | | |
| | | | SHORT-TERM INVESTMENTS – 0.8% | | | | | | | | | | | | | | | | |
| | | | | | |
| | | | MUNICIPAL BONDS – 0.8% | | | | | | | | | | | | | | | | |
| | | | | | |
| | | | National – 0.0% | | | | | | | | | | | | | |
| | | | | | |
| $ | 1,223 | | | BB&T Municipal Trust Pool Tax Exempt Lease Certificates Class C, Variable Rate Demand Obligations, Series 2014, 0.710%, 11/15/17 (8) | | | No Opt. Call | | | | | | | | A+ | | | $ | 1,217,794 | |
| | | | | | |
| | | | California – 0.2% | | | | | | | | | | | | | |
| | | | | | |
| | 6,490 | | | California Pollution Control Financing Authority, Solid Waste Disposal Revenue Bonds, Waste Management, Inc. Project, Refunding Series 2015B-1, 3.000%, 11/01/25 (Alternative Minimum Tax) (8) | | | No Opt. Call | | | | | | | | A–/A-2 | | | | 6,863,954 | |
| | | | | | |
| | 3,365 | | | California Pollution Control Financing Authority, Solid Waste Disposal Revenue Bonds, Waste Management Inc., Refunding Series 2015B-2, 3.125%, 11/01/40 (Mandatory put 11/03/25) (Alternative Minimum Tax) (8) | | | No Opt. Call | | | | | | | | A– | | | | 3,550,815 | |
| | 9,855 | | | Total California | | | | | | | | | | | | | | | 10,414,769 | |
| | | | | | |
| | | | Missouri – 0.3% | | | | | | | | | | | | | |
| | | | | | |
| | 14,820 | | | Saint Louis, Missouri, Airport Revenue Bonds, Lambert-St. Louis International Airport, Tender Option Bond Trust DCL-017, 0.720%, 7/01/26 (8) | | | No Opt. Call | | | | | | | | AA+ | | | | 14,820,000 | |
| | | | | | |
| | | | Pennsylvania – 0.3% | | | | | | | | | | | | | |
| | | | | | |
| | 23 | | | Northampton County Industrial Development Authority, Pennsylvania, Recovery Revenue Bonds, Northampton Generating Project, Senior Lien Taxable Series 2013B, 5.000%, 12/31/23 (8) | | | 7/16 at 100.00 | | | | | | | | N/R | | | | 9,803 | |
| | | | | | |
| | 6,800 | | | Pennsylvania Higher Educational Facilities Authority, Revenue Bonds, Association of Independent Colleges and Universities of Pennsylvania Financing Program-Messiah College Project, Series 2001-14, 1.500%, 11/01/31 (Mandatory put 5/01/18) (8) | | | 5/18 at 100.00 | | | | | | | | A | | | | 6,840,800 | |
| | | | | | |
| | 1,600 | | | Pennsylvania Higher Educational Facilities Authority, Revenue Bonds, AICUP Financing Program-Mount Aloysius College Project, Series 2011R-1, 1.250%, 11/01/41 (Mandatory put 10/31/17) (8) | | | No Opt. Call | | | | | | | | A | | | | 1,600,000 | |
Nuveen Limited Term Municipal Bond Fund (continued)
| | |
| Portfolio of Investments | | April 30, 2016 |
| | | | | | | | | | | | | | | | | | | | |
Principal
Amount (000) | | | Description (1) | | Optional Call
Provisions (2) | | | | | | | Ratings (3) | | | Value | |
| | | | | | |
| | | | Pennsylvania (continued) | | | | | | | | | | | | | |
| | | | | | |
| $ | 2,600 | | | Pennsylvania Higher Educational Facilities Authority, Revenue Bonds, Association of Independent Colleges & Universities of Pennsylvania Financing Program, York College Project, Series 2014T-3, 1.350%, 5/01/34 (Mandatory put 4/30/18) (8) | | | No Opt. Call | | | | | | | | A | | | $ | 2,600,000 | |
| | 11,023 | | | Total Pennsylvania | | | | | | | | | | | | | | | 11,050,603 | |
| $ | 36,921 | | | Total Short-Term Investments (cost $36,920,901) | | | | | | | | | | | | | | | 37,503,166 | |
| | | | Total Investments (cost $4,315,419,723) – 98.4% | | | | | | | | | | | | | | | 4,433,531,991 | |
| | | | Other Assets Less Liabilities – 1.6% | | | | | | | | | | | | | | | 71,566,418 | |
| | | | Net Assets – 100% | | | | | | | | | | | | | | $ | 4,505,098,409 | |
| (1) | All percentages shown in the Portfolio of Investments are based on net assets. |
| (2) | Optional Call Provisions (not covered by the report of independent registered public accounting firm): Dates (month and year) and prices of the earliest optional call or redemption. There may be other call provisions at varying prices at later dates. Certain mortgagebacked securities may be subject to periodic principal paydowns. |
| (3) | Ratings (not covered by the report of independent registered public accounting firm): Using the highest of Standard & Poor’s Group (“Standard & Poor’s”), Moody’s Investors Service, Inc. (“Moody’s”) or Fitch, Inc. (“Fitch”) rating. Ratings below BBB by Standard & Poor’s, Baa by Moody’s or BBB by Fitch are considered to be below investment grade. Holdings designated N/R are not rated by any of these national rating agencies. |
| (4) | Backed by an escrow or trust containing sufficient U.S. Government or U.S. Government agency securities, which ensure the timely payment of principal and interest. Certain bonds backed by U.S. Government or agency securities are regarded as having an implied rating equal to the rating of such securities. |
| (5) | As of, or subsequent to, the end of the reporting period, this security is non-income producing. Non-income producing, in the case of a fixed-income security, generally denotes that the issuer has (1) defaulted on the payment of principal or interest, (2) is under the protection of the Federal Bankruptcy Court or (3) the Fund’s Adviser has concluded that the issue is not likely to meet its future interest payment obligations and has ceased accruing additional income on the Fund’s records. |
| (6) | Investment valued at fair value using methods determined in good faith by, or at the discretion of, the Board. For fair value measurement disclosure purposes, investment classified as Level 3. See Notes to Financial Statements, Note 2 – Investment Valuation and Fair Value Measurements for more information. |
| (7) | During January 2010, Las Vegas Monorail Company (“Las Vegas Monorail”) filed for federal bankruptcy protection. During March 2012, Las Vegas Monorail emerged from federal bankruptcy with the acceptance of a reorganization plan assigned by the Federal Bankruptcy Court. Under the reorganization plan, the Fund surrendered its Las Vegas Monorail Project Revenue Bonds, First Tier, Series 2000 and in turn received two senior interest corporate bonds: the first with an annual coupon rate of 5.500% maturing on July 15, 2019 and the second with an annual coupon rate of 3.000% (5.500% after December 31, 2015) maturing on July 15, 2055. The Fund is not accruing income for either senior interest corporate bond. |
| (8) | Investment has a maturity of more than one year, but has variable rate and/or demand features which qualify it as a short-term investment. The rate disclosed is that in effect as of the end of the reporting period. This rate changes periodically based on market conditions or a specified market index. |
| (9) | Step-up coupon. The rate shown is the coupon as of the end of the reporting period. |
| (10) | A copy of the most recent financial statements for these investment companies can be obtained directly from the Securities and Exchange Commission (SEC) on its website at http://www.sec.gov. |
| (ETM) | Escrowed to maturity. |
| (WI/DD) | Investment, or portion of investment purchased on a when-issued or delayed delivery basis. |
See accompanying notes to financial statements.
Nuveen Short Term Municipal Bond Fund
| | |
| Portfolio of Investments | | April 30, 2016 |
| | | | | | | | | | | | | | | | |
Principal
Amount (000) | | | Description (1) | | Optional Call
Provisions (2) | | | Ratings (3) | | �� | Value | |
| | | | |
| | | | LONG-TERM INVESTMENTS – 97.0% | | | | | | | | | | | | |
| | | | |
| | | | MUNICIPAL BONDS – 95.1% | | | | | | | | | | | | |
| | | | |
| | | | Alabama – 0.2% | | | | | | | | | |
| | | | |
| $ | 1,000 | | | Mobile Industrial Development Board, Alabama, Pollution Control Revenue Refunding Bonds, Alabama Power Company Barry Plan, Series 2008, 1.625%, 7/15/34 (Mandatory put 10/02/18) | | | No Opt. Call | | | | A1 | | | $ | 1,009,630 | |
| | | | |
| | | | Alaska – 1.0% | | | | | | | | | |
| | | | |
| | | | Alaska Industrial Development and Export Authority, Power Revenue Bonds, Snettisham Hydroelectric Project, Refunding Series 2015: | | | | | | | | | | | | |
| | 2,535 | | | 5.000%, 1/01/19 (Alternative Minimum Tax) | | | No Opt. Call | | | | Baa2 | | | | 2,755,013 | |
| | 1,660 | | | 5.000%, 1/01/20 (Alternative Minimum Tax) | | | No Opt. Call | | | | Baa2 | | | | 1,839,479 | |
| | | | |
| | 1,350 | | | Alaska State, International Airport System Revenue Bonds, Refunding Series 2016C, 5.000%, 10/01/20 (Alternative Minimum Tax) | | | No Opt. Call | | | | A1 | | | | 1,561,127 | |
| | | | |
| | 40 | | | Northern Tobacco Securitization Corporation, Alaska, Tobacco Settlement Asset-Backed Bonds, Series 2006A, 4.625%, 6/01/23 | | | 7/16 at 100.00 | | | | Ba1 | | | | 40,224 | |
| | 5,585 | | | Total Alaska | | | | | | | | | | | 6,195,843 | |
| | | | |
| | | | Arizona – 5.0% | | | | | | | | | |
| | | | |
| | 660 | | | Creighton Elementary School District 14, Maricopa County, Arizona, General Obligation Bonds, Series 2014B, 3.000%, 7/01/18 | | | No Opt. Call | | | | A1 | | | | 689,159 | |
| | | | |
| | 1,545 | | | Glendale Industrial Development Authority, Arizona, Revenue Bonds, Midwestern University, Refunding Series 2010, 5.000%, 5/15/19 | | | No Opt. Call | | | | A+ | | | | 1,709,728 | |
| | | | |
| | | | Kyrene Elementary School District 28, Maricopa County, Arizona, School Improvement Bonds, Project 2010, Series 2013B: | | | | | | | | | | | | |
| | 1,500 | | | 3.000%, 7/01/18 | | | No Opt. Call | | | | Aa1 | | | | 1,574,910 | |
| | 1,775 | | | 4.000%, 7/01/19 | | | No Opt. Call | | | | Aa1 | | | | 1,950,193 | |
| | | | |
| | 450 | | | Marana, Arizona, Pledged Excise Tax Revenue Bonds, Refunding Series 2013, 4.000%, 7/01/17 | | | No Opt. Call | | | | AA | | | | 466,547 | |
| | | | |
| | 2,045 | | | Maricopa County Industrial Development Authority, Arizona, Health Facility Revenue Bonds, Catholic Healthcare West, Series 2007A, 5.000%, 7/01/17 | | | No Opt. Call | | | | A | | | | 2,144,367 | |
| | | | |
| | 1,100 | | | Maricopa County Unified School District 11, Peoria, Arizona, General Obligation Bonds, School Improvement, Series 2014, 2.000%, 7/01/18 | | | No Opt. Call | | | | AA– | | | | 1,126,686 | |
| | | | |
| | 6,245 | | | Phoenix Civic Improvement Corporation, Arizona, Airport Revenue Bonds, Junior Lien Series 2010A, 5.000%, 7/01/17 | | | No Opt. Call | | | | A+ | | | | 6,554,877 | |
| | | | |
| | 1,495 | | | Phoenix Civic Improvement Corporation, Arizona, Airport Revenue Bonds, Refunding Senior Lien Series 2013, 5.000%, 7/01/17 (Alternative Minimum Tax) | | | No Opt. Call | | | | AA– | | | | 1,569,361 | |
| | | | |
| | 300 | | | Phoenix Mesa Gateway Airport Authority, Arizona, Special Facility Revenue Bonds, Mesa Project, Series 2012, 3.000%, 7/01/16 (Alternative Minimum Tax) | | | No Opt. Call | | | | AA+ | | | | 301,161 | |
| | | | |
| | 1,370 | | | Pima County Regional Transportation Authority, Arizona, Transportation Excise Tax Revenue Bonds, Regional Transportation Fund, Series 2014, 5.000%, 6/01/18 | | | No Opt. Call | | | | AA+ | | | | 1,491,738 | |
| | | | |
| | 1,260 | | | Pima County Unified School District 12 Sunnyside, Arizona, General Obligation Bonds, School Improvement Project 2011, Series 2014D, 2.000%, 7/01/18 – AGM Insured | | | No Opt. Call | | | | AA | | | | 1,291,664 | |
| | | | |
| | | | Pinal County, Arizona, Pledged Revenue Obligations, Refunding Series 2014: | | | | | | | | | | | | |
| | 1,000 | | | 5.000%, 8/01/18 | | | No Opt. Call | | | | AA– | | | | 1,091,360 | |
| | 3,195 | | | 3.000%, 8/01/19 | | | No Opt. Call | | | | AA– | | | | 3,395,774 | |
Nuveen Short Term Municipal Bond Fund (continued)
| | |
| Portfolio of Investments | | April 30, 2016 |
| | | | | | | | | | | | | | | | |
Principal
Amount (000) | | | Description (1) | | Optional Call
Provisions (2) | | | Ratings (3) | | | Value | |
| | | | |
| | | | Arizona (continued) | | | | | | | | | |
| | | | |
| $ | 1,195 | | | Regional Public Transportation Authority, Arizona, Transportation Excise Tax Revenue Bonds, Maricopa County Public Transportation Fund Series 2014, 5.250%, 7/01/18 | | | No Opt. Call | | | | AA+ | | | $ | 1,312,815 | |
| | | | |
| | 1,195 | | | Salt Verde Financial Corporation, Arizona, Senior Gas Revenue Bonds, Citigroup Energy Inc Prepay Contract Obligations, Series 2007, 5.250%, 12/01/20 | | | No Opt. Call | | | | BBB+ | | | | 1,374,764 | |
| | | | |
| | 1,070 | | | Sun Devil Energy LLC, Arizona, Revenue Refunding Bonds, Arizona State University Project, Series 2008, 5.000%, 7/01/18 | | | No Opt. Call | | | | AA– | | | | 1,163,657 | |
| | | | |
| | 1,325 | | | Vistancia Community Facilities District, Peoria, Arizona, General Obligation Bonds, Refunding Series 2015, 4.000%, 7/15/18 | | | No Opt. Call | | | | A1 | | | | 1,407,654 | |
| | | | |
| | 455 | | | Yuma & La Paz Counties Community College District, Arizona, General Obligation Bonds, Refunding Series 2014, 4.000%, 7/01/18 | | | No Opt. Call | | | | Aa3 | | | | 485,167 | |
| | | | |
| | 500 | | | Yuma County Elementary School District 1, Arizona, General Obligation Bonds, School Improvement Project 2014, Series 2015A, 4.000%, 7/01/18 – BAM Insured | | | No Opt. Call | | | | AA | | | | 532,815 | |
| | | | |
| | 830 | | | Yuma Industrial Development Authority, Arizona, Hospital Revenue Bonds, Yuma Regional Medical Center, Series 2014A, 5.000%, 8/01/19 | | | No Opt. Call | | | | A– | | | | 923,342 | |
| | 30,510 | | | Total Arizona | | | | | | | | | | | 32,557,739 | |
| | | | |
| | | | Arkansas – 0.8% | | | | | | | | | |
| | | | |
| | 3,280 | | | North Little Rock Health Facilities Board, Arkansas, Healthcare Revenue Bonds, Baptist Health, Series 1996B, 5.375%, 12/01/19 (Pre-refunded 12/01/18) | | | 12/18 at 100.00 | | | | A+ (4) | | | | 3,647,721 | |
| | | | |
| | 1,535 | | | University of Arkansas, Fayetteville, Various Facilities Revenue Bonds, Refunding Series 2015A, 5.000%, 11/01/19 | | | No Opt. Call | | | | Aa2 | | | | 1,749,010 | |
| | 4,815 | | | Total Arkansas | | | | | | | | | | | 5,396,731 | |
| | | | |
| | | | California – 4.5% | | | | | | | | | |
| | | | |
| | 715 | | | Calexico Community Redevelopment Agency Successor Agency, California, Tax Allocation Bonds, Merged Central Business District and Residential Redevelopment Project Area, Refunding Series 2014, 5.000%, 8/01/18 – AGM Insured | | | No Opt. Call | | | | AA | | | | 780,666 | |
| | | | |
| | 800 | | | California Health Facilities Financing Authority, Cal-Mortgage Insured Revenue Bonds, Northern California Retired Officers Community Corporation – Paradise Valley Estates, Refunding Series 2013, 3.000%, 1/01/17 | | | No Opt. Call | | | | AA– | | | | 813,344 | |
| | | | |
| | 2,095 | | | California Health Facilities Financing Authority, Revenue Bonds, Saint Joseph Health System, Series 2013B, 5.000%, 7/01/43 (Mandatory put 10/17/17) | | | No Opt. Call | | | | AA– | | | | 2,225,791 | |
| | | | |
| | | | California School Finance Authority, California, Charter School Revenue Bonds, Aspire Public Schools, Refunding Series 2016: | | | | | | | | | | | | |
| | 670 | | | 5.000%, 8/01/19 | | | No Opt. Call | | | | BBB | | | | 743,814 | |
| | 550 | | | 5.000%, 8/01/20 | | | No Opt. Call | | | | BBB | | | | 623,799 | |
| | | | |
| | 1,020 | | | California Statewide Community Development Authority, Revenue Bonds, Los Angeles Jewish Home for the Aging-Fountainview Gonda, Series 2014C, 2.500%, 8/01/20 | | | 11/16 at 100.00 | | | | AA– | | | | 1,027,885 | |
| | | | |
| | 175 | | | California Statewide Community Development Authority, Revenue Bonds, Los Angeles Jewish Home for the Aging-Fountainview Gonda, Series 2014D, 4.750%, 8/01/20 | | | 11/16 at 100.00 | | | | N/R | | | | 176,008 | |
| | | | |
| | 1,365 | | | Carson Redevelopment Agency, California, Tax Allocation Bonds, Redevelopment Project Area 1, Refunding Series 2014A, 4.000%, 10/01/17 | | | No Opt. Call | | | | A– | | | | 1,423,067 | |
| | | | |
| | 2,135 | | | Cathedral City Redevelopment Agency Successor Agency, California, Tax Allocation Bonds, Merged Redevelopment Project Area, Series 2014A, 4.000%, 8/01/17 | | | No Opt. Call | | | | BBB+ | | | | 2,219,098 | |
| | | | |
| | 500 | | | Corona-Norco Unified School District Public Financing Authority, California, Special Tax Revenue Bonds, Refunding Senior Lien Series 2013A, 4.000%, 9/01/17 | | | No Opt. Call | | | | A– | | | | 519,165 | |
| | | | | | | | | | | | | | | | |
Principal
Amount (000) | | | Description (1) | | Optional Call
Provisions (2) | | | Ratings (3) | | | Value | |
| | | | |
| | | | California (continued) | | | | | | | | | |
| | | | |
| | | | Fontana, California, Community Facilities District No. 22, Special Tax Refunding Bonds, Sierra Hills South, Series 2014: | | | | | | | | | | | | |
| $ | 400 | | | 4.000%, 9/01/16 | | | No Opt. Call | | | | N/R | | | $ | 404,744 | |
| | 475 | | | 4.000%, 9/01/17 | | | No Opt. Call | | | | N/R | | | | 494,138 | |
| | | | |
| | 905 | | | Fresno, California, Airport Revenue Bonds, Refunding Series 2013B, 4.000%, 7/01/17 (Alternative Minimum Tax) | | | No Opt. Call | | | | Baa1 | | | | 935,471 | |
| | | | |
| | 1,040 | | | Golden State Tobacco Securitization Corporation, California, Enhanced Tobacco Settlement Asset-Backed Revenue Bonds, Series 2013A, 5.000%, 6/01/17 | | | No Opt. Call | | | | A+ | | | | 1,089,213 | |
| | | | |
| | 3,425 | | | Los Angeles County Redevelopment Refunding Authority, California, Tax Allocation Revenue Bonds, Various Redevelopment Project Areas, Refunding Series 2013D, 5.000%, 9/01/16 | | | No Opt. Call | | | | A– | | | | 3,476,307 | |
| | | | |
| | 500 | | | Northern California Power Agency, Hydroelectric Project Number One Revenue Bonds, Refunding Series 2010A, 5.000%, 7/01/16 | | | No Opt. Call | | | | A+ | | | | 504,015 | |
| | | | |
| | | | Orange City, California, Special Tax Bonds, Community Facilities District 91-2, Serrano Heights Public Improvements, Refunding Series 2013: | | | | | | | | | | | | |
| | 320 | | | 3.000%, 10/01/16 | | | No Opt. Call | | | | A | | | | 323,082 | |
| | 360 | | | 3.000%, 10/01/17 | | | No Opt. Call | | | | A | | | | 370,242 | |
| | 300 | | | 4.000%, 10/01/18 | | | No Opt. Call | | | | A | | | | 320,697 | |
| | | | |
| | 1,095 | | | Patterson Public Financing Authority, California, Revenue Bonds, Community Facilities District 2001-1, Senior Series 2013A, 3.000%, 9/01/16 | | | No Opt. Call | | | | N/R | | | | 1,100,902 | |
| | | | |
| | 940 | | | Richmond Community Development Agency Successor Agency, California, Tax Allocation Bonds, Refunding Series 2014A, 4.000%, 9/01/17 – BAM Insured | | | No Opt. Call | | | | AA | | | | 978,596 | |
| | | | |
| | 275 | | | Rio Elementary School District, California, Special Tax Bonds, Community Facilities District 1, Refunding Series 2014, 4.000%, 9/01/18 | | | No Opt. Call | | | | N/R | | | | 292,548 | |
| | | | |
| | 510 | | | Riverside County Transportation Commission, California, Sales Tax Revenue Bonds, Limited Tax Series 2013A, 5.000%, 6/01/18 | | | No Opt. Call | | | | AA+ | | | | 556,323 | |
| | | | |
| | 550 | | | Sacramento City Financing Authority, California, Special Tax Revenue Bonds, Westlake and Regency Park, Refunding Series 2013A, 3.000%, 9/01/16 | | | No Opt. Call | | | | BBB+ | | | | 554,081 | |
| | | | |
| | 420 | | | Salinas Valley Solid Waste Authority, California, Revenue Bonds, Refunding Series 2014A, 5.000%, 8/01/18 – AGM Insured (Alternative Minimum Tax) | | | No Opt. Call | | | | AA | | | | 456,271 | |
| | | | |
| | 350 | | | San Benito Health Care District, San Benito County, California, Revenue Bonds, Refunding Series 2013, 4.000%, 3/01/18 | | | No Opt. Call | | | | AA– | | | | 370,503 | |
| | | | |
| | 1,000 | | | San Francisco City and County Redevelopment Agency Successor Agency, California, Tax Allocation Bonds, Mission Bay South Redevelopment Project, Refunding Series 2016C, 5.000%, 8/01/21 | | | No Opt. Call | | | | A- | | | | 1,192,860 | |
| | | | |
| | 200 | | | San Francisco City and County Redevelopment Agency Successor Agency, California, Tax Allocation Bonds, Mission Bay South Redevelopment Project, Series 2014A, 5.000%, 8/01/17 | | | No Opt. Call | | | | A– | | | | 210,660 | |
| | | | |
| | 600 | | | Santa Cruz County Redevelopment Successor Agency, California, Tax Allocation Bonds, Refunding Series 2014, 5.000%, 9/01/18 – BAM Insured | | | No Opt. Call | | | | AA | | | | 658,068 | |
| | | | |
| | 815 | | | South Orange County Public Financing Authority, California, Special Tax Revenue Bonds, Ladera Ranch, Refunding Series 2014A, 4.000%, 8/15/17 | | | No Opt. Call | | | | BBB+ | | | | 849,670 | |
| | | | |
| | 970 | | | Sulphur Springs Union School District, Los Angeles County, California, General Obligation Bonds, Anticipation Notes Series 2014A, 0.000%, 1/01/18 | | | No Opt. Call | | | | N/R | | | | 956,420 | |
| | | | |
| | 280 | | | Twin Rivers Unified School District, Sacramento and Placer Counties, California, General Obligation Bonds, Refunding Series 2014A, 4.000%, 8/01/18 – BAM Insured | | | No Opt. Call | | | | AA | | | | 300,322 | |
Nuveen Short Term Municipal Bond Fund (continued)
| | |
| Portfolio of Investments | | April 30, 2016 |
| | | | | | | | | | | | | | | | |
Principal
Amount (000) | | | Description (1) | | Optional Call
Provisions (2) | | | Ratings (3) | | | Value | |
| | | | |
| | | | California (continued) | | | | | | | | | |
| | | | |
| $ | 985 | | | Union City Community Redevelopment Agency, California, Tax Allocation Revenue Bonds, Redevelopment Project, Subordinate Lien Series 2011, 5.000%, 12/01/18 | | | No Opt. Call | | | | A+ | | | $ | 1,082,013 | |
| | | | |
| | 260 | | | Val Verde Unified School District Financing Authority, California, Special Tax Revenue Bonds, Refunding Series 2014, 4.000%, 10/01/18 – BAM Insured | | | No Opt. Call | | | | AA | | | | 278,811 | |
| | | | |
| | 600 | | | West Kern Water District, California, Certificates of Participation, Series 2011, 3.000%, 6/01/16 | | | No Opt. Call | | | | AA– | | | | 601,314 | |
| | 27,600 | | | Total California | | | | | | | | | | | 28,909,908 | |
| | | | |
| | | | Colorado – 2.9% | | | | | | | | | |
| | | | |
| | 320 | | | Colorado Educational and Cultural Facilities Authority Charter School Revenue Bonds, Monument Academy Charter School Project, Refunding Series 2014, 2.000%, 10/01/16 | | | No Opt. Call | | | | A | | | | 321,398 | |
| | | | |
| | 250 | | | Colorado Educational and Cultural Facilities Authority, Charter School Refunding Revenue Bonds, Pinnacle Charter School, Inc. K-8 Facility Project, Series 2013, 3.000%, 6/01/16 | | | No Opt. Call | | | | A | | | | 250,540 | |
| | | | |
| | 130 | | | Colorado Educational and Cultural Facilities Authority, Charter School Revenue Bonds, Douglas County School District RE-1 – DCS Montessori School, Refunding & Improvement Series 2012, 2.250%, 7/15/17 | | | No Opt. Call | | | | A | | | | 131,221 | |
| | | | |
| | 300 | | | Colorado Educational and Cultural Facilities Authority, Charter School Revenue Bonds, Peak-to-Peak Charter School, Refunding Series 2014, 3.000%, 8/15/17 | | | No Opt. Call | | | | A | | | | 307,284 | |
| | | | |
| | | | Colorado Educational and Cultural Facilities Authority, Charter School Revenue Bonds, The Classical Academy Project, Refunding & Improvement Series 2014: | | | | | | | | | | | | |
| | 375 | | | 3.000%, 12/01/17 | | | No Opt. Call | | | | A | | | | 385,950 | |
| | 250 | | | 3.000%, 12/01/18 | | | No Opt. Call | | | | A | | | | 260,728 | |
| | | | |
| | 235 | | | Colorado Educational and Cultural Facilities Authority, Charter School Revenue Bonds, The Classical Academy Project, Refunding Series 2015A, 4.000%, 12/01/18 | | | No Opt. Call | | | | A | | | | 251,295 | |
| | | | |
| | 470 | | | Colorado Educational and Cultural Facilities Authority, Charter School Revenue Bonds, Vanguard School Project, Refunding & Improvement Series 2016, 4.000%, 6/15/20 (WI/DD, Settling 5/06/16) | | | No Opt. Call | | | | A | | | | 515,219 | |
| | | | |
| | 1,685 | | | Colorado Educational and Cultural Facilities Authority, Revenue Bonds, Regis University Project, Refunding Series 2016, 5.000%, 10/01/19 (WI/DD, Settling 5/11/16) | | | No Opt. Call | | | | Baa2 | | | | 1,883,864 | |
| | | | |
| | 625 | | | Colorado Health Facilities Authority, Colorado, Hospital Revenue Bonds, Boulder Community Hospital Project, Refunding Series 2010A, 4.000%, 10/01/18 | | | No Opt. Call | | | | A | | | | 668,900 | |
| | | | |
| | 1,750 | | | Colorado Health Facilities Authority, Colorado, Revenue Bonds, Catholic Health Initiatives, Series 2008-C2 | | | | | | | | | | | 1,745,800 | |
| | | | |
| | 2,000 | | | Colorado Health Facilities Authority, Colorado, Revenue Bonds, Catholic Health Initiatives, Series 2009B-3, 1.875%, 7/01/39 (Mandatory put 11/06/19) | | | No Opt. Call | | | | A+ | | | | 2,021,080 | |
| | | | |
| | | | Colorado Health Facilities Authority, Colorado, Revenue Bonds, Evangelical Lutheran Good Samaritan Society Project, Series 2013A: | | | | | | | | | | | | |
| | 300 | | | 3.000%, 6/01/18 | | | No Opt. Call | | | | A– | | | | 310,746 | |
| | 500 | | | 4.000%, 6/01/19 | | | No Opt. Call | | | | A– | | | | 536,175 | |
| | | | |
| | 375 | | | Commerce City, Colorado, Sales and Use Tax Revenue Bonds, Series 2014, 2.000%, 8/01/18 – AGM Insured | | | No Opt. Call | | | | AA | | | | 384,724 | |
| | | | |
| | 305 | | | Denver City & County Housing Authority, Colorado, Capital Fund Program Revenue Bonds, Three Tower Rehabilitation, Series 2007, 4.550%, 11/01/17 – AGM Insured (Alternative Minimum Tax) (ETM) | | | No Opt. Call | | | | Aaa | | | | 312,832 | |
| | | | |
| | 1,730 | | | Denver City and County, Colorado, Airport System Revenue Bonds, Series 2011A, 5.250%, 11/15/18 (Alternative Minimum Tax) | | | No Opt. Call | | | | A+ | | | | 1,912,653 | |
| | | | | | | | | | | | | | | | |
Principal
Amount (000) | | | Description (1) | | Optional Call
Provisions (2) | | | Ratings (3) | | | Value | |
| | | | |
| | | | Colorado (continued) | | | | | | | | | |
| | | | |
| $ | 555 | | | Denver City and County, Colorado, Airport System Revenue Bonds, Series 2012A, 4.000%, 11/15/17 (Alternative Minimum Tax) | | | No Opt. Call | | | | A+ | | | $ | 581,568 | |
| | | | |
| | 250 | | | Denver City and County, Colorado, Airport System Revenue Bonds, Subordinate Lien Series 2013A, 5.000%, 11/15/16 (Alternative Minimum Tax) | | | No Opt. Call | | | | A | | | | 255,795 | |
| | | | |
| | | | Denver City and County, Colorado, Airport System Revenue Bonds, Subordinate Lien Series 2013B: | | | | | | | | | | | | |
| | 475 | | | 4.000%, 11/15/16 | | | No Opt. Call | | | | A | | | | 483,883 | |
| | 375 | | | 5.000%, 11/15/17 | | | No Opt. Call | | | | A | | | | 399,308 | |
| | | | |
| | 375 | | | E-470 Public Highway Authority, Colorado, Senior Revenue Bonds, Series 1997B, 0.000%, 9/01/17 – NPFG Insured | | | No Opt. Call | | | | AA– | | | | 368,539 | |
| | | | |
| | | | Eaton Area Park and Recreation District, Colorado, General Obligation Limited Tax Bonds, Series 2015: | | | | | | | | | | | | |
| | 225 | | | 5.000%, 12/01/17 | | | No Opt. Call | | | | N/R | | | | 234,745 | |
| | 100 | | | 5.000%, 12/01/19 | | | No Opt. Call | | | | N/R | | | | 106,904 | |
| | | | |
| | 800 | | | Jefferson County School District R-1, Colorado, Certificates of Participation, Jefferson County School Finance Corporation, Series 2016, 3.000%, 12/15/19 | | | No Opt. Call | | | | Aa3 | | | | 849,624 | |
| | | | |
| | 1,060 | | | Park Creek Metropolitan District, Colorado, Senior Limited Property Tax Supported Revenue Bonds, Refunding Series 2015A, 4.000%, 12/01/19 | | | No Opt. Call | | | | BBB | | | | 1,156,513 | |
| | | | |
| | 1,015 | | | Plaza Metropolitan District 1, Lakewood, Colorado, Tax Increment Revenue Bonds, Refunding Series 2013, 4.000%, 12/01/16 | | | No Opt. Call | | | | N/R | | | | 1,024,064 | |
| | | | |
| | | | Sand Creek Metropolitan District, Colorado, General Obligation Bonds, Refunding Series 2013B: | | | | | | | | | | | | |
| | 490 | | | 3.000%, 12/01/16 | | | No Opt. Call | | | | A | | | | 496,448 | |
| | 510 | | | 3.000%, 12/01/17 | | | No Opt. Call | | | | A | | | | 528,171 | |
| | 17,830 | | | Total Colorado | | | | | | | | | | | 18,685,971 | |
| | | | |
| | | | Connecticut – 0.3% | | | | | | | | | |
| | | | |
| | 1,795 | | | Connecticut Health and Educational Facilities Authority, Revenue Bonds, Yale University, Series 2015A, 1.375%, 7/01/35 (Mandatory put 7/11/18) | | | No Opt. Call | | | | AAA | | | | 1,814,242 | |
| | | | |
| | | | District of Columbia – 0.3% | | | | | | | | | |
| | | | |
| | 325 | | | District of Columbia, Revenue Bonds, Association of American Medical Colleges, Series 2011A, 3.000%, 10/01/16 | | | No Opt. Call | | | | A+ | | | | 328,026 | |
| | | | |
| | 1,600 | | | District of Columbia, Revenue Bonds, Medlantic/Helix Issue, Series 1998B, 5.000%, 8/15/17 – AGM Insured | | | No Opt. Call | | | | AA | | | | 1,685,504 | |
| | 1,925 | | | Total District of Columbia | | | | | | | | | | | 2,013,530 | |
| | | | |
| | | | Florida – 4.0% | | | | | | | | | |
| | | | |
| | | | Atlantic Beach, Florida, Healthcare Facilities Revenue Refunding Bonds, Fleet Landing Project, Series 2013A: | | | | | | | | | | | | |
| | 300 | | | 3.000%, 11/15/16 | | | No Opt. Call | | | | BBB | | | | 302,274 | |
| | 600 | | | 4.000%, 11/15/17 | | | No Opt. Call | | | | BBB | | | | 618,156 | |
| | | | |
| | 425 | | | Brevard County Health Facilities Authority, Florida, Health Facilities Revenue Bonds, Health First, Inc. Project, Refunding Series 2014, 5.000%, 4/01/18 | | | No Opt. Call | | | | A | | | | 456,735 | |
| | | | |
| | | | Crossings at Fleming Island Community Development District, Florida, Special Assessment Revenue Bonds, Refunding Senior Lien Series 2014A-1: | | | | | | | | | | | | |
| | 1,220 | | | 1.500%, 5/01/16 | | | No Opt. Call | | | | BBB | | | | 1,220,024 | |
| | 1,240 | | | 1.750%, 5/01/17 | | | No Opt. Call | | | | BBB | | | | 1,244,439 | |
Nuveen Short Term Municipal Bond Fund (continued)
| | |
| Portfolio of Investments | | April 30, 2016 |
| | | | | | | | | | | | | | | | |
Principal
Amount (000) | | | Description (1) | | Optional Call
Provisions (2) | | | Ratings (3) | | | Value | |
| | | | |
| | | | Florida (continued) | | | | | | | | | |
| | | | |
| $ | 770 | | | Davie, Florida, Educational Facilities Revenue Bonds, Nova Southeastern University Project, Refunding Series 2014B, 4.000%, 4/01/17 | | | No Opt. Call | | | | A– | | | $ | 792,992 | |
| | | | |
| | 750 | | | Halifax Hospital Medical Center, Daytona Beach, Florida, Hospital Revenue Bonds, Series 2006, 5.250%, 6/01/16 (ETM) | | | No Opt. Call | | | | BBB+ (4) | | | | 753,210 | |
| | | | |
| | 2,000 | | | Highlands County Health Facilities Authority, Florida, Hospital Revenue Bonds, Adventist Health System/Sunbelt Obligated Group, Series 2005I, 5.000%, 11/15/16 | | | No Opt. Call | | | | Aa2 | | | | 2,047,900 | |
| | | | |
| | 1,195 | | | Lee County, Florida, Transportation Facilities Revenue Bonds, Refunding Series 2014, 5.000%, 10/01/18 – AGM Insured | | | No Opt. Call | | | | AA | | | | 1,311,967 | |
| | | | |
| | 1,000 | | | Miami, Florida, Special Obligation Non-Ad Valorem Revenue Bonds, Refunding Series 2011A, 5.000%, 2/01/17 | | | No Opt. Call | | | | AA | | | | 1,031,640 | |
| | | | |
| | 3,340 | | | Miami-Dade County Expressway Authority, Florida, Toll System Revenue Bonds, Refunding Series 2013A, 5.000%, 7/01/17 | | | No Opt. Call | | | | A | | | | 3,507,334 | |
| | | | |
| | 1,300 | | | Miami-Dade County School Board, Florida, Certificates of Participation, Series 2015A, 5.000%, 5/01/18 | | | No Opt. Call | | | | A1 | | | | 1,407,874 | |
| | | | |
| | | | Palm Beach County Health Facilities Authority, Florida, Hospital Revenue Bonds, BRCH Corporation Obligated Group, Refunding Series 2014: | | | | | | | | | | | | |
| | 1,000 | | | 3.000%, 12/01/16 | | | No Opt. Call | | | | BBB+ | | | | 1,012,330 | |
| | 1,000 | | | 3.000%, 12/01/17 | | | No Opt. Call | | | | BBB+ | | | | 1,028,000 | |
| | | | |
| | 1,060 | | | Pinellas County Educational Facilities Authority, Florida, General Revenue Bonds, Barry University, Refunding Series 2011, 4.000%, 10/01/16 | | | No Opt. Call | | | | BBB | | | | 1,073,716 | |
| | | | |
| | 3,505 | | | Saint Johns County School Board, Florida, Certificates of Participation, Master Lease Program, Refunding Series 2015, 5.000%, 7/01/18 | | | No Opt. Call | | | | A+ | | | | 3,822,132 | |
| | | | |
| | 215 | | | South Broward Hospital District, Florida, Hospital Revenue Bonds, Memorial Health System, Refunding Series 2006, 5.000%, 5/01/18 | | | 5/16 at 100.00 | | | | AA | | | | 215,834 | |
| | | | |
| | 575 | | | South Broward Hospital District, Florida, Hospital Revenue Bonds, Memorial Health System, Refunding Series 2006, 5.000%, 5/01/18 (Pre-refunded 5/01/16) – NPFG Insured | | | 5/16 at 100.00 | | | | AA– (4) | | | | 575,150 | |
| | | | |
| | 265 | | | Sumter County Industrial Development Authority, Florida, Hospital Revenue Bonds, Central Florida Health Alliance Projects, Series 2014A, 4.000%, 7/01/17 | | | No Opt. Call | | | | A– | | | | 273,970 | |
| | | | |
| | 1,720 | | | Sumter County Industrial Development Authority, Florida, Hospital Revenue Bonds, Central Florida Health Alliance Projects, Series 2014B, 4.000%, 7/01/18 | | | No Opt. Call | | | | A– | | | | 1,818,556 | |
| | | | |
| | 1,450 | | | Tallahassee, Florida, Health Facilities Revenue Bonds, Tallahassee Memorial HealthCare Inc. Project, Series 2016A, 5.000%, 12/01/18 | | | No Opt. Call | | | | Baa1 | | | | 1,589,432 | |
| | 24,930 | | | Total Florida | | | | | | | | | | | 26,103,665 | |
| | | | |
| | | | Georgia – 1.1% | | | | | | | | | |
| | | | |
| | 2,460 | | | Bartow County Development Authority, Georgia, Pollution Control Revenue Bonds, Georgia Power Company Plant Bowen Project, Series 1997, 2.375%, 9/01/29 (Mandatory put 8/10/17) | | | No Opt. Call | | | | A+ | | | | 2,498,228 | |
| | | | |
| | 525 | | | Burke County Development Authority, Georgia, Pollution Control Revenue Bonds, Georgia Power Company – Vogtle Plant Project, Fifth Series 1995, 1.375%, 10/01/32 (Mandatory put 4/04/17) | | | No Opt. Call | | | | A+ | | | | 526,570 | |
| | | | |
| | | | Liberty County Industrial Authority, Georgia, Revenue Bonds, Series 2014: | | | | | | | | | | | | |
| | 529 | | | 5.500%, 7/15/23 | | | 7/21 at 100.00 | | | | N/R | | | | 543,740 | |
| | 1,035 | | | 5.500%, 7/15/30 | | | 7/21 at 100.00 | | | | N/R | | | | 1,064,342 | |
| | 1,136 | | | 5.500%, 1/15/36 | | | 7/21 at 100.00 | | | | N/R | | | | 1,168,463 | |
| | | | | | | | | | | | | | | | |
Principal
Amount (000) | | | Description (1) | | Optional Call
Provisions (2) | | | Ratings (3) | | | Value | |
| | | | |
| | | | Georgia (continued) | | | | | | | | | |
| | | | |
| $ | 1,000 | | | Monroe County Development Authority, Georgia, Pollution Control Revenue Bonds, Gulf Power Company – Scherer Project, First Series 2010, 1.700%, 6/01/49 (Mandatory put 6/21/17) | | | No Opt. Call | | | | A2 | | | $ | 1,006,620 | |
| | | | |
| | 225 | | | Private Colleges and Universities Authority, Georgia, Revenue Bonds, Mercer University, Series 2012B, 4.000%, 10/01/18 | | | No Opt. Call | | | | Baa2 | | | | 239,409 | |
| | 6,910 | | | Total Georgia | | | | | | | | | | | 7,047,372 | |
| | | | |
| | | | Hawaii – 0.6% | | | | | | | | | |
| | | | |
| | 3,000 | | | Hawaii State, General Obligation Bonds, Series 2016FE, 5.000%, 10/01/21 | | | No Opt. Call | | | | AA | | | | 3,608,040 | |
| | | | |
| | | | Illinois – 6.1% | | | | | | | | | |
| | | | |
| | 1,390 | | | Arlington Heights, Illinois, General Obligation Bonds, Series 2014, 3.000%, 12/01/18 (ETM) | | | No Opt. Call | | | | Aa1 (4) | | | | 1,469,591 | |
| | | | |
| | 4,050 | | | Chicago Transit Authority, Illinois, Capital Grant Receipts Revenue Bonds, Federal Transit Administration Section 5307 Urbanized Area Formula Funds, Refunding Series 2015, 5.000%, 6/01/18 | | | No Opt. Call | | | | A | | | | 4,352,981 | |
| | | | |
| | | | Chicago, Illinois, General Airport Revenue Bonds, O’Hare International Airport, Senior Lien Series 2015B: | | | | | | | | | | | | |
| | 1,100 | | | 5.000%, 1/01/19 | | | No Opt. Call | | | | A | | | | 1,215,720 | |
| | 445 | | | 5.000%, 1/01/20 | | | No Opt. Call | | | | A | | | | 506,597 | |
| | | | |
| | 165 | | | Illinois Finance Authority, Charter School Revenue Bonds, Intrinsic Charter Schools Belmont School Project, Series 2015A, 4.500%, 12/01/20 | | | No Opt. Call | | | | N/R | | | | 166,247 | |
| | | | |
| | 2,145 | | | Illinois Finance Authority, National Rural Utilities Cooperative Finance Corporation Guaranteed Solid Waste Disposal Revenue Bonds, Prairie Power, Inc. Project, Series 2008A, 1.300%, 7/01/42 (Mandatory put 5/08/17) | | | No Opt. Call | | | | A | | | | 2,145,300 | |
| | | | |
| | | | Illinois Finance Authority, Revenue Bonds, Benedictine University Project, Series 2013A: | | | | | | | | | | | | |
| | 1,000 | | | 4.000%, 10/01/17 | | | No Opt. Call | | | | BBB | | | | 1,032,600 | |
| | 500 | | | 5.000%, 10/01/19 | | | No Opt. Call | | | | BBB | | | | 551,810 | |
| | | | |
| | 340 | | | Illinois Finance Authority, Revenue Bonds, Centegra Health System, Series 2014A, 5.000%, 9/01/19 | | | No Opt. Call | | | | BBB | | | | 374,105 | |
| | | | |
| | 225 | | | Illinois Finance Authority, Revenue Bonds, DePaul University, Refunding Series 2013, 5.000%, 10/01/17 | | | No Opt. Call | | | | A | | | | 238,550 | |
| | | | |
| | 315 | | | Illinois Finance Authority, Revenue Bonds, Illinois Institute of Technology, Series 2009, 6.250%, 2/01/19 | | | No Opt. Call | | | | Baa3 | | | | 330,955 | |
| | | | |
| | 1,095 | | | Illinois Finance Authority, Revenue Bonds, OSF Healthcare System, Series 2015A, 5.000%, 11/15/20 | | | No Opt. Call | | | | A | | | | 1,266,138 | |
| | | | |
| | 1,195 | | | Illinois Finance Authority, Revenue Bonds, Rehabilitation Institute of Chicago, Series 2013A, 5.000%, 7/01/18 | | | No Opt. Call | | | | A– | | | | 1,287,911 | |
| | | | |
| | 1,000 | | | Illinois Finance Authority, Revenue Bonds, Rush University Medical Center Obligated Group, Series 2015A, 5.000%, 11/15/19 | | | No Opt. Call | | | | A+ | | | | 1,133,800 | |
| | | | |
| | 300 | | | Illinois Finance Authority, Revenue Bonds, The Clare at Water Tower Project, Capitol Appreciation Series 2010B, 0.000%, 5/15/50 (5) | | | No Opt. Call | | | | N/R | | | | 3 | |
| | | | |
| | | | Illinois State, General Obligation Bonds, February Series 2014: | | | | | | | | | | | | |
| | 1,100 | | | 5.000%, 2/01/19 | | | No Opt. Call | | | | A– | | | | 1,189,276 | |
| | 1,275 | | | 5.000%, 2/01/20 | | | No Opt. Call | | | | A– | | | | 1,405,445 | |
| | | | |
| | 3,000 | | | Illinois State, General Obligation Bonds, January Series 2016, 5.000%, 1/01/21 | | | No Opt. Call | | | | A– | | | | 3,324,510 | |
Nuveen Short Term Municipal Bond Fund (continued)
| | |
| Portfolio of Investments | | April 30, 2016 |
| | | | | | | | | | | | | | | | |
Principal
Amount (000) | | | Description (1) | | Optional Call
Provisions (2) | | | Ratings (3) | | | Value | |
| | | | |
| | | | Illinois (continued) | | | | | | | | | |
| | | | |
| $ | 2,000 | | | Illinois State, General Obligation Bonds, May Series 2014, 5.000%, 5/01/17 | | | No Opt. Call | | | | A– | | | $ | 2,070,840 | |
| | | | |
| | 2,280 | | | Illinois State, General Obligation Bonds, Refunding Series 2012, 5.000%, 8/01/17 | | | No Opt. Call | | | | A– | | | | 2,379,066 | |
| | | | |
| | 5,905 | | | Illinois State, General Obligation Bonds, Series 2013, 4.000%, 7/01/16 | | | No Opt. Call | | | | A– | | | | 5,935,352 | |
| | | | |
| | 2,845 | | | Illinois Toll Highway Authority, Toll Highway Revenue Bonds, Senior Lien Series 2013B, 5.000%, 12/01/17 | | | No Opt. Call | | | | AA– | | | | 3,035,046 | |
| | | | |
| | | | Plano, Illinois, Special Tax Bonds, Special Service Area 1 & 2 Lakewood Springs Project, Refunding Series 2014: | | | | | | | | | | | | |
| | 475 | | | 3.000%, 3/01/17 – AGM Insured | | | No Opt. Call | | | | AA | | | | 481,683 | |
| | 505 | | | 3.000%, 3/01/18 – AGM Insured | | | No Opt. Call | | | | AA | | | | 518,746 | |
| | 535 | | | 3.000%, 3/01/19 – AGM Insured | | | No Opt. Call | | | | AA | | | | 553,896 | |
| | | | |
| | 295 | | | Quad Cities Regional Economic Development Authority, Illinois, Revenue Bonds, Augustana College, Series 2012, 3.000%, 10/01/16 | | | No Opt. Call | | | | Baa1 | | | | 297,089 | |
| | | | |
| | 1,705 | | | Regional Transportation Authority, Cook, DuPage, Kane, Lake, McHenry and Will Counties, Illinois, General Obligation Bonds, Series 2014A, 4.000%, 6/01/18 | | | No Opt. Call | | | | AA | | | | 1,817,735 | |
| | | | |
| | 360 | | | St Clair County, Illinois, Highway Revenue Bonds, Series 2013A, 5.000%, 1/01/17 | | | No Opt. Call | | | | AA– | | | | 369,940 | |
| | 37,545 | | | Total Illinois | | | | | | | | | | | 39,450,932 | |
| | | | |
| | | | Indiana – 3.5% | | | | | | | | | |
| | | | |
| | 1,045 | | | Greater Clark County School Building Corporation, Jeffersonville, Indiana, First Mortgage Bonds, Refunding Series 2014B, 5.000%, 7/15/18 | | | No Opt. Call | | | | AA+ | | | | 1,137,044 | |
| | | | |
| | 1,165 | | | Indiana Finance Authority, Hospital Revenue Bonds, Floyd Memorial Hospital and Health Services Project, Refunding Series 2010, 5.000%, 3/01/18 | | | No Opt. Call | | | | BBB– | | | | 1,219,825 | |
| | | | |
| | 920 | | | Indiana Finance Authority, Hospital Revenue Bonds, Indiana University Health Obligation Group, Refunding Series 2014A, 4.000%, 12/01/18 | | | No Opt. Call | | | | AA | | | | 994,989 | |
| | | | |
| | 1,930 | | | Indiana Finance Authority, Private Activity Bonds, Ohio River Bridges East End Crossing Project, Series 2013B, 5.000%, 1/01/19 (Alternative Minimum Tax) | | | 1/17 at 100.00 | | | | BBB+ | | | | 1,980,431 | |
| | | | |
| | 435 | | | Indiana Finance Authority, Wastewater Utility Revenue Bonds, CWA Authority Project, Series 2014A, 5.000%, 10/01/18 | | | No Opt. Call | | | | AA | | | | 477,908 | |
| | | | |
| | 1,125 | | | Indiana Health Facility Financing Authority, Revenue Bonds, Ascension Health, Series 2005A-5, 2.000%, 11/01/27 (Mandatory put 8/01/17) | | | No Opt. Call | | | | AA+ | | | | 1,140,829 | |
| | | | |
| | 3,140 | | | Indianapolis, Indiana, Gas Utility System Revenue Bonds, Refunding 2nd Lien Series 2008C, 5.000%, 6/01/17 | | | No Opt. Call | | | | AA | | | | 3,282,556 | |
| | | | |
| | 5,335 | | | IPS Multi-School Building Corporation, Indiana, First Mortgage Revenue Bonds, Series 2014, 5.000%, 7/15/18 | | | No Opt. Call | | | | AA+ | | | | 5,843,105 | |
| | | | |
| | 600 | | | Plainfield Community High School Building Corporation, Hendricks County, Indiana, Ad Valorem Property Tax First Mortgage Bonds, Refunding Series 2014, 4.000%, 1/15/18 | | | No Opt. Call | | | | AA+ | | | | 633,150 | |
| | | | |
| | 6,000 | | | Rockport, Indiana, Pollution Control Revenue Refunding Bonds, Indiana Michigan Power Company Project, Series 2009A, 1.750%, 6/01/25 (Mandatory put 6/01/18) | | | No Opt. Call | | | | Baa1 | | | | 6,039,540 | |
| | | | |
| | 285 | | | Vanderburgh County, Indiana, Redevelopment District Tax Increment Revenue bonds, Refunding Series 2014, 3.000%, 2/01/17 | | | No Opt. Call | | | | A | | | | 289,589 | |
| | 21,980 | | | Total Indiana | | | | | | | | | | | 23,038,966 | |
| | | | |
| | | | Iowa – 1.2% | | | | | | | | | |
| | | | |
| | | | Iowa Finance Authority, Healthcare Revenue Bonds, Genesis Health System, Refunding Series 2010: | | | | | | | | | | | | |
| | 1,150 | | | 5.000%, 7/01/16 | | | No Opt. Call | | | | A1 | | | | 1,159,143 | |
| | 2,520 | | | 5.000%, 7/01/20 | | | No Opt. Call | | | | A1 | | | | 2,912,414 | |
| | | | | | | | | | | | | | | | |
Principal
Amount (000) | | | Description (1) | | Optional Call
Provisions (2) | | | Ratings (3) | | | Value | |
| | | | |
| | | | Iowa (continued) | | | | | | | | | |
| | | | |
| $ | 290 | | | Iowa Finance Authority, Iowa, Midwestern Disaster Area Revenue Bonds, Iowa Fertilizer Company Project, Series 2013, 5.000%, 12/01/19 | | | No Opt. Call | | | | BB– | | | $ | 300,037 | |
| | | | |
| | 1,135 | | | Iowa Higher Education Loan Authority, Private College Facility Revenue Bonds, Drake University Project, Refunding Series 2016, 3.000%, 4/01/19 | | | No Opt. Call | | | | A– | | | | 1,198,866 | |
| | | | |
| | 1,130 | | | Johnston Community School District, Iowa, School Infrastructure Sales, Services and Use Tax Revenue Bonds, Series 2014, 5.000%, 7/01/19 – AGM Insured | | | No Opt. Call | | | | AA | | | | 1,269,261 | |
| | | | |
| | 1,090 | | | West Des Moines Community School District, Polk and Dallas Counties, Iowa, School Infrastructure Sales, Services, and Use Tax Bonds, Series 2014, 2.000%, 7/01/18 – BAM Insured | | | No Opt. Call | | | | AA | | | | 1,116,683 | |
| | 7,315 | | | Total Iowa | | | | | | | | | | | 7,956,404 | |
| | | | |
| | | | Kansas – 0.2% | | | | | | | | | |
| | | | |
| | 1,000 | | | Wichita, Kansas, Hospital Facilities Revenue Refunding and Improvement Bonds, Via Christi Health System Inc., Series 2009A-III, 5.000%, 11/15/16 (ETM) | | | No Opt. Call | | | | N/R (4) | | | | 1,024,430 | |
| | | | |
| | 500 | | | Wyandotte County/Kansas City Unified Government, Kansas, Utility System Revenue Bonds, Refunding & Improvement Series 2014A, 4.000%, 9/01/18 | | | No Opt. Call | | | | A+ | | | | 535,345 | |
| | 1,500 | | | Total Kansas | | | | | | | | | | | 1,559,775 | |
| | | | |
| | | | Kentucky – 1.8% | | | | | | | | | |
| | | | |
| | 2,950 | | | Kentucky Economic Development Finance Authority, Hospital Revenue Bonds, Baptist Healthcare System Obligated Group, Series 2009A, 5.000%, 8/15/17 | | | No Opt. Call | | | | A+ | | | | 3,087,647 | |
| | | | |
| | 2,345 | | | Kentucky Public Transportation Infrastructure Authority, First Tier Toll Revenue Bonds, Downtown Crossing Project, Series 2013A, 5.000%, 7/01/17 | | | No Opt. Call | | | | Baa3 | | | | 2,446,140 | |
| | | | |
| | 1,000 | | | Louisville Regional Airport Authority, Kentucky, Airport System Revenue Bonds, Refunding Series 2014A, 3.000%, 7/01/17 (Alternative Minimum Tax) | | | No Opt. Call | | | | A+ | | | | 1,024,430 | |
| | | | |
| | 1,155 | | | Louisville/Jefferson County Metro Government, Kentucky, Revenue Bonds, Catholic Health Initiatives, Series 2012A, 5.000%, 12/01/18 | | | No Opt. Call | | | | A+ | | | | 1,274,797 | |
| | | | |
| | 1,365 | | | Louisville-Jefferson County Metro Government, Kentucky, Mortgage Revenue Bonds, University of Louisville Papa John’s Cardinal Stadium Project, Refunding & Improvement, Series 2008A, 5.000%, 3/01/18 | | | No Opt. Call | | | | AA– | | | | 1,468,740 | |
| | | | |
| | 1,435 | | | Louisville-Jefferson County Metropolitan Government, Kentucky, Pollution Control Revenue Bonds, Louisville Gas and Electric Company Project, Series 2003A, 1.650%, 10/01/33 (Mandatory put 4/03/17) | | | No Opt. Call | | | | A1 | | | | 1,441,859 | |
| | | | |
| | 910 | | | Trimble County, Kentucky, Pollution Control Revenue Bonds, Louisville Gas and Electric Company Project, Series 2001B, 1.350%, 11/01/27 (Mandatory put 5/01/18) (Alternative Minimum Tax) | | | No Opt. Call | | | | A1 | | | | 911,647 | |
| | 11,160 | | | Total Kentucky | | | | | | | | | | | 11,655,260 | |
| | | | |
| | | | Louisiana – 2.8% | | | | | | | | | |
| | | | |
| | 315 | | | Calcasieu Parish Public Trust Authority, Louisiana, Student Lease Revenue Bonds, McNeese State University Student Housing-Cowboy Facilities, Inc. Project, Refunding Series 2011, 3.000%, 5/01/16 – AGM Insured | | | No Opt. Call | | | | A2 | | | | 315,047 | |
| | | | |
| | 700 | | | De Soto Parrish, Louisiana, Pollution Control Revenue Bonds, Southwestern Electric Power Company Project, Refunding Series 2010, 1.600%, 1/01/19 | | | No Opt. Call | | | | BBB | | | | 703,948 | |
| | | | |
| | 1,940 | | | Ernest N. Morial-New Orleans Exhibition Hall Authority, Louisiana, Special Tax Bonds, Refunding Series 2014, 5.000%, 7/15/18 | | | No Opt. Call | | | | A1 | | | | 2,110,875 | |
Nuveen Short Term Municipal Bond Fund (continued)
| | |
| Portfolio of Investments | | April 30, 2016 |
| | | | | | | | | | | | | | | | |
Principal
Amount (000) | | | Description (1) | | Optional Call
Provisions (2) | | | Ratings (3) | | | Value | |
| | | | |
| | | | Louisiana (continued) | | | | | | | | | |
| | | | |
| | | | Evangeline Parish Road & Drainage Sales Tax District 1, Louisiana, Sales and Use Tax Revenue Bonds, Series 2013: | | | | | | | | | | | | |
| $ | 250 | | | 3.000%, 12/01/16 – AGM Insured | | | No Opt. Call | | | | AA | | | $ | 253,395 | |
| | 500 | | | 3.000%, 12/01/17 – AGM Insured | | | No Opt. Call | | | | AA | | | | 517,140 | |
| | | | |
| | | | Louisiana Citizens Property Insurance Corporation, Assessment Revenue Bonds, Refunding Series 2015: | | | | | | | | | | | | |
| | 1,295 | | | 5.000%, 6/01/18 | | | No Opt. Call | | | | A1 | | | | 1,402,550 | |
| | 1,800 | | | 5.000%, 6/01/19 | | | No Opt. Call | | | | A1 | | | | 2,009,394 | |
| | 505 | | | 5.000%, 6/01/20 | | | No Opt. Call | | | | A1 | | | | 578,114 | |
| | | | |
| | 1,270 | | | Louisiana Local Government Environmental Facilities and Community Development Authority, Revenue Bonds, Southeastern Louisiana University Student Housing/University Facilities Project, Series 2013, 4.000%, 8/01/17 | | | No Opt. Call | | | | A3 | | | | 1,306,373 | |
| | | | |
| | 1,000 | | | Louisiana Local Government Environmental Facilities and Community Development Authority, Revenue Refunding Bonds, Parking Facilities Corporation – Phase I Project, Series 2012, 3.000%, 10/01/16 – AGM Insured | | | No Opt. Call | | | | AA | | | | 1,008,160 | |
| | | | |
| | 1,575 | | | Louisiana Public Facilities Authority, Revenue Bonds, Loyola University Project, Refunding Series 2011, 5.000%, 10/01/17 | | | No Opt. Call | | | | BBB+ | | | | 1,663,389 | |
| | | | |
| | | | Louisiana Public Facilities Authority, Revenue Bonds, Ochsner Clinic Foundation Project, Series 2015: | | | | | | | | | | | | |
| | 360 | | | 3.000%, 5/15/18 | | | No Opt. Call | | | | A– | | | | 372,661 | |
| | 595 | | | 4.000%, 5/15/19 | | | No Opt. Call | | | | A– | | | | 639,155 | |
| | | | |
| | | | Louisiana Stadium and Exposition District, Revenue Refunding Bonds, Senior Lien Series 2013A: | | | | | | | | | | | | |
| | 2,275 | | | 5.000%, 7/01/19 | | | No Opt. Call | | | | A | | | | 2,554,620 | |
| | 2,235 | | | 5.000%, 7/01/20 | | | No Opt. Call | | | | A | | | | 2,580,553 | |
| | 16,615 | | | Total Louisiana | | | | | | | | | | | 18,015,374 | |
| | | | |
| | | | Maine – 0.2% | | | | | | | | | |
| | | | |
| | | | Portland, Maine, General Airport Revenue Bonds, Refunding Series 2013: | | | | | | | | | | | | |
| | 500 | | | 3.000%, 7/01/16 | | | No Opt. Call | | | | BBB+ | | | | 501,860 | |
| | 535 | | | 3.000%, 7/01/17 | | | No Opt. Call | | | | BBB+ | | | | 546,486 | |
| | 1,035 | | | Total Maine | | | | | | | | | | | 1,048,346 | |
| | | | |
| | | | Maryland – 0.3% | | | | | | | | | |
| | | | |
| | 280 | | | Maryland Economic Development Corporation, Student Housing Revenue Bonds, Salisbury University Project, Refunding Series 2013, 3.000%, 6/01/16 | | | No Opt. Call | | | | Baa3 | | | | 280,414 | |
| | | | |
| | | | Maryland Health and Higher Educational Facilities Authority, Maryland, Hospital Revenue Bonds, Meritus Medical Center, Series 2015: | | | | | | | | | | | | |
| | 850 | | | 5.000%, 7/01/18 | | | No Opt. Call | | | | BBB | | | | 922,964 | |
| | 915 | | | 5.000%, 7/01/19 | | | No Opt. Call | | | | BBB | | | | 1,025,175 | |
| | 2,045 | | | Total Maryland | | | | | | | | | | | 2,228,553 | |
| | | | |
| | | | Massachusetts – 0.8% | | | | | | | | | |
| | | | |
| | 715 | | | Massachusetts Development Finance Agency, Revenue Bonds, UMass Memorial Healthcare, Refunding Series 2016I, 5.000%, 7/01/21 | | | No Opt. Call | | | | A– | | | | 835,392 | |
| | | | |
| | | | Massachusetts Educational Financing Authority, Student Loan Revenue Bonds, Issue I Series 2014: | | | | | | | | | | | | |
| | 600 | | | 4.000%, 1/01/17 (Alternative Minimum Tax) | | | No Opt. Call | | | | AA | | | | 610,434 | |
| | 1,500 | | | 4.000%, 1/01/18 (Alternative Minimum Tax) | | | No Opt. Call | | | | AA | | | | 1,562,685 | |
| | 1,255 | | | 3.000%, 1/01/19 (Alternative Minimum Tax) | | | No Opt. Call | | | | AA | | | | 1,298,097 | |
| | | | | | | | | | | | | | | | |
Principal
Amount (000) | | | Description (1) | | Optional Call
Provisions (2) | | | Ratings (3) | | | Value | |
| | | | |
| | | | Massachusetts (continued) | | | | | | | | | |
| | | | |
| $ | 1,000 | | | Massachusetts Water Pollution Abatement Trust, Pooled Loan Program Bonds, Series 2005-11, 5.250%, 8/01/18 | | | No Opt. Call | | | | AAA | | | $ | 1,102,380 | |
| | 5,070 | | | Total Massachusetts | | | | | | | | | | | 5,408,988 | |
| | | | |
| | | | Michigan – 3.3% | | | | | | | | | |
| | | | |
| | | | Brighton Area School District, Livingston County, Michigan, General Obligation Bonds, School Building & Site Series 2013II: | | | | | | | | | | | | |
| | 250 | | | 2.000%, 5/01/17 | | | No Opt. Call | | | | Aa1 | | | | 253,175 | |
| | 750 | | | 5.000%, 5/01/18 | | | No Opt. Call | | | | Aa1 | | | | 810,878 | |
| | | | |
| | 500 | | | East Lansing School District, Ingham County, Michigan, General Obligation Bonds, Refunding Series 2015, 5.000%, 5/01/18 | | | No Opt. Call | | | | AA– | | | | 540,585 | |
| | | | |
| | 1,000 | | | Livonia Public Schools, Wayne County, Michigan, General Obligation Bonds, Refunding Series 2014, 4.000%, 5/01/17 – BAM Insured | | | No Opt. Call | | | | AA | | | | 1,030,110 | |
| | | | |
| | 1,210 | | | Michigan Finance Authority, Hospital Revenue Bonds, Beaumont Health Credit Group, Refunding Series 2015A, 4.000%, 8/01/18 | | | No Opt. Call | | | | A1 | | | | 1,292,280 | |
| | | | |
| | 2,115 | | | Michigan Finance Authority, Revenue Bonds, Trinity Health Credit Group, Refunding Series 2015, 5.000%, 12/01/18 | | | No Opt. Call | | | | AA | | | | 2,340,311 | |
| | | | |
| | 2,415 | | | Michigan Hospital Finance Authority, Revenue Bonds, Ascension Health Group, Series 2010B, 5.000%, 11/15/16 | | | No Opt. Call | | | | AA+ | | | | 2,472,018 | |
| | | | |
| | 1,790 | | | Michigan Hospital Finance Authority, Revenue Bonds, Ascension Health Senior Credit Group, Refunding Series 2010F-1, 2.000%, 11/15/47 (Mandatory put 5/30/18) | | | No Opt. Call | | | | AA+ | | | | 1,825,818 | |
| | | | |
| | 1,025 | | | Michigan Hospital Finance Authority, Revenue Bonds, Ascension Health Senior Credit Group, Refunding Series 2010F-3, 1.400%, 11/15/47 (Mandatory put 6/29/18) | | | No Opt. Call | | | | AA+ | | | | 1,032,903 | |
| | | | |
| | 1,000 | | | Michigan State Hospital Finance Authority, Revenue Bonds, Trinity Health Care Group, Series 2008A-1, 6.000%, 12/01/17 | | | No Opt. Call | | | | AA | | | | 1,082,840 | |
| | | | |
| | 1,515 | | | Michigan State Trunk Line Fund Refunding Bonds, Series 2014, 5.000%, 11/15/18 | | | No Opt. Call | | | | AA+ | | | | 1,677,484 | |
| | | | |
| | 1,000 | | | Royal Oak City School District, Oakland County, Michigan, General Obligation Bonds, Refunding Series 2014, 5.000%, 5/01/18 | | | No Opt. Call | | | | Aa2 | | | | 1,083,960 | |
| | | | |
| | 200 | | | Saginaw Valley State University, Michigan, General Revenue Bonds, Refunding Series 2013A, 5.000%, 7/01/17 | | | No Opt. Call | | | | A1 | | | | 209,828 | |
| | | | |
| | | | Saginaw Valley State University, Michigan, General Revenue Bonds, Refunding Series 2016A: | | | | | | | | | | | | |
| | 1,325 | | | 5.000%, 7/01/19 | | | No Opt. Call | | | | A1 | | | | 1,484,755 | |
| | 1,000 | | | 5.000%, 7/01/20 | | | No Opt. Call | | | | A1 | | | | 1,150,650 | |
| | | | |
| | 1,000 | | | Saint Joseph Public Schools, Berrien County, Michigan, General Obligation Bonds, Refunding Series 2015, 5.000%, 5/01/18 | | | No Opt. Call | | | | AA– | | | | 1,081,170 | |
| | | | |
| | 1,600 | | | Wayne County Airport Authority, Michigan, Revenue Bonds, Detroit Metropolitan Airport, Refunding Series 2010A, 5.000%, 12/01/16 (Alternative Minimum Tax) | | | No Opt. Call | | | | A | | | | 1,636,192 | |
| | | | |
| | 690 | | | Western Michigan University, General Revenue Bonds, Refunding Series 2013, 5.000%, 11/15/17 | | | No Opt. Call | | | | A1 | | | | 734,643 | |
| | 20,385 | | | Total Michigan | | | | | | | | | | | 21,739,600 | |
| | | | |
| | | | Minnesota – 6.3% | | | | | | | | | |
| | | | |
| | | | Brainerd, Minnesota, Electric Utility Revenue Bonds, Series 2014A: | | | | | | | | | | | | |
| | 360 | | | 3.000%, 12/01/16 | | | No Opt. Call | | | | AA | | | | 364,716 | |
| | 360 | | | 3.000%, 12/01/17 | | | No Opt. Call | | | | AA | | | | 371,898 | |
| | 365 | | | 3.000%, 12/01/18 | | | No Opt. Call | | | | AA | | | | 382,808 | |
| | 380 | | | 3.000%, 12/01/20 – AGM Insured | | | No Opt. Call | | | | AA | | | | 408,888 | |
Nuveen Short Term Municipal Bond Fund (continued)
| | |
| Portfolio of Investments | | April 30, 2016 |
| | | | | | | | | | | | | | | | |
Principal
Amount (000) | | | Description (1) | | Optional Call
Provisions (2) | | | Ratings (3) | | | Value | |
| | | | |
| | | | Minnesota (continued) | | | | | | | | | |
| | | | |
| $ | 670 | | | Central Minnesota Municipal Power Agency, Revenue Bonds, Brookings – Southeast Twin Cities Transmission Project, Series 2012, 5.000%, 1/01/18 | | | No Opt. Call | | | | A2 | | | $ | 713,744 | |
| | | | |
| | 135 | | | Columbus, Minnesota, Senior Housing Revenue Bonds, Richfield Senior Housing, Inc., Refunding Series 2015, 2.000%, 1/01/18 | | | No Opt. Call | | | | N/R | | | | 135,552 | |
| | | | |
| | 3,020 | | | Farmington Independent School District 192, Dakota County, Minnesota, General Obligation Bonds, Refunding Crossover School Building Series 2014A, 4.000%, 2/01/18 | | | No Opt. Call | | | | Aa2 | | | | 3,193,922 | |
| | | | |
| | 2,090 | | | Hopkins Independent School District 270, Hennepin County, Minnesota, General Obligation Bonds, Crossover Refunding Series 2015C, 5.000%, 2/01/20 | | | No Opt. Call | | | | Aa2 | | | | 2,399,153 | |
| | | | |
| | | | Maple Grove, Minnesota, Health Care Facilities Revenue Refunding Bonds, North Memorial Health Care, Series 2015: | | | | | | | | | | | | |
| | 370 | | | 4.000%, 9/01/17 | | | No Opt. Call | | | | Baa1 | | | | 384,948 | |
| | 300 | | | 4.000%, 9/01/18 | | | No Opt. Call | | | | Baa1 | | | | 319,419 | |
| | | | |
| | 2,985 | | | Minneapolis Special School District 1, Hennepin County, Minnesota, Certificates of Participation, Refunding Series 2013D, 5.000%, 2/01/18 | | | No Opt. Call | | | | AA+ | | | | 3,208,905 | |
| | | | |
| | 2,500 | | | Minneapolis, Minnesota, Revenue Bonds, National Marrow Donor Program Project, Series 2010, 5.000%, 8/01/17 (ETM) | | | No Opt. Call | | | | BBB+ (4) | | | | 2,634,275 | |
| | | | |
| | | | Minneapolis, Minnesota, Tax Increment Revenue Bonds, Grant Park Project, Refunding Series 2015: | | | | | | | | | | | | |
| | 220 | | | 1.950%, 3/01/17 | | | No Opt. Call | | | | N/R | | | | 220,948 | |
| | 280 | | | 2.350%, 3/01/18 | | | No Opt. Call | | | | N/R | | | | 282,618 | |
| | | | |
| | | | Minneapolis, Minnesota, Tax Increment Revenue Bonds, Village at St. Anthony Falls Project, Refunding Series 2015: | | | | | | | | | | | | |
| | 490 | | | 2.000%, 3/01/17 | | | No Opt. Call | | | | N/R | | | | 491,132 | |
| | 460 | | | 2.400%, 3/01/18 | | | No Opt. Call | | | | N/R | | | | 462,305 | |
| | 605 | | | 3.000%, 3/01/20 | | | No Opt. Call | | | | N/R | | | | 611,189 | |
| | | | |
| | 600 | | | Minneapolis-St. Paul Metropolitan Airports Commission, Minnesota, Airport Revenue Bonds, Subordinate Lien, Refunding Series 2014B, 5.000%, 1/01/18 (Alternative Minimum Tax) | | | No Opt. Call | | | | A+ | | | | 639,588 | |
| | | | |
| | | | Minnesota Higher Education Facilities Authority, Revenue Bonds, Augsburg College, Series 2014-8-C: | | | | | | | | | | | | |
| | 200 | | | 1.250%, 5/01/16 | | | No Opt. Call | | | | Baa3 | | | | 200,006 | |
| | 215 | | | 1.550%, 5/01/17 | | | No Opt. Call | | | | Baa3 | | | | 215,707 | |
| | 300 | | | 2.000%, 5/01/18 | | | No Opt. Call | | | | Baa3 | | | | 302,301 | |
| | | | |
| | | | Minnesota Higher Education Facilities Authority, Revenue Bonds, Bethel University, Refunding Series 2007-6-R: | | | | | | | | | | | | |
| | 910 | | | 5.500%, 5/01/16 | | | No Opt. Call | | | | N/R | | | | 910,137 | |
| | 1,065 | | | 5.500%, 5/01/17 | | | No Opt. Call | | | | N/R | | | | 1,092,669 | |
| | | | |
| | 475 | | | Minnesota Higher Education Facilities Authority, Revenue Bonds, College of St. Benedict, Series 2016-8K, 3.000%, 3/01/20 | | | No Opt. Call | | | | Baa1 | | | | 506,246 | |
| | | | |
| | 650 | | | Minnesota Higher Education Facilities Authority, Revenue Bonds, Saint Catherine University, Refunding Series 2012-7Q, 4.000%, 10/01/16 | | | No Opt. Call | | | | Baa1 | | | | 658,288 | |
| | | | |
| | 1,140 | | | Minnesota Higher Education Facilities Authority, Revenue Bonds, University of Saint Thomas, Series 2009-7A, 4.000%, 10/01/17 | | | No Opt. Call | | | | A2 | | | | 1,192,885 | |
| | | | |
| | | | Minnesota Housing Finance Agency, Residential Housing Finance Bonds, Series 2014C: | | | | | | | | | | | | |
| | 255 | | | 1.050%, 7/01/17 (Alternative Minimum Tax) | | | No Opt. Call | | | | AA+ | | | | 255,607 | |
| | 785 | | | 1.400%, 7/01/18 (Alternative Minimum Tax) | | | No Opt. Call | | | | AA+ | | | | 788,776 | |
| | | | |
| | 3,635 | | | Minnesota State, General Obligation Bonds, Various Purpose Refunding Series 2013F, 5.000%, 10/01/18 | | | No Opt. Call | | | | AA+ | | | | 4,009,260 | |
| | | | | | | | | | | | | | | | |
Principal
Amount (000) | | | Description (1) | | Optional Call
Provisions (2) | | | Ratings (3) | | | Value | |
| | | | |
| | | | Minnesota (continued) | | | | | | | | | |
| | | | |
| $ | 1,585 | | | Northern Municipal Power Agency, Minnesota, Electric System Revenue Bonds, Refunding Series 2008A, 5.000%, 1/01/18 – AGC Insured | | | No Opt. Call | | | | AA | | | $ | 1,694,524 | |
| | | | |
| | | | Ramsey, Anoka County, Minnesota, Lease Revenue Bonds, PACT Charter School Project, Refunding Series 2013A: | | | | | | | | | | | | |
| | 320 | | | 2.500%, 12/01/16 | | | No Opt. Call | | | | BBB– | | | | 320,406 | |
| | 220 | | | 3.000%, 12/01/17 | | | No Opt. Call | | | | BBB– | | | | 222,180 | |
| | | | |
| | 990 | | | Rochester, Minnesota, Health Care Facilities Revenue Bonds, Mayo Clinic, Series 2011, 4.000%, 11/15/38 (Mandatory put 11/15/18) | | | No Opt. Call | | | | AA | | | | 1,067,359 | |
| | | | |
| | 1,295 | | | Saint Cloud Independent School District 742, Stearns County, Minnesota, General Obligation Bonds, Refunding Series 2015C, 5.000%, 2/01/20 | | | No Opt. Call | | | | Aa2 | | | | 1,484,484 | |
| | | | |
| | 295 | | | Saint Cloud, Minnesota, Charter School Lease Revenue Bonds, Stride Academy Project, Series 2016A, 3.000%, 4/01/21 | | | No Opt. Call | | | | BB– | | | | 295,086 | |
| | | | |
| | 425 | | | Saint Cloud, Minnesota, Health Care Revenue Bonds, CentraCare Health System, Refunding Series 2014B, 4.000%, 5/01/18 | | | No Opt. Call | | | | A1 | | | | 451,932 | |
| | | | |
| | 2,150 | | | Saint Louis Park, Minnesota, Health Care Facilities Revenue Bonds, Park Nicollet Health Services, Refunding Series 2009, 5.750%, 7/01/39 (Pre-refunded 7/01/19) | | | 7/19 at 100.00 | | | | Aaa | | | | 2,478,649 | |
| | | | |
| | 155 | | | Saint Paul Housing and Redevelopment Authority, Minnesota, Charter School Lease Revenue Bonds, Community of Peace Academy Project, Refunding Series 2015A, 2.750%, 12/01/20 | | | No Opt. Call | | | | BBB– | | | | 156,562 | |
| | | | |
| | 1,555 | | | Sauk Rapids Independent School District 047, Benton County, Minnesota, General Obligation Bonds, Refunding School Building Series 2015A, 5.000%, 2/01/20 | | | No Opt. Call | | | | AA+ | | | | 1,786,260 | |
| | | | |
| | 450 | | | Shakopee, Minnesota, Health Care Facilities Revenue Bonds, Saint Francis Regional Medical Center, Refunding Series 2014, 5.000%, 9/01/17 | | | No Opt. Call | | | | A | | | | 475,394 | |
| | | | |
| | | | St. Paul Housing and Redevelopment Authority, Minnesota, Hospital Revenue Bonds, HealthEast Inc., Series 2015A: | | | | | | | | | | | | |
| | 1,365 | | | 5.000%, 11/15/18 | | | No Opt. Call | | | | BBB– | | | | 1,491,181 | |
| | 1,330 | | | 5.000%, 11/15/19 | | | No Opt. Call | | | | BBB– | | | | 1,496,104 | |
| | 37,955 | | | Total Minnesota | | | | | | | | | | | 40,778,011 | |
| | | | |
| | | | Mississippi – 0.3% | | | | | | | | | |
| | | | |
| | 800 | | | Mississippi Business Finance Corporation, Solid Waste Disposal Revenue Bonds, Waste Management, Inc. Project, Series 2002, 1.375%, 3/01/27 (Mandatory put 3/01/17) (Alternative Minimum Tax) | | | No Opt. Call | | | | A– | | | | 799,192 | |
| | | | |
| | 1,000 | | | Mississippi Development Bank, Special Obligation Bonds, Municipal Energy Agency of Mississippi, Power Supply Project, Refunding Series 2015A, 5.000%, 3/01/19 – AGM Insured | | | No Opt. Call | | | | AA | | | | 1,101,220 | |
| | 1,800 | | | Total Mississippi | | | | | | | | | | | 1,900,412 | |
| | | | |
| | | | Missouri – 4.7% | | | | | | | | | |
| | | | |
| | 1,740 | | | Bi-State Development Agency of the Missouri-Illinois Metropolitan District, Mass Transit Sales Tax Appropriation Bonds, Refunding Combined Lien Series 2013A, 5.000%, 10/01/18 | | | No Opt. Call | | | | AA+ | | | | 1,920,490 | |
| | | | |
| | 1,000 | | | Boone County, Missouri, Hospital Revenue Bonds, Boone Hospital Center, Refunding Series 2012, 4.000%, 8/01/17 | | | No Opt. Call | | | | A | | | | 1,033,940 | |
| | | | |
| | 1,090 | | | Cape Girardeau County Industrial Development Authority, Missouri, Health Facilities Revenue Bonds, Saint Francis Medical Center, Series 2013A, 4.000%, 6/01/17 | | | No Opt. Call | | | | AA– | | | | 1,128,401 | |
| | | | |
| | | | Cape Girardeau County Reorganized School District R2, Missouri, Certificates of Participation, Refunding Series 2014: | | | | | | | | | | | | |
| | 200 | | | 3.000%, 4/01/17 – BAM Insured | | | No Opt. Call | | | | AA | | | | 203,662 | |
| | 300 | | | 3.000%, 4/01/18 – BAM Insured | | | No Opt. Call | | | | AA | | | | 310,461 | |
Nuveen Short Term Municipal Bond Fund (continued)
| | |
| Portfolio of Investments | | April 30, 2016 |
| | | | | | | | | | | | | | | | |
Principal
Amount (000) | | | Description (1) | | Optional Call
Provisions (2) | | | Ratings (3) | | | Value | |
| | | | |
| | | | Missouri (continued) | | | | | | | | | |
| | | | |
| $ | 1,470 | | | Chesterfield Valley Transportation Development District, Missouri, Transportation Sales Tax Revenue Bonds, Series 2015, 3.250%, 5/15/28 | | | 5/23 at 100.00 | | | | A– | | | $ | 1,517,951 | |
| | | | |
| | | | Curators of the University of Missouri, System Facilities Revenue Bonds, Series 2007A: | | | | | | | | | | | | |
| | 460 | | | 5.000%, 11/01/33 (Pre-refunded 11/01/17) | | | 11/17 at 100.00 | | | | AA+ (4) | | | | 490,130 | |
| | 180 | | | 5.000%, 11/01/35 (Pre-refunded 11/01/17) | | | 11/17 at 100.00 | | | | AA+ (4) | | | | 191,790 | |
| | | | |
| | 1,000 | | | Jackson County, Missouri, Special Obligation Bonds, Rirr Right of Way Project, Series 2016, 5.000%, 12/01/20 | | | No Opt. Call | | | | Aa3 | | | | 1,163,070 | |
| | | | |
| | 1,200 | | | Jackson County, Missouri, Special Obligation Bonds, Truman Sports Complex Project, Refunding Series 2014, 5.000%, 12/01/19 | | | No Opt. Call | | | | Aa3 | | | | 1,369,764 | |
| | | | |
| | 205 | | | Joplin Industrial Development Authority, Missouri, Revenue Bonds, Christian Homes Inc., Series 2007F, 5.500%, 5/15/17 | | | No Opt. Call | | | | BBB– | | | | 211,384 | |
| | | | |
| | | | Kansas City Industrial Development Authority, Missouri, Special Obligation Revenue Bonds, Plaza Library Project, Refunding Series 2014: | | | | | | | | | | | | |
| | 250 | | | 3.000%, 3/01/17 | | | No Opt. Call | | | | N/R | | | | 253,108 | |
| | 1,000 | | | 3.000%, 3/01/18 | | | No Opt. Call | | | | N/R | | | | 1,020,390 | |
| | | | |
| | 1,250 | | | Kansas City, Missouri, Airport Revenue Bonds, Refunding General Improvement Series 2013A, 5.000%, 9/01/17 | | | No Opt. Call | | | | A+ | | | | 1,319,988 | |
| | | | |
| | 1,300 | | | Kansas City, Missouri, Special Obligation Bonds, Kansas City Missouri Projects, Series 2016A, 5.000%, 10/01/20 | | | No Opt. Call | | | | AA– | | | | 1,505,725 | |
| | | | |
| | 4,000 | | | Missouri Environmental Improvement and Energy Resources Authority, Revenue Bonds, Kansas City Power & Light Company Project, Series 1992, 1.250%, 7/01/17 | | | No Opt. Call | | | | A | | | | 4,028,080 | |
| | | | |
| | | | Missouri Health and Educational Facilities Authority, Educational Facilities Revenue Bonds, Saint Louis College of Pharmacy, Series 2013: | | | | | | | | | | | | |
| | 360 | | | 3.000%, 5/01/16 | | | No Opt. Call | | | | BBB+ | | | | 360,047 | |
| | 995 | | | 5.000%, 5/01/17 | | | No Opt. Call | | | | BBB+ | | | | 1,032,919 | |
| | | | |
| | 495 | | | Missouri Health and Educational Facilities Authority, Educational Facilities Revenue Bonds, Southwest Baptist University Project, Series 2012, 3.000%, 10/01/16 | | | No Opt. Call | | | | BBB– | | | | 498,267 | |
| | | | |
| | 520 | | | Missouri Health and Educational Facilities Authority, Health Facilities Revenue Bonds, CoxHealth, Series 2013A, 5.000%, 11/15/17 | | | No Opt. Call | | | | A2 | | | | 552,874 | |
| | | | |
| | 555 | | | Missouri Health and Educational Facilities Authority, Health Facilities Revenue Bonds, Freeman Health System, Series 2012, 5.000%, 2/15/17 | | | No Opt. Call | | | | A– | | | | 571,977 | |
| | | | |
| | 285 | | | Missouri Health and Educational Facilities Authority, Revenue Bonds, Lutheran Senior Services Projects, Series 2014A, 4.000%, 2/01/18 | | | No Opt. Call | | | | BBB+ | | | | 298,401 | |
| | | | |
| | 1,435 | | | Missouri Health and Educational Facilities Authority, Revenue Bonds, Webster University, Series 2011, 4.000%, 4/01/17 | | | No Opt. Call | | | | A2 | | | | 1,477,576 | |
| | | | |
| | | | Plaza at Noah’s Ark Community Improvement District, Saint Charles, Missouri, Tax Increment and Improvement District Revenue Bonds, Series 2015: | | | | | | | | | | | | |
| | 780 | | | 2.500%, 5/01/18 | | | No Opt. Call | | | | N/R | | | | 788,432 | |
| | 775 | | | 2.750%, 5/01/19 | | | No Opt. Call | | | | N/R | | | | 789,291 | |
| | 500 | | | 3.000%, 5/01/20 | | | No Opt. Call | | | | N/R | | | | 513,390 | |
| | 300 | | | 3.250%, 5/01/21 | | | No Opt. Call | | | | N/R | | | | 309,876 | |
| | | | |
| | 610 | | | Raymore, Missouri, Tax Increment Revenue Bonds, Raymore Galleria Project, Refunding & Improvement Series 2014A, 3.000%, 5/01/17 | | | No Opt. Call | | | | N/R | | | | 616,405 | |
| | | | |
| | 505 | | | Saint Louis Industrial Development Authority, Missouri, Tax Increment Bonds, Southtown Redevelopment Project, Refunding Series 2015, 3.000%, 11/01/22 | | | No Opt. Call | | | | N/R | | | | 513,393 | |
| | | | |
| | 530 | | | Saint Louis Municipal Finance Corporation, Missouri, Leasehold Revenue Bonds, City Parks, Series 2014, 4.000%, 6/15/18 – AGM Insured | | | No Opt. Call | | | | AA | | | | 562,849 | |
| | | | | | | | | | | | | | | | |
Principal
Amount (000) | | | Description (1) | | Optional Call
Provisions (2) | | | Ratings (3) | | | Value | |
| | | | |
| | | | Missouri (continued) | | | | | | | | | |
| | | | |
| $ | 435 | | | Saint Louis, Missouri, Airport Revenue Bonds, Lambert-St. Louis International Airport, Refunding Series 2012, 5.000%, 7/01/17 (Alternative Minimum Tax) | | | No Opt. Call | | | | A– | | | $ | 455,589 | |
| | | | |
| | 1,135 | | | Saint Louis, Missouri, Airport Revenue Bonds, Lambert-St. Louis International Airport, Series 2005, 5.500%, 7/01/18 – NPFG Insured | | | No Opt. Call | | | | AA– | | | | 1,248,080 | |
| | | | |
| | 250 | | | St. Joseph Industrial Development Authority, Missouri, Tax Increment Bonds, Shoppes at North Village Project, Series 2005A, 5.100%, 11/01/19 | | | No Opt. Call | | | | N/R | | | | 250,245 | |
| | | | |
| | 530 | | | St. Louis County Industrial Development Authority, Missouri, Revenue Bonds, Friendship Village of Sunset Hills, Series 2012, 5.000%, 9/01/17 | | | No Opt. Call | | | | A– | | | | 553,007 | |
| | | | |
| | 1,500 | | | St. Louis County Industrial Development Authority, Missouri, Revenue Bonds, Friendship Village of Sunset Hills, Series 2013A, 2.850%, 9/01/18 | | | 9/16 at 100.00 | | | | A– | | | | 1,506,780 | |
| | 29,140 | | | Total Missouri | | | | | | | | | | | 30,567,732 | |
| | | | |
| | | | Montana – 0.3% | | | | | | | | | |
| | | | |
| | 1,740 | | | Montana Facilities Finance Authority, Revenue Bonds, Sisters of Charity of Leavenworth Health Services Corporation, Camposite Deal Series 2010B, 5.000%, 1/01/19 | | | No Opt. Call | | | | AA– | | | | 1,928,407 | |
| | | | |
| | | | Nebraska – 1.9% | | | | | | | | | |
| | | | |
| | 685 | | | Central Plains Energy Project, Nebraska, Gas Project 1 Revenue Bonds, Series 2007A, 5.250%, 12/01/21 | | | No Opt. Call | | | | A | | | | 812,109 | |
| | | | |
| | 6,180 | | | Central Plains Energy Project, Nebraska, Gas Supply Revenue Bonds, Refunding Series 2014, 5.000%, 8/01/39 (Mandatory put 12/01/19) | | | 12/19 at 100.00 | | | | Aa3 | | | | 6,996,625 | |
| | | | |
| | 770 | | | Douglas County Hospital Authority 2, Nebraska, Hospital Revenue Bonds, Madonna Rehabilitation Hospital Project, Series 2014, 4.000%, 5/15/17 | | | No Opt. Call | | | | BBB+ | | | | 794,517 | |
| | | | |
| | 1,125 | | | Nebraska Cooperative Republican Platte Enhancement, Middle Republica Natural Resources District, Platte River Flow Revenue, Series 2013, 2.000%, 12/15/16 | | | No Opt. Call | | | | A+ | | | | 1,133,955 | |
| | | | |
| | 1,000 | | | Nebraska State Colleges Facilities Corporation, Building Bonds, CSC Rangeland Center and WCS U.S. Conn Library Projects, Series 2014, 5.000%, 6/15/18 | | | No Opt. Call | | | | AA+ | | | | 1,087,350 | |
| | | | |
| | 1,235 | | | University of Nebraska Facilities Corporation, UNMC Cancer Center Bonds, Series 2014A, 4.000%, 2/15/18 | | | No Opt. Call | | | | Aa1 | | | | 1,307,198 | |
| | 10,995 | | | Total Nebraska | | | | | | | | | | | 12,131,754 | |
| | | | |
| | | | Nevada – 1.5% | | | | | | | | | |
| | | | |
| | 5,215 | | | Clark County, Nevada, Airport Revenue Bonds, Junior Lien Series 2014B, 5.000%, 7/01/18 | | | No Opt. Call | | | | A+ | | | | 5,684,506 | |
| | | | |
| | | | Henderson, Nevada, Limited Obligation Bonds, Local Improvement District T-4C Green Valley Properties, Refunding Series 2014: | | | | | | | | | | | | |
| | 1,505 | | | 4.000%, 11/01/17 | | | No Opt. Call | | | | N/R | | | | 1,573,447 | |
| | 1,055 | | | 4.000%, 11/01/18 | | | No Opt. Call | | | | N/R | | | | 1,125,020 | |
| | | | |
| | 290 | | | Las Vegas, Nevada, Local Improvement Bonds, Special Improvement District 607 Providence, Refunding Series 2013, 3.000%, 6/01/16 | | | No Opt. Call | | | | N/R | | | | 290,383 | |
| | | | |
| | 1,080 | | | Las Vegas, Nevada, Local Improvement Bonds, Special Improvement District 812 Summerlin Village 24, Series 2015, 3.500%, 12/01/19 | | | No Opt. Call | | | | N/R | | | | 1,116,558 | |
| | 9,145 | | | Total Nevada | | | | | | | | | | | 9,789,914 | |
| | | | |
| | | | New Hampshire – 0.2% | | | | | | | | | |
| | | | |
| | 1,030 | | | New Hampshire Business Finance Authority, Water Facility Revenue Bonds, Pennichuck Water Works Inc., Refunding Series 2014A, 4.000%, 1/01/18 (Alternative Minimum Tax) | | | No Opt. Call | | | | A+ | | | | 1,073,394 | |
Nuveen Short Term Municipal Bond Fund (continued)
| | |
| Portfolio of Investments | | April 30, 2016 |
| | | | | | | | | | | | | | | | |
Principal
Amount (000) | | | Description (1) | | Optional Call
Provisions (2) | | | Ratings (3) | | | Value | |
| | | | |
| | | | New Jersey – 3.7% | | | | | | | | | |
| | | | |
| | | | Camden County Improvement Authority, New Jersey, Health Care Redevelopment Revenue Bonds, Cooper Health System Obligated Group Issue, Refunding Series 2014A: | | | | | | | | | | | | |
| $ | 1,000 | | | 5.000%, 2/15/17 | | | No Opt. Call | | | | BBB+ | | | $ | 1,030,590 | |
| | 1,000 | | | 5.000%, 2/15/18 | | | No Opt. Call | | | | BBB+ | | | | 1,065,670 | |
| | | | |
| | | | Lacey Township School District, Ocean County, New Jersey, General Obligation Bonds, Refunding Series 2016: | | | | | | | | | | | | |
| | 1,585 | | | 4.000%, 4/01/19 – BAM Insured | | | No Opt. Call | | | | AA | | | | 1,711,578 | |
| | 1,665 | | | 4.000%, 4/01/20 – BAM Insured | | | No Opt. Call | | | | AA | | | | 1,828,636 | |
| | 1,330 | | | 5.000%, 4/01/21 – BAM Insured | | | No Opt. Call | | | | AA | | | | 1,545,952 | |
| | | | |
| | | | New Jersey Educational Facilities Authority, Revenue Bonds, Rider University, Series 2012A: | | | | | | | | | | | | |
| | 3,450 | | | 2.000%, 7/01/16 | | | No Opt. Call | | | | BBB | | | | 3,455,900 | |
| | 1,100 | | | 5.000%, 7/01/17 | | | No Opt. Call | | | | BBB | | | | 1,147,575 | |
| | | | |
| | 2,000 | | | New Jersey Health Care Facilities Financing Authority, Revenue Bonds, Princeton HealthCare System, Series 2016A, 5.000%, 7/01/19 | | | No Opt. Call | | | | Baa2 | | | | 2,238,820 | |
| | | | |
| | 2,000 | | | New Jersey Higher Education Assistance Authority, Student Loan Revenue Bonds, Series 2014-1A-1, 4.000%, 12/01/17 (Alternative Minimum Tax) | | | No Opt. Call | | | | AA | | | | 2,076,260 | |
| | | | |
| | | | New Jersey Transit Corporation, Grant Anticipation Notes, Federal Transit Administration Section 5307 Urbanized Area Formula Funds, Series 2014A: | | | | | | | | | | | | |
| | 1,575 | | | 5.000%, 9/15/17 | | | No Opt. Call | | | | A | | | | 1,647,986 | |
| | 2,000 | | | 5.000%, 9/15/18 | | | No Opt. Call | | | | A | | | | 2,149,900 | |
| | | | |
| | 3,100 | | | New Jersey Transportation Trust Fund Authority, Transportation System Bonds, Series 2010D, 5.000%, 12/15/18 | | | No Opt. Call | | | | A– | | | | 3,331,787 | |
| | | | |
| | | | Tobacco Settlement Financing Corporation, New Jersey, Tobacco Settlement Asset-Backed Bonds, Series 2007-1A: | | | | | | | | | | | | |
| | 945 | | | 4.500%, 6/01/23 | | | 6/17 at 100.00 | | | | BB | | | | 961,575 | |
| | 110 | | | 4.625%, 6/01/26 | | | 6/17 at 100.00 | | | | B+ | | | | 110,876 | |
| | 22,860 | | | Total New Jersey | | | | | | | | | | | 24,303,105 | |
| | | | |
| | | | New Mexico – 0.9% | | | | | | | | | |
| | | | |
| | 5,030 | | | New Mexico Municipal Energy Acquisition Authority, Gas Supply Revenue Bonds, Refunding Sub-Series 2014A, 5.000%, 11/01/39 (Mandatory put 8/01/19) | | | 8/19 at 100.00 | | | | Aa3 | | | | 5,614,687 | |
| | | | |
| | | | New York – 9.4% | | | | | | | | | |
| | | | |
| | 1,135 | | | Buffalo and Erie County Industrial Land Development Corporation, New York, Revenue Bonds, Catholic Health System, Inc. Project, Series 2015, 5.000%, 7/01/18 | | | No Opt. Call | | | | BBB+ | | | | 1,229,103 | |
| | | | |
| | 380 | | | Build New York City Resource Corporation, New York, Revenue Bonds, Bronx Charter School for Excellence, Series 2013A, 3.000%, 4/01/18 | | | No Opt. Call | | | | BBB– | | | | 383,397 | |
| | | | |
| | 5,000 | | | Chautauqua County Capital Resource Corporation, New York, Multi-Mode Revenue Bonds, Jamestown Center City Development Corporation Project, Guaranteed by the Gebbie Foundation, Series 2013D, 1.350%, 11/01/31 (Mandatory put 11/01/17) | | | No Opt. Call | | | | AA– | | | | 5,015,100 | |
| | | | |
| | 1,300 | | | Dormitory Authority of the State of New York, Insured Revenue Bonds, Pace University, Series 2013A, 4.000%, 5/01/16 | | | No Opt. Call | | | | BB+ | | | | 1,300,182 | |
| | | | |
| | 1,375 | | | Dormitory Authority of the State of New York, Revenue Bonds, NYU Hospitals Center, Series 2015, 5.000%, 7/01/18 | | | No Opt. Call | | | | A– | | | | 1,497,691 | |
| | | | |
| | 1,435 | | | Dormitory Authority of the State of New York, School Districts Financing Program Revenue Bonds, Series 2014A, 5.000%, 10/01/18 – AGM Insured | | | No Opt. Call | | | | AA | | | | 1,579,103 | |
| | | | |
| | 2,545 | | | Dormitory Authority of the State of New York, State Personal Income Tax Revenue Bonds, General Purpose Series 2012B, 5.000%, 3/15/18 | | | No Opt. Call | | | | AAA | | | | 2,750,458 | |
| | | | | | | | | | | | | | | | |
Principal
Amount (000) | | | Description (1) | | Optional Call
Provisions (2) | | | Ratings (3) | | | Value | |
| | | | |
| | | | New York (continued) | | | | | | | | | |
| | | | |
| $ | 4,015 | | | Dormitory Authority of the State of New York, State Personal Income Tax Revenue Bonds, General Purpose Series 2014A, 5.000%, 2/15/19 | | | No Opt. Call | | | | AAA | | | $ | 4,480,620 | |
| | | | |
| | 575 | | | Nassau County Local Economic Assistance Corporation, New York, Revenue Bonds, Catholic Health Services of Long Island Obligated Group Project, Series 2014, 3.000%, 7/01/17 | | | No Opt. Call | | | | BBB+ | | | | 588,536 | |
| | | | |
| | 5,000 | | | New York City Industrial Development Agency, New York, Special Facilities Revenue Bonds, JFK Airport – American Airlines Inc., Series 2002B, 2.000%, 8/01/28 (Mandatory put 8/01/16) (Alternative Minimum Tax) | | | No Opt. Call | | | | N/R | | | | 5,010,000 | |
| | | | |
| | 2,000 | | | New York City Transitional Finance Authority, New York, Future Tax Secured Bonds, Subordinate Fiscal 2014 Series B-1, 5.000%, 11/01/18 | | | No Opt. Call | | | | AAA | | | | 2,213,040 | |
| | | | |
| | 8,315 | | | New York City, New York, General Obligation Bonds, Fiscal 2014 Series G, 5.000%, 8/01/17 | | | No Opt. Call | | | | AA | | | | 8,768,583 | |
| | | | |
| | 2,000 | | | New York City, New York, General Obligation Bonds, Fiscal 2014 Series J, 5.000%, 8/01/18 | | | No Opt. Call | | | | AA | | | | 2,189,340 | |
| | | | |
| | 1,765 | | | New York State Energy Research and Development Authority, Pollution Control Revenue Bonds, New York State Electric and Gas Corporation, Series 1994B, 2.000%, 2/01/29 (Mandatory put 5/01/20) | | | No Opt. Call | | | | A3 | | | | 1,801,730 | |
| | | | |
| | 2,500 | | | New York State Environmental Facilities Corporation, State Clean Water and Drinking Water Revolving Funds Revenue Bonds, New York City Municipal Water Finance Authority Projects, Second Resolution Series 2013A, 5.000%, 6/15/17 | | | No Opt. Call | | | | AAA | | | | 2,626,425 | |
| | | | |
| | 1,960 | | | New York State Thruway Authority, General Revenue Junior Indebtedness Obligations, Series 2013A, 5.000%, 5/01/19 | | | No Opt. Call | | | | A– | | | | 2,197,160 | |
| | | | |
| | | | Niagara Falls, New York, General Obligation Bonds, Series 2014: | | | | | | | | | | | | |
| | 1,000 | | | 2.000%, 3/01/17 – AGM Insured | | | No Opt. Call | | | | AA | | | | 1,008,830 | |
| | 620 | | | 2.000%, 3/01/18 – AGM Insured | | | No Opt. Call | | | | AA | | | | 630,174 | |
| | | | |
| | 1,150 | | | Niagara Frontier Transportation Authority, New York, Airport Revenue Bonds, Buffalo International Airport, Series 2014A, 4.000%, 4/01/17 (Alternative Minimum Tax) | | | No Opt. Call | | | | Baa1 | | | | 1,179,486 | |
| | | | |
| | 6,000 | | | Port Authority of New York and New Jersey, Consolidated Revenue Bonds, One Hundred Eighty-Sixth Series 2014, 5.000%, 10/15/18 (Alternative Minimum Tax) | | | No Opt. Call | | | | AA– | | | | 6,593,340 | |
| | | | |
| | 3,500 | | | Port Authority of New York and New Jersey, Consolidated Revenue Bonds, One Hundred Seventy Eighth Series 2013, 5.000%, 12/01/17 (Alternative Minimum Tax) | | | No Opt. Call | | | | AA– | | | | 3,729,950 | |
| | | | |
| | 1,125 | | | Rockland County, New York, General Obligation Bonds, Series 2014A, 5.000%, 3/01/17 – AGM Insured | | | No Opt. Call | | | | AA | | | | 1,162,778 | |
| | | | |
| | 495 | | | Schenectady County Capital Resource Corporation, New York, FHA insured Mortgage Revenue Bonds, Ellis Hospital Project, Refunding Series 2012, 1.750%, 2/15/18 – AGM Insured | | | No Opt. Call | | | | AA+ | | | | 494,985 | |
| | | | |
| | 565 | | | Suffolk County Economic Development Corporation, New York, Revenue Bonds, Catholic Health Services of Long Island Obligated Group Project, Refunding Series 2011, 5.000%, 7/01/18 | | | No Opt. Call | | | | BBB+ | | | | 613,624 | |
| | | | |
| | 1,880 | | | Troy Capital Resource Corporation, New York, Revenue Bonds, Rensselaer Polytechnic Institute, Series 2015, 4.000%, 8/01/19 | | | No Opt. Call | | | | A– | | | | 2,053,110 | |
| | 57,635 | | | Total New York | | | | | | | | | | | 61,096,745 | |
| | | | |
| | | | North Dakota – 0.6% | | | | | | | | | |
| | | | |
| | 3,040 | | | Fargo, North Dakota, Health System Revenue Bonds, Sanford Health, Refunding Series 2011, 3.500%, 11/01/16 | | | No Opt. Call | | | | A+ | | | | 3,085,114 | |
| | | | |
| | 505 | | | Williston, North Dakota, Sales Tax Revenue Bonds, Series 2013A, 3.000%, 5/01/16 – AGM Insured | | | No Opt. Call | | | | AA | | | | 505,071 | |
| | 3,545 | | | Total North Dakota | | | | | | | | | | | 3,590,185 | |
Nuveen Short Term Municipal Bond Fund (continued)
| | |
| Portfolio of Investments | | April 30, 2016 |
| | | | | | | | | | | | | | | | |
Principal
Amount (000) | | | Description (1) | | Optional Call
Provisions (2) | | | Ratings (3) | | | Value | |
| | | | |
| | | | Ohio – 2.0% | | | | | | | | | |
| | | | |
| $ | 375 | | | Hamilton County, Ohio, Hospital Facilities Revenue Bonds, UC Health, Series 2014, 4.000%, 2/01/17 | | | No Opt. Call | | | | A | | | $ | 383,918 | |
| | | | |
| | 685 | | | Ohio Air Quality Development Authority, Ohio, Pollution Control Revenue Refunding Bonds, FirstEnergy Generation Corp. Project, Series 2006A, 3.750%, 12/01/23 (Mandatory put 12/03/18) | | | No Opt. Call | | | | BBB– | | | | 708,112 | |
| | | | |
| | 7,005 | | | Ohio Air Quality Development Authority, Ohio, Pollution Control Revenue Refunding Bonds, FirstEnergy Generation Corp. Project, Series 2009D, 2.250%, 8/01/29 (Mandatory put 9/15/16) | | | No Opt. Call | | | | BBB– | | | | 7,030,989 | |
| | | | |
| | 420 | | | Ohio Higher Education Facilities Commission, Revenue Bonds, John Carroll University, Series 2014, 2.250%, 9/01/33 (Mandatory put 9/01/18) | | | No Opt. Call | | | | A3 | | | | 428,568 | |
| | | | |
| | 1,000 | | | Ohio State Higher Educational Facility Commission, Higher Education Facility Revenue Bonds, Xavier University 2008C, 5.000%, 5/01/18 (ETM) | | | No Opt. Call | | | | A3 (4) | | | | 1,085,460 | |
| | | | |
| | 1,715 | | | Ohio State, Capital Facilities Lease-Appropriation Bonds, Cultural & Sports Facilities Building Fund Projects, Series 2013B, 5.000%, 4/01/18 | | | No Opt. Call | | | | AA | | | | 1,855,201 | |
| | | | |
| | 1,230 | | | University of Toledo, Ohio, General Receipts Bonds, Refunding Series 2010, 5.000%, 6/01/18 | | | No Opt. Call | | | | A1 | | | | 1,331,438 | |
| | 12,430 | | | Total Ohio | | | | | | | | | | | 12,823,686 | |
| | | | |
| | | | Oklahoma – 2.3% | | | | | | | | | |
| | | | |
| | 1,000 | | | Canadian County Educational Facilities Authority, Oklahoma, Educational Facilities Lease Revenue Bonds, Mustang Public Schools Project, Series 2012, 4.000%, 9/01/18 | | | No Opt. Call | | | | A+ | | | | 1,067,560 | |
| | | | |
| | 2,765 | | | Canadian County Independent School District 69, Mustang, Oklahoma, General Obligation Bond, Combined Purpose Series 2014, 2.000%, 6/01/18 | | | No Opt. Call | | | | AA– | | | | 2,824,226 | |
| | | | |
| | 895 | | | Cleveland County Educational Facilities Authority, Oklahoma, Educational Facilities Lease Revenue Bonds, Moore Public Schools Project, Series 2013, 5.000%, 6/01/16 | | | No Opt. Call | | | | A+ | | | | 898,661 | |
| | | | |
| | 1,005 | | | Cleveland County Educational Facilities Authority, Oklahoma, Educational Facilities Lease Revenue Bonds, Moore Public Schools Project, Series 2016, 5.000%, 6/01/20 | | | No Opt. Call | | | | A+ | | | | 1,147,630 | |
| | | | |
| | 1,000 | | | Edmond Public Works Authority, Oklahoma, Sales Tax and Utility Systems Revenue Bonds, Series 2014, 5.000%, 7/01/18 | | | No Opt. Call | | | | AA– | | | | 1,088,210 | |
| | | | |
| | 1,070 | | | Oklahoma Development Finance Authority, Health System Revenue Bonds, Integris Baptist Medical Center, Refunding Series 2015A, 5.000%, 8/15/18 | | | No Opt. Call | | | | AA– | | | | 1,174,732 | |
| | | | |
| | | | Tulsa Airports Improvement Trust, Oklahoma, General Airport Revenue Bonds, Refunding Series 2015B: | | | | | | | | | | | | |
| | 550 | | | 4.000%, 6/01/17 – BAM Insured (Alternative Minimum Tax) | | | No Opt. Call | | | | AA | | | | 566,060 | |
| | 860 | | | 4.000%, 6/01/18 – BAM Insured (Alternative Minimum Tax) | | | No Opt. Call | | | | AA | | | | 904,677 | |
| | 1,000 | | | 5.000%, 6/01/20 – BAM Insured | | | No Opt. Call | | | | AA | | | | 1,135,520 | |
| | | | |
| | | | Tulsa Airports Improvement Trust, Oklahoma, General Airport Revenue Bonds, Series 2015A: | | | | | | | | | | | | |
| | 525 | | | 4.000%, 6/01/17 – BAM Insured (Alternative Minimum Tax) | | | No Opt. Call | | | | AA | | | | 540,330 | |
| | 1,200 | | | 4.000%, 6/01/18 – BAM Insured (Alternative Minimum Tax) | | | No Opt. Call | | | | AA | | | | 1,262,340 | |
| | | | |
| | 2,000 | | | Tulsa County Independent School District 11 Owasso, Oklahoma, General Obligation Bonds, Combined Purpose Series 2014, 2.000%, 6/01/18 | | | No Opt. Call | | | | AA– | | | | 2,046,600 | |
| | 13,870 | | | Total Oklahoma | | | | | | | | | | | 14,656,546 | |
| | | | |
| | | | Oregon – 0.9% | | | | | | | | | |
| | | | |
| | 1,000 | | | Emerald Peoples Utility District, Oregon, Electric System Revenue Bonds, Refunding Series 2013, 3.000%, 11/01/16 | | | No Opt. Call | | | | A1 | | | | 1,011,020 | |
| | | | |
| | 2,295 | | | Multnomah County School District 1J, Portland, Oregon, General Obligation Bonds, Series 2013B, 5.000%, 6/15/20 | | | No Opt. Call | | | | Aa1 | | | | 2,669,774 | |
| | | | | | | | | | | | | | | | |
Principal
Amount (000) | | | Description (1) | | Optional Call
Provisions (2) | | | Ratings (3) | | | Value | |
| | | | |
| | | | Oregon (continued) | | | | | | | | | |
| | | | |
| $ | 1,930 | | | Port of Portland, Oregon, International Airport Revenue Bonds, Series 2011-21, 5.000%, 7/01/17 (Alternative Minimum Tax) | | | No Opt. Call | | | | AA– | | | $ | 2,025,303 | |
| | 5,225 | | | Total Oregon | | | | | | | | | | | 5,706,097 | |
| | | | |
| | | | Pennsylvania – 4.7% | | | | | | | | | |
| | | | |
| | 1,115 | | | Corry Area School District, Erie County, Pennsylvania, General Obligation Bonds, Refunding Series 2014, 3.000%, 12/15/18 | | | No Opt. Call | | | | AA | | | | 1,176,091 | |
| | | | |
| | 500 | | | East Hempfield Township Industrial Development Authority, Pennsylvania, Revenue Bonds, Willow Valley Communities Project, Refunding Series 2016, 4.000%, 12/01/18 | | | No Opt. Call | | | | A | | | | 536,305 | |
| | | | |
| | | | East Hempfield Township Industrial Development Authority, Pennsylvania, Student Services Inc – Student Housing Project at Millersville University, Series 2014: | | | | | | | | | | | | |
| | 300 | | | 2.000%, 7/01/17 | | | No Opt. Call | | | | BBB– | | | | 300,273 | |
| | 500 | | | 2.250%, 7/01/18 | | | No Opt. Call | | | | BBB– | | | | 501,900 | |
| | | | |
| | 350 | | | Economy Municipal Authority, Pennsylvania, Sewer Revenue Bonds, Refunding Series 2013, 3.000%, 12/15/17 | | | No Opt. Call | | | | AA | | | | 361,470 | |
| | | | |
| | | | Indiana County Hospital Authority, Pennsylvania, Hospital Revenue Bonds, Indiana Regional Medical Center, Series 2014A: | | | | | | | | | | | | |
| | 360 | | | 4.000%, 6/01/16 | | | No Opt. Call | | | | Ba1 | | | | 360,803 | |
| | 185 | | | 4.000%, 6/01/17 | | | No Opt. Call | | | | Ba1 | | | | 189,135 | |
| | 250 | | | 4.000%, 6/01/18 | | | No Opt. Call | | | | Ba1 | | | | 259,975 | |
| | | | |
| | | | Lancaster Industrial Development Authority, Pennsylvania, Revenue Bonds, Garden Spot Village Project, Series 2013: | | | | | | | | | | | | |
| | 300 | | | 5.000%, 5/01/16 | | | No Opt. Call | | | | BBB | | | | 300,060 | |
| | 1,000 | | | 5.000%, 5/01/18 | | | No Opt. Call | | | | BBB | | | | 1,050,980 | |
| | | | |
| | 1,000 | | | Manheim Township School District, Lancaster County, Pennsylvania, General Obligation Bonds, Libor Index Rate Mode, Series 2014A, 0.695%, 5/01/25 (Mandatory put 5/01/18) | | | 11/17 at 100.00 | | | | Aa3 | | | | 988,800 | |
| | | | |
| | 470 | | | Pennsylvania Higher Educational Facilities Authority, Revenue Bonds, AICUP Financing Program-Delaware Valley College of Science and Agriculture Project, Series 2012 LL1, 4.000%, 11/01/16 | | | No Opt. Call | | | | Baa3 | | | | 473,990 | |
| | | | |
| | 825 | | | Pennsylvania Higher Educational Facilities Authority, Revenue Bonds, Widener University, Series 2013A, 5.000%, 7/15/17 | | | No Opt. Call | | | | A– | | | | 865,202 | |
| | | | |
| | 400 | | | Pennsylvania Higher Educational Facilities Authority, Revenue Bonds, Widener University, Series 2014, 4.000%, 7/15/17 | | | No Opt. Call | | | | A– | | | | 414,616 | |
| | | | |
| | | | Pennsylvania Higher Educational Facilities Authority, Revenue Refunding Bonds, Lock Haven University Foundation Student Housing Project, Series 2013A: | | | | | | | | | | | | |
| | 540 | | | 3.000%, 7/01/16 | | | No Opt. Call | | | | BBB– | | | | 540,686 | |
| | 640 | | | 3.000%, 7/01/17 | | | No Opt. Call | | | | BBB– | | | | 645,734 | |
| | | | |
| | 5,045 | | | Pennsylvania Turnpike Commission, Turnpike Revenue Bonds, Refunding Subordinate Series 2016, 5.000%, 6/01/21 | | | No Opt. Call | | | | A3 | | | | 5,927,673 | |
| | | | |
| | 1,350 | | | Philadelphia Authority for Industrial Development, Pennsylvania, Lease Revenue Bonds, Refunding Series 2014B, 4.000%, 10/01/17 | | | No Opt. Call | | | | A+ | | | | 1,411,061 | |
| | | | |
| | 1,070 | | | Philadelphia Gas Works, Pennsylvania, Revenue Bonds, General Ordinance, Eighth Series 2009A, 5.000%, 8/01/16 | | | No Opt. Call | | | | A– | | | | 1,082,038 | |
| | | | |
| | | | Pittsburgh Public Parking Authority, Pennsylvania, Parking System Revenue Bonds, Refunding Series 2015A: | | | | | | | | | | | | |
| | 620 | | | 4.000%, 12/01/18 | | | No Opt. Call | | | | A+ | | | | 667,219 | |
| | 1,515 | | | 5.000%, 12/01/19 | | | No Opt. Call | | | | A+ | | | | 1,710,238 | |
Nuveen Short Term Municipal Bond Fund (continued)
| | |
| Portfolio of Investments | | April 30, 2016 |
| | | | | | | | | | | | | | | | |
Principal
Amount (000) | | | Description (1) | | Optional Call
Provisions (2) | | | Ratings (3) | | | Value | |
| | | | |
| | | | Pennsylvania (continued) | | | | | | | | | |
| | | | |
| $ | 1,275 | | | Pittsburgh School District, Allegheny County, Pennsylvania, General Obligation Bonds, Series 2014B, 4.000%, 9/01/18 – BAM Insured | | | No Opt. Call | | | | AA | | | $ | 1,366,048 | |
| | | | |
| | 2,760 | | | Pittsburgh School District, Allegheny County, Pennsylvania, General Obligation Refunding Bonds, Series 2002A, 5.500%, 9/01/18 – AGM Insured | | | No Opt. Call | | | | AA | | | | 3,041,851 | |
| | | | |
| | 1,080 | | | Pittsburgh, Pennsylvania, General Obligation Bonds, Refunding Series 2014B, 5.000%, 9/01/18 | | | No Opt. Call | | | | A+ | | | | 1,182,319 | |
| | | | |
| | 635 | | | Pittsburgh, Pennsylvania, General Obligation Bonds, Series 2012A, 5.000%, 9/01/19 | | | No Opt. Call | | | | A+ | | | | 717,664 | |
| | | | |
| | 430 | | | Southcentral Pennsylvania General Authority, Revenue Bonds, Wellspan Health Obligated Group, Refunding Series 2014A, 5.000%, 6/01/18 | | | No Opt. Call | | | | Aa3 | | | | 466,602 | |
| | | | |
| | | | State Public School Building Authority, Pennsylvania, College Revenue Bonds, Harrisburg Area Community College Project, Series 2014B2: | | | | | | | | | | | | |
| | 1,105 | | | 3.000%, 10/01/17 | | | No Opt. Call | | | | AA | | | | 1,134,780 | |
| | 1,255 | | | 4.000%, 10/01/18 | | | No Opt. Call | | | | AA | | | | 1,338,470 | |
| | | | |
| | 1,440 | | | Union County Hospital Authority, Pennsylvania, Hospital Revenue Bonds, Evangelical Community Hospital Project, Refunding and Improvement Series 2011, 4.250%, 8/01/16 | | | No Opt. Call | | | | A– | | | | 1,448,366 | |
| | 28,315 | | | Total Pennsylvania | | | | | | | | | | | 30,460,349 | |
| | | | |
| | | | Rhode Island – 0.4% | | | | | | | | | |
| | | | |
| | 270 | | | Rhode Island Health and Educational Building Corporation, Higher Education Facility Revenue Refunding Bonds, University of Rhode Island General Revenue Bonds, Series 2013A, 3.000%, 9/15/16 | | | No Opt. Call | | | | Aa3 | | | | 272,268 | |
| | | | |
| | | | Rhode Island Health and Educational Building Corporation, Higher Education Facility Revenue Bonds, Board of Education Auxiliary Enterprise, Refunding Series 2013D: | | | | | | | | | | | | |
| | 650 | | | 5.000%, 9/15/16 | | | No Opt. Call | | | | A2 | | | | 660,205 | |
| | 1,020 | | | 5.000%, 9/15/17 | | | No Opt. Call | | | | A2 | | | | 1,075,957 | |
| | | | |
| | | | Rhode Island Health and Educational Building Corporation, Higher Education Facility Revenue Bonds, Board of Education Educational & General, Refunding Series 2013B: | | | | | | | | | | | | |
| | 250 | | | 3.000%, 9/15/16 | | | No Opt. Call | | | | A1 | | | | 252,043 | |
| | 555 | | | 3.000%, 9/15/17 | | | No Opt. Call | | | | A1 | | | | 570,451 | |
| | 2,745 | | | Total Rhode Island | | | | | | | | | | | 2,830,924 | |
| | | | |
| | | | South Carolina – 0.5% | | | | | | | | | |
| | | | |
| | 2,390 | | | Charleston County, South Carolina, General Obligation Bonds, Refunding Series 2014A, 5.000%, 6/01/18 | | | No Opt. Call | | | | AAA | | | | 2,607,251 | |
| | | | |
| | 1,060 | | | South Carolina Jobs-Economic Development Authority, Hospital Revenue Bonds, Palmetto Health, Refunding Series 2013A, 5.000%, 8/01/16 | | | No Opt. Call | | | | BBB+ | | | | 1,071,225 | |
| | 3,450 | | | Total South Carolina | | | | | | | | | | | 3,678,476 | |
| | | | |
| | | | South Dakota – 0.7% | | | | | | | | | |
| | | | |
| | 1,515 | | | Sioux Falls School District 49-5, Minnehaha and Lincoln Counties, South Dakota, General Obligation Bonds, Refunding Certificate Series 2012, 4.000%, 1/01/18 | | | No Opt. Call | | | | AA– | | | | 1,597,431 | |
| | | | |
| | 525 | | | South Dakota Health and Educational Facilities Authority, Revenue Bonds, Sanford Health, Series 2014B, 3.000%, 11/01/18 | | | No Opt. Call | | | | A+ | | | | 552,584 | |
| | | | |
| | 485 | | | South Dakota Health and Educational Facilities Authority, Revenue Bonds, Sanford Health, Series 2015, 5.000%, 11/01/19 | | | No Opt. Call | | | | A+ | | | | 549,418 | |
| | | | |
| | 730 | | | South Dakota Health and Educational Facilities Authority, Revenue Bonds, Westhills Village Retirement Community, Series 2012, 3.500%, 9/01/16 | | | No Opt. Call | | | | A+ | | | | 735,190 | |
| | | | | | | | | | | | | | | | |
Principal
Amount (000) | | | Description (1) | | Optional Call
Provisions (2) | | | Ratings (3) | | | Value | |
| | | | |
| | | | South Dakota (continued) | | | | | | | | | |
| | | | |
| $ | 1,125 | | | South Dakota Housing Development Authority, Multiple Purpose Revenue Bonds, Series 2013A, 1.600%, 5/01/18 | | | No Opt. Call | | | | Aa3 | | | $ | 1,136,655 | |
| | 4,380 | | | Total South Dakota | | | | | | | | | | | 4,571,278 | |
| | | | |
| | | | Tennessee – 1.4% | | | | | | | | | |
| | | | |
| | 1,000 | | | Memphis-Shelby County Airport Authority, Tennessee, Airport Revenue Bonds, Series 2010B, 5.000%, 7/01/16 (Alternative Minimum Tax) | | | No Opt. Call | | | | A | | | | 1,007,340 | |
| | | | |
| | 1,290 | | | Memphis-Shelby County Sports Authority, Tennessee, Revenue Bonds, Memphis Arena, Refunding Series 2009B, 5.500%, 11/01/20 | | | 11/19 at 100.00 | | | | AA– | | | | 1,480,972 | |
| | | | |
| | 1,000 | | | Metropolitan Government of Nashville-Davidson County Health and Educational Facilities Board, Tennessee, Revenue Bonds, Belmont University Project, Series 2012, 3.000%, 11/01/16 | | | No Opt. Call | | | | BBB+ | | | | 1,009,410 | |
| | | | |
| | 700 | | | Metropolitan Government of Nashville-Davidson County, Tennessee, Electric System Revenue Bonds, Series 2014A, 5.000%, 5/15/18 | | | No Opt. Call | | | | AA+ | | | | 761,215 | |
| | | | |
| | 1,500 | | | Metropolitan Government of Nashville-Davidson County, Tennessee, Exempt Facilities Revenue Bonds, Waste Management Inc., Series 2001, 1.500%, 8/01/31 (Mandatory put 8/01/17) (Alternative Minimum Tax) | | | 8/16 at 102.00 | | | | A– | | | | 1,501,545 | |
| | | | |
| | 1,800 | | | Metropolitan Nashville Airport Authority, Tennessee, Airport Revenue Bonds, Refunding & Improvement Series 2010A, 5.000%, 7/01/16 | | | No Opt. Call | | | | A+ | | | | 1,814,094 | |
| | | | |
| | 1,710 | | | Shelby County Health, Educational and Housing Facilities Board, Tennessee, Revenue Bonds, Methodist Healthcare, Series 2004, 5.000%, 9/01/17 – AGM Insured | | | No Opt. Call | | | | AA | | | | 1,807,436 | |
| | 9,000 | | | Total Tennessee | | | | | | | | | | | 9,382,012 | |
| | | | |
| | | | Texas – 4.9% | | | | | | | | | |
| | | | |
| | 5,720 | | | Brazosport Independent School District, Brazoria County, Texas, General Obligation Bonds, School Building Series 2015, 5.000%, 2/15/20 | | | No Opt. Call | | | | Aaa | | | | 6,580,174 | |
| | | | |
| | 1,000 | | | Corpus Christi Business and Job Development Corporation, Texas, Sales Tax Revenue Bonds, Arena Project, Refunding Series 2014, 4.000%, 9/01/18 | | | No Opt. Call | | | | AA– | | | | 1,068,280 | |
| | | | |
| | 1,000 | | | Dallas-Fort Worth International Airport, Texas, Joint Revenue Bonds, Refunding Series 2009A, 5.000%, 11/01/21 | | | 11/16 at 100.00 | | | | A+ | | | | 1,023,660 | |
| | | | |
| | 3,000 | | | Dallas-Fort Worth International Airport, Texas, Joint Revenue Bonds, Refunding Series 2013E, 5.000%, 11/01/16 (Alternative Minimum Tax) | | | No Opt. Call | | | | A+ | | | | 3,067,230 | |
| | | | |
| | 1,525 | | | Dallas-Fort Worth International Airport, Texas, Joint Revenue Bonds, Refunding Series 2014D, 5.000%, 11/01/18 (Alternative Minimum Tax) | | | No Opt. Call | | | | A+ | | | | 1,676,356 | |
| | | | |
| | 645 | | | Harris County Cultural Education Facilities Finance Corporation, Texas, Hospital Revenue Bonds, Memorial Hermann Healthcare System, Series 2014A, 5.000%, 12/01/17 | | | No Opt. Call | | | | A+ | | | | 688,267 | |
| | | | |
| | 800 | | | Harris County Cultural Education Facilities Finance Corporation, Texas, Revenue Refunding Bonds, Young Men’s Christian Association of the Greater Houston Area, Series 2013A, 5.000%, 6/01/17 | | | No Opt. Call | | | | Baa3 | | | | 829,912 | |
| | | | |
| | | | Harris County-Houston Sports Authority, Texas, Revenue Bonds, Refunding Second Lien Series 2014C: | | | | | | | | | | | | |
| | 590 | | | 4.000%, 11/15/17 | | | No Opt. Call | | | | A3 | | | | 616,503 | |
| | 2,415 | | | 4.000%, 11/15/18 | | | No Opt. Call | | | | A3 | | | | 2,583,156 | |
| | | | |
| | 2,260 | | | Houston Independent School District, Harris County, Texas, General Obligation Bonds, Refunding Schoolhouse Series 2016A, 5.000%, 2/15/21 | | | No Opt. Call | | | | AAA | | | | 2,670,506 | |
Nuveen Short Term Municipal Bond Fund (continued)
| | |
| Portfolio of Investments | | April 30, 2016 |
| | | | | | | | | | | | | | | | |
Principal
Amount (000) | | | Description (1) | | Optional Call
Provisions (2) | | | Ratings (3) | | | Value | |
| | | | |
| | | | Texas (continued) | | | | | | | | | |
| | | | |
| $ | 335 | | | Houston, Texas, Hotel Occupancy Tax and Special Revenue Bonds, Convention and Entertainment Facilities Department, Refunding Series 2014, 5.000%, 9/01/18 | | | No Opt. Call | | | | A2 | | | $ | 366,165 | |
| | | | |
| | 500 | | | Laredo Community College District, Webb County, Texas, General Obligation Bonds, Series 2014, 5.000%, 8/01/18 | | | No Opt. Call | | | | AA– | | | | 545,445 | |
| | | | |
| | 560 | | | McCamey County Hospital District, Texas, General Obligation Bonds, Series 2013, 3.000%, 12/01/18 | | | No Opt. Call | | | | Ba2 | | | | 561,372 | |
| | | | |
| | | | New Hope Cultural Education Facilities Finance Corporation, Texas, Student Housing Revenue Bonds, CHF-Collegiate Housing Foundation – College Station I LLC – Texas A&M University Project, Series 2014A: | | | | | | | | | | | | |
| | 125 | | | 4.000%, 4/01/18 – AGM Insured | | | No Opt. Call | | | | AA | | | | 131,484 | |
| | 325 | | | 4.000%, 4/01/19 – AGM Insured | | | No Opt. Call | | | | AA | | | | 348,046 | |
| | | | |
| | 490 | | | Tarrant County Cultural Education Facilities Finance Corporation, Texas, Hospital Revenue Bonds, Hendrick Medical Center, Refunding Series 2013, 4.000%, 9/01/16 | | | No Opt. Call | | | | A | | | | 495,111 | |
| | | | |
| | | | Tarrant County Cultural Education Facilities Finance Corporation, Texas, Hospital Revenue Bonds, Hendrick Medical Center, Series 2009A: | | | | | | | | | | | | |
| | 1,260 | | | 4.000%, 9/01/16 – AGC Insured | | | No Opt. Call | | | | AA | | | | 1,273,759 | |
| | 1,425 | | | 4.375%, 9/01/18 – AGC Insured | | | No Opt. Call | | | | AA | | | | 1,529,524 | |
| | | | |
| | 3,000 | | | Texas Municipal Gas Acquisition and Supply Corporation III, Gas Supply Revenue Bonds, Series 2012, 5.000%, 12/15/16 | | | No Opt. Call | | | | A3 | | | | 3,080,820 | |
| | | | |
| | 2,605 | | | Texas State Transportation Commission, Highway Fund Revenue Bonds, First Tier Series 2014A, 5.000%, 4/01/19 | | | No Opt. Call | | | | AAA | | | | 2,921,586 | |
| | 29,580 | | | Total Texas | | | | | | | | | | | 32,057,356 | |
| | | | |
| | | | Utah – 0.5% | | | | | | | | | |
| | | | |
| | 2,870 | | | Intermountain Power Agency, Utah, Power Supply Revenue Bonds, Subordinate Lien Refunding Series 2014, 5.000%, 7/01/18 | | | No Opt. Call | | | | AA– | | | | 3,129,678 | |
| | | | |
| | | | Vermont – 0.6% | | | | | | | | | |
| | | | |
| | 705 | | | Vermont Housing Finance Agency, Multiple Purpose Bonds, Series 2012B, 1.900%, 11/01/16 (Alternative Minimum Tax) | | | No Opt. Call | | | | AA | | | | 707,707 | |
| | | | |
| | 3,040 | | | Vermont Student Assistance Corporation, Education Student Loan Revenue Notes Series 2012A, 2.550%, 6/15/18 (Alternative Minimum Tax) | | | No Opt. Call | | | | A | | | | 3,066,661 | |
| | 3,745 | | | Total Vermont | | | | | | | | | | | 3,774,368 | |
| | | | |
| | | | Virgin Islands – 0.6% | | | | | | | | | |
| | | | |
| | 3,595 | | | Virgin Islands Public Finance Authority, Gross Receipts Taxes Loan Note, Series 2012C, 3.000%, 10/01/17 | | | No Opt. Call | | | | BBB+ | | | | 3,675,923 | |
| | | | |
| | | | Virginia – 0.8% | | | | | | | | | |
| | | | |
| | 2,620 | | | Fredericksburg Economic Development Authority, Virginia, Hospital Facilities Revenue Bonds, MediCorp Health System, Series 2007, 5.000%, 6/15/17 | | | No Opt. Call | | | | Baa1 | | | | 2,710,154 | |
| | | | |
| | 1,275 | | | Henrico County Economic Development Authority, Virginia, Revenue Bonds, Bon Secours Health System Obligated Group, Series 2013, 4.000%, 11/01/16 | | | No Opt. Call | | | | A2 | | | | 1,297,070 | |
| | | | |
| | 1,160 | | | Wise County Industrial Development Authority, Virginia, Solid Waste and Sewage Disposal Revenue Bonds, Virginia Electric and Power Company, Series 2010A, 1.875%, 11/01/40 (Mandatory put 6/01/20) | | | No Opt. Call | | | | A2 | | | | 1,184,986 | |
| | 5,055 | | | Total Virginia | | | | | | | | | | | 5,192,210 | |
| | | | | | | | | | | | | | | | |
Principal
Amount (000) | | | Description (1) | | Optional Call
Provisions (2) | | | Ratings (3) | | | Value | |
| | | | |
| | | | Washington – 2.2% | | | | | | | | | |
| | | | |
| $ | 4,185 | | | Energy Northwest, Washington, Electric Revenue Bonds, Columbia Generating Station, Refunding Series 2014A, 5.000%, 7/01/18 | | | No Opt. Call | | | | Aa1 | | | $ | 4,574,121 | |
| | | | |
| | | | Port of Pasco, Washington, Airport and General Port Revenue Bonds, Series 2014A: | | | | | | | | | | | | |
| | 700 | | | 3.000%, 12/01/16 (Alternative Minimum Tax) | | | No Opt. Call | | | | A– | | | | 708,358 | |
| | 860 | | | 3.000%, 12/01/17 (Alternative Minimum Tax) | | | No Opt. Call | | | | A– | | | | 883,297 | |
| | | | |
| | 1,500 | | | Port of Seattle, Washington, Revenue Bonds, Intermediate Lien Series 2015C, 5.000%, 4/01/19 (Alternative Minimum Tax) | | | No Opt. Call | | | | A+ | | | | 1,674,210 | |
| | | | |
| | | | Skagit County Public Hospital District 1, Washington, Revenue Bonds, Skagit Regional Health, Improvement & Refunding Series 2013A: | | | | | | | | | | | | |
| | 470 | | | 4.000%, 12/01/16 | | | No Opt. Call | | | | Baa2 | | | | 476,984 | |
| | 1,425 | | | 4.000%, 12/01/17 | | | No Opt. Call | | | | Baa2 | | | | 1,474,661 | |
| | 610 | | | 5.000%, 12/01/18 | | | No Opt. Call | | | | Baa2 | | | | 658,556 | |
| | | | |
| | 205 | | | Washington Health Care Facilities Authority, Revenue Bonds, Kadlec Regional Medical Center, Series 2012, 4.000%, 12/01/16 (ETM) | | | No Opt. Call | | | | N/R (4) | | | | 209,166 | |
| | | | |
| | | | Washington Health Care Facilities Authority, Revenue Bonds, PeaceHealth, Refunding Series 2014A: | | | | | | | | | | | | |
| | 320 | | | 5.000%, 11/15/17 | | | No Opt. Call | | | | A+ | | | | 340,896 | |
| | 470 | | | 5.000%, 11/15/18 | | | No Opt. Call | | | | A+ | | | | 517,992 | |
| | | | |
| | 275 | | | Washington Higher Education Facilities Authority Revenue Bonds, Whitworth University Project, Series 2012, 4.000%, 10/01/16 | | | No Opt. Call | | | | Baa1 | | | | 278,242 | |
| | | | |
| | 900 | | | Washington State Economic Development Finance Authority, Solid Waste Disposal Revenue Bonds, Waste Management Inc., Series 2005D, 1.250%, 11/01/17 | | | No Opt. Call | | | | A– | | | | 904,311 | |
| | | | |
| | 500 | | | Washington State Health Care Facilities Authority, Revenue Bonds, Central Washington Health Services Association, Series 2009, 6.000%, 7/01/19 | | | No Opt. Call | | | | Baa1 | | | | 567,020 | |
| | | | |
| | 500 | | | Washington State Health Care Facilities Authority, Revenue Bonds, Fred Hutchinson Cancer Research Center, Series 2009A, 5.000%, 1/01/18 | | | No Opt. Call | | | | A | | | | 527,715 | |
| | | | |
| | 1,045 | | | Washington State, General Obligation Motor Vehicle Fuel Tax Bonds, Refunding Series R-2012D, 5.000%, 7/01/18 | | | No Opt. Call | | | | AA+ | | | | 1,142,404 | |
| | 13,965 | | | Total Washington | | | | | | | | | | | 14,937,933 | |
| | | | |
| | | | West Virginia – 0.6% | | | | | | | | | |
| | | | |
| | 3,750 | | | West Virginia Economic Development Authority, Solid Waste Disposal Facilities Revenue Bonds, Appalachian Power Company – Amos Project, Series 2011A, 2.250%, 1/01/41 (Mandatory put 9/01/16) (Alternative Minimum Tax) | | | No Opt. Call | | | | Baa1 | | | | 3,760,500 | |
| | | | |
| | | | Wisconsin – 1.3% | | | | | | | | | |
| | | | |
| | 535 | | | Wisconsin Health & Educational Facs Authority, Health Facilities Revenue Bonds, UnityPoint Health Project, Series 2014A, 5.000%, 12/01/17 | | | No Opt. Call | | | | Aa3 | | | | 569,918 | |
| | | | |
| | 630 | | | Wisconsin Health and Educational Facilities Authority, Revenue Bonds, Aurora Health Care, Inc., Series 2009B, 1.250%, 8/15/25 (Mandatory put 8/15/17) | | | 8/15 at 100.00 | | | | A2 | | | | 631,209 | |
| | | | |
| | 530 | | | Wisconsin Health and Educational Facilities Authority, Revenue Bonds, Bellin Memorial Hospital, Series 2015, 3.000%, 12/01/18 | | | No Opt. Call | | | | A+ | | | | 555,974 | |
| | | | |
| | 610 | | | Wisconsin Health and Educational Facilities Authority, Revenue Bonds, Beloit Health System, Inc., Series 2010B, 5.000%, 4/01/17 | | | No Opt. Call | | | | A– | | | | 628,250 | |
| | | | |
| | 750 | | | Wisconsin Health and Educational Facilities Authority, Revenue Bonds, Hospital Sisters Services, Inc., Refunding Series 2014A, 5.000%, 11/15/18 | | | No Opt. Call | | | | AA– | | | | 828,427 | |
Nuveen Short Term Municipal Bond Fund (continued)
| | |
| Portfolio of Investments | | April 30, 2016 |
| | | | | | | | | | | | | | | | |
Principal
Amount (000) | | | Description (1) | | Optional Call
Provisions (2) | | | Ratings (3) | | | Value | |
| | | | |
| | | | Wisconsin (continued) | | | | | | | | | |
| | | | |
| $ | 500 | | | Wisconsin Health and Educational Facilities Authority, Revenue Bonds, Watertown Regional Medical Center, Inc., Refunding Series 2012, 2.000%, 9/01/16 (ETM) | | | No Opt. Call | | | | N/R (4) | | | $ | 502,534 | |
| | | | |
| | 200 | | | Wisconsin Health and Educational Facilities Authority, Wisconsin, Revenue Bonds, Dickson Hollow Project. Series 2014, 2.750%, 10/01/17 | | | No Opt. Call | | | | N/R | | | | 200,107 | |
| | | | |
| | | | Wisconsin Health and Educational Facilities Authority, Wisconsin, Revenue Bonds, Fort Healthcare, Series 2014: | | | | | | | | | | | | |
| | 200 | | | 4.000%, 5/01/16 | | | No Opt. Call | | | | BBB | | | | 200,035 | |
| | 385 | | | 4.000%, 5/01/17 | | | No Opt. Call | | | | BBB | | | | 395,606 | |
| | 375 | | | 4.000%, 5/01/18 | | | No Opt. Call | | | | BBB | | | | 393,288 | |
| | 300 | | | 4.000%, 5/01/19 | | | No Opt. Call | | | | BBB | | | | 319,271 | |
| | | | |
| | | | Wisconsin Health and Educational Facilities Authority, Wisconsin, Revenue Bonds, ThedaCare Inc, Series 2015: | | | | | | | | | | | | |
| | 435 | | | 5.000%, 12/15/17 | | | No Opt. Call | | | | AA– | �� | | | 464,409 | |
| | 450 | | | 5.000%, 12/15/18 | | | No Opt. Call | | | | AA– | | | | 497,308 | |
| | | | |
| | | | Wisconsin Housing and Economic Development Authority, Home Ownership Revenue Bonds, Series 2015A: | | | | | | | | | | | | |
| | 1,000 | | | 1.850%, 3/01/19 (Alternative Minimum Tax) | | | No Opt. Call | | | | Aa2 | | | | 1,011,129 | |
| | 1,260 | | | 1.950%, 9/01/19 (Alternative Minimum Tax) | | | No Opt. Call | | | | Aa2 | | | | 1,279,265 | |
| | 8,160 | | | Total Wisconsin | | | | | | | | | | | 8,476,730 | |
| | | | |
| | | | Wyoming – 0.0% | | | | | | | | | |
| | | | |
| | 300 | | | Natrona County, Wyoming, Hospital Revenue Bonds, Wyoming Medical Center Project, Series 2011, 4.000%, 9/15/16 | | | No Opt. Call | | | | A3 | | | | 302,871 | |
| $ | 581,860 | | | Total Municipal Bonds (cost $611,368,252) | | | | | | | | | | | 617,636,152 | |
| | | | |
| Shares | | | Description (1), (8) | | | | | | | | Value | |
| | | | |
| | | | INVESTMENTS COMPANIES – 1.9% | | | | | | | | | | | | |
| | | | |
| | 875,000 | | | Eaton Vance Municipal Bond Fund II Institutional Munifund Term Perferred Shares iMTPs | | | | | | | | | | $ | 874,729 | |
| | | | |
| | 5,000,000 | | | Eaton Vance New York Municipal Bond Fund Institutional Munifund Term Perferred Shares iMTPs | | | | | | | | | | | 4,998,350 | |
| | | | |
| | 6,525,000 | | | Eaton Vance Michigan Municipal Bond Fund Institutional Munifund Term Perferred Shares iMTPs | | | | | | | | | | | 6,522,977 | |
| | | | Total Investment Companies (cost $12,400,000) | | | | | | | | | | | 12,396,056 | |
| | | | Total Long-Term Investments (cost $623,768,252) | | | | | | | | | | | 630,032,208 | |
| | | | |
Principal
Amount (000)/
Shares | | | Description (1) | | Optional Call
Provisions (2) | | | Ratings (3) | | | Value | |
| | | | |
| | | | SHORT-TERM INVESTMENTS – 2.0% | | | | | | | | | |
| | | | |
| | | | MONEY MARKET FUNDS – 0.4% | | | | | | | | | |
| | | | |
| | 2,338,807 | | | First American Tax Free Obligations Fund, Class Z, 0.167%, (6) | | | N/A | | | | N/A | | | $ | 2,338,807 | |
| | | | Total Money Market Funds (cost $2,338,807) | | | | | | | | | | | 2,338,807 | |
| | | | | | | | | | | | | | | | |
| | | | |
Principal
Amount (000)/
Shares | | | Description (1) | | Optional Call
Provisions (2) | | | Ratings (3) | | | Value | |
| | | | |
| | | | MUNICIPAL BONDS – 1.6% | | | | | | | | | | | | |
| | | | |
| | | | National – 0.2% | | | | | | | | | |
| | | | |
| $ | 1,223 | | | BB&T Municipal Trust Pool Tax Exempt Lease Certificates Class C, Variable Rate Demand Obligations, Series 2014, 0.710%, 11/15/17 (7) | | | No Opt. Call | | | | A+ | | | $ | 1,217,794 | |
| | | | |
| | | | Missouri – 0.1% | | | | | | | | | |
| | | | |
| | 1,000 | | | Missouri Environmental Improvement and Energy Resources Authority, Revenue Bonds, Kansas City Power & Light Company Project, Series 2008, 2.875%, 5/01/38 (Mandatory put 7/02/18) (Alternative Minimum Tax) (7) | | | No Opt. Call | | | | BBB+ | | | | 1,027,670 | |
| | | | |
| | | | New York – 0.5% | | | | | | | | | |
| | | | |
| | 1,625 | | | Chautauqua County Capital Resource Corporation, New York, Multi-Mode Revenue Bonds, Jamestown Center City Development Corporation Project, Guaranteed by the Gebbie Foundation, Series 2013A, 1.300%, 11/01/31 (Mandatory put 11/01/18) (7) | | | No Opt. Call | | | | AA– | | | | 1,625,943 | |
| | | | |
| | 1,750 | | | Chautauqua County Capital Resource Corporation, New York, Multi-Mode Revenue Bonds, Jamestown Center City Development Corporation Project, Guaranteed by the Gebbie Foundation, Series 2013B, 1.500%, 11/01/31 (Mandatory put 4/30/20) (7) | | | No Opt. Call | | | | AA– | | | | 1,750,000 | |
| | | | Total New York | | | | | | | | | | | 3,375,943 | |
| | | | |
| | | | Ohio – 0.6% | | | | | | | | | |
| | | | |
| | 4,000 | | | Ohio Water Development Authority, Ohio, Solid Waste Revenue Refunding Bonds, Waste Management, Inc. Project, Series 2002, 1.700%, 11/01/22 (Mandatory put 11/01/18) (Alternative Minimum Tax) (7) | | | No Opt. Call | | | | A– | | | | 4,021,520 | |
| | | | |
| | | | Pennsylvania – 0.2% | | | | | | | | | |
| | | | |
| | 1,135 | | | Pennsylvania Higher Educational Facilities Authority, Revenue Bonds, AICUP Financing Program-Mount Aloysius College Project, Series 2011R-1, 1.250%, 11/01/41 (Mandatory put 10/31/17) (7) | | | No Opt. Call | | | | A | | | | 1,135,000 | |
| | | | Total Municipal Bonds (cost $10,760,257) | | | | | | | | | | | 10,777,927 | |
| | | | Total Short-Term Investments (cost $13,099,064) | | | | | | | | | | | 13,116,734 | |
| | | | Total Investments (cost $636,867,316) – 99.0% | | | | | | | | | | | 643,148,942 | |
| | | | Other Assets Less Liabilities – 1.0% | | | | | | | | | | | 6,250,842 | |
| | | | Net Assets – 100% | | | | | | | | | | $ | 649,399,784 | |
| (1) | All percentages shown in the Portfolio of Investments are based on net assets. |
| (2) | Optional Call Provisions (not covered by the report of independent registered public accounting firm): Dates (month and year) and prices of the earliest optional call or redemption. There may be other call provisions at varying prices at later dates. Certain mortgage backed securities may be subject to periodic principal paydowns. |
| (3) | Ratings (not covered by the report of independent registered public accounting firm): Using the highest of Standard & Poor’s Group (“Standard & Poor’s”), Moody’s Investors Service, Inc. (“Moody’s”) or Fitch, Inc. (“Fitch”) rating. Ratings below BBB by Standard & Poor’s, Baa by Moody’s or BBB by Fitch are considered to be below investment grade. Holdings designated N/R are not rated by any of these national rating agencies. |
| (4) | Backed by an escrow or trust containing sufficient U.S. Government or U.S. Government agency securities, which ensure the timely payment of principal and interest. Certain bonds backed by U.S. Government or agency securities are regarded as having an implied rating equal to the rating of such securities. |
| (5) | During July 2010, the original issue for this security (1,000,000 par, 5.500% coupon and May, 15, 2015 maturity) was restructured into two new securities. The first security, which is 30% of the original issue, has 300,000 par, 0.000% coupon and May 15, 2050 maturity. The second security, which was the remaining 70% of the issue, had a 700,000 par, 5.100% coupon and May 15, 2014 maturity. During September 2011, the Adviser concluded this issue is not likely to meet its future interest payment obligations and has cease accruing additional income on the Fund’s records. |
| (6) | The rate shown is the annualized seven-day effective yield as of the end of the reporting period. |
| (7) | Investment has a maturity of more than one year, but has variable rate and demand features which qualify it as a short-term investment. The rate disclosed is that in effect as of the end of the reporting period. This rate changes periodically based on market conditions or a specified market index. |
| (8) | A copy of the most recent financial statements for these investment companies can be obtained directly from the Securities and Exchange Commission (SEC) on its website at http://www.sec.gov. |
| (ETM) | Escrowed to maturity. |
| (WI/DD) | Investment, or portion of investment purchased on a when-issued or delayed delivery basis. |
See accompanying notes to financial statements.
Statement of
| | | | |
| | Assets and Liabilities | | April 30, 2016 |
| | | | | | | | | | | | | | | | | | | | |
| | | All-American | | | Inflation Protected | | | Intermediate
Duration | | | Limited Term | | | Short Term | |
Assets | | | | | | | | | | | | | | | | | | | | |
Long-term investments, at value (cost $2,733,981,411, $42,543,696, $4,830,191,335, $4,278,498,822 and $623,768,252, respectively) | | $ | 2,997,054,451 | | | $ | 44,852,987 | | | $ | 5,122,046,520 | | | $ | 4,396,028,825 | | | $ | 630,032,208 | |
Short-term investments, at value (cost $—, $—, $30,180,675, $36,920,901 and $13,099,064, respectively) | | | — | | | | — | | | | 30,898,941 | | | | 37,503,166 | | | | 13,116,734 | |
Cash | | | 50,532,458 | | | | 14,639 | | | | 34,725,638 | | | | 14,150,050 | | | | — | |
Cash collateral at brokers(1) | | | — | | | | 1,275,000 | | | | — | | | | — | | | | — | |
Receivable for: | | | | | | | | | | | | | | | | | | | | |
Interest | | | 41,476,439 | | | | 574,524 | | | | 64,854,357 | | | | 53,595,743 | | | | 7,374,044 | |
Investments sold | | | 25,027,918 | | | | 571,550 | | | | 19,107,152 | | | | 16,507,524 | | | | — | |
Shares sold | | | 15,045,631 | | | | 103,431 | | | | 19,156,024 | | | | 26,555,743 | | | | 6,107,742 | |
Other assets | | | 354,731 | | | | 23,439 | | | | 561,339 | | | | 289,907 | | | | 44,501 | |
Total assets | | | 3,129,491,628 | | | | 47,415,570 | | | | 5,291,349,971 | | | | 4,544,630,958 | | | | 656,675,229 | |
Liabilities | | | | | | | | | | | | | | | | | | | | |
Floating rate obligations | | | 67,370,000 | | | | — | | | | — | | | | — | | | | — | |
Unrealized depreciation on consumer price index swaps | | | — | | | | 4,642,767 | | | | — | | | | — | | | | — | |
Payable for: | | | | | | | | | | | | | | | | | | | | |
Dividends | | | 2,716,650 | | | | 7,376 | | | | 4,204,373 | | | | 2,183,858 | | | | 275,458 | |
Investments purchased | | | 41,207,924 | | | | — | | | | 84,448,208 | | | | 22,006,168 | | | | 5,359,202 | |
Shares redeemed | | | 3,341,455 | | | | 109,206 | | | | 6,475,542 | | | | 12,557,092 | | | | 1,228,784 | |
Accrued expenses: | | | | | | | | | | | | | | | | | | | | |
Management fees | | | 1,014,476 | | | | 5,686 | | | | 1,709,961 | | | | 1,294,685 | | | | 218,609 | |
Directors/Trustees fees | | | 296,466 | | | | 68 | | | | 494,678 | | | | 262,027 | | | | 23,883 | |
12b-1 distribution and service fees | | | 468,180 | | | | 7,863 | | | | 274,087 | | | | 478,352 | | | | 39,992 | |
Other | | | 510,168 | | | | 51,805 | | | | 858,995 | | | | 750,367 | | | | 129,517 | |
Total liabilities | | | 116,925,319 | | | | 4,824,771 | | | | 98,465,844 | | | | 39,532,549 | | | | 7,275,445 | |
Net assets | | $ | 3,012,566,309 | | | $ | 42,590,799 | | | $ | 5,192,884,127 | | | $ | 4,505,098,409 | | | $ | 649,399,784 | |
Class A Shares | | | | | | | | | | | | | | | | | | | | |
Net assets | | $ | 1,170,705,411 | | | $ | 21,288,802 | | | $ | 1,076,822,237 | | | $ | 1,208,642,456 | | | $ | 174,483,695 | |
Shares outstanding | | | 99,218,034 | | | | 1,996,165 | | | | 114,615,768 | | | | 108,216,802 | | | | 17,233,518 | |
Net asset value (“NAV”) per share | | $ | 11.80 | | | $ | 10.66 | | | $ | 9.40 | | | $ | 11.17 | | | $ | 10.12 | |
Offering price per share (NAV per share plus maximum sales charge of 4.20%, 3.00%, 3.00%, 2.50% and 2.50%, respectively, of offering price) | | $ | 12.32 | | | $ | 10.99 | | | $ | 9.69 | | | $ | 11.46 | | | $ | 10.38 | |
Class C Shares | | | | | | | | | | | | | | | | | | | | |
Net assets | | $ | 116,023,567 | | | $ | 955,809 | | | $ | 35,070,054 | | | $ | 90,329,794 | | | $ | 6,970,862 | |
Shares outstanding | | | 9,830,595 | | | | 89,679 | | | | 3,729,396 | | | | 8,121,018 | | | | 689,790 | |
NAV and offering price per share | | $ | 11.80 | | | $ | 10.66 | | | $ | 9.40 | | | $ | 11.12 | | | $ | 10.11 | |
Class C2 Shares | | | | | | | | | | | | | | | | | | | | |
Net assets | | $ | 308,099,742 | | | $ | 5,826,977 | | | $ | 101,167,696 | | | $ | 461,558,129 | | | $ | 13,324,995 | |
Shares outstanding | | | 26,110,349 | | | | 546,475 | | | | 10,746,766 | | | | 41,451,910 | | | | 1,317,492 | |
NAV and offering price per share | | $ | 11.80 | | | $ | 10.66 | | | $ | 9.41 | | | $ | 11.13 | | | $ | 10.11 | |
Class I Shares | | | | | | | | | | | | | | | | | | | | |
Net assets | | $ | 1,417,737,589 | | | $ | 14,519,211 | | | $ | 3,979,824,140 | | | $ | 2,744,568,030 | | | $ | 454,620,232 | |
Shares outstanding | | | 119,671,882 | | | | 1,358,729 | | | | 422,388,283 | | | | 246,803,926 | | | | 44,875,477 | |
NAV and offering price per share | | $ | 11.85 | | | $ | 10.69 | | | $ | 9.42 | | | $ | 11.12 | | | $ | 10.13 | |
Net assets consist of: | | | | | | | | | | | | | | | | | | | | |
Capital paid-in | | $ | 2,825,020,883 | | | $ | 49,171,332 | | | $ | 4,895,098,172 | | | $ | 4,395,136,045 | | | $ | 643,767,786 | |
Undistributed (Over-distribution of) net investment income | | | 2,696,684 | | | | 64,009 | | | | 9,476,392 | | | | 5,295,771 | | | | 292,690 | |
Accumulated net realized gain (loss) | | | (78,224,298 | ) | | | (4,311,066 | ) | | | (4,263,888 | ) | | | (13,445,675 | ) | | | (942,318 | ) |
Net unrealized appreciation (depreciation) | | | 263,073,040 | | | | (2,333,476 | ) | | | 292,573,451 | | | | 118,112,268 | | | | 6,281,626 | |
Net assets | | $ | 3,012,566,309 | | | $ | 42,590,799 | | | $ | 5,192,884,127 | | | $ | 4,505,098,409 | | | $ | 649,399,784 | |
Authorized shares – per class | | | Unlimited | | | | Unlimited | | | | Unlimited | | | | Unlimited | | | | 2 billion | |
Par value per share | | $ | 0.01 | | | $ | 0.01 | | | $ | 0.001 | | | $ | 0.01 | | | $ | 0.0001 | |
| (1) | Cash pledged to collateralize the net payment obligations for investments in derivatives in addition to the Fund’s securities pledged as collateral as noted in the Fund’s portfolio of investments. |
See accompanying notes to financial statements.
Statement of
| | | | |
| | Operations | | Year Ended April 30, 2016 |
| | | | | | | | | | | | | | | | | | | | |
| | | All-American | | | Inflation Protected | | | Intermediate
Duration | | | Limited Term | | | Short Term | |
Investment Income | | $ | 115,916,083 | | | $ | 1,482,029 | | | $ | 159,744,422 | | | $ | 103,631,500 | | | $ | 11,322,993 | |
Expenses | | | | | | | | | | | | | | | | | | | | |
Management fees | | | 11,180,817 | | | | 214,620 | | | | 18,748,725 | | | | 14,934,019 | | | | 2,761,700 | |
12b-1 service fees – Class A Shares | | | 2,087,298 | | | | 43,319 | | | | 1,508,195 | | | | 2,318,835 | | | | 353,485 | |
12b-1 distribution and service fees – Class C Shares | | | 751,323 | | | | 11,577 | | | | 244,764 | | | | 677,816 | | | | 57,940 | |
12b-1 distribution and service fees – Class C2 Shares | | | 2,351,794 | | | | 51,457 | | | | 786,529 | | | | 2,703,744 | | | | 86,582 | |
Shareholder servicing agent fees | | | 1,138,770 | | | | 28,109 | | | | 2,113,482 | | | | 1,742,816 | | | | 224,952 | |
Interest expense | | | 91,983 | | | | — | | | | — | | | | — | | | | — | |
Custodian fees | | | 295,152 | | | | 44,566 | | | | 473,014 | | | | 445,778 | | | | 243,193 | |
Directors/Trustees fees | | | 71,649 | | | | 1,163 | | | | 108,247 | | | | 113,064 | | | | 17,841 | |
Professional fees | | | 138,768 | | | | 28,475 | | | | 197,001 | | | | 174,375 | | | | 50,232 | |
Shareholder reporting expenses | | | 145,653 | | | | 8,754 | | | | 250,986 | | | | 233,195 | | | | 29,258 | |
Federal and state registration fees | | | 201,176 | | | | 58,750 | | | | 230,342 | | | | 269,064 | | | | 82,844 | |
Other | | | 66,939 | | | | 9,155 | | | | 134,650 | | | | 119,231 | | | | 25,736 | |
Total expenses before fee waiver/expense reimbursement | | | 18,521,322 | | | | 499,945 | | | | 24,795,935 | | | | 23,731,937 | | | | 3,933,763 | |
Fee waiver/expense reimbursement | | | — | | | | (131,934 | ) | | | — | | | | (47,099 | ) | | | (7,642 | ) |
Net expenses | | | 18,521,322 | | | | 368,011 | | | | 24,795,935 | | | | 23,684,838 | | | | 3,926,121 | |
Net investment income (loss) | | | 97,394,761 | | | | 1,114,018 | | | | 134,948,487 | | | | 79,946,662 | | | | 7,396,872 | |
Realized and Unrealized Gain (Loss) | | | | | | | | | | | | | | | | | | | | |
Net realized gain (loss) from: | | | | | | | | | | | | | | | | | | | | |
Investments | | | 5,224,271 | | | | 3,608 | | | | 4,569,565 | | | | 2,714,425 | | | | (325,327 | ) |
Futures contracts | | | — | | | | — | | | | 617,735 | | | | — | | | | — | |
Swaps | | | — | | | | (861,457 | ) | | | — | | | | — | | | | — | |
Change in net unrealized appreciation (depreciation) of: | | | | | | | | | | | | | | | | | | | | |
Investments | | | 52,524,525 | | | | 1,027,350 | | | | 80,907,551 | | | | 25,392,818 | | | | 708,617 | |
Swaps | | | — | | | | (179,459 | ) | | | — | | | | — | | | | — | |
Net realized and unrealized gain (loss) | | | 57,748,796 | | | | (9,958 | ) | | | 86,094,851 | | | | 28,107,243 | | | | 383,290 | |
Net increase (decrease) in net assets from operations | | $ | 155,143,557 | | | $ | 1,104,060 | | | $ | 221,043,338 | | | $ | 108,053,905 | | | $ | 7,780,162 | |
See accompanying notes to financial statements.
Statement of
| | | | | | | | | | | | | | | | | | |
| | | All-American | | | | | Inflation Protected | |
| | | Year Ended
4/30/16 | | | Year Ended
4/30/15 | | | | | Year Ended
4/30/16 | | | Year Ended
4/30/15 | |
Operations | | | | | | | | | | | | | | | | | | |
Net investment income (loss) | | $ | 97,394,761 | | | $ | 94,336,448 | | | | | $ | 1,114,018 | | | $ | 1,594,576 | |
Net realized gain (loss) from: | | | | | | | | | | | | | | | | | | |
Investments | | | 5,224,271 | | | | 8,973,367 | | | | | | 3,608 | | | | 550,399 | |
Futures contracts | | | — | | | | — | | | | | | — | | | | — | |
Swaps | | | — | | | | — | | | | | | (861,457 | ) | | | (1,151,952 | ) |
Change in net unrealized appreciation (depreciation) of: | | | | | | | | | | | | | | | | | | |
Investments | | | 52,524,525 | | | | 60,142,510 | | | | | | 1,027,350 | | | | 1,630,602 | |
Swaps | | | — | | | | — | | | | | | (179,459 | ) | | | (2,088,468 | ) |
Net increase (decrease) in net assets from operations | | | 155,143,557 | | | | 163,452,325 | | | | | | 1,104,060 | | | | 535,157 | |
Distributions to Shareholders | | | | | | | | | | | | | | | | | | |
From net investment income: | | | | | | | | | | | | | | | | | | |
Class A Shares | | | (39,053,373 | ) | | | (38,795,730 | ) | | | | | (545,362 | ) | | | (678,852 | ) |
Class C Shares | | | (2,207,822 | ) | | | (800,859 | ) | | | | | (19,201 | ) | | | (13,507 | ) |
Class C2 Shares | | | (10,127,396 | ) | | | (12,441,818 | ) | | | | | (133,687 | ) | | | (170,443 | ) |
Class I Shares | | | (47,715,010 | ) | | | (45,483,221 | ) | | | | | (443,595 | ) | | | (697,354 | ) |
Decrease in net assets from distributions to shareholders | | | (99,103,601 | ) | | | (97,521,628 | ) | | | | | (1,141,845 | ) | | | (1,560,156 | ) |
Fund Share Transactions | | | | | | | | | | | | | | | | | | |
Proceeds from sale of shares | | | 793,145,702 | | | | 524,467,148 | | | | | | 9,670,740 | | | | 22,696,064 | |
Proceeds from shares issued to shareholders due to reinvestment of distributions | | | 68,074,039 | | | | 65,321,832 | | | | | | 1,081,857 | | | | 1,534,007 | |
| | | 861,219,741 | | | | 589,788,980 | | | | | | 10,752,597 | | | | 24,230,071 | |
Cost of shares redeemed | | | (405,292,419 | ) | | | (384,732,110 | ) | | | | | (21,552,502 | ) | | | (34,057,788 | ) |
Net increase (decrease) in net assets from Fund share transactions | | | 455,927,322 | | | | 205,056,870 | | | | | | (10,799,905 | ) | | | (9,827,717 | ) |
Net increase (decrease) in net assets | | | 511,967,278 | | | | 270,987,567 | | | | | | (10,837,690 | ) | | | (10,852,716 | ) |
Net assets at the beginning of period | | | 2,500,599,031 | | | | 2,229,611,464 | | | | | | 53,428,489 | | | | 64,281,205 | |
Net assets at the end of period | | $ | 3,012,566,309 | | | $ | 2,500,599,031 | | | | | $ | 42,590,799 | | | $ | 53,428,489 | |
Undistributed (Over-distribution of) net investment income at the end of period | | $ | 2,696,684 | | | $ | 4,521,694 | | | | | $ | 64,009 | | | $ | 99,376 | |
See accompanying notes to financial statements.
| | | | | | | | | | | | | | | | | | |
| | | Intermediate Duration | | | | | Limited Term | |
| | | Year Ended
4/30/16 | | | Year Ended
4/30/15 | | | | | Year Ended
4/30/16 | | | Year Ended
4/30/15 | |
Operations | | | | | | | | | | | | | | | | | | |
Net investment income (loss) | | $ | 134,948,487 | | | $ | 136,757,094 | | | | | $ | 79,946,662 | | | $ | 74,590,689 | |
Net realized gain (loss) from: | | | | | | | | | | | | | | | | | | |
Investments | | | 4,569,565 | | | | 7,526,894 | | | | | | 2,714,425 | | | | 520,320 | |
Futures contracts | | | 617,735 | | | | — | | | | | | — | | | | — | |
Swaps | | | — | | | | — | | | | | | — | | | | — | |
Change in net unrealized appreciation (depreciation) of: | | | | | | | | | | | | | | | | | | |
Investments | | | 80,907,551 | | | | 37,060,350 | | | | | | 25,392,818 | | | | (7,554,609 | ) |
Swaps | | | — | | | | — | | | | | | — | | | | — | |
Net increase (decrease) in net assets from operations | | | 221,043,338 | | | | 181,344,338 | | | | | | 108,053,905 | | | | 67,556,400 | |
Distributions to Shareholders | | | | | | | | | | | | | | | | | | |
From net investment income: | | | | | | | | | | | | | | | | | | |
Class A Shares | | | (20,944,763 | ) | | | (28,640,186 | ) | | | | | (21,389,495 | ) | | | (22,511,391 | ) |
Class C Shares | | | (490,682 | ) | | | (192,477 | ) | | | | | (767,472 | ) | | | (404,357 | ) |
Class C2 Shares | | | (2,384,876 | ) | | | (2,849,160 | ) | | | | | (7,246,079 | ) | | | (8,764,069 | ) |
Class I Shares | | | (109,851,125 | ) | | | (105,729,977 | ) | | | | | (49,746,560 | ) | | | (42,100,723 | ) |
Decrease in net assets from distributions to shareholders | | | (133,671,446 | ) | | | (137,411,800 | ) | | | | | (79,149,606 | ) | | | (73,780,540 | ) |
Fund Share Transactions | | | | | | | | | | | | | | | | | | |
Proceeds from sale of shares | | | 1,634,898,252 | | | | 1,309,069,536 | | | | | | 1,619,746,263 | | | | 1,464,411,917 | |
Proceeds from shares issued to shareholders due to reinvestment of distributions | | | 86,140,928 | | | | 91,558,445 | | | | | | 53,543,471 | | | | 48,558,051 | |
| | | 1,721,039,180 | | | | 1,400,627,981 | | | | | | 1,673,289,734 | | | | 1,512,969,968 | |
Cost of shares redeemed | | | (1,093,585,011 | ) | | | (1,183,673,670 | ) | | | | | (1,167,892,771 | ) | | | (1,229,233,296 | ) |
Net increase (decrease) in net assets from Fund share transactions | | | 627,454,169 | | | | 216,954,311 | | | | | | 505,396,963 | | | | 283,736,672 | |
Net increase (decrease) in net assets | | | 714,826,061 | | | | 260,886,849 | | | | | | 534,301,262 | | | | 277,512,532 | |
Net assets at the beginning of period | | | 4,478,058,066 | | | | 4,217,171,217 | | | | | | 3,970,797,147 | | | | 3,693,284,615 | |
Net assets at the end of period | | $ | 5,192,884,127 | | | $ | 4,478,058,066 | | | | | $ | 4,505,098,409 | | | $ | 3,970,797,147 | |
Undistributed (Over-distribution of) net investment income at the end of period | | $ | 9,476,392 | | | $ | 9,161,486 | | | | | $ | 5,295,771 | | | $ | 4,523,031 | |
See accompanying notes to financial statements.
Statement of Changes in Net Assets (continued)
| | | | | | | | |
| | | Short Term | |
| | | Year Ended
4/30/16 | | | Year Ended
4/30/15 | |
Operations | | | | | | | | |
Net investment income (loss) | | $ | 7,396,872 | | | $ | 8,670,216 | |
Net realized gain (loss) from: | | | | | | | | |
Investments | | | (325,327 | ) | | | (351,346 | ) |
Futures contracts | | | — | | | | — | |
Swaps | | | — | | | | — | |
Change in net unrealized appreciation (depreciation) of: | | | | | | | | |
Investments | | | 708,617 | | | | (2,582,077 | ) |
Swaps | | | — | | | | — | |
Net increase (decrease) in net assets from operations | | | 7,780,162 | | | | 5,736,793 | |
Distributions to Shareholders | | | | | | | | |
From net investment income: | | | | | | | | |
Class A Shares | | | (1,597,461 | ) | | | (1,918,292 | ) |
Class C Shares | | | (16,789 | ) | | | (15,985 | ) |
Class C2 Shares | | | (86,239 | ) | | | (136,183 | ) |
Class I Shares | | | (5,170,312 | ) | | | (6,417,765 | ) |
Decrease in net assets from distributions to shareholders | | | (6,870,801 | ) | | | (8,488,225 | ) |
Fund Share Transactions | | | | | | | | |
Proceeds from sale of shares | | | 251,309,993 | | | | 385,939,783 | |
Proceeds from shares issued to shareholders due to reinvestment of distributions | | | 3,366,594 | | | | 3,909,343 | |
| | | 254,676,587 | | | | 389,849,126 | |
Cost of shares redeemed | | | (326,957,476 | ) | | | (393,789,816 | ) |
Net increase (decrease) in net assets from Fund share transactions | | | (72,280,889 | ) | | | (3,940,690 | ) |
Net increase (decrease) in net assets | | | (71,371,528 | ) | | | (6,692,122 | ) |
Net assets at the beginning of period | | | 720,771,312 | | | | 727,463,434 | |
Net assets at the end of period | | $ | 649,399,784 | | | $ | 720,771,312 | |
Undistributed (Over-distribution of) net investment income at the end of period | | $ | 292,690 | | | $ | (229,666 | ) |
See accompanying notes to financial statements.
THIS PAGE INTENTIONALLY LEFT BLANK
Financial
Highlights
All-American
Selected data for a share outstanding throughout each period:
| | | | | | | | | | | | | | | | | | | | | | | | | | | | | | | | | | |
| | | | | |
| | | | | | Investment Operations | | | | | Less Distributions | | | | |
| | | | | | | | | |
Class (Commencement Date) Year Ended April 30, | | Beginning
NAV | | | Net
Investment
Income
(Loss)(a) | | | Net
Realized/
Unrealized
Gain (Loss) | | | Total | | | | | From
Net
Investment
Income | | | From
Accumulated
Net Realized
Gains | | | Total | | | Ending
NAV | |
Class A (10/88) | | | | | | | | | | | | | | | | | | | | | | | | | | | | | | | |
2016 | | $ | 11.57 | | | $ | 0.43 | | | $ | 0.23 | | | $ | 0.66 | | | | | $ | (0.43 | ) | | $ | — | | | $ | (0.43 | ) | | $ | 11.80 | |
2015 | | | 11.23 | | | | 0.46 | | | | 0.36 | | | | 0.82 | | | | | | (0.48 | ) | | | — | | | | (0.48 | ) | | | 11.57 | |
2014 | | | 11.76 | | | | 0.49 | | | | (0.56 | ) | | | (0.07 | ) | | | | | (0.46 | ) | | | — | | | | (0.46 | ) | | | 11.23 | |
2013 | | | 11.36 | | | | 0.47 | | | | 0.41 | | | | 0.88 | | | | | | (0.48 | ) | | | — | | | | (0.48 | ) | | | 11.76 | |
2012 | | | 10.24 | | | | 0.54 | | | | 1.13 | | | | 1.67 | | | | | | (0.55 | ) | | | — | | | | (0.55 | ) | | | 11.36 | |
Class C (2/14) | | | | | | | | | | | | | | | | | | | | | | | | | | | | | | | |
2016 | | | 11.58 | | | | 0.33 | | | | 0.23 | | | | 0.56 | | | | | | (0.34 | ) | | | — | | | | (0.34 | ) | | | 11.80 | |
2015 | | | 11.24 | | | | 0.36 | | | | 0.37 | | | | 0.73 | | | | | | (0.39 | ) | | | — | | | | (0.39 | ) | | | 11.58 | |
2014(e) | | | 10.99 | | | | 0.02 | | | | 0.32 | | | | 0.34 | | | | | | (0.09 | ) | | | — | | | | (0.09 | ) | | | 11.24 | |
Class C2 (6/93)(f) | | | | | | | | | | | | | | | | | | | | | | | | | | | | | | | |
2016 | | | 11.58 | | | | 0.36 | | | | 0.23 | | | | 0.59 | | | | | | (0.37 | ) | | | — | | | | (0.37 | ) | | | 11.80 | |
2015 | | | 11.24 | | | | 0.40 | | | | 0.36 | | | | 0.76 | | | | | | (0.42 | ) | | | — | | | | (0.42 | ) | | | 11.58 | |
2014 | | | 11.76 | | | | 0.43 | | | | (0.55 | ) | | | (0.12 | ) | | | | | (0.40 | ) | | | — | | | | (0.40 | ) | | | 11.24 | |
2013 | | | 11.37 | | | | 0.40 | | | | 0.41 | | | | 0.81 | | | | | | (0.42 | ) | | | — | | | | (0.42 | ) | | | 11.76 | |
2012 | | | 10.24 | | | | 0.48 | | | | 1.14 | | | | 1.62 | | | | | | (0.49 | ) | | | — | | | | (0.49 | ) | | | 11.37 | |
Class I (2/97) | | | | | | | | | | | | | | | | | | | | | | | | | | | | | | | |
2016 | | | 11.62 | | | | 0.45 | | | | 0.24 | | | | 0.69 | | | | | | (0.46 | ) | | | — | | | | (0.46 | ) | | | 11.85 | |
2015 | | | 11.28 | | | | 0.49 | | | | 0.35 | | | | 0.84 | | | | | | (0.50 | ) | | | — | | | | (0.50 | ) | | | 11.62 | |
2014 | | | 11.80 | | | | 0.51 | | | | (0.55 | ) | | | (0.04 | ) | | | | | (0.48 | ) | | | — | | | | (0.48 | ) | | | 11.28 | |
2013 | | | 11.40 | | | | 0.49 | | | | 0.41 | | | | 0.90 | | | | | | (0.50 | ) | | | — | | | | (0.50 | ) | | | 11.80 | |
2012 | | | 10.28 | | | | 0.55 | | | | 1.14 | | | | 1.69 | | | | | | (0.57 | ) | | | — | | | | (0.57 | ) | | | 11.40 | |
| | | | | | | | | | | | | | | | | | | | | | | | | | | | |
| | | | Ratios/Supplemental Data | |
| | | | | | | | | Ratios to Average
Net Assets | | | | |
| | | | | | | |
Total
Return(b) | | | Ending
Net
Assets
(000) | | | | | Expenses
Including
Interest(c) | | | Expenses
Excluding
Interest | | | | | | Net
Investment
Income
(Loss) | | | Portfolio
Turnover
Rate(d) | |
| | | | | | | | | | | | | | | | | | | | | | | | | | | | |
| | 5.85 | % | | $ | 1,170,705 | | | | | | 0.70 | % | | | 0.70 | | | | % | | | | 3.68 | % | | | 13 | % |
| | 7.38 | | | | 989,477 | | | | | | 0.71 | | | | 0.71 | | | | | | | | 4.01 | | | | 18 | |
| | (0.42 | ) | | | 907,137 | | | | | | 0.72 | | | | 0.72 | | | | | | | | 4.46 | | | | 13 | |
| | 7.83 | | | | 1,230,356 | | | | | | 0.72 | | | | 0.72 | | | | | | | | 4.01 | | | | 17 | |
| | 16.68 | | | | 969,745 | | | | | | 0.78 | | | | 0.77 | | | | | | | | 4.98 | | | | 18 | |
| | | | | | | | | | | | | | | | | | | | | | | | | | | | |
| | 5.04 | | | | 116,024 | | | | | | 1.50 | | | | 1.50 | | | | | | | | 2.86 | | | | 13 | |
| | 6.54 | | | | 48,472 | | | | | | 1.51 | | | | 1.51 | | | | | | | | 3.09 | | | | 18 | |
| | 3.06 | | | | 4,923 | | | | | | 1.50 | * | | | 1.50 | * | | | | | | | 3.39 | * | | | 13 | |
| | | | | | | | | | | | | | | | | | | | | | | | | | | | |
| | 5.22 | | | | 308,100 | | | | | | 1.25 | | | | 1.25 | | | | | | | | 3.13 | | | | 13 | |
| | 6.82 | | | | 328,649 | | | | | | 1.26 | | | | 1.26 | | | | | | | | 3.47 | | | | 18 | |
| | (0.90 | ) | | | 353,220 | | | | | | 1.27 | | | | 1.27 | | | | | | | | 3.91 | | | | 13 | |
| | 7.17 | | | | 494,747 | | | | | | 1.27 | | | | 1.27 | | | | | | | | 3.45 | | | | 17 | |
| | 16.14 | | | | 361,364 | | | | | | 1.33 | | | | 1.32 | | | | | | | | 4.43 | | | | 18 | |
| | | | | | | | | | | | | | | | | | | | | | | | | | | | |
| | 6.05 | | | | 1,417,738 | | | | | | 0.50 | | | | 0.50 | | | | | | | | 3.88 | | | | 13 | |
| | 7.57 | | | | 1,134,001 | | | | | | 0.51 | | | | 0.51 | | | | | | | | 4.21 | | | | 18 | |
| | (0.14 | ) | | | 962,101 | | | | | | 0.52 | | | | 0.52 | | | | | | | | 4.66 | | | | 13 | |
| | 8.03 | | | | 1,283,660 | | | | | | 0.52 | | | | 0.52 | | | | | | | | 4.22 | | | | 17 | |
| | 16.71 | | | | 1,120,747 | | | | | | 0.56 | | | | 0.55 | | | | | | | | 5.13 | | | | 18 | |
| (a) | Per share Net Investment Income (Loss) is calculated using the average daily shares method. | |
| (b) | Total return is the combination of changes in NAV without any sales charge, reinvested dividend income at NAV and reinvested capital gains distributions at NAV, if any. Total returns are not annualized. | |
| (c) | The expense ratios reflect, among other things, the interest expense deemed to have been paid by the Fund on the floating rate certificates issued by the special purpose trusts for the self-deposited inverse floaters held by the Fund, where applicable, as described in Note 3 – Portfolio Securities and Investments in Derivatives, Inverse Floating Rate Securities. | |
| (d) | Portfolio Turnover Rate is calculated based on the lesser of long-term purchases or sales (as disclosed in Note 5 – Investment Transactions) divided by the average long-term market value during the period. | |
| (e) | For the period February 10, 2014 (commencement of operations) through April 30, 2014. | |
| (f) | Formerly Class C Shares and renamed to Class C2 Shares on February 10, 2014. | |
See accompanying notes to financial statements.
Financial Highlights (continued)
Inflation Protected
Selected data for a share outstanding throughout each period:
| | | | | | | | | | | | | | | | | | | | | | | | | | | | | | | | | | |
| | | | | |
| | | | | | Investment Operations | | | | | Less Distributions | | | | |
| | | | | | | | | |
Class (Commencement Date) Year Ended April 30, | | Beginning
NAV | | | Net
Investment
Income
(Loss)(a) | | | Net
Realized/
Unrealized
Gain (Loss) | | | Total | | | | | From
Net
Investment
Income | | | From
Accumulated
Net Realized
Gains | | | Total | | | Ending
NAV | |
Class A (3/11) | | | | | | | | | | | | | | | | | | | | | | | | | | | | | | | |
2016 | | $ | 10.63 | | | $ | 0.26 | | | $ | 0.03 | | | $ | 0.29 | | | | | $ | (0.26 | ) | | $ | — | | | $ | (0.26 | ) | | $ | 10.66 | |
2015 | | | 10.77 | | | | 0.27 | | | | (0.14 | ) | | | 0.13 | | | | | | (0.27 | ) | | | — | | | | (0.27 | ) | | | 10.63 | |
2014 | | | 11.31 | | | | 0.26 | | | | (0.55 | ) | | | (0.29 | ) | | | | | (0.25 | ) | | | — | | | | (0.25 | ) | | | 10.77 | |
2013 | | | 11.01 | | | | 0.24 | | | | 0.35 | | | | 0.59 | | | | | | (0.28 | ) | | | (0.01 | ) | | | (0.29 | ) | | | 11.31 | |
2012 | | | 10.36 | | | | 0.33 | | | | 0.66 | | | | 0.99 | | | | | | (0.34 | ) | | | — | | | | (0.34 | ) | | | 11.01 | |
Class C (2/14) | | | | | | | | | | | | | | | | | | | | | | | | | | | | | | | |
2016 | | | 10.62 | | | | 0.17 | | | | 0.04 | | | | 0.21 | | | | | | (0.17 | ) | | | — | | | | (0.17 | ) | | | 10.66 | |
2015 | | | 10.76 | | | | 0.18 | | | | (0.14 | ) | | | 0.04 | | | | | | (0.18 | ) | | | — | | | | (0.18 | ) | | | 10.62 | |
2014(e) | | | 10.61 | | | | 0.02 | | | | 0.17 | | | | 0.19 | | | | | | (0.04 | ) | | | — | | | | (0.04 | ) | | | 10.76 | |
Class C2 (3/11)(f) | | | | | | | | | | | | | | | | | | | | | | | | | | | | | | | |
2016 | | | 10.62 | | | | 0.20 | | | | 0.04 | | | | 0.24 | | | | | | (0.20 | ) | | | — | | | | (0.20 | ) | | | 10.66 | |
2015 | | | 10.76 | | | | 0.21 | | | | (0.14 | ) | | | 0.07 | | | | | | (0.21 | ) | | | — | | | | (0.21 | ) | | | 10.62 | |
2014 | | | 11.30 | | | | 0.21 | | | | (0.57 | ) | | | (0.36 | ) | | | | | (0.18 | ) | | | — | | | | (0.18 | ) | | | 10.76 | |
2013 | | | 11.00 | | | | 0.18 | | | | 0.35 | | | | 0.53 | | | | | | (0.22 | ) | | | (0.01 | ) | | | (0.23 | ) | | | 11.30 | |
2012 | | | 10.36 | | | | 0.27 | | | | 0.66 | | | | 0.93 | | | | | | (0.29 | ) | | | — | | | | (0.29 | ) | | | 11.00 | |
Class I (3/11) | | | | | | | | | | | | | | | | | | | | | | | | | | | | | | | |
2016 | | | 10.64 | | | | 0.28 | | | | 0.05 | | | | 0.33 | | | | | | (0.28 | ) | | | — | | | | (0.28 | ) | | | 10.69 | |
2015 | | | 10.78 | | | | 0.29 | | | | (0.15 | ) | | | 0.14 | | | | | | (0.28 | ) | | | — | | | | (0.28 | ) | | | 10.64 | |
2014 | | | 11.32 | | | | 0.29 | | | | (0.57 | ) | | | (0.28 | ) | | | | | (0.26 | ) | | | — | | | | (0.26 | ) | | | 10.78 | |
2013 | | | 11.01 | | | | 0.26 | | | | 0.36 | | | | 0.62 | | | | | | (0.30 | ) | | | (0.01 | ) | | | (0.31 | ) | | | 11.32 | |
2012 | | | 10.37 | | | | 0.35 | | | | 0.65 | | | | 1.00 | | | | | | (0.36 | ) | | | — | | | | (0.36 | ) | | | 11.01 | |
| | | | | | | | | | | | | | | | | | | | | | | | | | | | | | |
| | | | Ratios/Supplemental Data | |
| | | | | | | | | Ratios to Average
Net Assets Before
Waiver/Reimbursement | | | | | Ratios to Average
Net Assets After
Waiver/Reimbursement(c) | | | | |
| | | | | | | | |
Total
Return(b) | | | Ending
Net
Assets
(000) | | | | | Expenses | | | Net
Investment
Income (Loss) | | | | | Expenses | | | Net
Investment
Income
(Loss) | | | Portfolio
Turnover
Rate(d) | |
| | | | | | | | | | | | | | | | | | | | | | | | | | | | | | |
| | 2.83 | % | | $ | 21,289 | | | | | | 1.05 | % | | | 2.15 | % | | | | | 0.77 | % | | | 2.44 | % | | | 1 | % |
| | 1.14 | | | | 24,104 | | | | | | 0.99 | | | | 2.26 | | | | | | 0.77 | | | | 2.48 | | | | 20 | |
| | (2.53 | ) | | | 28,862 | | | | | | 0.96 | | | | 2.29 | | | | | | 0.77 | | | | 2.49 | | | | 19 | |
| | 5.39 | | | | 61,926 | | | | | | 1.01 | | | | 1.87 | | | | | | 0.77 | | | | 2.11 | | | | 9 | |
| | 9.74 | | | | 7,339 | | | | | | 1.46 | | | | 2.44 | | | | | | 0.78 | | | | 3.13 | | | | 14 | |
| | | | | | | | | | | | | | | | | | | | | | | | | | | | | | |
| | 2.05 | | | | 956 | | | | | | 1.85 | | | | 1.36 | | | | | | 1.57 | | | | 1.64 | | | | 1 | |
| | 0.31 | | | | 1,344 | | | | | | 1.80 | | | | 1.41 | | | | | | 1.57 | | | | 1.65 | | | | 20 | |
| | 1.79 | | | | 238 | | | | | | 1.69 | * | | | 1.66 | * | | | | | 1.59 | * | | | 1.75 | * | | | 19 | |
| | | | | | | | | | | | | | | | | | | | | | | | | | | | | | |
| | 2.34 | | | | 5,827 | | | | | | 1.60 | | | | 1.61 | | | | | | 1.32 | | | | 1.90 | | | | 1 | |
| | 0.59 | | | | 7,697 | | | | | | 1.54 | | | | 1.72 | | | | | | 1.32 | | | | 1.94 | | | | 20 | |
| | (3.10 | ) | | | 10,221 | | | | | | 1.52 | | | | 1.76 | | | | | | 1.32 | | | | 1.96 | | | | 19 | |
| | 4.81 | | | | 15,064 | | | | | | 1.57 | | | | 1.33 | | | | | | 1.32 | | | | 1.58 | | | | 9 | |
| | 9.07 | | | | 4,209 | | | | | | 2.03 | | | | 1.87 | | | | | | 1.33 | | | | 2.57 | | | | 14 | |
| | | | | | | | | | | | | | | | | | | | | | | | | | | | | | |
| | 3.19 | | | | 14,519 | | | | | | 0.85 | | | | 2.35 | | | | | | 0.57 | | | | 2.64 | | | | 1 | |
| | 1.31 | | | | 20,284 | | | | | | 0.78 | | | | 2.46 | | | | | | 0.57 | | | | 2.68 | | | | 20 | |
| | (2.36 | ) | | | 24,960 | | | | | | 0.77 | | | | 2.52 | | | | | | 0.57 | | | | 2.72 | | | | 19 | |
| | 5.65 | | | | 35,046 | | | | | | 0.82 | | | | 2.10 | | | | | | 0.57 | | | | 2.35 | | | | 9 | |
| | 9.82 | | | | 6,704 | | | | | | 1.22 | | | | 2.64 | | | | | | 0.58 | | | | 3.28 | | | | 14 | |
| (a) | Per share Net Investment Income (Loss) is calculated using the average daily shares method. | |
| (b) | Total return is the combination of changes in NAV without any sales charge, reinvested dividend income at NAV and reinvested capital gains distributions at NAV, if any. Total returns are not annualized. | |
| (c) | After fee waiver and/or expense reimbursement from the Adviser, where applicable. | |
| (d) | Portfolio Turnover Rate is calculated based on the lesser of long-term purchases or sales (as disclosed in Note 5 – Investment Transactions) divided by the average long-term market value during the period. | |
| (e) | For the period February 10, 2014 (commencement of operations) through April 30, 2014. | |
| (f) | Formerly Class C Shares and renamed to Class C2 Shares on February 10, 2014. | |
See accompanying notes to financial statements.
Financial Highlights (continued)
Intermediate Duration
Selected data for a share outstanding throughout each period:
| | | | | | | | | | | | | | | | | | | | | | | | | | | | | | | | | | |
| | | | | |
| | | | | | Investment Operations | | | | | Less Distributions | | | | |
| | | | | | | | | |
Class (Commencement Date) Year Ended April 30, | | Beginning
NAV | | | Net
Investment
Income
(Loss)(a) | | | Net
Realized/
Unrealized
Gain (Loss) | | | Total | | | | | From
Net
Investment
Income | | | From
Accumulated
Net Realized
Gains | | | Total | | | Ending
NAV | |
Class A (6/95) | | | | | | | | | | | | | | | | | | | | | | | | | | | | | | | |
2016 | | $ | 9.22 | | | $ | 0.26 | | | $ | 0.18 | | | $ | 0.44 | | | | | $ | (0.26 | ) | | $ | — | | | $ | (0.26 | ) | | $ | 9.40 | |
2015 | | | 9.13 | | | | 0.26 | | | | 0.10 | | | | 0.36 | | | | | | (0.27 | ) | | | — | | | | (0.27 | ) | | | 9.22 | |
2014 | | | 9.38 | | | | 0.29 | | | | (0.26 | ) | | | 0.03 | | | | | | (0.28 | ) | | | — | | | | (0.28 | ) | | | 9.13 | |
2013 | | | 9.25 | | | | 0.30 | | | | 0.14 | | | | 0.44 | | | | | | (0.31 | ) | | | — | | | | (0.31 | ) | | | 9.38 | |
2012 | | | 8.84 | | | | 0.34 | | | | 0.42 | | | | 0.76 | | | | | | (0.35 | ) | | | — | | | | (0.35 | ) | | | 9.25 | |
Class C (2/14) | | | | | | | | | | | | | | | | | | | | | | | | | | | | | | | | | | |
2016 | | | 9.23 | | | | 0.18 | | | | 0.18 | | | | 0.36 | | | | | | (0.19 | ) | | | — | | | | (0.19 | ) | | | 9.40 | |
2015 | | | 9.14 | | | | 0.19 | | | | 0.10 | | | | 0.29 | | | | | | (0.20 | ) | | | — | | | | (0.20 | ) | | | 9.23 | |
2014(f) | | | 9.05 | | | | 0.01 | | | | 0.12 | | | | 0.13 | | | | | | (0.04 | ) | | | — | | | | (0.04 | ) | | | 9.14 | |
Class C2 (6/95)(g) | | | | | | | | | | | | | | | | | | | | | | | | | | | | | | | |
2016 | | | 9.24 | | | | 0.21 | | | | 0.17 | | | | 0.38 | | | | | | (0.21 | ) | | | — | | | | (0.21 | ) | | | 9.41 | |
2015 | | | 9.15 | | | | 0.22 | | | | 0.09 | | | | 0.31 | | | | | | (0.22 | ) | | | — | | | | (0.22 | ) | | | 9.24 | |
2014 | | | 9.41 | | | | 0.24 | | | | (0.27 | ) | | | (0.03 | ) | | | | | (0.23 | ) | | | — | | | | (0.23 | ) | | | 9.15 | |
2013 | | | 9.27 | | | | 0.25 | | | | 0.15 | | | | 0.40 | | | | | | (0.26 | ) | | | — | | | | (0.26 | ) | | | 9.41 | |
2012 | | | 8.87 | | | | 0.29 | | | | 0.41 | | | | 0.70 | | | | | | (0.30 | ) | | | — | | | | (0.30 | ) | | | 9.27 | |
Class I (11/76) | | | | | | | | | | | | | | | | | | | | | | | | | | | | | | | |
2016 | | | 9.25 | | | | 0.28 | | | | 0.17 | | | | 0.45 | | | | | | (0.28 | ) | | | — | | | | (0.28 | ) | | | 9.42 | |
2015 | | | 9.16 | | | | 0.28 | | | | 0.10 | | | | 0.38 | | | | | | (0.29 | ) | | | — | | | | (0.29 | ) | | | 9.25 | |
2014 | | | 9.41 | | | | 0.31 | | | | (0.26 | ) | | | 0.05 | | | | | | (0.30 | ) | | | — | | | | (0.30 | ) | | | 9.16 | |
2013 | | | 9.27 | | | | 0.32 | | | | 0.15 | | | | 0.47 | | | | | | (0.33 | ) | | | — | | | | (0.33 | ) | | | 9.41 | |
2012 | | | 8.86 | | | | 0.36 | | | | 0.41 | | | | 0.77 | | | | | | (0.36 | ) | | | — | | | | (0.36 | ) | | | 9.27 | |
| | | | | | | | | | | | | | | | | | | | | | | | |
| | | | Ratios/Supplemental Data | |
| | | | | | | | | Ratios to Average
Net Assets(c) | | | | |
| | | | | | |
Total
Return(b) | | | Ending
Net
Assets
(000) | | | | | Expenses
Including
Interest(d) | | | Expenses
Excluding
Interest | | | Net
Investment Income
(Loss) | | | Portfolio
Turnover
Rate(e) | |
| | | | | | | | | | | | | | | | | | | | | | | | |
| | 4.83 | % | | $ | 1,076,822 | | | | | | 0.68 | % | | | 0.68 | % | | | 2.77 | % | | | 18 | % |
| | 3.95 | | | | 773,091 | | | | | | 0.70 | | | | 0.70 | | | | 2.86 | | | | 19 | |
| | 0.39 | | | | 876,456 | | | | | | 0.70 | | | | 0.70 | | | | 3.20 | | | | 17 | |
| | 4.83 | | | | 512,139 | | | | | | 0.70 | | | | 0.70 | | | | 3.24 | | | | 15 | |
| | 8.68 | | | | 450,036 | | | | | | 0.72 | | | | 0.72 | | | | 3.70 | | | | 10 | |
| | | | | | | | | | | | | | | | | | | | | | | | |
| | 3.91 | | | | 35,070 | | | | | | 1.48 | | | | 1.48 | | | | 1.99 | | | | 18 | |
| | 3.14 | | | | 17,706 | | | | | | 1.50 | | | | 1.50 | | | | 2.03 | | | | 19 | |
| | 1.49 | | | | 2,412 | | | | | | 1.49 | * | | | 1.49 | * | | | 2.17 | * | | | 17 | |
| | | | | | | | | | | | | | | | | | | | | | | | |
| | 4.17 | | | | 101,168 | | | | | | 1.24 | | | | 1.24 | | | | 2.28 | | | | 18 | |
| | 3.40 | | | | 112,700 | | | | | | 1.25 | | | | 1.25 | | | | 2.32 | | | | 19 | |
| | (0.25 | ) | | | 126,951 | | | | | | 1.25 | | | | 1.25 | | | | 2.65 | | | | 17 | |
| | 4.39 | | | | 158,004 | | | | | | 1.25 | | | | 1.25 | | | | 2.69 | | | | 15 | |
| | 7.96 | | | | 134,478 | | | | | | 1.27 | | | | 1.27 | | | | 3.14 | | | | 10 | |
| | | | | | | | | | | | | | | | | | | | | | | | |
| | 4.91 | | | | 3,979,824 | | | | | | 0.49 | | | | 0.49 | | | | 3.02 | | | | 18 | |
| | 4.14 | | | | 3,574,561 | | | | | | 0.50 | | | | 0.50 | | | | 3.07 | | | | 19 | |
| | 0.59 | | | | 3,210,180 | | | | | | 0.50 | | | | 0.50 | | | | 3.40 | | | | 17 | |
| | 5.13 | | | | 3,520,696 | | | | | | 0.50 | | | | 0.50 | | | | 3.44 | | | | 15 | |
| | 8.87 | | | | 3,039,743 | | | | | | 0.52 | | | | 0.52 | | | | 3.91 | | | | 10 | |
| (a) | Per share Net Investment Income (Loss) is calculated using the average daily shares method. | |
| (b) | Total return is the combination of changes in NAV without any sales charge, reinvested dividend income at NAV and reinvested capital gains distributions at NAV, if any. Total returns are not annualized. | |
| (c) | The Fund has a fee waiver/expense reimbursement agreement with the Adviser, but did not receive a fee waiver/expense reimbursement during the periods presented herein. | |
| (d) | The expense ratios reflect, among other things, the interest expense deemed to have been paid by the Fund on the floating rate certificates issued by the special purpose trusts for the self-deposited inverse floaters held by the Fund, where applicable, as described in Note 3 – Portfolio Securities and Investments in Derivatives, Inverse Floating Rate Securities. | |
| (e) | Portfolio Turnover Rate is calculated based on the lesser of long-term purchases or sales (as disclosed in Note 5 – Investment Transactions) divided by the average long-term market value during the period. | |
| (f) | For the period February 10, 2014 (commencement of operations) through April 30, 2014. | |
| (g) | Formerly Class C Shares and renamed to Class C2 Shares on February 10, 2014. | |
See accompanying notes to financial statements.
Financial Highlights (continued)
Limited Term
Selected data for a share outstanding throughout each period:
| | | | | | | | | | | | | | | | | | | | | | | | | | | | | | | | | | |
| | | | | |
| | | | | | Investment Operations | | | | | Less Distributions | | | | |
| | | | | | | | | |
Class (Commencement Date) Year Ended April 30, | | Beginning
NAV | | | Net
Investment
Income
(Loss)(a) | | | Net
Realized/
Unrealized
Gain(Loss) | | | Total | | | | | From
Net
Investment
Income | | | From
Accumulated
Net Realized
Gains | | | Total | | | Ending
NAV | |
Class A (10/87) | | | | | | | | | | | | | | | | | | | | | | | | | | | | | | | |
2016 | | $ | 11.10 | | | $ | 0.20 | | | $ | 0.08 | | | $ | 0.28 | | | | | $ | (0.21 | ) | | $ | — | | | $ | (0.21 | ) | | $ | 11.17 | |
2015 | | | 11.12 | | | | 0.21 | | | | (0.02 | ) | | | 0.19 | | | | | | (0.21 | ) | | | — | | | | (0.21 | ) | | | 11.10 | |
2014 | | | 11.27 | | | | 0.22 | | | | (0.16 | ) | | | 0.06 | | | | | | (0.21 | ) | | | — | | | | (0.21 | ) | | | 11.12 | |
2013 | | | 11.20 | | | | 0.24 | | | | 0.07 | | | | 0.31 | | | | | | (0.24 | ) | | | — | | | | (0.24 | ) | | | 11.27 | |
2012 | | | 10.85 | | | | 0.29 | | | | 0.34 | | | | 0.63 | | | | | | (0.28 | ) | | | — | | | | (0.28 | ) | | | 11.20 | |
Class C (2/14) | | | | | | | | | | | | | | | | | | | | | | | | | | | | | | | |
2016 | | | 11.06 | | | | 0.12 | | | | 0.07 | | | | 0.19 | | | | | | (0.13 | ) | | | — | | | | (0.13 | ) | | | 11.12 | |
2015 | | | 11.08 | | | | 0.15 | | | | (0.02 | ) | | | 0.13 | | | | | | (0.15 | ) | | | — | | | | (0.15 | ) | | | 11.06 | |
2014(f) | | | 11.06 | | | | 0.01 | | | | 0.04 | | | | 0.05 | | | | | | (0.03 | ) | | | — | | | | (0.03 | ) | | | 11.08 | |
Class C2 (12/95)(g) | | | | | | | | | | | | | | | | | | | | | | | | | | | | | | | |
2016 | | | 11.06 | | | | 0.17 | | | | 0.06 | | | | 0.23 | | | | | | (0.16 | ) | | | — | | | | (0.16 | ) | | | 11.13 | |
2015 | | | 11.08 | | | | 0.17 | | | | (0.02 | ) | | | 0.15 | | | | | | (0.17 | ) | | | — | | | | (0.17 | ) | | | 11.06 | |
2014 | | | 11.23 | | | | 0.18 | | | | (0.16 | ) | | | 0.02 | | | | | | (0.17 | ) | | | — | | | | (0.17 | ) | | | 11.08 | |
2013 | | | 11.15 | | | | 0.20 | | | | 0.08 | | | | 0.28 | | | | | | (0.20 | ) | | | — | | | | (0.20 | ) | | | 11.23 | |
2012 | | | 10.81 | | | | 0.25 | | | | 0.34 | | | | 0.59 | | | | | | (0.25 | ) | | | — | | | | (0.25 | ) | | | 11.15 | |
Class I (2/97) | | | | | | | | | | | | | | | | | | | | | | | | | | | | | | | |
2016 | | | 11.05 | | | | 0.23 | | | | 0.06 | | | | 0.29 | | | | | | (0.22 | ) | | | — | | | | (0.22 | ) | | | 11.12 | |
2015 | | | 11.06 | | | | 0.23 | | | | (0.01 | ) | | | 0.22 | | | | | | (0.23 | ) | | | — | | | | (0.23 | ) | | | 11.05 | |
2014 | | | 11.21 | | | | 0.24 | | | | (0.16 | ) | | | 0.08 | | | | | | (0.23 | ) | | | — | | | | (0.23 | ) | | | 11.06 | |
2013 | | | 11.13 | | | | 0.26 | | | | 0.08 | | | | 0.34 | | | | | | (0.26 | ) | | | — | | | | (0.26 | ) | | | 11.21 | |
2012 | | | 10.79 | | | | 0.31 | | | | 0.33 | | | | 0.64 | | | | | | (0.30 | ) | | | — | | | | (0.30 | ) | | | 11.13 | |
| | | | | | | | | | | | | | | | | | | | | | | | | | | | | | | | | | | | | | |
| | | | Ratios/Supplemental Data | |
| | | | | | | | | Ratios to Average
Net Assets Before Waiver/Reimbursement | | | | | Ratios to Average
Net Assets After
Waiver/Reimbursement(c) | | | | |
| | | | | | | | | | |
Total
Return(b) | | | Ending
Net
Assets
(000) | | | | | Expenses
Including
Interest(d) | | | Expenses
Excluding
Interest | | | Net
Investment
Income
(Loss) | | | | | Expenses
Including
Interest(d) | | | Expenses
Excluding
Interest | | | Net
Investment
Income
(Loss) | | | Portfolio
Turnover
Rate(e) | |
| | | | | | | | | | | | | | | | | | | | | | | | | | | | | | | | | | | | | | |
| | 2.50 | % | | $ | 1,208,642 | | | | | | 0.63 | % | | | 0.63 | % | | | 1.84 | % | | | | | 0.63 | % | | | 0.63 | % | | | 1.84 | % | | | 20 | % |
| | 1.72 | | | | 1,168,646 | | | | | | 0.64 | | | | 0.64 | | | | 1.89 | | | | | | 0.64 | | | | 0.64 | | | | 1.89 | | | | 20 | |
| | 0.55 | | | | 1,279,131 | | | | | | 0.65 | | | | 0.65 | | | | 1.99 | | | | | | 0.65 | | | | 0.65 | | | | 1.99 | | | | 20 | |
| | 2.79 | | | | 1,438,077 | | | | | | 0.66 | | | | 0.66 | | | | 2.10 | | | | | | 0.66 | | | | 0.66 | | | | 2.10 | | | | 12 | |
| | 5.88 | | | | 1,113,802 | | | | | | 0.66 | | | | 0.66 | | | | 2.63 | | | | | | 0.66 | | | | 0.66 | | | | 2.63 | | | | 12 | |
| | | | | | | | | | | | | | | | | | | | | | | | | | | | | | | | | | | | | | |
| | 1.71 | | | | 90,330 | | | | | | 1.43 | | | | 1.43 | | | | 1.04 | | | | | | 1.36 | | | | 1.36 | | | | 1.11 | | | | 20 | |
| | 1.18 | | | | 51,973 | | | | | | 1.43 | | | | 1.43 | | | | 1.07 | | | | | | 1.18 | | | | 1.18 | | | | 1.32 | | | | 20 | |
| | 0.49 | | | | 9,695 | | | | | | 1.43 | * | | | 1.43 | * | | | 1.10 | * | | | | | 1.18 | * | | | 1.18 | * | | | 1.35 | * | | | 20 | |
| | | | | | | | | | | | | | | | | | | | | | | | | | | | | | | | | | | | | | |
| | 2.12 | | | | 461,558 | | | | | | 0.98 | | | | 0.98 | | | | 1.50 | | | | | | 0.98 | | | | 0.98 | | | | 1.50 | | | | 20 | |
| | 1.34 | | | | 528,287 | | | | | | 0.99 | | | | 0.99 | | | | 1.54 | | | | | | 0.99 | | | | 0.99 | | | | 1.54 | | | | 20 | |
| | 0.17 | | | | 623,242 | | | | | | 1.00 | | | | 1.00 | | | | 1.64 | | | | | | 1.00 | | | | 1.00 | | | | 1.64 | | | | 20 | |
| | 2.51 | | | | 721,302 | | | | | | 1.01 | | | | 1.01 | | | | 1.76 | | | | | | 1.01 | | | | 1.01 | | | | 1.76 | | | | 12 | |
| | 5.45 | | | | 641,602 | | | | | | 1.01 | | | | 1.01 | | | | 2.29 | | | | | | 1.01 | | | | 1.01 | | | | 2.29 | | | | 12 | |
| | | | | | | | | | | | | | | | | | | | | | | | | | | | | | | | | | | | | | |
| | 2.68 | | | | 2,744,568 | | | | | | 0.43 | | | | 0.43 | | | | 2.04 | | | | | | 0.43 | | | | 0.43 | | | | 2.04 | | | | 20 | |
| | 1.99 | | | | 2,221,891 | | | | | | 0.44 | | | | 0.44 | | | | 2.09 | | | | | | 0.44 | | | | 0.44 | | | | 2.09 | | | | 20 | |
| | 0.72 | | | | 1,781,216 | | | | | | 0.45 | | | | 0.45 | | | | 2.19 | | | | | | 0.45 | | | | 0.45 | | | | 2.19 | | | | 20 | |
| | 3.07 | | | | 1,549,809 | | | | | | 0.46 | | | | 0.46 | | | | 2.31 | | | | | | 0.46 | | | | 0.46 | | | | 2.31 | | | | 12 | |
| | 6.00 | | | | 1,196,319 | | | | | | 0.46 | | | | 0.46 | | | | 2.83 | | | | | | 0.46 | | | | 0.46 | | | | 2.83 | | | | 12 | |
| (a) | Per share Net Investment Income (Loss) is calculated using the average daily shares method. | |
| (b) | Total return is the combination of changes in NAV without any sales charge, reinvested dividend income at NAV and reinvested capital gains distributions at NAV, if any. Total returns are not annualized. | |
| (c) | After fee waiver and/or expense reimbursement from the Adviser, where applicable. During the fiscal years ended April 30, 2014 through April 30, 2016, the Adviser agreed to waive 0.25% of the 12b-1 distribution and/or service fees for Class C Shares through August 31, 2015. After August 31, 2015, the Adviser is no longer waiving fees or reimbursing expenses for Class C Shares. | |
| (d) | The expense ratios reflect, among other things, the interest expense deemed to have been paid by the Fund on the floating rate certificates issued by the special purpose trusts for the self-deposited inverse floaters held by the Fund, where applicable, as described in Note 3 – Portfolio Securities and Investments in Derivatives, Inverse Floating Rate Securities. | |
| (e) | Portfolio Turnover Rate is calculated based on the lesser of long-term purchases or sales (as disclosed in Note 5 – Investment Transactions) divided by the average long-term market value during the period. | |
| (f) | For the period February 10, 2014 (commencement of operations) through April 30, 2014. | |
| (g) | Formerly Class C Shares and renamed to Class C2 Shares on February 10, 2014. | |
See accompanying notes to financial statements.
Financial Highlights (continued)
Short Term
Selected data for a share outstanding throughout each period:
| | | | | | | | | | | | | | | | | | | | | | | | | | | | | | | | | | |
| | | | | |
| | | | | | Investment Operations | | | | | Less Distributions | | | | |
| | | | | | | | | |
Class (Commencement Date) Year Ended April 30, | | Beginning
NAV | | | Net
Investment
Income
(Loss)(a) | | | Net
Realized/
Unrealized
Gain(Loss) | | | Total | | | | | From
Net
Investment
Income | | | From
Accumulated
Net Realized
Gains | | | Total | | | Ending
NAV | |
Class A (10/02) | | | | | | | | | | | | | | | | | | | | | | | | | | | | | | | |
2016 | | $ | 10.11 | | | $ | 0.10 | | | $ | — | ** | | $ | 0.10 | | | | | $ | (0.09 | ) | | $ | — | | | $ | (0.09 | ) | | $ | 10.12 | |
2015 | | | 10.15 | | | | 0.10 | | | | (0.04 | ) | | | 0.06 | | | | | | (0.10 | ) | | | — | | | | (0.10 | ) | | | 10.11 | |
2014 | | | 10.20 | | | | 0.12 | | | | (0.05 | ) | | | 0.07 | | | | | | (0.12 | ) | | | — | | | | (0.12 | ) | | | 10.15 | |
2013 | | | 10.19 | | | | 0.15 | | | | 0.04 | | | | 0.19 | | | | | | (0.18 | ) | | | — | | | | (0.18 | ) | | | 10.20 | |
2012 | | | 9.98 | | | | 0.20 | | | | 0.21 | | | | 0.41 | | | | | | (0.20 | ) | | | — | | | | (0.20 | ) | | | 10.19 | |
Class C (2/14) | | | | | | | | | | | | | | | | | | | | | | | | | | | | | | | |
2016 | | | 10.10 | | | | 0.03 | | | | 0.01 | | | | 0.04 | | | | | | (0.03 | ) | | | — | | | | (0.03 | ) | | | 10.11 | |
2015 | | | 10.14 | | | | 0.06 | | | | (0.04 | ) | | | 0.02 | | | | | | (0.06 | ) | | | — | | | | (0.06 | ) | | | 10.10 | |
2014(f) | | | 10.15 | | | | — | ** | | | 0.01 | | | | 0.01 | | | | | | (0.02 | ) | | | — | | | | (0.02 | ) | | | 10.14 | |
Class C2 (8/11)(g) | | | | | | | | | | | | | | | | | | | | | | | | | | | | | | | |
2016 | | | 10.10 | | | | 0.06 | | | | 0.01 | | | | 0.07 | | | | | | (0.06 | ) | | | — | | | | (0.06 | ) | | | 10.11 | |
2015 | | | 10.14 | | | | 0.06 | | | | (0.04 | ) | | | 0.02 | | | | | | (0.06 | ) | | | — | | | | (0.06 | ) | | | 10.10 | |
2014 | | | 10.18 | | | | 0.08 | | | | (0.03 | ) | | | 0.05 | | | | | | (0.09 | ) | | | — | | | | (0.09 | ) | | | 10.14 | |
2013 | | | 10.18 | | | | 0.11 | | | | 0.03 | | | | 0.14 | | | | | | (0.14 | ) | | | — | | | | (0.14 | ) | | | 10.18 | |
2012(d) | | | 10.13 | | | | 0.10 | | | | 0.06 | | | | 0.16 | | | | | | (0.11 | ) | | | — | | | | (0.11 | ) | | | 10.18 | |
Class I (10/02) | | | | | | | | | | | | | | | | | | | | | | | | | | | | | | | |
2016 | | | 10.11 | | | | 0.12 | | | | 0.01 | | | | 0.13 | | | | | | (0.11 | ) | | | — | | | | (0.11 | ) | | | 10.13 | |
2015 | | | 10.15 | | | | 0.12 | | | | (0.04 | ) | | | 0.08 | | | | | | (0.12 | ) | | | — | | | | (0.12 | ) | | | 10.11 | |
2014 | | | 10.20 | | | | 0.14 | | | | (0.05 | ) | | | 0.09 | | | | | | (0.14 | ) | | | — | | | | (0.14 | ) | | | 10.15 | |
2013 | | | 10.19 | | | | 0.18 | | | | 0.03 | | | | 0.21 | | | | | | (0.20 | ) | | | — | | | | (0.20 | ) | | | 10.20 | |
2012 | | | 9.98 | | | | 0.23 | | | | 0.20 | | | | 0.43 | | | | | | (0.22 | ) | | | — | | | | (0.22 | ) | | | 10.19 | |
| | | | | | | | | | | | | | | | | | | | | | | | | | | | | | |
| | | | Ratios/Supplemental Data | |
| | | | | | | | | Ratios to Average
Net Assets Before
Waiver/Reimbursement | | | | | Ratios to Average
Net Assets After
Waiver/Reimbursement(c) | | | | |
| | | | | | | | |
Total
Return(b) | | | Ending
Net
Assets
(000) | | | | | Expenses | | | Net
Investment
Income
(Loss) | | | | | Expenses | | | Net
Investment
Income
(Loss) | | | Portfolio
Turnover
Rate(e) | |
| | | | | | | | | | | | | | | | | | | | | | | | | | | | | | |
| | 1.01 | % | | $ | 174,484 | | | | | | 0.71 | % | | | 0.97 | % | | | | | 0.71 | % | | | 0.97 | % | | | 24 | % |
| | 0.57 | | | | 184,317 | | | | | | 0.71 | | | | 0.97 | | | | | | 0.71 | | | | 0.97 | | | | 36 | |
| | 0.74 | | | | 201,145 | | | | | | 0.71 | | | | 1.16 | | | | | | 0.71 | | | | 1.16 | | | | 35 | |
| | 1.88 | | | | 101,836 | | | | | | 0.73 | | | | 1.49 | | | | | | 0.73 | | | | 1.49 | | | | 30 | |
| | 4.15 | | | | 34,793 | | | | | | 0.73 | | | | 2.01 | | | | | | 0.73 | | | | 2.01 | | | | 39 | |
| | | | | | | | | | | | | | | | | | | | | | | | | | | | | | |
| | 0.41 | | | | 6,971 | | | | | | 1.51 | | | | 0.17 | | | | | | 1.38 | | | | 0.30 | | | | 24 | |
| | 0.22 | | | | 4,615 | | | | | | 1.50 | | | | 0.16 | | | | | | 1.05 | | | | 0.61 | | | | 36 | |
| | 0.08 | | | | 822 | | | | | | 1.57 | * | | | 0.18 | * | | | | | 1.08 | * | | | 0.63 | * | | | 35 | |
| | | | | | | | | | | | | | | | | | | | | | | | | | | | | | |
| | 0.65 | | | | 13,325 | | | | | | 1.06 | | | | 0.62 | | | | | | 1.06 | | | | 0.62 | | | | 24 | |
| | 0.22 | | | | 16,524 | | | | | | 1.06 | | | | 0.63 | | | | | | 1.06 | | | | 0.63 | | | | 36 | |
| | 0.48 | | | | 28,134 | | | | | | 1.06 | | | | 0.82 | | | | | | 1.06 | | | | 0.82 | | | | 35 | |
| | 1.42 | | | | 10,618 | | | | | | 1.08 | | | | 1.10 | | | | | | 1.08 | | | | 1.10 | | | | 30 | |
| | 1.61 | | | | 1,026 | | | | | | 1.07 | * | | | 1.49 | * | | | | | 1.07 | * | | | 1.49 | * | | | 39 | |
| | | | | | | | | | | | | | | | | | | | | | | | | | | | | | |
| | 1.29 | | | | 454,620 | | | | | | 0.51 | | | | 1.16 | | | | | | 0.51 | | | | 1.16 | | | | 24 | |
| | 0.75 | | | | 515,315 | | | | | | 0.50 | | | | 1.17 | | | | | | 0.50 | | | | 1.17 | | | | 36 | |
| | 0.92 | | | | 497,363 | | | | | | 0.51 | | | | 1.37 | | | | | | 0.51 | | | | 1.37 | | | | 35 | |
| | 2.06 | | | | 383,339 | | | | | | 0.53 | | | | 1.74 | | | | | | 0.53 | | | | 1.74 | | | | 30 | |
| | 4.33 | | | | 304,109 | | | | | | 0.53 | | | | 2.27 | | | | | | 0.53 | | | | 2.27 | | | | 39 | |
| (a) | Per share Net Investment Income (Loss) is calculated using the average daily shares method. | |
| (b) | Total return is the combination of changes in NAV without any sales charge, reinvested dividend income at NAV and reinvested capital gains distributions at NAV, if any. Total returns are not annualized. | |
| (c) | After fee waiver and/or expense reimbursement from the Adviser, where applicable. During the fiscal years ended April 30, 2014 through April 30, 2016, the Advisor agreed to waive 0.45% of the 12b-1 distribution and/or service fees for Class C Shares through August 31, 2015. After August 31, 2015, the Advisor is no longer waiving fees or reimbursing expenses for Class C Shares. | |
| (d) | For the period August 31, 2011 (commencement of operations) through April 30, 2012. | |
| (e) | Portfolio Turnover Rate is calculated based on the lesser of long-term purchases or sales (as disclosed in Note 5 – Investment Transactions) divided by the average long-term market value during the period. | |
| (f) | For the period February 10, 2014 (commencement of operations) through April 30, 2014. | |
| (g) | Formerly Class C Shares and renamed to Class C2 Shares on February 10, 2014. | |
| ** | Rounds to less than $0.01 per share. | |
See accompanying notes to financial statements.
Notes to
Financial Statements
1. General Information and Significant Accounting Policies
General Information
Trust and Fund Information
Nuveen Municipal Trust and Nuveen Investment Funds, Inc. (each a “Trust” and collectively, the “Trusts”), are open-end management investment companies registered under the Investment Company Act of 1940, as amended. Nuveen Municipal Trust is comprised of Nuveen All-American Municipal Bond Fund (“All-American”), Nuveen Inflation Protected Municipal Bond Fund (“Inflation Protected”), Nuveen Intermediate Duration Municipal Bond Fund (“Intermediate Duration”) and Nuveen Limited Term Municipal Bond Fund (“Limited Term”), among others, and Nuveen Investment Funds, Inc. is comprised of Nuveen Short Term Municipal Bond Fund (“Short Term”), among others, (each a “Fund” and collectively, the “Funds”), as diversified funds. Nuveen Municipal Trust was organized as a Massachusetts business trust on July 1, 1996. Nuveen Investment Funds, Inc. was incorporated in the State of Maryland on August 20, 1987. The Funds, with the exception of Inflation Protected, were each organized as a series of predecessor trusts or corporations prior to that date.
The end of the reporting period for the Funds is April 30, 2016, and the period covered by these Notes to Financial Statements is the fiscal year ended April 30, 2016 (the “current fiscal period”).
Investment Adviser
The Funds’ investment adviser is Nuveen Fund Advisor, LLC (the “Adviser”), a wholly-owned subsidiary of Nuveen Investments, Inc. (“Nuveen”). Nuveen is an operating division of TIAA Global Asset Management. The Adviser is responsible for each Fund’s overall investment strategy and asset allocation decisions. The Adviser has entered into sub-advisory agreements with Nuveen Asset Management, LLC (the “Sub-Adviser”), a subsidiary of the Adviser, under which the Sub-Adviser manages the investment portfolios of the Funds.
Investment Objectives and Principal Investment Strategies
All-American’s, Intermediate Duration’s and Limited Term’s investment objective is to provide as high a level of current interest income exempt from regular federal income taxes as is consistent with preservation of capital. Under normal market conditions, each Fund invests at least 80% of the sum of its net assets and the amount of any borrowings for investment purposes in municipal bonds that pay interest that is exempt from regular federal personal income tax. These municipal bonds include obligations issued by U.S. states and their subdivisions, authorities, instrumentalities and corporations, as well as obligations issued by U.S. territories (such as Puerto Rico, the U.S. Virgin Islands and Guam) that pay interest that is exempt from regular federal personal income tax. Each Fund may invest without limit in securities that generate income subject to the alternative minimum tax. All-American will generally maintain, under normal market conditions, an investment portfolio with an overall weighted average maturity of greater than 10 years. Intermediate Duration maintains a weighted average portfolio duration between 3 and 10 years, and expects to generally maintain a weighted average portfolio duration between 4.5 and 7 years. Limited Term generally invests in bonds with short- to intermediate-term maturities. Limited Term will attempt to maintain the weighted average maturity of its portfolio securities at 3 to 7 years under normal market conditions. Each Fund invests at least 80% of its net assets in investment grade municipal bonds rated BBB/Baa or higher at the time of purchase by at least one independent rating agency, or, if unrated, judged by the Sub-Adviser, to be of comparable quality. Each Fund may invest up to 20% of its net assets in below investment grade municipal bonds, commonly referred to as “high yield” or “junk” bonds. Each Fund may invest in all types of municipal bonds, including general obligation bonds, revenue bonds and participation interests in municipal leases. Each Fund may invest in zero coupon bonds, which are issued at substantial discounts from their value at maturity and pay no cash income to their holders until they mature. Each Fund may invest up to 15% of its net assets in municipal securities whose interest payments vary inversely with changes in short-term tax-exempt interest rates (i.e., inverse floating rate securities).
Inflation Protected’s investment objective is to provide after-tax total return, protected from inflation, through a combination of federally tax-exempt income and inflation-linked investments. Under normal market conditions, the Fund invests at least 80% of the sum of its net assets and the amount of any borrowings for investment purposes in municipal bonds that pay interest that is exempt from regular federal personal income tax. These municipal bonds include obligations issued by U.S. states and their subdivisions, authorities, instrumentalities and corporations, as well as obligations issued by U.S. territories (such as Puerto Rico, the U.S. Virgin Islands and Guam) that pay interest that is exempt from regular federal personal income tax. The Fund may invest without limit in securities that generate income subject to the alternative minimum tax. The Fund generally invests in intermediate and long-term bonds with a duration of between 2 and 10 years, and generally maintain a weighted average duration of between 4 and 7 years. The Fund invests at least 80% of its net assets in investment grade municipal bonds rated BBB/Baa or higher at the time of purchase by at least one independent rating agency, or, if unrated, judged by the Sub-Adviser to be of comparable quality. The Fund may invest up to 20% of its net assets in below investment grade municipal bonds, commonly referred to as “high yield” or “junk” bonds. The Fund seeks to mitigate the effect that subsequent increases in inflation expectations may have on the purchasing power of the Fund by investing in inflation-linked instruments, such as Consumer Price
Index (“CPI”) swaps, in amounts sufficient to approximate the duration characteristics of the Fund’s underlying municipal bond portfolio. The Fund may invest in all types of municipal bonds, including general obligation bonds, revenue bonds and participation interests in municipal leases. The Fund may invest in zero coupon bonds, which are issued at substantial discounts from their value at maturity and pay no cash income to their holders until they mature.
Short Term’s investment objective is to provide current income that is exempt from federal income tax to the extent consistent with preservation of capital. Under normal market conditions, the Fund invests at least 80% of the sum of its net assets and the amount of any borrowings for investment purposes in municipal securities that pay interest that is exempt from regular federal personal income tax. The Fund may invest without limit in securities that generate income subject to the alternative minimum tax. The Fund normally may invest up to 20% of its net assets in taxable obligations. The Fund will attempt to maintain the weighted average maturity of its portfolio securities at 3 years or less under normal market conditions. The Fund invests mainly in securities that, at the time of purchase, are either rated investment grade or are unrated and determined to be of comparable quality by the Sub-Adviser. However, the Fund may invest up to 20% of its total assets in securities that, at the time of purchase, are rated lower than investment grade or are unrated and of comparable quality, commonly referred to as “high yield” or “junk” bonds. The Fund may invest in all types of municipal bonds, including general obligation bonds, revenue bonds and participation interests in municipal leases. The Fund may invest in zero coupon bonds, which are issued at substantial discounts from their value at maturity and pay no cash income to their holders until they mature. The Fund may invest up to 15% of its net assets in municipal securities whose interest payments vary inversely with changes in short-term tax-exempt interest rates (i.e., inverse floating rate securities).
All-American, Intermediate Duration, Limited Term and Short Term may utilize futures contracts and options on futures contracts. All-American, Intermediate Duration and Limited Term may utilize swap agreements, including interest rate swaps, and options on swap agreements. The Funds may use these derivatives in an attempt to manage market risk, credit risk and yield curve risk, and to manage the effective maturity or duration of securities in each Fund’s portfolio.
The Funds’ most recent prospectus provides further descriptions of each Fund’s investment objective, principal investment strategies, and principal risks.
Significant Accounting Policies
Each Fund is an investment company and follows accounting and reporting guidance under Financial Accounting Standards Board (FASB) Accounting Standards Codification (ASC) Topic 946 “Financial Services – Investment Companies.” The following is a summary of significant accounting policies followed by the Funds in the preparation of their financial statements in accordance with accounting principles generally accepted in the United States (“U.S. GAAP”).
Investment Transactions
Investment transactions are recorded on a trade date basis. Realized gains and losses from investment transactions are determined on the specific identification method, which is the same basis used for federal income tax purposes. Investments purchased on a when-issued/delayed delivery basis may have extended settlement periods. Any investments so purchased are subject to market fluctuation during this period. The Funds have earmarked securities in their portfolios with a current value at least equal to the amount of the when-issued/delayed delivery purchase commitments.
As of the end of the reporting period, the following Funds’ outstanding when-issued/delayed delivery purchase commitments were as follows:
| | | | | | | | | | | | | | | | |
| | | All-American | | | Intermediate
Duration | | | Limited
Term | | | Short
Term | |
| Outstanding when-issued/delayed delivery purchase commitments | | $ | 41,207,924 | | | $ | 80,416,284 | | | $ | 11,864,736 | | | $ | 2,396,749 | |
Investment Income
Dividend income is recorded on the ex-dividend date. Interest income, which reflects the amortization of premiums and includes accretion of discounts for financial reporting purposes, is recorded on an accrual basis. Interest income also reflects paydown gains and losses, if any.
Professional Fees
Professional fees presented on the Statement of Operations consist of legal fees incurred in the normal course of operations, audit fees, tax consulting fees and, in some cases, workout expenditures. Workout expenditures are incurred in an attempt to protect or enhance an investment, or to pursue other claims or legal actions on behalf of Fund shareholders. If a refund is received for workout expenditures paid in a prior reporting period, such amounts will be recognized as “Legal fee refund” on the Statement of Operations.
Dividends and Distributions to Shareholders
Dividends from net investment income are declared daily and distributed to shareholders monthly. Fund shares begin to accrue dividends on the business day after the day when the monies used to purchase Fund shares are collected by the transfer agent.
Net realized capital gains and/or market discount from investment transactions, if any, are declared and distributed to shareholders at least annually. Furthermore, capital gains are distributed only to the extent they exceed available capital loss carryforwards.
Notes to Financial Statements (continued)
Distributions to shareholders of net investment income, net realized capital gains and/or market discount, if any, are recorded on the ex-dividend date. The amount and timing of distributions are determined in accordance with federal income tax regulations, which may differ from U.S. GAAP.
Share Classes and Sales Charges
Class A Shares are generally sold with an up-front sales charge and incur a 0.20% annual 12b-1 service fee. Class A Share purchases of $1 million or more for All-American, Inflation Protected and Intermediate Duration, and $250,000 or more for Limited Term and Short Term are sold at net asset value (“NAV”) without an up-front sales charge but may be subject to a contingent deferred sales charge (“CDSC”) if redeemed within eighteen months of purchase. Such CDSC will be equal to 1.00% (0.70% for Limited Term and Short Term) for any shares purchased on or after November 1, 2015 if redeemed within eighteen months of purchase. Class C Shares are sold without an up-front sales charge but incur a 0.75% annual 12b-1 distribution fee and a 0.25% annual 12b-1 service fee. The Funds will issue Class C2 Shares upon the exchange of Class C2 Shares from another Nuveen mutual fund or for the purposes of dividend reinvestment, but Class C2 Shares are not available for new accounts or for additional investment into existing accounts. Class C2 Shares incur a 0.55% (0.35% for Limited Term and Short Term) annual 12b-1 distribution fee and a 0.20% annual 12b-1 service fee. Class C and C2 Shares are subject to a CDSC of 1% if redeemed within twelve months of purchase. Class I Shares are not subject to any sales charge or 12b-1 distribution or service fees.
Multiclass Operations and Allocations
Income and expenses of the Funds that are not directly attributable to a specific class of shares are prorated among the classes based on the relative settled shares of each class. Expenses directly attributable to a class of shares are recorded to the specific class. Currently, the only expenses that are allocated on a class-specific basis are 12b-1 distribution and service fees.
Realized and unrealized capital gains and losses of the Funds are prorated among the classes based on the relative net assets of each class.
Indemnifications
Under each Trust’s organizational documents, its officers and trustees are indemnified against certain liabilities arising out of the performance of their duties to each Trust. In addition, in the normal course of business, each Trust enters into contracts that provide general indemnifications to other parties. Each Trust’s maximum exposure under these arrangements is unknown as this would involve future claims that may be made against each Trust that have not yet occurred. However, each Trust has not had prior claims or losses pursuant to these contracts and expects the risk of loss to be remote.
Netting Arrangements
In the ordinary course of business, the Funds may enter into transactions subject to enforceable International Swaps and Derivative Association, Inc. (“ISDA”) master agreements or other similar arrangements (“netting agreements”). Generally, the right to offset in netting agreements allows each Fund to offset certain securities and derivatives with a specific counterparty, when applicable, as well as any collateral received or delivered to that counterparty based on the terms of the agreements. Generally, each Fund manages its cash collateral and securities collateral on a counterparty basis.
The Funds’ investments subject to netting agreements as of the end of the reporting period, if any, are further described in Note 3 – Portfolio Securities and Investments in Derivatives.
Use of Estimates
The preparation of financial statements in conformity with U.S. GAAP requires management to make estimates and assumptions that affect the reported amounts of assets and liabilities at the date of the financial statements and the reported amounts of increases and decreases in net assets from operations during the reporting period. Actual results may differ from those estimates.
2. Investment Valuation and Fair Value Measurements
The fair valuation input levels as described below are for fair value measurement purposes.
Fair value is defined as the price that would be received upon selling an investment or transferring a liability in an orderly transaction to an independent buyer in the principal or most advantageous market for the investment. A three-tier hierarchy is used to maximize the use of observable market data and minimize the use of unobservable inputs and to establish classification of fair value measurements for disclosure purposes. Observable inputs reflect the assumptions market participants would use in pricing the asset or liability. Observable inputs are based on market data obtained from sources independent of the reporting entity. Unobservable inputs reflect the reporting entity’s own assumptions about the assumptions market participants would use in pricing the asset or liability. Unobservable inputs are based on the best information available in the circumstances. The following is a summary of the three-tiered hierarchy of valuation input levels.
| | |
| Level 1 – | | Inputs are unadjusted and prices are determined using quoted prices in active markets for identical securities. |
| Level 2 – | | Prices are determined using other significant observable inputs (including quoted prices for similar securities, interest rates, prepayment speeds, credit risk, etc.). |
| Level 3 – | | Prices are determined using significant unobservable inputs (including management’s assumptions in determining the fair value of investments). |
Prices of fixed-income securities are provided by an independent pricing service (“pricing service”) approved by the Funds’ Board of Directors/Trustees (the “Board”). The pricing service establishes a security’s fair value using methods that may include consideration of the following: yields or prices of investments of comparable quality, type of issue, coupon, maturity and rating, market quotes or indications of value from security dealers, evaluations of anticipated cash flows or collateral, general market conditions and other information and analysis, including the obligor’s credit characteristics considered relevant. These securities are generally classified as Level 2. In pricing certain securities, particularly less liquid and lower quality securities, the pricing service may consider information about a security, its issuer or market activity, provided by the Adviser. These securities are generally classified as Level 2 or Level 3 depending on the priority of the significant inputs.
Prices of swap contracts are also provided an independent pricing service approved by the Board using the same methods as described above, and are generally classified as Level 2.
Investments in investment companies are valued at their respective NAVs on valuation date and are generally classified as Level 1.
Futures contracts are valued using the closing settlement price or, in the absence of such a price, the last traded price and are generally classified as Level 1.
Certain securities may not be able to be priced by the pre-established pricing methods as described above. Such securities may be valued by the Board and/or its appointee at fair value. These securities generally include, but are not limited to, restricted securities (securities which may not be publicly sold without registration under the Securities Act of 1933, as amended) for which a pricing service is unable to provide a market price; securities whose trading has been formally suspended; debt securities that have gone into default and for which there is no current market quotation; a security whose market price is not available from a pre-established pricing source; a security with respect to which an event has occurred that is likely to materially affect the value of the security after the market has closed but before the calculation of a Fund’s NAV (as may be the case in non-U.S. markets on which the security is primarily traded) or make it difficult or impossible to obtain a reliable market quotation; and a security whose price, as provided by the pricing service, is not deemed to reflect the security’s fair value. As a general principle, the fair value of a security would appear to be the amount that the owner might reasonably expect to receive for it in a current sale. A variety of factors may be considered in determining the fair value of such securities, which may include consideration of the following: yields or prices of investments of comparable quality, type of issue, coupon, maturity and rating, market quotes or indications of value from security dealers, evaluations of anticipated cash flows or collateral, general market conditions and other information and analysis, including the obligor’s credit characteristics considered relevant. These securities are generally classified as Level 2 or Level 3 depending on the priority of the significant inputs. Regardless of the method employed to value a particular security, all valuations are subject to review by the Board and/or its appointee.
The inputs or methodologies used for valuing securities are not an indication of the risks associated with investing in those securities. The following is a summary of each Fund’s fair value measurements as of the end of the reporting period:
| | | | | | | | | | | | | | | | |
| All-American | | Level 1 | | | Level 2 | | | Level 3 | | | Total | |
| Long-Term Investments*: | | | | | | | | | | | | | | | | |
Municipal Bonds | | $ | — | | | $ | 2,997,049,187 | | | $ | — | | | $ | 2,997,049,187 | |
Corporate Bonds | | | — | | | | — | | | | 5,264 | *** | | | 5,264 | |
| Total | | $ | — | | | $ | 2,997,049,187 | | | $ | 5,264 | | | $ | 2,997,054,451 | |
| | | | |
| Inflation Protected | | | | | | | | | | | | |
| Long-Term Investments*: | | | | | | | | | | | | | | | | |
Municipal Bonds | | $ | — | | | $ | 44,852,987 | | | $ | — | | | $ | 44,852,987 | |
| Investments in Derivatives: | | | | | | | | | | | | | | | | |
Consumer Price Index Swaps** | | | — | | | | (4,642,767 | ) | | | — | | | | (4,642,767 | ) |
| Total | | $ | — | | | $ | 40,210,220 | | | $ | — | | | $ | 40,210,220 | |
| | | | |
| Intermediate Duration | | | | | | | | | | | | |
| Long-Term Investments*: | | | | | | | | | | | | | | | | |
Municipal Bonds | | $ | — | | | $ | 5,107,043,360 | | | $ | — | | | $ | 5,107,043,360 | |
Corporate Bonds | | | — | | | | — | | | | 8,110 | *** | | | 8,110 | |
Investment Companies | | | 14,995,050 | | | | — | | | | — | | | | 14,995,050 | |
| Short-Term Investments*: | | | | | | | | | | | | | | | | |
Municipal Bonds | | | — | | | | 30,898,941 | | | | — | | | | 30,898,941 | |
| Total | | $ | 14,995,050 | | | $ | 5,137,942,301 | | | $ | 8,110 | | | $ | 5,152,945,461 | |
Notes to Financial Statements (continued)
| | | | | | | | | | | | | | | | |
| Limited Term | | Level 1 | | | Level 2 | | | Level 3 | | | Total | |
| Long-Term Investments*: | | | | | | | | | | | | | | | | |
Municipal Bonds | | $ | — | | | $ | 4,361,434,850 | | | $ | — | | | $ | 4,361,434,850 | |
Corporate Bonds | | | — | | | | — | | | | 5,001 | *** | | | 5,001 | |
Investment Companies | | | 34,588,974 | | | | — | | | | — | | | | 34,588,974 | |
| Short-Term Investments*: | | | | | | | | | | | | | | | | |
Municipal Bonds | | | — | | | | 37,503,166 | | | | — | | | | 37,503,166 | |
| Total | | $ | 34,588,974 | | | $ | 4,398,938,016 | | | $ | 5,001 | | | $ | 4,433,531,991 | |
| | | | |
| Short Term | | Level 1 | | | Level 2 | | | Level 3 | | | Total | |
| Long-Term Investments*: | | | | | | | | | | | | | | | | |
Municipal Bonds | | $ | — | | | $ | 617,636,152 | | | $ | — | | | $ | 617,636,152 | |
Investment Companies | | | 12,396,056 | | | | — | | | | — | | | | 12,396,056 | |
| Short-Term Investments*: | | | | | | | | | | | | | | | | |
Money Market Funds | | | 2,338,807 | | | | — | | | | — | | | | 2,338,807 | |
Municipal Bonds | | | — | | | | 10,777,927 | | | | — | | | | 10,777,927 | |
Total | | $ | 14,734,863 | | | $ | 628,414,079 | | | $ | — | | | $ | 643,148,942 | |
| * | Refer to the Fund’s Portfolio of Investments for state and/or industry classifications, where applicable. |
| ** | Represents net unrealized appreciation (depreciation) as reported in the Fund’s Portfolio of Investments. |
| *** | Refer to the Fund’s Portfolio of Investments for securities classified as Level 3. |
The Board is responsible for the valuation process and has appointed the oversight of the daily valuation process to the Adviser’s Valuation Committee. The Valuation Committee, pursuant to the valuation policies and procedures adopted by the Board, is responsible for making fair value determinations, evaluating the effectiveness of the Funds’ pricing policies and reporting to the Board. The Valuation Committee is aided in its efforts by the Adviser’s dedicated Securities Valuation Team, which is responsible for administering the daily valuation process and applying fair value methodologies as approved by the Valuation Committee. When determining the reliability of independent pricing services for investments owned by the Funds, the Valuation Committee, among other things, conducts due diligence reviews of the pricing services and monitors the quality of security prices received through various testing reports conducted by the Securities Valuation Team.
The Valuation Committee will consider pricing methodologies it deems relevant and appropriate when making a fair value determination, based on the facts and circumstances specific to the portfolio instrument. Fair value determinations generally will be derived as follows, using public or private market information:
| | (i) | If available, fair value determinations shall be derived by extrapolating from recent transactions or quoted prices for identical or comparable securities. |
| | (ii) | If such information is not available, an analytical valuation methodology may be used based on other available information including, but not limited to: analyst appraisals, research reports, corporate action information, issuer financial statements and shelf registration statements. Such analytical valuation methodologies may include, but are not limited to: multiple of earnings, discount from market value of a similar freely-traded security, discounted cash flow analysis, book value or a multiple thereof, risk premium/yield analysis, yield to maturity and/or fundamental investment analysis. |
The purchase price of a portfolio instrument will be used to fair value the instrument only if no other valuation methodology is available or deemed appropriate, and it is determined that the purchase price fairly reflects the instrument’s current value.
For each portfolio security that has been fair valued pursuant to the policies adopted by the Board, the fair value price is compared against the last available and next available market quotations. The Valuation Committee reviews the results of such testing and fair valuation occurrences are reported to the Board.
3. Portfolio Securities and Investments in Derivatives
Portfolio Securities
Inverse Floating Rate Securities
Each Fund, other than Inflation Protected, is authorized to invest in inverse floating rate securities. An inverse floating rate security is created by depositing a municipal bond (referred to as an “Underlying Bond”), typically with a fixed interest rate, into a special purpose tender option bond (“TOB”) trust (referred to as the “TOB Trust”) created by or at the direction of one or more Funds. In turn, the TOB Trust issues (a) floating rate certificates (referred to as “Floaters”), in face amounts equal to some fraction of the Underlying Bond’s par amount or market value, and (b) an inverse floating rate certificate (referred to as an “Inverse Floater”) that represents all remaining or residual interest in the TOB Trust. Floaters typically pay short-term tax-exempt interest rates to third parties who are also provided a right to tender their certificate and receive its par value, which may be paid from the proceeds of a remarketing of the Floaters, by a loan to the TOB Trust from a third party liquidity provider (“Liquidity Provider”), or by the sale of assets from the TOB Trust. The Inverse Floater is issued to a long term investor, such as one or more of the Funds. The income received by the Inverse Floater holder varies inversely with the short-term rate paid to holders of the Floaters, and in most circumstances the Inverse Floater holder
bears substantially all of the Underlying Bond’s downside investment risk and also benefits disproportionately from any potential appreciation of the Underlying Bond’s value. The value of an Inverse Floater will be more volatile than that of the Underlying Bond because the interest rate is dependent on not only the fixed coupon rate of the Underlying Bond but also on the short-term interest paid on the Floaters, and because the Inverse Floater essentially bears the risk of loss (and possible gain) of the greater face value of the Underlying Bond.
The Inverse Floater held by a Fund gives the Fund the right to (a) cause the holders of the Floaters to tender their certificates at par (or slightly more than par in certain circumstances), and (b) have the trustee of the TOB Trust (the “Trustee”) transfer the Underlying Bond held by the TOB Trust to the Fund, thereby collapsing the TOB Trust.
The Fund may acquire an Inverse Floater in a transaction where it (a) transfers an Underlying Bond that it owns to a TOB Trust created by a third party or (b) transfers an Underlying Bond that it owns, or that it has purchased in a secondary market transaction for the purpose of creating an Inverse Floater, to a TOB Trust created at its direction, and in return receives the Inverse Floater of the TOB Trust (referred to as a “self-deposited Inverse Floater”). A Fund may also purchase an Inverse Floater in a secondary market transaction from a third party creator of the TOB Trust without first owning the Underlying Bond (referred to as an “externally-deposited Inverse Floater”).
An investment in a self-deposited Inverse Floater is accounted for as a “financing” transaction (i.e., a secured borrowing). For a self-deposited Inverse Floater, the Underlying Bond deposited into the TOB Trust is identified in the Fund’s Portfolio of Investments as “(UB) – Underlying bond of an inverse floating rate trust reflected as a financing transaction,” with the Fund recognizing as liabilities, labeled “Floating rate obligations” on the Statement of Assets and Liabilities, (a) the liquidation value of Floaters issued by the TOB Trust, and (b) the amount of any borrowings by the TOB Trust from a Liquidity Provider to enable the TOB Trust to purchase outstanding Floaters in lieu of a remarketing. In addition, the Fund recognizes in “Investment Income” the entire earnings of the Underlying Bond, and recognizes (a) the interest paid to the holders of the Floaters or on the TOB Trust’s borrowings, and (b) other expenses related to remarketing, administration, trustee, liquidity and other services to a TOB Trust, as a component of “Interest expense” on the Statement of Operations.
In contrast, an investment in an externally-deposited Inverse Floater is accounted for as a purchase of the Inverse Floater and is identified in the Fund’s Portfolio of Investments as “(IF) – Inverse floating rate investment.” For an externally-deposited Inverse Floater, a Fund’s Statement of Assets and Liabilities recognizes the Inverse Floater and not the Underlying Bond as an asset, and the Fund does not recognize the Floaters, or any related borrowings from a Liquidity Provider, as a liability. Additionally, the Fund reflects in “Investment Income” only the net amount of earnings on the Inverse Floater (net of the interest paid to the holders of the Floaters or the Liquidity Provider as lender, and the expenses of the Trust), and does not show the amount of that interest paid or the expenses of the TOB Trust as described above as interest expense on the Statement of Operations.
Fees paid upon the creation of a TOB Trust for self-deposited Inverse Floaters and externally-deposited Inverse Floaters are recognized as part of the cost basis of the Inverse Floater and are capitalized over the term of the TOB Trust.
As of the end of the reporting period, the aggregate value of Floaters issued by each Fund’s TOB Trust for self-deposited Inverse Floaters and externally-deposited Inverse Floaters was as follows:
| | | | | | | | | | | | | | | | |
| Floating Rate Obligations Outstanding | | All-American | | | Intermediate
Duration | | | Limited
Term | | | Short
Term | |
| Floating rate obligations: self-deposited Inverse Floaters | | $ | 67,370,000 | | | $ | — | | | $ | — | | | $ | — | |
| Floating rate obligations: externally-deposited Inverse Floaters | | | 91,775,000 | | | | 23,740,000 | | | | — | | | | — | |
| Total | | $ | 159,145,000 | | | $ | 23,740,000 | | | $ | — | | | $ | — | |
During the current fiscal period, the average amount of Floaters (including any borrowings from a Liquidity Provider) outstanding and average annual interest rate and fees related to self-deposited Inverse Floaters, were as follows:
| | | | | | | | | | | | | | | | |
| Self-Deposited Inverse Floaters | | All-American | | | Intermediate
Duration | | | Limited
Term | | | Short
Term | |
| Average floating rate obligations outstanding | | $ | 12,765,642 | | | $ | — | | | $ | — | | | $ | — | |
| Average annual interest rate and fees | | | 0.72 | % | | | — | % | | | — | % | | | — | % |
TOB Trusts are supported by a liquidity facility provided by a Liquidity Provider pursuant to which the Liquidity Provider agrees, in the event that Floaters are (a) tendered to the Trustee for remarketing and the remarketing does not occur, or (b) subject to mandatory tender pursuant to the terms of the TOB Trust agreement, to either purchase Floaters or to provide the Trustee with an advance from a loan facility to fund the purchase of Floaters by the TOB Trust. In certain circumstances, the Liquidity Provider may otherwise elect to have the Trustee sell the Underlying Bond to retire the Floaters that were tendered and not remarketed prior to providing such a loan. In these circumstances, the Liquidity Provider remains obligated to provide a loan to the extent that the proceeds of the sale of the Underlying Bond are not sufficient to pay the purchase price of the Floaters.
The size of the commitment under the loan facility for a given TOB Trust is at least equal to the balance of that TOB Trust’s outstanding Floaters plus any accrued interest. In consideration of the loan facility, fee schedules are in place and are charged by the Liquidity Provider(s). Any loans made by the Liquidity Provider will be secured by the purchased Floaters held by the TOB Trust. Interest paid on any outstanding loan balances will be effectively borne by the Fund that owns the Inverse Floaters of the TOB Trust that has incurred the borrowing and may be at a rate that is greater than the rate that would have been paid had the Floaters been successfully remarketed.
Notes to Financial Statements (continued)
As described above, any amounts outstanding under a liquidity facility are recognized as a component of “Floating rate obligations” on the Statement of Assets and Liabilities by the Fund holding the corresponding Inverse Floaters issued by the borrowing TOB Trust. As of the end of the reporting period, there were no loans outstanding under any such facility.
Each Fund may also enter into shortfall and forbearance agreements (sometimes referred to as a “recourse arrangement” or “credit recovery swap”) (TOB Trusts involving such agreements are referred to herein as “Recourse Trusts”), under which a Fund agrees to reimburse the Liquidity Provider for the Trust’s Floaters, in certain circumstances, for the amount (if any) by which the liquidation value of the Underlying Bond held by the TOB Trust may fall short of the sum of the liquidation value of the Floaters issued by the TOB Trust plus any amounts borrowed by the TOB Trust from the Liquidity Provider, plus any shortfalls in interest cash flows. Under these agreements, a Fund’s potential exposure to losses related to or on an Inverse Floater may increase beyond the value of the Inverse Floater as a Fund may potentially be liable to fulfill all amounts owed to holders of the Floaters or the Liquidity Provider. Any such shortfall amount in the aggregate is recognized as “Unrealized depreciation on Recourse Trusts” on the Statement of Assets and Liabilities.
As of the end of the reporting period, each Fund’s maximum exposure to the Floaters issued by Recourse Trusts for self-deposited Inverse Floaters and externally-deposited Inverse Floaters was as follows:
| | | | | | | | | | | | | | | | |
| Floating Rate Obligations-Recourse Trusts | | All-American | | | Intermediate
Duration | | | Limited
Term | | | Short
Term | |
| Maximum exposure to Recourse Trusts: self-deposted Inverse Floaters | | $ | 52,370,000 | | | $ | — | | | $ | — | | | $ | — | |
| Maximum exposure to Recourse Trusts: externally-deposited Inverse Floaters | | | 39,215,000 | | | | 19,095,000 | | | | — | | | | — | |
| Total | | $ | 91,585,000 | | | $ | 19,095,000 | | | $ | — | | | $ | — | |
Zero Coupon Securities
A zero coupon security does not pay a regular interest coupon to its holders during the life of the security. Income to the holder of the security comes from accretion of the difference between the original purchase price of the security at issuance and the par value of the security at maturity and is effectively paid at maturity. The market prices of zero coupon securities generally are more volatile than the market prices of securities that pay interest periodically.
Investments in Derivatives
In addition to the inverse floating rate securities in which certain Funds may invest, which are considered portfolio securities for financial reporting purposes, each Fund is authorized to invest in certain derivative instruments. The Funds record derivative instruments at fair value, with changes in fair value recognized on the Statement of Operations, when applicable. Even though the Funds’ investments in derivatives may represent economic hedges, they are not considered to be hedge transactions for financial reporting purposes.
Futures Contracts
Upon execution of a futures contract, the Fund is obligated to deposit cash or eligible securities, also known as “initial margin,” into an account at its clearing broker equal to a specified percentage of the contract amount. Cash held by the broker to cover initial margin requirements on open futures contracts, if any, is recognized as “Cash collateral at brokers” on the Statement of Assets and Liabilities. Investments in futures contracts obligate the Fund and the clearing broker to settle monies on a daily basis representing changes in the prior days “mark-to-market” of the open contracts. If the Fund has unrealized appreciation the clearing broker would credit the Fund’s account with an amount equal to appreciation and conversely if the Fund has unrealized depreciation the clearing broker would debit the Fund’s account with an amount equal to depreciation. These daily cash settlements are also known as “variation margin.” Variation margin is recognized as a receivable and/or payable for “Variation margin on futures contracts” on the Statement of Assets and Liabilities.
During the period the futures contract is open, changes in the value of the contract are recognized as an unrealized gain or loss by “marking-to-market” on a daily basis to reflect the changes in market value of the contract, which is recognized as a component of “Change in net unrealized appreciation (depreciation) of futures contracts” on the Statement of Operations. When the contract is closed or expired, the Fund records a realized gain or loss equal to the difference between the value of the contract on the closing date and value of the contract when originally entered into, which is recognized as a component of “Net realized gain (loss) from futures contracts” on the Statement of Operations.
Risks of investments in futures contracts include the possible adverse movement in the price of the securities or indices underlying the contracts, the possibility that there may not be a liquid secondary market for the contracts and/or that a change in the value of the contract may not correlate with a change in the value of the underlying securities or indices.
During the current fiscal period, Intermediate Duration invested in interest rate futures contracts, which were used to help manage the duration of its portfolio.
The average notional amount of futures contracts outstanding during the current fiscal period was as follows:
| | | | |
| | | Intermediate
Duration | |
| Average notional amount of futures contracts outstanding* | | $ | 7,437,784 | |
| * | The average notional amount is calculated based on the absolute aggregate notional amount of contracts outstanding at the beginning of the fiscal period and at the end of each fiscal quarter within the current fiscal period. |
The following table presents the amount of net realized gain (loss) and change in net unrealized appreciation (depreciation) recognized on futures contracts on the Statement of Operations during the current fiscal period, and the primary underlying risk exposure.
| | | | | | | | | | | | |
| Fund | | Underlying Risk Exposure | | Derivative
Instrument | | Net Realized Gain (Loss)
from Futures Contracts | | | Change in Net Unrealized
Appreciation (Depreciation)
of Futures Contracts | |
| Intermediate Duration | | Interest rate | | Futures contracts | | $ | 617,735 | | | $ | — | |
Consumer Price Index Swaps
Inflation Protected seeks to hedge inflation risk by investing in inflation-linked instruments, such as CPI swaps, in amounts sufficient to approximate the duration characteristics of the Fund’s underlying municipal bond portfolio. A CPI swap is a fixed maturity, over-the-counter derivative in which the Fund pays to the counterparty a predetermined fixed annualized rate over the life of the CPI swap and receives in return the “realized” rate of inflation as measured by the CPI for All Urban Consumers Non-Seasonally Adjusted over the life of the swap. The Fund will benefit from a CPI swap if actual inflation during the swap’s period is greater than the level of inflation expected for that period at the time the swap was entered into, and conversely the Fund will lose money on a CPI swap if actual inflation turns out to be less than expected.
The amount of the payment obligation is based on the notional amount of the CPI swap contract and the termination date of the swap (which is akin to a bond’s maturity). CPI swap contracts are valued daily. The net amount recorded on these transactions, for each counterparty, is recognized on the Statement of Assets and Liabilities as a component of “Unrealized appreciation or depreciation on consumer price index swaps (,net)” with the change during the fiscal period recognized on the Statement of Operations as a component of “Change in net unrealized appreciation (depreciation) of swaps.”
Upon the termination of a swap contract, a realized gain or loss is recognized. When a CPI swap is terminated, it ordinarily does not involve the delivery of securities or other underlying assets or principal, but rather is settled in cash on a net basis. Net realized gains and losses during the fiscal period are recognized on the Statement of Operations as a component of “Net realized gain (loss) from swaps.” Accordingly, the risk of loss with respect to the swap counterparty on such transactions is limited to the credit risk associated with a counterparty failing to honor its commitment to pay any realized gain to the Fund upon termination.
During the current fiscal period, Inflation Protected continued to invest in CPI swap contracts to hedge against fluctuations in inflation expectations, which can influence bond prices, and realized inflation.
The average notional amount of CPI swap contracts outstanding during the current fiscal period, was as follows:
| | | | |
| | | Inflation
Protected | |
| Average notional amount of CPI swap contracts outstanding* | | $ | 51,450,000 | |
| * | The average notional amount is calculated based on the outstanding notional at the beginning of the fiscal period and at the end of each fiscal quarter within the current fiscal period. |
Credit Default Swaps
A Fund may enter into a credit default swap contract to seek to maintain a total return on a particular investment or portion of its portfolio, or to take an active long or short position with respect to the likelihood of a particular issuer’s default. Credit default swap contracts involve one party making a stream of payments to another party in exchange for the right to receive a specified return if/when there is a credit event by a third party. Generally, a credit event means bankruptcy, failure to pay, or restructuring. The specific credit events applicable for each credit default swap are stated in the terms of the particular swap agreement. Upon occurrence of a specific credit event with respect to the underlying referenced entity, the Fund will either (i) receive that security, or an equivalent amount of cash, from the counterparty in exchange for payment of the notional amount to the counterparty, or (ii) pay a net settlement amount of the credit default swap contract less the recovery value of the referenced obligation or underlying securities comprising the referenced index. The difference between the value of the security delivered and the notional amount received is recorded as a realized gain or loss. Payments received or made at the beginning of the measurement period are recognized as a component of “Credit default swaps premiums paid and/or received” on the Statement of Assets and Liabilities, when applicable.
Credit default swap contracts are valued daily. Changes in the value of a credit default swap during the fiscal period are recognized as a component of “Change in net unrealized appreciation (depreciation) of swaps” and realized gains and losses are recognized as a component of “Net realized gain (loss) from swaps” on the Statement of Operations.
For OTC swaps not cleared through a clearing house (“OTC Uncleared”), the daily change in the market value of the swap contract, along with any daily interest fees accrued, are recognized as components of “Unrealized appreciation or depreciation on credit default swaps (, net)” on the Statement of Assets and Liabilities.
Upon the execution of an OTC swap cleared through a clearing house (“OTC Cleared”), a Fund is obligated to deposit cash or eligible securities, also known as “initial margin,” into an account at its clearing broker equal to a specified percentage of the contract amount. Cash held by the broker to cover initial margin requirements on open swap contracts, if any, is recognized as “Cash collateral at brokers” on the Statement of Assets and Liabilities. Investments in OTC Cleared swaps obligate a Fund and the clearing broker to settle monies on a daily basis representing changes in the
Notes to Financial Statements (continued)
prior day’s “mark-to-market” of the swap. If a Fund has unrealized appreciation the clearing broker would credit the Fund’s account with an amount equal to the appreciation and conversely if a Fund has unrealized depreciation the clearing broker would debit a Fund’s account with an amount equal to the depreciation. These daily cash settlements are also known as “variation margin.” Variation margin for OTC Cleared swaps is recognized as a receivable and/or payable for “Variation margin on swap contracts” on the Statement of Assets and Liabilities. Upon the execution of an OTC Uncleared swap, neither the Fund nor the counterparty is required to deposit initial margin as the trades are recorded bilaterally between both parties to the swap contract, and the terms of the variation margin are subject to a predetermined threshold negotiated by the Fund and the counterparty. Variation margin for OTC Uncleared swaps is recognized as a component of “Unrealized appreciation or depreciation on credit default swaps (, net)” as described in the preceding paragraph. The maximum potential amount of future payments the Fund could incur as a buyer or seller of protection in a credit default swap contract is limited to the notional amount of the contract. The maximum potential amount would be offset by the recovery value, if any, of the respective referenced entity.
During the current fiscal period, Inflation Protected was invested in credit default swaps to manage credit risk.
The average notional amount of credit default swap contracts outstanding during the current fiscal period, was as follows:
| | | | |
| | | Inflation
Protected | |
| Average notional amount of credit default swap contracts outstanding* | | $ | 103,000 | |
| * | The average notional amount is calculated based on the outstanding notional at the beginning of the fiscal period and at the end of each fiscal quarter within the current fiscal period. |
The following table presents the fair value of all swap contracts held by the Funds as of the end of the reporting period, the location of these instruments on the Statement of Assets and Liabilities and the primary underlying risk exposure.
| | | | | | | | | | | | | | |
| | | | | Location on the Statement of Asset and Liabilities | |
| | | | | Asset Derivatives | | | (Liability) Derivatives | |
Underlying
Risk Exposure | | Derivative Instrument | | Location | | Value | | | Location | | Value | |
Inflation Protected | | | | | | | | | | | | | | |
Inflation | | Swaps | | — | | $ | — | | | Unrealized depreciation on
consumer price index swaps | | $ | (4,642,767 | ) |
The following table presents the swap contracts subject to netting agreements and the collateral delivered related to those swap contracts, as of the end of the reporting period.
| | | | | | | | | | | | | | | | | | | | | | | | | | |
| Fund | | Counterparty | | Gross
Unrealized
Appreciation on
CPI Swaps** | | | Gross
Unrealized
(Depreciation) on
CPI Swaps** | | | Amounts
Netted on
Statement of
Assets and
Liabilities | | | Net
Unrealized
Appreciation
(Depreciation)
on CPI Swaps | | | Collateral
Pledged
to (from)
Counterparty | | | Net
Exposure | |
| Inflation Protected | | | | | | | | | | | | | | | | | | | | | | | | |
| | Barclays Bank PLC | | $ | — | | | $ | (3,091,918 | ) | | $ | — | | | $ | (3,091,918 | ) | | $ | 3,091,918 | | | $ | — | |
| | | Morgan Stanley & Co. LLC | | | — | | | | (1,550,849 | ) | | | — | | | | (1,550,849 | ) | | | 1,550,849 | | | | — | |
Total | | | | $ | — | | | $ | (4,642,767 | ) | | $ | — | | | $ | (4,642,767 | ) | | $ | 4,642,767 | | | $ | — | |
| ** | Represents gross unrealized appreciation (depreciation) for the counterparty as reported in the Fund’s Portfolio of Investments. |
The following table presents the amount of net realized gain (loss) and change in net unrealized appreciation (depreciation) recognized on swap contracts on the Statement of Operations during the current fiscal period, and the primary underlying risk exposure.
| | | | | | | | | | | | |
| Fund | | Underlying
Risk Exposure | | Derivative
Instrument | | Net Realized
Gain (Loss) from
Swaps | | | Change in Net Unrealized
Appreciation (Depreciation) of
Swaps | |
Inflation Protected | | Credit | | Swaps | | $ | 39,443 | | | $ | (42,805 | ) |
| | | Inflation | | Swaps | | | (900,900 | ) | | | (136,654 | ) |
| Total | | | | | | $ | (861,457 | ) | | $ | (179,459 | ) |
Market and Counterparty Credit Risk
In the normal course of business each Fund may invest in financial instruments and enter into financial transactions where risk of potential loss exists due to changes in the market (market risk) or failure of the other party to the transaction to perform (counterparty credit risk). The potential loss could exceed the value of the financial assets recorded on the financial statements. Financial assets, which potentially expose each Fund to counterparty credit risk, consist principally of cash due from counterparties on forward, option and swap transactions, when applicable. The extent of each Fund’s exposure to counterparty credit risk in respect to these financial assets approximates their carrying value as recorded on the Statement of Assets and Liabilities.
Each Fund helps manage counterparty credit risk by entering into agreements only with counterparties the Adviser believes have the financial resources to honor their obligations and by having the Adviser monitor the financial stability of the counterparties. Additionally, counterparties may be
required to pledge collateral daily (based on the daily valuation of the financial asset) on behalf of each Fund with a value approximately equal to the amount of any unrealized gain above a pre-determined threshold. Reciprocally, when each Fund has an unrealized loss, the Funds have instructed the custodian to pledge assets of the Funds as collateral with a value approximately equal to the amount of the unrealized loss above a pre-determined threshold. Collateral pledges are monitored and subsequently adjusted if and when the valuations fluctuate, either up or down, by at least the pre-determined threshold amount.
4. Fund Shares
Transactions in Fund shares during the current and prior fiscal period were as follows:
| | | | | | | | | | | | | | | | |
| | | Year Ended
4/30/16 | | | Year Ended
4/30/15 | |
| All-American | | Shares | | | Amount | | | Shares | | | Amount | |
| Shares sold: | | | | | | | | | | | | | | | | |
Class A | | | 26,189,331 | | | $ | 303,700,651 | | | | 17,881,976 | | | $ | 206,831,082 | |
Class A – automatic conversion of Class B Shares | | | — | | | | — | | | | 187,266 | | | | 2,119,899 | |
Class B – exchanges | | | — | | | | — | | | | 46 | | | | 523 | |
Class C | | | 6,352,698 | | | | 73,700,023 | | | | 3,922,006 | | | | 45,359,571 | |
Class C2 | | | 330,060 | | | | 3,816,081 | | | | 409,484 | | | | 4,731,991 | |
Class I | | | 35,359,487 | | | | 411,928,947 | | | | 22,905,515 | | | | 265,424,082 | |
| Shares issued to shareholders due to reinvestment of distributions: | | | | | | | | | | | | | | | | |
Class A | | | 2,885,157 | | | | 33,420,518 | | | | 2,783,235 | | | | 32,130,804 | |
Class B | | | — | | | | — | | | | 428 | | | | 4,890 | |
Class C | | | 152,654 | | | | 1,772,587 | | | | 52,877 | | | | 613,647 | |
Class C2 | | | 612,128 | | | | 7,088,017 | | | | 739,010 | | | | 8,532,228 | |
Class I | | | 2,216,983 | | | | 25,792,917 | | | | 2,073,426 | | | | 24,040,263 | |
| | | | 74,098,498 | | | | 861,219,741 | | | | 50,955,269 | | | | 589,788,980 | |
| Shares redeemed: | | | | | | | | | | | | | | | | |
Class A | | | (15,366,035 | ) | | | (177,885,059 | ) | | | (16,086,340 | ) | | | (185,017,033 | ) |
Class B | | | — | | | | — | | | | (11,686 | ) | | | (132,181 | ) |
Class B – automatic conversion to Class A Shares | | | — | | | | — | | | | (186,936 | ) | | | (2,119,899 | ) |
Class C | | | (861,607 | ) | | | (9,980,363 | ) | | | (225,896 | ) | | | (2,631,153 | ) |
Class C2 | | | (3,223,474 | ) | | | (37,255,560 | ) | | | (4,177,185 | ) | | | (48,085,489 | ) |
Class I | | | (15,518,674 | ) | | | (180,171,437 | ) | | | (12,672,465 | ) | | | (146,746,355 | ) |
| | | | (34,969,790 | ) | | | (405,292,419 | ) | | | (33,360,508 | ) | | | (384,732,110 | ) |
| Net increase (decrease) | | | 39,128,708 | | | $ | 455,927,322 | | | | 17,594,761 | | | $ | 205,056,870 | |
| | |
| | | Year Ended
4/30/16 | | | Year Ended
4/30/15 | |
| Inflation Protected | | Shares | | | Amount | | | Shares | | | Amount | |
| Shares sold: | | | | | | | | |
Class A | | | 446,907 | | | $ | 4,685,786 | | | | 814,867 | | | $ | 8,835,261 | |
Class C | | | 14,811 | | | | 155,125 | | | | 114,397 | | | | 1,242,761 | |
Class C2 | | | 2 | | | | 6 | | | | 11,404 | | | | 123,251 | |
Class I | | | 461,989 | | | | 4,829,823 | | | | 1,140,754 | | | | 12,494,791 | |
| Shares issued to shareholders due to reinvestment of distributions: | | | | | | | | | | | | | | | | |
Class A | | | 50,564 | | | | 530,547 | | | | 61,354 | | | | 664,688 | |
Class C | | | 1,826 | | | | 19,135 | | | | 1,133 | | | | 12,163 | |
Class C2 | | | 12,313 | | | | 129,111 | | | | 14,973 | | | | 162,154 | |
Class I | | | 38,368 | | | | 403,064 | | | | 64,084 | | | | 695,002 | |
| | | | 1,026,780 | | | | 10,752,597 | | | | 2,222,966 | | | | 24,230,071 | |
| Shares redeemed: | | | | | | | | | | | | | | | | |
Class A | | | (769,441 | ) | | | (8,045,793 | ) | | | (1,288,469 | ) | | | (13,932,743 | ) |
Class C | | | (53,564 | ) | | | (559,729 | ) | | | (11,092 | ) | | | (118,268 | ) |
Class C2 | | | (190,400 | ) | | | (1,998,117 | ) | | | (251,571 | ) | | | (2,715,833 | ) |
Class I | | | (1,047,187 | ) | | | (10,948,863 | ) | | | (1,614,542 | ) | | | (17,290,944 | ) |
| | | | (2,060,592 | ) | | | (21,552,502 | ) | | | (3,165,674 | ) | | | (34,057,788 | ) |
| Net increase (decrease) | | | (1,033,812 | ) | | $ | (10,799,905 | ) | | | (942,708 | ) | | $ | (9,827,717 | ) |
Notes to Financial Statements (continued)
| | | | | | | | | | | | | | | | |
| | | Year Ended
4/30/16 | | | Year Ended
4/30/15 | |
| Intermediate Duration | | Shares | | | Amount | | | Shares | | | Amount | |
| Shares sold: | | | | | | | | | | | | | | | | |
Class A | | | 69,529,013 | | | $ | 648,344,302 | | | | 49,083,204 | | | $ | 452,283,382 | |
Class A – automatic conversion of Class B Shares | | | — | | | | — | | | | 118,455 | | | | 1,083,860 | |
Class B – exchanges | | | — | | | | — | | | | 52 | | | | 481 | |
Class C | | | 2,228,982 | | | | 20,656,289 | | | | 1,811,412 | | | | 16,765,697 | |
Class C2 | | | 167,761 | | | | 1,552,886 | | | | 267,428 | | | | 2,477,514 | |
Class I | | | 104,009,468 | | | | 964,344,775 | | | | 90,319,681 | | | | 836,458,602 | |
| Shares issued to shareholders due to reinvestment of distributions: | | | | | | | | | | | | | | | | |
Class A | | | 2,068,713 | | | | 19,160,080 | | | | 2,893,107 | | | | 26,753,963 | |
Class B | | | — | | | | — | | | | 158 | | | | 1,462 | |
Class C | | | 45,037 | | | | 417,557 | | | | 16,699 | | | | 154,818 | |
Class C2 | | | 172,693 | | | | 1,599,448 | | | | 202,855 | | | | 1,879,382 | |
Class I | | | 7,006,982 | | | | 64,963,843 | | | | 6,771,916 | | | | 62,768,820 | |
| | | | 185,228,649 | | | | 1,721,039,180 | | | | 151,484,967 | | | | 1,400,627,981 | |
| Shares redeemed: | | | | | | | | | | | | | | | | |
Class A | | | (40,835,311 | ) | | | (376,294,309 | ) | | | (64,229,621 | ) | | | (594,646,460 | ) |
Class B | | | — | | | | — | | | | (10,151 | ) | | | (93,128 | ) |
Class B – automatic conversion to Class A Shares | | | — | | | | — | | | | (118,068 | ) | | | (1,083,860 | ) |
Class C | | | (462,697 | ) | | | (4,281,899 | ) | | | (173,822 | ) | | | (1,607,168 | ) |
Class C2 | | | (1,789,899 | ) | | | (16,530,799 | ) | | | (2,142,664 | ) | | | (19,821,017 | ) |
Class I | | | (75,263,910 | ) | | | (696,478,004 | ) | | | (61,101,487 | ) | | | (566,422,037 | ) |
| | | | (118,351,817 | ) | | | (1,093,585,011 | ) | | | (127,775,813 | ) | | | (1,183,673,670 | ) |
| Net increase (decrease) | | | 66,876,832 | | | $ | 627,454,169 | | | | 23,709,154 | | | $ | 216,954,311 | |
| | |
| | | Year Ended
4/30/16 | | | Year Ended
4/30/15 | |
| Limited Term | | Shares | | | Amount | | | Shares | | | Amount | |
| Shares sold: | | | | | | | | | | | | | | | | |
Class A | | | 32,531,866 | | | $ | 361,340,996 | | | | 34,710,016 | | | $ | 386,982,851 | |
Class C | | | 4,483,492 | | | | 49,594,953 | | | | 4,198,352 | | | | 46,625,207 | |
Class C2 | | | 338,009 | | | | 3,733,436 | | | | 452,759 | | | | 5,029,160 | |
Class I | | | 109,078,079 | | | | 1,205,076,878 | | | | 92,453,352 | | | | 1,025,774,699 | |
| Shares issued to shareholders due to reinvestment of distributions: | | | | | | | | | | | | | | | | |
Class A | | | 1,664,294 | | | | 18,481,106 | | | | 1,708,836 | | | | 19,053,083 | |
Class C | | | 56,544 | | | | 625,394 | | | | 28,228 | | | | 313,522 | |
Class C2 | | | 463,720 | | | | 5,131,676 | | | | 558,740 | | | | 6,208,595 | |
Class I | | | 2,650,428 | | | | 29,305,295 | | | | 2,070,899 | | | | 22,982,851 | |
| | | | 151,266,432 | | | | 1,673,289,734 | | | | 136,181,182 | | | | 1,512,969,968 | |
| Shares redeemed: | | | | | | | | | | | | | | | | |
Class A | | | (31,279,111 | ) | | | (347,089,036 | ) | | | (46,199,189 | ) | | | (514,996,900 | ) |
Class C | | | (1,119,931 | ) | | | (12,377,432 | ) | | | (401,002 | ) | | | (4,453,746 | ) |
Class C2 | | | (7,107,002 | ) | | | (78,576,547 | ) | | | (9,522,071 | ) | | | (105,782,059 | ) |
Class I | | | (66,050,033 | ) | | | (729,849,756 | ) | | | (54,435,890 | ) | | | (604,000,591 | ) |
| | | | (105,556,077 | ) | | | (1,167,892,771 | ) | | | (110,558,152 | ) | | | (1,229,233,296 | ) |
| Net increase (decrease) | | | 45,710,355 | | | $ | 505,396,963 | | | | 25,623,030 | | | $ | 283,736,672 | |
| | | | | | | | | | | | | | | | |
| | | Year Ended
4/30/16 | | | Year Ended
4/30/15 | |
| Short Term | | Shares | | | Amount | | | Shares | | | Amount | |
| Shares sold: | | | | | | | | | | | | | | | | |
Class A | | | 6,266,698 | | | | 63,318,982 | | | | 8,586,124 | | | $ | 87,155,010 | |
Class C | | | 559,288 | | | | 5,643,547 | | | | 429,077 | | | | 4,347,843 | |
Class C2 | | | 210,818 | | | | 2,123,006 | | | | 95,624 | | | | 969,580 | |
Class I | | | 17,816,471 | | | | 180,224,458 | | | | 28,902,371 | | | | 293,467,350 | |
| Shares issued to shareholders due to reinvestment of distributions: | | | | | | | | | | | | | | | | |
Class A | | | 135,272 | | | | 1,367,482 | | | | 168,492 | | | | 1,710,132 | |
Class C | | | 1,422 | | | | 14,344 | | | | 1,445 | | | | 14,637 | |
Class C2 | | | 8,423 | | | | 85,048 | | | | 13,127 | | | | 133,105 | |
Class I | | | 187,817 | | | | 1,899,720 | | | | 202,092 | | | | 2,051,469 | |
| | | | 25,186,209 | | | | 254,676,587 | | | | 38,398,352 | | | | 389,849,126 | |
| Shares redeemed: | | | | | | | | | | | | | | | | |
Class A | | | (7,399,275 | ) | | | (74,778,844 | ) | | | (10,344,620 | ) | | | (104,980,940 | ) |
Class C | | | (328,066 | ) | | | (3,310,902 | ) | | | (54,421 | ) | | | (551,119 | ) |
Class C2 | | | (537,926 | ) | | | (5,430,070 | ) | | | (1,248,208 | ) | | | (12,651,132 | ) |
Class I | | | (24,080,228 | ) | | | (243,437,660 | ) | | | (27,156,616 | ) | | | (275,606,625 | ) |
| | | | (32,345,495 | ) | | | (326,957,476 | ) | | | (38,803,865 | ) | | | (393,789,816 | ) |
| Net increase (decrease) | | | (7,159,286 | ) | | | (72,280,889 | ) | | | (405,513 | ) | | $ | (3,940,690 | ) |
5. Investment Transactions
Long-term purchases and sales (including maturities but excluding derivative transactions, where applicable) during the current fiscal period were as follows:
| | | | | | | | | | | | | | | | | | | | |
| | | All-
American | | | Inflation
Protected | | | Intermediate
Duration | | | Limited
Term | | | Short
Term | |
| Purchases | | $ | 867,210,070 | | | $ | 656,677 | | | $ | 1,489,856,284 | | | $ | 1,334,196,547 | | | $ | 160,677,984 | |
| Sales and maturities | | | 332,331,452 | | | | 12,923,368 | | | | 815,094,633 | | | | 824,734,557 | | | | 220,716,972 | |
6. Income Tax Information
Each Fund is a separate taxpayer for federal income tax purposes. Each Fund intends to distribute substantially all of its net investment income and net capital gains to shareholders and to otherwise comply with the requirements of Subchapter M of the Internal Revenue Code applicable to regulated investment companies. Therefore, no federal income tax provision is required. Furthermore, each Fund intends to satisfy conditions that will enable interest from municipal securities, which is exempt from regular federal income tax, to retain such tax-exempt status when distributed to shareholders of the Funds. Net realized capital gains and ordinary income distributions paid by the Funds are subject to federal taxation.
For all open tax years and all major taxing jurisdictions, management of the Funds has concluded that there are no significant uncertain tax positions that would require recognition in the financial statements. Open tax years are those that are open for examination by taxing authorities (i.e., generally the last four tax year ends and the interim tax period since then). Furthermore, management of the Funds is also not aware of any tax positions for which it is reasonably possible that the total amounts of unrecognized tax benefits will significantly change in the next twelve months.
The following information is presented on an income tax basis. Differences between amounts for financial statement and federal income tax purposes are primarily due to timing differences in recognizing taxable market discount, timing differences in recognizing certain gains and losses on investment transactions and the treatment of investments in inverse floating rate securities reflected as financing transactions, if any. To the extent that differences arise that are permanent in nature, such amounts are reclassified within the capital accounts as detailed below. Temporary differences do not require reclassification. Temporary and permanent differences do not impact the NAVs of the Funds.
As of April 30, 2016, the cost and unrealized appreciation (depreciation) of investments (excluding investments in derivatives, where applicable), as determined on a federal income tax basis, were as follows:
| | | | | | | | | | | | | | | | | | | | |
| | | All-
American | | | Inflation
Protected | | | Intermediate
Duration | | | Limited
Term | | | Short
Term | |
| Cost of investments | | $ | 2,664,623,272 | | | $ | 42,528,109 | | | $ | 4,857,347,158 | | | $ | 4,313,088,842 | | | $ | 636,867,316 | |
| Gross unrealized: | | | | | | | | | | | | | | | | | | | | |
Appreciation | | $ | 274,544,226 | | | $ | 2,334,719 | | | $ | 302,114,513 | | | $ | 124,020,697 | | | $ | 6,573,303 | |
Depreciation | | | (9,483,714 | ) | | | (9,841 | ) | | | (6,516,210 | ) | | | (3,577,548 | ) | | | (291,677 | ) |
| Net unrealized appreciation (depreciation) of investments | | $ | 265,060,512 | | | $ | 2,324,878 | | | $ | 295,598,303 | | | $ | 120,443,149 | | | $ | 6,281,626 | |
Notes to Financial Statements (continued)
Permanent differences, primarily due to treatment of notional principal contracts, federal taxes paid, taxable market discount and expiration of capital loss carryforwards, resulted in reclassifications among the Funds’ components of net assets as of April 30, 2016, the Funds’ tax year end, as follows:
| | | | | | | | | | | | | | | | | | | | |
| | | All-
American | | | Inflation
Protected | | | Intermediate
Duration | | | Limited
Term | | | Short
Term | |
| Capital paid-in | | $ | (2,292,018 | ) | | $ | — | | | $ | (3,220 | ) | | $ | (546,021 | ) | | $ | 3,022 | |
| Undistributed (Over-distribution of) net investment income | | | (116,170 | ) | | | (7,540 | ) | | | (962,135 | ) | | | (24,316 | ) | | | (3,715 | ) |
| Accumulated net realized gain (loss) | | | 2,408,188 | | | | 7,540 | | | | 965,355 | | | | 570,337 | | | | 693 | |
The tax components of undistributed net tax-exempt income, net ordinary income and net long-term capital gains as of April 30, 2016, the Funds’ tax year end, were as follows:
| | | | | | | | | | | | | | | | | | | | |
| | | All-
American | | | Inflation
Protected | | | Intermediate
Duration | | | Limited
Term | | | Short
Term | |
| Undistributed net tax-exempt income1 | | $ | 7,695,011 | | | $ | 121,909 | | | $ | 18,299,720 | | | $ | 9,432,847 | | | $ | 747,188 | |
| Undistributed net ordinary income2 | | | 282,321 | | | | 13,029 | | | | 128,239 | | | | 393,517 | | | | — | |
| Undistributed net long-term capital gains | | | — | | | | — | | | | — | | | | — | | | | — | |
| 1 | Undistributed net tax-exempt income (on a tax basis) has not been reduced for the dividends declared during the period April 1, 2016 through April 30, 2016, and paid on May 2, 2016. |
| 2 | Net ordinary income consists of taxable market discount income and net short-term capital gains, if any. |
The tax character of distributions paid during the Funds’ tax years ended April 30, 2016, and April 30, 2015 was designated for purposes of the dividends paid deduction as follows:
| | | | | | | | | | | | | | | | | | | | |
2016 | | All-
American | | | Inflation
Protected | | | Intermediate
Duration | | | Limited
Term | | | Short
Term | |
| Distributions from net tax-exempt income3 | | $ | 97,888,700 | | | $ | 1,165,182 | | | $ | 132,211,966 | | | $ | 77,997,772 | | | $ | 6,918,991 | |
| Distributions from net ordinary income2 | | | 637,634 | | | | — | | | | 143,197 | | | | 381,557 | | | | 191 | |
| Distributions from net long-term capital gains | | | — | | | | — | | | | — | | | | — | | | | — | |
| | | | | |
2015 | | All-
American | | | Inflation
Protected | | | Intermediate
Duration | | | Limited
Term | | | Short
Term | |
| Distributions from net tax-exempt income | | $ | 96,817,053 | | | $ | 1,574,949 | | | $ | 137,050,292 | | | $ | 73,455,736 | | | $ | 8,645,467 | |
| Distributions from net ordinary income2 | | | 284,523 | | | | 6,360 | | | | 201,182 | | | | 208,876 | | | | — | |
| Distributions from net long-term capital gains | | | — | | | | — | | | | — | | | | — | | | | — | |
| 2 | Net ordinary income consists of taxable market discount income and net short-term capital gains, if any. |
| 3 | The Funds hereby designate these amounts paid during the fiscal year ended April 30, 2016, as Exempt Interest Dividends. |
As of April 30, 2016, the Funds’ tax year end, the Funds had unused capital loss carryforwards available for federal income tax purposes to be applied against future capital gains, if any. If not applied, the carryforwards will expire as shown in the following table. The losses not subject to expiration will be utilized first by a Fund.
| | | | | | | | | | | | | | | | | | | | |
| | | All-
American4 | | | Inflation
Protected | | | Intermediate
Duration4 | | | Limited
Term | | | Short
Term | |
| Expiration: | | | | | | | | | | | | | | | | | | | | |
April 30, 2017 | | $ | 22,698,037 | | | $ | — | | | $ | — | | | $ | 1,071,726 | | | $ | 312,109 | |
April 30, 2018 | | | 14,897,930 | | | | — | | | | 2,929,916 | | | | 543,730 | | | | — | |
April 30, 2019 | | | 881,168 | | | | — | | | | 1,043,786 | | | | 1,598,268 | | | | — | |
| Not subject to expiration: | | | 38,077,458 | | | | 4,311,066 | | | | — | | | | 10,141,104 | | | | 630,209 | |
| Total | | $ | 76,554,593 | | | $ | 4,311,066 | | | $ | 3,973,702 | | | $ | 13,354,828 | | | $ | 942,318 | |
| 4 | A portion of All-American’s and Intermediate Duration’s capital loss carryforward is subject to an annual limitation under the Internal Revenue Code and related regulations. |
As of April 30, 2016, the Funds’ tax year end, the following Funds’ capital loss carryforwards expired as follows:
| | | | | | | | |
| | | All-
American | | | Limited
Term | |
| Expired capital loss carryforwards | | $ | 2,298,768 | | | $ | 546,020 | |
During the Funds’ tax year ended April 30, 2016, the following Funds utilized capital loss carryforwards as follows:
| | | | | | | | | | | | |
| | | All-
American | | | Intermediate
Duration | | | Limited
Term | |
| Utilized capital loss carryforwards | | $ | 4,091,202 | | | $ | 6,121,768 | | | $ | 1,330,813 | |
7. Management Fees and Other Transactions with Affiliates
Each Fund’s management fee compensates the Adviser for overall investment advisory and administrative services and general office facilities. The Sub-Adviser is compensated for its services to the Funds from the management fees paid to the Adviser.
Each Fund’s management fee consists of two components – a fund-level fee, based only on the amount of assets within each individual Fund, and a complex-level fee, based on the aggregate amount of all eligible fund assets managed by the Adviser. This pricing structure enables each Fund’s shareholders to benefit from growth in the assets within their respective Fund as well as from growth in the amount of complex-wide assets managed by the Adviser.
The annual Fund-level fee, payable monthly, for each Fund is calculated according to the following schedule:
| | | | | | | | | | | | | | | | | | | | |
| Average Daily Net Assets | | All-
American | | | Inflation
Protected | | | Intermediate
Duration | | | Limited
Term | | | Short
Term | |
| For the first $125 million | | | 0.3000 | % | | | 0.3000 | % | | | 0.3000 | % | | | 0.2500 | % | | | 0.2500 | % |
| For the next $125 million | | | 0.2875 | | | | 0.2875 | | | | 0.2875 | | | | 0.2375 | | | | 0.2375 | |
| For the next $250 million | | | 0.2750 | | | | 0.2750 | | | | 0.2750 | | | | 0.2250 | | | | 0.2250 | |
| For the next $500 million | | | 0.2625 | | | | 0.2625 | | | | 0.2625 | | | | 0.2125 | | | | 0.2125 | |
| For the next $1 billion | | | 0.2500 | | | | 0.2500 | | | | 0.2500 | | | | 0.2000 | | | | 0.2000 | |
| For net assets over $2 billion | | | — | | | | 0.2250 | | | | — | | | | — | | | | 0.1750 | |
| For the next $3 billion | | | 0.2250 | | | | — | | | | 0.2250 | | | | 0.1750 | | | | — | |
| For net assets over $5 billion | | | 0.2125 | | | | — | | | | 0.2125 | | | | 0.1625 | | | | — | |
The annual complex-level fee, payable monthly, for each Fund is determined by taking the complex-level fee rate, which is based on the aggregate amount of “eligible assets” of all Nuveen Funds as set forth in the schedule below, and for All-American, Intermediate Duration and Short Term, making, as appropriate, an upward adjustment to that rate based upon the percentage of the Fund’s assets that are not “eligible assets.” The complex level fee schedule for the Funds is as follows:
| | | | |
| Complex-Level Asset Breakpoint Level* | | Effective Rate at Breakpoint Level | |
| $55 billion | | | 0.2000 | % |
| $56 billion | | | 0.1996 | |
| $57 billion | | | 0.1989 | |
| $60 billion | | | 0.1961 | |
| $63 billion | | | 0.1931 | |
| $66 billion | | | 0.1900 | |
| $71 billion | | | 0.1851 | |
| $76 billion | | | 0.1806 | |
| $80 billion | | | 0.1773 | |
| $91 billion | | | 0.1691 | |
| $125 billion | | | 0.1599 | |
| $200 billion | | | 0.1505 | |
| $250 billion | | | 0.1469 | |
| $300 billion | | | 0.1445 | |
| * | The complex-level fee is calculated based upon the aggregate daily “eligible assets” of all Nuveen funds. Eligible assets do not include assets attributable to investments in other Nuveen funds or assets in excess of a determined amount (originally $2 billion) added to the Nuveen fund complex in connection with the Adviser’s assumption of the management of the former First American Funds effective January 1, 2011. Eligible assets include closed-end fund assets managed by the Adviser that are attributable to certain types of leverage. For these purposes, leverage includes the closed-end funds’ use of preferred stock and borrowings and certain investments in the residual interest certificates (also called inverse floating rate securities) in tender option bond (TOB) trusts, including the portion of assets held by the TOB trust that has been effectively financed by the trust’s issuance of floating rate securities, subject to an agreement by the Adviser as to certain funds to limit the amount of such assets for determining eligible assets in certain circumstances. As of April 30, 2016, the complex-level fee for each Fund was as follows: |
| | | | |
| Fund | | Complex-Level Fee | |
All-American | | | 0.1680 | % |
Inflation Protected | | | 0.1629 | |
Intermediate Duration | | | 0.1676 | |
Limited Term | | | 0.1629 | |
Short Term | | | 0.1790 | |
The Adviser has agreed to waive fees and/or reimburse expenses (“Expense Cap”) of the following Funds so that total annual Fund operating expenses (excluding 12b-1 distribution and/or service fees, interest expenses, taxes, acquired fund fees and expenses, fees incurred in acquiring and disposing of portfolio securities and extraordinary expenses) do not exceed the average daily net assets of any class of Fund shares in the amounts and for the time periods stated in the following table.
Notes to Financial Statements (continued)
| | | | | | | | | | |
| Fund | | Temporary
Expense Cap | | | Temporary
Expense Cap
Expiration Date | | Permanent
Expense Cap | |
| Inflation Protected | | | 0.60 | % | | September 30, 2016 | | | 1.05 | % |
| Intermediate Duration | | | N/A | | | N/A | | | 0.75 | |
During the current fiscal period, the Adviser agreed to waive 0.25% of the 12b-1 distribution and/or service fees for Class C Shares of Limited Term through August 31, 2015 and 0.45% of the 12b-1 distribution and/or service fees for Class C Shares of Short Term through August 31, 2015.
Neither Trust pays compensation directly to those of its directors/trustees who are affiliated with the Adviser or to its officers, all of whom receive remuneration for their services to each Trust from the Adviser or its affiliates. The Board has adopted a deferred compensation plan for independent directors/trustees that enables directors/trustees to elect to defer receipt of all or a portion of the annual compensation they are entitled to receive from certain Nuveen-advised funds. Under the plan, deferred amounts are treated as though equal dollar amounts had been invested in shares of select Nuveen-advised funds.
Other Transactions with Affiliates
Each Fund is permitted to purchase or sell securities from or to certain other funds managed by the Adviser (“inter-fund trade”) under specified conditions outlined in procedures adopted by the Board. These procedures have been designed to ensure that any inter-fund trade of securities by the Fund from or to another fund that is, or could be, considered an affiliate of the Fund under certain limited circumstances by virtue of having a common investment adviser (or affiliated investment adviser), common officer and/or common trustee complies with Rule 17a-7 of the 1940 Act. Further, as defined under these procedures, each inter-fund trade is effected at the current market price as provided by an independent pricing service.
During the current fiscal period, the Funds’ engaged in inter-fund trades pursuant to these procedures as follows:
| | | | | | | | | | | | |
| Inter-Fund Trades | | All-
American | | | Intermediate
Duration | | | Short
Term | |
| Purchases | | $ | 16,024,827 | | | $ | 19,369,111 | | | $ | — | |
| Sales | | | — | | | | — | | | | 2,421,858 | |
Unsettled inter-fund trades as of the end of the reporting period are recognized as a component of “Receivable for investments sold” and/or “Payable for investments purchased” on the Statement of Assets and Liabilities, when applicable.
During the current fiscal period, Nuveen Securities, LLC, (the “Distributor”), a wholly-owned subsidiary of Nuveen, collected sales charges on purchases of Class A Shares, the majority of which were paid out as concessions to financial intermediaries as follows:
| | | | | | | | | | | | | | | | | | | | |
| | | All-
American | | | Inflation
Protected | | | Intermediate
Duration | | | Limited
Term | | | Short
Term | |
| Sales charges collected (Unaudited) | | $ | 2,441,865 | | | $ | 9,768 | | | $ | 585,739 | | | $ | 1,417,929 | | | $ | 229,664 | |
| Paid to financial intermediaries (Unaudited) | | | 2,144,028 | | | | 7,830 | | | | 512,800 | | | | 1,373,089 | | | | 225,288 | |
The Distributor also received 12b-1 service fees on Class A Shares, substantially all of which were paid to compensate financial intermediaries for providing services to shareholders relating to their investments.
During the current fiscal period, the Distributor compensated financial intermediaries directly with commission advances at the time of purchase as follows:
| | | | | | | | | | | | | | | | | | | | |
| | | All-
American | | | Inflation
Protected | | | Intermediate
Duration | | | Limited
Term | | | Short
Term | |
| Commission advances (Unaudited) | | $ | 1,233,361 | | | $ | 1,216 | | | $ | 427,756 | | | $ | 1,661,157 | | | $ | 238,871 | |
To compensate for commissions advanced to financial intermediaries, all 12b-1 service and distribution fees collected on Class C and Class C2 Shares during the first year following a purchase are retained by the Distributor. During the current fiscal period, the Distributor retained such 12b-1 fees as follows:
| | | | | | | | | | | | | | | | | | | | |
| | | All-
American | | | Inflation
Protected | | | Intermediate
Duration | | | Limited
Term | | | Short
Term | |
| 12b-1 fees retained (Unaudited) | | $ | 509,786 | | | $ | 6,056 | | | $ | 156,038 | | | $ | 432,380 | | | $ | 27,903 | |
The remaining 12b-1 fees charged to the Funds were paid to compensate financial intermediaries for providing services to shareholders relating to their investments.
The Distributor also collected and retained CDSC on share redemptions during the current fiscal period, as follows:
| | | | | | | | | | | | | | | | | | | | |
| | | All-
American | | | Inflation
Protected | | | Intermediate
Duration | | | Limited
Term | | | Short
Term | |
| CDSC retained (Unaudited) | | $ | 51,534 | | | $ | 114 | | | $ | 43,906 | | | $ | 83,166 | | | $ | 18,317 | |
8. Borrowing Arrangements
Uncommitted Line of Credit
During the current fiscal period, the Funds participated in an unsecured bank line of credit (“Unsecured Credit Line”) under which outstanding balances would bear interest at a variable rate. On December 31, 2015, (the only day utilized during the current fiscal period) Inflation Protected borrowed $567,037 from the Unsecured Credit Line at an annualized interest rate of 1.68% on its outstanding balance. The remaining Funds in this report did not draw on this Unsecured Credit Line during the current fiscal period.
Committed Line of Credit
The Funds, along with certain other funds managed by the Adviser (“Participating Funds”), have established a 364-day, $2.53 billion standby credit facility with a group of lenders, under which the Participating Funds may borrow for various purposes other than leveraging for investment purposes. A large portion of this facility’s capacity (and its associated costs as described below) is currently dedicated for use by a small number of Participating Funds, which does not include any of the Funds covered by this shareholder report. The remaining capacity under the facility (and the corresponding portion of the facility’s annual costs) is separately dedicated to most of the other open-end funds in the Nuveen fund family, including all of the Funds covered by this shareholder report, along with a number of Nuveen closed-end funds. The credit facility expires in July 2016 unless extended or
renewed.
The credit facility has the following terms: a fee of 0.15% per annum on unused commitment amounts, and interest at a rate equal to the higher of (a) one-month LIBOR (London Inter-Bank Offered Rate) plus 1.25% per annum or (b) the Fed Funds rate plus 1.25% per annum on amounts borrowed. Participating Funds paid administration, legal and arrangement fees, which are recognized as a component of “Other expenses” on the Statement of Operations, and along with commitment fees, have been allocated among such Participating Funds based upon the relative proportions of the facility’s aggregate capacity reserved for them and other factors deemed relevant by the Adviser and the Board of each Participating Fund.
During the current fiscal period, none of the Funds utilized this facility.
9. Subsequent Events
Class R6 Shares
Effective June 30, 2016, All-American will begin offering Class R6 Shares as further described in the Fund’s most recent prospectus.
Additional
Fund Information (Unaudited)
| | | | | | | | | | |
| | | | | |
| | Fund Manager Nuveen Fund Advisors, LLC 333 West Wacker Drive Chicago, IL 60606 Sub-Adviser Nuveen Asset Management, LLC 333 West Wacker Drive Chicago, IL 60606 | | Independent Registered
Public Accounting Firm PricewaterhouseCoopers LLP One North Wacker Drive Chicago, IL 60606 Custodians State Street Bank & Trust
Company One Lincoln Street Boston, MA 02111 U.S. Bank National Association 1555 North RiverCenter Drive, Suite 302 Milwaukee, WI 53202 | | Legal Counsel Chapman and Cutler LLP Chicago, IL 60603 | | Transfer Agent and
Shareholder Services Boston Financial Data Services, Inc. Nuveen Investor Services P.O. Box 8530 Boston, MA 02266-8530 (800) 257-8787 | | |
| | | | | | | | | | | | | | |
| | | | | |
| | | | | | | | | | |
| | |
| | Quarterly Form N-Q Portfolio of Investments Information: Each Fund is required to file its complete schedule of portfolio holdings with the Securities and Exchange Commission (SEC) for the first and third quarters of each fiscal year on Form N-Q. You may obtain this information directly from the SEC. Visit the SEC on-line at http://www.sec.gov or in person at the SEC’s Public Reference Room in Washington, D.C. Call the SEC toll-free at (800) SEC-0330 for room hours and operation. | | |
| | | |
| | | | | | |
| | |
| | Nuveen Funds’ Proxy Voting Information: You may obtain (i) information regarding how each fund voted proxies relating to portfolio securities held during the most recent twelve-month period ended June 30, without charge, upon request, by calling Nuveen toll-free at (800) 257-8787 or on Nuveen’s website at www.nuveen.com and (ii) a description of the policies and procedures that each fund used to determine how to vote proxies relating to portfolio securities without charge, upon request, by calling Nuveen toll-free at (800) 257-8787. You may also obtain this information directly from the SEC. Visit the SEC on-line at http://www.sec.gov. | | |
| | | |
| | | | | | |
| | |
| | FINRA BrokerCheck: The Financial Industry Regulatory Authority (FINRA) provides information regarding the disciplinary history of FINRA member firms and associated investment professionals. This information as well as an investor brochure describing FINRA BrokerCheck is available to the public by calling the FINRA BrokerCheck Hotline number at (800) 289-9999 or by visiting www.FINRA.org. | | |
Glossary of Terms
Used in this Report (Unaudited)
Average Annual Total Return: This is a commonly used method to express an investment’s performance over a particular, usually multi-year time period. It expresses the return that would have been necessary each year to equal the investment’s actual cumulative performance (including change in NAV or offer price and reinvested dividends and capital gains distributions, if any) over the time period being considered.
Barclays 1-10 Year Municipal Bond Index: An unmanaged index comprised of investment-grade municipal bonds with maturity dates of more than 1 year and less than 10 years. Index returns assume reinvestment of distributions, but do not reflect any applicable sales charges or management fees.
Duration: Duration is a measure of the expected period over which a bond’s principal and interest will be paid, and consequently is a measure of the sensitivity of a bond’s (or bond fund’s) value to changes when market interest rates change. Generally, the longer a bond or fund’s duration, the more the price of the bond or fund will change as interest rates change.
Effective Leverage (Effective Leverage Ratio): Effective leverage is investment exposure created either through borrowings or indirectly through inverse floaters, divided by the assets invested, including those assets that were purchased with the proceeds of the leverage, or referenced by the levered instrument.
Inflation Linked Swap: A contractual agreement between two counterparties under which one party agrees to make periodic interest payments to the other for an agreed period of time based on a fixed rate (alternatively, a floating rate based on an interest rate index), while the other party agrees to make periodic payments based on a floating rate of interest based on the Consumer Price Index.
Inverse Floating Rate Securities: Inverse floating rate securities, also known as inverse floaters or tender option bonds (TOBs), are created by depositing a municipal bond, typically with a fixed interest rate, into a special purpose trust. This trust, in turn, (a) issues floating rate certificates typically paying short-term tax-exempt interest rates to third parties in amounts equal to some fraction of the deposited bond’s par amount or market value, and (b) issues an inverse floating rate certificate (sometimes referred to as an “inverse floater”) to an investor (such as a fund) interested in gaining investment exposure to a long-term municipal bond. The income received by the holder of the inverse floater varies inversely with the short-term rate paid to the floating rate certificates’ holders, and in most circumstances the holder of the inverse floater bears substantially all of the underlying bond’s downside investment risk. The holder of the inverse floater typically also benefits disproportionately from any potential appreciation of the underlying bond’s value. Hence, an inverse floater essentially represents an investment in the underlying bond on a leveraged basis.
Leverage: Leverage is created whenever a fund has investment exposure (both reward and/or risk) equivalent to more than 100% of the investment capital.
Lipper General & Insured Municipal Debt Funds Classification Average: Represents the average annualized total return for all reporting funds in the Lipper General & Insured Municipal Debt Funds Classification. Lipper returns account for the effects of management fees and assume reinvestment of distributions, but do not reflect any applicable sales charge.
Lipper Intermediate Municipal Debt Funds Classification Average: Represents the average annualized total return for all reporting funds in the Lipper Intermediate Municipal Debt Funds Classification. Lipper returns account for the effects of management fees and assume reinvestment of distributions, but do not reflect any applicable sales charge.
Glossary of Terms Used in this Report (Unaudited) (continued)
Lipper Short-Intermediate Municipal Debt Funds Classification Average: Represents the average annualized total return for all reporting funds in the Lipper Short-Intermediate Municipal Debt Funds Classification. Lipper returns account for the effects of management fees and assume reinvestment of distributions, but do not reflect any applicable sales charge.
Lipper Short Municipal Debt Funds Classification Average: Represents the average annualized total return for all reporting funds in the Lipper Short Municipal Debt Funds Classification. Lipper returns account for the effects of management fees and assume reinvestment of distributions, but do not reflect any applicable sales charges.
Net Asset Value (NAV) Per Share: A fund’s Net Assets is equal to its total assets (securities, cash and accrued earnings) less its total liabilities. For funds with multiple classes, Net Assets are determined separately for each share class. NAV per share is equal to the fund’s (or share class’) Net Assets divided by its number of shares outstanding.
Pre-Refundings: Pre-Refundings, also known as advance refundings or refinancings, occur when an issuer sells new bonds and uses the proceeds to fund principal and interest payments of older existing bonds. This process often results in lower borrowing costs for bond issuers.
S&P Municipal Bond Intermediate Index: An unleveraged, market value-weighted index containing all bonds in the S&P Municipal Bond Index that mature between 3 and 14.999 years. Index returns assume reinvestment of dividends but do not reflect any applicable sales charges or management fees.
S&P Municipal Bond Index: An unleveraged, market value-weighted index designed to measure the performance of the tax-exempt, investment-grade U.S. municipal bond market. Index returns assume reinvestment of distributions, but do not reflect any applicable sales charges or management fees.
S&P Municipal Bond Short Index: An unleveraged, market value-weighted index containing all of the bonds in the S&P Municipal Bond Index with maturities between 6 months and 3.999 years. Index returns assume reinvestment of distributions, but do not reflect any applicable sales charges or management fees.
S&P Municipal Bond Short-Intermediate Index: An unleveraged, market value-weighted index containing all bonds in the S&P Municipal Bond Index that mature between 1 and 7.999 years. Index returns assume reinvestment of distributions, but do not reflect any applicable sales charges or management fees.
Total Investment Exposure: Total investment exposure is a fund’s assets managed by the Adviser that are attributable to financial leverage. For these purposes, financial leverage includes a fund’s use of preferred stock and borrowings and investments in the residual interest certificates (also called inverse floating rate securities) in tender option bond (TOB) trusts, including the portion of assets held by a TOB trust that has been effectively financed by the trust’s issuance of floating rate securities.
Weighted Average Maturity: The average time to maturity of debt securities held in a Fund.
Weighted Average Portfolio Duration: The weighted average duration, including the effects of leverage, of a fund’s bonds and loans, which is a measure of the fund’s price sensitivity expressed in years.
Zero Coupon Bond: A zero coupon bond does not pay a regular interest coupon to its holders during the life of the bond. Income to the holder of the bond comes from accretion of the difference between the original purchase price of the bond at issuance and the par value of the bond at maturity and is effectively paid at maturity. The market prices of zero coupon bonds generally are more volatile than the market prices of bonds that pay interest periodically.
Annual Investment Management Agreement
Approval Process (Unaudited)
The Board of Directors or Trustees (as the case may be) of each Fund (each, a “Board” and each Director or Trustee, a “Board Member”), including the Board Members who are not parties to the Funds’ advisory or sub-advisory agreements or “interested persons” of any such parties (the “Independent Board Members”), is responsible for overseeing the performance of the investment adviser and sub-adviser to the respective Fund and determining whether to continue such Fund’s advisory agreement (the “Investment Management Agreement”) between the Fund and Nuveen Fund Advisors, LLC (the “Adviser”) and the sub-advisory agreement (the “Sub-Advisory Agreement” and, together with the Investment Management Agreement, the “Advisory Agreements”) between the Adviser and Nuveen Asset Management, LLC (the “Sub-Adviser”). Following an initial term with respect to each Fund upon its commencement of operations, the Board is required to consider the continuation of the Advisory Agreements on an annual basis pursuant to the requirements of the Investment Company Act of 1940, as amended (the “1940 Act”). Accordingly, at an in-person meeting held on May 11-13, 2015 (the “May Meeting”), the Board, including a majority of the Independent Board Members, considered and approved the existing Advisory Agreements for the Funds.
In preparation for its considerations at the May Meeting, the Board received in advance of the meeting extensive materials prepared in connection with the review of the Advisory Agreements. The materials provided a broad range of information regarding the Funds, including, among other things, the nature, extent and quality of services provided by the Adviser and Sub-Adviser (the Adviser and Sub-Adviser are collectively, the “Fund Advisers” and each, a “Fund Adviser”); Fund performance including performance assessments against peers and the appropriate benchmark(s); fee and expense information of the Funds compared to peers; a description and assessment of shareholder service levels for the Funds; a summary of the performance of certain service providers; a review of product initiatives and shareholder communications; and profitability information of the Fund Advisers as described in further detail below. As part of its annual review, the Board also held a separate meeting on April 14-15, 2015 to review the Funds’ investment performance and consider an analysis by the Adviser of the Sub-Adviser which generally evaluated the Sub-Adviser’s investment team, investment mandate, organizational structure and history, investment philosophy and process, and the performance of the Funds, and any significant changes to the foregoing. During the review, the Independent Board Members asked questions of and requested additional information from management.
The Board considered that the evaluation process with respect to the Fund Advisers is an ongoing process that encompassed the information and knowledge gained throughout the year. The Board, acting directly or through its committees, met regularly during the course of the year and received information and considered factors at each meeting that would be relevant to its annual consideration of the Advisory Agreements, including information relating to Fund performance; Fund expenses; investment team evaluations; and valuation, compliance, regulatory and risk matters. In addition to regular reports, the Adviser provided special reports to the Board to enhance the Board’s understanding on topics that impact some or all of the Nuveen funds and the Adviser (such as presentations on risk and stress testing; the new governance, risk and compliance system; cybersecurity developments; Nuveen fund accounting and reporting matters; regulatory developments impacting the investment company industry and the business plans or other matters impacting the Adviser). The Board also met with key investment personnel managing certain Nuveen fund portfolios during the year.
The Board had created several standing committees including the Open-End Funds Committee and the Closed-End Funds Committee to assist the full Board in monitoring and gaining a deeper insight into the distinctive business practices of closed-end and open-end funds. These Committees met prior to each quarterly Board meeting, and the Adviser provided presentations to these Committees permitting them to delve further into specific matters or initiatives impacting the respective product line.
The Board also continued its program of seeking to have the Board Members or a subset thereof visit each sub-adviser to the Nuveen funds at least once over a multiple year rotation, meeting with key investment and business personnel. In this regard, the Independent Board Members made site visits to multiple equity and fixed-income investment teams of the Sub-Adviser in June 2014.
The Board considered the information provided and knowledge gained at these meetings and visits during the year when performing its annual review of the Advisory Agreements. The Independent Board Members also were assisted throughout the process by independent legal counsel. During the course of the year and during their deliberations regarding the review of advisory contracts, the Independent Board Members met with independent legal counsel in executive sessions without management present. The Independent Board Members also received a memorandum from independent legal counsel outlining the legal standards for their consideration of the proposed continuation of the Advisory Agreements. In addition, it is important to recognize that the management arrangements for the Nuveen funds are the result of many years of review and discussion between the Independent Board Members and Fund management and that the Board Members’ conclusions may be based, in part, on their consideration of fee arrangements and other factors developed in previous years.
Annual Investment Management Agreement Approval Process (Unaudited) (continued)
The Board took into account all factors it believed relevant with respect to each Fund, including, among other things: (a) the nature, extent and quality of the services provided by the Fund Advisers; (b) the investment performance of the Funds and Fund Advisers; (c) the advisory fees and costs of the services to be provided to the Funds and the profitability of the Fund Advisers; (d) the extent of any economies of scale; (e) any benefits derived by the Fund Advisers from the relationship with the Funds; and (f) other factors. Each Board Member may have accorded different weight to the various factors in reaching his or her conclusions with respect to the Advisory Agreements of each Fund. The Independent Board Members did not identify any single factor as all-important or controlling. The Independent Board Members’ considerations were instead based on a comprehensive consideration of all the information presented. The principal factors considered by the Board and its conclusions are described below.
A. Nature, Extent and Quality of Services
In evaluating the renewal of the Advisory Agreements, the Independent Board Members received and considered information regarding the nature, extent and quality of the applicable Fund Adviser’s services provided to each respective Fund. The Board reviewed information regarding, among other things, each Fund Adviser’s organization and business, the types of services that each Fund Adviser or its affiliates provided to the Funds, the performance record of the Funds (as described in further detail below), and any initiatives that had been undertaken on behalf of the open-end product line. The Board recognized the high quality of services the Adviser had provided to the Funds over the years and the conscientiousness with which the Adviser provided these services. The Board also considered the improved capital structure of Nuveen Investments, Inc. (“Nuveen”) (the parent of the Adviser) following the acquisition of Nuveen by TIAA-CREF in 2014 (the “TIAA-CREF Transaction”).
With respect to the services, the Board noted the Funds were registered investment companies that operated in a regulated industry and considered the myriad of investment management, administrative, compliance, oversight and other services the Adviser provided to manage and operate the Funds. Such services included, among other things: (a) product management (such as analyzing ways to better position a Nuveen fund in the marketplace, setting dividends; maintaining relationships to gain access to distribution platforms; and providing shareholder communications); (b) fund administration (such as preparing tax returns and other tax compliance services, preparing regulatory filings and shareholder reports; managing fund budgets and expenses; overseeing a fund’s various service providers and supporting and analyzing new and existing funds); (c) Board administration (such as supporting the Board and its committees, in relevant part, by organizing and administering the Board and committee meetings and preparing the necessary reports to assist the Board in its duties); (d) compliance (such as monitoring adherence to a fund’s investment policies and procedures and applicable law; reviewing the compliance program periodically and developing new policies or updating existing compliance policies and procedures as considered necessary or appropriate; responding to regulatory requests; and overseeing compliance testing of the funds’ sub-advisers); (e) legal support (such as preparing or reviewing fund registration statements, proxy statements and other necessary materials; interpreting regulatory requirements and compliance thereof; and maintaining applicable registrations); and (f) investment services (such as overseeing and reviewing the funds’ sub-advisers and their investment teams; analyzing performance of the funds; overseeing investment and risk management; evaluating brokerage transactions and securities lending, overseeing the daily valuation process for portfolio securities and developing and recommending valuation policies and methodologies and changes thereto; reporting to the Board on various matters including performance, risk and valuation; and participating in fund development, leverage management, and the developing or interpreting of investment policies and parameters).
In its review, the Board considered information highlighting the various initiatives that the Adviser had implemented or continued during the last year to enhance its services to the Nuveen funds. The Board recognized that some of these initiatives are a result of a multi-year process. In reviewing the activities of 2014, the Board recognized the Adviser’s continued focus on fund rationalization for open-end funds through mergers, fund closures or repositioning the funds in seeking to enhance shareholder value, reduce costs, improve performance, eliminate fund overlap and better meet shareholder needs. The Board noted the Adviser’s investment in additional staffing to strengthen and improve its services to the Nuveen funds, including with respect to risk management and valuation. The Board recognized that expanding the depth and range of its risk oversight activities had been a major priority for the Adviser in recent years, and the Adviser continued to add to the risk management team, develop additional risk management programs and create committees or other teams designated to oversee or evaluate certain risks, such as liquidity risk, enterprise risk, investment risk and cybersecurity risk. The Adviser had also continued to add to the valuation team, launched its centralized securities valuation system which is intended to provide for uniform pricing and reporting across the complex as the system continues to develop, continued to refine its valuation analysis and updated related policies and procedures and evaluated and assessed pricing services. The Board considered the Adviser’s ongoing investment in information technology and operations and the various projects of the information technology team to support the continued growth and complexity of the Nuveen funds and increase efficiencies in their operations. The Board also recognized the Adviser’s strong commitment to compliance and reviewed information reflecting the compliance group’s ongoing activities to enhance its compliance system and refine its compliance procedures as well as the Chief Compliance Officer’s report regarding the compliance team, the initiatives the team had undertaken in 2014 and proposed for 2015, the compliance functions and reporting process, the record of compliance with the policies and procedures and its supervision activities of other service providers.
With respect to the open-end fund product line, the Adviser had also, among other things: developed new funds in seeking to enhance the product line; enhanced the reporting to the Board and its committees regarding payments to intermediaries; and continued to explore opportunities for potential funds.
As noted, the Adviser also oversees the Sub-Adviser who primarily provides the portfolio advisory services to the Funds. The Board recognized the skill and competency of the Adviser in monitoring and analyzing the performance of the Sub-Adviser and managing the sub-advisory relationship. In considering the Sub-Advisory Agreements and supplementing its prior knowledge, the Board considered a current report provided by the Adviser analyzing, among other things, the Sub-Adviser’s investment team and changes thereto, investment approach, organization and history, and assets under management, and the investment performance of each Fund.
Based on their review, the Independent Board Members found that, overall, the nature, extent and quality of services provided to the Funds under each respective Advisory Agreement were satisfactory.
B. The Investment Performance of the Funds and Fund Advisers
The Board, including the Independent Board Members, considered the performance history of each Fund over various time periods. The Board reviewed reports, including an analysis of the Funds’ performance and the applicable investment team. The Board reviewed, among other things, each Fund’s investment performance both on an absolute basis and in comparison to peer funds (the “Performance Peer Group”) and to recognized and/or customized benchmarks (i.e., generally benchmarks derived from multiple recognized benchmarks) for the quarter, one-, three- and five-year periods ending December 31, 2014, as well as performance information reflecting the first quarter of 2015 (or for such shorter periods available for Nuveen Inflation Protected Municipal Bond Fund (the “Inflation Protected Fund”), which did not exist for part of the foregoing time frame). In its review, the Board noted that it also reviewed Fund performance results at each of its quarterly meetings.
In evaluating performance, the Board recognized several factors that may impact the performance data as well as the consideration given to particular performance data.
| | • | | The performance data reflected a snapshot in time, in this case as of the end of the most recent calendar year or quarter. A different performance period, however, could generate significantly different results. |
| | • | | Long-term performance can be adversely affected by even one period of significant underperformance so that a single investment decision or theme had the ability to disproportionately affect long-term performance. |
| | • | | The investment experience of a particular shareholder in a fund would vary depending on when such shareholder invested in the fund, the class held (if multiple classes are offered in the fund) and the performance of the fund (or respective class) during that shareholder’s investment period. |
| | • | | Open-end funds offer multiple classes and the performance data provided for open-end funds was based on Class A shares. The performance of the other classes of a fund, however, should be substantially similar on a relative basis because all of the classes would be invested in the same portfolio of securities and differences in performance among classes could be principally attributed to the variations in distribution and servicing expenses of each class. |
| | • | | The Board recognized that the funds in the Performance Peer Group may differ somewhat from the Nuveen fund with which it is being compared and due to these differences, performance comparisons between certain of the Nuveen funds and their Performance Peer Groups may be inexact and the relevancy limited. The Board considered that management had classified the Performance Peer Group as low, medium and high in relevancy. The Board took the analysis of the relevancy of the Performance Peer Group into account when considering the comparative performance data. The Board also considered comparative performance of an applicable benchmark. While the Board was cognizant of the relative performance of a Fund’s peer set and/or benchmark(s), the Board evaluated Fund performance in light of the respective Fund’s investment objectives, investment parameters and guidelines and considered that the variations between the objectives and investment parameters or guidelines of the Fund with its peers and/or benchmarks result in differences in performance results. |
With respect to any Nuveen funds for which the Board has identified performance concerns, the Board monitors such funds closely until performance improves, discusses with the Adviser the reasons for such results, considers those steps necessary or appropriate to address such issues, and reviews the results of any efforts undertaken. The Board is aware, however, that shareholders chose to invest or remain invested in a fund knowing that the Adviser manages the fund and knowing the fund’s fee structure.
In considering the performance data, the Independent Board Members noted the following with respect to the Funds:
| | • | | For Nuveen All-American Municipal Bond Fund, the Board noted that the Fund ranked in its Performance Peer Group in the first quartile in the one-, three- and five-year periods and outperformed its benchmark in each of such periods. |
| | • | | For the Inflation Protected Fund, the Board noted that, although the Fund ranked in its Performance Peer Group in the fourth quartile in the one-year period and third quartile in the three-year period, the Fund outperformed its benchmark in the three-year period and only slightly underperformed its benchmark in the one-year period. |
| | • | | For Nuveen Intermediate Duration Municipal Bond Fund (the “Intermediate Duration Fund”), the Board noted that the Fund ranked in its Performance Peer Group in the first quartile in the one- and three-year periods and the second quartile in the five-year period. The Board also |
Annual Investment Management Agreement Approval Process (Unaudited) (continued)
| | noted that, although the Fund underperformed its benchmark in the five-year period, it outperformed its benchmark in the one-year period and only slightly underperformed its benchmark in the three-year period. |
| | • | | For Nuveen Limited Term Municipal Bond Fund, the Board considered that the Fund ranked in its Performance Peer Group in the second quartile in the one-, three- and five-year periods and, although the Fund underperformed its benchmark in the three- and five-year periods, it slightly outperformed its benchmark in the one-year period. |
| | • | | For Nuveen Short Term Municipal Bond Fund, the Board noted that the Fund ranked in its Performance Peer Group in the third quartile in the one-year period, the first quartile in the three-year period and the second quartile in the five-year period. The Fund underperformed its benchmark in the one-year period but outperformed its benchmark in the three- and five-year periods. |
Based on their review, the Independent Board Members determined that each Fund’s investment performance had been satisfactory.
C. Fees, Expenses and Profitability
1. Fees and Expenses
The Board evaluated the management fees and other fees and expenses of each Fund (expressed as a percentage of average net assets) in absolute terms and in comparison to the fee and expense levels of a comparable universe of funds (the “Peer Universe”) and, with respect to open-end funds, to a more focused subset in the Peer Universe (the “Peer Group”), each selected by an independent third-party fund data provider. The Independent Board Members reviewed the methodology regarding the construction of the Peer Universe and Peer Group for each Fund. The Board reviewed, among other things, such Fund’s gross management fees, net management fees and net expense ratios in absolute terms as well as compared to the average and median fee and expense levels of the Peer Universe and/or Peer Group. The Board noted that the net total expense ratios paid by investors in the Funds were the most representative of an investor’s net experience. The Board Members also considered any fee waivers and/or expense reimbursement arrangements currently in effect for the Funds.
In reviewing the comparative fee and expense information, the Independent Board Members recognized that various factors such as the limited size and particular composition of the Peer Universe or Peer Group (including the inclusion of other Nuveen funds in the peer set); expense anomalies; changes in the funds comprising the Peer Universe or Peer Group from year to year; levels of reimbursement or fee waivers; the timing of information used; and differences in services provided can impact the comparative data limiting the usefulness of the data to help make a conclusive assessment of the Funds’ fees and expenses.
In reviewing the fee schedule for a fund, the Independent Board Members also considered the fund-level and complex-wide breakpoint schedules (described in further detail below) and any fee waivers and reimbursements provided by Nuveen. In reviewing fees and expenses, the Board considered the expenses and fees to be higher if they were over 10 basis points higher, slightly higher if they were approximately 6 to 10 basis points higher, in line if they were within approximately 5 basis points higher than the peer average and below if they were below the peer average of the Peer Group. In reviewing the reports, the Board noted that the majority of the Nuveen funds had a net expense ratio near or below their peer average.
The Board noted that each Fund had a net management fee and net expense ratio below or in line with its peer averages.
Based on their review of the fee and expense information provided, the Independent Board Members determined that each Fund’s management fees (as applicable) to a Fund Adviser were reasonable in light of the nature, extent and quality of services provided to the Fund.
2. Comparisons with the Fees of Other Clients
The Board considered information regarding the fees a Fund Adviser assessed to the Nuveen funds compared to that of other clients as described in further detail below. With respect to municipal funds, such other clients of a Fund Adviser may include municipal separately managed accounts and passively managed exchange traded funds (ETFs) sub-advised by the Sub-Adviser.
The Board recognized that each Fund had an affiliated sub-adviser and therefore the overall Fund management fee can be divided into two components, the fee retained by the Adviser and the fee paid to the Sub-Adviser. In reviewing the nature of the services provided by the Adviser, including through its affiliated sub-advisers, the Board considered the range of advisory fee rates for retail and institutional managed accounts advised by Nuveen-affiliated sub-advisers. The Board also reviewed, among other things, the average fee the affiliated sub-advisers assessed such clients as well as the range of fee rates assessed to the different types of clients (such as retail, institutional and wrap accounts as well as non-Nuveen funds) applicable to such sub-advisers.
In reviewing the comparative information, the Board also reviewed information regarding the differences between the Funds and the other clients, including differences in services provided, investment policies, investor profiles, compliance and regulatory requirements and account sizes. The Board recognized the breadth of services necessary to operate a registered investment company (as described above) and that, in general terms, the Adviser provided the administrative and other support services to the Funds and, although the Sub-Adviser may provide some of these services, the Sub-Adviser essentially provided the portfolio management services. In general, the Board noted that higher fee levels reflected higher levels of
service provided by the Fund Adviser, increased investment management complexity, greater product management requirements and higher levels of business risk or some combination of the foregoing. The Independent Board Members considered the differences in structure and operations of separately managed accounts and hedge funds from registered funds and noted that the range of day-to-day services was not generally of the breadth required for the registered funds. Many of the additional administrative services provided by the Adviser were not required for institutional clients or funds sub-advised by a Nuveen-affiliated sub-adviser that were offered by other fund groups. The Independent Board Members also recognized that the management fee rates of the foreign funds advised by the Adviser may vary due to, among other things, differences in the client base, governing bodies, operational complexities and services covered by the management fee. Given the inherent differences in the various products, particularly the extensive services provided to the Funds, the Independent Board Members believed such facts justify the different levels of fees.
3. Profitability of Fund Advisers
In conjunction with their review of fees, the Independent Board Members also considered the profitability of Nuveen for its advisory activities and its financial condition. The Independent Board Members reviewed, among other things, the adjusted operating margins for Nuveen for the last two calendar years, the revenues, expenses, net income (pre-tax and after-tax) and net revenue margins (pre-tax and after-tax) of Nuveen’s managed fund advisory activities for the last two calendar years, the allocation methodology used by Nuveen in preparing the profitability data and a history of the adjustments to the methodology due to changes in the business over time. The Independent Board Members also reviewed the revenues, expenses, net income (pre-tax and after-tax) and revenue margin (pre-tax and post-tax) of the Adviser and, as described in further detail below, each affiliated sub-adviser for the 2014 calendar year. In reviewing the profitability data, the Independent Board Members noted the subjective nature of cost allocation methodologies used to determine profitability as other reasonable methods could also have been employed but yield different results. The Independent Board Members reviewed an analysis of the key drivers behind the changes in revenues and expenses that impacted profitability in 2014. The Independent Board Members recognized that Nuveen’s net revenue margin from advisory activities for 2014 was consistent with 2013. The Independent Board Members also considered the profitability of Nuveen in comparison to the adjusted operating margins of other investment advisers with publicly available data and with comparable assets under management (based on asset size and asset composition) to Nuveen. The Independent Board Members noted that Nuveen’s adjusted operating margins appeared to be reasonable in relation to such other advisers. The Independent Board Members, however, recognized the difficulty of making comparisons of profitability from fund investment advisory contracts as the information is not generally publicly available, the information for the investment advisers that was publicly available may not be representative of the industry and various other factors would impact the profitability data such as differences in services offered, business mix, expense methodology and allocations, capital structure and costs, complex size, and types of funds and other accounts managed.
The Independent Board Members noted this information supplemented the profitability information requested and received during the year and noted that two Independent Board Members served as point persons to review the profitability analysis and methodologies employed, and any changes thereto, and to keep the Board apprised of such changes during the year.
The Independent Board Members determined that Nuveen appeared to be sufficiently profitable to operate as a viable investment management firm and to honor its obligations as a sponsor of the Nuveen funds. The Independent Board Members noted the Adviser’s continued expenditures to upgrade its investment technology and increase personnel and recognized the Adviser’s continued commitment to its business to enhance the Adviser’s capacity and capabilities in providing the services necessary to meet the needs of the Nuveen funds as they grow or change over time. The Independent Board Members also noted that the sub-advisory fees for the Nuveen funds are paid by the Adviser, however, the Board recognized that many of the sub-advisers, including the Sub-Adviser, are affiliated with Nuveen. The Independent Board Members also noted the increased resources and support available to Nuveen as well as an improved capital structure as a result of the TIAA-CREF Transaction.
With respect to the Sub-Adviser, the Independent Board Members reviewed the Sub-Adviser’s revenues, expenses and revenue margins (pre- and post-tax) for its advisory activities for the calendar year ended December 31, 2014. The Independent Board Members also reviewed profitability analysis reflecting the revenues, expenses and the revenue margin (pre- and post-tax) by asset type for the Sub-Adviser for the calendar year ended December 31, 2014.
In evaluating the reasonableness of the compensation, the Independent Board Members also considered other amounts paid to a Fund Adviser by the Funds as well as indirect benefits (such as soft dollar arrangements), if any, the Fund Adviser and its affiliates received or were expected to receive that were directly attributable to the management of a Fund. See Section E below for additional information on indirect benefits a Fund Adviser may receive as a result of its relationship with the Funds.
Based on their review, the Independent Board Members determined that the Adviser’s and the Sub-Adviser’s level of profitability was reasonable in light of the respective services provided.
Annual Investment Management Agreement Approval Process (Unaudited) (continued)
D. Economies of Scale and Whether Fee Levels Reflect These Economies of Scale
The Independent Board Members recognized that, as the assets of a particular fund or the Nuveen complex in the aggregate increase over time, economies of scale may be realized, and the Independent Board Members considered the extent to which the funds benefit from such economies of scale. Although the Independent Board Members recognized that economies of scale are difficult to measure, the Board recognized that one method to help ensure the shareholders share in these benefits is to include breakpoints in the management fee schedule reducing fee rates as asset levels grow. The Independent Board Members noted that, subject to certain exceptions, the management fees of the funds in the Nuveen complex are generally comprised of a fund-level component and complex-level component. Each component of the management fee for each Fund included breakpoints to reduce management fee rates of the Fund as the Fund grows and, as described below, as the Nuveen complex grows. In addition to fund-specific breakpoint schedules which reduce the fee rates of a particular fund as its assets increase, the Independent Board Members recognized that the Adviser also passed on the benefits of economies of scale through the complex-wide fee arrangement which reduced management fee rates as assets in the fund complex reached certain levels. The complex-wide fee arrangement seeks to provide the benefits of economies of scale to fund shareholders when total fund complex assets increase, even if assets of a particular fund are unchanged or have decreased. The approach reflected the notion that some of Nuveen’s costs were attributable to services provided to all its funds in the complex, and therefore all funds benefit if these costs were spread over a larger asset base. The Independent Board Members reviewed the breakpoint and complex-wide schedules and the fee reductions achieved as a result of such structures for the 2014 calendar year.
The Independent Board Members also noted that additional economies of scale were shared with shareholders of the Inflation Protected Fund and the Intermediate Duration Fund through the adoption of temporary and/or permanent expense caps. The Independent Board Members further considered that as part of the TIAA-CREF Transaction, Nuveen agreed, for a period of two years from the date of the closing of the TIAA-CREF Transaction, not to increase contractual management fees for any Nuveen fund and, with respect to funds with expense caps, not to raise expense cap levels for such funds from levels in effect at that time or scheduled to go into effect prior to the closing of the TIAA-CREF Transaction. The commitment would not limit or otherwise affect mergers or liquidations of any funds in the ordinary course.
Based on their review, the Independent Board Members concluded that the current fee structure was acceptable and reflected economies of scale to be shared with shareholders when assets under management increase.
E. Indirect Benefits
The Independent Board Members received and considered information regarding potential “fall out” or ancillary benefits the respective Fund Adviser or its affiliates may receive as a result of its relationship with the Funds. In this regard, the Independent Board Members recognized that an affiliate of the Adviser served as the Funds’ principal underwriter and may receive compensation therefore from, among other things, sales charges, distribution fees and shareholder services fees (which included fees received pursuant to any 12b-1 plan). The Independent Board Members therefore took into account, among other things, the 12b-1 fees retained by Nuveen during the last calendar year.
In addition to the above, the Independent Board Members considered whether the Fund Adviser received any benefits from soft dollar arrangements whereby a portion of the commissions paid by a Fund for brokerage may be used to acquire research that may be useful to the Fund Adviser in managing the assets of the Fund and other clients. The Funds’ portfolio transactions are allocated by the Sub-Adviser. Accordingly, the Independent Board Members considered that the Sub-Adviser may benefit from research provided by broker-dealers executing portfolio transactions on behalf of the Funds. With respect to any fixed income securities, however, the Board recognized that such securities generally trade on a principal basis that does not generate soft dollar credits. Similarly, the Board recognized that any research received pursuant to soft dollar arrangements by the Sub-Adviser may also benefit the Funds and shareholders to the extent the research enhanced the ability of the Sub-Adviser to manage the Funds. The Independent Board Members noted that the Sub-Adviser’s profitability may be somewhat lower if it had to acquire any such research services directly.
Based on their review, the Independent Board Members concluded that any indirect benefits received by a Fund Adviser as a result of its relationship with the Funds were reasonable and within acceptable parameters.
F. Other Considerations
The Independent Board Members did not identify any single factor discussed previously as all-important or controlling. The Board Members, including the Independent Board Members, concluded that the terms of each Advisory Agreement were fair and reasonable, that the respective Fund Adviser’s fees were reasonable in light of the services provided to each Fund and that the Advisory Agreements be renewed.
Trustees
and Officers (Unaudited)
The management of the Funds, including general supervision of the duties performed for the Funds by the Adviser, is the responsibility of the Board of Trustees of the Funds. The number of directors of the Funds is set at twelve, effective July 1, 2016. None of the trustees who are not “interested” persons of the Funds (referred to herein as “independent trustees”) has ever been a director or employee of, or consultant to, Nuveen or its affiliates. The names and business addresses of the trustees and officers of the Funds, their principal occupations and other affiliations during the past five years, the number of portfolios each oversees and other directorships they hold are set forth below.
The Funds’ Statement of Additional Information (“SAI”) includes more information about the trustees. To request a free copy, call Nuveen Investments at (800) 257-8787 or visit the Funds’ website at www.nuveen.com.
| | | | | | | | |
Name, Year of Birth & Address | | Position(s) Held with the Funds | | Year First Elected or Appointed (1) | | Principal Occupation(s) Including other Directorships During Past 5 Years | | Number of Portfolios in Fund Complex Overseen by Trustee |
| | | |
| Independent Trustee: | | | | |
William J. Schneider 1944 333 W. Wacker Drive Chicago, IL 60606 | | Chairman and Trustee | | 1996 | | Chairman of Miller-Valentine Partners, a real estate investment company; Board Member of Med-America Health System and WDPR Public Radio station; formerly, Senior Partner and Chief Operating Officer (retired (2004) of Miller-Valentine Group; formerly, Board member, Business Advisory Council of the Cleveland Federal Reserve Bank and University of Dayton Business School Advisory Council; past Chair and Director, Dayton Development Coalition. | | 184 |
Jack B. Evans 1948 333 W. Wacker Drive Chicago, IL 60606 | | Trustee | | 1999 | | President, The Hall-Perrine Foundation, a private philanthropic corporation (since 1996); Director and Chairman, United Fire Group, a publicly held company; Director, The Gazette Company; Life Trustee of Coe College and the Iowa College Foundation; formerly, President Pro-Tem of the Board of Regents for the State of Iowa University System; formerly, Director, Alliant Energy; formerly, Director, Federal Reserve Bank of Chicago; formerly, President and Chief Operating Officer, SCI Financial Group, Inc., a regional financial services firm. | | 184 |
William C. Hunter 1948 333 W. Wacker Drive Chicago, IL 60606 | | Trustee | | 2004 | | Dean Emeritus, formerly, Dean, Tippie College of Business, University of Iowa (2006-2012); Director (since 2004) of Xerox Corporation; Director (since 2005), and past President (2010-2014) Beta Gamma Sigma, Inc., The International Business Honor Society; Director of Wellmark, Inc. (since 2009); formerly, Dean and Distinguished Professor of Finance, School of Business at the University of Connecticut (2003-2006); previously, Senior Vice President and Director of Research at the Federal Reserve Bank of Chicago (1995-2003); formerly, Director (1997-2007), Credit Research Center at Georgetown University. | | 184 |
David J. Kundert 1942 333 W. Wacker Drive Chicago, IL 60606 | | Trustee | | 2005 | | Formerly, Director, Northwestern Mutual Wealth Management Company (2006-2013); retired (since 2004) as Chairman, JPMorgan Fleming Asset Management, President and CEO, Banc One Investment Advisors Corporation, and President, One Group Mutual Funds; prior thereto, Executive Vice President, Banc One Corporation and Chairman and CEO, Banc One Investment Management Group; Regent Emeritus, Member of Investment Committee, Luther College; member of the Wisconsin Bar Association; member of Board of Directors and Chair of Investment Committee, Greater Milwaukee Foundation; member of the Board of Directors (Milwaukee), College Possible; Board member of Milwaukee Repertory Theatre (since 2016). | | 184 |
Trustees and Officers (Unaudited) (continued)
| | | | | | | | |
Name, Year of Birth & Address | | Position(s) Held with the Funds | | Year First Elected or Appointed (1) | | Principal Occupation(s) Including other Directorships During Past 5 Years | | Number of Portfolios in Fund Complex Overseen by
Trustee |
Albin F. Moschner(2) 1952 333 W. Wacker Drive Chicago, IL 60606 | | Trustee | | 2016 | | Founder and Chief Executive Officer, Northcroft Partners, LLC, a management consulting firm (since 2012); previously, held positions at Leap Wireless International, Inc., including Consultant (2011-2012), Chief Operating Officer (2008-2011), and Chief Marketing Officer (2004-2008); formerly, President, Verizon Card Services division of Verizon Communications, Inc. (2000-2003); formerly, President, One Point Services at One Point Communications (1999-2000); formerly, Vice Chairman of the Board, Diba, Incorporated (1996-1997); formerly, various executive positions with Zenith Electronics Corporation (1991-1996). Director, USA Technologies, Inc., a provider of solutions and services to facilitate electronic payment transactions (since 2012); formerly, Director, Wintrust Financial Corporation (1996-2016). | | 184 |
John K. Nelson 1962 333 West Wacker Drive Chicago, IL 60606 | | Trustee | | 2013 | | Member of Board of Directors of Core12 LLC (since 2008), a private firm which develops branding, marketing and communications strategies for clients; Director of The Curran Center for Catholic American Studies (since 2009) and The President’s Council, Fordham University (since 2010); formerly senior external advisor to the financial services practice of Deloitte Consulting LLP (2012-2014); formerly, Chairman of the Board of Trustees of Marian University (2010 as trustee, 2011-2014 as Chairman); formerly, Chief Executive Officer of ABN AMRO N.V. North America, and Global Head of its Financial Markets Division (2007-2008); prior senior positions held at ABN AMRO include Corporate Executive Vice President and Head of Global Markets—the Americas (2006-2007), CEO of Wholesale Banking—North America and Global Head of Foreign Exchange and Futures Markets (2001-2006), and Regional Commercial Treasurer and Senior Vice President Trading—North America (1996-2001); formerly, Trustee at St. Edmund Preparatory School in New York City. | | 184 |
Judith M. Stockdale 1947 333 W. Wacker Drive Chicago, IL 60606 | | Trustee | | 1997 | | Board Member, Land Trust Alliance (since 2013) and U.S. Endowment for Forestry and Communities (since 2013); formerly, Executive Director (1994-2012), Gaylord and Dorothy Donnelley Foundation; prior thereto, Executive Director, Great Lakes Protection Fund (1990-1994). | | 184 |
Carole E. Stone 1947 333 W. Wacker Drive Chicago, IL 60606 | | Trustee | | 2007 | | Director, Chicago Board Options Exchange (since 2006), C2 Options Exchange, Incorporated (since 2009); Director, CBOE Holdings, Inc. (since 2010); formerly, Commissioner, New York State Commission on Public Authority Reform (2005-2010). | | 184 |
Terence J. Toth 1959 333 W. Wacker Drive Chicago, IL 60606 | | Trustee | | 2008 | | Managing Partner, Promus Capital (since 2008); Director, Fulcrum IT Service LLC (since 2010), Quality Control Corporation (since 2012) and LogicMark LLC (since 2012); member: Chicago Fellowship Board (since 2005), Catalyst Schools of Chicago Board (since 2008) and Mather Foundation Board (since 2012), and chair of its investment committee; formerly, Director, Legal & General Investment Management America, Inc. (2008-2013); formerly, CEO and President, Northern Trust Global Investments (2004-2007); Executive Vice President, Quantitative Management & Securities Lending (2000-2004); prior thereto, various positions with Northern Trust Company (since 1994); formerly, Member, Northern Trust Mutual Funds Board (2005-2007), Northern Trust Global Investments Board (2004-2007), Northern Trust Japan Board (2004-2007), Northern Trust Securities Inc. Board (2003-2007) and Northern Trust Hong Kong Board (1997-2004). | | 184 |
| | | | | | | | |
Name, Year of Birth & Address | | Position(s) Held with the Funds | | Year First Elected or Appointed (1) | | Principal Occupation(s) Including other Directorships During Past 5 Years | | Number of Portfolios in Fund Complex Overseen by
Trustee |
Margaret L. Wolff 1955 333 W. Wacker Drive Chicago, IL 60606 | | Trustee | | 2016 | | Member of the Board of Directors (since 2013) of Travelers Insurance Company of Canada and The Dominion of Canada General Insurance Company (each, a part of Travelers Canada, the Canadian operation of The Travelers Companies, Inc.); formerly, Of Counsel, Skadden, Arps, Slate, Meagher & Flom LLP (Mergers & Acquisitions Group) (2005-2014); Member of the Board of Trustees of New York-Presbyterian Hospital (since 2005); Member (since 2004) and Chair (since 2015) of the Board of Trustees of The John A. Hartford Foundation (a philanthropy dedicated to improving the care of older adults); formerly, Member (2005-2015) and Vice Chair (2011-2015) of the Board of Trustees of Mt. Holyoke College. | | 184 |
| | | |
| Interested Trustee: | | | | |
William Adams IV(3) 1955 333 W. Wacker Drive Chicago, IL 60606 | | Trustee | | 2013 | | Co-Chief Executive Officer and Co-President (since March 2016), formerly, Senior Executive Vice President, Global Structured Products (2010-2016) of Nuveen Investments, Inc.; Co-President of Nuveen Fund Advisors, LLC (since 2011); Co-Chief Executive Officer (since 2016), formerly, Senior Executive Vice President of Nuveen Securities, LLC; President (since 2011), of Nuveen Commodities Asset Management, LLC; Board Member of the Chicago Symphony Orchestra and of Gilda’s Club Chicago; formerly, Executive Vice President, U.S. Structured Products, of Nuveen Investments, Inc. (1999-2010). | | 184 |
Margo L. Cook(2)(3) 1964 333 W. Wacker Drive Chicago, IL 60606 | | Trustee | | 2016 | | Co-Chief Executive Officer and Co-President (since March 2016), formerly, Senior Executive Vice President of Nuveen Investments, Inc; Co-Chief Executive Officer (since 2015), previously, Executive Vice President (2013-2015) of Nuveen Securities, LLC; Senior Executive Vice President of Nuveen Fund Advisors, LLC (Executive Vice President since 2011); formerly, Managing Director of Nuveen Commodities Asset Management, LLC (2011-2016); Chartered Financial Analyst. | | 184 |
| | | | | | | | |
Name,
Year of Birth & Address | | Position(s) Held with the Funds | | Year First Elected or Appointed (4) | | Principal Occupation(s) During Past 5 Years | | Number of Portfolios in Fund Complex Overseen by
Officer |
| | | |
| Officers of the Funds: | | | | |
Gifford R. Zimmerman 1956 333 W. Wacker Drive Chicago, IL 60606 | | Chief Administrative Officer | | 1988 | | Managing Director (since 2002), and Assistant Secretary of Nuveen Securities, LLC; Managing Director (since 2004) and Assistant Secretary (since 1994) of Nuveen Investments, Inc.; Managing Director (since 2002), Assistant Secretary (since 1997) and Co-General Counsel (since 2011) of Nuveen Fund Advisors, LLC; Managing Director, Assistant Secretary and Associate General Counsel of Nuveen Asset Management, LLC (since 2011); Managing Director and Assistant Secretary of Nuveen Investments Advisers Inc. (since 2002), and Symphony Asset Management LLC (since 2003); Vice President and Assistant Secretary of NWQ Investment Management Company, LLC (since 2002), Santa Barbara Asset Management, LLC (since 2006) and of Winslow Capital Management, LLC, (since 2010); Vice President and Assistant Secretary (since 2013), formerly, Chief Administrative Officer and Chief Compliance Officer (2006-2013) of Nuveen Commodities Asset Management, LLC; Chartered Financial Analyst. | | 185 |
Lorna C. Ferguson 1945 333 W. Wacker Drive Chicago, IL 60606 | | Vice President | | 1998 | | Managing Director (since 2005) of Nuveen Fund Advisors, LLC and Nuveen Securities, LLC (since 2004). | | 185 |
Trustees and Officers (Unaudited) (continued)
| | | | | | | | |
Name,
Year of Birth & Address | | Position(s) Held with the Funds | | Year First Elected or Appointed (4) | | Principal Occupation(s) During Past 5 Years | | Number of Portfolios in Fund Complex Overseen by
Officer |
Stephen D. Foy 1954 333 W. Wacker Drive Chicago, IL 60606 | | Vice President and Controller | | 1998 | | Managing Director (since 2014), formerly, Senior Vice President (2013-2014) and Vice President (2005-2013) of Nuveen Fund Advisors, LLC; Chief Financial Officer of Nuveen Commodities Asset Management, LLC (since 2010); Managing Director (since 2016) of Nuveen Securities, LLC; Certified Public Accountant. | | 185 |
Nathaniel T. Jones 1979 333 W. Wacker Drive Chicago, IL 60606 | | Vice President and Treasurer | | 2016 | | Senior Vice President (since 2016), formerly, Vice President (2011-2016) of Nuveen Investments Holdings, Inc.; Chartered Financial Analyst. | | 185 |
Walter M. Kelly 1970 333 W. Wacker Drive Chicago, IL 60606 | | Chief Compliance Officer and Vice President | | 2003 | | Senior Vice President (since 2008) of Nuveen Investments Holdings, Inc. | | 185 |
Tina M. Lazar 1961 333 W. Wacker Drive Chicago, IL 60606 | | Vice President | | 2002 | | Senior Vice President of Nuveen Investments Holdings, Inc. and Nuveen Securities, LLC | | 185 |
Kevin J. McCarthy 1966 333 W. Wacker Drive Chicago, IL 60606 | | Vice President and Secretary | | 2007 | | Executive Vice President, Secretary and General Counsel (since March 2016), formerly, Managing Director and Assistant Secretary of Nuveen Investments, Inc.; Executive Vice President (since March 2016), formerly, Managing Director, and Assistant Secretary (since 2008) of Nuveen Securities, LLC; Executive Vice President and Secretary (since March 2016), formerly, Managing Director (2008-2016) and Assistant Secretary (2007-2016), and Co-General Counsel (since 2011) of Nuveen Fund Advisors, LLC; Executive Vice President and Secretary (since March 2016), formerly, Managing Director, Assistant Secretary (2011-2016), and Associate General Counsel (since 2011) of Nuveen Asset Management, LLC; Executive Vice President and Secretary of Nuveen Investments Advisers, LLC; Vice President (since 2007) and Secretary (since March 2016) of NWQ Investment Management Company, LLC, Symphony Asset Management LLC, Santa Barbara Asset Management, LLC, Winslow Capital Management, LLC (since 2010) and Tradewinds Global Investors, LLC (since 2016); Vice President (since 2010) and Secretary (since 2016), formerly, Assistant Secretary of Nuveen Commodities Asset Management, LLC. | | 185 |
Kathleen L. Prudhomme 1953 901 Marquette Avenue Minneapolis, MN 55402 | | Vice President and Assistant Secretary | | 2011 | | Managing Director, Assistant Secretary and Co-General Counsel (since 2011) of Nuveen Fund Advisors, LLC; Managing Director, Assistant Secretary and Associate General Counsel (since 2011) of Nuveen Asset Management, LLC; Managing Director and Assistant Secretary (since 2011) of Nuveen Securities, LLC; formerly, Deputy General Counsel, FAF Advisors, Inc. (2004-2010). | | 185 |
Joel T. Slager 1978 333 West Wacker Drive Chicago, IL 60606 | | Vice President and Assistant Secretary | | 2013 | | Fund Tax Director for Nuveen Funds (since 2013); previously, Vice President of Morgan Stanley Investment Management, Inc., Assistant Treasurer of the Morgan Stanley Funds (from 2010 to 2013). | | 185 |
Jeffery M. Wilson 1956 333 West Wacker Drive Chicago, IL 60606 | | Vice President | | 2011 | | Senior Vice President of Nuveen Investments Holdings, Inc. (since 2011); formerly Senior Vice President of Nuveen Securities, LLC (since 2011); formerly, Senior Vice President of FAF Advisors, Inc. (2000-2010). | | 102 |
| (1) | Trustees serve an indefinite term until his/her successor is elected or appointed. The year first elected or appointed represents the year in which the director was first elected or appointed to any fund in the Nuveen Fund Complex. |
| (2) | On June 22, 2016, Ms. Cook and Mr. Moschner were appointed as Board Members, effective July 1, 2016. |
| (3) | “Interested persons” of the Trust, as defined in the 1940 Act, by reason of their positions with Nuveen and certain of its subsidiaries. |
| (4) | Officers serve one year terms through August of each year. The year first elected or appointed represents the year in which the officer was first elected or appointed to any fund in the Nuveen Fund Complex. |
Notes
Notes
Notes
| | | | | | | | | | | | | | |
| | | | | | | | |
| | | | |
| | | | | | | | |
| | | | | |
| | Nuveen: | | | | | | | | |
| | | | Serving Investors for Generations | | |
| | |
| | | | |
| | | |
| | | | Since 1898, financial advisors and their clients have relied on Nuveen to provide dependable investment solutions through continued adherence to proven, long-term investing principles. Today, we offer a range of high quality equity and fixed-income solutions designed to be integral components of a well-diversified core portfolio. | | |
| | | |
| | | | | | |
| | | | |
| | | | | | Focused on meeting investor needs. Nuveen helps secure the long-term goals of individual investors and the advisors who serve them. As an operating division of TIAA Global Asset Management, Nuveen provides access to investment expertise from leading asset managers and solutions across traditional and alternative asset classes. Built on more than a century of industry leadership, Nuveen’s teams of experts align with clients’ specific financial needs and goals, demonstrating commitment to advisors and investors through market perspectives and wealth management and portfolio advisory services. Nuveen manages more than $229 billion in assets as of March 31, 2016. | | |
| | | | | |
| | | | | | | | | | |
| | | | | | Find out how we can help you. To learn more about how the products and services of Nuveen may be able to help you meet your financial goals, talk to your financial advisor, or call us at (800) 257-8787. Please read the information provided carefully before you invest. Investors should consider the investment objective and policies, risk considerations, charges and expenses of any investment carefully. Where applicable, be sure to obtain a prospectus, which contains this and other relevant information. To obtain a prospectus, please contact your securities representative or Nuveen, 333 W. Wacker Dr., Chicago, IL 60606. Please read the prospectus carefully before you invest or send money. Learn more about Nuveen Funds at: www.nuveen.com/mf | | |
| | | | | | |
| | | | | | | | | | | | |
| | Distributed by Nuveen Securities, LLC 333 West Wacker Drive Chicago, IL 60606 | www.nuveen.com | | |
MAN-NAT-0416D 16844-INV-Y-06/17
ITEM 2. CODE OF ETHICS.
As of the end of the period covered by this report, the registrant has adopted a code of ethics that applies to the registrant’s principal executive officer, principal financial officer, principal accounting officer or controller, or persons performing similar functions. There were no amendments to or waivers from the code during the period covered by this report. The registrant has posted the code of ethics on its website at www.nuveen.com/MutualFunds/ShareholderResources/FundGovernance.aspx. (To view the code, click on Code of Conduct.)
ITEM 3. AUDIT COMMITTEE FINANCIAL EXPERT.
The registrant’s Board of Directors or Trustees (“Board”) determined that the registrant has at least one “audit committee financial expert” (as defined in Item 3 of Form N-CSR) serving on its Audit Committee. The registrant’s audit committee financial experts are Carole E. Stone and Jack B. Evans, who are “independent” for purposes of Item 3 of Form N-CSR.
Ms. Stone served for five years as Director of the New York State Division of the Budget. As part of her role as Director, Ms. Stone was actively involved in overseeing the development of the State’s operating, local assistance and capital budgets, its financial plan and related documents; overseeing the development of the State’s bond-related disclosure documents and certifying that they fairly presented the State’s financial position; reviewing audits of various State and local agencies and programs; and coordinating the State’s system of internal audit and control. Prior to serving as Director, Ms. Stone worked as a budget analyst/examiner with increasing levels of responsibility over a 30 year period, including approximately five years as Deputy Budget Director. Ms. Stone has also served as Chair of the New York State Racing Association Oversight Board, as Chair of the Public Authorities Control Board, as a Commissioner on the New York State Commission on Public Authority Reform and as a member of the Boards of Directors of several New York State public authorities. These positions have involved overseeing operations and finances of certain entities and assessing the adequacy of project/entity financing and financial reporting. Currently, Ms. Stone is on the Board of Directors of CBOE Holdings, Inc., of the Chicago Board Options Exchange, and of C2 Options Exchange. Ms. Stone’s position on the boards of these entities and as a member of both CBOE Holdings’ Audit Committee and its Finance Committee has involved, among other things, the oversight of audits, audit plans and preparation of financial statements.
Mr. Evans was formerly President and Chief Operating Officer of SCI Financial Group, Inc., a full service registered broker-dealer and registered investment adviser (“SCI”). As part of his role as President and Chief Operating Officer, Mr. Evans actively supervised the Chief Financial Officer (the “CFO”) and actively supervised the CFO’s preparation of financial statements and other filings with various regulatory authorities. In such capacity, Mr. Evans was actively involved in the preparation of SCI’s financial statements and the resolution of issues raised in connection therewith. Mr. Evans has also served on the audit committee of various reporting companies. At such companies, Mr. Evans was involved in the oversight of audits, audit plans, and the preparation of financial statements. Mr. Evans also formerly chaired the audit committee of the Federal Reserve Bank of Chicago.
ITEM 4. PRINCIPAL ACCOUNTANT FEES AND SERVICES.
The following tables show the amount of fees that PricewaterhouseCoopers LLP, the Funds’ auditor, billed to the Funds’ during the Funds’ last two full fiscal years. The Audit Committee approved in advance all audit services and non-audit services that PricewaterhouseCoopers LLP provided to the Funds, except for those non-audit services that were subject to the pre-approval exception under Rule 2-01 of Regulation S-X (the “pre-approval exception”). The preapproval exception for services provided directly to the Funds waives the pre-approval requirement for services other than audit, review or attest services if: (A) the aggregate amount of all such services provided constitutes no more than 5% of the total amount of revenues paid by the Funds during the fiscal year in which the services are provided; (B) the Funds did not recognize the services as non-audit services at the time of the engagement; and (C) the services are promptly brought to the Audit Committee’s attention, and the Committee (or its delegate) approves the services before the audit is completed.
The Audit Committee has delegated certain pre-approval responsibilities to its Chairman (or, in his absence, any other member of the Audit Committee).
SERVICES THAT THE AUDITOR BILLED TO THE FUND
| | | | | | | | | | | | | | | | |
Fiscal Year Ended April 30, 2016 | | Audit Fees Billed
to Funds 1 | | | Audit-Related Fees
Billed to Funds 2 | | | Tax Fees
Billed to Funds 3 | | | All Other Fees
Billed to Funds 4 | |
Fund Name | | | | | | | | | | | | | | | | |
Nuveen Short Term Municipal Bond Fund | | | 20,216 | | | | 0 | | | | 74 | | | | 0 | |
| | | | | | | | | | | | | | | | |
Total | | $ | 20,216 | | | $ | 0 | | | $ | 74 | | | $ | 0 | |
| 1 | | “Audit Fees” are the aggregate fees billed for professional services for the audit of the Fund’s annual financial statements and services provided in connection with statutory and regulatory filings or engagements. |
| 2 | | “Audit-Related Fees” are the aggregate fees billed for assurance and related services reasonably related to the performance of the audit or review of financial statements that are not reported under “Audit Fees”. These fees include offerings related to the Fund’s common shares and leverage. |
| 3 | | “Tax Fees” are the aggregate fees billed for professional services for tax advice, tax compliance, and tax planning. These fees include: all global withholding tax services; excise and state tax reviews; capital gain, tax equalization and taxable basis calculations performed by the principal accountant. |
| 4 | | “All Other Fees” are the aggregate fees billed for products and services other than “Audit Fees”, “Audit-Related Fees” and “Tax Fees”. These fees represent all “Agreed-Upon Procedures” engagements pertaining to the Fund’s use of leverage. |
| | | | | | | | | | | | | | | | |
| | | Percentage Approved Pursuant to Pre-approval Exception | |
| | | Audit Fees Billed
to Funds | | | Audit-Related Fees
Billed to Funds | | | Tax Fees
Billed to Funds | | | All Other Fees
Billed to Funds | |
Fund Name | | | | | | | | | | | | | | | | |
Nuveen Short Term Municipal Bond Fund | | | 0 | % | | | 0 | % | | | 0 | % | | | 0 | % |
| | | | |
April 30, 2015 | | Audit Fees Billed
to Funds 1 | | | Audit-Related Fees
Billed to Funds 2 | | | Tax Fees
Billed to Funds 3 | | | All Other Fees
Billed to Funds 4 | |
Fund Name | | | | | | | | | | | | | | | | |
Nuveen Short Term Municipal Bond Fund | | | 19,736 | | | | 0 | | | | 0 | | | | 0 | |
| | | | | | | | | | | | | | | | |
Total | | $ | 19,736 | | | $ | 0 | | | $ | 0 | | | $ | 0 | |
| 1 | | “Audit Fees” are the aggregate fees billed for professional services for the audit of the Fund’s annual financial statements and services provided in connection with statutory and regulatory filings or engagements. |
| 2 | | “Audit-Related Fees” are the aggregate fees billed for assurance and related services reasonably related to the performance of the audit or review of financial statements that are not reported under “Audit Fees”. These fees include offerings related to the Fund’s common shares and leverage. |
| 3 | | “Tax Fees” are the aggregate fees billed for professional services for tax advice, tax compliance, and tax planning. These fees include: all global withholding tax services; excise and state tax reviews; capital gain, tax equalization and taxable basis calculations performed by the principal accountant. |
| 4 | | “All Other Fees” are the aggregate fees billed for products and services other than “Audit Fees”, “Audit-Related Fees” and “Tax Fees”. These fees represent all “Agreed-Upon Procedures” engagements pertaining to the Fund’s use of leverage. |
| | | | | | | | | | | | | | | | |
| | | Percentage Approved Pursuant to Pre-approval Exception | |
| | | Audit Fees Billed
to Funds | | | Audit-Related Fees
Billed to Funds | | | Tax Fees
Billed to Funds | | | All Other Fees
Billed to Funds | |
Fund Name | | | | | | | | | | | | | | | | |
Nuveen Short Term Municipal Bond Fund | | | 0 | % | | | 0 | % | | | 0 | % | | | 0 | % |
| | | | | | | | | | | | |
Fiscal Year Ended April 30, 2016 | | Audit-Related Fees
Billed to Adviser and
Affiliated Fund
Service Providers | | | Tax Fees Billed to
Adviser and
Affiliated Fund
Service Providers | | | All Other Fees
Billed to Adviser
and Affiliated Fund
Service Providers | |
Nuveen Investment Funds, Inc. | | $ | 0 | | | $ | 0 | | | $ | 0 | |
| |
| | | Percentage Approved Pursuant to Pre-approval Exception | |
| | | Audit-Related Fees
Billed to Adviser and
Affiliated Fund
Service Providers | | | Tax Fees Billed to
Adviser and
Affiliated Fund
Service Providers | | | All Other Fees
Billed to Adviser
and Affiliated Fund
Service Providers | |
| | | 0 | % | | | 0 | % | | | 0 | % |
| | | |
Fiscal Year Ended April 30, 2015 | | Audit-Related Fees
Billed to Adviser and
Affiliated Fund
Service Providers | | | Tax Fees Billed to
Adviser and
Affiliated Fund
Service Providers | | | All Other Fees
Billed to Adviser
and Affiliated Fund
Service Providers | |
Nuveen Investment Funds, Inc. | | $ | 0 | | | $ | 0 | | | $ | 0 | |
| |
| | | Percentage Approved Pursuant to Pre-approval Exception | |
| | | Audit-Related Fees
Billed to Adviser and
Affiliated Fund
Service Providers | | | Tax Fees Billed to
Adviser and
Affiliated Fund
Service Providers | | | All Other Fees
Billed to Adviser
and Affiliated Fund
Service Providers | |
| | | 0 | % | | | 0 | % | | | 0 | % |
| | | | | | | | | | | | | | | | |
Fiscal Year Ended April 30, 2016 | | Total Non-Audit Fees
Billed to Trust | | | Total Non-Audit Fees
billed to Adviser and
Affiliated Fund Service
Providers (engagements
related directly to the
operations and financial
reporting of the Trust) | | | Total Non-Audit Fees
billed to Adviser and
Affiliated Fund Service
Providers (all other
engagements) | | | Total | |
Fund Name | | | | | | | | | | | | | | | | |
Nuveen Short Term Municipal Bond Fund | | | 74 | | | | 0 | | | | 0 | | | | 74 | |
| | | | | | | | | | | | | | | | |
Total | | $ | 74 | | | $ | 0 | | | $ | 0 | | | $ | 74 | |
“Non-Audit Fees billed to Fund” for both fiscal year ends represent “Tax Fees” and “All Other Fees” billed to Fund in their respective amounts from the previous table.
Less than 50 percent of the hours expended on the principal accountant’s engagement to audit the registrant’s financial statements for the most recent fiscal year were attributed to work performed by persons other than the principal accountant’s full-time, permanent employees.
| | | | | | | | | | | | | | | | |
Fiscal Year Ended April 30, 2015 | | Total Non-Audit Fees
Billed to Trust | | | Total Non-Audit Fees
billed to Adviser and
Affiliated Fund Service
Providers (engagements
related directly to the
operations and financial
reporting of the Trust) | | | Total Non-Audit Fees
billed to Adviser and
Affiliated Fund Service
Providers (all other
engagements) | | | Total | |
Fund Name | | | | | | | | | | | | | | | | |
Nuveen Short Term Municipal Bond Fund | | | 0 | | | | 0 | | | | 0 | | | | 0 | |
| | | | | | | | | | | | | | | | |
Total | | $ | 0 | | | $ | 0 | | | $ | 0 | | | $ | 0 | |
“Non-Audit Fees billed to Fund” for both fiscal year ends represent “Tax Fees” and “All Other Fees” billed to Fund in their respective amounts from the previous table.
Audit Committee Pre-Approval Policies and Procedures. Generally, the Audit Committee must approve (i) all non-audit services to be performed for the Funds by the Funds’ independent accountant and (ii) all audit and non-audit services to be performed by the Funds’ independent accountant for the Affiliated Fund Service Providers with respect to the operations and financial reporting of the Funds. Regarding tax and research projects conducted by the independent accountant for the Funds and Affiliated Fund Service Providers (with respect to operations and financial reports of the Trust), such engagements will be (i) pre-approved by the Audit Committee if they are expected to be for amounts greater than $10,000; (ii) reported to the Audit Committee Chairman for his verbal approval prior to engagement if they are expected to be for amounts under $10,000 but greater than $5,000; and (iii) reported to the Audit Committee at the next Audit Committee meeting if they are expected to be for an amount under $5,000.
ITEM 5. AUDIT COMMITTEE OF LISTED REGISTRANTS.
Not applicable to this registrant.
ITEM 6. SCHEDULE OF INVESTMENTS.
| a) | | See Portfolio of Investments in Item 1. |
ITEM 7. DISCLOSURE OF PROXY VOTING POLICIES AND PROCEDURES FOR CLOSED-END
MANAGEMENT INVESTMENT COMPANIES.
Not applicable to this registrant.
ITEM 8. PORTFOLIO MANAGERS OF CLOSED-END MANAGEMENT INVESTMENT COMPANIES.
Not applicable to this registrant.
ITEM 9. PURCHASES OF EQUITY SECURITIES BY CLOSED-END MANAGEMENT INVESTMENT COMPANY AND AFFILIATED PURCHASERS.
Not applicable to this registrant.
ITEM 10. SUBMISSION OF MATTERS TO A VOTE OF SECURITY HOLDERS.
There have been no material changes to the procedures by which shareholders may recommend nominees to the registrant’s Board of Trustees implemented after the registrant last provided disclosure in response to this Item.
ITEM 11. CONTROLS AND PROCEDURES.
| | (a) | | The registrant’s principal executive and principal financial officers, or persons performing similar functions, have concluded that the registrant’s disclosure controls and procedures (as defined in Rule 30a-3(c) under the Investment Company Act of 1940, as amended (the “1940 Act”) (17 CFR 270.30a-3(c))) are effective, as of a date within 90 days of the filing date of this report that includes the disclosure required by this paragraph, based on their evaluation of the controls and procedures required by Rule 30a-3(b) under the 1940 Act (17 CFR 270.30a-3(b)) and Rules 13a-15(b) or 15d-15(b) under the Securities Exchange Act of 1934, as amended (the “Exchange Act”) (17 CFR 240.13a-15(b) or 240.15d-15(b)). |
| | (b) | | There were no changes in the registrant’s internal control over financial reporting (as defined in Rule 30a-3(d) under the 1940 Act (17 CFR 270.30a-3(d)) that occurred during the second fiscal quarter of the period covered by this report that has materially affected, or is reasonably likely to materially affect, the registrant’s internal control over financial reporting. |
ITEM 12. EXHIBITS.
File the exhibits listed below as part of this Form.
| | |
| (a)(1) | | Any code of ethics, or amendment thereto, that is the subject of the disclosure required by Item 2, to the extent that the registrant intends to satisfy the Item 2 requirements through filing of an exhibit: Not applicable because the code is posted on registrant’s website at www.nuveen.com/MutualFunds/ShareholderResources/FundGovernance.aspx and there were no amendments during the period covered by this report. (To view the code, click on Code of Conduct.) |
| |
| (a)(2) | | A separate certification for each principal executive officer and principal financial officer of the registrant as required by Rule 30a-2(a) under the 1940 Act (17 CFR 270.30a-2(a)) in the exact form set forth below: See EX-99.CERT attached hereto. |
| |
| (a)(3) | | Any written solicitation to purchase securities under Rule 23c-1 under the 1940 Act (17 CFR 270.23c-1) sent or given during the period covered by the report by or on behalf of the registrant to 10 or more persons: Not applicable to this registrant. |
| |
| (b) | | If the report is filed under Section 13(a) or 15(d) of the Exchange Act, provide the certifications required by Rule 30a-2(b) under the 1940 Act (17 CFR 270.30a-2(b)), Rule 13a-14(b) or Rule 15d-14(b) under the Exchange Act (17 CFR 240.13a-14(b) or 240.15d-14(b)), and Section 1350 of Chapter 63 of Title 18 of the United States Code (18 U.S.C. 1350) as an Exhibit. A certification furnished pursuant to this paragraph will not be deemed “filed” for purposes of Section 18 of the Exchange Act (15 U.S.C. 78r), or otherwise subject to the liability of that section. Such certification will not be deemed to be incorporated by reference into any filing under the Securities Act of 1933 or the Exchange Act, except to the extent that the registration specifically incorporates it by reference: See EX-99.906 CERT attached hereto. |
SIGNATURES
Pursuant to the requirements of the Securities Exchange Act of 1934 and the Investment Company Act of 1940, the registrant has duly caused this report to be signed on its behalf by the undersigned, thereunto duly authorized.
(Registrant) Nuveen Investment Funds, Inc.
| | |
| |
| By (Signature and Title) | | /s/ Kevin J. McCarthy |
| | Kevin J. McCarthy |
| | Vice President and Secretary |
Date: July 7, 2016
Pursuant to the requirements of the Securities Exchange Act of 1934 and the Investment Company Act of 1940, this report has been signed below by the following persons on behalf of the registrant and in the capacities and on the dates indicated.
| | |
| |
| By (Signature and Title) | | /s/ Gifford R. Zimmerman |
| | Gifford R. Zimmerman |
| | Chief Administrative Officer |
| | (principal executive officer) |
Date: July 7, 2016
| | |
| |
| By (Signature and Title) | | /s/ Stephen D. Foy |
| | Stephen D. Foy |
| | Vice President and Controller |
| | (principal financial officer) |
Date: July 7, 2016