A NO-LOAD
MUTUAL FUND
SEMI-ANNUAL REPORT
Dated March 31, 2017
April 28, 2017
Dear Shareholders,
We are pleased to present the Semi-Annual Report of Concorde Funds, Inc. for the six month period ending March 31, 2017.
Concorde Wealth Management Fund
Concorde Wealth Management Fund (the “Fund”), managed by Concorde Investment Management, generated a positive net total return of 3.27% for the six month period ending March 31, 2017. This is compared to the various equity, fixed income and blended indices below. The Fund continued to transition to the new balanced objective that became effective during late summer 2016. Asset allocations at period-end were approximately 45% equities, 48% fixed income and cash equivalents and 7% in pure commodity and metals based securities.
Individual fixed income securities, which increased from about 27% to 30% during the period, produced a modest total return of -1.08%, beating the Bloomberg Barclays U.S. Aggregate Bond index which reported -2.18%. The relatively short average maturity of the Fund holdings and the positive performance of the corporate holdings explain the modest difference. Open end fixed income investments that the Fund began to make during the period contributed significantly to performance for the fixed income allocation and the Fund overall. The three investments, which comprised almost 5% of Fund assets at March 31, 2017, contributed between 1.73% and 4.00% total return each for the period. Each investment has been selected to add diversification and specialized management and has been weighted according to the current attractiveness of the particular bond sectors that it focuses on. The Morgan Stanley Global Fixed Income Opportunities investment has a flexible policy mandate, however; despite the flexible policy, we are able to monitor current strategy exposures. These investments provided significant monthly or quarterly income in addition to capital appreciation potential. Combining the three managed money investments with our individual fixed income securities, total return performance for fixed income investments was only slightly negative, beating the broad bond indices. Cash equivalents remained elevated above expected long term target allocations as the transition to the new asset policy percentages is ongoing and we have not become fully invested in the fixed income, commodity, real estate and private equity segments.
| | Six Months Ended | 1 Year | Annualized | Annualized |
| | March 31, 2017 | Ending | 5 Years Ending | 10 Years Ending |
| | (Unaudited) | March 31, 2017 | March 31, 2017 | March 31, 2017 |
| Concorde Wealth Management Fund | 3.27% | 9.47% | 7.24% | 1.48% |
| Bloomberg Barclays | | | | |
| U.S. Aggregate Bond Index | -2.18% | 0.44% | 2.34% | 4.27% |
| Russell 3000 Index | 10.19% | 18.07% | 13.18% | 7.54% |
| Concorde Wealth Management | | | | |
| Blended Index | 3.82% | 8.12% | 6.91% | 5.79% |
| S&P 500 Index | | 17.17% | 13.30% | 7.51% |
| Russell 3000 Value Index | | 19.97% | 13.08% | 5.94% |
Note: The Concorde Wealth Management Blended Index consists of 45% equities represented by the Russell 3000 Index, 45% bonds represented by the Barclays Intermediate Aggregate Bond Index, 5% short-term investments represented by Bank of America Merrill Lynch 1-3 Year Treasuries, and 5% commodities represented by Barclays U.S. Treasury Inflation Protection Security. The Russell 3000
Index measures the performance of the largest 3,000 U.S. Companies representing approximately 98% of the investable U.S. equity market. The Barclays Aggregate Bond Index measures the investment grade, U.S. dollar denominated, fixed-rate taxable bond market, including Treasuries, government-related and corporate securities, MBS (agency fixed-rate and hybrid ARM pass throughs), ABS, and CMBS. The Concorde Wealth Management Blended Index, Russell 3000 Index, and Barclay Aggregate Bond Index are replacing the Russell 3000 Value Index and the S&P 500 because the Fund believes that, due to the Reorganization of the Fund in July 2016, the composition of these indices better reflect the Fund’s holdings for comparative reasons. The Russell 3000 Value Index measures the performance of the Russell 3000 Index companies with lower price-to-book ratios and lower forecasted growth values. The S&P 500 consists of 500 selected stocks, most of which are listed on the New York Stock Exchange. It is a widely recognized unmanaged index of stock prices.
Equity securities provided the majority of the Fund’s positive return with a high single digit contribution. As has been the case through most of the current bull market, sector and individual stock returns varied widely. Allergan, HCA Holdings, Johnson & Johnson, and HealthSouth all had positive returns and represented all of the healthcare holdings. All of these companies are leaders in their particular segments and should be able to navigate and prosper long term in the uncertain domestic environment and the growing international markets. The Fund’s energy holdings were mixed. Only Cimarex Energy had a loss for the six months, although this was after a large gain in the first half of 2016. Kinder Morgan Pfd. A, Halliburton and Valero Energy all rose as the domestic energy market stabilized and began to recover. After approaching our valuation target we sold the Valero position, realizing a modest gain over a one year time frame. Valero gained about 27% during the six month period. Texas Pacific Land Trust, a security primarily representing a long term call on domestic crude oil pricing and production via its non-participating royalty interests in the Midland and Delaware basis in Texas, rose 17%.
Among our technology investments, all contributed positive results for the period. Oracle, Amazon and Microsoft are all benefitting from the transition to cloud computing and service although in different segments and services. Level 3 Communications, a new holding during the period, entered into a merger agreement with Century Link soon after our investment, and our analysis shows that this combination may be as promising as our initial outlook for Level 3 as a standalone business. We are maintaining a modest position until further work is done. Amazon stock rose slightly after a strong move earlier in 2016 and Microsoft gained about 15% as reported results continue to impress. Market pricing for these two leaders are not as attractive compared to our valuations as they have been but still warrant a hold.
AB Inbev, Hanesbrands and The Hershey Company, all considered consumer oriented businesses, contributed mixed performance results. AB Inbev and Hanesbrands had the two largest losses for the period in the Fund. AB Inbev generally reported acceptable operating results, but is transitioning with additional debt incurred in their recent merger with SAB and in addition to the general shunning of defensive businesses compared to cyclical or growth-orientation businesses. Hanesbrands struggled with some inventory and acquisition related expense issues during 2016 and then reported a disappointing fourth quarter. We have rebalanced and reduced this position over the last three years and believe a smaller position is still warranted as the stock has dropped significantly over the last year. AB Inbev represents good value particularly if they are able to integrate the acquisition efficiently, and if they are able to eventually deleverage again. The Hershey Company, a new investment, rose about 15% after our initial purchase and we will look for opportunities to potentially increase the position in this quality business.
Three media industry investments in the portfolio, Walt Disney, Discovery Communications and Comcast, all contributed good gains as the concerns and weakness that investors have expressed over
the last two years began to recede as companies with high quality assets, such as these, began to reflect again their long-term income potential despite the changing distribution landscape. Discovery stock rose high single digits and Comcast and Walt Disney gained around 14% and 22% respectively.
Medical Properties Trust and Prologis, two real estate investment trust (“REIT”) holdings, both had negative total returns despite significant dividends. The anticipation of rising bond yields certainly hurt the REIT stocks and concerns rose over one of Medical Property Trust’s larger tenants. We believe both still represent good value at current market prices.
AIG, Fortune Brands Home & Security, Union Pacific and Speedway Motorsports, primarily longer term holdings of the Fund, all contributed mid-single digit, market like gains. AIG and Fortune Brands’ current market price is approaching our valuation targets and we are monitoring them closely. Speedway Motorsports, purchased at a discount to our valuation analysis as result of struggles in a portion of their revenue model (on sight attendance and associated sales) has guaranteed long term television contract revenue to add value to the target. Union Pacific has started to report improving results as the domestic energy industry stabilizes and sand shipments recover and as general industrial freight volumes improve.
Finally, two new holdings, Hexcel Corp. and OakTree Capital Group, moved modestly up and down respectively from our initial purchase prices. Hexcel, a major aerospace airframe supplier using composite materials and proprietary processes, should benefit from long term global growth in travel volume. OakTree Capital specializes in institutional investment management, particularly in the credit markets and distributes significant dividends along with the potential for growth over time.
Thank you for your continued support. We will continue to strive for the highest professional standards of performance and stewardship in the management of the Fund.
| | Best regards, |
| | |
| |  |
| | |
| | Gregory B. Wood |
| | Chief Compliance Officer |
| | Concorde Investment Management |
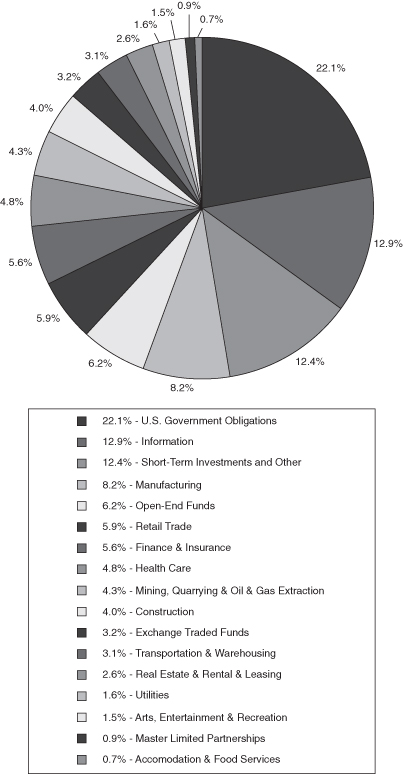
CONCORDE WEALTH MANAGEMENT FUND
PORTFOLIO HOLDINGS BY SECTOR
March 31, 2017 (Unaudited)
The portfolio’s holdings and allocations are subject to change. The percentages are of net assets as of March 31, 2017.
CONCORDE WEALTH MANAGEMENT FUND
SCHEDULE OF INVESTMENTS IN SECURITIES
March 31, 2017 (Unaudited)
| | | Shares or | | | Fair | | | Percent of | |
| | | Principal Amount | | | Value | | | Net Assets | |
| COMMON STOCKS - 39.60% | | | | | | | | | |
| ARTS, ENTERTAINMENT & RECREATION | | | | | | | | | |
| Speedway Motorsports, Inc. | | | 15,000 | | | $ | 282,600 | | | | 1.49 | % |
| | | | | | | | | | | | | |
| | | | | | | | | | | | | |
| FINANCE & INSURANCE | | | | | | | | | | | | |
| American International Group, Inc. | | | 5,000 | | | | 312,150 | | | | 1.64 | |
| Aon PLC (a) | | | 2,500 | | | | 296,725 | | | | 1.56 | |
| | | | | | | | 608,875 | | | | 3.20 | |
| | | | | | | | | | | | | |
| HEALTH CARE | | | | | | | | | | | | |
| HCA Holdings, Inc. (b) | | | 5,500 | | | | 489,445 | | | | 2.57 | |
| HealthSouth Corp. | | | 7,775 | | | | 332,848 | | | | 1.75 | |
| | | | | | | | 822,293 | | | | 4.32 | |
| | | | | | | | | | | | | |
| INFORMATION | | | | | | | | | | | | |
| Comcast Corp. - Class A | | | 9,800 | | | | 368,382 | | | | 1.94 | |
| Discovery Communications, Inc. (b) | | | 13,500 | | | | 382,185 | | | | 2.01 | |
| Level 3 Communications, Inc. (b) | | | 5,500 | | | | 314,710 | | | | 1.65 | |
| Microsoft Corp. | | | 8,000 | | | | 526,880 | | | | 2.77 | |
| Oracle Corp. | | | 5,000 | | | | 223,050 | | | | 1.17 | |
| The Walt Disney Co. | | | 2,700 | | | | 306,153 | | | | 1.61 | |
| Verizon Communications, Inc. | | | 3,500 | | | | 170,625 | | | | 0.90 | |
| | | | | | | | 2,291,985 | | | | 12.05 | |
| | | | | | | | | | | | | |
| MANUFACTURING | | | | | | | | | | | | |
| Allergan PLC (a) | | | 1,200 | | | | 286,704 | | | | 1.51 | |
| Anheuser Busch InBev NV - ADR (a) | | | 2,600 | | | | 285,376 | | | | 1.50 | |
| Fortune Brands Home & Security, Inc. | | | 4,700 | | | | 285,995 | | | | 1.50 | |
| Hexcel Corp. | | | 3,600 | | | | 196,380 | | | | 1.03 | |
| Johnson & Johnson | | | 1,500 | | | | 186,825 | | | | 0.98 | |
| The Hershey Co. | | | 1,090 | | | | 119,082 | | | | 0.63 | |
| | | | | | | | 1,360,362 | | | | 7.15 | |
| | | | | | | | | | | | | |
| MINING, QUARRYING & OIL & GAS EXTRACTION | | | | | | | | | | | | |
| Cimarex Energy Co. | | | 2,530 | | | | 302,310 | | | | 1.59 | |
| Halliburton Co. | | | 7,500 | | | | 369,075 | | | | 1.94 | |
| | | | | | | | 671,385 | | | | 3.53 | |
| | | | | | | | | | | | | |
| RETAIL TRADE | | | | | | | | | | | | |
| Amazon.com, Inc. (b) | | | 320 | | | | 283,693 | | | | 1.49 | |
| Hanesbrands, Inc. | | | 10,000 | | | | 207,600 | | | | 1.09 | |
| Lowe’s Companies, Inc. | | | 5,000 | | | | 411,050 | | | | 2.16 | |
| | | | | | | | 902,343 | | | | 4.74 | |
| | | | | | | | | | | | | |
The accompanying notes are an integral part of these financial statements.
CONCORDE WEALTH MANAGEMENT FUND
SCHEDULE OF INVESTMENTS IN SECURITIES (continued)
March 31, 2017 (Unaudited)
| | | Shares or | | | Fair | | | Percent of | |
| | | Principal Amount | | | Value | | | Net Assets | |
| COMMON STOCKS (continued) | | | | | | | | | |
| TRANSPORTATION & WAREHOUSING | | | | | | | | | |
| Union Pacific Corp. | | | 5,600 | | | $ | 593,152 | | | | 3.12 | % |
| TOTAL COMMON STOCKS (Cost $4,361,476) | | | | | | | 7,532,995 | | | | 39.60 | |
| | | | | | | | | | | | | |
| EXCHANGE TRADED FUNDS - 3.17% | | | | | | | | | | | | |
| Sprott Physical Gold Trust (a)(b) | | | 59,000 | | | | 602,980 | | | | 3.17 | |
| TOTAL EXCHANGE TRADED FUNDS (Cost $571,198) | | | | | | | 602,980 | | | | 3.17 | |
| | | | | | | | | | | | | |
| OPEN-END FUNDS - 6.17% | | | | | | | | | | | | |
| American Beacon SiM High Yield Opportunities Fund | | | 18,779 | | | | 181,778 | | | | 0.96 | |
| Deutsche CROCI International Fund - Class S | | | 6,069 | | | | 268,451 | | | | 1.41 | |
| Morgan Stanley Global Fixed Income Opportunities Fund | | | 65,259 | | | | 362,837 | | | | 1.91 | |
| PIMCO Mortgage Opportunities Fund (e) | | | 32,789 | | | | 359,365 | | | | 1.89 | |
| TOTAL OPEN-END FUNDS (Cost $1,150,000) | | | | | | | 1,172,431 | | | | 6.17 | |
| | | | | | | | | | | | | |
| REITS - 2.65% | | | | | | | | | | | | |
| REAL ESTATE & RENTAL & LEASING | | | | | | | | | | | | |
| Medical Properties Trust, Inc. | | | 19,000 | | | | 244,910 | | | | 1.29 | |
| Prologis, Inc. | | | 5,000 | | | | 259,400 | | | | 1.36 | |
| TOTAL REITS (Cost $433,576) | | | | | | | 504,310 | | | | 2.65 | |
| | | | | | | | | | | | | |
| ROYALTY TRUSTS - 3.97% | | | | | | | | | | | | |
| CONSTRUCTION | | | | | | | | | | | | |
| Texas Pacific Land Trust | | | 2,700 | | | | 755,325 | | | | 3.97 | |
| TOTAL ROYALTY TRUSTS (Cost $390,001) | | | | | | | 755,325 | | | | 3.97 | |
| | | | | | | | | | | | | |
| CONVERTIBLE PREFERRED STOCKS - 1.57% | | | | | | | | | | | | |
| UTILITIES | | | | | | | | | | | | |
| Kinder Morgan, Inc. | | | 6,000 | | | | 299,280 | | | | 1.57 | |
| TOTAL CONVERTIBLE PREFERRED STOCKS | | | | | | | | | | | | |
| (Cost $277,412) | | | | | | | 299,280 | | | | 1.57 | |
| | | | | | | | | | | | | |
| MASTER LIMITED PARTNERSHIPS - 0.91% | | | | | | | | | | | | |
| Oaktree Capital Group LLC | | | 3,800 | | | | 172,140 | | | | 0.91 | |
| TOTAL MASTER LIMITED PARTNERSHIPS | | | | | | | | | | | | |
| (Cost $175,121) | | | | | | | 172,140 | | | | 0.91 | |
The accompanying notes are an integral part of these financial statements.
CONCORDE WEALTH MANAGEMENT FUND
SCHEDULE OF INVESTMENTS IN SECURITIES (continued)
March 31, 2017 (Unaudited)
| | | Shares or | | | Fair | | | Percent of | |
| | | Principal Amount | | | Value | | | Net Assets | |
| CORPORATE BONDS - 7.48% | | | | | | | | | |
| ACCOMMODATION & FOOD SERVICES | | | | | | | | | |
| MGM Resorts International, 6.75%, 10/01/2020 | | | 125,000 | | | $ | 137,500 | | | | 0.72 | % |
| | | | | | | | | | | | | |
| FINANCE & INSURANCE | | | | | | | | | | | | |
| Discover Financial Services, 3.85%, 11/21/2022 | | | 150,000 | | | | 152,956 | | | | 0.80 | |
| Ford Motor Credit Co., LLC, 2.40%, 09/20/2021 | | | 150,000 | | | | 147,029 | | | | 0.77 | |
| Wells Fargo & Co., 3.45%, 02/13/2023 | | | 150,000 | | | | 151,369 | | | | 0.80 | |
| | | | | | | | 451,354 | | | | 2.37 | |
| HEALTH CARE | | | | | | | | | | | | |
| DaVita, Inc., 5.75%, 08/15/2022 | | | 100,000 | | | | 103,500 | | | | 0.54 | |
| | | | | | | | | | | | | |
| INFORMATION | | | | | | | | | | | | |
| Fiserv, Inc., 3.50%, 10/01/2022 | | | 150,000 | | | | 153,822 | | | | 0.81 | |
| | | | | | | | | | | | | |
| MANUFACTURING | | | | | | | | | | | | |
| NCR Corp., 4.63%, 02/15/2021 | | | 200,000 | | | | 204,522 | | | | 1.08 | |
| | | | | | | | | | | | | |
| MINING, QUARRYING, & OIL & GAS EXTRACTION | | | | | | | | | | | | |
| EnLink Midstream Partners LP, 2.70%, 04/01/2019 | | | 150,000 | | | | 150,345 | | | | 0.79 | |
| | | | | | | | | | | | | |
| RETAIL TRADE | | | | | | | | | | | | |
| Hanesbrands, Inc., 4.63%, 05/15/2024 (d) | | | 225,000 | | | | 221,906 | | | | 1.17 | |
| TOTAL CORPORATE BONDS (Cost $1,434,514) | | | | | | | 1,422,949 | | | | 7.48 | |
| | | | | | | | | | | | | |
| U.S. GOVERNMENT OBLIGATIONS - 22.08% | | | | | | | | | | | | |
| Federal Farm Credit Banks, 2.32%, 12/29/2021 | | | 150,000 | | | | 150,046 | | | | 0.79 | |
| Federal Home Loan Banks, 1.03%, 05/28/2019 | | | 150,000 | | | | 148,422 | | | | 0.78 | |
| Federal National Mortgage Association, 1.55%, 09/30/2021 | | | 200,000 | | | | 192,976 | | | | 1.01 | |
| United States Treasury Note | | | | | | | | | | | | |
| 1.375%, Note due 01/31/2021 | | | 1,400,000 | | | | 1,380,368 | | | | 7.25 | |
| 1.625%, Note due 02/15/2026 | | | 400,000 | | | | 376,078 | | | | 1.98 | |
| 2.750%, Note due 02/15/2019 | | | 1,900,000 | | | | 1,953,215 | | | | 10.27 | |
| TOTAL U.S. GOVERNMENT NOTES (Cost $4,290,030) | | | | | | | 4,201,105 | | | | 22.08 | |
The accompanying notes are an integral part of these financial statements.
CONCORDE WEALTH MANAGEMENT FUND
SCHEDULE OF INVESTMENTS IN SECURITIES (continued)
March 31, 2017 (Unaudited)
| | | Shares or | | | Fair | | | Percent of | |
| | | Principal Amount | | | Value | | | Net Assets | |
| SHORT-TERM INVESTMENTS - 11.73% | | | | | | | | | |
| Fidelity Institutional Money Market Funds - | | | | | | | | | |
| Government Portfolio, 0.56% (c) | | | 353,465 | | | $ | 353,465 | | | | 1.86 | % |
| Morgan Stanley Institutional Liquidity Funds - | | | | | | | | | | | | |
| Government Portfolio, 0.60% (c) | | | 941,148 | | | | 941,148 | | | | 4.95 | |
| The Government & Agency Portfolio - | | | | | | | | | | | | |
| Institutional Class, 0.61% (c) | | | 936,000 | | | | 936,000 | | | | 4.92 | |
| TOTAL SHORT-TERM INVESTMENTS (Cost $2,230,613) | | | | | | | 2,230,613 | | | | 11.73 | |
| | | | | | | | | | | | | |
| Total Investments (Cost $15,313,941) - 99.33% | | | | | | | 18,894,128 | | | | 99.33 | |
| Other Assets in Excess of Liabilities - 0.67% | | | | | | | 127,713 | | | | 0.67 | |
| TOTAL NET ASSETS - 100.00% | | | | | | $ | 19,021,841 | | | | 100.00 | % |
| ADR | American Depositary Receipt |
| PLC | Public Limited Company |
| REIT | Real Estate Investment Trust |
| (a) | Foreign issued security listed directly on a U.S. securities exchange. |
| (b) | Presently non-income producing. |
| (c) | Rate shown is the 7-day yield as of March 31, 2017. |
| (d) | Restricted security as defined in Rule 144(a) under the Securities Act of 1933. At March 31, 2017, the market value of these securities totaled $221,906 which represents 1.17% of total net assets. |
| (e) | Securities for which market quotations are not readily available are valued at fair value determined by the Adviser. Such values are approved on a quarterly basis by the Board of Trustees. The total fair value of such long securities at March 31, 2017 was $359,365 which represents 1.89% of net assets. |
The accompanying notes are an integral part of these financial statements.
CONCORDE WEALTH MANAGEMENT FUND
STATEMENT OF ASSETS AND LIABILITIES
March 31, 2017 (Unaudited)
| ASSETS | | | |
| Investments in securities, at fair value (cost $15,313,941) | | $ | 18,894,128 | |
| Dividends & interest receivable | | | 39,292 | |
| Receivable for capital shares sold | | | 125,000 | |
| Prepaid expense | | | 3,502 | |
| Other assets | | | 3,346 | |
| TOTAL ASSETS | | | 19,065,268 | |
| LIABILITIES | | | | |
| Investment advisory fee payable | | | 12,681 | |
| Accrued expenses | | | 30,621 | |
| Accrued director’s fees | | | 125 | |
| TOTAL LIABILITIES | | | 43,427 | |
| NET ASSETS | | $ | 19,021,841 | |
| | | | | |
| Composition of Net Assets: | | | | |
| Net capital paid in on shares of capital stock | | $ | 15,189,474 | |
| Accumulated net investment loss | | | (79,627 | ) |
| Accumulated net realized gain | | | 331,807 | |
| Net unrealized appreciation on: | | | | |
| Investments | | | 3,580,187 | |
| NET ASSETS | | $ | 19,021,841 | |
| Capital shares outstanding | | | 1,291,555 | |
| Net asset value, offering price and redemption price per share | | $ | 14.73 | |
The accompanying notes are an integral part of these financial statements.
CONCORDE WEALTH MANAGEMENT FUND
STATEMENT OF OPERATIONS
For the Six Month Period Ended March 31, 2017 (Unaudited)
| Investment Income | | | |
| Dividends (net of foreign withholding taxes and issuance fees of $924) | | $ | 104,604 | |
| Interest | | | 43,235 | |
| Total investment income | | | 147,839 | |
| | | | | |
| Expenses | | | | |
| Investment advisory fees (Note 7) | | | 72,121 | |
| Administration fees (Note 8) | | | 20,110 | |
| Professional fees | | | 16,221 | |
| Sub-transfer agent expenses (Note 8) | | | 12,936 | |
| Fund accounting fees (Note 8) | | | 12,591 | |
| Transfer agent fees (Note 8) | | | 8,082 | |
| Other expenses | | | 6,432 | |
| Printing, postage and delivery | | | 5,668 | |
| Federal and state registration fees | | | 2,805 | |
| Insurance expense | | | 2,690 | |
| Custody fees (Note 8) | | | 1,559 | |
| Directors fees | | | 1,521 | |
| Total expenses | | | 162,736 | |
| NET INVESTMENT LOSS | | | (14,897 | ) |
| REALIZED AND UNREALIZED GAIN FROM INVESTMENTS | | | | |
| Net realized gain from: | | | | |
| Investments | | | 363,119 | |
| Options written | | | 1,261 | |
| Net change in unrealized appreciation on: | | | | |
| Investments | | | 220,754 | |
| NET REALIZED AND UNREALIZED GAIN FROM INVESTMENTS | | | 585,134 | |
| NET INCREASE IN NET ASSETS RESULTING FROM OPERATIONS | | $ | 570,237 | |
| | | | | |
The accompanying notes are an integral part of these financial statements.
CONCORDE WEALTH MANAGEMENT FUND
STATEMENTS OF CHANGES IN NET ASSETS
| | | Six Months Ended | | | | |
| | | March 31, 2017 | | | Year Ended | |
| | | (Unaudited) | | | Sep. 30, 2016(1) | |
| INCREASE (DECREASE) IN NET ASSETS FROM OPERATIONS | | | | | | |
| Net investment loss | | $ | (14,897 | ) | | $ | (43,596 | ) |
| Net realized gain from: | | | | | | | | |
| Investments | | | 363,119 | | | | 3,438 | |
| Options written | | | 1,261 | | | | 26,894 | |
| Capital gain distribution from investment company | | | — | | | | 8,561 | |
| Net change in unrealized appreciation on: | | | | | | | | |
| Investments | | | 220,754 | | | | 983,758 | |
| Net increase in net assets resulting from operations | | | 570,237 | | | | 979,055 | |
| DISTRIBUTIONS TO SHAREHOLDERS FROM | | | | | | | | |
| Net realized gains on investments | | | (32,573 | ) | | | (553,913 | ) |
| Total distributions to shareholders | | | (32,573 | ) | | | (553,913 | ) |
| CAPITAL SHARE TRANSACTIONS-NET (Note 4) | | | 502,591 | | | | 8,418,536 | |
| Total increase in net assets | | | 1,040,255 | | | | 8,843,678 | |
| NET ASSETS | | | | | | | | |
| Beginning of period | | | 17,981,586 | | | | 9,137,908 | |
| End of period (including undistributed net investment | | | | | | | | |
| loss of $(79,627) and $(64,730), respectively) | | $ | 19,021,841 | | | $ | 17,981,586 | |
| (1) | For periods prior to July 23, 2016, financial and other information shown herein for the Fund is that of the Concorde Value Fund, the “Predecessor Fund” (See Note 1 in the accompanying notes to these financial statements). |
The accompanying notes are an integral part of these financial statements.
CONCORDE WEALTH MANAGEMENT FUND
FINANCIAL HIGHLIGHTS
| | | Six Months | | | | | | | | | | | | | | | | |
| | | Ended | | | | | | | | | | | | | | | | |
| | | March 31, | | | | |
| | | 2017(1) | | | Year Ended September 30, |
| | | (Unaudited) | | | 2016(2) | | | 2015(2) | | | 2014(2) | | | 2013(2) | | | 2012(2) | |
| PER SHARE OPERATING | | | | | | | | | | | | | | | | | | |
| PERFORMANCE: | | | | | | | | | | | | | | | | | | |
| Net asset value, beginning of period | | $ | 14.29 | | | $ | 13.79 | | | $ | 16.50 | | | $ | 14.22 | | | $ | 12.34 | | | $ | 9.97 | |
| Income (loss) from investment operations: | | | | | | | | | | | | | | | | | | | | | | | | |
Net investment income (loss)(3) | | | (0.01 | ) | | | (0.06 | ) | | | (0.07 | ) | | | (0.02 | ) | | | 0.03 | | | | 0.02 | |
| Net realized and unrealized gain (loss) | | | | | | | | | | | | | | | | | | | | | | | | |
| on investment transactions | | | 0.48 | | | | 1.40 | | | | (1.29 | ) | | | 2.33 | | | | 1.87 | | | | 2.35 | |
| Total from investment operations | | | 0.47 | | | | 1.34 | | | | (1.36 | ) | | | 2.31 | | | | 1.90 | | | | 2.37 | |
| Less distributions: | | | | | | | | | | | | | | | | | | | | | | | | |
| From net investment income | | | — | | | | — | | | | — | | | | (0.03 | ) | | | (0.02 | ) | | | — | |
| From net realized gains | | | (0.03 | ) | | | (0.84 | ) | | | (1.35 | ) | | | — | | | | — | | | | — | |
| Total distributions | | | (0.03 | ) | | | (0.84 | ) | | | (1.35 | ) | | | (0.03 | ) | | | (0.02 | ) | | | — | |
| Net asset value, end of period | | $ | 14.73 | | | $ | 14.29 | | | $ | 13.79 | | | $ | 16.50 | | | $ | 14.22 | | | $ | 12.34 | |
| TOTAL RETURN | | | 3.27 | % | | | 10.12 | % | | | (8.90 | )% | | | 16.29 | % | | | 15.46 | % | | | 23.77 | % |
| RATIOS/SUPPLEMENTAL DATA: | | | | | | | | | | | | | | | | | | | | | | | | |
| Net assets, end of period (in thousands) | | $ | 19,022 | | | $ | 17,982 | | | $ | 9,138 | | | $ | 11,882 | | | $ | 11,279 | | | $ | 11,027 | |
| Ratio of expenses to average net assets | | | 1.81 | % | | | 2.48 | % | | | 2.28 | % | | | 2.06 | % | | | 2.09 | % | | | 2.12 | % |
| Ratio of net investment income (loss) | | | | | | | | | | | | | | | | | | | | | | | | |
| to average net assets | | | (0.17 | )% | | | (0.44 | )% | | | (0.40 | )% | | | (0.16 | )% | | | 0.24 | % | | | 0.19 | % |
| Portfolio turnover rate | | | 10 | % | | | 28 | % | | | 57 | % | | | 32 | % | | | 34 | % | | | 19 | % |
______________
| (1) | Other than the ratios of expenses and net investment income (loss) to average net assets, financial highlights have not been annualized. |
| (2) | For periods prior to July 23, 2016, financial and other information shown herein for the Fund is that of the Concorde Value Fund, the “Predecessor Fund” (See Note 1 in the accompanying notes to these financial statements). |
| (3) | Based on average shares outstanding during the period. |
The accompanying notes are an integral part of these financial highlights.
CONCORDE WEALTH MANAGEMENT FUND
NOTES TO FINANCIAL STATEMENTS
| Note 1 – Nature of Business and Reorganization and Summary of Significant Accounting Policies |
NATURE OF BUSINESS AND REORGANIZATION
Concorde Wealth Management Fund (the “Fund”), is a non-diversified separate series of shares of common stock of Concorde Funds, Inc. (the “Company”). Each series is organized as a class of common stock under the Company’s articles of incorporation. The Company was incorporated in the state of Texas in September of 1987, and is registered under the Investment Company Act of 1940, as amended, as an open-end management investment company. Each capital share in the Fund represents an equal, proportionate interest in the net assets of the Fund with each other capital share in such series and no interest in any other series. The Company may establish multiple series, each of which would be organized as a class of common stock under the Company’s articles of incorporation. The Company presently has no series other than the Fund.
The primary investment objective of the Fund is to seek total return, from both appreciation of value and generation of current income, within the context of preservation of capital. The Fund is subject to various investment restrictions as set forth in the Statement of Additional Information.
On July 22, 2016 the shareholders of the Concorde Value Fund, a diversified separate former series of the Company, (the “Predecessor Fund”) approved a Plan of Acquisition and Liquidation (the “Reorganization”) between the Fund and the Predecessor Fund. Pursuant to the Reorganization, the Fund acquired all of the assets and liabilities of the Predecessor Fund in exchange for shares of the Fund after the close of business on July 22, 2016. The Fund issued 681,656 shares in exchange for the net assets of the Predecessor Fund valued at $9,666,396. The Fund had no assets, liabilities, shares issued or operations prior to the Reorganization. As a result of the Reorganization, the Predecessor Fund ceased to operate and its shareholders became shareholders of the Fund. The primary investment objective of the Predecessor Fund was to produce long-term growth of capital. As a result of the Reorganization, the Fund is the accounting successor of the Predecessor Fund. For periods prior to July 23, 2016, financial and other information shown herein for the Fund is that of the Predecessor Fund.
SIGNIFICANT ACCOUNTING POLICIES
The following is a summary of significant accounting policies followed by the Fund in the preparation of its financial statements. These policies are in conformity with accounting principles generally accepted in the United States. The Fund follows the investment company accounting and reporting guidance of the Financial Accounting Standard Board Accounting Standard Codification 946, Financial Services – Investment Companies.
VALUATION OF SECURITIES
All investments in securities are recorded at their estimated fair value, as described in Note 2.
CONCORDE WEALTH MANAGEMENT FUND
NOTES TO FINANCIAL STATEMENTS
| Note 1 – Nature of Business and Reorganization and Summary of Significant Accounting Policies (continued) |
FEDERAL INCOME TAXES
The Company’s policy is to continue to comply with the requirements of the Internal Revenue Code that are applicable to regulated investment companies and to distribute all its taxable income to its shareholders. The Company also intends to distribute sufficient net investment income and net capital gains, if any, so that it will not be subject to excise tax on undistributed income and gains. Therefore, no federal income tax or excise provision is required.
Management has reviewed all open tax years and major tax jurisdictions and concluded that no liability for unrecognized tax benefits should be recorded related to uncertain tax positions taken on returns filed or expected to be taken on a tax return. The tax returns of the Fund for the prior three years are open for examination.
SECURITY TRANSACTIONS AND RELATED INCOME
Security transactions are accounted for on the trade date, the day securities are purchased or sold. Realized gains and losses from securities transactions are reported on an identified cost basis. Dividend income is recognized on the ex-dividend date, and interest income is recognized on an accrual basis. Discounts and premiums on securities purchased are amortized over the lives of the respective securities.
DIVIDENDS AND DISTRIBUTIONS
Distributions to shareholders are determined in accordance with income tax regulations and recorded on the ex-dividend date. The Fund intends to distribute all of its net investment income, if any, as dividends to its shareholders on an annual basis. The Fund intends to distribute all of its capital gains, if any, on an annual basis. Distributions from net investment income and capital gains, if any, are generally declared and paid in December. The treatment for financial reporting purposes of distributions made to shareholders during the year from net investment income or capital gains may differ from their ultimate treatment for federal income tax purposes. These differences are caused primarily by differences in the timing of the recognition of certain components of income, expense or realized capital gain for federal income tax purposes. Where such differences are permanent in nature, they are reclassified in the components of net assets based on their ultimate characterization for federal income tax purposes. Any such reclassifications will have no effect on net assets, results of operations or net asset value per share.
USE OF ESTIMATES
The preparation of financial statements in conformity with U.S. generally accepted accounting principles (GAAP) requires management to make estimates and assumptions that affect the reported amounts of assets and liabilities and disclosure of contingent assets and liabilities at the date of the financial statements and the reported amounts of increases and decreases in net assets from operations during the reporting period. Actual results could differ from those estimates.
CONCORDE WEALTH MANAGEMENT FUND
NOTES TO FINANCIAL STATEMENTS
| Note 1 – Nature of Business and Reorganization and Summary of Significant Accounting Policies (continued) |
OPTION WRITING
To generate additional income or hedge against a possible loss in the value of securities it holds, the Fund may write covered call options. When the Fund writes an option, an amount equal to the premium received by the Fund is recorded as a liability and subsequently adjusted to the current fair value of the option written. Premiums received from writing options that expire unexercised are treated by the Fund on the expiration date as realized gains from investments. The difference between the premium and amount paid on effecting a closing purchase transaction, including brokerage commissions, is also treated as a realized gain or, if the premium is less than the amount paid for the closing purchase transaction, as a realized loss. If a call option is exercised, the premium is added to the proceeds from the sale of the underlying security in determining whether the Fund has realized a gain or loss. The Fund as writer of an option bears the market risk of an unfavorable change in the price of the security underlying the written option.
The objective, as stated above, is to hedge against a possible decline in the value of securities and to generate additional income when we feel certain securities are locked in a trading range. With regards to hedging against a possible decline, we will sell covered calls with strike prices below the price of a security at the time of writing the call. Regarding additional income, the Fund will sell calls on certain securities that are within a trading range.
NEW ACCOUNTING PRONOUNCEMENTS
In October 2016, the U.S. Securities and Exchange Commission adopted new rules and amended existing rules (together, “final rules”) intended to modernize the reporting and disclosure of information by registered investment companies. In part, the final rules amend Regulation S-X and require standardized, enhanced disclosure about derivatives in investment company financial statements, as well as other amendments. The compliance date for the amendments to Regulation S-X is August 1, 2017. Management has reviewed the requirements and believes the adoption of the final rules will not have a material impact on the Fund’s financial statements and related disclosures.
| Note 2 – Securities Valuation |
The Company’s Board of Directors (the “Board”) has adopted methods for valuing securities and other derivative instruments including in circumstances in which market quotes are not readily available, and has delegated authority to the Company’s investment advisor, Concorde Financial Corporation d/b/a Concorde Investment Management (“Concorde”) to apply those methods in making fair value determinations. All fair value determinations made by Concorde are subject to oversight by the Board.
The Fund utilizes various methods to measure the fair value of its investments on a recurring basis. GAAP establishes a hierarchy that prioritizes inputs to valuation techniques used to measure fair value. The three levels of inputs are as follows:
CONCORDE WEALTH MANAGEMENT FUND
NOTES TO FINANCIAL STATEMENTS
| Note 2 – Securities Valuation (continued) |
| | Level 1 – | Quoted unadjusted prices in active markets for identical assets or liabilities that the Fund has the ability to access at the date of measurement. |
| | | |
| | Level 2 – | Quoted prices for similar instruments in active markets; quoted prices for identical or similar instruments in markets that are not active; and model-derived valuations in which all significant inputs and significant value drivers are observable in active markets. Level 2 inputs are those in markets for which there are few transactions, the prices are not current, little public information exists or instances where prices vary substantially over time or among brokered market makers. |
| | | |
| | Level 3 – | Model derived valuations in which one or more significant inputs or significant value drivers are unobservable. Unobservable inputs are those inputs that reflect the Fund’s own assumptions that market participants would use in valuing the asset or liability based on the best available information. |
The availability of observable inputs can vary from security to security and is affected by a wide variety of factors, including, for example, the type of security, whether the security is new and not yet established in the marketplace, the liquidity of markets, and other characteristics particular to the security. To the extent that valuation is based on models or inputs that are less observable or unobservable in the market, the determination of fair value requires more judgment. Accordingly, the degree of judgment exercised in determining fair value is greatest for instruments categorized in Level 3.
The inputs used to measure fair value may fall into different levels of the fair value hierarchy. In such cases, for disclosure purposes, the level in the fair value hierarchy within which the fair value measurement falls in its entirety is determined based on the lowest level input that is significant to the fair value measurement in its entirety.
Following is a description of the valuation techniques applied to the Fund’s major categories of assets and liabilities measured at fair value on a recurring basis.
Equity Securities – Equity securities, usually common stocks, foreign issued common stocks, exchange traded funds (“ETFs”), real estate investment trusts, royalty trusts, and preferred stocks traded on a national securities exchange are valued at the last sale price on the exchange on which such securities are traded, as of the close of business on the day the securities are being valued or, lacking any reported sales, at the mean between the last available bid and asked price. To the extent these securities are actively traded and valuation adjustments are not applied, they are categorized in Level 1 of the fair value hierarchy.
Mutual Funds – Mutual funds are generally priced at the ending net asset value provided by the service agent of the Funds and are categorized in Level 1 of the fair value hierarchy.
CONCORDE WEALTH MANAGEMENT FUND
NOTES TO FINANCIAL STATEMENTS
| Note 2 – Securities Valuation (continued) |
Debt Securities – Bonds, notes, and U.S. government obligations are valued at an evaluated bid price obtained from an independent pricing service that uses a matrix pricing method or other analytical models. Demand notes are stated at amortized cost, which approximates fair value. These securities will generally be categorized in Level 2 of the fair value hierarchy.
Short-Term Securities – Short-term equity investments, including money market funds, are valued in the manner specified above for equity securities. Fixed income securities with maturities of less than 60 days when acquired, or which subsequently are within 60 days of maturity, are valued by an independent pricing service that uses a matrix pricing method or other analytical models. Short-term securities are generally classified in Level 1 or Level 2 of the fair value hierarchy depending on the inputs used and market activity levels for specific securities.
Derivative Instruments – Listed derivatives, including options, rights, and warrants that are actively traded are valued based on quoted prices from the exchange. If there is no such reported sale on the valuation date, the mean between the highest bid and lowest asked quotations at the close of the exchanges will be used. These securities will generally be categorized in Level 1 of the fair value hierarchy.
All other assets of the Fund are valued in such manner as the Board in good faith deems appropriate to reflect their fair value.
Securities for which market quotations are not readily available or if the closing price does not represent fair value, are valued at fair value as determined in good faith following procedures approved by the Board. Factors used in determining fair value vary by investment type and may include: trading volume of security and markets, value of other like securities and news events with direct bearing to security or market. Depending on the relative significance of the valuation inputs, these securities may be categorized in either Level 2 or Level 3 of the fair value hierarchy.
CONCORDE WEALTH MANAGEMENT FUND
NOTES TO FINANCIAL STATEMENTS
| Note 2 – Securities Valuation (continued) |
The following table summarizes the inputs used to value the Fund’s investments measured at fair value as of March 31, 2017:
| | Categories | | Level 1 | | | Level 2 | | | Level 3 | | | Fair Value | |
| | Common Stocks | | | | | | | | | | | | |
| | Arts, Entertainment & Recreation | | $ | 282,600 | | | $ | — | | | $ | — | | | $ | 282,600 | |
| | Finance & Insurance | | | 608,875 | | | | — | | | | — | | | | 608,875 | |
| | Health Care | | | 822,293 | | | | — | | | | — | | | | 822,293 | |
| | Information | | | 2,291,985 | | | | — | | | | — | | | | 2,291,985 | |
| | Manufacturing | | | 1,360,362 | | | | — | | | | — | | | | 1,360,362 | |
| | Mining, Quarrying & Oil & Gas Extraction | | | 671,385 | | | | — | | | | — | | | | 671,385 | |
| | Retail Trade | | | 902,343 | | | | — | | | | — | | | | 902,343 | |
| | Transportation & Warehousing | | | 593,152 | | | | — | | | | — | | | | 593,152 | |
| | Total Common Stocks | | | 7,532,995 | | | | — | | | | — | | | | 7,532,995 | |
| | Exchange Traded Funds | | | 602,980 | | | | — | | | | — | | | | 602,980 | |
| | Open-End Funds | | | 813,066 | | | | 359,365 | | | | — | | | | 1,172,431 | |
| | REITS | | | | | | | | | | | | | | | | |
| | Real Estate & Rental & Leasing | | | 504,310 | | | | — | | | | — | | | | 504,310 | |
| | Royalty Trusts | | | | | | | | | | | | | | | | |
| | Construction | | | 755,325 | | | | — | | | | — | | | | 755,325 | |
| | Convertible Preferred Stocks | | | | | | | | | | | | | | | | |
| | Utilities | | | 299,280 | | | | — | | | | — | | | | 299,280 | |
| | Master Limited Partnerships | | | 172,140 | | | | — | | | | — | | | | 172,140 | |
| | Corporate Bonds | | | | | | | | | | | | | | | | |
| | Accommodation & Food Services | | | — | | | | 137,500 | | | | — | | | | 137,500 | |
| | Finance & Insurance | | | — | | | | 451,354 | | | | — | | | | 451,354 | |
| | Health Care | | | — | | | | 103,500 | | | | — | | | | 103,500 | |
| | Information | | | — | | | | 153,822 | | | | — | | | | 153,822 | |
| | Manufacturing | | | — | | | | 204,522 | | | | — | | | | 204,522 | |
| | Mining, Quarrying & Oil & Gas Extraction | | | — | | | | 150,345 | | | | — | | | | 150,345 | |
| | Retail Trade | | | — | | | | 221,906 | | | | — | | | | 221,906 | |
| | Total Corporate Bonds | | | — | | | | 1,422,949 | | | | — | | | | 1,422,949 | |
| | U.S. Government Obligations | | | — | | | | 4,201,105 | | | | — | | | | 4,201,105 | |
| | Short-Term Investments | | | 2,230,613 | | | | — | | | | — | | | | 2,230,613 | |
| | Total Investments | | $ | 12,910,709 | | | $ | 5,983,419 | | | $ | — | | | $ | 18,894,128 | |
Transfers between levels are recognized at the end of the reporting period. There were no transfers between levels.
CONCORDE WEALTH MANAGEMENT FUND
NOTES TO FINANCIAL STATEMENTS
| Note 3 – Derivative Instruments |
The following contains information about the Fund’s use of derivative instruments and how derivative instruments affect the Fund’s financial position and operations.
Transactions in option contracts written during the six months ended March 31, 2017 were as follows:
| | | | Number of | | | Premiums | |
| | | | Contracts | | | Received | |
| | Options outstanding at September 30, 2016 | | | 0 | | | $ | 0 | |
| | Options written | | | 145 | | | | 119,746 | |
| | Options terminated in | | | | | | | | |
| | closing purchase transactions | | | (145 | ) | | | (119,746 | ) |
| | Options expired | | | 0 | | | | 0 | |
| | Options exercised | | | 0 | | | | 0 | |
| | Options outstanding at March 31, 2017 | | | 0 | | | $ | 0 | |
The average monthly fair values of options written during the six months ended March 31, 2017 for the Fund was $9,979.
The Fund did not hold any derivatives as of March 31, 2017.
The effect of derivative instruments on the Statement of Operations for the six months ended March 31, 2017 was as follows:
| | Amount of Realized Gain |
| | (Loss) on Derivatives |
| Derivatives not accounted for as hedging instruments | Options Written | Total |
| Equity Contracts | $1,261 | $1,261 |
| | |
| | Change in Unrealized Appreciation |
| | (Depreciation) on Derivatives |
| Derivatives not accounted for as hedging instruments | Options Written | Total |
| Equity Contracts | $— | $— |
| Note 4 – Capital Share Transactions |
As of March 31, 2017, 30,000,000 shares of $1 par value capital stock were authorized, of which 10,000,000 shares are classified as the Fund’s series. As of March 31, 2017, capital paid-in aggregated $15,189,474.
CONCORDE WEALTH MANAGEMENT FUND
NOTES TO FINANCIAL STATEMENTS
| Note 4 – Capital Share Transactions (continued) |
Transactions in shares of capital stock for the six months ended March 31, 2017 and year ended September 30, 2016 were as follows:
| | | Six Months Ended | | | | | | | |
| | | March 31, 2017 | | | Year Ended | |
| | | (Unaudited) | | | September 30, 2016 | |
| | | Shares | | | Amount | | | Shares | | | Amount | |
| Shares sold | | | 78,394 | | | $ | 1,145,629 | | | | 593,107 | | | $ | 8,405,931 | |
| Shares issued in | | | | | | | | | | | | | | | | |
| reinvestment of distributions | | | 2,248 | | | | 32,573 | | | | 41,275 | | | | 553,913 | |
| | | | 80,642 | | | | 1,178,202 | | | | 634,382 | | | | 8,959,844 | |
| Shares redeemed | | | (47,088 | ) | | | (675,611 | ) | | | (39,225 | ) | | | (541,308 | ) |
| Net increase (decrease) | | | 33,554 | | | $ | 502,591 | | | | 595,157 | | | $ | 8,418,536 | |
| Note 5 – Investment Transactions |
Purchases and sales of investment securities, excluding U.S. government obligations and short-term investments, for the Fund during the six month period ended March 31 ,2017, were $3,355,546 and $1,592,185, respectively.
Purchases and sales/maturities of long-term U.S. government obligations for the Fund during the period ended March 31, 2017 were $150,000 and $0, respectively.
The Fund in the normal course of business makes investments in financial instruments and derivatives where the risk of potential loss exists due to changes in the market (market risk), or failure or inability of the counterparty to a transaction to perform (credit and counterparty risk). See below for a detailed description of select principal risks.
American Depositary Receipts (“ADRs”) and Global Depository Receipts (“GDRs”) Risk. ADRs and GDRs may be subject to some of the same risks as direct investment in foreign companies, which includes international trade, currency, political, regulatory and diplomatic risks. In a sponsored ADR arrangement, the foreign issuer assumes the obligation to pay some or all of the depositary’s transaction fees. Under an unsponsored ADR arrangement, the foreign issuer assumes no obligations and the depositary’s transaction fees are paid directly by the ADR holders. Because unsponsored ADR arrangements are organized independently and without the cooperation of the issuer of the underlying securities, available information concerning the foreign issuer may not be as current as for sponsored ADRs and voting rights with respect to the deposited securities are not passed through. GDRs can involve currency risk since, unlike ADRs, they may not be U.S. dollar-denominated.
CONCORDE WEALTH MANAGEMENT FUND
NOTES TO FINANCIAL STATEMENTS
| Note 6 – Principal Risks (continued) |
Convertible Securities Risk. A convertible security is a fixed-income security (a debt instrument or a preferred stock) which may be converted at a stated price within a specified period of time into a certain quantity of the common stock of the same or a different issuer. Convertible securities are senior to common stock in an issuer’s capital structure, but are subordinated to any senior debt securities. While providing a fixed-income stream (generally higher in yield than the income derivable from common stock but lower than that afforded by a similar non-convertible security), a convertible security also gives an investor the opportunity, through its conversion feature, to participate in the capital appreciation of the issuing company depending upon a market price advance in the convertible security’s underlying common stock.
Debt/Fixed Income Securities Risk. An increase in interest rates typically causes a fall in the value of the debt securities in which the Fund may invest. The value of the Fund may change in response to changes in the credit ratings of the Fund’s portfolio of debt securities. Interest rates in the United States are at, or near, historic lows, which may increase the Fund’s exposure to risks associated with rising interest rates. Moreover, rising interest rates or lack of market participants may lead to decreased liquidity in the bond and loan markets, making it more difficult for the Fund to sell its holdings at a time when the Fund’s manager might wish to sell. Lower rated securities (“junk bonds”) are generally subject to greater risk of loss than higher rated securities. Debt securities are also subject to prepayment risk when interest rates decrease. Prepayment risk is the risk that the borrower will prepay some or all of the principal owed to the issuer. If prepayment occurs, the Fund may have to replace the security by investing the proceeds in a less attractive security.
Emerging Markets Risk. The Fund may invest in emerging markets, which may carry more risk than investing in developed foreign markets. Risks associated with investing in emerging markets include limited information about companies in these countries, greater political and economic uncertainties compared to developed foreign markets, underdeveloped securities markets and legal systems, potentially high inflation rates, and the influence of foreign governments over the private sector.
Equity and General Market Risk. Equities, such as common stocks, or other equity related investments are susceptible to general stock market fluctuations and to volatile increases and decreases in value. The stock market may experience declines or stocks in the Fund’s portfolio may not meet the financial expectations of the Fund or other market participants. The Fund’s net asset value and investment return will fluctuate based upon changes in the value of its portfolio securities.
ETF Risk. ETFs may trade at a discount to the aggregate value of the underlying securities and although expense ratios for ETFs are generally low, frequent trading of ETFs by the Fund can generate brokerage expenses. Shareholders of the Fund will indirectly be subject to the fees and expenses of the individual ETFs in which the Fund invests, in addition to the Fund’s own fees and expenses.
Foreign Securities Risk. The Fund may invest in foreign securities and is subject to risks associated with foreign markets, such as adverse political, currency, social and economic developments, accounting
CONCORDE WEALTH MANAGEMENT FUND
NOTES TO FINANCIAL STATEMENTS
| Note 6 – Principal Risks (continued) |
standards or governmental supervision that is not consistent with that to which U.S. companies are subject, limited information about foreign companies, less liquidity in foreign markets and less protection.
High Yield Risk. The Fund’s investment program permits it to invest in non-investment grade debt obligations, sometimes referred to as “junk bonds” (hereinafter referred to as “lower-quality securities”). Lower-quality securities are those securities that are rated lower than investment grade and unrated securities believed by Concorde to be of comparable quality. Although these securities generally offer higher yields than investment grade securities with similar maturities, lower-quality securities involve greater risks, including the possibility of default or bankruptcy. In general, they are regarded to be more speculative with respect to the issuer’s capacity to pay interest and repay principal.
Investments in Other Investment Companies Risk. Shareholders of the Fund will indirectly be subject to the fees and expenses of the other investment companies in which the Fund invests and these fees and expenses are in addition to the fees and expenses that Fund shareholders directly bear in connection with the Fund’s own operations. In addition, shareholders will be exposed to the investment risks associated with investments in the other investment companies.
Liquidity Risk. Certain securities held by the Fund may be difficult (or impossible) to sell at the time and at the price the Fund would like. As a result, the Fund may have to hold these securities longer than it would like and may forego other investment opportunities. There is the possibility that the Fund may lose money or be prevented from realizing capital gains if it cannot sell a security at a particular time and price.
Master Limited Partnership (“MLP”) Risk. Securities of master limited partnerships are listed and traded on U.S. securities exchanges. The value of an MLP fluctuates based predominately on its financial performance, as well as changes in overall market conditions. Investments in MLPs involve risks that differ from investments in common stocks, including risks related to the fact that investors have limited control of and limited rights to vote on matters affecting the MLP; risks related to potential conflicts of interest between the MLP and the MLP’s general partner; cash flow risks; dilution risks; and risks related to the general partner’s right to require investors to sell their holdings at an undesirable time or price. In addition, MLPs may be subject to state taxation in certain jurisdictions, which may reduce the amount of income an MLP pays to its investors. The securities of certain MLPs may trade in lower volumes due to their smaller capitalizations, and may be subject to more abrupt or erratic price movements and lower market liquidity. MLPs are generally considered interest-rate sensitive investments. During periods of interest rate volatility, these investments may not provide attractive returns. In addition, if the tax treatment of an MLP changes, the Fund’s after-tax return from its MLP investment would be materially reduced.
Non-Diversification Risk. Because the Fund is non-diversified (meaning that compared to diversified mutual funds, the Fund may invest a greater percentage of its assets in a particular issuer), the Fund’s shares may be more susceptible to adverse changes in the value of a particular security
CONCORDE WEALTH MANAGEMENT FUND
NOTES TO FINANCIAL STATEMENTS
| Note 6 – Principal Risks (continued) |
than would be the shares of a diversified mutual fund. Thus, the Fund is more sensitive to economic, business and political changes which may result in greater price fluctuations of the Fund’s shares.
Private Equity Risk. The sale or transfer of private equity investments may be limited or prohibited by contract or law. Private equity securities are generally valued in good faith following procedures approved by the Board as they are not traded frequently. The Fund may be required to hold such positions for several years, if not longer, regardless of valuation, which may cause the Fund to be less liquid.
Private Placement Risk. The Fund may invest in privately issued securities of domestic common and preferred stock, convertible debt securities, ADRs and REITs, including those which may be resold only in accordance with Rule 144A under the Securities Act of 1933, as amended. Privately issued securities are restricted securities that are not publicly traded. Delay or difficulty in selling such securities may result in a loss to the Fund.
REIT and Real Estate Risk. The value of the Fund’s investments in REITS may change in response to changes in the real estate market such as declines in the value of real estate, lack of available capital or financing opportunities, and increases in property taxes or operating costs.
Security Selection Risk. Concorde may misjudge the risk and/or return potential of a security. This misjudgment can result in a loss or a significant deviation relative to its benchmarks.
Smaller and Medium Capitalization Company Risk. Securities of smaller and medium-sized companies may be more volatile and more difficult to liquidate during market downturns than securities of larger companies. Additionally the price of smaller companies may decline more in response to selling pressures.
Style Risk. Concorde follows an investing style that favors value investments. The value investing style may, over time, go in and out of favor. At time when the value investing style is out of favor, the Fund may underperform other funds that use different investing styles. Investors should be prepared to tolerate volatility in Fund returns.
| Note 7 – Investment Advisory Fees and Transactions with Affiliate |
The Company has an Investment Advisory Agreement with Concorde to act as the Fund’s investment advisor. Concorde provides the Fund with investment management and advisory services consistent with the Fund’s investment objectives, policies and restrictions, supervises the purchase and sale of investment transactions and administers the business and administrative operations of the Fund. For such services, Concorde received an annual fee of 0.80% of the Fund’s average daily net assets, computed daily and paid on a monthly basis. The investment advisory fee was $72,121 for the six months ended March 31, 2017, of which $12,681 was payable at March 31, 2017. Certain officers and directors of the Company are also officers, directors and/or employees of Concorde.
CONCORDE WEALTH MANAGEMENT FUND
NOTES TO FINANCIAL STATEMENTS
| Note 8 – Service Organizations |
U.S. Bancorp Fund Services, LLC (“USBFS”) provides the Fund with administrative, fund accounting, and transfer agent services. U.S. Bank, N.A., (“USB”) an affiliate of USBFS, serves as the Fund’s custodian. Fees paid to USBFS and USB during the six months ended March 31, 2017, were $40,783 and $1,559, respectively.
Due to the Reorganization, the Company entered into new administrative, fund accounting, and transfer agent agreements with USBFS and a new custody agreement with USB in July 2016. Pursuant to the agreements, should the Company elect to terminate any of these agreements prior to the end of the initial three year term, the Company agrees to pay certain monthly, and other fees, through the lives of any of the terminated agreements.
The Company has an administrative agreement with National Financial Services, LLC (NFS). The agreement provides for monthly payments by the Fund to NFS for providing certain shareholder services (sub-transfer agent fees). Sub-transfer agent fees incurred by the Fund to NFS for the six months ended March 31, 2017 were $12,936.
| Note 9 – Federal Tax Information |
At September 30, 2016, the Fund’s most recent fiscal year end, the Fund’s investments and components of accumulated earnings (losses) on a tax basis were as follows:
| | Cost of Investments | | $ | 13,815,831 | |
| | Gross tax unrealized appreciation | | | 3,630,408 | |
| | Gross tax unrealized depreciation | | | (335,705 | ) |
| | Net tax unrealized appreciation | | $ | 3,294,703 | |
| | Undistributed ordinary income | | | — | |
| | Undistributed long-term gain | | | — | |
| | Total distributable earnings | | $ | — | |
| | Other accumulated losses | | $ | — | |
| | Net accumulated earnings | | $ | 3,294,703 | |
The difference between book basis and tax basis unrealized appreciation is attributable to the realization for tax purposes of the unrealized gain on investments in a passive foreign investment company.
At September 30, 2016, the Fund’s most recent fiscal year end, the Fund had no tax basis capital loss carryovers to offset future capital gains. The Fund did not utilize a capital loss carryover during the year ended September 30, 2016. The Fund had no late year loss deferrals and no post-October loss.
CONCORDE WEALTH MANAGEMENT FUND
NOTES TO FINANCIAL STATEMENTS
| Note 9 – Federal Tax Information (continued) |
The tax character of distributions paid during the six months ended March 31, 2017 and year ended September 30, 2016 was as follows:
| | | | Six Months Ended | | | | |
| | | | March 31, 2017 | | | | |
| | | | (Unaudited) | | | September 30, 2016 | |
| | Ordinary income | | $ | 7,139 | | | $ | 25,675 | |
| | Long-term capital gain | | $ | 25,434 | | | $ | 528,238 | |
| | | | $ | 32,573 | | | $ | 553,913 | |
| Note 10 – Subsequent Events |
Management has evaluated the Fund’s events and transactions that occurred subsequent to March 31, 2017 through the date of issuance of the Fund’s financial statements. There were no events or transactions that occurred during this period that materially impacted the amounts or disclosures in the Fund’s financial statements.
ADDITIONAL INFORMATION (Unaudited)
PROXY VOTING POLICIES AND PROCEDURES
For a description of the policies and procedures that the Fund uses to determine how to vote proxies relating to the portfolio securities, please call (972) 701-5400 and request a Statement of Additional Information. One will be mailed to you free of charge. The Statement of Additional Information is also available on the website of the Securities and Exchange Commission at http://www.sec.gov.
PROXY VOTING RECORDS
Information on how the Fund voted proxies relating to portfolio securities during the twelve month period ending June 30, 2016 is available without charge, upon request, by calling (972) 701-5400. Furthermore, you can obtain the Fund’s proxy voting records on the Securities and Exchange Commission’s website at http://www.sec.gov.
QUARTERLY FILINGS ON FORM N-Q
The Fund files its complete schedule of portfolio holdings with the Securities and Exchange Commission for the first and third quarters of each fiscal quarter on Form N-Q. The Fund’s Form N-Q is available (i) without charge, upon request, by calling (972) 701-5400, (ii) on the Securities and Exchange Commission’s website at http://www.sec.gov, or (iii) at the Securities and Exchange Commission’s public reference room. Information on the operation of the public reference room may be obtained by calling 1-800-SEC-0330.
HOUSEHOLD DELIVERY OF SHAREHOLDER DOCUMENTS
In an effort to decrease costs, the Fund intends to reduce the number of duplicate prospectuses and Annual and Semi-Annual Reports you receive by sending only one copy of each to those addresses shared by two or more accounts and to shareholders we reasonably believe are from the same family or household. Once implemented, if you would like to discontinue householding for your accounts, please call toll-free at 1-800-294-1699 to request individual copies of these documents. Once the Fund receives notice to stop householding, we will begin sending individual copies thirty days after receiving your request. This policy does not apply to account statements.
FUND EXPENSES (Unaudited)
As a shareholder of the Fund, you incur two types of costs: (1) transaction costs and exchange fees; and (2) ongoing costs, including management fees and other Fund expenses. This Example is intended to help you understand your ongoing costs (in dollars) of investing in the Fund and to compare these costs with the ongoing costs of investing in other mutual Funds.
The Example is based on an investment of $1,000 invested at the beginning of the period and held for the entire six month period ended March 31, 2017.
Actual Expenses
The first line of the table below provides information about actual account values and actual expenses. You may use the information in this line, together with the amount you invested, to estimate the expenses that you paid over the period. Simply divide your account value by $1,000 (for example, an $8,600 account value divided by $1,000 = 8.6), then multiply the result by the number in the first line under the heading entitled “Expenses Paid During Period” to estimate the expenses you paid on your account during this period.
Hypothetical Example for Comparison Purposes
The second line of the table below provides information about hypothetical account values and hypothetical expenses based on the Fund’s actual expense ratio and an assumed rate of return of 5% per year before expenses, which is not the Fund’s actual return. The hypothetical account values and expenses may not be used to estimate the actual ending account balance or expenses you paid for the period. You may use this information to compare the ongoing costs of investing in the Fund and other Funds. To do so, compare this 5% hypothetical example with the 5% hypothetical examples that appear in the shareholder reports of the other Funds.
Please note that the expenses shown in the table are meant to highlight your ongoing costs only and do not reflect any transactional costs or exchange fees. While the Fund does not currently assess sales charges, redemption or exchange fees, other Funds do, and those costs will not be reflected in their expense tables. Therefore, the second line of the table is useful in comparing ongoing costs only, and will not help you determine the relative total costs of owning different Funds.
| | Beginning Account | Ending Account | Expenses Paid During Period* – |
| | Value – 10/1/16 | Value – 3/31/17 | Six Months Ended 3/31/17 |
| Actual | $1,000.00 | $1,032.70 | $9.17 |
| Hypothetical (5% return before expenses) | $1,000.00 | $1,015.91 | $9.10 |
______________
| * | Expenses are equal to the Fund’s annualized expense ratio of 1.81%, multiplied by the average account value over the period, multiplied by 182/365 (to reflect the one-half year period ended March 31, 2017). |
INVESTMENT ADVISOR
Concorde Investment Management
1000 Three Lincoln Centre
5430 LBJ Freeway LB3
Dallas, Texas 75240
OFFICERS
Gary B. Wood, Ph.D.
President
Gregory B. Wood
Treasurer
John A. Stetter
Secretary
DIRECTORS
William Marcy, P.E., Ph.D.
John H. Wilson
Gary B. Wood, Ph.D.
CUSTODIAN
U.S. Bank, N.A.
Custody Operations
1555 North RiverCenter Drive, Suite 302
Milwaukee, Wisconsin 53212
TRANSFER AGENT AND
DIVIDEND DISBURSING AGENT
U.S. Bancorp Fund Services, LLC
Mutual Fund Services, 3rd Floor
615 East Michigan Street
Milwaukee, Wisconsin 53202
INDEPENDENT REGISTERED
PUBLIC ACCOUNTING FIRM
Brad A. Kinder, CPA
815 Parker Square
Flower Mound, Texas 75028
LEGAL COUNSEL
Foley & Lardner LLP
777 East Wisconsin Avenue
Milwaukee, Wisconsin 53202
TELEPHONE
(972) 701-5400
(Fund information)
(800) 294-1699
(Shareholder account information)