UNITED STATES
SECURITIES AND EXCHANGE COMMISSION
Washington, D.C. 20549
SECURITIES AND EXCHANGE COMMISSION
Washington, D.C. 20549
FORM N-CSR
CERTIFIED SHAREHOLDER REPORT OF REGISTERED
MANAGEMENT INVESTMENT COMPANIES
Investment Company Act file number (811-05339)
Concorde Funds, Inc.
(Exact name of registrant as specified in charter)
(Exact name of registrant as specified in charter)
1000 Three Lincoln Centre
5430 LBJ Freeway LB3
Dallas, TX 75240-2650
(Address of principal executive offices) (Zip code)
(Address of principal executive offices) (Zip code)
Gary B. Wood
1000 Three Lincoln Centre, 5430 LBJ Freeway LB3, Dallas, TX 75240-2650
(Name and address of agent for service)
(972)-701-5400
Registrant's telephone number, including area code
Date of fiscal year end: 09/30/2016
Date of reporting period: 03/31/2016
Item 1. Reports to Stockholders.
A NO-LOAD
MUTUAL FUND
SEMI-ANNUAL REPORT
Dated March 31, 2016

May 26, 2016
Dear Shareholders,
We are pleased to present the Semi-Annual report of Concorde Funds, Inc. for the six-month period ending March 31, 2016.
Concorde Value Fund
For the first half of the fiscal year for Concorde Value Fund, which currently owns mostly large cap companies, the total return was 3.88%, comparable to the large cap indices but below the broader indices which are dominated by smaller cap and mid-cap size companies. That relative performance pattern is consistent with the trialing 12 months return of -8.47%, but the preference for larger companies reflects our continuing concerns over market risks and the likelihood that larger companies can weather tough times better than small companies. In addition, value oriented equities like those the fund invests in generally lagged the performance of growth style equites for much of 2016, which includes the first 3 months of the current fiscal year. This is evidenced by the results of the Russell 3000 Value and Lipper Multi-Cap Value indices below vs. the S&P 500 Index which is a large cap index with weightings concentrated in some very large growth oriented equities which performed very well during the time period.
| Six Months Ended | Annualized | Annualized | |||
| 03/31/2016 | 1 Year Ending | 5 Years Ending | 10 Years Ending | ||
(Unaudited) | 03/31/2016 | 03/31/2016 | 03/31/2016 | ||
| Concorde Value Fund | 3.88% | -8.47% | 4.89% | 1.59% | |
| Russell 2000 Index | 2.02% | -9.76% | 7.20% | 5.26% | |
| S&P 500 Index | 8.49% | 1.78% | 11.58% | 7.01% | |
| Russell 3000 Value Index | 7.15% | -2.05% | 9.95% | 5.60% | |
| Lipper Multi-Cap Value Index | 4.88% | -4.69% | 8.48% | 4.81% | |
| Wilshire 4500 Index | 2.95% | -7.64% | 8.79% | 6.94% | |
| NASDAQ Global Select Market Index | 5.87% | 0.06% | 12.14% | 8.03% |
Equity performance in the domestic markets was positive for the Fund and all market and managed fund indices listed above for the first half of the fiscal year. However, there was a significant amount of variability and volatility in results, reflecting differences in gains for various capitalization and industry sectors.
The technology, industrials, and real estate sectors all had positive returns for the half year with mixed individual company results. In technology, Fund holdings had double digit gains compared to a 11.09% S&P sector gain. Microsoft, IBM, and Oracle all had total return gains which include meaningful dividends. Microsoft was up 25.97% for the 6 months ending while IBM and Oracle were closer to the sector gain at 10.33% and 14.10%, respectively. Long term prospects appear good for all three companies; however, IBM continues to face difficult transition periods. If even moderately successful we see large upside in these stocks. As we discussed last year, Microsoft was farther along with their changes and have had primarily good recent results along with stock performance.
The consumer discretionary holdings of the fund performed erratically vs. 6.63% for the S&P benchmark. Primary positive contributors include new holding Amazon which is up 7.12% since we added it to the portfolio in the first quarter of 2016, Fortune Brands Home & Security (up 18.7%) and Lowe’s (up 10.79%). Hanesbrands and Walt Disney were both down slightly over the 6-month period. Walt Disney continues to battle investor sentiment of cable cutting for some of their media properties such as ESPN. Fortune Brands and Lowe’s continue to benefit from the continued improvement of the housing market, particularly the high activity in rehabbing existing homes.
The energy holdings of the Fund contributed a net loss for the period, although it generated a total return gain in the last three months. We exited Devon during the first quarter of 2016 when a price recovery was uncertain and their long term liquidity position was unstable. The Company raised additional equity to the dilution of existing shareholders however the stock went up after that given they solved their immediate liquidity concerns. We continue to hold two quality companies through the recent weakness and recovery, Halliburton (up 2.09%) and Cimarex Energy (down 4.78%). One new holding in the energy sector is Valero which is down 1.52% since we bought it but feel the company is positioned well for a long term value creation. These holdings should provide more upside over the next several years if the energy industry stabilizes or recovers modestly.
The Fund’s only Industrial holding in the S&P index is Union Pacific which had negative performance, lagging the 12.01% positive return for S&P industrials. Union Pacific sold off in sympathy to the energy industry weakness. We still see a strong franchise that continues to participate in moderate economic growth with efficient management and a discount to long term valuation prospects.
The real estate related holdings had volatile movement in the first half. Texas Pacific Land Trust increased 3.96% during the 6-month period but is up 24.5% during the first quarter. The Trust has a large energy royalty aspect to valuation in addition to large raw land holdings. Medical Properties Trust rose during both quarters and had a total return of 14.51% and continues to contribute to the overall portfolio.
AB InBev has been a great performer during the period as a consumer staples holdings in the Fund and outperformed the low double digit benchmark return. The Company has market leading products, but is struggling slightly in some of their emerging markets. Long term these well financed stocks should benefit from exposure to those higher growth markets and generate solid cash flows from developed markets.
The Fund has held Sprott Physical Gold Trust and given the weakness in the US Dollar and current credibility issues with central banks, the metal has been in favor with investors recently. The position was up 8.38% over the period and was up almost 16% during the first quarter.
Three insurance related stocks continue to be the only investments for the Fund in the financial services segment. Combined, these three outperformed the S&P sector benchmark which was down 0.53%. AON PLC (up 18.63%), active in insurance brokerage and employee benefits, continues to perform well as their strong market position is leading to good earnings and cash flow growth as operations improve. AIG, primarily a property and casualty insurer, have reported good results, but the pricing environment may be weakening modestly, especially on the commercial side. We have exited our Travelers position in the recent period.
2
Healthcare positions in the Fund currently include Allergan Preferred shares, HCA Holdings, Johnson & Johnson, and HealthSouth Corp. Collective performance lagged significantly the 2.32% S&P sector, producing a low single digit positive return. The benchmark reflects our holdings, excluding Johnson & Johnson which was up 17.58%. Johnson & Johnson does have exposure in devices and pharmaceuticals in more established markets. HealthSouth is the domestic leader in inpatient rehabilitation facilities which should see continued growth from demographic trends and we see the current stock price as significantly undervalued.
Thank for your continued support and confidence. Be assured, we will always work to achieve good performance, but with a careful eye on capital preservation, particularly during these challenging times.
| Best regards, | |
 | |
| Gary B. Wood, Ph.D. | |
| President |
3
CONCORDE VALUE FUND
PORTFOLIO HOLDINGS BY SECTOR
March 31, 2016 (Unaudited)
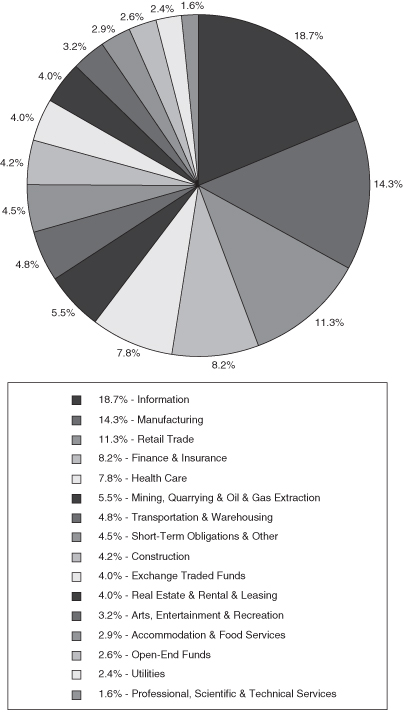
The portfolio’s holdings and allocations are subject to change. The percentages are of net assets as of March 31, 2016.
4
FUND EXPENSES (Unaudited)
As a shareholder of the FUND, you incur two types of costs: (1) transaction costs and exchange fees; and (2) ongoing costs, including management fees and other FUND expenses. This Example is intended to help you understand your ongoing costs (in dollars) of investing in the FUND and to compare these costs with the ongoing costs of investing in other mutual funds.
The Example is based on an investment of $1,000 invested at the beginning of the period and held for the entire six month period ended March 31, 2016.
Actual Expenses
The first line of the table below provides information about actual account values and actual expenses. As a shareholder you will be assessed fees for outgoing wire transfers, returned checks and stop payment orders at prevailing rates charged by U.S. Bancorp Fund Services, LLC, the FUND’s transfer agent. If you request that a redemption be made by wire transfer, currently, the FUND’s transfer agent charges a $15.00 fee. Individual Retirement Accounts (“IRA”) that are held directly at the FUND will be charged a $15.00 annual maintenance fee. IRAs held by broker-dealers or through other means, may or may not incur an annual maintenance fee. Yet, if IRAs maintenances fees are charged to accounts held elsewhere, the fees charged may be more or may be less than $15.00. To the extent the FUND invests in shares of other investment companies as part of their investment strategy, you will indirectly bear your proportionate share of any fees and expenses charged by the underlying funds in which the FUND invests in addition to the expenses of the FUND. Actual expenses of the underlying funds may vary. These expenses are not included in the example below. The example below includes, but is not limited to, investment advisory, fund accounting, custody and transfer agent fees. However, the example below does not include portfolio trading commissions and related expenses and other extraordinary expenses as determined under generally accepted accounting principles. You may use the information in this line, together with the amount you invested, to estimate the expenses that you paid over the period. Simply divide your account value by $1,000 (for example, an $8,600 account value divided by $1,000 = 8.6), then multiply the result by the number in the first line under the heading entitled “Expenses Paid During Period” to estimate the expenses you paid on your account during this period.
Hypothetical Example for Comparison Purposes
The second line of the table below provides information about hypothetical account values and hypothetical expenses based on the FUND’s actual expense ratio and an assumed rate of return of 5% per year before expenses, which is not the FUND’s actual return. The hypothetical account values and expenses may not be used to estimate the actual ending account balance or expenses you paid for the period. You may use this information to compare the ongoing costs of investing in the FUND and other funds. To do so, compare this 5% hypothetical example with the 5% hypothetical examples that appear in the shareholder reports of the other funds.
5
FUND EXPENSES (Unaudited) (continued)
Please note that the expenses shown in the table are meant to highlight your ongoing costs only and do not reflect any transactional costs or exchange fees. While the FUND does not currently assess sales charges, redemption or exchange fees, other funds do, and those costs will not be reflected in their expense tables. Therefore, the second line of the table is useful in comparing ongoing costs only, and will not help you determine the relative total costs of owning different funds.
| Beginning Account | Ending Account | Expenses Paid During Period* – | |
Value – 10/1/15 | Value – 3/31/16 | Six Months Ended 3/31/16 | |
| Actual | $1,000.00 | $1,038.80 | $13.42 |
| Hypothetical (5% return before expenses) | $1,000.00 | $1,011.83 | $13.25 |
______________
| * | Expenses are equal to the FUND’s annualized expense ratio of 2.63%, multiplied by the average account value over the period, multiplied by 183/366 (to reflect the one-half year period ended March 31, 2016). |
6
CONCORDE VALUE FUND
SCHEDULE OF INVESTMENTS IN SECURITIES
March 31, 2016 (Unaudited)
| Fair | Percent of | |||||||||||
| Shares | Value | Net Assets | ||||||||||
| COMMON STOCKS - 75.47% | ||||||||||||
| ACCOMMODATION & FOOD SERVICES | ||||||||||||
| Darden Restaurants, Inc. | 4,000 | $ | 265,200 | 2.85 | % | |||||||
| ARTS, ENTERTAINMENT & RECREATION | ||||||||||||
| Speedway Motorsports, Inc. | 15,000 | 297,450 | 3.20 | |||||||||
| FINANCE & INSURANCE | ||||||||||||
| American International Group, Inc. | 6,000 | 324,300 | 3.49 | |||||||||
| Aon Corp. (a) | 4,200 | 438,690 | 4.71 | |||||||||
| 762,990 | 8.20 | |||||||||||
| HEALTH CARE | ||||||||||||
| HCA Holdings, Inc. (b) | 5,500 | 429,275 | 4.61 | |||||||||
| HealthSouth Corp. | 7,775 | 292,573 | 3.15 | |||||||||
| 721,848 | 7.76 | |||||||||||
| INFORMATION | ||||||||||||
| Comcast Corp. - Class A | 4,900 | 299,292 | 3.22 | |||||||||
| Discovery Communications (b) | 12,000 | 324,000 | 3.48 | |||||||||
| Microsoft Corp. | 8,000 | 441,840 | 4.75 | |||||||||
| Oracle Corp. | 10,000 | 409,100 | 4.39 | |||||||||
| The Walt Disney Co. | 2,700 | 268,137 | 2.88 | |||||||||
| 1,742,369 | 18.72 | |||||||||||
| MANUFACTURING | ||||||||||||
| Anheuser Busch InBev NV - ADR (a) | 2,600 | 324,116 | 3.48 | |||||||||
| Fortune Brands Home & Security, Inc. | 4,700 | 263,388 | 2.83 | |||||||||
| Johnson & Johnson | 2,900 | 313,780 | 3.37 | |||||||||
| Valero Energy Corp. | 2,700 | 173,178 | 1.86 | |||||||||
| 1,074,462 | 11.54 | |||||||||||
| MINING, QUARRYING & OIL & GAS EXTRACTION | ||||||||||||
| Cimarex Energy Co. | 2,530 | 246,093 | 2.64 | |||||||||
| Halliburton Co. | 7,500 | 267,900 | 2.88 | |||||||||
| 513,993 | 5.52 | |||||||||||
| PROFESSIONAL, SCIENTIFIC & TECHNICAL SERVICES | ||||||||||||
| International Business Machines Corp. | 1,000 | 151,450 | 1.63 | |||||||||
| RETAIL TRADE | ||||||||||||
| Amazon.com, Inc. (b) | 320 | 189,965 | 2.04 | |||||||||
| Hanesbrands, Inc. | 8,500 | 240,890 | 2.59 | |||||||||
| Lowe’s Companies, Inc. | 5,000 | 378,750 | 4.07 | |||||||||
| Staples, Inc. | 21,600 | 238,248 | 2.56 | |||||||||
| 1,047,853 | 11.26 | |||||||||||
The accompanying notes are an integral part of these financial statements.
7
CONCORDE VALUE FUND
SCHEDULE OF INVESTMENTS IN SECURITIES (continued)
March 31, 2016 (Unaudited)
| Fair | Percent of | |||||||||||
| Shares | Value | Net Assets | ||||||||||
| COMMON STOCKS (continued) | ||||||||||||
| TRANSPORTATION & WAREHOUSING | ||||||||||||
| Union Pacific Corp. | 5,600 | $ | 445,480 | 4.79 | % | |||||||
| TOTAL COMMON STOCKS (Cost $4,279,122) | 7,023,095 | 75.47 | ||||||||||
| CONVERTIBLE PREFERRED STOCKS - 5.14% | ||||||||||||
| MANUFACTURING | ||||||||||||
| Allergan PLC (a) | 275 | 252,764 | 2.72 | |||||||||
| UTILITIES | ||||||||||||
| Kinder Morgan, Inc. | 5,000 | 225,500 | 2.42 | |||||||||
| TOTAL CONVERTIBLE PREFERRED STOCKS | ||||||||||||
| (Cost $511,484) | 478,264 | 5.14 | ||||||||||
| EXCHANGE TRADED FUNDS - 4.02% | ||||||||||||
| Sprott Physical Gold Trust (a)(b) | 37,000 | 374,440 | 4.02 | |||||||||
| TOTAL EXCHANGE TRADED FUNDS (Cost $340,421) | 374,440 | 4.02 | ||||||||||
| OPEN-END FUNDS - 2.63% | ||||||||||||
| Deutsche CROCI International Fund - Class S | 6,069 | 244,780 | 2.63 | |||||||||
| TOTAL OPEN-END FUNDS (Cost $250,000) | 244,780 | 2.63 | ||||||||||
| REITS - 3.99% | ||||||||||||
| REAL ESTATE & RENTAL & LEASING | ||||||||||||
| Medical Properties Trust, Inc. | 15,000 | 194,700 | 2.09 | |||||||||
| Prologis, Inc. | 4,000 | 176,720 | 1.90 | |||||||||
| TOTAL REITS (Cost $334,868) | 371,420 | 3.99 | ||||||||||
| ROYALTY TRUST - 4.22% | ||||||||||||
| CONSTRUCTION | ||||||||||||
| Texas Pacific Land Trust | 2,700 | 392,877 | 4.22 | |||||||||
| TOTAL ROYALTY TRUST (Cost $390,001) | 392,877 | 4.22 | ||||||||||
| SHORT-TERM INVESTMENTS - 5.11% | ||||||||||||
| The STIC Prime Portolfio - Institutional Class, 0.35% (c) | 103,529 | 103,529 | 1.11 | |||||||||
| Fidelity Institutional Money Market - Select Class, 0.30% (c) | 371,994 | 371,994 | 4.00 | |||||||||
| TOTAL SHORT-TERM INVESTMENTS (Cost $475,523) | 475,523 | 5.11 | ||||||||||
| Total Investments (Cost $6,581,419) - 100.58% | 9,360,399 | 100.58 | ||||||||||
| Liabilities in Excess of Other Assets - (0.58)% | (53,978 | ) | (0.58 | ) | ||||||||
| TOTAL NET ASSETS - 100.00% | $ | 9,306,421 | 100.00 | % | ||||||||
______________
Notes:
ADR American Depository Receipt
PLC Public Limited Company
REIT Real Estate Investment Trust
| (a) | Foreign issued security listed directly on a U.S. securities exchange. |
| (b) | Presently non-income producing. |
| (c) | Rate shown is the 7-day yield as of March 31, 2016. |
The accompanying notes are an integral part of these financial statements.
8
CONCORDE VALUE FUND
STATEMENT OF ASSETS AND LIABILITIES
March 31, 2016 (Unaudited)
| ASSETS | ||||
| Investments in securities, at fair value (cost $6,581,419) | $ | 9,360,399 | ||
| Dividends & interest receivable | 7,747 | |||
| Fund shares sold | 14,500 | |||
| Prepaid expense | 2,725 | |||
| Other asset | 3,346 | |||
| TOTAL ASSETS | 9,388,717 | |||
| LIABILITIES | ||||
| Investment advisory fee payable | 6,928 | |||
| Payable for investment securities purchased | 45,549 | |||
| Accrued expenses | 29,661 | |||
| Accrued director’s fees | 158 | |||
| TOTAL LIABILITIES | 82,296 | |||
| NET ASSETS | $ | 9,306,421 | ||
| Composition of Net Assets: | ||||
| Net capital paid in on shares of capital stock | $ | 6,653,028 | ||
| Accumulated net investment loss | (53,576 | ) | ||
| Accumulated net realized loss | (72,011 | ) | ||
| Net unrealized appreciation (depreciation) on: | ||||
| Investments | 2,778,980 | |||
| NET ASSETS | $ | 9,306,421 | ||
| Capital shares outstanding | 690,503 | |||
| Net asset value, offering price and redemption price per share | $ | 13.48 | ||
The accompanying notes are an integral part of these financial statements.
9
CONCORDE VALUE FUND
STATEMENT OF OPERATIONS
For the Six Months Ended March 31, 2016 (Unaudited)
| Investment Income | ||||
| Dividends (net of foreign withholding taxes of $868) | $ | 104,174 | ||
| Interest | 342 | |||
| Total investment income | 104,516 | |||
| Expenses | ||||
| Investment advisory fees (Note 6) | 41,055 | |||
| Administration fees | 18,128 | |||
| Professional fees | 17,782 | |||
| Fund accounting fees | 14,589 | |||
| Transfer agent fees | 8,282 | |||
| Other expenses | 6,392 | |||
| Printing, postage and delivery | 4,796 | |||
| Sub-transfer agent expenses (Note 6) | 2,763 | |||
| Insurance expense | 2,693 | |||
| Custody fees | 1,725 | |||
| Directors fees | 1,338 | |||
| Federal and state registration fees | 587 | |||
| Total expenses | 120,130 | |||
| NET INVESTMENT LOSS | (15,614 | ) | ||
| REALIZED AND UNREALIZED GAIN (LOSS) FROM INVESTMENTS | ||||
| Net realized gain (loss) on: | ||||
| Investments | (57,766 | ) | ||
| Written options | 13,992 | |||
| Long-term capital gain distributions from regulated investment companies | 8,561 | |||
| Net change in unrealized appreciation (depreciation) on: | ||||
| Investments | 403,305 | |||
| NET REALIZED AND UNREALIZED GAIN FROM INVESTMENTS | 368,092 | |||
| NET INCREASE IN NET ASSETS RESULTING FROM OPERATIONS | $ | 352,478 | ||
The accompanying notes are an integral part of these financial statements.
10
CONCORDE VALUE FUND
STATEMENTS OF CHANGES IN NET ASSETS
| Six Months Ended | ||||||||
| March 31, 2016 | Year Ended | |||||||
| (Unaudited) | Sep. 30, 2015 | |||||||
| INCREASE (DECREASE) IN NET ASSETS FROM OPERATIONS | ||||||||
| Net investment loss | $ | (15,614 | ) | $ | (44,125 | ) | ||
| Net realized gain (loss) from: | ||||||||
| Investments | (57,766 | ) | 748,170 | |||||
| Written options | 13,992 | 24,678 | ||||||
| Long-term capital gain distributions from | ||||||||
| regulated investment companies | 8,561 | — | ||||||
| Net change in unrealized appreciation (depreciation) on: | ||||||||
| Investments | 403,305 | (1,572,430 | ) | |||||
| Net increase (decrease) in net assets resulting from operations | 352,478 | (843,707 | ) | |||||
| DISTRIBUTIONS TO SHAREHOLDERS FROM | ||||||||
| Net investment income | — | — | ||||||
| Net realized gains on investments | (553,913 | ) | (953,218 | ) | ||||
| Total distributions to shareholders | (553,913 | ) | (953,218 | ) | ||||
| CAPITAL SHARE TRANSACTIONS-NET (Note 3) | 369,948 | (947,014 | ) | |||||
| Total increase (decrease) in net assets | 168,513 | (2,743,939 | ) | |||||
| NET ASSETS | ||||||||
| Beginning of period | 9,137,908 | 11,881,847 | ||||||
| End of period (including accumulated net investment | ||||||||
| loss of $(53,576) and $(37,962), respectively) | $ | 9,306,421 | $ | 9,137,908 | ||||
The accompanying notes are an integral part of these financial statements.
11
CONCORDE VALUE FUND
FINANCIAL HIGHLIGHTS
| Six Months | ||||||||||||||||||||||||
| Ended | ||||||||||||||||||||||||
| March 31, | Year Ended September 30, | |||||||||||||||||||||||
2016(2) | ||||||||||||||||||||||||
| (Unaudited) | 2015 | 2014 | 2013 | 2012 | 2011 | |||||||||||||||||||
| PER SHARE OPERATING | ||||||||||||||||||||||||
| PERFORMANCE: | ||||||||||||||||||||||||
| Net asset value, beginning of period | $ | 13.79 | $ | 16.50 | $ | 14.22 | $ | 12.34 | $ | 9.97 | $ | 10.65 | ||||||||||||
| Income (loss) from investment operations: | ||||||||||||||||||||||||
Net investment income (loss)(1) | (0.02 | ) | (0.07 | ) | (0.02 | ) | 0.03 | 0.02 | (0.03 | ) | ||||||||||||||
| Net realized and unrealized gain (loss) | ||||||||||||||||||||||||
| on investment transactions | 0.55 | (1.29 | ) | 2.33 | 1.87 | 2.35 | (0.65 | ) | ||||||||||||||||
| Total from investment operations | 0.53 | (1.36 | ) | 2.31 | 1.90 | 2.37 | (0.68 | ) | ||||||||||||||||
| Less distributions: | ||||||||||||||||||||||||
| From net investment income | — | — | (0.03 | ) | (0.02 | ) | — | — | ||||||||||||||||
| From net realized gains | (0.84 | ) | (1.35 | ) | — | — | — | — | ||||||||||||||||
| Total distributions | (0.84 | ) | (1.35 | ) | (0.03 | ) | (0.02 | ) | — | — | ||||||||||||||
| Net asset value, end of period | $ | 13.48 | $ | 13.79 | $ | 16.50 | $ | 14.22 | $ | 12.34 | $ | 9.97 | ||||||||||||
| TOTAL RETURN | 3.88 | % | (8.90 | )% | 16.29 | % | 15.46 | % | 23.77 | % | (6.38 | )% | ||||||||||||
| RATIOS/SUPPLEMENTAL DATA: | ||||||||||||||||||||||||
| Net assets, end of period (in thousands) | $ | 9,306 | $ | 9,138 | $ | 11,882 | $ | 11,279 | $ | 11,027 | $ | 9,331 | ||||||||||||
| Ratio of expenses to average net assets | 2.63 | % | 2.28 | % | 2.06 | % | 2.09 | % | 2.12 | % | 2.07 | % | ||||||||||||
| Ratio of net investment income (loss) | ||||||||||||||||||||||||
| to average net assets | (0.34 | )% | (0.40 | )% | (0.16 | )% | 0.24 | % | 0.19 | % | (0.24 | )% | ||||||||||||
| Portfolio turnover rate | 27 | % | 57 | % | 32 | % | 34 | % | 19 | % | 37 | % | ||||||||||||
______________
| (1) | Per share amounts calculated using average shares method, which more appropriately presents the per share data for the period. |
| (2) | Other than the ratios of expenses and net investment income (loss) to average net assets, financial highlights have not been annualized. |
The accompanying notes are an integral part of these financial highlights.
12
CONCORDE VALUE FUND
NOTES TO FINANCIAL STATEMENTS
Note 1 – Nature of Business and Summary of Significant Accounting Policies
NATURE OF BUSINESS
Concorde Value Fund (Fund) is a separate series of shares of common stock of Concorde Funds, Inc. (Company). The Company was incorporated in the state of Texas in September of 1987, and is registered under the Investment Company Act of 1940, as amended, as a diversified, open-end management investment company. The Fund is subject to various investment restrictions as set forth in the Statement of Additional Information. The Fund’s Registration Statement under the Securities Act of 1933 was effective in December of 1987. The primary investment objective of the Fund is to produce long-term growth of capital. The Company may designate one or more series of common stock. The Company presently has no series other than the Fund. Each capital share in the Fund represents an equal, proportionate interest in the net assets of the Fund with each other capital share in such series and no interest in any other series. The Fund follows the investment company accounting and reporting guidance of the Financial Accounting Standard Board Accounting Standard Codification Topic 946, Financial Services – Investment Companies.
SIGNIFICANT ACCOUNTING POLICIES
The following is a summary of significant accounting policies followed by the Fund in the preparation of its financial statements. These policies are in conformity with accounting principles generally accepted in the United States.
VALUATION OF SECURITIES
All investments in securities are recorded at their estimated fair value, as described in Note 2.
FEDERAL INCOME TAXES
The Fund’s policy is to continue to comply with the requirements of the Internal Revenue Code that are applicable to regulated investment companies and to distribute all its taxable income to its shareholders. The Fund also intends to distribute sufficient net investment income and net capital gains, if any, so that it will not be subject to excise tax on undistributed income and gains. Therefore, no federal income tax or excise provision is required.
Management has reviewed all open tax years and major tax jurisdictions and concluded that no liability for unrecognized tax benefits should be recorded related to uncertain tax positions taken on returns filed or expected to be taken on a tax return. The tax returns of the Fund for the prior three fiscal years are open for examination.
SECURITY TRANSACTIONS AND RELATED INCOME
Security transactions are accounted for on the date the securities are purchased or sold. Realized gains and losses from securities transactions are reported on an identified cost basis. Dividend income is recognized on the ex-dividend date, and interest income is recognized on an accrual basis. Discounts and premiums on securities purchased are amortized, over the lives of the respective securities.
13
CONCORDE VALUE FUND
NOTES TO FINANCIAL STATEMENTS
Note 1 – Nature of Business and Summary of Significant Accounting Policies (continued)
DIVIDENDS AND DISTRIBUTIONS
Distributions to shareholders are determined in accordance with income tax regulations and recorded on the ex-dividend date. The Fund intends to distribute all of its net investment income, if any, as dividends to its shareholders on an annual basis. The Fund intends to distribute all of its capital gains, if any, at least once a year. Distributions from net investment income and capital gains, if any, are generally declared and paid in December. The treatment for financial reporting purposes of distributions made to shareholders during the year from net investment income or capital gains may differ from their ultimate treatment for federal income tax purposes. These differences are caused primarily by differences in the timing of the recognition of certain components of income, expense or realized capital gain for federal income tax purposes. Where such differences are permanent in nature, they are reclassified in the components of net assets based on their ultimate characterization for federal income tax purposes. Any such reclassifications will have no effect on net assets, results of operations or net asset value per share.
USE OF ESTIMATES
The preparation of financial statements in conformity with U.S. generally accepted accounting principles (GAAP) requires management to make estimates and assumptions that affect the reported amounts of assets and liabilities and disclosure of contingent assets and liabilities at the date of the financial statements and the reported amounts of increases and decreases in net assets from operations during the reporting period. Actual results could differ from those estimates.
OPTION WRITING
To generate additional income or hedge against a possible loss in the value of securities it holds, the Fund may write covered call options. When the Fund writes an option, an amount equal to the premium received by the Fund is recorded as a liability and subsequently adjusted to the current fair value of the option written. Premiums received from writing options that expire unexercised are treated by the Fund on the expiration date as realized gains from investments. The difference between the premium and amount paid on effecting a closing purchase transaction, including brokerage commissions, is also treated as a realized gain or, if the premium is less than the amount paid for the closing purchase transaction, as a realized loss. If a call option is exercised, the premium is added to the proceeds from the sale of the underlying security or currency in determining whether the Fund has realized a gain or loss. The Fund as writer of an option bears the market risk of an unfavorable change in the price of the security underlying the written option.
The objective, as stated above, is to hedge against a possible decline in the value of securities and to generate additional income when we feel certain securities are locked in a trading range. With regards to hedging against a possible decline, we will sell covered calls with strike prices below the price of a security at the time of writing the call. Regarding additional income, the Fund will sell calls on certain securities that are within a trading range.
14
CONCORDE VALUE FUND
NOTES TO FINANCIAL STATEMENTS
Note 1 – Nature of Business and Summary of Significant Accounting Policies (continued)
Transactions in written options contracts for the six months ended March 31, 2016 were as follows:
| Number of | Premiums | ||||||||
| Contracts | Received | ||||||||
| Options outstanding at September 30, 2015 | 0 | $ | 0 | ||||||
| Options written | 165 | $ | 19,492 | ||||||
| Options terminated in | |||||||||
| closing purchase transactions | (100 | ) | (7,150 | ) | |||||
| Options expired | (45 | ) | (9,292 | ) | |||||
| Options exercised | (20 | ) | (3,050 | ) | |||||
| Options outstanding at March 31, 2016 | 0 | $ | 0 | ||||||
The average monthly fair values of written options during the six months ended March 31, 2016 for the Fund was $3,193.
The Fund did not hold any derivatives as of March 31, 2016. The effect of derivative instruments on the Statement of Operations for the six months ended March 31, 2016 was as follows:
| Amount of Realized Gain (Loss) | |||
| on Derivatives Recognized in Income | |||
| Derivatives not accounted for as hedging instruments | Written Options | Total | |
| Equity Contracts | $13,992 | $13,992 | |
Note 2 – Securities Valuation
The Company’s board of directors has adopted methods for valuing securities and other derivative instruments including in circumstances in which market quotes are not readily available, and has delegated authority to Concorde Financial Corporation dba Concorde Investment Management (Concorde) to apply those methods in making fair value determinations. All fair value determinations made by Concorde are subject to oversight by the board of directors.
The Fund utilizes various methods to measure the fair value of its investments on a recurring basis. GAAP establishes a hierarchy that prioritizes inputs to valuation techniques used to measure fair value. The three levels of inputs are as follows:
| Level 1 – | Quoted unadjusted prices in active markets for identical assets or liabilities that the Fund has the ability to access at the date of measurement. | |
| Level 2 – | Quoted prices for similar instruments in active markets; quoted prices for identical or similar instruments in markets that are not active; and model-derived valuations in which all significant inputs and significant value drivers are observable in active markets. Level 2 inputs are those in markets for which there are few transactions, the prices are not current, little public information exists or instances where prices vary substantially over time or among brokered market makers. |
15
CONCORDE VALUE FUND
NOTES TO FINANCIAL STATEMENTS
Note 2 – Securities Valuation (continued)
| Level 3 – | Model derived valuations in which one or more significant inputs or significant value drivers are unobservable. Unobservable inputs are those inputs that reflect the Fund’s own assumptions that market participants would use in valuing the asset or liability based on the best available information. |
The availability of observable inputs can vary from security to security and is affected by a wide variety of factors, including, for example, the type of security, whether the security is new and not yet established in the marketplace, the liquidity of markets, and other characteristics particular to the security. To the extent that valuation is based on models or inputs that are less observable or unobservable in the market, the determination of fair value requires more judgment. Accordingly, the degree of judgment exercised in determining fair value is greatest for instruments categorized in Level 3.
The inputs used to measure fair value may fall into different levels of the fair value hierarchy. In such cases, for disclosure purposes, the level in the fair value hierarchy within which the fair value measurement falls in its entirety is determined based on the lowest level input that is significant to the fair value measurement in its entirety.
Following is a description of the valuation techniques applied to the Fund’s major categories of assets and liabilities measured at fair value on a recurring basis.
Equity Securities – Equity securities, usually common stocks, preferred stocks, foreign issued common stocks, exchanged traded funds, and real estate investment trusts traded on a national securities exchange are valued at the last sale price on the exchange on which such securities are traded, as of the close of business on the day the securities are being valued or, lacking any reported sales, at the mean between the last available bid and asked price. To the extent, these securities are actively traded and valuation adjustments are not applied, they are categorized in Level 1 of the fair value hierarchy.
Derivative Instruments – Listed derivatives, including options, rights, and warrants that are actively traded are valued based on quoted prices from the exchange. If there is no such reported sale on the valuation date, the mean between the highest bid and lowest asked quotations at the close of the exchanges will be used. These securities will generally be categorized in Level 1 of the fair value hierarchy.
Mutual Funds – Mutual funds are generally priced at the ending net asset value provided by the service agent of the Funds and are categorized as Level 1 securities.
Bonds & Notes – Bonds and notes are valued at an evaluated bid price obtained from independent pricing services. Short-term demand notes and certificates of deposit are stated at amortized cost, which approximates fair value. These securities will generally be categorized in Level 2 of the fair value hierarchy.
16
CONCORDE VALUE FUND
NOTES TO FINANCIAL STATEMENTS
Short-Term Debt Securities – Fixed income securities with maturities of less than 60 days when acquired, or which subsequently are within 60 days of maturity, are valued by an independent pricing service that uses a matrix pricing method or other analytical models. To the extent the inputs are observable and timely, these securities would be categorized in Level 2 of the fair value hierarchy.
All other assets of the Fund are valued in such manner as the Board in good faith deems appropriate to reflect their fair value.
Securities for which market quotations are not readily available or if the closing price does not represent fair value, are valued at fair value as determined in good faith following procedures approved by the Board. Factors used in determining fair value vary by investment type and may include: trading volume of security and markets, value of other like securities and news events with direct bearing to security or market. Depending on the relative significance of the valuation inputs, these securities may be categorized in either Level 2 or Level 3 of the fair value hierarchy.
17
CONCORDE VALUE FUND
NOTES TO FINANCIAL STATEMENTS
Note 2 – Securities Valuation (continued)
The following table summarizes the inputs used to value the Fund’s investments measured at fair value as of March 31, 2016:
| Categories | Level 1 | Level 2 | Level 3 | Fair Value | |||||||||||||
| Common Stocks | |||||||||||||||||
| Accommodation & Food Services | $ | 265,200 | $ | — | $ | — | $ | 265,200 | |||||||||
| Arts, Entertainment & Recreation | 297,450 | — | — | 297,450 | |||||||||||||
| Finance & Insurance | 762,990 | — | — | 762,990 | |||||||||||||
| Healthcare | 721,848 | — | — | 721,848 | |||||||||||||
| Information | 1,742,369 | — | — | 1,742,369 | |||||||||||||
| Manufacturing | 1,074,462 | — | — | 1,074,462 | |||||||||||||
| Mining, Quarrying & Oil & Gas Extraction | 513,993 | — | — | 513,993 | |||||||||||||
| Professional, Scientific & Technical Services | 151,450 | — | — | 151,450 | |||||||||||||
| Retail Trade | 1,047,853 | — | — | 1,047,853 | |||||||||||||
| Transportation & Warehousing | 445,480 | — | — | 445,480 | |||||||||||||
| Total Common Stocks | 7,023,095 | — | — | 7,023,095 | |||||||||||||
| Convertible Preferred Stocks | |||||||||||||||||
| Manufacturing | 252,764 | — | — | 252,764 | |||||||||||||
| Utilities | 225,500 | — | — | 225,500 | |||||||||||||
| Total Convertible Preferred Stocks | 478,264 | — | — | 478,264 | |||||||||||||
| Exchange Traded Funds | 374,440 | — | — | 374,440 | |||||||||||||
| Open-End Funds | 244,780 | — | — | 244,780 | |||||||||||||
| REITs | |||||||||||||||||
| Real Estate & Rental & Leasing | 371,420 | — | — | 371,420 | |||||||||||||
| Royalty Trust | |||||||||||||||||
| Construction | 392,877 | — | — | 392,877 | |||||||||||||
| Short-Term Investments | 475,523 | — | — | 475,523 | |||||||||||||
| Total Investments | $ | 9,360,399 | $ | — | $ | — | $ | 9,360,399 | |||||||||
Transfers between levels are recognized at the end of the reporting period. There were no transfers between levels. There were no Level 3 investments held by the Fund during the six months ended March 31, 2016.
Note 3 – Capital Share Transactions
As of March 31, 2016, 30,000,000 shares of $1 par value capital stock were authorized, of which 9,841,293 shares are classified as the Fund’s series and the remaining balance is unallocated for future use. As of March 31, 2016, capital paid-in aggregated $6,653,028.
18
CONCORDE VALUE FUND
NOTES TO FINANCIAL STATEMENTS
Note 3 – Capital Share Transactions (continued)
Transactions in shares of capital stock for the six months ended March 31, 2016 and year ended September 30, 2015 were as follows:
| Six Months Ended | |||||||||||||||||
| March 31, 2016 | Year Ended | ||||||||||||||||
| (Unaudited) | September 30, 2015 | ||||||||||||||||
| Shares | Amount | Shares | Amount | ||||||||||||||
| Shares sold | 6,425 | $ | 89,900 | 17,087 | $ | 261,280 | |||||||||||
| Shares issued in reinvestment of distributions | 41,275 | 553,913 | 63,506 | 953,218 | |||||||||||||
| 47,700 | 643,813 | 80,593 | 1,214,498 | ||||||||||||||
| Shares redeemed | (20,041 | ) | (273,865 | ) | (137,675 | ) | (2,161,512 | ) | |||||||||
| Net increase (decrease) | 27,659 | $ | 369,948 | (57,082 | ) | $ | (947,014 | ) | |||||||||
Note 4 – Investment Transactions
The aggregate cost of purchases and proceeds from sales of investment securities, excluding short-term investments, were $2,329,941 and $2,392,238, respectively. The aggregate cost of purchases and proceeds from sales of short-term investments, were $3,031,569 and $2,829,787, respectively.
Note 5 – Principal Risks
The Fund in the normal course of business makes investments in financial instruments and derivatives where the risk of potential loss exists due to changes in the market (market risk), or failure or inability of the counterparty to a transaction to perform (credit and counterparty risk). See below for a detailed description of select principal risks.
Market Risk. The prices of the stocks in which the Fund invests may decline for a number of reasons such as changing economic, political or market conditions. The price declines may be steep, sudden and/or prolonged. This means you may lose money.
Financial Risk. There is a risk that the price of a common stock will decline because the issuing company experiences financial distress or does not perform as well as anticipated. Factors affecting a company’s performance can include the strength of its management and the demand for its products or services.
Value Investing Risk. The Fund mainly invests in undervalued stocks. There is a risk that the Advisor may not properly assess a company’s value or that the market does not recognize improving fundamentals as quickly as the Fund anticipated. In such cases, the stocks may not reach prices which reflect the intrinsic value of the company. There is also a risk that the Fund may not perform as well as other types of mutual funds when “value” style investing is out of favor with other investors.
Foreign Securities Risk. The Fund may invest in securities of foreign issuers which may be U.S. dollar-denominated or denominated in foreign currencies. Investments in securities of foreign issuers involve risks which are in addition to the usual risks inherent in domestic investments. The value of
19
CONCORDE VALUE FUND
NOTES TO FINANCIAL STATEMENTS
Note 5 – Principal Risks (continued)
the Fund’s foreign investments may be significantly affected by changes in currency exchange rates, and the Fund may incur certain costs in converting securities denominated in foreign currencies to U.S. dollars. In many countries, there is less publicly available information about issuers than is available in the reports and ratings published about companies in the United States. Additionally, foreign companies are not subject to uniform accounting, auditing and financial reporting standards. Dividends and interest on foreign securities may be subject to foreign withholding taxes which would reduce the Fund’s income without providing a tax credit for the Fund’s shareholders. When the Fund invests in securities of foreign issuers, the Fund intends to invest in securities of foreign issuers domiciled in nations in which the Advisor considers as having stable and friendly governments, however, there is a possibility of expropriation, confiscatory taxation, currency blockage or political or social instability which could affect investments in those nations.
Small and Mid-Cap Company Risk. The Fund may invest in small and mid-capitalization companies that may not have the size, resources, and other assets of large capitalization companies. As a result, the securities of small and mid-capitalization companies held by the Fund may be subject to greater market risks and fluctuations in value than large capitalization companies, and fluctuations in the value of such securities may not correspond to changes in the stock market in general.
Liquidity Risk. Liquidity risk is the risk, due to certain investments trading in lower volumes or to market and economic conditions, that the Fund may be unable to find a buyer for its investments when it seeks to sell them or to receive the price it expects based on the Fund’s valuation of the investments. Events that may lead to increased redemptions, such as market disruptions, may also negatively impact the liquidity of the Fund’s investments when it needs to dispose of them. If the Fund is forced to sell its investments at an unfavorable time and/or under adverse conditions in order to meet redemption requests, such sales could negatively affect the Fund. Liquidity issues may also make it difficult to value the Fund’s investments.
Hedging Risk. By writing a call option, the Fund may incur the risk of lost opportunity if the price of the underlying security rises in value. If the Fund does not exercise or sell a put option it has purchased, such as a stock index put option, prior to the option’s expiration date, it will realize a loss in the amount of the entire premium paid plus commission cost. It is possible there may be times when a market for the Fund’s outstanding options does not exist
Investments in Other Investment Companies and ETFs Risk. Investments in other investment companies, including money market funds and ETFs, may involve duplication of certain fees and expenses. By investing in other investment companies, the Fund becomes a shareholder of that company. As a result, Fund shareholders indirectly bear their proportionate share of the other investment company’s fees and expenses which are paid by the Fund as a shareholder of the other investment company. These fees and expenses are in addition to the fees and expenses that Fund shareholders directly bear in connection with the Fund’s own operations. If the other investment
20
CONCORDE VALUE FUND
NOTES TO FINANCIAL STATEMENTS
Note 5 – Principal Risks (continued)
company fails to achieve its investment objective, the Fund’s investment in the other investment company may adversely affect the Fund’s performance. In addition, because ETFs are listed on national stock exchanges and are traded like stocks listed on an exchange, the Fund may acquire ETF shares at a discount or premium to their NAV.
Credit and Counterparty Risk. The Fund is exposed to credit risk to counterparties with whom it transacts with and also bears the risk of settlement default. The Fund may lose money if the issuer or guarantor of a fixed income security, or the counterparty to a derivative instrument contract is unable or unwilling to make timely principal and/or interest payments, or to otherwise honor its obligations. Securities are subject to varying degrees of credit risk, which are often reflected in credit ratings. The Fund minimizes concentration of credit risk by undertaking transactions with a diverse population of counterparties with a history of good credit quality.
REIT and Real Estate Risk. The Fund’s investments in REITs may subject the Fund to the following additional risks:
| o | declines in the value of real estate; | |
| o | changes in interest rates; | |
| o | lack of available mortgage funds or other limits on obtaining capital; | |
| o | overbuilding; | |
| o | extended vacancies of properties; | |
| o | increases in property taxes and operating expenses; | |
| o | changes in zoning laws and regulations; | |
| o | casualty or condemnation losses; and | |
| o | tax consequences of the failure of a REIT to comply with tax law requirements. |
The Fund will bear a proportionate share of the REIT’s on-going operating fees and expenses, which may include management, operating and administrative expenses in addition to the expenses of the Fund.
Note 6 – Investment Advisory Fees and Other Transactions with Affiliates
The Fund has an Investment Advisory Agreement (Advisory Agreement) with Concorde to act as the Fund’s investment advisor. Concorde provides the Fund with investment management and advisory services consistent with the Fund’s investment objectives, policies and restrictions, and supervises the purchase and sale of investment transactions on behalf of the Fund. For such services, Concorde receives an annual fee of 0.90% of the Fund’s average daily net assets, computed daily and paid on a monthly basis. The investment advisory fee was $41,055 for the six months ended March 31, 2016, of which $6,928 was payable at March 31, 2016. Certain officers and directors of the Company are also officers, directors and/or employees of Concorde.
The Fund has entered into an agreement with National Financial Services, LLC (NFS) in connection with the sale of shares of the Fund. The agreement provides for periodic payments by the
21
CONCORDE VALUE FUND
NOTES TO FINANCIAL STATEMENTS
Note 6 – Investment Advisory Fees and Other Transactions with Affiliates (continued)
Fund to NFS for providing certain shareholder maintenance services (sub transfer agent expenses). These shareholder services include the pre-processing and quality control of new accounts, shareholder correspondence, answering customer inquiries regarding account status, and facilitating shareholder telephone transactions. Fees paid by the Fund to NFS for the six months ended March 31, 2016 were $2,763.
Note 7 – Federal Tax Information
At September 30, 2015, the Fund’s most recent fiscal year end, the Fund’s investments and components of accumulated earnings (losses) on a tax basis were as follows:
| Cost of Investments | $ | 6,504,370 | |||
| Gross tax unrealized appreciation | 2,654,586 | ||||
| Gross tax unrealized depreciation | (278,911 | ) | |||
| Net tax unrealized appreciation | $ | 2,375,675 | |||
| Undistributed ordinary income | — | ||||
| Undistributed long-term gain | 517,115 | ||||
| Total distributable earnings | $ | 517,115 | |||
| Other accumulated losses | $ | (37,962 | ) | ||
| Net accumulated earnings | $ | 2,854,828 |
At September 30, 2015, the Fund’s most recent fiscal year end, the Fund had no tax basis capital loss carryovers to offset future capital gains. The Fund did not utilize a capital loss carryover during the year ended September 30, 2015. The Fund had $37,962 of late year loss deferrals and no post-October loss.
The tax character of distributions paid during the six months ended March 31, 2016 and year ended September 30, 2015 was as follows:
| Six Months Ended | |||
| March 31, 2016 | |||
(Unaudited) | September 30, 2015 | ||
| Ordinary income | $ — | $ — | |
| Long-term capital gain | $553,913 | $953,218 |
22
CONCORDE VALUE FUND
NOTES TO FINANCIAL STATEMENTS
Note 8 – Subsequent Events
Management has evaluated the Fund’s events and transactions that occurred subsequent to March 31, 2016 through the date of issuance of the Fund’s financial statements. The Company has called a special meeting of shareholders of the Concorde Value Fund to be held on or about June 30, 2016 in the offices of the Fund at 1000 Three Lincoln Centre, 5430 LBJ Freeway LB3, Dallas, Texas 75240-2650. The purpose of the meeting is to seek shareholder approval of a Plan of Acquisition and Liquidation under which the Concorde Value Fund would be reorganized into the Concorde Wealth Management Trust, a newly formed series of Concorde Funds, Inc. Concorde Financial Corporation is the investment advisor for both the Concorde Value Fund and the Concorde Wealth Management Trust. The proposed reorganization is not expected to have any adverse federal or state tax consequences to the Fund or its shareholders. The Company has filed a preliminary proxy statement/prospectus on Form N-14, which sets forth the proposed reorganization to be submitted to shareholders of the Fund. Shareholders of record as of May 31, 2016 will be sent a proxy statement/prospectus and may refer to it for a detailed explanation of the reorganization. Shareholders of the Fund are urged to read the definitive proxy statement/prospectus when it becomes available, because it will contain important information about the proposed reorganization.
23
BOARD APPROVAL OF CONTINUATION OF INVESTMENT ADVISORY AGREEMENT (Unaudited)
At its meeting held on November 16, 2015, the Board of Directors (the “Board”) of Concorde Funds, Inc. (the “Company”) including all the Directors who are not “interested persons” (as defined in the Investment Company Act of 1940) considered and then voted to re-approve the current investment advisory agreement (the “Advisory Agreement”) between Concorde Financial Corporation (the “Advisor”) and the Company, on behalf of the Concorde Value Fund (the “Fund”). In connection with its re-approval of the Advisory Agreement, the Board reviewed and discussed the specific services provided by the Advisor. The Board considered the following factors:
The Advisor:
| 1) | Provides daily investment management for the Concorde Value Fund. In providing investment management, Concorde Financial Corporation will oversee the trading of securities and the rebalancing of the portfolio. | |
| 2) | Retains the services of the Fund’s Chief Compliance Officer and will make all reasonable efforts to insure that the Fund is in compliance with the securities laws. | |
| 3) | Provide responsive customer and shareholder servicing which consists of responding to shareholder inquiries received, including specific mutual fund account information, in addition to calls directed to the transfer agent call center. | |
| 4) | Oversees distribution of the Fund through third-party broker/dealers and independent financial institutions. | |
| 5) | Oversees those third party service providers that support the Fund in providing fund accounting, fund administration, transfer agency and custodial services. |
The Board also: (i) compared the performance of the Fund to benchmark indices over various periods of time and concluded that the performance of the Fund, particularly on a risk-adjusted basis, warranted the continuation of the Advisory Agreement; (ii) compared the expense ratios of funds similar in asset size and investment objective to those of the Fund and concluded the expenses of the Fund were reasonable and warranted continuation of the Advisory Agreement; (iii) considered the fees charged by Concorde Financial Corporation to those of funds similar in asset size and investment objective to the Fund and concluded the advisory fees of the Fund were reasonable and warranted continuation of the Advisory Agreement; and (iv) considered the profitability of Concorde Financial Corporation with respect to the Fund, and concluded that the profits were reasonable and not excessive when compared to profitability guidelines set forth in relevant court cases.
The Board reviewed the Fund’s expense ratios and comparable expense ratios for similar funds. The Board used data from Lipper, as presented in the charts in the Board Materials, showing funds classified by Lipper as Multi-Cap Value Funds, similar in nature to the Concorde Value Fund. The Board determined that the total expense ratio of the Fund falls within the range of the ratios of other funds in the Multi-Cap Value classification. The Board also referenced Concorde Financial Corporation’s Form ADV and a copy of the current Investment Advisory Agreement. After further discussion and upon a motion duly made and seconded, the Directors, including a majority of Directors who are not “interested persons,” as defined by the 1940 Act, of the Corporation unanimously approved the Continuation of Investment Advisory Agreement.
24
ADDITIONAL INFORMATION (Unaudited)
PROXY VOTING POLICIES AND PROCEDURES
For a description of the policies and procedures that the Fund uses to determine how to vote proxies relating to the portfolio securities, please call (972) 701-5400 and request a Statement of Additional Information. One will be mailed to you free of charge. The Statement of Additional Information is also available on the website of the Securities and Exchange Commission at http://www.sec.gov.
PROXY VOTING RECORDS
Information on how the Fund voted proxies relating to portfolio securities during the most recent twelve month period ending June 30 is available without charge, upon request, by calling (972) 701-5400. Furthermore, you can obtain the Fund’s proxy voting records on the Securities and Exchange Commission’s website at http://www.sec.gov.
QUARTERLY FILINGS ON FORM N-Q
The Fund files its complete schedule of portfolio holdings with the Securities and Exchange Commission for the first and third quarters of each fiscal quarter on Form N-Q. The Fund’s Form N-Q is available (i) without charge, upon request, by calling (972) 701-5400, (ii) on the Securities and Exchange Commission’s website at http://www.sec.gov, or (iii) at the Securities and Exchange Commission’s public reference room
HOUSEHOLD DELIVERY OF SHAREHOLDER DOCUMENTS
In an effort to decrease costs, the Fund intends to reduce the number of duplicate prospectuses and Annual and Semi-Annual Reports you receive by sending only one copy of each to those addresses shared by two or more accounts and to shareholders we reasonably believe are from the same family or household. Once implemented, if you would like to discontinue householding for your accounts, please call toll-free at 1-800-294-1699 to request individual copies of these documents. One the Fund receives notice to stop householding, we will begin sending individual copies thirty days after receiving your request. This policy does not apply to account statements.
25
(This Page Intentionally Left Blank.)
INVESTMENT ADVISOR
Concorde Investment Management
1000 Three Lincoln Centre
5430 LBJ Freeway LB3
Dallas, Texas 75240
OFFICERS
Gary B. Wood, Ph.D.
President
Gregory B. Wood
Treasurer
John A. Stetter
Secretary
DIRECTORS
William Marcy, P.E., Ph.D.
John H. Wilson
Gary B. Wood, Ph.D.
CUSTODIAN
U.S. Bank, N.A.
Custody Operations
1555 North RiverCenter Drive, Suite 302
Milwaukee, Wisconsin 53212
TRANSFER AGENT AND
DIVIDEND DISBURSING AGENT
U.S. Bancorp Fund Services, LLC
Mutual Fund Services, 3rd Floor
615 East Michigan Street
Milwaukee, Wisconsin 53202
INDEPENDENT REGISTERED
PUBLIC ACCOUNTING FIRM
Brad A. Kinder, CPA
815 Parker Square
Flower Mound, Texas 75028
LEGAL COUNSEL
Foley & Lardner LLP
777 East Wisconsin Avenue
Milwaukee, Wisconsin 53202
TELEPHONE
(972) 701-5400
(Fund information)
(800) 294-1699
(Shareholder account information)
Item 2. Code of Ethics.
Not applicable for semi-annual reports.
Item 3. Audit Committee Financial Expert.
Not applicable for semi-annual reports.
Item 4. Principal Accountant Fees and Services.
Not applicable for semi-annual reports.
Item 5. Audit Committee of Listed Registrants.
Not applicable to registrants who are not listed issuers (as defined in Rule 10A-3 under the Securities Exchange Act of 1934).
(b) Not applicable.
Item 6. Investments.
| (a) | Schedule of Investments is included as part of the report to shareholders filed under Item 1 of this Form. |
(b) Not Applicable
Item 7. Disclosure of Proxy Voting Policies and Procedures for Closed-End Management Investment Companies.
Not applicable to open-end investment companies.
Item 8. Portfolio Managers of Closed-End Management Investment Companies.
Not applicable to open-end investment companies.
Item 9. Purchases of Equity Securities by Closed‑End Management Investment Company and Affiliated Purchasers.
Not applicable to open-end investment companies.
Item 10. Submission of Matters to a Vote of Security Holders.
Not Applicable.
Item 11. Controls and Procedures.
| (a) | The Registrant’s President and Treasurer have reviewed the Registrant's disclosure controls and procedures (as defined in Rule 30a-3(c) under the Investment Company Act of 1940 (the “Act”)) as of a date within 90 days of the filing of this report, as required by Rule 30a-3(b) under the Act and Rules 13a-15(b) or 15d‑15(b) under the Securities Exchange Act of 1934. Based on their review, such officers have concluded that the disclosure controls and procedures are effective in ensuring that information required to be disclosed in this report is appropriately recorded, processed, summarized and reported and made known to them by others within the Registrant and by the Registrant’s service provider. |
| (b) | There were no changes in the Registrant's internal control over financial reporting (as defined in Rule 30a-3(d) under the Act) that occurred during the second fiscal quarter of the period covered by this report that has materially affected, or is reasonably likely to materially affect, the Registrant's internal control over financial reporting. |
Item 12. Exhibits.
| (a) | (1) Any code of ethics or amendment thereto, that is the subject of the disclosure required by Item 2, to the extent that the registrant intends to satisfy Item 2 requirements through filing an exhibit. Not Applicable for semi-annual reports. |
(2) A separate certification for each principal executive officer and principal financial officer pursuant to Section 302 of the Sarbanes-Oxley Act of 2002. Filed herewith.
(3) Any written solicitation to purchase securities under Rule 23c‑1 under the Act sent or given during the period covered by the report by or on behalf of the registrant to 10 or more persons. Not applicable to open-end investment companies.
| (b) | Certifications pursuant to Section 906 of the Sarbanes‑Oxley Act of 2002. Furnished herewith. |
SIGNATURES
Pursuant to the requirements of the Securities Exchange Act of 1934 and the Investment Company Act of 1940, the registrant has duly caused this report to be signed on its behalf by the undersigned, thereunto duly authorized.
(Registrant) Concorde Funds, Inc.
By (Signature and Title)* /s/Gary B. Wood
Gary B. Wood, President
Date June 9, 2016
Pursuant to the requirements of the Securities Exchange Act of 1934 and the Investment Company Act of 1940, this report has been signed below by the following persons on behalf of the registrant and in the capacities and on the dates indicated.
By (Signature and Title)* /s/Gary B. Wood
Gary B. Wood, President
Date June 9, 2016
By (Signature and Title)* /s/Gregory B. Wood
Gregory B. Wood, Treasurer
Date June 9, 2016
* Print the name and title of each signing officer under his or her signature.