As filed with the Securities and Exchange Commission on June 7, 2013
UNITED STATES
SECURITIES AND EXCHANGE COMMISSION
Washington, D.C. 20549
FORM N-CSR
CERTIFIED SHAREHOLDER REPORT OF REGISTERED
MANAGEMENT INVESTMENT COMPANIES
Investment Company Act file number (811-05339)
Concorde Funds, Inc.
(Exact name of registrant as specified in charter)
1000 Three Lincoln Centre
5430 LBJ Freeway LB3
Dallas, TX 75240-2650
(Address of principal executive offices) (Zip code)
Gary B. Wood
1000 Three Lincoln Centre, 5430 LBJ Freeway LB3, Dallas, TX 75240-2650
(Name and address of agent for service)
(972)-701-5400
Registrant's telephone number, including area code
Date of fiscal year end: 09/30/2013
Date of reporting period: 03/31/2013
Item 1. Reports to Stockholders.
A NO-LOAD
MUTUAL FUND
SEMI-ANNUAL REPORT
Dated March 31, 2013
May 15, 2013
Dear Shareholders,
We are pleased to present the Semi-Annual report of Concorde Funds, Inc. for the six month period ending March 31, 2013.
Concorde Value Fund
Concorde Value Fund, managed by Concorde Investment Management, extended the gains which began four years ago at the bottom of the 2007-2009 bear market and generated a net return of 7.34% for the first half of the fiscal year ending March 31, 2013. This performance lagged most major indices as cash holdings, significant positions in the underperforming energy and technology sectors and poor results among some individual holdings hindered relative performance. The nature of our concentrated portfolio tends to produce results which do not track diversified indices for some shorter time periods. The individual performance of holdings in the Fund varied dramatically for such a short time period. In addition, many holdings have recently increased their dividend rates — which indicates excellent long term prospects — including several positions which have incurred relatively poor short term performance.
| | Six Months Ended* | Annualized | Annualized | Annualized |
| | 03/31/2013 | 1 Year Ending* | 5 Years Ending* | 10 Years Ending* |
| | (Unaudited) | 03/31/2013 | 03/31/2013 | 03/31/2013 |
| Concorde Value Fund | 7.34% | 9.47% | -0.78% | 4.60% |
| Russell 3000 Value Total Return | 14.11% | 18.71% | 5.05% | 9.33% |
| S&P 500 | 10.19% | 13.96% | 5.81% | 8.53% |
| Russell 2000 | 14.48% | 16.30% | 8.24% | 11.52% |
| Lipper Multi-Cap Value | 14.88% | 16.34% | 4.88% | 8.40% |
| Wilshire 4500 | 16.40% | 16.67% | 8.74% | 12.39% |
| NASDAQ | 4.81% | 5.62% | 7.77% | 9.64% |
* Source – Morningstar, Inc.; US Bancorp Fund Services, LLC
Among the sectors which provided superior results for the period include consumer cyclical, consumer defensive, financial services and industrials. Among the consumer cyclicals, the second largest industry position at period end, Fortune Brands Home & Security, Hanesbrands and Lowe’s Companies all had positive returns greater than 25%. Fortune Brands and Lowe’s are participating in the strengthening residential real estate market and Hanesbrands continues to show steady growth while utilizing cash flow to deleverage, which the market is beginning to appreciate. Titan International, Walt Disney Co., and Viacom contributed smaller gains. Titan is expanding internationally, particularly in their agricultural and mining segments. Disney and Viacom are benefitting from the firming advertising markets in the U.S. and we believe that Viacom, in particular, has meaningful upside as it has lagged because of some recent weakness in audience for several of their key cable channels. AB Inbev and General Mills were the best performing stocks among
consumer defensives as their businesses grew steadily and large cap international leaders continued to be attractive to new investors. Dole Food Company, a new fund holding, dropped modestly from our original entry price. We believe Dole, which just announced the sale of a large portion of the operating business, is significantly undervalued based on the remaining fresh food operations and some additional non-operating real estate and other assets.
The three sectors which contributed the least on a relative basis for the first half were basic materials, energy and technology. Potash Corporation of Saskatchewan is a long time fund investment and the only basic materials holding. The stock dropped modestly during the past two quarters as uncertainty regarding pricing for potash worldwide for 2013 weighed on the market price along with concern over the outcome of some longer term contracts. Within the energy sector, all holdings fell during the last quarter of 2012 except for ConocoPhillips. The relatively small holding of Poseidon Concepts, a Canadian oil service tank manufacturer, fell 90% subsequent to the declaration that management had not disclosed promptly the non-compliance with long term contracts with many customers as business slowed. Legal expenses will likely overwhelm the business and we have exited the position. Devon Energy, Exxon Mobil and Kinder Morgan all rose during the first quarter after falling at the end of 2012. Among technology holdings, EMC Corporation and Microsoft both fell in the fourth quarter, with Microsoft rallying in early 2013. EMC in particular, has reported lackluster results recently and appears to have significant headwinds for the balance of this year. We have reduced this position. Oracle Corporation, the remaining tech holding, produced a net gain for the first half after moving up during late 2012 and then pulling back.
The remaining holdings are in three industry groups which generated gains consistently through the six month period. These included financial services, healthcare, and industrials. All three holdings in financial services are in the insurance industry, including new holding American International Group. AIG has been reconfiguring itself significantly since the credit crisis and is close to shrinking back to two core businesses. The property & casualty and life & annuity businesses are both leaders in their respective segments and combined are valued in the market at a significant discount to peers. The company is positioned to resume a normal profile after the Treasury ownership has been disposed of and other large assets such as the Asian insurance and aircraft leasing business have either been sold or under contract to do so. Travelers Companies continues to ride the rebound in commercial and personal property & casualty markets. Any increase in either inflation or interest rates will enhance results. Aon PLC, a large international commercial insurance broker and employee benefits consultant is reporting good business results and the large cash flow generation is becoming recognized. Aon is also benefitting from major contracts to help develop corporate healthcare exchanges spurred by new legislation.
In the healthcare segment performance results were quite varied. Quest Diagnostics stock dropped modestly during the period as reported results struggled versus expectations but still included excellent cash flow and prospects in the near future. We believe the stock trades at a discount to intrinsic value and continue to hold while receiving a good dividend. HCA Holdings performed best in the group as results have been good and future growth prospects appear promising. Abbott Laboratories was sold after approaching our targets as the company split into two distinct business lines on January 1. Johnson & Johnson and Agilent Technologies both rose as reported earnings were on track in businesses that should thrive in the current environment.
Among the industrial holdings, Deere & Co lagged performance of the sector and our other holdings as the stock digested recent gains and some concerns surfaced over longer term agricultural demand. We have taken profits over recent years as the price has risen, but still believe the long term trend is sustainable. Union Pacific Corp, United Parcel Service and Waste Management all rose significantly (approximately 20%) during the fiscal first half. Union Pacific and Waste Management both benefitted from a recovering domestic economy. Union Pacific has gotten an extra boost from the resurging domestic energy expansion and Waste Management is beginning to see modest additional demand related to the stabilization in the residential and commercial construction markets. UPS stock exceeded the broad market indices as shipping volumes continue to increase worldwide and they are outperforming their principal competitor in many industry metrics.
A good indicator of both current and future prospects is often dividend policy for the boards of companies that elect to allocate a portion of the capital in that direction. During the past year the following fund holdings have increased their annualized dividend rate: Agilent Technologies (initiated 2012/increased 2013), AON, AB Inbev, Canadian Oil Sands, Deere & Co., Quest Diagnostics, Walt Disney Co., Devon Energy, Fortune Brands Home & Security (initiated 2013), General Mills, Hanesbrands (initiated 2013), HCA (paid multiple special dividends in 2012), Johnson & Johnson, Kinder Morgan, Lowe’s Companies, Microsoft, Potash Corp. (2 increases), Travelers Companies, Union Pacific, UPS, Waste Management and Exxon Mobil.
In summary, the fund continues to be positioned partially as defensive and partially with the assumption that the US and global economy could accelerate growth and thereby justify recent market gains. Dividend paying stocks, and those with defensive characteristics relative to a slower economy, have done well in recent months as many investors have been wary of the complex and unsettling issues such as global slowing and excess, but ever increasing, domestic debt. Stocks with cyclical sensitivities to a growing economy, such as technology, have been less impressive, but would quickly respond to significantly improving economic news. Given the dramatic uncertainties in the near term, the fund will remain diversified in its holdings , not only in terms of specific industry sectors, but also in terms of holdings that will perform in either a growth or weaker economic environment. In any event, the companies in which the fund invests meet standards for strong financial balance sheets, top executive management leadership and excellent long term performance expectations.
Thank you for your continued support. We will continue to strive for the highest professional standards of performance and stewardship in the management of the Value Fund.
| | Best regards, |
| |  |
| | Gary B. Wood, Ph.D. |
| | President |
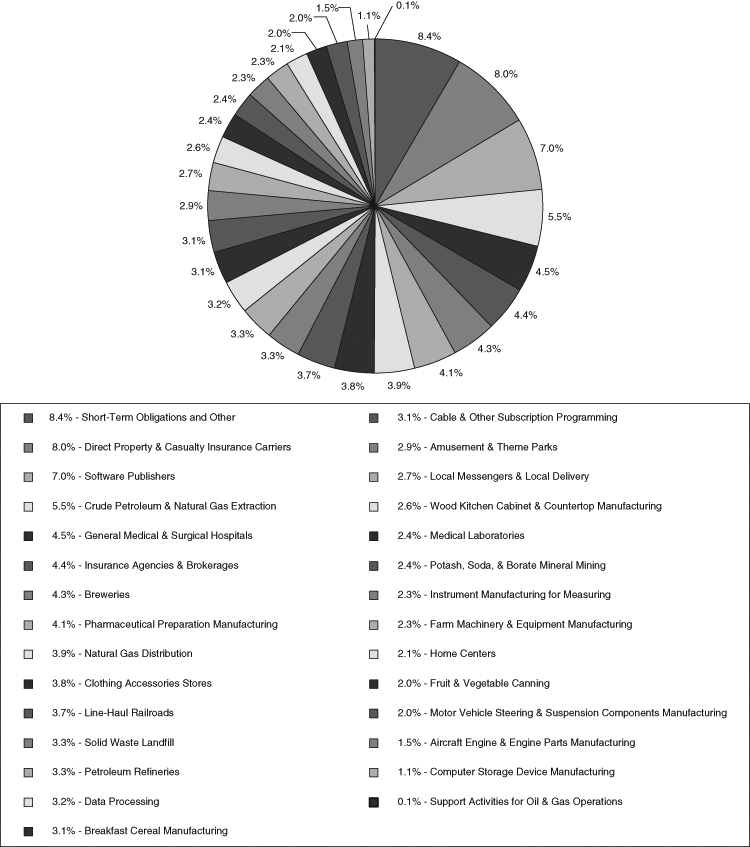
CONCORDE VALUE FUND
PORTFOLIO HOLDINGS BY SECTOR
March 31, 2013 (Unaudited)
The portfolio’s holdings and allocations are subject to change. The percentages are of net assets as of March 31, 2013.
FUND EXPENSES (Unaudited)
As a shareholder of the FUND, you incur two types of costs: (1) transaction costs and exchange fees; and (2) ongoing costs, including management fees and other FUND expenses. This Example is intended to help you understand your ongoing costs (in dollars) of investing in the FUND and to compare these costs with the ongoing costs of investing in other mutual funds.
The Example is based on an investment of $1,000 invested at the beginning of the period and held for the entire six month period ended March 31, 2013.
Actual Expenses
The first line of the table below provides information about actual account values and actual expenses. You may use the information in this line, together with the amount you invested, to estimate the expenses that you paid over the period. Simply divide your account value by $1,000 (for example, an $8,600 account value divided by $1,000 = 8.6), then multiply the result by the number in the first line under the heading entitled “Expenses Paid During Period” to estimate the expenses you paid on your account during this period.
Hypothetical Example for Comparison Purposes
The second line of the table below provides information about hypothetical account values and hypothetical expenses based on the FUND’s actual expense ratio and an assumed rate of return of 5% per year before expenses, which is not the FUND’s actual return. The hypothetical account values and expenses may not be used to estimate the actual ending account balance or expenses you paid for the period. You may use this information to compare the ongoing costs of investing in the FUND and other funds. To do so, compare this 5% hypothetical example with the 5% hypothetical examples that appear in the shareholder reports of the other funds.
Please note that the expenses shown in the table are meant to highlight your ongoing costs only and do not reflect any transactional costs or exchange fees. While the FUND does not currently assess sales charges, redemption or exchange fees, other funds do, and those costs will not be reflected in their expense tables. Therefore, the second line of the table is useful in comparing ongoing costs only, and will not help you determine the relative total costs of owning different funds.
| | Beginning Account | Ending Account | Expenses Paid During Period* – |
| | Value – 10/1/12 | Value – 3/31/13 | Six Months Ended 3/31/13 |
| Actual | $1,000.00 | $1,073.40 | $10.96 |
| Hypothetical (5% return before expenses) | $1,000.00 | $1,014.36 | $10.65 |
______________
| * | Expenses are equal to the FUND’s annualized expense ratio of 2.12%, multiplied by the average account value over the period, multiplied by 182/365 (to reflect the one-half year period ended March 31, 2013). |
CONCORDE VALUE FUND
SCHEDULE OF INVESTMENTS IN SECURITIES
March 31, 2013 (Unaudited)
| | | | | | Fair | | | Percent of | |
| | | Shares | | | Value | | | Net Assets | |
| COMMON STOCKS - 90.10% | | | | | | | | | |
| AMUSEMENT & THEME PARKS | | | | | | | | | |
| The Walt Disney Co. | | | 5,500 | | | $ | 312,400 | | | | 2.89 | % |
| BREAKFAST CEREAL MANUFACTURING | | | | | | | | | | | | |
| General Mills, Inc. | | | 6,800 | | | | 335,308 | | | | 3.11 | |
| BREWERIES | | | | | | | | | | | | |
| Anheuser Busch InBev NV - ADR (b) | | | 4,700 | | | | 467,885 | | | | 4.33 | |
| CABLE & OTHER SUBSCRIPTION PROGRAMMING | | | | | | | | | | | | |
| Viacom, Inc. | | | 5,500 | | | | 338,635 | | | | 3.14 | |
| CLOTHING ACCESSORIES STORES | | | | | | | | | | | | |
| Hanesbrands, Inc. (a) | | | 9,000 | | | | 410,040 | | | | 3.80 | |
| COMPUTER STORAGE DEVICE MANUFACTURING | | | | | | | | | | | | |
| EMC Corp. (a) | | | 5,000 | | | | 119,450 | | | | 1.11 | |
| CRUDE PETROLEUM & NATURAL GAS EXTRACTION | | | | | | | | | | | | |
| Canadian Oil Sands Ltd. (c) | | | 9,500 | | | | 195,795 | | | | 1.81 | |
| Devon Energy Corp. | | | 7,000 | | | | 394,940 | | | | 3.66 | |
| | | | | | | | 590,735 | | | | 5.47 | |
| DATA PROCESSING | | | | | | | | | | | | |
| Fiserv, Inc. (a) | | | 4,000 | | | | 351,320 | | | | 3.25 | |
| DIRECT PROPERTY & CASUALTY | | �� | | | | | | | | | | |
| INSURANCE CARRIERS | | | | | | | | | | | | |
| American International Group, Inc. (a) | | | 11,000 | | | | 427,020 | | | | 3.96 | |
| Travelers Companies, Inc. | | | 5,200 | | | | 437,788 | | | | 4.05 | |
| | | | | | | | 864,808 | | | | 8.01 | |
| FARM MACHINERY & EQUIPMENT MANUFACTURING | | | | | | | | | | | | |
| Deere & Co. | | | 2,900 | | | | 249,342 | | | | 2.31 | |
| FRUIT & VEGETABLE CANNING | | | | | | | | | | | | |
| Dole Food Company, Inc. (a) | | | 20,000 | | | | 218,000 | | | | 2.02 | |
| GENERAL MEDICAL & SURGICAL HOSPITALS | | | | | | | | | | | | |
| HCA Holdings, Inc. | | | 12,000 | | | | 487,560 | | | | 4.52 | |
| HOME CENTERS | | | | | | | | | | | | |
| Lowe’s Companies, Inc. | | | 6,000 | | | | 227,520 | | | | 2.11 | |
| INSTRUMENT MANUFACTURING FOR MEASURING | | | | | | | | | | | | |
| Agilent Technologies, Inc. | | | 6,000 | | | | 251,820 | | | | 2.33 | |
| INSURANCE AGENCIES & BROKERAGES | | | | | | | | | | | | |
| Aon Corp. (c) | | | 7,700 | | | | 473,550 | | | | 4.39 | |
The accompanying notes are an integral part of these financial statements.
CONCORDE VALUE FUND
SCHEDULE OF INVESTMENTS IN SECURITIES (continued)
March 31, 2013 (Unaudited)
| | | | | | Fair | | | Percent of | |
| | | Shares | | | Value | | | Net Assets | |
| COMMON STOCKS (continued) | | | | | | | | | |
| LINE-HAUL RAILROADS | | | | | | | | | |
| Union Pacific Corp. | | | 2,800 | | | $ | 398,748 | | | | 3.69 | % |
| LOCAL MESSENGERS & LOCAL DELIVERY | | | | | | | | | | | | |
| United Parcel Service, Inc. | | | 3,400 | | | | 292,060 | | | | 2.71 | |
| MEDICAL LABORATORIES | | | | | | | | | | | | |
| Quest Diagnostics, Inc. | | | 4,500 | | | | 254,025 | | | | 2.35 | |
| MOTOR VEHICLE STEERING & SUSPENSION | | | | | | | | | | | | |
| COMPONENTS MANUFACTURING | | | | | | | | | | | | |
| Titan International, Inc. | | | 10,000 | | | | 210,800 | | | | 1.95 | |
| NATURAL GAS DISTRIBUTION | | | | | | | | | | | | |
| Kinder Morgan, Inc. | | | 11,000 | | | | 425,480 | | | | 3.94 | |
| PETROLEUM REFINERIES | | | | | | | | | | | | |
| ConocoPhillips | | | 3,500 | | | | 210,350 | | | | 1.94 | |
| Exxon Mobil Corp. | | | 1,600 | | | | 144,176 | | | | 1.34 | |
| | | | | | | | 354,526 | | | | 3.28 | |
| PHARMACEUTICAL PREPARATION MANUFACTURING | | | | | | | | | | | | |
| Johnson & Johnson | | | 5,500 | | | | 448,415 | | | | 4.15 | |
| POTASH, SODA, & BORATE MINERAL MINING | | | | | | | | | | | | |
| Potash Corp. Saskatchewan - ADR (b) | | | 6,500 | | | | 255,125 | | | | 2.36 | |
| SOFTWARE PUBLISHERS | | | | | | | | | | | | |
| Microsoft Corp. | | | 15,500 | | | | 443,455 | | | | 4.11 | |
| Oracle Corp. | | | 9,600 | | | | 310,464 | | | | 2.87 | |
| | | | | | | | 753,919 | | | | 6.98 | |
| SOLID WASTE LANDFILL | | | | | | | | | | | | |
| Waste Management, Inc. | | | 9,000 | | | | 352,890 | | | | 3.27 | |
| SUPPORT ACTIVITIES FOR OIL & GAS OPERATIONS | | | | | | | | | | | | |
| Poseidon Concepts Corp. (c) | | | 19,500 | | | | 2,925 | | | | 0.03 | |
| WOOD KITCHEN CABINET & | | | | | | | | | | | | |
| COUNTERTOP MANUFACTURING | | | | | | | | | | | | |
| Fortune Brands Home & Security, Inc. (a) | | | 7,500 | | | | 280,725 | | | | 2.60 | |
| TOTAL COMMON STOCKS (Cost $6,295,120) | | | | | | | 9,728,011 | | | | 90.10 | |
| | | | | | | | | | | | | |
| PREFERRED STOCK - 1.50% | | | | | | | | | | | | |
| AIRCRAFT ENGINE & ENGINE | | | | | | | | | | | | |
| PARTS MANUFACTURING | | | | | | | | | | | | |
| United Technologies Corp., 7.50%, 08/01/2015 | | | 2,700 | | | | 161,595 | | | | 1.50 | |
| TOTAL PREFERRED STOCKS (Cost $160,457) | | | | | | | 161,595 | | | | 1.50 | |
The accompanying notes are an integral part of these financial statements.
CONCORDE VALUE FUND
SCHEDULE OF INVESTMENTS IN SECURITIES (continued)
March 31, 2013 (Unaudited)
| | | | | | Fair | | | Percent of | |
| | | Shares | | | Value | | | Net Assets | |
| SHORT-TERM INVESTMENTS - 8.63% | | | | | | | | | |
| Fidelity Institutional Money Market - | | | | | | | | | |
| Select Class, 0.05% (d) | | | 400,000 | | | $ | 400,000 | | | | 3.70 | % |
| First American Prime Obligations Fund - Class Y, 0.00% (d) | | | 132,251 | | | | 132,251 | | | | 1.23 | |
| The STIC Prime Portfolio - Institutional Class, 0.09% (d) | | | 400,000 | | | | 400,000 | | | | 3.70 | |
| TOTAL SHORT-TERM INVESTMENTS | | | | | | | | | | | | |
| (Cost $932,251) | | | | | | | 932,251 | | | | 8.63 | |
| Total Investments (Cost $7,387,828) - 100.23% | | | | | | | 10,821,857 | | | | 100.23 | |
| Liabilities in Excess of Other Assets - (0.23)% | | | | | | | (25,000 | ) | | | (0.23 | ) |
| TOTAL NET ASSETS - 100.00% | | | | | | $ | 10,796,857 | | | | 100.00 | % |
______________
Notes:
ADR American Depository Receipt
| (a) | Presently non-income producing. |
| (b) | Foreign issued security listed directly on a U.S. securities exchange. |
| (c) | Foreign issued security traded over-the-counter in the U.S. |
| (d) | Rate shown is the 7-day yield as of March 31, 2013. |
The accompanying notes are an integral part of these financial statements.
CONCORDE VALUE FUND
STATEMENT OF ASSETS AND LIABILITIES
March 31, 2013 (Unaudited)
| ASSETS | | | |
| Investments in securities, at fair value (cost $7,387,828) | | $ | 10,821,857 | |
| Cash | | | 3,792 | |
| Receivables | | | | |
| Dividends | | | 8,512 | |
| Interest | | | 52 | |
| Prepaid expense | | | 2,773 | |
| Other asset | | | 3,347 | |
| TOTAL ASSETS | | | 10,840,333 | |
| LIABILITIES | | | | |
| Investment advisory fee payable | | | 8,294 | |
| Accrued expenses | | | 35,182 | |
| TOTAL LIABILITIES | | | 43,476 | |
| NET ASSETS | | $ | 10,796,857 | |
| Composition of Net Assets: | | | | |
| Net capital paid in on shares of capital stock | | $ | 8,723,433 | |
| Accumulated net investment income | | | 40,235 | |
| Accumulated net realized loss | | | (1,400,840 | ) |
| Net unrealized appreciation | | | 3,434,029 | |
| NET ASSETS | | $ | 10,796,857 | |
| Capital shares outstanding | | | 816,494 | |
| | | | | |
| Net asset value, offering price and redemption price per share | | $ | 13.22 | |
The accompanying notes are an integral part of these financial statements.
CONCORDE VALUE FUND
STATEMENT OF OPERATIONS
For the Six Month Period Ended March 31, 2013 (Unaudited)
| Investment income | | | |
| Dividends (net of foreign withholding taxes of $2,128) | | $ | 152,739 | |
| Interest | | | 313 | |
| Total investment income | | | 153,052 | |
| Expenses | | | | |
| Investment advisory fees (Note 5) | | | 47,934 | |
| Administration fees | | | 19,070 | |
| Fund accounting fees | | | 13,614 | |
| Professional fees | | | 10,100 | |
| Transfer agent fees | | | 8,503 | |
| Printing, postage and delivery | | | 5,510 | |
| Other expenses | | | 4,913 | |
| Custodian fees | | | 1,345 | |
| Directors fees | | | 1,122 | |
| Federal and state registration fees | | | 706 | |
| Total expenses | | | 112,817 | |
| NET INVESTMENT INCOME | | | 40,235 | |
| REALIZED AND UNREALIZED | | | | |
| GAIN FROM INVESTMENTS | | | | |
| Net realized gain from investments in securities | | | 383,656 | |
| Net increase in unrealized appreciation | | | | |
| on investments in securities | | | 332,512 | |
| NET REALIZED AND UNREALIZED GAIN FROM INVESTMENTS | | | 716,168 | |
| NET INCREASE IN NET ASSETS RESULTING FROM OPERATIONS | | $ | 756,403 | |
The accompanying notes are an integral part of these financial statements.
CONCORDE VALUE FUND
STATEMENTS OF CHANGES IN NET ASSETS
| | | Six Months Ended | | | | |
| | | March 31, 2012 | | | Year Ended | |
| | | (Unaudited) | | | Sept. 30, 2012 | |
| INCREASE IN NET ASSETS FROM OPERATIONS | | | | | | |
| Net investment income | | $ | 40,235 | | | $ | 20,361 | |
| Net realized gain (loss) from investments | | | 383,656 | | | | (12,359 | ) |
| Net unrealized appreciation on investments | | | 332,512 | | | | 2,179,786 | |
| Net increase in net assets resulting from operations | | | 756,403 | | | | 2,187,788 | |
| DISTRIBUTIONS TO SHAREHOLDERS FROM | | | | | | | | |
| Net investment income | | | (20,358 | ) | | | — | |
| Total distributions to shareholders | | | (20,358 | ) | | | — | |
| CAPITAL SHARE TRANSACTIONS – NET (Note 3) | | | (966,620 | ) | | | (491,112 | ) |
| Total increase (decrease) in net assets | | | (230,575 | ) | | | 1,696,676 | |
| NET ASSETS | | | | | | | | |
| Beginning of year | | | 11,027,432 | | | | 9,330,756 | |
| End of year (including accumulated net investment | | | | | | | | |
| income of $40,235 and $20,358 respectively) | | $ | 10,796,857 | | | $ | 11,027,432 | |
The accompanying notes are an integral part of these financial statements.
CONCORDE VALUE FUND
FINANCIAL HIGHLIGHTS
| | | Six Months | | | | | | | | | | | | | | | | |
| | | Ended | | | | | | | | | | | | | | | | |
| | | March 31, | | | | | | | | | | | | | | | | |
| | | 2013(2) | | | Year Ended September 30, | |
| | | (Unaudited) | | | 2012 | | | 2011 | | | 2010 | | | 2009 | | | 2008 | |
PER SHARE DATA(1): | | | | | | | | | | | | | | | | | | |
| Net asset value, beginning of period | | $ | 12.34 | | | $ | 9.97 | | | $ | 10.65 | | | $ | 9.98 | | | $ | 12.74 | | | $ | 18.39 | |
| Income (loss) from investment operations: | | | | | | | | | | | | | | | | | | | | | | | | |
| Net investment income (loss) | | | 0.05 | | | | 0.02 | | | | (0.03 | ) | | | (0.03 | ) | | | (0.02 | ) | | | 0.01 | |
| Net realized and unrealized gain (loss) | | | | | | | | | | | | | | | | | | | | | | | | |
| on investments | | | 0.85 | | | | 2.35 | | | | (0.65 | ) | | | 0.70 | | | | (2.14 | ) | | | (3.88 | ) |
| Total income (loss) from | | | | | | | | | | | | | | | | | | | | | | | | |
| investment operations | | | 0.9 | | | | 2.37 | | | | (0.68 | ) | | | 0.67 | | | | (2.16 | ) | | | (3.87 | ) |
| Less distributions: | | | | | | | | | | | | | | | | | | | | | | | | |
| Distributions from | | | | | | | | | | | | | | | | | | | | | | | | |
| net investment income | | | (0.02 | ) | | | — | | | | — | | | | — | | | | — | | | | — | |
| Distributions from net realized gains | | | — | | | | — | | | | — | | | | — | | | | (0.60 | ) | | | (1.78 | ) |
| Total distributions | | | (0.02 | ) | | | — | | | | — | | | | — | | | | (0.60 | ) | | | (1.78 | ) |
| Net asset value, end of period | | $ | 13.22 | | | $ | 12.34 | | | $ | 9.97 | | | $ | 10.65 | | | $ | 9.98 | | | $ | 12.74 | |
| TOTAL RETURN | | | 7.34% | | | | 23.77% | | | | (6.38% | ) | | | 6.71% | | | | (16.40% | ) | | | (22.98% | ) |
| RATIOS/SUPPLEMENTAL DATA: | | | | | | | | | | | | | | | | | | | | | | | | |
| Net assets, | | | | | | | | | | | | | | | | | | | | | | | | |
| end of period (in thousands) | | $ | 10,797 | | | $ | 11,027 | | | $ | 9,331 | | | $ | 10,495 | | | $ | 12,487 | | | $ | 14,115 | |
| Ratio of expenses to average net assets | | | 2.12% | | | | 2.12% | | | | 2.07% | | | | 2.02% | | | | 2.00% | | | | 1.62% | |
| Ratio of net investment income (loss) | | | | | | | | | | | | | | | | | | | | | | | | |
| to average net assets | | | 0.76% | | | | 0.19% | | | | (0.24% | ) | | | (0.32% | ) | | | (0.24% | ) | | | 0.03% | |
| Portfolio turnover rate | | | 16% | | | | 19% | | | | 37% | | | | 33% | | | | 51% | | | | 34% | |
______________
| (1) | Per share information has been calculated using the average number of shares outstanding. |
| (2) | Other than the ratios of expenses and net investment income (loss) to average net assets, financial highlights have not been annualized |
The accompanying notes are an integral part of these financial highlights.
CONCORDE VALUE FUND
NOTES TO FINANCIAL STATEMENTS
Note 1 – Nature of Business and Summary of Significant Accounting Policies
NATURE OF BUSINESS
Concorde Value Fund (Fund) is a separate series of shares of common stock of Concorde Funds, Inc. (Company). The Company was incorporated in the state of Texas in September of 1987, and is registered under the Investment Company Act of 1940, as amended, as a diversified, open-end management investment company. The Fund is subject to various investment restrictions as set forth in the Statement of Additional Information. The effective date of the Fund’s Registration Statement under the Securities Act of 1933 was December 4, 1987. The primary investment objective of the Fund is to produce long-term growth of capital. The Company may designate one or more series of common stock. The Company presently has no series other than the Fund. Each capital share in the Fund represents an equal, proportionate interest in the net assets of the Fund with each other capital share in such series and no interest in any other series.
SIGNIFICANT ACCOUNTING POLICIES
The following is a summary of significant accounting policies followed by the Fund in the preparation of its financial statements. These policies are in conformity with accounting principles generally accepted in the United States.
VALUATION OF SECURITIES
All investments in securities are recorded on their estimated fair value, as described in note 2.
FEDERAL INCOME TAXES
The Fund’s policy is to continue to qualify as a regulated investment company under Subchapter M of the Internal Revenue Code of 1986, as amended, by distributing substantially all of its net investment income and net realized capital gains to its shareholders. The Fund also intends to distribute sufficient net investment income and net realized capital gains, if any, so that it will not be subject to excise tax on undistributed investment income and capital gains. Therefore, no federal income or excise tax provision is required.
Net investment income (loss), net realized gains (losses) and the cost of investments in securities may differ for financial statement and income tax purposes. The character of distributions from net investment income or net realized gains may differ from their ultimate characterization for income tax purposes. Accounting principles generally accepted in the United States of America require that certain components of net assets relating to permanent differences be reclassified between financial and tax reporting. For the year ended September 30, 2012, the Fund decreased accumulated net investment income by $3, and decreases undistributed net realized loss by $3. These reclassifications have no effect on net assets, results of operations or net asset value per share. The permanent differences primarily relate to foreign currency reclassifications. Also, due to the timing of dividend distributions, the fiscal year in which amounts are distributed may differ from the year that the income or realized gains were recorded by the Fund.
CONCORDE VALUE FUND
NOTES TO FINANCIAL STATEMENTS
Note 1 – Nature of Business and Summary of Significant Accounting Policies (continued)
FEDERAL INCOME TAXES (CONTINUED)
The Fund has adopted financial reporting rules regarding recognition and measurement of tax positions taken or expected to be taken on a tax return. The Fund has reviewed all open tax years and major jurisdictions and concluded that there is no impact on the Fund’s net assets and no tax liability resulting from unrecognized tax benefits relating to uncertain income tax positions taken or expected to be taken on a tax return. As of March 31, 2013, open Federal tax years include the tax year ended September 30, 2010 through 2012.
SECURITY TRANSACTIONS AND RELATED INCOME
Security transactions are accounted for on the date the securities are purchased or sold. Realized gains and losses from securities transactions are reported on an identified cost basis. Dividend income is recognized on the ex-dividend date, and interest income is recognized on the accrual basis. Discounts and premiums on securities purchased are amortized, over the life of the respective securities.
DIVIDENDS AND DISTRIBUTIONS
Distributions to shareholders, which are determined in accordance of income tax regulations, are recorded on the ex-date. The Fund intends to distribute substantially all of its net investment income as dividends to its shareholders on an annual basis. The Fund intends to distribute substantially all of its net realized long-term capital gains and its net realized short-term capital gains at least once a year. The treatment for financial reporting purposes of distributions made to shareholders during the year from net investment income or net realized capital gains may differ from their ultimate treatment for federal tax purposes. These differences are caused primarily by differences in the timing of the recognition of certain components of income, expense or realized capital gain for federal income tax purposes. Where such differences are permanent in nature, they are reclassified in the components of the net assets based on their ultimate characterization for federal income tax purposes. Any such reclassifications will have no effect on net assets, results of operations or net assets values per share.
USE OF ESTIMATES
The preparation of financial statements in conformity with generally accepted accounting principles requires management to make estimates and assumptions that affect the reported amounts of the assets and liabilities and disclosure of contingent assets and liabilities at the date of the financial statements and the reported amounts of increases and decreases in net assets from operations during the reporting period. Actual results could differ from those estimates.
OPTION WRITING
When the Fund writes an option, an amount equal to the premium received by the Fund is recorded as a liability and is subsequently adjusted to the current fair value of the option written. The Fund treats premiums received from writing options that expire unexercised on the expiration date as realized gains
CONCORDE VALUE FUND
NOTES TO FINANCIAL STATEMENTS
Note 1 – Nature of Business and Summary of Significant Accounting Policies (continued)
OPTION WRITING (continued)
from investments. The difference between the premium and the amount paid on effecting a closing purchase transaction, including brokerage commissions, is also treated as a realized gain, or, if the premium is less than the amount paid for the closing purchase transaction, as a realized loss. If a call option is exercised, the premium is added to the proceeds from the sale of the underlying security or currency in determining whether the Fund has realized a gain or loss. The Fund as writer of an option bears the market risk of an unfavorable change in the price of the security underlying the written option.
DERIVATIVES
The Fund has adopted the financial accounting reporting rules as required by the Derivatives and Hedging Topic of the FASB Accounting Standards Codification (“FASB ASC”). The Fund is required to include enhanced disclosure that enables investors to understand how and why an entity uses derivatives, how derivatives are accounted for, and how derivatives instruments affect an entity’s results of operations and financial position. During the six months ended March 31, 2013, the Fund did not hold any derivatives instruments.
EVENTS SUBSEQUENT TO THE FISCAL PERIOD END
The Fund has adopted financial reporting rules regarding subsequent events, which requires an entity to recognize in the financial statements the effects of all subsequent events that provide additional evidence about conditions that existed at the date of the balance sheet. Management has evaluated the Fund’s related events and transactions that occurred subsequent to March 31, 2013, through the date of issuance of the Fund’s financial statements. There were no events or transactions that occurred during this period that materially impacted the amounts or disclosures in the Fund’s financial statements.
NEW ACCOUNTING PRONOUNCEMENT
In December 2011, FASB issued ASU No. 2011-11 related to disclosures about offsetting assets and liabilities. The amendments in this ASU require an entity to disclose information about offsetting and related arrangements to enable users of its financial statements to understand the effect of those arrangements on its financial position. The ASU is effective for annual reporting periods beginning on or after January 1, 2013, and interim periods within those annual periods. The guidance requires retrospective applications for all comparative periods presented. The Fund is currently evaluating the impact ASU 2011-11 will have on the financial statements disclosures.
Note 2 – Summary of Fair Value Exposure
The Fund has adopted authoritative fair valuation accounting standards which establish an authoritative definition of fair value and set out a hierarchy for measuring fair value. These standards require additional disclosures about the various inputs and valuation techniques used to develop the
CONCORDE VALUE FUND
NOTES TO FINANCIAL STATEMENTS
Note 2 – Summary of Fair Value Exposure (continued)
measurements of fair value and a discussion in changes in valuation techniques and related inputs during the period and expanded disclosure of valuation levels for major security types. These inputs are summarized in the three broad levels listed below:
| | Level 1 – | Quoted unadjusted prices for identical instruments in active markets to which the Fund has access at the date of measurement. |
| | Level 2 – | Quoted prices for similar instruments in active markets; quoted prices for identical or similar instruments in markets that are not active; and model-derived valuations in which all significant inputs and significant value drivers are observable in active markets. Level 2 inputs are those in markets for which there are few transactions, the prices are not current, little public information exists or instances where prices vary substantially over time or among brokered market makers. |
| | Level 3 – | Model derived valuations in which one or more significant inputs or significant value drivers are unobservable. Unobservable inputs are those inputs that reflect the Fund’s own assumptions that market participants would use to price the asset or liability based on the best available information. |
Following is a description of the valuation techniques applied to the Fund’s major categories of assets and liabilities measured at fair value on a recurring basis.
Equity Securities – The Fund’s investments are carried at fair value. Securities which are traded on securities exchanges are valued at the last sale price on the exchange on which such securities are traded, as of the close of business on the day the securities are being valued or, lacking any reported sales, at the mean between the last available bid and asked price, except for call options written for which the last quoted bid price is used. To the extent, these securities are actively traded and valuation adjustments are not applied, they are categorized in level 1 of the fair value hierarchy.
Mutual Funds – Investments in mutual funds are generally priced at the ending net asset value (NAV) provided by the service agent of the Funds and will be classified as Level 1 securities.
Bonds & Notes – Bonds and notes are valued at the last quoted bid price obtained from independent pricing services. Short-term demand notes and certificates of deposit are stated at amortized cost, which approximates fair value. Short-term debt obligations with remaining maturities in excess of 60 days are valued at current market prices.
Short-Term Debt Securities – Short-term investments in fixed income securities with maturities of less than 60 days when acquired, or which subsequently are within 60 days of maturity, are valued by using the amortized cost method of valuation, which the Board has determined will represent fair value. Short-term securities with 60 days or less remaining to maturity are, unless conditions indicate otherwise, amortized to maturity based on their cost to a Fund if acquired within 60 days of maturity or, if already held by the Fund on the 60th day, based on the value determined on the 61st day.
CONCORDE VALUE FUND
NOTES TO FINANCIAL STATEMENTS
Note 2 – Summary of Fair Value Exposure (continued)
All other assets of the Funds are valued in such manner as the Board in good faith deems appropriate to reflect their fair value.
Securities for which market quotations are not readily available or if the closing price does not represent fair value, are valued at fair value as determined in good faith following procedures approved by the Board. Fair value pricing determinations are made in good faith in accordance with these procedures. There are numerous criteria that will be given consideration in determining a fair value of a security. Some of these criteria are: trading volume of security and markets, value of other like securities and news events with direct bearing to security or market. Fair value pricing results in an estimated price that reasonably reflects the current market conditions in order to rate the portfolio holdings such that shareholder transactions receive a fair net asset value. Depending on the relative significance of the valuation inputs, these securities may be classified in either Level 2 or Level 3 of the fair value hierarchy.
CONCORDE VALUE FUND
NOTES TO FINANCIAL STATEMENTS
Note 2 – Summary of Fair Value Exposure (continued)
The inputs or methodology used for valuing securities are not an indication of the risk associated with investing in those securities. The following is a summary of the inputs used to value the Fund’s net assets as of March 31, 2013:
| | | Level 1 | | | Level 2 | | | Level 3 | | | Total | |
| Common Stocks | | | | | | | | | | | | |
| Amusement & Theme Parks | | $ | 312,400 | | | $ | — | | | $ | — | | | $ | 312,400 | |
| Breakfast Cereal Manufacturing | | | 335,308 | | | | — | | | | — | | | | 335,308 | |
| Breweries | | | 467,885 | | | | — | | | | — | | | | 467,885 | |
| Cable & Other Subscription Programming | | | 338,635 | | | | — | | | | — | | | | 338,635 | |
| Clothing Accessories Stores | | | 410,040 | | | | — | | | | — | | | | 410,040 | |
| Computer Storage Device Manufacturing | | | 119,450 | | | | — | | | | — | | | | 119,450 | |
| Crude Petroleum & Natural Gas Extraction | | | 590,735 | | | | — | | | | — | | | | 590,735 | |
| Data Processing | | | 351,320 | | | | — | | | | — | | | | 351,320 | |
| Direct Property & Casualty Insurance Carriers | | | 864,808 | | | | — | | | | — | | | | 864,808 | |
| Farm Machinery & Equipment Manufacturing | | | 249,342 | | | | — | | | | — | | | | 249,342 | |
| Fruit & Vegetable Canning | | | 218,000 | | | | — | | | | — | | | | 218,000 | |
| General Medical and Surgical Hospitals | | | 487,560 | | | | — | | | | — | | | | 487,560 | |
| Home Centers | | | 227,520 | | | | — | | | | — | | | | 227,520 | |
| Instrument Manufacturing for Measuring | | | 251,820 | | | | — | | | | — | | | | 251,820 | |
| Insurance Agencies & Brokerages | | | 473,550 | | | | — | | | | — | | | | 473,550 | |
| Line-Haul Railroads | | | 398,748 | | | | — | | | | — | | | | 398,748 | |
| Local Messengers & Local Delivery | | | 292,060 | | | | — | | | | — | | | | 292,060 | |
| Medical Laboratories | | | 254,025 | | | | — | | | | — | | | | 254,025 | |
| Motor Vehicle Steering & Suspension | | | | | | | | | | | | | | | | |
| Components Manufacturing | | | 210,800 | | | | — | | | | — | | | | 210,800 | |
| Natural Gas Distribution | | | 425,480 | | | | — | | | | — | | | | 425,480 | |
| Petroleum Refineries | | | 354,526 | | | | — | | | | — | | | | 354,526 | |
| Pharmaceutical Preparation Manufacturing | | | 448,415 | | | | — | | | | — | | | | 448,415 | |
| Potash, Soda, & Borate Mineral Mining | | | 255,125 | | | | — | | | | — | | | | 255,125 | |
| Software Publishers | | | 753,919 | | | | — | | | | — | | | | 753,919 | |
| Solid Waste Landfill | | | 352,890 | | | | — | | | | — | | | | 352,890 | |
| Support Activities for Oil & Gas Operations | | | 2,925 | | | | — | | | | — | | | | 2,925 | |
| Wood Kitchen Cabinet & Countertop | | | | | | | | | | | | | | | | |
| Manufacturing | | | 280,725 | | | | — | | | | — | | | | 280,725 | |
| Total Common Stocks | | | 9,889,606 | | | | — | | | | — | | | | 9,889,606 | |
| Preferred Stocks | | | | | | | | | | | | | | | | |
| Aircraft Engine & Engine Parts Manufacturing | | | 161,595 | | | | — | | | | — | | | | 161,595 | |
| Total Preferred Stocks | | | 161,595 | | | | — | | | | — | | | | 161,595 | |
| Short-Term Investments | | | 932,251 | | | | — | | | | — | | | | 932,251 | |
| Total Investments | | $ | 10,821,857 | | | $ | — | | | $ | — | | | $ | 10,821,857 | |
Transfers between levels are recognized at the end of the reporting period. During the six months ended March 31, 2013, the Fund recognized no transfers to/from level 1 and level 2. There were no level 3 securities held in the Fund during the six months ended March 31, 2013.
CONCORDE VALUE FUND
NOTES TO FINANCIAL STATEMENTS
Note 3 – Capital Share Transactions
As of March 31, 2013, there were 30,000,000 shares of $1 par value capital stock authorized of which 9,841,293 shares are classified as the Fund’s series and the remaining balance is unallocated for future use. As of March 31, 2013, capital paid-in aggregated $8,723,433.
Transactions in shares of capital stock for the six months ended March 31, 2013 and September 30, 2012 were as follows:
| | | Six Months Ended | | | | | | | |
| | | March 31, 2013 | | | Year Ended | |
| | | (Unaudited) | | | September 30, 2012 | |
| | | Shares | | | Amount | | | Shares | | | Amount | |
| Shares sold | | | 1,582 | | | $ | 20,000 | | | | 5,519 | | | $ | 66,000 | |
| Shares issued in reinvestment of dividends | | | 1,670 | | | | 20,358 | | | | — | | | | — | |
| | | | 3,252 | | | | 40,358 | | | | 5,519 | | | | 66,000 | |
| Shares redeemed | | | (80,663 | ) | | | (1,006,978 | ) | | | (47,704 | ) | | | (557,112 | ) |
| Net increase (decrease) | | | (77,411 | ) | | $ | (966,620 | ) | | | (42,185 | ) | | $ | (491,112 | ) |
Note 4 – Investment Transactions
The aggregate cost of purchases and proceeds from sales of investment securities, excluding short-term investments, were $1,600,698 and $2,593,003, respectively. The cost of purchases and proceeds from sales of short-term securities aggregated $2,301,824 and $2,254,166, respectively, for the six months ended March 31, 2013.
Note 5 – Investment Advisory Fees and Other Transactions with Affiliates
The Fund has an Investment Advisory Agreement (Advisory Agreement) with Concorde Financial Corporation dba Concorde Investment Management (Concorde) to act as the Fund’s investment advisor. Concorde provides the Fund with investment advice and recommendations consistent with the Fund’s investment objectives, policies and restrictions, and supervises the purchase and sale of investment transactions on behalf of the Fund. For such services, Concorde receives an annual fee of 0.90% of the Fund’s average daily net assets, computed daily and paid on a monthly basis. The investment advisory fee was $47,934 for the six months ended March 31, 2013, of which $8,294 was payable at March 31, 2013.
Certain directors and officers of the Company are also directors, officers and/or employees of Concorde.
CONCORDE VALUE FUND
NOTES TO FINANCIAL STATEMENTS
Note 6 – Federal Tax Information
At September 30, 2012, the Fund’s most recent fiscal year end, the components of accumulated earnings (losses) on a tax basis were as follows:
| Cost of Investments (a) | | $ | 7,951,526 | |
| Gross tax unrealized appreciation | | | 3,273,849 | |
| Gross tax unrealized depreciation | | | (174,976 | ) |
| Net tax unrealized appreciation | | $ | 3,098,873 | |
| Undistributed ordinary income | | | 20,358 | |
| Undistributed long-term capital gain | | | — | |
| Total distributable earnings | | $ | 20,358 | |
| Other accumulated gains (losses) | | $ | (1,781,852 | ) |
| Total accumulated earnings (losses) | | $ | 1,337,379 | |
| | (a) | Represents cost for federal income tax purposes and differs from the cost for financial reporting purposes primarily due to wash sale adjustments. |
At September 30, 2012, the Fund’s most recent fiscal year end, the Fund had tax basis capital losses of $1,755,487, which may be carried over to offset future capital gains and expires on September 30, 2018. The Fund utilized a capital loss carryover in the amount of $4,016 during the fiscal year ended September 30, 2012. Additionally, at September 30, 2012 the Fund deferred, on a tax basis, a post-October capital loss of $26,365.
BOARD APPROVAL OF CONTINUATION OF INVESTMENT ADVISORY AGREEMENT (Unaudited)
At its meeting held on November 14, 2012, the Board of Directors (the “Board”) of Concorde Funds, Inc. (the “Company”) including all the Directors who are not “interested persons” (as defined in the Investment Company Act of 1940) considered and then voted to re-approve the current investment advisory agreement (the “Advisory Agreement”) between Concorde Financial Corporation (the “Advisor”) and the Company, on behalf of the Concorde Value Fund (the “Fund”). In connection with its re-approval of the Advisory Agreement, the Board reviewed and discussed the specific services provided by the Advisor. The Board considered the following factors:
The Advisor:
| | 1) | Provides daily investment management for the Concorde Value Fund. In providing investment management, Concorde Financial Corporation will oversee the trading of securities and the rebalancing of the portfolio. |
| | 2) | Retains the services of the Fund’s Chief Compliance Officer and will make all reasonable efforts to insure that the Fund is in compliance with the securities laws. |
| | 3) | Provide responsive customer and shareholder servicing which consists of responding to shareholder inquiries received, including specific mutual fund account information, in addition to calls directed to the transfer agent call center. |
| | 4) | Oversees distribution of the Fund through third-party broker/dealers and independent financial institutions. |
| | 5) | Oversees those third party service providers that support the Fund in providing fund accounting, fund administration, transfer agency and custodial services. |
The Board also: (i) compared the performance of the Fund to benchmark indices over various periods of time and concluded that the performance of the Fund, articulately on a risk-adjusted basis, warranted the continuation of the Advisory Agreement; (ii) compared the expense ratios of funds similar in asset size and investment objective to those of the Fund and concluded the expenses of the Fund were reasonable and warranted continuation of the Advisory Agreement; (iii) considered the fees charged by Concorde Financial Corporation to those of funds similar in asset size and investment objective to the Fund and concluded the advisory fees of the Fund were reasonable and warranted continuation of the Advisory Agreement; and (iv) considered the profitability of Concorde Financial Corporation with respect to the Fund, and concluded that the profits were reasonable and not excessive when compared to profitability guidelines set forth in relevant court cases.
The Board then discussed economies of scale and breakpoints and determined that the Fund, managed by Concorde Financial Corporation, has not yet grown in size, nor has the marketplace demonstrated significant rapid potential growth to any extent, that would warrant the imposition of breakpoints.
The Board reviewed the Fund’s expense ratios and comparable expense ratios for similar funds. The Board used data from Lipper, as presented in the charts in the Board Materials, showing funds classified by Lipper as Multi-Cap Value Funds, similar in nature to the Concorde Value Fund. The Board determined that the total expense ratio of the Fund falls within the range of the ratios of other funds in the Multi-Cap Value classification. The Board also referenced Concorde Financial Corporation’s Form ADV and a copy of the current Investment Advisory Agreement. They also referenced a Concorde Investment Management Fee and Service Agreement to compare fees charged by the Advisor to their other clients versus what they charge the Fund. After further discussion and upon a motion duly made and seconded, the Directors, including a majority of Directors who are not “interested persons,” as defined by the 1940 Act, of the Corporation unanimously approved the Continuation of Investment Advisory Agreement.
ADDITIONAL INFORMATION (Unaudited)
PROXY VOTING POLICIES AND PROCEDURES
For a description of the policies and procedures that the Fund uses to determine how to vote proxies relating to the portfolio securities, please call (972) 701-5400 and request a Statement of Additional Information. One will be mailed to you free of charge. The Statement of Additional Information is also available on the website of the Securities and Exchange Commission at http://www.sec.gov.
PROXY VOTING RECORDS
Information on how the Fund voted proxies relating to portfolio securities during the twelve month period ending June 30, 2012 is available without charge, upon request, by calling (972) 701-5400. Furthermore, you can obtain the Fund’s proxy voting records on the Securities and Exchange Commission’s website at http://www.sec.gov.
QUARTERLY FILINGS ON FORM N-Q
The Fund files its complete schedule of portfolio holdings with the Securities and Exchange Commission for the first and third quarters of each fiscal quarter on Form N-Q. The Fund’s Form N-Q is available (i) without charge, upon request, by calling (972) 701-5400, (ii) on the Securities and Exchange Commission’s website at http://www.sec.gov, or (iii) at the Securities and Exchange Commission’s public reference room.
DIRECTORS AND OFFICERS
The Fund’s Statement of Additional Information includes additional information about the Fund’s Directors and Officers and is available, without charge, upon request by calling (972) 701-5400.
HOUSEHOLD DELIVERY OF SHAREHOLDER DOCUMENTS
In an effort to decrease costs, the FUND intends to reduce the number of duplicate prospectuses and Annual and Semi-Annual Reports you receive by sending only one copy of each to those addresses shared by two or more accounts and to shareholders we reasonably believe are from the same family or household. Once implemented, if you would like to discontinue householding for your accounts, please call toll-free at 1-800-294-1699 to request individual copies of these documents. One the FUND receives notice to stop householding, we will begin sending individual copies thirty days after receiving your request. This policy does not apply to account statements.
(This Page Intentionally Left Blank.)
INVESTMENT ADVISOR
Concorde Investment Management
1000 Three Lincoln Centre
5430 LBJ Freeway LB3
Dallas, Texas 75240
OFFICERS
Gary B. Wood, Ph.D.
President and Treasurer
John A. Stetter
Secretary
DIRECTORS
William Marcy
John H. Wilson
Gary B. Wood, Ph.D.
CUSTODIAN
U.S. Bank, N.A.
Custody Operations
1555 North RiverCenter Drive, Suite 302
Milwaukee, Wisconsin 53212
TRANSFER AGENT AND
DIVIDEND DISBURSING AGENT
U.S. Bancorp Fund Services, LLC
Mutual Fund Services, 3rd Floor
615 East Michigan Street
Milwaukee, Wisconsin 53202
INDEPENDENT REGISTERED
PUBLIC ACCOUNTING FIRM
Brad A. Kinder, CPA
815 Parker Square
Flower Mound, Texas 75028
LEGAL COUNSEL
Foley & Lardner LLP
777 East Wisconsin Avenue
Milwaukee, Wisconsin 53202
TELEPHONE
(972) 701-5400
(Fund information)
(800) 294-1699
(Shareholder account information)
Item 2. Code of Ethics.
Not applicable for semi-annual reports.
Item 3. Audit Committee Financial Expert.
Not applicable for semi-annual reports
Item 4. Principal Accountant Fees and Services.
Not applicable for semi-annual reports
Item 5. Audit Committee of Listed Registrants.
Not applicable to registrants who are not listed issuers (as defined in Rule 10A-3 under the Securities Exchange Act of 1934).
Item 6. Investments.
| (a) | Schedule of Investments is included as part of the report to shareholders filed under Item 1 of this Form. |
Item 7. Disclosure of Proxy Voting Policies and Procedures for Closed-End Management Investment Companies.
Not applicable to open-end investment companies.
Item 8. Portfolio Managers of Closed-End Management Investment Companies.
Not applicable to open-end investment companies.
Item 9. Purchases of Equity Securities by Closed-End Management Investment Company and Affiliated Purchasers.
Not applicable to open-end investment companies.
Item 10. Submission of Matters to a Vote of Security Holders.
Not Applicable
Item 11. Controls and Procedures.
| (a) | The Registrant’s President and Treasurer have reviewed the Registrant's disclosure controls and procedures (as defined in Rule 30a-3(c) under the Investment Company Act of 1940 (the “Act”)) as of a date within 90 days of the filing of this report, as required by Rule 30a-3(b) under the Act and Rules 13a-15(b) or 15d-15(b) under the Securities Exchange Act of 1934. Based on their review, such officers have concluded that the disclosure controls and procedures are effective in ensuring that information required to be disclosed in this report is appropriately recorded, processed, summarized and reported and made known to them by others within the Registrant and by the Registrant’s service provider. |
| (b) | There were no changes in the Registrant's internal control over financial reporting (as defined in Rule 30a-3(d) under the Act) that occurred during the second fiscal quarter of the period covered by this report that has materially affected, or is reasonably likely to materially affect, the Registrant's internal control over financial reporting. |
Item 12. Exhibits.
| (a) | (1) Any code of ethics or amendment thereto, that is the subject of the disclosure required by Item 2, to the extent that the registrant intends to satisfy Item 2 requirements through filing an exhibit. Not Applicable for semi-annual reports |
(2) A separate certification for each principal executive and principal financial officer pursuant to Section 302 of the Sarbanes-Oxley Act of 2002. Filed herewith.
(3) Any written solicitation to purchase securities under Rule 23c-1 under the Act sent or given during the period covered by the report by or on behalf of the registrant to 10 or more persons. Not applicable to open-end investment companies.
| (b) | Certifications pursuant to Section 906 of the Sarbanes-Oxley Act of 2002. Furnished herewith. |
SIGNATURES
Pursuant to the requirements of the Securities Exchange Act of 1934 and the Investment Company Act of 1940, the registrant has duly caused this report to be signed on its behalf by the undersigned, thereunto duly authorized.
(Registrant) Concorde Funds, Inc.
By (Signature and Title)* /s/Gary B. Wood
Gary B. Wood, President
Date June 6, 2013
Pursuant to the requirements of the Securities Exchange Act of 1934 and the Investment Company Act of 1940, this report has been signed below by the following persons on behalf of the registrant and in the capacities and on the dates indicated.
By (Signature and Title)* /s/Gary B. Wood
Gary B. Wood, President
By (Signature and Title)* /s/Gary B. Wood
Gary B. Wood, Treasurer
* Print the name and title of each signing officer under his or her signature.