As filed with the Securities and Exchange Commission on May 28, 2015
UNITED STATES
SECURITIES AND EXCHANGE COMMISSION
Washington, D.C. 20549
FORM N-CSR
CERTIFIED SHAREHOLDER REPORT OF REGISTERED
MANAGEMENT INVESTMENT COMPANIES
Investment Company Act file number (811-05339)
Concorde Funds, Inc.
(Exact name of registrant as specified in charter)
1000 Three Lincoln Centre
5430 LBJ Freeway LB3
Dallas, TX 75240-2650
(Address of principal executive offices) (Zip code)
Gary B. Wood
1000 Three Lincoln Centre, 5430 LBJ Freeway LB3, Dallas, TX 75240-2650
(Name and address of agent for service)
(972)-701-5400
Registrant's telephone number, including area code
Date of fiscal year end: 09/30/2015
Date of reporting period: 03/31/2015
Item 1. Reports to Stockholders.
A NO-LOAD
MUTUAL FUND
SEMI-ANNUAL REPORT
Dated March 31, 2015
May 15, 2015
Dear Shareholders,
We are pleased to present the Semi-Annual report of Concorde Funds, Inc. for the six month period ending March 31, 2015.
Concorde Value Fund
For the first half of the fiscal year for Concorde Value Fund, which currently owns mostly large cap companies, the total return was 3.39%, comparable to the large cap indices but below the broader indices which are dominated by smaller cap and mid-cap size companies. That relative performance pattern is consistent with the trialing 12 months return of 10.63%, but the preference for larger companies reflects our continuing concerns over market risks and the likelihood that larger companies can weather tough times better than small companies.
| | | Six Months Ended | | Annualized | Annualized |
| | | 03/31/2015 | 1 Year Ending | 5 Years Ending | 10 Years Ending |
| | | (Unaudited) | 03/31/2015 | 03/31/2015 | 03/31/2015 |
| | | | | | |
| | Concorde Value Fund | 3.39% | 10.63% | 9.79% | 3.50% |
| | Russell 3000 Value Total Return | 4.77% | 8.94% | 13.66% | 7.24% |
| | S&P 500 | 5.93% | 12.73% | 14.47% | 8.01% |
| | Russell 2000 | 14.46% | 8.21% | 14.57% | 8.82% |
| | Lipper Multi-Cap Value | 5.58% | 8.59% | 12.70% | 6.61% |
| | Wilshire 4500 | 12.33% | 10.64% | 15.81% | 10.20% |
| | NASDAQ | 8.97% | 17.11% | 15.47% | 9.74% |
Equity performance in the domestic markets was positive for the Fund and all market and managed fund indices listed above for the first half of the fiscal year. However, there was a significant amount of variability in results, reflecting differences in gains for various capitalization and industry sectors. In the ten broad S&P 500 sectors, three had negative returns for the period and the difference between the best (healthcare at 14.50%) and worst (energy at -13.20%) performing sectors was very wide for a short 6 month time frame.
The consumer discretionary sector, currently the largest position in the Fund, produced a near 20% gain vs. 14% for the S&P benchmark. Primary contributors include Fortune Brands Home & Security, Lowe’s, Time Warner, Hanesbrands, Walt Disney and new holding Darden Restaurants. Fortune Brands and Lowe’s continue to benefit from the continued firming of the housing market, particularly the high activity in rehabbing existing homes. Walt Disney results are benefitting from firming attendance and pricing at theme parks and the leveraging of recent acquisitions in both movie production and licensing rights, particularly for the Marvel properties. Hanesbrands continues to benefit from deleveraging and intelligent acquisitions, however, we have reduced our position as the stock approaches fair valuation levels. Time Warner operations have been good and the stock is continuing to reflect the long term value of the HBO franchise.
The energy holdings of the Fund contributed a net loss for the period, although it generated a total return gain in the last three months. We have added two quality companies in the recent weakness, Halliburton and Cimarex Energy. These new holdings represent a larger discount to our calculated long term value than the two defensive stocks they replaced, Exxon Mobil and Occidental Petroleum, and should provide more upside over the next several years if the energy industry stabilizes or recovers modestly.
The technology, industrials, and real estate sectors all had negative returns for the half year with mixed individual company results. In technology, Fund holdings had a mid-single digit loss compared to a 5.80% S&P sector gain. IBM, NCR and Microsoft all had total return losses despite meaningful dividends. IBM and NCR are both transitioning to a more significant software focus and Microsoft reported a disappointing December quarter. Long term prospects appear good for all three companies, however, NCR and IBM face difficult transition periods. If even moderately successful we see large upside in these stocks. Microsoft is farther along with their changes and have had primarily good recent results along with stock performance. Oracle contributed a low double digit gain.
The Fund’s two large industrial holdings, UPS and Union Pacific, had close to flat performance, lagging the 5.85% positive return for S&P industrials. We have recently sold UPS as recent erratic results and a diminished discount to valuation estimates prompted that decision. Union Pacific sold off in sympathy to the energy industry weakness. We still see a strong franchise that continues to participate in moderate economic growth with efficient management and a discount to long term valuation prospects.
The real estate related holdings had volatile movement in the first half. Texas Pacific Land Trust dropped over 35% in the fourth quarter, but rebounded strongly early in 2015. The Trust has a large energy royalty aspect to valuation in addition to large raw land holdings. Medical Properties Trust rose during both quarters along with a significant dividend, but was not large enough to outweigh the Texas Pacific Land Trust performance for the period.
In the telecom services group, Verizon Communications was the only holding during the period and was sold. Increased competition in the domestic postpaid phone market caused us to adjust our valuation targets lower. We will revisit this strong competitor if a more favorable entry price is reached. DuPont has been the only position in the materials sector and outperformed that S&P group by approximately 8%. DuPont continues to reconfigure itself in order to maximize value in this complex set of businesses. The company is receiving pressure from a significant outside investor to look at more aggressive changes.
AB InBev and Unilever are consumer staples holdings in the Fund and performed in line with the high single digit benchmark return. Both companies have many market leading products, but are struggling slightly in some of their emerging markets. Long term these well financed stocks should benefit from exposure to those higher growth markets and generate solid cash flows from developed markets.
Three insurance related stocks continue to be the only investments for the Fund in the financial services segment. Combined, these three modestly outperformed the S&P sector benchmark. AON PLC, active in insurance brokerage and employee benefits, continues to perform well as their strong market position is leading to good earnings and cash flow growth as operations improve and unusual pension and restructuring expenses begin to abate. Travelers and AIG, primarily property and casualty
insurers, have reported good results, but the pricing environment may be weakening modestly, especially on the commercial side. We have trimmed our Travelers position in the recent period.
Healthcare positions in the Fund currently include HCA Holdings, Johnson & Johnson, and HealthSouth Corp., a new purchase. Collective performance lagged significantly the 14.50% S&P sector, producing a low single digit positive return. The benchmark reflects recent strong gains in smaller growth companies involved in medical device and new drug product lines. The Fund holdings reflect a larger exposure to healthcare services, however, Johnson & Johnson does have exposure in devices and pharmaceuticals in more established markets. HealthSouth is the domestic leader in inpatient rehabilitation facilities which should see continued growth from demographic trends and we see the current stock price as significantly undervalued.
Thank for your continued support and confidence. Be assured, we will always work to achieve good performance, but with a careful eye on capital preservation, particularly during these challenging times.
| | Best regards, |
| |  |
| | |
| | Gary B. Wood, Ph.D. |
| | President |
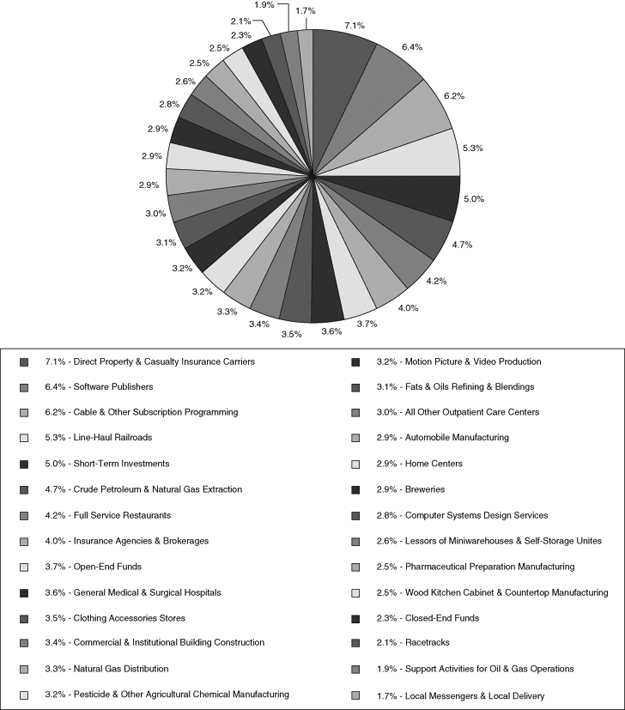
CONCORDE VALUE FUND
PORTFOLIO HOLDINGS BY SECTOR
March 31, 2015 (Unaudited)
The portfolio’s holdings and allocations are subject to change. The percentages are of net assets as of March 31, 2015.
FUND EXPENSES (Unaudited)
As a shareholder of the FUND, you incur two types of costs: (1) transaction costs and exchange fees; and (2) ongoing costs, including management fees and other FUND expenses. This Example is intended to help you understand your ongoing costs (in dollars) of investing in the FUND and to compare these costs with the ongoing costs of investing in other mutual funds.
The Example is based on an investment of $1,000 invested at the beginning of the period and held for the entire six month period ended March 31, 2015.
Actual Expenses
The first line of the table below provides information about actual account values and actual expenses. You may use the information in this line, together with the amount you invested, to estimate the expenses that you paid over the period. Simply divide your account value by $1,000 (for example, an $8,600 account value divided by $1,000 = 8.6), then multiply the result by the number in the first line under the heading entitled “Expenses Paid During Period” to estimate the expenses you paid on your account during this period.
Hypothetical Example for Comparison Purposes
The second line of the table below provides information about hypothetical account values and hypothetical expenses based on the FUND’s actual expense ratio and an assumed rate of return of 5% per year before expenses, which is not the FUND’s actual return. The hypothetical account values and expenses may not be used to estimate the actual ending account balance or expenses you paid for the period. You may use this information to compare the ongoing costs of investing in the FUND and other funds. To do so, compare this 5% hypothetical example with the 5% hypothetical examples that appear in the shareholder reports of the other funds.
Please note that the expenses shown in the table are meant to highlight your ongoing costs only and do not reflect any transactional costs or exchange fees. While the FUND does not currently assess sales charges, redemption or exchange fees, other funds do, and those costs will not be reflected in their expense tables. Therefore, the second line of the table is useful in comparing ongoing costs only, and will not help you determine the relative total costs of owning different funds.
| | Beginning Account | Ending Account | Expenses Paid During Period* – |
| | Value – 10/1/14 | Value – 3/31/15 | Six Months Ended 3/31/15 |
| Actual | $1,000.00 | $1,033.90 | $11.00 |
| Hypothetical (5% return before expenses) | $1,000.00 | $1,014.11 | $10.90 |
| * | Expenses are equal to the FUND’s annualized expense ratio of 2.17%, multiplied by the average account value over the period, multiplied by 182/365 (to reflect the one-half year period ended March 31, 2015). |
CONCORDE VALUE FUND
SCHEDULE OF INVESTMENTS IN SECURITIES
March 31, 2015 (Unaudited)
| | | | | | Fair | | | Percent of | |
| | | Shares | | | Value | | | Net Assets | |
| COMMON STOCKS - 83.13% | | | | | | | | | |
| | | | | | | | | | |
| ALL OTHER OUTPATIENT CARE CENTERS | | | | | | | | | |
| HealthSouth Corp. | | | 7,775 | | | $ | 344,899 | | | | 3.02 | % |
| | | | | | | | | | | | | |
| AUTOMOBILE MANUFACTURING | | | | | | | | | | | | |
| Ford Motor Co. | | | 21,000 | | | | 338,940 | | | | 2.96 | |
| | | | | | | | | | | | | |
| BREWERIES | | | | | | | | | | | | |
| Anheuser Busch InBev NV - ADR (a) | | | 2,700 | | | | 329,157 | | | | 2.88 | |
| | | | | | | | | | | | | |
| CABLE & OTHER SUBSCRIPTION PROGRAMMING | | | | | | | | | | | | |
| Comcast Corp. | | | 6,000 | | | | 336,390 | | | | 2.94 | |
| The Walt Disney Co. | | | 3,500 | | | | 367,115 | | | | 3.21 | |
| | | | | | | | 703,505 | | | | 6.15 | |
| CLOTHING ACCESSORIES STORES | | | | | | | | | | | | |
| Hanesbrands, Inc. | | | 12,000 | | | | 402,120 | | | | 3.52 | |
| | | | | | | | | | | | | |
| COMPUTER SYSTEMS DESIGN SERVICES | | | | | | | | | | | | |
| International Business Machines Corp. | | | 2,000 | | | | 321,000 | | | | 2.81 | |
| | | | | | | | | | | | | |
| CRUDE PETROLEUM & NATURAL GAS EXTRACTION | | | | | | | | | | | | |
| Cimarex Energy Co. | | | 2,180 | | | | 250,896 | | | | 2.20 | |
| Devon Energy Corp. | | | 4,800 | | | | 289,488 | | | | 2.53 | |
| | | | | | | | 540,384 | | | | 4.73 | |
| DIRECT PROPERTY & CASUALTY | | | | | | | | | | | | |
| INSURANCE CARRIERS | | | | | | | | | | | | |
| American International Group, Inc. | | | 7,500 | | | | 410,925 | | | | 3.59 | |
| Travelers Companies, Inc. | | | 3,700 | | | | 400,081 | | | | 3.50 | |
| | | | | | | | 811,006 | | | | 7.09 | |
| FATS & OILS REFINING & BLENDING | | | | | | | | | | | | |
| Unilever NV - ADR (a) | | | 8,600 | | | | 359,136 | | | | 3.14 | |
| | | | | | | | | | | | | |
| FULL-SERVICE RESTAURANTS | | | | | | | | | | | | |
| Darden Restaurants, Inc. | | | 7,000 | | | | 485,380 | | | | 4.25 | |
| | | | | | | | | | | | | |
| GENERAL MEDICAL & SURGICAL HOSPITALS | | | | | | | | | | | | |
| HCA Holdings, Inc. (c) | | | 5,500 | | | | 413,765 | | | | 3.62 | |
| | | | | | | | | | | | | |
| HOME CENTERS | | | | | | | | | | | | |
| Lowe’s Companies, Inc. | | | 4,500 | | | | 334,755 | | | | 2.93 | |
| | | | | | | | | | | | | |
| INSURANCE AGENCIES & BROKERAGES | | | | | | | | | | | | |
| Aon Corp. (a) | | | 4,700 | | | | 451,764 | | | | 3.95 | |
| | | | | | | | | | | | | |
| LINE-HAUL RAILROADS | | | | | | | | | | | | |
| Union Pacific Corp. | | | 5,600 | | | | 606,536 | | | | 5.31 | |
The accompanying notes are an integral part of these financial statements.
CONCORDE VALUE FUND
SCHEDULE OF INVESTMENTS IN SECURITIES (continued)
March 31, 2015 (Unaudited)
| | | | | | Fair | | | Percent of | |
| | | Shares | | | Value | | | Net Assets | |
| COMMON STOCKS (continued) | | | | | | | | | |
| | | | | | | | | | |
| LOCAL MESSENGERS & LOCAL DELIVERY | | | | | | | | | |
| United Parcel Service, Inc. | | | 2,000 | | | $ | 193,880 | | | | 1.70 | % |
| | | | | | | | | | | | | |
| MOTION PICTURE & VIDEO PRODUCTION | | | | | | | | | | | | |
| Time Warner, Inc. | | | 4,300 | | | | 363,092 | | | | 3.18 | |
| | | | | | | | | | | | | |
| NATURAL GAS DISTRIBUTION | | | | | | | | | | | | |
| Kinder Morgan, Inc. | | | 9,000 | | | | 378,540 | | | | 3.31 | |
| | | | | | | | | | | | | |
| PESTICIDE & OTHER AGRICULTURAL | | | | | | | | | | | | |
| CHEMICAL MANUFACTURING | | | | | | | | | | | | |
| EI du Pont de Nemours & Co. | | | 5,100 | | | | 364,497 | | | | 3.19 | |
| | | | | | | | | | | | | |
| PHARMACEUTICAL PREPARATION MANUFACTURING | | | | | | | | | | | | |
| Johnson & Johnson | | | 2,900 | | | | 291,740 | | | | 2.55 | |
| | | | | | | | | | | | | |
| RACETRACKS | | | | | | | | | | | | |
| International Speedway Corp. | | | 7,200 | | | | 234,792 | | | | 2.05 | |
| | | | | | | | | | | | | |
| SOFTWARE PUBLISHERS | | | | | | | | | | | | |
| Microsoft Corp. | | | 8,400 | | | | 341,502 | | | | 2.99 | |
| Oracle Corp. | | | 9,000 | | | | 388,350 | | | | 3.39 | |
| | | | | | | | 729,852 | | | | 6.38 | |
| SUPPORT ACTIVITIES FOR OIL & GAS OPERATIONS | | | | | | | | | | | | |
| Halliburton Co. | | | 5,000 | | | | 219,400 | | | | 1.92 | |
| | | | | | | | | | | | | |
| WOOD KITCHEN CABINET & | | | | | | | | | | | | |
| COUNTERTOP MANUFACTURING | | | | | | | | | | | | |
| Fortune Brands Home & Security, Inc. | | | 6,000 | | | | 284,880 | | | | 2.49 | |
| TOTAL COMMON STOCKS (Cost $5,618,668) | | | | | | | 9,503,020 | | | | 83.13 | |
| | | | | | | | | | | | | |
| CLOSED-END FUNDS - 2.26% | | | | | | | | | | | | |
| Sprott Physical Gold Trust (b)(c) | | | 26,400 | | | | 258,192 | | | | 2.26 | |
| CLOSED-END FUNDS (Cost $276,898) | | | | | | | 258,192 | | | | 2.26 | |
| | | | | | | | | | | | | |
| OPEN-END FUNDS - 3.69% | | | | | | | | | | | | |
| Harbor Institutional Fund | | | 3,081 | | | | 211,136 | | | | 1.85 | |
| Matthews Asian Growth & Income Fund | | | 11,490 | | | | 211,063 | | | | 1.84 | |
| TOTAL OPEN-END FUNDS (Cost $420,000) | | | | | | | 422,199 | | | | 3.69 | |
| | | | | | | | | | | | | |
| REITS - 2.58% | | | | | | | | | | | | |
| LESSORS OF MINIWAREHOUSES | | | | | | | | | | | | |
| & SELF-STORAGE UNITS | | | | | | | | | | | | |
| Medical Properties Trust, Inc. | | | 20,000 | | | | 294,800 | | | | 2.58 | |
| TOTAL REITS (Cost $252,826) | | | | | | | 294,800 | | | | 2.58 | |
The accompanying notes are an integral part of these financial statements.
CONCORDE VALUE FUND
SCHEDULE OF INVESTMENTS IN SECURITIES (continued)
March 31, 2015 (Unaudited)
| | | | | | Fair | | | Percent of | |
| | | Shares | | | Value | | | Net Assets | |
| ROYALTY TRUST - 3.42% | | | | | | | | | |
| COMMERCIAL & INSTITUTIONAL | | | | | | | | | |
| BUILDING CONSTRUCTION | | | | | | | | | |
| Texas Pacific Land Trust | | | 2,700 | | | $ | 391,095 | | | | 3.42 | % |
| TOTAL ROYALTY TRUST (Cost $390,001) | | | | | | | 391,095 | | | | 3.42 | |
| | | | | | | | | | | | | |
| SHORT-TERM INVESTMENTS - 5.04% | | | | | | | | | | | | |
| Fidelity Institutional Money Market - Select Class, 0.02% (d) | | | 400,000 | | | | 400,000 | | | | 3.50 | |
| The STIC Prime Portfolio - Institutional Class, 0.04% (d) | | | 175,918 | | | | 175,918 | | | | 1.54 | |
| TOTAL SHORT-TERM INVESTMENTS | | | | | | | | | | | | |
| (Cost $575,918) | | | | | | | 575,918 | | | | 5.04 | |
| Total Investments (Cost $7,534,311) - 100.12% | | | | | | | 11,445,224 | | | | 100.12 | |
| Liabilities in Excess of Other Assets - (0.12)% | | | | | | | (13,557 | ) | | | (0.12 | ) |
| TOTAL NET ASSETS - 100.00% | | | | | | $ | 11,431,667 | | | | 100.00 | % |
Notes:
ADR American Depository Receipt
REIT Real Estate Investment Trust
| (a) | Foreign issued security listed directly on a U.S. securities exchange. |
| (b) | Foreign issued security traded over-the-counter in the U.S. |
| (c) | Presently non-income producing. |
| (d) | Rate shown is the 7-day yield as of March 31, 2015. |
The accompanying notes are an integral part of these financial statements.
CONCORDE VALUE FUND
STATEMENT OF ASSETS AND LIABILITIES
March 31, 2015 (Unaudited)
| ASSETS | | | |
| Investments in securities, at fair value (cost $7,534,311) | | $ | 11,445,224 | |
| Dividend & interest receivable | | | 7,567 | |
| Prepaid expense | | | 4,543 | |
| Other asset | | | 3,346 | |
| TOTAL ASSETS | | | 11,460,680 | |
| LIABILITIES | | | | |
| Investment advisory fee payable | | | 8,768 | |
| Accrued expenses | | | 20,245 | |
| TOTAL LIABILITIES | | | 29,013 | |
| NET ASSETS | | $ | 11,431,667 | |
| Composition of Net Assets: | | | | |
| Net capital paid in on shares of capital stock | | $ | 7,375,807 | |
| Undistributed net investment loss | | | (28,623 | ) |
| Accumulated net realized gain | | | 173,570 | |
| Net unrealized appreciation | | | 3,910,913 | |
| NET ASSETS | | $ | 11,431,667 | |
| Capital shares outstanding | | | 730,421 | |
| Net asset value, offering price and redemption price per share | | $ | 15.65 | |
The accompanying notes are an integral part of these financial statements.
CONCORDE VALUE FUND
STATEMENT OF OPERATIONS
For the Six Months Ended March 31, 2015 (Unaudited)
| Investment Income | | | |
| Dividends (net of foreign withholding taxes of $1,842) | | $ | 109,388 | |
| Interest | | | 49 | |
| Total investment income | | | 109,437 | |
| Expenses | | | | |
| Investment advisory fees (Note 5) | | | 51,652 | |
| Administration fees | | | 17,532 | |
| Professional fees | | | 16,441 | |
| Fund accounting fees | | | 14,210 | |
| Transfer agent fees | | | 8,497 | |
| Other expenses | | | 5,615 | |
| Printing, postage and delivery | | | 5,473 | |
| Insurance expense | | | 1,759 | |
| Custody fees | | | 1,570 | |
| Directors fees | | | 1,216 | |
| Federal and state registration fees | | | 571 | |
| Total expenses | | | 124,536 | |
| NET INVESTMENT LOSS | | | (15,099 | ) |
| REALIZED AND UNREALIZED GAIN FROM INVESTMENTS | | | | |
| Net realized gain from investments in securities | | | 429,303 | |
| Net increase in unrealized depreciation on investments in securities | | | (37,192 | ) |
| NET REALIZED AND UNREALIZED GAIN FROM INVESTMENTS | | | 392,111 | |
| NET INCREASE IN NET ASSETS RESULTING FROM OPERATIONS | | $ | 377,012 | |
The accompanying notes are an integral part of these financial statements.
CONCORDE VALUE FUND
STATEMENTS OF CHANGES IN NET ASSETS
| | Six Months Ended | | | |
| | | March 31, 2015 | | | Year Ended | |
| | | (Unaudited) | | | Sept. 30, 2014 | |
| INCREASE IN NET ASSETS FROM OPERATIONS | | | | | | |
| Net investment loss | | $ | (15,099 | ) | | $ | (18,996 | ) |
| Net realized gain on investments | | | 429,303 | | | | 1,482,836 | |
| Net unrealized appreciation/(depreciation) on investments | | | (37,192 | ) | | | 317,834 | |
| Net increase in net assets resulting from operations | | | 377,012 | | | | 1,781,674 | |
| DISTRIBUTIONS TO SHAREHOLDERS FROM | | | | | | | | |
| Net investment income | | | — | | | | (25,654 | ) |
| From net realized gain | | | (953,218 | ) | | | — | |
| Total distributions to shareholders | | | (953,218 | ) | | | (25,654 | ) |
| CAPITAL SHARE TRANSACTIONS – NET (Note 3) | | | 126,026 | | | | (1,153,394 | ) |
| Total increase/(decrease) in net assets | | | (450,180 | ) | | | 602,626 | |
| NET ASSETS | | | | | | | | |
| Beginning of period | | | 11,881,847 | | | | 11,279,221 | |
| End of period (including undistributed net investment | | | | | | | | |
| loss of (28,623) and (13,524), respectively) | | $ | 11,431,667 | | | $ | 11,881,847 | |
The accompanying notes are an integral part of these financial statements.
CONCORDE VALUE FUND
FINANCIAL HIGHLIGHTS
| | | Six Months | | | | | | | | | | | | | | | | |
| | | Ended | | | | | | | | | | | | | | | | |
| | | March 31, | | | | | | | | | | | | | | | | |
| | | 2015(2) | | | Year Ended September 30, | |
| | | (Unaudited) | | | 2014 | | | 2013 | | | 2012 | | | 2011 | | | 2010 | |
| PER SHARE OPERATING | | | | | | | | | | | | | | | | | | |
PERFORMANCE(1): | | | | | | | | | | | | | | | | | | |
| Net asset value, beginning of period | | $ | 16.50 | | | $ | 14.22 | | | $ | 12.34 | | | $ | 9.97 | | | $ | 10.65 | | | $ | 9.98 | |
| Income (loss) from investment operations: | | | | | | | | | | | | | | | | | | | | | | | | |
| Net investment income (loss) | | | (0.02 | ) | | | (0.02 | ) | | | 0.03 | | | | 0.02 | | | | (0.03 | ) | | | (0.03 | ) |
| Net realized and unrealized gain (loss) | | | | | | | | | | | | | | | | | | | | | | | | |
| on investments | | | 0.52 | | | | 2.33 | | | | 1.87 | | | | 2.35 | | | | (0.65 | ) | | | 0.70 | |
| Total from investment operations | | | 0.50 | | | | 2.31 | | | | 1.90 | | | | 2.37 | | | | (0.68 | ) | | | 0.67 | |
| Less distributions: | | | | | | | | | | | | | | | | | | | | | | | | |
| From net investment income | | | — | | | | (0.03 | ) | | | (0.02 | ) | | | — | | | | — | | | | — | |
| From net realized gains | | | (1.35 | ) | | | — | | | | — | | | | — | | | | — | | | | — | |
| Total distributions | | | (1.35 | ) | | | (0.03 | ) | | | (0.02 | ) | | | — | | | | — | | | | — | |
| Net asset value, end of period | | $ | 15.65 | | | $ | 16.50 | | | $ | 14.22 | | | $ | 12.34 | | | $ | 9.97 | | | $ | 10.65 | |
| TOTAL RETURN | | | 3.39 | % | | | 16.29 | % | | | 15.46 | % | | | 23.77 | % | | | (6.38 | )% | | | 6.71 | % |
| RATIOS/SUPPLEMENTAL DATA: | | | | | | | | | | | | | | | | | | | | | | | | |
| Net assets, end of period (in thousands) | | $ | 11,432 | | | $ | 11,882 | | | $ | 11,279 | | | $ | 11,027 | | | $ | 9,331 | | | $ | 10,495 | |
| Ratio of expenses to average net assets | | | 2.17 | % | | | 2.06 | % | | | 2.09 | % | | | 2.12 | % | | | 2.07 | % | | | 2.02 | % |
| Ratio of net investment income (loss) | | | | | | | | | | | | | | | | | | | | | | | | |
| to average net assets | | | (0.26 | )% | | | (0.16 | )% | | | 0.24 | % | | | 0.19 | % | | | (0.24 | )% | | | (0.32 | )% |
| Portfolio Turnover | | | 24 | % | | | 32 | % | | | 34 | % | | | 19 | % | | | 37 | % | | | 33 | % |
| (1) | Per share information has been calculated using the average number of shares outstanding. |
| (2) | Other than the ratios of expenses and net investment income (loss) to average net assets, financial highlights have not been annualized. |
The accompanying notes are an integral part of these financial highlights.
CONCORDE VALUE FUND
NOTES TO FINANCIAL STATEMENTS
Note 1 – Nature of Business and Summary of Significant Accounting Policies
NATURE OF BUSINESS
Concorde Value Fund (Fund) is a separate series of shares of common stock of Concorde Funds, Inc. (Company). The Company was incorporated in the state of Texas in September of 1987, and is registered under the Investment Company Act of 1940, as amended, as a diversified, open-end management investment company. The Fund follows the investment company accounting and reporting guidance of the Financial Accounting Standards Board (FASB) Accounting Standard Codification Topic 946 “Financial Services – Investment Companies.” The Fund is subject to various investment restrictions as set forth in the Statement of Additional Information. The Fund’s Registration Statement under the Securities Act of 1933 was effective in December of 1987. The primary investment objective of the Fund is to produce long-term growth of capital. The Company may designate one or more series of common stock. The Company presently has no series other than the Fund. Each capital share in the Fund represents an equal, proportionate interest in the net assets of the Fund with each other capital share in such series and no interest in any other series.
SIGNIFICANT ACCOUNTING POLICIES
The following is a summary of significant accounting policies followed by the Fund in the preparation of its financial statements. These policies are in conformity with accounting principles generally accepted in the United States.
VALUATION OF SECURITIES
All investments in securities are recorded at their estimated fair value, as described in note 2.
FEDERAL INCOME TAXES
The Fund’s policy is to continue to comply with the requirements of the Internal Revenue Code that are applicable to regulated investment companies and to distribute all its taxable income to its shareholders. The Fund also intends to distribute sufficient net investment income and net capital gains, if any, so that it will not be subject to excise tax on undistributed income and gains. Therefore, no federal income tax or excise provision is required.
Net investment income (loss), net realized gains (losses) and the cost of investments in securities may differ for financial statement and income tax purposes. The character of distributions from net investment income or net realized gains may differ from their ultimate characterization for income tax purposes. Permanent book and tax differences, if any, result in reclassifications to certain components of net assets. For the year ended September 30, 2014, the Fund decreased undistributed net investment loss by $5,472, increased accumulated net realized gain by $34, and decreased net capital pain in on shares of capital stock by $5,506. These reclassifications have no effect on net assets, results of operations or net asset value per share. These permanent differences primarily relate to net operating losses. Also, due to the timing of dividend distributions, the fiscal year in which amounts are distributed may differ from the year that the income or realized gains were recorded by the Fund.
CONCORDE VALUE FUND
NOTES TO FINANCIAL STATEMENTS
Note 1 – Nature of Business and Summary of Significant Accounting Policies (continued)
FEDERAL INCOME TAXES (continued)
Management has reviewed all open tax years and major tax jurisdictions and concluded that no liability for unrecognized tax benefits should be recorded related to uncertain tax positions taken on returns filed or expected to be taken on a tax return. As of March 31, 2015, open tax years include the tax years ended September 30, 2012 through 2014.
SECURITY TRANSACTIONS AND RELATED INCOME
Security transactions are accounted for on the date the securities are purchased or sold. Realized gains and losses from securities transactions are reported on an identified cost basis. Dividend income is recognized on the ex-dividend date, and interest income is recognized on an accrual basis. Discounts and premiums on securities purchased are amortized, over the lives of the respective securities.
DIVIDENDS AND DISTRIBUTIONS
Distributions to shareholders are determined in accordance with income tax regulations and recorded on the ex-dividend date. The Fund intends to distribute all of its net investment income, if any, as dividends to its shareholders on an annual basis. The Fund intends to distribute all of its capital gains, if any, at least once a year. The treatment for financial reporting purposes of distributions made to shareholders during the year from net investment income or capital gains may differ from their ultimate treatment for federal income tax purposes. These differences are caused primarily by differences in the timing of the recognition of certain components of income, expense or realized capital gain for federal income tax purposes. Where such differences are permanent in nature, they are reclassified in the components of net assets based on their ultimate characterization for federal income tax purposes. Any such reclassifications will have no effect on net assets, results of operations or net asset value per share.
USE OF ESTIMATES
The preparation of financial statements in conformity with U.S. generally accepted accounting principles (GAAP) requires management to make estimates and assumptions that affect the reported amounts of assets and liabilities and disclosure of contingent assets and liabilities at the date of the financial statements and the reported amounts of increases and decreases in net assets from operations during the reporting period. Actual results could differ from those estimates.
OPTION WRITING
When the Fund writes an option, an amount equal to the premium received by the Fund is recorded as a liability and subsequently adjusted to the current fair value of the option written. Premiums received from writing options that expire unexercised are treated by the fund on the expiration date as realized gains from investments. The difference between the premium and amount paid on effecting a closing purchase transaction, including brokerage commissions, is also treated as
CONCORDE VALUE FUND
NOTES TO FINANCIAL STATEMENTS
Note 1 – Nature of Business and Summary of Significant Accounting Policies (continued)
OPTION WRITING (continued)
a realized gain or, if the premium is less than the amount paid for the closing purchase transaction, as a realized loss. If a call option is exercised, the premium is added to the proceeds from the sale of the underlying security or currency in determining whether the Fund has realized a gain or loss. The Fund as writer of an option bears the market risk of an unfavorable change in the price of the security underlying the written option.
Note 2 – Fair Value Measurements
The Fund utilizes various methods to measure the fair value of its investments on a recurring basis. GAAP establishes a hierarchy that prioritizes inputs to valuation techniques used to measure fair value. The three levels of inputs are as follows:
| | Level 1 – | Quoted unadjusted prices in active markets for identical assets or liabilities that the Fund has the ability to access at the date of measurement. |
| | Level 2 – | Quoted prices for similar instruments in active markets; quoted prices for identical or similar instruments in markets that are not active; and model-derived valuations in which all significant inputs and significant value drivers are observable in active markets. Level 2 inputs are those in markets for which there are few transactions, the prices are not current, little public information exists or instances where prices vary substantially over time or among brokered market makers. |
| | Level 3 – | Model derived valuations in which one or more significant inputs or significant value drivers are unobservable. Unobservable inputs are those inputs that reflect the Fund’s own assumptions that market participants would use in valuing the asset or liability based on the best available information. |
Following is a description of the valuation techniques applied to the Fund’s major categories of assets and liabilities measured at fair value on a recurring basis.
Equity Securities (common and preferred stock) – Securities traded on a national securities exchange (or reported on the NASDAQ national market) are valued at the last reported sale price on the exchange on which such securities are traded, as of the close of business on the day the securities are being valued or, lacking any reported sales, at the mean between the last available bid and asked price, except for call options written for which the last quoted bid price is used. To the extent these securities are actively traded, and valuation adjustments are not applied, they are categorized in Level 1 of the fair value hierarchy.
Mutual Funds – Mutual funds are generally priced at the ending net asset value provided by the service agent of the Funds and are classified as Level 1 securities.
CONCORDE VALUE FUND
NOTES TO FINANCIAL STATEMENTS
Note 2 – Fair Value Measurements (continued)
Bonds & Notes – Bonds and notes are valued at the last quoted bid price obtained from independent pricing services. Short-term notes and certificates of deposit are valued using amortized cost, which approximates fair value. Short-term debt obligations with remaining maturities in excess of 60 days are valued at current market prices.
Short-Term Debt Securities – Fixed income securities with maturities of less than 60 days when acquired, or which subsequently are within 60 days of maturity, are valued by using amortized cost, which approximates fair value. Short-term securities with 60 days or less remaining to maturity are, unless conditions indicate otherwise, amortized to maturity based on their cost to the Fund if acquired within 60 days of maturity or, if already held by the Fund on the 60th day, based on the value determined on the 61st day.
All other assets of the Fund are valued in such manner as the Board in good faith deems appropriate to reflect their fair value.
Securities for which market quotations are not readily available or if the closing price does not represent fair value, are valued at fair value as determined in good faith following procedures approved by the Board. Factors used in determining fair value vary by investment type and may include: trading volume of security and markets, value of other like securities and news events with direct bearing to security or market. Depending on the valuation inputs, these securities may be classified in either Level 2 or Level 3 of the fair value hierarchy.
CONCORDE VALUE FUND
NOTES TO FINANCIAL STATEMENTS
Note 2 – Fair Value Measurements (continued)
The following table summarizes the inputs used to value the Fund’s investments measured at fair value as of March 31, 2015:
| | | | Level 1 | | | Level 2 | | | Level 3 | | | Total | |
| | Common Stocks | | | | | | | | | | | | |
| | All Other Outpatient Care Centers | | $ | 344,899 | | | $ | — | | | $ | — | | | $ | 344,899 | |
| | Automobile Manufacturing | | | 338,940 | | | | — | | | | — | | | | 338,940 | |
| | Breweries | | | 329,157 | | | | — | | | | — | | | | 329,157 | |
| | Cable & Other Subscription Programming | | | 703,505 | | | | — | | | | — | | | | 703,505 | |
| | Clothing Accessories Stores | | | 402,120 | | | | — | | | | — | | | | 402,120 | |
| | Computer Systems Design Services | | | 321,000 | | | | — | | | | — | | | | 321,000 | |
| | Crude Petroleum & Natural Gas Extraction | | | 540,384 | | | | — | | | | — | | | | 540,384 | |
| | Direct Property & Casualty Insurance Carriers | | | 811,006 | | | | — | | | | — | | | | 811,006 | |
| | Fats & Oils Refining & Blending | | | 359,136 | | | | — | | | | — | | | | 359,136 | |
| | Full-Service Restaurants | | | 485,380 | | | | — | | | | — | | | | 485,380 | |
| | General Medical and Surgical Hospitals | | | 413,765 | | | | — | | | | — | | | | 413,765 | |
| | Home Centers | | | 334,755 | | | | — | | | | — | | | | 334,755 | |
| | Insurance Agencies & Brokerages | | | 451,764 | | | | — | | | | — | | | | 451,764 | |
| | Line-Haul Railroads | | | 606,536 | | | | — | | | | — | | | | 606,536 | |
| | Local Messengers & Local Delivery | | | 193,880 | | | | — | | | | — | | | | 193,880 | |
| | Motion Picture & Video Production | | | 363,092 | | | | — | | | | — | | | | 363,092 | |
| | Natural Gas Distribution | | | 378,540 | | | | — | | | | — | | | | 378,540 | |
| | Pesticide & Other Agricultural | | | | | | | | | | | | | | | | |
| | Chemical Manufacturing | | | 364,497 | | | | — | | | | — | | | | 364,497 | |
| | Pharmaceutical Preparation Manufacturing | | | 291,740 | | | | — | | | | — | | | | 291,740 | |
| | Racetracks | | | 234,792 | | | | — | | | | — | | | | 234,792 | |
| | Software Publishers | | | 729,852 | | | | — | | | | — | | | | 729,852 | |
| | Support Activities for Oil & Gas Operations | | | 219,400 | | | | — | | | | — | | | | 219,400 | |
| | Wood Kitchen Cabinet & | | | | | | | | | | | | | | | | |
| | Countertop Manufacturing | | | 284,880 | | | | — | | | | — | | | | 284,880 | |
| | Total Common Stocks | | | 9,503,020 | | | | — | | | | — | | | | 9,503,020 | |
| | Closed-End Funds | | | 258,192 | | | | — | | | | — | | | | 258,192 | |
| | Open-End Funds | | | 422,199 | | | | — | | | | — | | | | 422,199 | |
| | REITs | | | | | | | | | | | | | | | | |
| | Lessors of Miniwarehouses & Self-Storage Units | | | 294,800 | | | | — | | | | — | | | | 294,800 | |
| | Total REITs | | | 294,800 | | | | — | | | | — | | | | 294,800 | |
| | Royalty Trust | | | | | | | | | | | | | | | | |
| | Commercial & Institutional Building Construction | | | 391,095 | | | | — | | | | — | | | | 391,095 | |
| | Total Royalty Trust | | | 391,095 | | | | — | | | | — | | | | 391,095 | |
| | Short-Term Investments | | | 575,918 | | | | — | | | | — | | | | 575,918 | |
| | Total Investments | | $ | 11,445,224 | | | $ | — | | | $ | — | | | $ | 11,445,224 | |
CONCORDE VALUE FUND
NOTES TO FINANCIAL STATEMENTS
Note 2 – Fair Value Measurements (continued)
Transfers between levels are recognized at the end of the reporting period. There were no transfers between Level 1 and Level 2 during the year. There were no Level 3 investments held by the Fund during the period ended March 31, 2015.
Note 3 – Capital Share Transactions
As of March 31, 2015, there were 30,000,000 shares of $1 par value capital stock authorized of which 9,841,293 shares are classified as the Fund’s series and the remaining balance is unallocated for future use. As of March 31, 2015, capital paid-in aggregated $7,375,807.
Transactions in shares of capital stock for the period ended March 31, 2015 and September 30, 2014 were as follows:
| | | Six Months Ended | | | | | | | |
| | | March 31, 2015 | | | Year Ended | |
| | | (Unaudited) | | | September 30, 2014 | |
| | | Shares | | | Amount | | | Shares | | | Amount | |
| Shares sold | | | 2,303 | | | $ | 36,000 | | | | 12,727 | | | $ | 207,100 | |
| Shares issued in reinvestment of dividends | | | 63,506 | | | | 953,218 | | | | 1,742 | | | | 25,654 | |
| | | | 65,809 | | | | 989,218 | | | | 14,469 | | | | 232,754 | |
| Shares redeemed | | | (55,314 | ) | | | (863,192 | ) | | | (88,015 | ) | | | (1,386,148 | ) |
| Net increase (decrease) | | | 10,495 | | | $ | 126,026 | | | | (73,546 | ) | | $ | (1,153,394 | ) |
On November 19, 2014, a distribution of $1.35 per share was declared from net investment income. The dividend was paid on December 11, 2014, to shareholders of record on December 10, 2014.
Note 4 – Investment Transactions
The aggregate cost of purchases and proceeds from sales of investment securities, excluding short-term investments, were $2,715,573 and $3,554,352, respectively. The cost of purchases and proceeds from sales of short-term securities aggregated $3,088,382 and $3,101,445 respectively, for the period ended March 31, 2015.
Note 5 – Investment Advisory Fees and Other Transactions with Affiliates
The Fund has an Investment Advisory Agreement (Advisory Agreement) with Concorde Financial Corporation dba Concorde Investment Management (Concorde) to act as the Fund’s investment advisor. Concorde provides the Fund with investment management and advisory services consistent with the Fund’s investment objectives, policies and restrictions, and supervises the purchase and sale of investment transactions on behalf of the Fund. For such services, Concorde receives an annual fee of 0.90% of the Fund’s average daily net assets, computed daily and paid on a monthly basis. The investment advisory fee was $51,652 for the period ended March 31, 2015, of which $8,768 was payable at March 31, 2015.
CONCORDE VALUE FUND
NOTES TO FINANCIAL STATEMENTS
Note 5 – Investment Advisory Fees and Other Transactions with Affiliates (continued)
Certain directors and officers of the Company are also directors, officers and/or employees of Concorde.
Note 6 – Federal Tax Information
The tax character of distributions paid during the period ended March 31, 2015 and September 30, 2014 was as follows:
| | | Six Months Ended | | | | | |
| | | March 31, 2015 | | September 30, 2014 | |
| | Ordinary income | | $ | — | | | | $ | 25,654 | | |
| | Long term capital gains income | | $ | 953,218 | | | | $ | — | | |
Note 7 – Subsequent Events
Management has evaluated the Fund’s events and transactions that occurred subsequent to March 31, 2015 through the date of issuance of the Fund’s financial statements. There were no events or transactions that occurred during this period that materially impacted the amounts or disclosures in the Fund’s financial statements.
BOARD APPROVAL OF CONTINUATION OF INVESTMENT ADVISORY AGREEMENT (Unaudited)
At its meeting held on November 19, 2014, the Board of Directors (the “Board”) of Concorde Funds, Inc. (the “Company”) including all the Directors who are not “interested persons” (as defined in the Investment Company Act of 1940) considered and then voted to re-approve the current investment advisory agreement (the “Advisory Agreement”) between Concorde Financial Corporation (the “Advisor”) and the Company, on behalf of the Concorde Value Fund (the “Fund”). In connection with its re-approval of the Advisory Agreement, the Board reviewed and discussed the specific services provided by the Advisor. The Board considered the following factors:
The Advisor:
| | 1) | Provides daily investment management for the Concorde Value Fund. In providing investment management, Concorde Financial Corporation will oversee the trading of securities and the rebalancing of the portfolio. |
| | 2) | Retains the services of the Fund’s Chief Compliance Officer and will make all reasonable efforts to insure that the Fund is in compliance with the securities laws. |
| | 3) | Provide responsive customer and shareholder servicing which consists of responding to shareholder inquiries received, including specific mutual fund account information, in addition to calls directed to the transfer agent call center. |
| | 4) | Oversees distribution of the Fund through third-party broker/dealers and independent financial institutions. |
| | 5) | Oversees those third party service providers that support the Fund in providing fund accounting, fund administration, transfer agency and custodial services. |
The Board also: (i) compared the performance of the Fund to benchmark indices over various periods of time and concluded that the performance of the Fund, articulately on a risk-adjusted basis, warranted the continuation of the Advisory Agreement; (ii) compared the expense ratios of funds similar in asset size and investment objective to those of the Fund and concluded the expenses of the Fund were reasonable and warranted continuation of the Advisory Agreement; (iii) considered the fees charged by Concorde Financial Corporation to those of funds similar in asset size and investment objective to the Fund and concluded the advisory fees of the Fund were reasonable and warranted continuation of the Advisory Agreement; and (iv) considered the profitability of Concorde Financial Corporation with respect to the Fund, and concluded that the profits were reasonable and not excessive when compared to profitability guidelines set forth in relevant court cases.
The Board then discussed economies of scale and breakpoints and determined that the Fund, managed by Concorde Financial Corporation, has not yet grown in size, nor has the marketplace demonstrated significant rapid potential growth to any extent, that would warrant the imposition of breakpoints.
The Board reviewed the Fund’s expense ratios and comparable expense ratios for similar funds. The Board used data from Lipper, as presented in the charts in the Board Materials, showing funds classified by Lipper as Multi-Cap Value Funds, similar in nature to the Concorde Value Fund. The Board determined that the total expense ratio of the Fund falls within the range of the ratios of other funds in the Multi-Cap Value classification. The Board also referenced Concorde Financial Corporation’s Form ADV and a copy of the current Investment Advisory Agreement. They also referenced a Concorde Investment Management Fee and Service Agreement to compare fees charged by the Advisor to their other clients versus what they charge the Fund. After further discussion and upon a motion duly made and seconded, the Directors, including a majority of Directors who are not “interested persons,” as defined by the 1940 Act, of the Corporation unanimously approved the Continuation of Investment Advisory Agreement.
ADDITIONAL INFORMATION (Unaudited)
PROXY VOTING POLICIES AND PROCEDURES
For a description of the policies and procedures that the Fund uses to determine how to vote proxies relating to the portfolio securities, please call (972) 701-5400 and request a Statement of Additional Information. One will be mailed to you free of charge. The Statement of Additional Information is also available on the website of the Securities and Exchange Commission at http://www.sec.gov.
PROXY VOTING RECORDS
Information on how the Fund voted proxies relating to portfolio securities during the twelve month period ending June 30, 2013 is available without charge, upon request, by calling (972) 701-5400. Furthermore, you can obtain the Fund’s proxy voting records on the Securities and Exchange Commission’s website at http://www.sec.gov.
QUARTERLY FILINGS ON FORM N-Q
The Fund files its complete schedule of portfolio holdings with the Securities and Exchange Commission for the first and third quarters of each fiscal quarter on Form N-Q. The Fund’s Form N-Q is available (i) without charge, upon request, by calling (972) 701-5400, (ii) on the Securities and Exchange Commission’s website at http://www.sec.gov, or (iii) at the Securities and Exchange Commission’s public reference room.
DIRECTORS AND OFFICERS
The Fund’s Statement of Additional Information includes additional information about the Fund’s Directors and Officers and is available, without charge, upon request by calling (972) 701-5400.
HOUSEHOLD DELIVERY OF SHAREHOLDER DOCUMENTS
In an effort to decrease costs, the FUND intends to reduce the number of duplicate prospectuses and Annual and Semi-Annual Reports you receive by sending only one copy of each to those addresses shared by two or more accounts and to shareholders we reasonably believe are from the same family or household. Once implemented, if you would like to discontinue householding for your accounts, please call toll-free at 1-800-294-1699 to request individual copies of these documents. Once the FUND receives notice to stop householding, we will begin sending individual copies thirty days after receiving your request. This policy does not apply to account statements.
(This Page Intentionally Left Blank.)
INVESTMENT ADVISOR
Concorde Investment Management
1000 Three Lincoln Centre
5430 LBJ Freeway LB3
Dallas, Texas 75240
OFFICERS
Gary B. Wood, Ph.D.
President
Gregory B. Wood
Treasurer
John A. Stetter
Secretary
DIRECTORS
William Marcy, P.E., Ph.D.
John H. Wilson
Gary B. Wood, Ph.D.
CUSTODIAN
U.S. Bank, N.A.
Custody Operations
1555 North RiverCenter Drive, Suite 302
Milwaukee, Wisconsin 53212
TRANSFER AGENT AND
DIVIDEND DISBURSING AGENT
U.S. Bancorp Fund Services, LLC
Mutual Fund Services, 3rd Floor
615 East Michigan Street
Milwaukee, Wisconsin 53202
INDEPENDENT REGISTERED
PUBLIC ACCOUNTING FIRM
Brad A. Kinder, CPA
815 Parker Square
Flower Mound, Texas 75028
LEGAL COUNSEL
Foley & Lardner LLP
777 East Wisconsin Avenue
Milwaukee, Wisconsin 53202
TELEPHONE
(972) 701-5400
(Fund information)
(800) 294-1699
(Shareholder account information)
Item 2. Code of Ethics.
Not applicable for semi-annual reports.
Item 3. Audit Committee Financial Expert.
Not applicable for semi-annual reports.
Item 4. Principal Accountant Fees and Services.
Not applicable for semi-annual reports.
Item 5. Audit Committee of Listed Registrants.
Not applicable to registrants who are not listed issuers (as defined in Rule 10A-3 under the Securities Exchange Act of 1934).
Item 6. Investments.
| (a) | Schedule of Investments is included as part of the report to shareholders filed under Item 1 of this Form. |
(b) Not Applicable
Item 7. Disclosure of Proxy Voting Policies and Procedures for Closed-End Management Investment Companies.
Not applicable to open-end investment companies.
Item 8. Portfolio Managers of Closed-End Management Investment Companies.
Not applicable to open-end investment companies.
Item 9. Purchases of Equity Securities by Closed-End Management Investment Company and Affiliated Purchasers.
Not applicable to open-end investment companies.
Item 10. Submission of Matters to a Vote of Security Holders.
Not Applicable.
Item 11. Controls and Procedures.
| (a) | The Registrant’s President and Treasurer have reviewed the Registrant's disclosure controls and procedures (as defined in Rule 30a-3(c) under the Investment Company Act of 1940 (the “Act”)) as of a date within 90 days of the filing of this report, as required by Rule 30a-3(b) under the Act and Rules 13a-15(b) or 15d-15(b) under the Securities Exchange Act of 1934. Based on their review, such officers have concluded that the disclosure controls and procedures are effective in ensuring that information required to be disclosed in this report is appropriately recorded, processed, summarized and reported and made known to them by others within the Registrant and by the Registrant’s service provider. |
| (b) | There were no changes in the Registrant's internal control over financial reporting (as defined in Rule 30a-3(d) under the Act) that occurred during the second fiscal quarter of the period covered by this report that has materially affected, or is reasonably likely to materially affect, the Registrant's internal control over financial reporting. |
Item 12. Exhibits.
| (a) | (1) Any code of ethics or amendment thereto, that is the subject of the disclosure required by Item 2, to the extent that the registrant intends to satisfy Item 2 requirements through filing an exhibit. Not Applicable for semi-annual reports |
(2) A separate certification for each principal executive and principal financial officer pursuant to Section 302 of the Sarbanes-Oxley Act of 2002. Filed herewith.
(3) Any written solicitation to purchase securities under Rule 23c-1 under the Act sent or given during the period covered by the report by or on behalf of the registrant to 10 or more persons. Not applicable to open-end investment companies.
| (b) | Certifications pursuant to Section 906 of the Sarbanes-Oxley Act of 2002. Furnished herewith. |
SIGNATURES
Pursuant to the requirements of the Securities Exchange Act of 1934 and the Investment Company Act of 1940, the registrant has duly caused this report to be signed on its behalf by the undersigned, thereunto duly authorized.
(Registrant) Concorde Funds, Inc.
By (Signature and Title)* /s/Gary B. Wood
Gary B. Wood, President
Date 05/28/2015
Pursuant to the requirements of the Securities Exchange Act of 1934 and the Investment Company Act of 1940, this report has been signed below by the following persons on behalf of the registrant and in the capacities and on the dates indicated.
By (Signature and Title)* /s/Gary B. Wood
Gary B. Wood, President
Date 05/28/2015
By (Signature and Title)* /s/Gregory B. Wood
Gregory B. Wood, Treasurer
Date 05/27/2015
* Print the name and title of each signing officer under his or her signature.