UNITED STATES
SECURITIES AND EXCHANGE COMMISSION
Washington, D.C. 20549
Form N-CSR
CERTIFIED SHAREHOLDER REPORT OF REGISTERED
MANAGEMENT INVESTMENT COMPANIES
Investment Company Act File Number 811-5344
William Blair Funds
(Exact name of registrant as specified in charter)
| 222 West Adams Street, Chicago, IL | | 60606 |
| (Address of principal executive offices) | | (Zip Code) |
Michelle R. Seitz
William Blair Funds
222 West Adams Street, Chicago, IL 60606
(Name and address of agent for service)
Registrant’s telephone number, including area code: 312-236-1600
Date of fiscal year end: December 31,
Date of reporting period: June 30, 2013
Form N-CSR is to be used by management investment companies to file reports with the Commission not later than 10 days after the transmission to stockholders of any report that is required to be transmitted to stockholders under Rule 30e-1 under the Investment Company Act of 1940 (17 CFR 270.30e-1). The Commission may use the information provided on Form N-CSR in its regulatory, disclosure review, inspection, and policymaking roles.
A registrant is required to disclose the information specified by Form N-CSR, and the Commission will make this information public. A Registrant is not required to respond to the collection of information contained in Form N-CSR unless the form displays a currently valid Office of Management and Budget (“OMB”) control number. Please direct comments concerning the accuracy of the information collection burden estimates and any suggestions for reducing the burden to Secretary, Securities and Exchange Commission, 100 F Street, NE, Washington, DC 20549. The OMB has reviewed this collection of information under the clearance requirements of 44 U.S.C. (ss) 3507.
| Item 1. | June 30, 2013 Semi Annual Reports transmitted to shareholders. |
 | |
| | |
| | |
| | |
| | |
| | June 30, 2013 |
William Blair Funds Semiannual Report | |
| June 30, 2013 | William Blair Funds | 1 |
The views expressed in the commentary for each Fund reflect those of the portfolio management team only through the end of the period of the report as stated on the cover. The portfolio management team’s views are subject to change at any time based on market and other conditions and should not be construed as a recommendation. Statements involving predictions, assessments, analyses, or outlook for individual securities, industries, market sectors, and/or markets involve risks and uncertainties, and there is no guarantee they will come to pass.
This report is submitted for the general information of the shareholders of the William Blair Funds. It is not authorized for distribution to prospective investors unless accompanied or preceded by a prospectus of the William Blair Funds. Please carefully consider the Funds’ investment objectives, risks, charges, and expenses before investing. This and other information is contained in the Funds’ prospectus, which you may obtain by calling 1-800-742-7272. Read it carefully before you invest or send money.
| 2 | Semi-Annual Report | June 30, 2013 |
PERFORMANCE AS OF JUNE 30, 2013—CLASS N SHARES (Unaudited)
| | | | | | | | | | | | | | | 10 yr | | | | Overall |
| | | Year | | | | | | | | | (or since | | Inception | | Morningstar |
| | | To Date | | 1 yr | | 3yr | | 5 yr | | inception) | | Date | | Rating |
| Growth Fund | | | | | | | | | | | | | | | | | | | | | | | | |
| Class N | | | 11.54 | | | | 18.42 | | | | 16.23 | | | | 6.13 | | | | 7.80 | | | 3/20/1946 | | «««« |
| Morningstar Large Growth | | | 11.05 | | | | 17.23 | | | | 16.51 | | | | 5.57 | | | | 7.02 | | | | | Among 1,488 |
| Russell 3000® Growth Index | | | 12.23 | | | | 17.56 | | | | 18.78 | | | | 7.58 | | | | 7.57 | | | | | Large Growth Funds |
| S&P 500 | | | 13.82 | | | | 20.60 | | | | 18.45 | | | | 7.01 | | | | 7.30 | | | | | |
| | | | | | | | | | | | | | | | | | | | | | | | | |
| Large Cap Growth Fund | | | | | | | | | | | | | | | | | | | | | | | | |
| Class N | | | 9.34 | | | | 15.43 | | | | 16.42 | | | | 5.28 | | | | 5.44 | | | 12/27/1999 | | ««« |
| Morningstar Large Growth | | | 11.05 | | | | 17.23 | | | | 16.51 | | | | 5.57 | | | | 7.02 | | | | | Among 1,488 |
| Russell 1000® Growth Index | | | 11.80 | | | | 17.07 | | | | 18.68 | | | | 7.47 | | | | 7.40 | | | | | Large Growth Funds |
| | | | | | | | | | | | | | | | | | | | | | | | | |
| Mid Cap Growth Fund | | | | | | | | | | | | | | | | | | | | | | | | |
| Class N | | | 12.49 | | | | 16.56 | | | | 17.31 | | | | 8.59 | | | | 7.20 | | | 2/1/2006 | | «««« |
| Morningstar Mid-Cap Growth | | | 13.11 | | | | 19.79 | | | | 17.01 | | | | 6.07 | | | | — | | | | | Among 637 |
| Russell MidCap® Growth Index | | | 14.70 | | | | 22.88 | | | | 19.53 | | | | 7.61 | | | | 6.20 | | | | | Mid-Cap Growth Funds |
| | | | | | | | | | | | | | | | | | | | | | | | | |
| Small-Mid Cap Growth Fund | | | | | | | | | | | | | | | | | | | | | | | | |
| Class N | | | 19.07 | | | | 27.23 | | | | 19.05 | | | | 10.82 | | | | 8.93 | | | 12/29/2003 | | ««««« |
| Morningstar Mid-Cap Growth | | | 13.11 | | | | 19.79 | | | | 17.01 | | | | 6.07 | | | | — | | | | | Among 637 |
| Russell 2500TM Growth Index | | | 15.82 | | | | 24.03 | | | | 20.22 | | | | 8.94 | | | | 8.35 | | | | | Mid-Cap Growth Funds |
| | | | | | | | | | | | | | | | | | | | | | | | | |
| Small Cap Growth Fund | | | | | | | | | | | | | | | | | | | | | | | | |
| Class N | | | 23.65 | | | | 33.79 | | | | 15.15 | | | | 9.65 | | | | 9.45 | | | 12/27/1999 | | ««« |
| Morningstar Small Growth | | | 16.03 | | | | 22.25 | | | | 18.57 | | | | 8.33 | | | | 9.26 | | | | | Among 632 |
| Russell 2000® Growth Index | | | 17.44 | | | | 23.67 | | | | 19.97 | | | | 8.89 | | | | 9.62 | | | | | Small Growth Funds |
| | | | | | | | | | | | | | | | | | | | | | | | | |
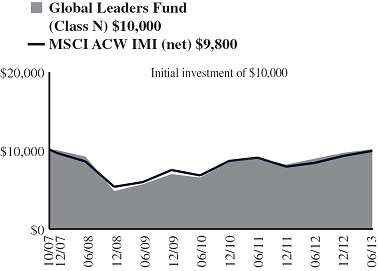
| Global Leaders Fund | | | | | | | | | | | | | | | | | | | | | | | | |
| Class N | | | 4.65 | | | | 12.93 | | | | 14.83 | | | | 1.89 | | | | 0.02 | | | 10/15/2007 | | ««« |
| Morningstar World Stock | | | 7.45 | | | | 18.01 | | | | 12.72 | | | | 3.25 | | | | — | | | | | Among 759 |
| MSCI All Country World IMI (net) | | | 6.40 | | | | 17.08 | | | | 12.60 | | | | 2.79 | | | | (0.35 | ) | | | | World Stock Funds |
| | | | | | | | | | | | | | | | | | | | | | | | | |
| Global Small Cap Growth Fund | | | | | | | | | | | | | | | | | | | | | | | | |
| Class N | | | — | | | | — | | | | — | | | | — | | | | 3.00 | | | 4/10/2013 | | Not rated. |
MSCI All Country World Small
Cap Index (net) | | | — | | | | — | | | | — | | | | — | | | | 0.75 | | | | | |
| | | | | | | | | | | | | | | | | | | | | | | | | |
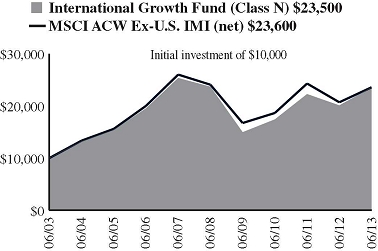
| International Growth Fund | | | | | | | | | | | | | | | | | | | | | | | | |
| Class N | | | 1.96 | | | | 17.13 | | | | 10.56 | | | | (0.13 | ) | | | 8.94 | | | 10/1/1992 | | ««« |
| Morningstar Foreign Large Growth | | | 1.83 | | | | 14.49 | | | | 9.88 | | | | 0.39 | | | | 8.16 | | | | | Among 223 |
MSCI All Country World Ex-U.S.
IMI (net) | | | 0.18 | | | | 13.91 | | | | 8.13 | | | | (0.41 | ) | | | 8.95 | | | | | Foreign Large Growth Funds |
| | | | | | | | | | | | | | | | | | | | | | | | | |
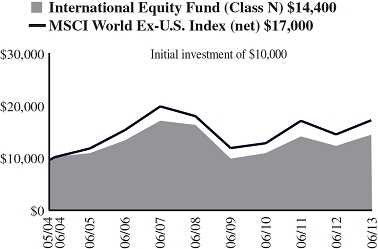
| International Equity Fund | | | | | | | | | | | | | | | | | | | | | | | | |
| Class N | | | 2.90 | | | | 15.72 | | | | 8.80 | | | | (2.23 | ) | | | 4.11 | | | 5/24/2004 | | «« |
| Morningstar Foreign Large Growth | | | 1.83 | | | | 14.49 | | | | 9.88 | | | | 0.39 | | | | — | | | | | Among 223 |
| MSCI World Ex-U.S. Index (net) | | | 3.01 | | | | 17.07 | | | | 9.43 | | | | (0.84 | ) | | | 5.99 | | | | | Foreign Large Growth Funds |
| | | | | | | | | | | | | | | | | | | | | | | | | |
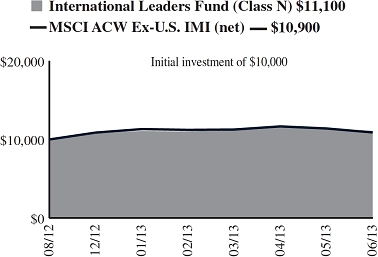
| International Leaders Fund | | | | | | | | | | | | | | | | | | | | | | | | |
| Class N | | | 2.50 | | | | — | | | | — | | | | — | | | | 10.86 | | | 8/16/2012 | | Not rated. |
| Morningstar Foreign Large Growth | | | 1.83 | | | | — | | | | — | | | | — | | | | — | | | | | |
MSCI All Country World Ex-U.S.
IMI (net) | | | 0.18 | | | | — | | | | — | | | | — | | | | 9.81 | | | | | |
| June 30, 2013 | William Blair Funds | 3 |
PERFORMANCE AS OF JUNE 30, 2013—CLASS N SHARES (Unaudited)—CONTINUED
| | | | | | | | | | | | | | | 10 yr | | | | Overall |
| | | Year | | | | | | | | | | | (or since | | Inception | | Morningstar |
| | | To Date | | 1 yr | | 3yr | | 5 yr | | inception) | | Date | | Rating |
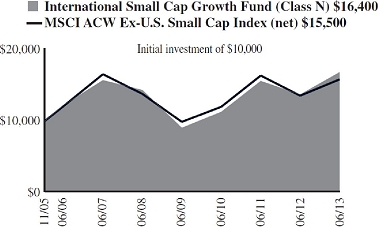
| International Small Cap Growth Fund | | | | | | | | | | | | | | | | | | | | | | | | |
| Class N | | | 6.91 | | | | 21.58 | | | | 13.47 | | | | 3.11 | | | | 6.67 | | | 11/1/2005 | | ««« |
| Morningstar Foreign Small/Mid Growth | | | 7.09 | | | | 22.11 | | | | 14.56 | | | | 3.32 | | | | — | | | | | Among 111 |
| MSCI All Country World Ex-U.S. Small Cap Index (net) | | | 1.83 | | | | 15.94 | | | | 9.16 | | | | 2.65 | | | | 5.85 | | | | | Foreign Small/Mid Growth Funds |
| | | | | | | | | | | | | | | | | | | | | | | | | |
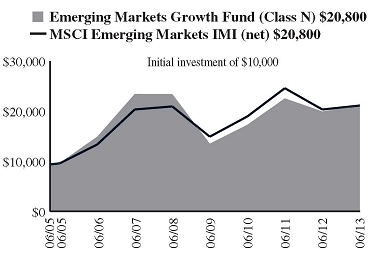
| Emerging Markets Growth Fund | | | | | | | | | | | | | | | | | | | | | | | | |
| Class N | | | (6.27 | ) | | | 5.66 | | | | 6.46 | | | | (1.87 | ) | | | 9.51 | | | 6/6/2005 | | ««« |
| Morningstar Diversified Emerging Markets | | | (7.78 | ) | | | 4.45 | | | | 3.44 | | | | (1.35 | ) | | | — | | | | | Among 366
Diversified Emerging Markets Funds |
| MSCI Emerging Markets IMI (net) | | | (8.89 | ) | | | 3.66 | | | | 3.43 | | | | 0.16 | | | | 9.49 | | | | | |
| | | | | | | | | | | | | | | | | | | | | | | | | |
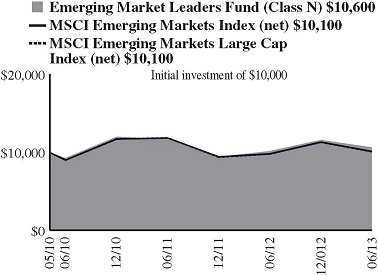
| Emerging Markets Leaders Fund | | | | | | | | | | | | | | | | | | | | | | | | |
| Class N | | | (7.50 | ) | | | 4.15 | | | | 4.16 | | | | — | | | | 1.88 | | | 5/3/2010 | | ««« |
| Morningstar Diversified Emerging Markets | | | (7.78 | ) | | | 4.45 | | | | 3.44 | | | | — | | | | — | | | | | Among 366
Diversified Emerging Markets Funds |
| MSCI Emerging Markets Index (net) | | | (9.57 | ) | | | 2.87 | | | | 3.38 | | | | — | | | | 0.36 | | | | | |
| | | | | | | | | | | | | | | | | | | | | | | | | |
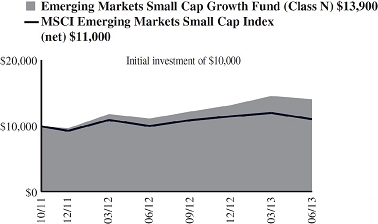
Emerging Markets Small Cap
Growth Fund | | | | | | | | | | | | | | | | | | | | | | | | |
| Class N | | | 6.54 | | | | 25.14 | | | | — | | | | — | | | | 21.67 | | | 10/24/2011 | | Not rated. |
Morningstar Diversified Emerging
Markets | | | (7.78 | ) | | | 4.45 | | | | — | | | | — | | | | — | | | | | |
| MSCI Emerging Markets Small Cap Index (net) | | | (3.58 | ) | | | 9.86 | | | | — | | | | — | | | | 6.04 | | | | | |
| | | | | | | | | | | | | | | | | | | | | | | | | |
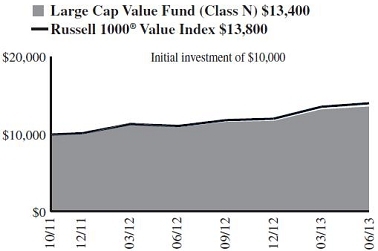
| Large Cap Value Fund | | | | | | | | | | | | | | | | | | | | | | | | |
| Class N | | | 15.08 | | | | 23.28 | | | | — | | | | — | | | | 19.12 | | | 10/24/2011 | | Not rated. |
| Morningstar Large Value | | | 14.94 | | | | 23.02 | | | | — | | | | — | | | | — | | | | | |
| Russell 1000® Value Index | | | 15.90 | | | | 25.32 | | | | — | | | | — | | | | 21.30 | | | | | |
| | | | | | | | | | | | | | | | | | | | | | | | | |
| Mid Cap Value Fund | | | | | | | | | | | | | | | | | | | | | | | | |
| Class N | | | 15.28 | | | | 25.04 | | | | 17.65 | | | | — | | | | 11.54 | | | 5/3/2010 | | ««« |
| Morningstar Mid-Cap Value | | | 15.98 | | | | 26.71 | | | | 17.61 | | | | — | | | | — | | | | | Among 369 |
| Russell Midcap® Value Index | | | 16.10 | | | | 27.65 | | | | 19.53 | | | | — | | | | 12.57 | | | | | Mid-Cap Value Funds |
| | | | | | | | | | | | | | | | | | | | | | | | | |
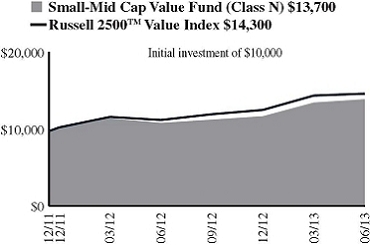
| Small-Mid Cap Value Fund | | | | | | | | | | | | | | | | | | | | | | | | |
| Class N | | | 16.74 | | | | 24.95 | | | | — | | | | — | | | | 22.40 | | | 12/15/2011 | | Not rated. |
| Morningstar Mid-Cap Value | | | 15.30 | | | | 25.62 | | | | — | | | | — | | | | — | | | | | |
| Russell 2500TM Value Index | | | 15.10 | | | | 26.88 | | | | — | | | | — | | | | 26.09 | | | | | |
| | | | | | | | | | | | | | | | | | | | | | | | | |
| Small Cap Value Fund | | | | | | | | | | | | | | | | | | | | | | | | |
| Class N | | | 17.58 | | | | 25.41 | | | | 17.09 | | | | 9.84 | | | | 9.36 | | | 12/23/1996 | | ««« |
| Morningstar Small Value | | | 15.30 | | | | 25.62 | | | | 16.70 | | | | 9.31 | | | | 9.95 | | | | | Among 295 |
| Russell 2000® Value Index | | | 14.39 | | | | 24.76 | | | | 17.33 | | | | 8.59 | | | | 9.30 | | | | | Small Value Funds |
| | | | | | | | | | | | | | | | | | | | | | | | | |
| Bond Fund | | | | | | | | | | | | | | | | | | | | | | | | |
| Class N | | | (3.37 | ) | | | 0.73 | | | | 4.84 | | | | 6.31 | | | | 5.80 | | | 5/1/2007 | | «««« |
| Morningstar Intermediate-Term Bond | | | (2.31 | ) | | | 0.91 | | | | 4.28 | | | | 5.60 | | | | — | | | | | Among 1,005 |
| Barclays U.S. Aggregate Bond Index | | | (2.44 | ) | | | (0.69 | ) | | | 3.51 | | | | 5.19 | | | | 5.18 | | | | | Intermediate-Term Bond Funds |
| 4 | Semi-Annual Report | June 30, 2013 |
PERFORMANCE AS OF JUNE 30, 2013—CLASS N SHARES (Unaudited)—CONTINUED
| | | | | | | | | | | | | | | 10 yr | | | | Overall |
| | | Year | | | | | | | | | | | (or since | | Inception | | Morningstar |
| | | To Date | | 1 yr | | 3yr | | 5 yr | | inception) | | Date | | Rating |
| Income Fund | | | | | | | | | | | | | | | | | | | | | | | | |
| Class N | | | (2.45 | ) | | | 0.45 | | | | 3.54 | | | | 4.36 | | | | 3.19 | | | 10/1/1990 | | ««« |
| Morningstar Short-term Bond | | | (0.54 | ) | | | 1.23 | | | | 2.10 | | | | 3.11 | | | | 2.86 | | | | | Among 360 |
| Barclays U.S. Intermediate | | | | | | | | | | | | | | | | | | | | | | | | Short-Term Bond Funds |
| Govt./Credit Bond Index | | | (1.45 | ) | | | 0.28 | | | | 3.14 | | | | 4.57 | | | | 4.03 | | | | | |
| | | | | | | | | | | | | | | | | | | | | | | | | |
| Low Duration Fund | | | | | | | | | | | | | | | | | | | | | | | | |
| Class N | | | (1.27 | ) | | | (0.09 | ) | | | 1.22 | | | | — | | | | 1.25 | | | 12/1/2009 | | ««« |
| Morningstar Ultra Short Bond | | | (0.03 | ) | | | 0.87 | | | | 1.07 | | | | — | | | | — | | | | | Among 88 |
| Bank of America Merrill Lynch 1-Year U.S. Treasury Note Index | | | 0.11 | | | | 0.32 | | | | 0.41 | | | | — | | | | 0.44 | | | | | Ultrashort Bond Funds |
Performance cited represents past performance. Past performance does not guarantee future results and current performance may be lower or higher than the data quoted. Results shown are average annual total returns, which assume reinvestment of dividends and capital gains. Investment returns and principal will fluctuate and you may have a gain or a loss when you sell shares. For the most current month-end performance information, please call 1-800-742-7272, or visit our Web site at www.williamblairfunds.com. From time to time, the investment advisor may waive fees or reimburse expenses for the Fund. Without these waivers, performance would be lower. Investing in smaller companies involves special risks, including higher volatility and lower liquidity. International and emerging markets investing involves special risk considerations, including currency fluctuations, lower liquidity, economic and political risk. As interest rates rise, bond prices will fall and bond funds may become more volatile. Class N shares are available to the general public without a sales load.
Morningstar RatingsTM are as of 06/30/2013 and are subject to change every month. The ratings are based on a risk-adjusted return measure that accounts for variation in a fund’s monthly performance, placing more emphasis on downward variations and rewarding consistent performance. The top 10% of funds in each Category receive 5 stars, the next 22.5% receive 4 stars, the middle 35% receive 3 stars, the next 22.5% receive 2 stars, and the bottom 10% receive 1 star. The Overall Morningstar Rating for a fund is derived from a weighted-average of the performance figures associated with its three-, five- and ten-year (if applicable) Morningstar Rating metrics. The 3/5/10 year Morningstar ratings were as follows: Growth Fund «««/«««/«««« and Large Cap Growth Fund «««/«««/««, out of 1,488/1,308/863 large growth funds; Small Cap Growth Fund ««/«««/«««, out of 632/558/362 small growth funds; Mid Cap Growth Fund «««/««««/NA and Small-Mid Cap Growth Fund ««««/«««««/NA out of 637/563/NA mid cap growth funds; Global Leaders Fund ««««/««/NA out of 759/603/NA world stock funds; International Growth Fund «««/«««/««« and International Equity Fund «««/««/NA out of 223/183/106 foreign large growth funds; International Small Cap Growth Fund «««/«««/NA out of 111/88/NA foreign small/mid growth funds; Emerging Markets Growth Fund ««««/««/NA and Emerging Markets Leaders Fund «««/NA/NA, out of 366/269/NA diversified emerging markets funds; Mid Cap Value Fund «««/NA/NA, out of 369/NA/NA mid-cap value funds; Small Cap Value Fund «««/««««/««« out of 295/254/151 small value funds; Income Fund ««««/««««/««« out of 360/322/217 short-term bond funds; Bond Fund ««««/««««/NA out of 1,005/873/NA intermediate-term bond funds; Low Duration Fund «««/NA/NA out of 88/NA/NA ultrashort bond funds.
Please carefully consider the Funds’ investment objectives, risks, charges, and expenses before investing. This and other information is contained in the Funds’ prospectus, which you may obtain by calling 1-800-742-7272. Read it carefully before you invest or send money.
| June 30, 2013 | William Blair Funds | 5 |
| | GROWTH FUND |
| | |
| | The Growth Fund seeks long-term capital appreciation. |
| | |
| | AN OVERVIEW FROM THE PORTFOLIO MANAGERS |
| | |

David C. Fording

John F. Jostrand
| The William Blair Growth Fund (Class N shares) posted an 11.54% increase, net of fees, for the six months ended June 30, 2013. By comparison, the Fund’s benchmark index, the Russell 3000® Growth Index (the “Index”), increased 12.23%. Market Review Solid economic and corporate performance provided an upward bias to the market in the first half of the year. Continued improvement in economic data, especially in housing and also employment data, pushed stocks to their 2013 highs through May. In June, the market witnessed its only, albeit minor, hiccup of the year as the Federal Reserve signaled an eventual slowdown in monetary easing (dubbed as the Federal Reserve’s “tapering”). The uncertainty sparked a rapid increase in long-term interest rates from historically low levels, pressuring the fixed income market. Stocks experienced a short-lived correction on worries less quantitative easing may become a drag on the economy and investor psychology. However, the period ended on a positive note, in part as investors realized the Federal Reserve would only taper to the extent the economy stayed on a sustainable path to recovery. Portfolio Results The Fund’s modest underperformance relative to the Index in the first half of the year is attributable to mixed stock selection and modest style headwinds. Investors’ gravitation to cheaper stocks (as defined by several valuation measures including price-to-earnings ratio), to which the Fund is underweight, served as a style headwind given the Fund’s higher growth orientation, and therefore, typical underweight to the cheapest segment of the market. This was true in March and even more so in April, periods in which the Fund underperformed. As far as stock selection, the Information Technology sector was a prime example of mixed results. The sector housed some of our biggest detractors from relative return such as Cognizant Technology Solutions, SolarWinds, and Real Page, but also some of our biggest winners such as Pandora Media and Google. Health Care stock selection was negative, with underperformances by Allergan and HMS Holdings. On the other hand, Green Mountain Coffee Roasters (Consumer Staples) and IntercontinentalExchange (Financials) stood out as positive contributors during the first half of the year. Outlook Looking forward, the importance of central bank policy over the past few years brings plans for future policy into the forefront. The “tapering” of quantitative easing by the Federal Reserve (i.e., the slowing of its bond buying program) and China’s ability to execute a soft landing for its decelerating economy will be closely watched by the marketplace for their impacts on economic growth, global capital flows, and investor psychology. In addition, a potential change in leadership at the Federal Reserve as well as fiscal debate in Washington D.C. regarding the debt ceiling could negatively impact investor psychology. However, we believe that U.S. corporate performance remains solid and that U.S. stocks have been a relative safe haven versus more interest rate-sensitive asset classes, commodities, and stocks outside the U.S. Broadly speaking, the U.S. housing market remains a tailwind for U.S. employment and growth as well. In the end, while we factor various economic scenarios into our stock picking, we focus our time on constructing the Fund from a bottom-up perspective. We continue to find good ideas across sectors, and are confident the Fund consists of well-managed companies with solid competitive positions whose stocks are at attractive valuations compared to the expected growth and consistency of their business. |
| 6 | Semi-Annual Report | June 30, 2013 |
Growth Fund
Performance Highlights (Unaudited)
| Average Annual Total Return at 6/30/2013 |
| | | Year
to Date | | 1 Year | | 3 Year | | 5 Year | | 10 Year |
| Class N | | | 11.54 | % | | | 18.42 | % | | | 16.23 | % | | | 6.13 | % | | | 7.80 | % |
| Class I | | | 11.76 | | | | 18.84 | | | | 16.63 | | | | 6.49 | | | | 8.13 | |
| Russell 3000® Growth Index | | | 12.23 | | | | 17.56 | | | | 18.78 | | | | 7.58 | | | | 7.57 | |
| S&P 500 | | | 13.82 | | | | 20.60 | | | | 18.45 | | | | 7.01 | | | | 7.30 | |
Performance cited represents past performance. Past performance does not guarantee future results and current performance may be lower or higher than the data quoted. Results shown are average annual returns, which assume reinvestment of dividends and capital gains. Investment returns and principal will fluctuate and you may have a gain or loss when you sell shares. For the most current month-end performance information, please call 1-800-742-7272, or visit our Web site at www.williamblairfunds.com. Class N shares are available to the general public without a sales load. Class I shares are available to certain institutional investors and advisory clients of William Blair & Company L.L.C. without a sales load or distribution (12b-1) or service fees.
The performance highlights and graph presented above do not reflect the deduction of taxes that a shareholder would pay on fund distributions or the redemption of fund shares.
The Russell 3000® Growth Index consists of large, medium, and small capitalization companies with above average price-to-book ratios and forecasted growth rates. The index is weighted by market capitalization and large/medium/small companies make up approximately 80%/15%/5% of the index.
The S&P 500 Index indicates broad larger capitalization equity market performance.
This report identifies the Fund’s investments on June 30, 2013. These holdings are subject to change. Not all stocks in the Fund performed the same, nor is there any guarantee that these stocks will perform as well in the future. Market forecasts provided in this report may not necessarily come to pass.
Sector Diversification (Unaudited)
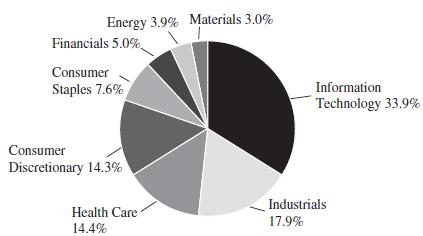
The sector diversification shown is based on the total long-term securities.
| June 30, 2013 | William Blair Funds | 7 |
Growth Fund
Portfolio of Investments, June 30, 2013 (all dollar amounts in thousands) (unaudited)
| | Issuer | | Shares | | | Value | |
| | | | | | | | | |
| | Common Stocks | | | | | | | | | |
| | | | | | | | | | | |
| | Information Technology—33.6% | | | | | | | | | |
| * | Akamai Technologies, Inc. | | | 204,900 | | | | $ | 8,719 | |
| | Apple, Inc. | | | 72,885 | | | | | 28,868 | |
| * | Citrix Systems, Inc. | | | 116,400 | | | | | 7,022 | |
| * | Cognizant Technology Solutions
Corporation | | | 403,400 | | | | | 25,257 | |
| * | eBay, Inc. | | | 363,600 | | | | | 18,805 | |
| | FactSet Research Systems, Inc. | | | 61,400 | | | | | 6,259 | |
| | Genpact, Ltd.† | | | 1,055,305 | | | | | 20,304 | |
| * | Google, Inc. | | | 51,405 | | | | | 45,255 | |
| | Mastercard, Inc. | | | 64,200 | | | | | 36,883 | |
| * | Pandora Media, Inc. | | | 977,183 | | | | | 17,980 | |
| | QUALCOMM, Inc. | | | 301,140 | | | | | 18,394 | |
| * | RealPage, Inc. | | | 525,275 | | | | | 9,634 | |
| * | Red Hat, Inc. | | | 189,006 | | | | | 9,038 | |
| * | SolarWinds, Inc. | | | 385,700 | | | | | 14,969 | |
| | | | | | | | | | 267,387 | |
| | | | | | | | | | | |
| | Industrials—17.7% | | | | | | | | | |
| * | B/E Aerospace, Inc. | | | 137,200 | | | | | 8,655 | |
| | Equifax, Inc. | | | 198,400 | | | | | 11,692 | |
| | Fastenal Co. | | | 232,458 | | | | | 10,658 | |
| * | IHS, Inc. | | | 79,922 | | | | | 8,342 | |
| * | Jacobs Engineering Group, Inc. | | | 222,956 | | | | | 12,292 | |
| | Precision Castparts Corporation | | | 118,000 | | | | | 26,669 | |
| * | Stericycle, Inc. | | | 141,400 | | | | | 15,615 | |
| | TransDigm Group, Inc. | | | 77,180 | | | | | 12,099 | |
| * | Trimas Corporation | | | 268,022 | | | | | 9,992 | |
| | Union Pacific Corporation | | | 159,800 | | | | | 24,654 | |
| | | | | | | | | | 140,668 | |
| | | | | | | | | | | |
| | Health Care—14.2% | | | | | | | | | |
| | Allergan, Inc. | | | 213,500 | | | | | 17,985 | |
| * | Gilead Sciences, Inc. | | | 427,070 | | | | | 21,870 | |
| * | Haemonetics Corporation | | | 357,597 | | | | | 14,787 | |
| * | HMS Holdings Corporation | | | 432,362 | | | | | 10,074 | |
| * | IDEXX Laboratories, Inc. | | | 220,618 | | | | | 19,807 | |
| * | NxStage Medical, Inc. | | | 647,761 | | | | | 9,250 | |
| | Perrigo Co. | | | 160,400 | | | | | 19,409 | |
| | | | | | | | | | 113,182 | |
| | | | | | | | | | | |
| | Consumer Discretionary—14.2% | | | | | | | | | |
| * | Amazon.com, Inc. | | | 74,000 | | | | | 20,549 | |
| * | Discovery Communications, Inc. | | | 144,800 | | | | | 11,180 | |
| | Harley-Davidson, Inc. | | | 265,499 | | | | | 14,555 | |
| * | K12, Inc. | | | 164,013 | | | | | 4,309 | |
| | Lowe’s Cos., Inc. | | | 247,800 | | | | | 10,135 | |
| * | Sally Beauty Holdings, Inc. | | | 358,800 | | | | | 11,159 | |
| | Tractor Supply Co. | | | 73,900 | | | | | 8,691 | |
| | VF Corporation | | | 93,300 | | | | | 18,012 | |
| | Yum! Brands, Inc. | | | 206,700 | | | | | 14,333 | |
| | | | | | | | | | 112,923 | |
| | Issuer | | Shares or
Principal
Amount | | | Value | |
| | | | | | | | | |
| | Common Stocks—(continued) | | | | | | | | | |
| | | | | | | | | | | |
| | Consumer Staples—7.5% | | | | | | | | | |
| | Costco Wholesale Corporation | | | 283,200 | | | | $ | 31,313 | |
| * | Green Mountain Coffee Roasters, Inc. | | | 150,300 | | | | | 11,282 | |
| | Mead Johnson Nutrition Co. | | | 219,200 | | | | | 17,367 | |
| | | | | | | | | | 59,962 | |
| | | | | | | | | | | |
| | Financials—4.9% | | | | | | | | | |
| * | Encore Capital Group, Inc. | | | 354,921 | | | | | 11,752 | |
| * | IntercontinentalExchange, Inc. | | | 96,700 | | | | | 17,189 | |
| | LPL Financial Holdings, Inc. | | | 266,400 | | | | | 10,059 | |
| | | | | | | | | | 39,000 | |
| | | | | | | | | | | |
| | Energy—3.9% | | | | | | | | | |
| * | Cameron International Corporation | | | 138,447 | | | | | 8,467 | |
| | Schlumberger, Ltd.† | | | 309,500 | | | | | 22,179 | |
| | | | | | | | | | 30,646 | |
| | | | | | | | | | | |
| | Materials—3.0% | | | | | | | | | |
| | Airgas, Inc. | | | 121,800 | | | | | 11,627 | |
| | Ecolab, Inc. | | | 144,720 | | | | | 12,329 | |
| | | | | | | | | | 23,956 | |
| | | | | | | | | | | |
| | Total Common Stocks—99.0%
(cost $608,829) | | | | | | | | 787,724 | |
| | | | | | | | | | | |
| | Repurchase Agreement | | | | | | | | | |
| | Fixed Income Clearing Corporation, 0.010%
dated 6/28/13, due 7/1/13, repurchase
price $5,550, collateralized by U.S.
Treasury Note, 0.750%, due 10/31/2017 . | | | $5,550 | | | | | 5,550 | |
| | | | | | | | | | | |
| | Total Repurchase Agreement—0.7%
(cost $5,550) | | | | | | | | 5,550 | |
| | | | | | | | | | | |
| | Total Investments—99.7%
(cost $614,379) | | | | | | | | 793,274 | |
| | Cash and other assets, less
liabilities—0.3% | | | | | | | | 2,293 | |
| | Net assets—100.0% | | | | | | | $ | 795,567 | |
* Non-income producing securities
† = U.S. listed foreign security
See accompanying Notes to Financial Statements.
| 8 | Semi-Annual Report | June 30, 2013 |
| | LARGE CAP GROWTH FUND |
| | |
| | The Large Cap Growth Fund seeks long-term capital appreciation. |
| | |
| | AN OVERVIEW FROM THE PORTFOLIO MANAGERS |
| | |
 James S. Golan 
David P. Ricci | The William Blair Large Cap Growth Fund (Class N shares) posted a 9.34% increase, net of fees, for the six months ended June 30, 2013. By comparison, the Fund’s benchmark index, the Russell 1000® Growth Index (the “Index”), increased 11.80%. Market Review Solid economic and corporate performance provided an upward bias to the market in the first half of the year. Continued improvement in economic data, especially in housing and also employment data, pushed stocks to their 2013 highs through May. In June, the market witnessed its only, albeit minor, hiccup of the year as the Federal Reserve signaled an eventual slowdown in monetary easing (dubbed as the Federal Reserve’s “tapering”). The uncertainty sparked a rapid increase in long-term interest rates from historically low levels, pressuring the fixed income market. Stocks experienced a short-lived correction on worries less quantitative easing may become a drag on the economy and investor psychology. However, the period ended on a positive note, in part as investors realized the Federal Reserve would only taper to the extent the economy stayed on a sustainable path to recovery. Portfolio Results The Fund’s underperformance relative to the Index in the first half of the year is attributable to style headwinds and stock selection. Investors’ gravitation to cheaper stocks (as defined by several valuation measures including price-to-earnings ratio), to which the Fund is underweight, served as a style headwind given the Fund’s typical underweight to this segment of the market. It is worth noting that this dynamic reversed late in the period (along with the Fund’s relative performance) as interest rates increased, seemingly reducing demand for the cheaper, higher dividend yielding stocks the market desired in the historically low interest rate environment. Stock selection in Information Technology was the largest source of underperformance. Cognizant Technology Solutions and Apple Inc. were the primary detractors in the sector. Allergan within Health Care was another meaningful detractor from return. On the upside, Green Mountain Coffee Roasters (Consumer Staples) and Financials stock selection (JPMorgan Chase and Affiliated Managers Group) helped the Fund partially keep pace with the market. Outlook Looking forward, the importance of central bank policy over the past few years brings plans for future policy into the forefront. The “tapering” of quantitative easing by the Federal Reserve (i.e., the slowing of its bond buying program) and China’s ability to execute a soft landing for its decelerating economy will be closely watched by the marketplace for their impacts on economic growth, global capital flows, and investor psychology. In addition, a potential change in leadership at the Federal Reserve as well as fiscal debate in Washington D.C. regarding the debt ceiling could negatively impact investor psychology. However, we believe that U.S. corporate performance remains solid and that U.S. stocks have been a relative safe haven versus more interest rate-sensitive asset classes, commodities, and stocks outside the U.S. Broadly speaking, the U.S. housing market remains a tailwind for U.S. employment and growth as well. In the end, while we factor various economic scenarios into our stock picking, we focus our time on constructing the Fund from a bottom-up perspective. We continue to find good ideas across sectors, and are confident the Fund consists of well-managed companies with solid competitive positions whose stocks are at attractive valuations compared to the expected growth and consistency of their business. |
| June 30, 2013 | William Blair Funds | 9 |
Large Cap Growth Fund
Performance Highlights (Unaudited)
Average Annual Total Return at 6/30/2013
| | | Year
to Date | | 1 Year | | 3 Year | | 5 Year | | 10 Year |
| Class N | | | 9.34 | % | | | 15.43 | % | | | 16.42 | % | | | 5.28 | % | | | 5.44 | % |
| Class I | | | 9.46 | | | | 15.70 | | | | 16.76 | | | | 5.56 | | | | 5.69 | |
| Russell 1000® Growth Index | | | 11.80 | | | | 17.07 | | | | 18.68 | | | | 7.47 | | | | 7.40 | |
Performance cited represents past performance. Past performance does not guarantee future results and current performance may be lower or higher than the data quoted. Results shown are average annual total returns, which assume reinvestment of dividends and capital gains. Investment returns and principal will fluctuate and you may have a gain or loss when you sell shares. For the most current month-end performance information, please call 1-800-742-7272, or visit our Web site at www.williamblairfunds.com. From time to time, the investment advisor may waive fees or reimburse expenses for the Fund. Without these waivers, performance would be lower. Class N shares are available to the general public without a sales load. Class I shares are available to certain institutional investors and advisory clients of William Blair & Company, L.L.C., without a sales load or distribution (12b-1) or service fees.
The performance highlights and graph presented above do not reflect the deduction of taxes that a shareholder would pay on fund distributions or the redemption of fund shares.
The Russell 1000® Growth Index consists of large capitalization companies with above average price-to-book ratios and forecasted growth rates.
This report identifies the Fund’s investments on June 30, 2013. These holdings are subject to change. Not all stocks in the Fund performed the same, nor is there any guarantee that these stocks will perform as well in the future. Market forecasts provided in this report may not necessarily come to pass.
Sector Diversification (Unaudited)
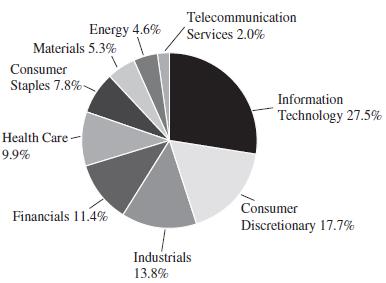
The sector diversification shown is based on the total long-term securities.
| 10 | Semi-Annual Report | June 30, 2013 |
Large Cap Growth Fund
Portfolio of Investments, June 30, 2013 (all dollar amounts in thousands) (unaudited)
| | | | | | | | |
| | | | | | | | |
| | Issuer | | Shares | | | Value | |
| | | | | | | | | | | |
| | Common Stocks | | | | | | | | | |
| | | | | | | | | | | |
| | Information Technology—27.3% | | | | | | | | | |
| | Apple, Inc. | | | 2,605 | | | | $ | 1,032 | |
| * | Citrix Systems, Inc. | | | 16,440 | | | | | 992 | |
| * | Cognizant Technology Solutions
Corporation | | | 19,200 | | | | | 1,202 | |
| * | eBay, Inc. | | | 8,360 | | | | | 432 | |
| * | Google, Inc. | | | 2,298 | | | | | 2,023 | |
| | Mastercard, Inc. | | | 2,135 | | | | | 1,227 | |
| | QUALCOMM, Inc. | | | 10,395 | | | | | 635 | |
| * | Red Hat, Inc. | | | 11,040 | | | | | 528 | |
| * | Trimble Navigation, Ltd. | | | 26,850 | | | | | 698 | |
| | | | | | | | | | 8,769 | |
| | | | | | | | | | | |
| | Consumer Discretionary—17.5% | | | | | | | | | |
| * | Amazon.com, Inc. | | | 1,540 | | | | | 428 | |
| * | Discovery Communications, Inc. | | | 6,280 | | | | | 485 | |
| * | Dollar General Corporation | | | 18,700 | | | | | 943 | |
| | Harley-Davidson, Inc. | | | 15,130 | | | | | 829 | |
| * | O’Reilly Automotive, Inc. | | | 8,440 | | | | | 950 | |
| * | priceline.com, Inc. | | | 651 | | | | | 538 | |
| | Starbucks Corporation | | | 21,920 | | | | | 1,436 | |
| | | | | | | | | | 5,609 | |
| | | | | | | | | | | |
| | Industrials—13.6% | | | | | | | | | |
| | Equifax, Inc. | | | 9,330 | | | | | 550 | |
| | Precision Castparts Corporation | | | 6,040 | | | | | 1,365 | |
| * | Stericycle, Inc. | | | 7,590 | | | | | 838 | |
| | The Boeing Co. | | | 3,170 | | | | | 325 | |
| | Union Pacific Corporation | | | 8,410 | | | | | 1,297 | |
| | | | | | | | | | 4,375 | |
| | | | | | | | | | | |
| | Financials—11.2% | | | | | | | | | |
| * | Affiliated Managers Group, Inc. | | | 5,350 | | | | | 877 | |
| | Citigroup, Inc. | | | 21,120 | | | | | 1,013 | |
| | JPMorgan Chase & Co. | | | 23,630 | | | | | 1,248 | |
| | T Rowe Price Group, Inc. | | | 6,440 | | | | | 471 | |
| | | | | | | | | | 3,609 | |
| | | | | | | | | | | |
| | Health Care—9.7% | | | | | | | | | |
| | Allergan, Inc. | | | 6,925 | | | | | 583 | |
| * | Gilead Sciences, Inc. | | | 22,630 | | | | | 1,159 | |
| * | IDEXX Laboratories, Inc. | | | 11,820 | | | | | 1,061 | |
| | Perrigo Co. | | | 2,650 | | | | | 321 | |
| | | | | | | | | | 3,124 | |
| | | | | | | | | | | |
| | Consumer Staples—7.7% | | | | | | | | | |
| | Colgate-Palmolive Co. | | | 12,270 | | | | | 703 | |
| * | Green Mountain Coffee Roasters, Inc. | | | 12,870 | | | | | 966 | |
| | Mead Johnson Nutrition Co. | | | 10,260 | | | | | 813 | |
| | | | | | | | | | 2,482 | |
| | Issuer | | Shares or
Principal
Amount | | | Value | |
| | | | | | | | | | | |
| | Common Stocks—(continued) | | | | | | | | | |
| | | | | | | | | | | |
| | Materials—5.2% | | | | | | | | | |
| | Monsanto Co. | | | 11,270 | | | | $ | 1,114 | |
| | Praxair, Inc. | | | 4,795 | | | | | 552 | |
| | | | | | | | | | 1,666 | |
| | | | | | | | | | | |
| | Energy—4.5% | | | | | | | | | |
| | Noble Energy, Inc. | | | 11,420 | | | | | 686 | |
| | Schlumberger, Ltd.† | | | 10,680 | | | | | 765 | |
| | | | | | | | | | 1,451 | |
| | | | | | | | | | | |
| | Telecommunication Services—2.0% | | | | | | | | | |
| * | SBA Communications Corporation | | | 8,500 | | | | | 630 | |
| | | | | | | | | | | |
| | Total Common Stocks—98.7%
(cost $24,741) | | | | | | | | 31,715 | |
| | | | | | | | | | | |
| | Repurchase Agreement | | | | | | | | | |
| | Fixed Income Clearing Corporation, 0.010%
dated 6/28/13, due 7/1/13, repurchase
price $395, collateralized by U.S.
Treasury Note, 0.750%, due 10/31/17 | | $ | 395 | | | | | 395 | |
| | | | | | | | | | | |
| | Total Repurchase Agreement—1.2%
(cost $395) | | | | | | | | 395 | |
| | | | | | | | | | | |
| | Total Investments—99.9%
(cost $25,136) | | | | | | | | 32,110 | |
| | Cash and other assets, less
liabilities—0.1% | | | | | | | | 33 | |
| | Net assets—100.0% | | | | | | | $ | 32,143 | |
* Non-income producing securities
† = U.S. listed foreign security
See accompanying Notes to Financial Statements.
| June 30, 2013 | William Blair Funds | 11 |
| | MID CAP GROWTH FUND |
| | |
| | The Mid Cap Growth Fund seeks long-term capital appreciation. |
| | |
| | AN OVERVIEW FROM THE PORTFOLIO MANAGERS |
| | |

Robert C. Lanphier, IV 
David P. Ricci | The William Blair Mid Cap Growth Fund (Class N shares) posted a 12.49% increase, net of fees, for the six months ended June 30, 2013. By comparison, the Fund’s benchmark index, the Russell Midcap® Growth Index (the “Index”), increased 14.70%. Market Review Solid economic and corporate performance provided an upward bias to the market in the first half of the year. Continued improvement in economic data, especially in housing and also employment data, pushed stocks to their 2013 highs through May. In June, the market witnessed its only, albeit minor, hiccup of the year as the Federal Reserve signaled an eventual slowdown in monetary easing (dubbed as the Federal Reserve’s “tapering”). The uncertainty sparked a rapid increase in long-term interest rates from historically low levels, pressuring the fixed income market. Stocks experienced a short-lived correction on worries less quantitative easing may become a drag on the economy and investor psychology. However, the period ended on a positive note, in part as investors realized the Federal Reserve would only taper to the extent the economy stayed on a sustainable path to recovery. Portfolio Results The Fund’s underperformance relative to the Index in the first half of the year is attributable to style headwinds and stock selection. Our more conservative investment style detracted in the period’s rapid ascent, as did investors’ gravitation to cheaper stocks (as defined by several valuation measures including price-to-earnings ratio) to which the Fund is underweight. Stock picks such as HMS Holdings (Health Care), SolarWinds (Information Technology), and Citrix Systems (Information Technology) were the largest detractors from return. In each case, we have maintained or added to each of those positions. On the upside, Green Mountain Coffee Roasters (Consumer Staples), LPL Financial Holdings (Financials), and HealthSouth (Health Care) helped the Fund partially keep pace with the market. Outlook Looking forward, the importance of central bank policy over the past few years brings plans for future policy into the forefront. The “tapering” of quantitative easing by the Federal Reserve (i.e., the slowing of its bond buying program) and China’s ability to execute a soft landing for its decelerating economy will be closely watched by the marketplace for their impacts on economic growth, global capital flows, and investor psychology. In addition, a potential change in leadership at the Federal Reserve as well as fiscal debate in Washington D.C. regarding the debt ceiling could negatively impact investor psychology. However, we believe that U.S. corporate performance remains solid and that U.S. stocks have been a relative safe haven versus more interest rate-sensitive asset classes, commodities, and stocks outside the U.S. Broadly speaking, the U.S. housing market remains a tailwind for U.S. employment and growth as well. In the end, while we factor various economic scenarios into our stock picking, we focus our time on constructing the Fund from a bottom-up perspective. We continue to find good ideas across sectors, and are confident the Fund consists of well-managed companies with solid competitive positions whose stocks are at attractive valuations compared to the expected growth and consistency of their business. |
| 12 | Semi-Annual Report | June 30, 2013 |
Mid Cap Growth Fund
Performance Highlights (Unaudited)
| Average Annual Total Return at 6/30/2013 |
| | | Year
to Date | | 1 Year | | 3 Year | | 5 Year | | Since
Inception(a) |
| Class N | | | 12.49 | % | | | 16.56 | % | | | 17.31 | % | | | 8.59 | % | | | 7.20 | % |
| Class I | | | 12.63 | | | | 16.88 | | | | 17.62 | | | | 8.88 | | | | 7.50 | |
| Russell Midcap® Growth Index | | | 14.70 | | | | 22.88 | | | | 19.53 | | | | 7.61 | | | | 6.20 | |
| (a) | For the period from February 1, 2006 (Commencement of Operations) to June 30, 2013. |
Performance cited represents past performance. Past performance does not guarantee future results and current performance may be lower or higher than the data quoted. Results shown are average annual total returns, which assume reinvestment of dividends and capital gains. Investment returns and principal will fluctuate and you may have a gain or loss when you sell shares. For the most current month-end performance information, please call 1-800-742-7272, or visit our Web site at www.williamblairfunds.com. Investing in medium capitalization companies involves special risks, including higher volatility and lower liquidity. Medium Capitalization stocks are also more sensitive to purchase/sale transactions and changes in the issuer’s financial condition. From time to time, the investment advisor may waive fees or reimburse expenses for the Fund. Without these waivers, performance would be lower. Class N shares are available to the general public without a sales load. Class I shares are available to certain institutional investors and advisory clients of William Blair & Company, L.L.C., without a sales load or distribution (12b-1) or service fees.
The performance highlights and graph presented above do not reflect the deduction of taxes that a shareholder would pay on fund distributions or the redemption of fund shares.
The Russell MidCap® Growth Index is an index that is constructed to provide a comprehensive and unbiased barometer of the mid-cap growth market.
This report identifies the Fund’s investments on June 30, 2013. These holdings are subject to change. Not all stocks in the Fund performed the same, nor is there any guarantee that these stocks will perform as well in the future. Market forecasts provided in this report may not necessarily come to pass.
Sector Diversification (Unaudited)
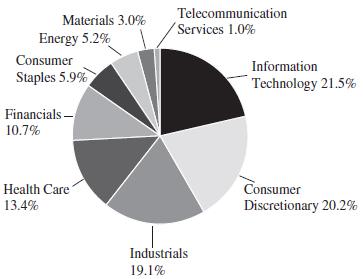
The sector diversification shown is based on the total long-term securities.
| June 30, 2013 | William Blair Funds | 13 |
Mid Cap Growth Fund
Portfolio of Investments, June 30, 2013 (all dollar amounts in thousands) (unaudited)
| | | | | | | | | |
| | | | | | | | | |
| | Issuer | | Shares | | | Value | |
| | | | | | | | | |
| | Common Stocks | | | | | | | | | |
| | | | | | | | | | | |
| | Information Technology—21.0% | | | | | | | | | |
| * | Akamai Technologies, Inc. | | | 113,900 | | | | $ | 4,846 | |
| | Amphenol Corporation | | | 121,500 | | | | | 9,470 | |
| * | Citrix Systems, Inc. | | | 197,000 | | | | | 11,885 | |
| * | CoStar Group, Inc. | | | 62,277 | | | | | 8,038 | |
| | FactSet Research Systems, Inc. | | | 61,900 | | | | | 6,310 | |
| * | Gartner, Inc. | | | 40,800 | | | | | 2,325 | |
| | Genpact, Ltd.† | | | 589,512 | | | | | 11,342 | |
| * | Guidewire Software, Inc. | | | 132,200 | | | | | 5,559 | |
| * | Pandora Media, Inc. | | | 355,900 | | | | | 6,549 | |
| * | RealPage, Inc. | | | 105,600 | | | | | 1,937 | |
| * | Red Hat, Inc. | | | 50,200 | | | | | 2,401 | |
| * | SolarWinds, Inc. | | | 303,800 | | | | | 11,790 | |
| * | Trimble Navigation, Ltd. | | | 347,608 | | | | | 9,041 | |
| * | VeriSign, Inc. | | | 146,900 | | | | | 6,561 | |
| | | | | | | | | | 98,054 | |
| | | | | | | | | | | |
| | Consumer Discretionary—19.7% | | | | | | | | | |
| * | Bed Bath & Beyond, Inc. | | | 138,060 | | | | | 9,788 | |
| * | Chipotle Mexican Grill, Inc. | | | 14,890 | | | | | 5,425 | |
| | Dick’s Sporting Goods, Inc. | | | 323,929 | | | | | 16,216 | |
| * | Dollar General Corporation | | | 214,805 | | | | | 10,833 | |
| * | Fossil Group, Inc. | | | 64,600 | | | | | 6,674 | |
| | Harley-Davidson, Inc. | | | 170,700 | | | | | 9,358 | |
| | Harman International Industries, Inc. | | | 65,506 | | | | | 3,550 | |
| * | Lululemon Athletica, Inc. | | | 103,400 | | | | | 6,775 | |
| * | O’Reilly Automotive, Inc. | | | 117,080 | | | | | 13,185 | |
| * | Select Comfort Corporation | | | 393,195 | | | | | 9,853 | |
| | | | | | | | | | 91,657 | |
| | | | | | | | | | | |
| | Industrials—18.6% | | | | | | | | | |
| | AMETEK, Inc. | | | 226,400 | | | | | 9,577 | |
| * | B/E Aerospace, Inc. | | | 89,800 | | | | | 5,665 | |
| * | Clean Harbors, Inc. | | | 191,400 | | | | | 9,671 | |
| | Equifax, Inc. | | | 152,700 | | | | | 8,999 | |
| | Fastenal Co. | | | 69,962 | | | | | 3,208 | |
| | Graco, Inc. | | | 122,300 | | | | | 7,731 | |
| | J.B. Hunt Transport Services, Inc. | | | 121,400 | | | | | 8,770 | |
| * | Jacobs Engineering Group, Inc. | | | 170,600 | | | | | 9,405 | |
| * | Stericycle, Inc. | | | 125,330 | | | | | 13,840 | |
| | TransDigm Group, Inc. | | | 61,750 | | | | | 9,680 | |
| | | | | | | | | | 86,546 | |
| | | | | | | | | | | |
| | Health Care—13.0% | | | | | | | | | |
| * | BioMarin Pharmaceutical, Inc. | | | 78,200 | | | | | 4,363 | |
| * | HealthSouth Corporation | | | 334,624 | | | | | 9,637 | |
| * | HMS Holdings Corporation | | | 550,974 | | | | | 12,838 | |
| * | IDEXX Laboratories, Inc. | | | 182,472 | | | | | 16,382 | |
| * | Mettler-Toledo International, Inc. | | | 11,700 | | | | | 2,354 | |
| | Perrigo Co. | | | 88,400 | | | | | 10,696 | |
| * | Sirona Dental Systems, Inc. | | | 68,700 | | | | | 4,526 | |
| | | | | | | | | | 60,796 | |
| | | | Shares or | | | | | |
| | | | Principal | | | | | |
| | Issuer | | Amount | | | Value | |
| | |
| | Common Stocks—(continued) | | | | | | | | | |
| | | | | | | | | | | |
| | Financials—10.4% | | | | | | | | | |
| * | Affiliated Managers Group, Inc. | | | 65,575 | | | | $ | 10,751 | |
| | First Republic Bank | | | 186,000 | | | | | 7,157 | |
| | LPL Financial Holdings, Inc. | | | 251,063 | | | | | 9,480 | |
| * | Signature Bank | | | 169,300 | | | | | 14,055 | |
| | T Rowe Price Group, Inc. | | | 97,000 | | | | | 7,096 | |
| | | | | | | | | | 48,539 | |
| | | | | | | | | | | |
| | Consumer Staples—5.8% | | | | | | | | | |
| * | Green Mountain Coffee Roasters, Inc. | | | 135,346 | | | | | 10,159 | |
| | McCormick & Co., Inc. | | | 70,500 | | | | | 4,960 | |
| | Mead Johnson Nutrition Co. | | | 148,600 | | | | | 11,774 | |
| | | | | | | | | | 26,893 | |
| | | | | | | | | | | |
| | Energy—5.1% | | | | | | | | | |
| * | FMC Technologies, Inc. | | | 124,300 | | | | | 6,921 | |
| | Helmerich & Payne, Inc. | | | 117,627 | | | | | 7,346 | |
| | Oceaneering International, Inc. | | | 31,500 | | | | | 2,274 | |
| | Range Resources Corporation | | | 90,400 | | | | | 6,990 | |
| | | | | | | | | | 23,531 | |
| | | | | | | | | | | |
| | Materials—2.9% | | | | | | | | | |
| | Airgas, Inc. | | | 95,917 | | | | | 9,156 | |
| | Cytec Industries, Inc. | | | 58,800 | | | | | 4,307 | |
| | | | | | | | | | 13,463 | |
| | | | | | | | | | | |
| | Telecommunication Services—1.0% | | | | | | | | | |
| * | SBA Communications Corporation | | | 62,500 | | | | | 4,633 | |
| | | | | | | | | | | |
| | Total Common Stocks—97.5%
(cost $399,581) | | | | | | | | 454,112 | |
| | |
| | Repurchase Agreement | | | | | | | | | |
| | Fixed Income Clearing Corporation, 0.010%
dated 6/28/13, due 7/1/13, repurchase
price $10,738, collateralized by U.S.
Treasury Note, 0.750%, due 10/31/17 | | $ | 10,738 | | | | | 10,738 | |
| | |
| | Total Repurchase Agreement—2.3%
(cost $10,738) | | | | | | | | 10,738 | |
| | |
| | Total Investments—99.8%
(cost $410,319) | | | | | | | | 464,850 | |
| | Cash and other assets, less
liabilities—0.2% | | | | | | | | 1,039 | |
| | Net assets—100.0% | | | | | | | $ | 465,889 | |
* Non-income producing securities
† = U.S. listed foreign security
See accompanying Notes to Financial Statements.
| 14 | Semi-Annual Report | June 30, 2013 |
| | SMALL-MID CAP GROWTH FUND |
| | |
| | The Small-Mid Cap Growth Fund seeks long-term capital appreciation. |
| | |
| | AN OVERVIEW FROM THE PORTFOLIO MANAGERS |
| | |

Karl W. Brewer 
Robert C. Lanphier, IV 
Matthew A. Litfin | The Small-Mid Cap Growth Fund (Class N shares) posted a 19.07% increase, net of fees, for the six months ended June 30, 2013. By comparison, the Fund’s benchmark index, the Russell 2500TM Growth Index (the “Index”), increased 15.82%. Market Review Solid economic and corporate performance provided an upward bias to the market in the first half of the year. Continued improvement in economic data, especially in housing and also employment data, pushed stocks to their 2013 highs through May. In June, the market witnessed its only, albeit minor, hiccup of the year as the Federal Reserve signaled an eventual slowdown in monetary easing (dubbed as the Federal Reserve’s “tapering”). The uncertainty sparked a rapid increase in long-term interest rates from historically low levels, pressuring the fixed income market. Stocks experienced a short-lived correction on worries less quantitative easing may become a drag on the economy and investor psychology. However, the period ended on a positive note, in part as investors realized the Federal Reserve would only taper to the extent the economy stayed on a sustainable path to recovery. Portfolio Results The Fund’s outperformance relative to the Index in the first half of the year is attributable to strong stock selection. Pandora Media (Information Technology) and Green Mountain Coffee Roasters (Consumer Staples) were the two largest contributors to return from a single stock perspective. Industrials stock selection (e.g., ICF International) and Financials stock selection (e.g., Portfolio Recovery Associates) were the largest sources of outperformance by sector. On the downside, while Information Technology as a whole was neutral to relative performance, the Fund’s top four detractors were Information Technology holdings: Real Page, Aruba Networks, Xoom Corp, and SolarWinds. Outlook Looking forward, the importance of central bank policy over the past few years brings plans for future policy into the forefront. The “tapering” of quantitative easing by the Federal Reserve (i.e., the slowing of its bond buying program) and China’s ability to execute a soft landing for its decelerating economy will be closely watched by the marketplace for their impacts on economic growth, global capital flows, and investor psychology. In addition, a potential change in leadership at the Federal Reserve as well as fiscal debate in Washington D.C. regarding the debt ceiling could negatively impact investor psychology. However, we believe that U.S. corporate performance remains solid and that U.S. stocks have been a relative safe haven versus more interest rate-sensitive asset classes, commodities, and stocks outside the U.S. Broadly speaking, the U.S. housing market remains a tailwind for U.S. employment and growth as well. In the end, while we factor various economic scenarios into our stock picking, we focus our time on constructing the Fund from a bottom-up perspective. We continue to find good ideas across sectors, and are confident the Fund consists of well-managed companies with solid competitive positions whose stocks are at attractive valuations compared to the expected growth and consistency of their business. |
| June 30, 2013 | William Blair Funds | 15 |
Small-Mid Cap Growth Fund
Performance Highlights (Unaudited)
| Average Annual Total Return at 6/30/2013 |
| | | Year
to Date | | 1 Year | | 3 Year | | 5 Year | | Since
Inception(a) |
| Class N | | | 19.07 | % | | | 27.23 | % | | | 19.05 | % | | | 10.82 | % | | | 8.93 | % |
| Class I | | | 19.24 | | | | 27.48 | | | | 19.32 | | | | 11.10 | | | | 9.20 | |
| Russell 2500TM Growth Index | | | 15.82 | | | | 24.03 | | | | 20.22 | | | | 8.94 | | | | 8.35 | |
| (a) | For the period from December 29, 2003 (Commencement of Operations) to June 30, 2013. |
Performance cited represents past performance. Past performance does not guarantee future results and current performance may be lower or higher than the data quoted. Results shown are average annual total returns, which assume reinvestment of dividends and capital gains. Investment returns and principal will fluctuate and you may have a gain or loss when you sell shares. For the most current month-end performance information, please call 1-800-742-7272, or visit our Web site at www.williamblairfunds.com. Investing in smaller and medium capitalization companies involves special risks, including higher volatility and lower liquidity. Smaller and medium capitalization stocks are also more sensitive to purchase/sale transactions and changes in the issuer’s financial condition. From time to time, the investment advisor may waive fees or reimburse expenses for the Fund. Without these waivers, performance would be lower. Class N shares are available to the general public without a sales load. Class I shares are available to certain institutional investors and advisory clients of William Blair & Company, L.L.C., without a sales load or distribution (12b-1) or service fees.
The performance highlights and graph presented above do not reflect the deduction of taxes that a shareholder would pay on fund distributions or the redemption of fund shares.
The Russell 2500TM Growth Index measures the performance of those Russell 2500 companies with above average price-to-book ratios and forecasted growth rates.
This report identifies the Fund’s investments on June 30, 2013. These holdings are subject to change. Not all stocks in the Fund performed the same, nor is there any guarantee that these stocks will perform as well in the future. Market forecasts provided in this report may not necessarily come to pass.
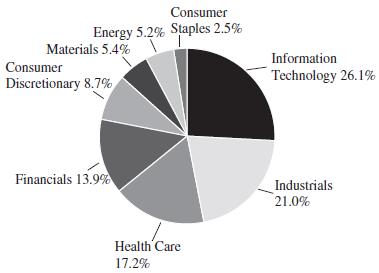
Sector Diversification (Unaudited)

The sector diversification shown is based on the total long-term securities.
| 16 | Semi-Annual Report | June 30, 2013 |
Small-Mid Cap Growth Fund
Portfolio of Investments, June 30, 2013 (all dollar amounts in thousands) (unaudited)
| | | | | | | |
| | | | | | | |
| | Issuer | | Shares | | Value | |
| | | | | | | | | | | |
| | Common Stocks | | | | | | | | | |
| | | | | | | | | | | |
| | Industrials—22.4% | | | | | | | | | |
| * | B/E Aerospace, Inc. | | | 197,853 | | | | $ | 12,481 | |
| | Fortune Brands Home & Security, Inc. | | | 146,500 | | | | | 5,675 | |
| | Graco, Inc. | | | 77,500 | | | | | 4,899 | |
| | Healthcare Services Group, Inc. | | | 246,832 | | | | | 6,052 | |
| * | Huron Consulting Group, Inc. | | | 109,085 | | | | | 5,044 | |
| * | ICF International, Inc. | | | 263,525 | | | | | 8,304 | |
| | Manpowergroup, Inc. | | | 107,150 | | | | | 5,872 | |
| * | Old Dominion Freight Line, Inc. | | | 191,200 | | | | | 7,958 | |
| * | Pandora Media, Inc. | | | 555,902 | | | | | 10,229 | |
| | Robert Half International, Inc. | | | 219,100 | | | | | 7,281 | |
| * | Standard Parking Corporation | | | 176,418 | | | | | 3,786 | |
| * | Stericycle, Inc. | | | 153,870 | | | | | 16,992 | |
| | The Corporate Executive Board Co. | | | 126,135 | | | | | 7,974 | |
| | TransDigm Group, Inc. | | | 10,175 | | | | | 1,595 | |
| * | Trimas Corporation | | | 214,740 | | | | | 8,005 | |
| | | | | | | | | | 112,147 | |
| | | | | | | | | | | |
| | Health Care—19.4% | | | | | | | | | |
| * | ABIOMED, Inc. | | | 244,938 | | | | | 5,281 | |
| * | Align Technology, Inc. | | | 176,003 | | | | | 6,519 | |
| * | BioMarin Pharmaceutical, Inc. | | | 139,500 | | | | | 7,783 | |
| * | Brookdale Senior Living, Inc. | | | 121,876 | | | | | 3,222 | |
| * | Catamaran Corporation† | | | 171,132 | | | | | 8,338 | |
| * | Haemonetics Corporation | | | 124,100 | | | | | 5,131 | |
| * | HealthSouth Corporation | | | 230,584 | | | | | 6,641 | |
| * | HMS Holdings Corporation | | | 236,461 | | | | | 5,510 | |
| * | Hologic, Inc. | | | 353,700 | | | | | 6,826 | |
| * | IDEXX Laboratories, Inc. | | | 83,300 | | | | | 7,479 | |
| * | Mettler-Toledo International, Inc. | | | 22,400 | | | | | 4,507 | |
| * | Myriad Genetics, Inc. | | | 70,000 | | | | | 1,881 | |
| | Perrigo Co. | | | 92,900 | | | | | 11,241 | |
| * | Sirona Dental Systems, Inc. | | | 103,483 | | | | | 6,817 | |
| * | Team Health Holdings, Inc. | | | 235,811 | | | | | 9,685 | |
| | | | | | | | | | 96,861 | |
| | | | | | | | | | | |
| | Consumer Discretionary—15.7% | | | | | | | | | |
| | Dick’s Sporting Goods, Inc. | | | 254,390 | | | | | 12,735 | |
| * | Fossil Group, Inc. | | | 49,000 | | | | | 5,062 | |
| * | Grand Canyon Education, Inc. | | | 219,100 | | | | | 7,061 | |
| * | Jarden Corporation | | | 117,350 | | | | | 5,134 | |
| * | K12, Inc. | | | 179,814 | | | | | 4,724 | |
| * | LKQ Corporation | | | 242,100 | | | | | 6,234 | |
| * | Panera Bread Co. | | | 26,000 | | | | | 4,834 | |
| | Polaris Industries, Inc. | | | 54,600 | | | | | 5,187 | |
| * | Sally Beauty Holdings, Inc. | | | 268,300 | | | | | 8,344 | |
| | Six Flags Entertainment Corporation | | | 104,600 | | | | | 3,678 | |
| | Tractor Supply Co. | | | 64,800 | | | | | 7,621 | |
| * | Under Armour, Inc. | | | 125,520 | | | | | 7,495 | |
| | | | | | | | | | 78,109 | |
| | | | | | | | | | | |
| | Information Technology—16.6% | | | | | | | | | |
| * | Akamai Technologies, Inc. | | | 124,900 | | | | | 5,314 | |
| * | ANSYS, Inc. | | | 50,500 | | | | | 3,692 | |
| * | Aruba Networks, Inc. | | | 252,100 | | | | | 3,872 | |
| * | CoStar Group, Inc. | | | 47,910 | | | | | 6,184 | |
| * | Envestnet, Inc. | | | 179,483 | | | | | 4,415 | |
| | FactSet Research Systems, Inc. | | | 50,900 | | | | | 5,189 | |
| * | Gartner, Inc. | | | 146,100 | | | | | 8,326 | |
| | Genpact, Ltd.† | | | 373,900 | | | | | 7,194 | |
| * | Guidewire Software, Inc. | | | 133,100 | | | | | 5,597 | |
| | Issuer | | Shares or
Principal
Amount | | Value | |
| | | | | | | | | | | |
| | Common Stocks—(continued) | | | | | | | | | |
| | | | | | | | | | | |
| | Information Technology—(continued) | | | | | | | | | |
| | j2 Global, Inc. | | | 101,700 | | | | $ | 4,323 | |
| * | Liquidity Services, Inc. | | | 152,720 | | | | | 5,295 | |
| * | RealPage, Inc. | | | 317,860 | | | | | 5,830 | |
| * | SolarWinds, Inc. | | | 108,500 | | | | | 4,211 | |
| * | Ultimate Software Group, Inc. | | | 21,825 | | | | | 2,560 | |
| * | WEX, Inc. | | | 76,900 | | | | | 5,898 | |
| * | WNS Holdings, Ltd.—ADR | | | 305,065 | | | | | 5,091 | |
| | | | | | | | | | 82,991 | |
| | | | | | | | | | | |
| | Financials—11.4% | | | | | | | | | |
| * | Affiliated Managers Group, Inc. | | | 76,109 | | | | | 12,477 | |
| | CBOE Holdings, Inc. | | | 160,600 | | | | | 7,490 | |
| * | Encore Capital Group, Inc. | | | 120,000 | | | | | 3,973 | |
| * | First Cash Financial Services, Inc. | | | 112,443 | | | | | 5,533 | |
| | First Republic Bank | | | 97,600 | | | | | 3,756 | |
| | FirstService Corporation† | | | 120,041 | | | | | 3,755 | |
| | Jones Lang LaSalle, Inc. | | | 83,900 | | | | | 7,647 | |
| * | Portfolio Recovery Associates, Inc. | | | 79,200 | | | | | 12,168 | |
| | | | | | | | | | 56,799 | |
| | | | | | | | | | | |
| | Energy—5.2% | | | | | | | | | |
| | Core Laboratories N.V.† | | | 41,400 | | | | | 6,279 | |
| | Helmerich & Payne, Inc. | | | 92,900 | | | | | 5,802 | |
| * | KiOR, Inc. | | | 282,897 | | | | | 1,615 | |
| * | Oasis Petroleum, Inc. | | | 127,800 | | | | | 4,968 | |
| | Oceaneering International, Inc. | | | 104,200 | | | | | 7,523 | |
| | | | | | | | | | 26,187 | |
| | | | | | | | | | | |
| | Materials—3.1% | | | | | | | | | |
| | Celanese Corporation | | | 125,100 | | | | | 5,605 | |
| | Cytec Industries, Inc. | | | 55,200 | | | | | 4,043 | |
| | Rockwood Holdings, Inc. | | | 92,900 | | | | | 5,948 | |
| | | | | | | | | | 15,596 | |
| | | | | | | | | | | |
| | Consumer Staples—2.3% | | | | | | | | | |
| * | Green Mountain Coffee Roasters, Inc. | | | 90,623 | | | | | 6,802 | |
| | Nu Skin Enterprises, Inc. | | | 75,100 | | | | | 4,590 | |
| | | | | | | | | | 11,392 | |
| | | | | | | | | | | |
| | Telecommunication Services—1.9% | | | | | | | | | |
| * | SBA Communications Corporation | | | 129,900 | | | | | 9,628 | |
| | | | | | | | | | | |
| | Total Common Stocks—98.0%
(cost $388,649) | | | | | | | | 489,710 | |
| | | | | | | | | | | |
| | Repurchase Agreement | | | | | | | | | |
| | Fixed Income Clearing Corporation, 0.010%
dated 6/28/13, due 7/1/13 repurchase
price $9,541, collateralized by U.S.
Treasury Note, 0.750%, due 10/31/17 | | $ | 9,540 | | | | $ | 9,540 | |
| | | | | | | | | | | |
| | Total Repurchase Agreement—1.9%
(cost $9,540) | | | | | | | | 9,540 | |
| | | | | | | | | | | |
| | Total Investments—99.9%
(cost $398,189) | | | | | | | | 499,250 | |
| | Cash and other assets, less liabilities—0.1% | | | | | | | | 614 | |
| | Net assets—100.0% | | | | | | | $ | 499,864 | |
| ADR = American Depository Receipt | | |
| * Non-income producing securities | | |
| † = U.S. listed foreign security | | |
See accompanying Notes to Financial Statements.
| June 30, 2013 | William Blair Funds | 17 |
| | SMALL CAP GROWTH FUND |
| | |
| | The Small Cap Growth Fund seeks long-term capital appreciation. |
| | |
| | AN OVERVIEW FROM THE PORTFOLIO MANAGERS |
| | |

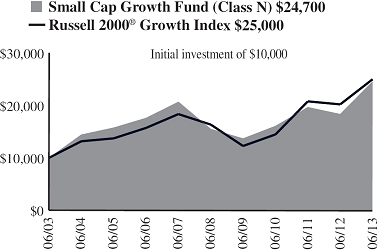
Michael P. Balkin 
Karl W. Brewer | The Small Cap Growth Fund (Class N shares) posted a 23.65% increase, net of fees, for the six months ended June 30, 2013. By comparison, the Fund’s benchmark index, the Russell 2000® Growth Index (the “Index”), increased 17.44%. Market Review Solid economic and corporate performance provided an upward bias to the market in the first half of the year. Continued improvement in economic data, especially in housing and also employment data, pushed stocks to their 2013 highs through May. In June, the market witnessed its only, albeit minor, hiccup of the year as the Federal Reserve signaled an eventual slowdown in monetary easing (dubbed as the Federal Reserve’s “tapering”). The uncertainty sparked a rapid increase in long-term interest rates from historically low levels, pressuring the fixed income market. Stocks experienced a short-lived correction on worries less quantitative easing may become a drag on the economy and investor psychology. However, the period ended on a positive note, in part as investors realized the Federal Reserve would only taper to the extent the economy stayed on a sustainable path to recovery. Portfolio Results The Fund’s outperformance relative to the Index in the first half of the year is attributable to strong stock selection and a modest benefit from the Fund’s smaller-than-benchmark weighted average market capitalization. We witnessed strong stock selection across all sectors during the period. Pandora Media (Information Technology), National Financial Partners (Financials), Nu Skin Enterprises (Consumer Staples), and WNS Holdings (Information Technology) were the largest contributors to relative return. While Information Technology as a sector contributed positively to relative performance, three of our top detractors were holdings in the sector: Liquidity Services, OSI Systems, and Real Page. Stillwater Mining (Materials) was another top detractor. Outlook Looking forward, the importance of central bank policy over the past few years brings plans for future policy into the forefront. The “tapering” of quantitative easing by the Federal Reserve (i.e., the slowing of its bond buying program) and China’s ability to execute a soft landing for its decelerating economy will be closely watched by the marketplace for its impact on economic growth, global capital flows, and investor psychology. A potential change in leadership at the Federal Reserve could negatively impact investor psychology. However, we believe that U.S. corporate performance remains solid and that U.S. stocks have been a relative safe haven versus more interest rate-sensitive asset classes, commodities and stocks outside the U.S. Broadly speaking, the U.S. housing market remains a tailwind for U.S. employment and growth as well. In the end, while we factor various economic scenarios into our stock picking, we focus our time on constructing the Fund from a bottom-up perspective. We continue to find good ideas across sectors, and are confident the Fund consists of well-managed companies with solid competitive positions whose stocks are at attractive valuations compared to the expected growth and consistency of their business. |
| 18 | Semi-Annual Report | June 30, 2013 |
Small Cap Growth Fund
Performance Highlights (Unaudited)
| Average Annual Total Return at 6/30/2013 |
| | | Year
to Date | | 1 Year | | 3 Year | | 5 Year | | 10 Year |
| Class N | | | 23.65 | % | | | 33.79 | % | | | 15.15 | % | | | 9.65 | % | | | 9.45 | % |
| Class I | | | 23.84 | | | | 34.15 | | | | 15.47 | | | | 9.96 | | | | 9.75 | |
| Russell 2000® Growth Index | | | 17.44 | | | | 23.67 | | | | 19.97 | | | | 8.89 | | | | 9.62 | |
Performance cited represents past performance. Past performance does not guarantee future results and current performance may be lower or higher than the data quoted. Results shown are average annual total returns, which assume reinvestment of dividends and capital gains. Investment returns and principal will fluctuate and you may have a gain or loss when you sell shares. For the most current month-end performance information, please call 1-800-742-7272, or visit our Web site at www.williamblairfunds.com. Investing in smaller companies involves special risks, including higher volatility and lower liquidity. Smaller Capitalization stocks are also more sensitive to purchase/sale transactions and changes in the issuer’s financial condition. From time to time, the investment advisor may waive fees or reimburse expenses for the Fund. Without these waivers, performance would be lower. Class N shares are available to the general public without a sales load. Class I shares are available to certain institutional investors and advisory clients of William Blair & Company, L.L.C., without a sales load or distribution (12b-1) or service fees.
The performance highlights and graph presented above do not reflect the deduction of taxes that a shareholder would pay on fund distributions or the redemption of fund shares.
The Russell 2000® Growth Index is an unmanaged composite of the smallest 2000 stocks of the Russell 3000® Growth Index.
This report identifies the Fund’s investments on June 30, 2013. These holdings are subject to change. Not all stocks in the Fund performed the same, nor is there any guarantee that these stocks will perform as well in the future. Market forecasts provided in this report may not necessarily come to pass.
Sector Diversification (Unaudited)
The sector diversification shown is based on the total long-term securities.
| June 30, 2013 | William Blair Funds | 19 |
Small Cap Growth Fund
Portfolio of Investments, June 30, 2013 (all dollar amounts in thousands) (unaudited)
| | | | | | | | |
| | | | | | | | |
| | Issuer | | Shares | | | Value | |
| | | | | | | | | | | |
| | Common Stocks | | | | | | | | | |
| | | | | | | | | | | |
| | Information Technology—25.4% | | | | | | | | | |
| * | Audience, Inc. | | | 544,922 | | | | $ | 7,198 | |
| * | Cardtronics, Inc. | | | 211,844 | | | | | 5,847 | |
| * | CoStar Group, Inc. | | | 73,470 | | | | | 9,483 | |
| * | Envestnet, Inc. | | | 210,806 | | | | | 5,186 | |
| * | Exar Corporation | | | 741,344 | | | | | 7,984 | |
| * | ExlService Holdings, Inc. | | | 168,570 | | | | | 4,983 | |
| * | Inphi Corporation | | | 536,971 | | | | | 5,907 | |
| * | Inuvo, Inc. | | | 1,886,947 | | | | | 1,509 | |
| | j2 Global, Inc. | | | 150,990 | | | | | 6,419 | |
| * | Liquidity Services, Inc. | | | 197,070 | | | | | 6,832 | |
| | Monolithic Power Systems, Inc. | | | 216,120 | | | | | 5,211 | |
| * | Pandora Media, Inc. | | | 767,688 | | | | | 14,125 | |
| * | RealPage, Inc. | | | 239,180 | | | | | 4,386 | |
| * | ServiceSource International, Inc. | | | 453,880 | | | | | 4,230 | |
| * | SolarWinds, Inc. | | | 124,400 | | | | | 4,828 | |
| * | Tangoe, Inc. | | | 542,690 | | | | | 8,374 | |
| * | TeleTech Holdings, Inc. | | | 178,940 | | | | | 4,193 | |
| * | Ultimate Software Group, Inc. | | | 21,252 | | | | | 2,493 | |
| * | WEX, Inc. | | | 66,931 | | | | | 5,134 | |
| * | WNS Holdings, Ltd.—ADR | | | 591,999 | | | | | 9,880 | |
| | | | | | | | | | 124,202 | |
| | | | | | | | | | | |
| | Industrials—20.5% | | | | | | | | | |
| | Acorn Energy, Inc. | | | 456,126 | | | | | 3,850 | |
| * | Ameresco, Inc. | | | 272,673 | | | | | 2,457 | |
| * | Astronics Corporation | | | 128,900 | | | | | 5,268 | |
| | Barrett Business Services, Inc. | | | 108,376 | | | | | 5,658 | |
| * | CAI International, Inc. | | | 282,177 | | | | | 6,651 | |
| * | Clean Harbors, Inc. | | | 103,890 | | | | | 5,249 | |
| * | DigitalGlobe, Inc. | | | 159,720 | | | | | 4,953 | |
| * | Franklin Covey Co. | | | 636,031 | | | | | 8,561 | |
| * | Furmanite Corporation | | | 749,026 | | | | | 5,011 | |
| | Healthcare Services Group, Inc. | | | 275,708 | | | | | 6,760 | |
| * | Heritage-Crystal Clean, Inc. | | | 184,994 | | | | | 2,703 | |
| * | Hudson Technologies, Inc. | | | 677,684 | | | | | 2,162 | |
| * | Huron Consulting Group, Inc. | | | 107,937 | | | | | 4,991 | |
| * | ICF International, Inc. | | | 211,414 | | | | | 6,662 | |
| * | Old Dominion Freight Line, Inc. | | | 102,090 | | | | | 4,249 | |
| * | On Assignment, Inc. | | | 201,335 | | | | | 5,380 | |
| * | Trimas Corporation | | | 324,835 | | | | | 12,110 | |
| | US Ecology, Inc. | | | 272,169 | | | | | 7,468 | |
| | | | | | | | | | 100,143 | |
| | | | | | | | | | | |
| | Health Care—16.8% | | | | | | | | | |
| * | ABIOMED, Inc. | | | 169,360 | | | | | 3,651 | |
| | Air Methods Corporation | | | 130,706 | | | | | 4,428 | |
| * | Cyberonics, Inc. | | | 95,780 | | | | | 4,977 | |
| * | ExamWorks Group, Inc. | | | 508,141 | | | | | 10,788 | |
| * | Globus Medical, Inc. | | | 389,200 | | | | | 6,562 | |
| * | Haemonetics Corporation | | | 173,912 | | | | | 7,191 | |
| * | HealthSouth Corporation | | | 223,105 | | | | | 6,425 | |
| | | | | | | | |
| | | | | | | | |
| | Issuer | | Shares | | | Value | |
| | | | | | | | | | | |
| | Common Stocks—(continued) | | | | | | | | | |
| | | | | | | | | | | |
| | Health Care—(continued) | | | | | | | | | |
| * | HMS Holdings Corporation | | | 144,236 | | | | $ | 3,361 | |
| * | Nanosphere, Inc. | | | 1,139,618 | | | | | 3,498 | |
| * | Novadaq Technologies, Inc.† | | | 405,111 | | | | | 5,453 | |
| * | NxStage Medical, Inc. | | | 508,822 | | | | | 7,266 | |
| * | Quidel Corporation | | | 185,379 | | | | | 4,733 | |
| * | Spectranetics Corporation | | | 389,877 | | | | | 7,283 | |
| | Trinity Biotech plc—ADR | | | 360,334 | | | | | 6,072 | |
| | | | | | | | | | 81,688 | |
| | | | | | | | | | | |
| | Financials—13.5% | | | | | | | | | |
| * | Cowen Group, Inc. | | | 2,475,086 | | | | | 7,178 | |
| * | Encore Capital Group, Inc. | | | 304,354 | | | | | 10,077 | |
| * | First Cash Financial Services, Inc. | | | 207,102 | | | | | 10,192 | |
| | FirstService Corporation† | | | 147,838 | | | | | 4,624 | |
| | FXCM, Inc. | | | 344,130 | | | | | 5,647 | |
| | GFI Group, Inc. | | | 1,682,831 | | | | | 6,580 | |
| * | ICG Group, Inc. | | | 519,881 | | | | | 5,927 | |
| | Jones Lang LaSalle, Inc. | | | 70,134 | | | | | 6,392 | |
| | Manning & Napier, Inc. | | | 229,182 | | | | | 4,070 | |
| | Marlin Business Services Corporation | | | 232,681 | | | | | 5,300 | |
| | | | | | | | | | 65,987 | |
| | | | | | | | | | | |
| | Consumer Discretionary—8.5% | | | | | | | | | |
| | Dorman Products, Inc. | | | 102,161 | | | | | 4,661 | |
| * | Gentherm, Inc. | | | 605,314 | | | | | 11,241 | |
| * | K12, Inc. | | | 209,672 | | | | | 5,508 | |
| | MDC Partners, Inc.† | | | 251,432 | | | | | 4,536 | |
| * | SHFL Entertainment, Inc. | | | 372,543 | | | | | 6,598 | |
| | Six Flags Entertainment Corporation | | | 191,602 | | | | | 6,737 | |
| * | U.S. Auto Parts Network, Inc. | | | 1,985,154 | | | | | 2,283 | |
| | | | | | | | | | 41,564 | |
| | | | | | | | | | | |
| | Materials—5.3% | | | | | | | | | |
| | Compass Minerals International, Inc. | | | 57,240 | | | | | 4,838 | |
| | Cytec Industries, Inc. | | | 34,710 | | | | | 2,543 | |
| | HB Fuller Co. | | | 118,770 | | | | | 4,491 | |
| * | Horsehead Holding Corporation | | | 551,481 | | | | | 7,064 | |
| * | Stillwater Mining Co. | | | 636,486 | | | | | 6,836 | |
| | | | | | | | | | 25,772 | |
| | | | | | | | | | | |
| | Energy—5.2% | | | | | | | | | |
| * | Atwood Oceanics, Inc. | | | 96,232 | | | | | 5,009 | |
| * | Dril-Quip, Inc. | | | 32,006 | | | | | 2,890 | |
| | Gulfmark Offshore, Inc. | | | 80,450 | | | | | 3,627 | |
| * | Hornbeck Offshore Services, Inc. | | | 78,159 | | | | | 4,181 | |
| * | Oasis Petroleum, Inc. | | | 135,890 | | | | | 5,282 | |
| * | PDC Energy, Inc. | | | 71,598 | | | | | 3,686 | |
| | | | | | | | | | 24,675 | |
| | | | | | | | | | | |
| | Consumer Staples—2.5% | | | | | | | | | |
| | Nu Skin Enterprises, Inc. | | | 194,713 | | | | | 11,901 | |
| | | | | | | | | | | |
| | Total Common Stocks—97.6%
(cost $396,167) | | | | | | | | 476,391 | |
See accompanying Notes to Financial Statements.
| 20 | Semi-Annual Report | June 30, 2013 |
Small Cap Growth Fund
Portfolio of Investments, June 30, 2013 (all dollar amounts in thousands) (unaudited)
| | | | | | | | |
| | Issuer | | Principal
Amount | | | Value | |
| | | | | | | | | | | |
| | Repurchase Agreement | | | | | | | | | |
| | Fixed Income Clearing Corporation, 0.010%
dated 6/28/13, due 7/1/13, repurchase
price $8,418, collateralized by U.S.
Treasury Note, 0.750%, due 10/31/17 | | | $8,418 | | | | $ | 8,418 | |
| | | | | | | | | | | |
| | Total Repurchase Agreement—1.7%
(cost $8,418) | | | | | | | | 8,418 | |
| | | | | | | | | | | |
| | Total Investments—99.3%
(cost $404,585) | | | | | | | | 484,809 | |
| | Cash and other assets, less liabilities—0.7% | | | | | | | | 3,611 | |
| | Net assets—100.0% | | | | | | | $ | 488,420 | |
ADR = American Depository Receipt
* Non-income producing securities
† = U.S. listed foreign security
If the Fund’s portfolio holdings represent ownership of 5% or more of the voting securities of a company, the company is deemed to be an affiliate as defined in the Investment Company Act of 1940. The Small Cap Growth Fund had the following transactions during the period ended June 30, 2013 with companies deemed affiliated during the period or at June 30, 2013.
| | | | Share Activity | | Period Ended June 30, 2013 |
| | | | | | | | | | | | (in thousands) |
| | Security Name | | Balance
12/31/2012 | | Purchases | | Sales | | Balance
6/30/2013 | | Value | | Dividends
Included in
Income |
| π | Inuvo, Inc. | | 1,886,947 | | — | | — | | 1,886,947 | | $ | 1,509 | | — |
| π | U.S. Auto Parts Network, Inc. | | 1,091,812 | | 893,342 | | — | | 1,985,154 | | | 2,283 | | — |
| | | | | | | | | | | | $ | 3,792 | | — |
| π | Affiliated company at June 30, 2013. The Small Cap Growth Fund’s total value in companies deemed to be affiliated at June 30, 2013 was $ 3,792 (in thousands). |
Affiliated companies accounted for $(934) of change in net unrealized appreciation on investments during the period.
See accompanying Notes to Financial Statements.
| June 30, 2013 | William Blair Funds | 21 |
| GLOBAL MARKETS OVERVIEW FUND |
| | |
| | Market Summary & Outlook |
| | |
| | The global equity market rallied early in 2013, led by Japan on expectations of pro-growth fiscal and monetary policies. The United States also rose on solid economic data and the sequester non-event, while the USD rallied against most major currencies. In addition, corporate earnings results were generally better than expected, boosting the equity market, along with positive fund flows into equities as investors rotated out of fixed income and cash. This rally faltered in the second quarter as investors viewed Japanese Prime Minister Abe’s announced “third arrow” growth measures as underwhelming, and as Fed Chairman Ben Bernanke announced the Fed would begin tapering its bond purchases in 2014, leading to increased bond yields globally and a strengthening U.S. Dollar (USD). While 10 Year U.S. Treasury yields increased nearly 100 basis points, the impact of changing Fed policy was also felt heavily in emerging markets (EM), as bond yields increased and as investors, who searched for yield in a low yielding post Global Financial Crisis environment, began withdrawing from the bond markets, with equity outflows accelerating as well. In addition, as the carry trade began to unwind, the USD accelerated versus EM currencies, with commodity-exporting and current account deficit countries bearing the brunt of the currency decline. The market’s consternation increased when SHIBOR (the Chinese interbank lending rate) spiked to over 13% in mid-late June, raising concerns about Chinese banking system stability. While the Peoples Bank of China eventually made statements to assuage investor concerns about banking system liquidity, investors began to reduce their growth expectations for China as it appeared that the new government was willing to sacrifice some short term growth in order to implement longer term structural changes. Within this environment, the global equity market fell 0.47% during the second quarter as represented by the MSCI All Country World IMI Index (net), but rose 6.40% year to date, led by the U.S., which was up 2.59% and 13.67%, respectively. Year to date, Japan was up approximately 16% (33% in local terms), while Europe rose 3.52%, led by Switzerland, Ireland, and core Europe. Conversely, Pacific ex-Japan fell 5.38%, led on the downside by Australia, as its currency weakened significantly and as commodity prices eased. Emerging markets fell sharply during the period, down approximately 8.89% year to date, as represented by the MSCI Emerging Markets IMI Index (net). As a result, emerging markets underperformed developed markets by approximately 17.5% year to date in USD terms, the most underperformance in six months since the late 1990s Asian Financial Crisis.Year to date Latin America fell 15.07%, led on the downside by Brazil, which more than offset relative strength in Mexico, which was bolstered by improving economic activity in the U.S. EM Asia fell 5.70% year to date, as China fell 9.53%, on concerns about slowing growth and financial system stability. This decline was somewhat offset by Indonesia’s 7% rally year to date, along with a 2.3% return in Taiwan. EMEA (Emerging Europe, Mid-East, Africa) fell approximately 13% year to date, as weakness in Russia and South Africa (commodity exporters) and Turkey (demonstrations) more than offset positive Hungary and Israeli markets. Year to date, the MSCI World Small Cap Index (net) rose 10.42%, ahead of the 8.43% MSCI World Index (net) return, due to significant outperformance of U.K. and U.S. small cap stocks during the period. Within emerging markets EM small cap stocks outpaced their larger cap counterparts by nearly 6%, on stronger returns in Asia, particularly China and the ASEAN countries. From a sector perspective Healthcare was the strongest sector globally, up approximately 17%, due largely to Biotech and Life Sciences strength, followed by Discretionary, which rallied 14.84%. The Resources sectors were the laggards year to date, with Materials down 13.88%, driven on the downside by Metals/Mining, which was down over 30% on concerns about EM prospective demand. Energy was largely flat during the period as underperformance in Oil/Gas was largely mitigated by positive returns in Services. From a style perspective, companies with strong earnings trends and price momentum performed well globally, with particular strength outside the U.S., while high quality companies did well in emerging markets. |
| 22 | Semi-Annual Report | June 30, 2013 |
| | GLOBAL LEADERS FUND |
| | |
| | The Global Leaders Fund seeks long-term capital appreciation. |
| | |
| | AN OVERVIEW FROM THE PORTFOLIO MANAGERS |
| | |

W. George Greig 
Kenneth J. McAtamney 
David C. Fording | The William Blair Global Leaders Fund (Class N shares) posted a 4.65% increase, net of fees, for the six months ended June 30, 2013. By comparison, the Fund’s benchmark index, the MSCI All Country World IMI Index (net) (the “Index”), increased 6.40%. Despite its second quarter outperformance, the Fund’s underperfomance against the Index year to date was driven by underperformance in Information Technology (“IT”) and Telecom Services. IT stock selection was hampered by underperformance by Samsung on concerns of declining margins and Solarwinds on negative sentiment following the price paid for its recent announced acquisition. Accenture and SAP also detracted from performance as Accenture warned on near term revenue growth, while SAP missed expectations on lower revenue growth than expected. The Fund’s sole Telecom Services holding, China Mobile, also detracted from results both on negative China sentiment more broadly, but also on concerns about the cost of building the new LTE network and potential earnings impact. Offsetting these negatives was strong Financials and Industrials stock selection, coupled with overall sector positioning. Japanese and U.S. Financials boosted overall sector performance, while Industrials performance was augmented by good operating performance by Rolls-Royce, low cost airline Easyjet and Fortune Brands Home & Security. The United States continues to be the developed economy demonstrating the strongest economic resilience, and we are especially encouraged by the data from the housing market leading to positive implications for labor and overall consumer spending. At the same time, input costs remain subdued in the form of both low/stable wages and lower energy prices. This is bolstering domestic manufacturing activity. Despite the market’s consternation about the Federal Reserve tapering the bond purchasing program, leading to an interest rate tightening cycle, we believe the U.S. economy’s underlying strength without material attendant inflation can remain in an enviable range for economic growth and equities. Year to date the biggest change to Fund positioning was a 5% increase in U.S. holdings. We continue to find the prospects for a resurgent Japan promising. Though evidence of Prime Minister Abe’s “third arrow” of corporate reform remains anecdotal, we are focusing our research on those companies that have demonstrated high or improving returns, growth potential, and shareholder orientation on par with leading companies globally. While we remain modestly underweighted in Japan, we increased its weighting and are evaluating several potential additions to the Fund. We also increased Industrials to approximately 20% of the Fund, well ahead of the 11.4% Index weighting, due to additions in the U.S., U.K., and Japan, which more than offset a reduction in Europe Ex-U.K. Sources of funds for these additions included emerging markets, which decreased to approximately 8.4% as of June 30, along with Resources and Telecom Services. As of June 30, the largest sector overweightings were Consumer Discretionary, Industrials, and IT at the expense of Resources and Staples. |
| June 30, 2013 | William Blair Funds | 23 |
| Global Leaders Fund |
| |
| Performance Highlights (Unaudited) |
| Average Annual Total Return at 6/30/2013 | |
| | |
| | | Year
to Date | | 1 Year | | 3 Year | | 5 Year | | Since
Inception | |
| Class N(a) | | | 4.65 | % | | | 12.93 | % | | | 14.83 | % | | | 1.89 | % | | | 0.02 | % | |
| Class I(a) | | | 4.65 | | | | 13.17 | | | | 15.06 | | | | 2.11 | | | | 0.28 | | |
| MSCI ACW IMI (net)(a) | | | 6.40 | | | | 17.08 | | | | 12.60 | | | | 2.79 | | | | (0.35 | ) | |
| Institutional Class(b) | | | 4.75 | | | | — | | | | — | | | | — | | | | 4.42 | | |
| MSCI ACW IMI (net)(b) | | | 6.40 | | | | — | | | | — | | | | — | | | | 6.04 | | |
| (a) | Since inception is for the period from October 15, 2007 (Commencement of Operations) to June 30, 2013. |
| (b) | Since inception is for the period from December 19, 2012 (Commencement of Operations) to June 30, 2013. |
Performance cited represents past performance. Past performance does not guarantee future results and current performance may be lower or higher than the data quoted. Results shown are average annual total returns, which assume reinvestment of dividends and capital gains. Investment returns and principal will fluctuate and you may have a gain or loss when you sell shares. For the most current month-end performance information, please call 1-800-742-7272, or visit our Web site at www.williamblairfunds.com. Investing in smaller and medium capitalization companies involves special risks, including higher volatility and lower liquidity. Smaller and medium capitalization stocks are also more sensitive to purchase/sale transactions and changes in the issuer’s financial condition. International investing involves special risk considerations, including currency fluctuations, lower liquidity, economic and political risk. From time to time, the investment advisor may waive fees or reimburse expenses for the Fund. Without these waivers, performance would be lower. Class N shares are available to the general public without a sales load. Class I shares are available to certain institutional investors and advisory clients of William Blair & Company, L.L.C., without a sales load or distribution fees (12b-1). Institutional Class Shares are available to institutional investors without a sales load or distribution (12b-1) or service fees.
The performance highlights and graph presented above do not reflect the deduction of taxes that a shareholder would pay on fund distributions or the redemption of fund shares.
The Morgan Stanley Capital International (MSCI) All Country World (ACW) Investable Market Index (IMI) (net) is a free float-adjusted market capitalization weighted index that is designed to measure the equity market of developed and emerging markets. This series approximates the minimum possible dividend reinvestment.
This report identifies the Fund’s investments on June 30, 2013. These holdings are subject to change. Not all stocks in the Fund performed the same, nor is there any guarantee that these stocks will perform as well in the future. Market forecasts provided in this report may not necessarily come to pass.
| Sector Diversification (Unaudited) |
|---|

The sector diversification shown is based on the total long-term securities.
| 24 | Semi-Annual Report | June 30, 2013 |
| Global Leaders Fund |
| |
| Portfolio of Investments, June 30, 2013 (all dollar amounts in thousands) (unaudited) |
| | Issuer | | Shares | | | Value | |
| | | | | | | | | | | |
| | Common Stocks | | | | | | | | | |
| | | | | | | | | | | |
| | Western Hemisphere—48.3% | | | | | | | | | |
| | | | | | | | | | | |
| | Canada—1.4% | | | | | | | | | |
| | Brookfield Asset Management, Inc.
Class “A” (Real estate management
& development)† | | | 49,713 | | | | $ | 1,791 | |
| | | | | | | | | | | |
| | United States—46.9% | | | | | | | | | |
| * | Affiliated Managers Group, Inc. (Capital
markets) | | | 11,281 | | | | | 1,849 | |
| | American Express Co. (Consumer finance) | | | 36,685 | | | | | 2,743 | |
| * | Citrix Systems, Inc. (Software) | | | 22,775 | | | | | 1,374 | |
| | Colgate-Palmolive Co. (Household products) | | | 22,682 | | | | | 1,299 | |
| | Costco Wholesale Corporation (Food &
staples retailing) | | | 20,638 | | | | | 2,282 | |
| | Covidien plc (Health care equipment &
supplies)† | | | 31,771 | | | | | 1,997 | |
| * | Discovery Communications, Inc. (Media) | | | 29,898 | | | | | 2,308 | |
| * | Express Scripts Holding Co. (Health care
providers & services) | | | 34,491 | | | | | 2,128 | |
| | Exxon Mobil Corporation (Oil, gas &
consumable fuels) | | | 25,041 | | | | | 2,262 | |
| | Fortune Brands Home & Security, Inc.
(Building products) | | | 57,795 | | | | | 2,239 | |
| * | Green Mountain Coffee Roasters, Inc.
(Food products) | | | 20,725 | | | | | 1,556 | |
| | Harley-Davidson, Inc. (Automobiles) | | | 39,336 | | | | | 2,156 | |
| * | IDEXX Laboratories, Inc. (Health care
equipment & supplies) | | | 16,395 | | | | | 1,472 | |
| | Invesco, Ltd. (Capital markets)† | | | 55,080 | | | | | 1,752 | |
| * | Jacobs Engineering Group, Inc.
(Construction & engineering) | | | 32,373 | | | | | 1,785 | |
| | Jones Lang LaSalle, Inc. (Real estate
management & development) | | | 18,585 | | | | | 1,694 | |
| | JPMorgan Chase & Co. (Diversified
financial services) | | | 60,574 | | | | | 3,198 | |
| | Marriott International, Inc. Class “A”
(Hotels, restaurants & leisure) | | | 45,991 | | | | | 1,857 | |
| | Mastercard, Inc. (IT services) | | | 4,437 | | | | | 2,549 | |
| * | O’Reilly Automotive, Inc. (Specialty retail) | | | 14,280 | | | | | 1,608 | |
| * | Old Dominion Freight Line, Inc. (Road & rail) | | | 21,768 | | | | | 906 | |
| * | priceline.com, Inc. (Internet & catalog retail) | | | 2,827 | | | | | 2,338 | |
| | QUALCOMM, Inc. (Communications
equipment) | | | 31,946 | | | | | 1,951 | |
| | Schlumberger, Ltd. (Energy equipment &
services)† | | | 36,938 | | | | | 2,647 | |
| * | SolarWinds, Inc. (Software) | | | 28,226 | | | | | 1,095 | |
| | Starbucks Corporation (Hotels, restaurants
& leisure) | | | 22,077 | | | | | 1,446 | |
| | The Toro Co. (Machinery) | | | 18,087 | | | | | 821 | |
| | The Walt Disney Co. (Media) | | | 40,550 | | | | | 2,561 | |
| | Union Pacific Corporation (Road & rail) | | | 17,476 | | | | | 2,696 | |
| | Williams-Sonoma, Inc. (Specialty retail) | | | 40,314 | | | | | 2,253 | |
| | | | | | | | | | 58,822 | |
| | | | | | | | | | | |
| | Europe, Mid-East—20.0% | | | | | | | | | |
| | | | | | | | | | | |
| | Denmark—1.0% | | | | | | | | | |
| | Novo Nordisk A/S Class “B” (Pharmaceuticals) | | | 8,054 | | | | | 1,255 | |
| | Issuer | | Shares | | | Value | |
| | | | | | | | | | | |
| | Common Stocks—(continued) | | | | | | | | | |
| | | | | | | | | | | |
| | Europe, Mid-East—(continued) | | | | | | | | | |
| | | | | | | | | | | |
| | France—4.6% | | | | | | | | | |
| | BNP Paribas S.A. (Commercial banks) | | | 43,059 | | | | $ | 2,353 | |
| | Christian Dior S.A. (Textiles, apparel &
luxury goods) | | | 12,146 | | | | | 1,960 | |
| | Technip S.A. (Energy equipment & services) | | | 14,527 | | | | | 1,475 | |
| | | | | | | | | | 5,788 | |
| | | | | | | | | | | |
| | Germany—2.8% | | | | | | | | | |
| | Bayerische Motoren Werke AG (Automobiles) | | | 22,694 | | | | | 1,985 | |
| | MTU Aero Engines AG (Aerospace &
defense) | | | 7,643 | | | | | 737 | |
| | SAP AG (Software) | | | 9,713 | | | | | 711 | |
| | | | | | | | | | 3,433 | |
| | | | | | | | | | | |
| | Ireland—2.4% | | | | | | | | | |
| | Accenture plc Class “A” (IT services)† | | | 28,748 | | | | | 2,069 | |
| | Paddy Power plc (Hotels, restaurants &
leisure) | | | 11,283 | | | | | 968 | |
| | | | | | | | | | 3,037 | |
| | | | | | | | | | | |
| | Israel—1.1% | | | | | | | | | |
| * | Check Point Software Technologies, Ltd.
(Software)† | | | 28,127 | | | | | 1,397 | |
| | | | | | | | | | | |
| | Sweden—1.8% | | | | | | | | | |
| | Atlas Copco AB Class “A” (Machinery) | | | 92,470 | | | | | 2,234 | |
| | | | | | | | | | | |
| | Switzerland—6.3% | | | | | | | | | |
| | Nestle S.A. (Food products) | | | 18,177 | | | | | 1,192 | |
| | Partners Group Holding AG (Capital
markets) | | | 7,135 | | | | | 1,932 | |
| | Roche Holding AG (Pharmaceuticals) | | | 12,463 | | | | | 3,101 | |
| | Syngenta AG (Chemicals) | | | 4,375 | | | | | 1,712 | |
| | | | | | | | | | 7,937 | |
| | | | | | | | | | | |
| | United Kingdom—12.9% | | | | | | | | | |
| | ARM Holdings plc (Semiconductors &
semiconductor equipment) | | | 133,062 | | | | | 1,609 | |
| | Ashmore Group plc (Capital markets) | | | 154,141 | | | | | 806 | |
| | Babcock International Group plc
(Commercial services & supplies) | | | 48,284 | | | | | 810 | |
| | BHP Billiton plc (Metals & mining) | | | 75,691 | | | | | 1,936 | |
| | Compass Group plc (Hotels, restaurants &
leisure) | | | 174,594 | | | | | 2,231 | |
| | Diageo plc (Beverages) | | | 42,186 | | | | | 1,206 | |
| | easyJet plc (Airlines) | | | 95,817 | | | | | 1,889 | |
| | Experian plc (Professional services) | | | 113,801 | | | | | 1,978 | |
| | Hargreaves Lansdown plc (Capital markets) | | | 53,508 | | | | | 723 | |
| * | Rolls-Royce Holdings plc (Aerospace &
defense) | | | 110,078 | | | | | 1,898 | |
| | The Weir Group plc (Machinery) | | | 33,492 | | | | | 1,096 | |
| | | | | | | | | | 16,182 | |
See accompanying Notes to Financial Statements.
| June 30, 2013 | William Blair Funds | 25 |
Portfolio of Investments, June 30, 2013 (all dollar amounts in thousands) (unaudited)
| | Issuer | | Shares | | | Value | |
| | | | | | | | | | | |
| | Common Stocks—(continued) | | | | | | | | | |
| | | | | | | | | | | |
| | Japan—6.2% | | | | | | | | | |
| | Daikin Industries, Ltd. (Building products) | | | 31,400 | | | | $ | 1,270 | |
| | Makita Corporation (Machinery) | | | 33,400 | | | | | 1,805 | |
| | Sumitomo Mitsui Financial Group, Inc.
(Commercial banks) | | | 59,500 | | | | | 2,730 | |
| | Yahoo! Japan Corporation (Internet software
& services) | | | 4,055 | | | | | 1,999 | |
| | | | | | | | | | 7,804 | |
| | | | | | | | | | | |
| | Emerging Asia—5.9% | | | | | | | | | |
| | | | | | | | | | | |
| | India—1.1% | | | | | | | | | |
| | Tata Motors, Ltd. (Automobiles) | | | 304,595 | | | | | 1,442 | |
| | | | | | | | | | | |
| | Indonesia—0.9% | | | | | | | | | |
| | PT Bank Rakyat Indonesia Persero Tbk
(Commercial banks) | | | 1,470,000 | | | | | 1,148 | |
| | | | | | | | | | | |
| | South Korea—2.0% | | | | | | | | | |
| | Samsung Electronics Co., Ltd.
(Semiconductors & semiconductor
equipment) | | | 2,093 | | | | | 2,459 | |
| | | | | | | | | | | |
| | Taiwan—1.9% | | | | | | | | | |
| | Taiwan Semiconductor Manufacturing Co.,
Ltd.—ADR (Semiconductors &
semiconductor equipment) | | | 130,661 | | | | | 2,394 | |
| | | | | | | | | | | |
| | Asia—1.6% | | | | | | | | | |
| | | | | | | | | | | |
| | Hong Kong—1.6% | | | | | | | | | |
| | AIA Group, Ltd. (Insurance) | | | 466,600 | | | | | 1,976 | |
| | | | | | | | | | | |
| | Emerging Europe, Mid-East, Africa—1.3% | | | | | | | | | |
| | | | | | | | | | | |
| | South Africa—0.6% | | | | | | | | | |
| | Bidvest Group, Ltd. (Industrial
conglomerates) | | | 31,765 | | | | | 787 | |
| | | | | | | | | | | |
| | Turkey—0.7% | | | | | | | | | |
| | Turkiye Halk Bankasi A.S. (Commercial
banks) | | | 103,121 | | | | | 874 | |
| | | | | | | | | | | |
| | Emerging Latin America—1.2% | | | | | | | | | |
| | | | | | | | | | | |
| | Panama—1.2% | | | | | | | | | |
| | Copa Holdings S.A. Class “A” (Airlines)† | | | 11,831 | | | | | 1,551 | |
| | | | | | | | | | | |
| | Total Common Stocks—97.4%
(cost $113,425) | | | | | | | | 122,311 | |
| | Issuer | | Principal
Amount | | | Value | |
| | | | | | | | | | | |
| | Repurchase Agreement | | | | | | | | | |
| | Fixed Income Clearing Corporation, 0.010%
dated 6/28/13, due 7/1/13, repurchase
price $1,641, collateralized by U.S.
Treasury Note, 0.750%, due 10/31/17 | | | $1,641 | | | | $ | 1,641 | |
| | | | | | | | | | | |
| | Total Repurchase Agreement—1.3%
(cost $1,641) | | | | | | | | 1,641 | |
| | | | | | | | | | | |
| | Total Investments—98.7%
(cost $115,066) | | | | | | | | 123,952 | |
| | Cash and other assets, less liabilities—1.3% | | | | | | | | 1,660 | |
| | Net assets—100.0% | | | | | | | $ | 125,612 | |
ADR = American Depository Receipt
† = U.S. listed foreign security
* Non-income producing securities
For securities primarily traded on exchanges or markets that close before the close of regular trading on the New York Stock Exchange, the Fund may use an independent pricing service to fair value price the securities pursuant to Valuation Procedures approved by the Board of Trustees.
At June 30, 2013, the Fund’s Portfolio of Investments includes the following industry categories:
| Consumer Discretionary | | | 20.6 | % |
| Industrials | | | 20.0 | % |
| Financials | | | 19.4 | % |
| Information Technology | | | 17.5 | % |
| Health Care | | | 8.1 | % |
| Consumer Staples | | | 6.2 | % |
| Energy | | | 5.2 | % |
| Materials | | | 3.0 | % |
| Total | | | 100.0 | % |
At June 30, 2013, the Fund’s Portfolio of Investments includes the following currency categories:
| U.S. Dollar | | | 55.6 | % |
| British Pound Sterling | | | 13.2 | % |
| Euro | | | 8.4 | % |
| Swiss Franc | | | 6.5 | % |
| Japanese Yen | | | 6.4 | % |
| South Korean Won | | | 2.0 | % |
| Swedish Krona | | | 1.8 | % |
| Hong Kong Dollar | | | 1.6 | % |
| Indian Rupee | | | 1.2 | % |
| Danish Krone | | | 1.0 | % |
| All Other Currencies | | | 2.3 | % |
| Total | | | 100.0 | % |
See accompanying Notes to Financial Statements.
| 26 | Semi-Annual Report | June 30, 2013 |
| | GLOBAL SMALL CAP GROWTH FUND |
| | |
| | The Global Small Cap Growth Fund seeks long-term capital appreciation. |
| | |
| | AN OVERVIEW FROM THE PORTFOLIO MANAGERS |
| | |

Andrew G. Flynn 
Matthew A. Litfin 
Karl W. Brewer 
Jeffrey A. Urbina | The William Blair Global Small Cap Growth Fund (Class N shares) posted a 3.00% increase, net of fees, since its inception date of April 10, 2013. By comparison, the Fund’s benchmark index, the MSCI ACW Small Cap Index (net) (the “Index”), increased 0.75%. The Fund’s outperformance relative to the Index since inception was precipitated by strong performance across most sectors and regions. In particular, the Fund’s Consumer Discretionary holdings were up approximately 13%, well ahead of the 5.69% Index return, with significant value added across Media, Specialty Retail and Textiles/Apparel/Luxury Goods holdings. In addition, Grand Canyon Education, the U.S. for profit education company, outperformed as results were ahead of expectations and management increased guidance. Industrials benefited from strong performance in Aerospace/Defense and Airlines, along with good results by Keller Group, the U.K. ground engineering contractor, as North American revenues were significantly above expectations. Materials performance was augmented by limited Metals/Mining exposure and strong stock selection versus the Index. Somewhat detracting from results was overall regional positioning, given the Fund’s underweighting in the U.S. and, to some extent, the U.K. and overweighting in Latin America. Cash also detracted from results during the initial funding stage, given the market rally during that time. As of June 30, the Fund’s largest weighting was in Industrials, which was 24.1%, above the 17.3% Index weighting, due to a focus in services-oriented and trading companies. Other significant Fund exposures included Consumer Discretionary (17.9%) and Information Technology (15.2%). Financials, which represented 15.9%, was below the approximately 22% Index weighting, due to lower exposure in developed markets including the U.S., despite the higher weighting in emerging markets. Materials was the most underweighted sector at June 30, approximating 3% of the portfolio, well below the 8.6% Index weighting, as the Fund only held Chemicals names. Regionally, 11.0% of the Fund was invested in the U.K., well above the 6.7% Index weighting, while the U.S. was 46.0%, below the 51.9% Index exposure despite significant Industrials holdings. Conversely, emerging markets totaled 12.7% of the Fund, above the 10.8% Index weighting, due largely to Europe, the Middle East and Africa. |
| June 30, 2013 | William Blair Funds | 27 |
Global Small Cap Growth Fund
Performance Highlights (Unaudited)
Average Annual Total Return at 6/30/2013
| | | Since |
| | | Inception(a) |
| Class N | | | 3.00 | % |
| Class I | | | 3.10 | |
| MSCI ACW Small Cap Index (net) | | | 0.75 | |
| (a) | For the period from April 10, 2013 (Commencement of Operations) to June 30, 2013. |
| | |
| Note: | Chart is excluded since the Fund is less than six months old. |
Performance cited represents past performance. Past performance does not guarantee future results and current performance may be lower or higher than the data quoted. Results shown are average annual total returns, which assume reinvestment of dividends and capital gains. Investment returns and principal will fluctuate and you may have a gain or loss when you sell shares. For the most current month-end performance information, please call 1-800-742-7272, or visit our Web site at www.williamblairfunds.com. Investing in smaller and medium capitalization companies involves special risks, including higher volatility and lower liquidity. Smaller and medium capitalization stocks are also more sensitive to purchase/sale transactions and changes in the issuer’s financial condition. International investing involves special risk considerations, including currency fluctuations, lower liquidity, economic and political risk. From time to time, the investment advisor may waive fees or reimburse expenses to the Fund. Without these waivers, performance would be lower. Class N shares are available to the general public without a sales load. Class I shares are available to certain institututional investors and advisory clients of William Blair & Company, L.L.C., without a sales load or distribution (12b-1) fees.
The performance highlights and graph presented above do not reflect the deduction of taxes that a shareholder would pay on fund distributions or the redemption of fund shares.
The Morgan Stanley Capital International (MSCI) All Country World (ACW) Small Cap Index (net) is a free float-adjusted market capitalization index designed to measure global developed and emerging market small capitalization equity performance. The Index is unmanaged, does not incur fees or expenses, and cannot be invested in directly.
This report identifies the Fund’s investments on June 30, 2013. These holdings are subject to change. Not all stocks in the Fund performed the same, nor is there any guarantee that these stocks will perform as well in the future. Market forecasts provided in this report may not necessarily come to pass.
Sector Diversification (Unaudited)

The sector diversification shown is based on the total long-term securities.
| 28 | Semi-Annual Report | June 30, 2013 |
Global Small Cap Growth Fund
Portfolio of Investments, June 30, 2013 (all dollar amounts in thousands) (unaudited)
| | Issuer | | Shares | | | Value | |
| | | | | | | | | | | |
| | Common Stocks | | | | | | | | | |
| | | | | | | | | | | |
| | Western Hemisphere—48.5% | | | | | | | | | |
| | | | | | | | | | | |
| | Canada—2.5% | | | | | | | | | |
| * | Legacy Oil + Gas, Inc. (Oil, gas &
consumable fuels) | | | 10,126 | | | | $ | 48 | |
| | Precision Drilling Corporation (Energy
equipment & services) | | | 9,095 | | | | | 77 | |
| | Trilogy Energy Corporation (Oil, gas &
consumable fuels) | | | 5,242 | | | | | 156 | |
| | | | | | | | | | 281 | |
| | | | | | | | | | | |
| | United States—46.0% | | | | | | | | | |
| * | Align Technology, Inc. (Health care
equipment & supplies) | | | 3,270 | | | | | 121 | |
| | Allegiant Travel Co. (Airlines) | | | 1,210 | | | | | 128 | |
| * | Aruba Networks, Inc. (Communications
equipment) | | | 4,565 | | | | | 70 | |
| * | Astronics Corporation (Aerospace & defense) | | | 2,912 | | | | | 119 | |
| * | Atwood Oceanics, Inc. (Energy equipment
& services) | | | 1,371 | | | | | 71 | |
| * | CAI International, Inc. (Trading companies
& distributors) | | | 3,862 | | | | | 91 | |
| * | Cardtronics, Inc. (IT services) | | | 4,826 | | | | | 133 | |
| | CBOE Holdings, Inc. (Diversified financial
services) | | | 3,333 | | | | | 156 | |
| * | CoStar Group, Inc. (Internet software &
services) | | | 1,075 | | | | | 139 | |
| * | Cyberonics, Inc. (Health care equipment &
supplies) | | | 2,788 | | | | | 145 | |
| * | Encore Capital Group, Inc. (Consumer finance) | | | 3,266 | | | | | 108 | |
| * | Envestnet, Inc. (Internet software & services) | | | 4,346 | | | | | 107 | |
| * | First Cash Financial Services, Inc.
(Consumer finance) | | | 2,052 | | | | | 101 | |
| * | Gentherm, Inc. (Auto components) | | | 5,444 | | | | | 101 | |
| * | Globus Medical, Inc. Class “A” (Health
care equipment & supplies) | | | 6,143 | | | | | 104 | |
| | Graco, Inc. (Machinery) | | | 1,667 | | | | | 105 | |
| * | Grand Canyon Education, Inc. (Diversified
consumer services) | | | 4,220 | | | | | 136 | |
| * | Guidewire Software, Inc. (Software) | | | 2,572 | | | | | 108 | |
| * | Haemonetics Corporation (Health care
equipment & supplies) | | | 3,338 | | | | | 138 | |
| | Healthcare Services Group, Inc.
(Commercial services & supplies) | | | 4,879 | | | | | 120 | |
| * | HealthSouth Corporation (Health care
providers & services) | | | 5,255 | | | | | 151 | |
| | HEICO Corporation (Aerospace & defense) | | | 2,666 | | | | | 134 | |
| * | Huron Consulting Group, Inc. (Professional
services) | | | 2,487 | | | | | 115 | |
| | j2 Global, Inc. (Internet software & services) | | | 2,841 | | | | | 121 | |
| | Jones Lang LaSalle, Inc. (Real estate
management & development) | | | 1,510 | | | | | 138 | |
| * | K 12, Inc. (Diversified consumer services) | | | 3,961 | | | | | 104 | |
| * | Middleby Corporation (Machinery) | | | 453 | | | | | 77 | |
| | Nu Skin Enterprises, Inc. Class “A”
(Personal products) | | | 2,673 | | | | | 163 | |
| * | Old Dominion Freight Line, Inc.
(Road & rail) | | | 2,885 | | | | | 120 | |
| | Issuer | | Shares | | | Value | |
| | | | | | | | | | | |
| | Common Stocks—(continued) | | | | | | | | | |
| | | | | | | | | | | |
| | Western Hemisphere—(continued) | | | | | | | | | |
| * | Portfolio Recovery Associates, Inc.
(Consumer finance) | | | 963 | | | | $ | 148 | |
| | Robert Half International, Inc. (Professional
services) | | | 2,276 | | | | | 76 | |
| | Rollins, Inc. (Commercial services & supplies) | | | 4,697 | | | | | 122 | |
| * | Signature Bank (Commercial banks) | | | 1,770 | | | | | 147 | |
| * | Sirona Dental Systems, Inc. (Health care
equipment & supplies) | | | 2,446 | | | | | 161 | |
| | Six Flags Entertainment Corporation (Hotels,
restaurants & leisure) | | | 3,276 | | | | | 115 | |
| * | Standard Parking Corporation (Commercial
services & supplies) | | | 4,973 | | | | | 107 | |
| * | Team Health Holdings, Inc. (Health care
providers & services) | | | 3,360 | | | | | 138 | |
| | Texas Roadhouse, Inc. (Hotels, restaurants
& leisure) | | | 4,731 | | | | | 118 | |
| | The Corporate Executive Board Co.
(Professional services) | | | 1,953 | | | | | 124 | |
| | The Toro Co. (Machinery) | | | 2,415 | | | | | 110 | |
| | US Ecology, Inc. (Commercial services &
supplies) | | | 4,664 | | | | | 128 | |
| | Watsco, Inc. (Trading companies &
distributors) | | | 1,322 | | | | | 111 | |
| * | WEX, Inc. (IT services) | | | 1,254 | | | | | 96 | |
| | Williams-Sonoma, Inc. (Specialty retail) | | | 1,810 | | | | | 101 | |
| | | | | | | | | | 5,226 | |
| | | | | | | | | | | |
| | United Kingdom—11.0% | | | | | | | | | |
| * | ASOS plc (Internet & catalog retail) | | | 1,537 | | | | | 95 | |
| | Aveva Group plc (Software) | | | 2,894 | | | | | 99 | |
| | AZ Electronic Materials S.A. (Chemicals) | | | 21,228 | | | | | 99 | |
| | Cineworld Group plc (Media) | | | 17,393 | | | | | 90 | |
| * | Countrywide plc (Real estate management
& development) | | | 14,391 | | | | | 111 | |
| | Domino’s Pizza Group plc (Hotels, restaurants
& leisure) | | | 8,867 | | | | | 90 | |
| | Keller Group plc (Construction & engineering) | | | 8,549 | | | | | 129 | |
| | Rightmove plc (Media) | | | 3,799 | | | | | 120 | |
| | Senior plc (Machinery) | | | 27,348 | | | | | 104 | |
| | Spirax-Sarco Engineering plc (Machinery) | | | 2,585 | | | | | 106 | |
| | Ted Baker plc (Textiles, apparel & luxury
goods) | | | 4,252 | | | | | 110 | |
| | The Restaurant Group plc (Hotels, restaurants
& leisure) | | | 12,142 | | | | | 92 | |
| | | | | | | | | | 1,245 | |
| | | | | | | | | | | |
| | Europe—10.3% | | | | | | | | | |
| | | | | | | | | | | |
| | Belgium—0.9% | | | | | | | | | |
| | Melexis N.V. (Semiconductors &
semiconductor equipment) | | | 2,740 | | | | | 58 | |
| * | ThromboGenics N.V. (Biotechnology) | | | 1,237 | | | | | 47 | |
| | | | | | | | | | 105 | |
See accompanying Notes to Financial Statements.
| June 30, 2013 | William Blair Funds | 29 |
Global Small Cap Growth Fund
Portfolio of Investments, June 30, 2013 (all dollar amounts in thousands) (unaudited)
| | Issuer | | Shares | | | Value | |
| | | | | | | | | | | |
| | Common Stocks—(continued) | | | | | | | | | |
| | | | | | | | | | | |
| | Europe—(continued) | | | | | | | | | |
| | | | | | | | | | | |
| | Denmark—1.1% | | | | | | | | | |
| | GN Store Nord A/S (Health care equipment
& supplies) | | | 6,290 | | | | $ | 119 | |
| | | | | | | | | | | |
| | France—0.8% | | | | | | | | | |
| * | GameLoft SE (Software) | | | 13,302 | | | | | 93 | |
| | | | | | | | | | | |
| | Germany—1.9% | | | | | | | | | |
| | Bertrandt AG (Professional services) | | | 708 | | | | | 76 | |
| | Wincor Nixdorf AG (Computers &
peripherals) | | | 2,531 | | | | | 137 | |
| | | | | | | | | | 213 | |
| | | | | | | | | | | |
| | Italy—2.4% | | | | | | | | | |
| | Azimut Holding SpA (Capital markets) | | | 6,694 | | | | | 122 | |
| | Brembo SpA (Auto components) | | | 8,486 | | | | | 151 | |
| | | | | | | | | | 273 | |
| | | | | | | | | | | |
| | Norway—3.2% | | | | | | | | | |
| | Borregaard ASA (Chemicals) | | | 30,641 | | | | | 134 | |
| | Fred Olsen Energy ASA (Energy equipment
& services) | | | 2,133 | | | | | 84 | |
| | Opera Software ASA (Internet software &
services) | | | 10,152 | | | | | 79 | |
| | TGS Nopec Geophysical Co. ASA (Energy
equipment & services) | | | 2,442 | | | | | 71 | |
| | | | | | | | | | 368 | |
| | | | | | | | | | | |
| | Japan—8.2% | | | | | | | | | |
| | ABC-Mart, Inc. (Specialty retail) | | | 1,800 | | | | | 70 | |
| | Kakaku.com, Inc. (Internet software &
services) | | | 3,600 | | | | | 110 | |
| | MISUMI Group, Inc. (Trading companies &
distributors) | | | 2,700 | | | | | 74 | |
| | MonotaRO Co., Ltd. (Trading companies &
distributors) | | | 3,100 | | | | | 76 | |
| | Nihon M&A Center, Inc. (Professional
services) | | | 1,300 | | | | | 73 | |
| | Park24 Co., Ltd. (Commercial services &
supplies) | | | 6,300 | | | | | 114 | |
| | Sawai Pharmaceutical Co., Ltd.
(Pharmaceuticals) | | | 500 | | | | | 60 | |
| | Sundrug Co., Ltd. (Food & staples retailing) | | | 1,800 | | | | | 76 | |
| | TS Tech Co., Ltd. (Auto components) | | | 3,600 | | | | | 114 | |
| | United Arrows, Ltd. (Specialty retail) | | | 4,000 | | | | | 167 | |
| | | | | | | | | | 934 | |
| | | | | | | | | | | |
| | Emerging Asia—6.5% | | | | | | | | | |
| | | | | | | | | | | |
| | China—2.3% | | | | | | | | | |
| | China Medical System Holdings, Ltd.
(Pharmaceuticals) | | | 94,000 | | | | | 84 | |
| | Hilong Holding, Ltd. (Energy equipment &
services) | | | 161,000 | | | | | 95 | |
| | Sunny Optical Technology Group Co., Ltd.
(Electronic equipment, instruments &
components) | | | 67,000 | | | | | 81 | |
| | | | | | | | | | 260 | |
| | Issuer | | Shares | | | Value | |
| | | | | | | | | | | |
| | Common Stocks—(continued) | | | | | | | | | |
| | | | | | | | | | | |
| | Emerging Asia—(continued) | | | | | | | | | |
| | | | | | | | | | | |
| | Indonesia—0.5% | | | | | | | | | |
| * | PT Bank Tabungan Pensiunan Nasional Tbk
(Commercial banks) | | | 132,000 | | | | $ | 55 | |
| | | | | | | | | | | |
| | Malaysia—0.9% | | | | | | | | | |
| | Guinness Anchor Bhd (Beverages) | | | 11,600 | | | | | 70 | |
| | Silverlake Axis, Ltd. (Software) | | | 48,000 | | | | | 28 | |
| | | | | | | | | | 98 | |
| | | | | | | | | | | |
| | Philippines—0.6% | | | | | | | | | |
| * | East West Banking Corporation
(Commercial banks) | | | 101,700 | | | | | 70 | |
| | | | | | | | | | | |
| | Taiwan—0.9% | | | | | | | | | |
| | Novatek Microelectronics Corporation
(Semiconductors & semiconductor
equipment) | | | 22,000 | | | | | 107 | |
| | | | | | | | | | | |
| | Thailand—1.3% | | | | | | | | | |
| | LPN Development PCL (Real estate
management & development) | | | 110,200 | | | | | 86 | |
| | Tisco Financial Group PCL (Commercial
banks) | | | 49,310 | | | | | 65 | |
| | | | | | | | | | 151 | |
| | | | | | | | |
| | Emerging Europe, Mid-East, Africa—4.4% | | | | | | |
| | | | | | | | | | | |
| | Kenya—1.1% | | | | | | | | | |
| | Safaricom, Ltd. (Wireless
telecommunication services) | | | 1,621,000 | | | | | 124 | |
| | | | | | | | | | | |
| | Poland—0.5% | | | | | | | | | |
| | LPP S.A. (Textiles, apparel & luxury goods) | | | 32 | | | | | 63 | |
| | | | | | | | | | | |
| | South Africa—1.3% | | | | | | | | | |
| | Coronation Fund Managers, Ltd. (Capital
markets) | | | 11,570 | | | | | 74 | |
| | Oceana Group, Ltd. (Food products) | | | 8,489 | | | | | 72 | |
| | | | | | | | | | 146 | |
| | | | | | | | | | | |
| | Turkey—1.5% | | | | | | | | | |
| | Tofas Turk Otomobil Fabrikasi A.S.
(Automobiles) | | | 15,968 | | | | | 100 | |
| | Turkiye Sinai Kalkinma Bankasi A.S.
(Commercial banks) | | | 67,774 | | | | | 67 | |
| | | | | | | | | | 167 | |
| | | | | | | | | | | |
| | Asia—3.8% | | | | | | | | | |
| | | | | | | | | | | |
| | Australia—1.9% | | | | | | | | | |
| | carsales.com, Ltd. (Internet software &
services) | | | 9,987 | | | | | 86 | |
| | DuluxGroup, Ltd. (Chemicals) | | | 20,000 | | | | | 77 | |
| | FlexiGroup, Ltd. (Consumer finance) | | | 13,556 | | | | | 54 | |
| | | | | | | | | | 217 | |
| | | | | | | | | | | |
| | New Zealand—1.0% | | | | | | | | | |
| | Ryman Healthcare, Ltd. (Health care
providers & services) | | | 21,259 | | | | | 105 | |
See accompanying Notes to Financial Statements.
| 30 | Semi-Annual Report | June 30, 2013 |
Global Small Cap Growth Fund
Portfolio of Investments, June 30, 2013 (all dollar amounts in thousands) (unaudited)
| | | | Shares or | | | | | |
| | | | Principal | | | | | |
| | Issuer | | Amount | | | Value | |
| | | | | | | | | | | |
| | Common Stocks—(continued) | | | | | | | | | |
| | | | | | | | | | | |
| | Asia—(continued) | | | | | | | | | |
| | | | | | | | | | | |
| | Singapore—0.9% | | | | | | | | | |
| | ARA Asset Management Ltd.—144A
(Capital markets) | | | 74,000 | | | | $ | 102 | |
| | | | | | | | | | | |
| | Emerging Latin America—1.8% | | | | | | | | | |
| | | | | | | | | | | |
| | Brazil—1.2% | | | | | | | | | |
| | Iguatemi Empresa de Shopping Centers S.A.
(Real estate management & development) | | | 5,800 | | | | | 57 | |
| | Mills Estruturas e Servicos de Engenharia
S.A. (Trading companies & distributors) | | | 5,800 | | | | | 79 | |
| | | | | | | | | | 136 | |
| | | | | | | | | | | |
| | Mexico—0.6% | | | | | | | | | |
| | Banregio Grupo Financiero S.A.B. de C.V.
(Commercial banks) | | | 13,474 | | | | | 71 | |
| | | | | | | | | | | |
| | Total Common Stocks—94.5%
(cost $10,375) | | | | | | | | 10,729 | |
| | | | | | | | | | | |
| | Exchange-Traded Fund | | | | | | | | | |
| | | | | | | | | | | |
| | India—1.4% | | | | | | | | | |
| | Market Vectors India Small—Cap Index ETF | | | 22,125 | | | | | 157 | |
| | | | | | | | | | | |
| | Total Exchange-Traded Fund—1.4%
(cost $198) | | | | | | | | 157 | |
| | | | | | | | | | | |
| | Repurchase Agreement | | | | | | | | | |
| | Fixed Income Clearing Corporation, 0.010%
dated 6/28/13, due 7/1/13, repurchase
price $238, collateralized by U.S.
Treasury Note, 0.750%, due 10/31/17 | | | $238 | | | | | 238 | |
| | | | | | | | | | | |
| | Total Repurchase Agreement—2.1%
(cost $238) | | | | | | | | 238 | |
| | | | | | | | | | | |
| | Total Investments—98.0%
(cost $10,811) | | | | | | | | 11,124 | |
| | Cash and other assets, less liabilities—2.0% | | | | | | | | 230 | |
| | Net assets—100.0% | | | | | | | $ | 11,354 | |
* Non-income producing securities
For securities primarily traded on exchanges or markets that close before the close of regular trading on the New York Stock Exchange, the Fund may use an independent pricing service to fair value price the securities pursuant to Valuation Procedures approved by the Board of Trustees.
At June 30, 2013, the Fund’s Portfolio of Investments includes the following industry categories:
| Industrials | | | 24.1 | % |
| Consumer Discretionary | | | 17.9 | % |
| Financials | | | 15.9 | % |
| Information Technology | | | 15.2 | % |
| Health Care | | | 12.6 | % |
| Energy | | | 5.5 | % |
| Consumer Staples | | | 3.5 | % |
| Materials | | | 2.8 | % |
| Exchange-Traded Funds | | | 1.4 | % |
| Telecommunication Services | | | 1.1 | % |
| Total | | | 100.0 | % |
At June 30, 2013, the Fund’s Portfolio of Investments includes the following currency categories:
| U.S. Dollar | | | 49.4 | % |
| British Pound Sterling | | | 11.4 | % |
| Japanese Yen | | | 8.6 | % |
| Euro | | | 6.9 | % |
| Norwegian Krone | | | 3.4 | % |
| Canadian Dollar | | | 2.6 | % |
| Hong Kong Dollar | | | 2.4 | % |
| Australian Dollar | | | 2.0 | % |
| Turkish Lira | | | 1.5 | % |
| Thai Baht | | | 1.4 | % |
| South African Rand | | | 1.3 | % |
| Brazilian Real | | | 1.3 | % |
| Singapore Dollar | | | 1.2 | % |
| Kenyan Shilling | | | 1.1 | % |
| Danish Krone | | | 1.1 | % |
| All Other Currencies | | | 4.4 | % |
| Total | | | 100.0 | % |
See accompanying Notes to Financial Statements.
| June 30, 2013 | William Blair Funds | 31 |
| | INTERNATIONAL GROWTH FUND |
| | |
| | The International Growth Fund seeks long-term capital appreciation. |
| | |
| | AN OVERVIEW FROM THE PORTFOLIO MANAGERS |
| | |
 W. George Greig 
Jeffrey A. Urbina 
Simon Fennell | The William Blair International Growth Fund (Class N shares) posted a 1.96% increase, net of fees, for the six months ended June 30, 2013. By comparison, the Fund’s benchmark index, the MSCI ACW Ex-U.S. IMI Index (net) (the “Index”), increased 0.18%. The Fund outperformed the Index as its Consumer Discretionary, Financials, and Materials stock selection was strong, and due to the Fund’s higher weighting in Consumer Discretionary at the expense of Resources. Consumer Discretionary performance was driven by Fuji Heavy, coupled with strong performance in Auto Components, Specialty Retail, and Media. Financials stock selection was bolstered by the 5.3% Commercial Banks return, as compared to the -1.4% Index return, in addition to strong performance by Japanese holdings and Insurance. Materials stock selection benefited from outperformance in the underweighted Metals/Mining industry. The Fund’s focus on companies with above average earnings trends and positive price momentum added value year to date, offsetting the higher quality focus and higher valuation, which hampered results. Somewhat mitigating these performance drivers were underperformance in Oil/Gas and in Europe ex-U.K. more broadly. We increased the Fund’s weighting in Japan from 13.6% at the end of 2012 on an improving fiscal/monetary policy outlook, coupled with improving earnings and moderate valuations. However, in May we reduced the Fund’s weighting in Japan from nearly 18% down to 15.5%, on concerns about valuation, but began increasing the weighting again in June after the market underperformed. As of June 30, the Fund maintained an approximate market weight of 16.5% in Japan, tilted towards Consumer Discretionary and Financials holdings. The U.K. increased from 18.1% to 24.2% of the Fund, well above the 13.7% Index weighting, due primarily to higher weightings in Consumer Discretionary, Financials (Insurers), and Industrials. Emerging markets were reduced from approximately 22% to 19.4%, both due to emerging markets underperformance, coupled with reductions in Korea, South Africa, and Brazil. From a sector perspective, the Fund’s largest weighting was in Financials, which totaled 27.0% of the Fund, above the 25.6% Index weighting, due to higher Capital Markets and Insurance weightings, which more than offset the lower weighting in Commercial Banks. Industrials and Consumer Discretionary each approximated 17% of the Fund, above the Index weighting, while Resources were significantly underweighted at approximately 8% of the Fund, well below the 18% Index weighting. |
| 32 | Semi-Annual Report | June 30, 2013 |
International Growth Fund
Performance Highlights (Unaudited)
| Average Annual Total Return at 6/30/2013 |
| | | Year
to Date | | 1 Year | | 3 Year | | 5 Year | | 10 Year |
| Class N | | | 1.96 | % | | | 17.13 | % | | | 10.56 | % | | | (0.13 | )% | | | 8.94 | % |
| Class I | | | 2.14 | | | | 17.45 | | | | 10.87 | | | | 0.17 | | | | 9.25 | |
| MSCI ACW Ex-U.S. IMI (net) | | | 0.18 | | | | 13.91 | | | | 8.13 | | | | (0.41 | ) | | | 8.95 | |
Performance cited represents past performance. Past performance does not guarantee future results and current performance may be lower or higher than the data quoted. Results shown are average annual total returns, which assume reinvestment of dividends and capital gains. Investment returns and principal will fluctuate and you may have a gain or loss when you sell shares. For the most current month-end performance information, please call 1-800-742-7272, or visit our Web site at www.williamblairfunds.com. From time to time, the investment advisor may waive fees or reimburse expenses for the Fund. Without these waivers, performance would be lower. International investing involves special risk considerations, including currency fluctuations, lower liquidity, economic and political risk. Class N shares are available to the general public without a sales load. Class I shares are available to certain institutional investors and advisory clients of William Blair & Company, L.L.C., without a sales load or distribution (12b-1) or service fees.
The performance highlights and graph presented above do not reflect the deduction of taxes that a shareholder would pay on fund distributions or the redemption of fund shares.
The Morgan Stanley Capital International (MSCI) All Country World (ACW) Ex-U.S. Investable Market Index (IMI) (net) is a free float-adjusted market capitalization weighted index that is designed to measure the equity market performance of developed and emerging markets, excluding the United States. This series approximates the minimum possible dividend reinvestment.
This report identifies the Fund’s investments on June 30, 2013. These holdings are subject to change. Not all stocks in the Fund performed the same, nor is there any guarantee that these stocks will perform as well in the future. Market forecasts provided in this report may not necessarily come to pass.
Sector Diversification (Unaudited)

The sector diversification shown is based on the total long-term securities.
| June 30, 2013 | William Blair Funds | 33 |
International Growth Fund
Portfolio of Investments, June 30, 2013 (all dollar amounts in thousands) (unaudited)
| | Issuer | | Shares | | | Value | |
| | | | | | | | | |
| | Common Stocks | | | | | | | | | |
| | | | | | | | | | | |
| | Europe—28.2% | | | | | | | | | |
| | | | | | | | | | | |
| | Austria—0.1% | | | | | | | | | |
| | Andritz AG (Machinery) | | | 76,092 | | | | $ | 3,905 | |
| | | | | | | | | | | |
| | Belgium—0.4% | | | | | | | | | |
| | Colruyt S.A. (Food & staples retailing) | | | 290,449 | | | | | 15,275 | |
| | | | | | | | | | | |
| | Denmark—0.7% | | | | | | | | | |
| | GN Store Nord A/S (Health care equipment
& supplies) | | | 1,049,292 | | | | | 19,832 | |
| | SimCorp A/S (Software) | | | 273,400 | | | | | 8,111 | |
| | | | | | | | | | 27,943 | |
| | | | | | | | | | | |
| | Finland—1.5% | | | | | | | | | |
| | Kone Oyj (Machinery) | | | 232,336 | | | | | 18,463 | |
| | Sampo (Insurance) | | | 1,032,299 | | | | | 40,230 | |
| | | | | | | | | | 58,693 | |
| | France—4.9% | | | | | | | | | |
| | AXA S.A. (Insurance) | | | 3,003,033 | | | | | 59,005 | |
| | BNP Paribas S.A. (Commercial banks) | | | 566,292 | | | | | 30,940 | |
| | Hermes International (Textiles, apparel &
luxury goods) | | | 43,320 | | | | | 13,984 | |
| | Publicis Groupe S.A. (Media) | | | 393,947 | | | | | 28,049 | |
| | Societe BIC S.A. (Commercial services &
supplies) | | | 13,050 | | | | | 1,308 | |
| | Unibail-Rodamco SE (Real estate
investment trusts (REITs)) | | | 201,025 | | | | | 46,838 | |
| | Zodiac Aerospace (Aerospace & defense) | | | 48,980 | | | | | 6,484 | |
| | | | | | | | | | 186,608 | |
| | | | | | | | | | | |
| | Germany—5.6% | | | | | | | | | |
| | Adidas AG (Textiles, apparel & luxury
goods) | | | 290,902 | | | | | 31,481 | |
| | Bayer AG (Pharmaceuticals) | | | 503,678 | | | | | 53,715 | |
| | Bayerische Motoren Werke AG
(Automobiles) | | | 686,508 | | | | | 60,032 | |
| | Bertrandt AG (Professional services) | | | 54,018 | | | | | 5,802 | |
| | Brenntag AG (Trading companies &
distributors) | | | 105,977 | | | | | 16,098 | |
| | Deutsche Wohnen AG (Real estate
management & development) | | | 917,068 | | | | | 15,572 | |
| | Gerry Weber International AG (Textiles,
apparel & luxury goods) | | | 51,586 | | | | | 2,182 | |
| | MTU Aero Engines AG (Aerospace &
defense) | | | 203,543 | | | | | 19,632 | |
| | Wincor Nixdorf AG (Computers &
peripherals) | | | 162,392 | | | | | 8,806 | |
| | | | | | | | | | 213,320 | |
| | | | | | | | | | | |
| | Italy—1.6% | | | | | | | | | |
| | Azimut Holding SpA (Capital markets) | | | 667,642 | | | | | 12,158 | |
| | Banca Generali SpA (Capital markets) | | | 260,522 | | | | | 5,616 | |
| | Brembo SpA (Auto components) | | | 193,675 | | | | | 3,456 | |
| | Intesa Sanpaolo SpA (Commercial banks) | | | 16,979,569 | | | | | 27,207 | |
| | Tod’s SpA (Textiles, apparel & luxury
goods) | | | 98,438 | | | | | 13,915 | |
| | | | | | | | | | 62,352 | |
| | Issuer | | Shares | | | Value | |
| | | | | | | | | |
| | Common Stocks—(continued) | | | | | | | | | |
| | | | | | | | | | | |
| | Luxembourg—0.1% | | | | | | | | | |
| * | Eurofins Scientific (Life sciences tools &
services) | | | 23,494 | | | | $ | 4,963 | |
| | | | | | | | | | | |
| | Netherlands—1.6% | | | | | | | | | |
| | Unilever N.V. (Food products) | | | 1,573,083 | | | | $ | 61,950 | |
| | | | | | | | | | | |
| | Norway—3.5% | | | | | | | | | |
| * | Algeta ASA (Biotechnology) | | | 125,365 | | | | | 4,771 | |
| | Fred Olsen Energy ASA (Energy equipment
& services) | | | 150,866 | | | | | 5,961 | |
| | Prosafe SE (Energy equipment & services) | | | 609,213 | | | | | 5,351 | |
| | Statoil ASA (Oil, gas & consumable fuels) | | | 2,673,972 | | | | | 55,158 | |
| | Telenor ASA (Diversified
telecommunication services) | | | 2,311,571 | | | | | 45,818 | |
| | TGS Nopec Geophysical Co. ASA (Energy
equipment & services) | | | 577,852 | | | | | 16,790 | |
| | | | | | | | | | 133,849 | |
| | | | | | | | | | | |
| | Spain—0.1% | | | | | | | | | |
| | Viscofan S.A. (Food products) | | | 36,731 | | | | | 1,840 | |
| | | | | | | | | | | |
| | Sweden—1.2% | | | | | | | | | |
| | Atlas Copco AB Class “A” (Machinery) | | | 1,454,149 | | | | | 35,128 | |
| | Hexpol AB (Chemicals) | | | 165,901 | | | | | 10,811 | |
| | | | | | | | | | 45,939 | |
| | | | | | | | | | | |
| | Switzerland—6.9% | | | | | | | | | |
| | Burckhardt Compression Holding AG
(Machinery) | | | 14,258 | | | | | 5,676 | |
| * | Credit Suisse Group AG (Capital markets) | | | 2,005,034 | | | | | 53,175 | |
| | Geberit AG (Building products) | | | 109,554 | | | | | 27,175 | |
| | Glencore Xstrata plc (Metals & mining) | | | 13,778,882 | | | | | 57,034 | |
| | Partners Group Holding AG (Capital
markets) | | | 87,548 | | | | | 23,705 | |
| | Roche Holding AG (Pharmaceuticals) | | | 316,608 | | | | | 78,771 | |
| | SGS S.A. (Professional services) | | | 9,852 | | | | | 21,163 | |
| | | | | | | | | | 266,699 | |
| | | | | | | | | | | |
| | United Kingdom—24.2% | | | | | | | | | |
| | Abcam plc (Biotechnology) | | | 1,032,007 | | | | | 7,118 | |
| | Aberdeen Asset Management plc (Capital
markets) | | | 2,813,276 | | | | | 16,379 | |
| | Amlin plc (Insurance) | | | 2,410,896 | | | | | 14,422 | |
| | Antofagasta plc (Metals & mining) | | | 794,581 | | | | | 9,608 | |
| | ARM Holdings plc (Semiconductors &
semiconductor equipment) | | | 549,221 | | | | | 6,641 | |
| | Ashmore Group plc (Capital markets) | | | 1,305,974 | | | | | 6,827 | |
| | AZ Electronic Materials S.A. (Chemicals) | | | 1,177,339 | | | | | 5,501 | |
| | Babcock International Group plc
(Commercial services & supplies) | | | 1,915,640 | | | | | 32,137 | |
| | Berkeley Group Holdings plc (Household
durables) | | | 889,740 | | | | | 28,838 | |
| | Big Yellow Group plc (Real estate
investment trusts (REITs)) | | | 959,247 | | | | | 5,611 | |
| | BT Group plc (Diversified
telecommunication services) | | | 8,866,529 | | | | | 41,697 | |
| | Bunzl plc (Trading companies & distributors) | | | 997,727 | | | | | 19,424 | |
| | Capita plc (Professional services) | | | 1,050,949 | | | | | 15,441 | |
See accompanying Notes to Financial Statements.
| 34 | Semi-Annual Report | June 30, 2013 |
International Growth Fund
Portfolio of Investments, June 30, 2013 (all dollar amounts in thousands) (unaudited)
| | Issuer | | Shares | | | Value | |
| | | | | | | | | | | |
| | United Kingdom—(continued) | | | | | | | | | |
| | Compass Group plc (Hotels, restaurants &
leisure) | | | 3,004,472 | | | | $ | 38,385 | |
| | Daily Mail & General Trust plc (Media) | | | 1,169,534 | | | | | 13,688 | |
| | Derwent London plc (Real estate investment
trusts (REITs)) | | | 227,568 | | | | | 7,961 | |
| | Diageo plc (Beverages) | | | 1,609,633 | | | | | 46,026 | |
| | Dunelm Group plc (Specialty retail) | | | 1,032,488 | | | | | 14,871 | |
| | easyJet plc (Airlines) | | | 1,233,540 | | | | | 24,315 | |
| | Elementis plc (Chemicals) | | | 2,209,133 | | | | | 7,372 | |
| | Experian plc (Professional services) | | | 1,276,640 | | | | | 22,194 | |
| | GlaxoSmithKline plc (Pharmaceuticals) | | | 1,916,860 | | | | | 48,047 | |
| | Halma plc (Electronic equipment,
instruments & components) | | | 1,365,998 | | | | | 10,461 | |
| | Hargreaves Lansdown plc (Capital markets) | | | 478,172 | | | | | 6,458 | |
| | Hiscox, Ltd. (Insurance) | | | 1,115,330 | | | | | 9,661 | |
| | Howden Joinery Group plc (Specialty retail) | | | 2,201,695 | | | | | 8,485 | |
| | IG Group Holdings plc (Diversified
financial services) | | | 1,280,360 | | | | | 11,295 | |
| | IMI plc (Machinery) | | | 811,162 | | | | | 15,298 | |
| | InterContinental Hotels Group plc (Hotels,
restaurants & leisure) | | | 1,360,031 | | | | | 37,399 | |
| | ITV plc (Media) | | | 19,220,646 | | | | | 40,956 | |
| | John Wood Group plc (Energy equipment
& services) | | | 1,635,209 | | | | | 20,133 | |
| | Jupiter Fund Management plc (Capital
markets) | | | 1,724,240 | | | | | 7,597 | |
| | Keller Group plc (Construction &
engineering) | | | 374,316 | | | | | 5,642 | |
| | Lancashire Holdings, Ltd. (Insurance) | | | 1,081,998 | | | | | 13,034 | |
| | Meggitt plc (Aerospace & defense) | | | 1,934,732 | | | | | 15,228 | |
| | Moneysupermarket.com Group plc
(Internet software & services) | | | 3,081,548 | | | | | 8,980 | |
| * | Nanoco Group plc (Semiconductors &
semiconductor equipment) | | | 801,031 | | | | | 1,608 | |
| | Oxford Instruments plc (Electronic
equipment, instruments & components) | | | 104,503 | | | | | 1,922 | |
| | Provident Financial plc (Consumer finance) | | | 416,653 | | | | | 9,436 | |
| | Prudential plc (Insurance) | | | 4,416,583 | | | | | 72,212 | |
| | Reckitt Benckiser Group plc (Household
products) | | | 719,292 | | | | | 50,849 | |
| | Restaurant Group plc (Hotels, restaurants &
leisure) | | | 462,636 | | | | | 3,518 | |
| | Rightmove plc (Media) | | | 470,896 | | | | | 14,926 | |
| * | Rolls-Royce Holdings plc (Aerospace &
defense) | | | 2,526,183 | | | | | 43,570 | |
| | Rotork plc (Machinery) | | | 285,126 | | | | | 11,579 | |
| | RPS Group plc (Commercial services &
supplies) | | | 1,049,791 | | | | | 3,225 | |
| | Senior plc (Machinery) | | | 1,030,368 | | | | | 3,924 | |
| | St James’s Place plc (Insurance) | | | 1,386,208 | | | | | 11,385 | |
| | Tullow Oil plc (Oil, gas & consumable fuels) | | | 2,424,690 | | | | | 36,915 | |
| | William Hill plc (Hotels, restaurants &
leisure) | | | 2,904,000 | | | | | 19,474 | |
| | | | | | | | | | 927,673 | |
| | Issuer | | Shares | | | Value | |
| | | | | | | | | | | |
| | Japan—16.5% | | | | | | | | | |
| | Astellas Pharma, Inc. (Pharmaceuticals) | | | 745,400 | | | | $ | 40,509 | |
| | Daikin Industries, Ltd. (Building products) | | | 388,300 | | | | | 15,700 | |
| | Denso Corporation (Auto components) | | | 735,300 | | | | | 34,585 | |
| | FamilyMart Co., Ltd. (Food & staples
retailing) | | | 287,600 | | | | | 12,266 | |
| | Fuji Heavy Industries, Ltd. (Automobiles) | | | 2,856,000 | | | | | 70,407 | |
| | Isuzu Motors, Ltd. (Automobiles) | | | 3,831,000 | | | | | 26,228 | |
| | ITOCHU Corporation (Trading companies
& distributors) | | | 3,465,400 | | | | | 40,007 | |
| | Keyence Corporation (Electronic equipment,
instruments & components) | | | 44,000 | | | | | 14,041 | |
| | Lawson, Inc. (Food & staples retailing) | | | 295,000 | | | | | 22,516 | |
| | Makita Corporation (Machinery) | | | 549,700 | | | | | 29,708 | |
| | MISUMI Group, Inc. (Trading companies
& distributors) | | | 152,800 | | | | | 4,201 | |
| | Nexon Co., Ltd. (Software) | | | 1,340,300 | | | | | 14,784 | |
| | Nitto Denko Corporation (Chemicals) | | | 317,600 | | | | | 20,430 | |
| | ORIX Corporation (Diversified financial
services) | | | 4,134,500 | | | | | 56,486 | |
| | Park24 Co., Ltd. (Commercial services &
supplies) | | | 336,600 | | | | | 6,105 | |
| | Secom Co., Ltd. (Commercial services &
supplies) | | | 388,600 | | | | | 21,158 | |
| | Shimamura Co., Ltd. (Specialty retail) | | | 100,400 | | | | | 12,198 | |
| | Shin-Etsu Chemical Co., Ltd. (Chemicals) | | | 311,100 | | | | | 20,640 | |
| | Ship Healthcare Holdings, Inc. (Health
care providers & services) | | | 201,700 | | | | | 7,423 | |
| | Sumitomo Mitsui Financial Group, Inc.
(Commercial banks) | | | 1,944,900 | | | | | 89,225 | |
| | Sundrug Co., Ltd. (Food & staples retailing) | | | 198,700 | | | | | 8,434 | |
| | Suruga Bank, Ltd. (Commercial banks) | | | 1,049,000 | | | | | 19,059 | |
| | TS Tech Co., Ltd. (Auto components) | | | 125,000 | | | | | 3,970 | |
| | Tsuruha Holdings, Inc. (Food & staples
retailing) | | | 71,100 | | | | | 6,731 | |
| | United Arrows, Ltd. (Specialty retail) | | | 154,300 | | | | | 6,449 | |
| | Yahoo! Japan Corporation (Internet
software & services) | | | 64,625 | | | | | 31,863 | |
| | | | | | | | | | 635,123 | |
| | | | | | | | | | | |
| | Emerging Asia—13.6% | | | | | | | | | |
| | | | | | | | | | | |
| | China—5.3% | | | | | | | | | |
| | AAC Technologies Holdings, Inc.
(Communications equipment) | | | 2,490,000 | | | | | 14,062 | |
| | Biostime International Holdings, Ltd.
(Food products) | | | 224,500 | | | | | 1,259 | |
| | China Merchants Bank Co., Ltd. Class “H”
(Commercial banks) | | | 11,904,500 | | | | | 19,892 | |
| | China Overseas Grand Oceans Group, Ltd.
(Real estate management & development) | | | 6,904,000 | | | | | 8,812 | |
| | China Overseas Land & Investment, Ltd.
(Real estate management &
development) | | | 12,300,000 | | | | | 32,272 | |
| | Great Wall Motor Co., Ltd. Class “H”
(Automobiles) | | | 5,831,500 | | | | | 25,150 | |
| | Haier Electronics Group Co., Ltd.
(Household durables) | | | 2,237,000 | | | | | 3,565 | |
See accompanying Notes to Financial Statements.
| June 30, 2013 | William Blair Funds | 35 |
International Growth Fund
Portfolio of Investments, June 30, 2013 (all dollar amounts in thousands) (unaudited)
| | Issuer | | Shares | | | Value | |
| | | | | | | | | | | |
| | Emerging Asia—(continued) | | | | | | | | | |
| | | | | | | | | | | |
| | China—(continued) | | | | | | | | | |
| | Haitian International Holdings, Ltd.
(Machinery) | | | 1,345,000 | | | | $ | 1,967 | |
| * | Hollysys Automation Technologies, Ltd.
(Electronic equipment, instruments &
components)† | | | 403,494 | | | | | 5,007 | |
| | Industrial and Commercial Bank of China,
Ltd. Class “H” (Commercial banks) | | | 47,974,000 | | | | | 30,246 | |
| | Minth Group, Ltd. (Auto components) | | | 2,588,000 | | | | | 4,024 | |
| | Sino Biopharmaceutical (Pharmaceuticals) | | | 17,796,000 | | | | | 11,541 | |
| | Tencent Holdings, Ltd. (Internet software
& services) | | | 1,096,600 | | | | | 43,010 | |
| * | WuXi PharmaTech Cayman, Inc.—ADR
(Life sciences tools & services) | | | 233,977 | | | | | 4,914 | |
| | | | | | | | | | 205,721 | |
| | | | | | | | | | | |
| | India—2.3% | | | | | | | | | |
| | Eicher Motors, Ltd. (Machinery) | | | 80,335 | | | | | 4,430 | |
| | Glenmark Pharmaceuticals, Ltd.
(Pharmaceuticals) | | | 1,532,904 | | | | | 14,142 | |
| | Gruh Finance, Ltd. (Thrifts & mortgage
finance) | | | 870,425 | | | | | 3,350 | |
| | HCL Technologies, Ltd. (IT services) | | | 805,794 | | | | | 10,523 | |
| | IndusInd Bank, Ltd. (Commercial banks) | | | 1,025,306 | | | | | 8,065 | |
| | Ipca Laboratories, Ltd. (Pharmaceuticals) | | | 601,557 | | | | | 6,633 | |
| | Lupin, Ltd. (Pharmaceuticals) | | | 744,202 | | | | | 9,786 | |
| | Oberoi Realty, Ltd. (Real estate
management & development) | | | 872,228 | | | | | 2,904 | |
| | Tata Consultancy Services, Ltd. (IT services) | | | 761,381 | | | | | 19,451 | |
| | Yes Bank, Ltd. (Commercial banks) | | | 1,069,125 | | | | | 8,296 | |
| | | | | | | | | | 87,580 | |
| | | | | | | | | | | |
| | Indonesia—1.2% | | | | | | | | | |
| | PT Alam Sutera Realty Tbk (Real estate
management & development) | | | 48,407,500 | | | | | 3,658 | |
| | PT Bank Rakyat Indonesia Persero Tbk
(Commercial banks) | | | 21,856,500 | | | | | 17,067 | |
| | PT Ciputra Development Tbk (Real estate
management & development) | | | 29,420,500 | | | | | 4,002 | |
| | PT Telekomunikasi Indonesia Persero Tbk
(Diversified telecommunication services) | | | 19,360,000 | | | | | 21,944 | |
| | | | | | | | | | 46,671 | |
| | | | | | | | | | | |
| | Philippines—0.1% | | | | | | | | | |
| | Security Bank Corporation (Commercial
banks) | | | 978,390 | | | | | 3,424 | |
| | | | | | | | | | | |
| | South Korea—1.6% | | | | | | | | | |
| | GS Home Shopping, Inc. (Internet &
catalog retail) | | | 29,524 | | | | | 6,114 | |
| | Samsung Electronics Co., Ltd.
(Semiconductors & semiconductor
equipment) | | | 45,873 | | | | | 53,905 | |
| | | | | | | | | | 60,019 | |
| | | | | | | | | | | |
| | Sri Lanka—0.1% | | | | | | | | | |
| | John Keells Holdings plc (Industrial
conglomerates) | | | 1,892,546 | | | | | 3,657 | |
| | Issuer | | Shares | | | | Value | |
| | | | | | | | | | | |
| | Emerging Asia—(continued) | | | | | | | | | |
| | | | | | | | | | | |
| | Taiwan—2.2% | | | | | | | | | |
| | Asustek Computer, Inc. (Computers &
peripherals) | | | 1,498,000 | | | | $ | 12,895 | |
| | Eclat Textile Co., Ltd. (Textiles, apparel &
luxury goods) | | | 1,102,000 | | | | | 8,144 | |
| | St Shine Optical Co., Ltd. (Health care
equipment & supplies) | | | 101,000 | | | | | 2,625 | |
| | Taiwan Semiconductor Manufacturing Co.,
Ltd.—ADR (Semiconductors &
semiconductor equipment) | | | 3,234,522 | | | | | 59,257 | |
| | | | | | | | | | 82,921 | |
| | | | | | | | | | | |
| | Thailand—0.8% | | | | | | | | | |
| | Advanced Info Service PCL (Wireless
telecommunication services) | | | 900,600 | | | | | 8,189 | |
| | BEC World PCL (Media) | | | 3,101,400 | | | | | 5,875 | |
| | Kasikornbank PCL (Commercial banks) | | | 2,207,100 | | | | | 13,948 | |
| | Kiatnakin Bank PCL (Commercial banks) | | | 1,824,300 | | | | | 3,117 | |
| | | | | | | | | | 31,129 | |
| | | | | | | | | | | |
| | | | | | | | | | | |
| | Asia—6.6% | | | | | | | | | |
| | | | | | | | | | | |
| | Australia—2.6% | | | | | | | | | |
| | CSL, Ltd. (Biotechnology) | | | 503,913 | | | | | 28,380 | |
| | DuluxGroup, Ltd. (Chemicals) | | | 1,656,717 | | | | | 6,379 | |
| | REA Group, Ltd. (Media) | | | 150,375 | | | | | 3,786 | |
| | Seek, Ltd. (Professional services) | | | 667,303 | | | | | 5,535 | |
| | Super Retail Group, Ltd. (Specialty retail) | | | 383,487 | | | | | 4,198 | |
| | Telstra Corporation, Ltd. (Diversified
telecommunication services) | | | 11,789,844 | | | | | 51,432 | |
| | | | | | | | | | 99,710 | |
| | | | | | | | | | | |
| | Hong Kong—2.5% | | | | | | | | | |
| | China High Precision Automation Group,
Ltd. (Electronic equipment, instruments
& components)**§ | | | 6,597,000 | | | | | 689 | |
| | Hutchison Telecommunications Hong Kong
Holdings, Ltd. (Diversified
telecommunication services) | | | 23,772,000 | | | | | 12,566 | |
| | Sa Sa International Holdings, Ltd.
(Specialty retail) | | | 10,214,000 | | | | | 10,140 | |
| | SmarTone Telecommunications Holdings,
Ltd. (Wireless telecommunication services) | | | 6,639,000 | | | | | 11,025 | |
| | Techtronic Industries Co. (Household
durables) | | | 6,588,000 | | | | | 15,765 | |
| | Value Partners Group, Ltd. (Capital markets) | | | 7,014,000 | | | | | 3,780 | |
| | Wharf Holdings, Ltd. (Real estate
management & development) | | | 5,007,000 | | | | | 42,091 | |
| | | | | | | | | | 96,056 | |
| | | | | | | | | | | |
| | New Zealand—0.1% | | | | | | | | | |
| | Ryman Healthcare, Ltd. (Health care
providers & services) | | | 1,179,202 | | | | | 5,821 | |
| | | | | | | | | | | |
| | Singapore—1.4% | | | | | | | | | |
| | First Resources, Ltd. (Food products) | | | 3,336,000 | | | | | 4,672 | |
| | Keppel Corporation, Ltd. (Industrial
conglomerates) | | | 1,619,300 | | | | | 13,286 | |
See accompanying Notes to Financial Statements.
| 36 | Semi-Annual Report | June 30, 2013 |
International Growth Fund
Portfolio of Investments, June 30, 2013 (all dollar amounts in thousands) (unaudited)
| | Issuer | | Shares | | | Value | |
| | | | | | | | | | | |
| | Asia—(continued) | | | | | | | | | |
| | | | | | | | | | | |
| | Singapore—(continued) | | | | | | | | | |
| | Singapore Technologies Engineering, Ltd.
(Aerospace & defense) | | | 8,184,000 | | | | $ | 27,054 | |
| | StarHub, Ltd. (Wireless telecommunication
services) | | | 2,735,000 | | | | | 9,020 | |
| | | | | | | | | | 54,032 | |
| | | | | | | | | | | |
| | Emerging Europe, Mid-East, Africa—3.0% | | | | | | | | | |
| | | | | | | | | | | |
| | Kenya—0.1% | | | | | | | | | |
| | Equity Bank, Ltd. (Commercial banks) | | | 5,466,500 | | | | | 1,991 | |
| | Kenya Commercial Bank, Ltd.
(Commercial banks) | | | 7,519,700 | | | | | 3,243 | |
| | | | | | | | | | 5,234 | |
| | | | | | | | | | | |
| | Nigeria—0.3% | | | | | | | | | |
| | Guaranty Trust Bank plc (Commercial
banks) | | | 70,554,411 | | | | | 10,549 | |
| | | | | | | | | | | |
| | Poland—0.3% | | | | | | | | | |
| * | Alior Bank S.A. (Commercial banks) | | | 116,884 | | | | | 3,148 | |
| | Eurocash S.A. (Food & staples retailing) | | | 459,791 | | | | | 8,123 | |
| | | | | | | | | | 11,271 | |
| | | | | | | | | | | |
| | South Africa—1.1% | | | | | | | | | |
| | Bidvest Group, Ltd. (Industrial
conglomerates) | | | 725,976 | | | | | 17,990 | |
| | Coronation Fund Managers, Ltd. (Capital
markets) | | | 703,262 | | | | | 4,464 | |
| | FirstRand, Ltd. (Diversified financial
services) | | | 5,992,585 | | | | | 17,538 | |
| | | | | | | | | | 39,992 | |
| | | | | | | | | | | |
| | Turkey—0.6% | | | | | | | | | |
| | Tofas Turk Otomobil Fabrikasi A.S.
(Automobiles) | | | 768,066 | | | | | 4,799 | |
| | Turkiye Halk Bankasi A.S. (Commercial
banks) | | | 2,252,278 | | | | | 19,093 | |
| | | | | | | | | | 23,892 | |
| | | | | | | | | | | |
| | United Arab Emirates—0.6% | | | | | | | | | |
| | Dragon Oil plc (Oil, gas & consumable
fuels) | | | 1,218,607 | | | | | 10,611 | |
| | First Gulf Bank PJSC (Commercial banks) | | | 2,968,407 | | | | | 12,890 | |
| | | | | | | | | | 23,501 | |
| | | | | | | | | | | |
| | Canada—2.8% | | | | | | | | | |
| | Canadian National Railway Co. (Road
& rail)† | | | 488,529 | | | | | 47,519 | |
| | CI Financial Corporation (Capital markets) | | | 630,623 | | | | | 18,151 | |
| | First Quantum Minerals, Ltd. (Metals &
mining) | | | 890,340 | | | | | 13,206 | |
| | Metro, Inc. (Food & staples retailing) | | | 320,762 | | | | | 21,496 | |
| | Westjet Airlines, Ltd. (Airlines) | | | 387,247 | | | | | 8,292 | |
| | | | | | | | | | 108,664 | |
| | Issuer | | Shares or
Principal
Amount | | | | Value | |
| | | | | | | | | | | |
| | Emerging Latin America—2.2% | | | | | | | | | |
| | | | | | | | | | | |
| | Brazil—1.4% | | | | | | | | | |
| * | BB Seguridade Participacoes S.A.
(Insurance) | | | 2,339,100 | | | | $ | 18,450 | |
| | CCR S.A (Transportation infrastructure) | | | 1,233,700 | | | | | 9,786 | |
| | Kroton Educacional S.A. (Diversified
consumer services) | | | 886,500 | | | | | 12,276 | |
| | Linx S.A. (Software) | | | 347,200 | | | | | 5,602 | |
| | Mills Estruturas e Servicos de Engenharia
S.A. (Trading companies & distributors) | | | 361,800 | | | | | 4,898 | |
| | | | | | | | | | 51,012 | |
| | Chile—0.6% | | | | | | | | | |
| | Forus S.A. (Textiles, apparel & luxury goods) | | | 607,900 | | | | | 3,465 | |
| | Inversiones La Construccion S.A.
(Diversified financial services) | | | 210,385 | | | | | 3,222 | |
| | Parque Arauco S.A. (Real estate
management & development) | | | 5,294,073 | | | | | 11,567 | |
| | Sonda S.A. (IT services) | | | 1,750,122 | | | | | 5,098 | |
| | | | | | | | | | 23,352 | |
| | | | | | | | | | | |
| | Mexico—0.2% | | | | | | | | | |
| | Banregio Grupo Financiero S.A.B. de C.V.
(Commercial banks) | | | 1,649,300 | | | | | 8,713 | |
| | | | | | | | | | | |
| | Total Common Stocks—97.1%
(cost $3,338,530) | | | | | | | | 3,729,053 | |
| | | | | | | | | | | |
| | Affiliated Fund | | | | | | | | | |
| | | | | | | | | | | |
| | China—0.6% | | | | | | | | | |
| | William Blair China A-Share Fund, LLC | | | 2,202,200 | | | | | 22,815 | |
| | | | | | | | | | | |
| | Total Affiliated Fund—0.6%
(cost $22,022) | | | | | | | | 22,815 | |
| | | | | | | | | | | |
| | Repurchase Agreement | | | | | | | | | |
| | Fixed Income Clearing Corporation, 0.010%
dated 6/28/13, due 7/1/13, repurchase
price $72,519, collateralized by U.S.
Treasury Note, 0.750%, due 10/31/17 | | | $72,519 | | | | | 72,519 | |
| | | | | | | | | | | |
| | Total Repurchase Agreement—1.9%
(cost $72,519) | | | | | | | | 72,519 | |
| | | | | | | | | | | |
| | Total Investments—99.6%
(cost $3,433,071) | | | | | | | | 3,824,387 | |
| | Cash and other assets, less liabilities—0.4% | | | | | | | | 15,491 | |
| | Net assets—100.0% | | | | | | | $ | 3,839,878 | |
ADR = American Depository Receipt
* Non-income producing securities
† = U.S. listed foreign security
** = Fair valued pursuant to Valuation Procedures adopted by the Board of Trustees. This holding represents 0.02% of the Fund’s net assets at June 30, 2013.
§ = Deemed illiquid pursuant to Liquidity Procedures approved by the Board of Trustees. This holding represents 0.02% of the net assets at June 30, 2013.
See accompanying Notes to Financial Statements.
| June 30, 2013 | William Blair Funds | 37 |
International Growth Fund
Portfolio of Investments, June 30, 2013 (all dollar amounts in thousands) (unaudited)
For securities primarily traded on exchanges or markets that close before the close of regular trading on the New York Stock Exchange, the Fund may use an independent pricing service to fair value price the securities pursuant to Valuation Procedures approved by the Board of Trustees.
At June 30, 2013, the Fund’s Portfolio of Investments includes the following industry categories:
| Financials | | 27.0% |
| Consumer Discretionary | | 17.0% |
| Industrials | | 17.0% |
| Health Care | | 9.4% |
| Information Technology | | 9.1% |
| Consumer Staples | | 7.1% |
| Telecommunication Services | | 5.4% |
| Energy | | 4.0% |
| Materials | | 4.0% |
| Total | | 100.0% |
At June 30, 2013, the Fund’s Portfolio of Investments includes the following currency categories:
| British Pound Sterling | | 26.5% |
| Japanese Yen | | 16.9% |
| Euro | | 16.5% |
| Hong Kong Dollar | | 7.9% |
| Swiss Franc | | 5.6% |
| U.S. Dollar | | 3.6% |
| Norwegian Krone | | 3.6% |
| Australian Dollar | | 2.7% |
| Indian Rupee | | 2.3% |
| Canadian Dollar | | 1.6% |
| South Korean Won | | 1.6% |
| Singapore Dollar | | 1.4% |
| Brazilian Real | | 1.4% |
| Indonesian Rupiah | | 1.2% |
| Swedish Krona | | 1.2% |
| South African Rand | | 1.1% |
| All Other Currencies | | 4.9% |
| Total | | 100.0% |
As of June 30, 2013 the Fund invested in William Blair China A-Share Fund, LLC, an affiliated fund. There are no unfunded commitments to the affiliated fund and the Fund may redeem its investment monthly.
| | | Shares Activity Affiliated with China A-Share Fund | | Period Ended June 30, 2013 |
| | | | | | | | | | | (in thousands) |
| Fund Name | | Balance
12/31/2012 | | Purchases | | Sales | | Balance
6/30/2013 | | | Value | |
| William Blair China A-Share Fund, LLC | | 2,202,200 | | — | | — | | 2,202,200 | | | $22,815 | |
| | | | | | | | | | | | $22,815 | |
Affiliated Funds accounted for $793 of change in net unrealized depreciation on investments during the period.
See accompanying Notes to Financial Statements.
| 38 | Semi-Annual Report | June 30, 2013 |
| | INSTITUTIONAL INTERNATIONAL GROWTH FUND |
| | |
| | The Institutional International Growth Fund seeks long-term capital appreciation. |
| | |
| | AN OVERVIEW FROM THE PORTFOLIO MANAGERS |
| | |

W. George Greig 
Jeffrey A. Urbina 
Simon Fennell | The William Blair Institutional International Growth Fund posted a 2.22% increase, net of fees, for the six months ended June 30, 2013. By comparison, the Fund’s benchmark index, the MSCI All Country World Ex-U.S. IMI Index (net) (the “Index”), increased 0.18%.
The Fund outperformed the Index as its Consumer, Financials, and Materials stock selection was strong, and due to the Fund’s higher weighting in Consumer Discretionary at the expense of Resources. Discretionary performance was driven by Fuji Heavy, coupled with strong performance in Auto Components, Specialty Retail, and Media. Financials stock selection was bolstered by the 5.3% Commercial Banks return, as compared to the -1.4% Index return, in addition to strong performance by Japanese holdings and Insurance. Materials stock selection benefited from outperformance in the underweighted Metals/Mining industry. The Fund’s focus on companies with above average earnings trends and positive price momentum added value year to date, offsetting the higher quality focus and higher valuation, which hampered results. Somewhat mitigating these performance drivers were underperformance in Oil/Gas and in Europe Ex-U.K. more broadly.
We increased the Fund’s weighting in Japan from 13.6% at the end of 2012 on an improving fiscal/monetary policy outlook, coupled with improving earnings and moderate valuations. However, in May we reduced the Fund’s weighting in Japan from nearly 18% down to 15.5%, on concerns about valuation, but began increasing the weighting again in June after the market underperformed. As of June 30, the Fund maintained an approximate market weight of 16.5% in Japan, tilted towards Discretionary and Financials holdings. The U.K. increased from 18.2% to 24.1% of the Fund, well above the 13.7% Index weighting, due primarily to higher weightings in Discretionary, Financials (Insurers), and Industrials. Emerging markets were reduced from approximately 22% to 19.3%, both due to emerging markets underperformance, coupled with reductions in Korea, South Africa, and Brazil. From a sector perspective, the Fund’s largest weighting was in Financials, which totaled 27.0% of the Fund, above the 25.6% Index weighting, due to higher Capital Markets and Insurance weightings, which more than offset the lower weighting in Commercial Banks. Industrials and Discretionary each approximated 17% of the Fund, above the Index weighting, while Resources were significantly underweighted at approximately 8% of the Fund, well below the 18% Index weighting. |
| June 30, 2013 | William Blair Funds | 39 |
Institutional International Growth Fund
Performance Highlights (Unaudited)
| Average Annual Total Return at 6/30/2013 |
| | | Year
to Date | | 1 Year | | 3 Year | | 5 Year | | 10 Year |
| Institutional Class | | | 2.22 | % | | | 17.47 | % | | | 11.20 | % | | | 0.35 | % | | | 9.36 | % |
| MSCI ACW Ex-U.S. IMI (net) | | | 0.18 | | | | 13.91 | | | | 8.13 | | | | (0.41 | ) | | | 8.95 | |
Performance cited represents past performance. Past performance does not guarantee future results and current performance may be lower or higher than the data quoted. Results shown are average annual returns, which assume reinvestment of dividends and capital gains. Investment returns and principal will fluctuate and you may have a gain or loss when you sell shares. For the most current month-end performance information, please call 1-800-742-7272, or visit our Web site at www.williamblairfunds.com. International investing involves special risk considerations, including currency fluctuations, lower liquidity, economic and political risk. Shares of the Fund are available without a sales load or distribution (12b-1) or service fees.
The performance highlights and graph presented above do not reflect the deduction of taxes that a shareholder would pay on fund distributions or the redemption of fund shares.
The Morgan Stanley Capital International (MSCI) All Country World (ACW) Ex-U.S. Investable Market Index (IMI) (net) is a free float-adjusted market capitalization weighted index that is designed to measure the equity market performance of developed and emerging markets, excluding the United States. This series approximates the minimum possible dividend reinvestment.
This report identifies the Fund’s investments on June 30, 2013. These holdings are subject to change. Not all stocks in the Fund performed the same, nor is there any guarantee that these stocks will perform as well in the future. Market forecasts provided in this report may not necessarily come to pass.
Sector Diversification (Unaudited)

The sector diversification shown is based on the total long-term securities.
| 40 | Semi-Annual Report | June 30, 2013 |
Institutional International Growth Fund
Portfolio of Investments, June 30, 2013 (all dollar amounts in thousands) (unaudited)
| | Issuer | | Shares | | | Value | |
| | | | | | | | | | | |
| | Common Stocks | | | | | | | | | |
| | | | | | | | | | | |
| | Europe—28.1% | | | | | | | | | |
| | | | | | | | | | | |
| | Austria—0.1% | | | | | | | | | |
| | Andritz AG (Machinery) | | | 41,001 | | | | $ | 2,104 | |
| | | | | | | | | | | |
| | Belgium—0.4% | | | | | | | | | |
| | Colruyt S.A. (Food & staples retailing) | | | 156,876 | | | | | 8,251 | |
| | | | | | | | | | | |
| | Denmark—0.7% | | | | | | | | | |
| | GN Store Nord A/S (Health care equipment
& supplies) | | | 567,331 | | | | | 10,723 | |
| | SimCorp A/S (Software) | | | 144,560 | | | | | 4,289 | |
| | | | | | | | | | 15,012 | |
| | Finland—1.5% | | | | | | | | | |
| | Kone Oyj Class ‘‘B’’ (Machinery) | | | 125,489 | | | | | 9,972 | |
| | Sampo Class ‘‘A’’ (Insurance) | | | 556,846 | | | | | 21,701 | |
| | | | | | | | | | 31,673 | |
| | France—4.9% | | | | | | | | | |
| | AXA S.A. (Insurance) | | | 1,620,463 | | | | | 31,840 | |
| | BNP Paribas S.A. (Commercial banks) | | | 305,864 | | | | | 16,711 | |
| | Hermes International (Textiles, apparel &
luxury goods) | | | 23,398 | | | | | 7,553 | |
| | Publicis Groupe S.A. (Media) | | | 212,088 | | | | | 15,101 | |
| | Societe BIC S.A. (Commercial services &
supplies) | | | 7,152 | | | | | 717 | |
| | Unibail-Rodamco SE (Real estate
investment trusts (REITs)) | | | 108,577 | | | | | 25,298 | |
| | Zodiac Aerospace (Aerospace & defense) | | | 26,277 | | | | | 3,478 | |
| | | | | | | | | | 100,698 | |
| | Germany—5.5% | | | | | | | | | |
| | Adidas AG (Textiles, apparel & luxury
goods) | | | 156,660 | | | | | 16,953 | |
| | Bayer AG (Pharmaceuticals) | | | 272,045 | | | | | 29,012 | |
| | Bayerische Motoren Werke AG
(Automobiles) | | | 369,988 | | | | | 32,353 | |
| | Bertrandt AG (Professional services) | | | 29,130 | | | | | 3,129 | |
| | Brenntag AG (Trading companies &
distributors) | | | 57,240 | | | | | 8,695 | |
| | Deutsche Wohnen AG (Real estate
management & development) | | | 494,646 | | | | | 8,399 | |
| | Gerry Weber International AG (Textiles,
apparel & luxury goods) | | | 27,675 | | | | | 1,171 | |
| | MTU Aero Engines AG (Aerospace &
defense) | | | 109,937 | | | | | 10,604 | |
| | Wincor Nixdorf AG (Computers &
peripherals) | | | 86,190 | | | | | 4,674 | |
| | | | | | | | | | 114,990 | |
| | Italy—1.6% | | | | | | | | | |
| | Azimut Holding SpA (Capital markets) | | | 360,605 | | | | | 6,567 | |
| | Banca Generali SpA (Capital markets) | | | 140,299 | | | | | 3,024 | |
| | Brembo SpA (Auto components) | | | 104,693 | | | | | 1,868 | |
| | Intesa Sanpaolo SpA (Commercial banks) | | | 9,162,321 | | | | | 14,681 | |
| | Tod’s SpA (Textiles, apparel & luxury
goods) | | | 53,168 | | | | | 7,516 | |
| | | | | | | | | | 33,656 | |
| | Issuer | | Shares | | | Value | |
| | | | | | | | | | | |
| | Common Stocks—(continued) | | | | | | | | | |
| | | | | | | | | | | |
| | Europe—(continued) | | | | | | | | | |
| | | | | | | | | | | |
| | Luxembourg—0.1% | | | | | | | | | |
| * | Eurofins Scientific (Life sciences tools &
services) | | | 12,460 | | | | $ | 2,632 | |
| | | | | | | | | | | |
| | Netherlands—1.6% | | | | | | | | | |
| | Unilever N.V. (Food products) | | | 849,650 | | | | | 33,460 | |
| | | | | | | | | | | |
| | Norway—3.5% | | | | | | | | | |
| * | Algeta ASA (Biotechnology) | | | 66,486 | | | | | 2,530 | |
| | Fred Olsen Energy ASA (Energy equipment
& services) | | | 79,538 | | | | | 3,143 | |
| | Prosafe SE (Energy equipment & services) | | | 323,089 | | | | | 2,838 | |
| | Statoil ASA (Oil, gas & consumable fuels) | | | 1,440,774 | | | | | 29,720 | |
| | Telenor ASA (Diversified
telecommunication services) | | | 1,245,507 | | | | | 24,687 | |
| | TGS Nopec Geophysical Co. ASA (Energy
equipment & services) | | | 311,191 | | | | | 9,042 | |
| | | | | | | | | | 71,960 | |
| | Spain—0.1% | | | | | | | | | |
| | Viscofan S.A. (Food products) | | | 19,543 | | | | | 979 | |
| | | | | | | | | | | |
| | Sweden—1.2% | | | | | | | | | |
| | Atlas Copco AB Class “A” (Machinery) | | | 785,412 | | | | | 18,973 | |
| | Hexpol AB (Chemicals) | | | 89,005 | | | | | 5,800 | |
| | | | | | | | | | 24,773 | |
| | Switzerland—6.9% | | | | | | | | | |
| | Burckhardt Compression Holding AG
(Machinery) | | | 7,560 | | | | | 3,010 | |
| * | Credit Suisse Group AG (Capital markets) | | | 1,080,492 | | | | | 28,655 | |
| * | Geberit AG (Building products) | | | 59,172 | | | | | 14,678 | |
| | Glencore Xstrata plc (Metals & mining) | | | 7,437,105 | | | | | 30,784 | |
| | Partners Group Holding AG (Capital
markets) | | | 47,286 | | | | | 12,803 | |
| | Roche Holding AG (Pharmaceuticals) | | | 171,006 | | | | | 42,546 | |
| | SGS S.A. (Professional services) | | | 5,321 | | | | | 11,430 | |
| | | | | | | | | | 143,906 | |
| | | | | | | | | | | |
| | United Kingdom—24.1% | | | | | | | | | |
| | Abcam plc (Biotechnology) | | | 545,441 | | | | | 3,762 | |
| | Aberdeen Asset Management plc (Capital
markets) | | | 1,515,284 | | | | | 8,822 | |
| | Amlin plc (Insurance) | | | 1,302,167 | | | | | 7,789 | |
| | Antofagasta plc (Metals & mining) | | | 428,600 | | | | | 5,183 | |
| | ARM Holdings plc (Semiconductors &
semiconductor equipment) | | | 285,974 | | | | | 3,458 | |
| | Ashmore Group plc (Capital markets) | | | 705,338 | | | | | 3,687 | |
| | AZ Electronic Materials S.A. (Chemicals) | | | 624,388 | | | | | 2,917 | |
| | Babcock International Group plc
(Commercial services & supplies) | | | 1,034,671 | | | | | 17,358 | |
| | Berkeley Group Holdings plc (Household
durables) | | | 480,564 | | | | | 15,576 | |
| | Big Yellow Group plc (Real estate
investment trusts (REITs)) | | | 517,839 | | | | | 3,029 | |
| | BT Group plc (Diversified
telecommunication services) | | | 4,774,900 | | | | | 22,455 | |
See accompanying Notes to Financial Statements.
| June 30, 2013 | William Blair Funds | 41 |
Institutional International Growth Fund
Portfolio of Investments, June 30, 2013 (all dollar amounts in thousands) (unaudited)
| | Issuer | | Shares | | | Value | |
| | | | | | | | | | | |
| | Common Stocks—(continued) | | | | | | | | | |
| | | | | | | | | | | |
| | United Kingdom—(continued) | | | | | | | | | |
| | Bunzl plc (Trading companies &
distributors) | | | 538,859 | | | | $ | 10,491 | |
| | Capita plc (Professional services) | | | 567,775 | | | | | 8,342 | |
| | Compass Group plc (Hotels, restaurants &
leisure) | | | 1,621,240 | | | | | 20,713 | |
| | Daily Mail & General Trust plc Class “A”
(Media) | | | 630,132 | | | | | 7,375 | |
| | Derwent London plc (Real estate
investment trusts (REITs)) | | | 122,882 | | | | | 4,299 | |
| | Diageo plc (Beverages) | | | 867,970 | | | | | 24,819 | |
| | Dunelm Group plc (Specialty retail) | | | 565,546 | | | | | 8,146 | |
| | easyJet plc (Airlines) | | | 664,095 | | | | | 13,090 | |
| | Elementis plc (Chemicals) | | | 1,176,458 | | | | | 3,926 | |
| | Experian plc (Professional services) | | | 688,886 | | | | | 11,976 | |
| | GlaxoSmithKline plc (Pharmaceuticals) | | | 1,031,971 | | | | | 25,867 | |
| | Halma plc (Electronic equipment,
instruments & components) | | | 748,226 | | | | | 5,730 | |
| | Hargreaves Lansdown plc (Capital markets) | | | 255,795 | | | | | 3,455 | |
| | Hiscox, Ltd. (Insurance) | | | 602,409 | | | | | 5,218 | |
| | Howden Joinery Group plc (Specialty retail) | | | 1,185,315 | | | | | 4,568 | |
| | IG Group Holdings plc (Diversified
financial services) | | | 701,314 | | | | | 6,187 | |
| | IMI plc (Machinery) | | | 438,096 | | | | | 8,262 | |
| | InterContinental Hotels Group plc (Hotels,
restaurants & leisure) | | | 734,578 | | | | | 20,200 | |
| | ITV plc (Media) | | | 10,381,410 | | | | | 22,121 | |
| | John Wood Group plc (Energy equipment &
services) | | | 883,205 | | | | | 10,874 | |
| | Jupiter Fund Management plc (Capital
markets) | | | 916,912 | | | | | 4,040 | |
| | Keller Group plc (Construction &
engineering) | | | 201,218 | | | | | 3,033 | |
| | Lancashire Holdings, Ltd. (Insurance) | | | 592,661 | | | | | 7,139 | |
| | Meggitt plc (Aerospace & defense) | | | 1,044,983 | | | | | 8,225 | |
| | Moneysupermarket.com Group plc (Internet
software & services) | | | 1,658,536 | | | | | 4,833 | |
| * | Nanoco Group plc (Semiconductors &
semiconductor equipment) | | | 432,625 | | | | | 869 | |
| | Oxford Instruments plc (Electronic
equipment, instruments & components) | | | 56,289 | | | | | 1,035 | |
| | Provident Financial plc (Consumer finance) | | | 224,490 | | | | | 5,084 | |
| | Prudential plc (Insurance) | | | 2,380,727 | | | | | 38,925 | |
| | Reckitt Benckiser Group plc (Household
products) | | | 388,047 | | | | | 27,433 | |
| | Rightmove plc (Media) | | | 254,324 | | | | | 8,061 | |
| * | Rolls-Royce Holdings plc (Aerospace &
defense) | | | 1,364,436 | | | | | 23,533 | |
| | Rotork plc (Machinery) | | | 156,180 | | | | | 6,342 | |
| | RPS Group plc (Commercial services &
supplies) | | | 552,726 | | | | | 1,698 | |
| | Senior plc (Machinery) | | | 548,072 | | | | | 2,087 | |
| | St James’s Place plc (Insurance) | | | 747,728 | | | | | 6,141 | |
| | The Restaurant Group plc (Hotels,
restaurants & leisure) | | | 245,353 | | | | | 1,866 | |
| | Tullow Oil plc (Oil, gas & consumable
fuels) | | | 1,306,769 | | | | | 19,895 | |
| | Issuer | | Shares | | | Value | |
| | | | | | | | | | | |
| | Common Stocks—(continued) | | | | | | | | | |
| | | | | | | | | | | |
| | United Kingdom—(continued) | | | | | | | | | |
| | William Hill plc (Hotels, restaurants &
leisure) | | | 1,568,024 | | | | $ | 10,515 | |
| | | | | | | | | | 500,449 | |
| | | | | | | | | | | |
| | Japan—16.5% | | | | | | | | | |
| | Astellas Pharma, Inc. (Pharmaceuticals) | | | 402,600 | | | | | 21,880 | |
| | Daikin Industries, Ltd. (Building products) | | | 209,700 | | | | | 8,478 | |
| | Denso Corporation (Auto components) | | | 397,100 | | | | | 18,678 | |
| | FamilyMart Co., Ltd. (Food & staples
retailing) | | | 155,200 | | | | | 6,619 | |
| | Fuji Heavy Industries, Ltd. (Automobiles) | | | 1,542,000 | | | | | 38,014 | |
| | Isuzu Motors, Ltd. (Automobiles) | | | 2,062,000 | | | | | 14,117 | |
| | ITOCHU Corporation (Trading companies
& distributors) | | | 1,865,700 | | | | | 21,539 | |
| | Keyence Corporation (Electronic equipment, instruments &
components) | | | 23,700 | | | | | 7,563 | |
| | Lawson, Inc. (Food & staples retailing) | | | 159,300 | | | | | 12,159 | |
| | Makita Corporation (Machinery) | | | 296,900 | | | | | 16,045 | |
| | MISUMI Group, Inc. (Trading companies &
distributors) | | | 81,200 | | | | | 2,233 | |
| | Nexon Co., Ltd. (Software) | | | 721,600 | | | | | 7,960 | |
| | Nitto Denko Corporation (Chemicals) | | | 171,000 | | | | | 11,000 | |
| | ORIX Corporation (Diversified financial
services) | | | 2,197,800 | | | | | 30,026 | |
| | Park24 Co., Ltd. (Commercial services &
supplies) | | | 181,400 | | | | | 3,290 | |
| | Secom Co., Ltd. (Commercial services &
supplies) | | | 209,200 | | | | | 11,390 | |
| | Shimamura Co., Ltd. (Specialty retail) | | | 54,700 | | | | | 6,646 | |
| | Shin-Etsu Chemical Co., Ltd. (Chemicals) | | | 167,500 | | | | | 11,113 | |
| | Ship Healthcare Holdings, Inc. (Health care
providers & services) | | | 106,800 | | | | | 3,930 | |
| | Sumitomo Mitsui Financial Group, Inc.
(Commercial banks) | | | 1,049,900 | | | | | 48,165 | |
| | Sundrug Co., Ltd. (Food & staples retailing) | | | 109,500 | | | | | 4,648 | |
| | Suruga Bank, Ltd. (Commercial banks) | | | 565,000 | | | | | 10,265 | |
| | TS Tech Co., Ltd. (Auto components) | | | 67,400 | | | | | 2,141 | |
| | Tsuruha Holdings, Inc. (Food & staples
retailing) | | | 37,600 | | | | | 3,560 | |
| | United Arrows, Ltd. (Specialty retail) | | | 81,100 | | | | | 3,389 | |
| | Yahoo! Japan Corporation (Internet
software & services) | | | 34,792 | | | | | 17,154 | |
| | | | | | | | | | 342,002 | |
| | | | | | | | | | | |
| | Emerging Asia—13.5% | | | | | | | | | |
| | | | | | | | | | | |
| | China—5.3% | | | | | | | | | |
| | AAC Technologies Holdings, Inc.
(Communications equipment) | | | 1,344,000 | | | | | 7,590 | |
| | Biostime International Holdings, Ltd.
(Food products) | | | 120,000 | | | | | 673 | |
| | China Merchants Bank Co., Ltd. Class “H”
(Commercial banks) | | | 6,414,000 | | | | | 10,718 | |
| | China Overseas Grand Oceans Group, Ltd.
(Real estate management & development) | | | 3,804,000 | | | | | 4,856 | |
See accompanying Notes to Financial Statements.
| 42 | Semi-Annual Report | June 30, 2013 |
Institutional International Growth Fund
Portfolio of Investments, June 30, 2013 (all dollar amounts in thousands) (unaudited)
| | Issuer | | Shares | | | Value | |
| | | | | | | | | | | |
| | Common Stocks—(continued) | | | | | | | | | |
| | | | | | | | | | | |
| | Emerging Asia—(continued) | | | | | | | | | |
| | | | | | | | | | | |
| | China—(continued) | | | | | | | | | |
| | China Overseas Land & Investment, Ltd.
(Real estate management & development) | | | 6,644,000 | | | | $ | 17,432 | |
| | Great Wall Motor Co., Ltd. Class “H”
(Automobiles) | | | 3,149,500 | | | | | 13,583 | |
| | Haier Electronics Group Co., Ltd.
(Household durables) | | | 1,205,000 | | | | | 1,920 | |
| | Haitian International Holdings, Ltd.
(Machinery) | | | 713,000 | | | | | 1,042 | |
| * | Hollysys Automation Technologies, Ltd.
(Electronic equipment, instruments &
components)† | | | 214,215 | | | | | 2,658 | |
| | Industrial and Commercial Bank of China,
Ltd. Class “H” (Commercial banks) | | | 25,909,000 | | | | | 16,335 | |
| | Minth Group, Ltd. (Auto components) | | | 1,382,000 | | | | | 2,149 | |
| | Sino Biopharmaceutical (Pharmaceuticals) | | | 9,580,000 | | | | | 6,213 | |
| | Tencent Holdings, Ltd. (Internet software &
services) | | | 593,500 | | | | | 23,278 | |
| * | WuXi PharmaTech Cayman, Inc.—ADR
(Life sciences tools & services) | | | 123,283 | | | | | 2,589 | |
| | | | | | | | | | 111,036 | |
| | | | | | | | | | | |
| | India—2.3% | | | | | | | | | |
| | Eicher Motors, Ltd. (Machinery) | | | 43,480 | | | | | 2,398 | |
| | Glenmark Pharmaceuticals, Ltd.
(Pharmaceuticals) | | | 827,948 | | | | | 7,639 | |
| | Gruh Finance, Ltd. (Thrifts & mortgage
finance) | | | 467,643 | | | | | 1,800 | |
| | HCL Technologies, Ltd. (IT services) | | | 442,046 | | | | | 5,772 | |
| | IndusInd Bank, Ltd. (Commercial banks) | | | 551,010 | | | | | 4,334 | |
| | Ipca Laboratories, Ltd. (Pharmaceuticals) | | | 317,967 | | | | | 3,506 | |
| | Lupin, Ltd. (Pharmaceuticals) | | | 399,258 | | | | | 5,250 | |
| | Oberoi Realty, Ltd. (Real estate
management & development) | | | 461,980 | | | | | 1,538 | |
| | Tata Consultancy Services, Ltd. (IT services) | | | 410,825 | | | | | 10,495 | |
| | Yes Bank, Ltd. (Commercial banks) | | | 576,197 | | | | | 4,471 | |
| | | | | | | | | | 47,203 | |
| | | | | | | | | | | |
| | Indonesia—1.2% | | | | | | | | | |
| | PT Alam Sutera Realty Tbk (Real estate
management & development) | | | 26,120,000 | | | | | 1,974 | |
| | PT Bank Rakyat Indonesia Persero Tbk
(Commercial banks) | | | 11,799,500 | | | | | 9,214 | |
| | PT Ciputra Development Tbk (Real estate
management & development) | | | 15,602,500 | | | | | 2,122 | |
| | PT Telekomunikasi Indonesia Persero Tbk
(Diversified telecommunication services) | | | 10,446,000 | | | | | 11,840 | |
| | | | | | | | | | 25,150 | |
| | Philippines—0.1% | | | | | | | | | |
| | Security Bank Corporation (Commercial
banks) | | | 518,880 | | | | | 1,816 | |
| | | | | | | | | | | |
| | South Korea—1.5% | | | | | | | | | |
| | GS Home Shopping, Inc. (Internet &
catalog retail) | | | 15,911 | | | | | 3,295 | |
| | Issuer | | Shares | | | Value | |
| | | | | | | | | | | |
| | Common Stocks—(continued) | | | | | | | | | |
| | | | | | | | | | | |
| | Emerging Asia—(continued) | | | | | | | | | |
| | | | | | | | | | | |
| | South Korea—(continued) | | | | | | | | | |
| | Samsung Electronics Co., Ltd.
(Semiconductors & semiconductor
equipment) | | | 24,704 | | | | $ | 29,029 | |
| | | | | | | | | | 32,324 | |
| | Sri Lanka—0.1% | | | | | | | | | |
| | John Keells Holdings plc (Industrial
conglomerates) | | | 1,005,757 | | | | | 1,944 | |
| | Taiwan—2.2% | | | | | | | | | |
| | Asustek Computer, Inc. (Computers &
peripherals) | | | 809,000 | | | | | 6,964 | |
| | Eclat Textile Co., Ltd. (Textiles, apparel &
luxury goods) | | | 594,000 | | | | | 4,390 | |
| | St Shine Optical Co., Ltd. (Health care
equipment & supplies) | | | 62,100 | | | | | 1,614 | |
| | Taiwan Semiconductor Manufacturing Co.,
Ltd.—ADR (Semiconductors &
semiconductor equipment) | | | 1,747,022 | | | | | 32,006 | |
| | | | | | | | | | 44,974 | |
| | | | | | | | | | | |
| | Thailand—0.8% | | | | | | | | | |
| | Advanced Info Service PCL (Wireless
telecommunication services) | | | 486,000 | | | | | 4,419 | |
| | BEC World PCL (Media) | | | 1,640,400 | | | | | 3,107 | |
| | Kasikornbank PCL (Commercial banks) | | | 1,191,200 | | | | | 7,528 | |
| | Kiatnakin Bank PCL (Commercial banks) | | | 982,100 | | | | | 1,678 | |
| | | | | | | | | | 16,732 | |
| | | | | | | | | | | |
| | Asia—6.6% | | | | | | | | | |
| | | | | | | | | | | |
| | Australia—2.6% | | | | | | | | | |
| | CSL, Ltd. (Biotechnology) | | | 272,173 | | | | | 15,328 | |
| | DuluxGroup, Ltd. (Chemicals) | | | 879,307 | | | | | 3,386 | |
| | REA Group, Ltd. (Media) | | | 80,361 | | | | | 2,023 | |
| | Seek, Ltd. (Professional services) | | | 354,742 | | | | | 2,943 | |
| | Super Retail Group, Ltd. (Specialty retail) | | | 203,865 | | | | | 2,232 | |
| | Telstra Corporation, Ltd. (Diversified telecommunication services) | | | 6,367,902 | | | | | 27,779 | |
| | | | | | | | | | 53,691 | |
| | Hong Kong—2.5% | | | | | | | | | |
| | China High Precision Automation Group,
Ltd. (Electronic equipment, instruments
& components)**§ | | | 3,373,000 | | | | | 352 | |
| | Hutchison Telecommunications Hong Kong
Holdings, Ltd. (Diversified
telecommunication services) | | | 12,840,000 | | | | | 6,788 | |
| | Sa Sa International Holdings, Ltd.
(Specialty retail) | | | 5,614,000 | | | | | 5,573 | |
| | SmarTone Telecommunications Holdings,
Ltd. (Wireless telecommunication services) | | | 3,512,500 | | | | | 5,833 | |
| | Techtronic Industries Co. (Household
durables) | | | 3,562,500 | | | | | 8,525 | |
| | Value Partners Group, Ltd. (Capital markets) | | | 3,678,000 | | | | | 1,982 | |
See accompanying Notes to Financial Statements.
| June 30, 2013 | William Blair Funds | 43 |
Institutional International Growth Fund
Portfolio of Investments, June 30, 2013 (all dollar amounts in thousands) (unaudited)
| | Issuer | | Shares | | | Value | |
| | | | | | | | | | | |
| | Common Stocks—(continued) | | | | | | | | | |
| | | | | | | | | | | |
| | Asia—(continued) | | | | | | | | | |
| | | | | | | | | | | |
| | Hong Kong—(continued) | | | | | | | | | |
| | Wharf Holdings, Ltd. (Real estate
management & development) | | | 2,696,000 | | | | $ | 22,664 | |
| | | | | | | | | | 51,717 | |
| | | | | | | | | | | |
| | New Zealand—0.1% | | | | | | | | | |
| | Ryman Healthcare, Ltd. (Health care
providers & services) | | | 626,869 | | | | | 3,094 | |
| | | | | | | | | | | |
| | Singapore—1.4% | | | | | | | | | |
| | First Resources, Ltd. (Food products) | | | 1,781,000 | | | | | 2,494 | |
| | Keppel Corporation, Ltd. (Industrial
conglomerates) | | | 873,300 | | | | | 7,166 | |
| | Singapore Technologies Engineering, Ltd.
(Aerospace & defense) | | | 4,410,000 | | | | | 14,578 | |
| | StarHub, Ltd. (Wireless telecommunication
services) | | | 1,478,000 | | | | | 4,874 | |
| | | | | | | | | | 29,112 | |
| | | | | | | | | | | |
| | Emerging Europe, Mid-East, Africa—3.0% | | | | | | | | | |
| | | | | | | | | | | |
| | Kenya—0.1% | | | | | | | | | |
| | Equity Bank, Ltd. (Commercial banks) | | | 2,895,700 | | | | | 1,055 | |
| | Kenya Commercial Bank, Ltd. (Commercial
banks) | | | 3,896,900 | | | | | 1,680 | |
| | | | | | | | | | 2,735 | |
| | | | | | | | | | | |
| | Nigeria—0.3% | | | | | | | | | |
| | Guaranty Trust Bank plc (Commercial
banks) | | | 37,969,896 | | | | | 5,677 | |
| | | | | | | | | | | |
| | Poland—0.3% | | | | | | | | | |
| * | Alior Bank S.A. (Commercial banks) | | | 62,376 | | | | | 1,680 | |
| | Eurocash S.A. (Food & staples retailing) | | | 246,731 | | | | | 4,359 | |
| | | | | | | | | | 6,039 | |
| | | | | | | | | | | |
| | South Africa—1.1% | | | | | | | | | |
| | Bidvest Group, Ltd. (Industrial
conglomerates) | | | 392,112 | | | | | 9,716 | |
| | Coronation Fund Managers, Ltd. (Capital
markets) | | | 372,967 | | | | | 2,368 | |
| | FirstRand, Ltd. (Diversified
financial services) | | | 3,236,701 | | | | | 9,473 | |
| | | | | | | | | | 21,557 | |
| | | | | | | | | | | |
| | Turkey—0.6% | | | | | | | | | |
| | Tofas Turk Otomobil Fabrikasi A.S.
(Automobiles) | | | 414,156 | | | | | 2,588 | |
| | Turkiye Halk Bankasi A.S. (Commercial
banks) | | | 1,216,495 | | | | | 10,312 | |
| | | | | | | | | | 12,900 | |
| | | | | | | | | | | |
| | United Arab Emirates—0.6% | | | | | | | | | |
| | Dragon Oil plc (Oil, gas & consumable
fuels) | | | 661,315 | | | | | 5,759 | |
| | First Gulf Bank PJSC (Commercial banks) | | | 1,603,289 | | | | | 6,962 | |
| | | | | | | | | | 12,721 | |
| | Issuer | | Shares | | | Value | |
| | | | | | | | | | | |
| | Western Hemisphere—2.8% | | | | | | | | | |
| | | | | | | | | | | |
| | Canada—2.8% | | | | | | | | | |
| | Canadian National Railway Co. (Road &
rail)† | | | 263,863 | | | | $ | 25,666 | |
| | CI Financial Corporation (Capital markets) | | | 340,611 | | | | | 9,804 | |
| | First Quantum Minerals, Ltd. (Metals &
mining) | | | 480,254 | | | | | 7,124 | |
| | Metro, Inc. (Food & staples retailing) | | | 173,249 | | | | | 11,610 | |
| | Westjet Airlines, Ltd. (Airlines) | | | 205,630 | | | | | 4,403 | |
| | | | | | | | | | 58,607 | |
| | | | | | | | | | | |
| | Emerging Latin America—2.2% | | | | | | | | | |
| | | | | | | | | | | |
| | Brazil—1.3% | | | | | | | | | |
| * | BB Seguridade Participacoes S.A.
(Insurance) | | | 1,263,100 | | | | | 9,963 | |
| | CCR S.A (Transportation infrastructure) | | | 666,200 | | | | | 5,285 | |
| | Kroton Educacional S.A. (Diversified
consumer services) | | | 479,800 | | | | | 6,644 | |
| | Linx S.A. (Software) | | | 187,700 | | | | | 3,028 | |
| | Mills Estruturas e Servicos de Engenharia S.A. (Trading companies & distributors) | | | 190,800 | | | | | 2,583 | |
| | | | | | | | | | 27,503 | |
| | Chile—0.6% | | | | | | | | | |
| | Forus S.A. (Textiles, apparel & luxury goods) | | | 328,070 | | | | | 1,870 | |
| | Inversiones La Construccion S.A.
(Diversified financial services) | | | 110,889 | | | | | 1,698 | |
| | Parque Arauco S.A. (Real estate
management & development) | | | 2,859,422 | | | | | 6,248 | |
| | Sonda S.A. (IT services) | | | 922,766 | | | | | 2,688 | |
| | | | | | | | | | 12,504 | |
| | Mexico—0.3% | | | | | | | | | |
| | Banregio Grupo Financiero S.A.B. de C.V. (Commercial banks) | | | 888,600 | | | | | 4,694 | |
| | | | | | | | | | | |
| | Total Common Stocks—96.8%
(cost $1,805,153) | | | | | | | | 2,010,275 | |
| | | | | | | | | | | |
| | Affiliated Fund | | | | | | | | | |
| | | | | | | | | | | |
| | China—0.6% | | | | | | | | | |
| | William Blair China A-Share Fund, LLC | | | 1,183,400 | | | | | 12,260 | |
| | Total Affiliated Fund—0.6%
(cost $11,834) | | | | | | | | 12,260 | |
See accompanying Notes to Financial Statements.
| 44 | Semi-Annual Report | June 30, 2013 |
Institutional International Growth Fund
Portfolio of Investments, June 30, 2013 (all dollar amounts in thousands) (unaudited)
| Issuer | | | Principal Amount | | | | Value | |
| | | | | | | | | |
| Repurchase Agreement | | | | | | | | |
Fixed Income Clearing Corporation, 0.010% dated
6/28/13, due 7/1/13, repurchase
price $39,731, collateralized by U.S.
Treasury Notes, 0.750%, due 10/31/17 | | | $39,731 | | | $ | 39,731 | |
| | | | | | | | | |
Total Repurchase Agreement—1.9%
(cost $39,731) | | | | | | | 39,731 | |
| | | | | | | | | |
Total Investments—99.3%
(cost $1,856,718) | | | | | | | 2,062,266 | |
| Cash and other assets, less liabilities—0.7% | | | | | | | 14,310 | |
| Net assets—100.0% | | | | | | $ | 2,076,576 | |
ADR = American Depository Receipt
* Non-income producing securities
† = U.S. listed foreign security
** = Fair valued pursuant to Valuation Procedures adopted by the Board of Trustees. This holding represents 0.02% of the Fund’s net assets at June 30, 2013.
§ = Deemed illiquid pursuant to Liquidity Procedures approved by the Board of Trustees. This holding represents 0.02% of the net assets at June 30, 2013.
For securities primarily traded on exchanges or markets that close before the close of regular trading on the New York Stock Exchange, the Fund may use an independent pricing service to fair value price the securities pursuant to Valuation Procedures approved by the Board of Trustees.
At June 30, 2013, the Fund’s Portfolio of Investments includes the following industry categories:
| Financials | | | 27.0 | % |
| Consumer Discretionary | | | 17.0 | % |
| Industrials | | | 17.0 | % |
| Health Care | | | 9.4 | % |
| Information Technology | | | 9.1 | % |
| Consumer Staples | | | 7.1 | % |
| Telecommunication Services | | | 5.4 | % |
| Energy | | | 4.0 | % |
| Materials | | | 4.0 | % |
| Total | | | 100.0 | % |
At June 30, 2013, the Fund’s Portfolio of Investments includes the following currency categories:
| British Pound Sterling | | | 26.5 | % |
| Japanese Yen | | | 16.9 | % |
| Euro | | | 16.5 | % |
| Hong Kong Dollar | | | 7.9 | % |
| Swiss Franc | | | 5.6 | % |
| U.S. Dollar | | | 3.6 | % |
| Norwegian Krone | | | 3.6 | % |
| Australian Dollar | | | 2.7 | % |
| Indian Rupee | | | 2.3 | % |
| Canadian Dollar | | | 1.6 | % |
| South Korean Won | | | 1.6 | % |
| Singapore Dollar | | | 1.4 | % |
| Brazilian Real | | | 1.4 | % |
| Indonesian Rupiah | | | 1.2 | % |
| Swedish Krona | | | 1.2 | % |
| South African Rand | | | 1.1 | % |
| All Other Currencies | | | 4.9 | % |
| Total | | | 100.0 | % |
As of June 30, 2013 the Fund invested in William Blair China A-Share Fund, LLC, an affiliated fund. There are no unfunded commitments to the affiliated fund and the Fund may redeem its investment monthly.
| | | Shares Activity Affiliated with China A-Share Fund | | | Period Ended June 30, 2013 |
| | | | | | | | | | | | | | | (in thousands) |
| Fund Name | | Balance
12/31/2012 | | Purchases | | | Sales | | | Balance
6/30/2013 | | | Value | |
| William Blair China A-Share Fund, LLC | | | 1,183,400 | | | | — | | | | — | | | | 1,183,400 | | | | $12,260 | |
| | | | | | | | | | | | | | | | | | | | $12,260 | |
Affiliated Funds accounted for $426 of change in net unrealized depreciation on investments during the period.
See accompanying Notes to Financial Statements.
| June 30, 2013 | William Blair Funds | 45 |
| | INTERNATIONAL EQUITY FUND |
| | |
| | The International Equity Fund seeks long-term capital appreciation. |
| | |
| | AN OVERVIEW FROM THE PORTFOLIO MANAGER |
| | |

David Merjan | The William Blair International Equity Fund (Class N shares) posted a 2.90% increase, net of fees, for the six months ended June 30, 2013. By comparison, the Fund’s benchmark index, the MSCI World Ex-U.S. Index (net) (the “Index”), increased 3.01%. The key detractor from year to date results was the Fund’s regional positioning, which detracted approximately 2% from relative performance. In particular, the Fund’s emerging markets exposure averaged 12% during the period, which detracted from results, given the severe underperformance of emerging markets relative to developed markets. In addition, the underweighting in Japan hampered performance, given market strength, coupled with the Fund’s strong stock selection. Conversely, stock selection was strong across most regions, with particular value added in Japan. Fuji Heavy, the manufacturer of Subarus, was a key contributor to performance, on good operating results and positive guidance, coupled with positive sentiment surrounding Japanese stocks generally, and exporters particularly. The Fund’s overweighting of Japanese Financials added value, as they were up nearly 24% during the period, bolstered by strong results across most holdings. Yahoo Japan was another key contributor, given increased ad spend and increased guidance. Canadian stock selection was bolstered by minimal Resources holdings, while the Healthcare overweighting and Industrials stock selection drove Europe Ex-U.K. results. Overall sector positioning did not change substantially during the period. Financials, which totaled approximately 22% of the Fund, was below the 26.2% Index weighting, due primarily to the underweighting in Commercial Banks. Industrials was approximately 6% overweighted versus the Index, while Information Technology was approximately 10% overweighted. Conversely, Energy, and Materials were underweighted as was Consumer Staples. Regionally, the Fund’s emerging markets weighting 10.5%, due primarily to a focus on Asian exporters. This weighting represented a decrease since the beginning of the year. The Fund was also overweighted in the U.K., which totaled 27.0% of the Fund, above the 17.5% Index weighting, given significant exposure in Financials and Industrials. Conversely, Europe was most underweighted at 34.4% of the Fund, well below the 41.2% Index weighting, despite the significant Healthcare weighting, given limited Energy and Financials exposure. |
| 46 | Semi-Annual Report | June 30, 2013 |
International Equity Fund
Performance Highlights (Unaudited)
| Average Annual Total Return at 6/30/2013 |
| | | Year | | | | | | | | Since |
| | | to Date | | 1 Year | | 3 Year | | 5 Year | | Inception(a) |
| Class N | | | 2.90 | % | | | 15.72 | % | | | 8.80 | % | | | (2.23 | )% | | | 4.11 | % |
| Class I | | | 3.12 | | | | 16.13 | | | | 9.07 | | | | (1.97 | ) | | | 4.40 | |
| MSCI World Ex-U.S. Index (net) | | | 3.01 | | | | 17.07 | | | | 9.43 | | | | (0.84 | ) | | | 5.99 | |
| (a) | For the period from May 24, 2004 (Commencement of Operations) to June 30, 2013. |
Performance cited represents past performance. Past performance does not guarantee future results and current performance may be lower or higher than the data quoted. Results shown are average annual returns, which assume reinvestment of dividends and capital gains. Investment returns and principal will fluctuate and you may have a gain or loss when you sell shares. For the most current month-end performance information, please call 1-800-742-7272, or visit our Web site at www.williamblairfunds.com. From time to time the investment advisor may waive fees or reimburse expenses for the Fund. Without these waivers, performance would be lower. International investing involves special risk considerations, including currency fluctuations, lower liquidity, economic and political risk. Class N shares are available to the general public without a sales load. Class I shares are available to certain institutional investors and advisory clients of William Blair & Company L.L.C. without a sales load or distribution (12b-1) or service fees.
The performance highlights and graph presented above do not reflect the deduction of taxes that a shareholder would pay on fund distributions or the redemption of fund shares.
The Morgan Stanley Capital International (MSCI) World Ex-U.S. Index (net) is a free float-adjusted market capitalization weighted index that is designed to measure the equity market performance of developed markets, excluding the United States. This series approximates the minimum possible dividend reinvestment.
This report identifies the Fund’s investments on June 30, 2013. These holdings are subject to change. Not all stocks in the Fund performed the same, nor is there any guarantee that these stocks will perform as well in the future. Market forecasts provided in this report may not necessarily come to pass.
Sector Diversification (Unaudited)
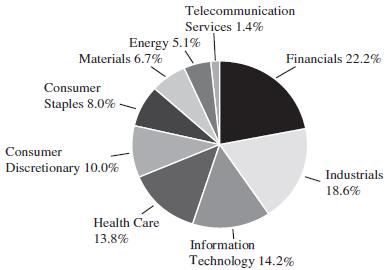
The sector diversification shown is based on the total long-term securities.
| June 30, 2013 | William Blair Funds | 47 |
International Equity Fund
Portfolio of Investments, June 30, 2013 (all dollar amounts in thousands) (unaudited)
| | Issuer | | Shares | | | Value | |
| | | | | | | | | |
| | Common Stocks | | | | | | | | | |
| | | | | | | | | | | |
| | Europe—34.4% | | | | | | | | | |
| | | | | | | | | | | |
| | Belgium—1.2% | | | | | | | | | |
| | UCB S.A. (Pharmaceuticals) | | | 15,077 | | | | $ | 812 | |
| | | | | | | | | | | |
| | Denmark—2.0% | | | | | | | | | |
| | Coloplast A/S Class “B” (Health care
equipment & supplies) | | | 11,347 | | | | | 636 | |
| | Novo Nordisk A/S Class “B”
(Pharmaceuticals) | | | 4,880 | | | | | 761 | |
| | | | | | | | | | 1,397 | |
| | | | | | | | | | | |
| | France—10.7% | | | | | | | | | |
| | BNP Paribas S.A. (Commercial banks) | | | 11,535 | | | | | 630 | |
| | Christian Dior S.A. (Textiles, apparel &
luxury goods) | | | 4,463 | | | | | 720 | |
| | Dassault Systemes S.A. (Software) | | | 5,388 | | | | | 659 | |
| | Essilor International S.A. (Health care
equipment & supplies) | | | 8,339 | | | | | 887 | |
| | L’Oreal S.A. (Personal products) | | | 3,923 | | | | | 645 | |
| | Publicis Groupe S.A. (Media) | | | 14,968 | | | | | 1,066 | |
| | Sanofi (Pharmaceuticals) | | | 12,381 | | | | | 1,283 | |
| | Technip S.A. (Energy equipment & services) | | | 9,228 | | | | | 937 | |
| | Unibail-Rodamco SE (Real estate
investment trusts (REITs)) | | | 3,365 | | | | | 784 | |
| | | | | | | | | | 7,611 | |
| | | | | | | | | | | |
| | Germany—4.9% | | | | | | | | | |
| | BASF SE (Chemicals) | | | 14,271 | | | | | 1,275 | |
| | Bayer AG (Pharmaceuticals) | | | 12,705 | | | | | 1,355 | |
| | MTU Aero Engines AG (Aerospace &
defense) | | | 8,408 | | | | | 811 | |
| | | | | | | | | | 3,441 | |
| | | | | | | | | | | |
| | Ireland—3.7% | | | | | | | | | |
| | Accenture plc Class “A” (IT services)† | | | 13,726 | | | | | 988 | |
| | Ryanair Holdings plc—ADR (Airlines) | | | 13,383 | | | | | 689 | |
| | Shire plc (Pharmaceuticals) | | | 30,527 | | | | | 968 | |
| | | | | | | | | | 2,645 | |
| | | | | | | | | | | |
| | Netherlands—1.9% | | | | | | | | | |
| | Unilever N.V. (Food products) | | | 34,957 | | | | | 1,377 | |
| | | | | | | | | | | |
| | Norway—1.4% | | | | | | | | | |
| | Telenor ASA (Diversified
telecommunication services) | | | 49,914 | | | | | 989 | |
| | | | | | | | | | | |
| | Spain—0.7% | | | | | | | | | |
| | Inditex S.A. (Specialty retail) | | | 4,128 | | | | | 510 | |
| | | | | | | | | | | |
| | Sweden—1.3% | | | | | | | | | |
| | Atlas Copco AB Class “A” (Machinery) | | | 37,527 | | | | | 906 | |
| | | | | | | | | | | |
| | Switzerland—6.6% | | | | | | | | | |
| * | Credit Suisse Group AG (Capital markets) | | | 45,145 | | | | | 1,197 | |
| * | Geberit AG (Building products) | | | 2,224 | | | | | 552 | |
| | Nestle S.A. (Food products) | | | 12,373 | | | | | 812 | |
| | Roche Holding AG (Pharmaceuticals) | | | 4,841 | | | | | 1,204 | |
| | Syngenta AG (Chemicals) | | | 2,412 | | | | | 944 | |
| | | | | | | | | | 4,709 | |
| | Issuer | | Shares | | | Value | |
| | | | | | | | | |
| | Common Stocks—(continued) | | | | | | | |
| | | | | | | | | | | |
| | United Kingdom—27.0% | | | | | | | | | |
| | Antofagasta plc (Metals & mining) | | | 74,639 | | | | $ | 903 | |
| | ARM Holdings plc (Semiconductors &
semiconductor equipment) | | | 56,014 | | | | | 677 | |
| | Babcock International Group plc
(Commercial services & supplies) | | | 50,694 | | | | | 851 | |
| | Burberry Group plc (Textiles, apparel &
luxury goods) | | | 26,290 | | | | | 540 | |
| | Capita plc (Professional services) | | | 24,305 | | | | | 357 | |
| | Compass Group plc (Hotels, restaurants &
leisure) | | | 131,520 | | | | | 1,680 | |
| | Diageo plc (Beverages) | | | 47,620 | | | | | 1,362 | |
| | Experian plc (Professional services) | | | 46,172 | | | | | 803 | |
| | GlaxoSmithKline plc (Pharmaceuticals) | | | 33,707 | | | | | 845 | |
| | HSBC Holdings plc (Commercial banks) | | | 110,400 | | | | | 1,145 | |
| | IMI plc (Machinery) | | | 52,335 | | | | | 987 | |
| | InterContinental Hotels Group plc (Hotels,
restaurants & leisure) | | | 25,213 | | | | | 693 | |
| | John Wood Group plc (Energy equipment
& services) | | | 73,510 | | | | | 905 | |
| | Prudential plc (Insurance) | | | 64,137 | | | | | 1,049 | |
| | Reckitt Benckiser Group plc (Household
products) | | | 7,948 | | | | | 562 | |
| | Regus plc (Commercial services & supplies) | | | 203,517 | | | | | 487 | |
| * | Rolls-Royce Holdings plc (Aerospace &
defense) | | | 85,080 | | | | | 1,467 | |
| | St James’s Place plc (Insurance) | | | 128,543 | | | | | 1,056 | |
| | Standard Life plc (Insurance) | | | 216,123 | | | | | 1,136 | |
| | Tullow Oil plc (Oil, gas & consumable fuels) | | | 42,835 | | | | | 652 | |
| | Wolseley plc (Trading companies &
distributors) | | | 21,304 | | | | | 983 | |
| | | | | | | | | | 19,140 | |
| | | | | | | | | | | |
| | Japan—20.3% | | | | | | | | | |
| | Astellas Pharma, Inc. (Pharmaceuticals) | | | 16,600 | | | | | 902 | |
| | Chiyoda Corporation (Construction &
engineering) | | | 28,000 | | | | | 330 | |
| | Daikin Industries, Ltd. (Building products) | | | 23,500 | | | | | 950 | |
| | Denso Corporation (Auto components) | | | 21,400 | | | | | 1,007 | |
| | Fuji Heavy Industries, Ltd. (Automobiles) | | | 31,000 | | | | | 764 | |
| | ITOCHU Corporation (Trading companies
& distributors) | | | 54,100 | | | | | 625 | |
| | Japan Exchange Group, Inc. (Diversified
financial services) | | | 8,000 | | | | | 808 | |
| | Keyence Corporation (Electronic equipment,
instruments & components) | | | 1,400 | | | | | 447 | |
| | Makita Corporation (Machinery) | | | 13,400 | | | | | 724 | |
| | Nitto Denko Corporation (Chemicals) | | | 10,700 | | | | | 688 | |
| | ORIX Corporation (Diversified financial
services) | | | 69,500 | | | | | 950 | |
| | Otsuka Corporation (IT services) | | | 8,200 | | | | | 911 | |
| | Shin-Etsu Chemical Co., Ltd. (Chemicals) | | | 12,900 | | | | | 856 | |
| | Sumitomo Mitsui Financial Group, Inc.
(Commercial banks) | | | 26,500 | | | | | 1,216 | |
| | Sumitomo Mitsui Trust Holdings, Inc.
(Commercial banks) | | | 289,000 | | | | | 1,349 | |
| | Trend Micro, Inc. (Software) | | | 27,500 | | | | | 873 | |
See accompanying Notes to Financial Statements.
| 48 | Semi-Annual Report | June 30, 2013 |
International Equity Fund
Portfolio of Investments, June 30, 2013 (all dollar amounts in thousands) (unaudited)
| | Issuer | | Shares | | | Value | |
| | | | | | | | | |
| | Common Stocks—(continued) | | | | | | | | | |
| | | | | | | | | | | |
| | Japan—(continued) | | | | | | | | | |
| | Yahoo! Japan Corporation (Internet
software & services) | | | 1,960 | | | | $ | 966 | |
| | | | | | | | | | 14,366 | |
| | | | | | | | | | | |
| | Emerging Asia—7.2% | | | | | | | | | |
| | | | | | | | | | | |
| | China—0.8% | | | | | | | | | |
| | CNOOC, Ltd. (Oil, gas & consumable fuels) | | | 346,000 | | | | | 587 | |
| | | | | | | | | | | |
| | India—0.8% | | | | | | | | | |
| | Tata Consultancy Services, Ltd. (IT services) | | | 22,107 | | | | | 565 | |
| | | | | | | | | | | |
| | Papua New Guinea—0.7% | | | | | | | | | |
| | Oil Search, Ltd. (Oil, gas & consumable
fuels) | | | 68,769 | | | | | 486 | |
| | | | | | | | | | | |
| | South Korea—1.8% | | | | | | | | | |
| | Samsung Electronics Co., Ltd.
(Semiconductors & semiconductor
equipment) | | | 1,078 | | | | | 1,267 | |
| | | | | | | | | | | |
| | Taiwan—1.7% | | | | | | | | | |
| | Novatek Microelectronics Corporation
(Semiconductors & semiconductor
equipment) | | | 106,000 | | | | | 514 | |
| | Taiwan Semiconductor Manufacturing Co.,
Ltd.—ADR (Semiconductors &
semiconductor equipment) | | | 37,881 | | | | | 694 | |
| | | | | | | | | | 1,208 | |
| | | | | | | | | | | |
| | Thailand—1.4% | | | | | | | | | |
| | Kasikornbank PCL (Commercial banks) | | | 161,200 | | | | | 1,019 | |
| | | | | | | | | | | |
| | Asia—3.4% | | | | | | | | | |
| | | | | | | | | | | |
| | Hong Kong—2.5% | | | | | | | | | |
| | AIA Group, Ltd. (Insurance) | | | 415,800 | | | | | 1,761 | |
| | | | | | | | | | | |
| | Singapore—0.9% | | | | | | | | | |
| | Keppel REIT (Real estate investment trusts
(REITs)) | | | 619,800 | | | | | 633 | |
| | | | | | | | | | | |
| | Canada—3.4% | | | | | | | | | |
| | Brookfield Asset Management, Inc. Class
“A” (Real estate management &
development)† | | | 38,360 | | | | | 1,382 | |
| | Canadian National Railway Co. (Road & rail)† | | | 10,310 | | | | | 1,003 | |
| | | | | | | | | | 2,385 | |
| | | | | | | | | | | |
| | Emerging Latin America—2.0% | | | | | | | | | |
| | | | | | | | | | | |
| | Mexico—1.2% | | | | | | | | | |
| | Fomento Economico Mexicano S.A.B. de
C.V.—ADR (Beverages) | | | 8,041 | | | | | 830 | |
| | | | | | | | | | | |
| | Panama—0.8% | | | | | | | | | |
| | Copa Holdings S.A. Class “A” (Airlines)† . | | | 4,283 | | | | | 561 | |
| | | | | | | | | | | |
| | Emerging Europe, Mid-East, Africa—1.3% | | | | | | | | | |
| | | | | | | | | | | |
| | South Africa—1.3% | | | | | | | | | |
| | FirstRand, Ltd. (Diversified financial
services) | | | 312,106 | | | | | 913 | |
| | | | Principal | | | | | |
| | Issuer | | Amount | | | Value | |
| | | | | | | | | |
| | Common Stocks—(continued) | | | | | | | | | |
| | | | | | | | | | | |
| | Total Common Stocks—99.0%
(cost $60,288) | | | | | | | $ | 70,118 | |
| | | | | | | | | | | |
| | Repurchase Agreement | | | | | | | | | |
| | Fixed Income Clearing Corporation, 0.010%
dated 6/28/13, due 7/1/13, repurchase
price $865, collateralized by U.S.
Treasury Note, 0.750%, due 10/31/17 | | | $865 | | | | | 865 | |
| | | | | | | | | | | |
| | Total Repurchase Agreement—1.2%
(cost $865) | | | | | | | | 865 | |
| | | | | | | | | | | |
| | Total Investments—100.2%
(cost $61,153) | | | | | | | | 70,983 | |
| | Liabilities, plus cash and other assets—(0.2)% | | | | | | | | (119 | ) |
| | Net assets—100.0% | | | | | | | $ | 70,864 | |
ADR = American Depository Receipt
† = U.S. listed foreign security
* Non-income producing securities
For securities primarily traded on exchanges or markets that close before the close of regular trading on the New York Stock Exchange, the Fund may use an independent pricing service to fair value price the securities pursuant to Valuation Procedures approved by the Board of Trustees.
At June 30, 2013, the Fund’s Portfolio of Investments includes the following industry categories:
| Financials | | | 22.2 | % |
| Industrials | | | 18.6 | % |
| Information Technology | | | 14.2 | % |
| Health Care | | | 13.8 | % |
| Consumer Discretionary | | | 10.0 | % |
| Consumer Staples | | | 8.0 | % |
| Materials | | | 6.7 | % |
| Energy | | | 5.1 | % |
| Telecommunication Services | | | 1.4 | % |
| Total | | | 100.0 | % |
At June 30, 2013, the Fund’s Portfolio of Investments includes the following currency categories:
| British Pound Sterling | | | 28.7 | % |
| Japanese Yen | | | 20.5 | % |
| Euro | | | 19.6 | % |
| U.S. Dollar | | | 8.8 | % |
| Swiss Franc | | | 6.7 | % |
| Hong Kong Dollar | | | 3.3 | % |
| Danish Krone | | | 2.0 | % |
| South Korean Won | | | 1.8 | % |
| Thai Baht | | | 1.5 | % |
| Norwegian Krone | | | 1.4 | % |
| South African Rand | | | 1.3 | % |
| Swedish Krona | | | 1.3 | % |
| All Other Currencies | | | 3.1 | % |
| Total | | | 100.0 | % |
See accompanying Notes to Financial Statements.
| June 30, 2013 | William Blair Funds | 49 |
| | INSTITUTIONAL INTERNATIONAL EQUITY FUND |
| | |
| | The Institutional International Equity Fund seeks long-term capital appreciation. |
| | |
| | AN OVERVIEW FROM THE PORTFOLIO MANAGER |
| | |

David Merjan | The William Blair Institutional International Equity Fund posted a 3.14% increase, net of fees, for the six months ended June 30, 2013. By comparison, the Fund’s benchmark index, the MSCI World Ex-U.S. Index (net) (the “Index”), increased 3.01%. Stock selection was strong across most regions, with particular value added in Japan. Fuji Heavy, the manufacturer of Subarus, was a key contributor to performance, on good operating results and positive guidance, coupled with positive sentiment surrounding Japanese stocks generally, and exporters particularly. The Fund’s overweighting of Japanese Financials added value, as they were up nearly 24% during the period, bolstered by strong results across most holdings. Yahoo Japan was another key contributor, given increased ad spend and increased guidance. Canadian stock selection was bolstered by minimal Resources holdings, while the Healthcare overweighting and Industrials stock selection drove Europe ex-U.K. results. The key detractor from year to date results was the Fund’s regional positioning, which detracted approximately 2% from relative performance. In particular, the Fund’s emerging markets exposure averaged 14% during the period, which detracted from results, given the severe underperformance of emerging markets relative to developed markets. In addition, the underweighting in Japan hampered performance, given market strength, coupled with the Fund’s strong stock selection. Overall sector positioning did not change substantially during the period. Financials, which totaled approximately 22% of the Fund, was below the 26.2% Index weighting, due primarily to the underweighting in Commercial Banks. Industrials was approximately 6% overweighted versus the Index, while Information Technology was approximately 10% overweighted. Conversely, Energy, and Materials were underweighted as was Staples. Regionally, the Fund’s emerging markets weighting 10.5%, due primarily to a focus on Asian exporters. This weighting represented a decrease since the beginning of the year. The Fund was also overweighted in the U.K., which totaled 27.1% of the Fund, above the 17.5% Index weighting, given significant exposure in Financials and Industrials. Conversely, Europe was most underweighted at 34.5% of the Fund, well below the 41.1% Index weighting, despite the significant Healthcare weighting, given limited Energy and Financials exposure. |
| 50 | Semi-Annual Report | June 30, 2013 |
Institutional International Equity Fund
Performance Highlights (Unaudited)
| Average Annual Total Return at 6/30/2013 |
| | | Year
to Date | | 1 Year | | 3 Year | | 5 Year | | Since
Inception(a) |
| Institutional Class | | | 3.14 | % | | | 16.26 | % | | | 9.50 | % | | | (2.06 | )% | | | 3.78 | % |
| MSCI World Ex-U.S.Index (net) | | | 3.01 | | | | 17.07 | | | | 9.43 | | | | (0.84 | ) | | | 4.43 | |
| (a) | For the period from December 1, 2004 (Commencement of Operations) to June 30, 2013. |
Performance cited represents past performance. Past performance does not guarantee future results and current performance may be lower or higher than the data quoted. Results shown are average annual returns, which assume reinvestment of dividends and capital gains. Investment returns and principal will fluctuate and you may have a gain or loss when you sell shares. For the most current month end performance information, please call 1-800-742-7272, or visit our Web site at www.williamblairfunds.com. From time to time, the investment advisor may waive fees or reimburse expenses for the Fund. Without these waivers, performance would be lower. International investing involves special risk considerations, including currency fluctuations, lower liquidity, economic and political risk. Shares of the Fund are available without a sales load or distribution (12b-1) or service fees.
The performance highlights and graph presented above do not reflect the deduction of taxes that a shareholder would pay on fund distributions or the redemption of fund shares.
The Morgan Stanley Capital International (MSCI) World Ex-U.S. Index (net) is a free float-adjusted market capitalization weighted index that is designed to measure the equity market performance of developed markets, excluding the United States. This series approximates the minimum possible dividend reinvestment.
This report identifies the Fund’s investments on June 30, 2013. These holdings are subject to change. Not all stocks in the Fund performed the same, nor is there any guarantee that these stocks will perform as well in the future. Market forecasts provided in this report may not necessarily come to pass.
Sector Diversification (Unaudited)
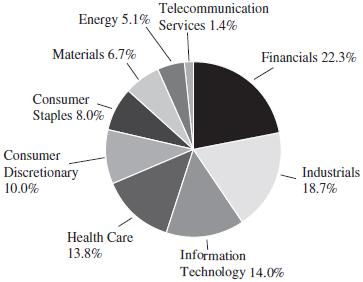
The sector diversification shown is based on the total long-term securities.
| June 30, 2013 | William Blair Funds | 51 |
Institutional International Equity Fund
Portfolio of Investments, June 30, 2013 (all dollar amounts in thousands) (unaudited)
| | | | | | | | | |
| | | | | | | | | |
| | Issuer | | Shares | | | Value | |
| | | | | | | | | | | |
| | Common Stocks | | | | | | | | | |
| | | | | | | | | | | |
| | Europe—34.5% | | | | | | | | | |
| | | | | | | | | | | |
| | Belgium—1.1% | | | | | | | | | |
| | UCB S.A. (Pharmaceuticals) | | | 19,240 | | | | $ | 1,036 | |
| | | | | | | | | | | |
| | Denmark—2.0% | | | | | | | | | |
| | Coloplast A/S Class “B” (Health care
equipment & supplies) | | | 14,480 | | | | | 812 | |
| | Novo Nordisk A/S Class “B”
(Pharmaceuticals) | | | 6,221 | | | | | 969 | |
| | | | | | | | | | 1,781 | |
| | | | | | | | | | | |
| | France—10.8% | | | | | | | | | |
| | BNP Paribas S.A. (Commercial banks) | | | 14,719 | | | | | 804 | |
| | Christian Dior S.A. (Textiles, apparel &
luxury goods) | | | 5,695 | | | | | 919 | |
| | Dassault Systemes S.A. (Software) | | | 6,875 | | | | | 841 | |
| | Essilor International S.A. (Health care
equipment & supplies) | | | 10,642 | | | | | 1,132 | |
| | L’Oreal S.A. (Personal products) | | | 5,006 | | | | | 823 | |
| | Publicis Groupe S.A. (Media) | | | 19,100 | | | | | 1,360 | |
| | Sanofi (Pharmaceuticals) | | | 15,799 | | | | | 1,637 | |
| | Technip S.A. (Energy equipment & services) | | | 11,776 | | | | | 1,196 | |
| | Unibail-Rodamco SE (Real estate
investment trusts (REITs)) | | | 4,317 | | | | | 1,006 | |
| | | | | | | | | | 9,718 | |
| | | | | | | | | | | |
| | Germany—4.9% | | | | | | | | | |
| | BASF SE (Chemicals) | | | 18,210 | | | | | 1,627 | |
| | Bayer AG (Pharmaceuticals) | | | 16,213 | | | | | 1,729 | |
| | MTU Aero Engines AG (Aerospace &
defense) | | | 10,729 | | | | | 1,035 | |
| | | | | | | | | | 4,391 | |
| | | | | | | | | | | |
| | Ireland—3.7% | | | | | | | | | |
| | Accenture plc Class “A” (IT services)† | | | 17,482 | | | | | 1,258 | |
| | Ryanair Holdings plc—ADR (Airlines) | | | 17,057 | | | | | 879 | |
| | Shire plc (Pharmaceuticals) | | | 38,955 | | | | | 1,235 | |
| | | | | | | | | | 3,372 | |
| | | | | | | | | | | |
| | Netherlands—1.9% | | | | | | | | | |
| | Unilever N.V. (Food products) | | | 44,608 | | | | | 1,757 | |
| | | | | | | | | | | |
| | Norway—1.4% | | | | | | | | | |
| | Telenor ASA (Diversified
telecommunication services) | | | 63,694 | | | | | 1,263 | |
| | | | | | | | | | | |
| | Spain—0.7% | | | | | | | | | |
| | Inditex S.A. (Specialty retail) | | | 5,268 | | | | | 650 | |
| | | | | | | | | | | |
| | Sweden—1.3% | | | | | | | | | |
| | Atlas Copco AB Class “A” (Machinery) | | | 47,887 | | | | | 1,157 | |
| | | | | | | | | | | |
| | Switzerland—6.7% | | | | | | | | | |
| * | Credit Suisse Group AG (Capital markets) | | | 57,609 | | | | | 1,528 | |
| * | Geberit AG (Building products) | | | 2,838 | | | | | 704 | |
| | Nestle S.A. (Food products) | | | 15,789 | | | | | 1,035 | |
| | Roche Holding AG (Pharmaceuticals) | | | 6,177 | | | | | 1,537 | |
| | Syngenta AG (Chemicals) | | | 3,071 | | | | | 1,202 | |
| | | | | | | | | 6,006 | |
| | | | | | | | | |
| | | | | | | | |
| | Issuer | | Shares | | | Value | |
| | | | | |
| | Common Stocks—(continued) | | | | | | | | | |
| | | | | | | | | | | |
| | United Kingdom—27.1% | | | | | | | | | |
| | Antofagasta plc (Metals & mining) | | | 95,055 | | | | $ | 1,149 | |
| | ARM Holdings plc (Semiconductors &
semiconductor equipment) | | | 71,323 | | | | | 862 | |
| | Babcock International Group plc
(Commercial services & supplies) | | | 64,690 | | | | | 1,085 | |
| | Burberry Group plc (Textiles, apparel &
luxury goods) | | | 33,548 | | | | | 689 | |
| | Capita plc (Professional services) | | | 32,395 | | | | | 476 | |
| | Compass Group plc (Hotels, restaurants &
leisure) | | | 167,830 | | | | | 2,144 | |
| | Diageo plc (Beverages) | | | 60,767 | | | | | 1,738 | |
| | Experian plc (Professional services) | | | 58,919 | | | | | 1,024 | |
| | GlaxoSmithKline plc (Pharmaceuticals) | | | 42,922 | | | | | 1,076 | |
| | HSBC Holdings plc (Commercial banks) | | | 140,583 | | | | | 1,458 | |
| | IMI plc (Machinery) | | | 66,783 | | | | | 1,260 | |
| | InterContinental Hotels Group plc (Hotels,
restaurants & leisure) | | | 32,174 | | | | | 885 | |
| | John Wood Group plc (Energy equipment
& services) | | | 93,804 | | | | | 1,155 | |
| | Prudential plc (Insurance) | | | 81,843 | | | | | 1,338 | |
| | Reckitt Benckiser Group plc (Household
products) | | | 10,142 | | | | | 717 | |
| | Regus plc (Commercial services & supplies) | | | 259,751 | | | | | 622 | |
| * | Rolls-Royce Holdings plc (Aerospace &
defense) | | | 108,569 | | | | | 1,873 | |
| | St James’s Place plc (Insurance) | | | 163,864 | | | | | 1,346 | |
| | Standard Life plc (Insurance) | | | 275,789 | | | | | 1,450 | |
| | Tullow Oil plc (Oil, gas & consumable fuels) | | | 54,660 | | | | | 832 | |
| | Wolseley plc (Trading companies &
distributors) | | | 27,186 | | | | | 1,254 | |
| | | | | | | | | | 24,433 | |
| | | | | | | | | | | |
| | Japan—20.3% | | | | | | | | | |
| | Astellas Pharma, Inc. (Pharmaceuticals) | | | 21,200 | | | | | 1,152 | |
| | Chiyoda Corporation (Construction &
engineering) | | | 36,000 | | | | | 424 | |
| | Daikin Industries, Ltd. (Building products) | | | 29,900 | | | | | 1,209 | |
| | Denso Corporation (Auto components) | | | 27,400 | | | | | 1,289 | |
| | Fuji Heavy Industries, Ltd. (Automobiles) | | | 39,000 | | | | | 961 | |
| | ITOCHU Corporation (Trading companies
& distributors) | | | 69,000 | | | | | 796 | |
| | Japan Exchange Group, Inc. (Diversified
financial services) | | | 10,200 | | | | | 1,030 | |
| | Keyence Corporation (Electronic equipment,
instruments & components) | | | 1,900 | | | | | 606 | |
| | Makita Corporation (Machinery) | | | 17,000 | | | | | 919 | |
| | Nitto Denko Corporation (Chemicals) | | | 13,600 | | | | | 875 | |
| | ORIX Corporation (Diversified financial
services) | | | 88,700 | | | | | 1,212 | |
| | Otsuka Corporation (IT services) | | | 10,300 | | | | | 1,144 | |
| | Shin-Etsu Chemical Co., Ltd. (Chemicals) | | | 16,500 | | | | | 1,095 | |
| | Sumitomo Mitsui Financial Group, Inc.
(Commercial banks) | | | 33,900 | | | | | 1,555 | |
| | Sumitomo Mitsui Trust Holdings, Inc.
(Commercial banks) | | | 369,000 | | | | | 1,723 | |
| | Trend Micro, Inc. (Software) | | | 35,000 | | | | | 1,112 | |
See accompanying Notes to Financial Statements.
| 52 | Semi-Annual Report | June 30, 2013 |
Institutional International Equity Fund
Portfolio of Investments, June 30, 2013 (all dollar amounts in thousands) (unaudited)
| | | | | | | | |
| | | | | | | | |
| | Issuer | | Shares | | | Value | |
| | | | | | | | | |
| | Common Stocks—(continued) | | | | | | | |
| | | | | | | | | |
| | Japan—(continued) | | | | | | | |
| | Yahoo! Japan Corporation (Internet
software & services) | | | 2,497 | | | | $ | 1,231 | |
| | | | | | | | | | 18,333 | |
| | | | | | | | | | | |
| | Emerging Asia—7.2% | | | | | | | | | |
| | | | | | | | | | | |
| | China—0.8% | | | | | | | | | |
| | CNOOC, Ltd. (Oil, gas & consumable fuels) | | | 442,000 | | | | | 750 | |
| | | | | | | | | | | |
| | India—0.8% | | | | | | | | | |
| | Tata Consultancy Services, Ltd. (IT services) | | | 28,210 | | | | | 721 | |
| | | | | | | | | | | |
| | Papua New Guinea—0.7% | | | | | | | | | |
| | Oil Search, Ltd. (Oil, gas & consumable fuels) | | | 87,755 | | | | | 620 | |
| | | | | | | | | | | |
| | South Korea—1.8% | | | | | | | | | |
| | Samsung Electronics Co., Ltd.
(Semiconductors & semiconductor
equipment) | | | 1,375 | | | | | 1,616 | |
| | | | | | | | | | | |
| | Taiwan—1.7% | | | | | | | | | |
| | Novatek Microelectronics Corporation
(Semiconductors & semiconductor
equipment) | | | 135,000 | | | | | 655 | |
| | Taiwan Semiconductor Manufacturing Co.,
Ltd.—ADR (Semiconductors &
semiconductor equipment) | | | 48,338 | | | | | 886 | |
| | | | | | | | | | 1,541 | |
| | | | | | | | | | | |
| | Thailand—1.4% | | | | | | | | | |
| | Kasikornbank PCL (Commercial banks) | | | 205,300 | | | | | 1,297 | |
| | | | | | | | | | | |
| | Asia—3.4% | | | | | | | | | |
| | | | | | | | | | | |
| | Hong Kong—2.5% | | | | | | | | | |
| | AIA Group, Ltd. (Insurance) | | | 530,600 | | | | | 2,247 | |
| | | | | | | | | | | |
| | Singapore—0.9% | | | | | | | | | |
| | Keppel REIT (Real estate investment trusts
(REITs)) | | | 790,600 | | | | | 808 | |
| | | | | | | | | | | |
| | Canada—3.2% | | | | | | | | | |
| | Brookfield Asset Management, Inc. Class “A”
(Real estate management & development)† | | | 43,789 | | | | | 1,578 | |
| | Canadian National Railway Co. (Road &
rail)† | | | 13,141 | | | | | 1,278 | |
| | | | | | | | | | 2,856 | |
| | | | | | | | | | | |
| | Emerging Latin America—2.0% | | | | | | | | | |
| | | | | | | | | | | |
| | Mexico—1.2% | | | | | | | | | |
| | Fomento Economico Mexicano S.A.B. de
C.V.—ADR (Beverages) | | | 10,261 | | | | | 1,059 | |
| | | | | | | | | | | |
| | Panama—0.8% | | | | | | | | | |
| | Copa Holdings S.A. Class “A” (Airlines)† | | | 5,462 | | | | | 716 | |
| | | | | | | | | | | |
| | Emerging Europe, Mid-East, Africa—1.3% | | | | | | | | | |
| | | | | | | | | | | |
| | South Africa—1.3% | | | | | | | | | |
| | FirstRand, Ltd. (Diversified financial services) | | | 398,270 | | | | | 1,166 | |
| | | | | | | | | | | |
| | Total Common Stocks—99.0%
(cost $76,662) | | | | | | | | 89,294 | |
| | | | | | | | | |
| | Issuer | | Principal
Amount | | | Value | |
| | | | | | | | | | | |
| | Repurchase Agreement | | | | | | | | | |
| | Fixed Income Clearing Corporation, 0.010%
dated 6/28/13, due 7/1/13, repurchase
price $3,446, collateralized by FNMA,
0.875%, due 10/26/17 | | | $3,446 | | | | $ | 3,446 | |
| | | | | | | | | | | |
| | Total Repurchase Agreement—3.8%
(cost $3,446) | | | | | | | | 3,446 | |
| | | | | | | | | | | |
| | Total Investments—102.8%
(cost $80,108) | | | | | | | | 92,740 | |
| | Liabilities, plus cash and other assets—(2.8)% | | | | | | | | (2,544 | ) |
| | Net assets—100.0% | | | | | | | $ | 90,196 | |
ADR = American Depository Receipt
† = U.S. listed foreign security
* Non-income producing securities
For securities primarily traded on exchanges or markets that close before the close of regular trading on the New York Stock Exchange, the Fund may use an independent pricing service to fair value price the securities pursuant to Valuation Procedures approved by the Board of Trustees.
At June 30, 2013, the Fund’s Portfolio of Investments includes the following industry categories:
| Financials | | | 22.3 | % |
| Industrials | | | 18.7 | % |
| Information Technology | | | 14.0 | % |
| Health Care | | | 13.8 | % |
| Consumer Discretionary | | | 10.0 | % |
| Consumer Staples | | | 8.0 | % |
| Materials | | | 6.7 | % |
| Energy | | | 5.1 | % |
| Telecommunication Services | | | 1.4 | % |
| Total | | | 100.0 | % |
At June 30, 2013, the Fund’s Portfolio of Investments includes the following currency categories:
| British Pound Sterling | | | 28.7 | % |
| Japanese Yen | | | 20.5 | % |
| Euro | | | 19.7 | % |
| U.S. Dollar | | | 8.6 | % |
| Swiss Franc | | | 6.7 | % |
| Hong Kong Dollar | | | 3.4 | % |
| Danish Krone | | | 2.0 | % |
| South Korean Won | | | 1.8 | % |
| Thai Baht | | | 1.5 | % |
| Norwegian Krone | | | 1.4 | % |
| South African Rand | | | 1.3 | % |
| Swedish Krona | | | 1.3 | % |
| All Other Currencies | | | 3.1 | % |
| Total | | | 100.0 | % |
See accompanying Notes to Financial Statements.
| June 30, 2013 | William Blair Funds | 53 |
| | INTERNATIONAL LEADERS FUND |
| | |
| | The International Leaders Fund seeks long-term capital appreciation. |
| | |
| | AN OVERVIEW FROM THE PORTFOLIO MANAGERS |
| | |

W. George Greig 
Kenneth J. McAtamney 
Simon Fennell | The William Blair International Leaders Fund (Class N shares) posted a 2.50% increase, net of fees, for the six months ended June 30, 2013. By comparison, the Fund’s benchmark index, the MSCI ACW ex-U.S. IMI Index (net) (the “Index”), increased 0.18%. The Fund’s outperformance relative to the Index was driven by overall sector positioning, coupled with Materials and Financials stock selection and regional stock selection more broadly. Within Materials, the Fund’s underweighting and stock selection in Mining added value, as did performance in the overweighted Chemicals industry. Financials stock selection was driven by Insurance performance, as the Fund’s stocks rose 11.5%, compared to the 6.2% Index return. In addition, Japanese financials added value, as did Partners Group. Regionally, developed Asia performance was strong, while Europe ex-U.K. lagged due to weakness in Consumer Discretionary, Energy, Healthcare, and Materials, as did Emerging Asia. We continue to find the prospects for a resurgent Japan promising. Though evidence of Prime Minister Abe’s “third arrow” of corporate reform remains anecdotal, we are focusing our research on those companies that have demonstrated high or improving returns, growth potential, and shareholder orientation on par with leading companies globally. Thus, the biggest regional change was the 7.8% increased Japanese weighting to 17.8% of the Fund. More broadly, we purchased companies in the Consumer Discretionary and Industrial sectors where the growth outlook was improving while valuations remained reasonable. The sources of funds for these purchases came primarily from sales in the emerging markets and Financials. Emerging markets declined approximately 4%, while Financials was reduced approximately 5%. As of June 30, the largest sector overweightings were in Consumer Discretionary, Healthcare, and Industrials, while the largest underweightings were in the Resources-related sectors and Consumer Staples. |
| 54 | Semi-Annual Report | June 30, 2013 |
International Leaders Fund
Performance Highlights (Unaudited)
| Average Annual Total Return at 6/30/2013 |
| | | | | |
| | | Year
to Date | | Since
Inception |
| Class N(a) | | | 2.50 | % | | | 10.86 | % |
| Class I(a) | | | 2.68 | | | | 11.16 | |
| MSCI ACW Ex-U.S. IMI (net)(a) | | | 0.18 | | | | 9.81 | |
| Institutional Class(b) | | | 2.78 | | | | 8.61 | |
| MSCI ACW Ex-U.S. IMI (net)(b) | | | 0.18 | | | | 4.93 | |
| (a) | Since inception is for the period from August 16, 2012 (Commencement of Operations) to June 30, 2013. |
| (b) | Since inception is for the period from November 2, 2012 (Commencement of Operations) to June 30, 2013. |
Performance cited represents past performance. Past performance does not guarantee future results and current performance may be lower or higher than the data quoted. Results shown are average annual returns, which assume reinvestment of dividends and capital gains. Investment returns and principal will fluctuate and you may have a gain or loss when you sell shares. For the most current month-end performance information, please call 1-800-742-7272, or visit our Web site at www.williamblairfunds.com. From time to time the investment advisor may waive fees or reimburse expenses for the Fund. Without these waivers, performance would be lower. International investing involves special risk considerations, including currency fluctuations, lower liquidity, economic and political risk. Class N shares are available to the general public without a sales load. Class I shares are available to certain institutional investors and advisory clients of William Blair & Company L.L.C. without a sales load or distribution (12b-1) fees. Institutional Class Shares are available to institutional investors without a sales load or distribution (12b-1) or service fees.
The performance highlights presented above do not reflect the deduction of taxes that a shareholder would pay on fund distributions or the redemption of fund shares.
The Morgan Stanley Capital International (MSCI) All Country World (ACW) Ex-U.S. Investable Market Index (IMI) (net) is a free float-adjusted market capitalization weighted index that is designed to measure the equity market performance of developed and emerging markets, excluding the United States. This series approximates the minimum possible dividend reinvestment.
This report identifies the Fund’s investments on June 30, 2013. These holdings are subject to change. Not all stocks in the Fund performed the same, nor is there any guarantee that these stocks will perform as well in the future. Market forecasts provided in this report may not necessarily come to pass.
Sector Diversification (Unaudited)
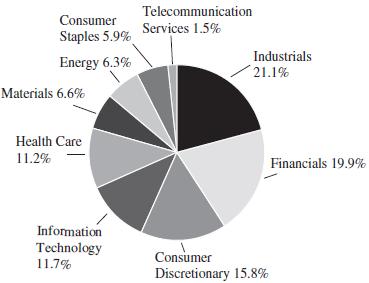
The sector diversification shown is based on the total long-term securities.
| June 30, 2013 | William Blair Funds | 55 |
International Leaders Fund
Portfolio of Investments, June 30, 2013 (all dollar amounts in thousands) (unaudited)
| | | | | | | | |
| | | | | | | | |
| | Issuer | | Shares | | | Value | |
| | | | | | | | | | | |
| | Common Stocks | | | | | | | | | |
| | | | | | | | | | | |
| | Europe, Mid-East—40.5% | | | | | | | | | |
| | | | | | | | | | | |
| | Denmark—2.9% | | | | | | | | | |
| | Coloplast A/S Class “B” (Health care
equipment & supplies) | | | 17,480 | | | | $ | 980 | |
| | Novo Nordisk A/S Class “B”
(Pharmaceuticals) | | | 4,982 | | | | | 777 | |
| | | | | | | | | | 1,757 | |
| | | | | | | | | | | |
| | France—8.4% | | | | | | | | | |
| | BNP Paribas S.A. (Commercial banks) | | | 33,805 | | | | | 1,847 | |
| | Dassault Systemes S.A. (Software) | | | 9,916 | | | | | 1,213 | |
| | Publicis Groupe S.A. (Media) | | | 15,496 | | | | | 1,104 | |
| | Technip S.A. (Energy equipment & services) | | | 9,851 | | | | | 1,000 | |
| | | | | | | | | | 5,164 | |
| | | | | | | | | | | |
| | Germany—6.6% | | | | | | | | | |
| | Bayerische Motoren Werke AG
(Automobiles) | | | 15,425 | | | | | 1,349 | |
| | Brenntag AG (Trading companies &
distributors) | | | 5,282 | | | | | 802 | |
| | Fresenius SE & Co. KGaA (Health care
providers & services) | | | 11,428 | | | | | 1,409 | |
| | SAP AG (Software) | | | 6,880 | | | | | 504 | |
| | | | | | | | | | 4,064 | |
| | | | | | | | | | | |
| | Ireland—1.6% | | | | | | | | | |
| | Ryanair Holdings plc—ADR (Airlines) | | | 19,593 | | | | | 1,010 | |
| | | | | | | | | | | |
| | Israel—1.4% | | | | | | | | | |
| * | Check Point Software Technologies, Ltd.
(Software)† | | | 17,664 | | | | | 877 | |
| | | | | | | | | | | |
| | Netherlands—1.8% | | | | | | | | | |
| | Unilever N.V. (Food products) | | | 27,819 | | | | | 1,095 | |
| | | | | | | | | | | |
| | Norway—2.8% | | | | | | | | | |
| | Statoil ASA (Oil, gas & consumable fuels) | | | 42,311 | | | | | 873 | |
| | Telenor ASA (Diversified
telecommunication services) | | | 16,067 | | | | | 318 | |
| | TGS Nopec Geophysical Co. ASA (Energy
equipment & services) | | | 19,443 | | | | | 565 | |
| | | | | | | | | | 1,756 | |
| | | | | | | | | | | |
| | Spain—1.1% | | | | | | | | | |
| | Inditex S.A. (Specialty retail) | | | 5,584 | | | | | 689 | |
| | | | | | | | | | | |
| | Sweden—2.1% | | | | | | | | | |
| | Atlas Copco AB Class “A” (Machinery) | | | 53,597 | | | | | 1,295 | |
| | | | | | | | | | | |
| | Switzerland—11.8% | | | | | | | | | |
| | Cie Financiere Richemont S.A. (Textiles,
apparel & luxury goods) | | | 13,614 | | | | | 1,204 | |
| * | Geberit AG (Building products) | | | 3,938 | | | | | 977 | |
| | Glencore Xstrata plc (Metals & mining) | | | 209,623 | | | | | 868 | |
| | Partners Group Holding AG (Capital markets) | | | 4,325 | | | | | 1,171 | |
| | Roche Holding AG (Pharmaceuticals) | | | 7,682 | | | | | 1,911 | |
| | Syngenta AG (Chemicals) | | | 3,019 | | | | | 1,181 | |
| | | | | | | | | | 7,312 | |
| | | | | | | | |
| | | | | | | | |
| | Issuer | | Shares | | | Value | |
| | | | | | | | | | | |
| | Common Stocks—(continued) | | | | | | | | | |
| | | | | | | | | | | |
| | United Kingdom—24.7% | | | | | | | | | |
| | ARM Holdings plc (Semiconductors &
semiconductor equipment) | | | 66,052 | | | | $ | 799 | |
| | Babcock International Group plc
(Commercial services & supplies) | | | 48,461 | | | | | 813 | |
| | Berkeley Group Holdings plc (Household
durables) | | | 28,759 | | | | | 932 | |
| | Compass Group plc (Hotels, restaurants &
leisure) | | | 102,837 | | | | | 1,314 | |
| | Diageo plc (Beverages) | | | 32,370 | | | | | 926 | |
| | Experian plc (Professional services) | | | 60,121 | | | | | 1,045 | |
| | HSBC Holdings plc (Commercial banks) | | | 130,800 | | | | | 1,370 | |
| | InterContinental Hotels Group plc (Hotels,
restaurants & leisure) | | | 36,582 | | | | | 1,006 | |
| | John Wood Group plc (Energy equipment
& services) | | | 56,641 | | | | | 697 | |
| | Johnson Matthey plc (Chemicals) | | | 25,621 | | | | | 1,024 | |
| | Meggitt plc (Aerospace & defense) | | | 127,755 | | | | | 1,006 | |
| * | Rolls-Royce Holdings plc (Aerospace &
defense) | | | 43,287 | | | | | 747 | |
| | St James’s Place plc (Insurance) | | | 94,527 | | | | | 776 | |
| | The Weir Group plc (Machinery) | | | 28,450 | | | | | 931 | |
| | Tullow Oil plc (Oil, gas & consumable fuels) | | | 48,025 | | | | | 731 | |
| | Wolseley plc (Trading companies & distributors) | | | 25,564 | | | | | 1,179 | |
| | | | | | | | | | 15,296 | |
| | | | | | | | | | | |
| | Japan—17.8% | | | | | | | | | |
| | Astellas Pharma, Inc. (Pharmaceuticals) | | | 23,000 | | | | | 1,250 | |
| | Fuji Heavy Industries, Ltd. (Automobiles) | | | 51,959 | | | | | 1,281 | |
| | Lawson, Inc. (Food & staples retailing) | | | 8,600 | | | | | 656 | |
| | Makita Corporation (Machinery) | | | 21,400 | | | | | 1,156 | |
| | ORIX Corporation (Diversified financial
services) | | | 113,100 | | | | | 1,545 | |
| | Secom Co., Ltd. (Commercial services &
supplies) | | | 21,500 | | | | | 1,171 | |
| | Shin-Etsu Chemical Co., Ltd. (Chemicals) | | | 15,300 | | | | | 1,015 | |
| | Sumitomo Mitsui Financial Group, Inc.
(Commercial banks) | | | 35,500 | | | | | 1,629 | |
| | Yahoo! Japan Corporation (Internet
software & services) | | | 2,636 | | | | | 1,300 | |
| | | | | | | | | | 11,003 | |
| | | | | | | | | | | |
| | Emerging Europe, Mid-East, Africa—5.7% | | | | | | | | | |
| | | | | | | | | | | |
| | Kenya—1.0% | | | | | | | | | |
| | Safaricom, Ltd. (Wireless
telecommunication services) | | | 8,105,800 | | | | | 624 | |
| | | | | | | | | | | |
| | South Africa—4.0% | | | | | | | | | |
| | Aspen Pharmacare Holdings, Ltd.
(Pharmaceuticals) | | | 25,489 | | | | | 585 | |
| | Bidvest Group, Ltd. (Industrial
conglomerates) | | | 33,796 | | | | | 837 | |
| | Discovery, Ltd. (Insurance) | | | 120,126 | | | | | 1,022 | |
| | | | | | | | | | 2,444 | |
See accompanying Notes to Financial Statements.
| 56 | Semi-Annual Report | June 30, 2013 |
International Leaders Fund
Portfolio of Investments, June 30, 2013 (all dollar amounts in thousands) (unaudited)
| | | | | | | | |
| | | | | | | | |
| | Issuer | | Shares | | | Value | |
| | | | | | | | | | | |
| | Common Stocks—(continued) | | | | | | | | | |
| | | | | | | | | | | |
| | Emerging Europe, Mid-East, Africa—(continued) | | | | | | | | | |
| | | | | | | | | | | |
| | Turkey—0.7% | | | | | | | | | |
| | Turkiye Halk Bankasi A.S. (Commercial
banks) | | | 51,526 | | | | $ | 437 | |
| | | | | | | | | | | |
| | Emerging Asia—4.4% | | | | | | | | | |
| | | | | | | | | | | |
| | India—1.3% | | | | | | | | | |
| | Tata Motors, Ltd.—ADR (Automobiles) | | | 34,700 | | | | | 813 | |
| | | | | | | | | | | |
| | Indonesia—1.0% | | | | | | | | | |
| | PT Bank Rakyat Indonesia Persero Tbk
(Commercial banks) | | | 815,000 | | | | | 637 | |
| | | | | | | | | | | |
| | South Korea—2.1% | | | | | | | | | |
| | Samsung Electronics Co., Ltd.
(Semiconductors & semiconductor
equipment) | | | 1,087 | | | | | 1,277 | |
| | | | | | | | | | | |
| | Asia—2.9% | | | | | | | | | |
| | | | | | | | | | | |
| | Hong Kong—2.9% | | | | | | | | | |
| | AIA Group, Ltd. (Insurance) | | | 429,000 | | | | | 1,817 | |
| | | | | | | | | | | |
| | Canada—2.0% | | | | | | | | | |
| | Brookfield Asset Management, Inc. Class
“A” (Real estate management &
development)† | | | 34,240 | | | | | 1,233 | |
| | | | | | | | | | | |
| | Emerging Latin America—1.5% | | | | | | | | | |
| | | | | | | | | | | |
| | Mexico—1.5% | | | | | | | | | |
| | Fomento Economico Mexicano S.A.B. de
C.V.—ADR (Beverages) | | | 9,012 | | | | | 930 | |
| | | | | | | | | | | |
| | Total Common Stocks—99.5%
(cost $60,848) | | | | | | | | 61,530 | |
| | | | | | | | | | | |
| | Total Investments—99.5%
(cost $60,848) | | | | | | | | 61,530 | |
| | Cash and other assets, less liabilities—0.5% | | | | | | | | 283 | |
| | Net assets—100.0% | | | | | | | $ | 61,813 | |
ADR = American Depository Receipt
* Non-income producing securities
† = U.S. listed foreign security
For securities primarily traded on exchanges or markets that close before the close of regular trading on the New York Stock Exchange, the Fund may use an independent pricing service to fair value price the securities pursuant to Valuation Procedures approved by the Board of Trustees.
At June 30, 2013, the Fund’s Portfolio of Investments includes the following industry categories:
| Industrials | 21.1% |
| Financials | 19.9% |
| Consumer Discretionary | 15.8% |
| Information Technology | 11.7% |
| Health Care | 11.2% |
| Materials | 6.6% |
| Energy | 6.3% |
| Consumer Staples | 5.9% |
| Telecommunication Services | 1.5% |
| Total | 100.0% |
At June 30, 2013, the Fund’s Portfolio of Investments includes the following currency categories:
| British Pound Sterling | 24.0% |
| Euro | 17.9% |
| Japanese Yen | 17.9% |
| Swiss Franc | 10.5% |
| U.S. Dollar | 7.9% |
| Hong Kong Dollar | 5.2% |
| South African Rand | 4.0% |
| Danish Krone | 2.9% |
| Norwegian Krone | 2.8% |
| Swedish Krona | 2.1% |
| South Korean Won | 2.1% |
| Indonesian Rupiah | 1.0% |
| Kenyan Shilling | 1.0% |
| All Other Currencies | 0.7% |
| Total | 100.0% |
See accompanying Notes to Financial Statements.
| June 30, 2013 | William Blair Funds | 57 |
| | INTERNATIONAL SMALL CAP GROWTH FUND |
| | |
| | The International Small Cap Growth Fund seeks long-term capital appreciation. |
| | |
| | AN OVERVIEW FROM THE PORTFOLIO MANAGERS |
| | |

Jeffrey A. Urbina 
Andrew G. Flynn | The William Blair International Small Cap Growth Fund (Class N shares) posted a 6.91% increase, net of fees, for the six months ended June 30, 2013. By comparison, the Fund’s benchmark index, the MSCI All Country World Ex-U.S. Small Cap Index (net) (the “Index”), increased 1.83%. The Fund’s outperformance relative to the Index was driven by stock selection in Consumer Discretionary, Financials, and Materials. The Fund’s Consumer Discretionary stocks rallied approximately 19%, well ahead of the 10.3% Index return, as U.K. and Japanese specialty and internet retailers added value, in addition to Japanese auto component manufacturers. The Fund’s Financials stocks rose approximately 8.5% during the period, well ahead of the 2% Index return, due to strong performance by the Fund’s REIT holdings, coupled with Suruga Bank, the Japanese regional bank, which rose on positive results and positive Japanese sentiment, and Azimut, the Italian asset management company, on good earnings results amidst strong positive fund flows. Materials benefited from strong stock performance by Hoganas, the Fund’s sole Metals/Mining holding, which was up approximately 25% during the period, as it was acquired. Emerging Markets stock selection also augmented results, as did strong performance across developed market regions. The Fund’s focus on Japan and the U.K. at the expense of Canada was additive as well. Somewhat detracting from positive year to date results was Energy and Telecom Services stock selection, coupled with the underweighting in Financials. After increasing Japanese holdings in the first quarter, we reduced Japan on valuation concerns in May, as the market rallied substantially with cash largely reinvested in Europe-Ex U.K. holdings. As of June 30, the U.K. remained the most overweighted at 26.2% of the Fund, well ahead of the 14.2% Index weighting, while emerging markets totaled 12.8%, well below the 22.6% weighting of the Index, and a decline since December 31, due to concerns about slower growth in the short term. From a sector perspective, the Fund remained most overweighted versus the Index in Consumer Discretionary (25.3% v. 18.4%), Healthcare (13.9% v. 5.7%), and Information Technology (“IT”) (17.3% v. 10.4%), and most underweighted versus the Index in Financials (12.9% v. 19.9%) and Industrials (10.5% v. 19.0%). Since year end, IT increased from 11.8% to 17.3% of the Fund, while Consumer Staples, Energy, and Telecom Services declined. |
| 58 | Semi-Annual Report | June 30, 2013 |
International Small Cap Growth Fund
Performance Highlights (Unaudited)
Average Annual Total Return at 6/30/2013
| | | Year
to Date | | 1 Year | | 3 Year | | 5 Year | | Since
Inception(a) |
| Class N | | | 6.91 | % | | | 21.58 | % | | | 13.47 | % | | | 3.11 | % | | | 6.67 | % |
| Class I | | | 7.07 | | | | 22.00 | | | | 13.84 | | | | 3.46 | | | | 7.01 | |
| Institutional Class | | | 7.18 | | | | 22.22 | | | | 14.08 | | | | 3.67 | | | | 7.20 | |
MSCI ACW
Ex-U.S. Small
Cap Index (net) | | | 1.83 | | | | 15.94 | | | | 9.16 | | | | 2.65 | | | | 5.85 | |
| (a) | For the period from November 1, 2005 (Commencement of Operations) to June 30, 2013. |
Performance cited represents past performance. Past performance does not guarantee future results and current performance may be lower or higher than the data quoted. Results shown are average annual returns, which assume reinvestment of dividends and capital gains. Investment returns and principal will fluctuate and you may have a gain or loss when you sell shares. For the most current month-end performance information, please call 1-800-742-7272, or visit our Web site at www.williamblairfunds.com. Smaller capitalization stocks are also more sensitive to purchase/sale transactions and changes in the issuer’s financial condition. From time to time, the investment advisor may waive fees or reimburse expenses for the Fund. Without these waivers, performance would be lower. International investing involves special risk considerations, including currency fluctuations, lower liquidity, economic and political risk. Class N shares are available to the general public without a sales load. Class I shares are available to certain institutional investors and advisory clients of William Blair & Company L.L.C. without a sales load or distribution (12b-1) fees. Institutional Class Shares are available to institutional investors without a sales load or distribution (12b-1) or service fees.
The performance highlights and graph presented above do not reflect the deduction of taxes that a shareholder would pay on fund distributions or the redemption of fund shares.
The Morgan Stanley Capital International (MSCI) All Country World (ACW) Ex-U.S. Small Cap Index (net) is a free float-adjusted market capitalization weighted index that is designed to measure the equity market performance of small capitalization developed and emerging markets, excluding the United States. This series approximates the minimum possible dividend reinvestment.
This report identifies the Fund’s investments on June 30, 2013. These holdings are subject to change. Not all stocks in the Fund performed the same, nor is there any guarantee that these stocks will perform as well in the future. Market forecasts provided in this report may not necessarily come to pass.
Sector Diversification (Unaudited)

The sector diversification shown is based on the total long-term securities.
| June 30, 2013 | William Blair Funds | 59 |
International Small Cap Growth Fund
Portfolio of Investments, June 30, 2013 (all dollar amounts in thousands) (unaudited)
| | | | | | | | |
| | | | | | | | |
| | Issuer | | Shares | | | Value | |
| | | | | | | | | | | |
| | Common Stocks | | | | | | | | | |
| | | | | | | | | | | |
| | Europe—26.7% | | | | | | | | | |
| | | | | | | | | | | |
| | Belgium—0.8% | | | | | | | | | |
| | Melexis N.V. (Semiconductors &
semiconductor equipment) | | | 56,818 | | | | $ | 1,195 | |
| * | ThromboGenics N.V. (Biotechnology) | | | 120,666 | | | | | 4,626 | |
| | | | | | | | | | 5,821 | |
| | | | | | | | | | | |
| | Denmark—4.1% | | | | | | | | | |
| | GN Store Nord A/S (Health care equipment
& supplies) | | | 629,397 | | | | | 11,896 | |
| * | Matas A/S (Specialty retail) | | | 29,430 | | | | | 603 | |
| | SimCorp A/S (Software) | | | 238,665 | | | | | 7,081 | |
| * | Topdanmark A/S (Insurance) | | | 470,613 | | | | | 11,991 | |
| | | | | | | | | | 31,571 | |
| | | | | | | | | | | |
| | Finland—1.1% | | | | | | | | | |
| | Tikkurila Oyj (Chemicals) | | | 361,521 | | | | | 8,164 | |
| | | | | | | | | | | |
| | France—0.4% | | | | | | | | | |
| * | GameLoft SE (Software) | | | 480,904 | | | | | 3,368 | |
| | | | | | | | | | | |
| | Germany—6.9% | | | | | | | | | |
| | Bertrandt AG (Professional services) | | | 33,076 | | | | | 3,553 | |
| | Deutsche Wohnen AG (Real estate
management & development) | | | 531,568 | | | | | 9,026 | |
| | ElringKlinger AG (Auto components) | | | 168,825 | | | | | 5,635 | |
| | Gerry Weber International AG (Textiles,
apparel & luxury goods) | | | 73,524 | | | | | 3,110 | |
| | Pfeiffer Vacuum Technology AG (Machinery) | | | 41,396 | | | | | 4,289 | |
| | Wincor Nixdorf AG (Computers &
peripherals) | | | 294,776 | | | | | 15,985 | |
| | Wirecard AG (IT services) | | | 426,204 | | | | | 11,600 | |
| | | | | | | | | | 53,198 | |
| | | | | | | | | | | |
| | Ireland—1.1% | | | | | | | | | |
| | Paddy Power plc (Hotels, restaurants &
leisure) | | | 92,993 | | | | | 7,979 | |
| | | | | | | | | | | |
| | Italy—4.4% | | | | | | | | | |
| | Azimut Holding SpA (Capital markets) | | | 724,559 | | | | | 13,195 | |
| | Brembo SpA (Auto components) | | | 244,301 | | | | | 4,360 | |
| | De’Longhi SpA (Household durables) | | | 80,675 | | | | | 1,261 | |
| | Recordati SpA (Pharmaceuticals) | | | 854,881 | | | | | 9,486 | |
| * | Yoox SpA (Internet & catalog retail) | | | 254,867 | | | | | 5,477 | |
| | | | | | | | | | 33,779 | |
| | | | | | | | | | | |
| | Norway—2.6% | | | | | | | | | |
| * | Algeta ASA (Biotechnology) | | | 73,510 | | | | | 2,798 | |
| | Borregaard ASA (Chemicals) | | | 944,414 | | | | | 4,120 | |
| | Opera Software ASA (Internet software &
services) | | | 830,051 | | | | | 6,423 | |
| | Prosafe SE (Energy equipment & services) | | | 757,542 | | | | | 6,653 | |
| | | | | | | | | | 19,994 | |
| | | | | | | | | | | |
| | Spain—1.1% | | | | | | | | | |
| | Viscofan S.A. (Food products) | | | 172,370 | | | | | 8,636 | |
| | | | | | | | |
| | | | | | | | |
| | Issuer | | Shares | | | Value | |
| | | | | | | | | | | |
| | Common Stocks—(continued) | | | | | | | | | |
| | | | | | | | | | | |
| | Europe—(continued) | | | | | | | | | |
| | | | | | | | | | | |
| | Sweden—3.4% | | | | | | | | | |
| | Axis Communications AB (Communications
equipment) | | | 291,710 | | | | $ | 7,212 | |
| | Hexpol AB (Chemicals) | | | 158,759 | | | | | 10,345 | |
| | JM AB (Household durables) | | | 320,661 | | | | | 6,766 | |
| | Nolato AB (Communications equipment) | | | 118,780 | | | | | 2,055 | |
| | | | | | | | | | 26,378 | |
| | | | | | | | | | | |
| | Switzerland—0.8% | | | | | | | | | |
| | Burckhardt Compression Holding AG
(Machinery) | | | 15,516 | | | | | 6,176 | |
| | | | | | | | | | | |
| | United Kingdom—26.2% | | | | | | | | | |
| | Abcam plc (Biotechnology) | | | 1,125,991 | | | | | 7,766 | |
| | Alent plc (Chemicals) | | | 982,962 | | | | | 4,904 | |
| * | ASOS plc (Internet & catalog retail) | | | 252,047 | | | | | 15,506 | |
| | Aveva Group plc (Software) | | | 318,176 | | | | | 10,908 | |
| | AZ Electronic Materials S.A. (Chemicals) | | | 2,256,662 | | | | | 10,544 | |
| | Big Yellow Group plc (Real estate
investment trusts (REITs)) | | | 312,614 | | | | | 1,829 | |
| | Booker Group plc (Food & staples retailing) | | | 6,372,000 | | | | | 11,775 | |
| | Cineworld Group plc (Media) | | | 622,515 | | | | | 3,212 | |
| * | Countrywide plc (Real estate management
& development) | | | 1,045,557 | | | | | 8,031 | |
| | Domino’s Pizza Group plc (Hotels,
restaurants & leisure) | | | 463,189 | | | | | 4,723 | |
| | Dunelm Group plc (Specialty retail) | | | 889,020 | | | | | 12,805 | |
| | Elementis plc (Chemicals) | | | 2,010,113 | | | | | 6,708 | |
| | Fidessa Group plc (Software) | | | 196,525 | | | | | 5,763 | |
| | Howden Joinery Group plc (Specialty retail) | | | 3,035,504 | | | | | 11,699 | |
| | Keller Group plc (Construction &
engineering) | | | 115,914 | | | | | 1,747 | |
| | Lancashire Holdings, Ltd. (Insurance) | | | 888,860 | | | | | 10,707 | |
| | Moneysupermarket.com Group plc (Internet
software & services) | | | 2,892,596 | | | | | 8,429 | |
| * | Nanoco Group plc (Semiconductors &
semiconductor equipment) | | | 1,762,211 | | | | | 3,538 | |
| * | Ocado Group plc (Internet & catalog retail) | | | 1,148,326 | | | | | 5,210 | |
| | Oxford Instruments plc (Electronic
equipment, instruments & components) | | | 366,684 | | | | | 6,743 | |
| | Provident Financial plc (Consumer finance) | | | 632,216 | | | | | 14,318 | |
| | Regus plc (Commercial services & supplies) | | | 3,062,555 | | | | | 7,327 | |
| | Restaurant Group plc (Hotels, restaurants
& leisure) | | | 993,062 | | | | | 7,552 | |
| | RPS Group plc (Commercial services &
supplies) | | | 724,487 | | | | | 2,226 | |
| * | Salamander Energy plc (Oil, gas &
consumable fuels) | | | 1,574,706 | | | | | 3,449 | |
| | Senior plc (Machinery) | | | 1,831,788 | | | | | 6,976 | |
| | Synergy Health plc (Health care providers
& services) | | | 196,553 | | | | | 3,372 | |
| | Ted Baker plc (Textiles, apparel & luxury
goods) | | | 129,909 | | | | | 3,359 | |
| | | | | | | | | | 201,126 | |
See accompanying Notes to Financial Statements.
| 60 | Semi-Annual Report | June 30, 2013 |
International Small Cap Growth Fund
Portfolio of Investments, June 30, 2013 (all dollar amounts in thousands) (unaudited)
| | | | | | | | |
| | | | | | | | |
| | Issuer | | Shares | | | Value | |
| | | | | | | | | | | |
| | Common Stocks—(continued) | | | | | | | | | |
| | | | | | | | | | | |
| | Japan—20.2% | | | | | | | | | |
| | Cosmos Pharmaceutical Corporation (Food
& staples retailing) | | | 77,200 | | | | $ | 7,815 | |
| | CyberAgent, Inc. (Media) | | | 1,705 | | | | | 3,266 | |
| | Don Quijote Co., Ltd. (Multiline retail) | | | 166,300 | | | | | 8,090 | |
| | F.C.C. Co., Ltd. (Auto components) | | | 486,709 | | | | | 11,503 | |
| | Kakaku.com, Inc. (Internet software &
services) | | | 446,700 | | | | | 13,624 | |
| | M3, Inc. (Health care technology) | | | 1,778 | | | | | 3,994 | |
| | Miraca Holdings, Inc. (Health care providers
& services) | | | 166,800 | | | | | 7,669 | |
| | MISUMI Group, Inc. (Trading companies &
distributors) | | | 262,300 | | | | | 7,212 | |
| | MonotaRO Co., Ltd. (Trading companies &
distributors) | | | 154,600 | | | | | 3,768 | |
| | Nihon M&A Center, Inc. (Professional
services) | | | 62,300 | | | | | 3,474 | |
| | Nippon Kayaku Co., Ltd. (Chemicals) | | | 260,000 | | | | | 3,240 | |
| * | Nippon Prologis REIT, Inc. (Real estate
investment trusts (REITs)) | | | 443 | | | | | 3,855 | |
| | Nissan Chemical Industries, Ltd. (Chemicals) | | | 618,900 | | | | | 8,337 | |
| | Park24 Co., Ltd. (Commercial services &
supplies) | | | 676,100 | | | | | 12,264 | |
| | Ryohin Keikaku Co., Ltd. (Multiline retail) | | | 125,400 | | | | | 10,292 | |
| | Sawai Pharmaceutical Co., Ltd.
(Pharmaceuticals) | | | 74,000 | | | | | 8,841 | |
| | Ship Healthcare Holdings, Inc. (Health care
providers & services) | | | 173,300 | | | | | 6,378 | |
| | Sundrug Co., Ltd. (Food & staples retailing) | | | 264,600 | | | | | 11,232 | |
| | TS Tech Co., Ltd. (Auto components) | | | 378,000 | | | | | 12,005 | |
| | United Arrows, Ltd. (Specialty retail) | | | 198,300 | | | | | 8,287 | |
| | | | | | | | | | 155,146 | |
| | | | | | | | | | | |
| | Emerging Asia—11.1% | | | | | | | | | |
| | | | | | | | | | | |
| | China—3.3% | | | | | | | | | |
| | China Medical System Holdings, Ltd.
(Pharmaceuticals) | | | 8,867,000 | | | | | 7,911 | |
| | China Overseas Grand Oceans Group, Ltd.
(Real estate management & development) | | | 5,478,000 | | | | | 6,992 | |
| | Dongyue Group (Chemicals) | | | 6,363,000 | | | | | 2,543 | |
| | Haitian International Holdings, Ltd.
(Machinery) | | | 3,828,496 | | | | | 5,598 | |
| | Sino Biopharmaceutical (Pharmaceuticals) | | | 3,176,000 | | | | | 2,060 | |
| | | | | | | | | | 25,104 | |
| | | | | | | | | | | |
| | India—3.4% | | | | | | | | | |
| | Glenmark Pharmaceuticals, Ltd.
(Pharmaceuticals) | | | 1,208,859 | | | | | 11,153 | |
| | Ipca Laboratories, Ltd. (Pharmaceuticals) | | | 694,363 | | | | | 7,656 | |
| | Motherson Sumi Systems, Ltd. (Auto
components) | | | 1,904,902 | | | | | 6,355 | |
| | Oberoi Realty, Ltd. (Real estate management
& development) | | | 328,318 | | | | | 1,093 | |
| | | | | | | | | | 26,257 | |
| | | | | | | | |
| | | | | | | | |
| | Issuer | | Shares | | | Value | |
| | | | | | | | | | | |
| | Common Stocks—(continued) | | | | | | | | | |
| | | | | | | | | | | |
| | Emerging Asia—(continued) | | | | | | | | | |
| | | | | | | | | | | |
| | Indonesia—0.5% | | | | | | | | | |
| | PT Ace Hardware Indonesia Tbk (Specialty
retail) | | | 26,233,000 | | | | $ | 1,956 | |
| | PT Mitra Adiperkasa Tbk (Multiline retail) | | | 2,160,500 | | | | | 1,524 | |
| | | | | | | | | | 3,480 | |
| | | | | | | | | | | |
| | Malaysia—0.4% | | | | | | | | | |
| | Hartalega Holdings Bhd (Health care
equipment & supplies) | | | 986,300 | | | | | 1,998 | |
| | Silverlake Axis, Ltd. (Software) | | | 2,304,000 | | | | | 1,354 | |
| | | | | | | | | | 3,352 | |
| | | | | | | | | | | |
| | South Korea—0.9% | | | | | | | | | |
| * | Cheil Worldwide, Inc. (Media) | | | 328,150 | | | | | 7,068 | |
| | | | | | | | | | | |
| | Taiwan—2.6% | | | | | | | | | |
| | Chipbond Technology Corporation
(Semiconductors & semiconductor
equipment) | | | 1,827,527 | | | | | 4,482 | |
| | Eclat Textile Co., Ltd. (Textiles, apparel &
luxury goods) | | | 511,000 | | | | | 3,776 | |
| | Novatek Microelectronics Corporation
(Semiconductors & semiconductor
equipment) | | | 2,417,000 | | | | | 11,734 | |
| | | | | | | | | | 19,992 | |
| | | | | | | | | | | |
| | Asia—7.8% | | | | | | | | | |
| | | | | | | | | | | |
| | Australia—4.0% | | | | | | | | | |
| | carsales.com, Ltd. (Internet software &
services) | | | 1,054,661 | | | | | 9,096 | |
| | Domino’s Pizza Enterprises, Ltd. (Hotels,
restaurants & leisure) | | | 190,884 | | | | | 1,950 | |
| | DuluxGroup, Ltd. (Chemicals) | | | 1,657,035 | | | | | 6,380 | |
| | FlexiGroup, Ltd. (Consumer finance) | | | 874,056 | | | | | 3,485 | |
| | Super Retail Group, Ltd. (Specialty retail) | | | 908,115 | | | | | 9,941 | |
| | | | | | | | | | 30,852 | |
| | | | | | | | | | | |
| | Hong Kong—1.3% | | | | | | | | | |
| | Sa Sa International Holdings, Ltd. (Specialty
retail) | | | 3,608,000 | | | | | 3,582 | |
| | SmarTone Telecommunications Holdings, Ltd.
(Wireless telecommunication services) | | | 3,847,500 | | | | | 6,389 | |
| | | | | | | | | | 9,971 | |
| | | | | | | | | | | |
| | New Zealand—1.0% | | | | | | | | | |
| | Ryman Healthcare, Ltd. (Health care
providers & services) | | | 1,476,767 | | | | | 7,290 | |
| | | | | | | | | | | |
| | Singapore—1.5% | | | | | | | | | |
| | ARA Asset Management Ltd.—144A
(Capital markets) | | | 1,345,300 | | | | | 1,847 | |
| | First Resources, Ltd. (Food products) | | | 4,865,000 | | | | | 6,813 | |
| | SATS, Ltd. (Transportation infrastructure) | | | 1,160,000 | | | | | 3,011 | |
| | | | | | | | | | 11,671 | |
See accompanying Notes to Financial Statements.
| June 30, 2013 | William Blair Funds | 61 |
International Small Cap Growth Fund
Portfolio of Investments, June 30, 2013 (all dollar amounts in thousands) (unaudited)
| | Issuer | | Shares or
Principal
Amount | | | Value | |
| | | | | | | | | | | |
| | Common Stocks—(continued) | | | | | | | | | |
| | | | | | | | | | | |
| | Canada—4.5% | | | | | | | | | |
| | Canadian Energy Services & Technology
Corporation (Energy equipment &
services) | | | 423,357 | | | | $ | 6,574 | |
| * | Legacy Oil + Gas, Inc. (Oil, gas &
consumable fuels) | | | 1,312,910 | | | | | 6,180 | |
| | Precision Drilling Corporation (Energy
equipment & services) | | | 919,619 | | | | | 7,826 | |
| | Total Energy Services, Inc. (Energy
equipment & services) | | | 216,430 | | | | | 2,994 | |
| | Westjet Airlines, Ltd. (Airlines) | | | 521,374 | | | | | 11,164 | |
| | | | | | | | | | 34,738 | |
| | | | | | | | | | | |
| | Emerging Europe, Mid-East, Africa—1.4% | | | | | | | | | |
| | | | | | | | | | | |
| | Turkey—1.4% | | | | | | | | | |
| | Dogus Otomotiv Servis ve Ticaret A.S.
(Distributors) | | | 358,552 | | | | | 1,818 | |
| | Turkiye Sinai Kalkinma Bankasi A.S.
(Commercial banks) | | | 8,640,409 | | | | | 8,557 | |
| | | | | | | | | | 10,375 | |
| | | | | | | | | | | |
| | Emerging Latin America—0.3% | | | | | | | | | |
| | | | | | | | | | | |
| | Mexico—0.3% | | | | | | | | | |
| * | Macquarie Mexico Real Estate Management
S.A. de C.V.—144A (Real estate
investment trusts (REITs)) | | | 874,140 | | | | | 1,889 | |
| | | | | | | | | | | |
| | Total Common Stocks—98.2%
(cost $671,270) | | | | | | | | 753,375 | |
| | | | | | | | | | | |
| | Repurchase Agreement | | | | | | | | | |
| | Fixed Income Clearing Corporation, 0.010%
dated 6/28/13, due 7/1/13, repurchase
price $15,669, collateralized by FNMA,
0.875%, due 10/26/17 | | | $15,669 | | | | | 15,669 | |
| | | | | | | | | | | |
| | Total Repurchase Agreement—2.0%
(cost $15,669) | | | | | | | | 15,669 | |
| | | | | | | | | | | |
| | Total Investments—100.2%
(cost $686,939) | | | | | | | | 769,044 | |
| | Liabilities, plus cash and other assets—(0.2)% | | | | | | | | (1,835 | ) |
| | Net assets—100.0% | | | | | | | $ | 767,209 | |
* Non-income producing securities
For securities primarily traded on exchanges or markets that close before the close of regular trading on the New York Stock Exchange, the Fund may use an independent pricing service to fair value price the securities pursuant to Valuation Procedures approved by the Board of Trustees.
At June 30, 2013, the Fund’s Portfolio of Investments includes the following industry categories:
| Consumer Discretionary | | 25.3 | % |
| Information Technology | | 17.3 | % |
| Health Care | | 13.9 | % |
| Financials | | 12.9 | % |
| Industrials | | 10.5 | % |
| Materials | | 8.7 | % |
| Consumer Staples | | 6.1 | % |
| Energy | | 4.5 | % |
| Telecommunication Services | | 0.8 | % |
| Total | | 100.0 | % |
At June 30, 2013, the Fund’s Portfolio of Investments includes the following currency categories:
| British Pound Sterling | | 26.7 | % |
| Japanese Yen | | 20.6 | % |
| Euro | | 16.0 | % |
| Hong Kong Dollar | | 4.7 | % |
| Canadian Dollar | | 4.6 | % |
| Danish Krone | | 4.2 | % |
| Australian Dollar | | 4.1 | % |
| Swedish Krona | | 3.5 | % |
| Indian Rupee | | 3.5 | % |
| Norwegian Krone | | 2.7 | % |
| New Taiwan Dollar | | 2.6 | % |
| Singapore Dollar | | 1.7 | % |
| Turkish Lira | | 1.4 | % |
| All Other Currencies | | 3.7 | % |
| Total | | 100.0 | % |
See accompanying Notes to Financial Statements.
| 62 | Semi-Annual Report | June 30, 2013 |
| | EMERGING MARKETS GROWTH FUND |
| | |
| | The Emerging Markets Growth Fund seeks long-term capital appreciation. |
| | |
| | AN OVERVIEW FROM THE PORTFOLIO MANAGERS |
| | |

Todd M. McClone 
Jeffrey A. Urbina | The William Blair Emerging Markets Growth Fund (Class N shares) posted a 6.27% decrease, net of fees, for the six months ended June 30, 2013. By comparison, the Fund’s benchmark index, the MSCI Emerging Markets IMI Index (net) (the “Index”), decreased 8.89%. While the Fund outperformed the Index, it was down in absolute terms, given weakness in Emerging Markets in general during the period. This weakness was precipitated by lower demand for commodities, coupled with concerns of a structural slowdown in China and expectations of rising interest rates in the United States. The Fund’s performance relative to the Index was driven by strong performance across sectors and regions, coupled with overall sector positioning. In particular, the Fund’s Materials stocks added value year to date, due largely to the underweighting and stock selection in Metals/Mining, coupled with good results by Indocement Tunggal Prakarsa, the Indonesian cement company. Industrials stock selection was strong, as the Fund’s holdings were up 2.31%, well ahead of the -9.41% Index return. Low cost airlines added value, as did solid operating results from Industries Qatar and Haitian International Holdings. Consumer Staples and Financials stock selection were also additive to results. Somewhat detracting from year to date performance was Energy stock selection, particularly in Chinese Oil/Gas, as Shenhua Energy, CNOOC, and Kunlun underperformed. Regionally, Asian stock selection was bolstered by good relative performance in China, India, and Thailand, more than offsetting weakness in South Korea, particularly Hyundai Motors, which we sold on margin pressure and increasing competition. Europe, the Middle East and Africa benefited from frontier markets exposure in Qatar, UAE, Nigeria, and Kenya, coupled with good stock selection in Russia and South Africa. The Fund’s focus on companies with above average earnings trends and positive price momentum added value year to date, offsetting the higher quality focus and higher valuation, which hampered results. Consumer Discretionary and Consumer Staples each represented approximately 12% of the Fund, ahead of the Index weightings, while Information Technology totaled 19.6% of the Fund, above the 14.8% Index weighting. Conversely, Resources were significantly underweighted, as Energy represented approximately 5% of the Fund, half the Index weighting, and Materials totaled 2.0% of the Fund, well below the 9.8% Index weighting. Regionally, the Fund remained underweighted in Asia, due largely to underweighting in Taiwan and Korea, which more than offset the India overweighting. EMEA increased to 19.5% of the Fund, despite underweightings in Europe and Russia, due largely to 5.3% exposure in Middle East and African frontier markets. |
| June 30, 2013 | William Blair Funds | 63 |
Emerging Markets Growth Fund
Performance Highlights (Unaudited)
| Average Annual Total Return at 6/30/2013 |
| | | Year
to Date | | 1 Year | | 3 Year | | 5 Year | | Since
Inception(a) |
| Class N | | | (6.27 | )% | | | 5.66 | % | | | 6.46 | % | | | (1.87 | )% | | | 9.51 | % |
| Class I | | | (6.07 | ) | | | 5.93 | | | | 6.78 | | | | (1.60 | ) | | | 9.80 | |
| Institutional Class | | | (6.03 | ) | | | 6.18 | | | | 6.98 | | | | (1.43 | ) | | | 9.98 | |
MSCI Emerging
Markets IMI
(net) | | | (8.89 | ) | | | 3.66 | | | | 3.43 | | | | 0.16 | | | | 9.49 | |
| (a) | For the period from June 6, 2005 (Commencement of Operations) to June 30, 2013. |
Performance cited represents past performance. Past performance does not guarantee future results and current performance may be lower or higher than the data quoted. Results shown are average annual returns, which assume reinvestment of dividends and capital gains. Investment returns and principal will fluctuate and you may have a gain or loss when you sell shares. For the most current month-end performance information, please call 1-800-742-7272, or visit our Web site at www.williamblairfunds.com. From time to time, the investment advisor may waive fees or reimburse expenses for the Fund. Without these waivers, performance would be lower. International investing involves special risk considerations, including currency fluctuations, lower liquidity, economic and political risk. Class N shares are available to the general public without a sales load. Class I shares are available to certain institutional investors and advisory clients of William Blair & Company L.L.C. without a sales load or distribution (12b-1) fees. Institutional Class Shares are available to institutional investors without a sales load or distribution (12b-1) or service fees.
The performance highlights and graph presented above do not reflect the deduction of taxes that a shareholder would pay on fund distributions or the redemption of fund shares.
The Morgan Stanley Capital International (MSCI) Emerging Markets Investable Market Index (IMI) (net) is a free float-adjusted market capitalization weighted index that is designed to measure the equity market performance of emerging markets. This series approximates the minimum possible dividend reinvestment.
This report identifies the Fund’s investments on June 30, 2013. These holdings are subject to change. Not all stocks in the Fund performed the same, nor is there any guarantee that these stocks will perform as well in the future. Market forecasts provided in this report may not necessarily come to pass.
Sector Diversification (Unaudited)
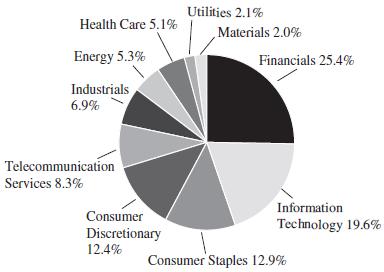
The sector diversification shown is based on the total long-term securities.
| 64 | Semi-Annual Report | June 30, 2013 |
Emerging Markets Growth Fund
Portfolio of Investments, June 30, 2013 (all dollar amounts in thousands) (unaudited)
| | Issuer | | Shares | | | Value | |
| | | | | | | | | | | |
| | Common Stocks | | | | | | | | | |
| | | | | | | | | | | |
| | Emerging Asia—53.8% | | | | | | | | | |
| | | | | | | | | | | |
| | Cambodia—0.3% | | | | | | | | | |
| | NagaCorp, Ltd. (Hotels, restaurants &
leisure) | | | 2,874,000 | | | | $ | 2,242 | |
| | | | | | | | | | | |
| | China—17.4% | | | | | | | | | |
| | AAC Technologies Holdings, Inc.
(Communications equipment) | | | 767,959 | | | | | 4,337 | |
| | Biostime International Holdings, Ltd.
(Food products) | | | 299,000 | | | | | 1,677 | |
| | China BlueChemical, Ltd. (Chemicals) | | | 3,590,609 | | | | | 2,194 | |
| | China Mobile, Ltd. (Wireless
telecommunication services) | | | 2,570,309 | | | | | 26,843 | |
| | China Overseas Grand Oceans Group, Ltd.
(Real estate management & development) | | | 1,642,000 | | | | | 2,096 | |
| | China Overseas Land & Investment, Ltd.
(Real estate management & development) | | | 5,102,000 | | | | | 13,386 | |
| | China Unicom Hong Kong, Ltd.
(Diversified telecommunication services) | | | 10,364,000 | | | | | 13,763 | |
| | Dongyue Group (Chemicals) | | | 3,907,287 | | | | | 1,562 | |
| | ENN Energy Holdings, Ltd. (Gas utilities) | | | 1,744,000 | | | | | 9,298 | |
| | Haier Electronics Group Co., Ltd.
(Household durables) | | | 5,489,000 | | | | | 8,747 | |
| | Haitian International Holdings, Ltd.
(Machinery) | | | 2,315,870 | | | | | 3,386 | |
| | Kunlun Energy Co., Ltd. (Oil, gas &
consumable fuels) | | | 7,518,000 | | | | | 13,338 | |
| | Shenzhou International Group Holdings,
Ltd. (Textiles, apparel & luxury goods) | | | 667,000 | | | | | 1,918 | |
| | Sino Biopharmaceutical (Pharmaceuticals) | | | 3,796,000 | | | | | 2,462 | |
| | Sun Art Retail Group, Ltd. (Food & staples
retailing) | | | 5,387,245 | | | | | 7,793 | |
| | Sunny Optical Technology Group Co., Ltd.
(Electronic equipment, instruments &
components) | | | 1,719,000 | | | | | 2,074 | |
| | Tencent Holdings, Ltd. (Internet software &
services) | | | 702,835 | | | | | 27,566 | |
| | Want Want China Holdings, Ltd. (Food
products) | | | 6,612,217 | | | | | 9,311 | |
| * | WuXi PharmaTech Cayman, Inc.—ADR
(Life sciences tools & services) | | | 143,757 | | | | | 3,019 | |
| | | | | | | | | | 154,770 | |
| | | | | | | | | | | |
| | India—15.3% | | | | | | | | | |
| | Apollo Hospitals Enterprise, Ltd. (Health
care providers & services) | | | 154,479 | | | | | 2,739 | |
| | Bajaj Auto, Ltd. (Automobiles) | | | 226,153 | | | | | 7,322 | |
| | HCL Technologies, Ltd. (IT services) | | | 990,957 | | | | | 12,940 | |
| | HDFC Bank, Ltd. (Commercial banks) | | | 828,401 | | | | | 9,333 | |
| | Housing Development Finance Corporation
(Thrifts & mortgage finance) | | | 1,063,733 | | | | | 15,735 | |
| | IndusInd Bank, Ltd. (Commercial banks) | | | 650,266 | | | | | 5,115 | |
| | ITC, Ltd. (Tobacco) | | | 3,985,041 | | | | | 21,751 | |
| | Lupin, Ltd. (Pharmaceuticals) | | | 559,430 | | | | | 7,357 | |
| | Marico, Ltd. (Personal products) | | | 567,382 | | | | | 1,983 | |
| | Issuer | | Shares | | | Value | |
| | | | | | | | | | | |
| | Common Stocks—(continued) | | | | | | | | | |
| | | | | | | | | | | |
| | Emerging Asia—(continued) | | | | | | | | | |
| | | | | | | | | | | |
| | India—(continued) | | | | | | | | | |
| | Motherson Sumi Systems, Ltd. (Auto
components) | | | 1,011,710 | | | | $ | 3,375 | |
| | Sun Pharmaceutical Industries, Ltd.
(Pharmaceuticals) | | | 713,243 | | | | | 12,141 | |
| | Tata Consultancy Services, Ltd. (IT services) | | | 518,104 | | | | | 13,236 | |
| | Tata Motors, Ltd. (Automobiles) | | | 4,501,204 | | | | | 21,307 | |
| | Yes Bank, Ltd. (Commercial banks) | | | 273,097 | | | | | 2,119 | |
| | | | | | | | | | 136,453 | |
| | | | | | | | | | | |
| | Indonesia—3.4% | | | | | | | | | |
| | PT Bank Rakyat Indonesia Persero Tbk
(Commercial banks) | | | 12,047,321 | | | | | 9,407 | |
| | PT Indocement Tunggal Prakarsa Tbk
(Construction materials) | | | 1,795,500 | | | | | 4,423 | |
| | PT Jasa Marga Persero Tbk (Transportation
infrastructure) | | | 3,771,000 | | | | | 2,299 | |
| | PT Kalbe Farma Tbk (Pharmaceuticals) | | | 17,712,915 | | | | | 2,570 | |
| * | PT Matahari Department Store Tbk
(Multiline retail) | | | 2,078,000 | | | | | 2,429 | |
| | PT Telekomunikasi Indonesia Persero Tbk
(Diversified telecommunication services) | | | 8,042,000 | | | | | 9,115 | |
| | | | | | | | | | 30,243 | |
| | | | | | | | | | | |
| | Malaysia—2.7% | | | | | | | | | |
| | CIMB Group Holdings Bhd (Commercial
banks) | | | 6,379,787 | | | | | 16,720 | |
| | Guinness Anchor Bhd (Beverages) | | | 331,400 | | | | | 1,999 | |
| * | IHH Healthcare Bhd (Health care providers
& services) | | | 4,520,000 | | | | | 5,651 | |
| | | | | | | | | | 24,370 | |
| | | | | | | | | | | |
| | Papua New Guinea—1.0% | | | | | | | | | |
| | Oil Search, Ltd. (Oil, gas & consumable
fuels) | | | 1,299,864 | | | | | 9,189 | |
| | | | | | | | | | | |
| | Philippines—1.1% | | | | | | | | | |
| | SM Prime Holdings, Inc. (Real estate
management & development) | | | 18,287,700 | | | | | 6,900 | |
| | Universal Robina Corporation (Food
products) | | | 1,069,710 | | | | | 3,096 | |
| | | | | | | | | | 9,996 | |
| | | | | | | | | | | |
| | South Korea—5.0% | | | | | | | | | |
| * | Cheil Worldwide, Inc. (Media) | | | 105,200 | | | | | 2,266 | |
| | GS Home Shopping, Inc. (Internet &
catalog retail) | | | 10,945 | | | | | 2,267 | |
| | Hana Tour Service, Inc. (Hotels, restaurants
& leisure) | | | 36,196 | | | | | 2,279 | |
| | LG Household & Health Care, Ltd.
(Household products) | | | 4,622 | | | | | 2,258 | |
| | Samsung Electronics Co., Ltd.
(Semiconductors & semiconductor
equipment) | | | 29,840 | | | | | 35,064 | |
| | | | | | | | | | 44,134 | |
See accompanying Notes to Financial Statements.
| June 30, 2013 | | William Blair Funds | 65 |
Emerging Markets Growth Fund
Portfolio of Investments, June 30, 2013 (all dollar amounts in thousands) (unaudited)
| | Issuer | | Shares | | | Value | |
| | | | | | | | | | | |
| | Common Stocks—(continued) | | | | | | | | | |
| | | | | | | | | | | |
| | Emerging Asia—(continued) | | | | | | | | | |
| | | | | | | | | | | |
| | Taiwan—5.1% | | | | | | | | | |
| | Asustek Computer, Inc. (Computers &
peripherals) | | | 941,000 | | | | $ | 8,100 | |
| | Novatek Microelectronics Corporation
(Semiconductors & semiconductor
equipment) | | | 693,000 | | | | | 3,364 | |
| | Taiwan Semiconductor Manufacturing Co.,
Ltd.—ADR (Semiconductors &
semiconductor equipment) | | | 1,647,918 | | | | | 30,190 | |
| | TPK Holding Co., Ltd. (Electronic
equipment, instruments & components) | | | 251,979 | | | | | 4,036 | |
| | | | | | | | | | 45,690 | |
| | | | | | | | | | | |
| | Thailand—2.5% | | | | | | | | | |
| | Advanced Info Service PCL (Wireless
telecommunication services) | | | 836,262 | | | | | 7,603 | |
| | Bangkok Dusit Medical Services PCL
(Health care providers & services) | | | 472,000 | | | | | 2,397 | |
| | BEC World PCL (Media) | | | 1,113,300 | | | | | 2,109 | |
| | Kasikornbank PCL (Commercial banks) | | | 1,598,182 | | | | | 10,100 | |
| | | | | | | | | | 22,209 | |
| | | | | | | | | | | |
| | Emerging Europe, Mid-East, Africa—19.5% | | | | |
| | | | | | | | | | | |
| | Kenya—0.1% | | | | | | | | | |
| | Safaricom, Ltd. (Wireless
telecommunication services) | | | 15,213,800 | | | | | 1,170 | |
| | | | | | | | | | | |
| | Nigeria—1.2% | | | | | | | | | |
| | Guaranty Trust Bank plc (Commercial
banks) | | | 40,269,497 | | | | | 6,021 | |
| | Nestle Nigeria plc (Food products) | | | 344,565 | | | | | 2,056 | |
| | Nigerian Breweries plc (Beverages) | | | 2,375,731 | | | | | 2,282 | |
| | | | | | | | | | 10,359 | |
| | | | | | | | | | | |
| | Poland—0.4% | | | | | | | | | |
| | Eurocash S.A. (Food & staples retailing) | | | 220,047 | | | | | 3,888 | |
| | | | | | | | | | | |
| | Qatar—2.3% | | | | | | | | | |
| | Industries Qatar QSC (Industrial
conglomerates) | | | 406,490 | | | | | 17,698 | |
| | Qatar National Bank S.A.Q. (Commercial
banks) | | | 59,840 | | | | | 2,613 | |
| | | | | | | | | | 20,311 | |
| | | | | | | | | | | |
| | Russia—4.0% | | | | | | | | | |
| * | Etalon Group Ltd.—144A—GDR (Real
estate management & development) | | | 448,600 | | | | | 1,539 | |
| | M Video OJSC (Specialty retail) | | | 278,070 | | | | | 2,014 | |
| | Magnit OJSC (Food & staples retailing)† | | | 64,131 | | | | | 14,756 | |
| | Mail.ru Group Ltd.—144A—GDR (Internet
software & services)† | | | 28,376 | | | | | 813 | |
| | Mail.ru Group, Ltd.—GDR (Internet
software & services) | | | 74,481 | | | | | 2,135 | |
| * | Yandex N.V. Class “A” (Internet software &
services)† | | | 517,514 | | | | | 14,299 | |
| | | | | | | | | | 35,556 | |
| | Issuer | | Shares | | | Value | |
| | | | | | | | | | | |
| | Common Stocks—(continued) | | | | | | | | | |
| | | | | | | | | | | |
| | Emerging Europe, Mid-East, Africa—(continued) | | |
| | | | | | | | | | | |
| | South Africa—6.9% | | | | | | | | | |
| | Bidvest Group, Ltd. (Industrial
conglomerates) | | | 285,076 | | | | $ | 7,064 | |
| | Discovery, Ltd. (Insurance) | | | 329,789 | | | | | 2,804 | |
| | FirstRand, Ltd. (Diversified financial
services) | | | 3,406,500 | | | | | 9,970 | |
| | Life Healthcare Group Holdings, Ltd.
(Health care providers & services) | | | 634,643 | | | | | 2,408 | |
| | Mr. Price Group, Ltd. (Specialty retail) | | | 233,156 | | | | | 3,177 | |
| | MTN Group, Ltd. (Wireless
telecommunication services) | | | 633,027 | | | | | 11,783 | |
| | Naspers, Ltd. (Media) | | | 236,721 | | | | | 17,481 | |
| | Shoprite Holdings, Ltd. (Food & staples
retailing) | | | 370,345 | | | | | 6,950 | |
| | | | | | | | | | 61,637 | |
| | | | | | | | | | | |
| | Turkey—2.9% | | | | | | | | | |
| | Coca-Cola Icecek A.S. (Beverages) | | | 217,949 | | | | | 6,272 | |
| * | Pegasus Hava Tasimaciligi A.S. (Airlines) | | | 233,156 | | | | | 2,768 | |
| | Tofas Turk Otomobil Fabrikasi A.S.
(Automobiles) | | | 786,224 | | | | | 4,912 | |
| | Turkiye Halk Bankasi A.S. (Commercial
banks) | | | 1,384,825 | | | | | 11,740 | |
| | | | | | | | | | 25,692 | |
| | | | | | | | | | | |
| | United Arab Emirates—1.7% | | | | | | | | | |
| | Dragon Oil plc (Oil, gas & consumable
fuels) | | | 491,246 | | | | | 4,277 | |
| | First Gulf Bank PJSC (Commercial banks) | | | 2,402,721 | | | | | 10,434 | |
| | | | | | | | | | 14,711 | |
| | | | | | | | | | | |
| | Emerging Latin America—19.4% | | | | | | | | | |
| | | | | | | | | | | |
| | Argentina—0.3% | | | | | | | | | |
| | MercadoLibre, Inc. (Internet software &
services) | | | 27,576 | | | | | 2,972 | |
| | | | | | | | | | | |
| | Brazil—8.8% | | | | | | | | | |
| * | BB Seguridade Participacoes S.A. (Insurance) | | | 1,662,300 | | | | | 13,112 | |
| | BR Malls Participacoes S.A. (Real estate
management & development) | | | 466,890 | | | | | 4,181 | |
| | CCR S.A (Transportation infrastructure) | | | 1,177,489 | | | | | 9,340 | |
| | Cia de Bebidas das Americas—ADR
(Beverages) | | | 472,321 | | | | | 17,641 | |
| | Embraer S.A.—ADR (Aerospace & defense) | | | 237,821 | | | | | 8,773 | |
| | Grendene S.A. (Textiles, apparel & luxury
goods) | | | 213,900 | | | | | 1,942 | |
| | Iguatemi Empresa de Shopping Centers S.A.
(Real estate management & development) | | | 205,200 | | | | | 2,021 | |
| | Iochpe-Maxion S.A. (Machinery) | | | 30,800 | | | | | 332 | |
| | Kroton Educacional S.A. (Diversified
consumer services) | | | 302,680 | | | | | 4,192 | |
| | Localiza Rent a Car S.A. (Road & rail) | | | 188,510 | | | | | 2,670 | |
| | Lojas Renner S.A. (Multiline retail) | | | 107,722 | | | | | 3,087 | |
| | Totvs S.A. (Software) | | | 146,232 | | | | | 2,293 | |
| | Tractebel Energia S.A. (Independent power
producers & energy traders) | | | 551,538 | | | | | 8,570 | |
| | | | | | | | | | 78,154 | |
See accompanying Notes to Financial Statements.
| 66 | Semi-Annual Report | June 30, 2013 |
Emerging Markets Growth Fund
Portfolio of Investments, June 30, 2013 (all dollar amounts in thousands) (unaudited)
| | Issuer | | Shares | | | Value | |
| | | | | | | | | | | |
| | Common Stocks—(continued) | | | | | | | | | |
| | | | | | | | | | | |
| | Emerging Latin America—19.4% | | | | | | | | | |
| | | | | | | | | | | |
| | Chile—2.0% | | | | | | | | | |
| | Banco Santander Chile—ADR (Commercial
banks) | | | 107,230 | | | | $ | 2,622 | |
| | CFR Pharmaceuticals S.A. (Pharmaceuticals) | | | 9,180,599 | | | | | 2,073 | |
| | Inversiones La Construccion S.A.
(Diversified financial services) | | | 170,487 | | | | | 2,611 | |
| | S.A.C.I. Falabella (Multiline retail) | | | 718,000 | | | | | 7,773 | |
| | Sonda S.A. (IT services) | | | 902,353 | | | | | 2,628 | |
| | | | | | | | | | 17,707 | |
| | | | | | | | | | | |
| | Colombia—2.0% | | | | | | | | | |
| | Ecopetrol S.A. (Oil, gas & consumable fuels) | | | 3,456,625 | | | | | 7,339 | |
| | Pacific Rubiales Energy Corporation (Oil,
gas & consumable fuels) | | | 601,269 | | | | | 10,559 | |
| | | | | | | | | | 17,898 | |
| | | | | | | | | | | |
| | Mexico—4.6% | | | | | | | | | |
| | Fibra Uno Administracion S.A. de C.V.
(Real estate investment trusts (REITs)) | | | 1,818,769 | | | | | 6,107 | |
| | Fomento Economico Mexicano S.A.B. de
C.V.—ADR (Beverages) | | | 44,841 | | | | | 4,627 | |
| | Grupo Financiero Banorte S.A.B. de C.V.
(Commercial banks) | | | 2,801,210 | | | | | 16,733 | |
| | Grupo Mexico S.A.B. de C.V. Series “B”
(Metals & mining) | | | 3,009,067 | | | | | 8,709 | |
| | Grupo Sanborns S.A. de C.V. (Multiline
retail) | | | 2,008,600 | | | | | 4,483 | |
| | | | | | | | | | 40,659 | |
| | | | | | | | | | | |
| | Panama—0.4% | | | | | | | | | |
| | Copa Holdings S.A. Class “A” (Airlines)† | | | 28,320 | | | | | 3,713 | |
| | | | | | | | | | | |
| | Peru—1.3% | | | | | | | | | |
| | Credicorp, Ltd. (Commercial banks)† | | | 74,469 | | | | | 9,529 | |
| | Intercorp Financial Services, Inc.
(Diversified financial services) | | | 68,646 | | | | | 2,265 | |
| | | | | | | | | | 11,794 | |
| | | | | | | | | | | |
| | Total Common Stocks—92.7%
(cost $793,867) | | | | | | | | 825,517 | |
| | | | | | | | | | | |
| | Preferred Stock | | | | | | | | | |
| | | | | | | | | | | |
| | Brazil—2.3% | | | | | | | | | |
| | Itau Unibanco Holding S.A. (Commercial
banks) | | | 1,625,385 | | | | | 20,957 | |
| | | | | | | | | | | |
| | Total Preferred Stock—2.3%
(cost $23,239) | | | | | | | | 20,957 | |
| | | | | | | | | | | |
| | Affiliated Fund | | | | | | | | | |
| | | | | | | | | | | |
| | China—2.7% | | | | | | | | | |
| | William Blair China A-Share Fund, LLC | | | 2,362,400 | | | | | 24,474 | |
| | | | | | | | | | | |
| | Total Affiliated Fund—2.7%
(cost $23,624) | | | | | | | | 24,474 | |
| | Issuer | | Principal
Amount | | | Value | |
| | | | | | | | | | | |
| | Repurchase Agreement | | | | | | | | | |
| | Fixed Income Clearing Corporation, 0.010%
dated 6/28/13, due 7/1/13, repurchase
price $8,594, collateralized by FNMA,
1.160%, due 6/28/17 | | | $8,594 | | | | $ | 8,594 | |
| | | | | | | | | | | |
| | Total Repurchase Agreement—1.0%
(cost $8,594) | | | | | | | | 8,594 | |
| | | | | | | | | | | |
| | Total Investments—98.7%
(cost $849,324) | | | | | | | | 879,542 | |
| | Cash and other assets, less liabilities—1.3% | | | | | | | | 11,339 | |
| | Net assets—100.0% | | | | | | | $ | 890,881 | |
ADR = American Depository Receipt
GDR = Global Depository Receipt
* Non-income producing securities
† = U.S. listed foreign security
See accompanying Notes to Financial Statements.
| June 30, 2013 | William Blair Funds | 67 |
Emerging Markets Growth Fund
Portfolio of Investments, June 30, 2013 (all dollar amounts in thousands) (unaudited)
For securities primarily traded on exchanges or markets that close before the close of regular trading on the New York Stock Exchange, the Fund may use an independent pricing service to fair value price the securities pursuant to Valuation Procedures approved by the Board of Trustees.
At June 30, 2013, the Fund’s Portfolio of Investments includes the following industry categories:
| Financials | | | 25.4 | % |
| Information Technology | | | 19.6 | % |
| Consumer Staples | | | 12.9 | % |
| Consumer Discretionary | | | 12.4 | % |
| Telecommunication Services | | | 8.3 | % |
| Industrials | | | 6.9 | % |
| Energy | | | 5.3 | % |
| Health Care | | | 5.1 | % |
| Utilities | | | 2.1 | % |
| Materials | | | 2.0 | % |
| Total | | | 100.0 | % |
At June 30, 2013, the Fund’s Portfolio of Investments includes the following currency categories:
| Hong Kong Dollar | | | 18.0 | % |
| U.S. Dollar | | | 16.2 | % |
| Indian Rupee | | | 15.7 | % |
| Brazilian Real | | | 8.3 | % |
| South African Rand | | | 7.1 | % |
| South Korean Won | | | 5.1 | % |
| Mexican Peso | | | 4.1 | % |
| Indonesian Rupiah | | | 3.5 | % |
| Turkish Lira | | | 2.9 | % |
| Malaysian Ringgit | | | 2.8 | % |
| Thai Baht | | | 2.6 | % |
| Qatari Rial | | | 2.3 | % |
| New Taiwan Dollar | | | 1.8 | % |
| Chilean Peso | | | 1.7 | % |
| Canadian Dollar | | | 1.2 | % |
| UAE Dirham | | | 1.2 | % |
| Nigerian Naira | | | 1.2 | % |
| Philippine Peso | | | 1.1 | % |
| Australian Dollar | | | 1.1 | % |
| All Other Currencies | | | 2.1 | % |
| Total | | | 100.0 | % |
As of June 30, 2013 the Fund invested in William Blair China A-Share Fund, LLC, an affiliated fund. There are no unfunded commitments to the affiliated fund and the Fund may redeem its investment monthly.
| | | | Shares Activity Affiliated with China A-Share Fund | | | Period Ended June 30, 2013 |
| | | | | | | | | | | | | | | | (in thousands) |
| Fund Name | | | Balance
12/31/2012 | | | | Purchases | | | | Sales | | | | Balance
6/30/2013 | | | | Value | |
| William Blair China A-Share Fund, LLC | | | 2,362,400 | | | | — | | | | — | | | | 2,362,400 | | | | $24,474 | |
| | | | | | | | | | | | | | | | | | | | $24,474 | |
Affiliated Funds accounted for $850 of change in net unrealized depreciation on investments during the period.
See accompanying Notes to Financial Statements.
| 68 | Semi-Annual Report | June 30, 2013 |
| | EMERGING MARKETS LEADERS FUND |
| | |
| | The Emerging Markets Leaders Fund seeks long-term capital appreciation. |
| | |
| | AN OVERVIEW FROM THE PORTFOLIO MANAGERS |
| | |

Todd M. McClone 
Jeffrey A. Urbina | The William Blair Emerging Markets Leaders Fund (Class N shares) posted a 7.50% decrease, net of fees, for the six months ended June 30, 2013. By comparison, the Fund’s benchmark index, the MSCI Emerging Markets Index (net) decreased 9.57%. While the Fund outperformed the Index it was down in absolute terms, given weakness in Emerging Markets in general during the period. This weakness was precipitated by lower demand for commodities, coupled with concerns of a structural slowdown in China and expectations of rising interest rates in the United States. The Fund’s performance relative to the Index resulted from strong stock selection across most sectors, coupled with overall sector positioning. The Fund’s focus on Healthcare and Staples at the expense of Materials and Energy added value. In addition, the Fund’s Industrials stocks were up 0.3%, well above the -10% Index return, due largely to a lack of Machinery holdings. Within Materials, performance benefited from an underweighting in Metals/Mining. In addition, Grupo Mexico outpaced the Mining industry as a whole during the period. The Fund’s Healthcare stocks rose 19.6%, well ahead of the 2% Index return, given strong performance by Sun Pharmaceutical and IHH Healthcare. Detracting from results was the Fund’s Energy stock selection, as oil/gas holdings underperformed. Regionally, stock selection added value across all regions, with particular value added in Europe, the Middle East and Africa, and Latin America. In EMEA, strong performance by stocks held in Qatar and the UAE (frontier markets) added value, as did strong stock selection in Russia and South Africa, given the lack of Resources exposure. Within Latin America, strong performance in Brazil and Chile more than offset weakness in Resource-oriented holdings (Ecopetrol and Pacific Rubiales) in the region. While overall positioning did not change substantially, we reduced Financials from approximately 30% to 29%, due to a reduction in Commercial Banks, which more than offset additional weightings in Insurance names. This reduction funded an increase in Industrials to 8.7%, above the 6.3% Index weighting. We also reduced Resources on continued concerns about slowing demand and stagnating prices. Regionally, EMEA increased from approximately 17% to 19.8%, above the 17.2% Index weighting, due largely to a 4.7% weighting in frontier countries, coupled with increased exposure in South African consumer and financials-related holdings. While Latin America was slightly overweighted versus the Index, Emerging Asia totaled 53.5%, and remained significantly underweighted versus the Index, given lower weightings in Korea and Taiwan, which more than offset the higher India exposure. |
| June 30, 2013 | William Blair Funds | 69 |
Emerging Markets Leaders Fund
Performance Highlights (Unaudited)
| Average Annual Total Return at 6/30/2013 |
| | | Year
to Date | | 1 Year | | 3 Year | | 5 Year | | Since
Inception |
| Class N(b) | | | (7.50 | )% | | | 4.15 | % | | | 4.16 | % | | | — | | | | 1.88 | % |
| Class I(a) | | | (7.41 | ) | | | 4.47 | | | | 4.38 | | | | (0.22 | ) | | | (0.92 | ) |
| Institutional Class(a) | | | (7.41 | ) | | | 4.63 | | | | 4.54 | | | | (0.10 | ) | | | (0.78 | ) |
MSCI
Emerging Markets
Index (net)(a) | | | (9.57 | ) | | | 2.87 | | | | 3.38 | | | | (0.43 | ) | | | (0.62 | ) |
MSCI
Emerging Markets
Large Cap Index
(net)(a) | | | (9.65 | ) | | | 2.73 | | | | 3.54 | | | | (0.82 | ) | | | (0.73 | ) |
| (a) | Since Inception is for the period from March 26, 2008 (Commencement of Operations) to June 30, 2013. |
| (b) | Since Inception for Class N is for the period from May 3, 2010 (Commencement of Operations) to June 30, 2013. The corresponding benchmark inception returns for the MSCI Emerging Index (net) and the MSCI Emerging Markets Large Cap Index (net) are 0.36% and 0.42%, respectively. |
Performance cited represents past performance. Past performance does not guarantee future results and current performance may be lower or higher than the data quoted. Results shown are average annual total returns, which assume reinvestment of dividends and capital gains. Investment returns and principal will fluctuate and you may have a gain or loss when you sell shares. For the most current month-end performance information, please call 1-800-742-7272, or visit our Web site at www.williamblairfunds.com. International investing involves special risk considerations, including currency fluctuations, lower liquidity, economic and political risk. From time to time, the investment advisor may waive fees or reimburse expenses for the Fund. Without these waivers, performance would be lower. Class N shares are available to the general public without a sales load. Class I shares are available to certain institutional investors and advisory clients of William Blair & Company, L.L.C., without a sales load or distribution (12b-1) fees. Institutional Class Shares are available to institutional investors without a sales load or distribution (12b-1) or service fees.
The performance highlights and graph presented above do not reflect the deduction of taxes that a shareholder would pay on fund distributions or the redemption of fund shares.
The Morgan Stanley Capital International (MSCI) Emerging Markets Index (net) is a free float-adjusted market-capitalization-weighted index that is designed to measure equity market performance of emerging markets. This series approximates the minimum possible dividend reinvestment.
The Morgan Stanley Capital International (MSCI) Emerging Markets Large Cap Index (net) is a free float-adjusted market capitalization weighted index that is designed to measure market performance of large capitalization stocks in emerging markets. This series approximates the minimum possible dividend reinvestment.
On December 31, 2012, the Fund’s Benchmark changed from the Morgan Stanley Capital International (MSCI) Emerging Markets Large Cap Index (net) to the Morgan Stanley Capital International (MSCI) Emerging Markets Index (net). The primary reason for this change is to compare the Fund to a benchmark that more closely reflects the market capitalization focus the Fund uses in its investment strategy.
This report identifies the Fund’s investments on June 30, 2013. These holdings are subject to change. Not all stocks in the Fund performed the same, nor is there any guarantee that these stocks will perform as well in the future. Market forecasts provided in this report may not necessarily come to pass.
Sector Diversification (Unaudited)
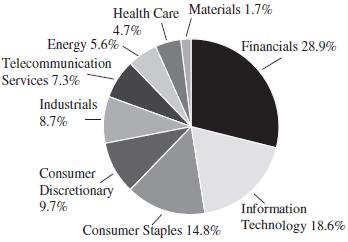
The sector diversification shown is based on the total long-term securities.
| 70 | Semi-Annual Report | June 30, 2013 |
Emerging Markets Leaders Fund
Portfolio of Investments, June 30, 2013 (all dollar amounts in thousands) (unaudited)
| | | | | | | | |
| | | | | | | | |
| | Issuer | | Shares | | | Value | |
| | | | | | | | | | | |
| | Common Stocks | | | | | | | | | |
| | | | | | | | | | | |
| | Emerging Asia—53.5% | | | | | | | | | |
| | | | | | | | | | | |
| | China—17.4% | | | | | | | | | |
| | China Mobile, Ltd. (Wireless
telecommunication services) | | | 156,500 | | | | $ | 1,634 | |
| | China Overseas Land & Investment, Ltd.
(Real estate management & development) | | | 634,000 | | | | | 1,663 | |
| | China Unicom Hong Kong, Ltd. (Diversified
telecommunication services) | | | 906,000 | | | | | 1,203 | |
| | Great Wall Motor Co., Ltd. Class “H”
(Automobiles) | | | 286,500 | | | | | 1,236 | |
| | Kunlun Energy Co., Ltd. (Oil, gas &
consumable fuels) | | | 818,000 | | | | | 1,451 | |
| | Sun Art Retail Group, Ltd. (Food & staples
retailing) | | | 445,500 | | | | | 645 | |
| | Tencent Holdings, Ltd. (Internet software &
services) | | | 47,700 | | | | | 1,871 | |
| | Want Want China Holdings, Ltd. (Food
products) | | | 677,000 | | | | | 953 | |
| | | | | | | | | | 10,656 | |
| | | | | | | | | | | |
| | India—14.8% | | | | | | | | | |
| | Bajaj Auto, Ltd. (Automobiles) | | | 24,311 | | | | | 787 | |
| | HCL Technologies, Ltd. (IT services) | | | 115,477 | | | | | 1,508 | |
| | HDFC Bank, Ltd. (Commercial banks) | | | 55,042 | | | | | 620 | |
| | Housing Development Finance Corporation
(Thrifts & mortgage finance) | | | 99,909 | | | | | 1,478 | |
| | ITC, Ltd. (Tobacco) | | | 233,908 | | | | | 1,277 | |
| | Lupin, Ltd. (Pharmaceuticals) | | | 37,040 | | | | | 487 | |
| | Sun Pharmaceutical Industries, Ltd.
(Pharmaceuticals) | | | 68,613 | | | | | 1,168 | |
| | Tata Consultancy Services, Ltd. (IT services) | | | 35,589 | | | | | 909 | |
| | Tata Motors, Ltd. (Automobiles) | | | 164,913 | | | | | 781 | |
| | | | | | | | | | 9,015 | |
| | | | | | | | | | | |
| | Indonesia—3.5% | | | | | | | | | |
| | PT Bank Rakyat Indonesia Persero Tbk
(Commercial banks) | | | 1,113,000 | | | | | 869 | |
| | PT Jasa Marga Persero Tbk (Transportation
infrastructure) | | | 499,500 | | | | | 305 | |
| | PT Kalbe Farma Tbk (Pharmaceuticals) | | | 1,435,000 | | | | | 208 | |
| | PT Telekomunikasi Indonesia Persero Tbk
(Diversified telecommunication services) | | | 685,500 | | | | | 777 | |
| | | | | | | | | | 2,159 | |
| | | | | | | | | | | |
| | Malaysia—4.1% | | | | | | | | | |
| | CIMB Group Holdings Bhd (Commercial
banks) | | | 618,800 | | | | | 1,622 | |
| * | IHH Healthcare Bhd (Health care providers
& services) | | | 722,700 | | | | | 903 | |
| | | | | | | | | | 2,525 | |
| | | | | | | | | | | |
| | Philippines—1.2% | | | | | | | | | |
| | SM Prime Holdings, Inc. (Real estate
management & development) | | | 1,881,700 | | | | | 710 | |
| | | | | | | | | | | |
| | South Korea—5.2% | | | | | | | | | |
| | LG Household & Health Care, Ltd.
(Household products) | | | 1,194 | | | | | 584 | |
| | | | | | | | |
| | | | | | | | |
| | Issuer | | Shares | | | Value | |
| | | | | | | | | | | |
| | Common Stocks—(continued) | | | | | | | | | |
| | | | | | | | | | | |
| | Emerging Asia—(continued) | | | | | | | | | |
| | | | | | | | | | | |
| | South Korea—(continued) | | | | | | | | | |
| | Samsung Electronics Co., Ltd.
(Semiconductors & semiconductor
equipment) | | | 2,194 | | | | $ | 2,578 | |
| | | | | | | | | | 3,162 | |
| | | | | | | | | | | |
| | Taiwan—4.8% | | | | | | | | | |
| | Asustek Computer, Inc. (Computers &
peripherals) | | | 61,000 | | | | | 525 | |
| | Taiwan Semiconductor Manufacturing Co.,
Ltd.—ADR (Semiconductors &
semiconductor equipment) | | | 131,675 | | | | | 2,412 | |
| | | | | | | | | | 2,937 | |
| | | | | | | | | | | |
| | Thailand—2.5% | | | | | | | | | |
| | Advanced Info Service PCL (Wireless
telecommunication services) | | | 75,700 | | | | | 688 | |
| | Kasikornbank PCL (Commercial banks) | | | 136,000 | | | | | 860 | |
| | | | | | | | | | 1,548 | |
| | | | | | | | | | | |
| | Emerging Latin America—20.7% | | | | | | | | | |
| | | | | | | | | | | |
| | Brazil—8.8% | | | | | | | | | |
| * | BB Seguridade Participacoes S.A.
(Insurance) | | | 144,200 | | | | | 1,137 | |
| | BR Malls Participacoes S.A. (Real estate
management & development) | | | 49,600 | | | | | 444 | |
| | CCR S.A (Transportation infrastructure) | | | 97,700 | | | | | 775 | |
| | Cia de Bebidas das Americas—ADR
(Beverages) | | | 39,768 | | | | | 1,485 | |
| | Embraer S.A.—ADR (Aerospace & defense) | | | 15,067 | | | | | 556 | |
| | Kroton Educacional S.A. (Diversified
consumer services) | | | 50,000 | | | | | 693 | |
| | Localiza Rent a Car S.A. (Road & rail) | | | 18,870 | | | | | 267 | |
| | | | | | | | | | 5,357 | |
| | | | | | | | | | | |
| | Chile—1.0% | | | | | | | | | |
| | S.A.C.I. Falabella (Multiline retail) | | | 58,155 | | | | | 629 | |
| | | | | | | | | | | |
| | Colombia—3.0% | | | | | | | | | |
| | Ecopetrol S.A. (Oil, gas & consumable fuels) | | | 300,750 | | | | | 639 | |
| | Pacific Rubiales Energy Corporation (Oil,
gas & consumable fuels) | | | 68,067 | | | | | 1,195 | |
| | | | | | | | | | 1,834 | |
| | | | | | | | | | | |
| | Mexico—6.3% | | | | | | | | | |
| | Fomento Economico Mexicano S.A.B. de
C.V.—ADR (Beverages) | | | 9,354 | | | | | 965 | |
| | Grupo Financiero Banorte S.A.B. de C.V.
(Commercial banks) | | | 243,100 | | | | | 1,452 | |
| | Grupo Mexico S.A.B. de C.V. Series “B”
(Metals & mining) | | | 353,600 | | | | | 1,023 | |
| | Grupo Sanborns S.A. de C.V. (Multiline
retail) | | | 186,100 | | | | | 416 | |
| | | | | | | | | | 3,856 | |
| | | | | | | | | | | |
| | Panama—0.5% | | | | | | | | | |
| | Copa Holdings S.A. Class “A” (Airlines)† | | | 2,410 | | | | | 316 | |
See accompanying Notes to Financial Statements.
| June 30, 2013 | William Blair Funds | 71 |
Emerging Markets Leaders Fund
Portfolio of Investments, June 30, 2013 (all dollar amounts in thousands) (unaudited)
| | | | | | | | |
| | | | | | | | |
| | Issuer | | Shares | | | Value | |
| | | | | | | | | | | |
| | Common Stocks—(continued) | | | | | | | | | |
| | | | | | | | | | | |
| | Emerging Latin America—(continued) | | | | | | | | | |
| | | | | | | | | | | |
| | Peru—1.1% | | | | | | | | | |
| | Credicorp, Ltd. (Commercial banks)† | | | 5,437 | | | | $ | 696 | |
| | | | | | | | | | | |
| | Emerging Europe, Mid-East, Africa—19.8% | | | | | | | | | |
| | | | | | | | | | | |
| | Nigeria—0.5% | | | | | | | | | |
| | Guaranty Trust Bank plc (Commercial
banks) | | | 2,213,912 | | | | | 331 | |
| | | | | | | | | | | |
| | Qatar—3.5% | | | | | | | | | |
| | Industries Qatar QSC (Industrial
conglomerates) | | | 44,788 | | | | | 1,950 | |
| | Qatar National Bank S.A.Q. (Commercial
banks) | | | 3,717 | | | | | 162 | |
| | | | | | | | | | 2,112 | |
| | | | | | | | | | | |
| | Russia—5.0% | | | | | | | | | |
| * | Magnit OJSC—144A—GDR (Food &
staples retailing)† | | | 31,246 | | | | | 1,787 | |
| * | Yandex N.V. Class “A” (Internet software &
services)† | | | 45,629 | | | | | 1,261 | |
| | | | | | | | | | 3,048 | |
| | | | | | | | | | | |
| | South Africa—6.9% | | | | | | | | | |
| | Bidvest Group, Ltd. (Industrial
conglomerates) | | | 38,813 | | | | | 962 | |
| | Discovery, Ltd. (Insurance) | | | 75,243 | | | | | 640 | |
| | FirstRand, Ltd. (Diversified financial
services) | | | 271,290 | | | | | 794 | |
| | Naspers, Ltd. (Media) | | | 16,045 | | | | | 1,185 | |
| | Shoprite Holdings, Ltd. (Food & staples
retailing) | | | 33,471 | | | | | 628 | |
| | | | | | | | | | 4,209 | |
| | | | | | | | | | | |
| | Turkey—2.6% | | | | | | | | | |
| | Coca-Cola Icecek A.S. (Beverages) | | | 14,528 | | | | | 418 | |
| | Turkiye Halk Bankasi A.S. (Commercial
banks) | | | 136,887 | | | | | 1,160 | |
| | | | | | | | | | 1,578 | |
| | | | | | | | | | | |
| | United Arab Emirates—1.3% | | | | | | | | | |
| | First Gulf Bank PJSC (Commercial banks) | | | 189,402 | | | | | 823 | |
| | | | | | | | | | | |
| | Total Common Stocks—94.0%
(cost $55,962) | | | | | | | | 57,501 | |
| | | | | | | | | | | |
| | Preferred Stock | | | | | | | | | |
| | | | | | | | | | | |
| | Brazil—2.7% | | | | | | | | | |
| | Itau Unibanco Holding S.A. (Commercial
banks) | | | 129,600 | | | | | 1,671 | |
| | | | | | | | | | | |
| | Total Preferred Stock—2.7%
(cost $1,849) | | | | | | | | 1,671 | |
| | | | | | | | |
| | | | Principal | | | | | |
| | Issuer | | Amount | | | Value | |
| | | | | | | | | | | |
| | Repurchase Agreement | | | | | | | | | |
| | Fixed Income Clearing Corporation, 0.010%
dated 6/28/13, due 7/1/13, repurchase
price $2,926, collateralized by U.S.
Treasury Note, 0.750%, due 10/31/17 | | | $2,926 | | | | $ | 2,926 | |
| | | | | | | | | | | |
| | Total Repurchase Agreement—4.8%
(cost $2,926) | | | | | | | | 2,926 | |
| | | | | | �� | | | | | |
| | Total Investments—101.5%
(cost $60,737) | | | | | | | | 62,098 | |
| | Liabilities, plus cash and other assets—(1.5)% | | | | | | | | (928 | ) |
| | Net assets—100.0% | | | | | | | $ | 61,170 | |
ADR = American Depository Receipt
GDR = Global Depository Receipt
* Non-income producing securities
† = U.S. listed foreign security
For securities primarily traded on exchanges or markets that close before the close of regular trading on the New York Stock Exchange, the Fund may use an independent pricing service to fair value price the securities pursuant to Valuation Procedures approved by the Board of Trustees.
At June 30, 2013, the Fund’s Portfolio of Investments includes the following industry categories:
| Financials | | | 28.9 | % |
| Information Technology | | | 18.6 | % |
| Consumer Staples | | | 14.8 | % |
| Consumer Discretionary | | | 9.7 | % |
| Industrials | | | 8.7 | % |
| Telecommunication Services | | | 7.3 | % |
| Energy | | | 5.6 | % |
| Health Care | | | 4.7 | % |
| Materials | | | 1.7 | % |
| Total | | | 100.0 | % |
At June 30, 2013, the Fund’s Portfolio of Investments includes the following currency categories:
| Hong Kong Dollar | | | 18.0 | % |
| U.S. Dollar | | | 16.0 | % |
| Indian Rupee | | | 15.2 | % |
| Brazilian Real | | | 8.4 | % |
| South African Rand | | | 7.1 | % |
| South Korean Won | | | 5.3 | % |
| Mexican Peso | | | 4.9 | % |
| Malaysian Ringgit | | | 4.3 | % |
| Indonesian Rupiah | | | 3.7 | % |
| Qatari Rial | | | 3.6 | % |
| Turkish Lira | | | 2.7 | % |
| Thai Baht | | | 2.6 | % |
| Canadian Dollar | | | 2.0 | % |
| UAE Dirham | | | 1.4 | % |
| Philippine Peso | | | 1.2 | % |
| Colombian Peso | | | 1.1 | % |
| Chilean Peso | | | 1.1 | % |
| All Other Currencies | | | 1.4 | % |
| Total | | | 100.0 | % |
See accompanying Notes to Financial Statements.
| 72 | Semi-Annual Report | June 30, 2013 |
| | EMERGING MARKETS SMALL CAP GROWTH FUND |
| | |
| | The Emerging Markets Small Cap Growth Fund seeks long-term capital appreciation. |
| | |
| | AN OVERVIEW FROM THE PORTFOLIO MANAGERS |
| | |

Todd M. McClone 
Jeffrey A. Urbina | The William Blair Emerging Markets Small Cap Growth Fund (Class N shares) posted a 6.54% increase, net of fees, for the six months ended June 30, 2013. By comparison, the Fund’s benchmark index, the MSCI Emerging Markets Small Cap Index (net) (the “Index”), decreased 3.58%. Year to date, the Fund significantly outpaced the Index due to strong stock selection across all sectors, with all sectors except Materials posting positive absolute returns. In particular, the Fund’s Consumer Discretionary stocks rallied 10.64%, while the Index fell 2.72%. Performance was bolstered by strong results in Hotels/Restaurants and Textiles/Apparel/Luxury Goods. In addition, GS Home Shopping added value on strong earnings results on increased mobile sales, and Nagacorp, the Cambodian casino added value, as visitation growth accelerated during the first quarter and the company announced new initiatives to drive the Chinese VIP segment. Consumer Staples outperformed due to strong operating performance from Prince Frog, the Chinese child care products company, and good performance in Food Products, while Energy benefited from the focused exposure in Energy Equipment/Services, particularly with Dayang Enterprises. Industrials stock selection was bolstered by strong performance in low cost airlines, coupled with good performance by Haitian Holdings, the Chinese plastic injection molding machine supplier, as 2012 results were better than expected due to improving product mix and increased average sales prices. The Fund’s Materials stocks were down 2.58%, well above the -14.63% Index return, due to a focus on and stock selection in Chemicals at the expense of Mining. The Fund’s underweighting in Energy, Industrials, and Materials were key detractors from results, as was the underweighting in Emerging Asia, as the Fund’s regional return rallied 12.37%, well ahead of the flat Index return. Overall positioning did not change markedly year to date. The Fund remained significantly overweighted in Consumer Discretionary at approximately 27% versus the 18% Index weighting, as well as in Consumer Staples, which totaled approximately 15% of the Fund, versus the 8% Index weighting. Financials remained above the Index weighting, due to higher Commercial Banks and REIT weightings, which more than offset underweightings elsewhere. Resources remained significantly underweighted versus the Index, with Energy and Materials combined approximating 4% of the Fund, well below the nearly 14% Index weighting. Regionally, the Fund was underweighted in Asia, due to South Korea and Taiwan, which more than offset higher India and Philippines exposure. Europe, the Middle East and Africa totaled approximately 19% of the Fund, well above the Index weighting, given approximately 6% invested in frontier markets. Latin America, while overweighted, declined since December 31, due to reductions across most markets in the region. |
| June 30, 2013 | William Blair Funds | 73 |
| Emerging Markets Small Cap Growth Fund |
| |
| Performance Highlights (Unaudited) |
| Average Annual Total Return at 6/30/2013 |
| |
| | | Year
to Date | | 1 Year | | Since
Inception |
| Class N(a) | | | 6.54 | % | | | 25.14 | % | | | 21.67 | % |
| Class I(a) | | | 6.62 | | | | 25.36 | | | | 21.92 | |
MSCI Emerging Markets
Small Cap Index (net)(a) | | | (3.58 | ) | | | 9.86 | | | | 6.04 | |
| Institutional Class(b) | | | 6.62 | | | | — | | | | 8.37 | |
MSCI Emerging Markets
Small Cap Index (net)(b) | | | (3.58 | ) | | | — | | | | (2.20 | ) |
| (a) | Since inception is for the period from October 24, 2011 (Commencement of Operations) to June 30, 2013. |
| (b) | Since inception is for the period from December 20, 2012 (Commencement of Operations) to June 30, 2013. |
Performance cited represents past performance. Past performance does not guarantee future results and current performance may be lower or higher than the data quoted. Results shown are average annual returns, which assume reinvestment of dividends and capital gains. Investment returns and principal will fluctuate and you may have a gain or loss when you sell shares. For the most current month-end performance information, please call 1-800-742-7272, or visit our Web site at www.williamblairfunds.com. From time to time, the investment advisor may waive fees or reimburse expenses for the Fund. Without these waivers, performance would be lower. International investing involves special risk considerations, including currency fluctuations, lower liquidity, economic and political risk. Class N shares are available to the general public without a sales load. Class I shares are available to certain institutional investors and advisory clients of William Blair & Company L.L.C. without a sales load or distribution (12b-1) fees. Institutional Class Shares are available to institutional investors without a sales load or distribution (12b-1) or service fees.
The performance highlights and graph presented above do not reflect the deduction of taxes that a shareholder would pay on fund distributions or the redemption of fund shares.
The Morgan Stanley Capital International (MSCI) Emerging Markets Small Cap Index (net) is a free float-adjusted market capitalization weighted index that is designed to measure the equity market performance of emerging markets. This series approximates the minimum possible dividend reinvestment.
This report identifies the Fund’s investments on June 30, 2013. These holdings are subject to change. Not all stocks in the Fund performed the same, nor is there any guarantee that these stocks will perform as well in the future. Market forecasts provided in this report may not necessarily come to pass.
| Sector Diversification (Unaudited) |
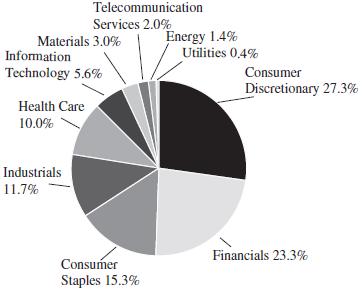
The sector diversification shown is based on the total long-term securities.
| 74 | Semi-Annual Report | June 30, 2013 |
| Emerging Markets Small Cap Growth Fund |
Portfolio of Investments, June 30, 2013 (all dollar amounts in thousands) (unaudited)
| | | | | | | | |
| | | | | | | | |
| | Issuer | | Shares | | | Value | |
| | | | | | | | | | | |
| | Common Stocks | | | | | | | | | |
| | | | | | | | | | | |
| | Emerging Asia—63.0% | | | | | | | | | |
| | | | | | | | | | | |
| | Cambodia—1.8% | | | | | | | | | |
| | NagaCorp, Ltd. (Hotels, restaurants &
leisure) | | | 1,918,000 | | | | $ | 1,496 | |
| | | | | | | | | | | |
| | China—13.7% | | | | | | | | | |
| | AAC Technologies Holdings, Inc.
(Communications equipment) | | | 180,000 | | | | | 1,017 | |
| | Biostime International Holdings, Ltd. (Food
products) | | | 213,500 | | | | | 1,198 | |
| | China Medical System Holdings, Ltd.
(Pharmaceuticals) | | | 485,000 | | | | | 433 | |
| | China Overseas Grand Oceans Group, Ltd.
(Real estate management & development) | | | 636,000 | | | | | 812 | |
| | CIMC Enric Holdings, Ltd. (Machinery) | | | 812,000 | | | | | 1,263 | |
| | Haitian International Holdings, Ltd.
(Machinery) | | | 968,000 | | | | | 1,415 | |
| | Hilong Holding, Ltd. (Energy equipment &
services) | | | 812,000 | | | | | 477 | |
| | Minth Group, Ltd. (Auto components) | | | 910,000 | | | | | 1,415 | |
| | Prince Frog International Holdings, Ltd.
(Personal products) | | | 1,609,000 | | | | | 1,112 | |
| | Sunny Optical Technology Group Co., Ltd.
(Electronic equipment, instruments &
components) | | | 698,000 | | | | | 842 | |
| | Tiangong International Co., Ltd. (Metals &
mining) | | | 1,290,000 | | | | | 319 | |
| * | WuXi PharmaTech Cayman, Inc.-ADR
(Life sciences tools & services) | | | 42,762 | | | | | 898 | |
| | | | | | | | | | 11,201 | |
| | | | | | | | | | | |
| | India—13.5% | | | | | | | | | |
| | Amara Raja Batteries, Ltd. (Electrical
equipment) | | | 112,474 | | | | | 486 | |
| | Apollo Hospitals Enterprise, Ltd. (Health
care providers & services) | | | 34,561 | | | | | 613 | |
| | Bata India, Ltd. (Textiles, apparel & luxury
goods) | | | 14,278 | | | | | 201 | |
| | Bayer CropScience, Ltd. (Chemicals) | | | 24,473 | | | | | 574 | |
| | Berger Paints India, Ltd. (Chemicals) | | | 171,755 | | | | | 663 | |
| | Colgate-Palmolive India, Ltd. (Personal
products) | | | 10,410 | | | | | 238 | |
| | Eicher Motors, Ltd. (Machinery) | | | 9,672 | | | | | 533 | |
| | Emami, Ltd. (Personal products) | | | 86,931 | | | | | 702 | |
| | Glenmark Pharmaceuticals, Ltd.
(Pharmaceuticals) | | | 74,634 | | | | | 689 | |
| | Gruh Finance, Ltd. (Thrifts & mortgage
finance) | | | 148,808 | | | | | 573 | |
| | Havells India, Ltd. (Electrical equipment) . | | | 42,292 | | | | | 523 | |
| | IndusInd Bank, Ltd. (Commercial banks) | | | 136,138 | | | | | 1,071 | |
| | Ipca Laboratories, Ltd. (Pharmaceuticals) | | | 97,345 | | | | | 1,073 | |
| | Marico, Ltd. (Personal products) | | | 116,461 | | | | | 407 | |
| | Motherson Sumi Systems, Ltd. (Auto
components) | | | 149,233 | | | | | 498 | |
| | Page Industries, Ltd. (Textiles, apparel &
luxury goods) | | | 9,114 | | | | | 628 | |
| | Pidilite Industries, Ltd. (Chemicals) | | | 179,947 | | | | | 809 | |
| | Yes Bank, Ltd. (Commercial banks) | | | 97,845 | | | | | 759 | |
| | | | | | | | | | 11,040 | |
| | | | | | | | |
| | | | | | | | |
| | Issuer | | Shares | | | Value | |
| | | | | | | | | | | |
| | Common Stocks—(continued) | | | | | | | | | |
| | | | | | | | | | | |
| | Emerging Asia—(continued) | | | | | | | | | |
| | | | | | | | | | | |
| | Indonesia—3.9% | | | | | | | | | |
| | PT Ace Hardware Indonesia Tbk (Specialty
retail) | | | 7,033,000 | | | | $ | 524 | |
| | PT Alam Sutera Realty Tbk (Real estate
management & development) | | | 4,404,500 | | | | | 333 | |
| | PT Ciputra Development Tbk (Real estate
management & development) | | | 3,079,000 | | | | | 419 | |
| | PT Mitra Adiperkasa Tbk (Multiline retail) | | | 757,500 | | | | | 534 | |
| | PT Pakuwon Jati Tbk (Real estate
management & development) | | | 24,503,000 | | | | | 852 | |
| | PT Sumber Alfaria Trijaya Tbk (Food &
staples retailing) | | | 496,000 | | | | | 337 | |
| * | PT Tower Bersama Infrastructure Tbk
(Wireless telecommunication services) | | | 456,000 | | | | | 239 | |
| | | | | | | | | | 3,238 | |
| | | | | | | | | | | |
| | Malaysia—5.6% | | | | | | | | | |
| | Aeon Co. M Bhd (Multiline retail) | | | 179,500 | | | | | 841 | |
| | Aeon Credit Service M Bhd (Consumer
finance) | | | 191,400 | | | | | 1,043 | |
| | Dayang Enterprise Holdings Bhd (Energy
equipment & services) | | | 394,300 | | | | | 612 | |
| | Guinness Anchor Bhd (Beverages) | | | 105,200 | | | | | 635 | |
| | Hartalega Holdings Bhd (Health care
equipment & supplies) | | | 230,100 | | | | | 466 | |
| | Oldtown Bhd (Food products) | | | 1,021,900 | | | | | 889 | |
| | Silverlake Axis, Ltd. (Software) | | | 140,000 | | | | | 82 | |
| | | | | | | | | | 4,568 | |
| | | | | | | | | | | |
| | Philippines—4.0% | | | | | | | | | |
| | Alliance Global Group, Inc. (Industrial
conglomerates) | | | 1,441,100 | | | | | 781 | |
| * | East West Banking Corporation
(Commercial banks) | | | 638,000 | | | | | 441 | |
| | Puregold Price Club, Inc. (Food & staples
retailing) | | | 1,279,900 | | | | | 1,075 | |
| | Security Bank Corporation (Commercial
banks) | | | 93,630 | | | | | 328 | |
| | Universal Robina Corporation (Food
products) | | | 234,140 | | | | | 677 | |
| | | | | | | | | | 3,302 | |
| | | | | | | | | | | |
| | South Korea—5.6% | | | | | | | | | |
| * | Cheil Worldwide, Inc. (Media) | | | 8,010 | | | | | 173 | |
| | GS Home Shopping, Inc. (Internet &
catalog retail) | | | 6,397 | | | | | 1,325 | |
| | Hana Tour Service, Inc. (Hotels, restaurants
& leisure) | | | 12,637 | | | | | 796 | |
| | Kolao Holdings (Automobiles) | | | 26,298 | | | | | 678 | |
| | Medy-Tox, Inc. (Biotechnology) | | | 3,448 | | | | | 303 | |
| | Paradise Co., Ltd. (Hotels, restaurants &
leisure) | | | 67,020 | | | | | 1,358 | |
| | | | | | | | | | 4,633 | |
| | | | | | | | | | | |
| | Sri Lanka—1.4% | | | | | | | | | |
| | Commercial Bank of Ceylon plc
(Commercial banks) | | | 661,457 | | | | | 589 | |
See accompanying Notes to Financial Statements.
| June 30, 2013 | William Blair Funds | 75 |
| Emerging Markets Small Cap Growth Fund |
Portfolio of Investments, June 30, 2013 (all dollar amounts in thousands) (unaudited)
| | | | | | | | |
| | | | | | | | |
| | Issuer | | Shares | | | Value | |
| | | | | | | | | | | |
| | Common Stocks—(continued) | | | | | | | | | |
| | | | | | | | | | | |
| | Emerging Asia—(continued) | | | | | | | | | |
| | | | | | | | | | | |
| | Sri Lanka—(continued) | | | | | | | | | |
| | John Keells Holdings plc (Industrial
conglomerates) | | | 288,842 | | | | $ | 558 | |
| | | | | | | | | | 1,147 | |
| | | | | | | | | | | |
| | Taiwan—7.8% | | | | | | | | | |
| | Chipbond Technology Corporation
(Semiconductors & semiconductor
equipment) | | | 63,000 | | | | | 154 | |
| | Eclat Textile Co., Ltd. (Textiles, apparel &
luxury goods) | | | 115,000 | | | | | 850 | |
| | Ginko International Co., Ltd. (Health care
equipment & supplies) | | | 49,000 | | | | | 827 | |
| | Makalot Industrial Co., Ltd. (Textiles,
apparel & luxury goods) | | | 204,000 | | | | | 973 | |
| | Merida Industry Co., Ltd. (Leisure
equipment & products) | | | 185,000 | | | | | 1,099 | |
| | Novatek Microelectronics Corporation
(Semiconductors & semiconductor
equipment) | | | 249,000 | | | | | 1,209 | |
| | St Shine Optical Co., Ltd. (Health care
equipment & supplies) | | | 48,000 | | | | | 1,248 | |
| | | | | | | | | | 6,360 | |
| | | | | | | | | | | |
| | Thailand—5.7% | | | | | | | | | |
| | Bangkok Chain Hospital PCL (Health care
providers & services) | | | 2,076,375 | | | | | 526 | |
| | Dynasty Ceramic PCL (Building products) | | | 308,600 | | | | | 634 | |
| | Home Product Center PCL (Specialty retail) | | | 717,513 | | | | | 266 | |
| | Kiatnakin Bank PCL (Commercial banks) | | | 179,300 | | | | | 306 | |
| | LPN Development PCL (Real estate
management & development) | | | 432,200 | | | | | 336 | |
| | Major Cineplex Group PCL (Media) | | | 844,700 | | | | | 572 | |
| | Minor International PCL (Hotels,
restaurants & leisure) | | | 745,310 | | | | | 596 | |
| | Robinson Department Store PCL (Multiline
retail) | | | 201,600 | | | | | 397 | |
| | Siam Global House PCL (Specialty retail) | | | 444,400 | | | | | 334 | |
| | Thai Tap Water Supply PCL (Water utilities) | | | 885,200 | | | | | 288 | |
| | Tisco Financial Group PCL (Commercial
banks) | | | 315,450 | | | | | 417 | |
| | | | | | | | | | 4,672 | |
| | | | | | | | | | | |
| | Emerging Europe, Mid—East, Africa—19.3% | | | | | | | | | |
| | | | | | | | | | | |
| | Kenya—3.2% | | | | | | | | | |
| | East African Breweries, Ltd. (Beverages) | | | 117,700 | | | | | 466 | |
| | Equity Bank, Ltd. (Commercial banks) | | | 1,066,200 | | | | | 388 | |
| | Kenya Commercial Bank, Ltd. (Commercial
banks) | | | 894,600 | | | | | 386 | |
| | Safaricom, Ltd. (Wireless
telecommunication services) | | | 17,886,000 | | | | | 1,376 | |
| | | | | | | | | | 2,616 | |
| | | | | | | | | | | |
| | Nigeria—2.6% | | | | | | | | | |
| | Access Bank plc (Commercial banks) | | | 6,022,024 | | | | | 404 | |
| | Guaranty Trust Bank plc (Commercial
banks) | | | 5,382,745 | | | | | 805 | |
| | | | | | | | |
| | | | | | | | |
| | Issuer | | Shares | | | Value | |
| | | | | | | | | | | |
| | Common Stocks—(continued) | | | | | | | | | |
| | | | | | | | | | | |
| | Emerging Europe, Mid-East, Africa—(continued) | | | | | | | | | |
| | | | | | | | | | | |
| | Nigeria—(continued) | | | | | | | | | |
| | Nestle Nigeria plc (Food products) | | | 160,382 | | | | $ | 957 | |
| | | | | | | | | | 2,166 | |
| | | | | | | | | | | |
| | Poland—3.5% | | | | | | | | | |
| * | Alior Bank S.A. (Commercial banks) | | | 26,677 | | | | | 718 | |
| | Eurocash S.A. (Food & staples retailing) | | | 52,543 | | | | | 928 | |
| | LPP S.A. (Textiles, apparel & luxury goods) | | | 605 | | | | | 1,193 | |
| | | | | | | | | | 2,839 | |
| | | | | | | | | | | |
| | Russia—0.3% | | | | | | | | | |
| | MD Medical Group Investments
plc-144A-GDR (Health care providers
& services) | | | 15,831 | | | | | 230 | |
| | | | | | | | | | | |
| | South Africa—4.5% | | | | | | | | | |
| | Coronation Fund Managers, Ltd. (Capital
markets) | | | 199,521 | | | | | 1,267 | |
| | Discovery, Ltd. (Insurance) | | | 49,210 | | | | | 418 | |
| | Famous Brands, Ltd. (Hotels, restaurants &
leisure) | | | 94,956 | | | | | 912 | |
| | Life Healthcare Group Holdings, Ltd.
(Health care providers & services) | | | 71,255 | | | | | 270 | |
| | Oceana Group, Ltd. (Food products) | | | 101,506 | | | | | 865 | |
| | | | | | | | | | 3,732 | |
| | | | | | | | | | | |
| | Turkey—4.7% | | | | | | | | | |
| | Anadolu Hayat Emeklilik A.S. (Insurance) | | | 179,274 | | | | | 396 | |
| | Bizim Toptan Satis Magazalari A.S. (Food
& staples retailing) | | | 62,724 | | | | | 1,021 | |
| | Dogus Otomotiv Servis ve Ticaret A.S.
(Distributors) | | | 60,229 | | | | | 306 | |
| * | Pegasus Hava Tasimaciligi A.S. (Airlines) | | | 56,786 | | | | | 674 | |
| | Tofas Turk Otomobil Fabrikasi A.S.
(Automobiles) | | | 154,179 | | | | | 963 | |
| | Turkiye Sinai Kalkinma Bankasi A.S.
(Commercial banks) | | | 492,339 | | | | | 488 | |
| | | | | | | | | | 3,848 | |
| | | | | | | | | | | |
| | United Arab Emirates—0.5% | | | | | | | | | |
| | NMC Health plc (Health care providers &
services) | | | 94,279 | | | | | 387 | |
| | | | | | | | | | | |
| | | | | | | | | | | |
| | Emerging Latin America—14.6% | | | | | | | | | |
| | | | | | | | | | | |
| | Brazil—5.1% | | | | | | | | | |
| | Arezzo Industria e Comercio S.A. (Textiles,
apparel & luxury goods) | | | 16,000 | | | | | 243 | |
| | Iguatemi Empresa de Shopping Centers S.A.
(Real estate management & development) | | | 24,300 | | | | | 239 | |
| | International Meal Co. Holdings S.A.
(Hotels, restaurants & leisure) | | | 73,000 | | | | | 697 | |
| | Kroton Educacional S.A. (Diversified
consumer services) | | | 97,020 | | | | | 1,344 | |
| | Linx S.A. (Software) | | | 35,500 | | | | | 573 | |
| | Lojas Renner S.A. (Multiline retail) | | | 2,150 | | | | | 62 | |
| | Mills Estruturas e Servicos de Engenharia
S.A. (Trading companies & distributors) | | | 75,686 | | | | | 1,025 | |
| | | | | | | | | | 4,183 | |
See accompanying Notes to Financial Statements.
| 76 | Semi-Annual Report | | June 30, 2013 |
| Emerging Markets Small Cap Growth Fund |
Portfolio of Investments, June 30, 2013 (all dollar amounts in thousands) (unaudited)
| | | | | | | | |
| | | | | | | | |
| | Issuer | | Shares | | | Value | |
| | | | | | | | | | | |
| | Common Stocks—(continued) | | | | | | | | | |
| | | | | | | | | | | |
| | Emerging Latin America—(continuied) | | | | | | | | | |
| | | | | | | | | | | |
| | Chile—2.1% | | | | | | | | | |
| | Forus S.A. (Textiles, apparel & luxury goods) | | | 45,499 | | | | $ | 259 | |
| | Inversiones La Construccion S.A.
(Diversified financial services) | | | 28,448 | | | | | 436 | |
| | Parque Arauco S.A. (Real estate
management & development) | | | 178,536 | | | | | 390 | |
| | Sonda S.A. (IT services) | | | 204,237 | | | | | 595 | |
| | | | | | | | | | 1,680 | |
| | | | | | | | | | | |
| | Mexico—5.2% | | | | | | | | | |
| | Alsea S.A.B. de C.V. (Hotels, restaurants &
leisure) | | | 148,055 | | | | | 351 | |
| | Banregio Grupo Financiero S.A.B. de C.V.
(Commercial banks) | | | 117,438 | | | | | 620 | |
| | Concentradora Fibra Hotelera Mexicana
S.A. de C.V. (Real estate investment
trusts (REITs)) | | | 268,406 | | | | | 536 | |
| | Fibra Uno Administracion S.A. de C.V.
(Real estate investment trusts (REITs)) | | | 199,700 | | | | | 671 | |
| * | Macquarie Mexico Real Estate Management
S.A. de C.V.-144A (Real estate
investment trusts (REITs)) | | | 584,095 | | | | | 1,262 | |
| | TF Administradora Industrial S de RL de
C.V. (Real estate investment trusts (REITs)) | | | 401,756 | | | | | 837 | |
| | | | | | | | | | 4,277 | |
| | | | | | | | | | | |
| | Panama—0.6% | | | | | | | | | |
| | Copa Holdings S.A. (Airlines)† | | | 3,893 | | | | | 510 | |
| | | | | | | | | | | |
| | Peru—1.6% | | | | | | | | | |
| | Alicorp S.A. (Food products) | | | 199,423 | | | | | 670 | |
| | Grana y Montero S.A. (Construction &
engineering) | | | 164,658 | | | | | 652 | |
| | | | | | | | | | 1,322 | |
| | | | | | | | | | | |
| | Total Common Stocks—96.9%
(cost $77,009) | | | | | | | | 79,447 | |
| | | | | | | | | | | |
| | Preferred Stock | | | | | | | | | |
| | | | | | | | | | | |
| | Brazil—0.3% | | | | | | | | | |
| | Marcopolo S.A. (Machinery) | | | 40,400 | | | | | 231 | |
| | | | | | | | | | | |
| | Total Preferred Stock—0.3%
(cost $247) | | | | | | | | 231 | |
| | | | | | | | |
| | Issuer | | Principal
Amount | | | Value | |
| | | | | | | | | | | |
| | Repurchase Agreement | | | | | | | | | |
| | Fixed Income Clearing Corporation, 0.010%
dated 6/28/13, due 7/1/13, repurchase
price $1,563, collateralized by U.S.
Treasury Note, 0.750%, due 10/31/17 | | | $1,563 | | | | $ | 1,563 | |
| | | | | | | | | | | |
| | Total Repurchase Agreement—1.9%
(cost $1,563) | | | | | | | | 1,563 | |
| | | | | | | | | | | |
| | Total Investments—99.1%
(cost $78,819) | | | | | | | | 81,241 | |
| | Cash and other assets, less liabilities—0.9% | | | | | | | | 738 | |
| | Net assets—100.0% | | | | | | | $ | 81,979 | |
ADR = American Depository Receipt
GDR = Global Depository Receipt
* Non-income producing securities
† = U.S. listed foreign security
See accompanying Notes to Financial Statements.
| June 30, 2013 | William Blair Funds | 77 |
| Emerging Markets Small Cap Growth Fund |
Portfolio of Investments, June 30, 2013 (all dollar amounts in thousands) (unaudited)
For securities primarily traded on exchanges or markets that close before the close of regular trading on the New York Stock Exchange, the Fund may use an independent pricing service to fair value price the securities pursuant to Valuation Procedures approved by the Board of Trustees.
At June 30, 2013, the Fund’s Portfolio of Investments includes the following industry categories:
| Consumer Discretionary | | | 27.3 | % |
| Financials | | | 23.3 | % |
| Consumer Staples | | | 15.3 | % |
| Industrials | | | 11.7 | % |
| Health Care | | | 10.0 | % |
| Information Technology | | | 5.6 | % |
| Materials | | | 3.0 | % |
| Telecommunication Services | | | 2.0 | % |
| Energy | | | 1.4 | % |
| Utilities | | | 0.4 | % |
| Total | | | 100.0 | % |
At June 30, 2013, the Fund’s Portfolio of Investments includes the following currency categories:
| Hong Kong Dollar | | | 14.8 | % |
| Indian Rupee | | | 13.8 | % |
| New Taiwan Dollar | | | 8.0 | % |
| Thai Baht | | | 5.9 | % |
| South Korean Won | | | 5.8 | % |
| Malaysian Ringgit | | | 5.6 | % |
| Brazilian Real | | | 5.5 | % |
| Mexican Peso | | | 5.4 | % |
| Turkish Lira | | | 4.8 | % |
| South African Rand | | | 4.7 | % |
| Philippine Peso | | | 4.1 | % |
| Indonesian Rupiah | | | 4.1 | % |
| Kenyan Shilling | | | 3.3 | % |
| Nigerian Naira | | | 2.7 | % |
| Euro | | | 2.7 | % |
| Chilean Peso | | | 2.1 | % |
| U.S. Dollar | | | 2.1 | % |
| Peruvian Nouveau Sol | | | 1.7 | % |
| Sri Lanka Rupee | | | 1.4 | % |
| All Other Currencies | | | 1.5 | % |
| Total | | | 100.0 | % |
See accompanying Notes to Financial Statements.
| 78 | Semi-Annual Report | June 30, 2013 |
| | LARGE CAP VALUE FUND |
| | |
| | The Large Cap Value Fund seeks long-term capital appreciation. |
| | |
| | AN OVERVIEW FROM THE PORTFOLIO MANAGER |
| | |

David F. Hone | The William Blair Large Cap Value Fund (Class N shares) posted a 15.08% increase, net of fees, for the six months ended June 30, 2013. By comparison, the Fund’s benchmark index, the Russell 1000® Value Index (the “Index”), increased 15.90%. Market Review The market’s strong performance during the first five months of the year was fueled by positive economic data. More specifically, improvements in housing and employment data helped instill confidence that the recovery in the market was self-sustaining. The tide seemed to turn in mid-June as questions about Federal Reserve Chairman Ben Bernanke’s tenure and possible successors injected uncertainty into the market. The Federal Reserve’s plans of “tapering” quantitative easing (i.e., the slowing of its bond buying program) added to the markets concerns regarding sustainable growth domestically and contributed to a spike in bond yields. Within the next week, stocks around the world sold off over 4.5% before finding some footing and reversing course to close out the quarter. Adding to the questions about tapering and who will succeed Chairman Bernanke, investors were also concerned with a slowdown in emerging markets, China in particular, and the implications a slowdown may have on global and domestic growth. Portfolio Results The Fund’s slightly positive contribution from stock selection was more than offset by a negative allocation effect in the first half of the year. The largest detractors from performance came from poor stock selection within Information Technology and Health Care; the top two performing sectors in the market. Positive stock selection within Energy and Financials were not able to offset the negative performance from these two sectors. Given the strong market performance year-to-date, the Fund’s cash position was a drag on performance. From a style perspective, growth factors were in favor. All companies have a growth rate associated with them, even value stocks. Because the Fund tends to have an overweight to higher growth companies and an underweight to slower growth companies, this was a nice tailwind for the Fund and contributed to relative performance. Looking specifically at stock selection, VeriFone Systems, American Tower Corp., and Freeport McMoRan Cooper & Gold were the largest detractors from relative performance. Offsetting the underperformance were investments in Hewlett-Packard, Lincoln National Corp., and Boeing. Outlook Despite currently being overshadowed by the other political and legislative agendas, the fiscal debate in Washington D.C. regarding the debt ceiling and potential spending cuts could be headwinds to growth as we move into the second half of 2013. Even in the face of these headwinds, we believe the domestic economy will continue to grind ahead in a slow growth environment. Domestically, we may benefit in the face of strong or weak economic data: strong economic data is good and should help move the markets higher, whereas weaker data may delay tapering of quantitative easing, resulting in support for the markets. Corporate performance remains solid and U.S. stocks have been a relative safe haven versus more interest rate-sensitive asset classes, commodities, and stocks outside the U.S. Broadly speaking, the U.S. housing market remains a tailwind for U.S. employment and GDP as well. For the Fund, we continue to find attractive opportunities on a valuation basis across most sectors. As always, our focus remains on fundamental analysis to identify quality companies that are temporarily out of favor with investors but have prospects for longer-term growth reacceleration. Over time, we believe investors can benefit from attractive value creation as these companies return toward historical growth trends and investor sentiment improves. |
June 30, 2013 | William Blair Funds | 79 |
Large Cap Value Fund
Performance Highlights (Unaudited)
| Average Annual Total Return at 6/30/2013 |
| | | Year
to Date | | 1 Year | | Since
Inception(a) |
| Class N | | | 15.08 | % | | | 23.28 | % | | | 19.12 | % |
| Class I | | | 15.15 | | | | 23.51 | | | | 19.38 | |
| Russell 1000® Value Index | | | 15.90 | | | | 25.32 | | | | 21.30 | |
| (a) | For the period from October 24, 2011 (Commencement of Operations) to June 30, 2013. |
Performance cited represents past performance. Past performance does not guarantee future results and current performance may be lower or higher than the data quoted. Results shown are average annual total returns, which assume reinvestment of dividends and capital gains. Investment returns and principal will fluctuate and you may have a gain or loss when you sell shares. For the most current month-end performance information, please call 1-800-742-7272, or visit our Web site at www.williamblairfunds.com. From time to time, the investment advisor may waive fees or reimburse expenses for the Fund. Without these waivers, performance would be lower. Class N shares are available to the general public without a sales load. Class I shares are available to certain institutional investors and advisory clients of William Blair & Company, L.L.C., without a sales load or distribution (12b-1) or service fees.
The performance highlights and graph presented above do not reflect the deduction of taxes that a shareholder would pay on fund distributions or the redemption of fund shares.
The Russell 1000® Value Index consists of large capitalization companies with above average price-to-book ratios and forecasted growth rates.
This report identifies the Fund’s investments on June 30, 2013. These holdings are subject to change. Not all stocks in the Fund performed the same, nor is there any guarantee that these stocks will perform as well in the future. Market forecasts provided in this report may not necessarily come to pass.
Sector Diversification (Unaudited)
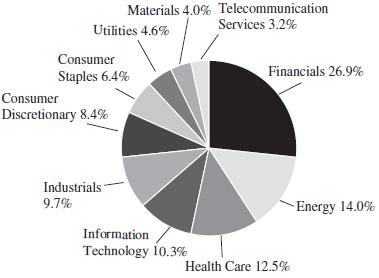
The sector diversification shown is based on the total long-term securities.
| 80 | Semi-Annual Report | June 30, 2013 |
Large Cap Value Fund
Portfolio of Investments, June 30, 2013 (all dollar amounts in thousands) (unaudited)
| | | | | | | | |
| | | | | | | | |
| | Issuer | | Shares | | | Value | |
| | | | | | | | | | | |
| | Common Stocks | | | | | | | | | |
| | | | | | | | | | | |
| | Financials—26.3% | | | | | | | | | |
| * | American International Group, Inc. | | | 1,559 | | | | $ | 70 | |
| | American Tower Corporation | | | 833 | | | | | 61 | |
| | Bank of America Corporation | | | 5,313 | | | | | 68 | |
| * | CBRE Group, Inc. Class “A” | | | 1,334 | | | | | 31 | |
| | Citigroup, Inc. | | | 1,840 | | | | | 88 | |
| | CNA Financial Corporation | | | 740 | | | | | 24 | |
| | Discover Financial Services | | | 952 | | | | | 45 | |
| | JPMorgan Chase & Co. | | | 2,157 | | | | | 114 | |
| | Lazard, Ltd. Class “A”† | | | 1,444 | | | | | 46 | |
| | Lincoln National Corporation | | | 1,777 | | | | | 65 | |
| | Morgan Stanley | | | 2,626 | | | | | 64 | |
| | Regions Financial Corporation | | | 4,605 | | | | | 44 | |
| | State Street Corporation | | | 857 | | | | | 56 | |
| | SunTrust Banks, Inc. | | | 1,666 | | | | | 53 | |
| | The Allstate Corporation | | | 887 | | | | | 43 | |
| | The Goldman Sachs Group, Inc. | | | 101 | | | | | 15 | |
| | Wells Fargo & Co. | | | 2,008 | | | | | 83 | |
| | Zions Bancorporation | | | 1,862 | | | | | 54 | |
| | | | | | | | | | 1,024 | |
| | | | | | | | | | | |
| | Energy—13.7% | | | | | | | | | |
| | Anadarko Petroleum Corporation | | | 471 | | | | | 41 | |
| | Apache Corporation | | | 430 | | | | | 36 | |
| | Baker Hughes, Inc. | | | 1,032 | | | | | 48 | |
| | Chevron Corporation | | | 754 | | | | | 89 | |
| | Devon Energy Corporation | | | 1,042 | | | | | 54 | |
| | Exxon Mobil Corporation | | | 1,376 | | | | | 124 | |
| | Hess Corporation | | | 627 | | | | | 42 | |
| | Occidental Petroleum Corporation | | | 740 | | | | | 66 | |
| * | Southwestern Energy Co. | | | 877 | | | | | 32 | |
| | | | | | | | | | 532 | |
| | | | | | | | | | | |
| | Health Care—12.2% | | | | | | | | | |
| | Baxter International, Inc. | | | 618 | | | | | 43 | |
| * | Boston Scientific Corporation | | | 2,100 | | | | | 19 | |
| | Cardinal Health, Inc. | | | 1,133 | | | | | 54 | |
| * | Express Scripts Holding Co. | | | 758 | | | | | 47 | |
| | Merck & Co., Inc. | | | 1,802 | | | | | 84 | |
| | Pfizer, Inc. | | | 3,547 | | | | | 99 | |
| | UnitedHealth Group, Inc. | | | 1,181 | | | | | 77 | |
| | Zimmer Holdings, Inc. | | | 684 | | | | | 51 | |
| | | | | | | | | | 474 | |
| | | | | | | | | | | |
| | Information Technology—10.0% | | | | | | | | | |
| * | Adobe Systems, Inc. | | | 1,045 | | | | | 48 | |
| | Broadcom Corporation Class “A” | | | 880 | | | | | 30 | |
| | Corning, Inc. | | | 3,828 | | | | | 54 | |
| | Hewlett-Packard Co. | | | 2,948 | | | | | 73 | |
| | Intel Corporation | | | 2,491 | | | | | 60 | |
| | Microsoft Corporation | | | 1,033 | | | | | 36 | |
| * | NetApp, Inc. | | | 949 | | | | | 36 | |
| | Symantec Corporation | | | 1,476 | | | | | 33 | |
| * | VeriFone Systems, Inc. | | | 1,160 | | | | | 19 | |
| | | | | | | | | | 389 | |
| | | | | | | | |
| | | | | | | | |
| | Issuer | | Shares | | | Value | |
| | | | | | | | | | | |
| | Common Stocks—(continued) | | | | | | | | | |
| | | | | | | | | | | |
| | Industrials—9.4% | | | | | | | | | |
| | General Electric Co. | | | 4,520 | | | | $ | 105 | |
| | Honeywell International, Inc. | | | 215 | | | | | 17 | |
| | Kansas City Southern | | | 442 | | | | | 47 | |
| | SPX Corporation | | | 464 | | | | | 33 | |
| | Textron, Inc. | | | 2,010 | | | | | 52 | |
| | The ADT Corporation | | | 775 | | | | | 31 | |
| | The Boeing Co. | | | 497 | | | | | 51 | |
| | Union Pacific Corporation | | | 195 | | | | | 30 | |
| | | | | | | | | | 366 | |
| | | | | | | | | | | |
| | Consumer Discretionary—8.1% | | | | | | | | | |
| * | Big Lots, Inc. | | | 1,103 | | | | | 35 | |
| | Brunswick Corporation | | | 1,071 | | | | | 34 | |
| | Coach, Inc. | | | 472 | | | | | 27 | |
| * | General Motors Co. | | | 1,436 | | | | | 48 | |
| | Kohl’s Corporation | | | 735 | | | | | 37 | |
| | Lear Corporation | | | 609 | | | | | 37 | |
| * | MGM Resorts International | | | 1,257 | | | | | 18 | |
| | The Walt Disney Co. | | | 596 | | | | | 38 | |
| | Time Warner Cable, Inc. | | | 383 | | | | | 43 | |
| | | | | | | | | | 317 | |
| | | | | | | | | | | |
| | Consumer Staples—6.3% | | | | | | | | | |
| | General Mills, Inc. | | | 997 | | | | | 49 | |
| | Kimberly-Clark Corporation | | | 248 | | | | | 24 | |
| | Philip Morris International, Inc. | | | 533 | | | | | 46 | |
| | The Procter & Gamble Co. | | | 974 | | | | | 75 | |
| | Walgreen Co. | | | 1,131 | | | | | 50 | |
| | | | | | | | | | 244 | |
| | | | | | | | | | | |
| | Utilities—4.5% | | | | | | | | | |
| | CMS Energy Corporation | | | 2,096 | | | | | 57 | |
| | NextEra Energy, Inc. | | | 819 | | | | | 67 | |
| | Wisconsin Energy Corporation | | | 1,270 | | | | | 52 | |
| | | | | | | | | | 176 | |
| | | | | | | | | | | |
| | Materials—3.9% | | | | | | | | | |
| | Alcoa, Inc. | | | 3,029 | | | | | 24 | |
| | Cliffs Natural Resources, Inc. | | | 427 | | | | | 7 | |
| | Freeport-McMoRan Copper & Gold, Inc. | | | 1,241 | | | | | 34 | |
| * | Owens-Illinois, Inc. | | | 1,794 | | | | | 50 | |
| | Rockwood Holdings, Inc. | | | 570 | | | | | 36 | |
| | | | | | | | | | 151 | |
| | | | | | | | | | | |
| | Telecommunication Services—3.1% | | | | | | | | | |
| | AT&T, Inc. | | | 2,095 | | | | | 74 | |
| | CenturyLink, Inc. | | | 1,337 | | | | | 47 | |
| | | | | | | | | | 121 | |
| | | | | | | | | | | |
| | Total Common Stocks—97.5%
(cost $3,361) | | | | | | | | 3,794 | |
See accompanying Notes to Financial Statements.
| June 30, 2013 | William Blair Funds | 81 |
Large Cap Value Fund
Portfolio of Investments, June 30, 2013 (all dollar amounts in thousands) (unaudited)
| | | | | | | | |
| | Issuer | | Principal
Amount | | | Value | |
| | | | | | | | | | | |
| | Repurchase Agreement | | | | | | | | | |
| | Fixed Income Clearing Corporation, 0.010%
dated 6/28/13, due 7/1/13, repurchase
price $115, collateralized by U.S.
Treasury Note, 0.750%, due 10/31/17 | | | $115 | | | | $ | 115 | |
| | | | | | | | | | | |
| | Total Repurchase Agreement—3.0%
(cost $115) | | | | | | | | 115 | |
| | | | | | | | | | | |
| | Total Investments—100.5%
(cost $3,476) | | | | | | | | 3,909 | |
| | Liabilities, plus cash and other assets—(0.5)% | | | | | | | | (19 | ) |
| | Net assets—100.0% | | | | | | | $ | 3,890 | |
* Non-income producing securities
† = U.S. listed foreign security
See accompanying Notes to Financial Statements.
| 82 | Semi-Annual Report | June 30, 2013 |
| | MID CAP VALUE FUND |
| | |
| | The Mid Cap Value Fund seeks long-term capital appreciation. |
| | |
| | AN OVERVIEW FROM THE PORTFOLIO MANAGERS |
| | |
 Chad M. Kilmer 
Mark T. Leslie 
David S. Mitchell | The William Blair Mid Cap Value Fund (Class N shares) posted a 15.28% increase, net of fees, for the six months ended June 30, 2013. By comparison, the Fund’s benchmark index, the Russell Midcap® Value Index (the “Index”), increased 16.10%. Market Review The market’s strong performance during the first five months of the year was fueled by positive economic data. More specifically, improvements in housing and employment data helped instill confidence that the recovery in the market was self-sustaining. The tide seemed to turn mid-June as questions about Federal Reserve Chairman Ben Bernanke’s tenure and possible successors injected uncertainty into the market. The Federal Reserve’s plans of “tapering” quantitative easing (i.e., the slowing of its bond buying program) added to the market’s concerns regarding sustainable growth domestically and contributed to a spike in bond yields. Within the next week, stocks around the world sold off over 4.5% before finding some footing and reversing course to close out the quarter. Adding to the questions about tapering and who will succeed Chairman Bernanke, investors were also concerned with a slowdown in emerging markets, China in particular, and the implications a slowdown may have on global and domestic growth. Portfolio Results The Fund narrowly trailed its benchmark in the first half 2013 due to stock selection. Detracting from performance was selection within Information Technology, Industrials, and Health Care. The sector that contributed most to relative returns was Energy, which was one of the worst performing sectors in the first half of the year. The lack of exposure to Coal and Consumables contributed almost one-third of the positive relative performance within Energy. From a style perspective, growth factors were in favor. All companies have a growth rate associated with them, even value stocks. Because the Fund tends to have an overweight to higher growth companies and an underweight to slower growth companies, this was a nice tailwind for the Fund and contributed to relative performance. Looking specifically at stock selection, Joy Global, American Campus Communities, and Carpenter Technology Corp. were the largest detractors from relative performance. Partially offsetting the underperformance were investments in H&R Block, Pioneer Natural Resources, and The Hartford Services Group. Outlook Despite currently being overshadowed by the other political and legislative agendas, the fiscal debate in Washington D.C. regarding the debt ceiling and potential spending cuts could be headwinds to growth as we move into the second half of 2013. Even in the face of these headwinds, we believe the domestic economy will continue to grind ahead in a slow growth environment. Domestically, we may benefit in the face of strong or weak economic data: strong economic data is good and should help move the markets higher, whereas weaker data may delay tapering of quantitative easing, resulting in support for the markets. Corporate performance remains solid and U.S. stocks have been a relative safe haven versus more interest rate-sensitive asset classes, commodities, and stocks outside the U.S. Broadly speaking, the U.S. housing market remains a tailwind for U.S. employment and GDP as well. In the end, while we are cognizant of various economic scenarios and incorporate these into our stock picking, we focus our time on constructing the portfolio from a bottom-up perspective. As always, we remain focused on finding quality companies at discount prices and corporate transformation opportunities, and we continue to find good ideas across sectors. We believe building a fund with these types of companies should produce solid investment results over the long term. |
| June 30, 2013 | William Blair Funds | 83 |
Mid Cap Value Fund
Performance Highlights (Unaudited)
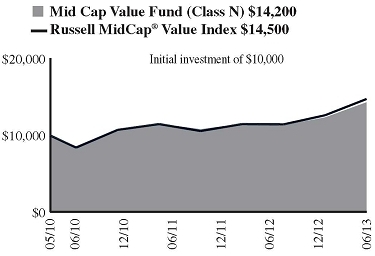
’
Average Annual Total Return at 6/30/2013
| | | Year
to Date | | 1 Year | | 3 Year | | Since
Inception(a) |
| Class N | | | 15.28 | % | | | 25.04 | % | | | 17.65 | % | | | 11.54 | % |
| Class I | | | 15.45 | | | | 25.37 | | | | 17.89 | | | | 11.80 | |
| Russell Midcap® Value Index | | | 16.10 | | | | 27.65 | | | | 19.53 | | | | 12.57 | |
| (a) | For the period from May 3, 2010 (Commencement of Operations) to June 30, 2013. |
Performance cited represents past performance. Past performance does not guarantee future results and current performance may be lower or higher than the data quoted. Results shown are average annual total returns, which assume reinvestment of dividends and capital gains. Investment returns and principal will fluctuate and you may have a gain or loss when you sell shares. For the most current month-end performance information, please call 1-800-742-7272, or visit our Web site at www.williamblairfunds.com. Investing in smaller and medium capitalization companies involves special risks, including higher volatility and lower liquidity. Medium Capitalization stocks are also more sensitive to purchase/sale transactions and changes in the issuer’s financial condition. From time to time, the investment advisor may waive fees or reimburse expenses for the Fund. Without these waivers, performance would be lower. Class N shares are available to the general public without a sales load. Class I shares are available to certain institutional investors and advisory clients of William Blair & Company, L.L.C., without a sales load or distribution (12b-1) or service fees.
The performance highlights and graph presented above do not reflect the deduction of taxes that a shareholder would pay on fund distributions or the redemption of fund shares.
The Russell Midcap® Value Index consists of midcap-capitalization companies with below average price-to-book ratios and forecasted growth rates.
This report identifies the Fund’s investments on June 30, 2013. These holdings are subject to change. Not all stocks in the Fund performed the same, nor is there any guarantee that these stocks will perform as well in the future. Market forecasts provided in this report may not necessarily come to pass.
Sector Diversification (Unaudited)
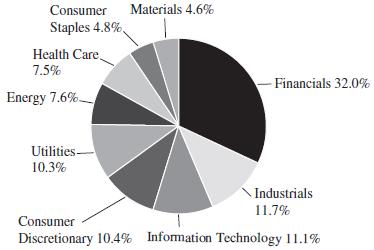
The sector diversification shown is based on the total long-term securities.
| 84 | Semi-Annual Report | June 30, 2013 |
Mid Cap Value Fund
Portfolio of Investments, June 30, 2013 (all dollar amounts in thousands) (unaudited)
| | Issuer | | Shares | | | | Value | |
| | | | | | | | | | | |
| | Common Stocks | | | | | | | | | |
| | | | | | | | | | | |
| | Financials—31.7% | | | | | | | | | |
| | Allied World Assurance Co. Holdings, Ltd.† | | | 485 | | | | $ | 44 | |
| | American Campus Communities, Inc. | | | 1,285 | | | | | 52 | |
| | Ameriprise Financial, Inc. | | | 840 | | | | | 68 | |
| * | CIT Group, Inc. | | | 1,265 | | | | | 59 | |
| | Comerica, Inc. | | | 1,275 | | | | | 51 | |
| | DDR Corporation | | | 2,515 | | | | | 42 | |
| | Digital Realty Trust, Inc. | | | 590 | | | | | 36 | |
| | East West Bancorp, Inc. | | | 1,705 | | | | | 47 | |
| | Essex Property Trust, Inc. | | | 265 | | | | | 42 | |
| | Fifth Third Bancorp | | | 2,990 | | | | | 54 | |
| | First Horizon National Corporation | | | 3,895 | | | | | 44 | |
| * | Forest City Enterprises, Inc. | | | 2,480 | | | | | 44 | |
| | General Growth Properties, Inc. | | | 2,100 | | | | | 42 | |
| * | Genworth Financial, Inc. | | | 3,988 | | | | | 45 | |
| | Hartford Financial Services Group, Inc. | | | 2,640 | | | | | 82 | |
| | Host Hotels & Resorts, Inc. | | | 2,795 | | | | | 47 | |
| | Marsh & McLennan Cos., Inc. | | | 1,650 | | | | | 66 | |
| | People’s United Financial, Inc. | | | 2,960 | | | | | 44 | |
| | Post Properties, Inc. | | | 645 | | | | | 32 | |
| | SL Green Realty Corporation | | | 715 | | | | | 63 | |
| | SunTrust Banks, Inc. | | | 2,050 | | | | | 65 | |
| | Taubman Centers, Inc. | | | 555 | | | | | 42 | |
| | The Hanover Insurance Group, Inc. | | | 1,080 | | | | | 53 | |
| | Validus Holdings, Ltd.† | | | 1,530 | | | | | 55 | |
| | Ventas, Inc. | | | 920 | | | | | 64 | |
| | Zions Bancorporation | | | 1,140 | | | | | 33 | |
| | | | | | | | | | 1,316 | |
| | | | | | | | | | | |
| | Industrials—11.6% | | | | | | | | | |
| | Dover Corporation | | | 800 | | | | | 62 | |
| | Eaton Corporation plc† | | | 650 | | | | | 43 | |
| | EMCOR Group, Inc. | | | 1,035 | | | | | 42 | |
| | Generac Holdings, Inc. | | | 735 | | | | | 27 | |
| | Hubbell, Inc. | | | 655 | | | | | 65 | |
| | Pall Corporation | | | 925 | | | | | 61 | |
| | Pentair, Ltd.† | | | 1,090 | | | | | 63 | |
| | Rockwell Collins, Inc. | | | 865 | | | | | 55 | |
| | Towers Watson & Co. | | | 775 | | | | | 64 | |
| | | | | | | | | | 482 | |
| | | | | | | | | | | |
| | Information Technology—11.0% | | | | | | | | | |
| * | Atmel Corporation | | | 5,975 | | | | | 44 | |
| * | Cadence Design Systems, Inc. | | | 3,735 | | | | | 54 | |
| | Genpact, Ltd.† | | | 2,345 | | | | | 45 | |
| * | Juniper Networks, Inc. | | | 2,255 | | | | | 43 | |
| | Linear Technology Corporation | | | 1,195 | | | | | 44 | |
| * | ON Semiconductor Corporation | | | 4,185 | | | | | 34 | |
| * | PTC, Inc. | | | 1,835 | | | | | 45 | |
| | TE Connectivity, Ltd.† | | | 1,705 | | | | | 78 | |
| | Xerox Corporation | | | 7,800 | | | | | 71 | |
| | | | | | | | | | 458 | |
| | | | | | | | | | | |
| | Consumer Discretionary—10.2% | | | | | | | | | |
| | Autoliv, Inc. | | | 475 | | | | | 37 | |
| * | Bed Bath & Beyond, Inc. | | | 755 | | | | | 53 | |
| | DISH Network Corporation | | | 1,235 | | | | | 52 | |
| | H&R Block, Inc. | | | 1,435 | | | | | 40 | |
| | Issuer | | Shares | | | | Value | |
| | | | | | | | | | | |
| | Common Stocks—(continued) | | | | | | | | | |
| | | | | | | | | | | |
| | Consumer Discretionary—(continued) | | | | | | | | | |
| | Kohl’s Corporation | | | 1,355 | | | | $ | 68 | |
| | Macy’s, Inc. | | | 1,180 | | | | | 57 | |
| | Newell Rubbermaid, Inc. | | | 2,350 | | | | | 62 | |
| | VF Corporation | | | 290 | | | | | 56 | |
| | | | | | | | | | 425 | |
| | | | | | | | | | | |
| | Utilities—10.2% | | | | | | | | | |
| | American Water Works Co., Inc. | | | 1,440 | | | | | 59 | |
| | CMS Energy Corporation | | | 1,750 | | | | | 48 | |
| | DTE Energy Co. | | | 880 | | | | | 59 | |
| | Northeast Utilities | | | 1,465 | | | | | 62 | |
| | Pinnacle West Capital Corporation | | | 580 | | | | | 32 | |
| | Sempra Energy | | | 760 | | | | | 62 | |
| | Southwest Gas Corporation | | | 880 | | | | | 41 | |
| | Xcel Energy, Inc. | | | 2,095 | | | | | 59 | |
| | | | | | | | | | 422 | |
| | | | | | | | | | | |
| | Energy—7.5% | | | | | | | | | |
| * | Cameron International Corporation | | | 670 | | | | | 41 | |
| | Noble Energy, Inc. | | | 870 | | | | | 52 | |
| | Pioneer Natural Resources Co. | | | 460 | | | | | 67 | |
| * | Rowan Cos. plc† | | | 1,420 | | | | | 48 | |
| * | Superior Energy Services, Inc. | | | 1,575 | | | | | 41 | |
| * | Whiting Petroleum Corporation | | | 1,375 | | | | | 63 | |
| | | | | | | | | | 312 | |
| | | | | | | | | | | |
| | Health Care—7.4% | | | | | | | | | |
| * | CareFusion Corporation | | | 1,695 | | | | | 62 | |
| | CIGNA Corporation | | | 1,230 | | | | | 89 | |
| * | Laboratory Corporation of America
Holdings | | | 465 | | | | | 47 | |
| * | Mettler-Toledo International, Inc. | | | 257 | | | | | 52 | |
| | Zimmer Holdings, Inc. | | | 780 | | | | | 58 | |
| | | | | | | | | | 308 | |
| | | | | | | | | | | |
| | Consumer Staples—4.7% | | | | | | | | | |
| | ConAgra Foods, Inc. | | | 2,155 | | | | | 75 | |
| | Ingredion, Inc. | | | 915 | | | | | 60 | |
| | The Kroger Co. | | | 1,775 | | | | | 62 | |
| | | | | | | | | | 197 | |
| | | | | | | | | | | |
| | Materials—4.5% | | | | | | | | | |
| | Airgas, Inc. | | | 425 | | | | | 41 | |
| | Carpenter Technology Corporation | | | 1,005 | | | | | 45 | |
| | FMC Corporation | | | 945 | | | | | 58 | |
| | Steel Dynamics, Inc. | | | 3,025 | | | | | 45 | |
| | | | | | | | | | 189 | |
| | | | | | | | | | | |
| | Total Common Stocks—98.8%
(cost $3,299) | | | | | | | | 4,109 | |
| | | | | | | | | | | |
| | Total Investments—98.8%
(cost $3,299) | | | | | | | | 4,109 | |
| | Cash and other assets, less liabilities—1.2% | | | | | | | | 48 | |
| | Net assets—100.0% | | | | | | | $ | 4,157 | |
† = U.S. listed foreign security
* Non-income producing securities
See accompanying Notes to Financial Statements.
| June 30, 2013 | William Blair Funds | 85 |
| | SMALL-MID CAP VALUE FUND |
| | |
| | The Small-Mid Cap Value Fund seeks long-term capital appreciation. |
| | |
| | AN OVERVIEW FROM THE PORTFOLIO MANAGERS |
| | |

Chad M. Kilmer 
Mark T. Leslie 
David S. Mitchell | The William Blair Small-Mid Cap Value Fund (Class N shares) posted a 16.74% increase, net of fees, for the six months ended June 30, 2013. By comparison, the Fund’s benchmark index, the Russell 2500TM Value Index (the “Index”), increased 15.10%. Market Review The market’s strong performance during the first five months of the year was fueled by positive economic data. More specifically, improvements in housing and employment data helped instill confidence that the recovery in the market was self-sustaining. The tide seemed to turn mid-June as questions about Federal Reserve Chairman Ben Bernanke’s tenure and possible successors injected uncertainty into the market. The Federal Reserve’s plans of “tapering” quantitative easing (i.e., the slowing of its bond buying program) added to the market’s concerns regarding sustainable growth domestically and contributed to a spike in bond yields. Within the next week, stocks around the world sold off over 4.5% before finding some footing and reversing course to close out the quarter. Adding to the questions about tapering and who will succeed Chairman Bernanke, investors were also concerned with a slowdown in emerging markets, China in particular, and the implications a slowdown may have on global and domestic growth. Portfolio Results The Fund’s first half 2013 outperformance relative to the Index was driven by positive stock selection in most sectors of the market. The Fund’s biggest contribution to relative performance came from Financials. This more than offset stock selection within Industrials and Consumer Staples, which detracted from relative performance. The Fund also benefitted from positive relative performance in Energy and Consumer Discretionary. From a style perspective, growth factors were in favor. All companies have a growth rate associated with them, even value stocks. Because the Fund tends to have an overweight to higher growth companies and an underweight to slower growth companies, this was a nice tailwind for the Fund and contributed to relative performance. Looking specifically at stock selection, ESCO Technologies, Joy Global, and Quanex Building Products were the largest detractors from relative performance. More than offsetting the underperformance were investments in Krispy Kreme Doughnuts, WMS Industries, and National Financial Partners. Outlook Despite currently being overshadowed by the other political and legislative agendas, the fiscal debate in Washington D.C. regarding the debt ceiling and potential spending cuts could be headwinds to growth as we move into the second half of 2013. Even in the face of these headwinds, we believe the domestic economy will continue to grind ahead in a slow growth environment. Domestically, we may benefit in the face of strong or weak economic data: strong economic data is good and should help move the markets higher, whereas weaker data may delay tapering of quantitative easing, resulting in support for the markets. Corporate performance remains solid and U.S. stocks have been a relative safe haven versus more interest rate-sensitive asset classes, commodities, and stocks outside the U.S. Broadly speaking, the U.S. housing market remains a tailwind for U.S. employment and GDP as well. In the end, while we are cognizant of various economic scenarios and incorporate these into our stock picking, we focus our time on constructing the portfolio from a bottom-up perspective. As always, we remain focused on finding quality companies at discount prices and corporate transformation opportunities, and we continue to find good ideas across sectors. We believe building a fund with these types of companies should produce solid investment results over the long term. |
| 86 | Semi-Annual Report | June 30, 2013 |
Small-Mid Cap Value Fund
Performance Highlights (Unaudited)
| Average Annual Total Return at 6/30/2013 |
| | | Year
to Date | | 1 Year | | Since
Inception(a) |
| Class N | | | 16.74 | % | | | 24.95 | % | | | 22.40 | % |
| Class I | | | 16.92 | | | | 25.33 | | | | 22.70 | |
| Russell 2500TM Value Index | | | 15.10 | | | | 26.88 | | | | 26.09 | |
| (a) | For the period from December 15, 2011 (Commencement of Operations) to June 30, 2013. |
Performance cited represents past performance. Past performance does not guarantee future results and current performance may be lower or higher than the data quoted. Results shown are average annual total returns, which assume reinvestment of dividends and capital gains. Investment returns and principal will fluctuate and you may have a gain or loss when you sell shares. For the most current month-end performance information, please call 1-800-742-7272, or visit our Web site at www.williamblairfunds.com. Investing in smaller and medium capitalization companies involves special risks, including higher volatility and lower liquidity. Smaller and medium capitalization stocks are also more sensitive to purchase/sale transactions and changes in the issuer’s financial condition. From time to time, the investment advisor may waive fees or reimburse expenses for the Fund. Without these waivers, performance would be lower. Class N shares are available to the general public without a sales load. Class I shares are available to certain institutional investors and advisory clients of William Blair & Company, L.L.C., without a sales load or distribution (12b-1) or service fees.
The performance highlights and graph presented above do not reflect the deduction of taxes that a shareholder would pay on fund distributions or the redemption of fund shares.
Russell 2500TM Value Index consists of midcap-capitalization companies with below average price-to-book ratios and forecasted growth rates.
This report identifies the Fund’s investments on June 30, 2013. These holdings are subject to change. Not all stocks in the Fund performed the same, nor is there any guarantee that these stocks will perform as well in the future. Market forecasts provided in this report may not necessarily come to pass.
Sector Diversification (Unaudited)
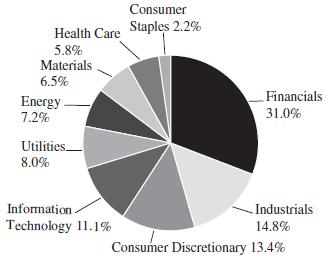
The sector diversification shown is based on the total long-term securities.
| June 30, 2013 | William Blair Funds | 87 |
Small-Mid Cap Value Fund
Portfolio of Investments, June 30, 2013 (all dollar amounts in thousands) (unaudited)
| | | | | | | | |
| | | | | | | | |
| | Issuer | | Shares | | | Value | |
| | | | | | | | | | | |
| | Common Stocks | | | | | | | | | |
| | | | | | | | | | | |
| | Financials—31.0% | | | | | | | | | |
| | Acadia Realty Trust | | | 865 | | | | $ | 21 | |
| | Allied World Assurance Co. Holdings AG† | | | 225 | | | | | 21 | |
| | American Assets Trust, Inc. | | | 935 | | | | | 29 | |
| | American Campus Communities, Inc. | | | 705 | | | | | 29 | |
| | Bank of the Ozarks, Inc. | | | 600 | | | | | 26 | |
| | Banner Corporation | | | 655 | | | | | 22 | |
| * | CIT Group, Inc. | | | 370 | | | | | 17 | |
| | CNO Financial Group, Inc. | | | 1,970 | | | | | 26 | |
| | Comerica, Inc. | | | 820 | | | | | 33 | |
| | Coresite Realty Corporation | | | 351 | | | | | 11 | |
| | East West Bancorp, Inc. | | | 755 | | | | | 21 | |
| | EastGroup Properties, Inc. | | | 470 | | | | | 26 | |
| | Essex Property Trust, Inc. | | | 180 | | | | | 29 | |
| | First Horizon National Corporation | | | 2,500 | | | | | 28 | |
| * | Forest City Enterprises, Inc. | | | 1,310 | | | | | 23 | |
| * | Genworth Financial, Inc. | | | 2,908 | | | | | 33 | |
| | Hartford Financial Services Group, Inc. | | | 1,220 | | | | | 38 | |
| | Highwoods Properties, Inc. | | | 610 | | | | | 22 | |
| | LaSalle Hotel Properties | | | 815 | | | | | 20 | |
| | Old National Bancorp | | | 1,390 | | | | | 19 | |
| | PacWest Bancorp | | | 909 | | | | | 28 | |
| | Pebblebrook Hotel Trust | | | 818 | | | | | 21 | |
| | People’s United Financial, Inc. | | | 1,890 | | | | | 28 | |
| | Post Properties, Inc. | | | 440 | | | | | 22 | |
| | ProAssurance Corporation | | | 514 | | | | | 27 | |
| | Prosperity Bancshares, Inc. | | | 540 | | | | | 28 | |
| | Radian Group, Inc. | | | 2,005 | | | | | 23 | |
| | Selective Insurance Group, Inc. | | | 985 | | | | | 23 | |
| | SL Green Realty Corporation | | | 355 | | | | | 31 | |
| | Susquehanna Bancshares, Inc. | | | 1,935 | | | | | 25 | |
| | Taubman Centers, Inc. | | | 280 | | | | | 21 | |
| | The Hanover Insurance Group, Inc. | | | 500 | | | | | 24 | |
| | Validus Holdings, Ltd.† | | | 840 | | | | | 30 | |
| * | Western Alliance Bancorp | | | 980 | | | | | 16 | |
| | Zions Bancorporation | | | 1,085 | | | | | 31 | |
| | | | | | | | | | 872 | |
| | | | | | | | | | | |
| | Industrials—14.8% | | | | | | | | | |
| | Actuant Corporation | | | 1,002 | | | | | 33 | |
| | Belden, Inc. | | | 505 | | | | | 25 | |
| | CIRCOR International, Inc. | | | 565 | | | | | 29 | |
| | EMCOR Group, Inc. | | | 885 | | | | | 36 | |
| * | FTI Consulting, Inc. | | | 805 | | | | | 26 | |
| | G&K Services, Inc. | | | 720 | | | | | 34 | |
| | Generac Holdings, Inc. | | | 505 | | | | | 19 | |
| | Hubbell, Inc. Class “B” | | | 320 | | | | | 32 | |
| | Interface, Inc. | | | 1,261 | | | | | 21 | |
| * | Moog, Inc. | | | 665 | | | | | 34 | |
| | Pall Corporation | | | 495 | | | | | 33 | |
| | Simpson Manufacturing Co., Inc. | | | 980 | | | | | 29 | |
| | Towers Watson & Co. | | | 405 | | | | | 33 | |
| | Werner Enterprises, Inc. | | | 1,270 | | | | | 31 | |
| | | | | | | | | | 415 | |
| | | | | | | | |
| | | | | | | | |
| | Issuer | | Shares | | | Value | |
| | | | | | | | | | | |
| | Common Stocks—(continued) | | | | | | | | | |
| | | | | | | | | | | |
| | Consumer Discretionary—13.4% | | | | | | | | | |
| | Autoliv, Inc. | | | 330 | | | | $ | 26 | |
| * | Big Lots, Inc. | | | 828 | | | | | 26 | |
| | Dana Holding Corporation | | | 970 | | | | | 19 | |
| * | Genesco, Inc. | | | 310 | | | | | 21 | |
| | H&R Block, Inc. | | | 740 | | | | | 21 | |
| * | Krispy Kreme Doughnuts, Inc. | | | 2,530 | | | | | 44 | |
| * | Life Time Fitness, Inc. | | | 665 | | | | | 33 | |
| | Meredith Corporation | | | 575 | | | | | 27 | |
| | Newell Rubbermaid, Inc. | | | 1,080 | | | | | 28 | |
| | Pier 1 Imports, Inc. | | | 1,085 | | | | | 26 | |
| | Regis Corporation | | | 1,125 | | | | | 18 | |
| * | The Children’s Place Retail Stores, Inc. | | | 450 | | | | | 25 | |
| | The Men’s Wearhouse, Inc. | | | 755 | | | | | 29 | |
| * | The PEP Boys-Manny, Moe & Jack | | | 1,510 | | | | | 17 | |
| | Vail Resorts, Inc. | | | 295 | | | | | 18 | |
| | | | | | | | | | 378 | |
| | | | | | | | | | | |
| | Information Technology—11.1% | | | | | | | | | |
| * | Acxiom Corporation | | | 1,500 | | | | | 34 | |
| | ADTRAN, Inc. | | | 1,113 | | | | | 27 | |
| * | Atmel Corporation | | | 3,995 | | | | | 29 | |
| * | Cadence Design Systems, Inc. | | | 2,520 | | | | | 37 | |
| | Earthlink, Inc. | | | 4,710 | | | | | 29 | |
| | Genpact, Ltd.† | | | 1,480 | | | | | 29 | |
| * | Integrated Device Technology, Inc. | | | 4,490 | | | | | 36 | |
| | j2 Global, Inc. | | | 570 | | | | | 24 | |
| | Monolithic Power Systems, Inc. | | | 858 | | | | | 21 | |
| * | ON Semiconductor Corporation | | | 2,650 | | | | | 21 | |
| * | PTC, Inc. | | | 1,010 | | | | | 25 | |
| | | | | | | | | | 312 | |
| | | | | | | | | | | |
| | Utilities—8.0% | | | | | | | | | |
| | ALLETE, Inc. | | | 525 | | | | | 26 | |
| | American Water Works Co., Inc. | | | 790 | | | | | 33 | |
| | Cleco Corporation | | | 540 | | | | | 25 | |
| | CMS Energy Corporation | | | 930 | | | | | 25 | |
| | Pinnacle West Capital Corporation | | | 340 | | | | | 19 | |
| | PNM Resources, Inc. | | | 1,170 | | | | | 26 | |
| | Southwest Gas Corporation | | | 625 | | | | | 29 | |
| | UIL Holdings Corporation | | | 365 | | | | | 14 | |
| | WGL Holdings, Inc. | | | 645 | | | | | 28 | |
| | | | | | | | | | 225 | |
| | | | | | | | | | | |
| | Energy—7.1% | | | | | | | | | |
| * | Bonanza Creek Energy, Inc. | | | 465 | | | | | 16 | |
| | Gulfmark Offshore, Inc. | | | 535 | | | | | 24 | |
| * | Gulfport Energy Corporation | | | 362 | | | | | 17 | |
| * | Helix Energy Solutions Group, Inc. | | | 930 | | | | | 21 | |
| * | Oasis Petroleum, Inc. | | | 435 | | | | | 17 | |
| * | Rosetta Resources, Inc. | | | 370 | | | | | 16 | |
| * | Rowan Cos. plc† | | | 710 | | | | | 24 | |
| * | Superior Energy Services, Inc. | | | 795 | | | | | 21 | |
| * | TETRA Technologies, Inc. | | | 2,535 | | | | | 26 | |
| * | Whiting Petroleum Corporation | | | 410 | | | | | 19 | |
| | | | | | | | | | 201 | |
See accompanying Notes to Financial Statements.
| 88 | Semi-Annual Report | June 30, 2013 |
Small-Mid Cap Value Fund
Portfolio of Investments, June 30, 2013 (all dollar amounts in thousands) (unaudited)
| | | | | | | | |
| | | | | | | | |
| | Issuer | | Shares | | | Value | |
| | | | | | | | | | | |
| | Common Stocks—(continued) | | | | | | | | | |
| | | | | | | | | | | |
| | Materials—6.5% | | | | | | | | | |
| | Airgas, Inc. | | | 200 | | | | $ | 19 | |
| | Carpenter Technology Corporation | | | 370 | | | | | 17 | |
| | FMC Corporation | | | 430 | | | | | 26 | |
| | Minerals Technologies, Inc. | | | 525 | | | | | 22 | |
| | PolyOne Corporation | | | 1,210 | | | | | 30 | |
| * | RTI International Metals, Inc. | | | 695 | | | | | 19 | |
| | Sensient Technologies Corporation | | | 420 | | | | | 17 | |
| | Silgan Holdings, Inc. | | | 299 | | | | | 14 | |
| | Steel Dynamics, Inc. | | | 1,245 | | | | | 19 | |
| | | | | | | | | | 183 | |
| | | | | | | | | | | |
| | Health Care—5.8% | | | | | | | | | |
| * | CareFusion Corporation | | | 845 | | | | | 31 | |
| | CONMED Corporation | | | 425 | | | | | 13 | |
| * | Greatbatch, Inc. | | | 535 | | | | | 18 | |
| * | HealthSouth Corporation | | | 875 | | | | | 25 | |
| * | Magellan Health Services, Inc. | | | 295 | | | | | 17 | |
| * | Mednax, Inc. | | | 365 | | | | | 33 | |
| * | Mettler-Toledo International, Inc. | | | 130 | | | | | 26 | |
| | | | | | | | | | 163 | |
| | | | | | | | | | | |
| | Consumer Staples—2.2% | | | | | | | | | |
| | Ingredion, Inc. | | | 540 | | | | | 35 | |
| | J&J Snack Foods Corporation | | | 260 | | | | | 20 | |
| | Spartan Stores, Inc. | | | 295 | | | | | 6 | |
| | | | | | | | | | 61 | |
| | | | | | | | | | | |
| | Total Common Stocks—99.9%
(cost $2,314) | | | | | | | | 2,810 | |
| | | | | | | | |
| | Issuer | | Principal
Amount | | | Value | |
| | | | | | | | | | | |
| | Repurchase Agreement | | | | | | | | | |
| | | | | | | | | | | |
| | State Street Bank and Trust Company, 0.010%
dated 6/28/13, due 7/1/13, repurchase
price $35, collateralized by FHLMC,
2.070% due 11/07/2022 | | | $35 | | | | $ | 35 | |
| | | | | | | | | | | |
| | Total Repurchase Agreement—1.2%
(cost $35) | | | | | | | | 35 | |
| | | | | | | | | | | |
| | Total Investments—101.1%
(cost $2,349) | | | | | | | | 2,845 | |
| | Liabilities, plus cash and other assets—(1.1)% | | | | | | | | (32 | ) |
| | Net assets—100.0% | | | | | | | $ | 2,813 | |
† = U.S. listed foreign security
* Non-income producing securities
See accompanying Notes to Financial Statements.
| June 30, 2013 | William Blair Funds | 89 |
| | SMALL CAP VALUE FUND |
| | |
| | The Small Cap Value Fund seeks long-term capital appreciation. |
| | |
| | AN OVERVIEW FROM THE PORTFOLIO MANAGERS |
| | |

Chad M. Kilmer

Mark T. Leslie

David S. Mitchell
| The William Blair Small Cap Value Fund (Class N shares) posted a 17.58% increase, net of fees, for the six months ended June 30, 2013. By comparison, the Fund’s benchmark index, the Russell 2000® Value Index (the “Index”), increased 14.39%. Market Review The market’s strong performance during the first five months of the year was fueled by positive economic data. More specifically, improvements in housing and employment data helped instill confidence that the recovery in the market was self-sustaining. The tide seemed to turn mid-June as questions about Federal Reserve Chairman Ben Bernanke’s tenure and possible successors injected uncertainty into the market. The Federal Reserve’s plans of “tapering” quantitative easing (i.e., the slowing of its bond buying program) added to the market’s concerns regarding sustainable growth domestically and contributed to a spike in bond yields. Within the next week, stocks around the world sold off over 4.5% before finding some footing and reversing course to close out the quarter. Adding to the questions about tapering and who will succeed Chairman Bernanke, investors were also concerned with a slowdown in emerging markets, China in particular, and the implications a slowdown may have on global and domestic growth. Portfolio Results The Fund’s first half 2013 outperformance relative to the Index was driven by positive stock selection in almost every sector of the market. The most significant sectors contributing to relative performance were Financials and Energy. Slightly detracting from performance was a cash drag and stock selection within Industrials. From a style perspective, growth factors were in favor. All companies have a growth rate associated with them, even value stocks. Because the Fund tends to have an overweight to higher growth companies and an underweight to slower growth companies, this was a nice tailwind for the Fund and contributed to relative performance. The Fund’s higher market cap bias versus the Index was a sizeable headwind in the first half of the year as stocks with a market capitalization over $2 billion were the only size segment to underperform during the period. Even in the face of this headwind, our stock selection within this market cap segment was additive to relative performance. Looking specifically at stock selection, ESCO Technologies, Quanex Building Products, and EarthLink were the detractors from relative performance. More than offsetting the underperformance were investments in Krispy Kreme Doughnuts, WMS Industries, and National Financial Partners. Outlook Despite currently being overshadowed by the other political and legislative agendas, the fiscal debate in Washington D.C. regarding the debt ceiling and potential spending cuts could be headwinds to growth as we move into the second half of 2013. Even in the face of these headwinds, we believe the domestic economy will continue to grind ahead in a slow growth environment. Domestically, we may benefit in the face of strong or weak economic data: strong economic data is good and should help move the markets higher, whereas weaker data may delay tapering of quantitative easing, resulting in support for the markets. Corporate performance remains solid and U.S. stocks have been a relative safe haven versus more interest rate-sensitive asset classes, commodities, and stocks outside the U.S. Broadly speaking, the U.S. housing market remains a tailwind for U.S. employment and GDP as well. |
| 90 | Semi-Annual Report | June 30, 2013 |
| | In the end, while we are cognizant of various economic scenarios and incorporate these into our stock picking, we focus our time on constructing the portfolio from a bottom-up perspective. As always, we remain focused on finding quality companies at discount prices and corporate transformation opportunities, and we continue to find good ideas across sectors. We believe building a fund with these types of companies should produce solid investment results over the long term. |
| June 30, 2013 | William Blair Funds | 91 |
Small Cap Value Fund
Performance Highlights (Unaudited)
| Average Annual Total Return at 6/30/2013 |
| | | Year | | | | | | | | |
| | | to Date | | 1 Year | | 3 Year | | 5 Year | | 10 Year |
| Class N | | | 17.58 | % | | | 25.41 | % | | | 17.09 | % | | | 9.84 | % | | | 9.36 | % |
| Class I | | | 17.80 | | | | 25.82 | | | | 17.39 | | | | 10.09 | | | | 9.59 | |
Russell 2000® Value
Index | | | 14.39 | | | | 24.76 | | | | 17.33 | | | | 8.59 | | | | 9.30 | |
Performance cited represents past performance. Past performance does not guarantee future results and current performance may be lower or higher than the data quoted. Results shown are average annual total returns, which assume reinvestment of dividends and capital gains. Investment returns and principal will fluctuate and you may have a gain or loss when you sell shares. For the most current month-end performance information, please call 1-800-742-7272, or visit our Web site at www.williamblairfunds.com. Investing in smaller companies involves special risks, including higher volatility and lower liquidity. Smaller Capitalization stocks are also more sensitive to purchase/sale transactions and changes in the issuer’s financial condition. From time to time, the investment advisor may waive fees or reimburse expenses for the Fund. Without these waivers, performance would be lower. Class N shares are available to the general public without a sales load. Class I shares are available to certain institutional investors and advisory clients of William Blair & Company, L.L.C., without a sales load or distribution (12b-1) or service fees.
The performance highlights and graph presented above do not reflect the deduction of taxes that a shareholder would pay on fund distributions or the redemption of fund shares.
The Russell 2000® Value Index consists of small-capitalization companies with below average price-to-book ratios and forecasted growth rates.
This report identifies the Fund’s investments on June 30, 2013. These holdings are subject to change. Not all stocks in the Fund performed the same, nor is there any guarantee that these stocks will perform as well in the future. Market forecasts provided in this report may not necessarily come to pass.
Sector Diversification (Unaudited)
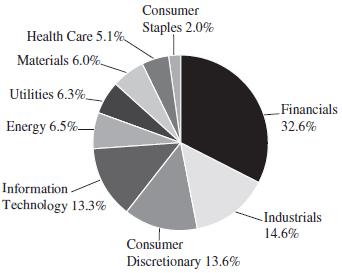
The sector diversification shown is based on the total long-term securities.
| 92 | Semi-Annual Report | June 30, 2013 |
Small Cap Value Fund
Portfolio of Investments, June 30, 2013 (all dollar amounts in thousands) (unaudited)
| | Issuer | | Shares | | | Value | |
| | | | | | | | | |
| | Common Stocks | | | | | | | | | |
| | | | | | | | | | | |
| | Financials—31.8% | | | | | | | | | |
| | Acadia Realty Trust | | | 138,320 | | | | $ | 3,415 | |
| | American Assets Trust, Inc. | | | 103,105 | | | | | 3,182 | |
| | Bank of the Ozarks, Inc. | | | 87,650 | | | | | 3,798 | |
| | Banner Corporation | | | 103,400 | | | | | 3,494 | |
| | Berkshire Hills Bancorp, Inc. | | | 126,290 | | | | | 3,506 | |
| | Boston Private Financial Holdings, Inc. | | | 373,213 | | | | | 3,971 | |
| | CNO Financial Group, Inc. | | | 317,385 | | | | | 4,113 | |
| | CoBiz Financial, Inc. | | | 307,945 | | | | | 2,556 | |
| | Coresite Realty Corporation | | | 67,945 | | | | | 2,161 | |
| * | Eagle Bancorp, Inc. | | | 165,055 | | | | | 3,694 | |
| | East West Bancorp, Inc. | | | 129,955 | | | | | 3,574 | |
| | EastGroup Properties, Inc. | | | 63,195 | | | | | 3,556 | |
| | Education Realty Trust, Inc. | | | 338,760 | | | | | 3,465 | |
| | First Horizon National Corporation | | | 269,600 | | | | | 3,020 | |
| * | Forest City Enterprises, Inc. | | | 151,480 | | | | | 2,713 | |
| | FXCM, Inc. | | | 164,068 | | | | | 2,692 | |
| | Highwoods Properties, Inc. | | | 67,155 | | | | | 2,391 | |
| | LaSalle Hotel Properties | | | 95,425 | | | | | 2,357 | |
| | Old National Bancorp | | | 186,176 | | | | | 2,575 | |
| | PacWest Bancorp | | | 133,773 | | | | | 4,100 | |
| | Pebblebrook Hotel Trust | | | 146,829 | | | | | 3,796 | |
| | Post Properties, Inc. | | | 46,880 | | | | | 2,320 | |
| | ProAssurance Corporation | | | 61,675 | | | | | 3,217 | |
| | Prosperity Bancshares, Inc. | | | 73,120 | | | | | 3,787 | |
| | Radian Group, Inc. | | | 266,470 | | | | | 3,096 | |
| * | Safeguard Scientifics, Inc. | | | 226,506 | | | | | 3,635 | |
| | Selective Insurance Group, Inc. | | | 153,285 | | | | | 3,529 | |
| | Susquehanna Bancshares, Inc. | | | 268,620 | | | | | 3,452 | |
| | The Hanover Insurance Group, Inc. | | | 74,100 | | | | | 3,626 | |
| * | Western Alliance Bancorp | | | 211,100 | | | | | 3,342 | |
| | | | | | | | | | 98,133 | |
| | | | | | | | | | | |
| | Industrials—14.3% | | | | | | | | | |
| | Actuant Corporation | | | 112,458 | | | | | 3,708 | |
| | Belden, Inc. | | | 60,650 | | | | | 3,028 | |
| | CIRCOR International, Inc. | | | 70,185 | | | | | 3,570 | |
| | EMCOR Group, Inc. | | | 116,106 | | | | | 4,720 | |
| * | FTI Consulting, Inc. | | | 103,233 | | | | | 3,395 | |
| | G&K Services, Inc. | | | 88,938 | | | | | 4,233 | |
| | Generac Holdings, Inc. | | | 54,830 | | | | | 2,029 | |
| | Interface, Inc. | | | 154,569 | | | | | 2,623 | |
| | Kadant, Inc. | | | 90,954 | | | | | 2,744 | |
| * | Moog, Inc. | | | 89,369 | | | | | 4,605 | |
| * | Northwest Pipe Co. | | | 94,690 | | | | | 2,642 | |
| | Simpson Manufacturing Co., Inc. | | | 116,065 | | | | | 3,415 | |
| | Werner Enterprises, Inc. | | | 142,820 | | | | | 3,452 | |
| | | | | | | | | | 44,164 | |
| | | | | | | | | | | |
| | Consumer Discretionary—13.3% | | | | | | | | | |
| * | Big Lots, Inc. | | | 89,065 | | | | | 2,808 | |
| | Core-Mark Holding Co., Inc. | | | 33,015 | | | | | 2,097 | |
| | Dana Holding Corporation | | | 171,920 | | | | | 3,311 | |
| * | Genesco, Inc. | | | 40,400 | | | | | 2,706 | |
| * | Krispy Kreme Doughnuts, Inc. | | | 341,840 | | | | | 5,965 | |
| * | Life Time Fitness, Inc. | | | 77,670 | | | | | 3,892 | |
| | Meredith Corporation | | | 72,435 | | | | | 3,455 | |
| | Pier 1 Imports, Inc. | | | 143,455 | | | | | 3,370 | |
| | Issuer | | Shares | | | Value | |
| | | | | | | | | |
| | Common Stocks—(continued) | | | | | | | | | |
| | | | | | | | | | | |
| | Consumer Discretionary—(continued) | | | | | | | | | |
| | Regis Corporation | | | 140,475 | | | | $ | 2,307 | |
| * | The Children’s Place Retail Stores, Inc. | | | 57,080 | | | | | 3,128 | |
| | The Men’s Wearhouse, Inc. | | | 91,100 | | | | | 3,448 | |
| * | The PEP Boys-Manny, Moe & Jack | | | 200,680 | | | | | 2,324 | |
| | Vail Resorts, Inc. | | | 37,170 | | | | | 2,287 | |
| | | | | | | | | | 41,098 | |
| | | | | | | | | | | |
| | Information Technology—13.0% | | | | | | | | | |
| * | Acxiom Corporation | | | 161,160 | | | | | 3,655 | |
| | ADTRAN, Inc. | | | 149,335 | | | | | 3,675 | |
| * | Atmel Corporation | | | 429,340 | | | | | 3,156 | |
| * | Cadence Design Systems, Inc. | | | 271,800 | | | | | 3,936 | |
| | Earthlink, Inc. | | | 558,760 | | | | | 3,470 | |
| | Genpact, Ltd.† | | | 167,520 | | | | | 3,223 | |
| * | Inphi Corporation | | | 189,706 | | | | | 2,087 | |
| * | Integrated Device Technology, Inc. | | | 480,082 | | | | | 3,812 | |
| * | IntraLinks Holdings, Inc. | | | 250,720 | | | | | 1,820 | |
| | j2 Global, Inc. | | | 55,125 | | | | | 2,343 | |
| | Monolithic Power Systems, Inc. | | | 92,464 | | | | | 2,229 | |
| * | ON Semiconductor Corporation | | | 293,270 | | | | | 2,369 | |
| * | PTC, Inc. | | | 119,635 | | | | | 2,935 | |
| * | Ultra Clean Holdings | | | 250,572 | | | | | 1,516 | |
| | | | | | | | | | 40,226 | |
| | | | | | | | | | | |
| | Energy—6.3% | | | | | | | | | |
| * | Bonanza Creek Energy, Inc. | | | 62,020 | | | | | 2,199 | |
| | Gulfmark Offshore, Inc. | | | 72,244 | | | | | 3,257 | |
| * | Gulfport Energy Corporation | | | 49,320 | | | | | 2,321 | |
| * | Helix Energy Solutions Group, Inc. | | | 154,365 | | | | | 3,557 | |
| * | Oasis Petroleum, Inc. | | | 59,135 | | | | | 2,299 | |
| * | Rosetta Resources, Inc. | | | 50,425 | | | | | 2,144 | |
| * | TETRA Technologies, Inc. | | | 358,175 | | | | | 3,675 | |
| | | | | | | | | | 19,452 | |
| | | | | | | | | | | |
| | Utilities—6.1% | | | | | | | | | |
| | ALLETE, Inc. | | | 62,115 | | | | | 3,096 | |
| | Chesapeake Utilities Corporation | | | 11,027 | | | | | 568 | |
| | Cleco Corporation | | | 66,860 | | | | | 3,104 | |
| | PNM Resources, Inc. | | | 139,985 | | | | | 3,106 | |
| | Southwest Gas Corporation | | | 69,650 | | | | | 3,259 | |
| | UIL Holdings Corporation | | | 71,152 | | | | | 2,722 | |
| | WGL Holdings, Inc. | | | 71,360 | | | | | 3,084 | |
| | | | | | | | | | 18,939 | |
| | | | | | | | | | | |
| | Materials—5.8% | | | | | | | | | |
| | Minerals Technologies, Inc. | | | 91,560 | | | | | 3,785 | |
| | PolyOne Corporation | | | 204,545 | | | | | 5,069 | |
| * | RTI International Metals, Inc. | | | 101,635 | | | | | 2,816 | |
| | Sensient Technologies Corporation | | | 82,660 | | | | | 3,345 | |
| | Silgan Holdings, Inc. | | | 64,385 | | | | | 3,024 | |
| | | | | | | | | | 18,039 | |
| | | | | | | | | | | |
| | Health Care—5.0% | | | | | | | | | |
| | CONMED Corporation | | | 90,585 | | | | | 2,830 | |
| * | Greatbatch, Inc. | | | 104,475 | | | | | 3,426 | |
| * | HealthSouth Corporation | | | 105,305 | | | | | 3,033 | |
| * | Magellan Health Services, Inc. | | | 42,505 | | | | | 2,383 | |
| * | Mednax, Inc. | | | 40,203 | | | | | 3,682 | |
| | | | | | | | | | 15,354 | |
See accompanying Notes to Financial Statements.
| June 30, 2013 | William Blair Funds | 93 |
Small Cap Value Fund
Portfolio of Investments, June 30, 2013 (all dollar amounts in thousands) (unaudited)
| | | | Shares or | | | | | |
| | | | Principal | | | | | |
| | Issuer | | Amount | | | Value | |
| | | | | | | | | |
| | Common Stocks—(continued) | | | | | | | | | |
| | | | | | | | | | | |
| | Consumer Staples—2.0% | | | | | | | | | |
| | J&J Snack Foods Corporation | | | 38,687 | | | | $ | 3,010 | |
| | Spartan Stores, Inc. | | | 170,094 | | | | | 3,136 | |
| | | | | | | | | | 6,146 | |
| | Total Common Stocks—97.6%
(cost $243,678) | | | | | | | | 301,551 | |
| | | | | | | | | | | |
| | Repurchase Agreement | | | | | | | | | |
| | Fixed Income Clearing Corporation, 0.010%
dated 6/28/13, due 7/1/13, repurchase
price $8,134, collateralized by U.S.
Treasury Note, 0.750%, due 10/31/17 | | | $8,134 | | | | | 8,134 | |
| | | | | | | | | | | |
| | Total Repurchase Agreement—2.7%
(cost $8,134) | | | | | | | | 8,134 | |
| | | | | | | | | | | |
| | Total Investments—100.3%
(cost $251,812) | | | | | | | | 309,685 | |
| | Liabilities, plus cash and other assets—(0.3)% | | | | | | | | (818 | ) |
| | Net assets—100.0% | | | | | | | $ | 308,867 | |
* Non-income producing securities
† = U.S. listed foreign security
See accompanying Notes to Financial Statements.
| 94 | Semi-Annual Report | June 30, 2013 |
| | BOND FUND |
| | |
| | The Bond Fund seeks to outperform the Barclays Capital U.S. Aggregate Bond Index by maximizing total return through a combination of income and capital appreciation. |
| | |
| | AN OVERVIEW FROM THE PORTFOLIO MANAGERS |
| | |

Christopher T. Vincent

Paul J. Sularz | The William Blair Bond Fund (Class N shares) posted a 3.37% decrease, net of fees, for the six months ended June 30, 2013. By comparison, the Fund’s benchmark index, the Barclays U.S. Aggregate Bond Index (the “Index”), decreased 2.44%. Portfolio Results The Fund’s underperformance year-to-date was caused primarily by two factors: an overweight to investment-grade corporate bonds and an allocation to U.S. Treasury Inflation-Protected Securities (“TIPS”). Factors that had a positive impact on the Fund’s performance year-to-date included security selection among mortgage-backed securities (“MBS”) and an allocation to high yield corporate bonds. The Fund’s overweight to investment-grade corporate bonds detracted year-to-date. Corporate risk spreads widened during the second quarter of 2013 due to elevated levels of volatility created by uncertainty regarding when and how the Federal Open Market Committee (“FOMC”) will end its quantitative easing programs. The Fund’s allocation to TIPS also had a negative effect on performance year-to-date. TIPS underperformed the broad market because the market’s expectations for inflation declined due to the FOMC’s signals that it will slow down the pace of purchases in its quantitative easing programs, with the result being less inflationary pressures. Despite the Fund’s underperformance, there were some themes that contributed year-to-date. Security selection among MBS impacted performance favorably. The Fund avoided mortgages that the FOMC purchased in its quantitative easing programs, and that helped performance as those bonds struggled during the quarter. The MBS owned in the Fund performed better than the Index and were a source of relative value. The Fund’s allocation to high yield corporate bonds also provided some performance benefits. High yield corporate bonds outperformed the Index, and their inclusion in the Fund helped mitigate declines year-to-date. Fixed Income Markets Summary & Outlook Fixed income instruments declined year-to-date after a volatile second quarter. Interest rates rose, interest rate volatility spiked, and risk spreads widened. The 10-year Treasury note yielded 2.49% at June 30, 2013. We believe that the threat of a sustained, rapid rise in interest rates is subdued, though longer-term interest rates may trend higher. Interest rate volatility has increased due to uncertainty surrounding the timing and magnitude of the FOMC’s exit from its quantitative easing programs. However, the FOMC continues to assert that its policy interest rate will be maintained at low levels until the unemployment rate declines below 6.5% and inflation expectations are well-anchored, and the market’s prices imply that will occur in late 2014 at the earliest. With corporations holding record levels of cash, the corporate bond market remains concerned about shareholder-friendly activities such as leveraged buyouts (“LBOs”), large share repurchases, and special dividends. We believe idiosyncratic risks are among the top issues for investment-grade corporate bond investors, but we do not believe the market will enter a period of excessive LBO activity. We believe that spread sectors are poised to lead the market. Risk premiums across all spread sectors remain elevated versus long-term averages but not approaching the historically cheap levels experienced in prior years. In addition, fundamentals are strong, as corporations’ balance sheets are strong given their historically high level of cash holdings. For these reasons, coupled with the low level of Treasury interest rates, we are bullish on spread products relative to Treasuries. |
| June 30, 2013 | William Blair Funds | 95 |
Bond Fund
Performance Highlights (Unaudited)
| Average Annual Total Return at 6/30/2013 |
| | | Year
to Date | | 1 Year | | 3 Year | | 5 Year | | Since
Inception(a) |
| Class N | | | (3.37 | )% | | | 0.73 | % | | | 4.84 | % | | | 6.31 | % | | | 5.80 | % |
| Class I | | | (3.26 | ) | | | 0.94 | | | | 5.02 | | | | 6.48 | | | | 5.97 | |
| Institutional Class | | | (3.19 | ) | | | 1.09 | | | | 5.18 | | | | 6.64 | | | | 6.13 | |
Barclays U.S.
Aggregate
Bond Index | | | (2.44 | ) | | | (0.69 | ) | | | 3.51 | | | | 5.19 | | | | 5.18 | |
| (a) | For the period from May 1, 2007 (Commencement of Operations) to June 30, 2013. |
Performance cited represents past performance. Past performance does not guarantee future results and current performance may be lower or higher than the data quoted. Results shown are average annual total returns, which assume reinvestment of dividends and capital gains. Investment returns and principal will fluctuate and you may have a gain or loss when you sell shares. For the most current month-end performance information, please call 1-800-742-7272, or visit our Web site at www.williamblairfunds.com. From time to time, the investment advisor may waive fees or reimburse expenses for the Fund. Without these waivers, performance would be lower. Class N shares are available to the general public without a sales load. Class I shares are available to certain institutional investors and advisory clients of William Blair & Company, L.L.C., without a sales load or distribution (12b-1) fees. Institutional Class Shares are available to institutional investors without a sales load or distribution (12b-1) or service fees.
The performance highlights and graph presented above do not reflect the deduction of taxes that a shareholder would pay on fund distributions or the redemption of fund shares.
The Barclays U.S. Aggregate Bond Index indicates broad intermediate government/corporate bond market performance.
This report identifies the Fund’s investments on June 30, 2013. These holdings are subject to change. Not all investments in the Fund performed the same, nor is there any guarantee that these investments will perform as well in the future. Market forecasts provided in this report may not necessarily come to pass.
Sector Diversification (Unaudited)

The sector diversification shown is based on the total investments.
| 96 | Semi-Annual Report | June 30, 2013 |
Bond Fund
Portfolio of Investments, June 30, 2013 (all dollar amounts in thousands) (unaudited)
| | Issuer | | Principal
Amount | | | Value | |
| | | | | | | | | |
| | U.S. Government and U.S. Government Agency—44.8% | |
| | | | | | | | | | | |
| | U.S. Treasury Inflation Indexed
Notes/Bonds—7.1% | | | | | | | | | |
| | U.S. Treasury Inflation Indexed | | | | | | | | | |
| | Note, 2.375%, due 1/15/17 | | | $4,612 | | | | $ | 5,113 | |
| | U.S. Treasury Inflation Indexed | | | | | | | | | |
| | Bond, 3.875%, due 4/15/29 | | | 9,336 | | | | | 13,455 | |
| | Total U.S. Treasury Inflation | | | | | | | | | |
| | Indexed Notes/Bonds | | | | | | | | 18,568 | |
| | | | | | | | | | | |
| | U.S. Treasury—0.6% | | | | | | | | | |
| | U.S. Treasury Strip Principal, | | | | | | | | | |
| | 0.000%, due 5/15/20 | | | 1,800 | | | | | 1,575 | |
| | | | | | | | | | | |
| | Government National Mortgage
Association (GNMA)—2.0% | | | | | | | | | |
| # | 344902, 6.250%, due 3/15/14 | | | 2 | | | | | 2 | |
| # | 623162, 6.500%, due 7/15/18 | | | 31 | | | | | 33 | |
| # | 616250, 6.000%, due 2/15/24 | | | 8 | | | | | 9 | |
| # | 422470, 7.500%, due 3/15/26 | | | 1 | | | | | 1 | |
| # | 509405, 7.500%, due 8/15/29 | | | 1 | | | | | 1 | |
| | GNR 2004–2 M5, 4.891%, due
7/16/34 | | | 125 | | | | | 130 | |
| # | 699118, 6.000%, due 9/15/38 | | | 4,431 | | | | | 4,980 | |
| | Total GNMA Mortgage Obligations | | | | | | | | 5,156 | |
| | | | | | | | | | | |
| | Federal Home Loan Mortgage
Corp. (FHLMC)—6.5% | | | | | | | | | |
| # | J16051, 4.500%, due 7/1/26 | | | 1,090 | | | | | 1,164 | |
| # | G01728, 7.500%, due 7/1/32 | | | 233 | | | | | 279 | |
| # | C01385, 6.500%, due 8/1/32 | | | 208 | | | | | 236 | |
| # | A13303, 5.000%, due 9/1/33 | | | 423 | | | | | 470 | |
| # | C01623, 5.500%, due 9/1/33 | | | 275 | | | | | 298 | |
| # | A15039, 5.500%, due 10/1/33 | | | 4 | | | | | 5 | |
| # | G01843, 6.000%, due 6/1/35 | | | 52 | | | | | 58 | |
| # | G02141, 6.000%, due 3/1/36 | | | 1,145 | | | | | 1,282 | |
| # | A62179, 6.000%, due 6/1/37 | | | 528 | | | | | 580 | |
| # | A63539, 6.000%, due 7/1/37 | | | 700 | | | | | 781 | |
| # | A62858, 6.500%, due 7/1/37 | | | 364 | | | | | 407 | |
| # | G03170, 6.500%, due 8/1/37 | | | 911 | | | | | 1,017 | |
| # | A66843, 6.500%, due 10/1/37 | | | 1,442 | | | | | 1,627 | |
| # | A78138, 5.500%, due 6/1/38 | | | 807 | | | | | 894 | |
| # | G04544, 6.000%, due 8/1/38 | | | 2,225 | | | | | 2,436 | |
| # | A81799, 6.500%, due 9/1/38 | | | 1,565 | | | | | 1,761 | |
| # | A86143, 5.000%, due 5/1/39 | | | 97 | | | | | 106 | |
| # | G06017, 5.500%, due 6/1/40 | | | 359 | | | | | 397 | |
| # | C03665, 9.000%, due 4/1/41 | | | 1,493 | | | | | 1,823 | |
| # | G06583, 5.000%, due 6/1/41 | | | 1,194 | | | | | 1,334 | |
| | Total FHLMC Mortgage
Obligations | | | | | | | | 16,955 | |
| | | | | | | | | | | |
| | Federal National Mortgage
Association (FNMA)—28.6% | | | | | | | | | |
| # | 576553, 8.000%, due 2/1/16 | | | 6 | | | | | 7 | |
| # | 580793, 6.000%, due 4/1/16 | | | 1 | | | | | 1 | |
| # | 624506, 6.000%, due 1/1/17 | | | 1 | | | | | 2 | |
| # | 679247, 7.000%, due 8/1/17 | | | 7 | | | | | 7 | |
| # | 689612, 5.000%, due 5/1/18 | | | 192 | | | | | 205 | |
| # | 695910, 5.000%, due 5/1/18 | | | 377 | | | | | 403 | |
| # | 697593, 5.000%, due 5/1/18 | | | 341 | | | | | 364 | |
| # | 770395, 5.000%, due 4/1/19 | | | 7 | | | | | 8 | |
| | Issuer | | Principal
Amount | | | | Value | |
| | | | | | | | | |
| | U.S. Government and U.S. Government Agency—(continued) | |
| | | | | | | | | | | |
| | Federal National Mortgage
Association (FNMA)—(continued) | | | | | | | | | |
| # | 900725, 6.000%, due 8/1/21 | | $ | 99 | | | | $ | 109 | |
| # | 893325, 7.000%, due 9/1/21 | | | 7 | | | | | 8 | |
| # | AA2924, 4.500%, due 4/1/24 | | | 668 | | | | | 727 | |
| # | 932095, 4.000%, due 11/1/24 | | | 2,759 | | | | | 2,978 | |
| # | 255956, 5.500%, due 10/1/25 | | | 43 | | | | | 48 | |
| # | AH2671, 4.000%, due 1/1/26 | | | 364 | | | | | 393 | |
| # | 890329, 4.000%, due 4/1/26 | | | 403 | | | | | 434 | |
| # | AI4872, 4.500%, due 6/1/26 | | | 708 | | | | | 771 | |
| # | AL2851, 4.000%, due 8/1/26 | | | 6,199 | | | | | 6,689 | |
| # | AI9811, 4.500%, due 8/1/26 | | | 462 | | | | | 503 | |
| # | AH9564, 3.500%, due 9/1/26 | | | 951 | | | | | 1,003 | |
| # | AJ8149, 3.500%, due 12/1/26 | | | 1,161 | | | | | 1,225 | |
| # | AJ9402, 4.000%, due 12/1/26 | | | 2,026 | | | | | 2,188 | |
| # | AB4818, 4.000%, due 4/1/27 | | | 1,129 | | | | | 1,220 | |
| # | AP0446, 3.500%, due 7/1/27 | | | 5,101 | | | | | 5,382 | |
| # | AL2590, 4.000%, due 7/1/27 | | | 2,197 | | | | | 2,373 | |
| # | 252925, 7.500%, due 12/1/29 | | | 2 | | | | | 3 | |
| # | 535977, 6.500%, due 4/1/31 | | | 18 | | | | | 20 | |
| # | 253907, 7.000%, due 7/1/31 | | | 3 | | | | | 3 | |
| # | 587849, 6.500%, due 11/1/31 | | | 27 | | | | | 31 | |
| # | 545437, 7.000%, due 2/1/32 | | | 107 | | | | | 122 | |
| # | 545759, 6.500%, due 7/1/32 | | | 1,067 | | | | | 1,181 | |
| # | 678007, 6.000%, due 9/1/32 | | | 21 | | | | | 23 | |
| # | 254548, 5.500%, due 12/1/32 | | | 44 | | | | | 49 | |
| # | 684601, 6.000%, due 3/1/33 | | | 1,048 | | | | | 1,159 | |
| # | 703391, 5.000%, due 5/1/33 | | | 155 | | | | | 167 | |
| # | 708993, 5.000%, due 6/1/33 | | | 65 | | | | | 72 | |
| # | 190340, 5.000%, due 9/1/33 | | | 128 | | | | | 138 | |
| # | 254868, 5.000%, due 9/1/33 | | | 14 | | | | | 15 | |
| # | 727056, 5.000%, due 9/1/33 | | | 693 | | | | | 772 | |
| # | 739243, 6.000%, due 9/1/33 | | | 1,321 | | | | | 1,483 | |
| # | 739331, 6.000%, due 9/1/33 | | | 642 | | | | | 721 | |
| # | 555800, 5.500%, due 10/1/33 | | | 146 | | | | | 159 | |
| # | 555946, 5.500%, due 11/1/33 | | | 568 | | | | | 636 | |
| # | 756153, 5.500%, due 11/1/33 | | | 1,348 | | | | | 1,508 | |
| # | 762505, 5.500%, due 11/1/33 | | | 273 | | | | | 305 | |
| # | 725017, 5.500%, due 12/1/33 | | | 66 | | | | | 73 | |
| # | 725205, 5.000%, due 3/1/34 | | | 1,739 | | | | | 1,881 | |
| # | 725232, 5.000%, due 3/1/34 | | | 1,842 | | | | | 1,992 | |
| # | 725238, 5.000%, due 3/1/34 | | | 654 | | | | | 708 | |
| # | 763798, 5.500%, due 3/1/34 | | | 195 | | | | | 218 | |
| # | 776964, 5.000%, due 4/1/34 | | | 522 | | | | | 579 | |
| # | 725611, 5.500%, due 6/1/34 | | | 265 | | | | | 291 | |
| # | 783786, 5.500%, due 7/1/34 | | | 200 | | | | | 223 | |
| # | 786546, 6.000%, due 7/1/34 | | | 566 | | | | | 632 | |
| # | 787816, 6.000%, due 7/1/34 | | | 655 | | | | | 736 | |
| # | 190353, 5.000%, due 8/1/34 | | | 192 | | | | | 207 | |
| # | 794474, 6.000%, due 10/1/34 | | | 116 | | | | | 129 | |
| # | 745092, 6.500%, due 7/1/35 | | | 782 | | | | | 875 | |
| # | 357944, 6.000%, due 9/1/35 | | | 58 | | | | | 65 | |
| # | 829306, 6.000%, due 9/1/35 | | | 614 | | | | | 669 | |
| # | 836140, 5.500%, due 10/1/35 | | | 99 | | | | | 110 | |
| # | 843487, 6.000%, due 10/1/35 | | | 182 | | | | | 204 | |
| # | 849191, 6.000%, due 1/1/36 | | | 382 | | | | | 425 | |
| # | 848782, 6.500%, due 1/1/36 | | | 495 | | | | | 558 | |
| # | 745349, 6.500%, due 2/1/36 | | | 747 | | | | | 843 | |
See accompanying Notes to Financial Statements.
| June 30, 2013 | William Blair Funds | 97 |
Bond Fund
Portfolio of Investments, June 30, 2013 (all dollar amounts in thousands) (unaudited)
| | Issuer | | NRSRO
Rating | | | Principal
Amount | | | | Value | |
| | | | | | | | | | | | |
| | U.S. Government and U.S. Government Agency—(continued) | |
| | | | | | | | | | | | | | | |
| | Federal National Mortgage
Association (FNMA)—(continued) | | | | | | | | | | | | | |
| # | 888305, 7.000%, due 3/1/36 | | | | | | $ | 20 | | | | $ | 23 | |
| # | 895637, 6.500%, due 5/1/36 | | | | | | | 267 | | | | | 300 | |
| # | 831540, 6.000%, due 6/1/36 | | | | | | | 86 | | | | | 96 | |
| # | 745802, 6.000%, due 7/1/36 | | | | | | | 366 | | | | | 411 | |
| # | 886220, 6.000%, due 7/1/36 | | | | | | | 799 | | | | | 896 | |
| # | 893318, 6.500%, due 8/1/36 | | | | | | | 104 | | | | | 117 | |
| # | 902974, 6.000%, due 12/1/36 | | | | | | | 748 | | | | | 830 | |
| # | 909480, 6.000%, due 2/1/37 | | | | | | | 732 | | | | | 814 | |
| # | 938440, 6.000%, due 7/1/37 | | | | | | | 362 | | | | | 401 | |
| # | 928561, 6.000%, due 8/1/37 | | | | | | | 463 | | | | | 519 | |
| # | 948689, 6.000%, due 8/1/37 | | | | | | | 640 | | | | | 703 | |
| # | 946646, 6.000%, due 9/1/37 | | | | | | | 220 | | | | | 246 | |
| # | 888967, 6.000%, due 12/1/37 | | | | | | | 1,495 | | | | | 1,677 | |
| # | 889385, 6.000%, due 2/1/38 | | | | | | | 425 | | | | | 473 | |
| # | 962058, 6.500%, due 3/1/38 | | | | | | | 3,201 | | | | | 3,613 | |
| # | 934006, 6.500%, due 9/1/38 | | | | | | | 946 | | | | | 1,067 | |
| # | 986856, 6.500%, due 9/1/38 | | | | | | | 649 | | | | | 725 | |
| # | 991911, 7.000%, due 11/1/38 | | | | | | | 549 | | | | | 619 | |
| # | AA7611, 5.000%, due 5/1/39 | | | | | | | 1,090 | | | | | 1,217 | |
| # | AA8443, 5.000%, due 6/1/39 | | | | | | | 417 | | | | | 466 | |
| # | 931492, 6.000%, due 7/1/39 | | | | | | | 306 | | | | | 343 | |
| # | AA6898, 6.000%, due 7/1/39 | | | | | | | 1,606 | | | | | 1,805 | |
| # | 932279, 5.000%, due 12/1/39 | | | | | | | 187 | | | | | 206 | |
| # | AE0082, 5.000%, due 5/1/40 | | | | | | | 1,047 | | | | | 1,155 | |
| # | AB1200, 5.500%, due 7/1/40 | | | | | | | 2,302 | | | | | 2,569 | |
| # | AL0913, 6.000%, due 7/1/41 | | | | | | | 2,854 | | | | | 3,159 | |
| # | AK2733, 5.000%, due 2/1/42 | | | | | | | 3,065 | | | | | 3,430 | |
| | Total FNMA Mortgage
Obligations | | | | | | | | | | | | 74,913 | |
| | | | | | | | | | | | | | | |
| | Non-Agency Mortgage-Backed Obligations—0.1% | |
| * | First Plus Home Loan Owner Trust, | | | | | | | | | | | | | |
| | 1997-4, Tranche M1, | | | | | | | | | | | | | |
| | 7.640%, 9/11/23§** | | | D | | | | 199 | | | | | 167 | |
| | | | | | | | | | | | | | | |
| | Asset-Backed Securities—3.6% | | | | | | | | | | | | | |
| | Avis Budget Rental Car Funding | | | | | | | | | | | | | |
| | AESOP LLC—144A, 2010–3A, | | | | | | | | | | | | | |
| | Tranche A, 4.640%, 5/20/16 | | | Aaa | | | | 100 | | | | | 106 | |
| | Centre Point Funding LLC—144A, | | | | | | | | | | | | | |
| | 2010–1A, Tranche 1, | | | | | | | | | | | | | |
| | 5.430%, 7/20/16 | | | A2 | | | | 1,625 | | | | | 1,695 | |
| | Hertz Vehicle Financing LLC—144A, | | | | | | | | | | | | | |
| | 2013–1A, Tranche B1, | | | | | | | | | | | | | |
| | 1.860%, 8/25/17 | | | Baa1 | | | | 1,500 | | | | | 1,480 | |
| | GE Capital Credit Card Master Note | | | | | | | | | | | | | |
| | Trust, 2012–6, Tranche B, | | | | | | | | | | | | | |
| | 1.830%, 8/17/20 | | | AA- | | | | 3,000 | | | | | 2,930 | |
| | SLM Student Loan Trust, 2002–1, | | | | | | | | | | | | | |
| | Tranche B, | | | | | | | | | | | | | |
| | 0.746%, 1/25/21, VRN | | | Aaa | | | | 1,500 | | | | | 1,490 | |
| | Centre Point Funding LLC—144A, | | | | | | | | | | | | | |
| | 2012–2A, Tranche 1, | | | | | | | | | | | | | |
| | 2.610%, 8/20/21 | | | Baa2 | | | | 1,722 | | | | | 1,727 | |
| | Total Asset-Backed Securities | | | | | | | | | | | | 9,428 | |
| | Issuer | | NRSRO
Rating | | | Principal
Amount | | | | Value | |
| | | | | | | | | | | | |
| | Corporate Obligations—51.8% | | | | | | | | | | | | | |
| | | | | | | | | | | | | | | |
| | Ally Financial, Inc.,
5.500%, due 2/15/17 | | | BB- | | | | $1,788 | | | | $ | 1,868 | |
| | Penske Truck Leasing Co.
L.P.—144A,
3.750%, due 5/11/17 | | | BBB+ | | | | 2,000 | | | | | 2,093 | |
| | JPMorgan Chase & Co.,
6.125%, due 6/27/17 | | | A | | | | 1,100 | | | | | 1,241 | |
| | General Motors Financial Co.,
Inc.—144A,
4.750%, due 8/15/17 | | | BB | | | | 1,000 | | | | | 1,025 | |
| | Capital One Financial Corporation,
6.750%, due 9/15/17 | | | A- | | | | 1,900 | | | | | 2,238 | |
| | Exelon Generation Co. LLC,
6.200%, due 10/1/17 | | | BBB+ | | | | 1,160 | | | | | 1,326 | |
| | Toll Brothers Finance Corporation,
8.910%, due 10/15/17 | | | BBB- | | | | 1,050 | | | | | 1,244 | |
| | American Tower Corporation,
4.500%, due 1/15/18 | | | BBB | | | | 1,625 | | | | | 1,733 | |
| | Intesa Sanpaolo SpA,
3.875%, due 1/16/18 | | | BBB+ | | | | 3,000 | | | | | 2,881 | |
| | Banco Davivienda S.A.—144A,
2.950%, due 1/29/18 | | | BBB- | | | | 2,000 | | | | | 1,890 | |
| | Wyndham Worldwide Corporation,
2.500%, due 3/1/18 | | | BBB- | | | | 500 | | | | | 491 | |
| | Morgan Stanley,
6.625%, due 4/1/18 | | | A | | | | 2,575 | | | | | 2,919 | |
| | International Lease Finance Corporation,
3.875%, due 4/15/18 | | | BBB- | | | | 1,400 | | | | | 1,316 | |
| | Regions Financial Corporation,
2.000%, due 5/15/18 | | | BBB- | | | | 2,500 | | | | | 2,363 | |
| | Merrill Lynch & Co., Inc.,
6.875%, due 11/15/18 | | | A | | | | 1,100 | | | | | 1,281 | |
| | Glencore Funding LLC—144A,
1.574%, due 1/15/19, VRN | | | BBB | | | | 3,000 | | | | | 2,788 | |
| | Petrobras Global Finance BV,
2.414%, due 1/15/19, VRN | | | A3 | | | | 2,900 | | | | | 2,842 | |
| | CSX Corporation,
7.375%, due 2/1/19 | | | BBB | | | | 870 | | | | | 1,073 | |
| | Cemex S.A.B. de C.V.—144A,
5.875%, due 3/25/19 | | | B+ | | | | 1,500 | | | | | 1,455 | |
| | Citigroup, Inc.,
8.500%, due 5/22/19 | | | A | | | | 2,050 | | | | | 2,583 | |
| | Roper Industries, Inc.,
6.250%, due 9/1/19 | | | BBB | | | | 1,850 | | | | | 2,153 | |
| | Republic Services, Inc.,
5.500%, due 9/15/19 | | | BBB | | | | 1,725 | | | | | 1,952 | |
| | SBA Communications Corp.—144A,
5.625%, due 10/1/19 | | | B2 | | | | 1,250 | | | | | 1,238 | |
| | Boston Properties L.P.,
5.875%, due 10/15/19 | | | A- | | | | 1,575 | | | | | 1,817 | |
| | Toll Brothers Finance Corporation,
6.750%, due 11/1/19 | | | BBB- | | | | 500 | | | | | 565 | |
| | Ford Motor Credit Co. LLC,
8.125%, due 1/15/20 | | | Baa3 | | | | 3,050 | | | | | 3,674 | |
| | Jarden Corporation,
7.500%, due 1/15/20 | | | B1 | | | | 1,550 | | | | | 1,658 | |
| | Johnson Controls, Inc.,
5.000%, due 3/30/20 | | | BBB+ | | | | 1,675 | | | | | 1,840 | |
See accompanying Notes to Financial Statements.
| 98 | Semi-Annual Report | June 30, 2013 |
Bond Fund
Portfolio of Investments, June 30, 2013 (all dollar amounts in thousands) (unaudited)
| Issuer | | NRSRO
Rating | | | Principal
Amount | | | | Value | |
| | | | | | | | | | | |
| Corporate Obligations—(continued) | | | | | | | | | | | | | |
The Goldman Sachs Group, Inc.,
6.000%, due 6/15/20 | | | A | | | $ | 2,575 | | | | $ | 2,893 | |
Hologic, Inc.,
6.250%, due 8/1/20 | | | BB | | | | 1,100 | | | | | 1,141 | |
Alcoa, Inc.,
6.150%, due 8/15/20 | | | BBB- | | | | 2,050 | | | | | 2,100 | |
Omnicom Group, Inc.,
4.450%, due 8/15/20 | | | BBB+ | | | | 2,075 | | | | | 2,156 | |
The Goodyear Tire & Rubber Co.,
8.250%, due 8/15/20 | | | B+ | | | | 1,500 | | | | | 1,642 | |
Georgia-Pacific LLC—144A,
5.400%, due 11/1/20 | | | A | | | | 1,500 | | | | | 1,673 | |
Standard Pacific Corporation,
8.375%, due 1/15/21 | | | B+ | | | | 1,750 | | | | | 1,995 | |
ArcelorMittal,
6.000%, due 3/1/21 | | | BB+ | | | | 1,600 | | | | | 1,592 | |
Wyndham Worldwide Corporation,
5.625%, due 3/1/21 | | | BBB- | | | | 1,000 | | | | | 1,072 | |
Ball Corporation,
5.750%, due 5/15/21 | | | BB+ | | | | 1,550 | | | | | 1,631 | |
Energizer Holdings, Inc.,
4.700%, due 5/19/21 | | | BBB- | | | | 2,050 | | | | | 2,081 | |
Hewlett-Packard Co.,
4.300%, due 6/1/21 | | | A- | | | | 2,900 | | | | | 2,836 | |
JBS USA LLC / JBS USA Finance,
Inc.—144A,
7.250%, due 6/1/21 | | | BB | | | | 1,500 | | | | | 1,500 | |
O’Reilly Automotive, Inc.,
4.625%, due 9/15/21 | | | BBB | | | | 2,275 | | | | | 2,381 | |
Corporation Nacional del Cobre de
Chile—144A,
3.875%, due 11/3/21 | | | A1 | | | | 1,900 | | | | | 1,853 | |
Itau Unibanco Holding S.A.—144A,
6.200%, due 12/21/21 | | | BBB | | | | 2,500 | | | | | 2,531 | |
SLM Corporation,
7.250%, due 1/25/22 | | | BBB- | | | | 2,000 | | | | | 2,100 | |
Fresenius Medical Care US Finance
II, Inc.—144A,
5.875%, due 1/31/22 | | | BB+ | | | | 1,000 | | | | | 1,053 | |
Masco Corporation,
5.950%, due 3/15/22 | | | BBB- | | | | 1,675 | | | | | 1,759 | |
BE Aerospace, Inc.,
5.250%, due 4/1/22 | | | BB | | | | 1,550 | | | | | 1,542 | |
Discover Financial Services,
5.200%, due 4/27/22 | | | BBB | | | | 2,150 | | | | | 2,219 | |
Embraer S.A.,
5.150%, due 6/15/22 | | | BBB | | | | 2,500 | | | | | 2,506 | |
Bancolombia S.A.,
5.125%, due 9/11/22 | | | BBB- | | | | 1,750 | | | | | 1,667 | |
DR Horton, Inc.,
4.375%, due 9/15/22 | | | BB | | | | 1,350 | | | | | 1,283 | |
Mexichem S.A.B. de C.V.—144A,
4.875%, due 9/19/22 | | | BBB- | | | | 1,500 | | | | | 1,508 | |
WEA Finance LLC—144A,
3.375%, due 10/3/22 | | | A2 | | | | 2,650 | | | | | 2,498 | |
American Axle & Manufacturing, Inc.,
6.625%, due 10/15/22 | | | B | | | | 1,550 | | | | | 1,573 | |
| Issuer | | | NRSRO
Rating | | | Principal
Amount | | | | Value | |
| | | | | | | | | | | | |
| Corporate Obligations—(continued) | | | | | | | | | | | | | | |
Southern Copper Corporation,
3.500%, due 11/8/22 | | | | BBB+ | | | $ | 1,750 | | | | $ | 1,571 | |
Jones Lang LaSalle, Inc.,
4.400%, due 11/15/22 | | | | Baa2 | | | | 1,650 | | | | | 1,619 | |
Owens Corning,
4.200%, due 12/15/22 | | | | BBB- | | | | 500 | | | | | 484 | |
Royal Bank of Scotland Group plc,
6.125%, due 12/15/22 | | | | BB+ | | | | 3,200 | | | | | 3,045 | |
Carlyle Holdings Finance
LLC—144A,
3.875%, due 2/1/23 | | | | A- | | | | 2,425 | | | | | 2,347 | |
Jaguar Land Rover Automotive
plc—144A,
5.625%, due 2/1/23 | | | | BB- | | | | 1,500 | | | | | 1,455 | |
Corporation Lindley S.A.—144A,
4.625%, due 4/12/23 | | | | BBB- | | | | 2,150 | | | | | 2,085 | |
Toll Brothers Finance Corporation,
4.375%, due 4/15/23 | | | | BBB- | | | | 1,300 | | | | | 1,209 | |
The Kroger Co.,
8.000%, due 9/15/29 | | | | BBB | | | | 450 | | | | | 565 | |
Comcast Corporation,
6.450%, due 3/15/37 | | | | A- | | | | 650 | | | | | 777 | |
Yum! Brands, Inc.,
6.875%, due 11/15/37 | | | | BBB | | | | 625 | | | | | 747 | |
JPMorgan Chase & Co.,
6.400%, due 5/15/38 | | | | A+ | | | | 1,470 | | | | | 1,724 | |
Philip Morris International, Inc.,
6.375%, due 5/16/38 | | | | A | | | | 2,175 | | | | | 2,585 | |
General Electric Capital Corporation,
6.875%, due 1/10/39 | | | | AA+ | | | | 750 | | | | | 924 | |
Burlington Northern Santa Fe LLC,
5.750%, due 5/1/40 | | | | A3 | | | | 1,565 | | | | | 1,743 | |
Express Scripts Holding Co.,
6.125%, due 11/15/41 | | | | BBB+ | | | | 2,500 | | | | | 2,887 | |
Gilead Sciences, Inc.,
5.650%, due 12/1/41 | | | | A- | | | | 1,775 | | | | | 1,974 | |
Bank of America Corporation,
5.875%, due 2/7/42 | | | | A | | | | 2,375 | | | | | 2,655 | |
Odebrecht Finance Ltd.—144A,
7.125%, due 6/26/42 | | | | BBB- | | | | 2,000 | | | | | 1,940 | |
Jefferies Group LLC,
6.500%, due 1/20/43 | | | | BBB | | | | 755 | | | | | 723 | |
| Total Corporate Obligations | | | | | | | | | | | | | 135,391 | |
| | | | | | | | | | | | | | | |
Total Long-Term Investments—100.3%
(cost $257,776) | | | | | | | | | | | | | 262,153 | |
| | | | | | | | | | | | | | | |
Total Investments—100.3%
(cost $257,776) | | | | | | | | | | | | | 262,153 | |
Liabilities, plus cash and other
assets—(0.3)% | | | | | | | | | | | | | (821 | ) |
| Net assets—100.0% | | | | | | | | | | | | $ | 261,332 | |
See accompanying Notes to Financial Statements.
| June 30, 2013 | | William Blair Funds | 99 |
Bond Fund
Portfolio of Investments, June 30, 2013 (all dollar amounts in thousands) (unaudited)
NRSRO = Nationally Recognized Statistical Rating Organization—The credit quality ratings of the securities in the Fund reflect the highest category rating by either Fitch Ratings, Moody’s Investors Service Inc., or Standard & Poor’s, a division of the McGraw-Hill Companies, Inc. The obligations of certain U. S. Government-sponsored securities are neither issued nor guaranteed by the U. S. Treasury.
VRN = Variable Rate Note
§ = Deemed illiquid pursuant to Liquidity Procedures approved by the Board of Trustees. This holding represents 0.06% of the net assets at June 30, 2013.
* = Non-income producing security
** = Fair valued pursuant to Valuation Procedures adopted by the Board of Trustees. This holding represents 0.06% of the Fund’s net assets at June 30, 2013.
See accompanying Notes to Financial Statements.
| 100 | Semi-Annual Report | June 30, 2013 |
| | INCOME FUND |
| | |
| | The Income Fund seeks a high level of current income with relative stability of principal. |
| | |
| | AN OVERVIEW FROM THE PORTFOLIO MANAGER |
| | |

Christopher T. Vincent | The William Blair Income Fund (Class N shares) posted a 2.45% decrease, net of fees, for the six months ended June 30, 2013. By comparison, the Fund’s benchmark index, the Barclays U.S. Intermediate Government/Credit Index (the “Index”), decreased 1.45%. Portfolio Results The Fund’s underperformance year-to-date was caused primarily by two factors: an overweight to investment-grade corporate bonds and an allocation to U.S. Treasury Inflation-Protected Securities (“TIPS”). Factors that had a positive impact on the Fund’s performance year-to-date included security selection among mortgage-backed securities (“MBS”) and its defensive position on interest rate exposure. The Fund’s overweight to investment-grade corporate bonds detracted year-to-date. Corporate risk spreads widened during the second quarter of 2013 due to elevated levels of volatility created by uncertainty regarding when and how the Federal Open Market Committee (“FOMC”) will end its quantitative easing programs. The Fund’s allocation to TIPS also had a negative effect on performance year-to-date. TIPS underperformed the broad market because the market’s expectations for inflation declined due to the FOMC’s signals that it will slow down the pace of purchases in its quantitative easing programs, with the result being less inflationary pressures. Despite the Fund’s underperformance, there were some themes that contributed year-to-date. Security selection among MBS impacted performance favorably. The MBS owned in the Fund were higher-coupon pools that generated consistent levels of income. These pools performed better than the Index and were a source of relative value. The Fund was also positioned defensively on interest rate risk; its duration was shorter than that of its Index. This position helped mitigate declines as interest rates rose year-to-date, and interest rates rose significantly during the second quarter of 2013. Fixed Income Markets Summary & Outlook Fixed income instruments declined year-to-date after a volatile second quarter. Interest rates rose, interest rate volatility spiked, and risk spreads widened. The 10-year Treasury note yielded 2.49% at June 30, 2013. We believe that the threat of a sustained, rapid rise in interest rates is subdued, though longer-term interest rates may trend higher. Interest rate volatility has increased due to uncertainty surrounding the timing and magnitude of the FOMC’s exit from its quantitative easing programs. However, the FOMC continues to assert that its policy interest rate will be maintained at low levels until the unemployment rate declines below 6.5% and inflation expectations are well-anchored, and the market’s prices imply that will occur in late 2014 at the earliest. With corporations holding record levels of cash, the corporate bond market remains concerned about shareholder-friendly activities such as leveraged buyouts (“LBOs”), large share repurchases, and special dividends. We believe idiosyncratic risks are among the top issues for investment-grade corporate bond investors, but we do not believe the market will enter a period of excessive LBO activity. We believe that spread sectors are poised to lead the market. Risk premiums across all spread sectors remain elevated versus long-term averages but not approaching the historically cheap levels experienced in prior years. In addition, fundamentals are strong, as corporations’ balance sheets are strong given their historically high level of cash holdings. For these reasons, coupled with the low level of Treasury interest rates, we are bullish on spread products relative to Treasuries. |
| June 30, 2013 | William Blair Funds | 101 |
Income Fund
Performance Highlights (Unaudited)
| Average Annual Total Return at 6/30/2013 |
| | | | Year
to Date | | | 1 Year | | | 3 Year | | | 5 Year | | | 10 Year |
| Class N | | | (2.45 | )% | | | 0.45 | % | | | 3.54 | % | | | 4.36 | % | | | 3.19 | % |
| Class I | | | (2.36 | ) | | | 0.67 | | | | 3.80 | | | | 4.59 | | | | 3.38 | |
Barclays U.S.
Intermediate
Government/Credit
Bond Index | | | (1.45 | ) | | | 0.28 | | | | 3.14 | | | | 4.57 | | | | 4.03 | |
Performance cited represents past performance. Past performance does not guarantee future results and current performance may be lower or higher than the data quoted. Results shown are average annual total returns, which assume reinvestment of dividends and capital gains. Investment returns and principal will fluctuate and you may have a gain or loss when you sell shares. For the most current month-end performance information, please call 1-800-742-7272, or visit our Web site at www.williamblairfunds.com. From time to time, the investment advisor may waive fees or reimburse expenses for the Fund. Without these waivers, performance would be lower. Class N shares are available to the general public without a sales load. Class I shares are available to certain institutional investors and advisory clients of William Blair & Company, L.L.C., without a sales load or distribution (12b-1) or service fees.
The performance highlights and graph presented above do not reflect the deduction of taxes that a shareholder would pay on fund distributions or the redemption of fund shares.
The Barclays Capital U.S. Intermediate Government/Credit Bond Index indicates broad intermediate government/corporate bond market performance.
This report identifies the Fund’s investments on June 30, 2013. These holdings are subject to change. Not all investments in the Fund performed the same, nor is there any guarantee that these investments will perform as well in the future. Market forecasts provided in this report may not necessarily come to pass.
Sector Diversification (Unaudited)
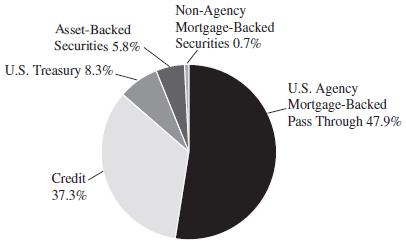
The sector diversification shown is based on the total investments.
| 102 | Semi-Annual Report | June 30, 2013 |
Income Fund
Portfolio of Investments, June 30, 2013 (all dollar amounts in thousands) (unaudited)
| | | | | | | | |
| | Issuer | | Principal
Amount | | | Value | |
| | | | | | | | | | | | |
| | U.S. Government and U.S. Government Agency—55.5% |
| | |
| | U.S. Treasury Inflation Indexed
Notes/Bonds—7.5% | | | | | | | | | | |
| | U.S. Treasury Inflation Indexed
Note, 2.375%, due 1/15/17 | | | $ | 4,180 | | | | $ | 4,633 | |
| | U.S. Treasury Inflation Indexed Note,
1.125%, due 1/15/21 | | | | 4,943 | | | | | 5,287 | |
| | Total U.S. Treasury Inflation Indexed
Notes/Bonds | | | | | | | | | 9,920 | |
| | | | | | | | | | | | |
| | U.S. Treasury—0.7% | | | | | | | | | | |
| | U.S. Treasury Strip Principal,
0.000%, due 5/15/20 | | | | 1,000 | | | | | 875 | |
| | | | | | | | | | | | |
| | Government National Mortgage
Association (GNMA)—0.1% | | | | | | | | | | |
| # | 780405, 9.500%, due 11/15/17 | | | | 66 | | | | | 70 | |
| # | 357322, 7.000%, due 9/15/23 | | | | 50 | | | | | 57 | |
| | Total GNMA Mortgage Obligations | | | | | | | | | 127 | |
| | | | | | | | | | | | |
| | Federal Home Loan Mortgage Corp.
(FHLMC)—8.1% | | | | | | | | | | |
| # | E72924, 7.000%, due 10/1/13 | | | | 16 | | | | | 16 | |
| # | E81703, 7.000%, due 5/1/15 | | | | 52 | | | | | 53 | |
| # | E81697, 8.000%, due 5/1/15 | | | | 216 | | | | | 225 | |
| # | E81908, 8.500%, due 12/1/15 | | | | 19 | | | | | 19 | |
| # | J02184, 8.000%, due 4/1/16 | | | | 117 | | | | | 121 | |
| # | G90022, 8.000%, due 9/17/16 | | | | 68 | | | | | 69 | |
| # | M30028, 5.500%, due 5/1/17 | | | | 8 | | | | | 8 | |
| # | E90398, 7.000%, due 5/1/17 | | | | 295 | | | | | 314 | |
| # | E97112, 4.000%, due 5/1/18 | | | | 128 | | | | | 134 | |
| # | D95621, 6.500%, due 7/1/22 | | | | 1,292 | | | | | 1,434 | |
| # | J16051, 4.500%, due 7/1/26 | | | | 2,019 | | | | | 2,157 | |
| # | J19032, 3.500%, due 5/1/27 | | | | 1,309 | | | | | 1,385 | |
| # | A45790, 7.500%, due 5/1/35 | | | | 170 | | | | | 196 | |
| # | G02141, 6.000%, due 3/1/36 | | | | 573 | | | | | 642 | |
| # | A66843, 6.500%, due 10/1/37 | | | | 653 | | | | | 736 | |
| # | A81799, 6.500%, due 9/1/38 | | | | 877 | | | | | 987 | |
| # | C03665, 9.000%, due 4/1/41 | | | | 724 | | | | | 884 | |
| # | G06583, 5.000%, due 6/1/41 | | | | 1,194 | | | | | 1,334 | |
| | Total FHLMC Mortgage Obligations | | | | | | | | | 10,714 | |
| | | | | | | | | | | | |
| | Federal National Mortgage
Association (FNMA)—39.1% | | | | | | | | | | |
| # | 593561, 9.500%, due 8/1/14 | | | | 16 | | | | | 17 | |
| # | 567027, 7.000%, due 9/1/14 | | | | 76 | | | | | 78 | |
| # | 567026, 6.500%, due 10/1/14 | | | | 40 | | | | | 41 | |
| # | 458124, 7.000%, due 12/15/14 | | | | 17 | | | | | 17 | |
| # | 576554, 8.000%, due 1/1/16 | | | | 268 | | | | | 282 | |
| # | 576553, 8.000%, due 2/1/16 | | | | 385 | | | | | 406 | |
| # | 555747, 8.000%, due 5/1/16 | | | | 26 | | | | | 28 | |
| # | 735569, 8.000%, due 10/1/16 | | | | 182 | | | | | 192 | |
| # | 725410, 7.500%, due 4/1/17 | | | | 53 | | | | | 55 | |
| # | 643217, 6.500%, due 6/1/17 | | | | 113 | | | | | 121 | |
| # | 679247, 7.000%, due 8/1/17 | | | | 391 | | | | | 416 | |
| # | 695910, 5.000%, due 5/1/18 | | | | 392 | | | | | 419 | |
| # | 740847, 6.000%, due 10/1/18 | | | | 236 | | | | | 252 | |
| # | 323501, 6.500%, due 1/1/19 | | | | 77 | | | | | 83 | |
| # | 751313, 5.000%, due 3/1/19 | | | | 337 | | | | | 365 | |
| # | 852864, 7.000%, due 7/1/20 | | | | 899 | | | | | 989 | |
| # | 458147, 10.000%, due 8/15/20 | | | | 203 | | | | | 232 | |
| | | | | | | | |
| | Issuer | | Principal
Amount | | | Value | |
| | | | | | | | | | |
| | U.S. Government and U.S. Government Agency—(continued) |
| | |
| | Federal National Mortgage
Association (FNMA)—(continued) | | | | | | | | | | |
| # | 835563, 7.000%, due 10/1/20 | | | $ | 346 | | | | $ | 380 | |
| # | 831430, 5.500%, due 3/1/21 | | | | 582 | | | | | 626 | |
| # | 735574, 8.000%, due 3/1/22 | | | | 235 | | | | | 263 | |
| # | 679253, 6.000%, due 10/1/22 | | | | 616 | | | | | 681 | |
FNR G93–19 SH, 11.234%, due
4/25/23, VRN | | | | 11 | | | | | 13 | |
| # | 982878, 4.500%, due 5/1/23 | | | | 470 | | | | | 506 | |
| # | 932095, 4.000%, due 11/1/24 | | | | 8,755 | | | | | 9,449 | |
| # | AC5124, 4.000%, due 11/1/24 | | | | 537 | | | | | 579 | |
| # | AC6257, 4.000%, due 12/1/24 | | | | 132 | | | | | 142 | |
| # | AD8164, 4.000%, due 8/1/25 | | | | 735 | | | | | 793 | |
| # | AE1176, 4.000%, due 8/1/25 | | | | 649 | | | | | 700 | |
| # | 255956, 5.500%, due 10/1/25 | | | | 130 | | | | | 143 | |
| # | AB2256, 3.500%, due 2/1/26 | | | | 1,062 | | | | | 1,120 | |
| # | 890329, 4.000%, due 4/1/26 | | | | 2,016 | | | | | 2,168 | |
| # | AL2851, 4.000%, due 8/1/26 | | | | 2,657 | | | | | 2,867 | |
| # | AI9811, 4.500%, due 8/1/26 | | | | 693 | | | | | 755 | |
| # | AJ2322, 3.500%, due 10/1/26 | | | | 838 | | | | | 884 | |
| # | AJ3203, 4.000%, due 10/1/26 | | | | 1,745 | | | | | 1,884 | |
| # | AJ8149, 3.500%, due 12/1/26 | | | | 2,300 | | | | | 2,426 | |
| # | AJ7724, 4.000%, due 12/1/26 | | | | 804 | | | | | 868 | |
| # | AK0498, 3.500%, due 1/1/27 | | | | 491 | | | | | 518 | |
| # | 256639, 5.000%, due 2/1/27 | | | | 28 | | | | | 30 | |
| # | AB4818, 4.000%, due 4/1/27 | | | | 873 | | | | | 943 | |
| # | AP0446, 3.500%, due 7/1/27 | | | | 3,246 | | | | | 3,425 | |
| # | AL2590, 4.000%, due 7/1/27 | | | | 2,728 | | | | | 2,946 | |
| # | 806458, 8.000%, due 6/1/28 | | | | 186 | | | | | 215 | |
| # | 880155, 8.500%, due 7/1/29 | | | | 322 | | | | | 378 | |
| # | 797846, 7.000%, due 3/1/32 | | | | 547 | | | | | 608 | |
| # | 745519, 8.500%, due 5/1/32 | | | | 182 | | | | | 214 | |
| # | 654674, 6.500%, due 9/1/32 | | | | 93 | | | | | 105 | |
| # | 733897, 6.500%, due 12/1/32 | | | | 262 | | | | | 293 | |
| # | 254693, 5.500%, due 4/1/33 | | | | 20 | | | | | 22 | |
| # | 555531, 5.500%, due 6/1/33 | | | | 55 | | | | | 60 | |
| # | 555591, 5.500%, due 7/1/33 | | | | 33 | | | | | 36 | |
| # | 762505, 5.500%, due 11/1/33 | | | | 273 | | | | | 305 | |
| # | 725231, 5.000%, due 2/1/34 | | | | 416 | | | | | 450 | |
| # | 725220, 5.000%, due 3/1/34 | | | | 403 | | | | | 436 | |
| # | 725232, 5.000%, due 3/1/34 | | | | 397 | | | | | 430 | |
| # | 725238, 5.000%, due 3/1/34 | | | | 225 | | | | | 244 | |
| # | 776964, 5.000%, due 4/1/34 | | | | 783 | | | | | 869 | |
| # | 725424, 5.500%, due 4/1/34 | | | | 214 | | | | | 234 | |
| # | 255630, 5.000%, due 3/1/35 | | | | 23 | | | | | 25 | |
| # | 888884, 5.500%, due 12/1/35 | | | | 403 | | | | | 450 | |
| # | 886220, 6.000%, due 7/1/36 | | | | 569 | | | | | 638 | |
| # | 928658, 6.500%, due 9/1/37 | | | | 70 | | | | | 78 | |
| # | 889385, 6.000%, due 2/1/38 | | | | 993 | | | | | 1,105 | |
| # | 962058, 6.500%, due 3/1/38 | | | | 1,121 | | | | | 1,266 | |
| # | 991911, 7.000%, due 11/1/38 | | | | 351 | | | | | 395 | |
| # | AB1200, 5.500%, due 7/1/40 | | | | 767 | | | | | 856 | |
| # | AL0028, 5.000%, due 2/1/41 | | | | 393 | | | | | 439 | |
| # | AL0913, 6.000%, due 7/1/41 | | | | 2,075 | | | | | 2,297 | |
| | Total FNMA Mortgage Obligations | | | | | | | | | 51,550 | |
See accompanying Notes to Financial Statements.
| June 30, 2013 | William Blair Funds | 103 |
Income Fund
Portfolio of Investments, June 30, 2013 (all dollar amounts in thousands) (unaudited)
| | | | | | | | | | | | | | |
| | Issuer | | NRSRO
Rating | | Principal
Amount | | | Value | |
| | | | | | | | | | | | | | |
| | U.S. Government and U.S. Government Agency—(continued) |
| | |
| | Non-Agency Mortgage-Backed
Obligations—0.8% | | | | | | | | | | | | |
| * | First Plus Home Loan Owner Trust,
1997–4, Tranche M1,
7.640%, 9/11/23§** | | D | | | $ | 676 | | | | $ | 565 | |
| * | First Plus Home Loan Owner Trust,
1997–4, Tranche M2,
7.830%, 9/11/23§** | | D | | | | 143 | | | | | 104 | |
| * | First Plus Home Loan Owner Trust,
1998–3, Tranche M2,
7.920%, 5/10/24§** | | Caa1ø | | | | 256 | | | | | 247 | |
| * | Lehman Structured Securities
Corp.—144A, 2004–2, Tranche M1,
2.694%, 2/28/33, VRN§ | | CCC | | | | 291 | | | | | 143 | |
| | Total Non-Agency Mortgage-Backed
Obligations | | | | | | | | | | | 1,059 | |
| | | | | | | | | | | | | | |
| | Asset-Backed Securities—5.7% | | | | | | | | | | | | |
| | Centre Point Funding LLC—144A,
2010–1A, Tranche 1,
5.430%, 7/20/16 | | A2 | | | | 832 | | | | | 868 | |
| | Chase Issuance Trust, 2008-A8,
Tranche A8,
1.393%, 5/15/17, VRN | | AAA | | | | 1,250 | | | | | 1,272 | |
| | Citibank Credit Card Issuance
Trust, 2008-A6, Tranche A6,
1.392%, 5/22/17, VRN | | AAA | | | | 700 | | | | | 713 | |
| | Citibank Omni Master
Trust—144A, 2009-A14A,
Tranche A14,
2.943%, 8/15/18, VRN | | Aaa | | | | 1,000 | | | | | 1,027 | |
| | GE Capital Credit Card Master
Note Trust, 2012–6, Tranche B,
1.830%, 8/17/20 | | AA- | | | | 1,705 | | | | | 1,665 | |
| | SLM Student Loan Trust, 2002–1,
Tranche B,
0.746%, 1/25/21, VRN | | Aaa | | | | 2,000 | | | | | 1,986 | |
| | Total Asset-Backed Securities | | | | | | | | | | | 7,531 | |
| | | | | | | | | | | | | | |
| | Corporate Obligations—36.8% | | | | | | | | | | | | |
| | The Goldman Sachs Group, Inc.,
3.300%, due 5/3/15 | | A | | | | 600 | | | | | 618 | |
| | Bank of America Corporation,
1.093%, due 3/22/16, VRN | | A | | | | 1,000 | | | | | 997 | |
| | BHP Billiton Finance USA, Ltd.,
5.400%, due 3/29/17 | | A+ | | | | 1,000 | | | | | 1,128 | |
| | JPMorgan Chase & Co.,
6.125%, due 6/27/17 | | A | | | | 1,750 | | | | | 1,974 | |
| | American Express Co.,
6.150%, due 8/28/17 | | A+ | | | | 1,500 | | | | | 1,738 | |
| | Capital One Financial Corporation,
6.750%, due 9/15/17 | | A- | | | | 1,000 | | | | | 1,178 | |
| | Standard Chartered Bank—144A,
6.400%, due 9/26/17 | | A+ | | | | 1,000 | | | | | 1,125 | |
| | Wells Fargo & Co.,
5.625%, due 12/11/17 | | AA- | | | | 1,250 | | | | | 1,421 | |
| | | | | | | | | |
| Issuer | | NRSRO
Rating | | Principal
Amount | | | Value | |
| | | | | | | | | | | | | |
| U.S. Government and U.S. Government Agency—(continued) |
| | | | | | | | | | | | | |
| Corporate Obligations—(continued) | | | | | | | | | | | | |
Intesa Sanpaolo SpA,
3.875%, due 1/16/18 | | BBB+ | | | $ | 1,000 | | | | $ | 960 | |
Morgan Stanley,
6.625%, due 4/1/18 | | A | | | | 1,250 | | | | | 1,417 | |
General Electric Capital Corporation,
5.625%, due 5/1/18 | | AA+ | | | | 1,200 | | | | | 1,376 | |
Philip Morris International, Inc.,
5.650%, due 5/16/18 | | A | | | | 1,250 | | | | | 1,441 | |
Simon Property Group L.P.,
6.125%, due 5/30/18 | | A | | | | 1,250 | | | | | 1,469 | |
John Deere Capital Corporation,
5.750%, due 9/10/18 | | A | | | | 1,300 | | | | | 1,517 | |
Merrill Lynch & Co., Inc.,
6.875%, due 11/15/18 | | A | | | | 1,000 | | | | | 1,165 | |
Glencore Funding LLC—144A,
1.574%, due 1/15/19, VRN | | BBB | | | | 1,000 | | | | | 929 | |
Petrobras Global Finance BV,
2.414%, due 1/15/19, VRN | | A3 | | | | 1,250 | | | | | 1,225 | |
Honeywell International, Inc.,
5.000%, due 2/15/19 | | A | | | | 1,280 | | | | | 1,463 | |
The Procter & Gamble Co.,
4.700%, due 2/15/19 | | AA- | | | | 500 | | | | | 564 | |
Citigroup, Inc.,
8.500%, due 5/22/19 | | A | | | | 1,250 | | | | | 1,575 | |
Burlington Northern Santa Fe LLC,
4.700%, due 10/1/19 | | A3 | | | | 1,000 | | | | | 1,110 | |
Boston Properties L.P.,
5.875%, due 10/15/19 | | A- | | | | 1,350 | | | | | 1,557 | |
Royal Bank of Scotland Group plc,
6.400%, due 10/21/19 | | A | | | | 750 | | | | | 833 | |
The Goldman Sachs Group, Inc.,
6.000%, due 6/15/20 | | A | | | | 1,250 | | | | | 1,405 | |
Alcoa, Inc.,
6.150%, due 8/15/20 | | BBB- | | | | 750 | | | | | 768 | |
Georgia-Pacific LLC—144A,
5.400%, due 11/1/20 | | A | | | | 1,000 | | | | | 1,115 | |
Hewlett-Packard Co.,
4.300%, due 6/1/21 | | A- | | | | 1,250 | | | | | 1,222 | |
Corporation Nacional del
Cobre de Chile—144A,
3.875%, due 11/3/21 | | A1 | | | | 1,000 | | | | | 975 | |
Gilead Sciences, Inc.,
4.400%, due 12/1/21 | | A- | | | | 1,425 | | | | | 1,530 | |
Itau Unibanco Holding S.A.—144A,
6.200%, due 12/21/21 | | BBB | | | | 750 | | | | | 759 | |
SLM Corporation,
7.250%, due 1/25/22 | | BBB- | | | | 750 | | | | | 788 | |
Masco Corporation,
5.950%, due 3/15/22 | | BBB- | | | | 1,000 | | | | | 1,050 | |
Potomac Electric Power Co.,
3.050%, due 4/1/22 | | A | | | | 1,000 | | | | | 987 | |
American International Group, Inc.,
4.875%, due 6/1/22 | | A- | | | | 1,275 | | | | | 1,359 | |
Odebrecht Finance Ltd.—144A,
5.125%, due 6/26/22 | | BBB- | | | | 1,000 | | | | | 980 | |
See accompanying Notes to Financial Statements.
| 104 | Semi-Annual Report | June 30, 2013 |
Income Fund
Portfolio of Investments, June 30, 2013 (all dollar amounts in thousands) (unaudited)
| | | | | | | | | | | | | |
| Issuer | | NRSRO
Rating | | Principal
Amount | | | Value | |
| | | | | | | | | | | | | |
| U.S. Government and U.S. Government Agency—(continued) |
| | | | | | | | | | | | | |
| Corporate Obligations—(continued) | | | | | | | | | | | | |
Bancolombia S.A.,
5.125%, due 9/11/22 | | BBB- | | | $ | 1,000 | | | | $ | 953 | |
Mexichem S.A.B. de C.V.—144A,
4.875%, due 9/19/22 | | BBB- | | | | 750 | | | | | 754 | |
WEA Finance LLC—144A,
3.375%, due 10/3/22 | | A2 | | | | 1,000 | | | | | 943 | |
Jones Lang LaSalle, Inc.,
4.400%, due 11/15/22 | | Baa2 | | | | 625 | | | | | 613 | |
Royal Bank of Scotland Group plc,
6.125%, due 12/15/22 | | BB+ | | | | 800 | | | | | 761 | |
Carlyle Holdings Finance
LLC—144A,
3.875%, due 2/1/23 | | A- | | | | 1,200 | | | | | 1,161 | |
Corporation Lindley S.A.—144A,
4.625%, due 4/12/23 | | BBB- | | | | 750 | | | | | 728 | |
Toll Brothers Finance Corporation,
4.375%, due 4/15/23 | | BBB- | | | | 900 | | | | | 837 | |
| Total Corporate Obligations | | | | | | | | | | | 48,468 | |
| | | | | | | | | | | | | |
Total Long-Term Investments—98.8%
(cost $129,503) | | | | | | | | | | | 130,244 | |
| | | | | | | | | | | | | |
Total Investments—98.8%
(cost $129,503) | | | | | | | | | | | 130,244 | |
Cash and other assets, less
liabilities—1.2% | | | | | | | | | | | 1,605 | |
| Net assets—100.0% | | | | | | | | | | $ | 131,849 | |
NRSRO = Nationally Recognized Statistical Rating Organization—The credit quality ratings of the securities in the Fund reflect the highest category rating by either Fitch Ratings, Moody’s Investors Service Inc., or Standard & Poor’s, a division of the McGraw-Hill Companies, Inc.
The obligations of certain U. S. Government-sponsored securities are neither issued nor guaranteed by the U. S. Treasury.
VRN = Variable Rate Note
§ = Deemed illiquid pursuant to Liquidity Procedures approved by the Board of Trustees. These holdings represent 0.80% of the net assets at June 30, 2013.
* = Non-income producing securities
** = Fair valued pursuant to Valuation Procedures adopted by the Board of Trustees. These holdings represent 0.69% of the Fund’s net assets at June 30, 2013.
ø = Moody’s withdrew its rating as of July 29, 2011. The rating shown represents the last issued. The bond currently is not rated by a NRSRO.
See accompanying Notes to Financial Statements.
| June 30, 2013 | William Blair Funds | 105 |
| | LOW DURATION FUND |
| | |
| | The Low Duration Fund seeks to maximize total return. Total return includes both income and capital appreciation. |
| | |
| | AN OVERVIEW FROM THE PORTFOLIO MANAGERS |
| | |
 Christopher T. Vincent 
Paul J. Sularz | The William Blair Low Duration Fund (Class N shares) posted a 1.27% decrease, net of fees, for the six months ended June 30, 2013. By comparison, the Fund’s benchmark index, the Bank of America Merrill Lynch 1-Year U.S. Treasury Note Index (the “Index”), increased 0.11%. Portfolio Results The Fund’s underperformance year-to-date was caused primarily by the performance of mortgage-backed securities (“MBS”) held in the Fund, as MBS comprises the majority of the Fund’s assets (approximately 70%). An allocation to U.S. Treasury Inflation-Protected Securities (“TIPS”) also detracted from performance. Factors that had a positive impact on the Fund’s performance year-to-date included its exposures to floating-rate instruments in the corporate and asset-backed sectors. The Fund’s positioning in MBS detracted year-to-date. MBS risk spreads widened during the second quarter of 2013 due to elevated levels of volatility created by uncertainty regarding when and how the Federal Open Market Committee (“FOMC”) will end its quantitative easing programs. MBS were one of the segments of the bond market that the FOMC targeted in its purchases for the quantitative easing programs. The Fund’s allocation to TIPS also had a negative effect on performance year-to-date. TIPS underperformed the broad market because the market’s expectations for inflation declined due to the FOMC’s signals that it will slow down the pace of purchases in its quantitative easing programs, with the result being less inflationary pressures. An allocation to floating-rate instruments in the corporate and asset-backed sectors mitigated declines year-to-date. The floating-rate instruments helped preserve principal as interest rates rose rapidly during the second quarter of 2013. Fixed Income Markets Summary & Outlook Fixed income instruments declined year-to-date after a volatile second quarter. Interest rates rose, interest rate volatility spiked, and risk spreads widened. The 10-year Treasury note yielded 2.49% at June 30, 2013. We believe that the threat of a sustained, rapid rise in interest rates is subdued, though longer-term interest rates may trend higher. Interest rate volatility has increased due to uncertainty surrounding the timing and magnitude of the FOMC’s exit from its quantitative easing programs. However, the FOMC continues to assert that its policy interest rate will be maintained at low levels until the unemployment rate declines below 6.5% and inflation expectations are well-anchored, and the market’s prices imply that will occur in late 2014 at the earliest. With corporations holding record levels of cash, the corporate bond market remains concerned about shareholder-friendly activities such as leveraged buyouts (“LBOs”), large share repurchases, and special dividends. We believe idiosyncratic risks are among the top issues for investment-grade corporate bond investors, but we do not believe the market will enter a period of excessive LBO activity. We believe that spread sectors are poised to lead the market. Risk premiums across all spread sectors remain elevated versus long-term averages but not approaching the historically cheap levels experienced in prior years. In addition, fundamentals are strong, as corporations’ balance sheets are strong given their historically high level of cash holdings. For these reasons, coupled with the low level of Treasury interest rates, we are bullish on spread products relative to Treasuries. |
| 106 | Semi-Annual Report | June 30, 2013 |
Low Duration Fund
Performance Highlights (Unaudited)
| Average Annual Total Return at 6/30/2013 |
| | | Year
to Date | | 1 Year | | 3 Year | | Since
Inception(a) |
| Class N | | | (1.27 | )% | | | (0.09 | )% | | | 1.22 | % | | | 1.25 | % |
| Class I | | | (1.20 | ) | | | 0.06 | | | | 1.36 | | | | 1.39 | |
| Institutional Class | | | (1.01 | ) | | | 0.32 | | | | 1.53 | | | | 1.58 | |
Bank of America Merrill
Lynch 1-Year U.S.
Treasury Note Index | | | 0.11 | | | | 0.32 | | | | 0.41 | | | | 0.44 | |
| (a) | For the period from December 1, 2009 (Commencement of Operations) to June 30, 2013. |
Performance cited represents past performance. Past performance does not guarantee future results and current performance may be lower or higher than the data quoted. Results shown are average annual total returns, which assume reinvestment of dividends and capital gains. Investment returns and principal will fluctuate and you may have a gain or loss when you sell shares. For the most current month-end performance information, please call 1-800-742-7272, or visit our Web site at www.williamblairfunds.com. From time to time, the investment advisor may waive fees or reimburse expenses for the Fund. Without these waivers, performance would be lower. Class N shares are available to the general public without a sales load. Class I shares are available to certain institutional investors and advisory clients of William Blair & Company, L.L.C., without a sales load or distribution (12b-1) fees. Institutional Class Shares are available to institutional investors without a sales load or distribution (12b-1) or service fees.
The performance highlights and graph presented above do not reflect the deduction of taxes that a shareholder would pay on fund distributions or the redemption of fund shares.
The Bank of America Merrill Lynch 1-Year U.S. Treasury Note Index is comprised of a single U.S. Treasury Note issue purchased at the beginning of the month and held for a full month. Each month the index is rebalanced and the issue selected is the outstanding U.S. Treasury Note that matures closest to, but not beyond one year from the rebalancing date.
This report identifies the Fund’s investments on June 30, 2013. These holdings are subject to change. Not all investments in the Fund performed the same, nor is there any guarantee that these investments will perform as well in the future. Market forecasts provided in this report may not necessarily come to pass.
Sector Diversification (Unaudited)
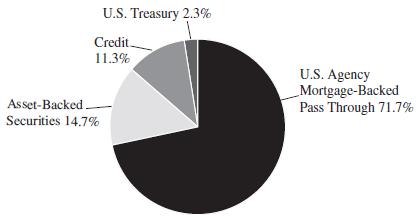
The sector diversification shown is based on the total investments.
| June 30, 2013 | William Blair Funds | 107 |
Low Duration Fund
Portfolio of Investments, June 30, 2013 (all dollar amounts in thousands) (unaudited)
| | | | | | | | |
| | Issuer | | Principal
Amount | | | Value | |
| | | | | | | | | | | |
| | U.S. Government and U.S. Government Agency—72.8% | |
| | | | | | | | | | | |
| | U.S. Treasury Inflation Indexed Notes/Bonds—2.2% | |
| | U.S. Treasury Inflation Indexed Note,
2.375%, due 1/15/17 | | | $3,748 | | | | $ | 4,154 | |
| | U.S. Treasury Inflation Indexed Note,
1.625%, due 1/15/18 | | | 2,220 | | | | | 2,430 | |
| | Total U.S. Treasury Inflation Indexed
Notes/Bonds | | | | | | | | 6,584 | |
| | | | | | | | | | | |
| | Government National Mortgage
Association (GNMA)—0.9% | | | | | | | | | |
| # | 623159, 5.000%, due 11/15/13 | | | 6 | | | | | 6 | |
| # | 628400, 6.000%, due 11/15/13 | | | 15 | | | | | 15 | |
| # | 002682, 6.500%, due 11/20/13 | | | 2 | | | | | 2 | |
| # | 623182, 5.000%, due 12/15/13 | | | 14 | | | | | 16 | |
| # | 781010, 6.500%, due 4/15/14 | | | 12 | | | | | 12 | |
| # | 002761, 6.000%, due 5/20/14 | | | 11 | | | | | 11 | |
| # | 002787, 5.500%, due 7/20/14 | | | 2 | | | | | 2 | |
| # | 781275, 6.000%, due 10/15/14 | | | 38 | | | | | 39 | |
| | GNR 2011–24 VA, 3.500%,
due 2/20/16 | | | 1,054 | | | | | 1,100 | |
| # | 561031, 5.500%, due 9/15/16 | | | 144 | | | | | 153 | |
| # | 003180, 6.000%, due 1/20/17 | | | 22 | | | | | 23 | |
| # | 781567, 5.000%, due 2/15/18 | | | 59 | | | | | 63 | |
| # | 606406, 5.000%, due 4/15/18 | | | 82 | | | | | 89 | |
| # | 003438, 4.500%, due 9/20/18 | | | 142 | | | | | 153 | |
| # | 003465, 4.500%, due 11/20/18 | | | 47 | | | | | 51 | |
| # | 004430, 4.500%, due 5/20/24 | | | 749 | | | | | 803 | |
| | Total GNMA Mortgage Obligations | | | | | | | | 2,538 | |
| | | | | | | | | | | |
| | Federal Home Loan Mortgage
Corp. (FHLMC)—18.6% | | | | | | | | | |
| # | G12631, 5.500%, due 4/1/17 | | | 201 | | | | | 215 | |
| # | G13127, 4.500%, due 4/1/18 | | | 54 | | | | | 56 | |
| # | G11606, 4.500%, due 5/1/18 | | | 22 | | | | | 23 | |
| # | E96962, 4.000%, due 6/1/18 | | | 98 | | | | | 103 | |
| # | E01418, 4.000%, due 7/1/18 | | | 22 | | | | | 23 | |
| # | E01424, 4.000%, due 8/1/18 | | | 11 | | | | | 12 | |
| # | E99160, 4.500%, due 9/1/18 | | | 117 | | | | | 122 | |
| # | E99582, 5.000%, due 9/1/18 | | | 29 | | | | | 30 | |
| # | E99659, 4.500%, due 10/1/18 | | | 160 | | | | | 167 | |
| # | B11362, 5.500%, due 12/1/18 | | | 17 | | | | | 18 | |
| # | G13367, 5.500%, due 12/1/18 | | | 378 | | | | | 404 | |
| # | B11849, 5.500%, due 1/1/19 | | | 194 | | | | | 208 | |
| # | B12826, 4.500%, due 3/1/19 | | | 637 | | | | | 671 | |
| # | B13051, 4.500%, due 4/1/19 | | | 86 | | | | | 92 | |
| # | B13143, 4.500%, due 4/1/19 | | | 428 | | | | | 457 | |
| # | B14961, 4.500%, due 6/1/19 | | | 86 | | | | | 92 | |
| # | B15141, 4.500%, due 6/1/19 | | | 85 | | | | | 90 | |
| # | G11604, 5.000%, due 7/1/19 | | | 166 | | | | | 177 | |
| # | G11596, 5.500%, due 8/1/19 | | | 141 | | | | | 152 | |
| # | G11605, 5.500%, due 9/1/19 | | | 66 | | | | | 72 | |
| # | B17142, 4.500%, due 11/1/19 | | | 1,047 | | | | | 1,115 | |
| # | B17161, 4.500%, due 11/1/19 | | | 29 | | | | | 31 | |
| # | G11697, 5.500%, due 4/1/20 | | | 1,100 | | | | | 1,189 | |
| # | J02537, 5.000%, due 9/1/20 | | | 66 | | | | | 70 | |
| # | G12113, 5.500%, due 5/1/21 | | | 198 | | | | | 214 | |
| # | E02322, 5.500%, due 5/1/22 | | | 56 | | | | | 61 | |
| # | J06484, 5.500%, due 11/1/22 | | | 460 | | | | | 498 | |
| | | | | | | | |
| | Issuer | | Principal
Amount | | | Value | |
| | | | | | | | | | | |
| | U.S. Government and U.S. Government Agency—(continued) | |
| | | | | | | | | | | |
| | Federal Home Loan Mortgage
Corp. (FHLMC)—(continued) | | | | | | | | | |
| # | J06871, 5.500%, due 1/1/23 | | | $ 161 | | | | $ | 174 | |
| # | J08703, 5.500%, due 9/1/23 | | | 72 | | | | | 78 | |
| # | J10351, 4.000%, due 7/1/24 | | | 288 | | | | | 310 | |
| # | C00351, 8.000%, due 7/1/24 | | | 99 | | | | | 116 | |
| # | G13695, 4.000%, due 9/1/24 | | | 1,361 | | | | | 1,465 | |
| # | G00363, 8.000%, due 6/1/25 | | | 139 | | | | | 161 | |
| # | J12853, 4.000%, due 8/1/25 | | | 200 | | | | | 215 | |
| # | C80329, 8.000%, due 8/1/25 | | | 26 | | | | | 30 | |
| # | J13022, 4.000%, due 9/1/25 | | | 2,473 | | | | | 2,662 | |
| # | J14491, 4.000%, due 2/1/26 | | | 6,741 | | | | | 7,335 | |
| # | G14150, 4.500%, due 4/1/26 | | | 3,235 | | | | | 3,455 | |
| # | E02912, 5.000%, due 6/1/26 | | | 991 | | | | | 1,062 | |
| # | J16051, 4.500%, due 7/1/26 | | | 4,083 | | | | | 4,362 | |
| # | J18361, 3.500%, due 3/1/27 | | | 3,323 | | | | | 3,515 | |
| # | J19032, 3.500%, due 5/1/27 | | | 1,549 | | | | | 1,640 | |
| # | G04053, 5.500%, due 3/1/38 | | | 2,696 | | | | | 2,984 | |
| # | G04424, 6.000%, due 6/1/38 | | | 202 | | | | | 223 | |
| # | G04778, 6.000%, due 7/1/38 | | | 192 | | | | | 215 | |
| # | A81372, 6.000%, due 8/1/38 | | | 72 | | | | | 80 | |
| # | G04544, 6.000%, due 8/1/38 | | | 1,113 | | | | | 1,218 | |
| # | G04687, 6.000%, due 9/1/38 | | | 268 | | | | | 296 | |
| # | G04745, 6.000%, due 9/1/38 | | | 130 | | | | | 143 | |
| # | A81799, 6.500%, due 9/1/38 | | | 824 | | | | | 927 | |
| # | G06964, 5.500%, due 11/1/38 | | | 4,237 | | | | | 4,779 | |
| # | G05723, 6.500%, due 11/1/38 | | | 3,769 | | | | | 4,232 | |
| # | A92646, 5.500%, due 6/1/40 | | | 358 | | | | | 398 | |
| # | G06017, 5.500%, due 6/1/40 | | | 2,344 | | | | | 2,593 | |
| # | G06583, 5.000%, due 6/1/41 | | | 1,592 | | | | | 1,779 | |
| # | 4122, Tranche FP, 0.593%,
due 10/15/42, VRN | | | 1,314 | | | | | 1,313 | |
| | Total FHLMC Mortgage Obligations | | | | | | | | 54,122 | |
| | | | | | | | | | | |
| | Federal National Mortgage
Association (FNMA)—51.1% | | | | | | | | | |
| # | 679220, 6.000%, due 12/1/14 | | | 9 | | | | | 9 | |
| # | 256224, 5.500%, due 4/1/16 | | | 16 | | | | | 17 | |
| # | 254181, 5.000%, due 1/1/17 | | | 51 | | | | | 55 | |
| # | 256559, 5.500%, due 1/1/17 | | | 9 | | | | | 10 | |
| # | 256606, 5.500%, due 2/1/17 | | | 12 | | | | | 13 | |
| # | 256646, 5.500%, due 3/1/17 | | | 10 | | | | | 11 | |
| # | 545862, 5.000%, due 8/1/17 | | | 54 | | | | | 57 | |
| # | 545898, 5.500%, due 9/1/17 | | | 298 | | | | | 314 | |
| # | 545899, 5.500%, due 9/1/17 | | | 314 | | | | | 331 | |
| # | 254510, 5.000%, due 11/1/17 | | | 50 | | | | | 53 | |
| # | 555029, 5.000%, due 11/1/17 | | | 39 | | | | | 42 | |
| # | 254545, 5.000%, due 12/1/17 | | | 22 | | | | | 23 | |
| # | 254590, 5.000%, due 1/1/18 | | | 25 | | | | | 26 | |
| # | 257067, 5.000%, due 1/1/18 | | | 58 | | | | | 62 | |
| # | 663692, 5.000%, due 1/1/18 | | | 116 | | | | | 124 | |
| # | 674713, 5.000%, due 1/1/18 | | | 9 | | | | | 10 | |
| # | 679305, 5.000%, due 1/1/18 | | | 46 | | | | | 49 | |
| # | 254591, 5.500%, due 1/1/18 | | | 233 | | | | | 246 | |
| # | 678938, 5.500%, due 2/1/18 | | | 23 | | | | | 25 | |
| # | 683100, 5.500%, due 2/1/18 | | | 301 | | | | | 318 | |
| # | 254684, 5.000%, due 3/1/18 | | | 15 | | | | | 16 | |
| # | 675717, 5.000%, due 3/1/18 | | | 180 | | | | | 193 | |
See accompanying Notes to Financial Statements.
| 108 | Semi-Annual Report | June 30, 2013 |
Low Duration Fund
Portfolio of Investments, June 30, 2013 (all dollar amounts in thousands) (unaudited)
| | | | | | | | | |
| | Issuer | | | Principal
Amount | | | Value | |
| | | | | | | | | | | |
| | U.S. Government and U.S. Government Agency—(continued) | |
| | | | | | | | | | | |
| | Federal National Mortgage
Association (FNMA)—(continued) | | | | | | | | | |
| # | 681361, 5.000%, due 3/1/18 | | | $ 66 | | | | $ | 70 | |
| # | 656564, 5.000%, due 4/1/18 | | | 1,115 | | | | | 1,191 | |
| # | 696677, 5.000%, due 4/1/18 | | | 72 | | | | | 77 | |
| # | 702888, 5.000%, due 4/1/18 | | | 107 | | | | | 115 | |
| # | 695838, 5.500%, due 4/1/18 | | | 70 | | | | | 74 | |
| # | 254721, 5.000%, due 5/1/18 | | | 180 | | | | | 193 | |
| # | 697593, 5.000%, due 5/1/18 | | | 182 | | | | | 194 | |
| # | 702332, 5.000%, due 5/1/18 | | | 36 | | | | | 39 | |
| # | 704049, 5.500%, due 5/1/18 | | | 703 | | | | | 743 | |
| # | 735357, 5.500%, due 5/1/18 | | | 979 | | | | | 1,037 | |
| # | 656573, 5.000%, due 6/1/18 | | | 179 | | | | | 191 | |
| # | 709848, 5.000%, due 6/1/18 | | | 161 | | | | | 172 | |
| # | 728715, 5.000%, due 7/1/18 | | | 294 | | | | | 314 | |
| # | 735003, 5.500%, due 7/1/18 | | | 1,001 | | | | | 1,060 | |
| # | 711991, 5.000%, due 8/1/18 | | | 156 | | | | | 166 | |
| # | 190341, 5.000%, due 9/1/18 | | | 42 | | | | | 45 | |
| # | 743183, 5.000%, due 10/1/18 | | | 65 | | | | | 70 | |
| # | 555872, 5.000%, due 11/1/18 | | | 162 | | | | | 173 | |
| # | 749596, 5.000%, due 11/1/18 | | | 246 | | | | | 266 | |
| # | 745237, 5.000%, due 12/1/18 | | | 48 | | | | | 51 | |
| # | 753866, 6.000%, due 12/1/18 | | | 337 | | | | | 362 | |
| # | 761246, 5.000%, due 1/1/19 | | | 340 | | | | | 369 | |
| # | 761267, 4.500%, due 2/1/19 | | | 567 | | | | | 617 | |
| # | 255079, 5.000%, due 2/1/19 | | | 42 | | | | | 45 | |
| # | 766059, 5.500%, due 2/1/19 | | | 250 | | | | | 270 | |
| # | 766276, 5.000%, due 3/1/19 | | | 372 | | | | | 400 | |
| # | 742086, 4.500%, due 4/1/19 | | | 2,090 | | | | | 2,275 | |
| # | 779363, 5.000%, due 6/1/19 | | | 71 | | | | | 77 | |
| # | 785259, 5.000%, due 8/1/19 | | | 289 | | | | | 311 | |
| # | 761489, 5.500%, due 9/1/19 | | | 165 | | | | | 178 | |
| # | 788424, 5.500%, due 9/1/19 | | | 69 | | | | | 75 | |
| # | 725953, 5.000%, due 10/1/19 | | | 87 | | | | | 95 | |
| # | 745877, 5.000%, due 1/1/20 | | | 195 | | | | | 212 | |
| # | 735401, 5.500%, due 3/1/20 | | | 191 | | | | | 202 | |
| # | 357865, 5.000%, due 7/1/20 | | | 190 | | | | | 205 | |
| # | 357978, 5.000%, due 9/1/20 | | | 204 | | | | | 221 | |
| # | 745735, 5.000%, due 3/1/21 | | | 638 | | | | | 685 | |
| # | 879607, 5.500%, due 4/1/21 | | | 103 | | | | | 111 | |
| # | 831497, 6.000%, due 4/1/21 | | | 373 | | | | | 408 | |
| # | 880993, 6.000%, due 1/1/22 | | | 24 | | | | | 26 | |
| # | 972934, 5.500%, due 2/1/23 | | | 297 | | | | | 321 | |
| # | 889342, 5.000%, due 3/1/23 | | | 120 | | | | | 128 | |
| # | 982878, 4.500%, due 5/1/23 | | | 425 | | | | | 458 | |
| # | 555734, 5.000%, due 7/1/23 | | | 822 | | | | | 903 | |
| # | 254908, 5.000%, due 9/1/23 | | | 54 | | | | | 58 | |
| # | AE0011, 5.500%, due 9/1/23 | | | 166 | | | | | 179 | |
| # | 747339, 5.500%, due 10/1/23 | | | 406 | | | | | 449 | |
| # | 255165, 4.500%, due 3/1/24 | | | 86 | | | | | 92 | |
| # | 934808, 4.500%, due 3/1/24 | | | 216 | | | | | 232 | |
| # | AA4519, 4.500%, due 3/1/24 | | | 1,663 | | | | | 1,805 | |
| # | AA2922, 4.000%, due 4/1/24 | | | 960 | | | | | 1,035 | |
| # | AA5028, 4.500%, due 4/1/24 | | | 318 | | | | | 346 | |
| # | 190988, 9.000%, due 6/1/24 | | | 142 | | | | | 160 | |
| # | 993231, 4.000%, due 7/1/24 | | | 1,225 | | | | | 1,323 | |
| # | AC1520, 4.000%, due 9/1/24 | | | 140 | | | | | 150 | |
| # | AC3674, 4.500%, due 10/1/24 | | | 1,632 | | | | | 1,776 | |
| | | | | | | | |
| | Issuer | | Principal
Amount | | | Value | |
| | | | | | | | | | | |
| | U.S. Government and U.S. Government Agency—(continued) | |
| | | | | | | | | | | |
| | Federal National Mortgage
Association (FNMA)—(continued) | | | | | | | | | |
| # | AC5410, 4.500%, due 10/1/24 | | | $ 625 | | | | $ | 678 | |
| # | 932095, 4.000%, due 11/1/24 | | | 8,067 | | | | | 8,707 | |
| # | AC5124, 4.000%, due 11/1/24 | | | 1,073 | | | | | 1,158 | |
| # | AC6600, 4.500%, due 11/1/24 | | | 83 | | | | | 90 | |
| # | AC6257, 4.000%, due 12/1/24 | | | 3,749 | | | | | 4,045 | |
| # | AC8857, 4.500%, due 12/1/24 | | | 65 | | | | | 71 | |
| # | AC9560, 5.000%, due 1/1/25 | | | 3,503 | | | | | 3,799 | |
| # | AL3422, 5.000%, due 1/1/25 | | | 1,408 | | | | | 1,578 | |
| # | 932449, 4.000%, due 2/1/25 | | | 429 | | | | | 463 | |
| # | 932629, 4.000%, due 3/1/25 | | | 470 | | | | | 507 | |
| # | AD0855, 4.000%, due 3/1/25 | | | 349 | | | | | 375 | |
| # | 932723, 4.000%, due 4/1/25 | | | 502 | | | | | 542 | |
| # | AD4073, 4.000%, due 5/1/25 | | | 185 | | | | | 200 | |
| # | 935995, 4.000%, due 6/1/25 | | | 186 | | | | | 201 | |
| # | AD4677, 4.000%, due 6/1/25 | | | 1,845 | | | | | 1,991 | |
| # | AD8164, 4.000%, due 8/1/25 | | | 4,023 | | | | | 4,341 | |
| # | AE1176, 4.000%, due 8/1/25 | | | 730 | | | | | 787 | |
| # | AB1459, 4.000%, due 9/1/25 | | | 359 | | | | | 387 | |
| # | AD8190, 4.000%, due 9/1/25 | | | 1,616 | | | | | 1,738 | |
| # | AH2671, 4.000%, due 1/1/26 | | | 1,711 | | | | | 1,847 | |
| # | 890329, 4.000%, due 4/1/26 | | | 3,025 | | | | | 3,252 | |
| # | AI4856, 4.500%, due 6/1/26 | | | 3,043 | | | | | 3,313 | |
| # | AL2851, 4.000%, due 8/1/26 | | | 3,542 | | | | | 3,822 | |
| # | AH9564, 3.500%, due 9/1/26 | | | 4,287 | | | | | 4,522 | |
| # | AB3497, 4.000%, due 9/1/26 | | | 1,787 | | | | | 1,922 | |
| # | AB3608, 3.500%, due 10/1/26 | | | 4,259 | | | | | 4,493 | |
| # | AI7363, 3.500%, due 10/1/26 | | | 1,119 | | | | | 1,180 | |
| # | AJ2322, 3.500%, due 10/1/26 | | | 3,924 | | | | | 4,139 | |
| # | AB3975, 3.500%, due 12/1/26 | | | 1,532 | | | | | 1,616 | |
| # | AJ8149, 3.500%, due 12/1/26 | | | 3,006 | | | | | 3,171 | |
| # | AJ7724, 4.000%, due 12/1/26 | | | 2,412 | | | | | 2,605 | |
| # | AK0498, 3.500%, due 1/1/27 | | | 811 | | | | | 855 | |
| # | AK2768, 3.500%, due 3/1/27 | | | 2,724 | | | | | 2,873 | |
| # | AK7384, 4.000%, due 3/1/27 | | | 3,460 | | | | | 3,737 | |
| # | AB4818, 4.000%, due 4/1/27 | | | 2,620 | | | | | 2,829 | |
| # | AP0446, 3.500%, due 7/1/27 | | | 6,921 | | | | | 7,304 | |
| # | AP0462, 3.500%, due 7/1/27 | | | 1,108 | | | | | 1,169 | |
| # | AL2590, 4.000%, due 7/1/27 | | | 6,387 | | | | | 6,899 | |
| # | AQ8404, 3.000%, due 12/1/27 | | | 2,970 | | | | | 3,068 | |
| # | 809926, 5.500%, due 2/1/35 | | | 197 | | | | | 219 | |
| # | 829306, 6.000%, due 9/1/35 | | | 92 | | | | | 101 | |
| # | 886762, 7.000%, due 9/1/36 | | | 983 | | | | | 1,126 | |
| # | 928574, 6.000%, due 7/1/37 | | | 191 | | | | | 210 | |
| # | 889385, 6.000%, due 2/1/38 | | | 1,418 | | | | | 1,578 | |
| # | 975649, 6.000%, due 7/1/38 | | | 302 | | | | | 328 | |
| # | AA8706, 5.500%, due 6/1/39 | | | 4,623 | | | | | 5,352 | |
| # | 935532, 4.500%, due 8/1/39 | | | 96 | | | | | 105 | |
| # | AC0505, 5.500%, due 9/1/39 | | | 1,480 | | | | | 1,713 | |
| # | AC3270, 5.500%, due 9/1/39 | | | 3,065 | | | | | 3,550 | |
| # | AC6651, 4.500%, due 12/1/39 | | | 125 | | | | | 136 | |
| # | AD3360, 5.500%, due 5/1/40 | | | 4,081 | | | | | 4,571 | |
| # | AB1146, 5.000%, due 6/1/40 | | | 449 | | | | | 495 | |
| # | AD8810, 5.500%, due 6/1/40 | | | 1,676 | | | | | 1,941 | |
| # | AL0913, 6.000%, due 7/1/41 | | | 5,708 | | | | | 6,318 | |
| Total FNMA Mortgage Obligations | | | | | | | | 148,821 | |
See accompanying Notes to Financial Statements.
| June 30, 2013 | William Blair Funds | 109 |
Low Duration Fund
Portfolio of Investments, June 30, 2013 (all dollar amounts in thousands) (unaudited)
| | | | | | | | | | |
| | Issuer | | NRSRO
Rating | | Principal
Amount | | | Value | |
| | | | | | | | | | | | | |
| Asset-Backed Securities—14.5% | | | | | | | | | |
| | Nissan Auto Receivables Owner
Trust, 2010-A, Tranche A3,
0.870%, 7/15/14 | | Aaa | | | $ 49 | | | | $ | 49 | |
| | CarMax Auto Owner Trust, 2012–1,
Tranche A2,
0.590%, 3/16/15 | | AAA | | | 263 | | | | | 263 | |
| | CNH Equipment Trust, 2010-C,
Tranche A3, 1.170%, 5/15/15 | | AAA | | | 87 | | | | | 87 | |
| | Harley-Davidson Motorcycle Trust,
2011–2, Tranche A2,
0.710%, 5/15/15 | | Aaa | | | 167 | | | | | 168 | |
| | FPL Recovery Funding LLC, 2007-A,
Tranche A2, 5.044%, 8/1/15 | | AAA | | | 160 | | | | | 161 | |
| | Chase Issuance Trust, 2008-A13,
Tranche A13,
1.773%, 9/15/15, VRN | | AAA | | | 100 | | | | | 100 | |
| | Hertz Vehicle Financing LLC—144A,
2009–2A, Tranche A2,
5.290%, 3/25/16 | | Aaa | | | 2,950 | | | | | 3,132 | |
| | CNH Equipment Trust, 2010-C,
Tranche A4,
1.750%, 5/16/16 | | AAA | | | 60 | | | | | 61 | |
| | Avis Budget Rental Car Funding
AESOP LLC—144A, 2010–3A,
Tranche A, 4.640%, 5/20/16 | | Aaa | | | 1,400 | | | | | 1,481 | |
| | Citibank Credit Card Issuance Trust,
2002-A4, Tranche A4,
0.443%, 6/7/16, VRN | | AAA | | | 2,200 | | | | | 2,200 | |
| | Centre Point Funding LLC—144A,
2010–1A, Tranche 1,
5.430%, 7/20/16 | | A2 | | | 1,457 | | | | | 1,519 | |
| | CNH Equipment Trust, 2011-B,
Tranche A3,
0.910%, 8/15/16 | | AAA | | | 590 | | | | | 590 | |
| | Discover Card Execution Note Trust,
2011-A1, Tranche A1,
0.543%, 8/15/16, VRN | | Aaa | | | 1,400 | | | | | 1,401 | |
| | Bank of America Credit Card Trust,
2007-A6, Tranche A6,
0.253%, 9/15/16, VRN | | AAA | | | 20 | | | | | 20 | |
| | Enterprise Fleet Financing
LLC—144A, 2011–2, Tranche A2,
1.430%, 10/20/16 | | AAA | | | 686 | | | | | 686 | |
| | GE Capital Credit Card Master Note
Trust, 2011–1, Tranche A,
0.743%, 1/15/17, VRN | | Aaa | | | 620 | | | | | 621 | |
| | Ford Credit Floorplan Master Owner
Trust A—144A, 2010–3, Tranche A2,
1.893%, 2/15/17, VRN | | AAA | | | 2,000 | | | | | 2,040 | |
| | GE Dealer Floorplan Master Note
Trust, 2012–1, Tranche A,
0.762%, 2/20/17, VRN | | Aaa | | | 2,010 | | | | | 2,016 | |
| | Bank of America Credit Card Trust,
2007-A15, Tranche A15,
0.543%, 4/17/17, VRN | | AAA | | | 100 | | | | | 100 | |
| | Chase Issuance Trust, 2008-A8,
Tranche A8,
1.393%, 5/15/17, VRN | | AAA | | | 3,000 | | | | | 3,054 | |
| | | | | | | | | | |
| | Issuer | | NRSRO
Rating | | Principal
Amount | | | Value | |
| | | | | | | | | | | | | |
| Asset-Backed Securities—(continued) | | | | | | | | | | | |
| | Nissan Master Owner Trust, 2012-A,
Tranche A,
0.663%, 5/15/17, VRN | | Aaa | | | $2,196 | | | | $ | 2,193 | |
| | Citibank Credit Card Issuance Trust,
2008-A6, Tranche A6,
1.392%, 5/22/17, VRN | | AAA | | | 200 | | | | | 204 | |
| | Ally Master Owner Trust, 2010–4,
Tranche A,
1.263%, 8/15/17, VRN | | Aaa | | | 125 | | | | | 126 | |
| | GE Dealer Floorplan Master Note
Trust, 2012–4, Tranche A,
0.632%, 10/20/17, VRN | | Aaa | | | 2,000 | | | | | 1,986 | |
| | Ford Credit Floorplan Master Owner
Trust, 2013–1, Tranche A2,
0.573%, 1/15/18, VRN | | AAA | | | 1,900 | | | | | 1,899 | |
| | Discover Card Execution Note Trust,
2010-A2, Tranche A2,
0.773%, 3/15/18, VRN | | AAA | | | 350 | | | | | 352 | |
| | Citibank Omni Master Trust—144A,
2009-A14A, Tranche A14,
2.943%, 8/15/18, VRN | | Aaa | | | 2,000 | | | | | 2,054 | |
| | Bank of America Credit Card Trust,
2007-A11, Tranche A11,
0.263%, 12/15/19, VRN | | AAA | | | 75 | | | | | 74 | |
| | Capital One Multi-Asset Execution
Trust, 2007-A2, Tranche A2,
0.273%, 12/16/19, VRN | | AAA | | | 215 | | | | | 213 | |
| | American Express Credit Account
Secured Note Trust, 2012–4,
Tranche A,
0.433%, 5/15/20, VRN | | AAA | | | 2,200 | | | | | 2,193 | |
| | SLM Student Loan Trust, 2002–1,
Tranche B,
0.746%, 1/25/21, VRN | | Aaa | | | 4,500 | | | | | 4,469 | |
| | MBNA Credit Card Master Note
Trust, 2004-A3, Tranche A3,
0.453%, 8/16/21, VRN | | AAA | | | 475 | | | | | 469 | |
| | SLM Student Loan Trust, 2008–5,
Tranche A4,
1.976%, 7/25/23, VRN | | Aaa | | | 4,000 | | | | | 4,132 | |
| | SLM Private Education Loan
Trust—144A, 2011-A, Tranche A3,
2.693%, 1/15/43, VRN | | AAA | | | 2,000 | | | | | 2,070 | |
| | Total Asset-Backed Securities | | | | | | | | | | 42,183 | |
| | | | | | | | | | | | | |
| Corporate Obligations—11.1% | | | | | | | | | | | |
| | Morgan Stanley,
6.000%, due 5/13/14 | | A | | | 1,300 | | | | | 1,352 | |
| | Daimler Finance North America
LLC—144A,
0.879%, due 1/9/15, VRN | | A- | | | 1,000 | | | | | 1,003 | |
| | The Goldman Sachs Group, Inc.,
0.777%, due 1/12/15, VRN | | A | | | 1,000 | | | | | 998 | |
| | The Goldman Sachs Group, Inc.,
5.125%, due 1/15/15 | | A | | | 1,000 | | | | | 1,055 | |
| | American International Group, Inc.,
3.000%, due 3/20/15 | | A- | | | 1,150 | | | | | 1,185 | |
See accompanying Notes to Financial Statements.
| 110 | Semi-Annual Report | June 30, 2013 |
Low Duration Fund
Portfolio of Investments, June 30, 2013 (all dollar amounts in thousands) (unaudited)
| | | | | | | | | | |
| | Issuer | | NRSRO
Rating | | Principal
Amount | | | Value | |
| | | | | | | | | | | | | |
| Corporate Obligations—(continued) | | | | | | | | | |
| | JPMorgan Chase & Co.,
1.875%, due 3/20/15 | | A+ | | | $1,525 | | | | $ | 1,543 | |
| | Citigroup, Inc.,
4.700%, due 5/29/15 | | A | | | 1,300 | | | | | 1,381 | |
| | American Express Credit Corporation,
2.750%, due 9/15/15 | | A+ | | | 1,000 | | | | | 1,037 | |
| | Royal Bank of Scotland Group, PLC,
2.550%, due 9/18/15 | | A | | | 3,000 | | | | | 3,050 | |
| | AbbVie, Inc.—144A,
1.200%, due 11/6/15 | | A | | | 1,250 | | | | | 1,251 | |
| | Capital One Financial Corporation,
1.000%, due 11/6/15 | | A- | | | 3,000 | | | | | 2,959 | |
| | McKesson Corporation,
0.950%, due 12/4/15 | | A- | | | 1,000 | | | | | 997 | |
| | General Electric Capital Corporation,
1.000%, due 1/8/16 | | AA+ | | | 1,000 | | | | | 995 | |
| | Petrobras International Finance Co.,
3.875%, due 1/27/16 | | A3 | | | 3,000 | | | | | 3,087 | |
| | Morgan Stanley,
1.523%, due 2/25/16, VRN | | A | | | 1,700 | | | | | 1,695 | |
| | Bank of America Corporation,
1.093%, due 3/22/16, VRN | | A | | | 3,000 | | | | | 2,991 | |
| | Capital One NA,
0.723%, due 3/22/16, VRN | | A3 | | | 2,500 | | | | | 2,483 | |
| | Petrobras Global Finance BV,
1.894%, due 5/20/16, VRN | | A3 | | | 1,400 | | | | | 1,392 | |
| | Hewlett-Packard Co.,
3.300%, due 12/9/16 | | A- | | | 2,000 | | | | | 2,076 | |
| | Total Corporate Obligations | | | | | | | | | | 32,530 | |
| | | | | | | | | | | | | |
| | Total Long-Term Investments—98.4%
(cost $288,575) | | | | | | | | | | 286,778 | |
| | | | | | | | | | | | | |
| | Total Investments—98.4%
(cost $288,575) | | | | | | | | | | 286,778 | |
| | Cash and other assets, less
liabilities—1.6% | | | | | | | | | | 4,537 | |
| | Net assets—100.0% | | | | | | | | | $ | 291,315 | |
NRSRO = Nationally Recognized Statistical Rating Organization—The credit quality ratings of the securities in the Fund reflect the highest category rating by either Fitch Ratings, Moody’s Investors Service Inc., or Standard & Poor’s, a division of the McGraw-Hill Companies, Inc.
The obligations of certain U. S. Government-sponsored securities are neither issued nor guaranteed by the U. S. Treasury.
VRN = Variable Rate Note
See accompanying Notes to Financial Statements.
| June 30, 2013 | William Blair Funds | 111 |

Christopher T. Vincent

Kathleen M. Lynch
READY RESERVES FUND
AN OVERVIEW FROM THE PORTFOLIO MANAGERS
The William Blair Ready Reserves Fund (Class N shares) posted a 0.00% return, net of fees, for the six months ended June 30, 2013. By comparison, the Fund’s benchmark, AAA Rated Money Market Funds, increased 0.01%.
Portfolio Results
The Fund preserved principal successfully year-to-date while investing in accordance with the SEC’s Rule 2a-7 for money market funds. The Fund invested primarily in commercial paper issued by Tier 1 industrial companies and repurchase agreements. The Fund’s weighted average maturity has been maintained at a defensive level that has been shorter than what is required by the SEC’s Rule 2a-7.
Money Market Outlook
Short-term interest rates continue to be held down by the weight of the Federal Open Market Committee’s (FOMC) large-scale asset purchases, known as quantitative easing (QE). The FOMC continues to purchase securities that dealers are pledging as collateral for reverse repurchase agreements (repo). These agreements are collateralized short-term loans that are generally employed by money market funds to meet Rule 2a-7 mandated liquidity requirements. The FOMC is purchasing collateral which is effectively shrinking the repo market and creating a significant amount of demand for other money market eligible securities such as corporate commercial paper. The corporate commercial paper market is also exhibiting low interest rates as corporations’ balances sheets are flushed with cash, limiting the need for short-term funding.
We do not anticipate that this trend will reverse in the near-term. It is widely expected that the FOMC will begin to trim its QE activities in the next several months; however, the Fed continues to assert that the federal funds’ rate will remain at exceptionally low levels until the unemployment rate improves below 6.5% and inflation expectations are well-anchored.
In June, the U.S. Securities and Exchange Commission (SEC) unanimously agreed to propose rule amendments that govern money market funds. The proposed rule amendments were designed to address money market funds susceptibility to heavy redemptions, improve their ability to manage and mitigate potential contagion from such redemptions and increase transparency of portfolio risks while preserving as much as possible the benefits of money market funds.
The SEC has requested money market participants to submit comments on two alternatives. The first alternative would require prime institutional money market funds to float their net asset values. The second alternative would allow money market funds to maintain a constant net asset value at $1.00 and require the implementation of liquidity fees and redemption gates. The comment period closes on September 17, 2013. At which time, the SEC will collect and study the merits of the comments. We do not anticipate hearing from the SEC on this matter until the first quarter 2014.
| 112 | Semi-Annual Report | June 30, 2013 |
Ready Reserves Fund
Performance Highlights (Unaudited)
The Fund’s 7 day yield on June 30, 2013 was 0.01%.
Average Annual Total Returns—Class N Shares
period ended 6/30/2013
| | | Year
to Date | | 1 Year | | 3 Year | | 5 Year | | 10 Year |
| Class N | | 0.00 | % | | 0.01 | % | | 0.01 | % | | 0.19 | % | | 1.51 | % |
| AAA Rated Money Market Funds | | 0.01 | | | 0.01 | | | 0.02 | | | 0.23 | | | 1.49 | |
| 30 Day Treasury Bills | | 0.02 | | | 0.05 | | | 0.07 | | | 0.16 | | | 1.54 | |
Performance cited represents past performance. Past performance does not guarantee future results and current performance may be lower or higher than the data quoted. For the most current month-end performance information, please call 1-800-742-7272, or visit our Web site at www.williamblairfunds.com. Class N Shares are available to the general public without a sales load. Total return includes reinvestment of income. Yields fluctuate and are not guaranteed. An investment in the Fund is neither insured nor guaranteed by the Federal Deposit Insurance Corp. (FDIC) or any government agency. Although the Fund seeks to preserve the value of your investment at $1.00 per share, it is possible to lose money by investing in the Fund.
The AAA Rated Money Market Funds represents the average annual composite performance of all AAA rated First Tier Retail Money Market Funds listed by iMoneyNet data.
This report identifies the Fund’s investments on June 30, 2013. These holdings are subject to change. Not all fixed-income securities in the Fund performed the same, nor is there any guarantee that these fixed-income securities will perform as well in the future. Market forecasts provided in this report may not necessarily come to pass.
Sector Diversification (Unaudited)
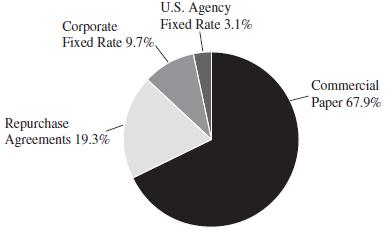
The sector diversification shown is based on the total investments.
| June 30, 2013 | William Blair Funds | 113 |
Ready Reserves Fund
Portfolio of Investments, June 30, 2013 (all dollar amounts in thousands) (unaudited)
| | | | | | | | |
| | Issuer | | Principal
Amount | | | Amortized
Cost | |
| | | | | | | | |
| | U.S. Government and U.S. Government Agency—4.7% | |
| | | |
| | Federal National Mortgage Association (FNMA)—3.1% | |
| | Federal National Mortgage Association,
0.500%-4.375%, 7/17/13-9/17/13 | | | $37,620 | | | $ | 37,654 | |
| | Total Federal National Mortgage
Association (FNMA) | | | | | | | 37,654 | |
| | | | | | | | | | |
| | U.S. Treasury—1.6% | | | | | | | | |
| | U.S. Treasury Bill,
0.014%, 7/11/13 | | | 20,000 | | | | 20,000 | |
| | | | | | | | | | |
| | Corporate Notes—9.7% | | | | | | | | |
| | Bristol-Myers Squibb Co.,
5.250%, 8/15/13 | | | 3,450 | | | | 3,471 | |
| | Caterpillar Financial Services Corporation,
1.550%-4.900%, 8/15/13-1/15/14 | | | 14,028 | | | | 14,155 | |
| | CME Group, Inc.,
5.400%, 8/1/13 | | | 2,127 | | | | 2,136 | |
| | Deere & Co.,
6.950%, 4/25/14 | | | 1,000 | | | | 1,054 | |
| | EI du Pont de Nemours & Co.,
1.750%, 3/25/14 | | | 10,000 | | | | 10,108 | |
| | General Electric Capital Corporation,
1.875%-5.900%, 9/16/13-5/13/14 | | | 39,077 | | | | 39,726 | |
| | International Business Machines Corporation,
1.000%-1.250%, 8/5/13-5/12/14 | | | 22,972 | | | | 23,073 | |
| | John Deere Capital Corporation,
4.900%, 9/9/13 | | | 7,211 | | �� | | 7,274 | |
| | PepsiCo, Inc.,
0.875%, 10/25/13 | | | 2,000 | | | | 2,004 | |
| | Pfizer, Inc.,
4.500%, 2/15/14 | | | 7,505 | | | | 7,702 | |
| | Toyota Motor Credit Corporation,
1.375%, 8/12/13 | | | 650 | | | | 651 | |
| | Wal-Mart Stores, Inc.,
0.750%-1.625%, 10/25/13-4/15/14 | | | 7,302 | | | | 7,365 | |
| | Total Corporate Notes | | | | | | | 118,719 | |
| | | | | | | | | | |
| | Commercial Paper—66.3% | | | | | | | | |
| | Abbott Laboratories,
0.080%-0.110%, 7/18/13-9/4/13 | | | 43,000 | | | | 42,993 | |
| | American Honda Finance Corporation,
0.050%-0.110%, 7/8/13-8/23/13 | | | 43,000 | | | | 42,997 | |
| | Caterpillar Financial Services Corporation,
0.080%-0.170%, 7/25/13-9/26/13 | | | 29,000 | | | | 28,994 | |
| | Chevron Corporation,
0.050%-0.080%, 7/2/13-7/22/13 | | | 36,000 | | | | 35,999 | |
| | Coca-Cola Co. (The),
0.050%-0.110%, 7/10/13-9/24/13 | | | 43,274 | | | | 43,270 | |
| | Colgate Palmolive Co.,
0.040%-0.060%, 7/8/13-7/16/13 | | | 20,000 | | | | 20,000 | |
| | ConocoPhillips Qatar Funding, Ltd.,
0.090%-0.130%, 7/18/13-7/29/13 | | | 32,800 | | | | 32,797 | |
| | Dover Corporation,
0.080%-0.100%, 7/1/13-7/11/13 | | | 46,000 | | | | 46,000 | |
| | EI du Pont de Nemours & Co.,
0.060%-0.080%, 7/8/13-7/23/13 | | | 34,000 | | | | 34,000 | |
| | Illinois Tool Works, Inc.,
0.080%-0.100%, 7/1/13-7/12/13 | | | 30,000 | | | | 30,000 | |
| | | | | | | | |
| | Issuer | | Principal
Amount | | | Amortized
Cost | |
| | | | | | | | |
| | Commercial Paper—(continued) | | | | | | | | |
| | International Business Machines Corporation,
0.030%-0.040%, 7/1/13-7/8/13 | | | $ 20,000 | | | $ | 20,000 | |
| | John Deere Financial Ltd.,
0.080%-0.100%, 7/1/13-7/25/13 | | | 36,100 | | | | 36,099 | |
| | Johnson & Johnson,
0.030%, 7/15/13 | | | 10,000 | | | | 10,000 | |
| | Kimberly-Clark Worldwide, Inc.,
0.060%, 7/8/13 | | | 10,800 | | | | 10,800 | |
| | Merck & Co., Inc.,
0.060%-0.080%, 7/15/13-7/26/13 | | | 42,000 | | | | 42,000 | |
| | Nestle Capital Corporation,
0.070%-0.100%, 7/11/13 | | | 6,000 | | | | 6,000 | |
| | PACCAR Financial Corporation,
0.070%-0.090%, 7/2/13-7/24/13 | | | 42,100 | | | | 42,099 | |
| | PepsiCo, Inc.,
0.050%-0.070%, 7/8/13-8/1/13 | | | 42,000 | | | | 42,000 | |
| | Pfizer, Inc.,
0.030%-0.050%, 7/2/13-7/16/13 | | | 42,000 | | | | 42,000 | |
| | Praxair, Inc.,
0.040%-0.050%, 7/5/13-7/22/13 | | | 29,700 | | | | 29,700 | |
| | Private Export Funding Corporation,
0.120%, 7/17/13 | | | 7,000 | | | | 6,999 | |
| | Procter & Gamble Co.
0.080%-0.140%, 8/1/13-8/6/13 | | | 24,691 | | | | 24,687 | |
| | Roche Holdings, Inc.,
0.070%, 7/8/13-7/26/13 | | | 32,000 | | | | 32,000 | |
| | Toyota Credit de Puerto Rico Corporation,
0.040%-0.090%, 7/1/13-7/31/13 | | | 43,000 | | | | 42,999 | |
| | Unilever Capital Corporation,
0.060%-0.110%, 7/3/13-8/6/13 | | | 42,000 | | | | 41,998 | |
| | Wal-Mart Stores, Inc.,
0.050%-0.090%, 7/1/13-9/16/13 | | | 28,000 | | | | 27,999 | |
| | Total Commercial Paper | | | | | | | 814,430 | |
| | | | | | | | | | |
| | Repurchase Agreements—19.2% | | | | | | | | |
| | Bank of America, 0.110% dated 6/28/13,
due 7/1/13, repurchase price $60,001,
collateralized by FMAC, 2.500%-5.200%,
due 7/1/24–10/1/32, and FNMA,
2.500%-5.000%, due 8/1/23–2/1/43 | | | 60,000 | | | | 60,000 | |
| | Fixed Income Clearing Corporation, 0.010%
dated 6/28/13, due 7/1/13, repurchase price
$116,088, collateralized by FHLB,
3.300%-5.500%, due 8/27/32–7/15/36,
and FNMA, 3.430%, due 5/27/33 | | | 116,088 | | | | 116,088 | |
| | Goldman Sachs, 0.120% dated 6/28/13, due
7/1/13, repurchase price $60,001,
collateralized by FMAC, 3.000%,
due 6/1/33, and FNMA, 4.000%, due 3/1/42 | | | 60,000 | | | | 60,000 | |
| | Total Repurchase Agreements | | | | | | | 236,088 | |
| | | | | | | | | | |
| | Total Investments—99.9%
(cost $1,226,891) | | | | | | | 1,226,891 | |
| | | | | | | | | | |
| | Cash and other assets, less liabilities—0.1% | | | | | | | 995 | |
| | Net assets—100.0% | | | | | | $ | 1,227,886 | |
| | Portfolio Weighted Average Maturity | | | | | | | 33 days | |
See accompanying Notes to Financial Statements.
| 114 | Semi-Annual Report | June 30, 2013 |
Statements of Assets and Liabilities
As of June 30, 2013 (dollar amounts in thousands) (unaudited)
| | | Growth
Fund | | | Large Cap
Growth
Fund | | | Mid Cap
Growth
Fund | | | Small-Mid
Cap Growth
Fund | |
| Assets | | | | | | | | | | | | | | | | |
| Investments in securities, at cost | | $ | 614,379 | | | $ | 25,136 | | | $ | 410,319 | | | $ | 398,189 | |
| Investments in securities, at value | | $ | 793,274 | | | $ | 32,110 | | | $ | 464,850 | | | $ | 499,250 | |
| Receivable for securities sold | | | 2,065 | | | | 163 | | | | 373 | | | | 687 | |
| Receivable for fund shares sold | | | 3,200 | | | | 60 | | | | 1,299 | | | | 1,349 | |
| Receivable from Advisor | | | — | | | | 5 | | | | 2 | | | | 13 | |
| Dividend and interest receivable | | | 319 | | | | 15 | | | | 66 | | | | 12 | |
| Total assets | | | 798,858 | | | | 32,353 | | | | 466,590 | | | | 501,311 | |
| | | | | | | | | | | | | | | | | |
| Liabilities | | | | | | | | | | | | | | | | |
| Payable for investment securities purchased | | | 2,001 | | | | 163 | | | | — | | | | 547 | |
| Payable for fund shares redeemed | | | 488 | | | | — | | | | 319 | | | | 267 | |
| Management fee payable | | | 490 | | | | 21 | | | | 362 | | | | 413 | |
| Distribution and shareholder administration fees payable | | | 54 | | | | 1 | | | | 10 | | | | 12 | |
| Other payables and accrued expenses | | | 258 | | | | 25 | | | | 10 | | | | 208 | |
| Total liabilities | | | 3,291 | | | | 210 | | | | 701 | | | | 1,447 | |
| Net Assets | | $ | 795,567 | | | $ | 32,143 | | | $ | 465,889 | | | $ | 499,864 | |
| | | | | | | | | | | | | | | | | |
| Capital | | | | | | | | | | | | | | | | |
| Composition of Net Assets | | | | | | | | | | | | | | | | |
| Par value of shares of beneficial interest | | $ | 57 | | | $ | 4 | | | $ | 31 | | | $ | 29 | |
| Capital paid in excess of par value | | | 575,826 | | | | 24,451 | | | | 392,434 | | | | 380,051 | |
| Accumulated net investment income (loss) | | | (1,067 | ) | | | (15 | ) | | | (1,485 | ) | | | (1,710 | ) |
| Accumulated realized gain (loss) | | | 41,856 | | | | 729 | | | | 20,378 | | | | 20,433 | |
Net unrealized appreciation (depreciation) of investments and
foreign currencies | | | 178,895 | | | | 6,974 | | | | 54,531 | | | | 101,061 | |
| Net Assets | | $ | 795,567 | | | $ | 32,143 | | | $ | 465,889 | | | $ | 499,864 | |
| | | | | | | | | | | | | | | | | |
| Class N Shares | | | | | | | | | | | | | | | | |
| Net Assets | | $ | 263,854 | | | $ | 5,046 | | | $ | 46,346 | | | $ | 59,354 | |
| Shares Outstanding | | | 19,627,809 | | | | 566,775 | | | | 3,257,148 | | | | 3,508,771 | |
| Net Asset Value Per Share | | $ | 13.44 | | | | 8.90 | | | $ | 14.23 | | | $ | 16.92 | |
| Class I Shares | | | | | | | | | | | | | | | | |
| Net Assets | | $ | 531,713 | | | $ | 27,097 | | | $ | 419,543 | | | $ | 440,510 | |
| Shares Outstanding | | | 37,810,914 | | | | 2,963,933 | | | | 28,858,246 | | | | 25,389,382 | |
| Net Asset Value Per Share | | $ | 14.06 | | | | 9.14 | | | $ | 14.54 | | | $ | 17.35 | |
See accompanying Notes to Financial Statements.
| June 30, 2013 | William Blair Funds | 115 |
Statements of Operations
For the Period Ended June 30, 2013 (all amounts in thousands) (unaudited)
| | | | | | Large Cap | | Mid Cap | | | Small-Mid | |
| | | Growth | | | Growth | | | Growth | | | Cap Growth | |
| | | Fund | | | Fund | | | Fund | | | Fund | |
| Investment income | | | | | | | | | | | | | | | | | | |
| Dividends | | $ | 2,638 | | | | $ | 139 | | | $ | 898 | | | | $ | 804 | |
| Less foreign tax withheld | | | — | | | | | — | | | | — | | | | | (6 | ) |
| Interest | | | 2 | | | | | — | | | | 4 | | | | | 3 | |
| Total income | | | 2,640 | | | | | 139 | | | | 902 | | | | | 801 | |
| Expenses | | | | | | | | | | | | | | | | | | |
| Investment advisory fees | | | 2,892 | | | | | 124 | | | | 2,012 | | | | | 2,246 | |
| Distribution fees | | | 326 | | | | | 6 | | | | 56 | | | | | 60 | |
| Custodian fees | | | 11 | | | | | 15 | | | | 16 | | | | | 18 | |
| Transfer agent fees | | | 74 | | | | | 5 | | | | 19 | | | | | 26 | |
| Sub-transfer agent fees | | | | | | | | | | | | | | | | | | |
| Class N | | | 168 | | | | | 3 | | | | 31 | | | | | 32 | |
| Class I | | | 158 | | | | | 5 | | | | 183 | | | | | 83 | |
| Professional fees | | | 25 | | | | | 10 | | | | 16 | | | | | 17 | |
| Registration fees | | | 21 | | | | | 17 | | | | 24 | | | | | 16 | |
| Shareholder reporting fees | | | 22 | | | | | 2 | | | | 28 | | | | | 22 | |
| Trustee fees | | | 14 | | | | | 1 | | | | 7 | | | | | 7 | |
| Other expenses | | | 4 | | | | | 2 | | | | 5 | | | | | 4 | |
| Total expenses before waiver | | | 3,715 | | | | | 190 | | | | 2,397 | | | | | 2,531 | |
| Expenses reimbursed to (waived or absorbed by) the Advisor | | | — | | | | | (36 | ) | | | (10 | ) | | | | (20 | ) |
| Net expenses | | | 3,715 | | | | | 154 | | | | 2,387 | | | | | 2,511 | |
| Net investment income (loss) | | | (1,075 | ) | | | | (15 | ) | | | (1,485 | ) | | | | (1,710 | ) |
| Realized and unrealized gain (loss) | | | | | | | | | | | | | | | | | | |
| Net realized gain (loss) on transactions from: | | | | | | | | | | | | | | | | | | |
| Investments in securities | | | 29,967 | | | | | 1,812 | | | | 21,225 | | | | | 16,869 | |
| Total net realized gain (loss) | | | 29,967 | | | | | 1,812 | | | | 21,225 | | | | | 16,869 | |
| Change in net unrealized appreciation (depreciation) of: | | | | | | | | | | | | | | | | | | |
| Investments | | | 55,145 | | | | | 954 | | | | 27,807 | | | | | 61,864 | |
| Change in net unrealized appreciation (depreciation) | | | 55,145 | | | | | 954 | | | | 27,807 | | | | | 61,864 | |
| Net increase (decrease) in net assets resulting from operations | | $ | 84,037 | | | | $ | 2,751 | | | $ | 47,547 | | | | $ | 77,023 | |
See accompanying Notes to Financial Statements.
| 116 | Semi-Annual Report | June 30, 2013 |
Statements of Changes in Net Assets
For the Period Ended June 30, 2013 (unaudited) and Year Ended December 31, 2012 (all amounts in thousands)
| | | | | | Large Cap | | | Mid Cap | | | Small-Mid | |
| | | Growth Fund | | | Growth Fund | | | Growth Fund | | | Cap Growth Fund | |
| | | 2013 | | | 2012 | | | 2013 | | | 2012 | | | 2013 | | | 2012 | | | 2013 | | | 2012 | |
| Operations | | | | | | | | | | | | | | | | | | | | | | | | | | | | | | | | |
| Net investment income (loss) | | $ | (1,075 | ) | | $ | 1,123 | | | $ | (15 | ) | | $ | (1 | ) | | $ | (1,485 | ) | | $ | 484 | | | $ | (1,710 | ) | | $ | 1,480 | |
| Net realized gain (loss) on investments and other assets | | | 29,967 | | | | 29,181 | | | | 1,812 | | | | 2,407 | | | | 21,225 | | | | 7,689 | | | | 16,869 | | | | 11,592 | |
| Change in net unrealized appreciation (depreciation) on investments | | | 55,145 | | | | 60,237 | | | | 954 | | | | 2,131 | | | | 27,807 | | | | 15,618 | | | | 61,864 | | | | 22,741 | |
| Net increase (decrease) in net assets resulting from operations | | | 84,037 | | | | 90,541 | | | | 2,751 | | | | 4,537 | | | | 47,547 | | | | 23,791 | | | | 77,023 | | | | 35,813 | |
| Distributions to shareholders from | | | | | | | | | | | | | | | | | | | | | | | | | | | | | | | | |
| Net investment income | | | | | | | | | | | | | | | | | | | | | | | | | | | | | | | | |
| Class N | | | — | | | | (10 | ) | | | — | | | | — | | | | — | | | | — | | | | — | | | | (61 | ) |
| Class I | | | — | | | | (1,133 | ) | | | — | | | | — | | | | — | | | | (488 | ) | | | — | | | | (1,426 | ) |
| Net realized gain | | | | | | | | | | | | | | | | | | | | | | | | | | | | | | | | |
| Class N | | | — | | | | (7,281 | ) | | | — | | | | — | | | | — | | | | (905 | ) | | | — | | | | (1,028 | ) |
| Class I | | | — | | | | (12,939 | ) | | | — | | | | — | | | | — | | | | (7,042 | ) | | | — | | | | (8,102 | ) |
| Total Distributions | | | — | | | | (21,363 | ) | | | — | | | | — | | | | — | | | | (8,435 | ) | | | — | | | | (10,617 | ) |
| Capital stock transactions | | | | | | | | | | | | | | | | | | | | | | | | | | | | | | | | |
| Net proceeds from sale of shares | | | 61,025 | | | | 178,095 | | | | 2,400 | | | | 3,967 | | | | 79,678 | | | | 273,232 | | | | 81,793 | | | | 188,047 | |
| Shares issued in reinvestment of income dividends and capital gain distributions | | | — | | | | 19,820 | | | | — | | | | — | | | | — | | | | 8,342 | | | | — | | | | 9,387 | |
| Less cost of shares redeemed | | | (65,740 | ) | | | (117,590 | ) | | | (1,421 | ) | | | (5,040 | ) | | | (31,571 | ) | | | (72,449 | ) | | | (50,312 | ) | | | (84,867 | ) |
| Net increase (decrease) in net assets resulting from capital share transactions | | | (4,715 | ) | | | 80,325 | | | | 979 | | | | (1,073 | ) | | | 48,107 | | | | 209,125 | | | | 31,481 | | | | 112,567 | |
| Increase (decrease) in net assets | | | 79,322 | | | | 149,503 | | | | 3,730 | | | | 3,464 | | | | 95,654 | | | | 224,481 | | | | 108,504 | | | | 137,763 | |
| Net assets | | | | | | | | | | | | | | | | | | | | | | | | | | | | | | | | |
| Beginning of period | | | 716,245 | | | | 566,742 | | | | 28,413 | | | | 24,949 | | | | 370,235 | | | | 145,754 | | | | 391,360 | | | | 253,597 | |
| End of period | | $ | 795,567 | | | $ | 716,245 | | | $ | 32,143 | | | $ | 28,413 | | | $ | 465,889 | | | $ | 370,235 | | | $ | 499,864 | | | $ | 391,360 | |
| Accumulated net investment income (loss) at the end of the period | | $ | (1,067 | ) | | $ | 8 | | | $ | (15 | ) | | $ | — | | | $ | (1,485 | ) | | $ | — | | | $ | (1,710 | ) | | $ | — | |
See accompanying Notes to Financial Statements.
| June 30, 2013 | William Blair Funds | 117 |
Statements of Assets and Liabilities
As of June 30, 2013 (dollar amounts in thousands) (unaudited)
| | | | | | | | | Global | | | | |
| | | Small Cap | | | Global | | | Small Cap | | | International | |
| | | Growth | | | Leaders | | | Growth | | | Growth | |
| | | Fund | | | Fund | | | Fund | | | Fund | |
| Assets | | | | | | | | | | | | | | | | |
| Investments in securities, at cost | | $ | 379,965 | | | $ | 115,066 | | | $ | 10,811 | | | $ | 3,411,049 | |
| Investments in affiliated companies, at cost | | | 24,620 | | | | — | | | | — | | | | 22,022 | |
| Investments in securities, at value | | $ | 481,017 | | | $ | 123,952 | | | $ | 11,124 | | | $ | 3,801,572 | |
| Investments in affiliated companies, at value | | | 3,792 | | | | — | | | | — | | | | 22,815 | |
| Foreign currency, at value ($—; $144; $—; $6,204) | | | — | | | | 144 | | | | — | | | | 6,164 | |
| Receivable for securities sold | | | 3,865 | | | | 398 | | | | 72 | | | | 7,204 | |
| Receivable for fund shares sold | | | 1,530 | | | | 22,000 | | | | 200 | | | | 9,436 | |
| Receivable from Advisor | | | 15 | | | | 7 | | | | 11 | | | | — | |
| Dividend and interest receiveable | | | 106 | | | | 226 | | | | 13 | | | | 12,556 | |
| Unrealized appreciation on forward currency contracts | | | — | | | | — | | | | — | | | | 6,195 | |
| Total assets | | | 490,325 | | | | 146,727 | | | | 11,420 | | | | 3,865,942 | |
| Liabilities | | | | | | | | | | | | | | | | |
| Payable for investment securities purchased | | | 974 | | | | 20,951 | | | | 31 | | | | 16,351 | |
| Payable for fund shares redeemed | | | 259 | | | | — | | | | — | | | | 4,717 | |
| Payable to custodian | | | — | | | | — | | | | — | | | | 4 | |
| Management fee payable | | | 444 | | | | 86 | | | | 9 | | | | 3,222 | |
| Distribution and shareholder administration fees payable | | | 32 | | | | 8 | | | | 1 | | | | 270 | |
| Foreign tax liability | | | — | | | | 12 | | | | — | | | | 672 | |
| Other payables and accrued expenses | | | 196 | | | | 58 | | | | 25 | | | | 828 | |
| Total liabilities | | | 1,905 | | | | 21,115 | | | | 66 | | | | 26,064 | |
| Net Assets | | $ | 488,420 | | | $ | 125,612 | | | $ | 11,354 | | | $ | 3,839,878 | |
| Capital | | | | | | | | | | | | | | | | |
| Composition of Net Assets | | | | | | | | | | | | | | | | |
| Par value of shares of beneficial interest | | $ | 16 | | | $ | 13 | | | $ | 1 | | | $ | 166 | |
| Capital paid in excess of par value | | | 353,994 | | | | 128,034 | | | | 11,062 | | | | 4,265,717 | |
| Accumulated net investment income (loss) | | | (1,984 | ) | | | 502 | | | | 21 | | | | 29,027 | |
| Accumulated realized gain (loss) | | | 56,170 | | | | (11,814 | ) | | | (43 | ) | | | (852,661 | ) |
| Net unrealized appreciation (depreciation) of investments and foreign currencies | | | 80,224 | | | | 8,877 | | | | 313 | | | | 397,629 | |
| Net Assets | | $ | 488,420 | | | $ | 125,612 | | | $ | 11,354 | | | $ | 3,839,878 | |
| | | | | | | | | | | | | | | | | |
| Class N Shares | | | | | | | | | | | | | | | | |
| Net Assets | | $ | 154,734 | | | $ | 5,557 | | | $ | 291 | | | $ | 1,291,137 | |
| Shares Outstanding | | | 5,283,804 | | | | 561,085 | | | | 28,266 | | | | 56,459,011 | |
| Net Asset Value Per Share | | $ | 29.28 | | | $ | 9.91 | | | $ | 10.30 | | | $ | 22.87 | |
| Class I Shares | | | | | | | | | | | | | | | | |
| Net Assets | | $ | 333,686 | | | $ | 48,384 | | | $ | 11,063 | | | $ | 2,548,741 | |
| Shares Outstanding | | | 10,927,644 | | | | 4,881,879 | | | | 1,073,535 | | | | 108,802,179 | |
| Net Asset Value Per Share | | $ | 30.54 | | | $ | 9.91 | | | $ | 10.31 | | | $ | 23.43 | |
| Class Institutional | | | | | | | | | | | | | | | | |
| Net Assets | | | | | | $ | 71,671 | | | | | | | | | |
| Shares Outstanding | | | | | | | 7,224,435 | | | | | | | | | |
| Net Asset Value Per Share | | | | | | $ | 9.92 | | | | | | | | | |
See accompanying Notes to Financial Statements.
| 118 | Semi-Annual Report | June 30, 2013 |
Statements of Operations
For the Year Ended June 30, 2013 (all amounts in thousands) (unaudited)
| | | | | | | | | | Global | | | | |
| | | Small Cap | | | Global | | | Small Cap | | | International | |
| | | Growth | | | Leaders | | | Growth | | | Growth | |
| | | Fund | | | Fund | | | Fund(a) | | | Fund | |
| Investment income | | | | | | | | | | | | | | | | | | | | |
| Dividends | | | $ | 1,004 | | | | $ | 1,171 | | | | $ | 58 | | | | $ | 74,713 | |
| Less foreign tax withheld | | | | (13 | ) | | | | (108 | ) | | | | (6 | ) | | | | (7,191 | ) |
| Interest | | | | 3 | | | | | 1 | | | | | — | | | | | 18 | |
| Total income | | | | 994 | | | | | 1,064 | | | | | 52 | | | | | 67,540 | |
| Expenses | | | | | | | | | | | | | | | | | | | | |
| Investment advisory fees | | | | 2,464 | | | | | 462 | | | | | 23 | | | | | 19,480 | |
| Distribution fees | | | | 178 | | | | | 7 | | | | | — | | | | | 1,659 | |
| Shareholder administration fees | | | | — | | | | | 40 | | | | | 3 | | | | | — | |
| Custodian fees | | | | 18 | | | | | 38 | | | | | 19 | | | | | 308 | |
| Transfer agent fees | | | | 52 | | | | | 9 | | | | | 1 | | | | | 173 | |
| Sub-transfer agent fees | | | | | | | | | | | | | | | | | | | | |
| Class N | | | | 94 | | | | | 2 | | | | | — | | | | | 758 | |
| Class I | | | | 200 | | | | | 9 | | | | | — | | | | | 994 | |
| Professional fees | | | | 24 | | | | | 14 | | | | | 8 | | | | | 144 | |
| Registration fees | | | | 21 | | | | | 23 | | | | | 2 | | | | | 38 | |
| Shareholder reporting fees | | | | 121 | | | | | 4 | | | | | — | | | | | 172 | |
| Trustee fees | | | | 12 | | | | | 1 | | | | | — | | | | | 78 | |
| Other expenses | | | | 3 | | | | | 2 | | | | | — | | | | | 19 | |
| Total expenses before waiver | | | | 3,187 | | | | | 611 | | | | | 56 | | | | | 23,823 | |
| Expenses reimbursed to (waived or absorbed by) the Advisor | | | | (209 | ) | | | | (56 | ) | | | | (25 | ) | | | | — | |
| Net expenses | | | | 2,978 | | | | | 555 | | | | | 31 | | | | | 23,823 | |
| Net investment income (loss) | | | | (1,984 | ) | | | | 509 | | | | | 21 | | | | | 43,717 | |
| Realized and unrealized gain (loss) | | | | | | | | | | | | | | | | | | | | |
| Net realized gain (loss) on transactions from: | | | | | | | | | | | | | | | | | | | | |
| Investments in securities | | | | 55,550 | | | | | 2,256 | | | | | (37 | ) | | | | 276,133 | |
| Forward foreign currency contracts | | | | — | | | | | — | | | | | — | | | | | (4,434 | ) |
| Foreign currency transactions | | | | — | | | | | (29 | ) | | | | (6 | ) | | | | (2,334 | ) |
| Total net realized gain (loss) | | | | 55,550 | | | | | 2,227 | | | | | (43 | ) | | | | 269,365 | |
| Change in net unrealized appreciation (depreciation) of: | | | | | | | | | | | | | | | | | | | | |
| Investments | | | | 40,314 | | | | | 589 | | | | | 313 | | | | | (243,846 | ) |
| Forward foreign currency contracts | | | | — | | | | | — | | | | | — | | | | | 6,195 | |
| Foreign currency transactions | | | | — | | | | | (9 | ) | | | | — | | | | | (212 | ) |
| Change in net unrealized appreciation (depreciation) | | | | 40,314 | | | | | 580 | | | | | 313 | | | | | (237,863 | ) |
| Net increase (decrease) in net assets resulting from operations | | | $ | 93,880 | | | | $ | 3,316 | | | | $ | 291 | | | | $ | 75,219 | |
| (a) | For the period from April 10, 2013 (commencement of operations) to June 30, 2013. |
See accompanying Notes to Financial Statements.
| June 30, 2013 | William Blair Funds | 119 |
Statements of Changes in Net Assets
For the Period Ended June 30, 2013 (unaudited) and Year Ended December 31, 2012 (all amounts in thousands)
| | | | | | | | | Global | | | | |
| | | | | | | | | Small Cap | | | | |
| | | Small Cap | | | Global | | | Growth | | | International | |
| | | Growth Fund | | | Leaders Fund | | | Fund | | | Growth Fund | |
| | | 2013 | | | 2012 | | | 2013 | | | 2012 | | | 2013(a) | | | 2013 | | | 2012 | |
| Operations | | | | | | | | | | | | | | | | | | | | | | | | | | | | | |
| Net investment income (loss) | | $ | (1,984 | ) | | $ | (3,984 | ) | | $ | 509 | | | $ | 258 | | | | $ | 21 | | | $ | 43,717 | | | $ | 49,275 | |
| Net realized gain (loss) on investments, forwards, and foreign currency | | | 55,550 | | | | 71,506 | | | | 2,227 | | | | 3,704 | | | | | (43 | ) | | | 269,365 | | | | 105,420 | |
| Change in net unrealized appreciation (depreciation) on investments, forwards, and foreign currency | | | 40,314 | | | | 18,864 | | | | 580 | | | | 3,879 | | | | | 313 | | | | (237,863 | ) | | | 580,675 | |
| Net increase (decrease) in net assets resulting from operations | | | 93,880 | | | | 86,386 | | | | 3,316 | | | | 7,841 | | | | | 291 | | | | 75,219 | | | | 735,370 | |
| Distributions to shareholders from | | | | | | | | | | | | | | | | | | | | | | | | | | | | | |
| Net investment income | | | | | | | | | | | | | | | | | | | | | | | | | | | | | |
| Class N | | | — | | | | — | | | | — | | | | (15 | ) | | | | — | | | | — | | | | (37,353 | ) |
| Class I | | | — | | | | — | | | | — | | | | (227 | ) | | | | — | | | | — | | | | (74,977 | ) |
| Class Institutional | | | — | | | | — | | | | — | | | | — | | | | | — | | | | — | | | | — | |
| Net realized gain | | | | | | | | | | | | | | | | | | | | | | | | | | | | | |
| Class N | | | — | | | | (564 | ) | | | — | | | | — | | | | | — | | | | — | | | | — | |
| Class I | | | — | | | | (1,107 | ) | | | — | | | | — | | | | | — | | | | — | | | | — | |
| Class Institutional | | | — | | | | — | | | | — | | | | — | | | | | — | | | | — | | | | — | |
| Total Distributions | | | — | | | | (1,671 | ) | | | — | | | | (242 | ) | | | | — | | | | — | | | | (112,330 | ) |
| Capital stock transactions | | | | | | | | | | | | | | | | | | | | | | | | | | | | | |
| Net proceeds from sale of shares | | | 50,509 | | | | 93,413 | | | | 60,627 | | | | 32,763 | | | | | 11,063 | | | | 418,377 | | | | 673,026 | |
| Shares issued in reinvestment of income dividends and capital gain distributions | | | — | | | | 1,627 | | | | — | | | | 234 | | | | | — | | | | — | | | | 103,180 | |
| Less cost of shares redeemed | | | (52,782 | ) | | | (337,680 | ) | | | (5,325 | ) | | | (16,176 | ) | | | | — | | | | (326,351 | ) | | | (955,515 | ) |
| Net increase (decrease) in net assets resulting from capital share transactions | | | (2,273 | ) | | | (242,640 | ) | | | 55,302 | | | | 16,821 | | | | | 11,063 | | | | 92,026 | | | | (179,309 | ) |
| Increase (decrease) in net assets | | | 91,607 | | | | (157,925 | ) | | | 58,618 | | | | 24,420 | | | | | 11,354 | | | | 167,245 | | | | 443,731 | |
| Net assets | | | | | | | | | | | | | | | | | | | | | | | | | | | | | |
| Beginning of period | | | 396,813 | | | | 554,738 | | | | 66,994 | | | | 42,574 | | | | | — | | | | 3,672,633 | | | | 3,228,902 | |
| End of period | | $ | 488,420 | | | $ | 396,813 | | | $ | 125,612 | | | $ | 66,994 | | | | $ | 11,354 | | | $ | 3,839,878 | | | $ | 3,672,633 | |
| Accumulated net investment income (loss) at the end of the period | | $ | (1,984 | ) | | $ | — | | | $ | 502 | | | $ | (7 | ) | | | $ | 21 | | | $ | 29,027 | | | $ | (14,690 | ) |
| (a) | For the period from April 10, 2013 (commencement of operations) to June 30, 2013. |
See accompanying Notes to Financial Statements.
| 120 | Semi-Annual Report | June 30, 2013 |
Statements of Assets and Liabilities
As of June 30, 2013 (dollar amounts in thousands) (unaudited)
| | | Institutional | | | | | | Institutional | | | International | |
| | | International | | | International | | | International | | | Leaders | |
| | Growth Fund | | | Equity Fund | | | Equity Fund | | | Fund | |
| Assets | | | | | | | | | | | | | | | | | | | |
| Investments in securities, at cost | | $ | 1,844,884 | | | | $ | 61,153 | | | | $ | 80,108 | | | | $ | 60,848 | |
| Investments in affiliated companies, at cost | | | 11,834 | | | | | — | | | | | — | | | | | — | |
| Investments in securities, at value | | $ | 2,050,006 | | | | $ | 70,983 | | | | $ | 92,740 | | | | $ | 61,530 | |
| Investments in affiliated companies, at value | | | 12,260 | | | | | — | | | | | — | | | | | — | |
| Foreign currency, at value ($3,119; $95; $149; $94) | | | 3,099 | | | | | 95 | | | | | 148 | | | | | 95 | |
| Receivable for securities sold | | | 3,885 | | | | | 15 | | | | | 19 | | | | | 552 | |
| Receivable for fund shares sold | | | 8,744 | | | | | 1 | | | | | — | | | | | — | |
| Receivable from Advisor | | | — | | | | | 17 | | | | | 1 | | | | | 9 | |
| Dividend and interest receivable | | | 6,258 | | | | | 128 | | | | | 192 | | | | | 163 | |
| Unrealized appreciation on forward currency contracts | | | 3,340 | | | | | — | | | | | — | | | | | — | |
| Total assets | | | 2,087,592 | | | | | 71,239 | | | | | 93,100 | | | | | 62,349 | |
| Liabilities | | | | | | | | | | | | | | | | | | | |
| Payable for investment securities purchased | | | 8,803 | | | | | 263 | | | | | 2,767 | | | | | 298 | |
| Payable for fund shares redeemed | | | 90 | | | | | — | | | | | — | | | | | — | |
| Payable to custodian | | | — | | | | | — | | | | | — | | | | | 164 | |
| Management fee payable | | | 1,616 | | | | | 65 | | | | | 73 | | | | | 50 | |
| Distribution and shareholder administration fees payable | | | — | | | | | 1 | | | | | — | | | | | 2 | |
| Foreign tax liability | | | 365 | | | | | 4 | | | | | 5 | | | | | 7 | |
| Other payables and accrued expenses | | | 142 | | | | | 42 | | | | | 59 | | | | | 15 | |
| Total liabilities | | | 11,016 | | | | | 375 | | | | | 2,904 | | | | | 536 | |
| Net Assets | | $ | 2,076,576 | | | | $ | 70,864 | | | | $ | 90,196 | | | | $ | 61,813 | |
| Capital | | | | | | | | | | | | | | | | | | | |
| Composition of Net Assets | | | | | | | | | | | | | | | | | | | |
| Par value of shares of beneficial interest | | $ | 136 | | | | $ | 6 | | | | $ | 8 | | | | $ | 6 | |
| Capital paid in excess of par value | | | 1,893,137 | | | | | 148,521 | | | | | 190,466 | | | | | 61,711 | |
| Accumulated net investment income (loss) | | | 18,078 | | | | | 562 | | | | | 695 | | | | | 617 | |
| Accumulated realized gain (loss) | | | (43,567 | ) | | | | (88,052 | ) | | | | (113,597 | ) | | | | (1,202 | ) |
| Net unrealized appreciation (depreciation) of investments and foreign currencies | | | 208,792 | | | | | 9,827 | | | | | 12,624 | | | | | 681 | |
| Net Assets | | $ | 2,076,576 | | | | $ | 70,864 | | | | $ | 90,196 | | | | $ | 61,813 | |
| | | | | | | | | | | | | | | | | | | | |
| Class N Shares | | | | | | | | | | | | | | | | | | | |
| Net Assets | | | | | | | $ | 3,844 | | | | | | | | | $ | 101 | |
| Shares Outstanding | | | | | | | | 309,920 | | | | | | | | | | 9,104 | |
| Net Asset Value Per Share | | | | | | | $ | 12.40 | | | | | | | | | $ | 11.08 | |
| Class I Shares | | | | | | | | | | | | | | | | | | | |
| Net Assets | | | | | | | $ | 67,020 | | | | | | | | | $ | 11,555 | |
| Shares Outstanding | | | | | | | | 5,337,425 | | | | | | | | | | 1,041,126 | |
| Net Asset Value Per Share | | | | | | | $ | 12.56 | | | | | | | | | $ | 11.10 | |
| Institutional Class Shares | | | | | | | | | | | | | | | | | | | |
| Net Assets | | $ | 2,076,576 | | | | | | | | | $ | 90,196 | | | | $ | 50,157 | |
| Shares Outstanding | | | 136,465,422 | | | | | | | | | | 8,079,727 | | | | | 4,517,826 | |
| Net Asset Value Per Share | | $ | 15.22 | | | | | | | | | $ | 11.16 | | | | $ | 11.10 | |
See accompanying Notes to Financial Statements.
| June 30, 2013 | William Blair Funds | 121 |
Statements of Operations
For the Period Ended June 30, 2013 (all amounts in thousands) (unaudited)
| | | Institutional
International
Growth Fund | | | International
Equity Fund | | | Institutional
International
Equity Fund | | | International
Leaders
Fund | |
| Investment income | | | | | | | | | | | | | | | | | | | | |
| Dividends | | | $ | 40,112 | | | | $ | 1,250 | | | | $ | 1,561 | | | | $ | 983 | |
| Less foreign tax withheld | | | | (3,866 | ) | | | | (121 | ) | | | | (153 | ) | | | | (111 | ) |
| Interest | | | | 9 | | | | | — | | | | | 1 | | | | | — | |
| Total income | | | | 36,255 | | | | | 1,129 | | | | | 1,409 | | | | | 872 | |
| Expenses | | | | | | | | | | | | | | | | | | | | |
| Investment advisory fees | | | | 9,737 | | | | | 399 | | | | | 470 | | | | | 222 | |
| Distribution fees | | | | — | | | | | 6 | | | | | — | | | | | — | |
| Shareholder administration fees | | | | — | | | | | — | | | | | — | | | | | 7 | |
| Custodian fees | | | | 195 | | | | | 35 | | | | | 39 | | | | | 39 | |
| Transfer agent fees | | | | 21 | | | | | 3 | | | | | 2 | | | | | 3 | |
| Sub-transfer agent fees | | | | | | | | | | | | | | | | | | | | |
| Class N | | | | — | | | | | 3 | | | | | — | | | | | — | |
| Class I | | | | — | | | | | 37 | | | | | — | | | | | — | |
| Professional fees | | | | 78 | | | | | 14 | | | | | 15 | | | | | 15 | |
| Registration fees | | | | 16 | | | | | 18 | | | | | 9 | | | | | 16 | |
| Shareholder reporting fees | | | | 6 | | | | | 1 | | | | | — | | | | | 5 | |
| Trustee fees | | | | 39 | | | | | 2 | | | | | 3 | | | | | — | |
| Other expenses | | | | 9 | | | | | 1 | | | | | 2 | | | | | 2 | |
| Total expenses before waiver | | | | 10,101 | | | | | 519 | | | | | 540 | | | | | 309 | |
| Expenses reimbursed to (waived or absorbed by) the Advisor | | | | — | | | | | (78 | ) | | | | (22 | ) | | | | (57 | ) |
| Net expenses | | | | 10,101 | | | | | 441 | | | | | 518 | | | | | 252 | |
| Net investment income (loss) | | | | 26,154 | | | | | 688 | | | | | 891 | | | | | 620 | |
| Realized and unrealized gain (loss) | | | | | | | | | | | | | | | | | | | | |
| Net realized gain (loss) on transactions from: | | | | | | | | | | | | | | | | | | | | |
| Investments in securities | | | | 141,537 | | | | | 4,248 | | | | | 9,893 | | | | | (858 | ) |
| Forward foreign currency contracts | | | | (2,353 | ) | | | | — | | | | | — | | | | | (175 | ) |
| Foreign currency transactions | | | | (1,326 | ) | | | | (33 | ) | | | | (46 | ) | | | | (65 | ) |
| Total net realized gain (loss) | | | | 137,858 | | | | | 4,215 | | | | | 9,847 | | | | | (1,098 | ) |
| Change in net unrealized appreciation (depreciation) of: | | | | | | | | | | | | | | | | | | | | |
| Investments | | | | (124,387 | ) | | | | (2,619 | ) | | | | (7,384 | ) | | | | (30 | ) |
| Forward foreign currency contracts | | | | 3,340 | | | | | — | | | | | — | | | | | — | |
| Foreign currency translations | | | | 551 | | | | | 1 | | | | | (3 | ) | | | | (1 | ) |
| Change in net unrealized appreciation (depreciation) | | | | (120,496 | ) | | | | (2,618 | ) | | | | (7,387 | ) | | | | (31 | ) |
| Net increase (decrease) in net assets resulting from operations | | | $ | 43,516 | | | | $ | 2,285 | | | | $ | 3,351 | | | | $ | (509 | ) |
See accompanying Notes to Financial Statements.
| 122 | Semi-Annual Report | June 30, 2013 |
Statements of Changes in Net Assets
For the Period Ended June 30, 2013 (unaudited) and Year Ended December 31, 2012 (all amounts in thousands)
| | | Institutional
International
Growth Fund | | | International
Equity Fund | | | Institutional
International
Equity Fund | | | International
Leaders Fund | |
| | | 2013 | | | 2012 | | | 2013 | | | 2012 | | | 2013 | | | 2012 | | | 2013 | | | 2012(a) | |
| Operations | | | | | | | | | | | | | | | | | | | | | | | | | | | | | | | | |
| Net investment income (loss) | | $ | 26,154 | | | $ | 29,169 | | | $ | 688 | | | $ | 799 | | | $ | 891 | | | $ | 1,465 | | | $ | 620 | | | $ | 3 | |
Net realized gain (loss) on investments,
forwards, and foreign currency | | | 137,858 | | | | 35,136 | | | | 4,215 | | | | 2,041 | | | | 9,847 | | | | 5,793 | | | | (1,098 | ) | | | (94 | ) |
Change in net unrealized appreciation
(depreciation) on investments,
forwards, and foreign currency | | | (120,496 | ) | | | 314,439 | | | | (2,618 | ) | | | 8,569 | | | | (7,387 | ) | | | 11,762 | | | | (31 | ) | | | 712 | |
| Net increase (decrease) in net assets resulting from operations | | | 43,516 | | | | 378,744 | | | | 2,285 | | | | 11,409 | | | | 3,351 | | | | 19,020 | | | | (509 | ) | | | 621 | |
| Distributions to shareholders from | | | | | | | | | | | | | | | | | | | | | | | | | | | | | | | | |
| Net investment income | | | | | | | | | | | | | | | | | | | | | | | | | | | | | | | | |
| Class N | | | — | | | | — | | | | — | | | | (172 | ) | | | — | | | | — | | | | — | | | | — | |
| Class I | | | — | | | | — | | | | — | | | | (2,061 | ) | | | — | | | | — | | | | — | | | | (6 | ) |
| Class Institutional | | | — | | | | (62,889 | ) | | | — | | | | — | | | | — | | | | (1,482 | ) | | | — | | | | (10 | ) |
| Net realized gain | | | | | | | | | | | | | | | | | | | | | | | | | | | | | | | | |
| Class N | | | — | | | | — | | | | — | | | | — | | | | — | | | | — | | | | — | | | | — | |
| Class I | | | — | | | | — | | | | — | | | | — | | | | — | | | | — | | | | — | | | | — | |
| Class Institutional | | | — | | | | — | | | | — | | | | — | | | | — | | | | — | | | | — | | | | — | |
| Total Distributions | | | — | | | | (62,889 | ) | | | — | | | | (2,233 | ) | | | — | | | | (1,482 | ) | | | — | | | | (16 | ) |
| Capital stock transactions | | | | | | | | | | | | | | | | | | | | | | | | | | | | | | | | |
| Net proceeds from sale of shares | | | 153,499 | | | | 283,364 | | | | 4,819 | | | | 3,288 | | | | 3,150 | | | | 9,705 | | | | 53,790 | | | | 9,543 | |
| Shares issued in reinvestment of income dividends and capital gain distributions | | | — | | | | 58,949 | | | | — | | | | 1,945 | | | | — | | | | 1,482 | | | | — | | | | 16 | |
| Less cost of shares redeemed | | | (94,569 | ) | | | (226,632 | ) | | | (6,424 | ) | | | (19,882 | ) | | | (25,995 | ) | | | (30,509 | ) | | | (1,632 | ) | | | — | |
| Net increase (decrease) in net assets resulting from capital share transactions | | | 58,930 | | | | 115,681 | | | | (1,605 | ) | | | (14,649 | ) | | | (22,845 | ) | | | (19,322 | ) | | | 52,158 | | | | 9,559 | |
| Increase (decrease) in net assets | | | 102,446 | | | | 431,536 | | | | 680 | | | | (5,473 | ) | | | (19,494 | ) | | | (1,784 | ) | | | 51,649 | | | | 10,164 | |
| Net assets | | | | | | | | | | | | | | | | | | | | | | | | | | | | | | | | |
| Beginning of period | | | 1,974,130 | | | | 1,542,594 | | | | 70,184 | | | | 75,657 | | | | 109,690 | | | | 111,474 | | | | 10,164 | | | | — | |
| End of period | | $ | 2,076,576 | | | $ | 1,974,130 | | | $ | 70,864 | | | $ | 70,184 | | | $ | 90,196 | | | $ | 109,690 | | | $ | 61,813 | | | $ | 10,164 | |
| Accumulated net investment income (loss) at the end of the period | | $ | 18,078 | | | $ | (8,076 | ) | | $ | 562 | | | $ | (126 | ) | | $ | 695 | | | $ | (196 | ) | | $ | 617 | | | $ | (3 | ) |
| (a) | For the period from August 16, 2012 (commencement of Operations) to December 31, 2012. |
See accompanying Notes to Financial Statements.
| June 30, 2013 | William Blair Funds | 123 |
Statements of Assets and Liabilities
As of June 30, 2013 (dollar amounts in thousands) (unaudited)
| | | International
Small Cap
Growth
Fund | | | Emerging
Markets
Growth
Fund | | | Emerging
Markets
Leaders
Fund | | | Emerging
Markets
Small Cap
Growth
Fund | |
| Assets | | | | | | | | | | | | | | | | | | | | |
| Investments in securities, at cost | | | $ | 686,939 | | | | $ | 825,700 | | | | $ | 60,737 | | | | $ | 78,819 | |
| Investments in affiliated companies, at cost | | | | — | | | | | 23,624 | | | | | — | | | | | — | |
| Investments in securities, at value | | | $ | 769,044 | | | | $ | 855,068 | | | | $ | 62,098 | | | | $ | 81,241 | |
| Investments in affiliated companies, at value | | | | — | | | | | 24,474 | | | | | — | | | | | — | |
| Foreign currency, at value ($2,222; $8,949; $369; $534) | | | | 2,224 | | | | | 8,903 | | | | | 367 | | | | | 534 | |
| Receivable for securities sold | | | | 3,251 | | | | | 9,766 | | | | | 155 | | | | | 349 | |
| Receivable for fund shares sold | | | | 537 | | | | | 270 | | | | | 262 | | | | | 742 | |
| Receivable from Advisor | | | | — | | | | | — | | | | | 12 | | | | | 34 | |
| Dividend and interest receivable | | | | 1,519 | | | | | 1,404 | | | | | 71 | | | | | 115 | |
| Total assets | | | | 776,575 | | | | | 899,885 | | | | | 62,965 | | | | | 83,015 | |
| Liabilities | | | | | | | | | | | | | | | | | | | | |
| Payable for investment securities purchased | | | | 7,606 | | | | | 6,181 | | | | | 1,658 | | | | | 875 | |
| Payable for fund shares redeemed | | | | 445 | | | | | 849 | | | | | 11 | | | | | — | |
| Unrealized depreciation on forward currency contracts | | | | 469 | | | | | 125 | | | | | 5 | | | | | — | |
| Management fee payable | | | | 635 | | | | | 883 | | | | | 56 | | | | | 76 | |
| Distribution and shareholder administration fees payable | | | | 55 | | | | | 23 | | | | | 4 | | | | | 8 | |
| Other payables and accrued expenses | | | | 156 | | | | | 943 | | | | | 61 | | | | | 77 | |
| Total liabilities | | | | 9,366 | | | | | 9,004 | | | | | 1,795 | | | | | 1,036 | |
| Net Assets | | | $ | 767,209 | | | | $ | 890,881 | | | | $ | 61,170 | | | | $ | 81,979 | |
| Capital | | | | | | | | | | | | | | | | | | | | |
| Composition of Net Assets | | | | | | | | | | | | | | | | | | | | |
| Par value of shares of beneficial interest | | | $ | 53 | | | | $ | 70 | | | | $ | 7 | | | | $ | 6 | |
| Capital paid in excess of par value | | | | 670,486 | | | | | 847,330 | | | | | 60,777 | | | | | 79,456 | |
| Accumulated net investment income (loss) | | | | 4,672 | | | | | 4,378 | | | | | 367 | | | | | 284 | |
| Accumulated realized gain (loss) | | | | 10,404 | | | | | 9,797 | | | | | (1,338 | ) | | | | (133 | ) |
| Net unrealized appreciation (depreciation) of investments and foreign currencies | | | | 81,594 | | | | | 29,306 | | | | | 1,357 | | | | | 2,366 | |
| Net Assets | | | $ | 767,209 | | | | $ | 890,881 | | | | $ | 61,170 | | | | $ | 81,979 | |
| | | | | | | | | | | | | | | | | | | | | |
| Class N Shares | | | | | | | | | | | | | | | | | | | | |
| Net Assets | | | $ | 15,339 | | | | $ | 13,912 | | | | $ | 199 | | | | $ | 10,194 | |
| Shares Outstanding | | | | 1,065,831 | | | | | 1,107,470 | | | | | 23,435 | | | | | 736,807 | |
| Net Asset Value Per Share | | | $ | 14.39 | | | | $ | 12.56 | | | | $ | 8.50 | | | | $ | 13.84 | |
| Class I Shares | | | | | | | | | | | | | | | | | | | | |
| Net Assets | | | $ | 399,781 | | | | $ | 143,033 | | | | $ | 31,061 | | | | $ | 32,301 | |
| Shares Outstanding | | | | 27,492,161 | | | | | 11,283,027 | | | | | 3,654,625 | | | | | 2,331,490 | |
| Net Asset Value Per Share | | | $ | 14.54 | | | | $ | 12.68 | | | | $ | 8.50 | | | | $ | 13.85 | |
| Institutional Class Shares | | | | | | | | | | | | | | | | | | | | |
| Net Assets | | | $ | 352,089 | | | | $ | 733,936 | | | | $ | 29,910 | | | | $ | 39,484 | |
| Shares Outstanding | | | | 24,079,224 | | | | | 57,489,299 | | | | | 3,518,695 | | | | | 2,847,880 | |
| Net Asset Value Per Share | | | $ | 14.62 | | | | $ | 12.77 | | | | $ | 8.51 | | | | $ | 13.86 | |
See accompanying Notes to Financial Statements.
| 124 | Semi-Annual Report | June 30, 2013 |
Statements of Operations
For the Period Ended June 30, 2013 (all amounts in thousands) (unaudited)
| | | International
Small Cap
Growth
Fund | | | Emerging
Markets
Growth
Fund | | | Emerging
Markets
Leaders
Fund | | | Emerging
Markets
Small Cap
Growth
Fund | |
| Investment income | | | | | | | | | | | | | | | | | | | | |
| Dividends | | | $ | 11,646 | | | | $ | 14,236 | | | | $ | 940 | | | | $ | 847 | |
| Less foreign tax withheld | | | | (725 | ) | | | | (1,318 | ) | | | | (77 | ) | | | | (80 | ) |
| Interest | | | | 4 | | | | | 5 | | | | | — | | | | | — | |
| Total income | | | | 10,925 | | | | | 12,923 | | | | | 863 | | | | | 767 | |
| Expenses | | | | | | | | | | | | | | | | | | | | |
| Investment advisory fees | | | | 3,742 | | | | | 5,606 | | | | | 378 | | | | | 344 | |
| Distribution fees | | | | 19 | | | | | 20 | | | | | — | | | | | 9 | |
| Shareholder administration fees | | | | 303 | | | | | 124 | | | | | 22 | | | | | 22 | |
| Custodian fees | | | | 85 | | | | | 274 | | | | | 52 | | | | | 108 | |
| Transfer agent fees | | | | 17 | | | | | 22 | | | | | 9 | | | | | 5 | |
| Sub-transfer agent fees | | | | | | | | | | | | | | | | | | | | |
| Class N | | | | 10 | | | | | 7 | | | | | — | | | | | — | |
| Class I | | | | 159 | | | | | 42 | | | | | 1 | | | | | — | |
| Professional fees | | | | 36 | | | | | 71 | | | | | 26 | | | | | 35 | |
| Registration fees | | | | 22 | | | | | 29 | | | | | 25 | | | | | 23 | |
| Shareholder reporting fees | | | | 45 | | | | | 40 | | | | | 3 | | | | | 1 | |
| Trustee fees | | | | 16 | | | | | 22 | | | | | 1 | | | | | — | |
| Other expenses | | | | 7 | | | | | 8 | | | | | 3 | | | | | 1 | |
| Total expenses before waiver | | | | 4,461 | | | | | 6,265 | | | | | 520 | | | | | 548 | |
| Expenses reimbursed to (waived or absorbed by) the Advisor | | | | — | | | | | — | | | | | (68 | ) | | | | (124 | ) |
| Net expenses | | | | 4,461 | | | | | 6,265 | | | | | 452 | | | | | 424 | |
| Net investment income (loss) | | | | 6,464 | | | | | 6,658 | | | | | 411 | | | | | 343 | |
| Realized and unrealized gain (loss) | | | | | | | | | | | | | | | | | | | | |
| Net realized gain (loss) on transactions from: | | | | | | | | | | | | | | | | | | | | |
| Investments in securities | | | | 68,179 | | | | | 48,333 | | | | | 3,723 | | | | | (5 | ) |
| Forward foreign currency contracts | | | | 279 | | | | | — | | | | | — | | | | | — | |
| Foreign currency transactions | | | | (460 | ) | | | | (1,142 | ) | | | | (74 | ) | | | | (124 | ) |
| Total net realized gain (loss) | | | | 67,998 | | | | | 47,191 | | | | | 3,649 | | | | | (129 | ) |
| Change in net unrealized appreciation (depreciation) of: | | | | | | | | | | | | | | | | | | | | |
| Investments | | | | (23,663 | ) | | | | (122,792 | ) | | | | (8,773 | ) | | | | 583 | |
| Forward foreign currency contracts | | | | (469 | ) | | | | (125 | ) | | | | (5 | ) | | | | — | |
| Foreign currency translations | | | | (37 | ) | | | | 939 | | | | | 1 | | | | | (30 | ) |
| Change in net unrealized appreciation (depreciation) | | | | (24,169 | ) | | | | (121,978 | ) | | | | (8,777 | ) | | | | 553 | |
| Net increase (decrease) in net assets resulting from operations | | | $ | 50,293 | | | | $ | (68,129 | ) | | | $ | (4,717 | ) | | | $ | 767 | |
See accompanying Notes to Financial Statements.
| June 30, 2013 | William Blair Funds | 125 |
Statements of Changes in Net Assets
For the Period Ended June 30, 2013 (unaudited) and Year Ended December 31, 2012 (all amounts in thousands)
| | | International
Small Cap
Growth Fund | | | Emerging Markets
Growth Fund | | | Emerging Markets
Leaders Fund | | | Emerging Markets
Small Cap
Growth Fund | |
| | | | 2013 | | | | 2012 | | | | 2013 | | | | 2012 | | | | 2013 | | | | 2012 | | | | 2013 | | | | 2012 | |
| Operations | | | | | | | | | | | | | | | | | | | | | | | | | | | | | | | | |
| Net investment income (loss) | | $ | 6,464 | | | $ | 7,217 | | | $ | 6,658 | | | $ | 10,446 | | | $ | 411 | | | $ | 496 | | | $ | 343 | | | $ | 39 | |
| Net realized gain (loss) on investments, forwards, and foreign currency | | | 67,998 | | | | 9,291 | | | | 47,191 | | | | (10,469 | ) | | | 3,649 | | | | (2,390 | ) | | | (129 | ) | | | 48 | |
| Change in net unrealized appreciation (depreciation) on investments, forwards, and foreign currency | | | (24,169 | ) | | | 125,993 | | | | (121,978 | ) | | | 170,595 | | | | (8,777 | ) | | | 12,693 | | | | 553 | | | | 1,831 | |
| Net increase (decrease) in net assets resulting from operations | | | 50,293 | | | | 142,501 | | | | (68,129 | ) | | | 170,572 | | | | (4,717 | ) | | | 10,799 | | | | 767 | | | | 1,918 | |
| Distributions to shareholders from | | | | | | | | | | | | | | | | | | | | | | | | | | | | | | | | |
| Net investment income | | | | | | | | | | | | | | | | | | | | | | | | | | | | | | | | |
| Class N | | | — | | | | (274 | ) | | | — | | | | (88 | ) | | | — | | | | (1 | ) | | | — | | | | (13 | ) |
| Class I | | | — | | | | (7,774 | ) | | | — | | | | (1,209 | ) | | | — | | | | (169 | ) | | | — | | | | (65 | ) |
| Class Institutional | | | — | | | | (8,146 | ) | | | — | | | | (7,965 | ) | | | — | | | | (303 | ) | | | — | | | | — | |
| Total Distributions | | | — | | | | (16,194 | ) | | | — | | | | (9,262 | ) | | | — | | | | (473 | ) | | | — | | | | (78 | ) |
| Capital stock transactions | | | | | | | | | | | | | | | | | | | | | | | | | | | | | | | | |
| Net proceeds from sale of shares | | | 53,982 | | | | 122,084 | | | | 137,296 | | | | 260,741 | | | | 8,998 | | | | 29,723 | | | | 61,168 | | | | 25,035 | |
| Shares issued in reinvestment of income dividends and capital gain distributions | | | — | | | | 14,490 | | | | — | | | | 8,174 | | | | — | | | | 413 | | | | — | | | | 52 | |
| Less cost of shares redeemed | | | (56,574 | ) | | | (261,594 | ) | | | (142,523 | ) | | | (283,834 | ) | | | (12,090 | ) | | | (19,305 | ) | | | (6,977 | ) | | | (3,178 | ) |
| Net increase (decrease) in net assets resulting from capital share transactions | | | (2,592 | ) | | | (125,020 | ) | | | (5,227 | ) | | | (14,919 | ) | | | (3,092 | ) | | | 10,831 | | | | 54,191 | | | | 21,909 | |
| Increase (decrease) in net assets | | | 47,701 | | | | 1,287 | | | | (73,356 | ) | | | 146,391 | | | | (7,809 | ) | | | 21,157 | | | | 54,958 | | | | 23,749 | |
| Net assets | | | | | | | | | | | | | | | | | | | | | | | | | | | | | | | | |
| Beginning of period | | | 719,508 | | | | 718,221 | | | | 964,237 | | | | 817,846 | | | | 68,979 | | | | 47,822 | | | | 27,021 | | | | 3,272 | |
| End of period | | $ | 767,209 | | | $ | 719,508 | | | $ | 890,881 | | | $ | 964,237 | | | $ | 61,170 | | | $ | 68,979 | | | $ | 81,979 | | | $ | 27,021 | |
| Accumulated net investment income (loss) at the end of the period | | $ | 4,672 | | | $ | (1,792 | ) | | $ | 4,378 | | | $ | (2,280 | ) | | $ | 367 | | | $ | (44 | ) | | $ | 284 | | | $ | (59 | ) |
See accompanying Notes to Financial Statements.
| 126 | Semi-Annual Report | June 30, 2013 |
Statements of Assets and Liabilities
As of June 30, 2013 (dollar amounts in thousands) (unaudited)
| | | Large
Cap Value
Fund | | | Mid Cap
Value
Fund | | | Small-Mid
Cap Value
Fund | | | Small
Cap Value
Fund | |
| Assets | | | | | | | | | | | | | | | | | | | | |
| Investments in securities, at cost | | | $ | 3,476 | | | | $ | 3,299 | | | | $ | 2,349 | | | | $ | 251,812 | |
| Investments in securities, at value | | | $ | 3,909 | | | | $ | 4,109 | | | | $ | 2,845 | | | | $ | 309,685 | |
| Cash | | | | — | | | | | 40 | | | | | — | | | | | — | |
| Receivable for securities sold | | | | — | | | | | 179 | | | | | 118 | | | | | 7,317 | |
| Receivable for fund shares sold | | | | — | | | | | — | | | | | — | | | | | 1,041 | |
| Receivable from Advisor | | | | 7 | | | | | 8 | | | | | 6 | | | | | 1 | |
| Dividend and interest receivable | | | | 6 | | | | | 6 | | | | | 3 | | | | | 217 | |
| Total assets | | | | 3,922 | | | | | 4,342 | | | | | 2,972 | | | | | 318,261 | |
| Liabilities | | | | | | | | | | | | | | | | | | | | |
| Payable for investment securities purchased | | | | — | | | | | 164 | | | | | 110 | | | | | 8,884 | |
| Payable for fund shares redeemed | | | | — | | | | | — | | | | | 10 | | | | | 106 | |
| Management fee payable | | | | 3 | | | | | 3 | | | | | 2 | | | | | 279 | |
| Distribution and shareholder administration fees payable | | | | — | | | | | ��� | | | | | — | | | | | 8 | |
| Other payables and accrued expenses | | | | 29 | | | | | 18 | | | | | 37 | | | | | 117 | |
| Total liabilities | | | | 32 | | | | | 185 | | | | | 159 | | | | | 9,394 | |
| Net Assets | | | $ | 3,890 | | | | $ | 4,157 | | | | $ | 2,813 | | | | $ | 308,867 | |
| Capital | | | | | | | | | | | | | | | | | | | | |
| Composition of Net Assets | | | | | | | | | | | | | | | | | | | | |
| Par value of shares of beneficial interest | | | $ | — | | | | $ | — | | | | $ | — | | | | $ | 19 | |
| Capital paid in excess of par value | | | | 2,976 | | | | | 3,050 | | | | | 2,140 | | | | | 236,216 | |
| Accumulated net investment income (loss) | | | | 17 | | | | | 18 | | | | | 6 | | | | | 149 | |
| Accumulated realized gain (loss) | | | | 464 | | | | | 279 | | | | | 171 | | | | | 14,610 | |
| Net unrealized appreciation (depreciation) of investments and foreign currencies | | | | 433 | | | | | 810 | | | | | 496 | | | | | 57,873 | |
| Net Assets | | | $ | 3,890 | | | | $ | 4,157 | | | | $ | 2,813 | | | | $ | 308,867 | |
| | | | | | | | | | | | | | | | | | | | | |
| Class N Shares | | | | | | | | | | | | | | | | | | | | |
| Net Assets | | | $ | 1,236 | | | | $ | 179 | | | | $ | 1,034 | | | | $ | 41,272 | |
| Shares Outstanding | | | | 93,096 | | | | | 13,611 | | | | | 78,414 | | | | | 2,571,050 | |
| Net Asset Value Per Share | | | $ | 13.28 | | | | $ | 13.13 | | | | $ | 13.18 | | | | $ | 16.05 | |
| Class I Shares | | | | | | | | | | | | | | | | | | | | |
| Net Assets | | | $ | 2,654 | | | | $ | 3,978 | | | | $ | 1,779 | | | | $ | 267,595 | |
| Shares Outstanding | | | | 199,553 | | | | | 302,450 | | | | | 134,755 | | | | | 16,367,934 | |
| Net Asset Value Per Share | | | $ | 13.30 | | | | $ | 13.15 | | | | $ | 13.20 | | | | $ | 16.35 | |
| | | | | | | | | | | | | | | | | | | | | |
See accompanying Notes to Financial Statements.
| June 30, 2013 | William Blair Funds | 127 |
Statements of Operations
For the Period Ended June 30, 2013 (all amounts in thousands) (unaudited)
| | | Large Cap
Value Fund | | | Mid Cap
Value Fund | | | Small-Mid
Cap Value
Fund | | | Small Cap
Value Fund | |
| Investment income | | | | | | | | | | | | | | | | | | | | |
| Dividends | | | $ | 33 | | | | $ | 41 | | | | $ | 21 | | | | $ | 1,818 | |
| Interest | | | | — | | | | | — | | | | | — | | | | | 2 | |
| Total income | | | | 33 | | | | | 41 | | | | | 21 | | | | | 1,820 | |
| Expenses | | | | | | | | | | | | | | | | | | | | |
| Investment advisory fees | | | | 13 | | | | | 20 | | | | | 13 | | | | | 1,553 | |
| Distribution fees | | | | 1 | | | | | — | | | | | 1 | | | | | 49 | |
| Custodian fees | | | | 20 | | | | | 16 | | | | | 19 | | | | | 24 | |
| Transfer agent fees | | | | 2 | | | | | 2 | | | | | 2 | | | | | 19 | |
| Sub-transfer agent fees | | | | | | | | | | | | | | | | | | | | |
| Class N | | | | — | | | | | — | | | | | — | | | | | 26 | |
| Class I | | | | — | | | | | — | | | | | — | | | | | 96 | |
| Professional fees | | | | 10 | | | | | 10 | | | | | 15 | | | | | 15 | |
| Registration fees | | | | 16 | | | | | 19 | | | | | 13 | | | | | 20 | |
| Shareholder reporting fees | | | | — | | | | | 1 | | | | | — | | | | | 17 | |
| Trustee fees | | | | — | | | | | — | | | | | — | | | | | 5 | |
| Other expenses | | | | 1 | | | | | 2 | | | | | 1 | | | | | 2 | |
| Total expenses before waiver | | | | 63 | | | | | 70 | | | | | 64 | | | | | 1,826 | |
| Expenses reimbursed to (waived or absorbed by) the Advisor | | | | (47 | ) | | | | (46 | ) | | | | (49 | ) | | | | (58 | ) |
| Net expenses | | | | 16 | | | | | 24 | | | | | 15 | | | | | 1,768 | |
| Net investment income (loss) | | | | 17 | | | | | 17 | | | | | 6 | | | | | 52 | |
| Realized and unrealized gain (loss) | | | | | | | | | | | | | | | | | | | | |
| Net realized gain (loss) on transactions from: | | | | | | | | | | | | | | | | | | | | |
| Investments in securities | | | | 463 | | | | | 269 | | | | | 149 | | | | | 15,442 | |
| Total net realized gain (loss) | | | | 463 | | | | | 269 | | | | | 149 | | | | | 15,442 | |
| Change in net unrealized appreciation (depreciation) of: | | | | | | | | | | | | | | | | | | | | |
| Investments | | | | 25 | | | | | 336 | | | | | 252 | | | | | 28,736 | |
| Change in net unrealized appreciation (depreciation) | | | | 25 | | | | | 336 | | | | | 252 | | | | | 28,736 | |
| Net increase (decrease) in net assets resulting from operations | | | $ | 505 | | | | $ | 622 | | | | $ | 407 | | | | $ | 44,230 | |
See accompanying Notes to Financial Statements.
| 128 | Semi-Annual Report | June 30, 2013 |
| Statements of Changes in Net Assets |
For the Period Ended June 30, 2013 (unaudited) and Year Ended December 31, 2012 (all amounts in thousands)
| | | Large Cap
Value Fund | | | Mid Cap
Value Fund | | | Small-Mid Cap
Value Fund | | | Small Cap
Value Fund | |
| | | 2013 | | | 2012 | | | 2013 | | | 2012 | | | 2013 | | | 2012 | | | 2013 | | | 2012 | |
| Operations | | | | | | | | | | | | | | | | | | | | | | | | | | | | | | | | | | | | | | | | |
| Net investment income (loss) | | | $ | 17 | | | | $ | 37 | | | | $ | 17 | | | | $ | 39 | | | | $ | 6 | | | | $ | 20 | | | | $ | 52 | | | | $ | 2,073 | |
| Net realized gain (loss) on investments | | | | 463 | | | | | 5 | | | | | 269 | | | | | 186 | | | | | 149 | | | | | 93 | | | | | 15,442 | | | | | 6,771 | |
| Change in net unrealized appreciation (depreciation) on investments | | | | 25 | | | | | 415 | | | | | 336 | | | | | 377 | | | | | 252 | | | | | 150 | | | | | 28,736 | | | | | 19,569 | |
| Net increase (decrease) in net assets resulting from operations | | | | 505 | | | | | 457 | | | | | 622 | | | | | 602 | | | | | 407 | | | | | 263 | | | | | 44,230 | | | | | 28,413 | |
| Distributions to shareholders from | | | | | | | | | | | | | | | | | | | | | | | | | | | | | | | | | | | | | | | | |
| Net investment income | | | | | | | | | | | | | | | | | | | | | | | | | | | | | | | | | | | | | | | | |
| Class N | | | | — | | | | | (12 | ) | | | | — | | | | | (1 | ) | | | | — | | | | | (7 | ) | | | | — | | | | | (256 | ) |
| Class I | | | | — | | | | | (25 | ) | | | | — | | | | | (35 | ) | | | | — | | | | | (14 | ) | | | | — | | | | | (1,734 | ) |
| Net realized gain | | | | | | | | | | | | | | | | | | | | | | | | | | | | | | | | | | | | | | | | |
| Class N | | | | — | | | | | — | | | | | — | | | | | (3 | ) | | | | — | | | | | (27 | ) | | | | — | | | | | (164 | ) |
| Class I | | | | — | | | | | — | | | | | — | | | | | (148 | ) | | | | — | | | | | (41 | ) | | | | — | | | | | (782 | ) |
| Total Distributions | | | | — | | | | | (37 | ) | | | | — | | | | | (187 | ) | | | | — | | | | | (89 | ) | | | | — | | | | | (2,936 | ) |
| Capital stock transactions | | | | | | | | | | | | | | | | | | | | | | | | | | | | | | | | | | | | | | | | |
| Net proceeds from sale of shares | | | | 2,164 | | | | | 957 | | | | | 135 | | | | | 303 | | | | | 127 | | | | | 72 | | | | | 58,504 | | | | | 47,641 | |
| Shares issued in reinvestment of income dividends and capital gain distributions | | | | — | | | | | 15 | | | | | — | | | | | 158 | | | | | — | | | | | 20 | | | | | — | | | | | 2,750 | |
| Less cost of shares redeemed | | | | (2,624 | ) | | | | — | | | | | (737 | ) | | | | (1,312 | ) | | | | (113 | ) | | | | (30 | ) | | | | (29,135 | ) | | | | (71,998 | ) |
| Net increase (decrease) in net assets resulting from capital share transactions | | | | (460 | ) | | | | 972 | | | | | (602 | ) | | | | (851 | ) | | | | 14 | | | | | 62 | | | | | 29,369 | | | | | (21,607 | ) |
| Increase (decrease) in net assets | | | | 45 | | | | | 1,392 | | | | | 20 | | | | | (436 | ) | | | | 421 | | | | | 236 | | | | | 73,599 | | | | | 3,870 | |
| Net assets | | | | | | | | | | | | | | | | | | | | | | | | | | | | | | | | | | | | | | | | |
| Beginning of period | | | | 3,845 | | | | | 2,453 | | | | | 4,137 | | | | | 4,573 | | | | | 2,392 | | | | | 2,156 | | | | | 235,268 | | | | | 231,398 | |
| End of period | | | $ | 3,890 | | | | $ | 3,845 | | | | $ | 4,157 | | | | $ | 4,137 | | | | $ | 2,813 | | | | $ | 2,392 | | | | $ | 308,867 | | | | $ | 235,268 | |
| Accumulated net investment income (loss) at the end of the period | | | $ | 17 | | | | $ | — | | | | $ | 18 | | | | $ | 1 | | | | $ | 6 | | | | $ | — | | | | $ | 149 | | | | $ | 97 | |
See accompanying Notes to Financial Statements.
| June 30, 2013 | William Blair Funds | 129 |
| Statements of Assets and Liabilities |
As of June 30, 2013 (dollar amounts in thousands) (unaudited)
| | | Bond
Fund | | | Income
Fund | | | Low
Duration
Fund | | | Ready
Reserves
Fund | |
| Assets | | | | | | | | | | | | | | | | |
| Investments in securities, at cost | | $ | 257,776 | | | $ | 129,503 | | | $ | 288,575 | | | $ | 990,803 | |
| Repurchase agreements, at cost | | | — | | | | — | | | | — | | | | 236,088 | |
| Investments in securities, at value | | $ | 262,153 | | | $ | 130,244 | | | $ | 286,778 | | | $ | 990,803 | |
| Repurchase agreements, at value | | | — | | | | — | | | | — | | | | 236,088 | |
| Receivable for securities sold | | | 5,327 | | | | 3,919 | | | | 22,689 | | | | — | |
| Receivable for fund shares sold | | | 255 | | | | 126 | | | | 1,001 | | | | — | |
| Receivable from Advisor | | | 16 | | | | — | | | | — | | | | 511 | |
| Dividend and interest receivable | | | 2,243 | | | | 769 | | | | 962 | | | | 1,074 | |
| Total assets | | | 269,994 | | | | 135,058 | | | | 311,430 | | | | 1,228,476 | |
| Liabilities | | | | | | | | | | | | | | | | |
| Payable for investment securities purchased | | | 2,896 | | | | 1,167 | | | | 16,813 | | | | — | |
| Payable for fund shares redeemed | | | 662 | | | | 882 | | | | 2,365 | | | | — | |
| Payable to custodian | | | 4,769 | | | | 1,052 | | | | 653 | | | | 2 | |
| Management fee payable | | | 63 | | | | 41 | | | | 68 | | | | 168 | |
| Distribution and shareholder administration fees payable | | | 25 | | | | 7 | | | | 22 | | | | 336 | |
| Shareholder distributions payable | | | 210 | | | | 39 | | | | 137 | | | | — | |
| Other payables and accrued expenses | | | 37 | | | | 21 | | | | 57 | | | | 84 | |
| Total liabilities | | | 8,662 | | | | 3,209 | | | | 20,115 | | | | 590 | |
| Net Assets | | $ | 261,332 | | | $ | 131,849 | | | $ | 291,315 | | | $ | 1,227,886 | |
| Capital | | | | | | | | | | | | | | | | |
| Composition of Net Assets | | | | | | | | | | | | | | | | |
| Par value of shares of beneficial interest | | $ | 26 | | | $ | 15 | | | $ | 30 | | | $ | 1,226 | |
| Capital paid in excess of par value | | | 253,400 | | | | 166,792 | | | | 300,849 | | | | 1,226,569 | |
| Accumulated net investment income (loss) | | | (1,248 | ) | | | (638 | ) | | | (2,076 | ) | | | 112 | |
| Accumulated realized gain (loss) | | | 4,777 | | | | (35,061 | ) | | | (5,691 | ) | | | (21 | ) |
| Net unrealized appreciation (depreciation) of investments and foreign currencies | | | 4,377 | | | | 741 | | | | (1,797 | ) | | | — | |
| Net Assets | | $ | 261,332 | | | $ | 131,849 | | | $ | 291,315 | | | $ | 1,227,886 | |
| | | | | | | | | | | | | | | | | |
| Class N Shares | | | | | | | | | | | | | | | | |
| Net Assets | | $ | 21,558 | | | $ | 59,339 | | | $ | 10,127 | | | $ | 1,227,886 | |
| Shares Outstanding | | | 2,014,483 | | | | 6,465,899 | | | | 1,054,911 | | | | 1,227,942,335 | |
| Net Asset Value Per Share | | $ | 10.70 | | | $ | 9.18 | | | $ | 9.59 | | | $ | 1.00 | |
| Class I Shares | | | | | | | | | | | | | | | | |
| Net Assets | | $ | 160,098 | | | $ | 72,510 | | | $ | 173,829 | | | | | |
| Shares Outstanding | | | 15,107,750 | | | | 7,959,906 | | | | 18,109,350 | | | | | |
| Net Asset Value Per Share | | $ | 10.60 | | | $ | 9.11 | | | $ | 9.59 | | | | | |
| Institutional Class Shares | | | | | | | | | | | | | | | | |
| Net Assets | | $ | 79,676 | | | | | | | $ | 107,359 | | | | | |
| Shares Outstanding | | | 7,524,826 | | | | | | | | 11,180,911 | | | | | |
| Net Asset Value Per Share | | $ | 10.59 | | | | | | | $ | 9.60 | | | | | |
See accompanying Notes to Financial Statements.
| 130 | Semi-Annual Report | June 30, 2013 |
For the Period Ended June 30, 2013 (all amounts in thousands) (unaudited)
| | | Bond
Fund | | | Income
Fund | | | Low
Duration
Fund | | | Ready
Reserves
Fund | |
| Investment income | | | | | | | | | | | | | | | | | | | | |
| Interest | | | $ | 5,111 | | | | $ | 2,020 | | | | $ | 2,532 | | | | $ | 779 | |
| Total income | | | | 5,111 | | | | | 2,020 | | | | | 2,532 | | | | | 779 | |
| Expenses | | | | | | | | | | | | | | | | | | | | |
| Investment advisory fees | | | | 434 | | | | | 274 | | | | | 444 | | | | | 1,605 | |
| Distribution fees | | | | 23 | | | | | 51 | | | | | 9 | | | | | — | |
| Shareholder administration fees | | | | 152 | | | | | — | | | | | 136 | | | | | 2,352 | |
| Custodian fees | | | | 30 | | | | | 25 | | | | | 35 | | | | | 25 | |
| Transfer agent fees | | | | 17 | | | | | 19 | | | | | 15 | | | | | 17 | |
| Sub-transfer agent fees | | | | | | | | | | | | | | | | | | | | |
| Class N | | | | 18 | | | | | 40 | | | | | 1 | | | | | — | |
| Class I | | | | 28 | | | | | 7 | | | | | 6 | | | | | — | |
| Professional fees | | | | 14 | | | | | 32 | | | | | 21 | | | | | 60 | |
| Registration fees | | | | 30 | | | | | 21 | | | | | 29 | | | | | 13 | |
| Shareholder reporting fees | | | | 9 | | | | | 10 | | | | | 6 | | | | | 65 | |
| Trustee fees | | | | 6 | | | | | 3 | | | | | 4 | | | | | 29 | |
| Other expenses | | | | 5 | | | | | 2 | | | | | 4 | | | | | 9 | |
| Total expenses before waiver | | | | 766 | | | | | 484 | | | | | 710 | | | | | 4,175 | |
| Expenses reimbursed to (waived or absorbed by) the Advisor | | | | (84 | ) | | | | — | | | | | — | | | | | (3,463 | ) |
| Net expenses | | | | 682 | | | | | 484 | | | | | 710 | | | | | 712 | |
| Net investment income (loss) | | | | 4,429 | | | | | 1,536 | | | | | 1,822 | | | | | 67 | |
| Realized and unrealized gain (loss) | | | | | | | | | | | | | | | | | | | | |
| Net realized gain (loss) on transactions from: | | | | | | | | | | | | | | | | | | | | |
| Investments in securities | | | | 3,384 | | | | | 702 | | | | | (883 | ) | | | | — | |
| Total net realized gain (loss) | | | | 3,384 | | | | | 702 | | | | | (883 | ) | | | | — | |
| Change in net unrealized appreciation (depreciation) of: | | | | | | | | | | | | | | | | | | | | |
| Investments | | | | (17,036 | ) | | | | (5,569 | ) | | | | (4,033 | ) | | | | — | |
| Change in net unrealized appreciation (depreciation) | | | | (17,036 | ) | | | | (5,569 | ) | | | | (4,033 | ) | | | | — | |
| Net increase (decrease) in net assets resulting from operations | | | $ | (9,223 | ) | | | $ | (3,331 | ) | | | $ | (3,094 | ) | | | $ | 67 | |
See accompanying Notes to Financial Statements.
| June 30, 2013 | William Blair Funds | 131 |
| Statements of Changes in Net Assets |
For the Period Ended June 30, 2013 (unaudited) and Year Ended December 31, 2012 (all amounts in thousands)
| | | Bond Fund | | | Income Fund | | | Low Duration Fund | | | Ready
Reserves Fund | |
| | | 2013 | | | 2012 | | | 2013 | | | 2012 | | | 2013 | | | 2012 | | | 2013 | | | 2012 | |
| Operations | | | | | | | | | | | | | | | | | | | | | | | | | | | | | | | | |
| Net investment income (loss) | | $ | 4,429 | | | $ | 9,312 | | | $ | 1,536 | | | $ | 3,393 | | | $ | 1,822 | | | $ | 3,071 | | | $ | 67 | | | $ | 131 | |
| Net realized gain (loss) on investments | | | 3,384 | | | | 4,348 | | | | 702 | | | | 2,712 | | | | (883 | ) | | | 192 | | | | — | | | | — | |
| Change in net unrealized appreciation (depreciation) on investments | | | (17,036 | ) | | | 8,020 | | | | (5,569 | ) | | | 1,352 | | | | (4,033 | ) | | | 1,977 | | | | — | | | | — | |
| Net increase (decrease) in net assets resulting from operations | | | (9,223 | ) | | | 21,680 | | | | (3,331 | ) | | | 7,457 | | | | (3,094 | ) | | | 5,240 | | | | 67 | | | | 131 | |
| Distributions to shareholders from | | | | | | | | | | | | | | | | | | | | | | | | | | | | | | | | |
| Net investment income | | | | | | | | | | | | | | | | | | | | | | | | | | | | | | | | |
| Class N | | | (567 | ) | | | (961 | ) | | | (1,009 | ) | | | (1,884 | ) | | | (144 | ) | | | (219 | ) | | | (67 | ) | | | (131 | ) |
| Class I | | | (3,359 | ) | | | (6,754 | ) | | | (1,165 | ) | | | (2,587 | ) | | | (2,185 | ) | | | (2,909 | ) | | | — | | | | — | |
| Class Institutional | | | (1,753 | ) | | | (3,467 | ) | | | — | | | | — | | | | (1,569 | ) | | | (2,382 | ) | | | — | | | | — | |
| Net realized gain | | | | | | | | | | | | | | | | | | | | | | | | | | | | | | | | |
| Class N | | | — | | | | (211 | ) | | | — | | | | — | | | | — | | | | — | | | | — | | | | — | |
| Class I | | | — | | | | (1,126 | ) | | | — | | | | — | | | | — | | | | — | | | | — | | | | — | |
| Class Institutional | | | — | | | | (597 | ) | | | — | | | | — | | | | — | | | | — | | | | — | | | | — | |
| Total Distributions | | | (5,679 | ) | | | (13,116 | ) | | | (2,174 | ) | | | (4,471 | ) | | | (3,898 | ) | | | (5,510 | ) | | | (67 | ) | | | (131 | ) |
| Capital stock transactions | | | | | | | | | | | | | | | | | | | | | | | | | | | | | | | | |
| Net proceeds from sale of shares | | | 32,176 | | | | 82,419 | | | | 38,382 | | | | 71,248 | | | | 68,664 | | | | 191,001 | | | | 349,973 | | | | 867,610 | |
Shares issued in reinvestment of income dividends and capital
gain distributions | | | 4,468 | | | | 10,216 | | | | 1,867 | | | | 3,667 | | | | 3,101 | | | | 4,275 | | | | 67 | | | | 131 | |
| Less cost of shares redeemed | | | (57,152 | ) | | | (36,473 | ) | | | (44,672 | ) | | | (48,109 | ) | | | (60,288 | ) | | | (65,323 | ) | | | (637,484 | ) | | | (624,157 | ) |
| Net increase (decrease) in net assets resulting from capital share transactions | | | (20,508 | ) | | | 56,162 | | | | (4,423 | ) | | | 26,806 | | | | 11,477 | | | | 129,953 | | | | (287,444 | ) | | | 243,584 | |
| Increase (decrease) in net assets | | | (35,410 | ) | | | 64,726 | | | | (9,928 | ) | | | 29,792 | | | | 4,485 | | | | 129,683 | | | | (287,444 | ) | | | 243,584 | |
| Net assets | | | | | | | | | | | | | | | | | | | | | | | | | | | | | | | | |
| Beginning of period | | | 296,742 | | | | 232,016 | | | | 141,777 | | | | 111,985 | | | | 286,830 | | | | 157,147 | | | | 1,515,330 | | | | 1,271,746 | |
| End of period | | $ | 261,332 | | | $ | 296,742 | | | $ | 131,849 | | | $ | 141,777 | | | $ | 291,315 | | | $ | 286,830 | | | $ | 1,227,886 | | | $ | 1,515,330 | |
| Accumulated net investment income (loss) at the end of the period | | $ | (1,248 | ) | | $ | 2 | | | $ | (638 | ) | | $ | — | | | $ | (2,076 | ) | | $ | — | | | $ | 112 | | | $ | 112 | |
See accompanying Notes to Financial Statements.
| 132 | Semi-Annual Report | June 30, 2013 |
| Notes to Financial Statements |
(1) Significant Accounting Policies
The following is a summary of William Blair Funds’ (the “Trust”) significant accounting policies in effect during the period covered by the financial statements, which are in accordance with U.S. generally accepted accounting principles.
(a) Description of the Trust
The Trust is a mutual fund registered under the Investment Company Act of 1940 (the “1940 Act”), as amended, as an open-end management investment company. The Trust currently consists of the following twenty-six funds (the “Funds”), each with its own investment objective and policies. For each Fund, the number of shares authorized is unlimited.
Domestic Equity Funds
Growth
Large Cap Growth
Mid Cap Growth
Small-Mid Cap Growth
Small Cap Growth
Large Cap Value
Mid Cap Value
Small-Mid Cap Value
Small Cap Value
Global Equity Fund
Global Leaders
Global Small Cap Growth
Multi-Asset and Alternative Funds
Macro Allocation
Commodity Strategy Long/Short | International Equity Funds
International Growth
Institutional International Growth
International Equity
Institutional International Equity
International Leaders
International Small Cap Growth
Emerging Markets Growth
Emerging Markets Leaders
Emerging Markets Small Cap Growth
Fixed-Income Funds
Bond
Income
Low Duration
Money Market Fund
Ready Reserves |
The Macro Allocation Fund and the Commodity Strategy Long/Short Fund have a fiscal year-end of October 31, and issue a separate report.
The investment objectives of the Funds are as follows:
| Domestic Equity | Long-term capital appreciation. |
| Global Equity | Long-term capital appreciation. |
| International Equity | Long-term capital appreciation. |
| Fixed-Income | High level of current income with relative stability of principal. |
| | (Maximize total return-Low Duration) |
| Money Market | Current income, a stable share price and daily liquidity. |
(b) Share Classes
Three different classes of shares currently exist: N, I and Institutional (“Inst.”).
| Class | | Description |
| N | | Class N shares are sold to the general public, either directly through the Trust’s distributor or through a select number of financial intermediaries. Class N shares are sold without any sales load, and carry an annual 12b-1 distribution fee (0.25% for the Equity, Global Equity and International Equity Funds and 0.15% for the Fixed-Income Funds) or a service fee (0.35% for the Money Market Fund), a sub-transfer agent fee that is not a fixed rate and may vary by Fund and class, and an annual shareholder administration fee (0.15% for the Global Leaders, the International Leaders, the International Small Cap Growth, the Emerging Markets Growth, the Emerging Markets Leaders, the Emerging Markets Small Cap Growth, the Bond and the Low Duration Funds) |
| June 30, 2013 | William Blair Funds | 133 |
| Class | | Description |
| I | | Class I shares are sold to a limited group of investors. They do not carry any sales load or distribution fees and generally have lower ongoing expenses than the Class N shares. Class I shares have a sub-transfer agent fee that is not a fixed rate and may vary by Fund and class and the Global Leaders, the International Leaders, the International Small Cap Growth, the Emerging Markets Growth, the Emerging Markets Leaders, the Emerging Markets Small Cap Growth, the Bond and the Low Duration Funds carry an annual shareholder administration fee of 0.15%. |
| | | |
| Inst. | | The Institutional share class is sold to institutional investors, including but not limited to employee benefit plans, endowments, foundations, trusts and corporations, who are able to meet the Fund’s high minimum investment requirement. The minimum initial investment required is $5 million. |
Sub-transfer agent fees: For Class N and Class I Shares the Funds may reimburse William Blair & Company, L.L.C. for fees paid to intermediaries such as banks, broker-dealers, financial advisors or other financial institutions for sub-transfer agency, sub-administration and other services provided to investors whose shares of record are held in omnibus, other group accounts, retirement plans or accounts traded through registered securities clearing agents. These fees may vary based on, for example, the nature of services provided, but generally range up to 0.15% of the assets of the class serviced or maintained by the intermediary or up to $15 per sub-account maintained by the intermediary.
Investment income, realized and unrealized gains and losses, and certain Fund level expenses and expense reductions, if any, are allocated based on the relative net assets of each class, except for certain class specific expenses, which are charged directly to the appropriate class. Differences in class expenses may result in the payment of different per share dividends by class. All share classes of the Funds have equal rights with respect to voting subject to class specific arrangements.
(c) Investment Valuation
The market value of domestic equity securities is determined by valuing securities traded on national securities markets or in the over-the-counter markets at the last sale price or, if applicable, the official closing price or, in the absence of a recent sale on the date of determination, the mean between the last reported bid and ask price.
The value of foreign equity securities is generally determined based upon the last sale price on the foreign exchange or market on which it is primarily traded and in the currency of that market as of the close of the appropriate exchange or, if there have been no sales during that day, the mean between the last reported bid and ask price. The Board of Trustees has determined that the passage of time between when the foreign exchanges or markets close and when the Funds compute their net asset values could cause the value of foreign equity securities to no longer be representative or accurate and, as a result, may necessitate that such securities be fair valued. Accordingly, for foreign equity securities, the Funds may use an independent pricing service to fair value the security as of the close of regular trading on the New York Stock Exchange. As a result, a Fund’s value for a security may be different from the last sale price (or the mean between the last reported bid and ask price).
Fixed-income securities are generally valued using evaluated prices provided by an independent pricing service. The evaluated prices are formed using various market inputs the pricing service believes accurately represent the fair market value of a security at a particular point in time. The pricing service determines evaluated prices for fixed-income securities using inputs including, but not limited to, recent transaction prices, dealer quotes, transaction prices for securities with similar characteristics, collateral characteristics, credit quality, payment history, liquidity and market conditions.
Securities, and other assets, for which a market price is not available or is deemed unreliable, (e.g., securities affected by unusual or extraordinary events, such as natural disasters or securities affected by market or economic events, such as bankruptcy filings), or the value of which is affected by a significant valuation event, are valued at a fair value as determined in good faith by, or under the direction of, the Board of Trustees and in accordance with the Trust’s Valuation Procedures. The value of fair valued securities may be different from the last sale price (or the mean between the last reported bid and ask price), and there is no guarantee that a fair valued security will be sold at the price at which a Fund is carrying the security.
Investments in other funds that are not exchange-traded funds are valued at the underlying fund’s net asset value on the date of valuation. Securities held in the Ready Reserves Fund are valued at amortized cost, which approximates fair value.
As of June 30, 2013, there were securities held in the International Growth, Institutional International Growth, Bond and Income Funds requiring fair valuation pursuant to the Trust’s Valuation Procedures.
(d) Investment income and transactions
Dividend income is recorded on the ex-dividend date, except for those dividends from certain foreign securities that are recorded when the information is available.
| 134 | Semi-Annual Report | June 30, 2013 |
Interest income is recorded on an accrual basis, adjusted for amortization of premium or accretion of discount. Variable rate bonds and floating rate notes earn interest at coupon rates that fluctuate at specific time intervals. The interest rates shown in the Portfolio of Investments for the Bond, Income, Low Duration and Ready Reserves Funds were the rates in effect on June 30, 2013. Put bonds may be redeemed at the discretion of the holder on specified dates prior to maturity.
Premiums and discounts are accreted and amortized on a straight-line basis for short-term investments and on an effective interest method for long-term investments.
Paydown gains and losses on mortgage-backed and asset-backed securities are treated as an adjustment to interest income. For the period ended June 30, 2013, the Bond, Income and Low Duration Funds recognized a reduction of interest income and a decrease of net realized loss of $(1,249), $(636) and $(2,075), respectively (in thousands). This reclassification had no effect on the net asset value or the net assets of the Funds.
The Funds do not isolate that portion of the results of operations resulting from changes in foreign exchange rates on investments from the fluctuations arising from changes in market prices of securities held. Such fluctuations are included with the net realized and unrealized gain or loss from investments.
Reported net realized foreign currency gains or losses arise from disposition of foreign currency, the difference in the foreign exchange rates between the trade and settlement dates on securities transactions, and the difference between the amounts of dividends, interest and foreign withholding taxes recorded on the ex-date or accrual date and the U.S. dollar equivalent of the amounts actually received or paid. Net unrealized foreign exchange gains and losses arise from changes (due to the changes in the exchange rate) in the value of foreign currency and other assets and liabilities denominated in foreign currencies held at period end.
Security and shareholder transactions are accounted for no later than one business day following the trade date. However, for financial reporting purposes, security and shareholder transactions are accounted for on the trade date of the last business day of the reporting period. Realized gains and losses from securities transactions are recognized on a specifically identified cost basis.
Awards from class action litigation may be recorded as a reduction of cost. If the Funds no longer own the applicable securities, the proceeds are recorded as realized gains.
(e) Share Valuation and Distributions to Shareholders
Shares are sold and redeemed on a continuous basis at net asset value. The net asset value per share is determined separately for each class by dividing the Fund’s net assets attributable to that class by the number of shares of the class outstanding as of the close of regular trading on the New York Stock Exchange (the “Exchange”), which is generally 4:00 p.m. Eastern time, on each day the Exchange is open. Redemption fees may be applicable to redemptions or exchanges within 60 days of purchase. For both Class N and Class I shares, the Domestic Equity Funds assess a 1% redemption fee on shares sold or exchanged that have been owned 60 days or less and the Global Equity and International Equity Funds assess a 2% redemption fee on shares sold or exchanged that have been owned 60 days or less as disclosed within the Fund’s Prospectus. The redemption fees collected by the Fund are netted against the amount of redemptions for presentation on the Statements of Changes in Net Assets.
The redemption fees collected by the Funds were as follows (in thousands):
| | Fund | | Period Ended
June 30,
2013 | | Year Ended
December 31,
2012 |
| | Growth | | $ | 3 | | | $ | 7 | |
| | Large Cap Growth | | | — | | | | — | |
| | Mid Cap Growth | | | 4 | | | | 12 | |
| | Small-Mid Cap Growth | | | 4 | | | | 9 | |
| | Small Cap Growth | | | 5 | | | | 4 | |
| | Global Leaders | | | 1 | | | | 1 | |
| | Global Small Cap Growth | | | — | | | N/A | |
| | International Growth | | | 35 | | | | 38 | |
| | International Equity | | | — | | | | 7 | |
| | International Leaders | | | 13 | | | | — | |
| | International Small Cap Growth | | | — | | | | 19 | |
| | Emerging Markets Growth | | | — | | | | 1 | |
| | Emerging Markets Leaders | | | — | | | | 1 | |
| | Emerging Markets Small Cap Growth | | | 23 | | | | 3 | |
| | Large Cap Value | | | — | | | | — | |
| | Mid Cap Value | | | — | | | | — | |
| | Small-Mid Cap Value | | | — | | | | 1 | |
| | Small Cap Value | | | 7 | | | | 8 | |
| June 30, 2013 | William Blair Funds | 135 |
Distributions from net investment income, if any, of all Equity Funds are declared and paid at least annually. Distributions from the Bond, Income, Low Duration and Ready Reserves Funds are declared daily and paid monthly. Capital gain distributions, if any, are declared and paid at least annually in December. Distributions payable to shareholders are recorded on the ex-dividend date.
(f) Foreign Currency Translation and Forward Foreign Currency Contracts
The Global Equity and International Equity Funds may invest in securities denominated in foreign currencies. As such, assets and liabilities denominated in foreign currencies are translated into U.S. dollar amounts at the current exchange rate on the date of valuation. The values of foreign investments, open forward foreign currency contracts, and cash denominated in foreign currencies are translated into U.S. dollars using a spot market rate of exchange as of the time of the determination of each Fund’s Net Asset Value, typically 4:00 p.m. Eastern time on days when there is regular trading on the New York Stock Exchange. Payables and receivables for securities transactions, dividends, interest income and tax reclaims are translated into U.S. dollars using a spot market rate of exchange as of 4:00 p.m. Eastern time. Settlement of purchases and sales and dividend and interest receipts are translated into U.S. dollars using a spot market rate of exchange as of 11:00 a.m. Eastern time.
(g) Income Taxes
Each Fund intends to comply with the provisions of Subchapter M of the Internal Revenue Code available to regulated investment companies. Each Fund intends to make the requisite distributions of income and capital gains to its shareholders sufficient to relieve it from all, or substantially all, federal income and excise taxes. No provision for federal income and excise taxes has been made.
Certain Funds may be subject to foreign income taxes imposed on realized gains on securities of issuers from certain foreign countries.
Management has evaluated all of the uncertain tax positions of the Funds and has determined that no liability is required to be recorded in the financial statements.
The statute of limitations on the Funds’ tax returns for each of the tax years in the four year period ended December 31, 2012, remains open and the returns are subject to examination.
The Funds have elected to mark-to-market their investments in Passive Foreign Investment Companies (“PFICs”) for federal income tax purposes. The Funds also treat the deferred loss associated with current and prior year wash sales as an adjustment to the cost of investments for tax purposes. The cost of investments for federal income tax purposes and related gross unrealized appreciation/(depreciation) and net unrealized appreciation (depreciation) at June 30, 2013, were as follows (in thousands):
| Fund | | Cost of
Investments | | Gross
Unrealized
Appreciation | | Gross
Unrealized
Depreciation | | Net
Unrealized
Appreciation/
(Depreciation) |
| Growth | | | $ | 615,510 | | | | $ | 181,920 | | | | $ | 4,156 | | | | $ | 177,764 | |
| Large Cap Growth | | | | 25,309 | | | | | 7,065 | | | | | 264 | | | | | 6,801 | |
| Mid Cap Growth | | | | 412,300 | | | | | 59,539 | | | | | 6,989 | | | | | 52,550 | |
| Small-Mid Cap Growth | | | | 400,815 | | | | | 104,002 | | | | | 5,567 | | | | | 98,435 | |
| Small Cap Growth | | | | 408,804 | | | | | 105,478 | | | | | 29,473 | | | | | 76,005 | |
| Global Leaders | | | | 115,361 | | | | | 10,572 | | | | | 1,981 | | | | | 8,591 | |
| Global Small Cap Growth | | | | 10,816 | | | | | 691 | | | | | 383 | | | | | 308 | |
| International Growth | | | | 3,444,437 | | | | | 505,910 | | | | | 125,960 | | | | | 379,950 | |
| Institutional International Growth | | | | 1,862,544 | | | | | 266,673 | | | | | 66,951 | | | | | 199,722 | |
| International Equity | | | | 61,334 | | | | | 11,090 | | | | | 1,441 | | | | | 9,649 | |
| Institutional International Equity | | | | 80,572 | | | | | 13,783 | | | | | 1,615 | | | | | 12,168 | |
| International Leaders | | | | 60,866 | | | | | 2,957 | | | | | 2,293 | | | | | 664 | |
| International Small Cap Growth | | | | 690,056 | | | | | 107,809 | | | | | 28,821 | | | | | 78,988 | |
| Emerging Markets Growth | | | | 857,646 | | | | | 56,297 | | | | | 34,401 | | | | | 21,896 | |
| 136 | Semi-Annual Report | June 30, 2013 |
| Fund | | Cost of
Investments | | | Gross
Unrealized
Appreciation | | | Gross
Unrealized
Depreciation | | | Net
Unrealized
Appreciation/
(Depreciation) | |
| Emerging Markets Leaders | | | $ | 61,449 | | | | $ | 3,393 | | | | | $ | 2,744 | | | | | $ | 649 | | |
| Emerging Markets Small Cap Growth | | | | 79,139 | | | | | 5,277 | | | | | | 3,175 | | | | | | 2,102 | | |
| Large Cap Value | | | | 3,502 | | | | | 443 | | | | | | 36 | | | | | | 407 | | |
| Mid Cap Value | | | | 3,310 | | | | | 819 | | | | | | 20 | | | | | | 799 | | |
| Small-Mid Cap Value | | | | 2,351 | | | | | 511 | | | | | | 17 | | | | | | 494 | | |
| Small Cap Value | | | | 253,808 | | | | | 57,862 | | | | | | 1,985 | | | | | | 55,877 | | |
| Bond | | | | 257,776 | | | | | 8,399 | | | | | | 4,022 | | | | | | 4,377 | | |
| Income | | | | 129,503 | | | | | 2,932 | | | | | | 2,191 | | | | | | 741 | | |
| Low Duration | | | | 288,574 | | | | | 912 | | | | | | 2,708 | | | | | | (1,796 | ) | |
| Ready Reserves | | | | 1,226,891 | | | | | — | | | | | | — | | | | | | — | | |
In addition, the Funds may periodically record reclassifications among certain capital accounts to reflect differences between financial reporting and income tax basis distributions. The reclassifications were reported in order to reflect the tax treatment for certain permanent differences that exist between income tax regulations and U.S. generally accepted accounting principles. The reclassifications generally relate to net operating losses, Section 988 currency gains and losses, PFICs gains and losses, expiration of capital loss carryforward, recharacterization of dividends received from investments in Real Estate Investment Trust, paydown gains and losses, and redemptions in-kind. These reclassifications have no impact on the net asset values of the Funds. Accordingly, at December 31, 2012, the following reclassifications were recorded (in thousands):
| Fund | | Accumulated
Undistributed
Net Investment
Income (Loss) | | Accumulated
Undistributed
Net Realized
Gain/(Loss) | | Capital Paid
in Excess
of Par Value |
| Growth | | | $ | 28 | | | | $ | (28 | ) | | | $ | — | |
| Large Cap Growth | | | | 1 | | | | | (1 | ) | | | | — | |
| Mid Cap Growth | | | | 4 | | | | | — | | | | | (4 | ) |
| Small-Mid Cap Growth | | | | 7 | | | | | (7 | ) | | | | — | |
| Small Cap Growth | | | | 3,984 | | | | | — | | | | | (3,984 | ) |
| Global Leaders | | | | (20 | ) | | | | 20 | | | | | — | |
| International Growth | | | | 20,416 | | | | | (20,416 | ) | | | | — | |
| Institutional International Growth | | | | 9,629 | | | | | (9,629 | ) | | | | — | |
| International Equity | | | | (71 | ) | | | | 71 | | | | | — | |
| Institutional International Equity | | | | (154 | ) | | | | 154 | | | | | — | |
| International Leaders | | | | 10 | | | | | (10 | ) | | | | — | |
| International Small Cap Growth | | | | 2,643 | | | | | (2,665 | ) | | | | 22 | |
| Emerging Markets Growth | | | | (1,511 | ) | | | | 1,511 | | | | | — | |
| Emerging Markets Leaders | | | | (53 | ) | | | | 53 | | | | | — | |
| Emerging Markets Small Cap Growth | | | | (7 | ) | | | | 6 | | | | | 1 | |
| Large Cap Value | | | | — | | | | | — | | | | | — | |
| Mid Cap Value | | | | (2 | ) | | | | (32 | ) | | | | 34 | |
| Small-Mid Cap Value | | | | — | | | | | — | | | | | — | |
| Small Cap Value | | | | (12 | ) | | | | 12 | | | | | — | |
| Bond | | | | 1,870 | | | | | (1,870 | ) | | | | — | |
| Income | | | | 1,078 | | | | | 1,412 | | | | | (2,490 | ) |
| Low Duration | | | | 2,439 | | | | | (2,439 | ) | | | | — | |
| Ready Reserves | | | | 4 | | | | | 20 | | | | | (24 | ) |
The timing and characterization of certain income and capital gain distributions are determined annually in accordance with federal income tax regulations that may differ from U.S. generally accepted accounting principles. As a result, net investment income or loss and net realized gain or loss for a reporting period may differ from the amount distributed during such period.
| June 30, 2013 | William Blair Funds | 137 |
Distributions from net realized gains for book purposes may include short-term capital gains, which are included as ordinary income for tax purposes. The tax character of distributions paid during 2012 and 2011 was as follows (in thousands):
| | | Distributions Paid in 2012 | | | Distributions Paid in 2011 | |
| | | Ordinary
Income | | | Long-Term
Capital Gains | | | Return of
Capital | | | Ordinary
Income | | | Long-Term
Capital Gains | |
| Fund | | Class N | | | Class I | | | Class N | | | Class I | | | Class N | | | Class I | | | Class N | | | Class I | | | Class N | | | Class I | |
| Growth | | $ | 10 | | | $ | 1,133 | | | $ | 7,281 | | | $ | 12,939 | | | $ | — | | | $ | — | | | $ | — | | | $ | 329 | | | $ | 5,882 | | | $ | 10,199 | |
| Large Cap Growth | | | — | | | | — | | | | — | | | | — | | | | — | | | | — | | | | — | | | | 37 | | | | — | | | | — | |
| Mid Cap Growth | | | — | | | | 488 | | | | 905 | | | | 7,042 | | | | — | | | | — | | | | — | | | | — | | | | 2,378 | | | | 8,679 | |
| Small-Mid Cap Growth | | | 63 | | | | 1,436 | | | | 1,026 | | | | 8,092 | | | | — | | | | — | | | | 595 | | | | 3,772 | | | | 2,542 | | | | 16,104 | |
| Small Cap Growth | | | — | | | | — | | | | 564 | | | | 1,107 | | | | — | | | | — | | | | — | | | | — | | | | — | | | | — | |
| Global Leaders | | | 15 | | | | 227 | | | | — | | | | — | | | | — | | | | — | | | | 4 | | | | 170 | | | | — | | | | — | |
| International Growth | | | 37,353 | | | | 74,977 | | | | — | | | | — | | | | — | | | | — | | | | — | | | | 6,046 | | | | — | | | | — | |
| International Equity | | | 172 | | | | 2,061 | | | | — | | | | — | | | | — | | | | — | | | | — | | | | — | | | | — | | | | — | |
| International Leaders | | | — | | | | 6 | | | | — | | | | — | | | | — | | | | — | | | | — | | | | — | | | | — | | | | — | |
| International Small Cap Growth | | | 274 | | | | 7,774 | | | | — | | | | — | | | | — | | | | — | | | | 193 | | | | 5,147 | | | | — | | | | — | |
| Emerging Markets Growth | | | 88 | | | | 1,209 | | | | — | | | | — | | | | — | | | | — | | | | — | | | | 466 | | | | 2,577 | | | | 18,690 | |
| Emerging Markets Leaders | | | 1 | | | | 169 | | | | — | | | | — | | | | — | | | | 11 | | | | 1 | | | | 582 | | | | 3 | | | | 1,287 | |
| Emerging Markets Small Cap Growth | | | 13 | | | | 65 | | | | — | | | | — | | | | — | | | | — | | | | — | | | | — | | | | — | | | | — | |
| Large Cap Value | | | 12 | | | | 25 | | | | — | | | | — | | | | — | | | | — | | | | 3 | | | | 4 | | | | — | | | | — | |
| Mid Cap Value | | | 1 | | | | 62 | | | | 3 | | | | 121 | | | | — | | | | — | | | | 1 | | | | 64 | | | | — | | | | 34 | |
| Small-Mid Cap Value | | | 34 | | | | 55 | | | | — | | | | — | | | | — | | | | — | | | | — | | | | — | | | | — | | | | — | |
| Small Cap Value | | | 256 | | | | 1,734 | | | | 164 | | | | 782 | | | | 60 | | | | 273 | | | | 6 | | | | 483 | | | | 1,471 | | | | 6,717 | |
| Bond | | | 961 | | | | 6,754 | | | | 211 | | | | 1,126 | | | | — | | | | — | | | | 229 | | | | 6,707 | | | | 66 | | | | 1,188 | |
| Income | | | 1,884 | | | | 2,587 | | | | — | | | | — | | | | — | | | | — | | | | 1,377 | | | | 2,800 | | | | — | | | | — | |
| Low Duration | | | 219 | | | | 2,909 | | | | — | | | | — | | | | — | | | | — | | | | 152 | | | | 2,098 | | | | — | | | | — | |
| Ready Reserves | | | 131 | | | | — | | | | — | | | | — | | | | — | | | | — | | | | 125 | | | | — | | | | — | | | | — | |
| | | Distributions Paid in 2012 | | | Distributions Paid in 2011 | |
| | | Ordinary
Income | | | Long-Term
Capital Gains | | | Return of
Capital | | | Ordinary
Income | | | Long-Term
Capital Gains | |
| | | Institutional | | | Institutional | | | Institutional | | | Institutional | | | Institutional | |
| Global Leaders | | | $ | — | | | | | $ | — | | | | | $ | — | | | | | $ | — | | | | | $ | — | | |
| Institutional International Growth | | | | 62,889 | | | | | | — | | | | | | — | | | | | | 1,997 | | | | | | — | | |
| Institutional International Equity | | | | 1,482 | | | | | | �� | | | | | | — | | | | | | 2,326 | | | | | | — | | |
| International Leaders | | | | 10 | | | | | | — | | | | | | — | | | | | | — | | | | | | — | | |
| International Small Cap Growth | | | | 8,146 | | | | | | — | | | | | | — | | | | | | 5,384 | | | | | | — | | |
| Emerging Markets Growth | | | | 7,965 | | | | | | — | | | | | | — | | | | | | 3,984 | | | | | | 93,763 | | |
| Emerging Markets Leaders | | | | 303 | | | | | | — | | | | | | 14 | | | | | | 695 | | | | | | 1,443 | | |
| Emerging Markets Small Cap Growth | | | | — | | | | | | — | | | | | | — | | | | | | — | | | | | | — | | |
| Bond | | | | 3,467 | | | | | | 597 | | | | | | — | | | | | | 2,764 | | | | | | 577 | | |
| Low Duration | | | | 2,382 | | | | | | — | | | | | | — | | | | | | 1,853 | | | | | | — | | |
As of December 31, 2012, the components of distributable earnings on a tax basis were as follows (in thousands):
| Fund | | Undistributed
Ordinary Income | | Accumulated
Capital and
Other Losses | | | Undistributed
Long-Term
Capital Gain | | Net Unrealized
Appreciation/
Depreciation |
| Growth | | | $ | 10 | | | $ | — | | | | $ | 13,481 | | | | $ | 122,156 | |
| Large Cap Growth | | | | — | | | | (887 | ) | | | | — | | | | | 5,824 | |
| Mid Cap Growth | | | | — | | | | (168 | ) | | | | 3,258 | | | | | 22,787 | |
| Small-Mid Cap Growth | | | | — | | | | 1 | | | | | 6,952 | | | | | 35,809 | |
| Small Cap Growth | | | | — | | | | — | | | | | 6,887 | | | | | 33,642 | |
| Global Leaders | | | | 2 | | | | (13,781 | ) | | | | — | | | | | 8,028 | |
| International Growth | | | | 16,303 | | | | (1,105,046 | ) | | | | — | | | | | 587,519 | |
| Institutional International Growth | | | | 8,836 | | | | (175,273 | ) | | | | — | | | | | 306,224 | |
| International Equity | | | | 120 | | | | (91,971 | ) | | | | — | | | | | 11,903 | |
| Institutional International Equity | | | | 191 | | | | (122,787 | ) | | | | — | | | | | 18,967 | |
| International Leaders | | | | 30 | | | | (104 | ) | | | | — | | | | | 679 | |
| International Small Cap Growth | | | | 1,592 | | | | (53,929 | ) | | | | — | | | | | 98,714 | |
| Emerging Markets Growth | | | | 155 | | | | (28,010 | ) | | | | — | | | | | 139,465 | |
| Emerging Markets Leaders | | | | 57 | | | | (3,213 | ) | | | | — | | | | | 8,259 | |
| Emerging Markets Small Cap Growth | | | | 56 | | | | (37 | ) | | | | 36 | | | | | 1,695 | |
| Large Cap Value | | | | 1 | | | | — | | | | | 5 | | | | | 403 | |
| Mid Cap Value | | | | 8 | | | | — | | | | | 14 | | | | | 463 | |
| 138 | Semi-Annual Report | June 30, 2013 |
| Fund | | Undistributed
Ordinary Income | | Accumulated
Capital and
Other Losses | | | Undistributed
Long-Term
Capital Gain | | Net Unrealized
Appreciation/
Depreciation |
| Small-Mid Cap Value | | | $ | 14 | | | | $ | — | | | | $ | 8 | | | | $ | 244 | |
| Small Cap Value | | | | 83 | | | | | — | | | | | 1,441 | | | | | 26,878 | |
| Bond | | | | 2 | | | | | (104 | ) | | | | 1,498 | | | | | 21,412 | |
| Income | | | | — | | | | | (35,763 | ) | | | | — | | | | | 6,310 | |
| Low Duration | | | | — | | | | | (4,807 | ) | | | | — | | | | | 2,235 | |
| Ready Reserves | | | | 113 | | | | | (22 | ) | | | | — | | | | | — | |
As of December 31, 2012, the Funds have unused capital loss carryforwards available for federal income tax purposes to be applied against future capital gains, if any. If not applied, the carryforwards will expire as follows (in thousands):
| Fund | | 2013 | | | 2014 | | | 2015 | | | 2016 | | | 2017 | | | 2018 | | | Total | |
| Large Cap Growth | | $ | — | | | $ | — | | | $ | — | | | $ | — | | | $ | 887 | | | $ | — | | | $ | 887 | |
| Global Leaders | | | — | | | | — | | | | — | | | | 644 | | | | 13,127 | | | | — | | | | 13,771 | |
| International Growth | | | — | | | | — | | | | — | | | | — | | | | 1,101,382 | | | | — | | | | 1,101,382 | |
| Institutional International Growth | | | — | | | | — | | | | — | | | | — | | | | 172,315 | | | | — | | | | 172,315 | |
| International Equity | | | — | | | | — | | | | — | | | | 10,048 | | | | 81,926 | | | | — | | | | 91,974 | |
| Institutional International Equity | | | — | | | | — | | | | — | | | | 9,705 | | | | 113,087 | | | | — | | | | 122,792 | |
| International Small Cap Growth | | | — | | | | — | | | | — | | | | — | | | | 53,954 | | | | — | | | | 53,954 | |
| Income | | | 3,398 | | | | 4,138 | | | | 9,190 | | | | 14,459 | | | | 4,577 | | | | — | | | | 35,762 | |
| Low Duration | | | — | | | | — | | | | — | | | | — | | | | — | | | | 955 | | | | 955 | |
| Ready Reserves | | | — | | | | — | | | | 2 | | | | — | | | | — | | | | — | | | | 2 | |
Under current law, the Funds may carry forward net capital losses indefinitely to use to offset capital gains realized in future years. Previous law limited the carry forward of capital losses to the eight tax years following the year the capital loss was realized. If a Fund has capital losses that are subject to current law and also has capital losses subject to prior law, the losses realized under current law will be utilized to offset capital gains before any of the losses governed by prior law can be used. As a result of these ordering rules, capital losses realized under previous law may be more likely to expire unused. Capital losses realized under current law will carry forward retaining their classification as long-term or short-term losses; as compared to under prior law in which all capital losses were carried forward as short term capital losses.
As of December 31, 2012, the Funds incurred the following capital losses which will not expire (in thousands):
| Fund | | Short-
Term | | | Long-
Term | |
| International Leaders | | $ | 33 | | | $ | — | |
| Emerging Markets Growth | | | 23,905 | | | | — | |
| Emerging Markets Leaders | | | 2,240 | | | | — | |
| Low Duration | | | 2,054 | | | | 1,296 | |
| Ready Reserves | | | 19 | | | | — | |
In order to meet certain excise tax distribution requirements, the Funds are required to measure and distribute annually, net capital gains realized during a twelve month period ending October 31 and net investment income earned during a twelve month period ending December 31. In connection with this, the Funds are permitted for tax purposes to defer into their next fiscal year qualified late year losses. Qualified late year capital losses are any net capital losses incurred between November 1 and the end of their fiscal year, December 31, 2012. Qualified late year ordinary losses are comprised of losses related to foreign currency and PFICs, incurred between November 1 and the end of their fiscal year, December 31, 2012.
At December 31, 2012, the following Funds deferred, on a tax basis, qualified late year losses of:
| | | Qualified Late Year Losses |
| Fund | | Ordinary
Income | | | Short-Term
Capital | | Long-Term
Capital |
| Mid Cap Growth | | | $ | — | | | | | $ | 168 | | | | $ | — | |
| Global Leaders | | | | 10 | | | | | | — | | | | | — | |
| International Growth | | | | — | | | | | | 4,050 | | | | | — | |
| Institutional International Growth | | | | — | | | | | | 2,341 | | | | | — | |
| International Leaders | | | | — | | | | | | 71 | | | | | — | |
| Emerging Markets Growth | | | | — | | | | | | 2,380 | | | | | — | |
| June 30, 2013 | William Blair Funds | 139 |
| | | Qualified Late Year Losses |
| Fund | | Ordinary
Income | | | Short-Term
Capital | | Long-Term
Capital |
| Emerging Markets Leaders | | | | $— | | | | | $ | 464 | | | | $ | 507 | |
| Emerging Markets Small Cap Growth | | | | — | | | | | | 7 | | | | | — | |
| Bond | | | | — | | | | | | 104 | | | | | — | |
| Low Duration | | | | — | | | | | | 291 | | | | | 210 | |
(h) Repurchase Agreements
In a repurchase agreement, a Fund buys a security at one price and at the time of sale, the seller agrees to repurchase the security at a mutually agreed upon time and price (usually within seven days). The repurchase agreement thereby determines the yield during the purchaser’s holding period, while the seller’s obligation to repurchase is secured by the value of the underlying security. William Blair & Company, L.L.C. (“William Blair” or the “Advisor”) will monitor, on an ongoing basis, the value of the underlying securities to ensure that the value always equals or exceeds the repurchase price plus accrued interest. Repurchase agreements could involve certain risks in the event of a default or insolvency of the other party to the agreement, including possible delays or restrictions upon a Fund’s ability to dispose of the underlying securities. The risk to a Fund is limited to the ability of the seller to pay the agreed upon sum on the delivery date. In the event of default, a repurchase agreement provides that a Fund is entitled to sell the underlying collateral. The loss, if any, to a Fund will be the difference between the proceeds from the sale and the repurchase price. However, if bankruptcy proceedings are commenced with respect to the seller of the security, disposition of the collateral by the Fund may be delayed or limited. Although no definitive creditworthiness criteria are used, the Advisor reviews the creditworthiness of the banks and non-bank dealers with which a Fund enters into repurchase agreements to evaluate those risks. A Fund may, for tax purposes, deem repurchase agreements collateralized by U.S. Government securities to be investments in U.S. Government securities.
(i) Use of Estimates
The preparation of financial statements in conformity with U.S. generally accepted accounting principles requires management to make estimates and assumptions that affect the amounts reported in the financial statements. Actual results may differ from those estimates.
(j) Indemnification
In the normal course of business, the Funds have entered into contracts in which the Funds agree to indemnify the other party or parties against various potential costs or liabilities. The Funds’ maximum exposure under these arrangements is unknown. No claim has been made for indemnification pursuant to any such agreement of the Funds.
(k) Fair Value Measurements
Fair value is defined as the price that a Fund would receive upon selling a security in an orderly transaction to an independent buyer in the principal or most advantageous market for the investment. Various inputs are used in determining the value of a Fund’s investments. A three-tier hierarchy of inputs is used to classify fair value measurements for disclosure purposes. The three-tier hierarchy of inputs is summarized in the three broad levels listed below:
| | • | Level 1—Quoted prices (unadjusted) in active markets for an identical security. |
| | | |
| | • | Level 2—Prices determined using other significant observable inputs. Observable inputs are inputs that other market participants would use in pricing a security. These may include quoted prices for similar securities, interest rates, prepayment speeds, credit risk, and others. In addition, other observable inputs such as foreign exchange rates, benchmark securities indices and foreign futures contracts may be utilized in the valuation of certain foreign securities when significant events occur between the last sale on the foreign securities exchange and the time the net asset value of the Fund is calculated. |
| | | |
| | • | Level 3—Prices determined using significant unobservable inputs. In situations where quoted prices or observable inputs are unavailable (for example, when there is little or no market activity for an investment), unobservable inputs may be used. Unobservable inputs reflect the Fund’s own assumptions about the factors market participants would use in pricing an investment, and would be based on the best information available. |
The inputs or methodology used for valuing an investment are not necessarily an indication of the risk associated with investing in those securities. For example, money market securities are valued using amortized cost, in accordance with rules under the 1940 Act. Generally, amortized cost approximates the current fair value of a security, but since the value is not obtained from a quoted price in an active market, such securities are reflected as Level 2.
| 140 | Semi-Annual Report | June 30, 2013 |
Any transfers between Level 1 and Level 2 are disclosed, effective as of the beginning of the period, in the following tables with the reasons for the transfers disclosed in a note to the tables, if applicable.
As of June 30, 2013, the hierarchical input levels of securities in each Fund, segregated by security class, are as follows (in thousands):
| Investments in securities | | Growth | | | Large Cap
Growth | | | Mid Cap
Growth | | | Small-Mid
Cap Growth | | | Small Cap
Growth | |
Level 1—Quoted prices
Common Stocks | | $ | 787,724 | | | $ | 31,715 | | | $ | 454,112 | | | $ | 489,710 | | | $ | 476,391 | |
Level 2—Other significant observable inputs
Short-Term Investments | | | 5,550 | | | | 395 | | | | 10,738 | | | | 9,540 | | | | 8,418 | |
Level 3—Significant unobservable inputs
None | | | — | | | | — | | | | — | | | | — | | | | — | |
| Total investments in securities | | $ | 793,274 | | | $ | 32,110 | | | $ | 464,850 | | | $ | 499,250 | | | $ | 484,809 | |
| Investments in securities | | Global
Leaders | | | Global
Small Cap
Growth | | | International
Growth | | | Institutional
International
Growth | | | International
Equity | | | Institutional
International
Equity | |
Level 1—Quoted prices
Common Stocks | | $ | 122,311 | | | $ | 10,729 | | | $ | 3,728,364 | | | $ | 2,009,923 | | | $ | 70,118 | | | $ | 89,294 | |
| Exchange-Traded Funds | | | — | | | | 157 | | | | — | | | | — | | | | — | | | | — | |
Level 2—Other significant observable inputs
Affiliated Fund | | | — | | | | — | | | | 22,815 | | | | 12,260 | | | | — | | | | — | |
| Short-Term Investments | | | 1,641 | | | | 238 | | | | 72,519 | | | | 39,731 | | | | 865 | | | | 3,446 | |
Level 3—Significant unobservable inputs
Common stock | | | — | | | | — | | | | 689 | | | | 352 | | | | — | | | | — | |
| Total investments in securities. | | $ | 123,952 | | | $ | 11,124 | | | $ | 3,824,387 | | | $ | 2,062,266 | | | $ | 70,983 | | | $ | 92,740 | |
Level 1 and Level 2 transfers
Transfers from Level 1 to Level 2 | | | — | | | | — | | | | — | | | | — | | | | — | | | | — | |
| Transfers from Level 2 to Level 1 (a) | | | 23,732 | | | | — | | | | 2,066,827 | | | | 1,112,905 | | | | 48,727 | | | | 76,072 | |
| Other financial instruments | | | | | | | | | | | | | | | | | | | | | | | | |
Level 2—Other significant observable inputs
Forward foreign currency contracts | | | — | | | | — | | | | 6,195 | | | | 3,340 | | | | — | | | | — | |
| Investments in securities | | International
Leaders | | | International
Small Cap
Growth | | | Emerging
Markets
Growth | | | Emerging
Markets
Leaders | | | Emerging
Markets
Small Cap
Growth | |
Level 1—Quoted prices
Common Stocks | | $ | 61,530 | | | $ | 753,375 | | | $ | 825,517 | | | $ | 57,501 | | | $ | 79,447 | |
| Preferred stock | | | — | | | | — | | | | 20,957 | | | | 1,671 | | | | 231 | |
Level 2—Other significant observable inputs
Short-Term Investments | | | — | | | | 15,669 | | | | 8,594 | | | | 2,926 | | | | 1,563 | |
| Affiliated Fund | | | — | | | | — | | | | 24,474 | | | | — | | | | — | |
Level 3—Significant unobservable inputs
None | | | — | | | | — | | | | — | | | | — | | | | — | |
| Total investments in securities | | $ | 61,530 | | | $ | 769,044 | | | $ | 879,542 | | | $ | 62,098 | | | $ | 81,241 | |
| Level 1 and Level 2 transfers | | | | | | | | | | | | | | | | | | | | |
| Transfers from Level 1 to Level 2 | | | — | | | | — | | | | — | | | | — | | | | — | |
| Transfers from Level 2 to Level 1 (a) | | | 7,088 | | | | 414,868 | | | | 473,910 | | | | 31,452 | | | | 13,076 | |
| Other financial instruments | | | | | | | | | | | | | | | | | | | | |
| Assets | | | | | | | | | | | | | | | | | | | | |
Level 2—Other significant observable inputs
Forward foreign currency contracts | | | — | | | | 192 | | | | — | | | | — | | | | — | |
| Liabilities | | | | | | | | | | | | | | | | | | | | |
Level 2—Other significant observable inputs
Forward foreign currency contracts | | | — | | | | (661 | ) | | | (125 | ) | | | (5 | ) | | | — | |
| June 30, 2013 | William Blair Funds | 141 |
| Investments in securities | | Large Cap
Value | | | Mid Cap
Value | | | Small-Mid
Cap Value | | | Small Cap
Value | |
Level 1—Quoted prices
Common Stocks | | $ | 3,794 | | | $ | 4,109 | | | $ | 2,810 | | | $ | 301,551 | |
Level 2—Other significant observable inputs
Short-Term Investments | | | 115 | | | | — | | | | 35 | | | | 8,134 | |
Level 3—Significant unobservable inputs
None | | | — | | | | — | | | | — | | | | — | |
| Total investments in securities | | $ | 3,909 | | | $ | 4,109 | | | $ | 2,845 | | | $ | 309,685 | |
| Investments in securities | | Bond | | | Income | | | Low
Duration | | | Ready
Reserves | |
Level 1—Quoted Prices
None | | | — | | | | — | | | | — | | | | — | |
Level 2—Other significant observable inputs
US Government and Agency Bonds | | $ | 117,167 | | | $ | 73,186 | | | $ | 212,065 | | | $ | 57,654 | |
| Corporate Bonds | | | 135,391 | | | | 48,468 | | | | 32,530 | | | | 118,719 | |
| Asset Backed Bonds | | | 9,428 | | | | 7,674 | | | | 42,183 | | | | — | |
| Commercial Paper | | | — | | | | — | | | | — | | | | 814,430 | |
| Short-Term Investments | | | — | | | | — | | | | — | | | | 236,088 | |
Level 3—Significant unobservable inputs
Asset Backed Bonds | | | 167 | | | | 916 | | | | — | | | | — | |
| Total investments in securities | | $ | 262,153 | | | $ | 130,244 | | | $ | 286,778 | | | $ | 1,226,891 | |
| (a) | Fair valuation estimates were obtained from the Portfolios’ pricing vendor and applied to certain foreign securities at December 31, 2012 but not at June 30, 2013. |
Level 1 Common Stocks are exchange-traded securities with a quoted price. See Portfolio of Investments for Sector Classification.
The fair value estimates for the Level 3 securities in the International Growth, Institutional International Growth, Bond and Income Funds were determined in good faith by the Pricing Committee in consultation with the Valuation Committee, pursuant to the Valuation Procedures adopted by the Board of Trustees. There were various factors considered in reaching this fair value determination, including, but not limited to, the following: the type of security, the extent of public trading of the security, information obtained from a broker-dealer for the security, analysis of the company’s performance, market trends that influence its performance and the potential for an adverse outcome in pending litigation. Level 3 securities represented 0.02%, 0.02%, 0.06% and 0.69% as a percentage of Net Assets in the International Growth, Institutional International Growth, Bond and Income Funds, respectively. The change in net unrealized gain (loss) related to those securities held at June 30, 2013 is included in the change in net unrealized appreciation (depreciation) of investments on the Statements of Operations.
(2) Transactions with Affiliates
(a) Management and Expense Limitation Agreements
Each Fund has a management agreement with the Advisor for investment advisory, clerical, bookkeeping and administrative services. Each Fund pays the Advisor an annual fee, payable monthly, based on a specified percentage of its average daily net assets. A summary of the annual rates expressed as a percentage of average daily net assets is as follows:
| Domestic Equity Funds | | | |
| Growth | | 0.75 | % |
| Large Cap Growth | | 0.80 | % |
| Mid Cap Growth | | 0.95 | % |
| Small-Mid Cap Growth | | 1.00 | % |
| Small Cap Growth | | 1.10 | % |
| Large Cap Value | | 0.80 | % |
| Mid Cap Value | | 0.95 | % |
| Small-Mid Cap Value | | 1.00 | % |
| Small Cap Value | | 1.10 | % |
| | | | |
| Global Equity Fund | | | |
| Global Leaders | | 1.00 | % |
| Global Small Cap Growth | | 1.00 | % |
| Fixed-Income Funds | | | |
| Bond | | 0.30 | % |
| Income*: | | | |
| First $250 million | | 0.25 | % |
| In excess of $250 million | | 0.20 | % |
| Low Duration | | 0.30 | % |
| | | | |
| Money Market Fund | | | |
| Ready Reserves: | | | |
| First $250 million | | 0.275 | % |
| Next $250 million | | 0.25 | % |
| Next $2 billion | | 0.225 | % |
| In excess of $2.5 billion | | 0.20 | % |
| 142 | Semi-Annual Report | June 30, 2013 |
| International Equity Funds | | | |
| International Growth: | | | |
| First $250 million | | 1.10 | % |
| Next $4.75 billion | | 1.00 | % |
| Next $5 billion | | 0.95 | % |
| Next $5 billion | | 0.925 | % |
| In excess of $15 billion | | 0.90 | % |
| Institutional International Growth: | | | |
| First $500 million | | 1.00 | % |
| Next $500 million | | 0.95 | % |
| Next $1.5 billion | | 0.90 | % |
| Next $2.5 billion | | 0.875 | % |
| Next $5 billion | | 0.85 | % |
| Next $5 billion | | 0.825 | % |
| In excess of $15 billion | | 0.80 | % |
| | | | |
| International Equity: | | | |
| First $250 million | | 1.10 | % |
| In excess of $250 million | | 1.00 | % |
| Institutional International Equity: | | | |
| First $500 million | | 1.00 | % |
| Next $500 million | | 0.95 | % |
| In excess of $1 billion | | 0.90 | % |
| International Leaders | | 0.95 | % |
| International Small Cap Growth | | 1.00 | % |
| Emerging Markets Growth | | 1.10 | % |
| Emerging Markets Leaders | | 1.10 | % |
| Emerging Markets Small Cap Growth | | 1.10 | % |
*Management fee also includes a charge of 5% of gross income.
Some of the Funds have also entered into an amended and restated Expense Limitation Agreement with the Advisor. Under the terms of the agreement, the Advisor will waive its management fee and/or reimburse the Fund for expenses in excess of the agreed upon rate. The amount the Advisor owes a Fund as of the reporting date is recorded as the Receivable from Advisor on the Statements of Assets and Liabilities. The Advisor reimburses the Funds on a monthly basis. Under the terms of the agreement, the Advisor has agreed to waive its advisory fees and/or absorb other operating expenses through April 30, 2014, if total expenses for each class of the following Funds exceed the following rates (as a percentage of average daily net assets):
| | | Class N | | Class I | | Institutional Class |
| Fund | | Effective
May 1, 2013
through
April 30, 2014 | | Effective
May 1, 2012
through
April 30, 2013 | | Effective
May 1, 2013
through
April 30, 2014 | | Effective
May 1, 2012
through
April 30, 2013 | | Effective
May 1, 2013
through
April 30, 2014 | | Effective
May 1, 2012
through
April 30, 2013 |
| Growth | | | N/A | | | | N/A | | | | N/A | | | | N/A | | | | N/A | | | | N/A | |
| Large Cap Growth | | | 1.20 | % | | | 1.20 | % | | | 0.95 | % | | | 0.95 | % | | | N/A | | | | N/A | |
| Mid Cap Growth | | | 1.35 | % | | | 1.35 | % | | | 1.10 | % | | | 1.10 | % | | | N/A | | | | N/A | |
| Small-Mid Cap Growth | | | 1.35 | % | | | 1.35 | % | | | 1.10 | % | | | 1.10 | % | | | N/A | | | | N/A | |
| Small Cap Growth | | | 1.50 | % | | | 1.50 | % | | | 1.25 | % | | | 1.25 | % | | | N/A | | | | N/A | |
| Global Leaders | | | 1.50 | % | | | 1.50 | % | | | 1.25 | % | | | 1.25 | % | | | 1.10 | % | | | 1.10 | % |
| Global Small Cap Growth | | | 1.65 | %(b) | | | N/A | | | | 1.40 | %(b) | | | N/A | | | | 1.25 | %(b) | | | N/A | |
| International Growth | | | 1.45 | % | | | 1.45 | % | | | 1.20 | % | | | 1.20 | % | | | N/A | | | | N/A | |
| Institutional International Growth | | | N/A | | | | N/A | | | | N/A | | | | N/A | | | | N/A | | | | N/A | |
| International Equity | | | 1.45 | % | | | 1.45 | % | | | 1.20 | % | | | 1.20 | % | | | N/A | | | | N/A | |
| Institutional International Equity | | | N/A | | | | N/A | | | | N/A | | | | N/A | | | | 1.10 | % | | | 1.10 | % |
| International Leaders | | | 1.45 | % | | | 1.45 | %(a) | | | 1.20 | % | | | 1.20 | %(a) | | | 1.05 | % | | | 1.05 | %(a) |
| International Small Cap Growth | | | 1.65 | % | | | 1.65 | % | | | 1.40 | % | | | 1.40 | % | | | 1.25 | % | | | 1.25 | % |
| Emerging Markets Growth | | | 1.70 | % | | | 1.70 | % | | | 1.45 | % | | | 1.45 | % | | | 1.30 | % | | | 1.30 | % |
| Emerging Markets Leaders | | | 1.65 | % | | | 1.65 | % | | | 1.40 | % | | | 1.40 | % | | | 1.25 | % | | | 1.25 | % |
| Emerging Markets Small Cap Growth | | | 1.65 | % | | | 1.65 | % | | | 1.40 | % | | | 1.40 | % | | | 1.25 | % | | | 1.25 | % |
| Large Cap Value | | | 1.20 | % | | | 1.20 | % | | | 0.95 | % | | | 0.95 | % | | | N/A | | | | N/A | |
| Mid Cap Value | | | 1.35 | % | | | 1.35 | % | | | 1.10 | % | | | 1.10 | % | | | N/A | | | | N/A | |
| Small-Mid Cap Value | | | 1.40 | % | | | 1.40 | % | | | 1.15 | % | | | 1.15 | % | | | N/A | | | | N/A | |
| Small Cap Value | | | 1.50 | % | | | 1.45 | % | | | 1.25 | % | | | 1.20 | % | | | N/A | | | | N/A | |
| Bond | | | 0.65 | % | | | 0.65 | % | | | 0.50 | % | | | 0.50 | % | | | 0.35 | % | | | 0.35 | % |
| Income | | | 0.85 | % | | | 0.85 | % | | | 0.70 | % | | | 0.70 | % | | | N/A | | | | N/A | |
| Low Duration | | | 0.70 | % | | | 0.70 | % | | | 0.55 | % | | | 0.55 | % | | | 0.40 | % | | | 0.40 | % |
| Ready Reserves | | | N/A | | | | N/A | | | | N/A | | | | N/A | | | | N/A | | | | N/A | |
| (a) | Effective August 16, 2012 through April 30, 2014 |
| (b) | Effective April 10, 2013 through April 30, 2014 |
| June 30, 2013 | William Blair Funds | 143 |
The Advisor has agreed to voluntarily waive fees and reimburse expenses incurred for the Ready Reserves Fund in order to maintain a minimum yield given the current interest rate environment.
For a period of three years subsequent to the commencement of operations, the Advisor is entitled to reimbursement for previously waived fees and reimbursed expenses to the extent the overall expense ratio remains below the expense limitation in place at the time the fee was waived and/or the expense was reimbursed. The total amounts available for recapture at June 30, 2013 were as follows (in thousands):
| Fund | | Available for
Recapture |
| Global Small Cap Growth | | $ | 25 | |
| International Leaders | | | 114 | |
| Emerging Markets Small Cap Growth | | | 377 | |
| Large Cap Value | | | 177 | |
| Small-Mid Cap Value | | | 177 | |
For the period ended June 30, 2013, the fee waivers and/or reimbursements for each Fund were as follows (in thousands):
| Fund | | Fund
Level
Waiver | | | Class I
Specific
Waiver | | | Class N
Specific
Waiver | | | Total
Waiver | |
| Growth | | $ | — | | | $ | — | | | $ | — | | | $ | — | |
| Large Cap Growth | | | 28 | | | | 5 | | | | 3 | | | | 36 | |
| Mid Cap Growth | | | — | | | | — | | | | 10 | | | | 10 | |
| Small-Mid Cap Growth | | | — | | | | — | | | | 20 | | | | 20 | |
| Small Cap Growth | | | — | | | | 143 | | | | 66 | | | | 209 | |
| Global Leaders | | | 45 | | | | 9 | | | | 2 | | | | 56 | |
| Global Small Cap Growth | | | 25 | | | | — | | | | — | | | | 25 | |
| International Growth | | | — | | | | — | | | | — | | | | — | |
| Institutional International Growth | | | — | | | | — | | | | — | | | | — | |
| International Equity | | | 38 | | | | 37 | | | | 3 | | | | 78 | |
| Institutional International Equity | | | 22 | | | | — | | | | — | | | | 22 | |
| International Leaders | | | 57 | | | | — | | | | — | | | | 57 | |
| International Small Cap Growth | | | — | | | | — | | | | — | | | | — | |
| Emerging Markets Growth | | | — | | | | — | | | | — | | | | — | |
| Emerging Markets Leaders | | | 67 | | | | 1 | | | | — | | | | 68 | |
| Emerging Markets Small Cap Growth | | | 124 | | | | — | | | | — | | | | 124 | |
| Large Cap Value | | | 47 | | | | — | | | | — | | | | 47 | |
| Mid Cap Value | | | 46 | | | | — | | | | — | | | | 46 | |
| Small-Mid Cap Value | | | 49 | | | | — | | | | — | | | | 49 | |
| Small Cap Value | | | — | | | | 41 | | | | 17 | | | | 58 | |
| Bond | | | 38 | | | | 28 | | | | 18 | | | | 84 | |
| Income | | | — | | | | — | | | | — | | | | — | |
| Low Duration | | | — | | | | — | | | | — | | | | — | |
| Ready Reserves | | | 3,463 | | | | — | | | | — | | | | 3,463 | |
(b) Underwriting, Distribution Services and Service Agreements
Each Fund, except the Institutional International Growth Fund, the Institutional International Equity Fund, and the Ready Reserves Fund, has a Distribution Agreement with William Blair for distribution services to the Funds’ Class N shares. Each Fund pays William Blair an annual fee, payable monthly, based on a specified percentage of its average daily net assets of Class N shares. The annual rate expressed as a percentage of average daily net assets for Class N is 0.25% for all Funds except the Income, Bond and Low Duration Funds, which is 0.15%. Pursuant to the Distribution Agreement, William Blair enters into related selling group agreements with various firms at various rates for sales of the Funds’ Class N shares.
The Ready Reserves Fund has entered into a Service Agreement with the Advisor under which the Advisor agrees to provide certain support services to Class N shareholders, including shareholder services and automatic sweep services, for a fee of 0.35% of the Fund’s average daily net assets attributable to Class N shares. The Board of Trustees has determined that the amount payable for “service fees” (as defined by FINRA, Financial Industry Regulatory Authority) does not exceed 0.25% of the average annual net assets attributable to the Class N shares of the Ready Reserves Fund.
| 144 | Semi-Annual Report | June 30, 2013 |
The Global Leaders, Global Small Cap Growth, International Leaders, International Small Cap Growth, Emerging Markets Growth, Emerging Markets Leaders, Emerging Markets Small Cap Growth, Bond and Low Duration Funds have a Shareholder Administration Agreement with William Blair to provide shareholder administration services to Class N and Class I shares. Class N and Class I shares of the Funds pay William Blair an annual fee, payable monthly, based upon 0.15% of average daily net assets attributable to each class, respectively. For the period ended June 30, 2013, the following fees were incurred (in thousands):
| Fund | | Class N | | Class I | | Total |
| Global Leaders | | $ | 4 | | | $ | 36 | | | $ | 40 | |
| Global Small Cap Growth | | | — | | | | 3 | | | | 3 | |
| International Leaders | | | — | | | | 7 | | | | 7 | |
| International Small Cap Growth | | | 11 | | | | 292 | | | | 303 | |
| Emerging Markets Growth | | | 12 | | | | 112 | | | | 124 | |
| Emerging Markets Leaders | | | — | | | | 22 | | | | 22 | |
| Emerging Markets Small Cap Growth | | | 6 | | | | 16 | | | | 22 | |
| Bond | | | 23 | | | | 129 | | | | 152 | |
| Low Duration | | | 9 | | | | 127 | | | | 136 | |
| Ready Reserves | | | 2,352 | | | | — | | | | 2,352 | |
(3) Investment Transactions
Investment transactions, excluding money market instruments, repurchase agreements and demand notes for the period ended June 30, 2013, were as follows (in thousands):
| Fund | | Purchases | | | Sales | |
| Growth | | $ | 191,316 | | | $ | (194,211 | ) |
| Large Cap Growth | | | 7,975 | | | | (7,128 | ) |
| Mid Cap Growth | | | 200,906 | | | | (153,823 | ) |
| Small-Mid Cap Growth | | | 109,795 | | | | (85,800 | ) |
| Small Cap Growth | | | 189,515 | | | | (190,535 | ) |
| Global Leaders | | | 81,064 | | | | (24,825 | ) |
| Global Small Cap Growth | | | 12,688 | | | | (2,079 | ) |
| International Growth | | | 2,171,218 | | | | (2,053,260 | ) |
| Institutional International Growth | | | 1,173,809 | | | | (1,106,627 | ) |
| International Equity | | | 29,844 | | | | (30,950 | ) |
| Institutional International Equity | | | 37,413 | | | | (59,241 | ) |
| International Leaders | | | 67,671 | | | | (15,218 | ) |
| International Small Cap Growth | | | 463,834 | | | | (451,515 | ) |
| Emerging Markets Growth | | | 609,793 | | | | (608,687 | ) |
| Emerging Markets Leaders | | | 44,449 | | | | (47,942 | ) |
| Emerging Markets Small Cap Growth | | | 95,652 | | | | (42,119 | ) |
| Large Cap Value | | | 2,303 | | | | (2,798 | ) |
| Mid Cap Value | | | 1,022 | | | | (1,625 | ) |
| Small-Mid Cap Value | | | 975 | | | | (937 | ) |
| Small Cap Value | | | 115,776 | | | | (91,920 | ) |
| Bond | | | 83,199 | | | | (99,271 | ) |
| Income | | | 42,364 | | | | (46,746 | ) |
| Low Duration | | | 128,965 | | | | (98,536 | ) |
(4) Forward Foreign Currency Contracts
The Global Equity and International Equity Funds from time to time may enter into forward foreign currency contracts with the Fund’s custodian and other counterparties in an attempt to hedge against a decline in the value of foreign currency against the U.S. dollar. The Funds bear the market risk that arises from changes in foreign currency rates and bear the credit risk if the counterparty fails to perform under the contract.
| June 30, 2013 | William Blair Funds | 145 |
For the period ended June 30, 2013, the International Growth, Institutional International Growth, International Leaders, International Small Cap Growth, Emerging Markets Growth and Emerging Markets Leaders Funds engaged in forward foreign currency contracts with notional volume (in thousands) of:
| Fund | | Average
Monthly
Notional
Value | |
| International Growth | | $ | 857,890 | |
| Institutional International Growth | | | 458,966 | |
| International Leaders | | | 5,877 | |
| International Small Cap Growth | | | 55,135 | |
| Emerging Markets Growth | | | 2,025 | |
| Emerging Markets Leaders | | | 58 | |
The following tables present the value of forward foreign currency contracts as of June 30, 2013 and their respective location on the Statements of Assets and Liabilities (values in thousands):
| | | Assets | | | Liabilities | |
| Fund | | Statement of Assets
and Liabilities Location | | Value | | | Statement of Assets
and Liabilities Location | | Value | |
| International Growth | | Unrealized appreciation on foreign forward currency contracts | | $ | 6,195 | | | Unrealized depreciation on foreign forward currency contracts | | $ | — | |
Institutional
International Growth | | Unrealized appreciation on foreign forward currency contracts | | | 3,340 | | | Unrealized depreciation on foreign forward currency contracts | | | — | |
| International Leaders | | Unrealized appreciation on foreign forward currency contracts | | | — | | | Unrealized depreciation on foreign forward currency contracts | | | — | |
International Small
Cap Growth | | Unrealized appreciation on foreign forward currency contracts | | | — | | | Unrealized depreciation on foreign forward currency contracts | | | 469 | |
| Emerging Markets Growth | | Unrealized appreciation on foreign forward currency contracts | | | — | | | Unrealized depreciation on foreign forward currency contracts | | | 125 | |
| Emerging Markets Leaders | | Unrealized appreciation on foreign forward currency contracts | | | — | | | Unrealized depreciation on foreign forward currency contracts | | | 5 | |
The effect of forward foreign currency contracts on the Statements of Operations for the period ended June 30, 2013 (values in thousands):
| Realized gain (loss) recognized on forward foreign currency contracts | | | |
| Fund | | Value | |
| International Growth | | $ | 4,434 | |
| Institutional International Growth | | | 2,353 | |
| International Leaders | | | (175 | ) |
| International Small Cap Growth | | | 279 | |
| Emerging Markets Growth | | | — | |
| Emerging Markets Leaders | | | — | |
| | | | | |
| Change in net unrealized gain (loss) recognized on forward foreign currency contracts | | | | |
| Fund | | | Value | |
| International Growth | | $ | 6,195 | |
| Institutional International Growth | | | 3,340 | |
| International Leaders | | | — | |
| International Small Cap Growth | | | (469 | ) |
| Emerging Markets Growth | | | (125 | ) |
| Emerging Markets Leaders | | | (5 | ) |
| 146 | Semi-Annual Report | June 30, 2013 |
The following table presents open forward foreign currency contracts as of June 30, 2013 (values in thousands):
| International Growth |
| Counterparty | | (S)hort
(B)uy to
cover | | Currency Description | | Settlement
Date | | Local
Currency | | | Current
Value (USD) | | | Net Unrealized
Gain/(Loss) | |
| State Street Bank | | S | | Pound Sterling | | 8/14/2013 | | | (65,057,000 | ) | | $ | 98,918 | | | | | 3,085 | |
| Bank Of New York | | S | | Japanese Yen | | 8/13/2013 | | | (6,048,222,000 | ) | | | 60,994 | | | | | 3,110 | |
| | | | | | | | | | | | | | | | | | $ | 6,195 | |
| |
| Institutional International Growth |
| Counterparty | | (S)hort
(B)uy to
cover | | Currency Description | | Settlement
Date | | Local
Currency | | | Current
Value (USD) | | | Unrealized
Gain/(Loss) | |
| State Street Bank | | S | | Pound Sterling | | 8/14/2013 | | | (35,098,000 | ) | | $ | 53,366 | | | | | 1,665 | |
| Bank Of New York | | S | | Japanese Yen | | 8/13/2013 | | | (3,256,868,000 | ) | | | 32,844 | | | | | 1,675 | |
| | | | | | | | | | | | | | | | | | $ | 3,340 | |
| |
| International Small Cap Growth |
| Counterparty | | (S)hort
(B)uy to
cover | | Currency Description | | Settlement
Date | | Local
Currency | | | Current
Value (USD) | | | Unrealized
Gain/(Loss) | |
| Bank Of New York | | S | | Japanese Yen | | 8/13/2013 | | | (2,807,630,000 | ) | | $ | 28,314 | | | | | (661 | ) |
| Bank Of New York | | S | | Japanese Yen | | 8/13/2013 | | | (910,034,000 | ) | | | 9,177 | | | | | 192 | |
| | | | | | | | | | | | | | | | | | $ | (469 | ) |
| |
| Emerging Markets Growth |
| Counterparty | | (S)hort
(B)uy to
cover | | Currency Description | | Settlement
Date | | Local
Currency | | | Current
Value (USD) | | | Unrealized
Gain/(Loss) | |
| Bank Of New York | | S | | South African Rand | | 8/5/2013 | | | (71,687,000 | ) | | $ | 7,214 | | | | $ | (125 | ) |
| |
| Emerging Markets Leaders |
| Counterparty | | (S)hort
(B)uy to
cover | | Currency Description | | Settlement
Date | | Local
Currency | | | Current
Value (USD) | | | Unrealized
Gain/(Loss) | |
| Bank Of New York | | S | | South African Rand | | 8/5/2013 | | | (4,053,000 | ) | | | $408 | | | | | $(5 | ) |
(5) Statement of Assets and Liabilities Offsetting
The Global and International Equity Funds from time to time may enter into foreign currency contracts. These contracts are subject to master netting agreements with each counterparty.
| | | | | | | Gross Amounts Not Offset
in the Statement of
Assets and Liabilities |
| Fund | | Gross
Amounts of
Recognized
Assets | | Gross Amounts
Offset in the
Statement of
Assets and
Liabilities | | Net Amounts of
Assets Presented
in the Statement of
Assets and Liabilities | | Financial
Instruments | | Net
Amount |
| | Foreign Currency Contracts | |
| International Growth | | $ | 6,195 | | | | $ — | | | $ | 6,195 | | | $ | — | | | $ | 6,195 | |
| Institutional International Growth | | | 3,340 | | | | — | | | | 3,340 | | | | — | | | | 3,340 | |
| | Repurchase Agreements | |
| Growth | | $ | 5,550 | | | | $ — | | | $ | 5,550 | | | $ | 5,550 | | | $ | — | |
| Large Cap Growth | | | 395 | | | | — | | | | 395 | | | | 395 | | | | — | |
| Mid Cap Growth | | | 10,738 | | | | — | | | | 10,738 | | | | 10,738 | | | | — | |
| Small-Mid Cap Growth | | | 9,540 | | | | — | | | | 9,540 | | | | 9,540 | | | | — | |
| Small Cap Growth | | | 8,418 | | | | — | | | | 8,418 | | | | 8,418 | | | | — | |
| Global Leaders | | | 1,641 | | | | — | | | | 1,641 | | | | 1,641 | | | | — | |
| Global Small Cap Growth | | | 238 | | | | — | | | | 238 | | | | 238 | | | | — | |
| International Growth | | | 72,519 | | | | — | | | | 72,519 | | | | 72,519 | | | | — | |
| Institutional International Growth | | | 39,731 | | | | — | | | | 39,731 | | | | 39,731 | | | | — | |
| June 30, 2013 | William Blair Funds | 147 |
| | | | | | | Gross Amounts Not Offset
in the Statement of
Assets and Liabilities |
| Fund | | Gross
Amounts of
Recognized
Assets | | Gross Amounts
Offset in the
Statement of
Assets and
Liabilities | | Net Amounts of
Assets Presented
in the Statement of
Assets and Liabilities | | Financial
Instruments | | Net
Amount |
| | Repurchase Agreements |
| International Equity | | $ | 865 | | | | $ — | | | $ | 865 | | | $ | 865 | | | $ | — | |
| Institutional International Equity | | | 3,446 | | | | — | | | | 3,446 | | | | 3,446 | | | | — | |
| International Small Cap Growth | | | 15,669 | | | | — | | | | 15,669 | | | | 15,669 | | | | — | |
| Emerging Markets Growth | | | 8,594 | | | | — | | | | 8,594 | | | | 8,594 | | | | — | |
| Emerging Markets Leaders | | | 2,926 | | | | — | | | | 2,926 | | | | 2,926 | | | | — | |
| Emerging Markets Small Cap Growth . | | | 1,563 | | | | — | | | | 1,563 | | | | 1,563 | | | | — | |
| Large Cap Value | | | 115 | | | | — | | | | 115 | | | | 115 | | | | — | |
| Small-Mid Cap Value | | | 35 | | | | — | | | | 35 | | | | 35 | | | | — | |
| Small Cap Value | | | 8,134 | | | | — | | | | 8,134 | | | | 8,134 | | | | — | |
| Ready Reserves | | | 236,088 | | | | — | | | | 236,088 | | | | 236,088 | | | | — | |
| | | | | | | |
| | | | | | | Gross Amounts Not Offset
in the Statement of
Assets and Liabilities |
| Fund | | Gross
Amounts of
Recognized
Liabilities | | Gross Amounts
Offset in the
Statement of
Assets and
Liabilities | | Net Amounts of
Liabilities Presented
in the Statement of
Assets and Liabilities | | Financial
Instruments | | Net
Amount |
| | Foreign Currency Contracts |
| International Small Cap Growth | | $ | (661 | ) | | | $ 192 | | | $ | (469 | ) | | $ | — | | | $ | (469 | ) |
| Emerging Markets Growth | | | (125 | ) | | | — | | | | (125 | ) | | | — | | | | (125 | ) |
| Emerging Markets Leaders | | | (5 | ) | | | — | | | | (5 | ) | | | — | | | | (5 | ) |
(6) Subsequent Event
On July 22, 2013, the William Blair Income Fund (the “Fund”) was named as a defendant in the case entitled OCWEN Loan Servicing, LLC, et al. v. State Street Bank, et al., No. 13-104 (JGK) (S.D.N.Y filed January 4, 2013). OCWEN Loan Servicing (“OCWEN”) determined that it made errors in its calculation and seeks to recover alleged overpayments made in 2007 and 2008 on certain mortgage pass-through securities (the “Bonds”) formerly owned by the Fund. The Fund sold the Bonds in 2008 at a price reflecting the allegedly erroneous overpayments before OCWEN discovered the errors. The total amount of the claim is $494,806.44. The Fund believes that OCWEN’s claims are without merit and intends to vigorously defend the action.
| 148 | Semi-Annual Report | June 30, 2013 |
(7) Fund Share Transactions
The following tables summarizes the activity in capital shares of each fund for the period ended June 30, 2013 (in thousands) (unaudited):
| | | Class N | |
| | | Dollars | | | Shares | |
| Fund | | Sales | | | Reinvest | | | Redemptions | | | Total | | | Sales | | | Reinvest | | | Redemptions | | | Total | |
| Growth | | $ | 17,073 | | | $ | — | | | $ | 29,889 | | | $ | (12,816 | ) | | | 1,319 | | | | — | | | | 2,284 | | | | (965 | ) |
| Large Cap Growth | | | 706 | | | | — | | | | 302 | | | | 404 | | | | 81 | | | | — | | | | 35 | | | | 46 | |
| Mid Cap Growth | | | 6,774 | | | | — | | | | 6,511 | | | | 263 | | | | 494 | | | | — | | | | 472 | | | | 22 | |
| Small Mid-Cap Growth | | | 14,342 | | | | — | | | | 5,136 | | | | 9,206 | | | | 872 | | | | — | | | | 320 | | | | 552 | |
| Small Cap Growth | | | 13,568 | | | | — | | | | 19,202 | | | | (5,634 | ) | | | 494 | | | | — | | | | 717 | | | | (223 | ) |
| Global Leaders | | | 1,251 | | | | — | | | | 1,158 | | | | 93 | | | | 126 | | | | — | | | | 115 | | | | 11 | |
| Global Small Cap Growth (a) | | | 292 | | | | — | | | | — | | | | 292 | | | | 28 | | | | — | | | | — | | | | 28 | |
| International Growth | | | 134,288 | | | | — | | | | 138,940 | | | | (4,652 | ) | | | 5,762 | | | | — | | | | 5,911 | | | | (149 | ) |
| International Equity | | | 264 | | | | — | | | | 2,233 | | | | (1,969 | ) | | | 20 | | | | — | | | | 179 | | | | (159 | ) |
| International Leaders | | | 3 | | | | — | | | | 455 | | | | (452 | ) | | | — | | | | — | | | | 41 | | | | (41 | ) |
| International Small Cap Growth | | | 1,922 | | | | — | | | | 2,338 | | | | (416 | ) | | | 136 | | | | — | | | | 167 | | | | (31 | ) |
| Emerging Markets Growth | | | 733 | | | | — | | | | 2,545 | | | | (1,812 | ) | | | 54 | | | | — | | | | 195 | | | | (141 | ) |
| Emerging Markets Leaders | | | — | | | | — | | | | 116 | | | | (116 | ) | | | 9 | | | | — | | | | 13 | | | | (4 | ) |
| Emerging Markets Small Cap Growth | | | 10,596 | | | | — | | | | 3,236 | | | | 7,360 | | | | 731 | | | | — | | | | 226 | | | | 505 | |
| Large Cap Value | | $ | 952 | | | | — | | | | 1,309 | | | | (357 | ) | | | 74 | | | | — | | | | 104 | | | | (30 | ) |
| Mid Cap Value | | | 86 | | | | — | | | | 6 | | | | 80 | | | | 7 | | | | — | | | | — | | | | 7 | |
| Small-Mid Cap Value | | | 27 | | | | — | | | | 102 | | | | (75 | ) | | | 2 | | | | — | | | | 8 | | | | (6 | ) |
| Small Cap Value | | | 5,841 | | | | — | | | | 10,095 | | | | (4,254 | ) | | | 384 | | | | — | | | | 677 | | | | (293 | ) |
| Bond | | | 4,761 | | | | 563 | | | | 15,087 | | | | (9,763 | ) | | | 451 | | | | 24 | | | | 1,374 | | | | (899 | ) |
| Income | | | 19,146 | | | | 943 | | | | 27,088 | | | | (6,999 | ) | | | 2,076 | | | | 46 | | | | 2,875 | | | | (753 | ) |
| Low Duration | | | 4,176 | | | | 58 | | | | 5,051 | | | | (817 | ) | | | 430 | | | | 3 | | | | 519 | | | | (86 | ) |
| Ready Reserves | | | 349,973 | | | | 67 | | | | 637,484 | | | | (287,444 | ) | | | 350,006 | | | | 35 | | | | 637,486 | | | | (287,445 | ) |
| | | Class I | |
| | | Dollars | | | | | | | Shares | |
| Fund | | Sales | | | Reinvest | | | Redemptions | | | Total | | | Sales | | | Reinvest | | | Redemptions | | | Total | |
| Growth | | $ | 43,952 | | | $ | — | | | $ | 35,851 | | | $ | 8,101 | | | | 3,223 | | | | — | | | | 2,612 | | | | 611 | |
| Large Cap Growth | | | 1,694 | | | | — | | | | 1,119 | | | | 575 | | | | 190 | | | | — | | | | 123 | | | | 67 | |
| Mid Cap Growth | | | 72,904 | | | | — | | | | 25,060 | | | | 47,844 | | | | 5,143 | | | | — | | | | 1,785 | | | | 3,358 | |
| Small Mid-Cap Growth | | | 67,451 | | | | — | | | | 45,176 | | | | 22,275 | | | | 4,156 | | | | — | | | | 2,768 | | | | 1,388 | |
| Small Cap Growth | | | 36,941 | | | | — | | | | 33,580 | | | | 3,361 | | | | 1,309 | | | | — | | | | 1,187 | | | | 122 | |
| Global Leaders | | | 4,077 | | | | — | | | | 3,528 | | | | 549 | | | | 412 | | | | — | | | | 359 | | | | 53 | |
| Global Small Cap Growth (a) | | | 10,771 | | | | — | | | | — | | | | 10,771 | | | | 1,074 | | | | — | | | | — | | | | 1,074 | |
| International Growth | | | 284,089 | | | | — | | | | 187,411 | | | | 96,678 | | | | 11,899 | | | | — | | | | 7,827 | | | | 4,072 | |
| International Equity | | | 4,555 | | | | — | | | | 4,191 | | | | 364 | | | | 366 | | | | — | | | | 328 | | | | 38 | |
| International Leaders | | | 7,690 | | | | — | | | | 535 | | | | 7,155 | | | | 690 | | | | — | | | | 50 | | | | 640 | |
| International Small Cap Growth | | | 39,152 | | | | — | | | | 24,703 | | | | 14,449 | | | | 2,734 | | | | — | | | | 1,713 | | | | 1,021 | |
| Emerging Markets Growth | | | 12,401 | | | | — | | | | 5,054 | | | | 7,347 | | | | 923 | | | | — | | | | 374 | | | | 549 | |
| Emerging Markets Leaders | | | 8,915 | | | | — | | | | 1,127 | | | | 7,788 | | | | 990 | | | | — | | | | 127 | | | | 863 | |
| Emerging Markets Small Cap Growth | | | 27,246 | | | | — | | | | 3,716 | | | | 23,530 | | | | 1,919 | | | | — | | | | 262 | | | | 1,657 | |
| Large Cap Value | | | 1,212 | | | | — | | | | 1,315 | | | | (103 | ) | | | 94 | | | | — | | | | 104 | | | | (10 | ) |
| Mid Cap Value | | | 49 | | | | — | | | | 731 | | | | (682 | ) | | | 4 | | | | — | | | | 58 | | | | (54 | ) |
| Small-Mid Cap Value | | | 100 | | | | — | | | | 11 | | | | 89 | | | | 8 | | | | — | | | | 1 | | | | 7 | |
| Small Cap Value | | | 52,663 | | | | — | | | | 19,040 | | | | 33,623 | | | | 3,468 | | | | — | | | | 1,231 | | | | 2,237 | |
| Bond | | | 22,796 | | | | 2,463 | | | | 29,098 | | | | (3,839 | ) | | | 2,178 | | | | 106 | | | | 2,644 | | | | (360 | ) |
| Income | | | 19,236 | | | | 924 | | | | 17,584 | | | | 2,576 | | | | 2,118 | | | | 45 | | | | 1,887 | | | | 276 | |
| Low Duration | | | 62,420 | | | | 1,442 | | | | 43,206 | | | | 20,656 | | | | 6,471 | | | | 70 | | | | 4,429 | | | | 2,112 | |
| Ready Reserves | | | — | | | | — | | | | — | | | | — | | | | — | | | | — | | | | — | | | | — | |
| (a) | For the period from April 10, 2013 (Commencement of Operations) to June 30, 2013. |
| June 30, 2013 | William Blair Funds | 149 |
| | | Institutional | |
| | | Dollars | | | Shares | |
| Fund | | Sales | | | Reinvest | | | Redemptions | | | Total | | | Sales | | | Reinvest | | | Redemptions | | | Total | |
| Global Leaders | | $ | 55,299 | | | $ | — | | | $ | 639 | | | $ | 54,660 | | | | 5,599 | | | | — | | | | 65.00 | | | | 5,534 | |
| Institutional International Growth | | | 153,499 | | | | — | | | | 94,569 | | | | 58,930 | | | | 9,948 | | | | — | | | | 6,071 | | | | 3,877 | |
| Institutional International Equity | | | 3,150 | | | | — | | | | 25,995 | | | | (22,845 | ) | | | 288 | | | | — | | | | 2,343 | | | | (2,055 | ) |
| International Leaders | | | 46,097 | | | | — | | | | 642 | | | | 45,455 | | | | 4,088 | | | | — | | | | 59 | | | | 4,029 | |
| International Small Cap Growth | | | 12,908 | | | | — | | | | 29,533 | | | | (16,625 | ) | | | 885 | | | | — | | | | 2,107 | | | | (1,222 | ) |
| Emerging Markets Growth | | | 124,162 | | | | — | | | | 134,924 | | | | (10,762 | ) | | | 8,974 | | | | — | | | | 10,562 | | | | (1,588 | ) |
| Emerging Markets Leaders | | | 83 | | | | — | | | | 10,847 | | | | (10,764 | ) | | | — | | | | — | | | | 1,179 | | | | (1,179 | ) |
| Emerging Markets Small Cap Growth | | | 23,326 | | | | — | | | | 25 | | | | 23,301 | | | | 1,675 | | | | — | | | | — | | | | 1,675 | |
| Bond | | | 4,619 | | | | 1,442 | | | | 12,967 | | | | (6,906 | ) | | | 486 | | | | 63 | | | | 1,178 | | | | (629 | ) |
| Low Duration | | | 2,068 | | | | 1,601 | | | | 12,031 | | | | (8,362 | ) | | | 297 | | | | 78 | | | | 1,238 | | | | (863 | ) |
| | | Total | |
| | | Dollars | | | Shares | |
| Fund | | Sales | | | Reinvest | | | Redemptions | | | Total | | | Sales | | | Reinvest | | | Redemptions | | | Total | |
| Growth | | $ | 61,025 | | | $ | — | | | $ | 65,740 | | | $ | (4,715 | ) | | | 4,542 | | | | — | | | | 4,896 | | | | (354 | ) |
| Large Cap Growth | | | 2,400 | | | | — | | | | 1,421 | | | | 979 | | | | 271 | | | | — | | | | 158 | | | | 113 | |
| Mid Cap Growth | | | 79,678 | | | | — | | | | 31,571 | | | | 48,107 | | | | 5,637 | | | | — | | | | 2,257 | | | | 3,380 | |
| Small Mid-Cap Growth | | | 81,793 | | | | — | | | | 50,312 | | | | 31,481 | | | | 5,028 | | | | — | | | | 3,088 | | | | 1,940 | |
| Small Cap Growth | | | 50,509 | | | | — | | | | 52,782 | | | | (2,273 | ) | | | 1,803 | | | | — | | | | 1,904 | | | | (101 | ) |
| Global Leaders | | | 60,627 | | | | — | | | | 5,325 | | | | 55,302 | | | | 6,137 | | | | — | | | | 539 | | | | 5,598 | |
| Global Small Cap Growth (a) | | | 11,063 | | | | — | | | | — | | | | 11,063 | | | | 1,102 | | | | — | | | | — | | | | 1,102 | |
| International Growth | | | 418,377 | | | | — | | | | 326,351 | | | | 92,026 | | | | 17,661 | | | | — | | | | 13,738 | | | | 3,923 | |
| Institutional International Growth | | | 153,499 | | | | — | | | | 94,569 | | | | 58,930 | | | | 9,948 | | | | — | | | | 6,071 | | | | 3,877 | |
| International Equity | | | 4,819 | | | | — | | | | 6,424 | | | | (1,605 | ) | | | 386 | | | | — | | | | 507 | | | | (121 | ) |
| Institutional International Equity | | | 3,150 | | | | — | | | | 25,995 | | | | (22,845 | ) | | | 288 | | | | — | | | | 2,343 | | | | (2,055 | ) |
| International Leaders | | | 53,790 | | | | — | | | | 1,632 | | | | 52,158 | | | | 4,778 | | | | — | | | | 150 | | | | 4,628 | |
| International Small Cap Growth | | | 53,982 | | | | — | | | | 56,574 | | | | (2,592 | ) | | | 3,755 | | | | — | | | | 3,987 | | | | (232 | ) |
| Emerging Markets Growth | | | 137,296 | | | | — | | | | 142,523 | | | | (5,227 | ) | | | 9,951 | | | | — | | | | 11,131 | | | | (1,180 | ) |
| Emerging Markets Leaders | | | 8,998 | | | | — | | | | 12,090 | | | | (3,092 | ) | | | 999 | | | | — | | | | 1,319 | | | | (320 | ) |
| Emerging Markets Small Cap Growth | | | 61,168 | | | | — | | | | 6,977 | | | | 54,191 | | | | 4,325 | | | | — | | | | 488 | | | | 3,837 | |
| Large Cap Value | | | 2,164 | | | | — | | | | 2,624 | | | | (460 | ) | | | 168 | | | | — | | | | 208 | | | | (40 | ) |
| Mid Cap Value | | | 135 | | | | — | | | | 737 | | | | (602 | ) | | | 11 | | | | — | | | | 58 | | | | (47 | ) |
| Small-Mid Cap Value | | | 127 | | | | — | | | | 113 | | | | 14 | | | | 10 | | | | — | | | | 9 | | | | 1 | |
| Small Cap Value | | | 58,504 | | | | — | | | | 29,135 | | | | 29,369 | | | | 3,852 | | | | — | | | | 1,908 | | | | 1,944 | |
| Bond | | | 32,176 | | | | 4,468 | | | | 57,152 | | | | (20,508 | ) | | | 3,115 | | | | 193 | | | | 5,196 | | | | (1,888 | ) |
| Income | | | 38,382 | | | | 1,867 | | | | 44,672 | | | | (4,423 | ) | | | 4,194 | | | | 91 | | | | 4,762 | | | | (477 | ) |
| Low Duration | | | 68,664 | | | | 3,101 | | | | 60,288 | | | | 11,477 | | | | 7,198 | | | | 151 | | | | 6,186 | | | | 1,163 | |
| Ready Reserves | | | 349,973 | | | | 67 | | | | 637,484 | | | | (287,444 | ) | | | 350,006 | | | | 35 | | | | 637,486 | | | | (287,445 | ) |
| (a) | For the period from April 10, 2013 (Commencement of Operations) to June 30, 2013. |
| 150 | Semi-Annual Report | June 30, 2013 |
The following tables summarizes the activity in capital shares of each fund for the period ended December 31, 2012 (in thousands):
| | | Class N | |
| | | Dollars | | | Shares | |
| Fund | | Sales | | | Reinvest | | | Redemptions | | | Total | | | Sales | | | Reinvest | | | Redemptions | | | Total | |
| Growth | | $ | 78,696 | | | $ | 7,021 | | | $ | 66,403 | | | $ | 19,314 | | | | 6,511 | | | | 581 | | | | 5,556 | | | | 1,536 | |
| Large Cap Growth | | | 910 | | | | — | | | | 679 | | | | 231 | | | | 117 | | | | — | | | | 88 | | | | 29 | |
| Mid Cap Growth | | | 23,163 | | | | 883 | | | | 15,631 | | | | 8,415 | | | | 1,835 | | | | 70 | | | | 1,251 | | | | 654 | |
| Small Mid-Cap Growth | | | 21,591 | | | | 1,057 | | | | 18,344 | | | | 4,304 | | | | 1,549 | | | | 74 | | | | 1,290 | | | | 333 | |
| Small Cap Growth | | | 11,395 | | | | 558 | | | | 114,495 | | | | (102,542 | ) | | | 507 | | | | 24 | | | | 5,073 | | | | (4,542 | ) |
| Global Leaders | | | 2,165 | | | | 14 | | | | 1,342 | | | | 837 | | | | 237 | | | | 1 | | | | 150 | | | | 88 | |
| International Growth | | | 201,960 | | | | 36,834 | | | | 478,336 | | | | (239,542 | ) | | | 9,747 | | | | 1,647 | | | | 23,161 | | | | (11,767 | ) |
| International Equity | | | 230 | | | | 172 | | | | 2,397 | | | | (1,995 | ) | | | 20 | | | | 14 | | | | 207 | | | | (173 | ) |
| International Leaders (a) | | | 501 | | | | — | | | | — | | | | 501 | | | | 50 | | | | — | | | | — | | | | 50 | |
| International Small Cap Growth | | | 1,764 | | | | 249 | | | | 8,879 | | | | (6,866 | ) | | | 140 | | | | 19 | | | | 734 | | | | (575 | ) |
| Emerging Markets Growth | | | 439 | | | | 71 | | | | 4,491 | | | | (3,981 | ) | | | 35 | | | | 5 | | | | 358 | | | | (318 | ) |
| Emerging Markets Leaders | | | 182 | | | | 1 | | | | 10 | | | | 173 | | | | 22 | | | | — | | | | 1 | | | | 21 | |
| Emerging Markets Small Cap Growth | | | 3,152 | | | | 12 | | | | 1,607 | | | | 1,557 | | | | 261 | | | | 1 | | | | 134 | | | | 128 | |
| Large Cap Value | | | 247 | | | | 2 | | | | — | | | | 249 | | | | 23 | | | | — | | | | — | | | | 23 | |
| Mid Cap Value | | | 27 | | | | 4 | | | | 16 | | | | 15 | | | | 2 | | | | — | | | | 1 | | | | 1 | |
| Small-Mid Cap Value | | | 22 | | | | 1 | | | | 2 | | | | 21 | | | | 2 | | | | — | | | | — | | | | 2 | |
| Small Cap Value | | | 13,727 | | | | 412 | | | | 20,304 | | | | (6,165 | ) | | | 1,057 | | | | 30 | | | | 1,543 | | | | (456 | ) |
| Bond | | | 29,217 | | | | 1,107 | | | | 6,469 | | | | 23,855 | | | | 2,628 | | | | 99 | | | | 579 | | | | 2,148 | |
| Income | | | 46,878 | | | | 1,690 | | | | 25,694 | | | | 22,874 | | | | 4,948 | | | | 178 | | | | 2,712 | | | | 2,414 | |
| Low Duration | | | 13,181 | | | | 97 | | | | 8,314 | | | | 4,964 | | | | 1,337 | | | | 10 | | | | 843 | | | | 504 | |
| Ready Reserves | | | 867,610 | | | | 131 | | | | 624,157 | | | | 243,584 | | | | 867,610 | | | | 131 | | | | 624,157 | | | | 243,584 | |
| | | Class I | |
| | | Dollars | | | Shares | |
| Fund | | Sales | | | Reinvest | | | Redemptions | | | Total | | | Sales | | | Reinvest | | | Redemptions | | | Total | |
| Growth | | $ | 99,399 | | | $ | 12,799 | | | $ | 51,187 | | | $ | 61,011 | | | | 7,918 | | | | 1,014 | | | | 4,123 | | | | 4,809 | |
| Large Cap Growth | | | 3,057 | | | | — | | | | 4,361 | | | | (1,304 | ) | | | 382 | | | | — | | | | 550 | | | | (168 | ) |
| Mid Cap Growth | | | 250,069 | | | | 7,459 | | | | 56,818 | | | | 200,710 | | | | 19,576 | | | | 576 | | | | 4,392 | | | | 15,760 | |
| Small Mid-Cap Growth | | | 166,456 | | | | 8,330 | | | | 66,523 | | | | 108,263 | | | | 11,543 | | | | 570 | | | | 4,593 | | | | 7,520 | |
| Small Cap Growth | | | 82,018 | | | | 1,069 | | | | 223,185 | | | | (140,098 | ) | | | 3,541 | | | | 44 | | | | 9,629 | | | | (6,044 | ) |
| Global Leaders | | | 14,574 | | | | 220 | | | | 14,834 | | | | (40 | ) | | | 1,589 | | | | 24 | | | | 1,585 | | | | 28 | |
| International Growth | | | 471,066 | | | | 66,346 | | | | 477,179 | | | | 60,233 | | | | 22,026 | | | | 2,899 | | | | 22,367 | | | | 2,558 | |
| International Equity | | | 3,058 | | | | 1,773 | | | | 17,485 | | | | (12,654 | ) | | | 266 | | | | 146 | | | | 1,569 | | | | (1,157 | ) |
| International Leaders (a) | | | 4,042 | | | | 6 | | | | — | | | | 4,048 | | | | 401 | | | | — | | | | — | | | | 401 | |
| International Small Cap Growth | | | 70,906 | | | | 6,537 | | | | 146,425 | | | | (68,982 | ) | | | 5,547 | | | | 483 | | | | 11,369 | | | | (5,339 | ) |
| Emerging Markets Growth | | | 14,379 | | | | 863 | | | | 19,348 | | | | (4,106 | ) | | | 1,140 | | | | 64 | | | | 1,558 | | | | (354 | ) |
| Emerging Markets Leaders | | | 5,784 | | | | 109 | | | | 6,173 | | | | (280 | ) | | | 702 | | | | 12 | | | | 745 | | | | (31 | ) |
| Emerging Markets Small Cap Growth | | | 6,883 | | | | 40 | | | | 1,571 | | | | 5,352 | | | | 568 | | | | 3 | | | | 129 | | | | 442 | |
| Large Cap Value | | | 710 | | | | 13 | | | | — | | | | 723 | | | | 63 | | | | 1 | | | | — | | | | 64 | |
| Mid Cap Value | | | 276 | | | | 154 | | | | 1,296 | | | | (866 | ) | | | 24 | | | | 14 | | | | 113 | | | | (75 | ) |
| Small-Mid Cap Value | | | 50 | | | | 19 | | | | 28 | | | | 41 | | | | 5 | | | | 2 | | | | 3 | | | | 4 | |
| Small Cap Value | | | 33,914 | | | | 2,338 | | | | 51,694 | | | | (15,442 | ) | | | 2,556 | | | | 169 | | | | 3,881 | | | | (1,156 | ) |
| Bond | | | 30,744 | | | | 5,895 | | | | 23,329 | | | | 13,310 | | | | 2,776 | | | | 531 | | | | 2,114 | | | | 1,193 | |
| Income | | | 24,370 | | | | 1,977 | | | | 22,415 | | | | 3,932 | | | | 2,595 | | | | 210 | | | | 2,382 | | | | 423 | |
| Low Duration | | | 106,781 | | | | 1,897 | | | | 34,142 | | | | 74,536 | | | | 10,837 | | | | 192 | | | | 3,465 | | | | 7,564 | |
| Ready Reserves | | | — | | | | — | | | | — | | | | — | | | | — | | | | — | | | | — | | | | — | |
| (a) | For the period from August 16, 2012 (Commencement of Operations) to December 31, 2012. |
| June 30, 2013 | William Blair Funds | 151 |
| | | Institutional | |
| | | Dollars | | | Shares | |
| Fund | | Sales | | | Reinvest | | | Redemptions | | | Total | | | Sales | | | Reinvest | | | Redemptions | | | Total | |
| Global Leaders | | $ | 16,024 | | | $ | — | | | $ | — | | | $ | 16,024 | | | | 1,690 | | | | — | | | | — | | | | 1,690 | |
| Institutional International Growth | | | 283,364 | | | | 58,949 | | | | 226,632 | | | | 115,681 | | | | 20,453 | | | | 3,970 | | | | 16,310 | | | | 8,113 | |
| Institutional International Equity | | | 9,705 | | | | 1,482 | | | | 30,509 | | | | (19,322 | ) | | | 987 | | | | 137 | | | | 3,013 | | | | (1,889 | ) |
| International Leaders (a) | | | 5,000 | | | | 10 | | | | — | | | | 5,010 | | | | 488 | | | | 1 | | | | — | | | | 489 | |
| International Small Cap Growth | | | 49,414 | | | | 7,704 | | | | 106,290 | | | | (49,172 | ) | | | 3,936 | | | | 567 | | | | 8,279 | | | | (3,776 | ) |
| Emerging Markets Growth | | | 245,923 | | | | 7,240 | | | | 259,995 | | | | (6,832 | ) | | | 19,326 | | | | 537 | | | | 20,495 | | | | (632 | ) |
| Emerging Markets Leaders | | | 23,757 | | | | 303 | | | | 13,122 | | | | 10,938 | | | | 2,826 | | | | 33 | | | | 1,581 | | | | 1,278 | |
| Emerging Markets Small Cap Growth | | | 15,000 | | | | — | | | | — | | | | 15,000 | | | | 1,173 | | | | — | | | | — | | | | 1,173 | |
| Bond | | | 22,458 | | | | 3,214 | | | | 6,675 | | | | 18,997 | | | | 2,035 | | | | 290 | | | | 604 | | | | 1,721 | |
| Low Duration | | | 71,039 | | | | 2,281 | | | | 22,867 | | | | 50,453 | | | | 7,207 | | | | 231 | | | | 2,321 | | | | 5,117 | |
| | | Net Change in Net Assets Relating to Fund Share Activity | |
| | | Dollars | | | Shares | |
| Fund | | Sales | | | Reinvest | | | Redemptions | | | Total | | | Sales | | | Reinvest | | | Redemptions | | | Total | |
| Growth | | $ | 178,095 | | | $ | 19,820 | | | $ | 117,590 | | | $ | 80,325 | | | | 14,429 | | | | 1,595 | | | | 9,679 | | | | 6,345 | |
| Large Cap Growth | | | 3,967 | | | | — | | | | 5,040 | | | | (1,073 | ) | | | 499 | | | | — | | | | 638 | | | | (139 | ) |
| Mid Cap Growth | | | 273,232 | | | | 8,342 | | | | 72,449 | | | | 209,125 | | | | 21,411 | | | | 646 | | | | 5,643 | | | | 16,414 | |
| Small Mid-Cap Growth | | | 188,047 | | | | 9,387 | | | | 84,867 | | | | 112,567 | | | | 13,092 | | | | 644 | | | | 5,883 | | | | 7,853 | |
| Small Cap Growth | | | 93,413 | | | | 1,627 | | | | 337,680 | | | | (242,640 | ) | | | 4,048 | | | | 68 | | | | 14,702 | | | | (10,586 | ) |
| Global Leaders | | | 32,763 | | | | 234 | | | | 16,176 | | | | 16,821 | | | | 3,516 | | | | 25 | | | | 1,735 | | | | 1,806 | |
| International Growth | | | 673,026 | | | | 103,180 | | | | 955,515 | | | | (179,309 | ) | | | 31,773 | | | | 4,546 | | | | 45,528 | | | | (9,209 | ) |
| Institutional International Growth | | | 283,364 | | | | 58,949 | | | | 226,632 | | | | 115,681 | | | | 20,453 | | | | 3,970 | | | | 16,310 | | | | 8,113 | |
| International Equity | | | 3,288 | | | | 1,945 | | | | 19,882 | | | | (14,649 | ) | | | 286 | | | | 160 | | | | 1,776 | | | | (1,330 | ) |
| Institutional International Equity | | | 9,705 | | | | 1,482 | | | | 30,509 | | | | (19,322 | ) | | | 987 | | | | 137 | | | | 3,013 | | | | (1,889 | ) |
| International Leaders (a) | | | 9,543 | | | | 16 | | | | — | | | | 9,559 | | | | 939 | | | | 1 | | | | — | | | | 940 | |
| International Small Cap Growth | | | 122,084 | | | | 14,490 | | | | 261,594 | | | | (125,020 | ) | | | 9,623 | | | | 1,069 | | | | 20,382 | | | | (9,690 | ) |
| Emerging Markets Growth | | | 260,741 | | | | 8,174 | | | | 283,834 | | | | (14,919 | ) | | | 20,501 | | | | 606 | | | | 22,411 | | | | (1,304 | ) |
| Emerging Markets Leaders | | | 29,723 | | | | 413 | | | | 19,305 | | | | 10,831 | | | | 3,550 | | | | 45 | | | | 2,327 | | | | 1,268 | |
| Emerging Markets Small Cap Growth | | | 25,035 | | | | 52 | | | | 3,178 | | | | 21,909 | | | | 2,002 | | | | 4 | | | | 263 | | | | 1,743 | |
| Large Cap Value | | | 957 | | | | 15 | | | | — | | | | 972 | | | | 86 | | | | 1 | | | | — | | | | 87 | |
| Mid Cap Value | | | 303 | | | | 158 | | | | 1,312 | | | | (851 | ) | | | 26 | | | | 14 | | | | 114 | | | | (74 | ) |
| Small-Mid Cap Value | | | 72 | | | | 20 | | | | 30 | | | | 62 | | | | 7 | | | | 2 | | | | 3 | | | | 6 | |
| Small Cap Value | | | 47,641 | | | | 2,750 | | | | 71,998 | | | | (21,607 | ) | | | 3,613 | | | | 199 | | | | 5,424 | | | | (1,612 | ) |
| Bond | | | 82,419 | | | | 10,216 | | | | 36,473 | | | | 56,162 | | | | 7,439 | | | | 920 | | | | 3,297 | | | | 5,062 | |
| Income | | | 71,248 | | | | 3,667 | | | | 48,109 | | | | 26,806 | | | | 7,543 | | | | 388 | | | | 5,094 | | | | 2,837 | |
| Low Duration | | | 191,001 | | | | 4,275 | | | | 65,323 | | | | 129,953 | | | | 19,381 | | | | 433 | | | | 6,629 | | | | 13,185 | |
| Ready Reserves | | | 867,610 | | | | 131 | | | | 624,157 | | | | 243,584 | | | | 867,610 | | | | 131 | | | | 624,157 | | | | 243,584 | |
| (a) | For the period from August 16, 2012 (Commencement of Operations) to December 31, 2012. |
| 152 | Semi-Annual Report | June 30, 2013 |
Financial Highlights
Growth Fund
| | | Class N | |
| | | (unaudited) | | | | | | | | | | | | | | | | |
| | | Period Ended | | | | | | | | | | | | | | | | |
| | | June 30, | | | Years Ended December 31, | |
| | | 2013 | | | 2012 | | | 2011 | | | 2010 | | | 2009 | | | 2008 | |
| Net asset value, beginning of year | | | $ | 12.05 | | | $ | 10.73 | | | $ | 11.28 | | | $ | 9.89 | | | $ | 7.12 | | | $ | 11.70 | |
| Income (loss) from investment operations: | | | | | | | | | | | | | | | | | | | | | | | | | |
| Net investment income (loss) | | | | (0.03 | ) | | | (0.01 | ) | | | (0.04 | ) | | | (0.01 | ) | | | (0.02 | ) | | | (0.05 | ) |
| Net realized and unrealized gain (loss) on investments | | | | 1.42 | | | | 1.69 | | | | (0.19 | ) | | | 1.40 | | | | 2.79 | | | | (4.35 | ) |
| Total from investment operations | | | | 1.39 | | | | 1.68 | | | | (0.23 | ) | | | 1.39 | | | | 2.77 | | | | (4.40 | ) |
| Less distributions from: | | | | | | | | | | | | | | | | | | | | | | | | | |
| Net investment income | | | | — | | | | 0.00 | ^ | | | — | | | | — | | | | — | | | | — | |
| Net realized gain | | | | — | | | | 0.36 | | | | 0.32 | | | | — | | | | — | | | | 0.18 | |
| Total distributions | | | | — | | | | 0.36 | | | | 0.32 | | | | — | | | | — | | | | 0.18 | |
| Net asset value, end of year | | | $ | 13.44 | | | $ | 12.05 | | | $ | 10.73 | | | $ | 11.28 | | | $ | 9.89 | | | $ | 7.12 | |
| Total Return (%)* | | | | 11.54 | | | | 15.67 | | | | (1.93 | ) | | | 14.05 | | | | 38.90 | | | | (37.61 | ) |
| Ratios to average daily net assets (%):** | | | | | | | | | | | | | | | | | | | | | | | | | |
| Expenses | | | | 1.17 | | | | 1.20 | | | | 1.21 | | | | 1.16 | | | | 1.23 | | | | 1.17 | |
| Net investment income (loss) | | | | (0.49 | ) | | | (0.06 | ) | | | (0.37 | ) | | | (0.13 | ) | | | (0.20 | ) | | | (0.54 | ) |
| Net assets at end of year (in thousands) | | | $ | 263,854 | | | $ | 248,121 | | | $ | 204,476 | | | $ | 198,622 | | | $ | 153,987 | | | $ | 85,142 | |
| Portfolio turnover rate (%)* | | | | 25 | | | | 73 | | | | 59 | | | | 66 | | | | 67 | | | | 60 | |
| | | Class I | |
| | | (unaudited) | | | | | | | | | | | | | | | | |
| | | Period Ended | | | | | | | | | | | | | | | | |
| | | June 30, | | | Years Ended December 31, | |
| | | 2013 | | | 2012 | | | 2011 | | | 2010 | | | 2009 | | | 2008 | |
| Net asset value, beginning of year | | | $ | 12.58 | | | $ | 11.18 | | | $ | 11.71 | | | $ | 10.24 | | | $ | 7.35 | | | $ | 12.02 | |
| Income (loss) from investment operations: | | | | | | | | | | | | | | | | | | | | | | | | | |
| Net investment income (loss) | | | | (0.01 | ) | | | 0.04 | | | | 0.00 | ^ | | | 0.02 | | | | 0.01 | | | | (0.02 | ) |
| Net realized and unrealized gain (loss) on investments | | | | 1.49 | | | | 1.75 | | | | (0.20 | ) | | | 1.45 | | | | 2.88 | | | | (4.47 | ) |
| Total from investment operations | | | | 1.48 | | | | 1.79 | | | | (0.20 | ) | | | 1.47 | | | | 2.89 | | | | (4.49 | ) |
| Less distributions from: | | | | | | | | | | | | | | | | | | | | | | | | | |
| Net investment income | | | | — | | | | 0.03 | | | | 0.01 | | | | 0.00 | ^ | | | 0.00 | ^ | | | — | |
| Net realized gain | | | | — | | | | 0.36 | | | | 0.32 | | | | — | | | | — | | | | 0.18 | |
| Total distributions | | | | — | | | | 0.39 | | | | 0.33 | | | | 0.00 | ^ | | | 0.00 | ^ | | | 0.18 | |
| Net asset value, end of year | | | $ | 14.06 | | | $ | 12.58 | | | $ | 11.18 | | | $ | 11.71 | | | $ | 10.24 | | | $ | 7.35 | |
| Total Return (%)* | | | | 11.76 | | | | 16.03 | | | | (1.60 | ) | | | 14.36 | | | | 39.34 | | | | (37.35 | ) |
| Ratios to average daily net assets (%):** | | | | | | | | | | | | | | | | | | | | | | | | | |
| Expenses | | | | 0.86 | | | | 0.89 | | | | 0.86 | | | | 0.84 | | | | 0.89 | | | | 0.85 | |
| Net investment income (loss) | | | | (0.17 | ) | | | 0.30 | | | | (0.03 | ) | | | 0.20 | | | | 0.14 | | | | (0.22 | ) |
| Net assets at end of year (in thousands) | | | $ | 531,713 | | | $ | 468,124 | | | $ | 362,266 | | | $ | 376,991 | | | $ | 265,533 | | | $ | 153,444 | |
| Portfolio turnover rate (%)* | | | | 25 | | | | 73 | | | | 59 | | | | 66 | | | | 67 | | | | 60 | |
| * | Rates not annualized for periods that are less than a year. |
| ** | Rates are annualized for periods that are less than a year. |
| ^ | Amount is less than $0.005 per share. |
Note: Net investment income (loss) per share is based on the average shares outstanding during the year.
Performance cited represents past performance. Past performance does not guarantee future results and current performance may be lower or higher than the data quoted. Results shown are annual returns, which assume reinvestment of dividends and capital gains. Investment returns and principal will fluctuate and you may have a gain or loss when you sell shares. For the most current month-end performance information, please call 1-800-742-7272 or visit our Web site at www.williamblairfunds.com.
See accompanying Notes to Financial Statements.
| June 30, 2013 | William Blair Funds | 153 |
Financial Highlights
Large Cap Growth Fund
| | | Class N | |
| | | (unaudited) | | | | | | | | | | | | | | | | |
| | | Period Ended | | | | | | | | | | | | | | | | |
| | | June 30, | | | Years Ended December 31, | |
| | | 2013 | | | 2012 | | | 2011 | | | 2010 | | | 2009 | | | 2008 | |
| Net asset value, beginning of year | | | $ | 8.14 | | | $ | 6.88 | | | $ | 7.14 | | | $ | 6.16 | | | $ | 4.68 | | | $ | 7.52 | |
| Income (loss) from investment operations: | | | | | | | | | | | | | | | | | | | | | | | | | |
| Net investment income (loss) | | | | (0.01 | ) | | | (0.02 | ) | | | (0.01 | ) | | | (0.00 | )^ | | | (0.01 | ) | | | (0.02 | ) |
| Net realized and unrealized gain (loss) on investments | | | | 0.77 | | | | 1.28 | | | | (0.25 | ) | | | 0.98 | | | | 1.49 | | | | (2.82 | ) |
| Total from investment operations | | | | 0.76 | | | | 1.26 | | | | (0.26 | ) | | | 0.98 | | | | 1.48 | | | | (2.84 | ) |
| Less distributions from: | | | | | | | | | | | | | | | | | | | | | | | | | |
| Net investment income | | | | — | | | | — | | | | — | | | | — | | | | — | | | | 0.00 | ^ |
| Net realized gain | | | | — | | | | — | | | | — | | | | — | | | | — | | | | — | |
| Total distributions | | | | — | | | | — | | | | — | | | | — | | | | — | | | | 0.00 | ^ |
| Net asset value, end of year | | | $ | 8.90 | | | $ | 8.14 | | | $ | 6.88 | | | $ | 7.14 | | | $ | 6.16 | | | $ | 4.68 | |
| Total Return (%)* | | | | 9.34 | | | | 18.31 | | | | (3.64 | ) | | | 15.91 | | | | 31.62 | | | | (37.76 | ) |
| Ratios to average daily net assets (%):** | | | | | | | | | | | | | | | | | | | | | | | | | |
| Expenses, net of waivers and reimbursements | | | | 1.20 | | | | 1.20 | | | | 1.20 | | | | 1.21 | | | | 1.23 | | | | 1.23 | |
| Expenses, before waivers and reimbursements | | | | 1.50 | | | | 1.57 | | | | 1.51 | | | | 1.53 | | | | 2.28 | | | | 1.85 | |
| Net investment income (loss), net of waivers and reimbursements | | | | (0.31 | ) | | | (0.21 | ) | | | (0.13 | ) | | | (0.08 | ) | | | (0.13 | ) | | | (0.29 | ) |
| Net investment income (loss), before waivers and reimbursements | | | | (0.61 | ) | | | (0.58 | ) | | | (0.44 | ) | | | (0.40 | ) | | | (1.18 | ) | | | (0.91 | ) |
| Net assets at end of year (in thousands) | | | $ | 5,046 | | | $ | 4,238 | | | $ | 3,387 | | | $ | 7,135 | | | $ | 5,952 | | | $ | 4,842 | |
| Portfolio turnover rate (%)* | | | | 23 | | | | 50 | | | | 67 | | | | 54 | | | | 88 | | | | 85 | |
| | | Class I | |
| | | (unaudited) | | | | | | | | | | | | | | | | |
| | | Period Ended | | | | | | | | | | | | | | | | |
| | | June 30, | | Years Ended December 31, | |
| | | 2013 | | | 2012 | | | 2011 | | | 2010 | | | 2009 | | | 2008 | |
| Net asset value, beginning of year | | | $ | 8.35 | | | $ | 7.03 | | | $ | 7.30 | | | $ | 6.30 | | | $ | 4.77 | | | $ | 7.64 | |
| Income (loss) from investment operations: | | | | | | | | | | | | | | | | | | | | | | | | | |
| Net investment income (loss) | | | | (0.00 | )^ | | | 0.00 | ^ | | | 0.01 | | | | 0.01 | | | | 0.01 | | | | 0.00 | ^ |
| Net realized and unrealized gain (loss) on investments | | | | 0.79 | | | | 1.32 | | | | (0.27 | ) | | | 1.00 | | | | 1.52 | | | | (2.87 | ) |
| Total from investment operations | | | | 0.79 | | | | 1.32 | | | | (0.26 | ) | | | 1.01 | | | | 1.53 | | | | (2.87 | ) |
| Less distributions from: | | | | | | | | | | | | | | | | | | | | | | | | | |
| Net investment income | | | | — | | | | — | | | | 0.01 | | | | 0.01 | | | | 0.00 | ^ | | | 0.00 | ^ |
| Net realized gain | | | | — | | | | — | | | | — | | | | — | | | | — | | | | — | |
| Total distributions | | | | — | | | | — | | | | 0.01 | | | | 0.01 | | | | 0.00 | ^ | | | 0.00 | ^ |
| Net asset value, end of year | | | $ | 9.14 | | | $ | 8.35 | | | $ | 7.03 | | | $ | 7.30 | | | $ | 6.30 | | | $ | 4.77 | |
| Total Return (%)* | | | | 9.46 | | | | 18.78 | | | | (3.54 | ) | | | 16.03 | | | | 32.17 | | | | (37.56 | ) |
| Ratios to average daily net assets (%):** | | | | | | | | | | | | | | | | | | | | | | | | | |
| Expenses, net of waivers and reimbursements | | | | 0.95 | | | | 0.95 | | | | 0.95 | | | | 0.96 | | | | 0.98 | | | | 0.98 | |
| Expenses, before waivers and reimbursements | | | | 1.17 | | | | 1.23 | | | | 1.16 | | | | 1.16 | | | | 1.26 | | | | 1.21 | |
| Net investment income (loss), net of waivers and reimbursements | | | | (0.05 | ) | | | 0.03 | | | | 0.11 | | | | 0.16 | | | | 0.12 | | | | (0.04 | ) |
| Net investment income (loss), before waivers and reimbursements | | | | (0.27 | ) | | | (0.25 | ) | | | (0.10 | ) | | | (0.04 | ) | | | (0.16 | ) | | | (0.27 | ) |
| Net assets at end of year (in thousands) | | | $ | 27,097 | | | $ | 24,175 | | | $ | 21,562 | | | $ | 24,900 | | | $ | 24,359 | | | $ | 18,437 | |
| Portfolio turnover rate (%)* | | | | 23 | | | | 50 | | | | 67 | | | | 54 | | | | 88 | | | | 85 | |
| * | Rates not annualized for periods that are less than a year. |
| ** | Rates are annualized for periods that are less than a year. |
| ^ | Amount is less than $0.005 per share. |
Note: Net investment income (loss) per share is based on the average shares outstanding during the year.
Performance cited represents past performance. Past performance does not guarantee future results and current performance may be lower or higher than the data quoted. Results shown are annual returns, which assume reinvestment of dividends and capital gains. Investment returns and principal will fluctuate and you may have a gain or loss when you sell shares. For the most current month-end performance information, please call 1-800-742-7272 or visit our Web site at www.williamblairfunds.com.
| 154 | Semi-Annual Report | June 30, 2013 |
Financial Highlights
Mid Cap Growth Fund
| | | Class N | |
| | | (unaudited) | | | | | | | | | | | | | | | | |
| | | Period Ended | | | | | | | | | | | | | | | | |
| | | June 30, | | | Years Ended December 31, | |
| | | 2013 | | | 2012 | | | 2011 | | | 2010 | | | 2009 | | | 2008 | |
| Net asset value, beginning of year | | | $ | 12.65 | | | $ | 11.66 | | | $ | 12.50 | | | $ | 10.08 | | | $ | 7.41 | | | $ | 11.35 | |
| Income (loss) from investment operations: | | | | | | | | | | | | | | | | | | | | | | | | | |
| Net investment income (loss) | | | | (0.06 | ) | | | (0.02 | ) | | | (0.08 | ) | | | (0.05 | ) | | | (0.04 | ) | | | (0.07 | ) |
| Net realized and unrealized gain (loss) on investments | | | | 1.64 | | | | 1.29 | | | | 0.25 | | | | 2.47 | | | | 2.71 | | | | (3.87 | ) |
| Total from investment operations | | | | 1.58 | | | | 1.27 | | | | 0.17 | | | | 2.42 | | | | 2.67 | | | | (3.94 | ) |
| Less distributions from: | | | | | | | | | | | | | | | | | | | | | | | | | |
| Net investment income | | | | — | | | | — | | | | — | | | | — | | | | — | | | | — | |
| Net realized gain | | | | — | | | | 0.28 | | | | 1.01 | | | | — | | | | — | | | | 0.00 | ^ |
| Total distributions | | | | — | | | | 0.28 | | | | 1.01 | | | | — | | | | — | | | | 0.00 | ^ |
| Net asset value, end of year | | | $ | 14.23 | | | $ | 12.65 | | | $ | 11.66 | | | $ | 12.50 | | | $ | 10.08 | | | $ | 7.41 | |
| Total Return (%)* | | | | 12.49 | | | | 10.90 | | | | 1.65 | | | | 24.01 | | | | 36.03 | | | | (34.71 | ) |
| Ratios to average daily net assets (%):** | | | | | | | | | | | | | | | | | | | | | | | | | |
| Expenses, net of waivers and reimbursements | | | | 1.35 | | | | 1.35 | | | | 1.35 | | | | 1.35 | | | | 1.36 | | | | 1.36 | |
| Expenses, before waivers and reimbursements | | | | 1.39 | | | | 1.42 | | | | 1.43 | | | | 1.42 | | | | 2.13 | | | | 2.03 | |
| Net investment income (loss), net of waivers and reimbursements | | | | (0.93 | ) | | | (0.15 | ) | | | (0.65 | ) | | | (0.42 | ) | | | (0.51 | ) | | | (0.76 | ) |
| Net investment income (loss), before waivers and reimbursements | | | | (0.97 | ) | | | (0.22 | ) | | | (0.73 | ) | | | (0.49 | ) | | | (1.28 | ) | | | (1.43 | ) |
| Net assets at end of year (in thousands) | | | $ | 46,346 | | | $ | 40,940 | | | $ | 30,093 | | | $ | 13,802 | | | $ | 10,379 | | | $ | 4,803 | |
| Portfolio turnover rate (%)* | | | | 37 | | | | 62 | | | | 70 | | | | 73 | | | | 87 | | | | 76 | |
| | | Class I | |
| | | (unaudited) | | | | | | | | | | | | | | | | |
| | | Period Ended | | | | | | | | | | | | | | | | |
| | | June 30, | | | Years Ended December 31, | |
| | | 2013 | | | 2012 | | | 2011 | | | 2010 | | | 2009 | | | 2008 | |
| Net asset value, beginning of year | | | $ | 12.91 | | | $ | 11.87 | | | $ | 12.68 | | | $ | 10.20 | | | $ | 7.48 | | | $ | 11.42 | |
| Income (loss) from investment operations: | | | | | | | | | | | | | | | | | | | | | | | | | |
| Net investment income (loss) | | | | (0.05 | ) | | | 0.03 | | | | (0.05 | ) | | | (0.02 | ) | | | (0.02 | ) | | | (0.05 | ) |
| Net realized and unrealized gain (loss) on investments | | | | 1.68 | | | | 1.31 | | | | 0.25 | | | | 2.50 | | | | 2.74 | | | | (3.89 | ) |
| Total from investment operations | | | | 1.63 | | | | 1.34 | | | | 0.20 | | | | 2.48 | | | | 2.72 | | | | (3.94 | ) |
| Less distributions from: | | | | | | | | | | | | | | | | | | | | | | | | | |
| Net investment income | | | | — | | | | 0.02 | | | | — | | | | — | | | | — | | | | — | |
| Net realized gain | | | | — | | | | 0.28 | | | | 1.01 | | | | — | | | | — | | | | 0.00 | ^ |
| Total distributions | | | | — | | | | 0.30 | | | | 1.01 | | | | — | | | | — | | | | 0.00 | ^ |
| Net asset value, end of year | | | $ | 14.54 | | | $ | 12.91 | | | $ | 11.87 | | | $ | 12.68 | | | $ | 10.20 | | | $ | 7.48 | |
| Total Return (%)* | | | | 12.63 | | | | 11.30 | | | | 1.86 | | | | 24.31 | | | | 36.36 | | | | (34.50 | ) |
| Ratios to average daily net assets (%):** | | | | | | | | | | | | | | | | | | | | | | | | | |
| Expenses, net of waivers and reimbursements | | | | 1.10 | | | | 1.07 | | | | 1.10 | | | | 1.10 | | | | 1.11 | | | | 1.11 | |
| Expenses, before waivers and reimbursements | | | | 1.10 | | | | 1.07 | | | | 1.13 | | | | 1.15 | | | | 1.28 | | | | 1.23 | |
| Net investment income (loss), net of waivers and reimbursements | | | | (0.67 | ) | | | 0.19 | | | | (0.42 | ) | | | (0.14 | ) | | | (0.26 | ) | | | (0.51 | ) |
| Net investment income (loss), before waivers and reimbursements | | | | (0.67 | ) | | | 0.19 | | | | (0.45 | ) | | | (0.19 | ) | | | (0.43 | ) | | | (0.63 | ) |
| Net assets at end of year (in thousands) | | | $ | 419,543 | | | $ | 329,295 | | | $ | 115,661 | | | $ | 87,446 | | | $ | 60,455 | | | $ | 35,723 | |
| Portfolio turnover rate (%)* | | | | 37 | | | | 62 | | | | 70 | | | | 73 | | | | 87 | | | | 76 | |
| * | Rates not annualized for periods that are less than a year. |
| ** | Rates are annualized for periods that are less than a year. |
| ^ | Amount is less than $0.005 per share. |
Note: Net investment income (loss) per share is based on the average shares outstanding during the year.
Performance cited represents past performance. Past performance does not guarantee future results and current performance may be lower or higher than the data quoted. Results shown are annual returns, which assume reinvestment of dividends and capital gains. Investment returns and principal will fluctuate and you may have a gain or loss when you sell shares. For the most current month-end performance information, please call 1-800-742-7272 or visit our Web site at www.williamblairfunds.com.
| June 30, 2013 | William Blair Funds | 155 |
Financial Highlights
Small-Mid Cap Growth Fund
| | | Class N | |
| | | (unaudited) | | | | | | | | | | | | | | | | |
| | | Period Ended | | | | | | | | | | | | | | | | |
| | | June 30, | | | Years Ended December 31, | |
| | | 2013 | | | 2012 | | | 2011 | | | 2010 | | | 2009 | | | 2008 | |
| Net asset value, beginning of year | | | $ | 14.21 | | | $ | 13.00 | | | $ | 14.40 | | | $ | 11.73 | | | $ | 8.16 | | | $ | 13.10 | |
| Income (loss) from investment operations: | | | | | | | | | | | | | | | | | | | | | | | | | |
| Net investment income (loss) | | | | (0.08 | ) | | | 0.02 | | | | (0.11 | ) | | | (0.09 | ) | | | (0.06 | ) | | | (0.03 | ) |
| Net realized and unrealized gain (loss) on investments | | | | 2.79 | | | | 1.57 | | | | 0.03 | | | | 2.76 | | | | 3.63 | | | | (4.91 | ) |
| Total from investment operations | | | | 2.71 | | | | 1.59 | | | | (0.08 | ) | | | 2.67 | | | | 3.57 | | | | (4.94 | ) |
| Less distributions from: | | | | | | | | | | | | | | | | | | | | | | | | | |
| Net investment income | | | | — | | | | 0.02 | | | | — | | | | — | | | | — | | | | — | |
| Net realized gain | | | | — | | | | 0.36 | | | | 1.32 | | | | — | | | | — | | | | 0.00 | ^ |
| Total distributions | | | | — | | | | 0.38 | | | | 1.32 | | | | — | | | | — | | | | 0.00 | ^ |
| Net asset value, end of year | | | $ | 16.92 | | | $ | 14.21 | | | $ | 13.00 | | | $ | 14.40 | | | $ | 11.73 | | | $ | 8.16 | |
| Total Return (%)* | | | | 19.07 | | | | 12.20 | | | | (0.27 | ) | | | 22.76 | | | | 43.75 | | | | (37.71 | ) |
| Ratios to average daily net assets (%):** | | | | | | | | | | | | | | | | | | | | | | | | | |
| Expenses, net of waivers and reimbursements | | | | 1.35 | | | | 1.35 | | | | 1.35 | | | | 1.35 | | | | 1.36 | | | | 1.36 | |
| Expenses, before waivers and reimbursements | | | | 1.43 | | | | 1.47 | | | | 1.46 | | | | 1.46 | | | | 1.49 | | | | 1.41 | |
| Net investment income (loss), net of waivers and reimbursements | | | | (1.00 | ) | | | 0.16 | | | | (0.77 | ) | | | (0.76 | ) | | | (0.60 | ) | | | (0.26 | ) |
| Net investment income (loss), before waivers and reimbursements | | | | (1.08 | ) | | | 0.04 | | | | (0.88 | ) | | | (0.87 | ) | | | (0.73 | ) | | | (0.31 | ) |
| Net assets at end of year (in thousands) | | | $ | 59,354 | | | $ | 42,015 | | | $ | 34,123 | | | $ | 26,876 | | | $ | 23,576 | | | $ | 7,954 | |
| Portfolio turnover rate (%)* | | | | 20 | | | | 82 | | | | 76 | | | | 93 | | | | 112 | | | | 77 | |
| | | Class I | |
| | | (unaudited) | | | | | | | | | | | | | | | | |
| | | Period Ended | | | | | | | | | | | | | | | | |
| | | June 30, | | | Years Ended December 31, | |
| | | 2013 | | | 2012 | | | 2011 | | | 2010 | | | 2009 | | | 2008 | |
| Net asset value, beginning of year | | | $ | 14.55 | | | $ | 13.32 | | | $ | 14.68 | | | $ | 11.93 | | | $ | 8.27 | | | $ | 13.24 | |
| Income (loss) from investment operations: | | | | | | | | | | | | | | | | | | | | | | | | | |
| Net investment income (loss) | | | | (0.06 | ) | | | 0.07 | | | | (0.08 | ) | | | (0.06 | ) | | | (0.03 | ) | | | 0.00 | ^ |
| Net realized and unrealized gain (loss) on investments | | | | 2.86 | | | | 1.58 | | | | 0.04 | | | | 2.81 | | | | 3.69 | | | | (4.97 | ) |
| Total from investment operations | | | | 2.80 | | | | 1.65 | | | | (0.04 | ) | | | 2.75 | | | | 3.66 | | | | (4.97 | ) |
| Less distributions from: | | | | | | | | | | | | | | | | | | | | | | | | | |
| Net investment income | | | | — | | | | 0.06 | | | | — | | | | — | | | | 0.00 | ^ | | | — | |
| Net realized gain | | | | — | | | | 0.36 | | | | 1.32 | | | | — | | | | — | | | | 0.00 | ^ |
| Total distributions | | | | — | | | | 0.42 | | | | 1.32 | | | | — | | | | 0.00 | ^ | | | 0.00 | ^ |
| Net asset value, end of year | | | $ | 17.35 | | | $ | 14.55 | | | $ | 13.32 | | | $ | 14.68 | | | $ | 11.93 | | | $ | 8.27 | |
| Total Return (%)* | | | | 19.24 | | | | 12.36 | | | | 0.01 | | | | 23.05 | | | | 44.26 | | | | (37.54 | ) |
| Ratios to average daily net assets (%):** | | | | | | | | | | | | | | | | | | | | | | | | | |
| Expenses, net of waivers and reimbursements | | | | 1.09 | | | | 1.10 | | | | 1.10 | | | | 1.10 | | | | 1.11 | | | | 1.11 | |
| Expenses, before waivers and reimbursements | | | | 1.09 | | | | 1.20 | | | | 1.12 | | | | 1.11 | | | | 1.18 | | | | 1.17 | |
| Net investment income (loss), net of waivers and reimbursements | | | | (0.73 | ) | | | 0.48 | | | | (0.54 | ) | | | (0.50 | ) | | | (0.33 | ) | | | 0.03 | |
| Net investment income (loss), before waivers and reimbursements | | | | (0.73 | ) | | | 0.38 | | | | (0.56 | ) | | | (0.51 | ) | | | (0.40 | ) | | | (0.03 | ) |
| Net assets at end of year (in thousands) | | | $ | 440,510 | | | $ | 349,345 | | | $ | 219,474 | | | $ | 181,189 | | | $ | 123,252 | | | $ | 75,525 | |
| Portfolio turnover rate (%)* | | | | 20 | | | | 82 | | | | 76 | | | | 93 | | | | 112 | | | | 77 | |
| * | Rates not annualized for periods that are less than a year. |
| ** | Rates are annualized for periods that are less than a year. |
| ^ | Amount is less than $0.005 per share. |
Note: Net investment income (loss) per share is based on the average shares outstanding during the year.
Performance cited represents past performance. Past performance does not guarantee future results and current performance may be lower or higher than the data quoted. Results shown are annual returns, which assume reinvestment of dividends and capital gains. Investment returns and principal will fluctuate and you may have a gain or loss when you sell shares. For the most current month-end performance information, please call 1-800-742-7272 or visit our Web site at www.williamblairfunds.com.
| 156 | Semi-Annual Report | June 30, 2013 |
Financial Highlights
Small Cap Growth Fund
| | | Class N | |
| | | (unaudited) | | | | | | | | | | | | | | | | |
| | | Period Ended | | | | | | | | | | | | | | | | |
| | | June 30, | | | Years Ended December 31, | |
| | | 2013 | | | 2012 | | | 2011 | | | 2010 | | | 2009 | | | 2008 | |
| Net asset value, beginning of year | | | $ | 23.68 | | | $ | 20.13 | | | $ | 23.22 | | | $ | 19.99 | | | $ | 11.79 | | | $ | 23.30 | |
| Income (loss) from investment operations: | | | | | | | | | | | | | | | | | | | | | | | | | |
| Net investment income (loss) | | | | (0.14 | ) | | | (0.22 | ) | | | (0.28 | ) | | | (0.21 | ) | | | (0.15 | ) | | | (0.19 | ) |
| Net realized and unrealized gain (loss) on investments | | | | 5.74 | | | | 3.87 | | | | (2.81 | ) | | | 3.44 | | | | 8.35 | | | | (10.73 | ) |
| Total from investment operations | | | | 5.60 | | | | 3.65 | | | | (3.09 | ) | | | 3.23 | | | | 8.20 | | | | (10.92 | ) |
| Less distributions from: | | | | | | | | | | | | | | | | | | | | | | | | | |
| Net investment income | | | | — | | | | — | | | | — | | | | — | | | | — | | | | — | |
| Net realized gain | | | | — | | | | 0.10 | | | | — | | | | — | | | | — | | | | 0.59 | |
| Total distributions | | | | — | | | | 0.10 | | | | — | | | | — | | | | — | | | | 0.59 | |
| Net asset value, end of year | | | $ | 29.28 | | | $ | 23.68 | | | $ | 20.13 | | | $ | 23.22 | | | $ | 19.99 | | | $ | 11.79 | |
| Total Return (%)* | | | | 23.65 | | | | 18.15 | | | | (13.31 | ) | | | 16.16 | | | | 69.55 | | | | (46.85 | ) |
| Ratios to average daily net assets (%):** | | | | | | | | | | | | | | | | | | | | | | | | | |
| Expenses, net of waivers and reimbursements | | | | 1.50 | | | | 1.50 | | | | 1.50 | | | | 1.50 | | | | 1.50 | | | | 1.50 | |
| Expenses, before waivers and reimbursements | | | | 1.59 | | | | 1.59 | | | | 1.59 | | | | 1.52 | | | | 1.55 | | | | 1.50 | |
| Net investment income (loss), net of waivers and reimbursements | | | | (1.06 | ) | | | (0.96 | ) | | | (1.25 | ) | | | (1.03 | ) | | | (0.93 | ) | | | (1.05 | ) |
| Net investment income (loss), before waivers and reimbursements | | | | (1.15 | ) | | | (1.05 | ) | | | (1.34 | ) | | | (1.05 | ) | | | (0.98 | ) | | | (1.05 | ) |
| Net assets at end of year (in thousands) | | | $ | 154,734 | | | $ | 130,382 | | | $ | 202,341 | | | $ | 396,767 | | | $ | 469,746 | | | $ | 224,612 | |
| Portfolio turnover rate (%)* | | | | 44 | | | | 89 | | | | 97 | | | | 117 | | | | 122 | | | | 135 | |
| | | Class I | |
| | | (unaudited) | | | | | | | | | | | | | | | | |
| | | Period Ended | | | | | | | | | | | | | | | | |
| | | June 30, | | | Years Ended December 31, | |
| | | 2013 | | | 2012 | | | 2011 | | | 2010 | | | 2009 | | | 2008 | |
| Net asset value, beginning of year | | | $ | 24.66 | | | $ | 20.91 | | | $ | 24.07 | | | $ | 20.64 | | | $ | 12.14 | | | $ | 23.89 | |
| Income (loss) from investment operations: | | | | | | | | | | | | | | | | | | | | | | | | | |
| Net investment income (loss) | | | | (0.11 | ) | | | (0.16 | ) | | | (0.23 | ) | | | (0.16 | ) | | | (0.11 | ) | | | (0.14 | ) |
| Net realized and unrealized gain (loss) on investments | | | | 5.99 | | | | 4.01 | | | | (2.93 | ) | | | 3.59 | | | | 8.61 | | | | (11.02 | ) |
| Total from investment operations | | | | 5.88 | | | | 3.85 | | | | (3.16 | ) | | | 3.43 | | | | 8.50 | | | | (11.16 | ) |
| Less distributions from: | | | | | | | | | | | | | | | | | | | | | | | | | |
| Net investment income | | | | — | | | | — | | | | — | | | | — | | | | — | | | | — | |
| Net realized gain | | | | — | | | | 0.10 | | | | — | | | | — | | | | — | | | | 0.59 | |
| Total distributions | | | | — | | | | 0.10 | | | | — | | | | — | | | | — | | | | 0.59 | |
| Net asset value, end of year | | | $ | 30.54 | | | $ | 24.66 | | | $ | 20.91 | | | $ | 24.07 | | | $ | 20.64 | | | $ | 12.14 | |
| Total Return (%)* | | | | 23.84 | | | | 18.43 | | | | (13.13 | ) | | | 16.62 | | | | 70.02 | | | | (46.70 | ) |
| Ratios to average daily net assets (%):** | | | | | | | | | | | | | | | | | | | | | | | | | |
| Expenses, net of waivers and reimbursements | | | | 1.25 | | | | 1.25 | | | | 1.25 | | | | 1.25 | | | | 1.20 | | | | 1.20 | |
| Expenses, before waivers and reimbursements | | | | 1.34 | | | | 1.35 | | | | 1.35 | | | | 1.25 | | | | 1.20 | | | | 1.20 | |
| Net investment income (loss), net of waivers and reimbursements | | | | (0.80 | ) | | | (0.71 | ) | | | (1.00 | ) | | | (0.76 | ) | | | (0.63 | ) | | | (0.75 | ) |
| Net investment income (loss), before waivers and reimbursements | | | | (0.89 | ) | | | (0.81 | ) | | | (1.10 | ) | | | (0.76 | ) | | | (0.63 | ) | | | (0.75 | ) |
| Net assets at end of year (in thousands) | | | $ | 333,686 | | | $ | 266,431 | | | $ | 352,397 | | | $ | 494,822 | | | $ | 293,052 | | | $ | 177,015 | |
| Portfolio turnover rate (%)* | | | | 44 | | | | 89 | | | | 97 | | | | 117 | | | | 122 | | | | 135 | |
| * | Rates not annualized for periods that are less than a year. |
| ** | Rates are annualized for periods that are less than a year. |
Note: Net investment income (loss) per share is based on the average shares outstanding during the year.
Performance cited represents past performance. Past performance does not guarantee future results and current performance may be lower or higher than the data quoted. Results shown are annual returns, which assume reinvestment of dividends and capital gains. Investment returns and principal will fluctuate and you may have a gain or loss when you sell shares. For the most current month-end performance information, please call 1-800-742-7272 or visit our Web site at www.williamblairfunds.com.
| June 30, 2013 | William Blair Funds | 157 |
Financial Highlights
Global Leaders Fund
| | | Class N | |
| | | (unaudited) | | | | | | | | | | | | | | | | |
| | | Period Ended | | | | | | | | | | | | | | | | |
| | | June 30, | | | Years Ended December 31, | |
| | | 2013 | | | 2012 | | | 2011 | | | 2010 | | | 2009 | | | 2008 | |
| Net asset value, beginning of year | | | $ | 9.47 | | | $ | 8.10 | | | $ | 8.40 | | | $ | 6.97 | | | $ | 4.96 | | | $ | 9.89 | |
| Income (loss) from investment operations: | | | | | | | | | | | | | | | | | | | | | | | | | |
| Net investment income (loss) (a) | | | | 0.04 | | | | 0.03 | | | | 0.02 | | | | (0.01 | ) | | | (0.01 | ) | | | 0.08 | |
| Net realized and unrealized gain (loss) on investments | | | | 0.40 | | | | 1.37 | | | | (0.31 | ) | | | 1.44 | | | | 2.02 | | | | (4.98 | ) |
| Total from investment operations | | | | 0.44 | | | | 1.40 | | | | (0.29 | ) | | | 1.43 | | | | 2.01 | | | | (4.90 | ) |
| Less distributions from: | | | | | | | | | | | | | | | | | | | | | | | | | |
| Net investment income | | | | — | | | | 0.03 | | | | 0.01 | | | | — | | | | — | | | | 0.03 | |
| Net realized gain | | | | — | | | | — | | | | — | | | | — | | | | — | | | | — | |
| Total distributions | | | | — | | | | 0.03 | | | | 0.01 | | | | — | | | | — | | | | 0.03 | |
| Net asset value, end of year | | | $ | 9.91 | | | $ | 9.47 | | | $ | 8.10 | | | $ | 8.40 | | | $ | 6.97 | | | $ | 4.96 | |
| Total Return (%)* | | | | 4.65 | | | | 17.25 | | | | (3.47 | ) | | | 20.52 | | | | 40.52 | | | | (49.52 | ) |
| Ratios to average daily net assets (%):** | | | | | | | | | | | | | | | | | | | | | | | | | |
| Expenses, net of waivers and reimbursements | | | | 1.50 | | | | 1.50 | | | | 1.50 | | | | 1.52 | | | | 1.55 | | | | 1.55 | |
| Expenses, before waivers and reimbursements | | | | 1.67 | | | | 1.84 | | | | 1.82 | | | | 1.93 | | | | 2.61 | | | | 2.17 | |
| Net investment income (loss), net of waivers and reimbursements | | | | 0.80 | | | | 0.29 | | | | 0.29 | | | | (0.09 | ) | | | (0.17 | ) | | | 0.98 | |
| Net investment income (loss), before waivers and reimbursements | | | | 0.63 | | | | (0.05 | ) | | | (0.03 | ) | | | (0.50 | ) | | | (1.23 | ) | | | 0.36 | |
| Net assets at end of year (in thousands) | | | $ | 5,557 | | | $ | 5,215 | | | $ | 3,740 | | | $ | 5,101 | | | $ | 4,721 | | | $ | 3,652 | |
| Portfolio turnover rate (%)* | | | | 27 | | | | 73 | | | | 75 | | | | 96 | | | | 133 | | | | 124 | |
| | | Class I | |
| | | (unaudited) | | | | | | | | | | | | | | | | |
| | | Period Ended | | | | | | | | | | | | | | | | |
| | | June 30, | | | Years Ended December 31, | |
| | | 2013 | | | 2012 | | | 2011 | | | 2010 | | | 2009 | | | 2008 | |
| Net asset value, beginning of year | | | $ | 9.47 | | | $ | 8.09 | | | $ | 8.40 | | | $ | 6.96 | | | $ | 4.94 | | | $ | 9.91 | |
| Income (loss) from investment operations: | | | | | | | | | | | | | | | | | | | | | | | | | |
| Net investment income (loss) (a) | | | | 0.05 | | | | 0.05 | | | | 0.04 | | | | 0.01 | | | | 0.00 | ^ | | | 0.08 | |
| Net realized and unrealized gain (loss) on investments | | | | 0.39 | | | | 1.38 | | | | (0.31 | ) | | | 1.43 | | | | 2.02 | | | | (4.98 | ) |
| Total from investment operations | | | | 0.44 | | | | 1.43 | | | | (0.27 | ) | | | 1.44 | | | | 2.02 | | | | (4.90 | ) |
| Less distributions from: | | | | | | | | | | | | | | | | | | | | | | | | | |
| Net investment income | | | | — | | | | 0.05 | | | | 0.04 | | | | 0.00 | ^ | | | 0.00 | ^ | | | 0.07 | |
| Net realized gain | | | | — | | | | — | | | | — | | | | — | | | | — | | | | — | |
| Total distributions | | | | — | | | | 0.05 | | | | 0.04 | | | | 0.00 | ^ | | | 0.00 | ^ | | | 0.07 | |
| Net asset value, end of year | | | $ | 9.91 | | | $ | 9.47 | | | $ | 8.09 | | | $ | 8.40 | | | $ | 6.96 | | | $ | 4.94 | |
| Total Return (%)* | | | | 4.65 | | | | 17.64 | | | | (3.26 | ) | | | 20.73 | | | | 40.90 | | | | (49.41 | ) |
| Ratios to average daily net assets (%):** | | | | | | | | | | | | | | | | | | | | | | | | | |
| Expenses, net of waivers and reimbursements | | | | 1.25 | | | | 1.25 | | | | 1.25 | | | | 1.27 | | | | 1.30 | | | | 1.30 | |
| Expenses, before waivers and reimbursements | | | | 1.39 | | | | 1.56 | | | | 1.55 | | | | 1.62 | | | | 1.62 | | | | 1.74 | |
| Net investment income (loss), net of waivers and reimbursements | | | | 1.04 | | | | 0.54 | | | | 0.52 | | | | 0.16 | | | | 0.05 | | | | 1.05 | |
| Net investment income (loss), before waivers and reimbursements | | | | 0.90 | | | | 0.23 | | | | 0.22 | | | | (0.19 | ) | | | (0.27 | ) | | | 0.61 | |
| Net assets at end of year (in thousands) | | | $ | 48,384 | | | $ | 45,757 | | | $ | 38,834 | | | $ | 39,776 | | | $ | 33,566 | | | $ | 24,353 | |
| Portfolio turnover rate (%)* | | | | 27 | | | | 73 | | | | 75 | | | | 96 | | | | 133 | | | | 124 | |
| (a) | Excludes $0.00, $0.00, $0.00, $0.00 $0.00 and $0.00 of PFIC mark to market which is treated as ordinary income for Federal tax purposes for the years 2013, 2012, 2011, 2010, 2009, and 2008 respectively. |
| * | Rates not annualized for periods that are less than a year. |
| ** | Rates are annualized for periods that are less than a year. |
| ^ | Amount is less than $0.005 per share. |
Note: Net investment income (loss) per share is based on the average shares outstanding during the year.
Performance cited represents past performance. Past performance does not guarantee future results and current performance may be lower or higher than the data quoted. Results shown are annual returns, which assume reinvestment of dividends and capital gains. Investment returns and principal will fluctuate and you may have a gain or loss when you sell shares. For the most current month-end performance information, please call 1-800-742-7272 or visit our Web site at www.williamblairfunds.com.
| 158 | Semi-Annual Report | June 30, 2013 |
Financial Highlights
Global Leaders Fund
| | | Institutional Class Shares | |
| | | (unaudited) | | | | |
| | | Period Ended | | | Period Ended | |
| | | June, 30 | | | December 31, | |
| | | 2013 | | | 2012(a) | |
| Net asset value, beginning of year | | | $ | 9.47 | | | | $ | 9.50 | |
| Income (loss) from investment operations: | | | | | | | | | | |
| Net investment income (loss) (b) | | | | 0.06 | | | | | 0.00 | ^ |
| Net realized and unrealized gain (loss) on investments | | | | 0.39 | | | | | (0.03 | ) |
| Total from investment operations | | | | 0.45 | | | | | (0.03 | ) |
| Less distributions from: | | | | | | | | | | |
| Net investment income | | | | — | | | | | — | |
| Net realized gain | | | | — | | | | | — | |
| Total distributions | | | | — | | | | | — | |
| Net asset value, end of year | | | $ | 9.92 | | | | $ | 9.47 | |
| Total Return (%)* | | | | 4.75 | | | | | (0.32 | ) |
| Ratios to average daily net assets (%):** | | | | | | | | | | |
| Expenses, net of waivers and reimbursements | | | | 1.10 | | | | | 1.10 | |
| Expenses, before waivers and reimbursements | | | | 1.19 | | | | | 1.26 | |
| Net investment income (loss), net of waivers and reimbursements | | | | 1.23 | | | | | (0.91 | ) |
| Net investment income (loss), before waivers and reimbursements | | | | 1.14 | | | | | (1.07 | ) |
| Net assets at end of year (in thousands) | | | $ | 71,671 | | | | $ | 16,022 | |
| Portfolio turnover rate (%)* | | | | 27 | | | | | 73 | |
| (a) | For the period from December 9, 2012 (Commencement of Operations) to December 31, 2012. |
| (b) | Excludes $0.00 and $0.00 of PFIC mark to market which is treated as ordinary income for Federal tax purposes for the periods 2013 and 2012 respectively. |
| * | Rates not annualized for periods that are less than a year. |
| ** | Rates are annualized for periods that are less than a year. |
| ^ | Amount is less than $0.005 per share. |
Note: Net investment income (loss) per share is based on the average shares outstanding during the year.
Performance cited represents past performance. Past performance does not guarantee future results and current performance may be lower or higher than the data quoted. Results shown are annual returns, which assume reinvestment of dividends and capital gains. Investment returns and principal will fluctuate and you may have a gain or loss when you sell shares. For the most current month-end performance information, please call 1-800-742-7272 or visit our Web site at www.williamblairfunds.com.
| June 30, 2013 | William Blair Funds | 159 |
Financial Highlights
Global Small Cap Growth Fund
| | | Class N | |
| | | (unaudited)
Period Ended
June 30, | |
| | | 2013(a) | |
| Net asset value, beginning of year | | | $ | 10.00 | |
| Income (loss) from investment operations: | | | | | |
| Net investment income (loss) (b) | | | | (0.04 | ) |
| Net realized and unrealized gain (loss) on investments | | | | 0.34 | |
| Total from investment operations | | | | 0.30 | |
| Less distributions from: | | | | | |
| Net investment income | | | | — | |
| Net realized gain | | | | — | |
| Total distributions | | | | — | |
| Net asset value, end of year | | | $ | 10.30 | |
| Total Return (%)* | | | | 3.00 | |
| Ratios to average daily net assets (%):** | | | | | |
| Expenses, net of waivers and reimbursements | | | | 1.65 | |
| Expenses, before waivers and reimbursements | | | | 2.78 | |
| Net investment income (loss), net of waivers and reimbursements | | | | (1.77 | ) |
| Net investment income (loss), before waivers and reimbursements | | | | (2.90 | ) |
| Net assets at end of year (in thousands) | | | $ | 291 | |
| Portfolio turnover rate (%)* | | | | 21 | |
| | | | | | |
|
| | | Class I | |
| | | (unaudited)
Period Ended
June 30, | |
| | | 2013(a) | |
| Net asset value, beginning of year | | | $ | 10.00 | |
| Income (loss) from investment operations: | | | | | |
| Net investment income (loss) (b) | | | | 0.02 | |
| Net realized and unrealized gain (loss) on investments | | | | 0.29 | |
| Total from investment operations | | | | 0.31 | |
| Less distributions from: | | | | | |
| Net investment income | | | | — | |
| Net realized gain. | | | | — | |
| Total distributions | | | | — | |
| Net asset value, end of year | | | $ | 10.31 | |
| Total Return (%)* | | | | 3.10 | |
| Ratios to average daily net assets (%):** | | | | | |
| Expenses, net of waivers and reimbursements | | | | 1.40 | |
| Expenses, before waivers and reimbursements | | | | 2.50 | |
| Net investment income (loss), net of waivers and reimbursements | | | | 0.94 | |
| Net investment income (loss), before waivers and reimbursements | | | | (0.16 | ) |
| Net assets at end of year (in thousands) | | | $ | 11,063 | |
| Portfolio turnover rate (%)* | | | | 21 | |
| (a) | For the period from April 10, 2013 (Commencement of Operations) to June 30, 2013. |
| * | Rates not annualized for periods that are less than a year. |
| ** | Rates are annualized for periods that are less than a year. |
Note: Net investment income (loss) per share is based on the average shares outstanding during the year.
Performance cited represents past performance. Past performance does not guarantee future results and current performance may be lower or higher than the data quoted. Results shown are annual returns, which assume reinvestment of dividends and capital gains. Investment returns and principal will fluctuate and you may have a gain or loss when you sell shares. For the most current month-end performance information, please call 1-800-742-7272 or visit our Web site at www.williamblairfunds.com.
| 160 | Semi-Annual Report | June 30, 2013 |
Financial Highlights
International Growth Fund
| | | Class N | |
| | | (unaudited)
Period Ended
June 30, | | | Years Ended December 31, | |
| | | | 2013 | | | | 2012 | | | | 2011 | | | | 2010 | | | | 2009 | | | | 2008 | |
| Net asset value, beginning of year | | | $ | 22.43 | | | | $ | 18.68 | | | | $ | 21.85 | | | | $ | 18.55 | | | | $ | 13.12 | | | | $ | 29.12 | |
| Income (loss) from investment operations: | | | | | | | | | | | | | | | | | | | | | | | | | | | | | | |
| Net investment income (loss) (a) | | | | 0.24 | | | | | 0.26 | | | | | 0.26 | | | | | 0.14 | | | | | 0.07 | | | | | 0.29 | |
| Net realized and unrealized gain (loss) on investments | | | | 0.20 | | | | | 4.16 | | | | | (3.43 | ) | | | | 3.58 | | | | | 5.47 | | | | | (15.54 | ) |
| Total from investment operations | | | | 0.44 | | | | | 4.42 | | | | | (3.17 | ) | | | | 3.72 | | | | | 5.54 | | | | | (15.25 | ) |
| Less distributions from: | | | | | | | | | | | | | | | | | | | | | | | | | | | | | | |
| Net investment income | | | | — | | | | | 0.67 | | | | | — | | | | | 0.42 | | | | | 0.11 | | | | | — | |
| Net realized gain | | | | — | | | | | — | | | | | — | | | | | — | | | | | — | | | | | 0.75 | |
| Total distributions | | | | — | | | | | 0.67 | | | | | — | | | | | 0.42 | | | | | 0.11 | | | | | 0.75 | |
| Net asset value, end of year | | | $ | 22.87 | | | | $ | 22.43 | | | | $ | 18.68 | | | | $ | 21.85 | | | | $ | 18.55 | | | | $ | 13.12 | |
| Total Return (%)* | | | | 1.96 | | | | | 23.67 | | | | | (14.51 | ) | | | | 20.09 | | | | | 42.27 | | | | | (52.33 | ) |
| Ratios to average daily net assets (%):** | | | | | | | | | | | | | | | | | | | | | | | | | | | | | | |
| Expenses, net of waivers and reimbursements | | | | 1.42 | | | | | 1.44 | | | | | 1.45 | | | | | 1.43 | | | | | 1.45 | | | | | 1.39 | |
| Expenses, before waivers and reimbursements. | | | | 1.42 | | | | | 1.44 | | | | | 1.46 | | | | | 1.43 | | | | | 1.46 | | | | | 1.39 | |
| Net investment income (loss), net of waivers and reimbursements | | | | 2.07 | | | | | 1.25 | | | | | 1.22 | | | | | 0.73 | | | | | 0.48 | | | | | 1.29 | |
| Net investment income (loss), before waivers and reimbursements | | | | 2.07 | | | | | 1.25 | | | | | 1.21 | | | | | 0.73 | | | | | 0.47 | | | | | 1.29 | |
| Net assets at end of year (in thousands) | | | $ | 1,291,137 | | | | $ | 1,269,736 | | | | $ | 1,277,534 | | | | $ | 2,689,417 | | | | $ | 2,539,596 | | | | $ | 1,980,750 | |
| Portfolio turnover rate (%)* | | | | 54 | | | | | 81 | | | | | 103 | | | | | 99 | | | | | 121 | | | | | 91 | |
|
| | | Class I | |
| | | (unaudited)
Period Ended
June 30, | | | | Years Ended December 31, |
| | | | | 2013 | | | | | 2012 | | | | | 2011 | | | | | 2010 | | | | | 2009 | | | | | 2008 | |
| Net asset value, beginning of year | | | $ | 22.94 | | | | $ | 19.10 | | | | $ | 22.34 | | | | $ | 18.95 | | | | $ | 13.40 | | | | $ | 29.61 | |
| Income (loss) from investment operations: | | | | | | | | | | | | | | | | | | | | | | | | | | | | | | |
| Net investment income (loss) (a) | | | | 0.28 | | | | | 0.32 | | | | | 0.30 | | | | | 0.20 | | | | | 0.12 | | | | | 0.37 | |
| Net realized and unrealized gain (loss) on investments | | | | 0.21 | | | | | 4.25 | | | | | (3.48 | ) | | | | 3.67 | | | | | 5.59 | | | | | (15.83 | ) |
| Total from investment operations | | | | 0.49 | | | | | 4.57 | | | | | (3.18 | ) | | | | 3.87 | | | | | 5.71 | | | | | (15.46 | ) |
| Less distributions from: | | | | | | | | | | | | | | | | | | | | | | | | | | | | | | |
| Net investment income | | | | — | | | | | 0.73 | | | | | 0.06 | | | | | 0.48 | | | | | 0.16 | | | | | — | |
| Net realized gain | | | | — | | | | | — | | | | | — | | | | | — | | | | | — | | | | | 0.75 | |
| Total distributions | | | | — | | | | | 0.73 | | | | | 0.06 | | | | | 0.48 | | | | | 0.16 | | | | | 0.75 | |
| Net asset value, end of year | | | $ | 23.43 | | | | $ | 22.94 | | | | $ | 19.10 | | | | $ | 22.34 | | | | $ | 18.95 | | | | $ | 13.40 | |
| Total Return (%)* | | | | 2.14 | | | | | 23.96 | | | | | (14.23 | ) | | | | 20.47 | | | | | 42.63 | | | | | (52.17 | ) |
| Ratios to average daily net assets (%):** | | | | | | | | | | | | | | | | | | | | | | | | | | | | | | |
| Expenses | | | | 1.13 | | | | | 1.15 | | | | | 1.15 | | | | | 1.14 | | | | | 1.17 | | | | | 1.08 | |
| Net investment income (loss) | | | | 2.36 | | | | | 1.51 | | | | | 1.40 | | | | | 0.99 | | | | | 0.74 | | | | | 1.58 | |
| Net assets at end of year (in thousands) | | | $ | 2,548,741 | | | | $ | 2,402,897 | | | | $ | 1,951,368 | | | | $ | 2,392,762 | | | | $ | 1,933,812 | | | | $ | 1,150,188 | |
| Portfolio turnover rate (%)* | | | | 54 | | | | | 81 | | | | | 103 | | | | | 99 | | | | | 121 | | | | | 91 | |
| (a) | Excludes $0.00, $0.10, $0.00, $0.13, $0.08 and $(0.18) of PFIC mark to market, which is treated as ordinary income for Federal tax purposes for the years 2013, 2012, 2011, 2010, 2009 and 2008 respectively. |
| * | Rates not annualized for periods that are less than a year. |
| ** | Rates are annualized for periods that are less than a year. |
Note: Net investment income (loss) per share is based on the average shares outstanding during the year.
Performance cited represents past performance. Past performance does not guarantee future results and current performance may be lower or higher than the data quoted. Results shown are annual returns, which assume reinvestment of dividends and capital gains. Investment returns and principal will fluctuate and you may have a gain or loss when you sell shares. For the most current month-end performance information, please call 1-800-742-7272 or visit our Web site at www.williamblairfunds.com.
| June 30, 2013 | William Blair Funds | 161 |
Financial Highlights
Institutional International Growth Fund
| | | Institutional Class Shares | |
| | | (unaudited)
Period Ended
June, 30 | | | Years Ended December 31, | |
| | | | 2013 | | | | 2012 | | | | 2011 | | �� | | 2010 | | | | 2009 | | | | 2008 | |
| Net asset value, beginning of year | | | $ | 14.89 | | | | $ | 12.39 | | | | $ | 14.37 | | | | $ | 12.20 | | | | $ | 8.66 | | | | $ | 19.20 | |
| Income (loss) from investment operations: | | | | | | | | | | | | | | | | | | | | | | | | | | | | | | |
| Net investment income (loss) (a) | | | | 0.19 | | | | | 0.23 | | | | | 0.21 | | | | | 0.14 | | | | | 0.10 | | | | | 0.25 | |
| Net realized and unrealized gain (loss) on investments | | | | 0.14 | | | | | 2.76 | | | | | (2.17 | ) | | | | 2.31 | | | | | 3.61 | | | | | (10.24 | ) |
| Total from investment operations | | | | 0.33 | | | | | 2.99 | | | | | (1.96 | ) | | | | 2.45 | | | | | 3.71 | | | | | (9.99 | ) |
| Less distributions from: | | | | | | | | | | | | | | | | | | | | | | | | | | | | | | |
| Net investment income | | | | — | | | | | 0.49 | | | | | 0.02 | | | | | 0.28 | | | | | 0.17 | | | | | — | |
| Net realized gain | | | | — | | | | | — | | | | | — | | | | | — | | | | | — | | | | | 0.55 | |
| Total distributions | | | | — | | | | | 0.49 | | | | | 0.02 | | | | | 0.28 | | | | | 0.17 | | | | | 0.55 | |
| Net asset value, end of year | | | $ | 15.22 | | | | $ | 14.89 | | | | $ | 12.39 | | | | $ | 14.37 | | | | $ | 12.20 | | | | $ | 8.66 | |
| Total Return (%)* | | | | 2.22 | | | | | 24.11 | | | | | (13.66 | ) | | | | 20.10 | | | | | 42.83 | | | | | (51.99 | ) |
| Ratios to average daily net assets (%):** | | | | | | | | | | | | | | | | | | | | | | | | | | | | | | |
| Expenses | | | | 0.97 | | | | | 0.98 | | | | | 0.99 | | | | | 0.99 | | | | | 1.01 | | | | | 0.98 | |
| Net investment income (loss) | | | | 2.51 | | | | | 1.64 | | | | | 1.51 | | | | | 1.12 | | | | | 0.95 | | | | | 1.68 | |
| Net assets at end of year (in thousands) | | | $ | 2,076,576 | | | | $ | 1,974,130 | | | | $ | 1,542,594 | | | | $ | 1,886,217 | | | | $ | 1,375,848 | | | | $ | 998,266 | |
| Portfolio turnover rate (%)* | | | | 55 | | | | | 83 | | | | | 111 | | | | | 99 | | | | | 125 | | | | | 86 | |
| (a) | Excludes $0.00, $0.00, $0.09, $0.05, $(0.10), and $0.06 of PFIC mark to market which is treated as ordinary income for Federal tax purposes for the years 2013, 2012, 2011, 2009, and 2008 respectively. |
| * | Rates not annualized for periods that are less than a year. |
| ** | Rates are annualized for periods that are less than a year. |
Note: Net investment income (loss) per share is based on the average shares outstanding during the year.
Performance cited represents past performance. Past performance does not guarantee future results and current performance may be lower or higher than the data quoted. Results shown are annual returns, which assume reinvestment of dividends and capital gains. Investment returns and principal will fluctuate and you may have a gain or loss when you sell shares. For the most current month-end performance information, please call 1-800-742-7272 or visit our Web site at www.williamblairfunds.com.
| 162 | Semi-Annual Report | June 30, 2013 |
Financial Highlights
International Equity Fund
| | | Class N | |
| | | (unaudited)
Period Ended
June 30, | | Years Ended December 31, | |
| | | | | 2013 | | | | 2012 | | | | 2011 | | | | 2010 | | | | 2009 | | | | 2008 | |
| Net asset value, beginning of year | | | $ | 12.05 | | | | $ | 10.56 | | | | $ | 12.12 | | | | $ | 11.07 | | | | $ | 8.35 | | | | $ | 16.53 | |
| Income (loss) from investment operations: | | | | | | | | | | | | | | | | | | | | | | | | | | | | | | |
| Net investment income (loss) (a) | | | | 0.08 | | | | | 0.11 | | | | | 0.13 | | | | | 0.06 | | | | | 0.09 | | | | | 0.10 | |
| Net realized and unrealized gain (loss) on investments | | | | 0.27 | | | | | 1.75 | | | | | (1.69 | ) | | | | 1.15 | | | | | 2.64 | | | | | (8.16 | ) |
| Total from investment operations | | | | 0.35 | | | | | 1.86 | | | | | (1.56 | ) | | | | 1.21 | | | | | 2.73 | | | | | (8.06 | ) |
| Less distributions from: | | | | | | | | | | | | | | | | | | | | | | | | | | | | | | |
| Net investment income | | | | — | | | | | 0.37 | | | | | — | | | | | 0.16 | | | | | 0.01 | | | | | — | |
| Net realized gain | | | | — | | | | | — | | | | | — | | | | | — | | | | | — | | | | | 0.12 | |
| Total distributions | | | | — | | | | | 0.37 | | | | | — | | | | | 0.16 | | | | | 0.01 | | | | | 0.12 | |
| Net asset value, end of year | | | $ | 12.40 | | | | $ | 12.05 | | | | $ | 10.56 | | | | $ | 12.12 | | | | $ | 11.07 | | | | $ | 8.35 | |
| Total Return (%)* | | | | 2.90 | | | | | 17.57 | | | | | (12.87 | ) | | | | 10.92 | | | | | 32.69 | | | | | (48.75 | ) |
| Ratios to average daily net assets (%):** | | | | | | | | | | | | | | | | | | | | | | | | | | | | | | |
| Expenses, net of waivers and reimbursements | | | | 1.45 | | | | | 1.45 | | | | | 1.45 | | | | | 1.45 | | | | | 1.45 | | | | | 1.45 | |
| Expenses, before waivers and reimbursements | | | | 1.69 | | | | | 1.71 | | | | | 1.60 | | | | | 1.66 | | | | | 1.59 | | | | | 1.45 | |
| Net investment income (loss), net of waivers and reimbursements | | | | 1.36 | | | | | 0.95 | | | | | 1.09 | | | | | 0.55 | | | | | 1.03 | | | | | 0.80 | |
| Net investment income (loss), before waivers and reimbursements | | | | 1.12 | | | | | 0.69 | | | | | 0.94 | | | | | 0.34 | | | | | 0.89 | | | | | 0.80 | |
| Net assets at end of year (in thousands) | | | $ | 3,844 | | | | $ | 5,648 | | | | $ | 6,773 | | | | $ | 13,733 | | | | $ | 15,436 | | | | $ | 42,824 | |
| Portfolio turnover rate (%)* | | | | 42 | | | | | 80 | | | | | 99 | | | | | 71 | | | | | 88 | | | | | 92 | |
| | | | | | | | | | | | | | | | | | | | | | | | | | | | | | | |
|
| | | Class I | |
| | | (unaudited)
Period Ended
June 30, | | | Years Ended December 31, | |
| | | | 2013 | | | | 2012 | | | | 2011 | | | | 2010 | | | | 2009 | | | | 2008 | |
| Net asset value, beginning of year | | | $ | 12.18 | | | | $ | 10.67 | | | | $ | 12.22 | | | | $ | 11.16 | | | | $ | 8.44 | | | | $ | 16.66 | |
| Income (loss) from investment operations: | | | | | | | | | | | | | | | | | | | | | | | | | | | | | | |
| Net investment income (loss) (a) | | | | 0.12 | | | | | 0.14 | | | | | 0.17 | | | | | 0.10 | | | | | 0.08 | | | | | 0.15 | |
| Net realized and unrealized gain (loss) on investments | | | | 0.26 | | | | | 1.77 | | | | | (1.72 | ) | | | | 1.15 | | | | | 2.70 | | | | | (8.25 | ) |
| Total from investment operations | | | | 0.38 | | | | | 1.91 | | | | | (1.55 | ) | | | | 1.25 | | | | | 2.78 | | | | | (8.10 | ) |
| Less distributions from: | | | | | | | | | | | | | | | | | | | | | | | | | | | | | | |
| Net investment income | | | | — | | | | | 0.40 | | | | | — | | | | | 0.19 | | | | | 0.06 | | | | | — | |
| Net realized gain | | | | — | | | | | — | | | | | — | | | | | — | | | | | — | | | | | 0.12 | |
| Total distributions | | | | — | | | | | 0.40 | | | | | — | | | | | 0.19 | | | | | 0.06 | | | | | 0.12 | |
| Net asset value, end of year | | | $ | 12.56 | | | | $ | 12.18 | | | | $ | 10.67 | | | | $ | 12.22 | | | | $ | 11.16 | | | | $ | 8.44 | |
| Total Return (%)* | | | | 3.12 | | | | | 17.89 | | | | | (12.68 | ) | | | | 11.19 | | | | | 32.93 | | | | | (48.61 | ) |
| Ratios to average daily net assets (%):** | | | | | | | | | | | | | | | | | | | | | | | | | | | | | | |
| Expenses, net of waivers and reimbursements | | | | 1.20 | | | | | 1.20 | | | | | 1.20 | | | | | 1.20 | | | | | 1.20 | | | | | 1.20 | |
| Expenses, before waivers and reimbursements | | | | 1.41 | | | | | 1.44 | | | | | 1.33 | | | | | 1.28 | | | | | 1.39 | | | | | 1.22 | |
| Net investment income (loss), net of waivers and reimbursements | | | | 1.94 | | | | | 1.17 | | | | | 1.43 | | | | | 0.88 | | | | | 0.86 | | | | | 1.12 | |
| Net investment income (loss), before waivers and reimbursements | | | | 1.73 | | | | | 0.93 | | | | | 1.30 | | | | | 0.80 | | | | | 0.67 | | | | | 1.10 | |
| Net assets at end of year (in thousands) | | | $ | 67,020 | | | | $ | 64,536 | | | | $ | 68,884 | | | | $ | 164,322 | | | | $ | 282,732 | | | | $ | 185,662 | |
| Portfolio turnover rate (%)* | | | | 42 | | | | | 80 | | | | | 99 | | | | | 71 | | | | | 88 | | | | | 92 | |
| (a) | Excludes $0.00, $0.01, $0.00, $0.04, $0.00, and $0.00 of PFIC mark to market which is treated as ordinary income for Federal tax purposes for the years 2013, 2012, 2011, 2010, 2009, and 2008 respectively. |
| * | Rates not annualized for periods that are less than a year. |
| ** | Rates are annualized for periods that are less than a year. |
Note: Net investment income (loss) per share is based on the average shares outstanding during the year.
Performance cited represents past performance. Past performance does not guarantee future results and current performance may be lower or higher than the data quoted. Results shown are annual returns, which assume reinvestment of dividends and capital gains. Investment returns and principal will fluctuate and you may have a gain or loss when you sell shares. For the most current month-end performance information, please call 1-800-742-7272 or visit our Web site at www.williamblairfunds.com.
| June 30, 2013 | William Blair Funds | 163 |
Financial Highlights
Institutional International Equity Fund
| | | Institutional Class Shares | |
| | | (unaudited)
Period Ended
June, 30 | | | Years Ended December 31, | |
| | | | 2013 | | | | 2012 | | | | 2011 | | | | 2010 | | | | 2009 | | | | 2008 | |
| Net asset value, beginning of year | | | $ | 10.82 | | | | $ | 9.27 | | | | $ | 10.78 | | | | $ | 9.84 | | | | $ | 7.44 | | | | $ | 15.03 | |
| Income (loss) from investment operations: | | | | | | | | | | | | | | | | | | | | | | | | | | | | | | |
| Net investment income (loss) (a) | | | | 0.11 | | | | | 0.13 | | | | | 0.16 | | | | | 0.10 | | | | | 0.09 | | | | | 0.15 | |
| Net realized and unrealized gain (loss) on investments | | | | 0.23 | | | | | 1.57 | | | | | (1.47 | ) | | | | 0.99 | | | | | 2.38 | | | | | (7.60 | ) |
| Total from investment operations | | | | 0.34 | | | | | 1.70 | | | | | (1.31 | ) | | | | 1.09 | | | | | 2.47 | | | | | (7.45 | ) |
| Less distributions from: | | | | | | | | | | | | | | | | | | | | | | | | | | | | | | |
| Net investment income | | | | — | | | | | 0.15 | | | | | 0.20 | | | | | 0.15 | | | | | 0.07 | | | | | — | |
| Net realized gain | | | | — | | | | | — | | | | | — | | | | | — | | | | | — | | | | | 0.14 | |
| Total distributions | | | | — | | | | | 0.15 | | | | | 0.20 | | | | | 0.15 | | | | | 0.07 | | | | | 0.14 | |
| Net asset value, end of year | | | $ | 11.16 | | | | $ | 10.82 | | | | $ | 9.27 | | | | $ | 10.78 | | | | $ | 9.84 | | | | $ | 7.44 | |
| Total Return (%)* | | | | 3.14 | | | | | 18.31 | | | | | (12.12 | ) | | | | 11.12 | | | | | 33.27 | | | | | (49.57 | ) |
| Ratios to average daily net assets (%):** | | | | | | | | | | | | | | | | | | | | | | | | | | | | | | |
| Expenses, net of waivers and reimbursements | | | | 1.10 | | | | | 1.10 | | | | | 1.10 | | | | | 1.07 | | | | | 1.09 | | | | | 1.05 | |
| Expenses, before waivers and reimbursements. | | | | 1.15 | | | | | 1.16 | | | | | 1.10 | | | | | 1.07 | | | | | 1.09 | | | | | 1.05 | |
| Net investment income (loss), net of waivers and reimbursements | | | | 1.90 | | | | | 1.28 | | | | | 1.48 | | | | | 0.97 | | | | | 1.04 | | | | | 1.26 | |
| Net investment income (loss), before waivers and reimbursements | | | | 1.85 | | | | | 1.22 | | | | | 1.48 | | | | | 0.97 | | | | | 1.04 | | | | | 1.26 | |
| Net assets at end of year (in thousands) | | | $ | 90,196 | | | | $ | 109,690 | | | | $ | 111,474 | | | | $ | 291,468 | | | | $ | 365,271 | | | | $ | 360,451 | |
| Portfolio turnover rate (%)* | | | | 40 | | | | | 86 | | | | | 91 | | | | | 73 | | | | | 78 | | | | | 91 | |
| (a) | Excludes $0.00, $0.00, $0.04, $0.00, $0.00, and $(0.07) of PFIC mark to market which is treated as ordinary income for Federal tax purposes for the years 2013, 2012, 2011, 2010, 2009, and 2008 respectively. |
| * | Rates not annualized for periods that are less than a year. |
| ** | Rates are annualized for periods that are less than a year. |
Note: Net investment income (loss) per share is based on the average shares outstanding during the year.
Performance cited represents past performance. Past performance does not guarantee future results and current performance may be lower or higher than the data quoted. Results shown are annual returns, which assume reinvestment of dividends and capital gains. Investment returns and principal will fluctuate and you may have a gain or loss when you sell shares. For the most current month-end performance information, please call 1-800-742-7272 or visit our Web site at www.williamblairfunds.com.
| 164 | Semi-Annual Report | June 30, 2013 |
Financial Highlights
International Leaders Fund
| | | | | | | Class N | |
| | | (unaudited)
Period Ended
June 30, | | | Period Ended
December 31, | |
| | | | 2013 | | | 2012(a) | |
| Net asset value, beginning of year | | | $ | 10.81 | | | | $ | 10.00 | |
| Income (loss) from investment operations: | | | | | | | | | | |
| Net investment income (loss) (b) | | | | 0.03 | | | | | 0.00 | ^ |
| Net realized and unrealized gain (loss) on investments | | | | 0.24 | | | | | 0.82 | |
| Total from investment operations | | | | 0.27 | | | | | 0.82 | |
| Less distributions from: | | | | | | | | | | |
| Net investment income | | | | — | | | | | 0.01 | |
| Net realized gain | | | | — | | | | | — | |
| Total distributions | | | | — | | | | | 0.01 | |
| Net asset value, end of year | | | $ | 11.08 | | | | $ | 10.81 | |
| Total Return (%)* | | | | 2.50 | | | | | 8.16 | |
| Ratios to average daily net assets (%):** | | | | | | | | | | |
| Expenses, net of waivers and reimbursements | | | | 1.45 | | | | | 1.45 | |
| Expenses, before waivers and reimbursements | | | | 1.76 | | | | | 4.98 | |
| Net investment income (loss), net of waivers and reimbursements | | | | 0.54 | | | | | — | |
| Net investment income (loss), before waivers and reimbursements | | | | 0.23 | | | | | (3.53 | ) |
| Net assets at end of year (in thousands) | | | $ | 101 | | | | $ | 542 | |
| Portfolio turnover rate (%)* | | | | 36 | | | | | 16 | |
| | | | | | | | | | | |
| | | | | | | | Class I | |
| | | (unaudited) | | | | | | |
| | | Period Ended | | | Period Ended | |
| | | June 30, | | | December 31, | |
| | | | 2013 | | | 2012(a) | |
| Net asset value, beginning of year | | | $ | 10.81 | | | | $ | 10.00 | |
| Income (loss) from investment operations: | | | | | | | | | | |
| Net investment income (loss) (b) | | | | 0.12 | | | | | 0.01 | |
| Net realized and unrealized gain (loss) on investments | | | | 0.17 | | | | | 0.82 | |
| Total from investment operations | | | | 0.29 | | | | | 0.83 | |
| Less distributions from: | | | | | | | | | | |
| Net investment income | | | | — | | | | | 0.02 | |
| Net realized gain | | | | — | | | | | — | |
| Total distributions | | | | — | | | | | 0.02 | |
| Net asset value, end of year | | | $ | 11.10 | | | | $ | 10.81 | |
| Total Return (%)* | | | | 2.68 | | | | | 8.26 | |
| Ratios to average daily net assets (%):** | | | | | | | | | | |
| Expenses, net of waivers and reimbursements | | | | 1.20 | | | | | 1.20 | |
| Expenses, before waivers and reimbursements. | | | | 1.45 | | | | | 4.56 | |
| Net investment income (loss), net of waivers and reimbursements | | | | 2.21 | | | | | 0.22 | |
| Net investment income (loss), before waivers and reimbursements | | | | 1.96 | | | | | (3.14 | ) |
| Net assets at end of year (in thousands) | | | $ | 11,555 | | | | $ | 4,336 | |
| Portfolio turnover rate (%)* | | | | 36 | | | | | 16 | |
| (a) | For the period from August 16, 2012 (Comencement of Operations) to December 31, 2012. |
| (b) | Excludes $0.00 and $0.00 of PFIC mark to market which is treated as ordinary income for Federal tax purposes for the year 2013 and 2012. |
| * | Rates not annualized for periods that are less than a year. |
| ** | Rates are annualized for periods that are less than a year. |
| ^ | Amount is less than $0.005 per share. |
Note: Net investment income (loss) per share is based on the average shares outstanding during the year.
Performance cited represents past performance. Past performance does not guarantee future results and current performance may be lower or higher than the data quoted. Results shown are annual returns, which assume reinvestment of dividends and capital gains. Investment returns and principal will fluctuate and you may have a gain or loss when you sell shares. For the most current month-end performance information, please call 1-800-742-7272 or visit our Web site at www.williamblairfunds.com.
| June 30, 2013 | William Blair Funds | 165 |
Financial Highlights
International Leaders Fund
| | | | | | Institutional
Class Shares | |
| | | (unaudited)
Period Ended
June, 30 | | | Period Ended
December 31, | |
| | | | 2013 | | | 2012(a) | |
| Net asset value, beginning of year | | | $ | 10.80 | | | | $ | 10.24 | |
| Income (loss) from investment operations: | | | | | | | | | | |
| Net investment income (loss) (b) | | | | 0.16 | | | | | 0.00 | ^ |
| Net realized and unrealized gain (loss) on investments | | | | 0.14 | | | | | 0.58 | |
| Total from investment operations | | | | 0.30 | | | | | 0.58 | |
| Less distributions from: | | | | | | | | | | |
| Net investment income | | | | — | | | | | 0.02 | |
| Net realized gain | | | | — | | | | | — | |
| Total distributions | | | | — | | | | | 0.02 | |
| Net asset value, end of year | | | $ | 11.10 | | | | $ | 10.80 | |
| Total Return (%)* | | | | 2.78 | | | | | 5.67 | |
| Ratios to average daily net assets (%):** | | | | | | | | | | |
| Expenses, net of waivers and reimbursements | | | | 1.05 | | | | | 1.05 | |
| Expenses, before waivers and reimbursements. | | | | 1.29 | | | | | 1.84 | |
| Net investment income (loss), net of waivers and reimbursements | | | | 2.78 | | | | | 0.01 | |
| Net investment income (loss), before waivers and reimbursements | | | | 2.54 | | | | | (0.78 | ) |
| Net assets at end of year (in thousands) | | | $ | 50,157 | | | | $ | 5,286 | |
| Portfolio turnover rate (%)* | | | | 36 | | | | | 16 | |
| (a) | For the period from August 16, 2012 (Comencement of Operations) to December 31, 2012. |
| (b) | Excludes $0.00 and $0.00 of PFIC mark to market which is treated as ordinary income for Federal tax purposes for the year 2012 and 2013 respectively. |
| * | Rates not annualized for periods that are less than a year. |
| ** | Rates are annualized for periods that are less than a year. |
| ^ | Amount is less than $0.005 per share. |
Note: Net investment income (loss) per share is based on the average shares outstanding during the year.
Performance cited represents past performance. Past performance does not guarantee future results and current performance may be lower or higher than the data quoted. Results shown are annual returns, which assume reinvestment of dividends and capital gains. Investment returns and principal will fluctuate and you may have a gain or loss when you sell shares. For the most current month-end performance information, please call 1-800-742-7272 or visit our Web site at www.williamblairfunds.com.
| 166 | Semi-Annual Report | June 30, 2013 |
Financial Highlights
International Small Cap Growth Fund
| | | | | | | | | | | | | | Class N | |
| | | (unaudited)
Period Ended
June 30, | | | Years Ended December 31, | |
| | | | 2013 | | | 2012 | | | 2011 | | | 2010 | | | 2009 | | | 2008 | |
| Net asset value, beginning of year | | | $ | 13.46 | | | $ | 11.36 | | | $ | 13.07 | | | $ | 10.40 | | | $ | 6.62 | | | $ | 13.98 | |
| Income (loss) from investment operations: | | | | | | | | | | | | | | | | | | | | | | | | | |
| Net investment income (loss) (a) | | | | 0.09 | | | | 0.08 | | | | 0.07 | | | | 0.03 | | | | (0.01 | ) | | | (0.02 | ) |
| Net realized and unrealized gain (loss) on investments | | | | 0.84 | | | | 2.27 | | | | (1.66 | ) | | | 2.66 | | | | 3.79 | | | | (7.22 | ) |
| Total from investment operations | | | | 0.93 | | | | 2.35 | | | | (1.59 | ) | | | 2.69 | | | | 3.78 | | | | (7.24 | ) |
| Less distributions from: | | | | | | | | | | | | | | | | | | | | | | | | | |
| Net investment income | | | | — | | | | 0.25 | | | | 0.12 | | | | 0.02 | | | | — | | | | — | |
| Net realized gain | | | | — | | | | — | | | | — | | | | — | | | | — | | | | 0.12 | |
| Total distributions | | | | — | | | | 0.25 | | | | 0.12 | | | | 0.02 | | | | — | | | | 0.12 | |
| Net asset value, end of year | | | $ | 14.39 | | | $ | 13.46 | | | $ | 11.36 | | | $ | 13.07 | | | $ | 10.40 | | | $ | 6.62 | |
| Total Return (%)* | | | | 6.91 | | | | 20.73 | | | | (12.16 | ) | | | 25.88 | | | | 57.10 | | | | (51.82 | ) |
| Ratios to average daily net assets (%):** | | | | | | | | | | | | | | | | | | | | | | | | | |
| Expenses, net of waivers and reimbursements | | | | 1.59 | | | | 1.61 | | | | 1.64 | | | | 1.55 | | | | 1.65 | | | | 1.65 | |
| Expenses, before waivers and reimbursements | | | | 1.59 | | | | 1.61 | | | | 1.64 | | | | 1.55 | | | | 1.83 | | | | 1.62 | |
| Net investment income (loss), net of waivers and reimbursements | | | | 1.30 | | | | 0.65 | | | | 0.55 | | | | 0.30 | | | | (0.16 | ) | | | (0.20 | ) |
| Net investment income (loss), before waivers and reimbursements | | | | 1.30 | | | | 0.65 | | | | 0.55 | | | | 0.30 | | | | (0.34 | ) | | | (0.17 | ) |
| Net assets at end of year (in thousands) | | | $ | 15,339 | | | $ | 14,771 | | | $ | 18,991 | | | $ | 21,916 | | | $ | 14,854 | | | $ | 11,363 | |
| Portfolio turnover rate (%)* | | | | 62 | | | | 76 | | | | 85 | | | | 85 | | | | 136 | | | | 78 | |
| | | | | | | | | | | | | | | | | | | | | | | | | | |
| | | | | | | | | | | | | | | | | | | | | | | Class I | |
| | | (unaudited)
Period Ended
June 30, | | | Years Ended December 31, | |
| | | | | 2013 | | | | 2012 | | | | 2011 | | | | 2010 | | | | 2009 | | | | 2008 | |
| Net asset value, beginning of year | | | $ | 13.58 | | | $ | 11.46 | | | $ | 13.19 | | | $ | 10.49 | | | $ | 6.67 | | | $ | 14.01 | |
| Income (loss) from investment operations: | | | | | | | | | | | | | | | | | | | | | | | | | |
| Net investment income (loss) (a) | | | | 0.12 | | | | 0.12 | | | | 0.12 | | | | 0.07 | | | | 0.01 | | | | 0.01 | |
| Net realized and unrealized gain (loss) on investments | | | | 0.84 | | | | 2.30 | | | | (1.69 | ) | | | 2.68 | | | | 3.83 | | | | (7.23 | ) |
| Total from investment operations | | | | 0.96 | | | | 2.42 | | | | (1.57 | ) | | | 2.75 | | | | 3.84 | | | | (7.22 | ) |
| Less distributions from: | | | | | | | | | | | | | | | | | | | | | | | | | |
| Net investment income | | | | — | | | | 0.30 | | | | 0.16 | | | | 0.05 | | | | 0.02 | | | | — | |
| Net realized gain | | | | — | | | | — | | | | — | | | | — | | | | — | | | | 0.12 | |
| Total distributions | | | | — | | | | 0.30 | | | | 0.16 | | | | 0.05 | | | | 0.02 | | | | 0.12 | |
| Net asset value, end of year | | | $ | 14.54 | | | $ | 13.58 | | | $ | 11.46 | | | $ | 13.19 | | | $ | 10.49 | | | $ | 6.67 | |
| Total Return (%)* | | | | 7.07 | | | | 21.10 | | | | (11.84 | ) | | | 26.24 | | | | 57.51 | | | | (51.56 | ) |
| Ratios to average daily net assets (%):** | | | | | | | | | | | | | | | | | | | | | | | | | |
| Expenses, net of waivers and reimbursements | | | | 1.29 | | | | 1.30 | | | | 1.28 | | | | 1.25 | | | | 1.31 | | | | 1.31 | |
| Expenses, before waivers and reimbursements | | | | 1.29 | | | | 1.30 | | | | 1.28 | | | | 1.25 | | | | 1.31 | | | | 1.28 | |
| Net investment income (loss), net of waivers and reimbursements | | | | 1.64 | | | | 0.95 | | | | 0.92 | | | | 0.61 | | | | 0.11 | | | | 0.11 | |
| Net investment income (loss), before waivers and reimbursements | | | | 1.64 | | | | 0.95 | | | | 0.92 | | | | 0.61 | | | | 0.11 | | | | 0.14 | |
| Net assets at end of year (in thousands) | | | $ | 399,781 | | | $ | 359,557 | | | $ | 364,574 | | | $ | 349,679 | | | $ | 210,561 | | | $ | 89,452 | |
| Portfolio turnover rate (%)* | | | | 62 | | | | 76 | | | | 85 | | | | 85 | | | | 136 | | | | 78 | |
| (a) | Excludes $0.00, $0.04, $0.00, $0.15, $0.01 and $(0.02) of PFIC mark to market which is treated as ordinary income for Federal tax purposes for the years 2013, 2012, 2011, 2010, 2009, and 2008 respectively. |
| * | Rates not annualized for periods that are less than a year. |
| ** | Rates are annualized for periods that are less than a year. |
Note: Net investment income (loss) per share is based on the average shares outstanding during the year.
Performance cited represents past performance. Past performance does not guarantee future results and current performance may be lower or higher than the data quoted. Results shown are annual returns, which assume reinvestment of dividends and capital gains. Investment returns and principal will fluctuate and you may have a gain or loss when you sell shares. For the most current month-end performance information, please call 1-800-742-7272 or visit our Web site at www.williamblairfunds.com.
| June 30, 2013 | William Blair Funds | 167 |
Financial Highlights
International Small Cap Growth Fund
| | | Institutional Class Shares | |
| | | (unaudited)
Period Ended
June 30, | | | Years Ended December 31, | |
| | | | 2013 | | | 2012 | | | 2011 | | | 2010 | | | 2009 | | | 2008 | |
| Net asset value, beginning of year | | | $ | 13.64 | | | $ | 11.51 | | | $ | 13.24 | | | $ | 10.53 | | | $ | 6.69 | | | $ | 14.04 | |
| Income (loss) from investment operations: | | | | | | | | | | | | | | | | | | | | | | | | | |
| Net investment income (loss) (a) | | | | 0.13 | | | | 0.15 | | | | 0.14 | | | | 0.09 | | | | 0.04 | | | | 0.03 | |
| Net realized and unrealized gain (loss) on investments | | | | 0.85 | | | | 2.31 | | | | (1.68 | ) | | | 2.69 | | | | 3.83 | | | | (7.26 | ) |
| Total from investment operations | | | | 0.98 | | | | 2.46 | | | | (1.54 | ) | | | 2.78 | | | | 3.87 | | | | (7.23 | ) |
| Less distributions from: | | | | | | | | | | | | | | | | | | | | | | | | | |
| Net investment income | | | | — | | | | 0.33 | | | | 0.19 | | | | 0.07 | | | | 0.03 | | | | — | |
| Net realized gain | | | | — | | | | — | | | | — | | | | — | | | | — | | | | 0.12 | |
| Total distributions | | | | — | | | | 0.33 | | | | 0.19 | | | | 0.07 | | | | 0.03 | | | | 0.12 | |
| Net asset value, end of year | | | $ | 14.62 | | | $ | 13.64 | | | $ | 11.51 | | | $ | 13.24 | | | $ | 10.53 | | | $ | 6.69 | |
| Total Return (%)* | | | | 7.18 | | | | 21.36 | | | | (11.60 | ) | | | 26.40 | | | | 57.84 | | | | (51.53 | ) |
| Ratios to average daily net assets (%):** | | | | | | | | | | | | | | | | | | | | | | | | | |
| Expenses, net of waivers and reimbursements | | | | 1.06 | | | | 1.08 | | | | 1.08 | | | | 1.08 | | | | 1.13 | | | | 1.14 | |
| Expenses, before waivers and reimbursements | | | | 1.06 | | | | 1.08 | | | | 1.08 | | | | 1.08 | | | | 1.13 | | | | 1.11 | |
| Net investment income (loss), net of waivers and reimbursements | | | | 1.84 | | | | 1.14 | | | | 1.10 | | | | 0.77 | | | | 0.48 | | | | 0.28 | |
| Net investment income (loss), before waivers and reimbursements | | | | 1.84 | | | | 1.14 | | | | 1.10 | | | | 0.77 | | | | 0.48 | | | | 0.31 | |
| Net assets at end of year (in thousands) | | | $ | 352,089 | | | $ | 345,180 | | | $ | 334,656 | | | $ | 275,356 | | | $ | 165,436 | | | $ | 191,173 | |
| Portfolio turnover rate (%)* | | | | 62 | | | | 76 | | | | 85 | | | | 85 | | | | 136 | | | | 78 | |
| (a) | Excludes $0.00, $0.04, $0.00, $0.13, $0.01 and $(0.02) of PFIC mark to market which is treated as ordinary income for Federal tax purposes for the years 2013, 2012, 2011, 2010, 2009, and 2008 respectively. |
| * | Rates not annualized for periods that are less than a year. |
| ** | Rates are annualized for periods that are less than a year. |
Note: Net investment income (loss) per share is based on the average shares outstanding during the year.
Performance cited represents past performance. Past performance does not guarantee future results and current performance may be lower or higher than the data quoted. Results shown are annual returns, which assume reinvestment of dividends and capital gains. Investment returns and principal will fluctuate and you may have a gain or loss when you sell shares. For the most current month-end performance information, please call 1-800-742-7272 or visit our Web site at www.williamblairfunds.com.
| 168 | Semi-Annual Report | June 30, 2013 |
Financial Highlights
Emerging Markets Growth Fund
| | | Class N | |
| | | (unaudited)
Period Ended
June 30, | | | Years Ended December 31, | |
| | | | | 2013 | | | | 2012 | | | | 2011 | | | | 2010 | | | | 2009 | | | | 2008 | |
| Net asset value, beginning of year | | | $ | 13.40 | | | $ | 11.16 | | | $ | 15.76 | | | $ | 12.87 | | | $ | 7.46 | | | $ | 21.92 | |
| Income (loss) from investment operations: | | | | | | | | | | | | | | | | | | | | | | | | | |
| Net investment income (loss) (a) | | | | 0.05 | | | | 0.07 | | | | 0.07 | | | | (0.01 | ) | | | 0.00 | ^ | | | 0.11 | |
| Net realized and unrealized gain (loss) on investments | | | | (0.89 | ) | | | 2.24 | | | | (2.84 | ) | | | 3.02 | | | | 5.51 | | | | (13.63 | ) |
| Total from investment operations | | | | (0.84 | ) | | | 2.31 | | | | (2.77 | ) | | | 3.01 | | | | 5.51 | | | | (13.52 | ) |
| Less distributions from: | | | | | | | | | | | | | | | | | | | | | | | | | |
| Net investment income | | | | — | | | | 0.07 | | | | — | | | | 0.12 | | | | 0.10 | | | | — | |
| Net realized gain | | | | — | | | | — | | | | 1.83 | | | | — | | | | — | | | | 0.94 | |
| Total distributions | | | | — | | | | 0.07 | | | | 1.83 | | | | 0.12 | | | | 0.10 | | | | 0.94 | |
| Net asset value, end of year | | | $ | 12.56 | | | $ | 13.40 | | | $ | 11.16 | | | $ | 15.76 | | | $ | 12.87 | | | $ | 7.46 | |
| Total Return (%)* | | | | (6.27 | ) | | | 20.70 | | | | (17.29 | ) | | | 23.44 | | | | 73.85 | | | | (61.71 | ) |
| Ratios to average daily net assets (%):** | | | | | | | | | | | | | | | | | | | | | | | | | |
| Expenses, net of waivers and reimbursements | | | | 1.68 | | | | 1.69 | | | | 1.68 | | | | 1.63 | | | | 1.70 | | | | 1.67 | |
| Expenses, before waivers and reimbursements | | | | 1.68 | | | | 1.69 | | | | 1.68 | | | | 1.63 | | | | 1.81 | | | | 1.65 | |
Net investment income (loss), net of waivers and
reimbursements | | | | 0.81 | | | | 0.59 | | | | 0.48 | | | | (0.05 | ) | | | 0.04 | | | | 0.65 | |
Net investment income (loss), before waivers and
reimbursements | | | | 0.81 | | | | 0.59 | | | | 0.48 | | | | (0.05 | ) | | | (0.07 | ) | | | 0.67 | |
| Net assets at end of year (in thousands) | | | $ | 13,912 | | | $ | 16,724 | | | $ | 17,474 | | | $ | 34,324 | | | $ | 27,271 | | | $ | 16,486 | |
| Portfolio turnover rate (%)* | | | | 62 | | | | 90 | | | | 104 | | | | 121 | | | | 113 | | | | 118 | |
| | | Class I | |
| | | (unaudited)
Period Ended
June 30, | | | Years Ended December 31, | |
| | | | 2013 | | | 2012 | | | 2011 | | | 2010 | | | 2009 | | | 2008 | |
| Net asset value, beginning of year | | | $ | 13.50 | | | $ | 11.25 | | | $ | 15.87 | | | $ | 12.95 | | | $ | 7.51 | | | $ | 21.99 | |
| Income (loss) from investment operations: | | | | | | | | | | | | | | | | | | | | | | | | | |
| Net investment income (loss) (a) | | | | 0.08 | | | | 0.11 | | | | 0.11 | | | | 0.04 | | | | 0.03 | | | | 0.15 | |
| Net realized and unrealized gain (loss) on investments | | | | (0.90 | ) | | | 2.25 | | | | (2.85 | ) | | | 3.03 | | | | 5.54 | | | | (13.69 | ) |
| Total from investment operations | | | | (0.82 | ) | | | 2.36 | | | | (2.74 | ) | | | 3.07 | | | | 5.57 | | | | (13.54 | ) |
| Less distributions from: | | | | | | | | | | | | | | | | | | | | | | | | | |
| Net investment income | | | | — | | | | 0.11 | | | | 0.05 | | | | 0.15 | | | | 0.13 | | | | — | |
| Net realized gain | | | | — | | | | — | | | | 1.83 | | | | — | | | | — | | | | 0.94 | |
| Total distributions | | | | — | | | | 0.11 | | | | 1.88 | | | | 0.15 | | | | 0.13 | | | | 0.94 | |
| Net asset value, end of year | | | $ | 12.68 | | | $ | 13.50 | | | $ | 11.25 | | | $ | 15.87 | | | $ | 12.95 | | | $ | 7.51 | |
| Total Return (%)* | | | | (6.07 | ) | | | 21.01 | | | | (17.00 | ) | | | 23.77 | | | | 74.18 | | | | (61.60 | ) |
| Ratios to average daily net assets (%):** | | | | | | | | | | | | | | | | | | | | | | | | | |
| Expenses, net of waivers and reimbursements | | | | 1.40 | | | | 1.41 | | | | 1.38 | | | | 1.36 | | | | 1.41 | | | | 1.41 | |
| Expenses, before waivers and reimbursements | | | | 1.40 | | | | 1.41 | | | | 1.38 | | | | 1.36 | | | | 1.41 | | | | 1.39 | |
| Net investment income (loss), net of waivers and reimbursements | | | | 1.12 | | | | 0.86 | | | | 0.77 | | | | 0.26 | | | | 0.31 | | | | 0.91 | |
| Net investment income (loss), before waivers and reimbursements | | | | 1.12 | | | | 0.86 | | | | 0.77 | | | | 0.26 | | | | 0.31 | | | | 0.93 | |
| Net assets at end of year (in thousands) | | | $ | 143,033 | | | $ | 144,942 | | | $ | 124,739 | | | $ | 194,763 | | | $ | 180,329 | | | $ | 69,363 | |
| Portfolio turnover rate (%)* | | | | 62 | | | | 90 | | | | 104 | | | | 121 | | | | 113 | | | | 118 | |
| (a) | Excludes $0.00, $0.00, $0.01, $0.11, $0.15 and $(0.09) of PFIC mark to market which is treated as ordinary income for Federal tax purposes for the years 2013, 2012, 2011, 2010, 2009, and 2008 respectively. |
| * | Rates not annualized for periods that are less than a year. |
| ** | Rates are annualized for periods that are less than a year. |
| ^ | Amount is less than $0.005 per share. |
Note: Net investment income (loss) per share is based on the average shares outstanding during the year.
Performance cited represents past performance. Past performance does not guarantee future results and current performance may be lower or higher than the data quoted. Results shown are annual returns, which assume reinvestment of dividends and capital gains. Investment returns and principal will fluctuate and you may have a gain or loss when you sell shares. For the most current month-end performance information, please call 1-800-742-7272 or visit our Web site at www.williamblairfunds.com.
| June 30, 2013 | William Blair Funds | 169 |
Financial Highlights
Emerging Markets Growth Fund
| | | Institutional Class Shares | |
| | | (unaudited)
Period Ended
June 30, | | | Years Ended December 31, | |
| | | | 2013 | | | 2012 | | | 2011 | | | 2010 | | | 2009 | | | 2008 | |
| Net asset value, beginning of year | | | $ | 13.59 | | | $ | 11.32 | | | $ | 15.96 | $ | | | 13.03 | | | $ | 7.56 | | | $ | 22.07 | |
| Income (loss) from investment operations: | | | | | | | | | | | | | | | | | | | | | | | | | |
| Net investment income (loss) (a) | | | | 0.09 | | | | 0.14 | | | | 0.14 | | | | 0.06 | | | | 0.06 | | | | 0.17 | |
| Net realized and unrealized gain (loss) on investments | | | | (0.91 | ) | | | 2.27 | | | | (2.87 | ) | | | 3.05 | | | | 5.55 | | | | (13.74 | ) |
| Total from investment operations | | | | (0.82 | ) | | | 2.41 | | | | (2.73 | ) | | | 3.11 | | | | 5.61 | | | | (13.57 | ) |
| Less distributions from: | | | | | | | | | | | | | | | | | | | | | | | | | |
| Net investment income | | | | — | | | | 0.14 | | | | 0.08 | | | | 0.18 | | | | 0.14 | | | | — | |
| Net realized gain | | | | — | | | | — | | | | 1.83 | | | | — | | | | — | | | | 0.94 | |
| Total distributions | | | | — | | | | 0.14 | | | | 1.91 | | | | 0.18 | | | | 0.14 | | | | 0.94 | |
| Net asset value, end of year | | | $ | 12.77 | | | $ | 13.59 | | | $ | 11.32 | $ | | | 15.96 | | | $ | 13.03 | | | $ | 7.56 | |
| Total Return (%)* | | | | (6.03 | ) | | | 21.28 | | | | (16.82 | ) | | | 23.91 | | | | 74.33 | | | | (61.51 | ) |
| Ratios to average daily net assets (%):** | | | | | | | | | | | | | | | | | | | | | | | | | |
| Expenses, net of waivers and reimbursements | | | | 1.19 | | | | 1.20 | | | | 1.19 | | | | 1.17 | | | | 1.22 | | | | 1.22 | |
| Expenses, before waivers and reimbursements | | | | 1.19 | | | | 1.20 | | | | 1.19 | | | | 1.17 | | | | 1.22 | | | | 1.20 | |
| Net investment income (loss), net of waivers and reimbursements | | | | 1.35 | | | | 1.12 | | | | 0.93 | | | | 0.43 | | | | 0.54 | | | | 1.08 | |
| Net investment income (loss), before waivers and reimbursements | | | | 1.35 | | | | 1.12 | | | | 0.93 | | | | 0.43 | | | | 0.54 | | | | 1.10 | |
| Net assets at end of year (in thousands) | | | $ | 733,936 | | | $ | 802,571 | | | $ | 675,633 | | | $ | 1,021,456 | | | $ | 830,660 | | | $ | 299,739 | |
| Portfolio turnover rate (%)* | | | | 62 | | | | 90 | | | | 104 | | | | 121 | | | | 113 | | | | 118 | |
| (a) | Excludes $0.00, $0.00, $0.01, $0.11, $0.15 and $(0.09) of PFIC mark to market which is treated as ordinary income for Federal tax purposes for the years 2013, 2012, 2011, 2010, 2009, and 2008respectively. |
| * | Rates not annualized for periods that are less than a year. |
| ** | Rates are annualized for periods that are less than a year. |
Note: Net investment income (loss) per share is based on the average shares outstanding during the year.
Performance cited represents past performance. Past performance does not guarantee future results and current performance may be lower or higher than the data quoted. Results shown are annual returns, which assume reinvestment of dividends and capital gains. Investment returns and principal will fluctuate and you may have a gain or loss when you sell shares. For the most current month-end performance information, please call 1-800-742-7272 or visit our Web site at www.williamblairfunds.com.
| 170 | Semi-Annual Report | June 30, 2013 |
Financial Highlights
Emerging Markets Leaders Fund
| | | Class N | |
| | | (unaudited)
Period Ended
June 30, | | | Periods Ended
December 31, | |
| | | | 2013 | | | 2012 | | | 2011 | | | 2010(a) | |
| Net asset value, beginning of year | | | $ | 9.20 | | | $ | 7.68 | | | $ | 10.34 | | | $ | 8.80 | |
| Income (loss) from investment operations: | | | | | | | | | | | | | | | | | |
| Net investment income (loss) (c) | | | | 0.04 | | | | 0.02 | | | | 0.04 | | | | (0.02 | ) |
| Net realized and unrealized gain (loss) on investments | | | | (0.74 | ) | | | 1.54 | | | | (2.08 | ) | | | 1.64 | |
| Total from investment operations | | | | (0.70 | ) | | | 1.56 | | | | (2.04 | ) | | | 1.62 | |
| Less distributions from: | | | | | | | | | | | | | | | | | |
| Net investment income | | | | — | | | | 0.04 | | | | — | | | | 0.02 | |
| Net realized gain | | | | — | | | | — | | | | 0.62 | | | | 0.06 | |
| Total distributions | | | | — | | | | 0.04 | | | | 0.62 | | | | 0.08 | |
| Net asset value, end of year | | | $ | 8.50 | | | $ | 9.20 | | | $ | 7.68 | | | $ | 10.34 | |
| Total Return (%)* | | | | (7.50 | ) | | | 20.37 | | | | (19.55 | ) | | | 18.43 | |
| Ratios to average daily net assets (%):** | | | | | | | | | | | | | | | | | |
| Expenses, net of waivers and reimbursements | | | | 1.65 | | | | 1.65 | | | | 1.65 | | | | 1.65 | |
| Expenses, before waivers and reimbursements | | | | 2.01 | | | | 2.10 | | | | 1.83 | | | | 1.71 | |
| Net investment income (loss), net of waivers and reimbursements | | | | 0.83 | | | | 0.26 | | | | 0.44 | | | | (0.38 | ) |
| Net investment income (loss), before waivers and reimbursements | | | | 0.47 | | | | (0.19 | ) | | | 0.26 | | | | (0.44 | ) |
| Net assets at end of year (in thousands) | | | $ | 199 | | | $ | 249 | | | $ | 46 | | | $ | 53 | |
| Portfolio turnover rate (%)* | | | | 66 | | | | 94 | | | | 142 | | | | 176 | |
| | | Class I | |
| | | (unaudited)
Period Ended
June 30, | | | Periods Ended December 31, | |
| | | | 2013 | | | 2012 | | | 2011 | | | 2010 | | | 2009 | | | 2008(b) | |
| Net asset value, beginning of year | | | $ | 9.18 | | | $ | 7.66 | | | $ | 10.35 | | | $ | 8.43 | | | $ | 4.79 | | | $ | 10.00 | |
| Income (loss) from investment operations: | | | | | | | | | | | | | | | | | | | | | | | | | |
| Net investment income (loss) (c) | | | | 0.05 | | | | 0.07 | | | | 0.06 | | | | 0.02 | | | | 0.02 | | | | 0.04 | |
| Net realized and unrealized gain (loss) on investments | | | | (0.73 | ) | | | 1.51 | | | | (2.08 | ) | | | 1.98 | | | | 3.73 | | | | (5.25 | ) |
| Total from investment operations | | | | (0.68 | ) | | | 1.58 | | | | (2.02 | ) | | | 2.00 | | | | 3.75 | | | | (5.21 | ) |
| Less distributions from: | | | | | | | | | | | | | | | | | | | | | | | | | |
| Net investment income | | | | — | | | | 0.06 | | | | 0.05 | | | | 0.02 | | | | 0.11 | | | | 0.00 | ^ |
| Net realized gain | | | | — | | | | — | | | | 0.62 | | | | 0.06 | | | | — | | | | — | |
| Return of capital | | | | — | | | | — | | | | 0.00 | ^ | | | — | | | | — | | | | — | |
| Total distributions | | | | — | | | | 0.06 | | | | 0.67 | | | | 0.08 | | | | 0.11 | | | | 0.00 | ^ |
| Net asset value, end of year | | | $ | 8.50 | | | $ | 9.18 | | | $ | 7.66 | | | $ | 10.35 | | | $ | 8.43 | | | $ | 4.79 | |
| Total Return (%)* | | | | (7.41 | ) | | | 20.64 | | | | (19.34 | ) | | | 23.70 | | | | 78.38 | | | | (52.09 | ) |
| Ratios to average daily net assets (%):** | | | | | | | | | | | | | | | | | | | | | | | | | |
| Expenses, net of waivers and reimbursements | | | | 1.40 | | | | 1.40 | | | | 1.40 | | | | 1.40 | | | | 1.40 | | | | 1.40 | |
| Expenses, before waivers and reimbursements | | | | 1.60 | | | | 1.75 | | | | 1.58 | | | | 1.52 | | | | 1.54 | | | | 1.56 | |
| Net investment income (loss), net of waivers and reimbursements | | | | 1.13 | | | | 0.83 | | | | 0.69 | | | | 0.25 | | | | 0.37 | | | | 0.70 | |
| Net investment income (loss), before waivers and reimbursements | | | | 0.93 | | | | 0.48 | | | | 0.51 | | | | 0.13 | | | | 0.23 | | | | 0.54 | |
| Net assets at end of year (in thousands) | | | $ | 31,061 | | | $ | 25,628 | | | $ | 21,610 | | | $ | 16,332 | | | $ | 8,823 | | | $ | 2,914 | |
| Portfolio turnover rate (%)* | | | | 66 | | | | 94 | | | | 142 | | | | 176 | | | | 176 | | | | 151 | |
| (a) | For the period from May 3, 2010 (Commencement of Operations) to Decmeber 31, 2010. |
| (b) | For the period from March 26, 2008 (Commencement of Operations) to December 31, 2008. |
| (c) | Excludes $0.00, $0.00, $0.00, $0.96, $1.29, and $0.00 of PFIC mark to market which is treated as ordinary income for Federal tax purposes for the years 2013, 2012, 2011, 2010, 2009, and 2008 respectively. |
| * | Rates not annualized for periods that are less than a year. |
| ** | Rates are annualized for periods that are less than a year. |
| ^ | Amount is less than $0.005 per share. |
Note: Net investment income (loss) per share is based on the average shares outstanding during the year.
Performance cited represents past performance. Past performance does not guarantee future results and current performance may be lower or higher than the data quoted. Results shown are annual returns, which assume reinvestment of dividends and capital gains. Investment returns and principal will fluctuate and you may have a gain or loss when you sell shares. For the most current month-end performance information, please call 1-800-742-7272 or visit our Web site at www.williamblairfunds.com.
| June 30, 2013 | William Blair Funds | 171 |
Financial Highlights
Emerging Markets Leaders Fund
| | | Institutional Class Shares | |
| | | (unaudited)
Period Ended
June 30, | | | Periods Ended December 31, | |
| | | | 2013 | | | 2012 | | | 2011 | | | 2010 | | | 2009 | | | 2008(a) | |
| Net asset value, beginning of year | | | $ | 9.18 | | | $ | 7.65 | | | $ | 10.35 | | | $ | 8.43 | | | $ | 4.78 | | | $ | 10.00 | |
| Income (loss) from investment operations: | | | | | | | | | | | | | | | | | | | | | | | | | |
| Net investment income (loss) (b) | | | | 0.06 | | | | 0.08 | | | | 0.09 | | | | 0.04 | | | | 0.04 | | | | 0.04 | |
| Net realized and unrealized gain (loss) on investments | | | | (0.73 | ) | | | 1.52 | | | | (2.10 | ) | | | 1.97 | | | | 3.73 | | | | (5.26 | ) |
| Total from investment operations | | | | (0.67 | ) | | | 1.60 | | | | (2.01 | ) | | | 2.01 | | | | 3.77 | | | | (5.22 | ) |
| Less distributions from: | | | | | | | | | | | | | | | | | | | | | | | | | |
| Net investment income | | | | — | | | | 0.07 | | | | 0.06 | | | | 0.03 | | | | 0.12 | | | | 0.00 | ^ |
| Net realized gain | | | | — | | | | — | | | | 0.63 | | | | 0.06 | | | | — | | | | — | |
| Return of capital | | | | — | | | | — | | | | 0.00 | ^ | | | — | | | | — | | | | — | |
| Total distributions | | | | — | | | | 0.07 | | | | 0.69 | | | | 0.09 | | | | 0.12 | | | | 0.00 | ^ |
| Net asset value, end of year | | | $ | 8.51 | | | $ | 9.18 | | | $ | 7.65 | | | $ | 10.35 | | | $ | 8.43 | | | $ | 4.78 | |
| Total Return (%)* | | | | (7.41 | ) | | | 20.97 | | | | (19.30 | ) | | | 23.84 | | | | 78.93 | | | | (52.11 | ) |
| Ratios to average daily net assets (%):** | | | | | | | | | | | | | | | | | | | | | | | | | |
| Expenses, net of waivers and reimbursements | | | | 1.25 | | | | 1.25 | | | | 1.25 | | | | 1.26 | | | | 1.25 | | | | 1.25 | |
| Expenses, before waivers and reimbursements | | | | 1.45 | | | | 1.59 | | | | 1.41 | | | | 1.35 | | | | 1.36 | | | | 1.41 | |
| Net investment income (loss), net of waivers and reimbursements | | | | 1.24 | | | | 0.90 | | | | 0.90 | | | | 0.50 | | | | 0.58 | | | | 0.70 | |
| Net investment income (loss), before waivers and reimbursements | | | | 1.04 | | | | 0.56 | | | | 0.74 | | | | 0.41 | | | | 0.47 | | | | 0.54 | |
| Net assets at end of year (in thousands) | | | $ | 29,910 | | | $ | 43,102 | | | $ | 26,166 | | | $ | 78,516 | | | $ | 106,313 | | | $ | 43,762 | |
| Portfolio turnover rate (%)* | | | | 66 | | | | 94 | | | | 142 | | | | 176 | | | | 176 | | | | 151 | |
| (a) | For the period from March 26, 2008 (Commencement of Operations) to Decmeber 31, 2008. |
| (b) | Excludes $0.00, $0.00, $0.00, $0.96, $1.29, and $0.00 of PFIC mark to market which is treated as ordinary income for Federal tax purposes for the years 2013, 2012, 2011, 2010, 2009, and 2008 respectively. |
| * | Rates not annualized for periods that are less than a year. |
| ** | Rates are annualized for periods that are less than a year. |
| ^ | Amount is less than $0.005 per share. |
Note: Net investment income (loss) per share is based on the average shares outstanding during the year.
Performance cited represents past performance. Past performance does not guarantee future results and current performance may be lower or higher than the data quoted. Results shown are annual returns, which assume reinvestment of dividends and capital gains. Investment returns and principal will fluctuate and you may have a gain or loss when you sell shares. For the most current month-end performance information, please call 1-800-742-7272 or visit our Web site at www.williamblairfunds.com.
| 172 | Semi-Annual Report | June 30, 2013 |
Financial Highlights
Emerging Markets Small Cap Growth Fund
| | | Class N | |
| | | (unaudited)
Period Ended
June 30, | | | Periods Ended
December 31, | |
| | | | 2013 | | | 2012 | | | 2011(a) | |
| Net asset value, beginning of year | | | $ | 12.99 | | | $ | 9.73 | | | $ | 10.00 | |
| Income (loss) from investment operations: | | | | | | | | | | | | | |
| Net investment income (loss)(b) | | | | 0.06 | | | | 0.06 | | | | 0.00 | ^ |
| Net realized and unrealized gain (loss) on investments | | | | 0.79 | | | | 3.27 | | | | (0.27 | ) |
| Total from investment operations | | | | 0.85 | | | | 3.33 | | | | (0.27 | ) |
| Less distributions from: | | | | | | | | | | | | | |
| Net investment income | | | | — | | | | 0.07 | | | | — | |
| Net realized gain | | | | — | | | | — | | | | — | |
| Total distributions | | | | — | | | | 0.07 | | | | — | |
| Net asset value, end of year | | | $ | 13.84 | | | $ | 12.99 | | | $ | 9.73 | |
| Total Return (%)* | | | | 6.54 | | | | 34.23 | | | | (2.70 | ) |
| Ratios to average daily net assets (%):** | | | | | | | | | | | | | |
| Expenses, net of waivers and reimbursements | | | | 1.65 | | | | 1.65 | | | | 1.65 | |
| Expenses, before waivers and reimbursements | | | | 2.07 | | | | 4.76 | | | | 9.53 | |
| Net investment income (loss), net of waivers and reimbursements | | | | 0.76 | | | | 0.56 | | | | 0.08 | |
| Net investment income (loss), before waivers and reimbursements | | | | 0.34 | | | | (2.54 | ) | | | (7.80 | ) |
| Net assets at end of year (in thousands) | | | $ | 10,194 | | | $ | 3,016 | | | $ | 1,012 | |
| Portfolio turnover rate (%)* | | | | 69 | | | | 78 | | | | 17 | |
| | | Class I | |
| | | (unaudited)
Period Ended
June 30, | | | Periods Ended
December 31, | |
| | | | 2013 | | | 2012 | | | 2011(a) | |
| Net asset value, beginning of year | | | $ | 12.99 | | | $ | 9.73 | | | $ | 10.00 | |
| Income (loss) from investment operations: | | | | | | | | | | | | | |
| Net investment income (loss)(b) | | | | 0.07 | | | | 0.08 | | | | 0.01 | |
| Net realized and unrealized gain (loss) on investments | | | | 0.79 | | | | 3.29 | | | | (0.28 | ) |
| Total from investment operations | | | | 0.86 | | | | 3.37 | | | | (0.27 | ) |
| Less distributions from: | | | | | | | | | | | | | |
| Net investment income | | | | — | | | | 0.11 | | | | — | |
| Net realized gain | | | | — | | | | — | | | | — | |
| Total distributions | | | | — | | | | 0.11 | | | | — | |
| Net asset value, end of year | | | $ | 13.85 | | | $ | 12.99 | | | $ | 9.73 | |
| Total Return (%)* | | | | 6.62 | | | | 34.62 | | | | (2.70 | ) |
| Ratios to average daily net assets (%):** | | | | | | | | | | | | | |
| Expenses, net of waivers and reimbursements | | | | 1.40 | | | | 1.40 | | | | 1.40 | |
| Expenses, before waivers and reimbursements | | | | 1.80 | | | | 4.40 | | | | 9.28 | |
| Net investment income (loss), net of waivers and reimbursements | | | | 1.01 | | | | 0.70 | | | | 0.33 | |
| Net investment income (loss), before waivers and reimbursements | | | | 0.61 | | | | (2.30 | ) | | | (7.55 | ) |
| Net assets at end of year (in thousands) | | | $ | 32,301 | | | $ | 8,763 | | | $ | 2,260 | |
| Portfolio turnover rate (%)* | | | | 69 | | | | 78 | | | | 17 | |
| (a) | For the period from October 24, 2011 (Comencement of Operations) to December 31, 2011. |
| (b) | Excludes $0.00, $0.05 and $0.00 of PFIC mark to market which is treated as ordinary income for Federal tax purposes for the years 2013, 2012, and 2011 respectively. |
| * | Rates not annualized for periods that are less than a year. |
| ** | Rates are annualized for periods that are less than a year. |
| ^ | Amount is less than $0.005 per share. |
Note: Net investment income (loss) per share is based on the average shares outstanding during the year.
Performance cited represents past performance. Past performance does not guarantee future results and current performance may be lower or higher than the data quoted. Results shown are annual returns, which assume reinvestment of dividends and capital gains. Investment returns and principal will fluctuate and you may have a gain or loss when you sell shares. For the most current month-end performance information, please call 1-800-742-7272 or visit our Web site at www.williamblairfunds.com.
| June 30, 2013 | William Blair Funds | 173 |
Financial Highlights
Emerging Markets Small Cap Growth Fund
| | | Institutional Class Shares | |
| | | (unaudited)
Period Ended
June 30, | | | Period Ended
December 31, | |
| | | | | 2013 | | | | 2012(a) | |
| Net asset value, beginning of year | | | $ | 13.00 | | | | $ | 12.79 | |
| Income (loss) from investment operations: | | | | | | | | | | |
| Net investment income (loss)(b) | | | | 0.09 | | | | | 0.00 | ^ |
| Net realized and unrealized gain (loss) on investments | | | | 0.77 | | | | | 0.21 | |
| Total from investment operations | | | | 0.86 | | | | | 0.21 | |
| Less distributions from: | | | | | | | | | | |
| Net investment income | | | | — | | | | | — | |
| Net realized gain | | | | — | | | | | — | |
| Total distributions | | | | — | | | | | — | |
| Net asset value, end of year | | | $ | 13.86 | | | | $ | 13.00 | |
| Total Return (%)* | | | | 6.62 | | | | | 1.64 | |
| Ratios to average daily net assets (%):** | | | | | | | | | | |
| Expenses, net of waivers and reimbursements | | | | 1.25 | | | | | 1.25 | |
| Expenses, before waivers and reimbursements | | | | 1.64 | | | | | 2.32 | |
| Net investment income (loss), net of waivers and reimbursements | | | | 1.21 | | | | | (0.87 | ) |
| Net investment income (loss), before waivers and reimbursements | | | | 0.82 | | | | | (1.93 | ) |
| Net assets at end of year (in thousands) | | | $ | 39,484 | | | | $ | 15,242 | |
| Portfolio turnover rate (%)* | | | | 69 | | | | | 78 | |
| | | | | | | | | | | |
| (a) | For the period from December 20, 2012 (Comencement of Operations) to December 31, 2012. |
| (b) | Excludes $0.00 and $0.00 of PFIC mark to market which is treated as ordinary income for Federal tax purposes for the years 2013 and 2012 respectively. |
| * | Rates not annualized for periods that are less than a year. |
| ** | Rates are annualized for periods that are less than a year. |
Note: Net investment income (loss) per share is based on the average shares outstanding during the year.
Performance cited represents past performance. Past performance does not guarantee future results and current performance may be lower or higher than the data quoted. Results shown are annual returns, which assume reinvestment of dividends and capital gains. Investment returns and principal will fluctuate and you may have a gain or loss when you sell shares. For the most current month-end performance information, please call 1-800-742-7272 or visit our Web site at www.williamblairfunds.com.
| 174 | Semi-Annual Report | June 30, 2013 |
Financial Highlights
Large Cap Value Fund
| | | Class N | |
| | | (unaudited)
Period Ended
June 30, | | | Periods Ended
December 31, | |
| | | | | 2013 | | | | | 2012 | | | 2011(a) | |
| Net asset value, beginning of year | | | $ | 11.54 | | | | $ | 9.95 | | | $ | 10.00 | |
| Income (loss) from investment operations: | | | | | | | | | | | | | | |
| Net investment income (loss) | | | | 0.05 | | | | | 0.11 | | | | 0.03 | |
| Net realized and unrealized gain (loss) on investments | | | | 1.69 | | | | | 1.57 | | | | (0.05 | ) |
| Total from investment operations | | | | 1.74 | | | | | 1.68 | | | | (0.02 | ) |
| Less distributions from: | | | | | | | | | | | | | | |
| Net investment income | | | | — | | | | | 0.09 | | | | 0.03 | |
| Net realized gain | | | | — | | | | | — | | | | 0.00 | ^ |
| Total distributions | | | | — | | | | | 0.09 | | | | 0.03 | |
| Net asset value, end of year | | | $ | 13.28 | | | | $ | 11.54 | | | $ | 9.95 | |
| Total Return (%)* | | | | 15.08 | | | | | 16.92 | | | | (0.19 | ) |
| Ratios to average daily net assets (%):** | | | | | | | | | | | | | | |
| Expenses, net of waivers and reimbursements | | | | 1.20 | | | | | 1.20 | | | | 1.20 | |
| Expenses, before waivers and reimbursements | | | | 4.01 | | | | | 4.25 | | | | 7.83 | |
| Net investment income (loss), net of waivers and reimbursements | | | | 0.76 | | | | | 0.96 | | | | 1.41 | |
| Net investment income (loss), before waivers and reimbursements | | | | (2.05 | ) | | | | (2.09 | ) | | | (5.22 | ) |
| Net assets at end of year (in thousands) | | | $ | 1,236 | | | | $ | 1,416 | | | $ | 998 | |
| Portfolio turnover rate (%)* | | | | 67 | | | | | 20 | | | | 5 | |
| | | Class I | |
| | | (unaudited)
Period Ended
June 30, | | | Periods Ended
December 31, | |
| | | | | 2013 | | | | | 2012 | | | 2011(a) | |
| Net asset value, beginning of year | | | $ | 11.55 | | | | $ | 9.95 | | | $ | 10.00 | |
| Income (loss) from investment operations: | | | | | | | | | | | | | | |
| Net investment income (loss) | | | | 0.07 | | | | | 0.14 | | | | 0.03 | |
| Net realized and unrealized gain (loss) on investments | | | | 1.68 | | | | | 1.58 | | | | (0.05 | ) |
| Total from investment operations | | | | 1.75 | | | | | 1.72 | | | | (0.02 | ) |
| Less distributions from: | | | | | | | | | | | | | | |
| Net investment income | | | | — | | | | | 0.12 | | | | 0.03 | |
| Net realized gain | | | | — | | | | | — | | | | 0.00 | ^ |
| Total distributions | | | | — | | | | | 0.12 | | | | 0.03 | |
| Net asset value, end of year | | | $ | 13.30 | | | | $ | 11.55 | | | $ | 9.95 | |
| Total Return (%)* | | | | 15.15 | | | | | 17.28 | | | | (0.19 | ) |
| Ratios to average daily net assets (%):** | | | | | | | | | | | | | | |
| Expenses, net of waivers and reimbursements | | | | 0.95 | | | | | 0.95 | | | | 0.95 | |
| Expenses, before waivers and reimbursements | | | | 3.74 | | | | | 4.06 | | | | 7.58 | |
| Net investment income (loss), net of waivers and reimbursements | | | | 1.03 | | | | | 1.22 | | | | 1.66 | |
| Net investment income (loss), before waivers and reimbursements | | | | (1.76 | ) | | | | (1.89 | ) | | | (4.97 | ) |
| Net assets at end of year (in thousands) | | | $ | 2,654 | | | | $ | 2,429 | | | $ | 1,455 | |
| Portfolio turnover rate (%)* | | | | 67 | | | | | 20 | | | | 5 | |
| (a) | For the period from October 24, 2011 (Comencement of Operations) to December 31, 2011. |
| * | Rates not annualized for periods that are less than a year. |
| ** | Rates are annualized for periods that are less than a year. |
| ^ | Amount is less than $0.005 per share. |
Note: Net investment income (loss) per share is based on the average shares outstanding during the year.
Performance cited represents past performance. Past performance does not guarantee future results and current performance may be lower or higher than the data quoted. Results shown are annual returns, which assume reinvestment of dividends and capital gains. Investment returns and principal will fluctuate and you may have a gain or loss when you sell shares. For the most current month-end performance information, please call 1-800-742-7272 or visit our Web site at www.williamblairfunds.com.
| June 30, 2013 | William Blair Funds | 175 |
Financial Highlights
Mid Cap Value Fund
| | | Class N | |
| | | (unaudited)
Period Ended
June 30, | | | Periods Ended
December 31, | |
| | | | | 2013 | | | | | 2012 | | | | 2011 | | | 2010(a) | |
| Net asset value, beginning of year | | | $ | 11.39 | | | | $ | 10.48 | | | $ | 10.75 | | | $ | 10.00 | |
| Income (loss) from investment operations: | | | | | | | | | | | | | | | | | | |
| Net investment income (loss) | | | | 0.04 | | | | | 0.08 | | | | 0.12 | | | | 0.09 | |
| Net realized and unrealized gain (loss) on investments | | | | 1.70 | | | | | 1.34 | | | | (0.17 | ) | | | 0.74 | |
| Total from investment operations | | | | 1.74 | | | | | 1.42 | | | | (0.05 | ) | | | 0.83 | |
| Less distributions from: | | | | | | | | | | | | | | | | | | |
| Net investment income | | | | — | | | | | 0.08 | | | | 0.09 | | | | 0.06 | |
| Net realized gain | | | | — | | | | | 0.43 | | | | 0.13 | | | | 0.02 | |
| Total distributions | | | | — | | | | | 0.51 | | | | 0.22 | | | | 0.08 | |
| Net asset value, end of year | | | $ | 13.13 | | | | $ | 11.39 | | | $ | 10.48 | | | $ | 10.75 | |
| Total Return (%)* | | | | 15.28 | | | | | 13.54 | | | | (0.34 | ) | | | 8.36 | |
| Ratios to average daily net assets (%):** | | | | | | | | | | | | | | | | | | |
| Expenses, net of waivers and reimbursements | | | | 1.35 | | | | | 1.35 | | | | 1.35 | | | | 1.35 | |
| Expenses, before waivers and reimbursements | | | | 3.53 | | | | | 3.40 | | | | 3.85 | | | | 5.09 | |
| Net investment income (loss), net of waivers and reimbursements | | | | 0.64 | | | | | 0.70 | | | | 1.15 | | | | 0.92 | |
| Net investment income (loss), before waivers and reimbursements | | | | (1.54 | ) | | | | (1.35 | ) | | | (1.35 | ) | | | (2.82 | ) |
| Net assets at end of year (in thousands) | | | $ | 179 | | | | $ | 79 | | | $ | 58 | | | $ | 4 | |
| Portfolio turnover rate (%)* | | | | 24 | | | | | 63 | | | | 69 | | | | 35 | |
| | | Class I | |
| | | (unaudited)
Period Ended
June 30, | | | Periods Ended
December 31, | |
| | | | | 2013 | | | | | 2012 | | | | 2011 | | | 2010(a) | |
| Net asset value, beginning of year | | | $ | 11.39 | | | | $ | 10.48 | | | $ | 10.76 | | | $ | 10.00 | |
| Income (loss) from investment operations: | | | | | | | | | | | | | | | | | | |
| Net investment income (loss) | | | | 0.05 | | | | | 0.10 | | | | 0.13 | | | | 0.11 | |
| Net realized and unrealized gain (loss) on investments | | | | 1.71 | | | | | 1.35 | | | | (0.17 | ) | | | 0.75 | |
| Total from investment operations | | | | 1.76 | | | | | 1.45 | | | | (0.04 | ) | | | 0.86 | |
| Less distributions from: | | | | | | | | | | | | | | | | | | |
| Net investment income | | | | — | | | | | 0.11 | | | | 0.11 | | | | 0.08 | |
| Net realized gain | | | | — | | | | | 0.43 | | | | 0.13 | | | | 0.02 | |
| Total distributions | | | | — | | | | | 0.54 | | | | 0.24 | | | | 0.10 | |
| Net asset value, end of year | | | $ | 13.15 | | | | $ | 11.39 | | | $ | 10.48 | | | $ | 10.76 | |
| Total Return (%)* | | | | 15.45 | | | | | 13.77 | | | | (0.25 | ) | | | 8.66 | |
| Ratios to average daily net assets (%):** | | | | | | | | | | | | | | | | | | |
| Expenses, net of waivers and reimbursements | | | | 1.10 | | | | | 1.10 | | | | 1.10 | | | | 1.10 | |
| Expenses, before waivers and reimbursements | | | | 3.24 | | | | | 3.13 | | | | 3.60 | | | | 4.92 | |
| Net investment income (loss), net of waivers and reimbursements | | | | 0.82 | | | | | 0.92 | | | | 1.20 | | | | 1.10 | |
| Net investment income (loss), before waivers and reimbursements | | | | (1.32 | ) | | | | (1.11 | ) | | | (1.30 | ) | | | (2.72 | ) |
| Net assets at end of year (in thousands) | | | $ | 3,978 | | | | $ | 4,058 | | | $ | 4,515 | | | $ | 3,389 | |
| Portfolio turnover rate (%)* | | | | 24 | | | | | 63 | | | | 69 | | | | 35 | |
| (a) | For the period from May 3, 2010 (Commencement of Operations) to December 31, 2010. |
| * | Rates not annualized for periods that are less than a year. |
| ** | Rates are annualized for periods that are less than a year. |
Note: Net investment income (loss) per share is based on the average shares outstanding during the year.
Performance cited represents past performance. Past performance does not guarantee future results and current performance may be lower or higher than the data quoted. Results shown are annual returns, which assume reinvestment of dividends and capital gains. Investment returns and principal will fluctuate and you may have a gain or loss when you sell shares. For the most current month-end performance information, please call 1-800-742-7272 or visit our Web site at www.williamblairfunds.com.
| 176 | Semi-Annual Report | June 30, 2013 |
Financial Highlights
Small-Mid Cap Value Fund
| | | Class N | |
| | | (unaudited)
Period Ended
June 30, | | | Periods Ended
December 31, | |
| | | | | 2013 | | | | | 2012 | | | 2011(a) | |
| Net asset value, beginning of year | | | $ | 11.29 | | | | $ | 10.45 | | | $ | 10.00 | |
| Income (loss) from investment operations: | | | | | | | | | | | | | | |
| Net investment income (loss) | | | | 0.01 | | | | | 0.10 | | | | 0.00 | ^ |
| Net realized and unrealized gain (loss) on investments | | | | 1.88 | | | | | 1.15 | | | | 0.45 | |
| Total from investment operations | | | | 1.89 | | | | | 1.25 | | | | 0.45 | |
| Less distributions from: | | | | | | | | | | | | | | |
| Net investment income | | | | — | | | | | 0.09 | | | | — | |
| Net realized gain | | | | — | | | | | 0.32 | | | | — | |
| Total distributions | | | | — | | | | | 0.41 | | | | — | |
| Net asset value, end of year | | | $ | 13.18 | | | | $ | 11.29 | | | $ | 10.45 | |
| Total Return (%)* | | | | 16.74 | | | | | 11.95 | | | | 4.50 | |
| Ratios to average daily net assets (%):** | | | | | | | | | | | | | | |
| Expenses, net of waivers and reimbursements | | | | 1.40 | | | | | 1.40 | | | | 1.40 | |
| Expenses, before waivers and reimbursements | | | | 5.09 | | | | | 6.34 | | | | 18.68 | |
| Net investment income (loss), net of waivers and reimbursements | | | | 0.17 | | | | | 0.87 | | | | 0.53 | |
| Net investment income (loss), before waivers and reimbursements | | | | (3.52 | ) | | | | (4.07 | ) | | | (16.75 | ) |
| Net assets at end of year (in thousands) | | | $ | 1,034 | | | | $ | 950 | | | $ | 860 | |
| Portfolio turnover rate (%)* | | | | 35 | | | | | 56 | | | | 1 | |
| | | Class I | |
| | | (unaudited)
Period Ended
June 30, | | | Periods Ended
December 31, | |
| | | | | 2013 | | | | | 2012 | | | 2011(a) | |
| Net asset value, beginning of year | | | $ | 11.29 | | | | $ | 10.45 | | | $ | 10.00 | |
| Income (loss) from investment operations: | | | | | | | | | | | | | | |
| Net investment income (loss) | | | | 0.03 | | | | | 0.13 | | | | 0.00 | ^ |
| Net realized and unrealized gain (loss) on investments | | | | 1.88 | | | | | 1.15 | | | | 0.45 | |
| Total from investment operations | | | | 1.91 | | | | | 1.28 | | | | 0.45 | |
| Less distributions from: | | | | | | | | | | | | | | |
| Net investment income | | | | — | | | | | 0.12 | | | | — | |
| Net realized gain | | | | — | | | | | 0.32 | | | | — | |
| Total distributions | | | | — | | | | | 0.44 | | | | — | |
| Net asset value, end of year | | | $ | 13.20 | | | | $ | 11.29 | | | $ | 10.45 | |
| Total Return (%)* | | | | 16.92 | | | | | 12.22 | | | | 4.50 | |
| Ratios to average daily net assets (%):** | | | | | | | | | | | | | | |
| Expenses, net of waivers and reimbursements | | | | 1.15 | | | | | 1.15 | | | | 1.15 | |
| Expenses, before waivers and reimbursements | | | | 4.82 | | | | | 5.88 | | | | 18.43 | |
| Net investment income (loss), net of waivers and reimbursements | | | | 0.42 | | | | | 1.12 | | | | 0.79 | |
| Net investment income (loss), before waivers and reimbursements | | | | (3.25 | ) | | | | (3.61 | ) | | | (16.49 | ) |
| Net assets at end of year (in thousands) | | | $ | 1,779 | | | | $ | 1,442 | | | $ | 1,296 | |
| Portfolio turnover rate (%)* | | | | 35 | | | | | 56 | | | | 1 | |
| (a) | For the period from December 15, 2011 (Comencement of Operations) to December 31, 2011. |
| * | Rates not annualized for periods that are less than a year. |
| ** | Rates are annualized for periods that are less than a year. |
| ^ | Amount is less than $0.005 per share. |
Note: Net investment income (loss) per share is based on the average shares outstanding during the year.
Performance cited represents past performance. Past performance does not guarantee future results and current performance may be lower or higher than the data quoted. Results shown are annual returns, which assume reinvestment of dividends and capital gains. Investment returns and principal will fluctuate and you may have a gain or loss when you sell shares. For the most current month-end performance information, please call 1-800-742-7272 or visit our Web site at www.williamblairfunds.com.
| June 30, 2013 | William Blair Funds | 177 |
Financial Highlights
Small Cap Value Fund
| | | Class N | |
| | | (unaudited)
Period Ended
June 30, | | | Years Ended December 31, | |
| | | | 2013 | | | 2012 | | | 2011 | | | 2010 | | | 2009 | | | 2008 | |
| Net asset value, beginning of year | | | $ | 13.65 | | | | $ | 12.26 | | | $ | 13.71 | | | $ | 10.49 | | | $ | 8.33 | | | $ | 11.31 | |
| Income (loss) from investment operations: | | | | | | | | | | | | | | | | | | | | | | | | | | |
| Net investment income (loss) | | | | (0.01 | ) | | | | 0.10 | | | | 0.00 | ^ | | | 0.03 | | | | 0.06 | | | | 0.09 | |
| Net realized and unrealized gain (loss) on investments | | | | 2.41 | | | | | 1.43 | | | | (0.97 | ) | | | 3.22 | | | | 2.13 | | | | (3.02 | ) |
| Total from investment operations | | | | 2.40 | | | | | 1.53 | | | | (0.97 | ) | | | 3.25 | | | | 2.19 | | | | (2.93 | ) |
| Less distributions from: | | | | | | | | | | | | | | | | | | | | | | | | | | |
| Net investment income | | | | — | | | | | 0.08 | | | | 0.02 | | | | 0.03 | | | | 0.03 | | | | 0.05 | |
| Net realized gain | | | | — | | | | | 0.06 | | | | 0.46 | | | | — | | | | — | | | | — | |
| Return of capital | | | | — | | | | | — | | | | 0.00 | ^ | | | — | | | | — | | | | — | |
| Total distributions | | | | — | | | | | 0.14 | | | | 0.48 | | | | 0.03 | | | | 0.03 | | | | 0.05 | |
| Net asset value, end of year | | | $ | 16.05 | | | | $ | 13.65 | | | $ | 12.26 | | | $ | 13.71 | | | $ | 10.49 | | | $ | 8.33 | |
| Total Return (%)* | | | | 17.58 | | | | | 12.49 | | | | (6.95 | ) | | | 30.94 | | | | 26.24 | | | | (25.85 | ) |
| Ratios to average daily net assets (%):** | | | | | | | | | | | | | | | | | | | | | | | | | | |
| Expenses, net of waivers and reimbursements | | | | 1.47 | | | | | 1.43 | | | | 1.38 | | | | 1.33 | | | | 1.29 | | | | 1.29 | |
| Expenses, before waivers and reimbursements | | | | 1.56 | | | | | 1.60 | | | | 1.60 | | | | 1.57 | | | | 1.78 | | | | 1.82 | |
| Net investment income (loss), net of waivers and reimbursements | | | | (0.19 | ) | | | | 0.78 | | | | (0.01 | ) | | | 0.25 | | | | 0.68 | | | | 0.84 | |
| Net investment income (loss), before waivers and reimbursements | | | | (0.28 | ) | | | | 0.61 | | | | (0.23 | ) | | | 0.01 | | | | 0.19 | | | | 0.31 | |
| Net assets at end of year (in thousands) | | | $ | 41,272 | | | | $ | 39,084 | | | $ | 40,712 | | | $ | 34,285 | | | $ | 7,745 | | | $ | 7,061 | |
| Portfolio turnover rate (%)* | | | | 33 | | | | | 51 | | | | 65 | | | | 71 | | | | 62 | | | | 87 | |
| | | Class I | |
| | | (unaudited)
Period Ended
June 30, | | | Years Ended December 31, | |
| | | 2013 | | | 2012 | | | 2011 | | | 2010 | | | 2009 | | | 2008 | |
| Net asset value, beginning of year | | | $ | 13.88 | | | | $ | 12.47 | | | $ | 13.93 | | | $ | 10.65 | | | $ | 8.45 | | | $ | 11.50 | |
| Income (loss) from investment operations: | | | | | | | | | | | | | | | | | | | | | | | | | | |
| Net investment income (loss) | | | | 0.01 | | | | | 0.14 | | | | 0.03 | | | | 0.05 | | | | 0.08 | | | | 0.11 | |
| Net realized and unrealized gain (loss) on investments | | | | 2.46 | | | | | 1.45 | | | | (0.98 | ) | | | 3.27 | | | | 2.16 | | | | (3.08 | ) |
| Total from investment operations | | | | 2.47 | | | | | 1.59 | | | | (0.95 | ) | | | 3.32 | | | | 2.24 | | | | (2.97 | ) |
| Less distributions from: | | | | | | | | | | | | | | | | | | | | | | | | | | |
| Net investment income | | | | — | | | | | 0.12 | | | | 0.03 | | | | 0.04 | | | | 0.04 | | | | 0.08 | |
| Net realized gain | | | | — | | | | | 0.06 | | | | 0.46 | | | | — | | | | — | | | | — | |
| Return of capital | | | | — | | | | | — | | | | 0.02 | | | | — | | | | — | | | | — | |
| Total distributions | | | | — | | | | | 0.18 | | | | 0.51 | | | | 0.04 | | | | 0.04 | | | | 0.08 | |
| Net asset value, end of year | | | $ | 16.35 | | | | $ | 13.88 | | | $ | 12.47 | | | $ | 13.93 | | | $ | 10.65 | | | $ | 8.45 | |
| Total Return (%)* | | | | 17.80 | | | | | 12.73 | | | | (6.68 | ) | | | 31.16 | | | | 26.56 | | | | (25.77 | ) |
| Ratios to average daily net assets (%):** | | | | | | | | | | | | | | | | | | | | | | | | | | |
| Expenses, net of waivers and reimbursements | | | | 1.22 | | | | | 1.18 | | | | 1.14 | | | | 1.10 | | | | 1.09 | | | | 1.09 | |
| Expenses, before waivers and reimbursements | | | | 1.25 | | | | | 1.29 | | | | 1.30 | | | | 1.29 | | | | 1.50 | | | | 1.57 | |
| Net investment income (loss), net of waivers and reimbursements | | | | 0.07 | | | | | 1.02 | | | | 0.26 | | | | 0.43 | | | | 0.86 | | | | 1.06 | |
| Net investment income (loss), before waivers and reimbursements | | | | 0.04 | | | | | 0.91 | | | | 0.10 | | | | 0.24 | | | | 0.45 | | | | 0.58 | |
| Net assets at end of year (in thousands) | | | $ | 267,595 | | | | $ | 196,184 | | | $ | 190,686 | | | $ | 130,214 | | | $ | 47,114 | | | $ | 29,188 | |
| Portfolio turnover rate (%)* | | | | 33 | | | | | 51 | | | | 65 | | | | 71 | | | | 62 | | | | 87 | |
| * | Rates not annualized for periods that are less than a year. |
| ** | Rates are annualized for periods that are less than a year. |
| ^ | Amount is less than $0.005 per share. |
Note: Net investment income (loss) per share is based on the average shares outstanding during the year.
Performance cited represents past performance. Past performance does not guarantee future results and current performance may be lower or higher than the data quoted. Results shown are annual returns, which assume reinvestment of dividends and capital gains. Investment returns and principal will fluctuate and you may have a gain or loss when you sell shares. For the most current month-end performance information, please call 1-800-742-7272 or visit our Web site at www.williamblairfunds.com.
| 178 | Semi-Annual Report | June 30, 2013 |
Financial Highlights
Bond Fund
| | | Class N | |
| | | (unaudited)
Period Ended
June 30, | | | Years Ended December 31, | |
| | | 2013 | | | 2012 | | | 2011 | | | 2010 | | | 2009 | | | 2008 | |
| Net asset value, beginning of year | | | $ | 11.28 | | | | $ | 10.91 | | | $ | 10.70 | | | $ | 10.40 | | | $ | 9.82 | | | $ | 10.07 | |
| Income (loss) from investment operations: | | | | | | | | | | | | | | | | | | | | | | | | | | |
| Net investment income (loss) | | | | 0.16 | | | | | 0.36 | | | | 0.43 | | | | 0.46 | | | | 0.48 | | | | 0.47 | |
| Net realized and unrealized gain (loss) on investments | | | | (0.53 | ) | | | | 0.53 | | | | 0.34 | | | | 0.35 | | | | 0.59 | | | | (0.31 | ) |
| Total from investment operations | | | | (0.37 | ) | | | | 0.89 | | | | 0.77 | | | | 0.81 | | | | 1.07 | | | | 0.16 | |
| Less distributions from: | | | | | | | | | | | | | | | | | | | | | | | | | | |
| Net investment income | | | | 0.21 | | | | | 0.45 | | | | 0.47 | | | | 0.48 | | | | 0.49 | | | | 0.41 | |
| Net realized gain | | | | — | | | | | 0.07 | | | | 0.09 | | | | 0.03 | | | | — | | | | — | |
| Total distributions | | | | 0.21 | | | | | 0.52 | | | | 0.56 | | | | 0.51 | | | | 0.49 | | | | 0.41 | |
| Net asset value, end of year | | | $ | 10.70 | | | | $ | 11.28 | | | $ | 10.91 | | | $ | 10.70 | | | $ | 10.40 | | | $ | 9.82 | |
| Total Return (%)* | | | | (3.37 | ) | | | | 8.33 | | | | 7.41 | | | | 7.86 | | | | 11.11 | | | | 1.64 | |
| Ratios to average daily net assets (%):** | | | | | | | | | | | | | | | | | | | | | | | | | | |
| Expenses, net of waivers and reimbursements | | | | 0.65 | | | | | 0.65 | | | | 0.65 | | | | 0.65 | | | | 0.65 | | | | 0.65 | |
| Expenses, before waivers and reimbursements | | | | 0.79 | | | | | 0.81 | | | | 0.76 | | | | 0.70 | | | | 1.40 | | | | 2.47 | |
| Net investment income (loss), net of waivers and reimbursements | | | | 2.88 | | | | | 3.25 | | | | 3.97 | | | | 4.25 | | | | 4.76 | | | | 4.69 | |
| Net investment income (loss), before waivers and reimbursements | | | | 2.74 | | | | | 3.09 | | | | 3.86 | | | | 4.20 | | | | 4.01 | | | | 2.87 | |
| Net assets at end of year (in thousands) | | | $ | 21,558 | | | | $ | 32,867 | | | $ | 8,345 | | | $ | 4,479 | | | $ | 3,580 | | | $ | 407 | |
| Portfolio turnover rate (%)* | | | | 29 | | | | | 25 | | | | 28 | | | | 25 | | | | 29 | | | | 52 | |
| | | Class I | |
| | | (unaudited)
Period Ended
June 30, | | | Years Ended December 31, | |
| | | 2013 | | | 2012 | | | 2011 | | | 2010 | | | 2009 | | | 2008 | |
| Net asset value, beginning of year | | | $ | 11.17 | | | | $ | 10.80 | | | $ | 10.59 | | | $ | 10.31 | | | $ | 9.72 | | | $ | 10.04 | |
| Income (loss) from investment operations: | | | | | | | | | | | | | | | | | | | | | | | | | | |
| Net investment income (loss) | | | | 0.17 | | | | | 0.38 | | | | 0.45 | | | | 0.47 | | | | 0.49 | | | | 0.48 | |
| Net realized and unrealized gain (loss) on investments | | | | (0.52 | ) | | | | 0.52 | | | | 0.33 | | | | 0.33 | | | | 0.59 | | | | (0.31 | ) |
| Total from investment operations | | | | (0.35 | ) | | | | 0.90 | | | | 0.78 | | | | 0.80 | | | | 1.08 | | | | 0.17 | |
| Less distributions from: | | | | | | | | | | | | | | | | | | | | | | | | | | |
| Net investment income | | | | 0.22 | | | | | 0.46 | | | | 0.48 | | | | 0.49 | | | | 0.49 | | | | 0.49 | |
| Net realized gain | | | | — | | | | | 0.07 | | | | 0.09 | | | | 0.03 | | | | — | | | | — | |
| Total distributions | | | | 0.22 | | | | | 0.53 | | | | 0.57 | | | | 0.52 | | | | 0.49 | | | | 0.49 | |
| Net asset value, end of year | | | $ | 10.60 | | | | $ | 11.17 | | | $ | 10.80 | | | $ | 10.59 | | | $ | 10.31 | | | $ | 9.72 | |
| Total Return (%)* | | | | (3.26 | ) | | | | 8.54 | | | | 7.62 | | | | 7.89 | | | | 11.40 | | | | 1.72 | |
| Ratios to average daily net assets (%):** | | | | | | | | | | | | | | | | | | | | | | | | | | |
| Expenses, net of waivers and reimbursements | | | | 0.50 | | | | | 0.50 | | | | 0.50 | | | | 0.50 | | | | 0.50 | | | | 0.50 | |
| Expenses, before waivers and reimbursements | | | | 0.56 | | | | | 0.56 | | | | 0.55 | | | | 0.55 | | | | 0.58 | | | | 0.71 | |
| Net investment income (loss), net of waivers and reimbursements | | | | 3.03 | | | | | 3.45 | | | | 4.17 | | | | 4.41 | | | | 4.92 | | | | 4.90 | |
| Net investment income (loss), before waivers and reimbursements | | | | 2.97 | | | | | 3.39 | | | | 4.12 | | | | 4.36 | | | | 4.84 | | | | 4.69 | |
| Net assets at end of year (in thousands) | | | $ | 160,098 | | | | $ | 172,836 | | | $ | 154,224 | | | $ | 147,807 | | | $ | 127,538 | | | $ | 63,763 | |
| Portfolio turnover rate (%)* | | | | 29 | | | | | 25 | | | | 28 | | | | 25 | | | | 29 | | | | 52 | |
| * | Rates not annualized for periods that are less than a year. |
| ** | Rates are annualized for periods that are less than a year. |
Note: Net investment income (loss) per share is based on the average shares outstanding during the year.
Performance cited represents past performance. Past performance does not guarantee future results and current performance may be lower or higher than the data quoted. Results shown are annual returns, which assume reinvestment of dividends and capital gains. Investment returns and principal will fluctuate and you may have a gain or loss when you sell shares. For the most current month-end performance information, please call 1-800-742-7272 or visit our Web site at www.williamblairfunds.com.
| June 30, 2013 | William Blair Funds | 179 |
Financial Highlights
Bond Fund
| | | Institutional Class Shares | |
| | | (unaudited)
Period Ended
June 30, | | | Years Ended December 31, | |
| | | 2013 | | | 2012 | | | 2011 | | | 2010 | | | 2009 | | | 2008 | |
| Net asset value, beginning of year | | | $ | 11.16 | | | | $ | 10.80 | | | $ | 10.58 | | | $ | 10.30 | | | $ | 9.72 | | | $ | 10.00 | |
| Income (loss) from investment operations: | | | | | | | | | | | | | | | | | | | | | | | | | | |
| Net investment income (loss) | | | | 0.17 | | | | | 0.40 | | | | 0.45 | | | | 0.48 | | | | 0.51 | | | | 0.50 | |
| Net realized and unrealized gain (loss) on investments | | | | (0.51 | ) | | | | 0.51 | | | | 0.36 | | | | 0.34 | | | | 0.58 | | | | (0.31 | ) |
| Total from investment operations | | | | (0.34 | ) | | | | 0.91 | | | | 0.81 | | | | 0.82 | | | | 1.09 | | | | 0.19 | |
| Less distributions from: | | | | | | | | | | | | | | | | | | | | | | | | | | |
| Net investment income | | | | 0.23 | | | | | 0.48 | | | | 0.50 | | | | 0.51 | | | | 0.51 | | | | 0.47 | |
| Net realized gain | | | | — | | | | | 0.07 | | | | 0.09 | | | | 0.03 | | | | — | | | | — | |
| Total distributions | | | | 0.23 | | | | | 0.55 | | | | 0.59 | | | | 0.54 | | | | 0.51 | | | | 0.47 | |
| Net asset value, end of year | | | $ | 10.59 | | | | $ | 11.16 | | | $ | 10.80 | | | $ | 10.58 | | | $ | 10.30 | | | $ | 9.72 | |
| Total Return (%)* | | | | (3.19 | ) | | | | 8.61 | | | | 7.88 | | | | 8.06 | | | | 11.47 | | | | 1.95 | |
| Ratios to average daily net assets (%):** | | | | | | | | | | | | | | | | | | | | | | | | | | |
| Expenses, net of waivers and reimbursements | | | | 0.35 | | | | | 0.35 | | | | 0.35 | | | | 0.35 | | | | 0.34 | | | | 0.35 | |
| Expenses, before waivers and reimbursements | | | | 0.38 | | | | | 0.38 | | | | 0.39 | | | | 0.40 | | | | 0.43 | | | | 0.56 | |
| Net investment income (loss), net of waivers and reimbursements | | | | 3.18 | | | | | 3.60 | | | | 4.24 | | | | 4.54 | | | | 5.07 | | | | 5.04 | |
| Net investment income (loss), before waivers and reimbursements | | | | 3.15 | | | | | 3.57 | | | | 4.20 | | | | 4.49 | | | | 4.98 | | | | 4.83 | |
| Net assets at end of year (in thousands) | | | $ | 79,676 | | | | $ | 91,039 | | | $ | 69,447 | | | $ | 40,490 | | | $ | 16,226 | | | $ | 10,443 | |
| Portfolio turnover rate (%)* | | | | 29 | | | | | 25 | | | | 28 | | | | 25 | | | | 29 | | | | 52 | |
| * | Rates not annualized for periods that are less than a year. |
| ** | Rates are annualized for periods that are less than a year. |
Note: Net investment income (loss) per share is based on the average shares outstanding during the year.
Performance cited represents past performance. Past performance does not guarantee future results and current performance may be lower or higher than the data quoted. Results shown are annual returns, which assume reinvestment of dividends and capital gains. Investment returns and principal will fluctuate and you may have a gain or loss when you sell shares. For the most current month-end performance information, please call 1-800-742-7272 or visit our Web site at www.williamblairfunds.com.
| 180 | Semi-Annual Report | June 30, 2013 |
Financial Highlights
Income Fund
| | | Class N | |
| | | (unaudited)
Period Ended
June 30, | | | Years Ended December 31, | |
| | | 2013 | | | 2012 | | | 2011 | | | 2010 | | | 2009 | | | 2008 | |
| Net asset value, beginning of year | | | $ | 9.55 | | | | $ | 9.32 | | | $ | 9.22 | | | $ | 9.07 | | | $ | 8.69 | | | $ | 9.29 | |
| Income (loss) from investment operations: | | | | | | | | | | | | | | | | | | | | | | | | | | |
| Net investment income (loss) | | | | 0.10 | | | | | 0.24 | | | | 0.32 | | | | 0.35 | | | | 0.40 | | | | 0.37 | |
| Net realized and unrealized gain (loss) on investments | | | | (0.33 | ) | | | | 0.31 | | | | 0.15 | | | | 0.19 | | | | 0.44 | | | | (0.59 | ) |
| Total from investment operations | | | | (0.23 | ) | | | | 0.55 | | | | 0.47 | | | | 0.54 | | | | 0.84 | | | | (0.22 | ) |
| Less distributions from: | | | | | | | | | | | | | | | | | | | | | | | | | | |
| Net investment income | | | | 0.14 | | | | | 0.32 | | | | 0.37 | | | | 0.39 | | | | 0.46 | | | | 0.38 | |
| Net realized gain | | | | — | | | | | — | | | | — | | | | — | | | | — | | | | — | |
| Total distributions | | | | 0.14 | | | | | 0.32 | | | | 0.37 | | | | 0.39 | | | | 0.46 | | | | 0.38 | |
| Net asset value, end of year | | | $ | 9.18 | | | | $ | 9.55 | | | $ | 9.32 | | | $ | 9.22 | | | $ | 9.07 | | | $ | 8.69 | |
| Total Return (%)* | | | | (2.45 | ) | | | | 6.00 | | | | 5.21 | | | | 6.04 | | | | 9.88 | | | | (2.46 | ) |
| Ratios to average daily net assets (%):** | | | | | | | | | | | | | | | | | | | | | | | | | | |
| Expenses, net of waivers and reimbursements | | | | 0.82 | | | | | 0.83 | | | | 0.85 | | | | 0.85 | | | | 0.85 | | | | 0.90 | |
| Expenses, before waivers and reimbursements | | | | 0.82 | | | | | 0.83 | | | | 0.91 | | | | 0.85 | | | | 0.93 | | | | 0.93 | |
| Net investment income (loss), net of waivers and reimbursements | | | | 2.06 | | | | | 2.49 | | | | 3.40 | | | | 3.79 | | | | 4.48 | | | | 4.38 | |
| Net investment income (loss), before waivers and reimbursements | | | | 2.06 | | | | | 2.49 | | | | 3.34 | | | | 3.79 | | | | 4.41 | | | | 4.35 | |
| Net assets at end of year (in thousands) | | | $ | 59,339 | | | | $ | 68,947 | | | $ | 44,802 | | | $ | 35,755 | | | $ | 37,567 | | | $ | 47,009 | |
| Portfolio turnover rate (%)* | | | | 28 | | | | | 33 | | | | 39 | | | | 29 | | | | 40 | | | | 38 | |
| | | Class I | |
| | | (unaudited)
Period Ended
June 30, | | | Years Ended December 31, | |
| | | 2013 | | | 2012 | | | 2011 | | | 2010 | | | 2009 | | | 2008 | |
| Net asset value, beginning of year | | | $ | 9.48 | | | | $ | 9.25 | | | $ | 9.15 | | | $ | 9.00 | | | $ | 8.64 | | | $ | 9.30 | |
| Income (loss) from investment operations: | | | | | | | | | | | | | | | | | | | | | | | | | | |
| Net investment income (loss) | | | | 0.11 | | | | | 0.26 | | | | 0.34 | | | | 0.37 | | | | 0.41 | | | | 0.39 | |
| Net realized and unrealized gain (loss) on investments | | | | (0.33 | ) | | | | 0.31 | | | | 0.15 | | | | 0.19 | | | | 0.43 | | | | (0.59 | ) |
| Total from investment operations | | | | (0.22 | ) | | | | 0.57 | | | | 0.49 | | | | 0.56 | | | | 0.84 | | | | (0.20 | ) |
| Less distributions from: | | | | | | | | | | | | | | | | | | | | | | | | | | |
| Net investment income | | | | 0.15 | | | | | 0.34 | | | | 0.39 | | | | 0.41 | | | | 0.48 | | | | 0.46 | |
| Net realized gain | | | | — | | | | | — | | | | — | | | | — | | | | — | | | | — | |
| Total distributions | | | | 0.15 | | | | | 0.34 | | | | 0.39 | | | | 0.41 | | | | 0.48 | | | | 0.46 | |
| Net asset value, end of year | | | $ | 9.11 | | | | $ | 9.48 | | | $ | 9.25 | | | $ | 9.15 | | | $ | 9.00 | | | $ | 8.64 | |
| Total Return (%)* | | | | (2.36 | ) | | | | 6.28 | | | | 5.46 | | | | 6.33 | | | | 9.89 | | | | (2.26 | ) |
| Ratios to average daily net assets (%):** | | | | | | | | | | | | | | | | | | | | | | | | | | |
| Expenses | | | | 0.57 | | | | | 0.58 | | | | 0.64 | | | | 0.63 | | | | 0.66 | | | | 0.72 | |
| Net investment income | | | | 2.31 | | | | | 2.78 | | | | 3.66 | | | | 4.01 | | | | 4.67 | | | | 4.57 | |
| Net assets at end of year (in thousands) | | | $ | 72,510 | | | | $ | 72,830 | | | $ | 67,183 | | | $ | 77,522 | | | $ | 80,041 | | | $ | 93,426 | |
| Portfolio turnover rate (%)* | | | | 28 | | | | | 33 | | | | 39 | | | | 29 | | | | 40 | | | | 38 | |
| * | Rates not annualized for periods that are less than a year. |
| ** | Rates are annualized for periods that are less than a year. |
Note: Net investment income (loss) per share is based on the average shares outstanding during the year.
Performance cited represents past performance. Past performance does not guarantee future results and current performance may be lower or higher than the data quoted. Results shown are annual returns, which assume reinvestment of dividends and capital gains. Investment returns and principal will fluctuate and you may have a gain or loss when you sell shares. For the most current month-end performance information, please call 1-800-742-7272 or visit our Web site at www.williamblairfunds.com.
| June 30, 2013 | William Blair Funds | 181 |
Low Duration Fund
| | | Class N | |
| | | (unaudited)
Period Ended
June, 30 | | | Years Ended December 31, | |
| | | 2013 | | | 2012 | | | 2011 | | | 2010 | | | 2009(a) | |
| Net asset value, beginning of year | | | $ | 9.83 | | | | $ | 9.82 | | | $ | 9.90 | | | $ | 9.93 | | | $ | 10.00 | |
| Income (loss) from investment operations: | | | | | | | | | | | | | | | | | | | | | | |
| Net investment income (loss) | | | | 0.05 | | | | | 0.13 | | | | 0.15 | | | | 0.13 | | | | 0.01 | |
| Net realized and unrealized gain (loss) on investments | | | | (0.17 | ) | | | | 0.14 | | | | 0.02 | | | | 0.05 | | | | (0.07 | ) |
| Total from investment operations | | | | (0.12 | ) | | | | 0.27 | | | | 0.17 | | | | 0.18 | | | | (0.06 | ) |
| Less distributions from: | | | | | | | | | | | | | | | | | | | | | | |
| Net investment income | | | | 0.12 | | | | | 0.26 | | | | 0.25 | | | | 0.21 | | | | 0.01 | |
| Net realized gain | | | | — | | | | | — | | | | — | | | | — | | | | — | |
| Total distributions | | | | 0.12 | | | | | 0.26 | | | | 0.25 | | | | 0.21 | | | | 0.01 | |
| Net asset value, end of year | | | $ | 9.59 | | | | $ | 9.83 | | | $ | 9.82 | | | $ | 9.90 | | | $ | 9.93 | |
| Total Return (%)* | | | | (1.27 | ) | | | | 2.80 | | | | 1.73 | | | | 1.86 | | | | (0.60 | ) |
| Ratios to average daily net assets (%):** | | | | | | | | | | | | | | | | | | | | | | |
| Expenses, net of waivers and reimbursements | | | | 0.69 | | | | | 0.70 | | | | 0.70 | | | | 0.70 | | | | 0.70 | |
| Expenses, before waivers and reimbursements | | | | 0.69 | | | | | 0.74 | | | | 0.73 | | | | 0.78 | | | | 0.94 | |
| Net investment income (loss), net of waivers and reimbursements | | | | 1.02 | | | | | 1.37 | | | | 1.52 | | | | 1.33 | | | | 1.27 | |
| Net investment income (loss), before waivers and reimbursements | | | | 1.02 | | | | | 1.33 | | | | 1.49 | | | | 1.25 | | | | 1.03 | |
| Net assets at end of year (in thousands) | | | $ | 10,127 | | | | $ | 11,216 | | | $ | 6,260 | | | $ | 6,937 | | | $ | 1,861 | |
| Portfolio turnover rate (%)* | | | | 24 | | | | | 20 | | | | 43 | | | | 51 | | | | — | |
| | | Class I | |
| | | (unaudited)
Period Ended
June, 30 | | | Years Ended December 31, | |
| | | 2013 | | | 2012 | | | 2011 | | | 2010 | | | 2009(a) | |
| Net asset value, beginning of year | | | $ | 9.83 | | | | $ | 9.82 | | | $ | 9.89 | | | $ | 9.93 | | | $ | 10.00 | |
| Income (loss) from investment operations: | | | | | | | | | | | | | | | | | | | | | | |
| Net investment income (loss) | | | | 0.06 | | | | | 0.15 | | | | 0.17 | | | | 0.15 | | | | 0.01 | |
| Net realized and unrealized gain (loss) on investments | | | | (0.17 | ) | | | | 0.14 | | | | 0.02 | | | | 0.04 | | | | (0.07 | ) |
| Total from investment operations | | | | (0.11 | ) | | | | 0.29 | | | | 0.19 | | | | 0.19 | | | | (0.06 | ) |
| Less distributions from: | | | | | | | | | | | | | | | | | | | | | | |
| Net investment income | | | | 0.13 | | | | | 0.28 | | | | 0.26 | | | | 0.23 | | | | 0.01 | |
| Net realized gain | | | | — | | | | | — | | | | — | | | | — | | | | — | |
| Total distributions | | | | 0.13 | | | | | 0.28 | | | | 0.26 | | | | 0.23 | | | | 0.01 | |
| Net asset value, end of year | | | $ | 9.59 | | | | $ | 9.83 | | | $ | 9.82 | | | $ | 9.89 | | | $ | 9.93 | |
| Total Return (%)* | | | | (1.20 | ) | | | | 2.96 | | | | 1.99 | | | | 1.89 | | | | (0.59 | ) |
| Ratios to average daily net assets (%):** | | | | | | | | | | | | | | | | | | | | | | |
| Expenses, net of waivers and reimbursements | | | | 0.53 | | | | | 0.55 | | | | 0.55 | | | | 0.55 | | | | 0.55 | |
| Expenses, before waivers and reimbursements | | | | 0.53 | | | | | 0.57 | | | | 0.58 | | | | 0.63 | | | | 0.79 | |
| Net investment income (loss), net of waivers and reimbursements | | | | 1.18 | | | | | 1.52 | | | | 1.67 | | | | 1.46 | | | | 1.39 | |
| Net investment income (loss), before waivers and reimbursements | | | | 1.18 | | | | | 1.50 | | | | 1.64 | | | | 1.38 | | | | 1.15 | |
| Net assets at end of year (in thousands) | | | $ | 173,829 | | | | $ | 157,213 | | | $ | 82,828 | | | $ | 88,568 | | | $ | 79,773 | |
| Portfolio turnover rate (%)* | | | | 24 | | | | | 20 | | | | 43 | | | | 51 | | | | — | |
| (a) | For the period from December 1, 2009 (Commencement of Operations) to December 31, 2009. |
| * | Rates not annualized for periods that are less than a year. |
| ** | Rates are annualized for periods that are less than a year. |
Note: Net investment income (loss) per share is based on the average shares outstanding during the year.
Performance cited represents past performance. Past performance does not guarantee future results and current performance may be lower or higher than the data quoted. Results shown are annual returns, which assume reinvestment of dividends and capital gains. Investment returns and principal will fluctuate and you may have a gain or loss when you sell shares. For the most current month-end performance information, please call 1-800-742-7272 or visit our Web site at www.williamblairfunds.com.
| 182 | Semi-Annual Report | June 30, 2013 |
Low Duration Fund
| | | Institutional Class Shares | |
| | | (unaudited)
Period Ended
June, 30 | | | Years Ended December 31, | |
| | | 2013 | | | 2012 | | | 2011 | | | 2010 | | | 2009(a) | |
| Net asset value, beginning of year | | | $ | 9.83 | | | | $ | 9.83 | | | $ | 9.90 | | | $ | 9.93 | | | $ | 10.00 | |
| Income (loss) from investment operations: | | | | | | | | | | | | | | | | | | | | | | |
| Net investment income (loss) | | | | 0.06 | | | | | 0.17 | | | | 0.18 | | | | 0.16 | | | | 0.01 | |
| Net realized and unrealized gain (loss) on investments | | | | (0.15 | ) | | | | 0.12 | | | | 0.03 | | | | 0.05 | | | | (0.07 | ) |
| Total from investment operations | | | | (0.09 | ) | | | | 0.29 | | | | 0.21 | | | | 0.21 | | | | (0.06 | ) |
| Less distributions from: | | | | | | | | | | | | | | | | | | | | | | |
| Net investment income | | | | 0.14 | | | | | 0.29 | | | | 0.28 | | | | 0.24 | | | | 0.01 | |
| Net realized gain | | | | — | | | | | — | | | | — | | | | — | | | | — | |
| Total distributions | | | | 0.14 | | | | | 0.29 | | | | 0.28 | | | | 0.24 | | | | 0.01 | |
| Net asset value, end of year | | | $ | 9.60 | | | | $ | 9.83 | | | $ | 9.83 | | | $ | 9.90 | | | $ | 9.93 | |
| Total Return (%)* | | | | (1.01 | ) | | | | 3.01 | | | | 2.14 | | | | 2.15 | | | | (0.58 | ) |
| Ratios to average daily net assets (%):** | | | | | | | | | | | | | | | | | | | | | | |
| Expenses, net of waivers and reimbursements | | | | 0.38 | | | | | 0.40 | | | | 0.40 | | | | 0.40 | | | | 0.40 | |
| Expenses, before waivers and reimbursements | | | | 0.38 | | | | | 0.41 | | | | 0.42 | | | | 0.48 | | | | 0.64 | |
| Net investment income (loss), net of waivers and reimbursements | | | | 1.33 | | | | | 1.68 | | | | 1.81 | | | | 1.61 | | | | 1.54 | |
| Net investment income (loss), before waivers and reimbursements | | | | 1.33 | | | | | 1.67 | | | | 1.79 | | | | 1.53 | | | | 1.30 | |
| Net assets at end of year (in thousands) | | | $ | 107,359 | | | | $ | 118,401 | | | $ | 68,059 | | | $ | 47,965 | | | $ | 13,500 | |
| Portfolio turnover rate (%)* | | | | 24 | | | | | 20 | | | | 43 | | | | 51 | | | | — | |
| (a) | For the period December 1, 2009 (Commencement of Operations) to December 31, 2009. |
| * | Rates not annualized for periods that are less than a year. |
| ** | Rates are annualized for periods that are less than a year. |
Note: Net investment income (loss) per share is based on the average shares outstanding during the year.
Performance cited represents past performance. Past performance does not guarantee future results and current performance may be lower or higher than the data quoted. Results shown are annual returns, which assume reinvestment of dividends and capital gains. Investment returns and principal will fluctuate and you may have a gain or loss when you sell shares. For the most current month-end performance information, please call 1-800-742-7272 or visit our Web site at www.williamblairfunds.com.
| June 30, 2013 | William Blair Funds | 183 |
Ready Reserves Fund
| | | Class N | |
| | | (unaudited)
Period Ended
June 30, | | | Years Ended December 31, | |
| | | 2013 | | | 2012 | | | 2011 | | | 2010 | | | 2009 | | | 2008 | |
| Net asset value, beginning of year | | | $ | 1.00 | | | | $ | 1.00 | | | $ | 1.00 | | | $ | 1.00 | | | $ | 1.00 | | | $ | 1.00 | |
| Income (loss) from investment operations: | | | | | | | | | | | | | | | | | | | | | | | | | | |
| Net investment income (loss) | | | | 0.00 | | | | | 0.00 | ^ | | | 0.00 | ^ | | | 0.00 | ^ | | | 0.00 | ^ | | | 0.02 | |
| Net realized and unrealized gain (loss) on investments | | | | — | | | | | — | | | | — | | | | — | | | | — | | | | — | |
| Total from investment operations | | | | 0.00 | | | | | 0.00 | ^ | | | 0.00 | ^ | | | 0.00 | ^ | | | 0.00 | ^ | | | 0.02 | |
| Less distributions from: | | | | | | | | | | | | | | | | | | | | | | | | | | |
| Net investment income | | | | 0.00 | ^ | | | | 0.00 | ^ | | | 0.00 | ^ | | | 0.00 | ^ | | | 0.00 | ^ | | | 0.02 | |
| Net realized gain | | | | — | | | | | — | | | | — | | | | — | | | | — | | | | — | |
| Total distributions | | | | 0.00 | ^ | | | | 0.00 | ^ | | | 0.00 | ^ | | | 0.00 | ^ | | | 0.00 | ^ | | | 0.02 | |
| Net asset value, end of year | | | $ | 1.00 | | | | $ | 1.00 | | | $ | 1.00 | | | $ | 1.00 | | | $ | 1.00 | | | $ | 1.00 | |
| Total Return (%)* | | | | 0.00 | | | | | 0.01 | | | | 0.01 | | | | 0.01 | | | | 0.10 | | | | 2.20 | |
| Ratios to average daily net assets (%):** | | | | | | | | | | | | | | | | | | | | | | | | | | |
| Expenses, net of waivers and reimbursements | | | | 0.11 | | | | | 0.14 | | | | 0.14 | | | | 0.24 | | | | 0.46 | | | | 0.60 | |
| Expenses, before waivers and reimbursements | | | | 0.62 | | | | | 0.62 | | | | 0.62 | | | | 0.61 | | | | 0.66 | | | | 0.60 | |
| Net investment income (loss), net of waivers and reimbursements | | | | 0.01 | | | | | 0.01 | | | | 0.01 | | | | 0.01 | | | | 0.11 | | | | 2.12 | |
| Net investment income (loss), before waivers and reimbursements | | | | (0.50 | ) | | | | (0.47 | ) | | | (0.47 | ) | | | (0.36 | ) | | | (0.09 | ) | | | 2.12 | |
| Net assets at end of year (in thousands) | | | $ | 1,227,886 | | | | $ | 1,515,330 | | | $ | 1,271,746 | | | $ | 1,216,543 | | | $ | 1,352,901 | | | $ | 1,841,189 | |
| * | Rates not annualized for periods that are less than a year. |
| ** | Rates are annualized for periods that are less than a year. |
| ^ | Amount is less than $0.005 per share. |
Note: Net investment income (loss) per share is based on the average shares outstanding during the year.
Performance cited represents past performance. Past performance does not guarantee future results and current performance may be lower or higher than the data quoted. Results shown are annual returns, which assume reinvestment of dividends and capital gains. Investment returns and principal will fluctuate and you may have a gain or loss when you sell shares. For the most current month-end performance information, please call 1-800-742-7272 or visit our Web site at www.williamblairfunds.com.
| 184 | Semi-Annual Report | June 30, 2013 |
Trustees and Officers (Unaudited). The trustees and officers of the William Blair Funds, their year of birth, their principal occupations during the last five years, their affiliations, if any, with William Blair & Company, L.L.C., and other significant affiliations are set forth below. The address of each trustee and officer is 222 West Adams Street, Chicago, Illinois 60606.
| Name and Year of Birth | | Position(s)
Held with
Fund | | Term of
Office and
Length of
Time
Served(1) | | Principal
Occupation(s)
During Past 5 Years(2) | | Number of
Portfolios
in Fund
Complex
Overseen
by Trustee | | Other Directorships
Held by Trustee/Officer |
| | | | | | | | | | | |
| Interested Trustees | | | | | | | | | | |
Michelle R. Seitz,
1965* | | Chairman of the Board of Trustees and President | | Trustee since 2002; Chairman since 2010 Since 2007 | | Partner, William Blair & Company, L.L.C.; Limited Partner, WBC Holdings, L.P. (since 2008); Member, WBC GP, L.L.P. (since 2008); Director, William Blair International, Ltd. (U.K.) (since 2012) | | 26 | | Chairman, William Blair SICAV; Director, William Blair CLS Ltd.; Director, William Blair MAS Ltd.; Financial Accounting Foundation (FAF) |
| | | | | | | | | | | |
Richard W. Smirl,
1967* | | Trustee and Senior Vice President | | Trustee since 2010 and Senior Vice President Since 2008 | | Partner, William Blair & Company, L.L.C.; Limited Partner, WBC Holdings, L.P. (since 2008); Director, William Blair International, Ltd. (U.K.) (since 2012) | | 26 | | Director, William Blair SICAV; Director, William Blair CLS Ltd.; Director, William Blair MAS Ltd. |
| | | | | | | | | | | |
| Non-Interested Trustees | | | | | | | | | | |
Vann A. Avedisian,
1964 | | Trustee | | Since 2012 | | Principal, Highgate Holdings (hotel investments) since 2009; formerly, co-founder and Managing Director, Oxford Capital Partners, Inc. from 1994 to 2006 | | 26 | | Potbelly Sandwich Works, LLC |
| | | | | | | | | | | |
Kathleen T. Barr,
1955 | | Trustee | | Since 2013 | | President, Productive Capital Management, Inc. (registered investment adviser to public entities) since 2010; Owner, KT Barr Consulting, LLC (mutual fund and investment management consulting) since 2010; formerly, Chief Administrative Officer, Senior Vice President and Senior Managing Director of Allegiant Asset Management Company (merged with PNC Capital Advisors, LLC in 2009) from 2004 to 2010; formerly, Chief Administrative Officer, Chief Compliance Officer and Senior Vice President of PNC Funds and PNC Advantage Funds (f/k/a Allegiant Funds) from 2003 to 2010 | | 26 | | AmericaFirst Quantitative Funds (4 portfolios) |
| | | | | | | | | | | |
Phillip O. Peterson,
1944 | | Trustee | | Since 2007 | | Retired; formerly, President, Strong Mutual Funds, 2004 to 2005; formerly, Partner, KPMG LLP | | 26 | | The Hartford Group of Mutual Funds (88 portfolios); Symetra Mutual Funds Trust (variable annuity funds) (3 portfolios) |
| | | | | | | | | | | |
Donald J. Reaves,
1946 | | Trustee | | Since 2004 | | Chancellor, Winston-Salem State University since 2007; formerly, Vice President for Administration and Chief Financial Officer, University of Chicago 2002 to 2007 | | 26 | | American Student Assistance Corp., guarantor of student loans; Amica Mutual Insurance Company |
| June 30, 2013 | William Blair Funds | 185 |
| Name and Year of Birth | | Position(s)
Held with
Fund | | Term of
Office and
Length of
Time
Served(1) | | Principal
Occupation(s)
During Past 5 Years(2) | | Number of
Portfolios
in Fund
Complex
Overseen
by Trustee | | Other Directorships
Held by Trustee/Officer |
| | | | | | | | | | | |
Donald L. Seeley,
1944 | | Trustee | | Since 2003 | | Retired; formerly, Director, Applied Investment Management Program, University of Arizona Department of Finance, prior thereto, Vice Chairman and Chief Financial Officer, True North Communications, Inc., (marketing communications and advertising firm) | | 26 | | Center for Furniture Craftsmanship (not-for-profit) |
| | | | | | | | | | | |
Thomas J. Skelly,
1951 | | Trustee | | Since 2007 | | Advisory Board Member for various U.S. Companies; Director and Investment Committee Chairman of the US Accenture Foundation, Inc.; prior to 2005, Managing Partner of various divisions at Accenture | | 26 | | Mutual Trust Financial Group, provider of insurance and investment products; First MetLife Investors Insurance Company, NY Chartered Company for Metropolitan Life Insurance |
| | | | | | | | | | | |
| Officers | | | | | | | | | | |
| | | | | | | | | | | |
Michael P. Balkin,
1959 | | Senior Vice President | | Since 2009 | | Partner, William Blair & Company, L.L.C. | | | | N/A |
| | | | | | | | | | | |
| | | Vice President | | 2008-2009 | | Associate, William Blair & Company, L.L.C.; former Partner, Magnetar Capital (2005-2009) | | | | |
| | | | | | | | | | | |
Karl W. Brewer,
1966 | | Senior Vice President | | Since 2000 | | Partner, William Blair & Company, L.L.C. | | | | N/A |
| | | | | | | | | | | |
Andrew G. Flynn,
1961 | | Senior Vice President | | Since 2013 | | Partner, William Blair & Company, L.L.C. (since 2009); prior thereto, Associate, William Blair & Company, L.L.C. (2006-2009) | | | | N/A |
| | | | | | | | | | | |
David C. Fording,
1967 | | Senior Vice President | | Since 2009 | | Partner, William Blair & Company, L.L.C. | | | | N/A |
| | | | | | | | | | | |
| | | Vice President | | 2006-2009 | | Associate, William Blair & Company, L.L.C. | | | | |
| | | | | | | | | | | |
James S. Golan,
1961 | | Senior Vice President | | Since 2005 | | Partner, William Blair & Company, L.L.C. | | | | N/A |
| | | | | | | | | | | |
W. George Greig,
1952 | | Senior Vice President | | Since 1996 | | Partner, William Blair & Company, L.L.C. | | | | N/A |
| | | | | | | | | | | |
Michael A. Jancosek,
1959 | | Senior Vice President | | Since 2004 | | Partner, William Blair & Company, L.L.C. | | | | N/A |
| | | | | | | | | | | |
John F. Jostrand,
1954 | | Senior Vice President | | Since 1999 | | Partner, William Blair & Company, L.L.C. | | | | N/A |
| | | | | | | | | | | |
Chad M. Kilmer,
1975 | | Senior Vice President | | Since 2011 | | Partner, William Blair & Company, L.L.C. | | | | N/A |
| | | | | | | | | | | |
| | | Vice President | | 2006-2011 | | Associate, William Blair & Company, L.L.C. | | | | |
| | | | | | | | | | | |
Robert C. Lanphier, IV,
1956 | | Senior Vice President | | Since 2003 | | Partner, William Blair & Company, L.L.C. | | | | Chairman, AG. Med, Inc. |
| 186 | Semi-Annual Report | June 30, 2013 |
| Name and Year of Birth | | Position(s)
Held with
Fund | | Term of
Office and
Length of9
Time
Served(1) | | Principal
Occupation(s)
During Past 5 Years(2) | | Other Directorships
Held by Trustee/Officer |
| | | | | | | | | |
Mark T. Leslie,
1967 | | Senior Vice President | | Since 2008 | | Partner, William Blair & Company, L.L.C. | | N/A |
| | | | | | | | | |
| | | Vice President | | 2005-2008 | | Associate, William Blair & Company, L.L.C. | | |
| | | | | | | | | |
Matthew A. Litfin,
1972 | | Senior Vice President | | Since 2008 | | Partner, William Blair & Company, L.L.C. | | N/A |
| | | | | | | | | |
Kenneth J. McAtamney
1966 | | Senior Vice President | | Since 2008 | | Partner, William Blair & Company, L.L.C. (since 2008); prior thereto, Associate, William Blair & Company, L.L.C., (2005-2008) | | N/A |
| | | | | | | | | |
Todd M. McClone,
1968 | | Senior Vice President | | Since 2006 | | Partner, William Blair & Company, L.L.C. | | N/A |
| | | | | | | | | |
David Merjan,
1960 | | Senior Vice President | | Since 2008 | | Partner, William Blair & Company, L.L.C. | | N/A |
| | | | | | | | | |
David S. Mitchell,
1960 | | Senior Vice President | | Since 2004 | | Partner, William Blair & Company, L.L.C. | | N/A |
| | | | | | | | | |
David P. Ricci,
1958 | | Senior Vice President | | Since 2006 | | Partner, William Blair & Company, L.L.C. | | N/A |
| | | | | | | | | |
Brian D. Singer,
1960 | | Senior Vice President | | Since 2012 | | Partner, William Blair & Company, L.L.C. | | N/A |
| | | | | | | | | |
| | | Vice President | | 2011-2012 | | Associate, William Blair & Company, L.L.C. (since 2011); prior thereto, Managing Partner, Singer Partners, LLC (2009-2011); prior thereto, UBS Global Asset Management (Americas) Inc. (2003-2007) | | |
| | | | | | | | | |
Paul J. Sularz,
1967 | | Senior Vice President | | Since 2012 | | Partner, William Blair & Company, L.L.C. | | N/A |
| | | | | | | | | |
| | | Vice President | | 2009-2012 | | Associate, William Blair & Company, L.L.C., Vice President, J.P. Morgan Securities, Inc. | | |
| | | | | | | | | |
Jeffrey A. Urbina,
1955 | | Senior Vice President | | Since 1998 | | Partner, William Blair & Company, L.L.C. | | N/A |
| | | | | | | | | |
Christopher T. Vincent,
1956 | | Senior Vice President | | Since 2004 | | Partner, William Blair & Company, L.L.C. | | N/A |
| | | | | | | | | |
Kathleen M. Lynch,
1971 | | Vice President | | Since 2010 | | Associate, William Blair & Company, L.L.C. | | N/A |
| | | | | | | | | |
Jason Moede,
1971 | | Vice President | | Since 2013 | | Associate, William Blair & Company L.L.C. (since 2011); prior thereto, TradeLink, LLC (2008-2011) | | N/A |
| | | | | | | | | |
David F. Hone,
1967 | | Vice President | | Since 2011 | | Associate, William Blair & Company, L.L.C. (since 2011); prior thereto, Portfolio Manager Large Cap Value, Deutsche Asset Management (2002-2010) | | N/A |
| June 30, 2013 | William Blair Funds | 187 |
| Name and Year of Birth | | Position(s)
Held with
Fund | | Term of
Office and
Length of
Time
Served(1) | | Principal
Occupation(s)
During Past 5 Years(2) | | Other Directorships
Held by Trustee/Officer |
| | | | | | | | | |
John Abunassar,
1967 | | Vice President | | Since 2011 | | Associate, William Blair & Company, L.L.C. (since 2011); prior thereto, Principal, Guidance Capital LLC (2009- 2011); prior thereto, President and CEO of Allegiant Asset Management (2004-2009) | | N/A |
| | | | | | | | | |
Peter Carl,
1967 | | Vice President | | Since 2011 | | Associate, William Blair & Company L.L.C. (since 2011); prior thereto, Portfolio Manager, Guidance Capital LLC (2006-2011) | | N/A |
| | | | | | | | | |
D. Trowbridge
Elliman III,
1957 | | Vice President | | Since 2011 | | Associate, William Blair & Company L.L.C. (since 2011); prior thereto, Principal, Guidance Capital LLC (2001-2011) | | N/A |
| | | | | | | | | |
Christopher Walvoord,
1966 | | Vice President | | Since 2011 | | Associate, William Blair & Company, L.L.C. (since 2011); prior thereto, Principal, Guidance Capital LLC (2002-2011) | | N/A |
| | | | | | | |
Brian Ziv,
1957 | | Vice President | | Since 2011 | | Associate, William Blair & Company, L.L.C. (since 2011); prior thereto, Principal, Guidance Capital LLC (2001- 2011) | | N/A |
| | | | | | | | | |
Edwin Denson,
1967 | | Vice President | | Since 2011 | | Associate, William Blair & Company, L.L.C. (since 2011); prior thereto, Managing Partner, Singer Partners, LLC (2009-2011); prior thereto, UBS Global Asset Management (Americas) Inc. (2001-2009) | | N/A |
| | | | | | | | | |
Thomas Clarke,
1968 | | Vice President | | Since 2011 | | Associate, William Blair & Company, L.L.C. (since 2011); prior thereto, Managing Partner, Singer Partners, LLC (2009- 2011); prior thereto, UBS Global Asset Management (Americas) Inc. (2000-2009) | | N/A |
| | | | | | | | | |
Walter R. Randall, Jr.,
1960 | | Chief Compliance Officer and Assistant Secretary | | Since 2009 | | Associate, William Blair & Company, L.L.C. (since 2008); prior thereto, Associate Counsel and Chief Compliance Officer, Calamos Investments (2006- 2008) | | N/A |
| | | | | | | | | |
Colette M. Garavalia,
1961 | | Treasurer | | Since 2009 | | Associate, William Blair & Company, L.L.C. | | N/A |
| | | | | | | | | |
| | | Secretary | | 2000-2009 | | Associate, William Blair & Company, L.L.C. | | N/A |
| 188 | Semi-Annual Report | June 30, 2013 |
| Name and Year of Birth | | Position(s)
Held with
Fund | | Term of
Office and
Length of
Time
Served(1) | | Principal
Occupation(s)
During Past 5 Years(2) | | Other Directorships
Held by Trustee/Officer |
| | | | | | | | | |
Andrew T. Pfau,
1970 | | Secretary | | Since 2009 | | Associate, William Blair & Company, L.L.C. (since 2008); prior thereto, Associate, Bell, Boyd & Lloyd, LLP (2006- 2008) | | N/A |
| | | | | | | | | |
John M. Raczek,
1970 | | Assistant Treasurer | | Since 2010 | | Associate, William Blair & Company, L.L.C. (since 2009); prior thereto, Manager, Calamos Investments (2003-2009) | | N/A |
| * | Ms. Seitz and Mr. Smirl are interested persons of the Trust because they are partners of William Blair & Company, L.L.C., the Fund’s investment advisor and principal underwriter. |
| (1) | Each Trustee serves until the election and qualification of a successor, or until death, resignation or retirement or removal as provided in the Fund’s Declaration of Trust. Retirement for non-interested Trustees occurs no later than at the conclusion of the first regularly scheduled Board meeting of the Fund’s fiscal year that occurs after the earlier of (a) the non-interested Trustee’s 72nd birthday or (b) the 15th anniversary of the date that the non-interested Trustee was first elected or appointed as a member of the Board of Trustees. The Fund’s officers, except the Chief Compliance Officer, are elected annually by the Trustees. The Fund’s Chief Compliance Officer is designated by the Board of Trustees and may only be removed by action of the Board of Trustees, including a majority of the non-interested Trustees. |
| (2) | In November 2008, all partners of William Blair & Company, L.L.C. also became limited partners in WBC Holdings, L.P. |
The Statement of Additional Information for the William Blair Funds includes additional information about the trustees and is available without charge by calling 1-800-635-2886 (in Massachusetts 1-800-635-2840) or by writing the Fund.
| June 30, 2013 | William Blair Funds | 189 |
Approval of the Management Agreement for the William Blair Global Small Cap Growth Fund
On February 20, 2013, the Board of Trustees (the “Board”) of William Blair Funds (the “Trust”), including the Trustees who are not interested persons of the Trust as defined by the Investment Company Act of 1940, as amended (the “Independent Trustees”), approved the Management Agreement between the Trust, on behalf of the William Blair Global Small Cap Growth Fund (the “Fund”), and William Blair & Company, L.L.C. (the “Advisor”). On February 20, 2013, the Board met to consider the approval of the Management Agreement. On February 19, 2013, the Independent Trustees also met independently of Trust management and the interested Trustees of the Trust to consider the approval of the Management Agreement. The Independent Trustees reviewed materials provided by the Advisor for the approval of the Management Agreement and were assisted by independent legal counsel in making their determination. The Board considered the following factors in making its determination, but did not identify any single factor or group of factors as all important or controlling and considered all factors together.
Nature, Quality and Extent of Services. In evaluating the nature, quality and extent of services expected to be provided by the Advisor to the Fund, the Board noted that the Advisor is a quality firm with a reputation for integrity and honesty that employs high quality people. The Board considered biographical information about the Fund’s portfolio managers and senior advisors, financial information regarding the Advisor, the compliance regime created by the Advisor and the proposed financial support of the Fund. The Board considered the proposed portfolio management team members’ experience in managing other series of the Trust. The Board also considered the Advisor’s experience in managing new funds. Based upon all relevant factors, the Board concluded that the nature, quality and extent of the services to be provided by the Advisor to the Fund were expected to be satisfactory.
Fees and Expenses. The Board reviewed the proposed advisory fee for the Fund and reviewed information comparing the advisory fee to a peer group of funds for Class N and Class I shares and a peer group of institutional funds for Institutional Class shares provided by Lipper Inc. The Lipper peer groups consisted of other no-load retail global small-/mid-cap funds. In considering the information, the Board noted that the proposed advisory fee for the Fund was below the median contractual management fee and above the actual management fees of the Lipper peer group for Class N and Class I and at the median of the Lipper peer group for Institutional Class shares. The Board also considered that the Advisor had proposed to limit total operating expenses, including waiving advisory fees, if necessary, for each share class of the Fund until April 30, 2014. On the basis of the information provided, the Board concluded that the proposed advisory fee was reasonable in light of the nature, quality and extent of services expected to be provided by the Advisor.
Profitability. With respect to the estimated profitability of the Management Agreement to the Advisor, the Board considered the proposed advisory fee, that the Fund was newly organized and had no assets and the Advisor’s agreement to limit total expenses until April 30, 2014. The Board concluded that the expected profits to be realized by the Advisor were not expected to be unreasonable.
Economies of Scale. The Board considered the extent to which economies of scale would be realized as the Fund grows and whether fee levels reflect these economies of scale. In considering whether fee levels reflect economies of scale for the benefit of Fund investors, the Board reviewed the Fund’s advisory fee compared to peer funds and the Fund’s estimated expense ratios giving effect to the Advisor’s agreement to limit total expenses until April 30, 2014, and concluded that the advisory fee was reasonable.
Other Benefits to the Advisor. The Board considered benefits to be derived by the Advisor from its relationship with the Fund. The Board concluded that, after taking into account these benefits, the proposed advisory fee was reasonable.
Conclusion. Based upon all of the information considered and the conclusions reached, the Board determined that the terms of the Management Agreement are fair and reasonable and that the approval of the Management Agreement is in the best interests of the Fund.
| 190 | Semi-Annual Report | June 30, 2013 |
Renewal of the Management Agreement
On April 23, 2013, the Board of Trustees (the “Board”) of the William Blair Funds (the “Trust”), including the Trustees who are not “interested persons” of the Trust as defined in the Investment Company Act of 1940, as amended (the “Independent Trustees”), approved the renewal for an additional one-year term of the Trust’s Management Agreement with William Blair & Company, L.L.C. (the “Advisor”) on behalf of each of the William Blair Growth Fund, the William Blair Large Cap Growth Fund, the William Blair Mid Cap Growth Fund, the William Blair Small-Mid Cap Growth Fund, the William Blair Small Cap Growth Fund, the William Blair Large Cap Value Fund, the William Blair Mid Cap Value Fund, the William Blair Small-Mid Cap Value Fund, the William Blair Small Cap Value Fund, the William Blair Global Leaders Fund, the William Blair International Growth Fund, the William Blair Institutional International Growth Fund, the William Blair International Equity Fund, the William Blair Institutional International Equity Fund, the William Blair International Small Cap Growth Fund, the William Blair Emerging Markets Growth Fund, the William Blair Emerging Markets Leaders Fund, the William Blair Emerging Markets Small Cap Growth Fund, the William Blair Bond Fund, the William Blair Income Fund, the William Blair Low Duration Fund and the William Blair Ready Reserves Fund (each, a “Fund” and collectively, the “Funds”). In deciding to approve the renewal of the Management Agreement, the Board did not identify any single factor or group of factors as all important or controlling and considered all factors together.
The information in this summary outlines the Board’s considerations associated with its renewal of the Management Agreement. In connection with its deliberations regarding the continuation of the Management Agreement, the Board considered such information and factors as it believed to be relevant. As described below, the Board considered the nature, quality and extent of the services performed by the Advisor under the Management Agreement; comparative management fees and expense ratios as prepared by an independent provider (Lipper Inc.); the estimated profits realized by the Advisor; the extent to which the Advisor realizes economies of scale as a Fund grows; and whether any fall-out benefits are being realized by the Advisor. In addition, the Independent Trustees discussed the renewal of the Management Agreement with Fund management and in private sessions with independent legal counsel at which no representatives of the Advisor were present.
The Board, including the Independent Trustees, considered the renewal of the Management Agreement pursuant to a process that concluded at the Board’s April 23, 2013 meeting. In preparation for the review process, the Independent Trustees met with independent legal counsel and discussed the type and nature of information to be requested and independent legal counsel sent a formal request for information to Trust management. The Advisor provided extensive information in response to the request. After reviewing the information received, the Independent Trustees requested supplemental information, which the Advisor provided. The Independent Trustees considered: (i) the nature, quality and extent of services provided by the Advisor; (ii) information comparing the performance of each Fund to one or more relevant securities indexes; (iii) information comparing advisory fees of each Fund to fees charged by the Advisor to other funds and client accounts with similar investment strategies; (iv) the estimated allocated direct or indirect costs of services provided and estimated profits realized by the Advisor for both the Trust as a whole and each Fund individually; and (v) information describing other benefits to the Advisor resulting from its relationship with the Funds. The Independent Trustees reviewed comparative performance for a performance peer universe of funds and comparative advisory fees and expense ratios for an expense peer group and an expense peer universe of funds provided by Lipper for each Fund. The Independent Trustees noted that they receive information from the Advisor regarding the Funds throughout the year in connection with regular Board meetings, including presentations from portfolio managers. The Independent Trustees received a memorandum from independent legal counsel advising them of their duties and responsibilities in connection with the review of the Management Agreement. Finally, the Advisor made an in-person presentation to the Independent Trustees regarding the contract review information, including addressing the supplemental information requests, and answered questions from the Independent Trustees.
On April 9, 22 and 23, 2013, the Independent Trustees met independently of Trust management and of the interested Trustees to review and discuss with independent legal counsel the information provided by the Advisor, Lipper and independent legal counsel. The Independent Trustees noted that in evaluating the Management Agreement, they were taking into account their accumulated experience as Board members in working with the Advisor on matters relating to the Funds. Based on their review, the Independent Trustees concluded that it was in the best interest of each Fund to renew the Management Agreement for each Fund and recommended to the Board the renewal of the Management Agreement. The Board considered the recommendation of the Independent Trustees along with the other factors that the Board deemed relevant.
Nature, Quality and Extent of Services. In evaluating the nature, quality and extent of the services provided by the Advisor to the Funds, the Board noted that the Advisor is a quality firm with a reputation for integrity and honesty that employs high quality people and has a long association with the Funds, in each case other than the Growth Fund, since the inception of the Funds. The Trustees believe that a long-term relationship with a capable, conscientious advisor is in the best interests of shareholders and that shareholders have invested in the Funds knowing that the Advisor managed the Funds and knowing the investment
| June 30, 2013 | William Blair Funds | 191 |
advisory fee. The Board considered biographical information about the Trust’s officers and the Funds’ portfolio managers, including information on the portfolio managers’ investments in the Funds. The Board also considered the administrative services performed by the Advisor, financial information regarding the Advisor, the Advisor’s execution quality and use of soft dollars, the Advisor’s risk management activities and its compliance program, and the Advisor’s expense limitations in place for the Funds. The Board was also provided with information pertaining to the Advisor’s organizational structure. The Board noted that the Advisor pays the compensation of all of the officers and the interested Trustees of the Trust.
The Board reviewed information on the annualized total returns of each Fund for the one, three, five and ten year periods ended December 31, 2012, as applicable, along with annualized total return information for a performance peer universe of funds provided by Lipper and one or more benchmark securities indexes. The Lipper performance peer universe for each Fund included all funds with a similar investment style as classified by Lipper regardless of asset size or primary channel of distribution. With respect to the comparative performance information, the Board considered the Advisor’s statement that it is committed to managing each Fund consistently with the Fund’s stated investment strategies through all market environments and that, as a result, the Funds’ relative performance compared to the Lipper performance peer universe and relevant securities indexes from year to year will be affected by whether the market environment favors or disfavors certain of the Advisor’s investment strategies, but that the Advisor seeks to provide superior performance over the long term. The Trustees reviewed each Fund’s ranking in its Lipper performance peer universe during the applicable periods, and based on that review, requested and discussed with the Advisor additional information regarding the performance of the Small Cap Growth Fund, the International Equity Fund and the Low Duration Fund. With respect to the Small Cap Growth Fund, the Board noted the Fund’s underperformance relative to its Lipper performance peer universe over the three and five year periods and discussed the Fund’s performance with the Advisor. The Board considered the Fund’s short-term performance, noting that the Fund’s total return over the one year period ended December 31, 2012 was in the top decile of its Lipper performance peer universe. With respect to the International Equity Fund, the Board considered the Advisor’s view that the Fund’s lower allocations to emerging markets and small cap securities relative to many of its peer funds had contributed to relative underperformance and that the Fund invested in high quality growth companies. With respect to the Low Duration Fund, the Board considered information presented by the Advisor comparing the Fund’s performance to the performance of a peer group of funds provided by Morningstar, Inc. that the Advisor believed to be more representative of the Fund’s investment style and portfolio characteristics, including the Fund’s average duration. The Board noted that the Fund’s performance was in the top quartile of the Morningstar peer group over the one and three year periods ended December 31, 2012. The Board considered the Advisor’s statement that the Fund’s lower average duration as compared to the funds in its Lipper performance peer universe negatively impacted its comparative performance versus the Lipper performance peer universe. Based upon all relevant factors, the Board concluded that the nature, quality and extent of the services provided by the Advisor to each Fund were satisfactory.
Fees and Expenses. Class N and Class I shares. The Board reviewed each Fund’s advisory fee and expense ratios for Class N and Class I shares and reviewed information comparing the advisory fee and expense ratios to those of an expense peer group and an expense peer universe of funds provided by Lipper for Class N and Class I shares of each Fund. The Lipper expense peer group for Class N and Class I shares of each Fund (“Class N and Class I Lipper Expense Group”) consisted of a group of retail no-load funds with a similar investment style as classified by Lipper and asset size as the Fund. The Lipper expense peer universe for Class N and Class I shares of each Fund consisted of the Fund’s Class N and Class I Lipper Expense Group and all other retail no-load funds (excluding outliers) with a similar investment style as classified by Lipper as the Fund. In considering the Lipper information, the Board noted that the contractual advisory fees for the Growth Fund, the Large Cap Growth Fund, the Large Cap Value Fund, the Mid Cap Value Fund, the Global Leaders Fund, the International Small Cap Growth Fund, the Emerging Markets Growth Fund, the Bond Fund, the Income Fund, the Low Duration Fund and the Ready Reserves Fund were below the average contractual advisory fee of their Class N and Class I Lipper Expense Group. The Board also noted that the contractual advisory fees for the Mid Cap Growth Fund, the Small-Mid Cap Growth Fund, the Small Cap Growth Fund, the Small-Mid Cap Value Fund, the Small Cap Value Fund, the International Growth Fund, the International Equity Fund, the Emerging Markets Leaders Fund and the Emerging Markets Small Cap Growth Fund were above the average contractual advisory fee of their Class N and Class I Lipper Expense Group.
Institutional shares. The Board reviewed each Fund’s advisory fee and expense ratio for institutional shares and reviewed information comparing the advisory fee and expense ratio to those of an expense peer group and an expense peer universe of funds provided by Lipper for institutional shares of each Fund. The Lipper expense peer group for institutional shares of each Fund (“Institutional Lipper Expense Group”) consisted of a group of institutional funds with a similar investment style as classified by Lipper and asset size as the Fund. The Lipper expense peer universe for institutional shares of each Fund consisted of the Fund’s Institutional Lipper Expense Group and all other institutional funds (excluding outliers) with a similar investment style as classified by Lipper as the Fund. In considering the Lipper information, the Board noted that the contractual advisory fees for the Emerging Markets Growth Fund, the Emerging Markets Small Cap Growth Fund, the Bond Fund and the Low Duration Fund were below the average contractual advisory fee of their Institutional Lipper Expense Group. The Board also
| 192 | Semi-Annual Report | June 30, 2013 |
noted that the contractual advisory fees for the Global Leaders Fund, the Institutional International Growth Fund, the Institutional International Equity Fund, the International Small Cap Growth Fund and the Emerging Markets Leaders Fund were above the average contractual advisory fee of their Institutional Lipper Expense Group.
The Board noted the contractual expense limitations in place for all of the Funds, except the Growth Fund, the Institutional International Growth Fund and the Ready Reserves Fund, and considered the advisory fees waived and other expenses reimbursed by the Advisor on behalf of the Funds in 2012, noting that for the Large Cap Value Fund, the Mid Cap Value Fund, the Small-Mid Cap Value Fund and the Emerging Markets Small Cap Growth Fund the Advisor waived its entire advisory fee. The Board also considered that the Advisor had proposed to continue to contractually limit operating expenses until April 30, 2014 for the Large Cap Growth Fund, the Mid Cap Growth Fund, the Small-Mid Cap Growth Fund, the Small Cap Growth Fund, Large Cap Value Fund, the Mid Cap Value Fund, the Small-Mid Cap Value Fund, the Small Cap Value Fund, the Global Leaders Fund, the International Growth Fund, the International Equity Fund, the Institutional International Equity Fund, the International Small Cap Growth Fund, the Emerging Markets Growth Fund, the Emerging Markets Leaders Fund, the Emerging Markets Small Cap Growth Fund, the Bond Fund, the Income Fund and the Low Duration Fund. The Board also considered that the Advisor intended to continue to voluntarily waive or reimburse certain operating expenses of the Ready Reserves Fund to maintain a positive yield for the Fund.
For each Fund, the Board also reviewed amounts charged by the Advisor to other pooled investment vehicles, including other registered funds for which the Advisor acts as a subadvisor, and the Advisor’s fee schedule for institutional separate accounts. With respect to other pooled investment vehicles and institutional separate accounts, the Board considered the Advisor’s statement that both the mix of services provided to the Funds and the additional regulatory responsibilities associated with sponsoring registered investment companies were greater as compared to the work involved for other pooled investment vehicles and separate accounts. In addition, the Board considered the Advisor’s statement that institutional separate accounts are distributed differently, operate under different investment and regulatory structures and have different business risks as compared to the Funds.
On the basis of all the information provided, the Board concluded that each Fund’s advisory fee, coupled with applicable expense limitations, was reasonable.
Profitability. With respect to the profitability of the Management Agreement to the Advisor, the Board considered the overall fees paid under the Management Agreement, including the estimated allocated costs of the services provided and profits realized by the Advisor from its relationship with the Trust as a whole and each Fund individually. The Board concluded that the estimated profits realized by the Advisor were not unreasonable.
Economies of Scale. The Board considered the extent to which economies of scale would be realized as the Funds grow and whether fee levels reflect these economies of scale for the benefit of investors. The Board noted the Advisor’s statement that certain Fund expenses are relatively fixed and unrelated to asset size and that because the Advisor emphasizes fundamental research, the Advisor’s strategies (other than for the Large Cap Growth Fund and Large Cap Value Fund) are subject to capacity constraints which limit economies of scale. In considering whether fee levels reflect economies of scale for the benefit of Fund investors, the Board reviewed each Fund’s asset size, breakpoints for those Funds with breakpoints in the advisory fee schedule, the Fund’s total and net expense ratios and the expense limitations in place for all but two of the Funds, and concluded that in the aggregate they reasonably reflect appropriate recognition of any economies of scale.
Other Benefits to the Advisor. The Board considered benefits derived by the Advisor from its relationship with the Funds, including (i) non-advisory fee revenue from the Funds in the form of shareholder administration fees, service fees and/or distribution fees and the payment of some or all of those revenues to affiliates or third parties, (ii) soft dollars, which pertain primarily to the Funds investing in equity securities, and (iii) favorable media coverage. The Board concluded that, taking into account these benefits, each Fund’s advisory fee was reasonable.
Conclusion. Based upon all of the information considered and the conclusions reached, the Board determined that the terms of the Management Agreement continue to be fair and reasonable and that the continuation of the Management Agreement is in the best interests of each Fund.
| June 30, 2013 | William Blair Funds | 193 |
(unaudited)
Proxy Voting
A description of the policies and procedures that the Funds use to determine how to vote proxies relating to portfolio securities and information regarding how the Funds voted proxies relating to portfolio securities for the most recent 12-month period ended June 30 are available without charge, upon request, by calling 1-800-635-2886 (in Massachusetts 1-800-635-2840), at www.williamblairfunds.com and on the SEC’s website at http://www.sec.gov.
Quarterly Portfolio Schedules
Each Fund files its complete schedule of portfolio holdings with the SEC for the first and third fiscal quarters of each fiscal year (quarters ended January 31 and July 31) on Form N-Q. The Fund’s Forms N-Q are available on the SEC’s website at http://www.sec.gov and may be reviewed and copied at the SEC’s Public Reference Room in Washington, D.C. Information on the operation of the SEC’s Public Reference Room may be obtained by calling 1-800-SEC-0330. The Fund’s Forms N-Q are also available on the Fund’s website at www.williamblairfunds.com.
Additional Federal Income Tax Information: (unaudited)
Under Section 852(b)(3)(C) of the Code, the Funds hereby designate the following amounts as capital gain dividends for the fiscal year ended December 31, 2012:
| Growth Fund | | Small Cap Growth | | Mid Cap Growth | | Small-Mid Cap Growth |
| 20,221,469 | | 1,671,239 | | 7,948,197 | | 9,118,849 |
| | | | | | | |
| Small Cap Value | | Mid Cap Value | | Small-Mid Cap Value | | Bond Fund |
| 946,031 | | 145,618 | | 123 | | 1,934,272 |
| 194 | Semi-Annual Report | June 30, 2013 |
The following table provides the percentage of the 2012 year-end distributions that qualify for the dividend received deduction, and the qualified dividend income percentage:
| Fund | | Dividend
Received
Deduction% | | Qualified
Dividend
Income% |
| Growth | | | 100.00 | % | | | 100.00 | % |
| Large Cap Growth | | | 0.00 | % | | | 0.00 | % |
| Small Cap Growth | | | 0.00 | % | | | 0.00 | % |
| Mid Cap Growth | | | 100.00 | % | | | 100.00 | % |
| Small-Mid Cap Growth | | | 99.13 | % | | | 100.00 | % |
| Global Leaders | | | 100.00 | % | | | 100.00 | % |
| International Growth | | | 0.00 | % | | | 72.82 | % |
| Institutional International Growth | | | 0.00 | % | | | 65.16 | % |
| International Equity | | | 0.00 | % | | | 70.29 | % |
| Institutional International Equity | | | 0.00 | % | | | 100.00 | % |
| International Leaders | | | 0.42 | % | | | 92.76 | % |
| International Small Cap Growth | | | 0.00 | % | | | 78.98 | % |
| Emerging Markets Growth | | | 0.27 | % | | | 100.00 | % |
| Emerging Markets Leaders | | | 0.00 | % | | | 100.00 | % |
| Emerging Markets Small Cap Growth | | | 0.21 | % | | | 100.00 | % |
| Large Cap Value | | | 100.00 | % | | | 100.00 | % |
| Small Cap Value | | | 100.00 | % | | | 100.00 | % |
| Mid Cap Value | | | 89.10 | % | | | 100.00 | % |
| Small-Mid Cap Value | | | 38.86 | % | | | 47.73 | % |
| Bond | | | 0.00 | % | | | 0.00 | % |
| Income | | | 0.00 | % | | | 0.00 | % |
| Low Duration | | | 0.00 | % | | | 0.00 | % |
| Ready Reserves | | | 0.00 | % | | | 0.00 | % |
In January 2013, investors were notified on IRS Form 1099-Div or substitute 1099 DIV as to the Federal tax status of the distributions received by investors in the calendar year 2012.
| June 30, 2013 | William Blair Funds | 195 |
| | Useful Information About Your Report (unaudited) |
| | |
| | Please refer to this information when reviewing the Expense Example for each Fund. |
| | |
| | Expense Example |
| | |
| | As a shareholder of a Fund, you incur two types of costs: (1) transaction costs such as redemption fees and (2) ongoing costs, including management fees, distribution (12b-1) fees (for Class N shares except for the Institutional International Growth Fund, the Institutional International Equity Fund, and the Ready Reserves Fund), service fees (for Class N shares of the Ready Reserves Fund), shareholder administration fees (for Class N and Class I shares of the Global Leaders Fund, the Global Small Cap Growth Fund, the International Leaders Fund, the International Small Cap Growth Fund, the Emerging Markets Growth Fund, the Emerging Markets Leaders Fund, the Emerging Markets Small Cap Growth Fund, the Bond Fund and the Low Duration Fund) and other Fund expenses. The example is intended to help you understand your ongoing costs (in dollars) of investing in the Fund and to compare these costs with the ongoing costs of investing in other mutual funds. To do so, compare the Fund’s 5% hypothetical example with the 5% hypothetical examples that appear in the shareholder reports of other funds. The example is based on an investment of $1,000 invested at the beginning of the period and held for the entire six-month period from January 1, 2013 to June 30, 2013. |
| | |
| | Actual Expenses |
| | |
| | In each example, the first line for each share class in the table provides information about the actual account values and actual expenses. These expenses reflect the effect of any expense cap applicable to the share class during the period. Without this expense cap, the costs shown in the table would have been higher. You may use the information in this line, together with the amount you invested, to estimate the expenses that you paid over the period. Simply divide your account value by $1,000 (example, an $8,600 account value divided by $1,000 = 8.6), then multiply the result by the number in the first line under the heading entitled “Expenses Paid During the Period” to estimate the expenses you paid on your account during the period. |
| | |
| | Hypothetical Example for Comparison Purposes |
| | |
| | In each example, the second line for each share class in the table provides information about hypothetical account values and hypothetical expenses based on the Fund’s actual expense ratio and an assumed rate of return of 5% per year before expenses. This is not the Fund’s actual return. The hypothetical account values and expenses may not be used to estimate the actual ending account balance or expenses you paid for the period. You may use this information to compare the ongoing costs of investing in the Fund to other funds. To do so, compare this 5% hypothetical example with the 5% hypothetical examples that appear in the shareholder reports of other funds. |
| | |
| | Please note that the expenses shown in both examples are meant to highlight your ongoing costs only and do not reflect any transactional costs or account type fees, such as redemption fees and IRA Fiduciary Administration fees, respectively. These fees are fully described in the prospectus. Therefore, the second line of each share class in the table is useful in comparing ongoing costs only and will not help you determine the relative costs of owning different funds. In addition, if these transactional costs or account fees were included, your costs would have been higher. |
| 196 | Semi-Annual Report | June 30, 2013 |
| Fund Expenses (unaudited) |
The example below shows you the ongoing costs (in dollars) of investing in your fund and allows you to compare these costs with those of other mutual funds. Please refer to the previous page for a detailed explanation of the information presented in these charts.
| Expense Example | | Beginning
Account Value
1/1/2013 | | Ending
Account Value
6/30/2013 | | Expenses Paid
During
the Period (a) | | Annualized
Expense Ratio | |
| Growth Fund | | | | | | | | | | | | | | | | | |
| Class N-actual return | | $ | 1,000.00 | | | $ | 1,115.40 | | | $ | 6.15 | | | | 1.17 | % | |
| Class N-hypothetical 5% return | | | 1,000.00 | | | | 1,044.18 | | | | 5.95 | | | | 1.17 | | |
| Class I-actual return | | | 1,000.00 | | | | 1,117.60 | | | | 4.49 | | | | 0.86 | | |
| Class I-hypothetical 5% return | | | 1,000.00 | | | | 1,045.76 | | | | 4.34 | | | | 0.86 | | |
| Large Cap Growth Fund | | | | | | | | | | | | | | | | | |
| Class N-actual return | | | 1,000.00 | | | | 1,093.40 | | | | 6.23 | | | | 1.20 | | |
| Class N-hypothetical 5% return | | | 1,000.00 | | | | 1,044.05 | | | | 6.08 | | | | 1.20 | | |
| Class I-actual return | | | 1,000.00 | | | | 1,094.60 | | | | 4.93 | | | | 0.95 | | |
| Class I-hypothetical 5% return | | | 1,000.00 | | | | 1,045.29 | | | | 4.82 | | | | 0.95 | | |
| Mid Cap Growth Fund | | | | | | | | | | | | | | | | | |
| Class N-actual return | | | 1,000.00 | | | | 1,124.90 | | | | 7.11 | | | | 1.35 | | |
| Class N-hypothetical 5% return | | | 1,000.00 | | | | 1,043.31 | | | | 6.84 | | | | 1.35 | | |
| Class I-actual return | | | 1,000.00 | | | | 1,126.30 | | | | 5.80 | | | | 1.10 | | |
| Class I-hypothetical 5% return | | | 1,000.00 | | | | 1,044.55 | | | | 5.58 | | | | 1.10 | | |
| Small-Mid Cap Growth Fund | | | | | | | | | | | | | | | | | |
| Class N-actual return | | | 1,000.00 | | | | 1,190.70 | | | | 7.33 | | | | 1.35 | | |
| Class N-hypothetical 5% return | | | 1,000.00 | | | | 1,043.31 | | | | 6.84 | | | | 1.35 | | |
| Class I-actual return | | | 1,000.00 | | | | 1,192.40 | | | | 5.93 | | | | 1.09 | | |
| Class I-hypothetical 5% return | | | 1,000.00 | | | | 1,044.59 | | | | 5.53 | | | | 1.09 | | |
| Small Cap Growth Fund | | | | | | | | | | | | | | | | | |
| Class N-actual return | | | 1,000.00 | | | | 1,236.50 | | | | 8.32 | | | | 1.50 | | |
| Class N-hypothetical 5% return | | | 1,000.00 | | | | 1,042.56 | | | | 7.60 | | | | 1.50 | | |
| Class I-actual return | | | 1,000.00 | | | | 1,238.40 | | | | 6.94 | | | | 1.25 | | |
| Class I-hypothetical 5% return | | | 1,000.00 | | | | 1,043.80 | | | | 6.33 | | | | 1.25 | | |
| Global Leaders Fund | | | | | | | | | | | | | | | | | |
| Institutional Class-actual return | | | 1,000.00 | | | | 1,047.50 | | | | 1.71 | | | | 1.10 | | |
| Institutional Class-hypothetical 5% return | | | 1,000.00 | | | | 1,044.55 | | | | 5.58 | | | | 1.10 | | |
| Class N-actual return | | | 1,000.00 | | | | 1,046.50 | | | | 7.61 | | | | 1.50 | | |
| Class N-hypothetical 5% return | | | 1,000.00 | | | | 1,042.56 | | | | 7.60 | | | | 1.50 | | |
| Class I-actual return | | | 1,000.00 | | | | 1,046.50 | | | | 6.34 | | | | 1.25 | | |
| Class I-hypothetical 5% return | | | 1,000.00 | | | | 1,043.80 | | | | 6.33 | | | | 1.25 | | |
| Global Small Cap Growth Fund | | | | | | | | | | | | | | | | | |
| Class N-actual return (b) | | | 1,000.00 | | | | 1,031.00 | | | | 8.31 | | | | 1.65 | | |
| Class N-hypothetical 5% return (6 month period) | | | 1,000.00 | | | | 1,041.82 | | | | 8.35 | | | | 1.65 | | |
| Class I-actual return (b) | | | 1,000.00 | | | | 1,030.00 | | | | 7.05 | | | | 1.40 | | |
| Class I-hypothetical 5% return (6 month period) | | | 1,000.00 | | | | 1,043.06 | | | | 7.09 | | | | 1.40 | | |
| International Growth Fund | | | | | | | | | | | | | | | | | |
| Class N-actual return | | | 1,000.00 | | | | 1,019.60 | | | | 7.11 | | | | 1.42 | | |
| Class N-hypothetical 5% return | | | 1,000.00 | | | | 1,042.96 | | | | 7.19 | | | | 1.42 | | |
| Class I-actual return | | | 1,000.00 | | | | 1,021.40 | | | | 5.68 | | | | 1.13 | | |
| Class I-hypothetical 5% return | | | 1,000.00 | | | | 1,044.38 | | | | 5.74 | | | | 1.13 | | |
| Institutional International Growth Fund | | | | | | | | | | | | | | | | | |
| Institutional Class-actual return | | | 1,000.00 | | | | 1,022.20 | | | | 4.87 | | | | 0.97 | | |
| Institutional Class-hypothetical 5% return | | | 1,000.00 | | | | 1,045.18 | | | | 4.92 | | | | 0.97 | | |
| International Equity Fund | | | | | | | | | | | | | | | | | |
| Class N-actual return | | | 1,000.00 | | | | 1,029.00 | | | | 7.29 | | | | 1.45 | | |
| Class N-hypothetical 5% return | | | 1,000.00 | | | | 1,042.81 | | | | 7.34 | | | | 1.45 | | |
| Class I-actual return | | | 1,000.00 | | | | 1,031.20 | | | | 6.04 | | | | 1.20 | | |
| Class I-hypothetical 5% return | | | 1,000.00 | | | | 1,044.05 | | | | 6.08 | | | | 1.20 | | |
| Institutional International Equity Fund | | | | | | | | | | | | | | | | | |
| Institutional Class-actual return | | | 1,000.00 | | | | 1,031.40 | | | | 5.54 | | | | 1.10 | | |
| Institutional Class-hypothetical 5% return | | | 1,000.00 | | | | 1,044.55 | | | | 5.58 | | | | 1.10 | | |
| June 30, 2013 | William Blair Funds | 197 |
| Expense Example | | Beginning
Account Value
1/1/2013 | | Ending
Account Value
6/30/2013 | | Expenses Paid
During
the Period (a) | | Annualized
Expense Ratio | |
| International Leaders Fund | | | | | | | | | | | | | | | | | |
| Class N-actual return | | $ | 1,000.00 | | | $ | 1,025.00 | | | $ | 7.28 | | | | 1.45 | % | |
| Class N-hypothetical 5% return | | | 1,000.00 | | | | 1,042.81 | | | | 7.34 | | | | 1.45 | | |
| Class I-actual return | | | 1,000.00 | | | | 1,026.80 | | | | 6.03 | | | | 1.20 | | |
| Class I-hypothetical 5% return | | | 1,000.00 | | | | 1,044.05 | | | | 6.08 | | | | 1.20 | | |
| Institutional Class-actual return | | | 1,000.00 | | | | 1,027.80 | | | | 5.28 | | | | 1.05 | | |
| Institutional Class-hypothetical 5% return | | | 1,000.00 | | | | 1,044.79 | | | | 5.32 | | | | 1.05 | | |
| International Small Cap Growth Fund | | | | | | | | | | | | | | | | | |
| Class N-actual return | | | 1,000.00 | | | | 1,069.10 | | | | 8.14 | | | | 1.59 | | |
| Class N-hypothetical 5% return | | | 1,000.00 | | | | 1,042.13 | | | | 8.04 | | | | 1.59 | | |
| Class I-actual return | | | 1,000.00 | | | | 1,070.70 | | | | 6.64 | | | | 1.29 | | |
| Class I-hypothetical 5% return | | | 1,000.00 | | | | 1,043.59 | | | | 6.55 | | | | 1.29 | | |
| Institutional Class-actual return | | | 1,000.00 | | | | 1,071.80 | | | | 5.45 | | | | 1.06 | | |
| Institutional Class-hypothetical 5% return | | | 1,000.00 | | | | 1,044.74 | | | | 5.38 | | | | 1.06 | | |
| Emerging Markets Growth Fund | | | | | | | | | | | | | | | | | |
| Class N-actual return | | | 1,000.00 | | | | 937.30 | | | | 8.06 | | | | 1.68 | | |
| Class N-hypothetical 5% return | | | 1,000.00 | | | | 1,041.67 | | | | 8.50 | | | | 1.68 | | |
| Class I-actual return | | | 1,000.00 | | | | 939.30 | | | | 6.72 | | | | 1.40 | | |
| Class I-hypothetical 5% return | | | 1,000.00 | | | | 1,043.07 | | | | 7.08 | | | | 1.40 | | |
| Institutional Class-actual return | | | 1,000.00 | | | | 939.70 | | | | 0.00 | | | | 1.19 | | |
| Institutional Class-hypothetical 5% return | | | 1,000.00 | | | | 1,044.09 | | | | 6.04 | | | | 1.19 | | |
| Emerging Markets Leaders Fund | | | | | | | | | | | | | | | | | |
| Class N-actual return | | | 1,000.00 | | | | 925.00 | | | | 7.88 | | | | 1.65 | | |
| Class N-hypothetical 5% return | | | 1,000.00 | | | | 1,041.82 | | | | 8.35 | | | | 1.65 | | |
| Class I-actual return | | | 1,000.00 | | | | 925.90 | | | | 6.69 | | | | 1.40 | | |
| Class I-hypothetical 5% return | | | 1,000.00 | | | | 1,043.06 | | | | 7.09 | | | | 1.40 | | |
| Institutional Class-actual return | | | 1,000.00 | | | | 925.90 | | | | 5.97 | | | | 1.25 | | |
| Institutional Class-hypothetical 5% return | | | 1,000.00 | | | | 1,043.80 | | | | 6.33 | | | | 1.25 | | |
| Emerging Markets Small Cap Growth Fund | | | | | | | | | | | | | | | | | |
| Class N-actual return | | | 1,000.00 | | | | 1,065.40 | | | | 8.45 | | | | 1.65 | | |
| Class N-hypothetical 5% return | | | 1,000.00 | | | | 1,041.82 | | | | 8.35 | | | | 1.65 | | |
| Class I-actual return | | | 1,000.00 | | | | 1,066.20 | | | | 7.17 | | | | 1.40 | | |
| Class I-hypothetical 5% return | | | 1,000.00 | | | | 1,043.06 | | | | 7.09 | | | | 1.40 | | |
| Institutional Class-actual return | | | 1,000.00 | | | | 1,066.20 | | | | 6.40 | | | | 1.25 | | |
| Institutional Class-hypothetical 5% return | | | 1,000.00 | | | | 1,043.80 | | | | 6.33 | | | | 1.25 | | |
| Large Cap Value Fund | | | | | | | | | | | | | | | | | |
| Class N-actual return | | | 1,000.00 | | | | 1,150.80 | | | | 6.40 | | | | 1.20 | | |
| Class N-hypothetical 5% return | | | 1,000.00 | | | | 1,044.05 | | | | 6.08 | | | | 1.20 | | |
| Class I-actual return | | | 1,000.00 | | | | 1,151.50 | | | | 5.07 | | | | 0.95 | | |
| Class I-hypothetical 5% return | | | 1,000.00 | | | | 1,045.29 | | | | 4.82 | | | | 0.95 | | |
| Mid Cap Value Fund | | | | | | | | | | | | | | | | | |
| Class N-actual return | | | 1,000.00 | | | | 1,152.80 | | | | 7.21 | | | | 1.35 | | |
| Class N-hypothetical 5% return | | | 1,000.00 | | | | 1,043.31 | | | | 6.84 | | | | 1.35 | | |
| Class I-actual return | | | 1,000.00 | | | | 1,154.50 | | | | 5.88 | | | | 1.10 | | |
| Class I-hypothetical 5% return | | | 1,000.00 | | | | 1,044.55 | | | | 5.58 | | | | 1.10 | | |
| Small-Mid Cap Value Fund | | | | | | | | | | | | | | | | | |
| Class N-actual return | | | 1,000.00 | | | | 1,167.40 | | | | 7.52 | | | | 1.40 | | |
| Class N-hypothetical 5% return | | | 1,000.00 | | | | 1,043.06 | | | | 7.09 | | | | 1.40 | | |
| Class I-actual return | | | 1,000.00 | | | | 1,169.20 | | | | 6.19 | | | | 1.15 | | |
| Class I-hypothetical 5% return | | | 1,000.00 | | | | 1,044.30 | | | | 5.83 | | | | 1.15 | | |
| Small Cap Value Fund | | | | | | | | | | | | | | | | | |
| Class N-actual return | | | 1,000.00 | | | | 1,175.80 | | | | 7.82 | | | | 1.45 | | |
| Class N-hypothetical 5% return | | | 1,000.00 | | | | 1,042.81 | | | | 7.34 | | | | 1.45 | | |
| Class I-actual return | | | 1,000.00 | | | | 1,178.00 | | | | 6.48 | | | | 1.20 | | |
| Class I-hypothetical 5% return | | | 1,000.00 | | | | 1,044.05 | | | | 6.08 | | | | 1.20 | | |
| 198 | Semi-Annual Report | June 30, 2013 |
| Expense Example | | Beginning
Account Value
1/1/2013 | | Ending
Account Value
6/30/2013 | | Expenses Paid
During
the Period (a) | | Annualized
Expense Ratio | |
| Bond Fund | | | | | | | | | | | | | | | | | |
| Class N-actual return | | $ | 1,000.00 | | | $ | 966.30 | | | $ | 3.17 | | | | 0.65 | % | |
| Class N-hypothetical 5% return | | | 1,000.00 | | | | 1,046.78 | | | | 3.30 | | | | 0.65 | | |
| Class I-actual return | | | 1,000.00 | | | | 967.40 | | | | 2.44 | | | | 0.50 | | |
| Class I-hypothetical 5% return | | | 1,000.00 | | | | 1,047.52 | | | | 2.54 | | | | 0.50 | | |
| Institutional Class-actual return | | | 1,000.00 | | | | 968.10 | | | | 1.71 | | | | 0.35 | | |
| Institutional Class-hypothetical 5% return | | | 1,000.00 | | | | 1,048.26 | | | | 1.78 | | | | 0.35 | | |
| Income Fund | | | | | | | | | | | | | | | | | |
| Class N-actual return | | | 1,000.00 | | | | 975.50 | | | | 4.01 | | | | 0.82 | | |
| Class N-hypothetical 5% return | | | 1,000.00 | | | | 1,045.94 | | | | 4.15 | | | | 0.82 | | |
| Class I-actual return | | | 1,000.00 | | | | 976.40 | | | | 2.81 | | | | 0.57 | | |
| Class I-hypothetical 5% return | | | 1,000.00 | | | | 1,047.15 | | | | 2.91 | | | | 0.57 | | |
| Low Duration Fund | | | | | | | | | | | | | | | | | |
| Class N-actual return | | | 1,000.00 | | | | 987.30 | | | | 3.40 | | | | 0.69 | | |
| Class N-hypothetical 5% | | | 1,000.00 | | | | 1,046.58 | | | | 3.50 | | | | 0.69 | | |
| Class I-actual return | | | 1,000.00 | | | | 988.00 | | | | 2.63 | | | | 0.53 | | |
| Class I-hypothetical 5% | | | 1,000.00 | | | | 1,047.36 | | | | 2.71 | | | | 0.53 | | |
| Institutional Class-actual return | | | 1,000.00 | | | | 989.90 | | | | 1.86 | | | | 0.38 | | |
| Institutional Class-hypothetical 5% return | | | 1,000.00 | | | | 1,048.13 | | | | 1.91 | | | | 0.38 | | |
| Ready Reserve Fund | | | | | | | | | | | | | | | | | |
| Class N-actual return | | | 1,000.00 | | | | 1,000.00 | | | | 0.50 | | | | 0.10 | | |
| Class N-hypothetical 5% return | | | 1,000.00 | | | | 1,049.50 | | | | 0.51 | | | | 0.10 | | |
| (a) | Expenses are equal to the annualized expense ratio, multiplied by the average account value over the period, multiplied by the number of days in the period 181, and divided by 365 (to reflect the one-half year period). |
| (b) | For the period April 10, 2013 (Commencement of Operations) to June 30, 2013. |
| June 30, 2013 | William Blair Funds | 199 |
BOARD OF TRUSTEES
Vann A. Avedisian
Principal, Highgate Holdings
Kathleen T. Barr
President, Productive Capital Management, Inc.
Phillip O. Peterson
Retired Partner, KPMG LLP
Donald J. Reaves
Chancellor, Winston-Salem State University
Donald L. Seeley
Retired Adjunct Lecturer and Director, University of Arizona Department of Finance
Michelle R. Seitz, Chairman and President
Partner, William Blair & Company, L.L.C.
Thomas J. Skelly
Retired Managing Partner, Accenture U.S.
Richard W. Smirl, Senior Vice President
Partner, William Blair & Company L.L.C.
Officers
Michael P. Balkin, Senior Vice President
Karl W. Brewer, Senior Vice President
Andrew G. Flynn, Senior Vice President
David C. Fording, Senior Vice President
James S. Golan, Senior Vice President
W. George Greig, Senior Vice President
Michael A. Jancosek, Senior Vice President
John F. Jostrand, Senior Vice President
Chad M. Kilmer, Senior Vice President
Robert C. Lanphier, IV, Senior Vice President
Mark T. Leslie, Senior Vice President
Matthew A. Litfin, Senior Vice President
Kenneth J. McAtamney, Senior Vice President
Todd M. McClone, Senior Vice President
David Merjan, Senior Vice President
David S. Mitchell, Senior Vice President
David P. Ricci, Senior Vice President
Brian D. Singer, Senior Vice President
Paul J. Sularz, Senior Vice President
Jeffrey A. Urbina, Senior Vice President
Christopher T. Vincent, Senior Vice President
Kathleen M. Lynch, Vice President
David F. Hone, Vice President
John Abunassar, Vice President
Peter Carl, Vice President
Jason Moede, Vice President
D. Trowbridge Elliman III, Vice President
Christopher Walvoord, Vice President
Brian Ziv, Vice President
Edwin Denson, Vice President
Thomas Clarke, Vice President
Walter R. Randall, Jr., Chief Compliance Officer and Assistant Secretary
Colette M. Garavalia, Treasurer
Andrew T. Pfau, Secretary
John M. Raczek, Assistant Treasurer
Investment Advisor
William Blair & Company, L.L.C.
Independent Registered Public Accounting Firm
Ernst & Young LLP
Legal Counsel
Vedder Price P.C.
Transfer Agent
Boston Financial Data Services, Inc.
P.O. Box 8506
Boston, MA 02266-8506
For customer assistance, call 1-800-635-2886
(Massachusetts 1-800-635-2840)
| 200 | Semi-Annual Report | June 30, 2013 |
| DOMESTIC EQUITY | | GLOBAL EQUITY | | FIXED-INCOME |
| Growth Fund | | Global Growth Fund | | Bond Fund |
| Large Cap Growth Fund | | Global Small Cap Growth Fund | | Income Fund |
| Small Cap Growth Fund | | | | Low Duration Fund |
| Mid Cap Growth Fund | | INTERNATIONAL EQUITY | | |
| Small-Mid Cap Growth Fund | | International Growth Fund | | MONEY MARKET |
| | | Institutional International Growth Fund | | |
| Large Cap Value Fund | | International Equity Fund | | Ready Reserves Fund |
| Small Cap Value Fund | | Institutional International Equity Fund | | |
| Mid Cap Value Fund | | International Leaders Fund | | |
| Small-Mid Cap Value Fund | | International Small Cap Growth Fund | | |
| | | Emerging Markets Growth Fund | | |
| | | Emerging Markets Leaders Fund | | |
| | | Emerging Markets Small Cap Growth Fund | | |
 | | ©William Blair & Company, L.L.C., distributor | |
| +1 800 742 7272 | 222 West Adams Street | |
| williamblairfunds.com | Chicago, Illinois 60606 | 00103188 |
| Item 2. | Code of Ethics |
| | |
| Not applicable to this filing. |
| | |
| Item 3. | Audit Committee Financial Expert |
| | |
| Not applicable to this filing. |
| | |
| Item 4. | Principal Accountant Fees and Services |
| | |
| Not applicable to this filing. |
| | |
| Item 5. | Audit Committee of Listed Registrants |
| | |
| Not Applicable to this Registrant, insofar as the Registrant is not a listed company. |
| | |
| Item 6. | Schedule of Investments |
| | |
| See Schedule of Investments in Item 1 |
| | |
| Item 7. | Disclosure of Proxy Voting Policies and Procedures for Closed-End Management Investment Companies |
| | |
| Not applicable to this Registrant, insofar as the Registrant is not a closed-end management investment company. |
| | |
| Item 8. | Portfolio Managers of Closed Investment Companies |
| | |
| Not applicable to this Registrant, insofar as the Registrant is not a closed-end management investment company. |
| | |
| Item 9. | Purchase of Equity Securities by Closed-End Management Investment Companies and Affiliated Purchasers |
| | |
| Not applicable to this Registrant, insofar as the Registrant is not a closed-end management investment company. |
| | |
| Item 10. | Submission of Matters to a Vote of Security Holders |
There have been no material changes to the procedures by which shareholders may recommend nominees to the Registrant’s Board of Trustees since the Registrant last provided disclosure in response to this item.
| Item 11. | |
| | |
| Controls and Procedures |
(a) The Registrant’s principal executive and principal financial officer, or persons performing similar functions, have concluded that the Registrant’s Disclosure Controls and Procedures (as defined in Rule 30a-3(c) under the Investment Company Act of 1940, as amended (the “1940 Act”) (17 CFR 270.30a-3(c)) are effective, as of a date within 90 days of the filing date of this report that includes the disclosure required by this paragraph, based on their evaluation of these controls and procedures required by Rule 30a-3 (b) under the 1940 Act (17 CFR 270.30a-3(b) and Rules 13a-15(b) or 15d-15(b) under the Exchange Act (17 CFR 240.13a-15(b) or 240.15d-15(b)).
(b) There were no changes in the Registrant’s internal control over financial reporting (as defined in Rule 30a-3(d) under the 1940 Act (17 CFR 270.30a-3(d)) that occurred during the final quarter of the period covered by this report that has materially affected, or is reasonably likely to materially affect, the Registrant’s internal control over financial reporting.
| Item 12. | Exhibits |
| | |
| 12. (a) (1) Code of Ethics |
| Not applicable because it is posted on Registrant’s website. |
| |
| 12. (a) (2) (1) |
| |
| Certification of Principal Executive Officer Required by Rule 30a-2(a) of the Investment Company Act |
| |
| 12. (a) (2) (2) |
| |
| Certification of Principal Financial Officer Required by Rule 30a-2(a) of the Investment Company Act. |
| |
| 12. (a) (3) |
| |
| Not applicable to this Registrant. |
Certification of Chief Executive Officer and Certification of Chief Financial Officer Required by Rule 30a-2(b) of the Investment Company Act
Pursuant to the requirements of the Securities Exchange Act of 1934 and the Investment Company Act of 1940, the Registrant has duly caused this report to be signed on its behalf by the undersigned, thereunto duly authorized.
| | William Blair Funds | |
| | | |
| | /s/ Michelle R. Seitz | |
| By: | Michelle R. Seitz | |
| | President | |
| | (Chief Executive Officer) | |
| | | |
| Date: August 27, 2013 | |
Pursuant to the requirements of the Securities Exchange Act of 1934 and the Investment Company Act of 1940, this report has been signed below by the following persons on behalf of the Registrant and in the capacities and on the dates indicated
| | /s/ Michelle R. Seitz | |
| By: | Michelle R. Seitz | |
| | President | |
| | (Chief Executive Officer) | |
| Date: August 27, 2013 | |
| | | |
| | /s/ Colette M. Garavalia | |
| By: | Colette M. Garavalia | |
| | Treasurer | |
| | (Chief Financial Officer) | |
| | | |
| Date: August 27, 2013 | |