UNITED STATES
SECURITIES AND EXCHANGE COMMISSION
Washington, D.C. 20549
Form N-CSR
CERTIFIED SHAREHOLDER REPORT OF REGISTERED
MANAGEMENT INVESTMENT COMPANIES
Investment Company Act File Number 811-5344
William Blair Funds
(Exact name of registrant as specified in charter)
| 222 West Adams Street, Chicago, IL | 60606 |
| (Address of principal executive offices) | (Zip Code) |
Michelle R. Seitz
William Blair Funds
222 West Adams Street, Chicago, IL 60606
(Name and address of agent for service)
Registrant’s telephone number, including area code: 312-236-1600
Date of fiscal year end: October 31
Date of reporting period: April 30, 2013
Form N-CSR is to be used by management investment companies to file reports with the Commission not later than 10 days after the transmission to stockholders of any report that is required to be transmitted to stockholders under Rule 30e-1 under the Investment Company Act of 1940 (17 CFR 270.30e-1). The Commission may use the information provided on Form N-CSR in its regulatory, disclosure review, inspection, and policymaking roles.
A registrant is required to disclose the information specified by Form N-CSR, and the Commission will make this information public. A Registrant is not required to respond to the collection of information contained in Form N-CSR unless the form displays a currently valid Office of Management and Budget (“OMB”) control number. Please direct comments concerning the accuracy of the information collection burden estimates and any suggestions for reducing the burden to Secretary, Securities and Exchange Commission, 450 Fifth Street, NW, Washington, DC 20549-0609. The OMB has reviewed this collection of information under the clearance requirements of 44 U.S.C. (ss) 3507.
| Item 1. | April 30, 2013 Semi Annual Reports transmitted to shareholders. |

| | April 30, 2013 |
| | Multi-Asset and Alternatives Funds |
| | |
William Blair Funds
Semiannual Report | |
| | |
| April 30, 2013 | William Blair Funds | 1 |
| | MACRO ALLOCATION FUND |
| | |
| | AN OVERVIEW FROM THE PORTFOLIO MANAGERS |
| | |
 Brian D. Singer 
Edwin Denson 
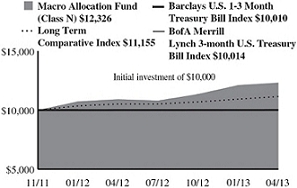
Thomas Clarke | The Macro Allocation Fund (Class N shares) posted an 8.49% increase, net of fees, for the six months ended April 30, 2013. By comparison, the Fund’s benchmarks, the BofA Merrill Lynch 3-Month U.S. Treasury Bill Index and its Long-Term Comparative Index, returned 0.06% and 4.31%, respectively, for the same period. The Long-Term Comparative Index return is comprised of the following indices: 40% Barclays U.S. Aggregate Index, 30% MSCI All Country World Index (net), and 30% BofA Merrill Lynch 3-Month U.S. Treasury Bill Index. The Fund benefited from positive contributions from both its market-oriented strategies and its currency-oriented strategy during the period covered by this report. Market performance benefited from an aggregate long exposure to equities, particularly within developed Europe and Japan, as well as from a long exposure to U.S. high yield. Market performance suffered due to short exposures to safe haven sovereign bond markets within the European Monetary Union and an average effective net short exposure to U.S. equities. Currency performance benefited from short exposures to the Japanese yen, as well as from an aggregate long exposure to emerging markets currencies, particularly within Asia. Currency performance was hurt by short exposures to the Australian dollar and the New Zealand dollar. We believe that the Fund remains positioned consistent with an elevated level of long-term opportunity, with an anticipation of continued long-term certainty about near-term stability, particularly within Europe. We are keeping a cautious eye toward safe haven sovereigns, and continue to anticipate the second half of calendar 2013 where much remains to be resolved in the U.S. with respect to the debt ceiling, the sequester, and the budget. Long equity exposure continues to be tilted toward Europe and the emerging markets. Call options on U.S. bonds remain in place and are designed to limit the downside from the Fund’s otherwise short exposure to these markets in case yields fall further. The Fund also has kept much of its long equity exposure protected with put options. |
| 2 | Semi-Annual Report | April 30, 2013 |
Macro Allocation Fund
Performance Highlights (Unaudited)
| Average Annual Total Return at 4/30/2013 | | | | | |
| | Fiscal Year | | | | Since |
| | to Date | | 1 Year | | Inception(a) |
| Class N | 8.49% | | 12.89% | | 15.84% |
| Class I | 8.52% | | 13.12% | | 16.08% |
BofA Merrill Lynch 3-month
U.S. Treasury Bill Index | 0.06% | | 0.12% | | 0.10% |
Barclays U.S. 1-3 Month
Treasury Bill Index | 0.04% | | 0.08% | | 0.07% |
| Long-Term Comparitive Index | 4.31% | | 6.01% | | 7.99% |
| (a) | For the period from November 29, 2011 (Commencement of Operations) to April 30, 2013. |
Performance cited represents past performance. Past performance does not guarantee future results and current performance may be lower or higher than the data quoted. Results shown are average annual total returns, which assume reinvestment of dividends and capital gains. Investment returns and principal will fluctuate and you may have a gain or loss when you sell shares. For the most current month-end performance information, please call 1-800-742-7272, or visit our Web site at www.williamblairfunds.com. The Fund involves a high level of risk and may not be appropriate for everyone. You could lose money by investing in the Fund. There can be no assurance that the Fund’s investment objective will be achieved or that the Fund’s investment strategies will be successful. The Fund is not a complete investment program. From time to time, the investment advisor may waive fees or reimburse expenses for the Fund. Without these waivers, performance would be lower. Class N shares are available to the general public without a sales load. Class I shares are available to certain institutional investors and advisory clients of William Blair & Company, L.L.C., without a sales load or distribution (12b-1) or service fees.
The performance highlights and graph presented above do not reflect the deduction of taxes that a shareholder would pay on fund distributions or the redemption of fund shares.
Effective March 1, 2013, the Fund uses the BofA Merrill Lynch 3-month U.S. Treasury Bill Index as the broad-based index because it is included as part of the Long-Term Comparative Index.
The BofA Merrill Lynch 3-Month U.S. Treasury Bill Index measures total return on cash, including price and interest income, based on short-term government Treasury Bills of about 90-day maturity. The Index is unmanaged, does not incur fees or expenses, and cannot be invested in directly.
The Barclays 1-3 Month U.S. Treasury Bill Index includes all publicly issued zero-coupon U.S. Treasury Bills that have a remaining maturity of less than 3 months and more than 1 month, are rated investment grade, and have $250 million or more of outstanding face value. In addition, the securities must be denominated in U.S. dollars and must be fixed rate and non convertible.
The Long-Term Comparative Index return is comprised of the following indices: 40% Barclays Capital U.S. Aggregate Index, 30% Morgan Stanley Capital International (MSCI) All Country World Index (net), and 30% Bank of America/Merrill Lynch 3-month U.S. Treasury Bill Index.
This report identifies the Fund’s investments on April 30, 2013. These holdings are subject to change. Not all investments in the Fund performed the same, nor is there any guarantee that these investments will perform as well in the future. Market forecasts provided in this report may not necessarily come to pass.
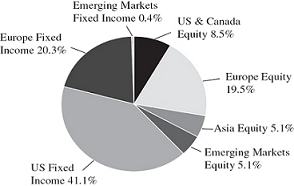
Sector Diversification (Unaudited)
The chart to the right is a graphical representation of gross portfolio exposure excluding forward foreign currency contracts as of April 30, 2013.
| April 30, 2013 | William Blair Funds | 3 |
| William Blair Macro Allocation Fund |
Portfolio of Investments, April 30, 2013 (unaudited)
| Issuer | | Shares or
Principal
Amount | | | Value | |
| | | | | | | | | |
| Exchange-Traded Funds—58.7% | | | | | | | | |
| Equity Exchange-Traded Funds—37.0% | | | | | | | | |
| Guggenheim China Small Cap ETF (a) | | | 45,000 | | | $ | 1,077,750 | |
| Guggenheim Frontier Markets ETF (a) | | | 150,000 | | | | 2,781,000 | |
| iShares FTSE China 25 Index Fund (a) | | | 28,000 | | | | 1,056,720 | |
| iShares MSCI EAFE Value Index (a) | | | 29,000 | | | | 1,532,940 | |
| iShares Russell 1000 Value Index Fund (a) | | | 110,000 | | | | 9,062,900 | |
| iShares S&P Global Energy Sector Index Fund (a) | | | 93,000 | | | | 3,719,070 | |
| SPDR S&P 500 ETF Trust (a) | | | 75,000 | | | | 11,976,000 | |
| SPDR S&P Emerging Markets Small Cap ETF (a) | | | 133,000 | | | | 6,526,310 | |
| Vanguard MSCI Emerging Markets ETF (a) | | | 24,000 | | | | 1,050,240 | |
| Vanguard MSCI European ETF (a) | | | 125,000 | | | | 6,420,000 | |
| Total Equity Exchange-Traded Funds | | | | | | | 45,202,930 | |
| Fixed Income Exchange-Traded Funds—21.7% | | | | |
| iShares iBoxx Investment Grade Corporate Bond Fund (a) | | | 127,000 | | | | 15,510,510 | |
| SPDR Barclays Capital High Yield Bond ETF (a) | | | 240,000 | | | | 10,020,000 | |
| WisdomTree Emerging Markets Local Debt ETF (a) | | | 19,000 | | | | 1,020,110 | |
| Total Fixed Income Exchange-Traded Funds | | | | | | | 26,550,620 | |
Total Exchange-Traded Funds—58.7%
(cost $68,426,967) | | | | | | | 71,753,550 | |
| | | | | | | | | |
| Common Stock—0.6% | | | | | | | | |
| | | | | | | | | |
| Europe—0.6% | | | | | | | | |
| France—0.6% | | | | | | | | |
| Schneider Electric S.A. (Electrical equipment) | | | 8,859 | | | | 675,511 | |
Total Common Stocks—0.6%
(cost $667,301) | | | | | | | 675,511 | |
| | | | | | | | | |
| Repurchase Agreement—27.7% | | | | | | | | |
Fixed Income Clearing Corporation,
0.060% dated 4/30/13, due 5/1/13,
repurchase price $33,775,983
collateralized by U.S. Treasury Note,
2.375%, due 10/31/14 | | $ | 33,775,927 | | | | 33,775,927 | |
Total Repurchase Agreement—27.7%
(cost $33,775,927) | | | | | | | 33,775,927 | |
| | | | | | | | | |
| U.S. Government—8.7% | | | | | | | | |
U.S. Treasury Bill,
0.180%, 5/2/13 | | | 125,000 | | | | 124,999 | |
U.S. Treasury Bill,
0.170%, 5/30/13 | | | 50,000 | | | | 49,993 | |
U.S. Treasury Bill,
0.180%–0.204%, 6/27/13 (a)(b) | | | 200,000 | | | | 199,938 | |
U.S. Treasury Bill,
0.170%–0.180%, 7/25/13 (a)(b) | | | 350,000 | | | | 349,853 | |
| Issuer | | Shares/
Principal
Amount/
Contracts | | | Value | |
| | | | | | | |
| U.S. Government—(continued) | | | | | | | | |
U.S. Treasury Bill,
0.180%, 8/22/13 (a)(b) | | $ | 100,000 | | | $ | 99,942 | |
U.S. Treasury Bill,
0.150%–0.170%, 9/19/13 (a)(b) | | | 1,550,000 | | | | 1,549,019 | |
U.S. Treasury Bill,
0.170%–0.180%, 10/17/13 (a)(b) | | | 1,250,000 | | | | 1,248,985 | |
U.S. Treasury Bill,
0.170%, 11/14/13 (a)(b) | | | 1,000,000 | | | | 999,097 | |
U.S. Treasury Bill,
0.130%, 1/9/14 (a)(b) | | | 1,000,000 | | | | 999,097 | |
U.S. Treasury Bill,
0.150%, 2/6/14 (a)(b) | | | 1,000,000 | | | | 998,841 | |
U.S. Treasury Bill,
0.130%–0.150%, 3/6/14 (a)(b) | | | 2,000,000 | | | | 1,997,588 | |
U.S. Treasury Bill,
0.130%, 4/3/14 (a)(b) | | | 2,000,000 | | | | 1,997,622 | |
Total U.S. Government—8.7%
(cost $10,614,974) | | | | | | | 10,614,974 | |
| | | | | | | | | |
| Purchased Options—0.8% | | | | | | | | |
| 10 Year U.S. Treasury Note, May 2013, Strike $131, CALL | | | 250 | | | | 601,563 | |
| S&P 500 Index, July 2013, Strike $1,475, PUT | | | 360 | | | | 423,000 | |
Total Purchased Options—0.8%
(cost $1,120,267) | | | | | | | 1,024,563 | |
| Total Investments in Securities—96.5% (cost $114,605,436) | | | | | | | 117,844,525 | |
| | | | | | | | | |
| Securities Sold Short—(6.0)% | | | | | | | | |
| Exchange-Traded Funds | | | | | | | | |
| iShares Russell 1000 Growth Index Fund | | | (100,000 | ) | | | (7,288,000 | ) |
Total Securities Sold Short—(6.0)%
(proceeds $6,706,050) | | | | | | | (7,288,000 | ) |
| Cash and other assets, less liabilities—9.5% | | | | | | | 11,585,708 | |
| Net assets—100.0% | | | | | | $ | 122,142,233 | |
| (a) | Security, or portion of security, is segregated as collateral for securities sold short and swap contracts aggregating a total value of $12,818,271. |
| (b) | Security, or portion of security, is pledged as collateral to cover initial margin requirements on open futures contracts aggregating a total value of $4,455,629. |
See accompanying Notes to Financial Statements.
| 4 | Semi-Annual Report | April 30, 2013 |
| William Blair Macro Allocation Fund |
Portfolio of Investments, April 30, 2013 (unaudited)
Forward Foreign Currency Contracts
Settlement
Date | | Deliver/Receive | | Counterparty | | Local Currency | | Current Value | | Net Unrealized
Appreciation
(Depreciation) |
| | | | | | | | | | | | | | |
| Purchased | | | | | | | | | | | | | |
| 5/15/13 | | Chinese Yuan Renminbi | | State Street Bank & Trust Company | | 87,808,000 | | $14,234,136 | | | $ | 254,819 | |
| 5/15/13 | | British Pound Sterling | | State Street Bank & Trust Company | | 8,261,000 | | 12,831,115 | | | | 55,763 | |
| 5/15/13 | | Hong Kong Dollar | | State Street Bank & Trust Company | | 29,487,000 | | 3,800,045 | | | | (2,120 | ) |
| 5/15/13 | | Hungarian Forint | | State Street Bank & Trust Company | | 470,759,000 | | 2,068,638 | | | | (42,950 | ) |
| 5/15/13 | | Indian Rupee | | State Street Bank & Trust Company | | 1,006,473,000 | | 18,638,110 | | | | 93,266 | |
| 5/15/13 | | Japanese Yen | | State Street Bank & Trust Company | | 637,564,000 | | 6,540,520 | | | | 16,616 | |
| 5/15/13 | | South Korean Won | | State Street Bank & Trust Company | | 15,501,409,000 | | 14,069,373 | | | | (54,936 | ) |
| 5/15/13 | | Mexican Peso | | State Street Bank & Trust Company | | 74,231,000 | | 6,107,337 | | | | 240,066 | |
| 5/15/13 | | Malaysian Ringgit | | State Street Bank & Trust Company | | 22,233,000 | | 7,300,976 | | | | 133,570 | |
| 5/15/13 | | Polish Zloty | | State Street Bank & Trust Company | | 5,777,000 | | 1,827,033 | | | | (11,194 | ) |
| 5/15/13 | | Thai Baht | | State Street Bank & Trust Company | | 151,157,000 | | 5,146,556 | | | | 78,424 | |
| 5/15/13 | | Taiwan Dollar | | State Street Bank & Trust Company | | 198,462,000 | | 6,725,804 | | | | 9,746 | |
| | | | | | | | | | | | $ | 771,070 | |
| Sold | | | | | | | | | | | | | |
| 5/15/13 | | Australian Dollar | | State Street Bank & Trust Company | | 16,607,000 | | $17,199,589 | | | $ | (160,464 | ) |
| 5/15/13 | | Brazilian Real | | State Street Bank & Trust Company | | 19,508,000 | | 9,736,874 | | | | (22,886 | ) |
| 5/15/13 | | Canadian Dollar | | State Street Bank & Trust Company | | 4,766,000 | | 4,729,242 | | | | (11,584 | ) |
| 5/15/13 | | Swiss Franc | | State Street Bank & Trust Company | | 21,966,000 | | 23,627,092 | | | | 150,107 | |
| 5/15/13 | | Czech Koruna | | State Street Bank & Trust Company | | 51,742,000 | | 2,641,819 | | | | 41,526 | |
| 5/15/13 | | Danish Krone | | State Street Bank & Trust Company | | 34,309,000 | | 6,061,293 | | | | 47,666 | |
| 5/15/13 | | Euro | | State Street Bank & Trust Company | | 5,705,000 | | 7,513,777 | | | | 113,026 | |
| 5/15/13 | | Japanese Yen | | State Street Bank & Trust Company | | 1,897,933,000 | | 19,470,155 | | | | 675,535 | |
| 5/15/13 | | New Zealand Dollar | | State Street Bank & Trust Company | | 10,492,000 | | 8,985,270 | | | | (203,553 | ) |
| 5/15/13 | | Singapore Dollar | | State Street Bank & Trust Company | | 4,832,000 | | 3,923,045 | | | | (26,406 | ) |
| 5/15/13 | | Thai Baht | | State Street Bank & Trust Company | | 151,157,000 | | 5,146,556 | | | | 122,074 | |
| 5/15/13 | | South African Rand | | State Street Bank & Trust Company | | 1,414,000 | | 157,320 | | | | (165 | ) |
| | | | | | | | | | | | $ | 724,876 | |
Futures Contracts
Number of
Contracts | | Description | | Expiration Date | | Local Currency | | Notional Amount
(Local) | | Net Unrealized
Appreciation
(Depreciation)
(USD) |
| | | | | | | | | | | | | | |
| Long | | | | | | | | | | | | | |
| 146 | | CAC 40 Index | | May 2013 | | Euro | | 5,204,433 | | | $ | 451,499 | |
| 105 | | IBEX 35 Index | | May 2013 | | Euro | | 8,230,843 | | | | 798,846 | |
| 40 | | NIKKEI 225 Index | | June 2013 | | Japanese Yen | | 243,008,080 | | | | 352,792 | |
| 9 | | ASX SPI 200 Index | | June 2013 | | Australian Dollar | | 1,134,906 | | | | 28,918 | |
| 190 | | EURO STOXX 50 Index | | June 2013 | | Euro | | 5,018,755 | | | | 68,936 | |
| 70 | | FTSE 100 Index | | June 2013 | | British Pound Sterling | | 4,487,082 | | | | (28,941 | ) |
| 47 | | FTSE MIB Index | | June 2013 | | Euro | | 3,929,648 | | | | (49,799 | ) |
| 43 | | S&P 500 E Mini Index | | June 2013 | | United States Dollar | | 3,328,119 | | | | 95,111 | |
| | | | | | | | | | | | $ | 1,717,362 | |
| Short | | | | | | | | | | | | | |
| 82 | | German Euro Bund* | | June 2013 | | Euro | | 11,791,100 | | | $ | (300,871 | ) |
| 151 | | Swiss Government Bond | | June 2013 | | Swiss Franc | | 23,042,500 | | | | (289,180 | ) |
| 91 | | 10YR JGB Mini | | June 2013 | | Japanese Yen | | 1,317,797,953 | | | | 18,946 | |
| 268 | | 10YR US Treasury Notes* | | June 2013 | | United States Dollar | | 35,259,149 | | | | (481,163 | ) |
| 85 | | FTSE 40 Index | | June 2013 | | South African Rand | | 29,249,833 | | | | 14,736 | |
| 29 | | S&P TSE 60 Index | | June 2013 | | Canadian Dollar | | 4,217,550 | | | | 103,419 | |
| 13 | | DAX Index | | June 2013 | | Euro | | 2,576,440 | | | | 2,785 | |
| 78 | | 5YR US Treasury Notes* | | June 2013 | | United States Dollar | | 9,667,438 | | | | (54,531 | ) |
| | | | | | | | | | | | $ | (985,859 | ) |
| * | Exposure to Futures Contract is achieved through the use of a swap contract with Credit Suisse. |
See accompanying Notes to Financial Statements.
| April 30, 2013 | William Blair Funds | 5 |
| William Blair Macro Allocation Fund |
Portfolio of Investments, April 30, 2013 (unaudited)
Total Return Swaps
| Reference Entity | | Floating Rate | | Pay/Receive
Floating Rate | | Expiration
Date | | Counterparty | | Notional
Amount | | Unrealized
Appreciation
(Depreciation) |
Credit Suisse Custom Equity Index
(U.S. Equities) | | 1 Month LIBOR
plus 45 bps | | | Pay | | 3/28/14 | | Credit Suisse International | | $ | 1,856,933 | | | | $ | (41,262 | ) |
Credit Suisse Custom Equity Index
(U.S. ETF) | | 1 Month LIBOR
minus 35 bps | | | Receive | | 3/28/14 | | Credit Suisse International | | | (2,107,919 | ) | | | | (36,109 | ) |
Credit Suisse Custom Equity Index
(Japanese Equities) | | 1 Month JPY LIBOR
plus 20 bps | | | Pay | | 7/17/13 | | Credit Suisse International | | | 3,576,708 | | | | | 210,870 | |
Credit Suisse Custom Equity Index
(U.S. Equities) | | 1 Month LIBOR
plus 65 bps | | | Pay | | 2/11/14 | | Credit Suisse International | | | 2,745,708 | | | | | 59,688 | |
Credit Suisse Custom Equity Index
(U.S. ETF) | | 1 Month LIBOR
minus 20 bps | | | Receive | | 2/11/14 | | Credit Suisse International | | | (3,107,809 | ) | | | | (204,604 | ) |
| | | | | | | | | | | | | | | | | $ | (11,417 | ) |
See accompanying Notes to Financial Statements.
| 6 | Semi-Annual Report | April 30, 2013 |
| | COMMODITY STRATEGY LONG/SHORT FUND |
| | |
| | AN OVERVIEW FROM THE PORTFOLIO MANAGERS |
| | |
 John Abunassar 
Peter Carl 
Toby Elliman 
Chris Walvoord 
Brian Ziv, CFA | Introduction The Commodity Strategy Long/Short Fund (Class N shares) posted a 3.40% decrease, net of fees, for the six months ended April 30, 2013. By comparison, the Fund’s benchmark index, the Morningstar Long/Short Commodity Index (the “Index”), decreased 0.82%. Over this stretch, inflation pressures remained subdued and long-only commodity indices were correspondingly negative (Dow Jones-UBS Commodity Index1 -6.34%, S&P GSCI2 -3.42%). Precious metals had a particularly difficult time over the last six months as risk assets, such as equities, remained popular and “safe haven” assets struggled; gold returned -14.37% and silver was an even worse -25.16% over the last six months. The cool, wet spring across the U.S. grain belt caused agricultural prices to ease considerably as well, with wheat (-15.44%), corn (-13.99%), and soybeans (-9.67%) leading the way to the downside. Portfolio Results While the Fund underperformed its benchmark Index over the period, the Fund has outperformed the Index since its inception on April 25, 2012 through April 30, 2013. The systematic portion of the portfolio, especially trend-following, continues to experience difficult trading conditions. The two trend-following managers in the portfolio returned -3.58% and -5.74% during the period. While trend-following is an essential element of the Fund’s strategy, steadily declining volatility provides a stiff headwind as trend-followers tend to carry an implicit long volatility profile. Commodity volatility, as measured by the Merrill Lynch (3-month) Commodity Volatility Index, dropped markedly during the period before rebounding slightly. On April 30, 2013, the Index reading stood at 12.03, down almost 40% from six months earlier. The lack of volatility tends to be most acutely felt by trend-followers but all types of commodity managers tend to suffer when volatility is low and/or declining. The performance highlight in the portfolio was the cotton specialist which was added during the period. This manager has returned a healthy 15.88% since its addition to the portfolio. While this manager trades an exceedingly narrow product set, its performance highlights the potential of specialized information and experience. While other agricultural commodities sold off strongly, cotton futures bucked the trend and rallied during the last six months, a move which the manager correctly anticipated and participated significantly in. The fixed income portion of the portfolio is invested in a diverse group of short duration and high-quality securities. This portion of the portfolio is intended to remain stable while the commodity future investments are intended to drive the overall return of the Fund. Outlook and Positioning With commodity volatility near all-time lows, we believe that the timing appears excellent for the strategies employed by commodity long-short managers. However, other conditions, such as a sustained disconnect between commodity fundamentals and commodity prices as well as persistently low interest rates, call for a conservative approach to portfolio construction. Given this backdrop, the portion of the portfolio dedicated to commodities continues to emphasize specialist managers (42.95% of the commodities portfolio) and fundamental managers (17.40%) relative to systematic managers (30.97% trend-following, 8.68% spread trading). In the coming six months, our preference for specialist managers is likely to become ever greater as our research efforts to extend both the depth and breadth of our manager lineup bears fruit. We are particularly excited by potential opportunities in energy (crude oil as well as refined products) and agricultural (e.g., soybeans) markets. In addition to a focused approach, we believe specialist managers tend to bring global networks of industry contacts, a firm grasp of supply and demand, and a full understanding of the positioning and tendencies of other market participants. Furthermore, specialist managers often have direct links to physical commodity businesses which can provide a steady stream of unique, timely, and actionable insights to assist their trading. As such, we believe the Fund’s positioning is not only excellent currently but should also improve incrementally going forward. 1 The S&P GSCI Index is a composite index of commodity sector returns representing an unleveraged, long-only investment in commodity futures that is broadly diversified across the spectrum of commodities. 2 The Dow Jones-UBS Commodity Index is a broadly diversified index that allows investors to track commodity futures through a single measure. |
| April 30, 2013 | William Blair Funds | 7 |
Commodity Strategy Long/Short Fund
Performance Highlights (Unaudited)

| Average Annual Total Return at 4/30/2013 | | | | | |
| | Fiscal Year | | | | Since |
| | to Date | | 1 Year | | Inception(a) |
| Class N | (3.40)% | | (4.65)% | | (4.40)% |
| Class I | (3.35)% | | (4.41)% | | (4.16)% |
| Morningstar Long/Short Commodity Index | (0.82)% | | (14.07)% | | (14.13)% |
| (a) | For the period from April 25, 2012 (Commencement of Operations) to April 30, 2013. |
Performance cited represents past performance. Past performance does not guarantee future results and current performance may be lower or higher than the data quoted. Results shown are average annual total returns, which assume reinvestment of dividends and capital gains. Investment returns and principal will fluctuate and you may have a gain or loss when you sell shares. For the most current month-end performance information, please call 1-800-742-7272, or visit our Web site at www.williamblairfunds.com. The Fund involves a high level of risk and may not be appropriate for everyone. You could lose money by investing in the Fund. There can be no assurance that the Fund's investment objective will be achieved or that the Fund's investment strategies will be successful. The Fund is not a complete investment program. From time to time, the investment advisor may waive fees or reimburse expenses for the Fund. Without these waivers, performance would be lower. Class N shares are available to the general public without a sales load. Class I shares are available to certain institutional investors and advisory clients of William Blair & Company, L.L.C., without a sales load or distribution (12b-1) or service fees.
The performance highlights and graph presented above do not reflect the deduction of taxes that a shareholder would pay on fund distributions or the redemption of fund shares.
The Morningstar Long/Short Commodity Index is a commodity futures index that uses the momentum rule to determine if each commodity is held long, short, or flat. The momentum rule compares a commodity's price to its 12 month moving average. If at monthly rebalance a commodity price is above its 12 month moving average, the index will take a long position. If the price is below its 12 month moving average, the index will take a short position. However, if the commodity is in the energy sector and the price is below its 12 month moving average, the index takes a flat position (position moved to cash).
This report identifies the Fund's investments on April 30, 2013. These holdings are subject to change. Not all investments in the Fund performed the same, nor is there any guarantee that these investments will perform as well in the future. Market forecasts provided in this report may not necessarily come to pass.
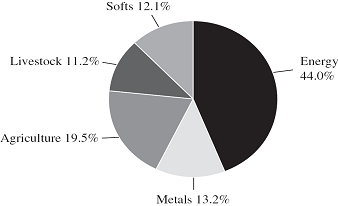
Sector Diversification (Unaudited)
The chart below provides a breakdown of the commodity exposure within the total return Swap as of April 30, 2013.
| 8 | Semi-Annual Report | April 30, 2013 |
| William Blair Commodity Strategy Long/Short Fund |
Consolidated Portfolio of Investments, April 30, 2013 (unaudited)
| | | | NRSRO | | Principal | | | | |
| | Issuer | | Rating | | Amount | | | Value | |
| | | | | | | | | | |
| | U.S. Government and U.S. Government Agency—74.6% | | | | | | | | | | | |
| | | | | | | | | | | | | |
| | Federal National Mortgage Association (FNMA)—52.4% | | | | | | | | | | | |
| # | 705741, 5.000%, due 6/1/18 | | | | | $ | 103,046 | | | $ | 110,313 | |
| # | 751313, 5.000%, due 3/1/19 | | | | | | 156,475 | | | | 170,926 | |
| # | 889670, 5.500%, due 6/1/23 | | | | | | 135,388 | | | | 149,814 | |
| # | AC3674, 4.500%, due 10/1/24 | | | | | | 1,123,975 | | | | 1,236,791 | |
| # | AC5124, 4.000%, due 11/1/24 | | | | | | 568,876 | | | | 623,642 | |
| # | AC0596, 4.000%, due 12/1/24 | | | | | | 379,800 | | | | 416,363 | |
| # | AC6257, 4.000%, due 12/1/24 | | | | | | 528,486 | | | | 579,364 | |
| # | 932629, 4.000%, due 3/1/25 | | | | | | 94,505 | | | | 103,603 | |
| # | AL2851, 4.000%, due 8/1/26 | | | | | | 325,453 | | | | 356,785 | |
| # | AK0498, 3.500%, due 1/1/27 | | | | | | 543,156 | | | | 590,036 | |
| # | AO0627, 3.500%, due 5/1/27 | | | | | | 1,693,638 | | | | 1,839,815 | |
| # | AP0446, 3.500%, due 7/1/27 | | | | | | 422,900 | | | | 459,401 | |
| # | AL2590, 4.000%, due 7/1/27 | | | | | | 558,214 | | | | 611,954 | |
| # | AA7611, 5.000%, due 5/1/39 | | | | | | 126,615 | | | | 143,031 | |
| # | 932638, 5.000%, due 3/1/40 | | | | | | 359,489 | | | | 399,809 | |
| | Total FNMA Mortgage Obligations | | | | | | | | | | 7,791,647 | |
| | | | | | | | | | | | | |
| | Federal Home Loan Mortgage Corp. (FHLMC)—18.4% | | | | | | | | | | | |
| # | G11697, 5.500%, due 4/1/20 | | | | | | 182,653 | | | | 197,590 | |
| # | G13124, 6.000%, due 12/1/22 | | | | | | 208,298 | | | | 230,213 | |
| # | J16051, 4.500%, due 7/1/26 | | | | | | 335,594 | | | | 365,801 | |
| # | J19032, 3.500%, due 5/1/27 | | | | | | 489,297 | | | | 531,342 | |
| # | J21621, 3.000%, due 12/1/27 | | | | | | 478,301 | | | | 512,933 | |
| # | G04053, 5.500%, due 3/1/38 | | | | | | 175,394 | | | | 195,527 | |
| # | G06964, 5.500%, due 11/1/38 | | | | | | 369,424 | | | | 418,270 | |
| # | G05723, 6.500%, due 11/1/38 | | | | | | 245,340 | | | | 276,542 | |
| | Total FHLMC Mortgage Obligations | | | | | | | | | | 2,728,218 | |
| | | | | | | | | | | | | |
| | U.S. Treasury Inflation Indexed Notes/Bonds—3.8% | | | | | | | | | | | |
| | U.S. Treasury Inflation Indexed Note,
2.375%, due 1/15/17 | | | | | | 299,244 | | | | 344,061 | |
| | U.S. Treasury Inflation Indexed Note,
1.625%, due 1/15/18 | | | | | | 193,884 | | | | 223,285 | |
| | Total U.S. Treasury Inflation Indexed Notes/Bonds | | | | | | | | | | 567,346 | |
| | | | | | | | | | | | | |
| | Total U.S. Government and U.S. Government Agency—74.6% | | | | | | | | | | | |
| | (cost $11,048,989) | | | | | | | | | | 11,087,211 | |
| | | | | | | | | | | | | |
| | Asset-Backed Securities—9.7% | | | | | | | | | | | |
| | CNH Equipment Trust, 2010-C, Tranche A3,
1.170%, 5/15/15 | | AAA | | | | 16,252 | | | | 16,279 | |
| | Harley-Davidson Motorcycle Trust, 2011-2, Tranche A2,
0.710%, 5/15/15 | | Aaa | | | | 22,800 | | | | 22,813 | |
| | Chase Issuance Trust, 2008-A11, Tranche A11,
5.400%, 7/15/15 | | AAA | | | | 100,000 | | | | 101,058 | |
| | BMW Vehicle Owner Trust, 2010-A, Tranche A4,
2.100%, 10/25/16 | | AAA | | | | 83,518 | | | | 83,821 | |
| | GE Dealer Floorplan Master Note Trust, 2012-1, Tranche A,
0.769%, 2/20/17, VRN | | Aaa | | | $ | 100,000 | | | $ | 100,745 | |
| | Capital One Multi-Asset Execution Trust, 2004-A4, Tranche A4,
0.419%, 3/15/17, VRN | | AAA | | | | 125,000 | | | | 125,132 | |
| | Bank of America Credit Card Trust, 2007-A15, Tranche A15,
0.549%, 4/17/17, VRN | | AAA | | | | 125,000 | | | | 125,484 | |
| | Citibank Credit Card Issuance Trust, 2008-A6, Tranche A6,
1.399%, 5/22/17, VRN | | AAA | | | | 200,000 | | | | 204,422 | |
| | Hertz Vehicle Financing LLC-144A, 2013-1A, Tranche B1,
1.860%, 8/25/17 | | Baa1 | | | | 150,000 | | | | 150,294 | |
| | Citibank Credit Card Issuance Trust, 2006-A8,
0.317%, 12/17/18, VRN | | AAA | | | | 200,000 | | | | 199,108 | |
| | SLM Student Loan Trust, 2008-5, Tranche A4,
1.976%, 7/25/23, VRN | | Aaa | | | | 300,000 | | | | 315,080 | |
| | Total Asset-Backed Securities—9.7% | | | | | | | | | | | |
| | (cost $1,449,549) | | | | | | | | | | 1,444,236 | |
| | | | | | | | | | | | | |
| | Corporate Obligations—10.0% | | | | | | | | | | | |
| | Citigroup, Inc.,
2.650%, due 3/2/15 | | A | | | | 200,000 | | | | 205,929 | |
| | The Goldman Sachs Group, Inc.,
3.300%, due 5/3/15 | | A | | | | 200,000 | | | | 208,650 | |
| | American Express Credit Corporation,
2.750%, due 9/15/15 | | A+ | | | | 250,000 | | | | 261,881 | |
| | Royal Bank of Scotland Group, PLC,
2.550%, due 9/18/15 | | A | | | | 100,000 | | | | 103,006 | |
| | Capital One Financial Corporation,
1.000%, due 11/6/15 | | A- | | | | 200,000 | | | | 199,452 | |
| | Morgan Stanley,
1.538%, due 2/25/16, VRN | | A | | | | 200,000 | | | | 201,104 | |
| | Bank of America Corporation,
1.104%, due 3/22/16, VRN | | A | | | | 100,000 | | | | 99,915 | |
| | Credit Agricole S.A.—144A,
1.438%, due 4/15/16, VRN | | A+ | | | | 200,000 | | | | 200,290 | |
| | Total Corporate Obligations—10.0%
(cost $1,457,805) | | | | | | | | | | 1,480,227 | |
| | Total Long-Term Investments—94.3%
(cost $13,956,343) | | | | | | | | | | 14,011,674 | |
| | | | | | | | | | | | | |
| | Short-Term Investments—15.5% | | | | | | | | | | | |
| | | | | | | | | | | | | |
| | Time Deposit—4.4% | | | | | | | | | | | |
| | State Street Euro Dollar Time Deposit,
0.010%, due 5/1/13 | | | | | | 650,266 | | | | 650,266 | |
See accompanying Notes to Financial Statements.
| April 30, 2013 | William Blair Funds | 9 |
| William Blair Commodity Strategy Long/Short Fund |
Consolidated Portfolio of Investments, April 30, 2013 (unaudited)
| Issuer | | Principal Amount | | | Value | |
| | | | | | | |
| Money Market Fund—5.0% | | | | | | |
| SSgA Prime Money Market Fund (a) | | $ | 750,000 | | | $ | 750,000 | |
| | | | | | | | | |
| Repurchase Agreement—6.1% | | | | | | | | |
| Fixed Income Clearing Corporation, 0.060% dated 4/30/13, due 5/1/13, repurchase price $906,757 collateralized by U.S. Treasury Bond, 4.500%, due 8/15/39 | | | 906,755 | | | | 906,755 | |
| Total Short-Term Investments—15.5% | | | | | | | | |
| (cost $2,307,021) | | | | | | | 2,307,021 | |
| Total Investments—109.8% | | | | | | | | |
| (cost $16,263,364) | | | | | | | 16,318,695 | |
| Liabilities, plus cash and other assets—(9.8)% | | | | | | | (1,451,448 | ) |
| Net assets—100.0% | | | | | | $ | 14,867,247 | |
Total Return Swap
| Reference Entity | | Effective/
Expiration
Date | | | Counterparty | | Notional
Amount | | | | Unrealized
Appreciation
(Depreciation) |
| William Blair Commodity Strategy Long-Short Mutual Fund Index | | 4/26/17 | | | Deutsche Bank AG, London Branch | | $ | 18,816,304 | | | | $(671,838) |
(a) Security, or portion of security, is segregated as collateral for the total return swap aggregating a total value of $750,000.
NRSRO = Nationally Recognized Statistical Rating Organization—The credit quality ratings of the securities in the Fund reflect the highest category rating by either Fitch Ratings, Moody’s Investors Service Inc., or Standard & Poor’s, a division of the McGraw-Hill Companies, Inc.
The obligations of certain U. S. Government-sponsored securities are neither issued nor guaranteed by the U. S. Treasury.
VRN = Variable Rate Note
See accompanying Notes to Financial Statements.
| 10 | Semi-Annual Report | April 30, 2013 |
| Statements of Assets and Liabilities (unaudited) |
As of April 30, 2013
| | | | | | Commodity |
| | | | | | Strategy |
| | | Macro | | | Long/Short |
| | | Allocation | | | Fund |
| | | Fund | | | (Consolidated) |
| | | | | | |
| Assets | | | | | | | | | |
| Investments in securities, at cost | | $ | 114,605,436 | | | | $ | 16,263,364 | |
| | | | | | | | | | |
| Investments in securities, at value | | $ | 84,068,598 | | | | $ | 15,411,940 | |
| Repurchase agreement | | | 33,775,927 | | | | | 906,755 | |
| Segregated cash at broker | | | 7,264,897 | | | | | — | |
| Foreign currency, at value ($528,512 ; $—) | | | 538,298 | | | | | — | |
| Receivable for fund shares sold | | | 5,395,368 | | | | | — | |
| Receivable from Advisor | | | 66,960 | | | | | 93,907 | |
| Dividend and interest receivable | | | 56 | | | | | 42,082 | |
| Unrealized appreciation on forward currency contracts | | | 1,495,946 | | | | | — | |
| Total assets | | | 132,606,050 | | | | | 16,454,684 | |
| Liabilities | | | | | | | | | |
| Security sold short ($6,706,050 ; $—) | | | 7,288,000 | | | | | — | |
| Payable for futures variation margin | | | 952,920 | | | | | — | |
| Payable for investment securities purchased | | | 2,027,848 | | | | | 838,098 | |
| Payable for fund shares redeemed | | | 50,250 | | | | | — | |
| Payable to custodian | | | 7,932 | | | | | — | |
| Unrealized depreciation on swap contract | | | 11,417 | | | | | 671,838 | |
| Management fee payable | | | 72,827 | | | | | 16,905 | |
| Distribution and shareholder administration fees payable | | | 21,493 | | | | | 2,039 | |
| Other payables and accrued expenses | | | 31,130 | | | | | 58,557 | |
| Total liabilities | | | 10,463,817 | | | | | 1,587,437 | |
| Net Assets | | $ | 122,142,233 | | | | $ | 14,867,247 | |
| Capital | | | | | | | | | |
| Composition of Net Assets | | | | | | | | | |
| Par value of shares of beneficial interest | | | 10,243 | | | | | 1,558 | |
| Capital paid in excess of par value | | | 116,897,188 | | | | | 15,539,621 | |
| Accumulated net investment income (loss) | | | (192,613 | ) | | | | (28,133 | ) |
| Accumulated realized gain (loss) | | | 546,178 | | | | | (29,292 | ) |
| Net unrealized appreciation (depreciation) of investments and foreign currencies | | | 4,881,237 | | | | | (616,507 | ) |
| Net Assets | | $ | 122,142,233 | | | | $ | 14,867,247 | |
| | | | | | | | | | |
| Class N Shares | | | | | | | | | |
| Net Assets | | $ | 41,748,018 | | | | $ | 1,107,274 | |
| Shares Outstanding | | | 3,507,529 | | | | | 116,279 | |
| Net Asset Value Per Share | | $ | 11.91 | | | | $ | 9.52 | |
| Class I Shares | | | | | | | | | |
| Net Assets | | $ | 80,394,215 | | | | $ | 13,759,973 | |
| Shares Outstanding | | | 6,735,420 | | | | | 1,441,947 | |
| Net Asset Value Per Share | | $ | 11.94 | | | | $ | 9.54 | |
See accompanying Notes to Financial Statements.
| April 30, 2013 | William Blair Funds | 11 |
| Statements of Operations (unaudited) |
For the Period Ended April 30, 2013
| | | | | | Commodity |
| | | | | | Strategy |
| | | Macro | | | Long/Short |
| | | Allocation | | | Fund |
| | | Fund | | | (Consolidated) |
| | | | | | |
| Investment income | | | | | | | | | |
| Dividends | | $ | 636,290 | | | | $ | — | |
| Interest | | | 6,699 | | | | | 117,485 | |
| Total income | | | 642,989 | | | | | 117,485 | |
| Expenses | | | | | | | | | |
| Investment advisory fees | | | 272,905 | | | | | 99,556 | |
| Distribution fees | | | 26,287 | | | | | 1,405 | |
| Shareholder administration fees | | | 51,170 | | | | | 10,667 | |
| Custodian fees | | | 43,495 | | | | | 38,824 | |
| Transfer agent fees | | | 5,134 | | | | | 4,266 | |
| Sub-transfer agent fees | | | | | | | | | |
| Class N | | | 5,438 | | | | | 254 | |
| Class I | | | 4,596 | | | | | 1,465 | |
| Professional fees | | | 55,088 | | | | | 34,829 | |
| Registration fees | | | 18,616 | | | | | 41,423 | |
| Shareholder reporting fees | | | 25,770 | | | | | 39,542 | |
| Trustee fees | | | 311 | | | | | 293 | |
| Other expenses | | | 6,045 | | | | | 3,833 | |
| Short dividend expenses | | | 36,569 | | | | | — | |
| Total expenses before waiver | | | 551,424 | | | | | 276,357 | |
| Expenses reimbursed to (waived or absorbed by) the Advisor | | | (113,265 | ) | | | | (154,061 | ) |
| Net expenses | | | 438,159 | | | | | 122,296 | |
| Net investment income (loss) | | | 204,830 | | | | | (4,811 | ) |
| Realized and unrealized gain (loss) | | | | | | | | | |
| Net Realized gain (loss) on transactions from: | | | | | | | | | |
| Investments in securities | | | 133,326 | | | | | 6,715 | |
| Options | | | (1,542,376 | ) | | | | — | |
| Futures contracts | | | 645,471 | | | | | — | |
| Swaps | | | 561,863 | | | | | — | |
| Forward foreign currency contracts | | | 783,828 | | | | | — | |
| Foreign currency transactions | | | (80,364 | ) | | | | — | |
| Total net realized gain (loss) | | | 501,748 | | | | | 6,715 | |
| Change in net unrealized appreciation (depreciation) of: | | | | | | | | | |
| Investments | | | 2,173,678 | | | | | (21,419 | ) |
| Options | | | (4,257 | ) | | | | — | |
| Futures contracts | | | 1,101,207 | | | | | — | |
| Swaps | | | (73,523 | ) | | | | (456,651 | ) |
| Forward foreign currency contracts | | | 1,333,748 | | | | | — | |
| Foreign currency translations | | | 17,093 | | | | | — | |
| Change in net unrealized appreciation (depreciation) | | | 4,547,946 | | | | | (478,070 | ) |
| Net increase (decrease) in net assets resulting from operations | | $ | 5,254,524 | | | | $ | (476,166 | ) |
See accompanying Notes to Financial Statements.
| 12 | Semi-Annual Report | April 30, 2013 |
| Statements of Changes in Net Assets (unaudited) |
For the Period Ended April 30, 2013
| | | | | | | | | Commodity Strategy | |
| | | | | | | | | Long/Short Fund | |
| | | Macro Allocation Fund | | | (Consolidated) | |
| | | 2013 | | | 2012(a) | | | 2013 | | | 2012(b) | |
| | | | | | | | | | | | | |
| Operations | | | | | | | | | | | | | | | | |
| Net investment income (loss) | | $ | 204,830 | | | $ | 178,321 | | | $ | (4,811 | ) | | $ | (3,789 | ) |
| Net realized gain (loss) on investments, and other assets and liabilities | | | 501,748 | | | | 670,771 | | | | 6,715 | | | | 1,578 | |
| Change in net unrealized appreciation (depreciation) on investments, and other assets and liabilities | | | 4,547,946 | | | | 333,291 | | | | (478,070 | ) | | | (138,437 | ) |
| Net increase (decrease) in net assets resulting from operations | | | 5,254,524 | | | | 1,182,383 | | | | (476,166 | ) | | | (140,648 | ) |
| Distributions to shareholders from | | | | | | | | | | | | | | | | |
| Net investment income | | | | | | | | | | | | | | | | |
| Class N | | | (118,305 | ) | | | (7,330 | ) | | | (4,033 | ) | | | — | |
| Class I | | | (306,887 | ) | | | (35,165 | ) | | | (53,887 | ) | | | — | |
| Net realized gain | | | | | | | | | | | | | | | | |
| Class N | | | (211,562 | ) | | | — | | | | — | | | | — | |
| Class I | | | (523,901 | ) | | | — | | | | — | | | | — | |
| Total Distributions | | | (1,160,655 | ) | | | (42,495 | ) | | | (57,920 | ) | | | — | |
| Capital stock transactions | | | | | | | | | | | | | | | | |
| Net proceeds from sale of shares | | | 88,227,592 | | | | 35,028,121 | | | | 4,739,200 | | | | 13,555,573 | |
| Shares issued in reinvestment of income dividends and capital gain distributions | | | 954,059 | | | | 30,634 | | | | 38,744 | | | | — | |
| Less cost of shares redeemed | | | (4,273,054 | ) | | | (3,058,876 | ) | | | (2,358,441 | ) | | | (433,095 | ) |
| Net increase (decrease) in net assets resulting from capital share transactions | | | 84,908,597 | | | | 31,999,879 | | | | 2,419,503 | | | | 13,122,478 | |
| Increase (decrease) in net assets | | | 89,002,466 | | | | 33,139,767 | | | | 1,885,417 | | | | 12,981,830 | |
| Net assets | | | | | | | | | | | | | | | | |
| Beginning of period | | | 33,139,767 | | | | — | | | | 12,981,830 | | | | — | |
| End of period | | $ | 122,142,233 | | | $ | 33,139,767 | | | $ | 14,867,247 | | | $ | 12,981,830 | |
| Accumulated net investment income (loss) at the end of the period | | $ | (192,613 | ) | | $ | 27,749 | | | $ | (28,133 | ) | | $ | 34,598 | |
| (a) | For the period from November 29, 2011 (Commencement of Operations) to October 31, 2012 |
| (b) | For the period from April 25, 2012 (Commencement of Operations) to October 31, 2012 |
See accompanying Notes to Financial Statements.
| April 30, 2013 | William Blair Funds | 13 |
| |
| Notes to Financial Statements |
| |
(1) Organization
The William Blair Macro Allocation Fund (“MAF” or “Macro Allocation”) and the William Blair Commodity Strategy Long/Short Fund (“CLS” or “Commodity Strategy Long/Short”) are separate Funds (together the “Funds”) within the William Blair Funds (the “Trust”). The Trust is registered under the Investment Company Act of 1940 (the “1940 Act”), as amended, as an open-end management investment company. For each Fund, the number of shares authorized is unlimited.
(a) Share Classes
Three different classes of shares currently are available: N, I and Institutional. There are currently no assets in the Institutional Share Class. This report includes financial highlight information for Classes N and I. Below is a brief description of the Class N shares and the Class I shares covered by this report:
Class N shares are offered to the general public, either directly through the Trust’s distributor or through a select number of financial intermediaries. Class N shares are sold without any sales load, and carry an annual 12b-1 distribution fee of 0.25%, a Shareholder Administration fee of 0.15%, and may have a Sub-transfer agent fee that is not a fixed rate and may vary by Fund and class.
Class I shares are offered to a limited group of investors. They do not carry any sales load or distribution fees and generally have lower ongoing expenses than the Class N shares. Class I shares have a Shareholder Administration fee of 0.15% and may have a Sub-transfer agent fee that is not a fixed rate and may vary by Fund and class.
(b) Fund Objective and Description
Macro Allocation Fund
MAF’s objective is to maximize long-term risk-adjusted total return.
In pursuing its investment objective, MAF employs a dynamic global macro asset allocation strategy. This strategy attempts to exploit periodic market inefficiencies by taking long and short positions in various asset classes (e.g., equity and fixed income) and currencies with a view to profit from movements across and within such asset classes and currencies. MAF uses a top-down approach that focuses on general price movements in various asset classes and currencies rather than the performance of individual company securities. MAF’s macro asset allocation strategy is based primarily on the fundamental investment valuations of asset classes and currencies. The goal is to identify and exploit periodic discrepancies between fundamental values and market prices. These perceived value/price discrepancies are the foundation of the MAF’s portfolio construction. MAF may invest in or seek exposure to a wide range of asset classes including, without limitation, equity and fixed income markets (including asset-backed securities, mortgage-backed securities and other collateralized obligations and all grades and maturities of domestic and foreign credit, including high yield (junk bonds)), commodities, and real estate, and currencies. MAF has no geographical or other limits on the allocation of its assets among asset classes.
Commodity Strategy Long/Short Fund
CLS’s objective is to seek long-term risk-adjusted total return.
CLS’s investment strategies seeks to provide broad exposure to commodities, provide attractive risk-adjusted returns with low correlations to traditional asset classes, maintain the inflation protection of commodities investing and profit in both up and down commodity markets. CLS seeks to provide exposure to the commodity trading strategies of independent commodity trading advisors (“CTAs”) selected by William Blair & Company, L.L.C., (the “Advisor”) currently through derivative instruments (instruments whose values are based on, for example, indices, currencies or securities), and invests in fixed-income securities.
CLS’s commodity investments include derivative instruments that provide exposure to trading strategies of CTAs selected by the Advisor and/or by investing in limited liability companies, limited partnerships, corporations or other pooled vehicles (“Underlying Vehicles”) managed by such CTAs. The Advisor currently seeks exposure to CTA trading strategies through a total return swap (the “Swap”), with Deutsche Bank AG, London Branch (“Deutsche Bank”) as the counterparty. The Swap, which is a type of derivative instrument, is based on a customized index (the “Index”) designed to replicate the aggregate returns
| 14 | Semi-Annual Report | April 30, 2013 |
of the trading strategies of CTAs selected by the Advisor. The swap currently has exposure to seven different CTAs which can be broadly placed into three different trading strategies. Systematic strategies which utilize quantitative systems to exploit trending behavior of futures markets over various time frames and may include some counter trend and mean reversion aspects. Fundamental strategies conduct deep research into fundamental supply and demand factors that drive futures markets and use specialized models, data sources and other tools to construct expectations of fundamental values. Specialist strategies employ specialized knowledge, research and analysis systems to seek value from niche markets. As of April 30, 2013, the swap was made up of 39.7% Systematic strategies, 17.4% Fundamental strategies and 42.9% Specialist strategies.
The Swap is based on a notional amount agreed to by the Advisor and Deutsche Bank. The notional amount of the Swap may be adjusted from time to time and may exceed the net assets of the fund. The Advisor may add or remove CTAs from the Index or increase or decrease the weighting given to a CTA included in the Index. The Swap will expire on April 26, 2017, but may be terminated by the Fund on one day’s notice to Deutsche Bank. The notional amount of the Swap as of April 30, 2013 was $18,816,304.
The Swap value reflects the current cost of the fees of Deutsche Bank and the fixed fees of the CTAs together aggregating no more than 1.80% of the notional allocations to the CTAs included in the Index and may include a deduction for the performance fees of the individual CTAs in an amount not to exceed 20%. The deduction for performance fees in the Index will be based on the performance results of each individual CTA’s trading strategy represented in the Index. Accordingly, a performance fee for one or more CTA trading strategies represented in the Index may be deducted in calculating the Index even if the aggregate returns of the trading strategies of the CTAs are negative. To the extent the aggregate notional allocations to the CTAs included in the Index exceed the net assets of the Fund, the deduction from the Index for the fees of Deutsche Bank and the fixed fees of the CTAs will be greater as a percentage of the Fund’s net assets than the deduction would be if the aggregate notional allocations to the CTAs included in the Index were equal to or less than the net assets of the Fund. Fees are accrued daily within the Swap and deducted from the Swap value quarterly. During the period ended April 30, 2013, total fees of the Swap were $128,791 of which $29,476 was related to performance fees.
(2) Significant Accounting Policies
The following is a summary of the Funds’ significant accounting policies in effect during the period covered by the financial statements, which are in accordance with U.S. generally accepted accounting principles.
(a) Basis for Consolidation for Commodity Strategy Long/Short Fund
CLS’s investments in the Swap are made through William Blair CLS Ltd., a wholly-owned subsidiary of CLS organized under the laws of the Cayman Islands (the “Subsidiary”). The Subsidiary acts as an investment vehicle for CLS in order to effect certain investments for the Fund consistent with CLS’s investment objective and policies as specified in its Prospectus and Statement of Additional Information. CLS’s Portfolio of Investments has been consolidated and includes the portfolio holdings of CLS and the Subsidiary. The consolidated financial statements include the accounts of CLS and the Subsidiary. All inter-company transactions and balances have been eliminated. Under the Articles of Association, shares issued by the Subsidiary confer upon a shareholder the right to receive notice of, to attend and to vote at general meetings of the Subsidiary and shall confer upon the shareholder rights in a winding-up or repayment of capital and the right to participate in the profits or assets of the Subsidiary. Investments held within the Subsidiary are used to meet collateral requirements of the Swap and are invested in a money market fund. Under normal conditions, CLS will have an investment in the Subsidiary between 5% and 20% of the net assets of CLS. As of April 30, 2013, the total investment in the Subsidiary was $732,752, representing 4.9% of the net assets of CLS.
(b) Investment Income and Transactions
Dividend income and expense is recorded on the ex-dividend date, except for those dividends from certain foreign securities that are recorded when the information is available.
Interest income is recorded on an accrual basis, adjusted for amortization of premium or discount. Variable rate bonds and floating rate notes earn interest at coupon rates that fluctuate at specific time intervals. The interest rates shown in the Consolidated Portfolio of Investments for CLS were the rates in effect on April 30, 2013. Put bonds may be redeemed at the discretion of the holder on specified dates prior to maturity.
Premiums and discounts are accreted and amortized on a straight-line basis for short-term investments with maturities < 60 days and on an effective interest method for long-term investments.
Paydown gains and losses on mortgage and asset-backed securities are reclassified to interest income. For the period ended April 30, 2013, the Commodity Strategy Long/Short Fund recognized a reduction of income and an increase in net realized gains of $77,394.
| April 30, 2013 | William Blair Funds | 15 |
The Funds do not isolate that portion of the results of operations resulting from changes in foreign exchange rates on investments from the fluctuations arising from changes in market prices of securities held. Such fluctuations are included with the net realized and unrealized gain or loss from investments.
Reported net realized foreign currency gains or losses arise from disposition of foreign currency, the difference in the foreign exchange rates between the trade and settlement dates on securities transactions, and the difference between the amounts of dividends, interest and foreign withholding taxes recorded on the ex-date or accrual date and the U.S. dollar equivalent of the amounts actually received or paid. Net unrealized foreign exchange gains and losses arise from changes (due to the changes in the exchange rate) in the value of foreign currency and other assets and liabilities denominated in foreign currencies held at year end.
Security and shareholder transactions are accounted for no later than one business day following the trade date. However, for financial reporting purposes, security and shareholder transactions are accounted for on the trade date of the last business day of the reporting period. Realized gains and losses from securities transactions are recognized on a specifically identified cost basis.
(c) Share Valuation and Distributions to Shareholders
Shares are sold and redeemed on a continuous basis at net asset value (“NAV”). The NAV per share is determined separately for each class by dividing each Fund’s net assets attributable to that class by the number of shares of the class outstanding as of the close of regular trading on the New York Stock Exchange (the “Exchange”), which is generally 4:00 p.m. Eastern time, on each day the Exchange is open. Redemption fees may be applicable to redemptions or exchanges within 60 days of purchase. For both Class N and Class I shares, the Funds assess a 2% redemption fee on shares sold or exchanged that have been owned 60 days or less as disclosed within each Fund’s Prospectus. The redemption fees collected by the Funds are netted against the amount of redemptions for presentation on the (Consolidated) Statements of Changes in Net Assets. As of April 30, 2013, the Funds have not collected any redemption fees.
Distributions from net investment income, if any, of the Funds are declared and paid at least annually. Capital gain distributions, if any, are declared and paid at least annually in December. Distributions payable to shareholders are recorded on the ex-dividend date.
(d) Foreign Currency Translation
The Funds may invest in securities denominated in foreign currencies. As such, assets and liabilities denominated in foreign currencies are translated into U.S. dollar amounts at the current exchange rate on the date of valuation. The values of foreign investments, open forward foreign currency contracts, and cash denominated in foreign currencies are translated into U.S. dollars using a spot market rate of exchange as of the time of the determination of each Fund’s NAV, typically 4:00 p.m. Eastern time on days when there is regular trading on the New York Stock Exchange. Payables and receivables for securities transactions, dividends, interest income and tax reclaims are translated into U.S. dollars using a spot market rate of exchange as of 4:00 p.m. Eastern time. Settlement of purchases and sales and dividend and interest receipts are translated into U.S. dollars using a spot market rate of exchange as of 11:00 a.m. Eastern time.
(e) Income Taxes
Each Fund intends to comply with the provisions of Subchapter M of the Internal Revenue Code available to regulated investment companies. Each Fund intends to make the requisite distributions of income and capital gains to its shareholders sufficient to relieve it from all, or substantially all, federal income and excise taxes. No provision for federal income and excise taxes has been made.
Management has evaluated all of the uncertain tax positions of the Funds and has determined that no provision for income tax is required to be recorded in the financial statements. As of October 31, 2012, the Funds had not been in existence for a complete fiscal year and therefore have not made annual filings with the Internal Revenue Service.
The Funds treat the deferred loss associated with current period wash sales as an adjustment to the cost of investments for tax purposes. The cost of investments for federal income tax purposes and related gross unrealized appreciation/(depreciation) and net unrealized appreciation (depreciation) at April 30, 2013, were as follows:
| Fund | | Cost of
Investments | | Gross
Unrealized
Appreciation | | Gross
Unrealized
Depreciation | | Net
Unrealized
Appreciation/ (Depreciation) |
| Macro Allocation | | | $114,614,956 | | | $3,787,504 | | | | $557,935 | | | | $3,229,569 | |
| Commodity Strategy Long/Short | | | 16,263,364 | | | 73,241 | | | | 17,910 | | | | 55,331 | |
| 16 | Semi-Annual Report | April 30, 2013 |
The timing and characterization of certain income and capital gain distributions are determined annually in accordance with federal income tax regulations that may differ from U.S. generally accepted accounting principles. As a result, net investment income or loss and net realized gain or loss for a reporting period may differ from the amount distributed during such period. In addition, the Funds may periodically record reclassifications among certain capital accounts to reflect differences between financial reporting and income tax basis distributions. The reclassifications were reported in order to reflect the tax treatment for certain permanent differences that exist between income tax regulations and U.S. generally accepted accounting principles. The reclassifications generally relate to differing treatment of paydown gains and losses, Section 988 currency transactions and income and gains from swap contracts. These reclassifications have no impact on the net asset values of the Funds. Accordingly, at October 31, 2012, the following reclassifications were recorded:
| Fund | | Accumulated
Net Investment
Income(Loss) | | Accumulated
Net Realized
Gain(Loss) | | Capital Paid
in Excess
of Par Value |
| Macro Allocation | | $(108,077 | ) | | $109,122 | | | $(1,045 | ) |
| Commodity Strategy Long/Short. | | 38,387 | | | (37,585 | ) | | (802 | ) |
The tax character of distributions paid during fiscal year ended 2012 was as follows:
| Fund | | Ordinary
Income | | Long-Term
Capital Gains | | Total
Distributions |
| Macro Allocation | | $42,495 | | | $— | | | $42,495 | |
| Commodity Strategy Long/Short | | — | | | — | | | — | |
As of October 31, 2012, the components of distributable earnings on a tax basis were as follows:
| Fund | | Undistributed
Ordinary Income | | Accumulated
Capital and
Other Losses | | Undistributed
Long-Term
Capital Gain | | Net Unrealized
Appreciation
(Depreciation) |
| Macro Allocation | | | $753,928 | | | | $ — | | | | $141,124 | | | | $ 245,881 | |
| Commodity Strategy Long/Short | | | 34,598 | | | | (36,007 | ) | | | — | | | | (138,437 | ) |
As of October 31, 2012, the Commodity Strategy Long/Short Fund has short-term capital loss carryforward, without expiration, of $36,007.
(f) Repurchase Agreements
In a repurchase agreement, a Fund buys a security at one price and at the time of sale, the seller agrees to repurchase the obligation at a mutually agreed upon time and price (usually within seven days). The repurchase agreement thereby determines the yield during the purchaser’s holding period, while the seller’s obligation to repurchase is secured by the value of the underlying security. The Advisor will monitor, on an ongoing basis, the value of the underlying securities to ensure that the value always equals or exceeds the repurchase price plus accrued interest. Repurchase agreements may involve certain risks in the event of a default or insolvency of the other party to the agreement, including possible delays or restrictions upon a Fund’s ability to dispose of the underlying securities. The risk to a Fund is limited to the ability of the seller to pay the agreed upon sum on the delivery date. In the event of default, a repurchase agreement provides that a Fund is entitled to sell the underlying collateral. The loss, if any, to a Fund will be the difference between the proceeds from the sale and the repurchase price. However, if bankruptcy proceedings are commenced with respect to the seller of the security, disposition of the collateral by the Fund may be delayed or limited. Although no definitive creditworthiness criteria are used, the Advisor reviews the creditworthiness of the banks and non-bank dealers with which a Fund enters into repurchase agreements to evaluate those risks. A Fund may, for tax purposes, deem repurchase agreements collateralized by U.S. Government securities to be investments in U.S. Government securities.
(g) Use of Estimates
The preparation of financial statements in conformity with U.S. generally accepted accounting principles requires management to make estimates and assumptions that affect the amounts reported in the financial statements. Actual results may differ from those estimates.
(h) Indemnifications
In the normal course of business, the Funds have entered into contracts in which the Funds agree to indemnify the other party or parties against various potential cost or liabilities. The Funds’ maximum exposure under these arrangements is unknown. No claim has been made for indemnification pursuant to any such agreement of the Funds.
| April 30, 2013 | William Blair Funds | 17 |
(3) Valuation
(a) Investment Valuation
The market value of domestic equity securities, including exchange-traded funds, is determined by valuing securities traded on national securities markets or in the over-the-counter markets at the last sale price or, if applicable, the official closing price or, in the absence of a recent sale on the date of determination, the mean between the last reported bid and ask prices.
Investments in mutual funds which are not traded on an exchange are valued at their respective net asset value per share.
The value of foreign equity securities is generally determined based upon the last sale price on the foreign exchange or market on which it is primarily traded and in the currency of that market as of the close of the appropriate exchange or, if there have been no sales during that day, at the mean between the latest bid and ask prices. The Board of Trustees has determined that the passage of time between when the foreign exchanges or markets close and when the Funds compute their net asset values could cause the value of foreign equity securities to no longer be representative or accurate, and as a result, may necessitate that such securities be fair valued. Accordingly, for foreign equity securities, the Funds may use an independent pricing service to fair value price the security as of the close of regular trading on the New York Stock Exchange. As a result, a Fund’s value for a security may be different from the last sale price (or the mean between the latest bid and ask prices).
Fixed-income securities are generally valued using evaluated prices provided by an independent pricing service. The evaluated prices are formed using various market inputs that the pricing service believes accurately represent the market value of a security at a particular point in time. The pricing service determines evaluated prices for fixed-income securities using inputs including, but not limited to, recent transaction prices, dealer quotes, transaction prices for securities with similar characteristics, collateral characteristics, credit quality, payment history, liquidity and market conditions.
Option contracts on securities, currencies and other financial instruments traded on one or more exchanges are valued at their most recent sale price on the exchange on which they are traded most extensively. Futures contracts (and options and swaps thereon) are valued at the most recent settlement price on the exchange on which they are traded most extensively. Forward foreign currency contracts are valued on the basis of the value of the underlying currencies at the prevailing currency exchange rate as supplied by an independent pricing service.
The total return swaps in the Macro Allocation Fund are valued by an independent pricing service using simulation pricing models. These models will value the underlying basket of exchange-traded equity securities within the total return swap based on readily observable market prices.
CLS’ shares of the Subsidiary are valued at the net asset value per share of the Subsidiary, which is calculated using the same valuation procedures as CLS. For CLS, the Subsidiary’s investment in the Swap is fair valued based on the calculation of the Index by the counterparty. The counterparty calculates the Index each index business day at the close of business in London, which is typically 11:00AM Eastern Time. The Advisor performs certain daily tests of the Swap value in order to test the reasonableness of the counterparty’s valuation. In determining the fair value of the Swap, the Advisor, under procedures approved by the Board of Trustees, will consider whether there have been significant events that have occurred from the close of business in London when the Swap is valued and the time that the Fund calculates its NAV.
Securities, and other assets, for which a market price is not available or is deemed unreliable (e.g., securities affected by unusual or extraordinary events, such as natural disasters or securities affected by market or economic events, such as bankruptcy filings), or the value of which is affected by a significant valuation event, are valued at a fair value as determined in good faith by, or under the direction of, the Board of Trustees and in accordance with the Trust’s valuation procedures. The value of fair valued securities may be different from the last sale price (or the latest bid price), and there is no guarantee that a fair valued security will be sold at the price at which a Fund is carrying the security.
(b) Fair Valuation Measurements
Fair value is defined as the price that a Fund would receive upon selling a security in an orderly transaction to an independent buyer in the principal or most advantageous market for the investment. Various inputs are used in determining the value of a Fund’s investments. A three-tier hierarchy of inputs is used to classify fair value measurements for disclosure purposes. The three-tier hierarchy of inputs is summarized in the three broad levels listed below:
| · | Level 1—Quoted prices (unadjusted) in active markets for an identical security. |
| | | |
| · | Level 2—Prices determined using other significant observable inputs. Observable inputs are inputs that other market participants would use in pricing a security. These may include quoted prices for similar securities, interest rates, |
| 18 | Semi-Annual Report | April 30, 2013 |
| | | prepayment speeds, credit risk, and others. In addition, other observable inputs such as foreign exchange rates, benchmark securities indices and foreign futures contracts may be utilized in the valuation of certain foreign securities when significant events occur between the last sale on the foreign securities exchange and the time the net asset value of the Fund is calculated. |
| | | |
| | · | Level 3—Prices determined using significant unobservable inputs. In situations where quoted prices or observable inputs are unavailable (for example, when there is little or no market activity for an investment) unobservable inputs may be used. Unobservable inputs reflect the Fund’s own assumptions about the factors market participants would use in pricing an investment, and would be based on the best information available. |
The inputs or methodology used for valuing an investment are not necessarily an indication of the risk associated with investing in those securities. For example, money market securities are valued using amortized cost, in accordance with rules under the 1940 Act. Generally, amortized cost approximates the current fair value of a security, but since the value is not obtained from a quoted price in an active market, such securities are reflected as Level 2.
Any transfers between Level 1 and Level 2 are disclosed, effective as of the beginning of the period, in the tables below with the reasons for the transfers disclosed in a note to the tables, if applicable.
A description of the valuation techniques applied to the Fund’s major categories of assets and liabilities measured at fair value on a recurring basis are as follows.
Exchange-Traded Securities
Securities traded on a national securities exchange (or reported on the NASDAQ national market), including exchange-traded funds, are stated at the last reported sales price on the day of valuation. Other securities traded in the over-the-counter market and listed securities for which no sale was reported on that date are stated at the mean between the last reported bid and ask prices. To the extent these securities are actively traded and valuation adjustments are not applied, they are categorized in Level 1 of the fair value hierarchy.
Fixed-Income Securities
Fixed-income securities including corporate, convertible and municipal bonds and notes, U.S. government agencies, U.S. treasury obligations, sovereign issues, bank loans, convertible preferred securities and non-U.S. bonds are generally valued using evaluated prices provided by an independent pricing service. The evaluated prices are formed using various market inputs that the pricing service believes accurately represent the market value of a security at a particular point in time. The pricing service determines evaluated prices for fixed-income securities using inputs including, but not limited to, recent transaction prices, dealer quotes, transaction prices for securities with similar characteristics, collateral characteristics, credit quality, payment history, liquidity and market conditions. Securities that use similar valuation techniques and observable inputs as described above are categorized as Level 2 of the fair value hierarchy.
Asset-Backed Securities
Mortgage-related and asset-backed securities are usually issued as separate tranches, or classes, of securities within each deal. These securities are also normally valued by pricing service providers that use broker dealer quotations or valuation estimates from their internal pricing models. The pricing models for these securities usually consider tranche-level attributes, current market data, estimated cash flows and market-based yield spreads for each tranche, and incorporate deal collateral performance, as available. Mortgage-related and asset-backed securities that use similar valuation techniques and inputs as described above are categorized as Level 2 of the fair value hierarchy.
Short-Term Investments
Short-term investments having a maturity of 60 days or less at the time of purchase are generally valued at amortized cost, which approximates fair market value. These investments are categorized as Level 2 of the fair value hierarchy.
Derivative Instruments
Listed derivatives, such as certain options and futures contracts, that are actively traded are valued based on quoted prices from the exchange on which they are traded most extensively and are categorized in Level 1 of the fair value hierarchy. Over-the-counter (OTC) derivative contracts include forward foreign currency contracts, swap and certain option contracts related to interest rates, foreign currencies, credit standing of reference entities, equity prices, or commodity prices. Depending on the
| April 30, 2013 | William Blair Funds | 19 |
product and the terms of the transaction, the fair value of OTC derivative products can be modeled taking into account the counterparties’ creditworthiness and using a series of techniques, including simulation models. Many pricing models do not entail material subjectivity because the methodologies employed do not necessitate significant judgments and the pricing inputs are observed from actively quoted markets, as is the case of forward foreign currency contracts and interest rate swaps. A substantial majority of OTC derivative products valued by a Fund using pricing models fall into this category and are categorized within Level 2 of the fair value hierarchy.
CLS Swap Contract
The Swap held by the Subsidiary of CLS is fair valued based on the calculation of the Index by the counterparty. The Swap is not a listed security nor does it actively trade. The fair value is based on inputs that are not readily observable in the market place, primarily of which are the underlying baskets of commodity investments on which the Swap value is derived. The Value of the Swap also reflects deductions for management and performance fees from the underlying CTAs, counterparty fees and trading costs. The Swap is categorized within Level 3 of the fair value hierarchy.
As of April 30, 2013, the hierarchical input levels of securities in each Portfolio, segregated by security class or other financial instrument, are as follows:
| Investments in Securities | | Macro
Allocation | | Commodity
Strategy
Long/Short |
| Assets | | | | | | | | |
| Level 1—Quoted Prices | | | | | | | | |
| Common Stock | | $ | 675,511 | | | $ | — | |
| Exchange-Traded Funds | | | 71,753,550 | | | | — | |
| Purchased Options | | | 1,024,563 | | | | — | |
| Level 2—Other Significant Observable Inputs | | | | | | | | |
| Government Securities | | | 10,614,974 | | | | 11,087,211 | |
| Asset-Backed Securities | | | — | | | | 1,444,236 | |
| Corporate Obligations | | | — | | | | 1,480,227 | |
| Short-term Investments | | | 33,775,927 | | | | 2,307,021 | |
| Liabilities | | | | | | | | |
| Level 1—Quoted Prices | | | | | | | | |
| Exchange-Traded Funds | | | (7,288,000 | ) | | | — | |
| Total Investments in Securities | | $ | 110,556,525 | | | $ | 16,318,695 | |
| | | | | | | | | |
| Other Financial Instruments | | | | | | | | |
| Assets | | | | | | | | |
| Level 1—Quoted Prices | | | | | | | | |
| Futures Contracts | | $ | 1,568,068 | | | $ | — | |
| Level 2—Other Significant Observable Inputs | | | | | | | | |
| Forward Foreign Currency Contracts | | | 1,495,946 | | | | — | |
| Liabilities | | | | | | | | |
| Level 2—Other Significant Observable Inputs | | | | | | | | |
| Futures Contracts | | | (836,565 | ) | | | — | |
| Total Return Swap | | | (11,417 | ) | | | — | |
| Level 3—Significant Unobservable Inputs | | | | | | | | |
| Total Return Swap | | | — | | | | (671,838 | ) |
| Total Other Financial Instruments | | $ | 2,216,032 | | | $ | (671,838 | ) |
The following is a reconciliation of Level 3 investments in the Commodity Strategy Long/Short Fund for which significant unobservable inputs were used to determine fair value:
| | | Value
10/31/2012 | | | Notional
Increase | | | Notional
Decrease | | | Change in
Unrealized
Depreciation | | | Value
4/30/2013 | |
| Total Return Swap | | $(215,187 | ) | | $7,671,724 | | | $1,357,583 | | | $(456,651 | ) | | $(671,838 | ) |
| 20 | Semi-Annual Report | April 30, 2013 |
Significant unobservable inputs for the Swap consist primarily of the performance of the underlying CTAs. For the period ended April 30, 2013, the CTA performance ranged from -5.74% to 15.88%. The Swap value will increase or decrease generally in proportion to the weighted average performance of the CTAs.
(4) Recent Accounting Pronouncement
In December 2011, the Financial Accounting Standards Board (“FASB”) issued Accounting Standard Update (“ASU”) No. 2011-11 “Disclosures about Offsetting Assets and Liabilities.” These common disclosure requirements are intended to help investors and other financial statement users to better assess the effect or potential effect of offsetting arrangements on a Fund’s financial position. They also improve transparency in the reporting of how companies mitigate credit risk, including disclosure of related collateral pledged or received. In addition, ASU 2011-11 facilitates comparison between those entities that prepare their financial statements on the basis of U.S. GAAP and those entities that prepare their financial statements on the basis of International Financial Reporting Standards. ASU 2011-11 requires entities to disclose both gross and net information about both instruments and transactions eligible for offset in the financial position; and disclose instruments and transactions subject to an agreement similar to a master netting agreement. ASU 2011-11 is effective for fiscal years beginning on or after January 1, 2013, and interim periods within those annual periods. Management is currently evaluating the implications of ASU 2011-11 and its impact on financial statement disclosures.
(5) Transactions with Affiliates
(a) Management and Expense Limitation Agreements
Each Fund has a management agreement with the Advisor for investment advisory, clerical, bookkeeping and administrative services. Each Fund pays the Advisor an annual fee, payable monthly, based on a specified percentage of its average daily net assets. The annual advisory fee rates for the Macro Allocation Fund and the Commodity Strategy Long/Short Fund are 0.80% and 1.40%, respectively.
Each Fund has also entered into an Amended and Restated Expense Limitation Agreement with the Advisor. Under the terms of the agreement, the Advisor will waive its management fee and/or reimburse each Fund for expenses (excluding interest, taxes, brokerage commissions, acquired fund fees and expenses, dividend expenses on short sales and other investment-related costs and extraordinary expenses, such as litigation and other expenses not incurred in the ordinary course of the Fund’s business) in excess of the agreed upon rate. The amount the Advisor owes a Fund as of the reporting date is recorded as Receivable from Advisor on the (Consolidated) Statements of Assets and Liabilities. The Advisor reimburses the Funds on a monthly basis. Under the terms of the agreement, the Advisor has agreed to waive its advisory fees and/or reimburse other operating expenses through April 30, 2014, if total expenses for each class of the following Funds exceed the following rates (as a percentage of average daily net assets):
| Funds | | Class N | | Class I |
| Macro Allocation | | 1.35 | % | | 1.10 | % |
| Commodity Strategy Long/Short | | 1.95 | % | | 1.70 | % |
For the period ended April 30, 2013, the fee waivers and/or reimbursements were as follows:
| | | Fund
Level
Waiver | | Class I
Specific
Waiver | | Class N
Specific
Waiver | | Total
Waiver |
| Macro Allocation Fund | | 103,253 | | | 4,587 | | | 5,425 | | | 113,265 | |
| Commodity Strategy Long/Short Fund | | 152,343 | | | 1,465 | | | 253 | | | 154,061 | |
For a period of three years subsequent to the commencement of operations, the Advisor is entitled to reimbursement for previously waived fees and reimbursed expenses to the extent the overall expense ratio remains below the expense limitation in place at the time the fee was waived and/or the expense was reimbursed. The total amounts available for recapture at April 30, 2013 for MAF and CLS were $311,426 and $364,515, respectively.
(b) Underwriting, Distribution Services and Service Agreements
Each Fund has a Distribution Agreement with William Blair for distribution services to the Funds’ Class N shares. Each Fund pays William Blair an annual fee, payable monthly, based on a specified percentage of its average daily net assets of Class N shares. The annual rate expressed as a percentage of average daily net assets for Class N is 0.25% for each Fund. Pursuant to the Distribution Agreement, William Blair enters into related selling group agreements with various firms at various rates for sales of the Funds’ Class N shares.
| April 30, 2013 | William Blair Funds | 21 |
Each Fund has a Shareholder Administration Agreement with William Blair to provide shareholder administration services. Class N and Class I shares of the Funds pay William Blair an annual fee, payable monthly, based upon 0.15% of average daily net assets attributable to each class, respectively. For the period ended April 30, 2013, the following shareholder administration fees were incurred:
| Funds | | Class N | | | Class I | | | Total | |
| Macro Allocation | | $ | 15,772 | | | $ | 35,398 | | | $ | 51,170 | |
| Commodity Strategy Long/Short | | | 843 | | | | 9,824 | | | | 10,667 | |
(6) Investment Transactions
Investment transactions, excluding money market instruments, repurchase agreements and demand notes for the period ended April 30, 2013, were as follows:
| Fund | | Purchases | | | Sales | |
| Macro Allocation | | $ | 59,267,069 | | | $ | 3,047,789 | |
| Commodity Strategy Long/Short | | | 6,253,063 | | | | 2,884,436 | |
Transactions in written call and put options for the period ended April 30, 2013 are as follows:
| Macro Allocation Fund | | # of
Contracts | | | Notional Amount | | | Premium | |
| Balance at October 31, 2012 | | | 40 | | | $ | 1,036,920 | | | $ | 33,938 | |
| Sales | | | 37 | | | | 1,080,856 | | | | 4,020 | |
| Closing Buys | | | (77 | ) | | | (2,117,776 | ) | | | (37,958 | ) |
| Expirations | | | — | | | | — | | | | — | |
| Excised | | | — | | | | — | | | | — | |
| Balance at April 30, 2013 | | | — | | | $ | — | | | $ | — | |
(7) Short Sales
A Fund may sell a security it does not own in anticipation of a decline in the fair value of that security. When the Fund sells a security short, it must borrow the security sold short and deliver it to the broker-dealer through which it made the short sale. A gain, limited to the price at which the Fund sold the security short, or a loss unlimited in size, will be recognized upon the termination of the short sale. The Fund is also subject to the risk that it may be unable to reacquire a security to terminate a short position except at a price substantially in excess of the price it sold the security short.
(8) Financial Derivative Instruments
The Funds may use derivative instruments to obtain investment exposures, to maintain liquidity, to provide hedging, or in anticipation of changes in the composition of its portfolio holdings or as otherwise provided in each Fund’s prospectus.
Derivative transactions carry counterparty risk as they are based on contracts between the Fund and the applicable counterparty. For exchange-traded or cleared derivative contracts, such counterparty risk is limited due to the role of the exchange or clearinghouse. OTC derivative contracts, however, are exposed to counterparty risk in the amount of unrealized gains, net of collateral held, for the duration of the contract. The Funds seek to reduce counterparty risk in respect of OTC derivatives contracts by only transacting with high credit-standing counterparties and by regularly monitoring its exposure to counterparties.
Futures Contracts
A futures contract provides for the future sale by one party and purchase by another party of a specified amount of a specific financial instrument for a specified price at a designated date, time and place. An index futures contract is an agreement pursuant to which the parties agree to take or make delivery of an amount of cash equal to the difference between the value of the index at the close of the last trading day of the contract and the price at which the index futures contract was originally written. If the offsetting purchase price is less than the original sale price, a Fund realizes a gain; if it is more, a Fund realizes a loss. Conversely, if the offsetting sale price is more than the original purchase price, a Fund realizes a gain; if it is less, a Fund realizes a loss. The transaction costs must also be included in these calculations. There can be no assurance, however, that a Fund will be able to enter into an offsetting transaction with respect to a particular futures contract at a particular time. If a Fund is not able to enter into an offsetting transaction, a Fund will continue to be required to maintain the margin deposits on the futures contract.
| 22 | Semi-Annual Report | April 30, 2013 |
Upon entering into a futures contract, a Fund is required to pledge to the broker an amount of cash, U.S. government securities, or other liquid assets equal to a certain percentage of the contract amount (initial margin deposit). Futures contracts are marked to market daily and an appropriate payable or receivable for the change in value (“variation margin”) is recorded by the Fund and a cash payment is either made to or received from the counterparty. Futures held through swaps are marked to market daily, however, the Fund does not make or receive cash payments to/from the counterparty. Gains or losses are recognized but not considered realized until the contracts expire or are closed.
Options
The purchase or sale of an option by the Funds involves the payment or receipt of a premium by the investor and the corresponding right or obligation, as the case may be, either to purchase or sell the underlying security, commodity, or other instrument for a specific price at a certain time or during a certain period. Purchasing options involves the risk that the underlying instrument will not change price in the manner expected, so the investor loses its premium. Selling options involves potentially greater risk because the investor is exposed to the extent of the actual price movement in the underlying security rather than only the amount of the premium paid (which could result in a potentially unlimited loss). OTC options also involve counterparty credit risk. Purchased options are shown as an asset on the (Consolidated) Statements of Assets and Liabilities and are included in Investments in securities. Premiums received for written options are shown as a liability on the (Consolidated) Statements of Assets and Liabilities. Realized gains and losses on the sale, expiration or assignment of an option are disclosed on the (Consolidated) Statements of Operations.
Forward Foreign Currency Contracts
The Funds may enter into forward foreign currency exchange contracts. When entering into a forward currency contract, the Funds agree to receive or deliver a fixed quantity of foreign currency for an agreed-upon price on an agreed future date. The Funds’ net equity therein, representing unrealized gain or loss on the contracts as measured by the difference between the forward foreign exchange rates at the dates of entry into the contracts and the forward rates at the reporting date, is included in the (Consolidated) Statements of Assets and Liabilities. Realized and unrealized gains and losses are included in the (Consolidated) Statements of Operations. These instruments may involve market risk, credit risk, or both kinds of risks in excess of the amount recognized in the (Consolidated) Statements of Assets and Liabilities. Risks arise from the possible inability of counterparties to meet the terms of their contracts and from the price movements in currencies.
Swap Contracts
Swap agreements may include total return, interest rate, securities index, commodity, security, currency exchange rate, credit default index, volatility and variance swaps. Swap agreements are two-party contracts entered into primarily by institutional investors for periods ranging from a few weeks to several years. In a standard “swap” transaction, two parties agree to exchange the returns (or differentials in rates of return) earned or realized on particular predetermined investments or instruments. The gross returns to be exchanged or “swapped” between the parties are calculated with respect to a “notional amount” (i.e., the change in the value of a particular dollar amount invested at a particular interest rate, in a particular foreign currency, or in a “basket” of securities representing a particular index). Swap agreements are subject to the risk that the counterparty to the swap will default on its obligation to pay the Fund and the risk that the Fund will not be able to meet its obligations to pay the counterparty to the swap. Swap agreements may also involve fees, commissions or other costs that may reduce the Fund’s gains from a swap agreement or may cause the Fund to lose money.
CLS gains exposure to the commodities market by investing in a total return swap with Deutsche Bank as counterparty. The Fund’s returns are reduced or its losses are increased by the costs associated with the Swap, which are the fees deducted by the counterparty in the valuation of the Swap. In addition, there is the risk that the Swap may be terminated by the Fund or the counterparty in accordance with its terms or as a result of regulatory changes. If the Swap were to terminate, the Fund may be unable to implement its investment strategies with respect to commodities investments and the Fund may not be able to seek to achieve its investment objective.
For the CLS Swap no price was paid upon entering into the arrangement nor is any initial margin required to be posted. Any increase or decrease in the Swap value will be recorded on the (Consolidated) Statements of Assets and Liabilities as appreciation or depreciation on the Swap contract. In the event of depreciation, the Fund is required to deposit in a segregated account with its custodian an amount at least equal to the unrealized losses.
| April 30, 2013 | William Blair Funds | 23 |
The following table presents the value of financial derivative instruments as of April 30, 2013 and their respective location on the Statement of Assets and Liabilities:
| | | Assets | | Liabilities | |
| | | Statement of Assets | | | | Statement of Assets | | | |
| Derivative | | and Liabilities | | Value | | and Liabilities | | Value | |
| Macro Allocation | | | | | | | | | | | |
| Currency | | Unrealized appreciation on forward currency contracts | | $ | 1,495,946 | | Unrealized depreciation on forward currency contracts | | $ | — | |
| Interest rate | | Receivable for variation margin | | | — | | Payable for variation margin | | | 1,106,799 | |
| Equity | | Receivable for variation margin | | | 1,838,302 | | Payable for variation margin | | | — | |
| Interest rate | | Investments in securities, at value | | | 601,563 | | | | | | |
| Equity | | Investments in securities, at value | | | 423,000 | | | | | | |
| Equity | | Unrealized appreciation on swap contract | | | — | | Unrealized depreciation on swap contract | | | 11,417 | |
| Commodity Strategy Long/Short | | | | | | | | | | | |
| Commodities | | Unrealized appreciation on swap contract | | | — | | Unrealized depreciation on swap contract | | | 671,838 | |
The following table indicates the effect of derivatives, by primary risk exposure, on the Statement of Operations for the period ended April 30, 2013:
| | | Realized Gain (Loss) | | | Change in Net Unrealized
Appreciation (Depreciation) | |
| Derivative | | Statement of Operations | | Value | | | Statement of Operations | | Value | |
| Macro Allocation | | | | | | | | | | | | |
| Currency | | Forward foreign currency contracts | | $ | 783,828 | | | Forward foreign currency contracts | | $ | 1,333,748 | |
| Interest rate | | Futures Contracts | | | (294,176 | ) | | Futures Contracts | | | (1,049,943 | ) |
| Equity | | Futures Contracts | | | 939,647 | | | Futures Contracts | | | 2,151,150 | |
| Interest rate | | Options | | | (65,150 | ) | | Options | | | 343,084 | |
| Equity | | Options | | | (1,477,226 | ) | | Options | | | (347,341 | ) |
| Equity | | Swap Contracts | | | 561,863 | | | Swap Contracts | | | (73,523 | ) |
| Commodity Strategy Long/Short | | | | | | | | | | | | |
| Commodities | | Swap Contract | | | — | | | Swap Contract | | | (456,651 | ) |
(9) Fund Share Transactions
The following table summarizes the activity in capital shares of each Portfolio for the period ending April 30, 2013:
| | | | | | | | | Commodity Strategy | |
| | | | Macro Allocation | | | Long/Short | |
| Class N Shares | | | Shares | | | Dollars | | | Shares | | | Dollars | |
| Shares sold | | | 2,809,486 | | | $ | 32,624,977 | | | 1,529 | | | $ | 15,000 | |
| Reinvestment of distributions | | | 29,042 | | | | 329,049 | | | 417 | | | | 4,033 | |
| Less shares redeemed | | | (221,287 | ) | | | (2,573,002 | ) | | (1,535 | ) | | | (14,608 | ) |
| Net increase (decrease) | | | 2,617,241 | | | $ | 30,381,024 | | | 411 | | | $ | 4,425 | |
| Class I Shares | | | Shares | | | Dollars | | | Shares | | | Dollars | |
| Shares sold | | | 4,783,887 | | | $ | 55,602,615 | | | 486,505 | | | $ | 4,724,200 | |
| Reinvestment of distributions | | | 55,019 | | | | 625,010 | | | 3,579 | | | | 34,711 | |
| Less shares redeemed | | | (145,871 | ) | | | (1,700,052 | ) | | (242,906 | ) | | | (2,343,833 | ) |
| Net increase (decrease) | | | 4,693,035 | | | $ | 54,527,573 | | | 247,178 | | | $ | 2,415,078 | |
| Total | | | Shares | | | Dollars | | | Shares | | | Dollars | |
| Shares sold | | | 7,593,373 | | | $ | 88,227,592 | | | 488,034 | | | $ | 4,739,200 | |
| Reinvestment of distributions | | | 84,061 | | | | 954,059 | | | 3,996 | | | | 38,744 | |
| Less shares redeemed | | | (367,158 | ) | | | (4,273,054 | ) | | (244,441 | ) | | | (2,358,441 | ) |
| Net increase (decrease) | | | 7,310,276 | | | $ | 84,908,597 | | | 247,589 | | | $ | 2,419,503 | |
| 24 | Semi-Annual Report | April 30, 2013 |
The following table summarizes the activity in capital shares of each Fund for the period ending October 31, 2012:
| | | | | | | | | Commodity Strategy | |
| | | | Macro Allocation (a) | | | Long/Short (b) | |
| Class N Shares | | | Shares | | | Dollars | | | Shares | | | Dollars | |
| Shares sold | | | 1,022,549 | | | $ | 11,087,240 | | | 115,868 | | | $ | 1,159,178 | |
| Reinvestment of distributions | | | 719 | | | | 7,331 | | | — | | | | — | |
| Less shares redeemed | | | (132,980 | ) | | | (1,505,829 | ) | | — | | | | — | |
| Net increase (decrease) | | | 890,288 | | | $ | 9,588,742 | | | 115,868 | | | $ | 1,159,178 | |
| Class I Shares | | | Shares | | | Dollars | | | Shares | | | Dollars | |
| Shares sold | | | 2,177,995 | | | $ | 23,940,881 | | | 1,237,719 | | | $ | 12,396,408 | |
| Reinvestment of distributions | | | 2,285 | | | | 23,303 | | | — | | | | — | |
| Less shares redeemed | | | (137,895 | ) | | | (1,553,047 | ) | | (42,950 | ) | | | (433,108 | ) |
| Net increase (decrease) | | | 2,042,385 | | | $ | 22,411,137 | | | 1,194,769 | | | $ | 11,963,300 | |
| Total | | | Shares | | | Dollars | | | Shares | | | Dollars | |
| Shares sold | | | 3,200,544 | | | $ | 35,028,121 | | | 1,353,587 | | | $ | 13,555,573 | |
| Reinvestment of distributions | | | 3,004 | | | | 30,634 | | | — | | | | — | |
| Less shares redeemed | | | (270,875 | ) | | | (3,058,876 | ) | | (42,950 | ) | | | (433,095 | ) |
| Net increase (decrease) | | | 2,932,673 | | | $ | 31,999,879 | | | 1,310,637 | | | $ | 13,122,478 | |
| (a) | For the period from November 29, 2011 (Commencement of Operations) to October 31, 2012. |
| (b) | For the period from April 25, 2012 (Commencement of Operations) to October 31, 2012. |
| April 30, 2013 | William Blair Funds | 25 |
Financial Highlights
Macro Allocation Fund
| | | Class N |
| | | Period Ended
April 30, | | | Period Ended
October 31, |
| | | 2013 | | | 2012(a) |
| Net asset value, beginning of year | | $ | 11.28 | | | $ | 10.00 | |
| Income (loss) from investment operations: | | | | | | | | |
| Net investment income (loss) | | | 0.02 | | | | 0.11 | |
| Net realized and unrealized gain (loss) on investments | | | 0.92 | | | | 1.24 | |
| Total from investment operations | | | 0.94 | | | | 1.35 | |
| Less distributions from: | | | | | | | | |
| Net investment income | | | 0.11 | | | | 0.07 | |
| Net realized gain | | �� | 0.20 | | | | — | |
| Total distributions | | | 0.31 | | | | 0.07 | |
| Net asset value, end of period | | $ | 11.91 | | | $ | 11.28 | |
| Total Return (%)* | | | 8.49 | | | | 13.61 | |
| Ratios to average daily net assets (%)**: | | | | | | | | |
| Expenses (excluding short dividend expense), net of waivers and reimbursements | | | 1.35 | | | | 1.35 | |
| Expenses, net of waivers and reimbursements | | | 1.46 | | | | 1.41 | |
| Expenses, before waivers and reimbursements. | | | 1.83 | | | | 2.95 | |
| Net investment income (loss), net of waivers and reimbursements | | | 0.38 | | | | 1.18 | |
| Net investment income (loss), before waivers and reimbursements | | | 0.01 | | | | (0.36 | ) |
| Class N net assets at end of period (in thousands) | | $ | 41,748,018 | | | $ | 10,045,079 | |
| Portfolio turnover rate (%)* | | | 8 | | | | 40 | |
| | | Class I |
| | | Period Ended
April 30, | | | Period Ended
October 31, |
| | | 2013 | | | 2012 (a) |
| Net asset value, beginning of year | | $ | 11.31 | | | $ | 10.00 | |
| Income (loss) from investment operations: | | | | | | | | |
| Net investment income (loss) | | | 0.04 | | | | 0.16 | |
| Net realized and unrealized gain (loss) on investments | | | 0.91 | | | | 1.22 | |
| Total from investment operations | | | 0.95 | | | | 1.38 | |
| Less distributions from: | | | | | | | | |
| Net investment income | | | 0.12 | | | | 0.07 | |
| Net realized gain | | | 0.20 | | | | — | |
| Total distributions | | | 0.32 | | | | 0.07 | |
| Net asset value, end of period | | $ | 11.94 | | | $ | 11.31 | |
| Total Return (%)* | | | 8.52 | | | | 13.91 | |
| Ratios to average daily net assets (%)**: | | | | | | | | |
| Expenses (excluding short dividend expense), net of waivers and reimbursements | | | 1.10 | | | | 1.10 | |
| Expenses, net of waivers and reimbursements | | | 1.21 | | | | 1.18 | |
| Expenses, before waivers and reimbursements | | | 1.52 | | | | 2.94 | |
| Net investment income (loss), net of waivers and reimbursements | | | 0.70 | | | | 1.67 | |
| Net investment income (loss), before waivers and reimbursements | | | 0.39 | | | | (0.09 | ) |
| Class I net assets at end of period (in thousands) | | $ | 80,394,215 | | | $ | 23,094,688 | |
| Portfolio turnover rate (%)* | | | 8 | | | | 40 | |
| (a) | For the period November 29, 2011 (Commencement of Operations) to October 31, 2012. |
| * | Rates not annualized for periods that are less than a year. |
| ** | Rates are annualized for periods that are less than a year. |
Performance cited represents past performance. Past performance does not guarantee future results and current performance may be lower or higher than the data quoted. Results shown are annual returns, which assume reinvestment of dividends and capital gains. Investment returns and principal will fluctuate and you may have a gain or loss when you sell shares. For the most current month-end performance information, please call 1-800-742-7272 or visit our Web site at www.williamblairfunds.com.
Note: Net investment income (loss) per share is based on the average shares outstanding during the year.
| 26 | Semi-Annual Report | April 30, 2013 |
Financial Highlights
Commodity Strategy Long/Short fund
| | | Class N |
| | | Period Ended
April 30, | | | Period Ended
October 31, | |
| | | 2013 | | | 2012 (a) | |
| Net asset value, beginning of year | | $ | 9.89 | | | $ | 10.00 | |
| Income (loss) from investment operations: | | | | | | | | |
| Net investment income (loss) | | | (0.01 | ) | | | (0.02 | ) |
| Net realized and unrealized gain (loss) on investments | | | (0.33 | ) | | | (0.09 | ) |
| Total from investment operations | | | (0.34 | ) | | | (0.11 | ) |
| Less distributions from: | | | | | | | | |
| Net investment income | | | 0.03 | | | | — | |
| Net realized gain | | | — | | | | — | |
| Total distributions | | | 0.03 | | | | — | |
| Net asset value, end of period | | $ | 9.52 | | | $ | 9.89 | |
| Total Return (%)* | | | (3.40 | ) | | | (1.10 | ) |
| Ratios to average daily net assets (%)**: | | | | | | | | |
| Expenses, net of waivers and reimbursements | | | 1.95 | | | | 1.95 | |
| Expenses, before waivers and reimbursements | | | 4.09 | | | | 5.88 | |
| Net investment income (loss), net of waivers and reimbursements | | | (0.29 | ) | | | (0.30 | ) |
| Net investment income (loss), before waivers and reimbursements | | | (2.43 | ) | | | (4.23 | ) |
| Class N net assets at end of period (in thousands) | | $ | 1,107,274 | | | $ | 1,146,277 | |
| Portfolio turnover rate (%)* | | | 22 | | | | 5 | |
| | | Class I |
| | | Period Ended
April 30, | | | Period Ended
October 31, | |
| | | 2013 | | | 2012(a) | |
| Net asset value, beginning of year | | $ | 9.91 | | | $ | 10.00 | |
| Income (loss) from investment operations: | | | | | | | | |
| Net investment income (loss) | | | 0.00^ | | | | 0.00^ | |
| Net realized and unrealized gain (loss) on investments | | | (0.33 | ) | | | (0.09 | ) |
| Total from investment operations | | | (0.33 | ) | | | (0.09 | ) |
| Less distributions from: | | | | | | | | |
| Net investment income | | | 0.04 | | | | — | |
| Net realized gain | | | — | | | | — | |
| Total distributions | | | 0.04 | | | | — | |
| Net asset value, end of period | | $ | 9.54 | | | $ | 9.91 | |
| Total Return (%)* | | | (3.35 | ) | | | (0.90 | ) |
| Ratios to average daily net assets (%)**: | | | | | | | | |
| Expenses, net of waivers and reimbursements | | | 1.70 | | | | 1.70 | |
| Expenses, before waivers and reimbursements | | | 3.87 | | | | 5.55 | |
| Net investment income (loss), net of waivers and reimbursements | | | (0.05 | ) | | | (0.05 | ) |
| Net investment income (loss), before waivers and reimbursements | | | (2.22 | ) | | | (3.90 | ) |
| Class I net assets at end of period (in thousands) | | $ | 13,759,973 | | | $ | 11,835,553 | |
| Portfolio turnover rate (%)* | | | 22 | | | | 5 | |
| (a) | For the period April 25, 2012 (Commencement of Operations) to October 31, 2012. |
| * | Rates not annualized for periods that are less than a year. |
| ** | Rates are annualized for periods that are less than a year. |
| ^ | Amount is less than $0.005 per share. |
Performance cited represents past performance. Past performance does not guarantee future results and current performance may be lower or higher than the data quoted. Results shown are annual returns, which assume reinvestment of dividends and capital gains. Investment returns and principal will fluctuate and you may have a gain or loss when you sell shares. For the most current month-end performance information, please call 1-800-742-7272 or visit our Web site at www.williamblairfunds.com.
Note: Net investment income (loss) per share is based on the average shares outstanding during the year.
| April 30, 2013 | William Blair Funds | 27 |
Trustees and Officers (Unaudited). The trustees and officers of the William Blair Funds, their year of birth, their principal occupations during the last five years, their affiliations, if any, with William Blair & Company, L.L.C., and other significant affiliations are set forth below. The address of each trustee and officer is 222 West Adams Street, Chicago, Illinois 60606.
| Name and Year of Birth | | Position(s)
Held with
Fund | | Term of
Office and
Length of
Time
Served(1) | | Principal
Occupation(s)
During Past 5 Years(2) | | Number of
Portfolios
in Fund
Complex
Overseen
by Trustee | | Other Directorships
Held by Trustee/Officer |
| | | | | | | | | | | |
| Interested Trustees | | | | | | | | | | |
Michelle R. Seitz,
1965* | | Chairman of the Board of Trustees and President | | Trustee since 2002; Chairman since 2010 Since 2007 | | Partner, William Blair & Company, L.L.C.; Limited Partner, WBC Holdings, L.P. (since 2008); Member, WBC GP, L.L.P. (since 2008) Director, William Blair International, Ltd. (U.K.) (since 2012) | | 26 | | Chairman, William Blair SICAV; Director, William Blair CLS Ltd., Director, William Blair MAS Ltd., Financial Accounting Foundation (FAF) |
| | | | | | | | | | | |
Richard W. Smirl,
1967* | | Trustee and Senior Vice President | | Trustee since 2010 and Senior Vice President Since 2008 | | Partner, William Blair & Company, L.L.C.; Limited Partner, WBC Holdings, L.P. (since 2008) Director, William Blair International, Ltd. (U.K.) (since 2012) | | 26 | | Director, William Blair SICAV Director, William Blair CLS Ltd., Director, William Blair MAS Ltd. |
| | | | | | | | | | | |
| Non-Interested Trustees | | | | | | | | | | |
Vann A. Avedisian,
1964 | | Trustee | | Since 2012 | | Principal, Highgate Holdings (hotel investments) since 2009; formerly, Co-founder and Managing Director, Oxford Capital Partners, Inc. from 1994 to 2006 | | 26 | | Potbelly Sandwich Works, LLC |
| | | | | | | | | | | |
Phillip O. Peterson,
1944 | | Trustee | | Since 2007 | | Retired; formerly, President, Strong Mutual Funds, 2004- 2005; formerly, Partner, KPMG LLP | | 26 | | The Hartford Group of Mutual Funds (87 portfolios); Symetra Mutual Funds Trust (variable annuity funds) (14 portfolios) |
| | | | | | | | | | | |
Donald J. Reaves,
1946 | | Trustee | | Since 2004 | | Chancellor, Winston-Salem State University since 2007; formerly, Vice President for Administration and Chief Financial Officer, University of Chicago 2002-2007. | | 26 | | American Student Assistance Corp., guarantor of student loans; Amica Mutual Insurance Company |
| | | | | | | | | | | |
Donald L. Seeley,
1944 | | Trustee | | Since 2003 | | Retired; formerly, Director, Applied Investment Management Program, University of Arizona Department of Finance, prior thereto, Vice Chairman and Chief Financial Officer, True North Communications, Inc., (marketing communications and advertising firm) | | 26 | | Warnaco Group, Inc., intimate apparel, sportswear, and swimwear manufacturer; Center for Furniture Craftsmanship (not-for-profit) |
| | | | | | | | | | | |
Thomas J. Skelly,
1951 | | Trustee | | Since 2007 | | Advisory Board Member for various U.S. Companies; Director and Investment Committee Chairman of the US Accenture Foundation, Inc.; prior to 2005, Managing Partner of various divisions at Accenture | | 26 | | Mutual Trust Financial Group, provider of insurance and investment products; Board Member First MetLife Investors Insurance Company, NY Chartered Company for Metropolitan Life Insurance |
| 28 | Semi-Annual Report | April 30, 2013 |
| Name and Year of Birth | | Position(s)
Held with
Fund | | Term of
Office and
Length of
Time
Served(1) | | Principal
Occupation(s)
During Past 5 Years(2) | | Number of
Portfolios
in Fund
Complex
Overseen
by Trustee | | Other Directorships
Held by Trustee/Officer |
| | | | | | | | | | | |
| Officers | | | | | | | | | | |
| | | | | | | | | | | |
Michael P. Balkin,
1959 | | Senior Vice President | | Since 2009 | | Partner, William Blair & Company, L.L.C. | | | | N/A |
| | | | | | | | | | | |
| | | Vice President | | 2008-2009 | | Associate, William Blair & Company, L.L.C.; former Partner, Magnetar Capital (2005-2009) | | | | |
| | | | | | | | | | | |
Karl W. Brewer,
1966 | | Senior Vice President | | Since 2000 | | Partner, William Blair & Company, L.L.C. | | | | N/A |
| | | | | | | | | | | |
Andrew G. Flynn,
1961 | | Senior Vice President | | Since 2013 | | Partner, William Blair & Company, L.L.C. (since 2009); prior thereto, Associate, William Blair & Company, L.L.C. (2006-2009) | | | | N/A |
| | | | | | | | | | | |
David C. Fording,
1967 | | Senior Vice President | | Since 2009 | | Partner, William Blair & Company, L.L.C. | | | | N/A |
| | | | | | | | | | | |
| | | Vice President | | 2006-2009 | | Associate, William Blair & Company, L.L.C. | | | | |
| | | | | | | | | | | |
James S. Golan,
1961 | | Senior Vice President | | Since 2005 | | Partner, William Blair & Company, L.L.C. | | | | N/A |
| | | | | | | | | | | |
W. George Greig,
1952 | | Senior Vice President | | Since 1996 | | Partner, William Blair & Company, L.L.C. | | | | N/A |
| | | | | | | | | | | |
Michael A. Jancosek,
1959 | | Senior Vice President | | Since 2004 | | Partner, William Blair & Company, L.L.C. | | | | N/A |
| | | | | | | | | | | |
John F. Jostrand,
1954 | | Senior Vice President | | Since 1999 | | Partner, William Blair & Company, L.L.C. | | | | N/A |
| | | | | | | | | | | |
Chad M. Kilmer,
1975 | | Senior Vice President | | Since 2011 | | Partner, William Blair & Company, L.L.C. | | | | N/A |
| | | | | | | | | | | |
| | | Vice President | | 2006-2011 | | Associate, William Blair & Company, L.L.C. | | | | |
Robert C. Lanphier, IV,
1956 | | Senior Vice President | | Since 2003 | | Partner, William Blair & Company, L.L.C. | | | | Chairman, AG. Med, Inc. |
| | | | | | | | | | | |
Mark T. Leslie,
1967 | | Senior Vice President | | Since 2008 | | Partner, William Blair & Company, L.L.C. | | | | N/A |
| | | | | | | | | | | |
| | | Vice President | | 2005-2008 | | Associate, William Blair & Company, L.L.C. | | | | |
| | | | | | | | | | | |
Matthew A. Litfin,
1972 | | Senior Vice President | | Since 2008 | | Partner, William Blair & Company, L.L.C. | | | | N/A |
| | | | | | | | | | | |
Kenneth J. McAtamney
1966 | | Senior Vice President | | Since 2008 | | Partner, William Blair & Company, L.L.C. (since 2008); prior thereto, Associate, William Blair & Company, L.L.C., (2005-2008) | | | | N/A |
| April 30, 2013 | William Blair Funds | 29 |
| Name and Year of Birth | | Position(s)
Held with
Fund | | Term of
Office and
Length of Time
Served(1) | | Principal
Occupation(s)
During Past 5 Years(2) | | Other Directorships
Held by Trustee/Officer |
| | | | | | | | | |
Todd M. McClone,
1968 | | Senior Vice President | | Since 2006 | | Partner, William Blair & Company, L.L.C. | | N/A |
| | | | | | | | | |
David Merjan,
1960 | | Senior Vice President | | Since 2008 | | Partner, William Blair & Company, L.L.C. | | N/A |
| | | | | | | | | |
David S. Mitchell,
1960 | | Senior Vice President | | Since 2004 | | Partner, William Blair & Company, L.L.C. | | N/A |
| | | | | | | | | |
David P. Ricci,
1958 | | Senior Vice President | | Since 2006 | | Partner, William Blair & Company, L.L.C. | | N/A |
| | | | | | | | | |
Brian D. Singer,
1960 | | Senior Vice President | | Since 2012 | | Partner, William Blair & Company, L.L.C. | | N/A |
| | | | | | | | | |
| | | Vice President | | 2011-2012 | | Associate, William Blair & Company, L.L.C. (since 2011); prior thereto, Managing Partner, Singer Partners, LLC (2009- 2011); prior thereto, UBS Global Asset Management (Americas) Inc. (2003-2007) | | |
| | | | | | | | | |
Paul J. Sularz,
1967 | | Senior Vice President | | Since 2012 | | Partner, William Blair & Company, L.L.C. | | N/A |
| | | | | | | | | |
| | | Vice President | | 2009-2012 | | Associate, William Blair & Company, L.L.C. | | |
| | | | | | | | | |
Jeffrey A. Urbina,
1955 | | Senior Vice President | | Since 1998 | | Partner, William Blair & Company, L.L.C. | | N/A |
| | | | | | | | | |
Christopher T. Vincent,
1956 | | Senior Vice President | | Since 2004 | | Partner, William Blair & Company, L.L.C. | | N/A |
| | | | | | | | | |
Kathleen M. Lynch,
1971 | | Vice President | | Since 2010 | | Associate, William Blair & Company, L.L.C. | | N/A |
| | | | | | | | | |
David F. Hone,
1967 | | Vice President | | Since 2011 | | Associate, William Blair & Company, L.L.C. (since 2011); prior thereto, Portfolio Manager Large Cap Value, Deutsche Asset Management (2002-2010) | | N/A |
| | | | | | | | | |
| John Abunassar, 1967 | | Vice President | | Since 2011 | | Associate, William Blair & Company, L.L.C. (since 2011); prior thereto, Principal, Guidance Capital LLC (2009- 2011); prior thereto. President and CEO of Allegiant Asset Management (2004-2009) | | N/A |
| | | | | | | | | |
| Peter Carl, 1967 | | Vice President | | Since 2011 | | Associate, William Blair & Company L.L.C. (since 2011); prior thereto, Portfolio Manager, Guidance Capital LLC (2006-2011) | | N/A |
| | | | | | | | | |
| D. Trowbridge Elliman III, 1957 | | Vice President | | Since 2011 | | Associate, William Blair & Company L.L.C. (since 2011); prior thereto, Principal, Guidance Capital LLC (2001-2011) | | N/A |
| | | | | | | | | |
| Jason Moede, 1971 | | Vice President | | Since 2013 | | Associate, William Blair & Company L.L.C. (since 2011); prior thereto, TradeLink, LLC (2008-2011) | | N/A |
| 30 | Semi-Annual Report | April 30, 2013 |
| Name and Year of Birth | | Position(s)
Held with
Fund | | Term of
Office and
Length of Time
Served(1) | | Principal
Occupation(s)
During Past 5 Years(2) | | Other Directorships
Held by Trustee/Officer |
| | | | | | | | | |
Christopher Walvoord,
1966 | | Vice President | | Since 2011 | | Associate, William Blair & Company, L.L.C. (since 2011); prior thereto, Principal, Guidance Capital LLC (2002-2011) | | N/A |
| | | | | | | | | |
Brian Ziv,
1957 | | Vice President | | Since 2011 | | Associate, William Blair & Company, L.L.C. (since 2011); prior thereto, Principal, Guidance Capital LLC (2001-2011) | | N/A |
| | | | | | | | | |
Edwin Denson,
1967 | | Vice President | | Since 2011 | | Associate, William Blair & Company, L.L.C. (since 2011); prior thereto, Managing Partner, Singer Partners, LLC (2009-2011); prior thereto, UBS Global Asset Management (Americas) Inc. (2001-2009) | | N/A |
| | | | | | | | | |
Thomas Clarke,
1968 | | Vice President | | Since 2011 | | Associate, William Blair & Company, L.L.C. (since 2011); prior thereto, Managing Partner, Singer Partners, LLC (2009- 2011); prior thereto, UBS Global Asset Management (Americas) Inc. (2000-2009) | | N/A |
| | | | | | | | | |
Walter R. Randall, Jr.,
1960 | | Chief Compliance Officer and Assistant Secretary | | Since 2009 | | Associate, William Blair & Company, L.L.C. (since 2008); prior thereto, Associate Counsel and Chief Compliance Officer, Calamos Investments (2006-2008) | | N/A |
| | | | | | | | | |
Colette M. Garavalia,
1961 | | Treasurer | | Since 2009 | | Associate, William Blair & Company, L.L.C. | | N/A |
| | | | | | | | | |
| | | Secretary | | 2000-2009 | | Associate, William Blair & Company, L.L.C. | | N/A |
| | | | | | | | | |
Andrew T. Pfau,
1970 | | Secretary | | Since 2009 | | Associate, William Blair & Company, L.L.C. (since 2008); prior thereto, Associate, Bell, Boyd & Lloyd, LLP (2006-2008) | | N/A |
| | | | | | | | | |
John M. Raczek,
1970 | | Assistant Treasurer | | Since 2010 | | Associate, William Blair & Company, L.L.C. (since 2009); prior thereto, Manager, Calamos Investments (2003-2009) | | N/A |
| * | Ms. Seitz and Mr. Smirl are interested persons of the Trust because they are partners of William Blair & Company, L.L.C., the Fund’s investment advisor and principal underwriter. |
| (1) | Each Trustee serves until the election and qualification of a successor, or until death, resignation or retirement or removal as provided in the Fund’s Declaration of Trust. Retirement for non-interested Trustees occurs no later than at the conclusion of the first regularly scheduled Board meeting of the Fund’s fiscal year that occurs after the earlier of (a) the non-interested Trustee’s 72nd birthday or (b) the 15th anniversary of the date that the non-interested Trustee was first elected or appointed as a member of the Board of Trustees. The Fund’s officers, except the Chief Compliance Officer, are elected annually by the Trustees. The Fund’s Chief Compliance Officer is designated by the Board of Trustees and may only be removed by action of the Board of Trustees, including a majority of the non-interested Trustees. |
| (2) | In November 2008, all partners of William Blair & Company, L.L.C. also became limited partners in WBC Holdings, L.P. |
The Statement of Additional Information for the William Blair Funds includes additional information about the trustees and is available without charge by calling 1-800-635-2886 (in Massachusetts 1-800-635-2840) or by writing the Fund.
| April 30, 2013 | William Blair Funds | 31 |
(unaudited)
Renewal of the Management Agreement
On April 23, 2013, the Board of Trustees (the “Board”) of the William Blair Funds (the “Trust”) including the Trustees who are not “interested persons” of the Trust as defined in the Investment Company Act of 1940, as amended (the “Independent Trustees”), approved the renewal for an additional one-year term of the Trust’s Management Agreement with William Blair & Company, L.L.C. (the “Advisor”) on behalf of each of the William Blair Macro Allocation Fund and the William Blair Commodity Strategy Long/Short Fund (each, a “Fund” and collectively, the “Funds”). In deciding to approve the renewal of the Management Agreement, the Board did not identify any single factor or group of factors as all important or controlling and considered all factors together.
The information in this summary outlines the Board’s considerations associated with its renewal of the Management Agreement. In connection with its deliberations regarding the continuation of the Management Agreement, the Board considered such information and factors as it believed to be relevant. As described below, the Board considered the nature, quality and extent of the services performed by the Advisor under the existing Management Agreement; comparative management fees and expense ratios as prepared by an independent provider (Lipper Inc.); the estimated profits realized by the Advisor; the extent to which the Advisor realizes economies of scale as a Fund grows; and whether any fall-out benefits are being realized by the Advisor. The Board considered that the Macro Allocation Fund commenced operations on November 29, 2011 and the Commodity Strategy Long/Short Fund commenced operations on April 25, 2012 and that the Funds had a limited operating history. In addition, the Independent Trustees discussed the renewal of the Management Agreement with Fund management and in private sessions with independent legal counsel at which no representatives of the Advisor were present.
The Board, including the Independent Trustees, considered the renewal of the Management Agreement pursuant to a process that concluded at the Board’s April 23, 2013 meeting. In preparation for the review process, the Independent Trustees met with independent legal counsel and discussed the type and nature of information to be requested and independent legal counsel sent a formal request for information to Trust management. The Advisor provided extensive information in response to the request. After reviewing the information received, the Independent Trustees requested supplemental information, which the Advisor provided. The Independent Trustees considered: (i) the nature, quality and extent of services provided by the Advisor; (ii) information comparing the performance of the Macro Allocation Fund for the one year period ended December 31, 2012 to a relevant securities index; (iii) information comparing advisory fees of each Fund to fees charged by the Advisor to other funds and client accounts with similar investment strategies; (iv) the estimated allocated direct or indirect costs of services provided and estimated profits realized by the Advisor for the Trust as a whole; and (v) information describing other benefits to the Advisor resulting from its relationship with the Funds. The Independent Trustees reviewed comparative performance for a performance peer universe of funds provided by Lipper for the Macro Allocation Fund for the one year period ended December 31, 2012 and comparative advisory fees and expense ratios for an expense peer group and an expense peer universe of funds provided by Lipper for each Fund. The Independent Trustees noted that they receive information from the Advisor regarding the Funds throughout the year in connection with regular Board meetings, including presentations from portfolio managers. The Independent Trustees received a memorandum from independent legal counsel advising them of their duties and responsibilities in connection with the review of the Management Agreement. Finally, the Advisor made an in-person presentation to the Independent Trustees regarding the contract review information, including addressing the supplemental information requests, and answered questions from the Independent Trustees.
On April 9, 22 and 23, 2013, the Independent Trustees met independently of Trust management and of the interested Trustees to review and discuss with independent legal counsel the information provided by the Advisor, Lipper and independent legal counsel. The Independent Trustees noted that in evaluating the Management Agreement, they were taking into account their accumulated experience as Board members in working with the Advisor on matters relating to the Funds. Based on their review, the Independent Trustees concluded that it was in the best interest of each Fund to renew the Management Agreement for each Fund and recommended to the Board the renewal of the Management Agreement. The Board considered the recommendation of the Independent Trustees along with the other factors that the Board deemed relevant.
Nature, Quality and Extent of Services. In evaluating the nature, quality and extent of the services provided by the Advisor to the Funds, the Board noted that the Advisor is a quality firm with a reputation for integrity and honesty that employs high quality people and has been associated with the Funds since their inception. The Trustees believe that a long-term relationship with a capable, conscientious advisor is in the best interests of shareholders and that shareholders have invested in the Funds knowing that the Advisor managed the Funds and knowing the investment advisory fee. The Board considered biographical information about the Trust’s officers and the Funds’ portfolio managers, including information on the portfolio managers’ investments in the Funds. The Board also considered the administrative services performed by the Advisor, financial information regarding the Advisor, the Advisor’s execution quality and use of soft dollars, the Advisor’s risk management activities and its compliance
| 32 | Semi-Annual Report | April 30, 2013 |
program, and the Advisor’s expense limitations in place for the Funds. The Board was also provided with information pertaining to the Advisor’s organizational structure. The Board noted that the Advisor pays the compensation of all of the officers and the interested Trustees of the Trust.
The Board reviewed information on the total return of the Macro Allocation Fund for the one year period ended December 31, 2012 (the Commodity Strategy Long/Short Fund commenced operations on April 25, 2012 and did not have a full year of performance), along with total return information for a performance peer universe of funds provided by Lipper and a benchmark securities index. The Lipper performance peer universe for the Macro Allocation Fund included all funds with a similar investment style as classified by Lipper regardless of asset size or primary channel of distribution. The Trustees reviewed the Macro Allocation Fund’s ranking in its Lipper performance peer universe during the applicable period. Based upon all relevant factors, the Board concluded that the nature, quality and extent of the services provided by the Advisor to each Fund were satisfactory.
Fees and Expenses. The Board reviewed each Fund’s advisory fee and expense ratios for Class N and Class I shares and reviewed information comparing the advisory fee and expense ratios to those of an expense peer group and an expense peer universe of funds provided by Lipper for Class N and Class I shares of each Fund. The Lipper expense peer group for Class N and Class I shares of each Fund (“Class N and Class I Lipper Expense Group”) consisted of a group of retail no-load funds with a similar investment style as classified by Lipper and asset size as the Fund. The Lipper expense peer universe for Class N and Class I shares of each Fund consisted of the Fund’s Class N and Class I Lipper Expense Group and all other retail no-load funds (excluding outliers) with a similar investment style as classified by Lipper as the Fund. In considering the Lipper information, the Board noted that the contractual advisory fee for the Macro Allocation Fund was below the average contractual advisory fee of its Class N and Class I Lipper Expense Group and the contractual advisory fee for the Commodity Strategy Long/Short Fund was above the average contractual advisory fee of its Class N and Class I Lipper Expense Group.
The Board noted the contractual expense limitations in place for each Fund and considered the advisory fees waived and other expenses reimbursed by the Advisor on behalf of the Funds in 2012, noting that for each Fund the Advisor waived its advisory fee. The Board also considered that the Advisor had previously agreed to continue to contractually limit operating expenses until April 30, 2014 for each Fund.
The Board also reviewed amounts charged by the Advisor to other pooled investment vehicles, including other registered funds for which the Advisor acts as a subadvisor, and the Advisor’s fee schedule for institutional separate accounts. With respect to other pooled investment vehicles and institutional separate accounts, the Board considered the Advisor’s statement that both the mix of services provided to the Funds and the additional regulatory responsibilities associated with sponsoring registered investment companies were greater as compared to the work involved for other pooled investment vehicles and separate accounts. In addition, the Board considered the Advisor’s statement that institutional separate accounts are distributed differently, operate under different investment and regulatory structures and have different business risks as compared to the Funds.
On the basis of all the information provided, the Board concluded that each Fund’s advisory fee, coupled with applicable expense limitations, was reasonable.
Profitability. With respect to the profitability of the Management Agreement to the Advisor, the Independent Trustees considered that the Advisor had waived its advisory fee for each Fund and absorbed operating expenses to limit each Fund’s operating expenses payable by shareholders and this provided no profit for the Advisor during 2012.
Economies of Scale. The Board considered the extent to which economies of scale would be realized as the Funds grow and whether fee levels reflect these economies of scale for the benefit of investors. The Board noted the Advisor’s statement that certain Fund expenses are relatively fixed and unrelated to asset size and that the Advisor may enjoy some economies of scale as a Fund’s assets grow. In considering whether fee levels reflect economies of scale for the benefit of Fund investors, the Board reviewed each Fund’s asset size, the Fund’s total and net expense ratios and the expense limitations in place for the Funds, and concluded that in the aggregate they reasonably reflect appropriate recognition of any economies of scale.
Other Benefits to the Advisor. The Board considered benefits derived by the Advisor from its relationship with the Funds, including (i) non-advisory fee revenue from the Funds in the form of shareholder administration fees and distribution fees and the payment of some or all of those revenues to third parties, and (ii) favorable media coverage. The Board concluded that, taking into account these benefits, each Fund’s advisory fee was reasonable.
Conclusion. Based upon all of the information considered and the conclusions reached, the Board determined that the terms of the Management Agreement continue to be fair and reasonable and that the continuation of the Management Agreement is in the best interests of each Fund.
| April 30, 2013 | William Blair Funds | 33 |
Proxy Voting
A description of the policies and procedures that the Fund uses to determine how to vote proxies relating to portfolio securities and information regarding how the Fund voted proxies relating to portfolio securities for the most recent 12-month period ended June 30 are available without charge, upon request, by calling 1-800-635-2886 (in Massachusetts 1-800-635-2840), at www.williamblairfunds.com and on the SEC’s website at http://www.sec.gov.
Quarterly Portfolio Schedules
Each Fund files its complete schedule of portfolio holdings with the SEC for the first and third fiscal quarters of each fiscal year (quarters ended January 31 and July 31) on Form N-Q. The Fund’s Forms N-Q are available on the SEC’s website at http://www.sec.gov and may be reviewed and copied at the SEC’s Public Reference Room in Washington, D.C. Information on the operation of the SEC’s Public Reference Room may be obtained by calling 1-800-SEC-0330. The Fund’s Forms N-Q are also available on the Fund’s website at www.williamblairfunds.com.
| 34 | Semi-Annual Report | April 30, 2013 |
| | Useful Information About Your Report (unaudited) Please refer to this information when reviewing the Expense Example for each Portfolio. Expense Example As a shareholder of a Portfolio, you incur two types of costs: (1) transaction costs such as redemption fees and (2) ongoing costs, including management fees, distribution (12b-1) fees, service fees, shareholder administration fees and other Portfolio expenses. The example is intended to help you understand your ongoing costs (in dollars) of investing in the Portfolio and to compare these costs with the ongoing costs of investing in other mutual funds. To do so, compare the Portfolio’s 5% hypothetical example with the 5% hypothetical examples that appear in the shareholder reports of other funds. The example is based on an investment of $1,000 invested at the beginning of the period and held for the entire six-month period from November 1, 2012 to April 30, 2013. Actual Expenses In each example, the first line for each share class in the table provides information about the actual account values and actual expenses. These expenses reflect the effect of any expense cap applicable to the share class during the period. Without this expense cap, the costs shown in the table would have been higher. You may use the information in this line, together with the amount you invested, to estimate the expenses that you paid over the period. Simply divide your account value by $1,000 (example, an $8,600 account value divided by $1,000 = 8.6), then multiply the result by the number in the first line under the heading entitled “Expenses Paid During the Period” to estimate the expenses you paid on your account during the period. Hypothetical Example for Comparison Purposes In each example, the second line for each share class in the table provides information about hypothetical account values and hypothetical expenses based on the Portfolio’s actual expense ratio and an assumed rate of return of 5% per year before expenses. This is not the Portfolio’s actual return. The hypothetical account values and expenses may not be used to estimate the actual ending account balance or expenses you paid for the period. You may use this information to compare the ongoing costs of investing in the Portfolio to other funds. To do so, compare this 5% hypothetical example with the 5% hypothetical examples that appear in the shareholder reports of other funds. Please note that the expenses shown in both examples are meant to highlight your ongoing costs only and do not reflect any transactional costs or account type fees, such as redemption fees and IRA Fiduciary Administration fees, respectively. These fees are fully described in the prospectus. Therefore, the second line of each share class in the table is useful in comparing ongoing costs only and will not help you determine the relative costs of owning different funds. In addition, if these transactional costs or account fees were included, your costs would have been higher. The expenses shown in the examples do not reflect the fees of the Commodity Strategy Long/ Short Fund’s Swap, which are described in the Footnote 1(b) in the Notes to Financial Statements. The costs of the Swap will affect the Fund’s performance. |
| April 30, 2013 | William Blair Funds | 35 |
| Fund Expenses (unaudited) |
The example below shows you the ongoing costs (in dollars) of investing in your fund and allows you to compare these costs with those of other mutual funds. Please refer to the previous page for a detailed explanation of the information presented in these charts.
| Expense Example | | Beginning
Account Value
11/1/2012 | | Ending
Account Value
4/30/2013 | | Expenses Paid
During
the Period(a) | | Annualized
Expense Ratio | |
| Macro Allocation Fund | | | | | | | | | | | | | | | | |
| Class N—actual return | | | $1,000.00 | | | | $1,084.90 | | | | $6.25 | | | | 1.21% | |
| Class N—hypothetical 5% return | | | 1,000.00 | | | | 1,018.79 | | | | 6.06 | | | | 1.21 | |
| Class I—actual return | | | 1,000.00 | | | | 1,085.20 | | | | 6.10 | | | | 1.18 | |
| Class I—hypothetical 5% return | | | 1,000.00 | | | | 1,018.94 | | | | 5.91 | | | | 1.18 | |
| Expense Example | | Beginning
Account Value
11/1/2012 | | Ending
Account Value
4/30/2013 | | Expenses Paid
During the
Period(a) | | Annualized
Expense Ratio | |
| Commodity Strategy Long/Short Fund | | | | | | | | | | | | | | | | |
| Class N—actual return | | | $1,000.00 | | | | $ 966.00 | | | | $9.51 | | | | 1.95% | |
| Class N—hypothetical 5% return | | | 1,000.00 | | | | 1,015.12 | | | | 9.74 | | | | 1.95 | |
| Class I—actual return | | | 1,000.00 | | | | 966.50 | | | | 8.29 | | | | 1.70 | |
| Class I—hypothetical 5% return | | | 1,000.00 | | | | 1,016.36 | | | | 8.50 | | | | 1.70 | |
| (a) | Expenses are equal to the annualized expense ratio, multiplied by the average account value over the period, multiplied by the number of days in the period 181, and divided by 365 (to reflect the one-half year period). |
| 36 | Semi-Annual Report | April 30, 2013 |
| | BOARD OF TRUSTEES |
| | |
| | Vann A. Avedisian
Principal, Highgate Holdings Phillip O. Peterson
Retired Partner, KPMG LLP Donald J. Reaves
Chancellor, Winston-Salem State University Donald L. Seeley
Retired Adjunct Lecturer and Director, University of Arizona Department of Finance Michelle R. Seitz, Chairman and President
Partner, William Blair & Company, L.L.C., Thomas J. Skelly
Retired Managing Partner, Accenture U.S. Richard W. Smirl, Senior Vice President
Partner, William Blair & Company L.L.C. Officers Michael P. Balkin, Senior Vice President
Karl W. Brewer, Senior Vice President
Andrew G. Flynn, Senior Vice President
David C. Fording, Senior Vice President
James S. Golan, Senior Vice President
W. George Greig, Senior Vice President
Michael A. Jancosek, Senior Vice President
John F. Jostrand, Senior Vice President
Chad M. Kilmer,Senior Vice President
Robert C. Lanphier, IV, Senior Vice President
Mark T. Leslie, Senior Vice President
Matthew A. Litfin, Senior Vice President
Kenneth J. McAtamney, Senior Vice President
Todd M. McClone, Senior Vice President
David Merjan, Senior Vice President
David S. Mitchell, Senior Vice President
David P. Ricci, Senior Vice President
Brian D. Singer, Senior Vice President
Paul J. Sularz, Senior Vice President
Jeffrey A. Urbina, Senior Vice President
Christopher T. Vincent, Senior Vice President
John Abunassar, Vice President
Peter Carl, Vice President
Thomas Clarke, Vice President
Edwin Denson, Vice President
D. Trowbridge Elliman III, Vice President
David F. Hone, Vice President
Kathleen M. Lynch, Vice President
Jason Moede, Vice President
Christopher Walvoord, Vice President
Brian Ziv, Vice President
Walter R. Randall, Jr., Chief Compliance Officer and Assistant Secretary
Colette M. Garavalia, Treasurer
Andrew T. Pfau, Secretary
John M. Raczek, Assistant Treasurer Investment Advisor
William Blair & Company, L.L.C. Independent Registered Public Accounting Firm
Ernst & Young LLP Legal Counsel
Vedder Price P.C. Transfer Agent
Boston Financial Data Services, Inc.
P.O. Box 8506
Boston, MA 02266-8506
For customer assistance, call 1-800-635-2886
(Massachusetts 1-800-635-2840) |
| April 30, 2013 | William Blair Funds | 37 |
| William Blair Funds |
Multi-Asset and Alternatives Macro Allocation Fund Commodity Strategy Long/Short Fund |
 | | ©William Blair & Company, L.L.C., distributor |
| +1 800 742 7272 | 222 West Adams Street |
| williamblairfunds.com | Chicago, Illinois 60606 |
Not applicable to this filing.
| Item 3. | Audit Committee Financial Expert |
Not applicable to this filing.
| Item 4. | Principal Accountant Fees and Services |
Not applicable to this filing.
| Item 5. | Audit Committee of Listed Registrants |
Not Applicable to this Registrant, insofar as the Registrant is not a listed company.
| Item 6. | Schedule of Investments |
See Schedule of Investments in Item 1
| Item 7. | Disclosure of Proxy Voting Policies and Procedures for Closed-End Management Investment Companies |
Not applicable to this Registrant, insofar as the Registrant is not a closed-end management investment company.
| Item 8. | Portfolio Managers of Closed Investment Companies |
Not applicable to this Registrant, insofar as the Registrant is not a closed-end management investment company.
| Item 9. | Purchase of Equity Securities by Closed-End Management Investment Companies and Affiliated Purchasers |
Not applicable to this Registrant, insofar as the Registrant is not a closed-end management investment company.
| Item 10. | Submission of Matters to a Vote of Security Holders |
There have been no material changes to the procedures by which shareholders may recommend nominees to the Registrant’s Board of Trustees since the Registrant last provided disclosure in response to this item.
Controls and Procedures
(a) The Registrant’s principal executive and principal financial officer, or persons performing similar functions, have concluded that the Registrant’s Disclosure Controls and Procedures (as defined in Rule 30a-3(c) under the Investment Company Act of 1940, as amended (the “1940 Act”) (17 CFR 270.30a-3(c)) are effective, as of a date within 90 days of the filing date of this report that includes the disclosure required by this paragraph, based on their evaluation of these controls and procedures required by Rule 30a-3 (b) under the 1940 Act (17 CFR 270.30a-3(b) and Rules 13a-15(b) or 15d-15(b) under the Exchange Act (17 CFR 240.13a-15(b) or 240.15d-15(b)).
(b) There were no changes in the Registrant’s internal control over financial reporting (as defined in Rule 30a-3(d) under the 1940 Act (17 CFR 270.30a-3(d)) that occurred during the final quarter of the period covered by this report that has materially affected, or is reasonably likely to materially affect, the Registrant’s internal control over financial reporting.
12. (a) (1) Code of Ethics
Not applicable because it is posted on Registrant’s website.
12. (a) (2) (1)
Certification of Principal Executive Officer Required by Rule 30a-2(a) of the Investment Company Act
12. (a) (2) (2)
Certification of Principal Financial Officer Required by Rule 30a-2(a) of the Investment Company Act.
12. (a) (3)
Not applicable to this Registrant.
12. (b)
Certification of Chief Executive Officer and Certification of Chief Financial Officer Required by Rule 30a-2(b) of the Investment Company Act
Pursuant to the requirements of the Securities Exchange Act of 1934 and the Investment Company Act of 1940, the Registrant has duly caused this report to be signed on its behalf by the undersigned, thereunto duly authorized.
| | William Blair Funds | |
| | | |
| | /s/ Michelle R. Seitz | |
| By: | Michelle R. Seitz | |
| | President | |
| | (Chief Executive Officer) | |
Date: June 20, 2013
Pursuant to the requirements of the Securities Exchange Act of 1934 and the Investment Company Act of 1940, this report has been signed below by the following persons on behalf of the Registrant and in the capacities and on the dates indicated
| | /s/ Michelle R. Seitz | |
| By: | Michelle R. Seitz | |
| | President | |
| | (Chief Executive Officer) | |
Date: June 20, 2013
| | /s/ Colette M. Garavalia | |
| By: | Colette M. Garavalia | |
| | Treasurer | |
| | (Chief Financial Officer) | |
Date: June 20, 2013