UNITED STATES
SECURITIES AND EXCHANGE COMMISSION
Washington, D.C. 20549
Form N-CSR
CERTIFIED SHAREHOLDER REPORT OF REGISTERED
MANAGEMENT INVESTMENT COMPANIES
Investment Company Act File Number 811-5344
William Blair Funds
(Exact name of registrant as specified in charter)
| | |
| 222 West Adams Street, Chicago, IL | | 60606 |
| (Address of principal executive offices) | | (Zip Code) |
Michelle R. Seitz
William Blair Funds
222 West Adams Street, Chicago, IL 60606
(Name and address of agent for service)
Registrant’s telephone number, including area code: 312-236-1600
Date of fiscal year end: December 31
Date of reporting period: June 30, 2012
Form N-CSR is to be used by management investment companies to file reports with the Commission not later than 10 days after the transmission to stockholders of any report that is required to be transmitted to stockholders under Rule 30e-1 under the Investment Company Act of 1940 (17 CFR 270.30e-1). The Commission may use the information provided on Form N-CSR in its regulatory, disclosure review, inspection, and policymaking roles.
A registrant is required to disclose the information specified by Form N-CSR, and the Commission will make this information public. A Registrant is not required to respond to the collection of information contained in Form N-CSR unless the form displays a currently valid Office of Management and Budget (“OMB”) control number. Please direct comments concerning the accuracy of the information collection burden estimates and any suggestions for reducing the burden to Secretary, Securities and Exchange Commission, 450 Fifth Street, NW, Washington, DC 20549-0609. The OMB has reviewed this collection of information under the clearance requirements of 44 U.S.C. (ss) 3507.
| Item 1. | June 30, 2012 Annual Reports transmitted to shareholders. |

William Blair Funds
Semiannual Report
June 30, 2012
Table of Contents
June 30, 2012 | William Blair Funds 1 |
The views expressed in the commentary for each Fund reflect those of the portfolio management team only through the end of the period of the report as stated on the cover. The portfolio management team’s views are subject to change at any time based on market and other conditions and should not be construed as a recommendation. Statements involving predictions, assessments, analyses, or outlook for individual securities, industries, market sectors, and/or markets involve risks and uncertainties, and there is no guarantee they will come to pass.
This report is submitted for the general information of the shareholders of the William Blair Funds. It is not authorized for distribution to prospective investors unless accompanied or preceded by a prospectus of the William Blair Funds. Please carefully consider the Funds’ investment objectives, risks, charges, and expenses before investing. This and other information is contained in the Funds’ prospectus, which you may obtain by calling 1-800-742-7272. Read it carefully before you invest or send money.
2 Semi-Annual Report | June 30, 2012 |
PERFORMANCE AS OF JUNE 30, 2012—CLASS N SHARES (Unaudited)
| | | | | | | | | | | | | | | | | | | | | | | | |
| | | Year
To Date | | | 1 yr | | | 3 yr | | | 5 yr | | | 10 yr
(or since
inception) | | | Inception
Date | | Overall
Morningstar
Rating |
Growth Fund | | | | | | | | | | | | | | | | | | | | | | | | |
Class N | | | 8.95 | | | | 1.11 | | | | 12.88 | | | | 2.07 | | | | 5.51 | | | 3/20/1946 | | «««
Among 1,510 Large Growth Funds |
Morningstar Large Growth | | | 9.23 | | | | 0.81 | | | | 14.83 | | | | 0.96 | | | | 5.19 | | | | |
Russell 3000® Growth | | | 9.98 | | | | 5.05 | | | | 17.55 | | | | 2.79 | | | | 6.13 | | | | |
S&P’s 500 | | | 9.49 | | | | 5.45 | | | | 16.40 | | | | 0.22 | | | | 5.33 | | | | | |
| | | | | | | |
Large Cap Growth Fund | | | | | | | | | | | | | | | | | | | | | | | | |
Class N | | | 12.06 | | | | 4.19 | | | | 14.25 | | | | 1.15 | | | | 3.59 | | | 12/27/1999 | | «««
Among 1,510 Large Growth Funds |
Morningstar Large Growth | | | 9.23 | | | | 0.81 | | | | 14.83 | | | | 0.96 | | | | 5.19 | | | | |
Russell 1000® Growth | | | 10.08 | | | | 5.76 | | | | 17.50 | | | | 2.87 | | | | 6.03 | | | | |
| | | | | | | |
Small Cap Growth Fund | | | | | | | | | | | | | | | | | | | | | | | | |
Class N | | | 9.19 | | | | (6.63 | ) | | | 10.25 | | | | (2.31 | ) | | | 7.15 | | | 12/27/1999 | | ««
Among 662 Small Growth Funds |
Morningstar Small Growth | | | 7.67 | | | | (5.09 | ) | | | 17.34 | | | | 0.94 | | | | 6.70 | | | | |
Russell 2000® Growth | | | 8.81 | | | | (2.71 | ) | | | 18.09 | | | | 1.99 | | | | 7.39 | | | | |
| | | | | | | |
Mid Cap Growth Fund | | | | | | | | | | | | | | | | | | | | | | | | |
Class N | | | 7.03 | | | | (2.86 | ) | | | 17.28 | | | | 3.99 | | | | 5.81 | | | 2/1/2006 | | ««««
Among 678 Mid-Cap Growth Funds |
Morningstar Mid-Cap Growth | | | 7.55 | | | | (4.31 | ) | | | 17.04 | | | | 1.17 | | | | — | | | | |
Russell MidCap® Growth | | | 8.10 | | | | (2.99 | ) | | | 19.01 | | | | 1.90 | | | | 3.82 | | | | |
| | | | | | | |
Small-Mid Cap Growth Fund | | | | | | | | | | | | | | | | | | | | | | | | |
Class N | | | 5.00 | | | | (6.10 | ) | | | 15.72 | | | | 2.69 | | | | 6.95 | | | 12/29/2003 | | ««««
Among 678 Mid-Cap Growth Funds |
Morningstar Mid-Cap Growth | | | 7.55 | | | | (4.31 | ) | | | 17.04 | | | | 1.17 | | | | — | | | | |
Russell 2500TM Growth | | | 8.44 | | | | (3.19 | ) | | | 19.38 | | | | 2.35 | | | | 6.65 | | | | |
| | | | | | | |
Global Growth Fund | | | | | | | | | | | | | | | | | | | | | | | | |
Class N | | | 8.64 | | | | (1.24 | ) | | | 15.15 | | | | — | | | | (2.52 | ) | | 10/15/2007 | | ««««
Among 706 World Stock Funds |
Morningstar World Stock | | | 5.38 | | | | (7.48 | ) | | | 10.79 | | | | — | | | | — | | | | |
MSCI All Country World IMI (net) | | | 5.76 | | | | (6.91 | ) | | | 11.30 | | | | — | | | | (3.70 | ) | | | |
| | | | | | | |
International Growth Fund | | | | | | | | | | | | | | | | | | | | | | | | |
Class N | | | 7.66 | | | | (9.74 | ) | | | 10.34 | | | | (4.53 | ) | | | 6.50 | | | 10/1/1992 | | «««
Among 210 Foreign Large Growth Funds |
Morningstar Foreign Large Growth | | | 4.86 | | | | (11.51 | ) | | | 9.53 | | | | (3.38 | ) | | | 6.03 | | | | |
MSCI All Country World Ex-U.S.
IMI (net) | | | 2.93 | | | | (14.79 | ) | | | 7.36 | | | | (4.46 | ) | | | 7.19 | | | | |
| | | | | | | |
International Equity Fund | | | | | | | | | | | | | | | | | | | | | | | | |
Class N | | | 4.55 | | | | (11.75 | ) | | | 6.80 | | | | (5.88 | ) | | | 2.76 | | | 5/24/2004 | | ««
Among 210 Foreign Large Growth Funds |
Morningstar Foreign Large Growth | | | 4.86 | | | | (11.51 | ) | | | 9.53 | | | | (3.38 | ) | | | — | | | | |
MSCI World Ex-U.S. (net) | | | 2.43 | | | | (14.13 | ) | | | 6.20 | | | | (5.67 | ) | | | 4.69 | | | | |
| | | | | | | |
International Small Cap Growth Fund | | | | | | | | | | | | | | | | | | | | | | | | |
Class N | | | 6.16 | | | | (11.55 | ) | | | 13.91 | | | | (2.56 | ) | | | 4.59 | | | 11/1/2005 | | «««
Among 96 Foreign Small/Mid Growth Funds |
Morningstar Foreign Small/Mid Growth | | | 7.36 | | | | (11.25 | ) | | | 12.80 | | | | (3.49 | ) | | | — | | | | |
MSCI All Country World Small Cap Ex-U.S. (net) | | | 4.09 | | | | (16.43 | ) | | | 10.41 | | | | (3.74 | ) | | | 4.41 | | | | |
| | | | | | | |
Emerging Markets Growth Fund | | | | | | | | | | | | | | | | | | | | | | | | |
Class N | | | 7.08 | | | | (10.81 | ) | | | 12.61 | | | | (2.96 | ) | | | 10.07 | | | 6/6/2005 | | «««
Among 353 Diversified Emerging Markets Funds |
Morningstar Diversified Emerging Markets | | | 4.15 | | | | (16.10 | ) | | | 8.96 | | | | (2.02 | ) | | | — | | | | |
MSCI Emerging Markets IMI (net) | | | 4.31 | | | | (16.29 | ) | | | 9.97 | | | | (0.01 | ) | | | 10.34 | | | | |
Please see the next page for important disclosure information.
June 30, 2012 | William Blair Funds 3 |
PERFORMANCE AS OF JUNE 30, 2012—CLASS N SHARES (Unaudited)—CONTINUED
| | | | | | | | | | | | | | | | | | | | | | | | |
| | | Year
To Date | | | 1 yr | | | 3 yr | | | 5 yr | | | 10 yr
(or since
inception) | | | Inception
Date | | Overall
Morningstar
Rating |
Emerging Leaders Growth Fund | | | | | | | | | | | | | | | | | |
Class N | | | 6.90 | | | | (11.87 | ) | | | — | | | | — | | | | 0.85 | | | 5/3/2010 | | Not rated. |
Morningstar Diversified Emerging Markets | | | 4.15 | | | | (16.10 | ) | | | — | | | | — | | | | — | | | | | |
MSCI Emerging Markets Large Cap (net) | | | 3.60 | | | | (15.51 | ) | | | — | | | | — | | | | (0.63 | ) | | | | |
| | | | | | | |
Emerging Markets Small Cap Growth Fund | | | | | | | | | | | | | | | | | | | | | | | | |
Class N | | | 14.29 | | | | — | | | | — | | | | — | | | | 11.20 | | | 10/24/2011 | | Not rated. |
Morningstar Diversified Emerging Markets | | | 4.15 | | | | — | | | | — | | | | — | | | | — | | | | | |
MSCI EM (Emerging Markets)
Small Cap | | | 7.27 | | | | — | | | | — | | | | — | | | | 0.49 | | | | | |
| | | | | | | |
Large Cap Value Fund | | | | | | | | | | | | | | | | | | | | | | | | |
Class N | | | 9.15 | | | | — | | | | — | | | | — | | | | 8.93 | | | 10/24/2011 | | Not rated. |
Morningstar Large Value | | | 7.01 | | | | — | | | | — | | | | — | | | | — | | | | | |
Russell 1000® Value | | | 8.68 | | | | — | | | | — | | | | — | | | | 10.48 | | | | | |
| | | | | | | |
Small Cap Value Fund | | | | | | | | | | | | | | | | | | | | | | | | |
Class N | | | 5.46 | | | | (3.97 | ) | | | 17.74 | | | | 1.31 | | | | 5.62 | | | 12/23/1996 | | «««
Among 284 Small Value Funds |
Morningstar Small Value | | | 6.53 | | | | (2.74 | ) | | | 17.37 | | | | (0.20 | ) | | | 7.34 | | | | |
Russell 2000® Value | | | 8.23 | | | | (1.44 | ) | | | 17.43 | | | | (1.05 | ) | | | 6.50 | | | | |
| | | | | | | |
Mid Cap Value Fund | | | | | | | | | | | | | | | | | | | | | | | | |
Class N | | | 4.68 | | | | (1.46 | ) | | | — | | | | — | | | | 5.82 | | | 5/3/2010 | | Not rated. |
Morningstar Mid-Cap Value | | | 6.95 | | | | (3.42 | ) | | | — | | | | — | | | | — | | | | | |
Russell Midcap® Value | | | 7.78 | | | | (0.37 | ) | | | — | | | | — | | | | 6.21 | | | | | |
| | | | | | | |
Small-Mid Cap Value Fund | | | | | | | | | | | | | | | | | | | | | | | | |
Class N | | | 4.59 | | | | — | | | | — | | | | — | | | | 9.30 | | | 12/15/2011 | | Not rated. |
Morningstar Mid-Cap Value | | | 6.16 | | | | — | | | | — | | | | — | | | | — | | | | | |
Russell 2500® Value | | | 8.15 | | | | — | | | | — | | | | — | | | | 12.69 | | | | | |
| | | | | | | |
Bond Fund | | | | | | | | | | | | | | | | | | | | | | | | |
Class N | | | 3.93 | | | | 8.49 | | | | 8.42 | | | | 7.30 | | | | 6.81 | | | 5/1/2007 | | ««««
Among 1,015 Intermediate-Term Bond Funds |
Morningstar Intermediate-Term Bond | | | 3.46 | | | | 6.57 | | | | 8.31 | | | | 6.20 | | | | — | | | | |
Barclays Capital U.S. Aggregate Bond | | | 2.37 | | | | 7.47 | | | | 6.93 | | | | 6.79 | | | | 6.35 | | | | |
| | | | | | | |
Income Fund | | | | | | | | | | | | | | | | | | | | | | | | |
Class N | | | 2.94 | | | | 5.68 | | | | 6.30 | | | | 4.37 | | | | 3.91 | | | 10/1/1990 | | ««««
Among 352 Short-Term Bond Funds |
Morningstar Short-term Bond | | | 1.86 | | | | 2.05 | | | | 4.11 | | | | 3.50 | | | | 3.36 | | | | |
Barclays Capital Intermediate | | | 2.10 | | | | 5.42 | | | | 5.81 | | | | 6.01 | | | | 5.08 | | | | |
Govt./Credit Bond | | | | | | | | | | | | | | | | | | | | | | | | |
| | | | | | | |
Low Duration Fund | | | | | | | | | | | | | | | | | | | | | | | | |
Class N | | | 1.59 | | | | 2.19 | | | | — | | | | — | | | | 1.77 | | | 12/1/2009 | | Not rated. |
Morningstar Ultra Short Bond | | | 1.05 | | | | 0.79 | | | | — | | | | — | | | | — | | | | | |
Merrill Lynch 1-Year U.S. Treasury Note | | | 0.04 | | | | 0.26 | | | | — | | | | — | | | | 0.50 | | | | | |
Performance cited represents past performance. Past performance does not guarantee future results and current performance may be lower or higher than the data quoted. Results shown are average annual total returns, which assume reinvestment of dividends and capital gains. Investment returns and principal will fluctuate and you may have a gain or a loss when you sell shares. For the most current month-end performance information, please call 1-800-742-7272, or visit our Web site at www.williamblairfunds.com. From time to time, the investment advisor may waive fees or reimburse expenses for the Fund. Without these waivers, performance would be lower. Investing in smaller companies involves special risks, including higher
4 Semi-Annual Report | June 30, 2012 |
PERFORMANCE AS OF JUNE 30, 2012—CLASS N SHARES (Unaudited)—CONTINUED
volatility and lower liquidity. International and emerging markets investing involves special risk considerations, including currency fluctuations, lower liquidity, economic and political risk. As interest rates rise, bond prices will fall and bond funds may become more volatile. Class N shares are available to the general public without a sales load.
Morningstar RatingsTM are as of 6/30/2012 and are subject to change every month. The ratings are based on a risk-adjusted return measure that accounts for variation in a fund’s monthly performance, placing more emphasis on downward variations and rewarding consistent performance. The top 10% of funds in each Category receive 5 stars, the next 22.5% receive 4 stars, the middle 35% receive 3 stars, the next 22.5% receive 2 stars, and the bottom 10% receive 1 star. The Overall Morningstar Rating for a fund is derived from a weighted-average of the performance figures associated with its three-, five- and ten-year (if applicable) Morningstar Rating metrics. The 3/5/10 year Morningstar ratings were as follows: Growth Fund ««/««««/««« and Large Cap Growth Fund «««/«««/««, out of 1,510/1,297/855 large growth funds; Small Cap Growth Fund «/««/«««, out of 662/574/378 small growth funds; Mid Cap Growth Fund «««/««««/NA and Small-Mid Cap Growth Fund «««/««««/NA out of 678/598/NA mid cap growth funds; Global Growth Fund ««««/NA/NA out of 706/NA/NA world stocks; International Growth Fund ««««/«««/««« and International Equity Fund ««/««/NA out of 210/171/96 foreign large growth funds; International Small Cap Growth Fund ««««/«««/NA out of 96/88/NA foreign small/mid growth funds; Emerging Markets Growth Fund ««««/««/NA and Emerging Leaders Growth Fund ««««/NA/NA, out of 353/243/NA diversified emerging markets growth funds; Small Cap Value Fund «««/««««/«« out of 284/253/150 small value funds; Income Fund «««««/««««/«««« out of 352/324/190 short-term bond funds; Bond Fund «««/««««/NA out of 1,015/880/NA intermediate-term bond fund.
Please carefully consider the Funds’ investment objectives, risks, charges, and expenses before investing. This and other information is contained in the Funds’ prospectus, which you may obtain by calling 1-800-742-7272. Read it carefully before you invest or send money.
See accompanying Notes to Financial Statements.
June 30, 2012 | William Blair Funds 5 |

David C. Fording

John F. Jostrand
GROWTH FUND
The Growth Fund seeks long-term capital appreciation.
AN OVERVIEW FROM THE PORTFOLIO MANAGERS
Thus far in 2012, U.S. equity markets posted strong results; the Russell 3000® Growth Index rose 9.98%. However, performance varied widely in each quarter. Like the past several years, the familiar pattern of risk-on occurred during periods of optimism while risk-off occurred during periods of pessimism due to rising macro and political concerns. The period began with robust upward momentum as investors gained confidence in the strengthening U.S. economy and were comforted by stabilization in Europe; the Russell 3000® Growth Index climbed 14.58% in the first quarter. Notably, investors differentiated based on underlying company fundamentals, a sound environment for active managers. However, during the second quarter, markets reversed course due to worries over U.S. economic growth, the re-intensified European debt crisis and continued slowing growth in emerging markets; the Russell 3000® Growth Index fell 4.02% in the second quarter. In the latter period, volatility and stock correlations picked up; investors preferred low risk, defensives and domestically focused companies.
Portfolio Results
The William Blair Growth Fund Class N rose 8.95% modestly trailing its benchmark, the Russell 3000® Growth Index. The positive results occurred primarily in the first quarter. Importantly, most of our companies had good quarterly earnings reports, which assisted.
Our Health Care and Industrials stock selection was strong. In Health Care, we added HMS Holdings Corporation to the portfolio in April and it rallied sharply at the end of June when the Supreme Court upheld the Patient Protection and Affordable Care Act (PPACA), which potentially expands the Medicaid population by 10 million in 2014. HMS Holdings’ coordination of benefit business should benefit as it ensures Medicaid does not pay claims that should be covered by other parties. More broadly, we had a half dozen other outperforming Health Care stocks in the portfolio in the first half. In Industrials, TransDigm Group, Inc. – a designer, producer, and supplier of engineered aircraft components, and IHS, Inc. – the leading global provider of critical technical information, decision support tools, and related services, contributed nicely to results. TransDigm Group reported quarterly earnings that were above consensus due to strong growth in all end markets. In our view, it has a superior business model relative to peers focusing its design and acquisition efforts on complex, low volume, low dollar value parts within an aircraft. Once it has a design win, it is the sole source provider for the life of the aircraft (30 to 40 years per platform). IHS had healthy quarterly results with attractive organic revenue growth. We believe the firm should continue to benefit from strong subscription renewal trends, a robust new product pipeline, improved cross-selling initiatives, as well as cost and efficiency improvements projects. Lastly, in Information Technology, eBay, Inc. continued to be a standout as the best overall portfolio contributor. It continued to experience strong top line growth and margin expansion for the Paypal business as well as continued improvement for the Marketplace division. We believe Paypal should continue to benefit from market share gains and market growth online as well as in the fast growing mobile payments arena.
Our weakest sector was Consumer Discretionary due to positions in Gentex Corporation and McDonald’s Corporation. Gentex, a technology company serving the global automotive industry, came under pressure given another delay by the National Transportation Safety Board in providing guidance for how auto manufacturers are to comply with the government’s mandate for rear cameras in vehicles. This news disappointed investors as it
6 Semi-Annual Report | June 30, 2012 |
continues the uncertainty in regard to an avenue of growth for Gentex. We believe the firm has attractive long term growth prospects from both current and upcoming products. For McDonald’s, it was a strong performer in 2011 and investors took profits in 2012. In our view, it is one of highest quality investments that did not perform as well as comparable peers especially in the second quarter. Notably, we had trimmed this large position early in 2012 on valuation and added back to it later in the first quarter period at a more attractive price; we believe it is a well positioned long term winner. Another sector that lagged was Consumer Staples due to a position in Green Mountain Coffee Roasters, Inc. It came under pressure on weaker than expected sales growth driven by a K-cup attachment rate that appears to be slowing faster than expected. The many moving parts of the model, notably the shifting channels of distribution and evolving consumer behavior as single-serve coffee goes mainstream, led to wide variability in company results versus Wall Street expectations, and investors lost confidence. This coincides with concerns around long-term K-cup profitability as select K-cup related patents expire. We believe current valuation implies substantial cuts to estimates based on various negative scenarios, which we do not consider probable; therefore, we maintained our relatively small position.
Outlook
While U.S. equity markets oscillate between optimism and pessimism from quarter to quarter, these moves seem more based on the latest macro or political news release than a change in the long-term trajectory for the U.S. economy. The Federal Reserve remains accommodative and stands ready to enact additional measures if necessary, which should be supportive of businesses and consumers. While in the second quarter unemployment ticked up and manufacturing modestly declined due to Europe’s recessionary environment, U.S. housing sales improved. Corporate balance sheets and operating margins in aggregate remain healthy. Falling commodity prices should provide some relief; the price of oil traded from $99 to $85 per barrel in the first half of 2012.
Typically, markets crave certainty; until clarity appears, volatility will likely remain elevated. Investors remain concerned over further deterioration in the European debt crisis and slowing emerging market growth, which in turn impacts U.S. exports. Also, in the U.S., stability of economic growth remains a primary focus, along with the November elections and the outcome for the fiscal cliff (i.e., expiration of the Bush-era tax cuts, coupled with mandatory federal spending cuts.) Finally, with revenue growth broadly decelerating and operating margins at or near peak levels for the U.S. market as a whole, the ability of corporations to sustain high levels of earnings growth is of some concern.
As always, our concentration remains on our quality growth philosophy, disciplined investment process, and deep fundamental research. We believe strategically advantaged companies with unique products/services, strong business models and seasoned management teams can sustain growth over peers and the benchmark. In terms of valuation, quality growth stocks remain attractive if consensus earnings can be achieved, while perceived “safe” stocks are elevated relative to history. In general, we continue to find attractive investment opportunities and use volatility to our advantage to buy quality growth companies with strong risk/reward profiles.
June 30, 2012 | William Blair Funds 7 |
Growth Fund
Performance Highlights (Unaudited)
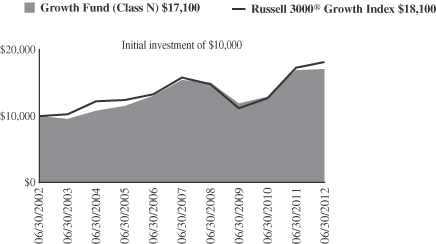
Average Annual Total Return at 6/30/2012
| | | | | | | | | | | | | | | | | | | | |
| | | Year
To Date | | | 1
Year | | | 3
Year | | | 5
Year | | | 10
Year | |
Class N | | | 8.95 | % | | | 1.11 | % | | | 12.88 | % | | | 2.07 | % | | | 5.51 | % |
Class I | | | 9.12 | | | | 1.41 | | | | 13.24 | | | | 2.40 | | | | 5.82 | |
Russell 3000® Growth Index | | | 9.98 | | | | 5.05 | | | | 17.55 | | | | 2.79 | | | | 6.13 | |
S&P 500 Index | | | 9.49 | | | | 5.45 | | | | 16.40 | | | | 0.22 | | | | 5.33 | |
Performance cited represents past performance. Past performance does not guarantee future results and current performance may be lower or higher than the data quoted. Results shown are average annual returns, which assume reinvestment of dividends and capital gains. Investment returns and principal will fluctuate and you may have a gain or loss when you sell shares. For the most current month-end performance information, please call 1-800-742-7272, or visit our Web site at www.williamblairfunds.com. Class N shares are available to the general public without a sales load. Class I shares are available to certain institutional investors and advisory clients of William Blair & Company L.L.C. without a sales load or distribution (12b-1) or service fees.
The performance highlights and graph presented above do not reflect the deduction of taxes that a shareholder would pay on fund distributions or the redemption of fund shares.
The Russell 3000® Growth Index consists of large, medium, and small capitalization companies with above average price-to-book ratios and forecasted growth rates. The index is weighted by market capitalization and large/medium/small companies make up approximately 80%/15%/5% of the index.
The S&P 500 Index indicates broad larger capitalization equity market performance.
This report identifies the Fund’s investments on June 30, 2012. These holdings are subject to change. Not all stocks in the Fund performed the same, nor is there any guarantee that these stocks will perform as well in the future. Market forecasts provided in this report may not necessarily come to pass.
Sector Diversification (Unaudited)
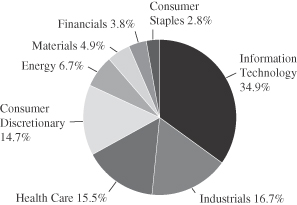
The sector diversification shown is based on the total long-term securities.
8 Semi-Annual Report | June 30, 2012 |
Growth Fund
Portfolio of Investments, June 30, 2012 (all dollar amounts in thousands) (unaudited)
| | | | | | | | |
Issuer | | Shares | | | Value | |
| | |
Common Stocks | | | | | | | | |
Information Technology—34.5% | | | | | | | | |
*Apple, Inc. | | | 85,285 | | | $ | 49,806 | |
*Cavium, Inc. | | | 242,700 | | | | 6,796 | |
*eBay, Inc. | | | 497,200 | | | | 20,887 | |
*Genpact, Ltd.† | | | 805,418 | | | | 13,394 | |
*Google, Inc. Class “A” | | | 44,905 | | | | 26,048 | |
Mastercard, Inc. Class “A” | | | 39,200 | | | | 16,860 | |
*Monolithic Power Systems, Inc. | | | 283,452 | | | | 5,632 | |
QUALCOMM, Inc. | | | 402,740 | | | | 22,425 | |
*RealPage, Inc. | | | 302,761 | | | | 7,012 | |
*Silicon Laboratories, Inc. | | | 179,227 | | | | 6,793 | |
*SolarWinds, Inc. | | | 184,500 | | | | 8,037 | |
Solera Holdings, Inc. | | | 142,300 | | | | 5,947 | |
TE Connectivity, Ltd.† | | | 383,500 | | | | 12,238 | |
*VeriSign, Inc. | | | 220,000 | | | | 9,585 | |
| | | | | | | | |
| | | | | | | 211,460 | |
| | | | | | | | |
Industrials—16.4% | | | | | | | | |
*BE Aerospace, Inc. | | | 146,600 | | | | 6,401 | |
Fastenal Co. | | | 223,458 | | | | 9,008 | |
*IHS, Inc. Class “A” | | | 203,869 | | | | 21,963 | |
*Jacobs Engineering Group, Inc. | | | 334,200 | | | | 12,653 | |
*Stericycle, Inc. | | | 148,600 | | | | 13,622 | |
*TransDigm Group, Inc. | | | 124,180 | | | | 16,677 | |
*Trimas Corporation | | | 316,423 | | | | 6,360 | |
Union Pacific Corporation | | | 116,900 | | | | 13,947 | |
| | | | | | | | |
| | | | | | | 100,631 | |
| | | | | | | | |
Health Care—15.2% | | | | | | | | |
*Align Technology, Inc. | | | 137,200 | | | | 4,591 | |
Allergan, Inc. | | | 176,200 | | | | 16,311 | |
*Cerner Corporation | | | 42,300 | | | | 3,497 | |
*DaVita, Inc. | | | 80,300 | | | | 7,886 | |
*Gilead Sciences, Inc. | | | 347,835 | | | | 17,837 | |
*Haemonetics Corporation | | | 134,100 | | | | 9,938 | |
*HMS Holdings Corporation | | | 302,100 | | | | 10,063 | |
*IDEXX Laboratories, Inc. | | | 118,518 | | | | 11,393 | |
*Illumina, Inc. | | | 115,900 | | | | 4,681 | |
*NxStage Medical, Inc. | | | 442,090 | | | | 7,409 | |
| | | | | | | | |
| | | | | | | 93,606 | |
| | | | | | | | |
Consumer Discretionary—14.5% | | | | | | | | |
*Amazon.com, Inc. | | | 82,600 | | | | 18,862 | |
*Discovery Communications, Inc. Class “A” | | | 176,600 | | | | 9,536 | |
Gentex Corporation | | | 288,200 | | | | 6,015 | |
Harley-Davidson, Inc. | | | 227,599 | | | | 10,408 | |
*K12, Inc. | | | 212,299 | | | | 4,947 | |
Issuer | | Shares or
Principal
Amount | | | Value | |
| | |
Common Stocks—(continued) | | | | | | | | |
Consumer Discretionary—(continued) | | | | | | | | |
McDonald’s Corporation | | | 267,764 | | | $ | 23,705 | |
*Pandora Media, Inc. | | | 568,000 | | | | 6,174 | |
*Teavana Holdings, Inc. | | | 357,280 | | | | 4,834 | |
*Vera Bradley, Inc. | | | 219,300 | | | | 4,623 | |
| | | | | | | | |
| | | | | | | 89,104 | |
| | | | | | | | |
Energy—6.6% | | | | | | | | |
*Cameron International Corporation | | | 148,147 | | | | 6,327 | |
Occidental Petroleum Corporation | | | 157,500 | | | | 13,509 | |
Schlumberger, Ltd.† | | | 314,900 | | | | 20,440 | |
| | | | | | | | |
| | | | | | | 40,276 | |
| | | | | | | | |
Materials—4.8% | | | | | | | | |
Airgas, Inc. | | | 150,700 | | | | 12,660 | |
Ecolab, Inc. | | | 243,720 | | | | 16,702 | |
| | | | | | | | |
| | | | | | | 29,362 | |
| | | | | | | | |
Financials—3.7% | | | | | | | | |
*IntercontinentalExchange, Inc. | | | 118,000 | | | | 16,046 | |
LPL Financial Holdings, Inc. | | | 197,500 | | | | 6,669 | |
| | | | | | | | |
| | | | | | | 22,715 | |
| | | | | | | | |
Consumer Staples—2.8% | | | | | | | | |
*Green Mountain Coffee Roasters, Inc. | | | 254,700 | | | | 5,548 | |
Mead Johnson Nutrition Co. | | | 141,700 | | | | 11,408 | |
| | | | | | | | |
| | | | | | | 16,956 | |
| | | | | | | | |
Total Common Stocks—98.5%
(cost $502,304) | | | | 604,110 | |
| | | | | | | | |
| | |
Repurchase Agreement | | | | | | | | |
Fixed Income Clearing Corporation, 0.100% dated 6/29/12, due 7/2/12, repurchase price $8,273, collateralized by FNMA,
5.00%, due 4/15/2015. | | $ | 8,272 | | | | 8,272 | |
| | | | | | | | |
Total Repurchase Agreement—1.3%
(cost $8,273) | | | | 8,272 | |
| | | | | | | | |
Total Investments—99.8%
(cost $510,576) | | | | 612,382 | |
Cash and other assets, less liabilities—0.2% | | | | 1,181 | |
| | | | | | | | |
Net assets—100.0% | | | $ | 613,563 | |
| | | | | | | | |
* Non-income producing securities
† = U.S. listed foreign security
See accompanying Notes to Portfolio of Investments.
June 30, 2012 | William Blair Funds 9 |

James S. Golan

David P. Ricci
LARGE CAP GROWTH FUND
The Large Cap Growth Fund seeks long-term capital appreciation.
AN OVERVIEW FROM THE PORTFOLIO MANAGERS
Thus far in 2012, U.S. equity markets posted strong results; the Russell 1000® Growth Index rose 10.08%. However, performance varied widely in each quarter. Like the past several years, the familiar pattern of risk-on occurred during periods of optimism while risk-off occurred during periods of pessimism due to rising macro and political concerns. The period began with robust upward momentum as investors gained confidence in the strengthening U.S. economy and were comforted by stabilization in Europe; the Russell 1000® Growth Index climbed 14.69% in the first quarter. Notably, investors differentiated based on underlying company fundamentals, a sound environment for active managers. However, during the second quarter, markets reversed course due to worries over U.S. economic growth, the re-intensified European debt crisis and continued slowing growth in emerging markets; the Russell 1000® Growth Index fell 4.02% in the second quarter. In the latter period, volatility and stock correlations picked up; investors preferred low risk, defensives and domestically focused companies.
Portfolio Results
The William Blair Large Cap Growth Fund Class N rose 12.06% surpassing the benchmark, the Russell 1000® Growth Index. Stock selection in the first quarter drove the positive relative results. Importantly, most of our companies had good quarterly earnings reports, which assisted.
Our Information Technology (IT) stock selection contributed most to the overall return; eBay, Inc., Apple, Inc. and Citrix Systems, Inc. ranked among the best performers. eBay continued to experience strong top line growth and margin expansion for the Paypal business as well as continued improvement for the Marketplace division. We believe Paypal should continue to benefit from market share gains and market growth online as well as in the fast growing mobile payments arena. Apple also continued to gain ground due to healthy iPhone, iPad, and Mac sales. Additionally, the company launched the newest iPad and announced it is initiating a dividend as well as a share repurchase program. Citrix Systems benefited from above expectations revenues driven by strong desktop virtualization license growth, increased traction with its networking product and momentum with its SaaS (software-as-a-service) business. We believe Citrix is well positioned to take advantage of attractive trends in desktop virtualization, which is primarily driven by Windows 7 upgrades, desktop refreshes, security, disaster recovery planning, and a move to support a variety of client access devices due to the continued proliferation of smartphones and the emerging iPad/tablet category. Outside of IT, Whole Foods Market, Inc. contributed nicely delivering strong sales and margin leverage. The management team continues to execute at a high level in a robust market for health conscious consumers – a long-term secular trend. Going forward, we believe Whole Foods Market has the potential to triple the number of stores in North America based on underpenetrated geographies and smaller stores in smaller cities.
The portfolio had only a couple of notable stock detractors across various sectors. In Consumer Staples, Green Mountain Coffee Roasters, Inc. came under pressure on slowing sales growth, driven primarily by a K-cup attachment rate that is deteriorating as the user base evolves from high coffee consuming early adopters to mass market. Given the broader uncertainty on the company (patent expiration, and hence the emergence of potential competition), this new information severely rattled investors. We believe the current valuation is unusually punishing and a dire view of the situation; therefore, we maintained our
10 Semi-Annual Report | June 30, 2012 |
relatively small position. In IT, Google, Inc. trailed peers; it slightly missed revenues in its fourth quarter report, which disappointed investors. Also, with increased attention over the Facebook IPO, some investors had concerns over Google’s competitive position and a potential threat to its advertising revenues. In our view, Google should continue to be a beneficiary of advertisers shifting their spending to the internet and wireless applications. Lastly, in Consumer Discretionary, Nike, Inc.’s stock detracted in the second quarter. The company’s fiscal fourth quarter results disappointed due to lower than expected gross margin and a deceleration of futures orders in China. We believe these issues will not be secular in nature. Over the long-term, Nike should enjoy compelling global growth due to its strong brand, innovation and further expansion into emerging markets.
Outlook
While U.S. equity markets oscillate between optimism and pessimism from quarter to quarter, these moves seem more based on the latest macro or political news release than a change in the long-term trajectory for the U.S. economy. The Federal Reserve remains accommodative and stands ready to enact additional measures if necessary, which should be supportive of businesses and consumers. While in the second quarter unemployment ticked up and manufacturing modestly declined due to Europe’s recessionary environment, U.S. housing sales improved. Corporate balance sheets and operating margins in aggregate remain healthy. Falling commodity prices should provide some relief; the price of oil traded from $99 to $85 per barrel in the first half of 2012.
Typically, markets crave certainty; until clarity appears, volatility will likely remain elevated. Investors remain concerned over further deterioration in the European debt crisis and slowing emerging market growth, which in turn impacts U.S. exports. Also, in the U.S., stability of economic growth remains a primary focus, along with the November elections and the outcome for the fiscal cliff (i.e., expiration of the Bush-era tax cuts, coupled with mandatory federal spending cuts.) Finally, with revenue growth broadly decelerating and operating margins at or near peak levels for the U.S. market as a whole, the ability of corporations to sustain high levels of earnings growth is of some concern.
As always, our concentration remains on our quality growth philosophy, disciplined investment process, and deep fundamental research. We believe strategically advantaged companies with unique products/services, strong business models and seasoned management teams can sustain growth over peers and the benchmark. In terms of valuation, quality growth stocks remain attractive if consensus earnings can be achieved, while perceived “safe” stocks are elevated relative to history. In general, we continue to find attractive investment opportunities and use volatility to our advantage to buy quality growth companies with strong risk/reward profiles.
June 30, 2012 | William Blair Funds 11 |
Large Cap Growth Fund
Performance Highlights (Unaudited)
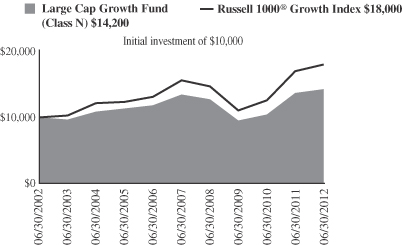
Average Annual Total Return at 6/30/2012
| | | | | | | | | | | | | | | | | | | | |
| | | Year
To Date | | | 1
Year | | | 3
Year | | | 5
Year | | | 10
Year | |
Class N | | | 12.06 | % | | | 4.19 | % | | | 14.25 | % | | | 1.15 | % | | | 3.59 | % |
Class I | | | 12.38 | | | | 4.40 | | | | 14.52 | | | | 1.43 | | | | 3.83 | |
Russell 1000® Growth Index | | | 10.08 | | | | 5.76 | | | | 17.50 | | | | 2.87 | | | | 6.03 | |
Performance cited represents past performance. Past performance does not guarantee future results and current performance may be lower or higher than the data quoted. Results shown are average annual total returns, which assume reinvestment of dividends and capital gains. Investment returns and principal will fluctuate and you may have a gain or loss when you sell shares. For the most current month-end performance information, please call 1-800-742-7272, or visit our Web site at www.williamblairfunds.com. From time to time, the investment advisor may waive fees or reimburse expenses for the Fund. Without these waivers, performance would be lower. Class N shares are available to the general public without a sales load. Class I shares are available to certain institutional investors and advisory clients of William Blair & Company, L.L.C., without a sales load or distribution (12b-1) or service fees.
The performance highlights and graph presented above do not reflect the deduction of taxes that a shareholder would pay on fund distributions or the redemption of fund shares.
The Russell 1000® Growth Index consists of large capitalization companies with above average price-to-book ratios and forecasted growth rates.
This report identifies the Fund’s investments on June 30, 2012. These holdings are subject to change. Not all stocks in the Fund performed the same, nor is there any guarantee that these stocks will perform as well in the future. Market forecasts provided in this report may not necessarily come to pass.
Sector Diversification (Unaudited)
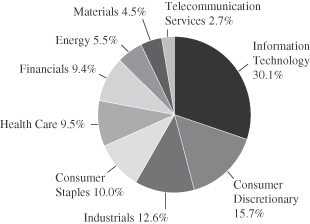
The sector diversification shown is based on the total long-term securities.
12 Semi-Annual Report | June 30, 2012 |
Large Cap Growth Fund
Portfolio of Investments, June 30, 2012 (all dollar amounts in thousands) (unaudited)
| | | | | | | | |
Issuer | | Shares | | | Value | |
| | |
Common Stocks | | | | | | | | |
Information Technology—29.7% | | | | | | | | |
Accenture plc Class “A”† | | | 13,030 | | | $ | 783 | |
*Apple, Inc. | | | 4,680 | | | | 2,733 | |
*Broadcom Corporation Class “A” | | | 7,730 | | | | 261 | |
*Citrix Systems, Inc. | | | 10,170 | | | | 854 | |
*eBay, Inc. | | | 24,410 | | | | 1,026 | |
*Google, Inc. Class “A” | | | 1,483 | | | | 860 | |
Mastercard, Inc. Class “A” | | | 940 | | | | 404 | |
QUALCOMM, Inc. | | | 15,125 | | | | 842 | |
*Trimble Navigation, Ltd. | | | 5,470 | | | | 252 | |
| | | | | | | | |
| | | | | | | 8,015 | |
| | | | | | | | |
Consumer Discretionary—15.5% | | | | | | | | |
*Amazon.com, Inc. | | | 2,680 | | | | 612 | |
*Discovery Communications, Inc. Class “A” | | | 10,270 | | | | 555 | |
*Dollar General Corporation | | | 7,350 | | | | 400 | |
Harley-Davidson, Inc. | | | 14,860 | | | | 679 | |
NIKE, Inc. Class “B” | | | 6,850 | | | | 601 | |
*priceline.com, Inc. | | | 725 | | | | 482 | |
Starbucks Corporation | | | 15,960 | | | | 851 | |
| | | | | | | | |
| | | | | | | 4,180 | |
| | | | | | | | |
Industrials—12.4% | | | | | | | | |
Donaldson Co., Inc. | | | 14,720 | | | | 491 | |
Precision Castparts Corporation | | | 5,130 | | | | 844 | |
*Stericycle, Inc. | | | 8,110 | | | | 743 | |
Union Pacific Corporation | | | 5,110 | | | | 610 | |
W.W. Grainger, Inc. | | | 3,450 | | | | 660 | |
| | | | | | | | |
| | | | | | | 3,348 | |
| | | | | | | | |
Consumer Staples—9.9% | | | | | | | | |
Colgate-Palmolive Co. | | | 8,930 | | | | 929 | |
*Green Mountain Coffee Roasters, Inc. | | | 12,520 | | | | 273 | |
Mead Johnson Nutrition Co. | | | 10,120 | | | | 815 | |
Whole Foods Market, Inc. | | | 6,810 | | | | 649 | |
| | | | | | | | |
| | | | | | | 2,666 | |
| | | | | | | | |
Health Care—9.4% | | | | | | | | |
Allergan, Inc. | | | 8,155 | | | | 755 | |
*DaVita, Inc. | | | 5,620 | | | | 552 | |
*Gilead Sciences, Inc. | | | 18,380 | | | | 942 | |
*IDEXX Laboratories, Inc. | | | 2,870 | | | | 276 | |
| | | | | | | | |
| | | | | | | 2,525 | |
| | | | | | | | |
Issuer | | Shares or
Principal
Amount | | | Value | |
| | |
Common Stocks—(continued) | | | | | | | | |
Financials—9.3% | | | | | | | | |
*Affiliated Managers Group, Inc. | | | 4,290 | | | $ | 470 | |
American Express Co. | | | 10,000 | | | | 582 | |
JPMorgan Chase & Co. | | | 25,860 | | | | 924 | |
T Rowe Price Group, Inc. | | | 8,350 | | | | 526 | |
| | | | | | | | |
| | | | | | | 2,502 | |
| | | | | | | | |
Energy—5.4% | | | | | | | | |
National Oilwell Varco, Inc. | | | 4,340 | | | | 280 | |
Occidental Petroleum Corporation | | | 5,110 | | | | 438 | |
Schlumberger, Ltd.† | | | 11,410 | | | | 741 | |
| | | | | | | | |
| | | | | | | 1,459 | |
| | | | | | | | |
Materials—4.4% | | | | | | | | |
Praxair, Inc. | | | 6,695 | | | | 728 | |
Syngenta AG—ADR | | | 6,840 | | | | 468 | |
| | | | | | | | |
| | | | | | | 1,196 | |
| | | | | | | | |
Telecommunication Services—2.6% | | | | | | | | |
*SBA Communications Corporation
Class “A” | | | 12,450 | | | | 710 | |
| | | | | | | | |
Total Common Stocks—98.6%
(cost $20,696) | | | | | | | 26,601 | |
| | | | | | | | |
| | |
Repurchase Agreement | | | | | | | | |
Fixed Income Clearing Corporation, 0.100% dated 6/29/12, due 7/2/12, repurchase price $467, collateralized by FNMA,
5.00%, due 4/15/2015 | | $ | 467 | | | | 467 | |
| | | | | | | | |
Total Repurchase Agreement—1.7%
(cost $467) | | | | 467 | |
| | | | | | | | |
Total Investments—100.3%
(cost $21,163) | | | | 27,068 | |
Liabilities, plus cash and other assets—(0.3)% | | | | (69 | ) |
| | | | | | | | |
Net assets—100.0% | | | $ | 26,999 | |
| | | | | | | | |
See accompanying Notes to Portfolio of Investments.
June 30, 2012 | William Blair Funds 13 |
ADR = American Depository Receipt
† = U.S. listed foreign security
* Non-income producing securities

Michael P. Balkin

Karl W. Brewer
SMALL CAP GROWTH FUND
The Small Cap Growth Fund seeks long-term capital appreciation.
AN OVERVIEW FROM THE PORTFOLIO MANAGERS
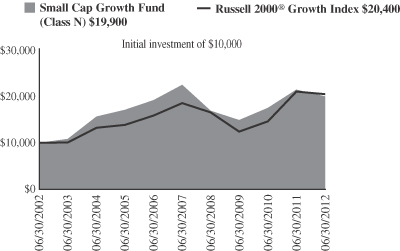
The Small Cap Growth Fund increased 9.19% on a total return basis (Class N shares) for the six months ended June 30, 2012. By comparison the Fund’s benchmark, the Russell 2000® Growth Index, increased 8.81%.
After a nearly 30% advance over the previous two quarters, U.S. equities corrected in the second quarter. Robust first quarter returns primarily were driven by improving economic data points in the U.S. and continued strength in the corporate sector. However, in the second quarter, investors refocused their attention on negative headline news from Europe. While news from Greece continued, the elevated fear in the market revolved around more substantial European economies. Investors focused on Europe’s efforts to stabilize the Spanish banking system and the potential risks to the Spanish government’s borrowing capacity. Essentially, investors grappled with the region’s ability to preserve the single-currency bloc.
The slowdown was felt worldwide; China’s growth notably decelerated, joined by other emerging economies, due in part to developed nations’ decreased demand for exports. The U.S. was not immune to the slowdown; U.S. companies with direct business exposure to these regions, combined with declining U.S. business confidence due to the barrage of negative global headlines, translated into slowing business investment and worsening economic data at home. A string of disappointing data points ensued: employment growth slowed significantly from earlier this year, consumer confidence declined, and manufacturing activity slowed.
Broadly speaking, investors’ risk appetite continued from last year during the first quarter, but they gravitated to stocks of companies with less economic sensitivity during the second quarter. From a sector perspective, the typically defensive Health Care and Consumer Staples sectors outperformed in both the second quarter and year-to-date period. Energy has been the standout underperformer in 2012 to date, in part due to the global slowdown’s impact on oil demand.
Year-to-date, the Fund gained 9.19%, surpassing its benchmark, the Russell 2000® Growth Index, which rose 8.81%. The Fund’s outperformance during the first half of 2012 is attributable to stock selection. Notably absent in 2012 as compared to recent years are meaningful style dynamics (i.e., neither tailwinds nor headwinds). From a stock selection perspective, two of the biggest contributors to relative return during the first half of the year were Kensey Nash and Catamaran (formerly SXC Health Solutions). Kensey Nash was one of the Fund’s worst performers in 2011 given royalty disputes with a partner, St. Jude Medical. The resolution of that issue lifted the stock in the first quarter. Then, in the second quarter, the stock rallied further after the company announced it was being acquired by a European biomedical company. The Fund sold its position after this announcement and prior to closing of the acquisition. Catamaran, a pharmacy benefit manager, has seen strong business momentum and announced the acquisition of a competitor, enabling the company to better compete with some of the largest pharmacy benefit managers in the world. On the other hand, Gentherm and Polypore have been the largest detractors from relative return this year. Gentherm has underperformed given complications relating to a German acquisition made in 2011. Polypore underperformed as investors questioned the proprietary nature of its battery separation processes and as the outlook for the electric vehicle market, a big growth driver for the company, became increasingly clouded.
Regarding the second quarter specifically, the Fund’s underperformance was attributable to stock selection. Gentherm and Office Depot were the two leading reasons for the quarter’s
14 Semi-Annual Report | June 30, 2012 |
underperformance. On the other hand, helping relative performance were Kensey Nash and Six Flags. While the recovery works to regain traction, there are a few positive developments to highlight: the stubborn housing market finally seems to be reversing course, as indicated by encouraging data on home prices and sales trends. Gas prices have declined from their April highs, although savings at the pump have yet to translate into higher confidence among consumers. Improving loan demand and banks’ willingness to lend are displaying some encouraging trends as well. Regarding the stock market specifically, while fundamentals are at a critical juncture given the current pause in business confidence, valuations appear attractive if estimated earnings growth materializes.
Today’s unresolved issues make for a cloudy outlook as the world waits to see how the next chapter of the euro zone will read. Much attention will be focused on U.S. politics leading up to the November elections, the potential “fiscal cliff” (i.e., expiration of the Bush-era tax cuts, coupled with mandatory federal spending cuts), and the overall pace of economic growth. While this quarter’s market pullback resembles the past two years’ mid-year slumps, the global easing cycle along with a strengthening housing market could serve as tailwinds unique to 2012.
In the end, while we factor various economic scenarios into our stock picking, we focus our time on constructing the Fund from a bottom-up perspective. We continue to find good ideas across sectors, and are confident the Fund consists of well-managed companies with solid competitive positions whose stocks are at attractive valuations compared to the expected growth and consistency of their business.
June 30, 2012 | William Blair Funds 15 |
Small Cap Growth Fund
Performance Highlights (Unaudited)
Average Annual Total Return at 6/30/2012
| | | | | | | | | | | | | | | | | | | | |
| | | Year
To Date | | | 1
Year | | | 3
Year | | | 5
Year | | | 10
Year | |
Class N | | | 9.19 | % | | | (6.63 | )% | | | 10.25 | % | | | (2.31 | )% | | | 7.15 | % |
Class I | | | 9.33 | | | | (6.39 | ) | | | 10.57 | | | | (2.03 | ) | | | 7.44 | |
Russell 2000® Growth Index | | | 8.81 | | | | (2.71 | ) | | | 18.09 | | | | 1.99 | | | | 7.39 | |
Performance cited represents past performance. Past performance does not guarantee future results and current performance may be lower or higher than the data quoted. Results shown are average annual total returns, which assume reinvestment of dividends and capital gains. Investment returns and principal will fluctuate and you may have a gain or loss when you sell shares. For the most current month-end performance information, please call 1-800-742-7272, or visit our Web site at www.williamblairfunds.com. Investing in smaller companies involves special risks, including higher volatility and lower liquidity. Smaller Capitalization stocks are also more sensitive to purchase/sale transactions and changes in the issuer’s financial condition. From time to time, the investment advisor may waive fees or reimburse expenses for the Fund. Without these waivers, performance would be lower. Class N shares are available to the general public without a sales load. Class I shares are available to certain institutional investors and advisory clients of William Blair & Company, L.L.C., without a sales load or distribution (12b-1) or service fees.
The performance highlights and graph presented above do not reflect the deduction of taxes that a shareholder would pay on fund distributions or the redemption of fund shares.
The Russell 2000® Growth Index is an unmanaged composite of the smallest 2000 stocks of the Russell 3000® Growth Index.
This report identifies the Fund’s investments on June 30, 2012. These holdings are subject to change. Not all stocks in the Fund performed the same, nor is there any guarantee that these stocks will perform as well in the future. Market forecasts provided in this report may not necessarily come to pass.
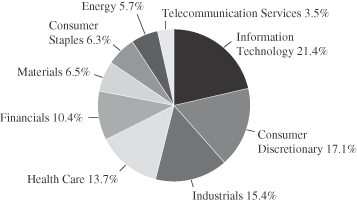
Sector Diversification (Unaudited)

The sector diversification shown is based on the total long-term securities.
16 Semi-Annual Report | June 30, 2012 |
Small Cap Growth Fund
Portfolio of Investments, June 30, 2012 (all dollar amounts in thousands) (unaudited)
| | | | | | | | |
Issuer | | Shares | | | Value | |
| | |
Common Stocks | | | | | | | | |
Information Technology—21.0% | | | | | | | | |
*Bottomline Technologies, Inc. | | | 413,073 | | | $ | 7,456 | |
*Cardtronics, Inc. | | | 79,340 | | | | 2,397 | |
*Cavium, Inc. | | | 215,316 | | | | 6,029 | |
*Inuvo, Inc. | | | 2,171,739 | | | | 1,477 | |
*Liquidity Services, Inc. | | | 102,140 | | | | 5,229 | |
*MaxLinear, Inc. Class “A” | | | 795,912 | | | | 3,948 | |
*Monolithic Power Systems, Inc. | | | 456,571 | | | | 9,072 | |
*RealPage, Inc. | | | 308,553 | | | | 7,146 | |
*Silicon Laboratories, Inc. | | | 152,674 | | | | 5,786 | |
*SolarWinds, Inc. | | | 160,280 | | | | 6,982 | |
*Stamps.com, Inc. | | | 251,620 | | | | 6,208 | |
Syntel, Inc. | | | 116,992 | | | | 7,101 | |
*Tangoe, Inc. | | | 240,729 | | | | 5,130 | |
*TeleTech Holdings, Inc. | | | 474,520 | | | | 7,592 | |
*Ultimate Software Group, Inc. | | | 78,556 | | | | 7,001 | |
*ValueClick, Inc. | | | 241,733 | | | | 3,962 | |
*Volterra Semiconductor Corporation | | | 231,017 | | | | 5,417 | |
*WNS Holdings, Ltd.—ADR | | | 789,008 | | | | 7,677 | |
*Wright Express Corp. | | | 42,630 | | | | 2,631 | |
| | | | | | | | |
| | | | | | | 108,241 | |
| | | | | | | | |
Industrials—20.5% | | | | | | | | |
*Acacia Research Corporation | | | 116,010 | | | | 4,320 | |
Acorn Energy, Inc. | | | 496,520 | | | | 4,131 | |
*CAI International, Inc. | | | 537,020 | | | | 10,676 | |
*Cenveo, Inc. | | | 2,090,976 | | | | 4,036 | |
*Clean Harbors, Inc. | | | 141,875 | | | | 8,005 | |
*Encore Capital Group, Inc. | | | 156,137 | | | | 4,625 | |
*Franklin Covey Co. | | | 715,830 | | | | 7,330 | |
*Furmanite Corporation | | | 670,735 | | | | 3,260 | |
Healthcare Services Group, Inc. | | | 361,656 | | | | 7,009 | |
*Heritage-Crystal Clean, Inc. | | | 317,291 | | | | 5,188 | |
*Huron Consulting Group, Inc. | | | 219,442 | | | | 6,945 | |
*ICF International, Inc. | | | 288,353 | | | | 6,874 | |
*Mistras Group, Inc. | | | 281,818 | | | | 7,406 | |
*Navigant Consulting, Inc. | | | 407,260 | | | | 5,148 | |
*On Assignment, Inc. | | | 589,800 | | | | 9,413 | |
*Trimas Corporation | | | 554,755 | | | | 11,150 | |
| | | | | | | | |
| | | | | | | 105,516 | |
| | | | | | | | |
Health Care—17.5% | | | | | | | | |
*ABIOMED, Inc. | | | 157,999 | | | | 3,606 | |
*Air Methods Corporation | | | 57,525 | | | | 5,652 | |
*Brookdale Senior Living, Inc. | | | 389,250 | | | | 6,905 | |
*Conceptus, Inc. | | | 161,658 | | | | 3,204 | |
*Cyberonics, Inc. | | | 142,509 | | | | 6,404 | |
*ExamWorks Group, Inc. | | | 584,638 | | | | 7,735 | |
*Haemonetics Corporation | | | 107,455 | | | | 7,964 | |
*HealthSouth Corporation | | | 344,370 | | | | 8,010 | |
*HMS Holdings Corporation | | | 138,807 | | | | 4,624 | |
*Natus Medical, Inc. | | | 441,770 | | | | 5,133 | |
*NxStage Medical, Inc. | | | 602,217 | | | | 10,093 | |
*Quidel Corporation | | | 413,256 | | | | 6,480 | |
*The Providence Service Corporation | | | 416,053 | | | | 5,704 | |
| | | | | | | | |
Issuer | | Shares | | | Value | |
| | |
Common Stocks—(continued) | | | | | | | | |
Health Care—(continued) | | | | | | | | |
Trinity Biotech plc—ADR | | | 744,674 | | | $ | 8,936 | |
| | | | | | | | |
| | | | | | | 90,450 | |
| | | | | | | | |
Consumer Discretionary—16.6% | | | | | | | | |
*Amerigon, Inc. | | | 742,757 | | | | 8,534 | |
*Genesco, Inc. | | | 91,257 | | | | 5,489 | |
*Grand Canyon Education, Inc. | | | 375,834 | | | | 7,870 | |
Jarden Corporation | | | 166,632 | | | | 7,002 | |
*K12, Inc. | | | 247,544 | | | | 5,768 | |
*Mattress Firm Holding Corporation | | | 85,731 | | | | 2,599 | |
*Office Depot, Inc. | | | 2,066,151 | | | | 4,463 | |
*Pandora Media, Inc. | | | 430,210 | | | | 4,676 | |
*Select Comfort Corporation | | | 159,109 | | | | 3,329 | |
*Shuffle Master, Inc. | | | 375,820 | | | | 5,186 | |
Six Flags Entertainment Corporation | | | 232,950 | | | | 12,621 | |
*Steven Madden, Ltd. | | | 121,545 | | | | 3,859 | |
Texas Roadhouse, Inc. | | | 89,694 | | | | 1,653 | |
*U.S. Auto Parts Network, Inc. | | | 1,116,362 | | | | 4,666 | |
*Vera Bradley, Inc. | | | 237,022 | | | | 4,997 | |
*WMS Industries, Inc. | | | 139,567 | | | | 2,784 | |
| | | | | | | | |
| | | | | | | 85,496 | |
| | | | | | | | |
Financials—11.3% | | | | | | | | |
*Cowen Group, Inc. | | | 2,741,550 | | | | 7,293 | |
*First Cash Financial Services, Inc. | | | 297,050 | | | | 11,932 | |
*FirstService Corporation† | | | 209,742 | | | | 5,866 | |
*FX Alliance, Inc. | | | 142,455 | | | | 2,238 | |
GFI Group, Inc. | | | 641,714 | | | | 2,285 | |
*ICG Group, Inc. | | | 941,898 | | | | 8,713 | |
Manning & Napier, Inc. | | | 437,183 | | | | 6,221 | |
Marlin Business Services Corporation | | | 280,138 | | | | 4,591 | |
*National Financial Partners Corporation | | | 695,076 | | | | 9,314 | |
| | | | | | | | |
| | | | | | | 58,453 | |
| | | | | | | | |
Energy—5.3% | | | | | | | | |
*Atwood Oceanics, Inc. | | | 155,090 | | | | 5,868 | |
*Hornbeck Offshore Services, Inc. | | | 171,633 | | | | 6,656 | |
*Laredo Petroleum Holdings, Inc. | | | 192,915 | | | | 4,013 | |
*Oil States International, Inc. | | | 93,420 | | | | 6,184 | |
*PDC Energy, Inc. | | | 178,253 | | | | 4,371 | |
| | | | | | | | |
| | | | | | | 27,092 | |
| | | | | | | | |
Materials—1.7% | | | | | | | | |
*Horsehead Holding Corporation | | | 426,220 | | | | 4,245 | |
*Stillwater Mining Co. | | | 509,626 | | | | 4,352 | |
| | | | | | | | |
| | | | | | | 8,597 | |
| | | | | | | | |
Total Common Stocks—93.9%
(cost $449,228) | | | | | | | 483,845 | |
| | | | | | | | |
Exchange-Traded Fund | | | | | | | | |
iShares Russell 2000 Growth Index Fund | | | 199,462 | | | | 18,245 | |
| | | | | | | | |
Total Exchange-Traded Fund—3.5%
(cost $16,936) | | | | | | | 18,245 | |
| | | | | | | | |
See accompanying Notes to Portfolio of Investments.
June 30, 2012 | William Blair Funds 17 |
Small Cap Growth Fund
Portfolio of Investments, June 30, 2012 (all dollar amounts in thousands) (unaudited)
| | | | | | | | |
Issuer | | Principal
Amount | | | Value | |
| | |
Repurchase Agreement | | | | | | | | |
Fixed Income Clearing Corporation, 0.100% dated 6/29/12, due 7/2/12, repurchase price $12,551, collateralized by U.S. Treasury Note, 4.250%, due 8/15/15; | | $ | 12,551 | | | $ | 12,551 | |
| | | | | | | | |
Total Repurchase Agreement—2.4%
(cost $12,551) | | | | | | | 12,551 | |
| | | | | | | | |
Total Investments—99.8%
(cost $478,715) | | | | | | | 514,641 | |
Cash and other assets, less liabilities—0.2% | | | | 795 | |
| | | | | | | | |
Net assets—100.0% | | | | | | $ | 515,436 | |
| | | | | | | | |
ADR = American Depository Receipt
* Non-income producing securities
† = U.S. listed foreign security
If the Fund’s portfolio holdings represent ownership of 5% or more of the voting securities of a company, the company is deemed to be an affiliate as defined in the Investment Company Act of 1940. The Small Cap Growth Fund had the following transactions during the period ended June 30, 2012 with companies deemed affiliated during the period or at June 30, 2012.
| | | | | | | | | | | | | | | | | | | | | | | | | | |
| | | | | Share Activity | | | Period Ended
June 30, 2012 | |
| | | | | | | | | | | | | | | | | (in thousands) | |
Security Name | | Balance
12/31/2011 | | | Purchases | | | Sales | | | Balance
6/30/2012 | | | Value | | | Dividends
Included
in Income | |
| | Dreams, Inc. | | | 2,671,926 | | | | 119,643 | | | | 2,791,569 | | | | — | | | $ | — | | | $ | — | |
| | Inuvo, Inc. | | | 861,747 | | | | 1,309,992 | | | | — | | | | 2,171,739 | | | | 1,477 | | | | — | |
| | Kensey Nash Corporation | | | 483,937 | | | | 44,009 | | | | 527,946 | | | | — | | | | — | | | | 217 | |
* | | Vertro, Inc. | | | 847,343 | | | | — | | | | 847,343 | | | | — | | | | — | | | | — | |
| | | | | | | | | | | | | | | | | | | | | | | | | | |
| | | | | | | | | | | | | | | | | | | | $ | 1,477 | | | $ | 217 | |
| | | | | | | | | | | | | | | | | | | | | | | | | | |
* Vertro, Inc. was acquired by Inuvo, Inc. at a rate of 1.546 shares of Inuvo, Inc. for each share of Vertro, Inc. on March 2, 2012.
See accompanying Notes to Portfolio of Investments.
18 Semi-Annual Report | June 30, 2012 |

Robert C. Lanphier, IV
David P. Ricci
MID CAP GROWTH FUND
The Mid Cap Growth Fund seeks long-term capital appreciation.
AN OVERVIEW FROM THE PORTFOLIO MANAGERS
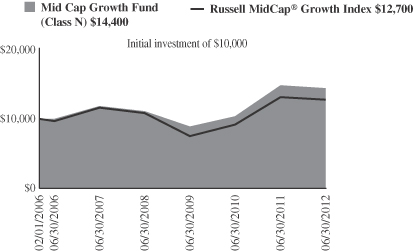
The Mid Cap Growth Fund posted a 7.03% increase on a total return basis (Class N Shares) for the six months ended June 30, 2012. By comparison, the Fund’s benchmark, the Russell Midcap® Growth Index, increased 8.10% during the period.
After a nearly 30% advance over the previous two quarters, U.S. equities corrected in the second quarter. Robust first quarter returns primarily were driven by improving economic data points in the U.S. and continued strength in the corporate sector. However, in the second quarter, investors refocused their attention on negative headline news from Europe. While news from Greece continued, the elevated fear in the market revolved around more substantial European economies. Investors focused on Europe’s efforts to stabilize the Spanish banking system and the potential risks to the Spanish government’s borrowing capacity. Essentially, investors grappled with the region’s ability to preserve the single-currency bloc.
The slowdown was felt worldwide; China’s growth notably decelerated, joined by other emerging economies, due in part to developed nations’ decreased demand for exports. The U.S. was not immune to the slowdown; U.S. companies with direct business exposure to these regions, combined with declining U.S. business confidence due to the barrage of negative global headlines, translated into slowing business investment and worsening economic data at home. A string of disappointing data points ensued: employment growth slowed significantly from earlier this year, consumer confidence declined, and manufacturing activity slowed.
Broadly speaking, investors’ risk appetite continued from last year during the first quarter, but they gravitated to stocks of companies with less economic sensitivity during the second quarter. From a sector perspective, the typically defensive Health Care and Consumer Staples sectors outperformed in both the second quarter and year-to-date period. Energy has been the standout underperformer in 2012 to date, in part due to the global slowdown’s impact on oil demand and rising natural gas supplies.
Year-to-date, the Fund gained 7.03%, closely trailing its benchmark, the Russell Midcap® Growth Index, which rose 8.10%. The Fund’s underperformance during the first half of 2012 is primarily attributable to style headwinds in the first quarter. Over 100% of our year-to-date underperformance occurred during the first quarter when the market was up nearly 15%, a robust environment not ideal for our style of investing. Detracting from performance were Green Mountain Coffee Roasters, Inc. and Gentex Corporation. While Green Mountain Coffee Roasters, Inc. continues to grow at a rapid pace, its rate of growth is slowing from the hyper levels of the past few years, in large part due to a greater-than-expected decrease in the amount of k-cups consumed per brewer as brewer sales expand beyond the early-adopters. Gentex Corporation has underperformed given uncertainty in its rear camera display division as governmental clarity on the issue is not expected until later this year. We continue to hold both of these detractors. From a stock-specific perspective, Illumina, Inc. has been the largest contributor to relative return in 2012 as the company announced it was being acquired by Roche Holdings (note: we liquidated our position on the announcement and the deal has since dissolved). TransDigm Group, Inc. has been the second largest contributor given continued business strength and its less-cyclical business model among aerospace-related companies.
For the second quarter specifically, the Fund’s outperformance was a result of style tailwinds and mixed stock selection. The Fund outpaced its benchmark during the second quarter declining 5.38% while the Russell Midcap® Growth Index declined 5.60%. In general, the
June 30, 2012 | William Blair Funds 19 |
market’s preference for stocks with less economic sensitivity benefitted our Fund’s performance. From a stock selection perspective, HMS Holdings Corporation and TransDigm Group, Inc. Group were two of the strongest contributors to relative return. On the other hand, Green Mountain Coffee Roasters, Inc. and NetApp detracted from relative performance.
While the recovery works to regain traction, there are a few positive developments to highlight: the stubborn housing market finally seems to be reversing course, with encouraging data on home prices and sales trends. Gas prices have declined from their April highs, although savings at the pump have yet to translate into higher confidence among consumers. Improving loan demand and banks’ willingness to lend are displaying some encouraging trends as well. Regarding the stock market specifically, while fundamentals are at a critical juncture given the current pause in business confidence, valuations appear attractive if estimated earnings growth materializes.
Today’s unresolved issues make for a cloudy outlook as the world waits to see how the next chapter of the euro zone will read. Much attention will be focused on U.S. politics leading up to the November elections, the potential “fiscal cliff” (i.e., expiration of the Bush-era tax cuts, coupled with mandatory federal spending cuts), and the overall pace of economic growth. On the other hand, the current global easing cycle and a strengthening U.S. housing market could serve as buffers.
In the end, while we factor various economic scenarios into our stock picking, we focus our time on constructing the Fund from a bottom-up perspective. We continue to find good ideas across sectors, and are confident the Fund consists of well-managed companies with solid competitive positions whose stocks are at attractive valuations compared to the expected growth and consistency of their business.
20 Semi-Annual Report | June 30, 2012 |
Mid Cap Growth Fund
Performance Highlights (Unaudited)
Average Annual Total Return at 6/30/2012
| | | | | | | | | | | | | | | | | | | | |
| | | Year
To Date | | | 1
Year | | | 3
Year | | | 5
Year | | | Since
Inception(a) | |
Class N | | | 7.03 | % | | | (2.86) | % | | | 17.28 | % | | | 3.99 | % | | | 5.81 | % |
Class I | | | 7.25 | | | | (2.53) | | | | 17.58 | | | | 4.26 | | | | 6.11 | |
Russell MidCap® Growth Index | | | 8.10 | | | | (2.99) | | | | 19.01 | | | | 1.90 | | | | 3.82 | |
| | (a) | | For the period from February 1, 2006 (Commencement of Operations) to June 30, 2012. |
Performance cited represents past performance. Past performance does not guarantee future results and current performance may be lower or higher than the data quoted. Results shown are average annual total returns, which assume reinvestment of dividends and capital gains. Investment returns and principal will fluctuate and you may have a gain or loss when you sell shares. For the most current month-end performance information, please call 1-800-742-7272, or visit our Web site at www.williamblairfunds.com. Investing in medium capitalization companies involves special risks, including higher volatility and lower liquidity. Medium Capitalization stocks are also more sensitive to purchase/sale transactions and changes in the issuer’s financial condition. From time to time, the investment advisor may waive fees or reimburse expenses for the Fund. Without these waivers, performance would be lower. Class N shares are available to the general public without a sales load. Class I shares are available to certain institutional investors and advisory clients of William Blair & Company, L.L.C., without a sales load or distribution (12b-1) or service fees.
The performance highlights and graph presented above do not reflect the deduction of taxes that a shareholder would pay on fund distributions or the redemption of fund shares.
The Russell MidCap® Growth Index is an index that is constructed to provide a comprehensive and unbiased barometer of the mid-cap growth market.
This report identifies the Fund’s investments on June 30, 2012. These holdings are subject to change. Not all stocks in the Fund performed the same, nor is there any guarantee that these stocks will perform as well in the future. Market forecasts provided in this report may not necessarily come to pass.
Sector Diversification (Unaudited)
The sector diversification shown is based on the total long-term securities.
June 30, 2012 | William Blair Funds 21 |
Mid Cap Growth Fund
Portfolio of Investments, June 30, 2012 (all dollar amounts in thousands) (unaudited)
| | | | | | | | |
Issuer | | Shares | | | Value | |
| | |
Common Stocks | | | | | | | | |
Information Technology—20.4% | | | | | | | | |
Amphenol Corporation | | | 117,000 | | | $ | 6,426 | |
*Aruba Networks, Inc. | | | 383,100 | | | | 5,766 | |
*Cavium, Inc. | | | 246,519 | | | | 6,902 | |
*Citrix Systems, Inc. | | | 134,700 | | | | 11,307 | |
*Concur Technologies, Inc. | | | 73,130 | | | | 4,980 | |
*Genpact, Ltd.† | | | 190,207 | | | | 3,163 | |
*Informatica Corporation | | | 35,100 | | | | 1,487 | |
*Silicon Laboratories, Inc. | | | 186,780 | | | | 7,079 | |
*SolarWinds, Inc. | | | 152,000 | | | | 6,621 | |
TE Connectivity, Ltd.† | | | 160,851 | | | | 5,133 | |
*Trimble Navigation, Ltd. | | | 112,104 | | | | 5,158 | |
*VeriSign, Inc. | | | 178,200 | | | | 7,764 | |
| | | | | | | | |
| | | | | | | 71,786 | |
| | | | | | | | |
Consumer Discretionary—16.2% | | | | | | | | |
*Bed Bath & Beyond, Inc. | | | 123,960 | | | | 7,661 | |
*Chipotle Mexican Grill, Inc. | | | 4,840 | | | | 1,839 | |
Dick’s Sporting Goods, Inc. | | | 229,329 | | | | 11,008 | |
Gentex Corporation | | | 147,080 | | | | 3,069 | |
Harley-Davidson, Inc. | | | 169,800 | | | | 7,765 | |
Harman International Industries, Inc. | | | 123,006 | | | | 4,871 | |
*Lululemon Athletica, Inc. | | | 136,400 | | | | 8,133 | |
*O’Reilly Automotive, Inc. | | | 92,480 | | | | 7,747 | |
*Select Comfort Corporation | | | 175,700 | | | | 3,676 | |
Tractor Supply Co. | | | 18,200 | | | | 1,512 | |
| | | | | | | | |
| | | | | | | 57,281 | |
| | | | | | | | |
Industrials—14.7% | | | | | | | | |
*Clean Harbors, Inc. | | | 110,200 | | | | 6,218 | |
Donaldson Co., Inc. | | | 186,300 | | | �� | 6,217 | |
Fastenal Co. | | | 82,462 | | | | 3,324 | |
Gardner Denver, Inc. | | | 60,800 | | | | 3,217 | |
J.B. Hunt Transport Services, Inc. | | | 146,800 | | | | 8,749 | |
*Jacobs Engineering Group, Inc. | | | 127,100 | | | | 4,812 | |
*Polypore International, Inc. | | | 50,300 | | | | 2,032 | |
*Stericycle, Inc. | | | 97,230 | | | | 8,913 | |
*TransDigm Group, Inc. | | | 61,350 | | | | 8,239 | |
| | | | | | | | |
| | | | | | | 51,721 | |
| | | | | | | | |
Health Care—13.0% | | | | | | | | |
*Cerner Corporation | | | 72,600 | | | | 6,001 | |
*HealthSouth Corporation | | | 328,024 | | | | 7,630 | |
*HMS Holdings Corporation | | | 373,300 | | | | 12,435 | |
*IDEXX Laboratories, Inc. | | | 119,072 | | | | 11,446 | |
Perrigo Co. | | | 72,200 | | | | 8,514 | |
| | | | | | | | |
| | | | | | | 46,026 | |
| | | | | | | | |
| | | | | | | | |
Issuer | | Shares or
Principal
Amount | | | Value | |
| | |
Common Stocks—(continued) | | | | | | | | |
Financials—9.9% | | | | | | | | |
*Affiliated Managers Group, Inc. | | | 48,775 | | | $ | 5,338 | |
*First Republic Bank | | | 172,700 | | | | 5,803 | |
LPL Financial Holdings, Inc. | | | 311,700 | | | | 10,526 | |
*Signature Bank | | | 102,600 | | | | 6,256 | |
T Rowe Price Group, Inc. | | | 111,100 | | | | 6,995 | |
| | | | | | | | |
| | | | | | | 34,918 | |
| | | | | | | | |
Materials—6.2% | | | | | | | | |
Airgas, Inc. | | | 120,800 | | | | 10,148 | |
Ecolab, Inc. | | | 168,600 | | | | 11,554 | |
| | | | | | | | |
| | | | | | | 21,702 | |
| | | | | | | | |
Consumer Staples—6.0% | | | | | | | | |
*Green Mountain Coffee Roasters, Inc. | | | 177,846 | | | | 3,873 | |
McCormick & Co., Inc. | | | 139,000 | | | | 8,430 | |
Mead Johnson Nutrition Co. | | | 109,000 | | | | 8,776 | |
| | | | | | | | |
| | | | | | | 21,079 | |
| | | | | | | | |
Energy—5.4% | | | | | | | | |
*Cameron International Corporation | | | 104,100 | | | | 4,446 | |
*Denbury Resources, Inc. | | | 264,670 | | | | 3,999 | |
*FMC Technologies, Inc. | | | 142,800 | | | | 5,602 | |
Range Resources Corporation | | | 83,700 | | | | 5,179 | |
| | | | | | | | |
| | | | | | | 19,226 | |
| | | | | | | | |
Telecommunication Services—3.3% | | | | | | | | |
*SBA Communications Corporation Class “A” | | | 204,000 | | | | 11,638 | |
| | | | | | | | |
Total Common Stocks—95.1%
(cost $317,572) | | | | | | | 335,377 | |
| | | | | | | | |
| | |
Repurchase Agreement | | | | | | | | |
Fixed Income Clearing Corporation, 0.100% dated 6/29/12, due 7/2/12, repurchase price $19,372, collateralized by FNMA, 5.000%, due 4/15/15 | | $ | 19,372 | | | | 19,372 | |
| | | | | | | | |
Total Repurchase Agreement—5.5%
(cost $19,372) | | | | 19,372 | |
| | | | | | | | |
Total Investments—100.6%
(cost $336,944) | | | | 354,749 | |
Liabilities, plus cash and other assets—(0.6)% | | | | (2,182 | ) |
| | | | | | | | |
Net assets—100.0% | | | $ | 352,567 | |
| | | | | | | | |
See accompanying Notes to Portfolio of Investments.
22 Semi-Annual Report | June 30, 2012 |
* Non-income producing securities
† = U.S. listed foreign security
Karl W. Brewer
Robert C. Lanphier, IV

Matthew A. Litfin
SMALL-MID CAP GROWTH FUND
The Small-Mid Cap Growth Fund seeks long-term capital appreciation.
AN OVERVIEW FROM THE PORTFOLIO MANAGERS
The Small-Mid Cap Growth Fund increased 5.00% on a total return basis (Class N Shares) for the six months ended June 30, 2012. By comparison, the Fund’s benchmark, the Russell 2500TM Growth Index, increased 8.44% during the period.
After a nearly 30% advance over the previous two quarters, U.S. equities corrected in the second quarter. Robust first quarter returns primarily were driven by improving economic data points in the U.S. and continued strength in the corporate sector. However, in the second quarter, investors refocused their attention on negative headline news from Europe. While news from Greece continued, the elevated fear in the market revolved around more substantial European economies. Investors focused on Europe’s efforts to stabilize the Spanish banking system and the potential risks to the Spanish government’s borrowing capacity. Essentially, investors grappled with the region’s ability to preserve the single-currency bloc.
The slowdown was felt worldwide; China’s growth notably decelerated, joined by other emerging economies, due in part to developed nations’ decreased demand for exports. The U.S. was not immune to the slowdown; U.S. companies with direct business exposure to these regions, combined with declining U.S. business confidence due to the barrage of negative global headlines, translated into slowing business investment and worsening economic data at home. A string of disappointing data points ensued: employment growth slowed significantly from earlier this year, consumer confidence declined, and manufacturing activity slowed.
Broadly speaking, investors’ risk appetite continued from last year during the first quarter, but investors gravitated to stocks of companies with less economic sensitivity during the second quarter. From a sector perspective, the typically defensive Health Care and Consumer Staples sectors outperformed in both the second quarter and year-to-date period. Energy has been the standout underperformer in 2012 to date, in part due to the global slowdown’s impact on oil demand and rising natural gas supplies.
Year-to-date, the Fund gained 5.00%, trailing its benchmark, the Russell 2500TM Growth Index, which rose 8.44%. The Fund’s underperformance during the first half of 2012 is attributable to both style headwinds (in the first quarter) and stock selection (primarily in the second quarter). The majority of our year-to-date underperformance occurred during the first quarter when the market was up nearly 15%, a robust environment not ideal for our style of investing. From a stock-specific perspective, Green Mountain Coffee Roasters, Inc. and Tempur-Pedic were responsible for a considerable amount of the underperformance. While Green Mountain continues to grow at a rapid pace, its rate of growth is slowing from the hyper levels of the past few years. Tempur-Pedic announced a slowdown in business as the competitive environment shifted substantially. Contributing positively to performance were Catamaran (formerly SXC Health Solutions) and athenahealth Inc. Catamaran, a pharmacy benefit manager, has seen strong business momentum and announced the acquisition of a competitor, enabling the company to better compete with some of the largest pharmacy benefit managers in the world. Athenahealth outperformed as physicians and hospitals continue to demand the company’s business management software solutions.
Regarding the second quarter specifically, the Fund’s underperformance was attributable to stock selection. While style tailwinds existed, one stock, Tempur-Pedic, was a significant contributor to underperformance. Tempur-Pedic and Green Mountain Coffee Roasters, Inc. were the two leading detractors from return during the second quarter, for the same reasons
June 30, 2012 | William Blair Funds 23 |
discussed above in the year-to-date comments. Conversely, Catamaran (formerly SXC Health Solutions) benefitted relative performance during the quarter. Stericycle was another positive standout during the quarter as investors flocked to its more economically-insulated business model.
While the recovery works to regain traction, there are a few positive developments to highlight: the stubborn housing market finally seems to be reversing course, with encouraging data on home prices and sales trends. Gas prices have declined from their April highs, although savings at the pump have yet to translate into higher confidence among consumers. Improving loan demand and banks’ willingness to lend are displaying some encouraging trends as well. Regarding the stock market specifically, while fundamentals are at a critical juncture given the current pause in business confidence, valuations appear attractive if estimated earnings growth materializes.
Today’s unresolved issues make for a cloudy outlook as the world waits to see how the next chapter of the euro zone will read. Much attention will be focused on U.S. politics leading up to the November elections, the potential “fiscal cliff” (i.e., expiration of the Bush-era tax cuts, coupled with mandatory federal spending cuts), and the overall pace of economic growth. While this quarter’s market pullback resembles the past two years’ mid-year slumps, the global easing cycle along with a strengthening housing market could serve as tailwinds unique to 2012.
In the end, while we factor various economic scenarios into our stock picking, we focus our time on constructing the Fund from a bottom-up perspective. We continue to find good ideas across sectors, and are confident the Fund consists of well-managed companies with solid competitive positions whose stocks are at attractive valuations compared to the expected growth and consistency of their business.
24 Semi-Annual Report | June 30, 2012 |
Small-Mid Cap Growth Fund
Performance Highlights (Unaudited)
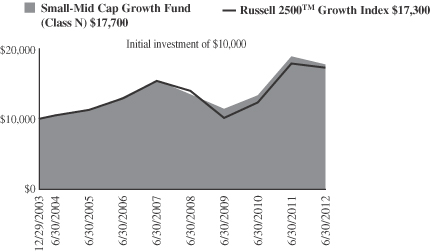
Average Annual Total Return at 6/30/2012
| | | | | | | | | | | | | | | | | | | | |
| | | Year
To Date | | | 1
Year | | | 3
Year | | | 5
Year | | | Since
Inception(a) | |
Class N | | | 5.00 | % | | | (6.10 | )% | | | 15.72 | % | | | 2.69 | % | | | 6.95 | % |
Class I | | | 5.11 | | | | (5.91 | ) | | | 16.02 | | | | 2.95 | | | | 7.22 | |
Russell 2500™ Growth Index | | | 8.44 | | | | (3.19 | ) | | | 19.38 | | | | 2.35 | | | | 6.65 | |
| | (a) | | For the period from December 29, 2003 (Commencement of Operations) to June 30, 2012. | |
Performance cited represents past performance. Past performance does not guarantee future results and current performance may be lower or higher than the data quoted. Results shown are average annual total returns, which assume reinvestment of dividends and capital gains. Investment returns and principal will fluctuate and you may have a gain or loss when you sell shares. For the most current month-end performance information, please call 1-800-742-7272, or visit our Web site at www.williamblairfunds.com. Investing in smaller and medium capitalization companies involves special risks, including higher volatility and lower liquidity. Smaller and medium capitalization stocks are also more sensitive to purchase/sale transactions and changes in the issuer’s financial condition. From time to time, the investment advisor may waive fees or reimburse expenses for the Fund. Without these waivers, performance would be lower. Class N shares are available to the general public without a sales load. Class I shares are available to certain institutional investors and advisory clients of William Blair & Company, L.L.C., without a sales load or distribution (12b-1) or service fees.
The performance highlights and graph presented above do not reflect the deduction of taxes that a shareholder would pay on fund distributions or the redemption of fund shares.
The Russell 2500™ Growth Index measures the performance of those Russell 2500 companies with above average price-to-book ratios and forecasted growth rates.
This report identifies the Fund’s investments on June 30, 2012. These holdings are subject to change. Not all stocks in the Fund performed the same, nor is there any guarantee that these stocks will perform as well in the future. Market forecasts provided in this report may not necessarily come to pass.
Sector Diversification (Unaudited)
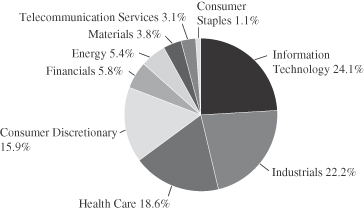
The sector diversification shown is based on the total long-term securities.
June 30, 2012 | William Blair Funds 25 |
Small-Mid Cap Growth Fund
Portfolio of Investments, June 30, 2012 (all dollar amounts in thousands) (unaudited)
| | | | | | | | |
Issuer | | Shares | | | Value | |
| | |
Common Stocks | | | | | | | | |
Information Technology—23.1% | | | | | | | | |
*ANSYS, Inc. | | | 85,100 | | | $ | 5,371 | |
*Aruba Networks, Inc. | | | 308,300 | | | | 4,640 | |
Booz Allen Hamilton Holding Corporation | | | 185,218 | | | | 2,830 | |
*Cavium, Inc. | | | 156,973 | | | | 4,395 | |
*Concur Technologies, Inc. | | | 69,500 | | | | 4,733 | |
*Constant Contact, Inc. | | | 199,500 | | | | 3,567 | |
*CoStar Group, Inc. | | | 71,800 | | | | 5,830 | |
*Genpact, Ltd.† | | | 331,100 | | | | 5,506 | |
*Guidewire Software, Inc. | | | 110,100 | | | | 3,096 | |
*Informatica Corporation | | | 114,200 | | | | 4,838 | |
*MICROS Systems, Inc. | | | 71,363 | | | | 3,654 | |
NIC, Inc. | | | 184,370 | | | | 2,342 | |
*RealPage, Inc. | | | 237,000 | | | | 5,489 | |
*Riverbed Technology, Inc. | | | 168,200 | | | | 2,716 | |
*SolarWinds, Inc. | | | 101,300 | | | | 4,413 | |
*Trimble Navigation, Ltd. | | | 63,700 | | | | 2,931 | |
*Ultimate Software Group, Inc. | | | 58,825 | | | | 5,242 | |
*Wright Express Corp. | | | 101,800 | | | | 6,283 | |
| | | | | | | | |
| | | | | | | 77,876 | |
| | | | | | | | |
Industrials—21.2% | | | | | | | | |
*Allegiant Travel Co. | | | 49,065 | | | | 3,419 | |
*BE Aerospace, Inc. | | | 104,553 | | | | 4,565 | |
*Fortune Brands Home & Security, Inc. | | | 292,800 | | | | 6,521 | |
Healthcare Services Group, Inc. | | | 248,700 | | | | 4,820 | |
*Huron Consulting Group, Inc. | | | 116,290 | | | | 3,680 | |
*ICF International, Inc. | | | 189,838 | | | | 4,526 | |
Manpower, Inc. | | | 83,750 | | | | 3,069 | |
*Portfolio Recovery Associates, Inc. | | | 15,642 | | | | 1,427 | |
Robert Half International, Inc. | | | 251,300 | | | | 7,180 | |
Roper Industries, Inc. | | | 54,000 | | | | 5,323 | |
*Standard Parking Corporation | | | 123,973 | | | | 2,668 | |
*Stericycle, Inc. | | | 114,670 | | | | 10,512 | |
The Corporate Executive Board Co. | | | 93,635 | | | | 3,828 | |
*TransDigm Group, Inc. | | | 42,108 | | | | 5,655 | |
*Trimas Corporation | | | 215,748 | | | | 4,336 | |
| | | | | | | | |
| | | | | | | 71,529 | |
| | | | | | | | |
Health Care—17.8% | | | | | | | | |
*ABIOMED, Inc. | | | 182,338 | | | | 4,161 | |
*athenahealth, Inc. | | | 48,271 | | | | 3,822 | |
*BioMarin Pharmaceutical, Inc. | | | 109,900 | | | | 4,350 | |
*Brookdale Senior Living, Inc. | | | 155,976 | | | | 2,767 | |
*Cerner Corporation | | | 19,636 | | | | 1,623 | |
*HealthSouth Corporation | | | 261,100 | | | | 6,073 | |
*HMS Holdings Corporation | | | 141,792 | | | | 4,723 | |
*Hologic, Inc. | | | 394,800 | | | | 7,122 | |
*IDEXX Laboratories, Inc. | | | 69,305 | | | | 6,662 | |
Perrigo Co. | | | 72,800 | | | | 8,585 | |
*Sirona Dental Systems, Inc. | | | 119,083 | | | | 5,360 | |
*SXC Health Solutions Corporation† | | | 47,616 | | | | 4,724 | |
| | | | | | | | |
| | | | | | | 59,972 | |
| | | | | | | | |
Consumer Discretionary—15.2% | | | | | | | | |
Dick’s Sporting Goods, Inc. | | | 189,590 | | | | 9,100 | |
*Fossil, Inc. | | | 53,300 | | | | 4,079 | |
Gentex Corporation | | | 147,800 | | | | 3,085 | |
* Non-income producing securities
† = U.S. listed foreign security
| | | | | | | | |
Issuer | | Shares or
Principal
Amount | | | Value | |
| | |
Common Stocks—(continued) | | | | | | | | |
Consumer Discretionary—(continued) | | | | | | | | |
*K12, Inc. | | | 241,814 | | | $ | 5,634 | |
*LKQ Corporation | | | 123,500 | | | | 4,125 | |
Polaris Industries, Inc. | | | 56,500 | | | | 4,039 | |
*Sally Beauty Holdings, Inc. | | | 138,800 | | | | 3,573 | |
Strayer Education, Inc. | | | 59,100 | | | | 6,443 | |
Texas Roadhouse, Inc. | | | 162,943 | | | | 3,003 | |
Tractor Supply Co. | | | 45,800 | | | | 3,804 | |
*Under Armour, Inc. | | | 47,660 | | | | 4,503 | |
| | | | | | | | |
| | | | | | | 51,388 | |
| | | | | | | | |
Financials—5.6% | | | | | | | | |
*Affiliated Managers Group, Inc. | | | 57,109 | | | | 6,251 | |
*First Republic Bank | | | 124,200 | | | | 4,173 | |
*FirstService Corporation† | | | 129,837 | | | | 3,632 | |
Invesco, Ltd.† | | | 12,091 | | | | 273 | |
Jones Lang LaSalle, Inc. | | | 62,600 | | | | 4,405 | |
| | | | | | | | |
| | | | | | | 18,734 | |
| | | | | | | | |
Energy—5.1% | | | | | | | | |
Cabot Oil & Gas Corporation | | | 68,800 | | | | 2,711 | |
Core Laboratories N.V.† | | | 30,600 | | | | 3,546 | |
Helmerich & Payne, Inc. | | | 69,300 | | | | 3,013 | |
*KiOR, Inc. | | | 211,499 | | | | 1,893 | |
Oceaneering International, Inc. | | | 64,200 | | | | 3,073 | |
*Oil States International, Inc. | | | 47,100 | | | | 3,118 | |
| | | | | | | | |
| | | | | | | 17,354 | |
| | | | | | | | |
Materials—3.6% | | | | | | | | |
Airgas, Inc. | | | 70,062 | | | | 5,886 | |
Celanese Corporation | | | 93,300 | | | | 3,230 | |
Rockwood Holdings, Inc. | | | 69,100 | | | | 3,065 | |
| | | | | | | | |
| | | | | | | 12,181 | |
| | | | | | | | |
Telecommunication Services—2.9% | | | | | | | | |
*SBA Communications Corporation Class “A” | | | 173,600 | | | | 9,904 | |
| | | | | | | | |
Consumer Staples—1.0% | | | | | | | | |
*Green Mountain Coffee Roasters, Inc. | | | 157,623 | | | | 3,433 | |
| | | | | | | | |
Total Common Stocks—95.5%
(cost $301,990) | | | | 322,371 | |
| | | | | | | | |
| | |
Repurchase Agreement | | | | | | | | |
Fixed Income Clearing Corporation, 0.100% dated 6/29/12, due 7/2/12, repurchase price $13,237, collateralized by FNMA, 5.000%,
due 4/15/15 | | $ | 13,237 | | | | 13,237 | |
| | | | | | | | |
Total Repurchase Agreement—3.9%
(cost $13,237) | | | | 13,237 | |
| | | | | | | | |
Total Investments—99.4%
(cost $315,227) | | | | 335,608 | |
Cash and other assets, less liabilities—0.6% | | | | 2,187 | |
| | | | | | | | |
Net assets—100.0% | | | $ | 337,795 | |
| | | | | | | | |
See accompanying Notes to Portfolio of Investments.
26 Semi-Annual Report | June 30, 2012 |
GLOBAL MARKETS OVERVIEW
The global growth scare that began in March continued through the second quarter, leading equity markets into negative territory. In addition, increased concerns about the viability of the Eurozone and remedies for significant bank and sovereign debt, a volatile Greek election cycle, and doubts about the wherewithal and will of European governments to forge tighter fiscal and monetary integration, weighed on the equity markets. Following a significant decline in March through May, the markets rebounded in June on expectations of a broad agreement on the European Stability Mechanism (ESM) lending directly to banks without seniority, more discussions of a pan-European regulator and deposit insurance, and the prospects for growth-oriented measures through the EIB (European Investment Bank). Despite the nearly 5% rally in June, the MSCI ACWI IMI fell 5.68% during the second quarter, paring year to date gains to 5.76%. High quality companies outperformed during the second quarter, as did those with strong earnings trends, price momentum, and good growth prospects. Year to date companies with lower valuations performed well, due to a rally in these companies during the beginning of the year, along with those exhibiting higher quality and growth characteristics.
Most sectors retreated during the second quarter with the Resources sectors—Materials and Energy—leading the decline, falling 11.16% and 9.58%, respectively, on expectations of slower emerging markets infrastructure spending and resources demand, coupled with recessionary pressures in Europe. Telecom Services and Healthcare each had positive returns, rising 2.55% and 1.32%, respectively, while Utilities and Staples were each slightly negative. Despite negative second quarter results, most sectors remained in solid positive territory year to date, with Information Technology (IT), Health Care, and Discretionary up 9.91%, 9.88% and 9.67%, respectively, while Energy and Materials underperformed, falling 4.85% and 1.65%, respectively.
The MSCI World Index IMI fell 5.23% during the second quarter, resulting in a year to date return of 5.98%. The U.S. Dollar was strong relative to most other currencies during the period, as the U.S. was viewed as a relative safe haven. The U.S. led developed market regions during the quarter, falling 3.33%, per the MSCI developed markets national (IMI) indices. Europe Ex-U.K. was the worst performing developed region, falling 9.49%, as Greece and Portugal fell over 20% and 17%, respectively, and as core European markets also lagged. The natural-resource oriented Canadian market fell 8.48% during the period. Year to date, the U.S. rose 9.01%, significantly outpacing other developed market regions, although all regions except Canada had positive returns. While Europe Ex-U.K. rose 2.14% during the first half of the year, this result masked significantly different results by country, as Greece, Portugal and Spain all fell between 12-16%, while countries such as Denmark and Belgium were each up approximately the same amount. While the MSCI World Index Small Cap fell 6.31% during the second quarter, underperforming their larger cap counterparts across most regions, with the exception of Japan, they outpaced large cap stocks year to date, rising 6.34%, led by the UK and the US.
After outpacing developed markets during the first quarter, the MSCI Emerging Markets IMI lagged during the second, falling 8.79%, reducing year to date returns to 4.31%. Latin America fell over 13%, dragged down by Brazil, which fell 18.64%, on concerns about slowing growth amidst lower resource oriented demand, and a weakening Real. Conversely, Mexico performed relatively well, falling just over 1%. Emerging Europe, Mid-East, and Africa (EMEA) fell 8.14% during the second quarter, as Russia (14.67%) led the decline both on resource demand concerns and amidst USD appreciation, which more than offset the 0.71% Turkey return. Asia fell 7.43%, as weaker results in India and Taiwan were partially offset by a positive 4.71% Philippines return, and -5-6% returns for China and Thailand. Year to date all emerging markets regions posted positive results, with EMEA rising 6.81%, as Egypt rose nearly 34% despite ongoing political unrest and as Turkey rose over 29%. Emerging Asia was up just over 5%, as the Philippines and Thailand posted double digit returns and as India outperformed during the first quarter. Latin America eked out a slightly positive return, despite the -6.93% Brazilian market return, given strong market performance in Chile, Mexico and Peru.
June 30, 2012 | William Blair Funds 27 |
As doubts about sovereign debt and banking solvency were alleviated in the first quarter, markets rallied. But apprehension quickly reasserted itself in the second quarter, with weakening growth replacing balance sheet woes as the focus of concern. Austerity and falling business confidence in Europe, combined with an industrial slowdown in China that seemed to spread out to the rest of the emerging world, lowered expectations for global growth and eroded belief in the effectiveness of policy.
The Eurozone is almost certainly in recession already, with the latest industrial production reading down by more than 2%. Weakness in the Euro periphery was already beginning to take a toll on growth in the core, and the more recent slowdown in emerging economies has only added to the problem. Deleveraging in the banking system and the overhang of prolonged uncertainty in the debt markets have exacerbated the problem, and ongoing weakness in Europe and China has become somewhat synergistic as trade flow growth decelerates.
In China, the landing is fairly soft at the reported real GDP level, but more pronounced in specific areas of output. Primary, extractive, and heavy industry generally are bearing the brunt of the economy’s slowdown. The pace of growth in new industrial capacity and infrastructure investment has slowed, and with it the demand for basic materials and commodities. In turn, softer commodity markets are impacting growth in areas that had been profiting from the resource boom, while India, Brazil, and Russia are all being restrained, ironically, by infrastructure shortfalls.
The picture that emerges is one of ‘Japanization’ in debt-burdened developed markets combined with a downshift and awkward growth transition in developing economies. Even if the narrative gets exaggerated in a downturn, there’s still a core of plausibility to the contention that the growth potential of the global economy may be subdued in the next several years.
In these circumstances, challenges to corporate performance multiply. The customer base—whether household, business or public sector—is squeezed, suppliers are under pressure, and the cost/quality/service equation is harder to solve than ever. It’s not a 2008-style collapse, but it looks like a competitive environment with fewer winners and more also-rans. We are finding increasing evidence of this phenomenon in instances of sharply differentiated growth and/or profitability between peer group companies previously considered to be fairly comparable in performance. Our strategy in the most basic sense is to invest in that differentiation—to select more rigorously for organic value creation at the company level.
28 Semi-Annual Report | June 30, 2012 |

W. George Greig

Kenneth J. McAtamney
GLOBAL GROWTH FUND
The Global Growth Fund seeks long-term capital appreciation.
AN OVERVIEW FROM THE PORTFOLIO MANAGERS
The Global Growth Fund posted a 8.64% increase (Class N Shares) for the six months ended June 30, 2012. By comparison, the Fund’s benchmark, the MSCI All Country World IMI (net) index increased 5.76%.
Year-to-date, performance was strong amidst market turbulence. Exposure to high quality companies with sound growth prospects was additive to results. Stock selection was strong during the period, particularly in Staples and Healthcare as well as in the United States and Europe—the Fund’s two largest regional weightings.
Sector positioning did not change appreciably during the six month period, as changes resulted from company-specific characteristics or valuation concerns. The Fund maintained its focus in Consumer with approximately 29.0% invested in these sectors, well above the 21.2% Index weighting, due largely to significant U.S. Discretionary and Staples weightings. Resources remained significantly underweighted during the six month period on concerns about infrastructure spending and the resulting impact on commodity demand, while Industrials and Information Technology (IT) increased at the margin and were overweighed versus the market. Regionally, the Fund maintained its significant weighting in the U.K., given the large opportunity set for leading companies, while Developed Asia was de-emphasized. The U.S. increased from 43.1% as of year end to 45.3% as of June 30. Emerging markets approximated the Index at 14.1% of the Fund.
June 30, 2012 | William Blair Funds 29 |
Global Growth Fund
Performance Highlights (Unaudited)
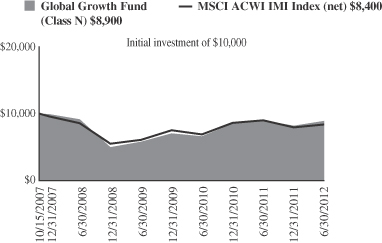
Average Annual Total Return at 6/30/2012
| | | | | | | | | | | | | | | | |
| | | Year
To Date | | | 1
Year | | | 3
Year | | | Since
Inception(a) | |
Class N | | | 8.64 | % | | | (1.24 | )% | | | 15.15 | % | | | (2.52 | )% |
Class I | | | 8.78 | | | | (1.01 | ) | | | 15.43 | | | | (2.26 | ) |
MSCI All Country World IMI Index (net) | | | 5.76 | | | | (6.91 | ) | | | 11.30 | | | | (3.70 | ) |
| | (a) | | For the period from October 15, 2007 (Commencement of Operations) to June 30, 2012. |
Performance cited represents past performance. Past performance does not guarantee future results and current performance may be lower or higher than the data quoted. Results shown are average annual total returns, which assume reinvestment of dividends and capital gains. Investment returns and principal will fluctuate and you may have a gain or loss when you sell shares. For the most current month-end performance information, please call 1-800-742-7272, or visit our Web site at www.williamblairfunds.com. Investing in smaller and medium capitalization companies involves special risks, including higher volatility and lower liquidity. Smaller and medium capitalization stocks are also more sensitive to purchase/sale transactions and changes in the issuer’s financial condition. International investing involves special risk considerations, including currency fluctuations, lower liquidity, economic and political risk. From time to time, the investment advisor may waive fees or reimburse expenses for the Fund. Without these waivers, performance would be lower. Class N shares are available to the general public without a sales load. Class I shares are available to certain institutional investors and advisory clients of William Blair & Company, L.L.C., without a sales load or distribution fees (12b-1).
The performance highlights and graph presented above do not reflect the deduction of taxes that a shareholder would pay on fund distributions or the redemption of fund shares.
The Morgan Stanley Capital International (MSCI) All Country World Investable Market Index (IMI) (net) is a free float-adjusted market capitalization weighted index that is designed to measure the equity market of developed and emerging markets. This series approximates the minimum possible dividend reinvestment.
This report identifies the Fund’s investments on June 30, 2012. These holdings are subject to change. Not all stocks in the Fund performed the same, nor is there any guarantee that these stocks will perform as well in the future. Market forecasts provided in this report may not necessarily come to pass.
Sector Diversification (Unaudited)
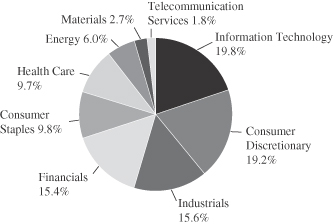
The sector diversification shown is based on the total long-term securities.
30 Semi-Annual Report | June 30, 2012 |
Global Growth Fund
Portfolio of Investments, June 30, 2012 (all dollar amounts in thousands) (unaudited)
| | | | | | | | |
Issuer | | Shares | | | Value | |
| | |
Common Stocks | | | | | | | | |
| | |
Western Hemisphere—47.9% | | | | | | | | |
Canada—2.6% | | | | | | | | |
Brookfield Asset Management, Inc. Class “A”
(Real estate management & development)† | | | 18,941 | | | $ | 627 | |
The Toronto-Dominion Bank (Commercial banks) | | | 7,595 | | | | 594 | |
| | | | | | | | |
| | | | | | | 1,221 | |
| | | | | | | | |
United States—45.3% | | | | | | | | |
*Affiliated Managers Group, Inc. (Capital markets) | | | 4,813 | | | | 527 | |
*Align Technology, Inc. (Health care equipment & supplies) | | | 8,880 | | | | 297 | |
American Express Co. (Consumer finance) | | | 15,489 | | | | 902 | |
AMETEK, Inc. (Electrical equipment) | | | 10,549 | | | | 526 | |
*Apple, Inc. (Computers & peripherals) | | | 2,506 | | | | 1,463 | |
Church & Dwight Co., Inc. (Household products) | | | 5,152 | | | | 286 | |
*Citrix Systems, Inc. (Software) | | | 7,457 | | | | 626 | |
*Clean Harbors, Inc. (Commercial services & supplies) | | | 3,104 | | | | 175 | |
Colgate-Palmolive Co. (Household products) | | | 7,859 | | | | 818 | |
Costco Wholesale Corporation (Food & staples retailing) | | | 7,598 | | | | 722 | |
*Discovery Communications, Inc. Class “A” (Media) | | | 12,626 | | | | 682 | |
*Express Scripts Holding Co. (Health care providers & services) | | | 14,684 | | | | 820 | |
Exxon Mobil Corporation (Oil, gas & consumable fuels) | | | 10,691 | | | | 915 | |
*Fortune Brands Home & Security, Inc. (Building products) | | | 10,349 | | | | 230 | |
Harley-Davidson, Inc. (Automobiles) | | | 9,929 | | | | 454 | |
*IDEXX Laboratories, Inc. (Health care equipment & supplies) | | | 5,655 | | | | 544 | |
International Business Machines Corporation (IT services) | | | 4,848 | | | | 948 | |
JPMorgan Chase & Co. (Diversified financial services) | | | 15,759 | | | | 563 | |
Mastercard, Inc. Class “A” (IT services) | | | 1,881 | | | | 809 | |
McCormick & Co., Inc. (Food products) | | | 9,337 | | | | 566 | |
*Monster Beverage Corporation (Beverages) | | | 6,020 | | | | 429 | |
NIKE, Inc. Class “B” (Textiles, apparel & luxury goods) | | | 6,493 | | | | 570 | |
*O’Reilly Automotive, Inc. (Specialty retail) | | | 6,958 | | | | 583 | |
*priceline.com, Inc. (Internet & catalog retail) | | | 1,196 | | | | 795 | |
QUALCOMM, Inc. (Communications equipment) | | | 13,621 | | | | 758 | |
*SolarWinds, Inc. (Software) | | | 7,871 | | | | 343 | |
Starbucks Corporation (Hotels, restaurants & leisure) | | | 8,695 | | | | 464 | |
The Walt Disney Co. (Media) | | | 13,502 | | | | 655 | |
Thermo Fisher Scientific, Inc. (Life sciences tools & services) | | | 10,847 | | | | 563 | |
Union Pacific Corporation (Road & rail) | | | 5,606 | | | | 669 | |
United Parcel Service, Inc. Class “B” (Air freight & logistics) | | | 8,770 | | | | 691 | |
W.W. Grainger, Inc. (Trading companies & distributors) | | | 1,927 | | | | 368 | |
Williams-Sonoma, Inc. (Specialty retail) | | | 12,811 | | | | 448 | |
| | | | | | | | |
Issuer | | Shares | | | Value | |
|
Common Stocks—Western Hemisphere—47.9%—(continued) | |
United States—(continued) | | | | | | | | |
Yum! Brands, Inc. (Hotels, restaurants & leisure) | | | 12,008 | | | $ | 773 | |
| | | | | | | | |
| | | | | | | 20,982 | |
| | | | | | | | |
| | |
United Kingdom—17.3% | | | | | | | | |
Abcam plc (Biotechnology) | | | 34,383 | | | | 225 | |
ARM Holdings plc (Semiconductors & semiconductor equipment) | | | 58,231 | | | | 461 | |
Ashmore Group plc (Capital markets) | | | 65,216 | | | | 356 | |
Babcock International Group plc (Commercial services & supplies) | | | 26,458 | | | | 354 | |
BG Group plc (Oil, gas & consumable fuels) | | | 31,350 | | | | 638 | |
BHP Billiton plc (Metals & mining) | | | 16,302 | | | | 461 | |
Burberry Group plc (Textiles, apparel & luxury goods) | | | 10,688 | | | | 222 | |
Compass Group plc (Hotels, restaurants & leisure) | | | 74,839 | | | | 784 | |
Diageo plc (Beverages) | | | 34,849 | | | | 896 | |
Experian plc (Professional services) | | | 54,765 | | | | 772 | |
Hargreaves Lansdown plc (Capital markets) | | | 27,548 | | | | 229 | |
Lancashire Holdings, Ltd. (Insurance) | | | 14,211 | | | | 177 | |
Pearson plc (Media) | | | 31,251 | | | | 620 | |
Petrofac, Ltd. (Energy equipment & services) | | | 11,687 | | | | 254 | |
*Rolls-Royce Holdings plc (Aerospace & defense) | | | 51,738 | | | | 695 | |
Standard Chartered plc (Commercial banks) | | | 24,767 | | | | 537 | |
The Weir Group plc (Machinery) | | | 14,120 | | | | 338 | |
| | | | | | | | |
| | | | | | | 8,019 | |
| | | | | | | | |
| | |
Europe, Mid-East—16.6% | | | | | | | | |
Denmark—3.1% | | | | | | | | |
CHR Hansen Holding A/S (Chemicals) | | | 8,244 | | | | 211 | |
Coloplast A/S Class “B” (Health care equipment & supplies) | | | 1,577 | | | | 283 | |
Novo Nordisk A/S (Pharmaceuticals) | | | 6,450 | | | | 932 | |
| | | | | | | | |
| | | | | | | 1,426 | |
| | | | | | | | |
France—2.0% | | | | | | | | |
Essilor International S.A. (Health care equipment & supplies) | | | 3,967 | | | | 368 | |
Technip S.A. (Energy equipment & services) | | | 5,420 | | | | 562 | |
| | | | | | | | |
| | | | | | | 930 | |
| | | | | | | | |
Germany—4.7% | | | | | | | | |
Bayerische Motoren Werke AG (Automobiles) | | | 9,604 | | | | 692 | |
Brenntag AG (Trading companies & distributors) | | | 4,143 | | | | 457 | |
MTU Aero Engines Holding AG (Aerospace & defense) | | | 3,207 | | | | 235 | |
SAP AG (Software) | | | 13,356 | | | | 787 | |
| | | | | | | | |
| | | | | | | 2,171 | |
| | | | | | | | |
Israel—0.9% | | | | | | | | |
*Check Point Software Technologies, Ltd. (Software)† | | | 8,740 | | | | 434 | |
| | | | | | | | |
See accompanying Notes to Portfolio of Investments.
June 30, 2012 | William Blair Funds 31 |
Global Growth Fund
Portfolio of Investments, June 30, 2012 (all dollar amounts in thousands) (unaudited)
| | | | | | | | |
Issuer | | Shares | | | Value | |
|
Common Stocks—Europe, Mid-East—16.6%—(continued) | |
Italy—0.4% | | | | | | | | |
Tod’s SpA (Textiles, apparel & luxury goods) | | | 1,860 | | | $ | 186 | |
| | | | | | | | |
Sweden—1.4% | | | | | | | | |
Atlas Copco AB Class “A” (Machinery) | | | 30,081 | | | | 645 | |
| | | | | | | | |
Switzerland—4.1% | | | | | | | | |
Nestle S.A. (Food products) | | | 13,288 | | | | 792 | |
Partners Group Holding AG (Capital markets) | | | 3,019 | | | | 536 | |
Syngenta AG (Chemicals) | | | 1,642 | | | | 559 | |
| | | | | | | | |
| | | | | | | 1,887 | |
| | | | | | | | |
| | |
Emerging Asia—9.9% | | | | | | | | |
China—4.5% | | | | | | | | |
*Baidu, Inc.—ADR (Internet software & services) | | | 7,670 | | | | 882 | |
Industrial and Commercial Bank of China, Ltd. Class “H” (Commercial banks) | | | 1,411,185 | | | | 780 | |
*WuXi PharmaTech Cayman, Inc.—ADR (Life sciences tools & services) | | | 29,674 | | | | 419 | |
| | | | | | | | |
| | | | | | | 2,081 | |
| | | | | | | | |
Indonesia—1.1% | | | | | | | | |
PT Bank Rakyat Indonesia (Commercial banks) | | | 746,000 | | | | 505 | |
| | | | | | | | |
South Korea—4.3% | | | | | | | | |
Hyundai Motor Co. (Automobiles) | | | 4,511 | | | | 916 | |
Samsung Electronics Co., Ltd. (Semiconductors & semiconductor equipment) | | | 1,057 | | | | 1,108 | |
| | | | | | | | |
| | | | | | | 2,024 | |
| | | | | | | | |
Japan—3.5% | | | | | | | | |
Fanuc Corporation (Machinery) | | | 3,200 | | | | 519 | |
*Nexon Co., Ltd. (Software) | | | 12,500 | | | | 242 | |
Softbank Corporation (Wireless telecommunication services) | | | 22,900 | | | | 846 | |
| | | | | | | | |
| | | | | | | 1,607 | |
| | | | | | | | |
| | |
Emerging Latin America—2.1% | | | | | | | | |
Argentina—0.5% | | | | | | | | |
MercadoLibre, Inc. (Internet software & services) | | | 3,055 | | | | 232 | |
| | | | | | | | |
Brazil—1.1% | | | | | | | | |
BR Malls Participacoes S.A. (Real estate management & development) | | | 43,400 | | | | 497 | |
| | | | | | | | |
Chile—0.5% | | | | | | | | |
Banco Santander Chile—ADR (Commercial banks) | | | 3,285 | | | | 254 | |
| | | | | | | | |
|
Emerging Europe, Mid-East, Africa—1.9% | |
South Africa—1.9% | | | | | | | | |
Bidvest Group, Ltd. (Industrial conglomerates) | | | 23,138 | | | | 515 | |
Sasol, Ltd. (Oil, gas & consumable fuels) | | | 9,154 | | | | 384 | |
| | | | | | | | |
| | | | | | | 899 | |
| | | | | | | | |
Total Common Stocks—99.2%
(cost $39,275) | | | | 46,000 | |
| | | | | | | | |
Issuer | | Principal
Amount | | | Value | |
| | |
Repurchase Agreement | | | | | | | | |
Fixed Income Clearing Corporation, 0.100% dated 6/29/12, due 7/2/12, repurchase price $683, collateralized by U.S. Treasury Note, 5.000%, due 4/15/15 | | $ | 683 | | | $ | 683 | |
| | | | | | | | |
Total Repurchase Agreement—1.5%
(cost $683) | | | | 683 | |
| | | | | | | | |
Total Investments—100.7%
(cost $39,958) | | | | 46,683 | |
Liabilities, plus cash and other assets—(0.7)% | | | | (310 | ) |
| | | | | | | | |
Net assets—100.0% | | | $ | 46,373 | |
| | | | | | | | |
ADR = American Depository Receipt
† = U.S. listed foreign security
* Non-income producing securities
For securities primarily traded on exchanges or markets that close before the close of regular trading on the New York Stock Exchange, the Fund may use an independent pricing service to fair value price the securities pursuant to Valuation Procedures approved by the Board of Trustees.
At June 30, 2012, the Fund’s Portfolio of Investments includes the following industry categories:
| | | | |
Information Technology | | | 19.8% | |
Consumer Discretionary | | | 19.2% | |
Industrials | | | 15.6% | |
Financials | | | 15.4% | |
Consumer Staples | | | 9.8% | |
Health Care | | | 9.7% | |
Energy | | | 6.0% | |
Materials | | | 2.7% | |
Telecommunication Services | | | 1.8% | |
| | | | |
Total | | | 100.0% | |
| | | | |
At June 30, 2012, the Fund’s Portfolio of Investments includes the following currency categories:
| | | | |
U.S. Dollar | | | 50.9% | |
British Pound Sterling | | | 17.4% | |
Euro | | | 7.1% | |
South Korean Won | | | 4.4% | |
Swiss Franc | | | 4.1% | |
Japanese Yen | | | 3.5% | |
Danish Krone | | | 3.1% | |
Hong Kong Dollar | | | 2.6% | |
South African Rand | | | 2.0% | |
Swedish Krona | | | 1.4% | |
Canadian Dollar | | | 1.3% | |
Indonesian Rupiah | | | 1.1% | |
Brazilian Real | | | 1.1% | |
| | | | |
Total | | | 100.0% | |
| | | | |
See accompanying Notes to Portfolio of Investments.
32 Semi-Annual Report | June 30, 2012 |
W. George Greig
INTERNATIONAL GROWTH FUND
The International Growth Fund seeks long-term capital appreciation.
AN OVERVIEW FROM THE PORTFOLIO MANAGER
The International Growth Fund posted a 7.66% increase (Class N Shares) for the six months ended June 30, 2012. By comparison, the Fund’s benchmark, the MSCI All Country World Ex-U.S. IMI Index (net), increased 2.93%.
Performance was due to strong stock selection across sectors, coupled with a focus on high quality companies with good earnings and price trends. In addition, industry and country weightings also contributed to results. Stock selection was particularly strong in Consumer, Financials and Industrials. In particular, Media performance was strong within Discretionary, along with Luxury and Retail, while the Food/Staples weighting and stock selection augmented Staples results as did strong performance by Diageo, the global spirits company. Commercial Banks stock selection was strong, given the sale in Barclays in early February following its strong rally, along with Japanese and emerging markets performance. The Fund’s focus on core Europe at the expense of peripheral countries, overweighting in the strongly performing UK market, and underweighting in natural resource-oriented economies enhanced performance. Somewhat detracting from year to date results was the Fund’s underweighting in Utilities, along with Japanese stock selection, due to underperformance by internet-related holdings.
During the six month period we increased Discretionary from approximately 14% to 18%, due to higher Autos and Media exposure, which more than offset a decline in Auto Components. As a result, at quarter end, the portfolio was 7.6% overweighted in Discretionary. Staples, Healthcare, and Industrials also increased during the period. These increases were funded by a decrease in Financials from 22.5% to 22.1%, remaining below the 23.5% Index weighting, due to a reduction and underweighting in European Capital Markets and Commercial Banks in early February, following their strong performance run to start 2012. We also decreased the Resources sectors primarily in Energy E&P (Exploration and Production) companies as well as Metals/Mining on a slower growth outlook. Both were underweighted versus the Index at June 30, with Materials representing under 5% of the portfolio, well below the 11.2% Index weighting due to the lower Metals/Mining exposure. Regionally, we increased emerging markets from approximately 21% as of year-end to 24.7%, above the 23.8% Index weighting, on an improving growth outlook at the beginning of the year, bolstered by lower inflationary pressure and valuation support. This increase was funded by a reduction in the UK from 24.1% to 19.3%, although it remained well above the 14.0% Index weighting. Developed Asia remained significantly underweighted versus the Index at a combined 14%, well below the 24.9% Index weighting, due to lower exposure across the region.
June 30, 2012 | William Blair Funds 33 |
International Growth Fund
Performance Highlights (Unaudited)
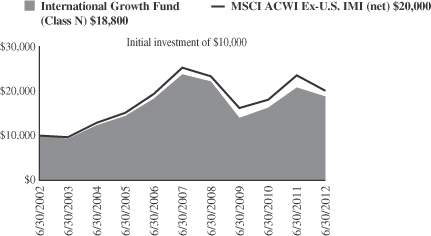
Average Annual Total Return at 6/30/2012
| | | | | | | | | | | | | | | | | | | | |
| | | Year
To Date | | | 1
Year | | | 3
Year | | | 5
Year | | | 10
Year | |
Class N | | | 7.66 | % | | | (9.74 | )% | | | 10.34 | % | | | (4.53 | )% | | | 6.50 | % |
Class I | | | 7.80 | | | | (9.45 | ) | | | 10.66 | | | | (4.24 | ) | | | 6.80 | |
MSCI All Country World Ex-U.S. IMI (net) | | | 2.93 | | | | (14.79 | ) | | | 7.36 | | | | (4.46 | ) | | | 7.19 | |
Performance cited represents past performance. Past performance does not guarantee future results and current performance may be lower or higher than the data quoted. Results shown are average annual total returns, which assume reinvestment of dividends and capital gains. Investment returns and principal will fluctuate and you may have a gain or loss when you sell shares. For the most current month-end performance information, please call 1-800-742-7272, or visit our Web site at www.williamblairfunds.com. From time to time, the investment advisor may waive fees or reimburse expenses for the Fund. Without these waivers, performance would be lower. International investing involves special risk considerations, including currency fluctuations, lower liquidity, economic and political risk. Class N shares are available to the general public without a sales load. Class I shares are available to certain institutional investors and advisory clients of William Blair & Company, L.L.C., without a sales load or distribution (12b-1) or service fees.
The performance highlights and graph presented above do not reflect the deduction of taxes that a shareholder would pay on fund distributions or the redemption of fund shares.
The Morgan Stanley Capital International (MSCI) All Country World Ex-U.S. Investable Market Index (IMI) (net) is a free float-adjusted market capitalization weighted index that is designed to measure the equity market performance of developed and emerging markets, excluding the United States. This series approximates the minimum possible dividend reinvestment.
This report identifies the Fund’s investments on June 30, 2012. These holdings are subject to change. Not all stocks in the Fund performed the same, nor is there any guarantee that these stocks will perform as well in the future. Market forecasts provided in this report may not necessarily come to pass.
Sector Diversification (Unaudited)
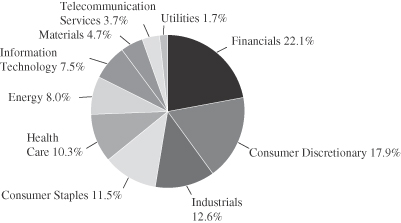
The sector diversification shown is based on the total long-term securities.
34 Semi-Annual Report | June 30, 2012 |
International Growth Fund
Portfolio of Investments, June 30, 2012 (all dollar amounts in thousands) (unaudited)
| | | | | | | | |
Issuer | | Shares | | | Value | |
| | |
Common Stocks | | | | | | | | |
| | |
Europe, Mid-East—33.8% | | | | | | | | |
Austria—0.6% | | | | | | | | |
Andritz AG (Machinery) | | | 377,093 | | | $ | 19,337 | |
| | | | | | | | |
Denmark—1.6% | | | | | | | | |
CHR Hansen Holding A/S (Chemicals) | | | 304,508 | | | | 7,811 | |
Coloplast A/S Class “B” (Health care equipment & supplies) | | | 120,354 | | | | 21,592 | |
SimCorp A/S (Software) | | | 28,353 | | | | 4,870 | |
*William Demant Holding A/S (Health care equipment & supplies) | | | 203,231 | | | | 18,213 | |
| | | | | | | | |
| | | | | | | 52,486 | |
| | | | | | | | |
Finland—1.0% | | | | | | | | |
Kone Oyj (Machinery) | | | 317,525 | | | | 19,139 | |
Nokian Renkaat Oyj (Auto components) | | | 332,026 | | | | 12,547 | |
| | | | | | | | |
| | | | | | | 31,686 | |
| | | | | | | | |
France—8.2% | | | | | | | | |
Arkema S.A. (Chemicals) | | | 239,808 | | | | 15,644 | |
AXA S.A. (Insurance) | | | 4,018,080 | | | | 53,290 | |
BNP Paribas S.A. (Commercial banks) | | | 1,836,474 | | | | 70,500 | |
Christian Dior S.A. (Textiles, apparel & luxury goods) | | | 226,692 | | | | 31,055 | |
Essilor International S.A. (Health care equipment & supplies) | | | 178,871 | | | | 16,592 | |
L’Oreal S.A. (Personal products) | | | 120,036 | | | | 14,012 | |
Sanofi (Pharmaceuticals) | | | 807,466 | | | | 61,045 | |
Zodiac Aerospace (Aerospace & defense) | | | 105,068 | | | | 10,649 | |
| | | | | | | | |
| | | | | | | 272,787 | |
| | | | | | | | |
Germany—4.3% | | | | | | | | |
Bayer AG (Pharmaceuticals) | | | 745,134 | | | | 53,542 | |
Bayerische Motoren Werke AG (Automobiles) | | | 547,992 | | | | 39,480 | |
Brenntag AG (Trading companies & distributors) | | | 88,772 | | | | 9,794 | |
Deutsche Bank AG (Capital markets) | | | 189,729 | | | | 6,843 | |
Gerry Weber International AG (Textiles, apparel & luxury goods) | | | 221,214 | | | | 9,108 | |
Hugo Boss AG (Textiles, apparel & luxury goods) | | | 45,538 | | | | 4,486 | |
MTU Aero Engines Holding AG (Aerospace & defense) | | | 208,691 | | | | 15,302 | |
Pfeiffer Vacuum Technology AG (Machinery) | | | 29,624 | | | | 3,012 | |
| | | | | | | | |
| | | | | | | 141,567 | |
| | | | | | | | |
Ireland—0.7% | | | | | | | | |
Paddy Power plc (Hotels, restaurants & leisure) | | | 155,915 | | | | 10,171 | |
Shire plc (Pharmaceuticals) | | | 464,315 | | | | 13,322 | |
| | | | | | | | |
| | | | | | | 23,493 | |
| | | | | | | | |
Israel—0.3% | | | | | | | | |
*Check Point Software Technologies, Ltd. (Software)† | | | 213,858 | | | | 10,605 | |
| | | | | | | | |
Italy—0.3% | | | | | | | | |
Pirelli & C. SpA (Auto components) | | | 1,032,197 | | | | 10,835 | |
| | | | | | | | |
|
Common Stocks—Europe, Mid-East—33.8%—(continued) | |
Luxembourg—0.6% | | | | | | | | |
Millicom International Cellular S.A. (Wireless telecommunication services) | | | 227,660 | | | $ | 21,425 | |
| | | | | | | | |
Netherlands—4.6% | | | | | | | | |
ASML Holding N.V. (Semiconductors & semiconductor equipment) | | | 612,335 | | | | 31,047 | |
Royal Dutch Shell plc Class “B” (Oil, gas & consumable fuels) | | | 1,701,540 | | | | 59,293 | |
Unilever N.V. (Food products) | | | 1,831,428 | | | | 61,152 | |
| | | | | | | | |
| | | | | | | 151,492 | |
| | | | | | | | |
Norway—2.5% | | | | | | | | |
*Norwegian Air Shuttle ASA (Airlines) | | | 290,057 | | | | 5,266 | |
Schibsted ASA (Media) | | | 249,083 | | | | 8,065 | |
Statoil ASA (Oil, gas & consumable fuels) | | | 1,525,840 | | | | 36,269 | |
Telenor ASA (Diversified telecommunication services) | | | 1,939,419 | | | | 32,244 | |
| | | | | | | | |
| | | | | | | 81,844 | |
| | | | | | | | |
Spain—1.8% | | | | | | | | |
Inditex S.A. (Specialty retail) | | | 499,140 | | | | 51,499 | |
Viscofan S.A. (Food products) | | | 206,986 | | | | 8,888 | |
| | | | | | | | |
| | | | | | | 60,387 | |
| | | | | | | | |
Sweden—2.0% | | | | | | | | |
Atlas Copco AB Class “A” (Machinery) | | | 1,489,989 | | | | 31,965 | |
Axis Communications AB (Communications equipment) | | | 180,144 | | | | 3,906 | |
Getinge AB (Health care equipment & supplies) | | | 1,064,299 | | | | 26,310 | |
JM AB (Household durables) | | | 276,947 | | | | 4,874 | |
NIBE Industrier AB (Building products) | | | 50,113 | | | | 683 | |
| | | | | | | | |
| | | | | | | 67,738 | |
| | | | | | | | |
Switzerland—5.3% | | | | | | | | |
*Geberit AG (Building products) | | | 112,318 | | | | 22,093 | |
Glencore International plc (Metals & mining) | | | 3,858,721 | | | | 17,861 | |
Nestle S.A. (Food products) | | | 1,312,572 | | | | 78,202 | |
*Orascom Development Holding AG (Hotels, restaurants & leisure) | | | 56,650 | | | | 901 | |
Partners Group Holding AG (Capital markets) | | | 83,530 | | | | 14,838 | |
SGS S.A. (Professional services) | | | 7,115 | | | | 13,306 | |
Sika AG (Chemicals) | | | 2,854 | | | | 5,497 | |
Syngenta AG (Chemicals) | | | 72,962 | | | | 24,852 | |
| | | | | | | | |
| | | | | | | 177,550 | |
| | | | | | | | |
| | |
United Kingdom—19.3% | | | | | | | | |
Abcam plc (Biotechnology) | | | 2,015,505 | | | | 13,171 | |
AMEC plc (Energy equipment & services) | | | 1,219,101 | | | | 19,131 | |
Amlin plc (Insurance) | | | 1,976,649 | | | | 10,956 | |
ARM Holdings plc (Semiconductors & semiconductor equipment) | | | 1,350,981 | | | | 10,696 | |
Ashmore Group plc (Capital markets) | | | 2,334,870 | | | | 12,744 | |
Babcock International Group plc (Commercial services & supplies) | | | 1,964,060 | | | | 26,254 | |
Croda International plc (Chemicals) | | | 335,709 | | | | 11,898 | |
Derwent London plc (Real estate investment trusts (REITs)) | | | 357,665 | | | | 10,380 | |
Diageo plc (Beverages) | | | 2,623,033 | | | | 67,454 | |
Dunelm Group plc (Specialty retail) | | | 1,067,286 | | | | 8,684 | |
See accompanying Notes to Portfolio of Investments.
June 30, 2012 | William Blair Funds 35 |
International Growth Fund
Portfolio of Investments, June 30, 2012 (all dollar amounts in thousands) (unaudited)
| | | | | | | | |
Issuer | | Shares | | | Value | |
|
Common Stocks—United Kingdom—19.3%—(continued) | |
Elementis plc (Chemicals) | | | 2,100,728 | | | $ | 6,531 | |
Experian plc (Professional services) | | | 1,279,661 | | | | 18,047 | |
Halma plc (Electronic equipment, instruments & components) | | | 1,412,041 | | | | 9,235 | |
Hiscox, Ltd. (Insurance) | | | 966,795 | | | | 6,470 | |
IG Group Holdings plc (Diversified financial services) | | | 1,323,541 | | | | 9,929 | |
InterContinental Hotels Group plc (Hotels, restaurants & leisure) | | | 375,210 | | | | 9,020 | |
ITV plc (Media) | | | 10,645,703 | | | | 12,771 | |
John Wood Group plc (Energy equipment & services) | | | 1,210,708 | | | | 12,998 | |
Johnson Matthey plc (Chemicals) | | | 814,382 | | | | 28,162 | |
Jupiter Fund Management plc (Capital markets) | | | 1,584,911 | | | | 5,342 | |
Kingfisher plc (Specialty retail) | | | 2,562,779 | | | | 11,535 | |
Lancashire Holdings, Ltd. (Insurance) | | | 1,124,978 | | | | 14,033 | |
Meggitt plc (Aerospace & defense) | | | 1,986,378 | | | | 11,987 | |
Moneysupermarket.com Group plc (Internet software & services) | | | 1,806,421 | | | | 3,542 | |
Next plc (Multiline retail) | | | 304,072 | | | | 15,234 | |
*Ocado Group plc (Internet & catalog retail) | | | 3,469,118 | | | | 4,222 | |
Pearson plc (Media) | | | 1,412,101 | | | | 27,998 | |
Petrofac, Ltd. (Energy equipment & services) | | | 399,169 | | | | 8,677 | |
Prudential plc (Insurance) | | | 2,306,221 | | | | 26,656 | |
Rightmove plc (Media) | | | 431,507 | | | | 10,759 | |
*Rolls-Royce Holdings plc (Aerospace & defense) | | | 3,668,796 | | | | 49,300 | |
Rotork plc (Machinery) | | | 296,877 | | | | 9,160 | |
RPS Group plc (Commercial services & supplies) | | | 1,085,160 | | | | 3,543 | |
Scottish & Southern Energy plc (Electric utilities) | | | 2,067,018 | | | | 45,030 | |
Spirax-Sarco Engineering plc (Machinery) | | | 207,996 | | | | 6,469 | |
*Sports Direct International plc (Specialty retail) | | | 687,478 | | | | 3,293 | |
St James’s Place plc (Insurance) | | | 939,343 | | | | 4,918 | |
Standard Chartered plc (Commercial banks) | | | 1,052,115 | | | | 22,813 | |
*The Berkeley Group Holdings plc (Household durables) | | | 912,211 | | | | 20,130 | |
The Weir Group plc (Machinery) | | | 369,212 | | | | 8,847 | |
Tullow Oil plc (Oil, gas & consumable fuels) | | | 744,614 | | | | 17,143 | |
Victrex plc (Chemicals) | | | 388,993 | | | | 7,743 | |
| | | | | | | | |
| | | | | | | 642,905 | |
| | | | | | | | |
| | |
Emerging Asia—13.2% | | | | | | | | |
China—3.1% | | | | | | | | |
China BlueChemical, Ltd. (Chemicals) | | | 9,808,000 | | | | 5,563 | |
China Overseas Land & Investment, Ltd. (Real estate management & development) | | | 5,608,000 | | | | 12,997 | |
CNOOC, Ltd. (Oil, gas & consumable fuels) | | | 15,649,000 | | | | 31,064 | |
Dongyue Group (Chemicals) | | | 2,326,000 | | | | 1,076 | |
Great Wall Motor Co., Ltd. (Automobiles) | | | 2,084,500 | | | | 4,133 | |
Haitian International Holdings, Ltd. (Machinery) | | | 3,378,000 | | | | 3,335 | |
*Hollysys Automation Technologies, Ltd. (Electronic equipment, instruments & components)† | | | 329,584 | | | | 2,808 | |
|
Common Stocks—Emerging Asia—13.2%—(continued) | |
China—(continued) | | | | | | | | |
Lenovo Group, Ltd. (Computers & peripherals) | | | 30,294,000 | | | $ | 25,538 | |
Spreadtrum Communications, Inc.—ADR (Semiconductors & semiconductor equipment) | | | 260,729 | | | | 4,602 | |
Sun Art Retail Group, Ltd. (Food & staples retailing) | | | 3,786,171 | | | | 4,144 | |
*WuXi PharmaTech Cayman, Inc.—ADR (Life sciences tools & services) | | | 245,177 | | | | 3,462 | |
Yingde Gases (Chemicals) | | | 4,297,000 | | | | 3,910 | |
| | | | | | | | |
| | | | | | | 102,632 | |
| | | | | | | | |
India—3.3% | | | | | | | | |
CRISIL, Ltd. (Diversified financial services) | | | 89,413 | | | | 1,719 | |
HDFC Bank, Ltd. (Commercial banks) | | | 1,700,615 | | | | 17,164 | |
IndusInd Bank, Ltd. (Commercial banks) | | | 482,173 | | | | 2,938 | |
Ipca Laboratories, Ltd. (Pharmaceuticals) | | | 532,906 | | | | 3,423 | |
Lupin, Ltd. (Pharmaceuticals) | | | 769,284 | | | | 7,401 | |
Oberoi Realty, Ltd. (Real estate management & development) | | | 681,897 | | | | 2,973 | |
Sun Pharmaceutical Industries, Ltd. (Pharmaceuticals) | | | 1,230,211 | | | | 14,009 | |
Tata Consultancy Services, Ltd. (IT services) | | | 1,481,612 | | | | 33,898 | |
Tata Motors, Ltd. (Automobiles) | | | 4,721,228 | | | | 20,501 | |
Yes Bank, Ltd. (Commercial banks) | | | 938,920 | | | | 5,707 | |
| | | | | | | | |
| | | | | | | 109,733 | |
| | | | | | | | |
Indonesia—1.0% | | | | | | | | |
PT Alam Sutera Realty Tbk (Real estate management & development) | | | 56,562,000 | | | | 2,951 | |
PT Kalbe Farma Tbk (Pharmaceuticals) | | | 21,487,000 | | | | 8,636 | |
PT Media Nusantara Citra Tbk (Media) | | | 22,802,500 | | | | 4,831 | |
PT United Tractors Tbk (Machinery) | | | 7,258,106 | | | | 16,498 | |
| | | | | | | | |
| | | | | | | 32,916 | |
| | | | | | | | |
Philippines—0.3% | | | | | | | | |
International Container Terminal Services, Inc. (Transportation infrastructure) | | | 2,173,320 | | | | 3,791 | |
SM Prime Holdings, Inc. (Real estate management & development) | | | 21,205,950 | | | | 6,553 | |
| | | | | | | | |
| | | | | | | 10,344 | |
| | | | | | | | |
South Korea—3.8% | | | | | | | | |
Celltrion, Inc. (Pharmaceuticals) | | | 469,275 | | | | 12,415 | |
Hyundai Motor Co. (Automobiles) | | | 191,101 | | | | 38,793 | |
Samsung Electronics Co., Ltd. (Semiconductors & semiconductor equipment) | | | 57,613 | | | | 60,412 | |
Samsung Heavy Industries Co., Ltd. (Machinery) | | | 482,830 | | | | 15,724 | |
| | | | | | | | |
| | | | | | | 127,344 | |
| | | | | | | | |
Thailand—1.7% | | | | | | | | |
Advanced Info Service PCL (Wireless telecommunication services) | | | 3,378,900 | | | | 19,629 | |
BEC World PCL (Media) | | | 3,215,100 | | | | 5,112 | |
CP ALL PCL (Food & staples retailing) | | | 11,765,700 | | | | 13,151 | |
Kasikornbank PCL (Commercial banks) | | | 3,271,300 | | | | 16,995 | |
| | | | | | | | |
| | | | | | | 54,887 | |
| | | | | | | | |
See accompanying Notes to Portfolio of Investments.
36 Semi-Annual Report | June 30, 2012 |
International Growth Fund
Portfolio of Investments, June 30, 2012 (all dollar amounts in thousands) (unaudited)
| | | | | | | | |
Issuer | | Shares | | | Value | |
| | |
Japan—10.2% | | | | | | | | |
Ain Pharmaciez, Inc. (Food & staples retailing) | | | 72,000 | | | $ | 4,319 | |
Cosmos Pharmaceutical Corporation (Food & staples retailing) | | | 4,000 | | | | 265 | |
CyberAgent, Inc. (Media) | | | 3,580 | | | | 9,105 | |
Daito Trust Construction Co., Ltd. (Real estate management & development) | | | 197,100 | | | | 18,616 | |
Exedy Corporation (Auto components) | | | 218,900 | | | | 4,708 | |
FamilyMart Co., Ltd. (Food & staples retailing) | | | 290,200 | | | | 13,251 | |
Fast Retailing Co., Ltd. (Specialty retail) | | | 120,900 | | | | 24,018 | |
*Gree, Inc. (Internet software & services) | | | 651,300 | | | | 12,882 | |
Lawson, Inc. (Food & staples retailing) | | | 221,900 | | | | 15,490 | |
Miraca Holdings, Inc. (Health care providers & services) | | | 143,900 | | | | 5,950 | |
*Nexon Co., Ltd. (Software) | | | 321,700 | | | | 6,238 | |
Nikon Corporation (Leisure equipment & products) | | | 1,736,600 | | | | 52,184 | |
Nitori Co., Ltd. (Specialty retail) | | | 263,620 | | | | 24,866 | |
ORIX Corporation (Diversified financial services) | | | 493,290 | | | | 45,481 | |
Ship Healthcare Holdings, Inc. (Health care providers & services) | | | 209,200 | | | | 5,012 | |
Softbank Corporation (Wireless telecommunication services) | | | 449,300 | | | | 16,598 | |
Sumitomo Mitsui Financial Group, Inc. (Commercial banks) | | | 2,111,500 | | | | 68,997 | |
Sundrug Co., Ltd. (Food & staples retailing) | | | 89,500 | | | | 2,901 | |
Tsuruha Holdings, Inc. (Food & staples retailing) | | | 45,500 | | | | 2,821 | |
United Arrows, Ltd. (Specialty retail) | | | 159,000 | | | | 3,942 | |
| | | | | | | | |
| | | | | | | 337,644 | |
| | | | | | | | |
| | |
Emerging Latin America—6.5% | | | | | | | | |
Brazil—3.2% | | | | | | | | |
BR Malls Participacoes S.A. (Real estate management & development) | | | 989,200 | | | | 11,328 | |
BR Properties S.A. (Real estate management & development) | | | 841,100 | | | | 9,925 | |
CETIP S.A.—Balcao Organizado de Ativos e Derivativos (Capital markets) | | | 493,701 | | | | 6,170 | |
Cia de Concessoes Rodoviarias (Transportation infrastructure) | | | 1,890,800 | | | | 15,373 | |
Cia Hering (Specialty retail) | | | 623,400 | | | | 11,825 | |
Cielo S.A. (IT services) | | | 464,900 | | | | 13,675 | |
Iochpe-Maxion S.A. (Machinery) | | | 156,800 | | | | 1,827 | |
OdontoPrev S.A. (Health care providers & services) | | | 892,500 | | | | 4,532 | |
Petroleo Brasileiro S.A. (Oil, gas & consumable fuels) | | | 1,301,900 | | | | 12,251 | |
*Qualicorp S.A. (Professional services) | | | 402,100 | | | | 3,515 | |
T4F Entretenimento S.A. (Media) | | | 588,300 | | | | 4,877 | |
Tractebel Energia S.A. (Independent power producers & energy traders) | | | 522,400 | | | | 9,663 | |
Valid Solucoes e Servicos de Seguranca em Meios de Pagamento e Identificacao S.A. (Commercial services & supplies) | | | 233,400 | | | | 3,486 | |
| | | | | | | | |
| | | | | | | 108,447 | |
| | | | | | | | |
|
Common Stocks—Emerging Latin
America—6.5%—(continued) | |
Chile—1.8% | | | | | | | | |
Banco Santander Chile—ADR (Commercial banks) | | | 179,691 | | | $ | 13,924 | |
CFR Pharmaceuticals S.A. (Pharmaceuticals) | | | 25,172,657 | | | | 5,656 | |
ENTEL Chile S.A. (Wireless telecommunication services) | | | 634,973 | | | | 12,047 | |
Parque Arauco S.A. (Real estate management & development) | | | 5,427,330 | | | | 9,646 | |
Sociedad Quimica y Minera de Chile
S.A.—ADR (Chemicals) | | | 231,639 | | | | 12,895 | |
Sonda S.A. (IT services) | | | 1,603,692 | | | | 4,506 | |
| | | | | | | | |
| | | | | | | 58,674 | |
| | | | | | | | |
Colombia—0.5% | | | | | | | | |
Ecopetrol S.A. (Oil, gas & consumable fuels) | | | 5,594,559 | | | | 15,642 | |
| | | | | | | | |
Panama—0.3% | | | | | | | | |
Copa Holdings S.A. (Airlines)† | | | 123,757 | | | | 10,207 | |
| | | | | | | | |
Peru—0.7% | | | | | | | | |
Credicorp, Ltd. (Commercial banks)† | | | 176,178 | | | | 22,179 | |
| | | | | | | | |
|
Emerging Europe, Mid-East, Africa—5.0% | |
Nigeria—0.2% | | | | | | | | |
Guaranty Trust Bank plc (Commercial banks) | | | 62,738,334 | | | | 5,782 | |
| | | | | | | | |
South Africa—4.0% | | | | | | | | |
*Aspen Pharmacare Holdings, Ltd. (Pharmaceuticals) | | | 869,628 | | | | 13,388 | |
Bidvest Group, Ltd. (Industrial conglomerates) | | | 742,830 | | | | 16,538 | |
FirstRand, Ltd. (Diversified financial services) | | | 6,143,905 | | | | 19,833 | |
Life Healthcare Group Holdings Pte, Ltd. (Health care providers & services) | | | 3,056,325 | | | | 11,638 | |
Mr Price Group, Ltd. (Specialty retail) | | | 112,549 | | | | 1,541 | |
Naspers, Ltd. (Media) | | | 329,239 | | | | 17,519 | |
Sasol, Ltd. (Oil, gas & consumable fuels) | | | 368,270 | | | | 15,425 | |
Shoprite Holdings, Ltd. (Food & staples retailing) | | | 787,116 | | | | 14,507 | |
The Foschini Group, Ltd. (Specialty retail) | | | 831,747 | | | | 13,024 | |
Tiger Brands, Ltd. (Food products) | | | 332,051 | | | | 9,951 | |
| | | | | | | | |
| | | | | | | 133,364 | |
| | | | | | | | |
Turkey—0.8% | | | | | | | | |
BIM Birlesik Magazalar A.S. (Food & staples retailing) | | | 342,197 | | | | 14,097 | |
Turkiye Halk Bankasi A.S. (Commercial banks) | | | 1,453,116 | | | | 11,369 | |
| | | | | | | | |
| | | | | | | 25,466 | |
| | | | | | | | |
| | |
Western Hemisphere—4.8% | | | | | | | | |
Bermuda—0.2% | | | | | | | | |
RenaissanceRe Holdings, Ltd. (Insurance)† | | | 67,622 | | | | 5,140 | |
| | | | | | | | |
Canada—4.6% | | | | | | | | |
Alimentation Couche Tard, Inc. (Food & staples retailing) | | | 650,387 | | | | 28,402 | |
See accompanying Notes to Portfolio of Investments.
June 30, 2012 | William Blair Funds 37 |
International Growth Fund
Portfolio of Investments, June 30, 2012 (all dollar amounts in thousands) (unaudited)
| | | | | | | | |
Issuer | | Shares | | | Value | |
|
Common Stocks—Western Hemisphere—4.8%—(continued) | |
Canada—(continued) | | | | | | | | |
Brookfield Asset Management, Inc. Class “A” (Real estate management & development)† | | | 1,374,805 | | | $ | 45,506 | |
CI Financial Corporation (Capital markets) | | | 646,493 | | | | 14,021 | |
Dollarama, Inc. (Multiline retail) | | | 254,217 | | | | 15,276 | |
Metro, Inc. (Food & staples retailing) | | | 328,018 | | | | 16,796 | |
Peyto Exploration & Development Corporation (Oil, gas & consumable fuels) | | | 871,720 | | | | 16,474 | |
*Precision Drilling Corporation (Energy equipment & services) | | | 1,725,674 | | | | 11,746 | |
Tim Hortons, Inc. (Hotels, restaurants & leisure) | | | 114,692 | | | | 6,046 | |
| | | | | | | | |
| | | | | | | 154,267 | |
| | | | | | | | |
| | |
Asia—3.8% | | | | | | | | |
Australia—0.3% | | | | | | | | |
Cochlear, Ltd. (Health care equipment & supplies) | | | 150,957 | | | | 10,173 | |
| | | | | | | | |
Hong Kong—2.0% | | | | | | | | |
AIA Group, Ltd. (Insurance) | | | 12,289,400 | | | | 41,979 | |
China High Precision Automation Group, Ltd. (Electronic equipment, instruments & components)**§ | | | 2,624,000 | | | | 695 | |
Hutchison Telecommunications Hong Kong Holdings, Ltd. (Diversified telecommunication services) | | | 20,058,000 | | | | 9,282 | |
Sa Sa International Holdings, Ltd. (Specialty retail) | | | 7,000,000 | | | | 4,376 | |
SmarTone Telecommunications Holdings, Ltd. (Wireless telecommunication services) | | | 4,181,500 | | | | 8,031 | |
Value Partners Group, Ltd. (Capital markets) | | | 7,631,000 | | | | 3,669 | |
| | | | | | | | |
| | | | | | | 68,032 | |
| | | | | | | | |
Issuer | | Shares or
Principal
Amount | | | Value | |
|
Common Stocks—Asia—3.8%—(continued) | |
Singapore—1.5% | | | | | | | | |
*Global Logistic Properties, Ltd. (Real estate management & development) | | | 11,235,000 | | | $ | 18,536 | |
Keppel Corporation, Ltd. (Industrial conglomerates) | | | 3,750,300 | | | | 30,435 | |
| | | | | | | | |
| | | | | | | 48,971 | |
| | | | | | | | |
Total Common Stocks—96.6%
(cost $2,993,411) | | | | 3,207,981 | |
| | | | | | | | |
| | |
Convertible Bond | | | | | | | | |
Brazil—0.0% | | | | | | | | |
Lupatech S.A., 6.500%, due 4/15/18 (Machinery)**§ | | $ | 2,875 | | | | 751 | |
| | | | | | | | |
Total Convertible Bond—0.0%
(cost $1,491) | | | | 751 | |
| | | | | | | | |
| | |
Repurchase Agreement | | | | | | | | |
Fixed Income Clearing Corporation, 0.100% dated 6/29/12, due 7/2/12, repurchase price $104,375, collateralized by FNMA, 0.760%-5.000%, due 4/15/15-6/11/15 and U.S Treasury Notes, 4.250%, due 8/15/15 | | $ | 104,374 | | | | 104,374 | |
| | | | | | | | |
Total Repurchase Agreement—3.1%
(cost $104,374) | | | | 104,374 | |
| | | | | | | | |
Total Investments—99.7%
(cost $3,099,276) | | | | 3,313,106 | |
Cash and other assets, less liabilities—0.3% | | | | 10,549 | |
| | | | | | | | |
Net assets—100.0% | | | $ | 3,323,655 | |
| | | | | | | | |
ADR = American Depository Receipt
* Non-income producing securities
† = U.S. listed foreign security
** = Fair valued pursuant to Valuation Procedures adopted by the Board of Trustees. These holdings represent 0.04% of the Fund’s net assets at June 30, 2012.
§ = Deemed illiquid pursuant to Liquidity Procedures approved by the Board of Trustees. These holdings represent 0.04% of the net assets at June 30, 2012.
For securities primarily traded on exchanges or markets that close before the close of regular trading on the New York Stock Exchange, the Fund may use an independent pricing service to fair value price the securities pursuant to Valuation Procedures approved by the Board of Trustees.
See accompanying Notes to Portfolio of Investments.
38 Semi-Annual Report | June 30, 2012 |
International Growth Fund
Portfolio of Investments, June 30, 2012 (all dollar amounts in thousands) (unaudited)
At June 30, 2012, the Fund’s Portfolio of Investments includes the following industry categories:
| | | | |
Financials | | | 22.1% | |
Consumer Discretionary | | | 17.9% | |
Industrials | | | 12.6% | |
Consumer Staples | | | 11.5% | |
Health Care | | | 10.3% | |
Energy | | | 8.0% | |
Information Technology | | | 7.5% | |
Materials | | | 4.7% | |
Telecommunication Services | | | 3.7% | |
Utilities | | | 1.7% | |
| | | | |
Total | | | 100.0% | |
| | | | |
At June 30, 2012, the Fund’s Portfolio of Investments includes the following currency categories:
| | | | |
British Pound Sterling | | | 22.9% | |
Euro | | | 19.9% | |
Japanese Yen | | | 10.5% | |
Hong Kong Dollar | | | 5.2% | |
Swiss Franc | | | 5.0% | |
South African Rand | | | 4.2% | |
South Korean Won | | | 4.0% | |
U.S. Dollar | | | 3.8% | |
Indian Rupee | | | 3.4% | |
Brazilian Real | | | 3.4% | |
Canadian Dollar | | | 3.4% | |
Swedish Krona | | | 2.8% | |
Norwegian Krone | | | 2.6% | |
Thai Baht | | | 1.7% | |
Danish Krone | | | 1.6% | |
Singapore Dollar | | | 1.5% | |
Indonesian Rupiah | | | 1.0% | |
All Other Currencies | | | 3.1% | |
| | | | |
Total | | | 100.0% | |
| | | | |
See accompanying Notes to Portfolio of Investments.
June 30, 2012 | William Blair Funds 39 |

David Merjan
INTERNATIONAL EQUITY FUND
The International Equity Fund seeks long-term capital appreciation.
AN OVERVIEW FROM THE PORTFOLIO MANAGER
The International Equity Fund posted a 4.55% increase (Class N Shares) for the six months ended June 30, 2012. By comparison, the Fund’s benchmark, the MSCI World Ex-U.S. (net) Index rose 2.43%.
Year-to-date, performance was strong. This performance was enhanced by positive stock selection across a number of sectors, coupled with the underweighting in Metals/Mining. During the period, the Fund’s Information Technology (IT) stocks were up 12.7%, well ahead of -3% Index return, ASML Holding N.V.’s performance was enhanced by rumors of a corporate breakup, while SAP AG and Samsung Electronics Co. Ltd. performed well in the first quarter on strong results. European Healthcare holdings bolstered that sector’s return, while Aerospace/Defense holdings and Keppel Corporation, Ltd. boosted Industrials performance. Somewhat detracting from first half performance was the Fund’s Staples underweighting, along with Financials and Utilities performance.
During the six month period, Consumer decreased by 3.3% in favor of Healthcare and Materials. As of period end, the Fund remained the most overweighted in Industrials and IT, which totaled 16.2% and 8.8%, respectively. While Financials represented 20.6% of the portfolio, it was below the 23.9% Index weighting, due to limited Developed Asia and Europe Ex-U.K. exposure. Regionally, Europe represented 37.9% of the Fund, due to an over 12% Healthcare weighting. The U.K. totaled 21.8%, slightly ahead of the Index weighting, while emerging markets represented 10.8%, a reduction from year end, when it represented 14.2%.
40 Semi-Annual Report | June 30, 2012 |
International Equity Fund
Performance Highlights (Unaudited)
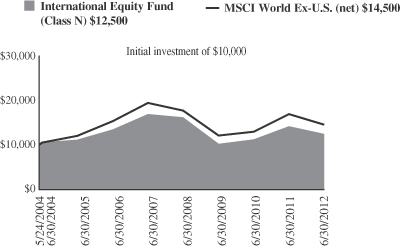
Average Annual Total Return at 6/30/2012
| | | | | | | | | | | | | | | | | | | | |
| | | Year
To Date | | | 1
Year | | | 3
Year | | | 5
Year | | | Since
Inception(a) | |
Class N | | | 4.55 | % | | | (11.75 | )% | | | 6.80 | % | | | (5.88 | )% | | | 2.76 | % |
Class I | | | 4.69 | | | | (11.56 | ) | | | 7.03 | | | | (5.66 | ) | | | 3.03 | |
MSCI World Ex-U.S. (net) | | | 2.43 | | | | (14.13 | ) | | | 6.20 | | | | (5.67 | ) | | | 4.69 | |
| | (a) | | For the period from May 24, 2004 (Commencement of Operations) to June 30, 2012. | |
Performance cited represents past performance. Past performance does not guarantee future results and current performance may be lower or higher than the data quoted. Results shown are average annual returns, which assume reinvestment of dividends and capital gains. Investment returns and principal will fluctuate and you may have a gain or loss when you sell shares. For the most current month-end performance information, please call 1-800-742-7272, or visit our Web site at www.williamblairfunds.com. From time to time the investment advisor may waive fees or reimburse expenses for the Fund. Without these waivers, performance would be lower. International investing involves special risk considerations, including currency fluctuations, lower liquidity, economic and political risk. Class N shares are available to the general public without a sales load. Class I shares are available to certain institutional investors and advisory clients of William Blair & Company L.L.C. without a sales load or distribution (12b-1) or service fees.
The performance highlights and graph presented above do not reflect the deduction of taxes that a shareholder would pay on fund distributions or the redemption of fund shares.
The Morgan Stanley Capital International (MSCI) World Ex-U.S. (net) is a free float-adjusted market capitalization weighted index that is designed to measure the equity market performance of developed markets, excluding the United States. This series approximates the minimum possible dividend reinvestment.
This report identifies the Fund’s investments on June 30, 2012. These holdings are subject to change. Not all stocks in the Fund performed the same, nor is there any guarantee that these stocks will perform as well in the future. Market forecasts provided in this report may not necessarily come to pass.
Sector Diversification (Unaudited)
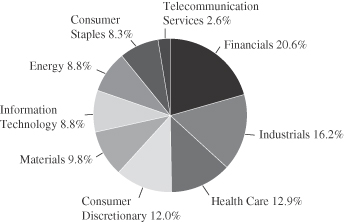
The sector diversification shown is based on the total long-term securities.
June 30, 2012 | William Blair Funds 41 |
International Equity Fund
Portfolio of Investments, June 30, 2012 (all dollar amounts in thousands) (unaudited)
| | | | | | | | |
Issuer | | Shares | | | Value | |
| | |
Common Stocks | | | | | | | | |
| | |
Europe, Mid-East—38.0% | | | | | | | | |
Denmark—2.1% | | | | | | | | |
Novo Nordisk A/S (Pharmaceuticals) | | | 9,789 | | | $ | 1,414 | |
| | | | | | | | |
France—10.9% | | | | | | | | |
AXA S.A. (Insurance) | | | 57,161 | | | | 758 | |
BNP Paribas S.A. (Commercial banks) | | | 21,580 | | | | 829 | |
Christian Dior S.A. (Textiles, apparel & luxury goods) | | | 5,654 | | | | 775 | |
Dassault Systemes S.A. (Software) | | | 9,908 | | | | 927 | |
Essilor International S.A. (Health care equipment & supplies) | | | 15,613 | | | | 1,448 | |
L’Oreal S.A. (Personal products) | | | 7,191 | | | | 839 | |
Sanofi (Pharmaceuticals) | | | 18,110 | | | | 1,369 | |
Technip S.A. (Energy equipment & services) | | | 5,363 | | | | 556 | |
| | | | | | | | |
| | | | | | | 7,501 | |
| | | | | | | | |
Germany—6.9% | | | | | | | | |
BASF SE (Chemicals) | | | 15,792 | | | | 1,093 | |
Bayer AG (Pharmaceuticals) | | | 14,464 | | | | 1,039 | |
Fresenius SE & Co. KGaA (Health care providers & services) | | | 12,959 | | | | 1,341 | |
Infineon Technologies AG (Semiconductors & semiconductor equipment) | | | 49,718 | | | | 336 | |
SAP AG (Software) | | | 16,191 | | | | 954 | |
| | | | | | | | |
| | | | | | | 4,763 | |
| | | | | | | | |
Ireland—2.9% | | | | | | | | |
*Ryanair Holdings plc—ADR (Airlines) | | | 27,327 | | | | 831 | |
Shire plc (Pharmaceuticals) | | | 41,244 | | | | 1,183 | |
| | | | | | | | |
| | | | | | | 2,014 | |
| | | | | | | | |
Israel—0.9% | | | | | | | | |
Teva Pharmaceutical Industries, Ltd.—ADR (Pharmaceuticals) | | | 15,930 | | | | 628 | |
| | | | | | | | |
Italy—1.1% | | | | | | | | |
Saipem SpA (Energy equipment & services) | | | 17,113 | | | | 758 | |
| | | | | | | | |
Netherlands—4.1% | | | | | | | | |
ASML Holding N.V. (Semiconductors & semiconductor equipment) | | | 17,446 | | | | 885 | |
Royal Dutch Shell plc Class “A” (Oil, gas & consumable fuels) | | | 228 | | | | 8 | |
Royal Dutch Shell plc Class “B” (Oil, gas & consumable fuels) | | | 19,114 | | | | 666 | |
Unilever N.V. (Food products) | | | 37,212 | | | | 1,242 | |
| | | | | | | | |
| | | | | | | 2,801 | |
| | | | | | | | |
Norway—1.4% | | | | | | | | |
Telenor ASA (Diversified telecommunication services) | | | 57,719 | | | | 959 | |
| | | | | | | | |
Spain—1.6% | | | | | | | | |
Inditex S.A. (Specialty retail) | | | 10,260 | | | | 1,058 | |
| | | | | | | | |
Sweden—1.3% | | | | | | | | |
Atlas Copco AB Class “A” (Machinery) | | | 41,515 | | | | 891 | |
| | | | | | | | |
Switzerland—4.8% | | | | | | | | |
*Geberit AG (Building products) | | | 3,916 | | | | 770 | |
Nestle S.A. (Food products) | | | 17,485 | | | | 1,042 | |
Syngenta AG (Chemicals) | | | 4,427 | | | | 1,508 | |
| | | | | | | | |
| | | | | | | 3,320 | |
| | | | | | | | |
|
Common Stocks—(continued) | |
United Kingdom—20.7% | | | | | | | | |
Barclays plc (Commercial banks) | | | 160,620 | | | $ | 410 | |
BG Group plc (Oil, gas & consumable fuels) | | | 36,903 | | | | 751 | |
Burberry Group plc (Textiles, apparel & luxury goods) | | | 45,740 | | | | 949 | |
Compass Group plc (Hotels, restaurants & leisure) | | | 136,651 | | | | 1,432 | |
Diageo plc (Beverages) | | | 52,680 | | | | 1,355 | |
Experian plc (Professional services) | | | 64,349 | | | | 908 | |
HSBC Holdings plc (Commercial banks) | | | 104,503 | | | | 923 | |
Johnson Matthey plc (Chemicals) | | | 30,346 | | | | 1,049 | |
Pearson plc (Media) | | | 60,164 | | | | 1,193 | |
Petrofac, Ltd. (Energy equipment & services) | | | 46,430 | | | | 1,009 | |
Prudential plc (Insurance) | | | 75,883 | | | | 877 | |
*Rolls-Royce Holdings plc (Aerospace & defense) | | | 112,463 | | | | 1,511 | |
Standard Chartered plc (Commercial banks) | | | 52,609 | | | | 1,141 | |
Tullow Oil plc (Oil, gas & consumable fuels) | | | 30,438 | | | | 701 | |
| | | | | | | | |
| | | | | | | 14,209 | |
| | | | | | | | |
| | |
Japan—13.9% | | | | | | | | |
Chiyoda Corporation (Construction & engineering) | | | 42,000 | | | | 509 | |
Daito Trust Construction Co., Ltd. (Real estate management & development) | | | 12,500 | | | | 1,181 | |
FamilyMart Co., Ltd. (Food & staples retailing) | | | 20,800 | | | | 950 | |
Fanuc Corporation (Machinery) | | | 7,400 | | | | 1,199 | |
Keyence Corporation (Electronic equipment, instruments & components) | | | 3,500 | | | | 859 | |
Nikon Corporation (Leisure equipment & products) | | | 33,700 | | | | 1,013 | |
Nitori Co., Ltd. (Specialty retail) | | | 7,800 | | | | 736 | |
ORIX Corporation (Diversified financial services) | | | 10,760 | | | | 992 | |
Sumitomo Mitsui Financial Group, Inc. (Commercial banks) | | | 26,000 | | | | 849 | |
Suruga Bank, Ltd. (Commercial banks) | | | 56,000 | | | | 570 | |
THK Co., Ltd. (Machinery) | | | 39,500 | | | | 737 | |
| | | | | | | | |
| | | | | | | 9,595 | |
| | | | | | | | |
| | |
Canada—7.1% | | | | | | | | |
Brookfield Asset Management, Inc. Class “A” (Real estate management & development)† | | | 34,364 | | | | 1,137 | |
Canadian National Railway Co. (Road & rail)† | | | 11,571 | | | | 976 | |
Goldcorp, Inc. (Metals & mining)† | | | 16,963 | | | | 637 | |
The Toronto-Dominion Bank (Commercial banks) | | | 18,155 | | | | 1,421 | |
Tim Hortons, Inc. (Hotels, restaurants & leisure) | | | 13,383 | | | | 706 | |
| | | | | | | | |
| | | | | | | 4,877 | |
| | | | | | | | |
| | |
Emerging Asia—5.5% | | | | | | | | |
China—2.2% | | | | | | | | |
China Mobile, Ltd. (Wireless telecommunication services) | | | 67,000 | | | | 732 | |
CNOOC, Ltd. (Oil, gas & consumable fuels) | | | 384,000 | | | | 762 | |
| | | | | | | | |
| | | | | | | 1,494 | |
| | | | | | | | |
India—0.8% | | | | | | | | |
Tata Consultancy Services, Ltd. (IT services) | | | 24,344 | | | $ | 557 | |
| | | | | | | | |
See accompanying Notes to Portfolio of Investments.
42 Semi-Annual Report | June 30, 2012 |
International Equity Fund
Portfolio of Investments, June 30, 2012 (all dollar amounts in thousands) (unaudited)
| | | | | | | | |
Issuer | | Shares or
Principal
Amount | | | Value | |
|
Common Stocks—Emerging Asia—5.5%—(continued) | |
Papua New Guinea—0.7% | | | | | | | | |
Oil Search, Ltd. (Oil, gas & consumable fuels) | | | 75,718 | | | $ | 510 | |
| | | | | | | | |
South Korea—1.8% | | | | | | | | |
Samsung Electronics Co., Ltd. (Semiconductors & semiconductor equipment) | | | 1,192 | | | | 1,250 | |
| | | | | | | | |
| | |
Asia—5.0% | | | | | | | | |
Australia—1.6% | | | | | | | | |
BHP Billiton, Ltd.—ADR (Metals & mining) | | | 16,669 | | | | 1,089 | |
| | | | | | | | |
Hong Kong—2.1% | | | | | | | | |
AIA Group, Ltd. (Insurance) | | | 416,600 | | | | 1,423 | |
| | | | | | | | |
Singapore—1.3% | | | | | | | | |
Keppel Corporation, Ltd. (Industrial conglomerates) | | | 115,000 | | | | 933 | |
| | | | | | | | |
| | |
Emerging Latin America—3.4% | | | | | | | | |
Brazil—1.0% | | | | | | | | |
Embraer S.A.—ADR (Aerospace & defense) | | | 24,740 | | | | 656 | |
| | | | | | | | |
Chile—1.5% | | | | | | | | |
Sociedad Quimica y Minera de Chile S.A.—ADR (Chemicals) | | | 18,520 | | | | 1,031 | |
| | | | | | | | |
Panama—0.9% | | | | | | | | |
Copa Holdings S.A. (Airlines)† | | | 7,669 | | | | 633 | |
| | | | | | | | |
|
Emerging Europe, Mid-East, Africa—1.4% | |
South Africa—1.4% | | | | | | | | |
FirstRand, Ltd. (Diversified financial services) | | | 292,045 | | | | 943 | |
| | | | | | | | |
Total Common Stocks—95.0%
(cost $60,111) | | | | | | | 65,307 | |
| | | | | | | | |
| | |
Repurchase Agreement | | | | | | | | |
Fixed Income Clearing Corporation, 0.100% dated 6/29/12, due 7/2/12, repurchase price $3,800, collateralized by FNMA, 5.000%, due 4/15/15 | | $ | 3,800 | | | | 3,800 | |
| | | | | | | | |
Total Repurchase Agreement—5.5%
(cost $3,800) | | | | 3,800 | |
| | | | | | | | |
Total Investments—100.5%
(cost $63,911) | | | | 69,107 | |
Liabilities, plus cash and other assets—(0.5)% | | | | (344 | ) |
| | | | | | | | |
Net assets—100.0% | | | $ | 68,763 | |
| | | | | | | | |
ADR = American Depository Receipt
* Non-income producing securities
† = U.S. listed foreign security
For securities primarily traded on exchanges or markets that close before the close of regular trading on the New York Stock Exchange, the Fund may use an independent pricing service to fair value price the securities pursuant to Valuation Procedures approved by the Board of Trustees.
At June 30, 2012, the Fund’s Portfolio of Investments includes the following industry categories:
| | | | |
Financials | | | 20.6% | |
Industrials | | | 16.2% | |
Health Care | | | 12.9% | |
Consumer Discretionary | | | 12.0% | |
Materials | | | 9.8% | |
Information Technology | | | 8.8% | |
Energy | | | 8.8% | |
Consumer Staples | | | 8.3% | |
Telecommunication Services | | | 2.6% | |
| | | | |
Total | | | 100.0% | |
| | | | |
At June 30, 2012, the Fund’s Portfolio of Investments includes the following currency categories:
| | | | |
Euro | | | 24.8% | |
British Pound Sterling | | | 23.2% | |
Japanese Yen | | | 14.7% | |
U.S. Dollar | | | 11.7% | |
Hong Kong Dollar | | | 5.9% | |
Swiss Franc | | | 5.1% | |
Canadian Dollar | | | 3.2% | |
Danish Krone | | | 2.2% | |
South Korean Won | | | 1.9% | |
Norwegian Krone | | | 1.5% | |
South African Rand | | | 1.4% | |
Singapore Dollar | | | 1.4% | |
Swedish Krona | | | 1.4% | |
All Other Currencies | | | 1.6% | |
| | | | |
Total | | | 100.0% | |
| | | | |
See accompanying Notes to Portfolio of Investments.
June 30, 2012 | William Blair Funds 43 |

Jeffrey A. Urbina
INTERNATIONAL SMALL CAP GROWTH FUND
The International Small Cap Growth Fund seeks long-term capital appreciation.
AN OVERVIEW FROM THE PORTFOLIO MANAGER
The International Small Cap Growth Fund posted a 6.16% increase (Class N Shares) for the six months ended June 30, 2012. By comparison, the Fund’s benchmark, the MSCI All Country Ex-U.S. Small Cap Index (net), rose 4.09%.
Performance was driven by strong stock selection across a number of sectors, along with a focus on high quality companies with good growth prospects. In addition, the Fund’s sector/industry exposures were positive given the significant Metals/Mining underweighting and Consumer overweighting. Within Discretionary, Nokian Renkaat (Tyres), the Finnish tire company, added to results on strong demand from its important Russian end market, while Salvatore Ferragamo Italia SpA, the Italian luxury goods company, rose on strong sales trends across most regions and distribution channels. Dollarama, Inc. also performed well over the period. Somewhat detracting from results was K’s Holdings Corporation, the Japanese electronics retailer, which had weak TV sales as incentives expired. Financials stock selection was bolstered by conservative Commercial Banks positioning coupled with strong results in Insurance and Real Estate. Defensive positioning within Industrials added value as well. Somewhat detracting from results was weak performance in Energy, as Legacy Oil & Gas, Inc. detracted from results on lower production growth and reserves than the market expected, and as Celtic Exploration Ltd. and Peyto Exploration & Development Corporation each underperformed on concerns of lower natural gas prices and slowing production growth.
The Fund maintained its significant Consumer focus, representing 34.8% as of June 30, approximately 10% above the Index weighting. At June 30, the Fund remained significantly overweighted in Health Care, which totaled 12.5%, well above the 5% Index weighting, although below the 15.8% weighting as of year end. Conversely, Resources, Industrials and Financials were significantly underweighted. Overall regional positioning did not change appreciably during the six month period, as the Fund maintained its significant weighting in the UK at the expense of Developed Asia and Canada. Emerging markets totaled 22.2% as of June 30, below the 23.1% Index weighting and a reduction from year end, due to lower exposure in Emerging Asia, given slowing growth in that region.
44 Semi-Annual Report | June 30, 2012 |
International Small Cap Growth Fund
Performance Highlights (Unaudited)
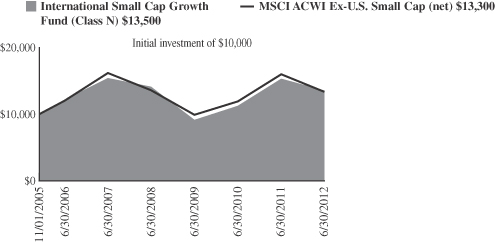
Average Annual Total Return at 6/30/2012
| | | | | | | | | | | | | | | | | | | | |
| | | Year
To Date | | | 1
Year | | | 3
Year | | | 5
Year | | | Since
Inception(a) | |
Class N | | | 6.16 | % | | | (11.55 | )% | | | 13.91 | % | | | (2.56 | )% | | | 4.59 | % |
Class I | | | 6.28 | | | | (11.35 | ) | | | 14.22 | | | | (2.23 | ) | | | 4.92 | |
MSCI ACWI Ex-U.S. Small Cap (net) | | | 4.09 | | | | (16.43 | ) | | | 10.41 | | | | (3.74 | ) | | | 4.41 | |
| | (a) | | For the period from November 1, 2005 (Commencement of Operations) to June 30, 2012. |
Performance cited represents past performance. Past performance does not guarantee future results and current performance may be lower or higher than the data quoted. Results shown are average annual returns, which assume reinvestment of dividends and capital gains. Investment returns and principal will fluctuate and you may have a gain or loss when you sell shares. For the most current month-end performance information, please call 1-800-742-7272, or visit our Web site at www.williamblairfunds.com. Smaller capitalization stock are also more sensitive to purchase/sale transactions and changes in the issuer’s financial condition. From time to time, the investment advisor may waive fees or reimburse expenses for the Fund. Without these waivers, performance would be lower. International investing involves special risk considerations, including currency fluctuations, lower liquidity, economic and political risk. Class N shares are available to the general public without a sales load. Class I shares are available to certain institutional investors and advisory clients of William Blair & Company L.L.C. without a sales load or distribution (12b-1) fees.
The performance highlights and graph presented above do not reflect the deduction of taxes that a shareholder would pay on fund distributions or the redemption of fund shares.
The Morgan Stanley Capital International (MSCI) All Country World Ex-U.S. Small Cap Index (net) is a free float-adjusted market capitalization weighted index that is designed to measure the equity market performance of small capitalization developed and emerging markets, excluding the United States. This series approximates the minimum possible dividend reinvestment.
This report identifies the Fund’s investments on June 30, 2012. These holdings are subject to change. Not all stocks in the Fund performed the same, nor is there any guarantee that these stocks will perform as well in the future. Market forecasts provided in this report may not necessarily come to pass.
Sector Diversification (Unaudited)
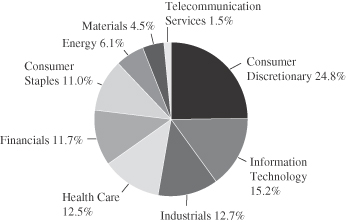
The sector diversification shown is based on the total long-term securities.
June 30, 2012 | William Blair Funds 45 |
International Small Cap Growth Fund
Portfolio of Investments, June 30, 2012 (all dollar amounts in thousands) (unaudited)
| | | | | | | | |
Issuer | | Shares | | | Value | |
| | |
Common Stocks | | | | | | | | |
United Kingdom—22.1% | | | | | | | | |
Abcam plc (Biotechnology) | | | 962,205 | | | $ | 6,288 | |
*ASOS plc (Internet & catalog retail) | | | 118,426 | | | | 3,292 | |
Aveva Group plc (Software) | | | 265,190 | | | | 6,770 | |
Babcock International Group plc (Commercial services & supplies) | | | 1,107,282 | | | | 14,801 | |
Booker Group plc (Food & staples retailing) | | | 8,352,829 | | | | 11,904 | |
Croda International plc (Chemicals) | | | 398,298 | | | | 14,116 | |
Domino’s Pizza Group plc (Hotels, restaurants & leisure) | | | 313,120 | | | | 2,523 | |
Dunelm Group plc (Specialty retail) | | | 445,908 | | | | 3,628 | |
Elementis plc (Chemicals) | | | 1,427,404 | | | | 4,438 | |
*EnQuest plc (Oil, gas & consumable fuels) | | | 1,476,078 | | | | 2,490 | |
Fidessa Group plc (Software) | | | 122,805 | | | | 2,981 | |
Halma plc (Electronic equipment, instruments & components) | | | 878,060 | | | | 5,743 | |
Hiscox, Ltd. (Insurance) | | | 488,558 | | | | 3,269 | |
IG Group Holdings plc (Diversified financial services) | | | 1,272,904 | | | | 9,549 | |
*Imagination Technologies Group plc (Computers & peripherals) | | | 903,107 | | | | 6,600 | |
Lancashire Holdings, Ltd. (Insurance) | | | 927,090 | | | | 11,565 | |
Moneysupermarket.com Group plc (Internet software & services) | | | 1,770,555 | | | | 3,472 | |
*Salamander Energy plc (Oil, gas & consumable fuels) | | | 1,680,109 | | | | 4,492 | |
Spirax-Sarco Engineering plc (Machinery) | | | 211,563 | | | | 6,580 | |
*Sports Direct International plc (Specialty retail) | | | 1,338,244 | | | | 6,409 | |
St James’s Place plc (Insurance) | | | 636,618 | | | | 3,333 | |
Synergy Health plc (Health care providers & services) | | | 207,366 | | | | 2,928 | |
*Telecity Group plc (Internet software & services) | | | 491,879 | | | | 6,186 | |
| | | | | | | | |
| | | | | | | 143,357 | |
| | | | | | | | |
| | |
Europe—20.7% | | | | | | | | |
Denmark—0.9% | | | | | | | | |
CHR Hansen Holding A/S (Chemicals) | | | 225,500 | | | | 5,785 | |
| | | | | | | | |
Germany—7.0% | | | | | | | | |
Aixtron AG (Semiconductors & semiconductor equipment) | | | 306,454 | | | | 4,367 | |
Delticom AG (Specialty retail) | | | 30,200 | | | | 1,983 | |
ElringKlinger AG (Auto components) | | | 191,003 | | | | 4,537 | |
Gerry Weber International AG (Textiles, apparel & luxury goods) | | | 145,938 | | | | 6,009 | |
MTU Aero Engines Holding AG (Aerospace & defense) | | | 169,142 | | | | 12,402 | |
Pfeiffer Vacuum Technology AG (Machinery) | | | 58,801 | | | | 5,980 | |
Wincor Nixdorf AG (Computers & peripherals) | | | 197,352 | | | | 6,988 | |
Wirecard AG (IT services) | | | 184,136 | | | | 3,563 | |
| | | | | | | | |
| | | | | | | 45,829 | |
| | | | | | | | |
Ireland—1.4% | | | | | | | | |
Paddy Power plc (Hotels, restaurants & leisure) | | | 143,495 | | | | 9,361 | |
| | | | | | | | |
Italy—3.2% | | | | | | | | |
De’Longhi SpA (Household durables) | | | 391,776 | | | | 3,760 | |
Recordati SpA (Pharmaceuticals) | | | 397,789 | | | | 2,829 | |
|
Common Stocks—Europe—20.7%—(continued) | |
Italy—(continued) | | | | | | | | |
Salvatore Ferragamo Italia SpA (Textiles, apparel & luxury goods) | | | 299,415 | | | $ | 6,214 | |
Tod’s SpA (Textiles, apparel & luxury goods) | | | 50,442 | | | | 5,040 | |
*Yoox SpA (Internet & catalog retail) | | | 201,285 | | | | 2,899 | |
| | | | | | | | |
| | | | | | | 20,742 | |
| | | | | | | | |
Norway—1.9% | | | | | | | | |
Opera Software ASA (Internet software & services) | | | 533,186 | | | | 3,756 | |
Schibsted ASA (Media) | | | 271,063 | | | | 8,776 | |
| | | | | | | | |
| | | | | | | 12,532 | |
| | | | | | | | |
Spain—2.3% | | | | | | | | |
Viscofan S.A. (Food products) | | | 341,795 | | | | 14,676 | |
| | | | | | | | |
Sweden—3.0% | | | | | | | | |
Axis Communications AB (Communications equipment) | | | 351,804 | | | | 7,629 | |
JM AB (Household durables) | | | 280,780 | | | | 4,942 | |
Mekonomen AB (Specialty retail) | | | 130,585 | | | | 3,992 | |
NIBE Industrier AB (Building products) | | | 211,658 | | | | 2,884 | |
| | | | | | | | |
| | | | | | | 19,447 | |
| | | | | | | | |
Switzerland—1.0% | | | | | | | | |
Partners Group Holding AG (Capital markets) | | | 36,436 | | | | 6,472 | |
| | | | | | | | |
Japan—16.2% | | | | | | | | |
Ain Pharmaciez, Inc. (Food & staples retailing) | | | 112,400 | | | | 6,742 | |
Cosmos Pharmaceutical Corporation (Food & staples retailing) | | | 60,600 | | | | 4,010 | |
CyberAgent, Inc. (Media) | | | 3,535 | | | | 8,991 | |
F.C.C. Co., Ltd. (Auto components) | | | 326,709 | | | | 5,436 | |
FamilyMart Co., Ltd. (Food & staples retailing) | | | 320,900 | | | | 14,653 | |
Kakaku.com, Inc. (Internet software & services) | | | 93,000 | | | | 3,143 | |
M3, Inc. (Health care technology) | | | 812 | | | | 3,870 | |
Miraca Holdings, Inc. (Health care providers & services) | | | 262,600 | | | | 10,858 | |
MISUMI Group, Inc. (Trading companies & distributors) | | | 278,100 | | | | 6,499 | |
Sawai Pharmaceutical Co., Ltd. (Pharmaceuticals) | | | 30,100 | | | | 3,231 | |
Ship Healthcare Holdings, Inc. (Health care providers & services) | | | 209,000 | | | | 5,007 | |
Start Today Co., Ltd. (Internet & catalog retail) | | | 284,300 | | | | 3,951 | |
Suruga Bank, Ltd. (Commercial banks) | | | 1,017,000 | | | | 10,356 | |
THK Co., Ltd. (Machinery) | | | 472,200 | | | | 8,814 | |
United Arrows, Ltd. (Specialty retail) | | | 167,700 | | | | 4,158 | |
Xebio Co., Ltd. (Specialty retail) | | | 257,300 | | | | 5,849 | |
| | | | | | | | |
| | | | | | | 105,568 | |
| | | | | | | | |
| | |
Emerging Asia—11.1% | | | | | | | | |
China—4.9% | | | | | | | | |
AAC Technologies Holdings, Inc. (Communications equipment) | | | 2,111,559 | | | | 6,070 | |
Dongyue Group (Chemicals) | | | 3,435,000 | | | | 1,590 | |
*Haier Electronics Group Co., Ltd. (Household durables) | | | 8,292,000 | | | | 9,876 | |
See accompanying Notes to Portfolio of Investments.
46 Semi-Annual Report | June 30, 2012 |
International Small Cap Growth Fund
Portfolio of Investments, June 30, 2012 (all dollar amounts in thousands) (unaudited)
| | | | | | | | |
Issuer | | Shares | | | Value | |
|
Common Stocks—Emerging Asia—11.1%—(continued) | |
China—(continued) | | | | | | | | |
Haitian International Holdings, Ltd. (Machinery) | | | 3,820,496 | | | $ | 3,772 | |
Minth Group, Ltd. (Auto components) | | | 2,728,000 | | | | 2,929 | |
Spreadtrum Communications, Inc.—ADR (Semiconductors & semiconductor equipment)† | | | 209,135 | | | | 3,691 | |
*WuXi PharmaTech Cayman, Inc.—ADR (Life sciences tools & services)† | | | 261,262 | | | | 3,689 | |
| | | | | | | | |
| | | | | | | 31,617 | |
| | | | | | | | |
India—2.0% | | | | | | | | |
CRISIL, Ltd. (Diversified financial services) | | | 181,617 | | | | 3,492 | |
eClerx Services, Ltd. (Professional services) | | | 160,640 | | | | 1,745 | |
Ipca Laboratories, Ltd. (Pharmaceuticals) | | | 300,246 | | | | 1,929 | |
*Jubilant Foodworks, Ltd. (Hotels, restaurants & leisure) | | | 112,272 | | | | 2,351 | |
Motherson Sumi Systems, Ltd. (Auto components) | | | 715,247 | | | | 2,094 | |
Oberoi Realty, Ltd. (Real estate management & development) | | | 344,191 | | | | 1,500 | |
| | | | | | | | |
| | | | | | | 13,111 | |
| | | | | | | | |
Indonesia—1.6% | | | | | | | | |
PT Harum Energy Tbk (Oil, gas & consumable fuels) | | | 2,587,500 | | | | 1,570 | |
PT Kalbe Farma Tbk (Pharmaceuticals) | | | 6,134,500 | | | | 2,466 | |
PT Media Nusantara Citra Tbk (Media) | | | 12,923,000 | | | | 2,738 | |
PT Perusahaan Perkebunan London Sumatra Indonesia Tbk (Food products) | | | 12,969,500 | | | | 3,694 | |
| | | | | | | | |
| | | | | | | 10,468 | |
| | | | | | | | |
South Korea—0.6% | | | | | | | | |
Daum Communications Corporation (Internet software & services) | | | 44,148 | | | | 3,943 | |
| | | | | | | | |
Taiwan—1.1% | | | | | | | | |
Hiwin Technologies Corporation (Machinery) | | | 370,000 | | | | 3,739 | |
Simplo Technology Co., Ltd. (Computers & peripherals) | | | 524,500 | | | | 3,571 | |
| | | | | | | | |
| | | | | | | 7,310 | |
| | | | | | | | |
Thailand—0.9% | | | | | | | | |
Bangkok Dusit Medical Services PCL (Health care providers & services) | | | 831,500 | | | | 2,552 | |
Siam Makro PCL (Food & staples retailing) | | | 267,900 | | | | 3,003 | |
| | | | | | | | |
| | | | | | | 5,555 | |
| | | | | | | | |
| | |
Asia—9.0% | | | | | | | | |
Australia—3.0% | | | | | | | | |
Cochlear, Ltd. (Health care equipment & supplies) | | | 196,219 | | | | 13,222 | |
Seek, Ltd. (Professional services) | | | 929,525 | | | | 6,032 | |
| | | | | | | | |
| | | | | | | 19,254 | |
| | | | | | | | |
Hong Kong—4.6% | | | | | | | | |
ASM Pacific Technology, Ltd. (Semiconductors & semiconductor equipment) | | | 1,249,300 | | | | 15,854 | |
Sa Sa International Holdings, Ltd. (Specialty retail) | | | 5,746,000 | | | | 3,592 | |
|
Common Stocks—Asia—9.0%—(continued) | |
Hong Kong—(continued) | | | | | | | | |
SmarTone Telecommunications Holdings, Ltd. (Wireless telecommunication services) | | | 4,925,500 | | | $ | 9,460 | |
Value Partners Group, Ltd. (Capital markets) | | | 1,968,000 | | | | 946 | |
| | | | | | | | |
| | | | | | | 29,852 | |
| | | | | | | | |
Singapore—1.4% | | | | | | | | |
*Biosensors International Group, Ltd. (Health care equipment & supplies) | | | 3,011,000 | | | | 2,698 | |
First Resources, Ltd. (Food products) | | | 4,340,000 | | | | 6,578 | |
| | | | | | | | |
| | | | | | | 9,276 | |
| | | | | | | | |
| | |
Canada—6.5% | | | | | | | | |
Canadian Energy Services & Technology Corporation (Energy equipment & services) | | | 202,155 | | | | 1,944 | |
Canadian Western Bank (Commercial banks) | | | 83,749 | | | | 2,173 | |
*Celtic Exploration, Ltd. (Oil, gas & consumable fuels) | | | 510,250 | | | | 6,901 | |
Dollarama, Inc. (Multiline retail) | | | 197,301 | | | | 11,856 | |
*Legacy Oil + Gas, Inc. (Oil, gas & consumable fuels) | | | 831,220 | | | | 4,588 | |
Major Drilling Group International, Inc. (Metals & mining) | | | 195,191 | | | | 2,257 | |
Petrominerales, Ltd. (Oil, gas & consumable fuels) | | | 158,581 | | | | 1,791 | |
Peyto Exploration & Development Corporation (Oil, gas & consumable fuels) | | | 327,812 | | | | 6,195 | |
*Precision Drilling Corporation (Energy equipment & services) | | | 417,208 | | | | 2,840 | |
Total Energy Services, Inc. (Energy equipment & services) | | | 128,308 | | | | 1,814 | |
| | | | | | | | |
| | | | | | | 42,359 | |
| | | | | | | | |
|
Emerging Europe, Mid-East, Africa—6.3% | |
Poland—1.0% | | | | | | | | |
Eurocash S.A. (Food & staples retailing) | | | 235,146 | | | | 2,894 | |
Lubelski Wegiel Bogdanka S.A. (Oil, gas & consumable fuels) | | | 97,701 | | | | 3,577 | |
| | | | | | | | |
| | | | | | | 6,471 | |
| | | | | | | | |
Russia—0.4% | | | | | | | | |
*Etalon Group Ltd.—144A—GDR (Real estate management & development)† | | | 419,810 | | | | 2,288 | |
| | | | | | | | |
South Africa—3.5% | | | | | | | | |
Capitec Bank Holdings, Ltd. (Commercial banks) | | | 271,332 | | | | 7,053 | |
Coronation Fund Managers, Ltd. (Capital markets) | | | 1,036,290 | | | | 3,508 | |
Life Healthcare Group Holdings Pte, Ltd. (Health care providers & services) | | | 2,264,242 | | | | 8,622 | |
Mr Price Group, Ltd. (Specialty retail) | | | 256,068 | | | | 3,506 | |
| | | | | | | | |
| | | | | | | 22,689 | |
| | | | | | | | |
Turkey—1.4% | | | | | | | | |
Tofas Turk Otomobil Fabrikasi A.S. (Automobiles) | | | 945,477 | | | | 4,047 | |
Turkiye Sinai Kalkinma Bankasi A.S. (Commercial banks) | | | 5,205,656 | | | | 5,296 | |
| | | | | | | | |
| | | | | | | 9,343 | |
| | | | | | | | |
See accompanying Notes to Portfolio of Investments.
June 30, 2012 | William Blair Funds 47 |
International Small Cap Growth Fund
Portfolio of Investments, June 30, 2012 (all dollar amounts in thousands) (unaudited)
| | | | | | | | |
Issuer | | Shares or
Principal
Amount | | | Value | |
|
Common Stocks—(continued) | |
| | |
Emerging Latin America—3.8% | | | | | | | | |
Brazil—2.7% | | | | | | | | |
Arezzo Industria e Comercio S.A. (Textiles, apparel & luxury goods) | | | 268,796 | | | $ | 4,002 | |
CETIP S.A.—Balcao Organizado de Ativos e Derivativos (Capital markets) | | | 148,542 | | | | 1,856 | |
Iochpe-Maxion S.A. (Machinery) | | | 166,500 | | | | 1,940 | |
OdontoPrev S.A. (Health care providers & services) | | | 837,700 | | | | 4,254 | |
Restoque Comercio e Confeccoes de Roupas S.A. (Textiles, apparel & luxury goods) | | | 439,800 | | | | 2,251 | |
T4F Entretenimento S.A. (Media) | | | 413,800 | | | | 3,430 | |
| | | | | | | | |
| | | | | | | 17,733 | |
| | | | | | | | |
Chile—0.5% | | | | | | | | |
CFR Pharmaceuticals S.A. (Pharmaceuticals) | | | 14,169,396 | | | | 3,183 | |
| | | | | | | | |
Panama—0.6% | | | | | | | | |
Copa Holdings S.A. (Airlines)† | | | 45,616 | | | | 3,763 | |
| | | | | | | | |
Total Common Stocks—95.7%
(cost $580,931) | | | | | | | 621,984 | |
| | | | | | | | |
| | |
Convertible Bond | | | | | | | | |
Brazil—0.0% | | | | | | | | |
Lupatech S.A., 6.500%, due 4/15/18 (Machinery)**§ | | $ | 959 | | | | 251 | |
| | | | | | | | |
Total Convertible Bond—0.0%
(cost $497) | | | | | | | 251 | |
| | | | | | | | |
| | |
Repurchase Agreement | | | | | | | | |
Fixed Income Clearing Corporation, 0.100% dated 6/29/12, due 7/2/12, repurchase price $26,085, collateralized by FNMA,
5.000%, due 4/15/15 | | $ | 26,085 | | | | 26,085 | |
| | | | | | | | |
Total Repurchase Agreement—4.0%
(cost $26,085) | | | | 26,085 | |
| | | | | | | | |
Total Investments—99.7%
(cost $607,513) | | | | 648,320 | |
Cash and other assets, less liabilities—0.3% | | | | 2,202 | |
| | | | | | | | |
Net assets—100.0% | | | $ | 650,522 | |
| | | | | | | | |
ADR = American Depository Receipt
GDR = Global Depository Receipt
* Non-income producing securities
† = U.S. listed foreign security
** = Fair valued pursuant to Valuation Procedures adopted by the Board of Trustees. This holding represents 0.04% of the Fund’s net assets at June 30, 2012.
§ = Deemed illiquid pursuant to Liquidity Procedures approved by the Board of Trustees. This holding represents 0.04% of the net assets at June 30, 2012.
For securities primarily traded on exchanges or markets that close before the close of regular trading on the New York Stock Exchange, the Fund may use an independent pricing service to fair value price the securities pursuant to Valuation Procedures approved by the Board of Trustees.
At June 30, 2012, the Fund’s Portfolio of Investments includes the following industry categories:
| | | | |
Consumer Discretionary | | | 24.8% | |
Information Technology | | | 15.2% | |
Industrials | | | 12.7% | |
Health Care | | | 12.5% | |
Financials | | | 11.7% | |
Consumer Staples | | | 11.0% | |
Energy | | | 6.1% | |
Materials | | | 4.5% | |
Telecommunication Services | | | 1.5% | |
| | | | |
Total | | | 100.0% | |
| | | | |
At June 30, 2012, the Fund’s Portfolio of Investments includes the following currency categories:
| | | | |
British Pound Sterling | | | 23.0% | |
Japanese Yen | | | 17.0% | |
Euro | | | 15.6% | |
Hong Kong Dollar | | | 9.9% | |
Canadian Dollar | | | 6.8% | |
South African Rand | | | 3.7% | |
Swedish Krona | | | 3.1% | |
Australian Dollar | | | 3.1% | |
Brazilian Real | | | 2.9% | |
Indian Rupee | | | 2.1% | |
Norwegian Krone | | | 2.0% | |
Indonesian Rupiah | | | 1.7% | |
Turkish Lira | | | 1.5% | |
Singapore Dollar | | | 1.5% | |
New Taiwan Dollar | | | 1.2% | |
Swiss Franc | | | 1.0% | |
All Other Currencies | | | 3.9% | |
| | | | |
Total | | | 100.0% | |
| | | | |
See accompanying Notes to Portfolio of Investments.
48 Semi-Annual Report | June 30, 2012 |

Todd M. McClone
Jeffrey A. Urbina
EMERGING MARKETS GROWTH FUND
The Emerging Markets Growth Fund seeks long-term capital appreciation.
AN OVERVIEW FROM THE PORTFOLIO MANAGERS
The Emerging Markets Growth Fund posted a 7.08% increase (Class N Shares) for the six months ended June 30, 2012. By comparison, the Fund’s benchmark, the MSCI Emerging Markets IMI Index (net), rose 4.31%.
Year-to-date, performance was strong. The Fund’s significant outperformance was driven by stock selection, coupled with the its focus on high quality companies with good growth prospects. In addition, the Fund’s industry positioning augmented performance during the period. Staples stock selection was strong, with good performance in Food/Staples Retailing and Food Products. In particular Magnit OJSC, the Russian grocery store chain was additive to results on strong same store sales, while CP ALL Public Company Limited, the Thai convenience store operator, also reported better than expected results on strong same store sales growth. BIM Birlesik Magazalar A.S., the hard discounter in Turkey, reported strong sales growth during the period. Financials stock selection was strong, supported by Turkiye Garanti Bankasi A.S., the Turkish bank specializing in lending. Somewhat detracting from performance was Information Technology (IT) stock selection, given weakness in HTC Corporation, the Taiwan smartphone producer, and Infosys Technologies Limited, the Indian IT and software company.
Consumer was reduced during the six month period to approximately 26% of the portfolio, with a tilt towards Staples, yet remained significantly overweighted versus the 17.5% Index weighting, given higher Autos, Media Retailing and Food/Staples Retailing weightings. This decrease funded a slight increase in Resources, although it remained significantly underweighted versus the 23.8% Index weighting, due primarily to the significant underweighting in Mining, given concerns about slowing infrastructure spending growth and the impact on commodity prices prospectively. Regionally, the portfolio’s positioning did not change significantly during the six month period and remained relatively similar to the Index, despite significant country weighting variances. Within Emerging Asia, the 8.2% India weighting and 4.4% weighting in Indonesia, was offset by lower Korean and Taiwanese exposure, while in Emerging Europe, Mid East, and Africa (EMEA), limited Eastern Europe and Russian exposure was offset by higher weightings in South Africa and Turkey. Emerging Latin America totaled 23.7% as of quarter end, above the 24.5% Index weighting given larger weights in Chile, Colombia and Peru, which offset lower Mexican exposure.
June 30, 2012 | William Blair Funds 49 |
Emerging Markets Growth Fund
Performance Highlights (Unaudited)
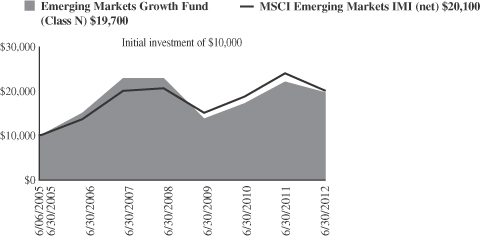
Average Annual Total Return at 6/30/2012
| | | | | | | | | | | | | | | | | | | | |
| | | Year
To Date | | | 1
Year | | | 3
Year | | | 5
Year | | | Since
Inception(a) | |
Class N | | | 7.08 | % | | | (10.81 | )% | | | 12.61 | % | | | (2.96 | )% | | | 10.07 | % |
Class I | | | 7.29 | | | | (10.45 | ) | | | 12.97 | | | | (2.70 | ) | | | 10.35 | |
MSCI Emerging Markets
IMI (net) | | | 4.31 | | | | (16.29 | ) | | | 9.97 | | | | (0.01 | ) | | | 10.34 | |
| | (a) | | For the period from June 6, 2005 (Commencement of Operations) to June 30, 2012. |
Performance cited represents past performance. Past performance does not guarantee future results and current performance may be lower or higher than the data quoted. Results shown are average annual returns, which assume reinvestment of dividends and capital gains. Investment returns and principal will fluctuate and you may have a gain or loss when you sell shares. For the most current month-end performance information, please call 1-800-742-7272, or visit our Web site at www.williamblairfunds.com. From time to time, the investment advisor may waive fees or reimburse expenses for the Fund. Without these waivers, performance would be lower. International investing involves special risk considerations, including currency fluctuations, lower liquidity, economic and political risk. Class N shares are available to the general public without a sales load. Class I shares are available to certain institutional investors and advisory clients of William Blair & Company L.L.C. without a sales load or distribution (12b-1) fees.
The performance highlights and graph presented above do not reflect the deduction of taxes that a shareholder would pay on fund distributions or the redemption of fund shares.
The Morgan Stanley Capital International (MSCI) Emerging Markets Investable Market Index (IMI) (net) is a free float-adjusted market capitalization weighted index that is designed to measure the equity market performance of emerging markets. This series approximates the minimum possible dividend reinvestment.
This report identifies the Fund’s investments on June 30, 2012. These holdings are subject to change. Not all stocks in the Fund performed the same, nor is there any guarantee that these stocks will perform as well in the future. Market forecasts provided in this report may not necessarily come to pass.
Sector Diversification (Unaudited)
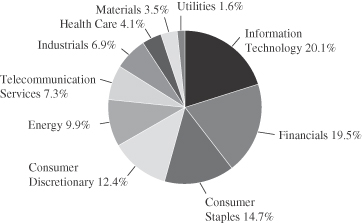
The sector diversification shown is based on the total long-term securities.
50 Semi-Annual Report | June 30, 2012 |
Emerging Markets Growth Fund
Portfolio of Investments, June 30, 2012 (all dollar amounts in thousands) (unaudited)
| | | | | | | | |
Issuer | | Shares | | | Value | |
| | |
Common Stocks | | | | | | | | |
| | |
Emerging Asia—53.7% | | | | | | | | |
China—19.4% | | | | | | | | |
AAC Technologies Holdings, Inc. (Communications equipment) | | | 1,157,959 | | | $ | 3,329 | |
*Baidu, Inc.—ADR (Internet software & services) | | | 151,291 | | | | 17,395 | |
Belle International Holdings, Ltd. (Specialty retail) | | | 2,638,610 | | | | 4,462 | |
China BlueChemical, Ltd. (Chemicals) | | | 4,060,609 | | | | 2,303 | |
China Mobile, Ltd. (Wireless telecommunication services) | | | 3,218,755 | | | | 35,163 | |
China Shenhua Energy Co., Ltd. (Oil, gas & consumable fuels) | | | 2,218,304 | | | | 7,735 | |
CNOOC, Ltd. (Oil, gas & consumable fuels) | | | 12,063,601 | | | | 23,947 | |
Comba Telecom Systems Holdings, Ltd. (Communications equipment) | | | 4,121,361 | | | | 1,711 | |
Dongfeng Motor Group Co., Ltd. (Automobiles) | | | 7,888,186 | | | | 12,100 | |
Dongyue Group (Chemicals) | | | 2,825,287 | | | | 1,307 | |
Golden Eagle Retail Group, Ltd. (Multiline retail) | | | 1,130,547 | | | | 2,294 | |
*Haier Electronics Group Co., Ltd. (Household durables) | | | 5,423,000 | | | | 6,459 | |
Haitian International Holdings, Ltd. (Machinery) | | | 2,617,870 | | | | 2,585 | |
Lenovo Group, Ltd. (Computers & peripherals) | | | 15,137,014 | | | | 12,761 | |
*NetEase, Inc.—ADR (Internet software & services) | | | 76,617 | | | | 4,509 | |
Ping An Insurance Group Co. of China, Ltd. Class “H” (Insurance) | | | 1,261,449 | | | | 10,032 | |
Spreadtrum Communications, Inc.—ADR (Semiconductors & semiconductor equipment) | | | 163,268 | | | | 2,882 | |
Sun Art Retail Group, Ltd. (Food & staples retailing) | | | 8,773,245 | | | | 9,601 | |
Tencent Holdings, Ltd. (Internet software & services) | | | 310,335 | | | | 9,040 | |
Want Want China Holdings, Ltd. (Food products) | | | 7,076,217 | | | | 8,665 | |
*WuXi PharmaTech Cayman, Inc.—ADR (Life sciences tools & services) | | | 162,514 | | | | 2,295 | |
Yingde Gases (Chemicals) | | | 2,319,981 | | | | 2,111 | |
*Youku.com, Inc.—ADR (Internet software & services) | | | 80,097 | | | | 1,736 | |
| | | | | | | | |
| | | | | | | 184,422 | |
| | | | | | | | |
India—8.2% | | | | | | | | |
Asian Paints, Ltd. (Chemicals) | | | 45,181 | | | | 3,147 | |
Bajaj Auto, Ltd. (Automobiles) | | | 168,227 | | | | 4,739 | |
HDFC Bank, Ltd. (Commercial banks) | | | 998,051 | | | | 10,073 | |
Housing Development Finance Corporation (Thrifts & mortgage finance) | | | 803,261 | | | | 9,397 | |
IndusInd Bank, Ltd. (Commercial banks) | | | 476,422 | | | | 2,903 | |
ITC, Ltd. (Tobacco) | | | 3,557,037 | | | | 16,494 | |
*Jubilant Foodworks, Ltd. (Hotels, restaurants & leisure) | | | 120,928 | | | | 2,532 | |
Lupin, Ltd. (Pharmaceuticals) | | | 234,955 | | | | 2,260 | |
Motherson Sumi Systems, Ltd. (Auto components) | | | 640,080 | | | | 1,874 | |
Nestle India, Ltd. (Food products) | | | 28,797 | | | | 2,341 | |
|
Common Stocks—Emerging Asia—53.7%—(continued) | |
India—(continued) | | | | | | | | |
Sun Pharmaceutical Industries, Ltd. (Pharmaceuticals) | | | 430,529 | | | $ | 4,903 | |
Tata Consultancy Services, Ltd. (IT services) | | | 370,963 | | | | 8,487 | |
Tata Motors, Ltd. (Automobiles) | | | 2,149,801 | | | | 9,335 | |
| | | | | | | | |
| | | | | | | 78,485 | |
| | | | | | | | |
Indonesia—4.4% | | | | | | | | |
PT Astra International Tbk (Automobiles) | | | 13,191,240 | | | | 9,620 | |
PT Bank Rakyat Indonesia (Commercial banks) | | | 17,979,821 | | | | 12,156 | |
PT Indo Tambangraya Megah (Oil, gas & consumable fuels) | | | 986,224 | | | | 3,775 | |
PT Jasa Marga Persero Tbk (Transportation infrastructure) | | | 2,980,500 | | | | 1,713 | |
PT Kalbe Farma Tbk (Pharmaceuticals) | | | 6,336,283 | | | | 2,547 | |
PT Perusahaan Perkebunan London Sumatra Indonesia Tbk (Food products) | | | 9,279,728 | | | | 2,643 | |
PT Unilever Indonesia Tbk (Household products) | | | 2,696,997 | | | | 6,576 | |
PT United Tractors Tbk (Machinery) | | | 1,036,273 | | | | 2,355 | |
| | | | | | | | |
| | | | | | | 41,385 | |
| | | | | | | | |
Malaysia—1.0% | | | | | | | | |
CIMB Group Holdings Bhd (Commercial banks) | | | 4,167,287 | | | | 9,934 | |
| | | | | | | | |
Papua New Guinea—1.0% | | | | | | | | |
Oil Search, Ltd. (Oil, gas & consumable fuels) | | | 1,471,402 | | | | 9,910 | |
| | | | | | | | |
Philippines—0.1% | | | | | | | | |
Alliance Global Group, Inc. (Industrial conglomerates) | | | 1,862,972 | | | | 510 | |
| | | | | | | | |
South Korea—8.2% | | | | | | | | |
Celltrion, Inc. (Pharmaceuticals) | | | 171,765 | | | | 4,544 | |
Hyundai Motor Co. (Automobiles) | | | 82,330 | | | | 16,713 | |
LG Household & Health Care, Ltd. (Household products) | | | 8,178 | | | | 4,405 | |
Samsung Electronics Co., Ltd. (Semiconductors & semiconductor equipment) | | | 31,001 | | | | 32,507 | |
Samsung Engineering Co., Ltd. (Construction & engineering) | | | 45,297 | | | | 7,099 | |
Samsung Fire & Marine Insurance Co., Ltd. (Insurance) | | | 38,338 | | | | 7,565 | |
Samsung Heavy Industries Co., Ltd. (Machinery) | | | 152,914 | | | | 4,980 | |
| | | | | | | | |
| | | | | | | 77,813 | |
| | | | | | | | |
Taiwan—6.4% | | | | | | | | |
Asustek Computer, Inc. (Computers & peripherals) | | | 1,218,000 | | | | 11,065 | |
Catcher Technology Co., Ltd. (Computers & peripherals) | | | 609,064 | | | | 4,046 | |
Hiwin Technologies Corporation (Machinery) | | | 260,742 | | | | 2,635 | |
Hon Hai Precision Industry Co., Ltd. (Electronic equipment, instruments & components) | | | 6,635,994 | | | | 19,851 | |
HTC Corporation (Communications equipment) | | | 499,800 | | | | 6,514 | |
MediaTek, Inc. (Semiconductors & semiconductor equipment) | | | 754,064 | | | | 6,888 | |
See accompanying Notes to Portfolio of Investments.
June 30, 2012 | William Blair Funds 51 |
Emerging Markets Growth Fund
Portfolio of Investments, June 30, 2012 (all dollar amounts in thousands) (unaudited)
| | | | | | | | |
Issuer | | Shares | | | Value | |
|
Common Stocks—Emerging Asia—53.7%—(continued) | |
Taiwan—(continued) | | | | | | | | |
Simplo Technology Co., Ltd. (Computers & peripherals) | | | 618,122 | | | $ | 4,209 | |
TPK Holding Co., Ltd. (Electronic equipment, instruments & components) | | | 442,979 | | | | 5,544 | |
TSRC Corporation (Chemicals) | | | 111,708 | | | | 274 | |
| | | | | | | | |
| | | | | | | 61,026 | |
| | | | | | | | |
Thailand—5.0% | | | | | | | | |
Advanced Info Service PCL (Wireless telecommunication services) | | | 2,656,362 | | | | 15,431 | |
BEC World PCL (Media) | | | 2,929,000 | | | | 4,657 | |
CP ALL PCL (Food & staples retailing) | | | 8,589,718 | | | | 9,601 | |
Kasikornbank PCL (Commercial banks) | | | 2,772,682 | | | | 14,405 | |
Siam Makro PCL (Food & staples retailing) | | | 304,532 | | | | 3,414 | |
| | | | | | | | |
| | | | | | | 47,508 | |
| | | | | | | | |
| | |
Emerging Latin America—21.8% | | | | | | | | |
Argentina—0.5% | | | | | | | | |
MercadoLibre, Inc. (Internet software & services) | | | 64,031 | | | | 4,853 | |
| | | | | | | | |
Brazil—10.2% | | | | | | | | |
BR Malls Participacoes S.A. (Real estate management & development) | | | 596,190 | | | | 6,827 | |
BR Properties S.A. (Real estate management & development) | | | 309,597 | | | | 3,653 | |
CETIP S.A.—Balcao Organizado de Ativos e Derivativos (Capital markets) | | | 153,548 | | | | 1,919 | |
Cia de Bebidas das Americas—ADR (Beverages) | | | 498,098 | | | | 19,092 | |
Cia de Concessoes Rodoviarias (Transportation infrastructure) | | | 652,489 | | | | 5,305 | |
Cia Hering (Specialty retail) | | | 229,116 | | | | 4,346 | |
Cielo S.A. (IT services) | | | 498,800 | | | | 14,672 | |
CPFL Energia S.A.—ADR (Electric utilities) | | | 274,394 | | | | 6,857 | |
Embraer S.A.—ADR (Aerospace & defense) | | | 358,522 | | | | 9,512 | |
Iochpe-Maxion S.A. (Machinery) | | | 188,500 | | | | 2,196 | |
Lojas Renner S.A. (Multiline retail) | | | 168,222 | | | | 4,720 | |
OdontoPrev S.A. (Health care providers & services) | | | 504,566 | | | | 2,562 | |
*OGX Petroleo e Gas Participacoes S.A. (Oil, gas & consumable fuels) | | | 811,289 | | | | 2,222 | |
Raia Drogasil S.A. (Food & staples retailing) | | | 246,545 | | | | 2,486 | |
Totvs S.A. (Software) | | | 124,732 | | | | 2,403 | |
Tractebel Energia S.A. (Independent power producers & energy traders) | | | 435,038 | | | | 8,047 | |
| | | | | | | | |
| | | | | | | 96,819 | |
| | | | | | | | |
Chile—3.4% | | | | | | | | |
Banco Santander Chile—ADR (Commercial banks) | | | 119,420 | | | | 9,254 | |
CFR Pharmaceuticals S.A. (Pharmaceuticals) | | | 10,378,475 | | | | 2,332 | |
ENTEL Chile S.A. (Wireless telecommunication services) | | | 349,425 | | | | 6,629 | |
S.A.C.I. Falabella (Multiline retail) | | | 768,693 | | | | 7,023 | |
Sociedad Quimica y Minera de Chile S.A.—ADR (Chemicals) | | | 82,591 | | | | 4,598 | |
Sonda S.A. (IT services) | | | 902,990 | | | | 2,537 | |
| | | | | | | | |
| | | | | | | 32,373 | |
| | | | | | | | |
|
Common Stocks—Emerging Latin
America—21.8%—(continued) | |
Colombia—2.3% | | | | | | | | |
Ecopetrol S.A. (Oil, gas & consumable fuels) | | | 5,554,705 | | | $ | 15,530 | |
Pacific Rubiales Energy Corporation (Oil, gas & consumable fuels) | | | 285,240 | | | | 6,041 | |
| | | | | | | | |
| | | | | | | 21,571 | |
| | | | | | | | |
Mexico—4.5% | | | | | | | | |
Coca-Cola Femsa S.A.B. de C.V.—ADR (Beverages) | | | 37,395 | | | | 4,894 | |
*Genomma Lab Internacional S.A.B. de C.V. (Pharmaceuticals) | | | 1,239,169 | | | | 2,448 | |
Grupo Financiero Banorte S.A.B. de C.V. (Commercial banks) | | | 3,187,010 | | | | 16,471 | |
Grupo Mexico S.A.B. de C.V. Series “B” (Metals & mining) | | | 6,411,812 | | | | 19,058 | |
| | | | | | | | |
| | | | | | | 42,871 | |
| | | | | | | | |
Peru—0.9% | | | | | | | | |
Credicorp, Ltd. (Commercial banks)† | | | 71,223 | | | | 8,966 | |
| | | | | | | | |
|
Emerging Europe, Mid-East, Africa—19.6% | |
Nigeria—0.3% | | | | | | | | |
Guaranty Trust Bank plc (Commercial banks) | | | 32,723,983 | | | | 3,016 | |
| | | | | | | | |
Poland—0.6% | | | | | | | | |
Eurocash S.A. (Food & staples retailing) | | | 466,227 | | | | 5,738 | |
| | | | | | | | |
Qatar—1.5% | | | | | | | | |
Industries Qatar QSC (Industrial conglomerates) | | | 412,537 | | | | 14,161 | |
| | | | | | | | |
Russia—2.7% | | | | | | | | |
*Etalon Group Ltd.—144A—GDR (Real estate management & development) | | | 473,600 | | | | 2,581 | |
Magnit OAO (Food & staples retailing)† | | | 120,783 | | | | 14,526 | |
*Mail.ru Group, Ltd.—GDR (Internet software & services) | | | 78,415 | | | | 2,658 | |
*Yandex N.V. Class “A” (Internet software & services)† | | | 328,102 | | | | 6,250 | |
| | | | | | | | |
| | | | | | | 26,015 | |
| | | | | | | | |
South Africa—10.5% | | | | | | | | |
*Aspen Pharmacare Holdings, Ltd. (Pharmaceuticals) | | | 319,257 | | | | 4,915 | |
AVI, Ltd. (Food products) | | | 771,245 | | | | 4,717 | |
Bidvest Group, Ltd. (Industrial conglomerates) | | | 457,034 | | | | 10,175 | |
FirstRand, Ltd. (Diversified financial services) | | | 4,552,014 | | | | 14,694 | |
Life Healthcare Group Holdings Pte, Ltd. (Health care providers & services) | | | 2,323,740 | | | | 8,849 | |
Mr Price Group, Ltd. (Specialty retail) | | | 188,991 | | | | 2,587 | |
MTN Group, Ltd. (Wireless telecommunication services) | | | 584,575 | | | | 10,077 | |
Naspers, Ltd. (Media) | | | 188,266 | | | | 10,018 | |
Sasol, Ltd. (Oil, gas & consumable fuels) | | | 407,706 | | | | 17,076 | |
Shoprite Holdings, Ltd. (Food & staples retailing) | | | 385,753 | | | | 7,110 | |
Tiger Brands, Ltd. (Food products) | | | 137,081 | | | | 4,108 | |
Truworths International, Ltd. (Specialty retail) | | | 472,654 | | | | 5,176 | |
| | | | | | | | |
| | | | | | | 99,502 | |
| | | | | | | | |
See accompanying Notes to Portfolio of Investments.
52 Semi-Annual Report | June 30, 2012 |
Emerging Markets Growth Fund
Portfolio of Investments, June 30, 2012 (all dollar amounts in thousands) (unaudited)
| | | | | | | | |
Issuer | | Shares or
Principal
Amount | | | Value | |
|
Common Stocks—Emerging Europe, Mid-East,
Africa—19.6%—(continued) | |
Turkey—4.0% | | | | | | | | |
Arcelik A.S. (Household durables) | | | 576,339 | | | $ | 2,913 | |
BIM Birlesik Magazalar A.S. (Food & staples retailing) | | | 220,658 | | | | 9,090 | |
Tofas Turk Otomobil Fabrikasi A.S. (Automobiles) | | | 718,901 | | | | 3,076 | |
Turkiye Halk Bankasi A.S. (Commercial banks) | | | 2,920,553 | | | | 22,851 | |
| | | | | | | | |
| | | | | | | 37,930 | |
| | | | | | | | |
Total Common Stocks—95.1%
(cost $858,643) | | | | | | | 904,808 | |
| | | | | | | | |
| | |
Preferred Stocks | | | | | | | | |
Brazil—2.0% | | | | | | | | |
Itau Unibanco Holding S.A. (Commercial banks) | | | 983,041 | | | | 13,846 | |
Petroleo Brasileiro S.A. (Oil, gas & consumable fuels) | | | 539,525 | | | | 4,902 | |
| | | | | | | | |
| | | | | | | 18,748 | |
| | | | | | | | |
Total Preferred Stocks—2.0%
(cost $19,749) | | | | | | | 18,748 | |
| | | | | | | | |
| | |
Convertible Bond | | | | | | | | |
Brazil—0.0% | | | | | | | | |
Lupatech S.A., 6.500%, due 4/15/18 (Machinery)**§ | | $ | 1,602 | | | | 419 | |
| | | | | | | | |
Total Convertible Bond—0.0%
(cost $831) | | | | | | | 419 | |
| | | | | | | | |
| | | | |
Total Investments—97.1%
(cost $879,223) | | | 923,975 | |
Cash and other assets, less liabilities—2.9% | | | 27,724 | |
| | | | |
Net assets—100.0% | | $ | 951,699 | |
| | | | |
ADR = American Depository Receipt
GDR = Global Depository Receipt
* Non-income producing securities
† = U.S. listed foreign security
** = Fair valued pursuant to Valuation Procedures adopted by the Board of Trustees. This holding represents 0.04% of the Fund’s net assets at June 30, 2012.
§ = Deemed illiquid pursuant to Liquidity Procedures approved by the Board of Trustees. This holding represents 0.04% of the net assets at June 30, 2012.
For securities primarily traded on exchanges or markets that close before the close of regular trading on the New York Stock Exchange, the Fund may use an independent pricing service to fair value price the securities pursuant to Valuation Procedures approved by the Board of Trustees.
At June 30, 2012, the Fund’s Portfolio of Investments includes the following industry categories:
| | | | |
Information Technology | | | 20.1% | |
Financials | | | 19.5% | |
Consumer Staples | | | 14.7% | |
Consumer Discretionary | | | 12.4% | |
Energy | | | 9.9% | |
Telecommunication Services | | | 7.3% | |
Industrials | | | 6.9% | |
Health Care | | | 4.1% | |
Materials | | | 3.5% | |
Utilities | | | 1.6% | |
| | | | |
Total | | | 100.0% | |
| | | | |
At June 30, 2012, the Fund’s Portfolio of Investments includes the following currency categories:
| | | | |
Hong Kong Dollar | | | 17.4% | |
U.S. Dollar | | | 12.5% | |
South African Rand | | | 10.8% | |
Brazilian Real | | | 8.7% | |
Indian Rupee | | | 8.5% | |
South Korean Won | | | 8.4% | |
New Taiwan Dollar | | | 6.6% | |
Thai Baht | | | 5.1% | |
Indonesian Rupiah | | | 4.5% | |
Mexican Peso | | | 4.1% | |
Turkish Lira | | | 4.1% | |
Chilean Peso | | | 2.0% | |
Colombian Peso | | | 1.7% | |
Qatari Rial | | | 1.5% | |
Malaysian Ringgit | | | 1.1% | |
Australian Dollar | | | 1.1% | |
All Other Currencies | | | 1.9% | |
| | | | |
Total | | | 100.0% | |
| | | | |
See accompanying Notes to Portfolio of Investments.
June 30, 2012 | William Blair Funds 53 |
Todd M. McClone
Jeffrey A. Urbina
EMERGING LEADERS GROWTH FUND
The Emerging Leaders Growth Fund seeks long-term capital appreciation.
AN OVERVIEW FROM THE PORTFOLIO MANAGERS
The Emerging Leaders Growth Fund posted a 6.90% increase (Class N Shares) for the six months ended June 30, 2012. By comparison, the Fund’s benchmark, the MSCI Emerging Markets Large Cap Index (net) rose 3.60% during the same period.
Year-to-date, performance was strong. The Fund’s significant outperformance was driven by stock selection, coupled with the Fund’s focus on high quality companies with good growth prospects. The overweighting in Staples along with good stock selection bolstered performance, as Magnit OJSC, the Russian grocery store chain, was additive to results on strong same store sales growth, while CP All, the Thai convenience store operator, also reported better than expected results on strong same store sales growth. Financials performance was bolstered by Banorte, which continued to generate strong results. Redecard, the Brazilian payment processing company, was up significantly on Itau Unibanco’s tender for outstanding shares. We sold the company as a result. Resources stock selection was also strong, driven by good performance in Oil/Gas and Metals/Mining holdings. Somewhat detracting from results was the Fund’s underperformance in IT and Industrials.
Consumer was reduced during the six month period to approximately 28% of the portfolio, with a tilt towards Staples, yet remained significantly overweighted versus the 14.7% Index weighting, given higher Autos, Retailing and Food/Staples Retailing weightings. This decrease funded a 2.5% increase in Resources, although it remained significantly underweighted versus the 26.7% Index weighting, due primarily to the significant underweighting in Mining, given concerns about slowing infrastructure spending growth and the impact on commodity prices prospectively. Regionally, the portfolio’s positioning did not change significantly during the three month period. EM Asia was slightly underweighted versus the Index as of June 30, due to lower Korean and Taiwanese exposure, which more than offset a 3% overweighting in India and slightly higher Chinese and Indonesian exposure. In EMEA, limited Eastern Europe and Russian exposure was offset by a 5% overweighting in South Africa. Latin America totaled 23.8% as of quarter end, above the 22.8% Index weighting given larger weights in Chile, Colombia and Peru, which offset lower Brazilian and Mexican exposure.
54 Semi-Annual Report | June 30, 2012 |
Emerging Leaders Growth Fund
Performance Highlights (Unaudited)
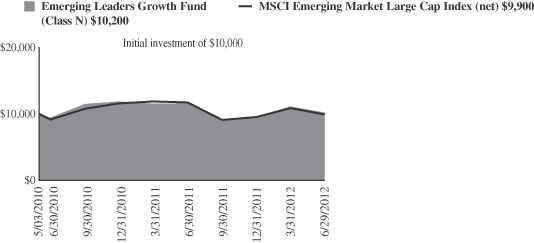
Average Annual Total Return at 6/30/2012
| | | | | | | | | | | | | | | | |
| | | Year
To Date | | | 1
Year | | | 3
Year | | | Since
Inception | |
Class N(a) | | | 6.90 | % | | | (11.87 | )% | | | N/A | | | | 0.85 | % |
MSCI Emerging Markets Large Cap Index (net)(a) | | | 3.60 | | | | (15.51 | ) | | | N/A | | | | (0.63 | ) |
Class I(b) | | | 6.92 | | | | (11.63 | ) | | | 11.93 | | | | (2.14 | ) |
MSCI Emerging Markets Large Cap Index (net)(b) | | | 3.60 | | | | (15.51 | ) | | | 9.62 | | | | (1.53 | ) |
| | (a) | | For the period from May 3, 2010 (Commencement of Operations) to June 30, 2012. | |
| | (b) | | For the period from March 26, 2008 (Commencement of Operations) to June 30, 2012. | |
Performance cited represents past performance. Past performance does not guarantee future results and current performance may be lower or higher than the data quoted. Results shown are average annual total returns, which assume reinvestment of dividends and capital gains. Investment returns and principal will fluctuate and you may have a gain or loss when you sell shares. For the most current month-end performance information, please call 1-800-742-7272, or visit our Web site at www.williamblairfunds.com. International investing involves special risk considerations, including currency fluctuations, lower liquidity, economic and political risk. From time to time, the investment advisor may waive fees or reimburse expenses for the Fund. Without these waivers, performance would be lower. Class N shares are available to the general public without a sales load. Class I shares are available to certain institutional investors and advisory clients of William Blair & Company, L.L.C., without a sales load or distribution (12b-1) fees.
The performance highlights and graph presented above do not reflect the deduction of taxes that a shareholder would pay on fund distributions or the redemption of fund shares.
The Morgan Stanley Capital International (MSCI) Emerging Markets Large Cap Index (net) is a free float-adjusted market capitalization weighted index that is designed to measure market performance of large capitalization stocks in emerging markets. This series approximates the minimum possible dividend reinvestment.
This report identifies the Fund’s investments on June 30, 2012. These holdings are subject to change. Not all stocks in the Fund performed the same, nor is there any guarantee that these stocks will perform as well in the future. Market forecasts provided in this report may not necessarily come to pass.
Sector Diversification (Unaudited)
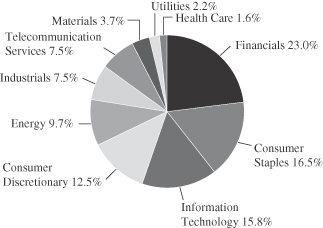
The sector diversification shown is based on the total long-term securities.
June 30, 2012 | William Blair Funds 55 |
Emerging Leaders Growth Fund
Portfolio of Investments, June 30, 2012 (all dollar amounts in thousands) (unaudited)
| | | | | | | | |
Issuer | | Shares | | | Value | |
| | |
Common Stocks | | | | | | | | |
| | |
Emerging Asia—55.9% | | | | | | | | |
China—20.0% | | | | | | | | |
*Baidu, Inc.—ADR (Internet software & services) | | | 8,786 | | | $ | 1,010 | |
Belle International Holdings, Ltd. (Specialty retail) | | | 244,000 | | | | 413 | |
China Mobile, Ltd. (Wireless telecommunication services) | | | 177,500 | | | | 1,939 | |
China Shenhua Energy Co., Ltd. (Oil, gas & consumable fuels) | | | 102,000 | | | | 356 | |
CNOOC, Ltd. (Oil, gas & consumable fuels) | | | 750,000 | | | | 1,489 | |
Dongfeng Motor Group Co., Ltd. (Automobiles) | | | 484,000 | | | | 742 | |
Lenovo Group, Ltd. (Computers & peripherals) | | | 836,000 | | | | 705 | |
*NetEase, Inc.—ADR (Internet software & services) | | | 3,908 | | | | 230 | |
Ping An Insurance Group Co. of China, Ltd. Class “H” (Insurance) | | | 73,000 | | | | 581 | |
Sun Art Retail Group, Ltd. (Food & staples retailing) | | | 514,000 | | | | 562 | |
Tencent Holdings, Ltd. (Internet software & services) | | | 18,700 | | | | 545 | |
Want Want China Holdings, Ltd. (Food products) | | | 327,000 | | | | 400 | |
| | | | | | | | |
| | | | | | | 8,972 | |
| | | | | | | | |
India—10.1% | | | | | | | | |
Bajaj Auto, Ltd. (Automobiles) | | | 15,682 | | | | 442 | |
HDFC Bank, Ltd. (Commercial banks) | | | 67,729 | | | | 684 | |
Housing Development Finance Corporation (Thrifts & mortgage finance) | | | 42,550 | | | | 498 | |
ITC, Ltd. (Tobacco) | | | 165,531 | | | | 767 | |
Nestle India, Ltd. (Food products) | | | 2,736 | | | | 222 | |
Sun Pharmaceutical Industries, Ltd. (Pharmaceuticals) | | | 63,475 | | | | 723 | |
Tata Consultancy Services, Ltd. (IT services) | | | 22,902 | | | | 524 | |
Tata Motors, Ltd. (Automobiles) | | | 161,854 | | | | 703 | |
| | | | | | | | |
| | | | | | | 4,563 | |
| | | | | | | | |
Indonesia—5.5% | | | | | | | | |
PT Astra International Tbk (Automobiles) | | | 1,225,500 | | | | 894 | |
PT Bank Rakyat Indonesia (Commercial banks) | | | 1,153,000 | | | | 779 | |
PT Unilever Indonesia Tbk (Household products) | | | 232,000 | | | | 566 | |
PT United Tractors Tbk (Machinery) | | | 108,500 | | | | 247 | |
| | | | | | | | |
| | | | | | | 2,486 | |
| | | | | | | | |
Malaysia—1.8% | | | | | | | | |
CIMB Group Holdings Bhd (Commercial banks) | | | 330,200 | | | | 787 | |
| | | | | | | | |
South Korea—8.8% | | | | | | | | |
Hyundai Motor Co. (Automobiles) | | | 4,437 | | | | 901 | |
LG Household & Health Care, Ltd. (Household products) | | | 1,063 | | | | 572 | |
Samsung Electronics Co., Ltd. (Semiconductors & semiconductor equipment) | | | 1,769 | | | | 1,855 | |
Samsung Engineering Co., Ltd. (Construction & engineering) | | | 4,091 | | | | 641 | |
| | | | | | | | |
| | | | | | | 3,969 | |
| | | | | | | | |
|
Common Stocks—Emerging Asia—55.9%—(continued) | |
Taiwan—3.4% | | | | | | | | |
Asustek Computer, Inc. (Computers & peripherals) | | | 41,000 | | | $ | 372 | |
Hon Hai Precision Industry Co., Ltd. (Electronic equipment, instruments & components) | | | 380,700 | | | | 1,139 | |
| | | | | | | | |
| | | | | | | 1,511 | |
| | | | | | | | |
Thailand—6.3% | | | | | | | | |
Advanced Info Service PCL (Wireless telecommunication services) | | | 164,800 | | | | 957 | |
CP ALL PCL (Food & staples retailing) | | | 965,700 | | | | 1,080 | |
Kasikornbank PCL (Commercial banks) | | | 155,800 | | | | 809 | |
| | | | | | | | |
| | | | | | | 2,846 | |
| | | | | | | | |
| | |
Emerging Latin America—21.8% | | | | | | | | |
Brazil—9.9% | | | | | | | | |
BR Malls Participacoes S.A. (Real estate management & development) | | | 63,300 | | | | 725 | |
Cia de Bebidas das Americas—ADR (Beverages) | | | 28,876 | | | | 1,107 | |
Cia de Concessoes Rodoviarias (Transportation infrastructure) | | | 63,100 | | | | 513 | |
Cielo S.A. (IT services) | | | 23,300 | | | | 685 | |
CPFL Energia S.A.—ADR (Electric utilities) | | | 16,614 | | | | 415 | |
Embraer S.A.—ADR (Aerospace & defense) | | | 15,600 | | | | 414 | |
Tractebel Energia S.A. (Independent power producers & energy traders) | | | 31,400 | | | | 581 | |
| | | | | | | | |
| | | | | | | 4,440 | |
| | | | | | | | |
Chile—3.7% | | | | | | | | |
Banco Santander Chile—ADR (Commercial banks) | | | 10,225 | | | | 792 | |
S.A.C.I. Falabella (Multiline retail) | | | 52,314 | | | | 478 | |
Sociedad Quimica y Minera de Chile S.A.—ADR (Chemicals) | | | 7,336 | | | | 409 | |
| | | | | | | | |
| | | | | | | 1,679 | |
| | | | | | | | |
Colombia—2.5% | | | | | | | | |
Ecopetrol S.A. (Oil, gas & consumable fuels) | | | 394,565 | | | | 1,103 | |
| | | | | | | | |
Mexico—4.9% | | | | | | | | |
Grupo Financiero Banorte S.A.B. de C.V. (Commercial banks) | | | 184,600 | | | | 954 | |
Grupo Mexico S.A.B. de C.V. Series “B” (Metals & mining) | | | 420,200 | | | | 1,249 | |
| | | | | | | | |
| | | | | | | 2,203 | |
| | | | | | | | |
Peru—0.8% | | | | | | | | |
Credicorp, Ltd. (Commercial banks)† | | | 3,045 | | | | 383 | |
| | | | | | | | |
| | |
Emerging Europe, Mid-East, Africa—19.6% | | | | | | | | |
Qatar—1.9% | | | | | | | | |
Industries Qatar QSC (Industrial conglomerates) | | | 24,491 | | | | 841 | |
| | | | | | | | |
Russia—3.6% | | | | | | | | |
Magnit OAO (Food & staples retailing)† | | | 924 | | | | 111 | |
* Magnit OJSC—144A—GDR (Food & staples retailing)† | | | 21,877 | | | | 658 | |
Sberbank of Russian Federation (Commercial banks)† | | | 316,195 | | | | 844 | |
| | | | | | | | |
| | | | | | | 1,613 | |
| | | | | | | | |
See accompanying Notes to Portfolio of Investments.
56 Semi-Annual Report | June 30, 2012 |
Emerging Leaders Growth Fund
Portfolio of Investments, June 30, 2012 (all dollar amounts in thousands) (unaudited)
| | | | | | | | |
Issuer | | Shares | | | Value | |
|
Common Stocks—Emerging Europe, Mid-East,
Africa—19.6%—(continued) | |
South Africa—12.3% | | | | | | | | |
Bidvest Group, Ltd. (Industrial conglomerates) | | | 31,864 | | | $ | 709 | |
FirstRand, Ltd. (Diversified financial services) | | | 283,763 | | | | 916 | |
MTN Group, Ltd. (Wireless telecommunication services) | | | 27,421 | | | | 473 | |
Naspers, Ltd. (Media) | | | 9,621 | | | | 512 | |
Sasol, Ltd. (Oil, gas & consumable fuels) | | | 25,709 | | | | 1,077 | |
Shoprite Holdings, Ltd. (Food & staples retailing) | | | 48,720 | | | | 898 | |
Tiger Brands, Ltd. (Food products) | | | 14,106 | | | | 423 | |
Truworths International, Ltd. (Specialty retail) | | | 47,800 | | | | 523 | |
| | | | | | | | |
| | | | | | | 5,531 | |
| | | | | | | | |
Turkey—1.8% | | | | | | | | |
Turkiye Garanti Bankasi A.S. (Commercial banks) | | | 210,924 | | | | 828 | |
| | | | | | | | |
Total Common Stocks—97.3%
(cost $41,454) | | | | 43,755 | |
| | | | | | | | |
| | |
Preferred Stocks | | | | | | | | |
Brazil—2.1% | | | | | | | | |
Itau Unibanco Holding S.A. (Commercial banks) | | | 45,600 | | | | 642 | |
Petroleo Brasileiro S.A. (Oil, gas & consumable fuels) | | | 32,055 | | | | 291 | |
| | | | | | | | |
| | | | | | | 933 | |
| | | | | | | | |
Total Preferred Stocks—2.1%
(cost $986) | | | | 933 | |
| | | | | | | | |
Total Investments—99.4%
(cost $42,440) | | | | 44,688 | |
Cash and other assets, less liabilities—0.6% | | | | 278 | |
| | | | | | | | |
Net assets—100.0% | | | $ | 44,966 | |
| | | | | | | | |
ADR = American Depository Receipt
GDR = Global Depository Receipt
* Non-income producing securities
† = U.S. listed foreign security
For securities primarily traded on exchanges or markets that close before the close of regular trading on the New York Stock Exchange, the Fund may use an independent pricing service to fair value price the securities pursuant to Valuation Procedures approved by the Board of Trustees.
At June 30, 2012, the Fund’s Portfolio of Investments includes the following industry categories:
| | | | |
Financials | | | 23.0% | |
Consumer Staples | | | 16.5% | |
Information Technology | | | 15.8% | |
Consumer Discretionary | | | 12.5% | |
Energy | | | 9.7% | |
Telecommunication Services | | | 7.5% | |
Industrials | | | 7.5% | |
Materials | | | 3.7% | |
Utilities | | | 2.2% | |
Health Care | | | 1.6% | |
| | | | |
Total | | | 100.0% | |
| | | | |
At June 30, 2012, the Fund’s Portfolio of Investments includes the following currency categories:
| | | | |
Hong Kong Dollar | | | 17.3% | |
U.S. Dollar | | | 14.2% | |
South African Rand | | | 12.4% | |
Indian Rupee | | | 10.2% | |
South Korean Won | | | 8.9% | |
Brazilian Real | | | 7.7% | |
Thai Baht | | | 6.4% | |
Indonesian Rupiah | | | 5.6% | |
Mexican Peso | | | 4.9% | |
New Taiwan Dollar | | | 3.4% | |
Colombian Peso | | | 2.5% | |
Qatari Rial | | | 1.9% | |
Turkish Lira | | | 1.8% | |
Malaysian Ringgit | | | 1.7% | |
Chilean Peso | | | 1.1% | |
| | | | |
Total | | | 100.0% | |
| | | | |
See accompanying Notes to Portfolio of Investments.
June 30, 2012 | William Blair Funds 57 |
Todd M. McClone
Jeffrey A. Urbina
EMERGING MARKETS SMALL CAP GROWTH FUND
The Emerging Markets Small Cap Growth Fund seeks long-term capital appreciation.
AN OVERVIEW FROM THE PORTFOLIO MANAGERS
The Emerging Markets Small Cap Growth Fund posted a 14.29% increase (Class N Shares) for the six months ended June 30, 2012. By comparison, the Fund’s benchmark the MSCI Emerging Markets Small Cap Index, rose 7.27% during the same period.
Year-to-date, performance was strong. Consumer and Industrials stock selection was strong. Within Discretionary, all industries performed well, with particular value added in Household Durables and Hotels/Restaurants/Leisure, more than offsetting weakness in Auto Components as demand slowed. Staples performance approximated 30% during the period, well ahead of the 9.78% Index return, as overweighed Food/Staples Retailing holdings performed well. In particular, the Turkish hard discount store, BIM Birlesik Magazalar, reported strong sales growth during the period. The Fund’s Industrials holdings surpassed the Index by 4x during the period, as Machinery and Transportation Infrastructure holdings performed well, and as the Fund lacked Construction/Engineering names, which underperformed the market as a whole. Somewhat mitigating these positive results was Financials, Information Technology (IT) and Materials stock selection. Financials was hampered by real estate performance, while underperformance in Internet Software/Services and Chemicals hurt IT and Materials results, respectively.
Overall sector positioning did not change substantially during the first half of 2012, with Consumer comprising a significant 42.1% of the portfolio, well ahead of the 26.1% Index weighting, with a significant tilt towards Retailing. Financials and Industrials increased 2% and 3%, respectively, which was funded by a decrease in the already underweighted IT and Resources sectors during the period. As of quarter end, IT represented 6.5% of the Fund, well below the 15.4% Index weighting, while Energy approximated 1% and Materials was just shy of 2%, compared to the 12.6% Index weighting. While overall regional positioning did not change substantially, Emerging Asia remained significantly underweighted at 57.7% of the portfolio, well below the 74.6% Index weighting. This underweighting was precipitated by limited exposure in Korea and Taiwan and 6% less invested in China, which more than offset higher Indonesian, Philippines and Thai weightings. Conversely, Latin America remained significantly overweighted versus the Index, given the Fund’s 15.9% Brazilian exposure, well ahead of the 6.3% Index weighting and larger weightings in Mexico, Panama, and Chile.
58 Semi-Annual Report | June 30, 2012 |
Emerging Markets Small Cap Growth Fund
Performance Highlights (Unaudited)
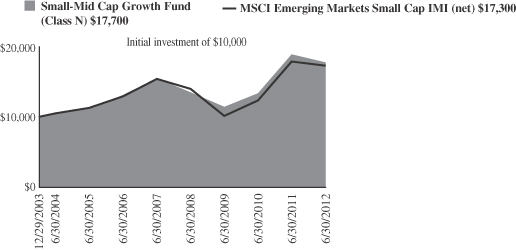
Average Annual Total Return at 6/30/2012
| | | | | | | | |
| | | Year
To Date | | | Since
Inception(a) | |
Class N | | | 14.29 | % | | | 11.20 | % |
Class I | | | 14.49 | | | | 11.40 | |
MSCI Emerging Markets Small Cap IMI (net) | | | 7.27 | | | | 0.49 | |
| | (a) | | For the period from October 24, 2011 (Commencement of Operations) to June 30, 2012. |
Performance cited represents past performance. Past performance does not guarantee future results and current performance may be lower or higher than the data quoted. Results shown are average annual returns, which assume reinvestment of dividends and capital gains. Investment returns and principal will fluctuate and you may have a gain or loss when you sell shares. For the most current month-end performance information, please call 1-800-742-7272, or visit our Web site at www.williamblairfunds.com. From time to time, the investment advisor may waive fees or reimburse expenses for the Fund. Without these waivers, performance would be lower. International investing involves special risk considerations, including currency fluctuations, lower liquidity, economic and political risk. Class N shares are available to the general public without a sales load. Class I shares are available to certain institutional investors and advisory clients of William Blair & Company L.L.C. without a sales load or distribution (12b-1) fees.
The performance highlights and graph presented above do not reflect the deduction of taxes that a shareholder would pay on fund distributions or the redemption of fund shares.
The Morgan Stanley Capital International (MSCI) Emerging Markets Small Cap Index IMI (net) is a free float-adjusted market capitalization weighted index that is designed to measure the equity market performance of emerging markets. This series approximates the minimum possible dividend reinvestment.
This report identifies the Fund’s investments on June 30, 2012. These holdings are subject to change. Not all stocks in the Fund performed the same, nor is there any guarantee that these stocks will perform as well in the future. Market forecasts provided in this report may not necessarily come to pass.
Sector Diversification (Unaudited)
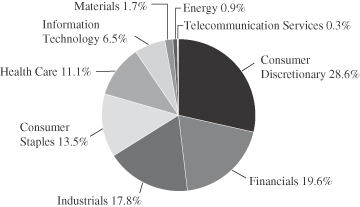
The sector diversification shown is based on the total long-term securities.
June 30, 2012 | William Blair Funds 59 |
Emerging Markets Small Cap Growth Fund
Portfolio of Investments, June 30, 2012 (all dollar amounts in thousands) (unaudited)
| | | | | | | | |
Issuer | | Shares | | | Value | |
| | |
Common Stocks | | | | | | | | |
| | |
Emerging Asia—56.0% | | | | | | | | |
Cambodia—0.8% | | | | | | | | |
NagaCorp, Ltd. (Hotels, restaurants & leisure) | | | 124,000 | | | $ | 55 | |
| | | | | | | | |
China—9.0% | | | | | | | | |
*3SBio, Inc.—ADR (Biotechnology) | | | 2,550 | | | | 35 | |
AAC Technologies Holdings, Inc. (Communications equipment) | | | 36,000 | | | | 104 | |
China Overseas Grand Oceans Group, Ltd. (Real estate management & development) | | | 52,000 | | | | 46 | |
Dongyue Group (Chemicals) | | | 31,000 | | | | 14 | |
Golden Eagle Retail Group, Ltd. (Multiline retail) | | | 34,000 | | | | 69 | |
*Haier Electronics Group Co., Ltd. (Household durables) | | | 60,000 | | | | 71 | |
Haitian International Holdings, Ltd. (Machinery) | | | 73,000 | | | | 72 | |
Hengdeli Holdings, Ltd. (Specialty retail) | | | 116,000 | | | | 37 | |
*Hollysys Automation Technologies, Ltd. (Electronic equipment, instruments & components)† | | | 3,643 | | | | 31 | |
Minth Group, Ltd. (Auto components) | | | 66,000 | | | | 71 | |
*WuXi PharmaTech Cayman, Inc.—ADR (Life sciences tools & services) | | | 2,413 | | | | 34 | |
Yingde Gases (Chemicals) | | | 23,500 | | | | 21 | |
| | | | | | | | |
| | | | | | | 605 | |
| | | | | | | | |
India—8.3% | | | | | | | | |
Bata India, Ltd. (Textiles, apparel & luxury goods) | | | 2,849 | | | | 44 | |
CRISIL, Ltd. (Diversified financial services) | | | 1,742 | | | | 33 | |
Eicher Motors, Ltd. (Machinery) | | | 1,072 | | | | 38 | |
GlaxoSmithKline Consumer Healthcare, Ltd. (Food products) | | | 1,252 | | | | 62 | |
Gruh Finance, Ltd. (Thrifts & mortgage finance) | | | 2,556 | | | | 33 | |
Havells India, Ltd. (Electrical equipment) | | | 2,755 | | | | 29 | |
IndusInd Bank, Ltd. (Commercial banks) | | | 8,782 | | | | 54 | |
Ipca Laboratories, Ltd. (Pharmaceuticals) | | | 3,876 | | | | 25 | |
*Jubilant Foodworks, Ltd. (Hotels, restaurants & leisure) | | | 2,236 | | | | 47 | |
Lupin, Ltd. (Pharmaceuticals) | | | 6,137 | | | | 59 | |
Oberoi Realty, Ltd. (Real estate management & development) | | | 4,473 | | | | 19 | |
Page Industries, Ltd. (Textiles, apparel & luxury goods) | | | 757 | | | | 39 | |
Pidilite Industries, Ltd. (Chemicals) | | | 10,383 | | | | 31 | |
Yes Bank, Ltd. (Commercial banks) | | | 6,728 | | | | 41 | |
| | | | | | | | |
| | | | | | | 554 | |
| | | | | | | | |
Indonesia—10.1% | | | | | | | | |
PT Ace Hardware Indonesia Tbk (Specialty retail) | | | 158,500 | | | | 85 | |
PT Alam Sutera Realty Tbk (Real estate management & development) | | | 807,500 | | | | 42 | |
*PT Bank Tabungan Pensiunan Nasional Tbk (Commercial banks) | | | 108,000 | | | | 46 | |
PT Ciputra Development Tbk (Real estate management & development) | | | 619,000 | | | | 43 | |
PT Hexindo Adiperkasa Tbk (Trading companies & distributors) | | | 38,500 | | | | 37 | |
PT Indomobil Sukses Internasional Tbk (Specialty retail) | | | 42,000 | | | | 32 | |
PT Jasa Marga (Transportation infrastructure) | | | 147,500 | | | | 85 | |
PT Kalbe Farma Tbk (Pharmaceuticals) | | | 184,500 | | | | 74 | |
PT Media Nusantara Citra Tbk (Media) | | | 387,500 | | | | 82 | |
Issuer | | Shares | | | Value | |
|
Common Stocks—Emerging Asia—56.0% (continued) | |
| | |
Indonesia—(continued) | | | | | | | | |
PT Mitra Adiperkasa Tbk (Multiline retail) | | | 114,000 | | | $ | 87 | |
*PT MNC Sky Vision Tbk (Media) | | | 104,000 | | | | 17 | |
PT Perusahaan Perkebunan London Sumatra Indonesia Tbk (Food products) | | | 85,000 | | | | 24 | |
*PT Sumber Alfaria Trijaya Tbk (Food & staples retailing) | | | 43,500 | | | | 22 | |
| | | | | | | | |
| | | | | | | 676 | |
| | | | | | | | |
Malaysia—4.6% | | | | | | | | |
Aeon Co. M Bhd (Multiline retail) | | | 13,500 | | | | 39 | |
AirAsia BHD (Airlines) | | | 32,700 | | | | 37 | |
Dayang Enterprise Holdings Bhd (Energy equipment & services) | | | 46,800 | | | | 28 | |
Guinness Anchor Bhd (Beverages) | | | 18,300 | | | | 77 | |
KPJ Healthcare Bhd (Health care providers & services) | | | 47,800 | | | | 88 | |
Nestle Malaysia Bhd (Food products) | | | 2,300 | | | | 42 | |
| | | | | | | | |
| | | | | | | 311 | |
| | | | | | | | |
Philippines—8.6% | | | | | | | | |
Alliance Global Group, Inc. (Industrial conglomerates) | | | 290,100 | | | | 79 | |
International Container Terminal Services, Inc. (Transportation infrastructure) | | | 51,970 | | | | 91 | |
Puregold Price Club, Inc. (Food & staples retailing) | | | 178,700 | | | | 115 | |
Security Bank Corporation (Commercial banks) | | | 36,240 | | | | 122 | |
SM Prime Holdings, Inc. (Real estate management & development) | | | 269,175 | | | | 83 | |
Universal Robina Corporation (Food products) | | | 56,600 | | | | 85 | |
| | | | | | | | |
| | | | | | | 575 | |
| | | | | | | | |
South Korea—1.0% | | | | | | | | |
Halla Climate Control Corporation (Auto components) | | | 1,890 | | | | 40 | |
Handsome Co., Ltd. (Textiles, apparel & luxury goods) | | | 570 | | | | 13 | |
LG Fashion Corporation (Textiles, apparel & luxury goods) | | | 480 | | | | 12 | |
| | | | | | | | |
| | | | | | | 65 | |
| | | | | | | | |
Taiwan—4.4% | | | | | | | | |
Catcher Technology Co., Ltd. (Computers & peripherals) | | | 8,000 | | | | 53 | |
Chroma ATE, Inc. (Electronic equipment, instruments & components) | | | 10,000 | | | | 23 | |
Hiwin Technologies Corporation (Machinery) | | | 9,000 | | | | 91 | |
PChome Online, Inc. (Internet software & services) | | | 2,000 | | | | 11 | |
Simplo Technology Co., Ltd. (Computers & peripherals) | | | 4,000 | | | | 27 | |
St Shine Optical Co., Ltd. (Health care equipment & supplies) | | | 4,000 | | | | 44 | |
TSRC Corporation (Chemicals) | | | 19,000 | | | | 47 | |
| | | | | | | | |
| | | | | | | 296 | |
| | | | | | | | |
Thailand—9.2% | | | | | | | | |
Bangkok Dusit Medical Services PCL (Health care providers & services) | | | 32,300 | | | | 99 | |
BEC World PCL (Media) | | | 38,000 | | | | 60 | |
Dynasty Ceramic PCL (Building products) | | | 16,700 | | | | 27 | |
Home Product Center PCL (Specialty retail) | | | 211,400 | | | | 84 | |
See accompanying Notes to Portfolio of Investments.
60 Semi-Annual Report | June 30, 2012 |
Emerging Markets Small Cap Growth Fund
Portfolio of Investments, June 30, 2012 (all dollar amounts in thousands) (unaudited)
| | | | | | | | |
Issuer | | Shares | | | Value | |
|
Common Stocks—Emerging Asia—56.0%—(continued) | |
Thailand—(continued) | | | | | | | | |
LPN Development PCL (Real estate management & development) | | | 81,100 | | | $ | 44 | |
Major Cineplex Group PCL (Media) | | | 33,600 | | | | 18 | |
Minor International PCL (Hotels, restaurants & leisure) | | | 165,710 | | | | 73 | |
Robinson Department Store PCL (Multiline retail) | | | 50,100 | | | | 98 | |
Siam Makro PCL (Food & staples retailing) | | | 6,750 | | | | 76 | |
Tisco Financial Group PCL (Commercial banks) | | | 27,400 | | | | 33 | |
| | | | | | | | |
| | | | | | | 612 | |
| | | | | | | | |
| | |
Emerging Latin America—24.8% | | | | | | | | |
Argentina—0.8% | | | | | | | | |
MercadoLibre, Inc. (Internet software & services) | | | 676 | | | | 51 | |
| | | | | | | | |
Brazil—15.9% | | | | | | | | |
Amil Participacoes S.A. (Health care providers & services) | | | 4,600 | | | | 46 | |
Arezzo Industria e Comercio S.A. (Textiles, apparel & luxury goods) | | | 2,200 | | | | 33 | |
BR Properties S.A. (Real estate management & development) | | | 7,800 | | | | 92 | |
CETIP S.A.—Balcao Organizado de Ativos e Derivativos (Capital markets) | | | 3,503 | | | | 44 | |
Cia Hering (Specialty retail) | | | 3,200 | | | | 61 | |
EcoRodovias Infraestrutura e Logistica S.A. (Transportation infrastructure) | | | 6,700 | | | | 54 | |
Ez Tec Empreendimentos e Participacoes S.A. (Household durables) | | | 4,600 | | | | 47 | |
Iochpe-Maxion S.A. (Machinery) | | | 2,500 | | | | 29 | |
Localiza Rent a Car S.A. (Road & rail) | | | 3,600 | | | | 54 | |
Lojas Renner S.A. (Multiline retail) | | | 1,500 | | | | 42 | |
Mills Estruturas e Servicos de Engenharia S.A. (Trading companies & distributors) | | | 6,658 | | | | 92 | |
OdontoPrev S.A. (Health care providers & services) | | | 14,800 | | | | 75 | |
*Qualicorp S.A. (Professional services) | | | 6,400 | | | | 56 | |
Raia Drogasil S.A. (Food & staples retailing) | | | 9,500 | | | | 96 | |
Restoque Comercio e Confeccoes de Roupas S.A. (Textiles, apparel & luxury goods) | | | 11,300 | | | | 58 | |
T4F Entretenimento S.A. (Media) | | | 1,500 | | | | 12 | |
Tegma Gestao Logistica S.A. (Road & rail) | | | 3,300 | | | | 50 | |
Totvs S.A. (Software) | | | 2,400 | | | | 46 | |
Valid Solucoes e Servicos de Seguranca em Meios de Pagamento e Identificacao S.A (Commercial services & supplies) | | | 5,400 | | | | 81 | |
| | | | | | | | |
| | | | | | | 1,068 | |
| | | | | | | | |
Chile—2.0% | | | | | | | | |
ENTEL Chile S.A. (Wireless telecommunication services) | | | 1,074 | | | | 20 | |
Parque Arauco S.A. (Real estate management & development) | | | 24,252 | | | | 43 | |
Sonda S.A. (IT services) | | | 26,488 | | | | 75 | |
| | | | | | | | |
| | | | | | | 138 | |
| | | | | | | | |
Mexico—3.8% | | | | | | | | |
*Alsea S.A.B. de C.V. (Hotels, restaurants & leisure) | | | 58,501 | | | | 79 | |
Banregio Grupo Financiero S.A.B. de C.V. (Commercial banks) | | | 31,900 | | | | 93 | |
Issuer | | Shares | | | Value | |
|
Common Stocks—Emerging Latin
America—24.8%—(continued) | |
Mexico—(continued) | | | | | | | | |
Fibra Uno Administracion S.A. de C.V. (Real estate investment trusts (REITs)) | | | 40,600 | | | $ | 83 | |
| | | | | | | | |
| | | | | | | 255 | |
| | | | | | | | |
Panama—1.5% | | | | | | | | |
Copa Holdings S.A. (Airlines)† | | | 1,228 | | | | 101 | |
| | | | | | | | |
Peru—0.8% | | | | | | | | |
Intercorp Financial Services, Inc. (Diversified financial services) | | | 1,695 | | | | 52 | |
| | | | | | | | |
| | |
Emerging Europe, Mid-East, Africa—15.3% | | | | | | | | |
Nigeria—0.7% | | | | | | | | |
Guaranty Trust Bank plc (Commercial banks) | | | 487,393 | | | | 45 | |
| | | | | | | | |
Poland—2.3% | | | | | | | | |
Eurocash S.A. (Food & staples retailing) | | | 6,573 | | | | 81 | |
LPP S.A. (Textiles, apparel & luxury goods) | | | 39 | | | | 38 | |
Lubelski Wegiel Bogdanka S.A. (Oil, gas & consumable fuels) | | | 870 | | | | 32 | |
| | | | | | | | |
| | | | | | | 151 | |
| | | | | | | | |
Russia—0.9% | | | | | | | | |
*Etalon Group Ltd.—144A—GDR (Real estate management & development) | | | 6,890 | | | | 38 | |
M Video OJSC (Specialty retail) | | | 3,410 | | | | 23 | |
| | | | | | | | |
| | | | | | | 61 | |
| | | | | | | | |
South Africa—8.4% | | | | | | | | |
AVI, Ltd. (Food products) | | | 13,793 | | | | 84 | |
Capitec Bank Holdings, Ltd. (Commercial banks) | | | 2,773 | | | | 72 | |
Cipla Medpro South Africa, Ltd. (Pharmaceuticals) | | | 41,060 | | | | 37 | |
Coronation Fund Managers, Ltd. (Capital markets) | | | 12,747 | | | | 43 | |
Life Healthcare Group Holdings Pte, Ltd. (Health care providers & services) | | | 26,707 | | | | 102 | |
Mr Price Group, Ltd. (Specialty retail) | | | 7,584 | | | | 104 | |
The Foschini Group, Ltd. (Specialty retail) | | | 4,657 | | | | 73 | |
Truworths International, Ltd. (Specialty retail) | | | 4,688 | | | | 51 | |
| | | | | | | | |
| | | | | | | 566 | |
| | | | | | | | |
Turkey—3.0% | | | | | | | | |
Arcelik A.S. (Household durables) | | | 6,825 | | | | 35 | |
BIM Birlesik Magazalar A.S. (Food & staples retailing) | | | 2,761 | | | | 114 | |
Tofas Turk Otomobil Fabrikasi A.S. (Automobiles) | | | 5,469 | | | | 23 | |
Turkiye Sinai Kalkinma Bankasi A.S. (Commercial banks) | | | 28,686 | | | | 29 | |
| | | | | | | | |
| | | | | | | 201 | |
| | | | | | | | |
Total Common Stocks—96.1%
(cost $5,983) | | | | 6,438 | |
| | | | | | | | |
See accompanying Notes to Portfolio of Investments.
June 30, 2012 | William Blair Funds 61 |
Emerging Markets Small Cap Growth Fund
Portfolio of Investments, June 30, 2012 (all dollar amounts in thousands) (unaudited)
| | | | | | | | |
Issuer | | Shares | | | Value | |
| | |
Preferred Stock | | | | | | | | |
Brazil—0.8% | | | | | | | | |
Marcopolo S.A. (Machinery) | | | 12,400 | | | $ | 56 | |
| | | | | | | | |
Total Preferred Stock—0.8%
(cost $58) | | | | 56 | |
| | | | | | | | |
Total Investments—96.9%
(cost $6,041) | | | | 6,494 | |
Cash and other assets, less liabilities—3.1% | | | | 207 | |
| | | | | | | | |
Net assets—100.0% | | | $ | 6,701 | |
| | | | | | | | |
ADR = American Depository Receipt
GDR = Global Depository Receipt
* Non-income producing securities
† = U.S. listed foreign security
For securities primarily traded on exchanges or markets that close before the close of regular trading on the New York Stock Exchange, the Fund may use an independent pricing service to fair value price the securities pursuant to Valuation Procedures approved by the Board of Trustees.
At June 30, 2012, the Fund’s Portfolio of Investments includes the following industry categories:
| | | | |
Consumer Discretionary | | | 28.6% | |
Financials | | | 19.6% | |
Industrials | | | 17.8% | |
Consumer Staples | | | 13.5% | |
Health Care | | | 11.1% | |
Information Technology | | | 6.5% | |
Materials | | | 1.7% | |
Energy | | | 0.9% | |
Telecommunication Services | | | 0.3% | |
| | | | |
Total | | | 100.0% | |
| | | | |
At June 30, 2012, the Fund’s Portfolio of Investments includes the following currency categories:
| | | | |
Brazilian Real | | | 17.3% | |
Indonesian Rupiah | | | 10.4% | |
Thai Baht | | | 9.4% | |
Philippine Peso | | | 8.9% | |
South African Rand | | | 8.7% | |
Hong Kong Dollar | | | 8.6% | |
Indian Rupee | | | 8.6% | |
U.S. Dollar | | | 5.6% | |
Malaysian Ringgit | | | 4.8% | |
New Taiwan Dollar | | | 4.6% | |
Mexican Peso | | | 3.9% | |
Turkish Lira | | | 3.1% | |
Euro | | | 2.3% | |
Chilean Peso | | | 2.1% | |
South Korean Won | | | 1.0% | |
All Other Currencies | | | 0.7% | |
| | | | |
Total | | | 100.0% | |
| | | | |
See accompanying Notes to Portfolio of Investments.
62 Semi-Annual Report | June 30, 2012 |

David F. Hone
LARGE CAP VALUE FUND
The Large Cap Value Fund seeks long-term capital appreciation.
AN OVERVIEW FROM THE PORTFOLIO MANAGER
Thus far in 2012, U.S. equity markets posted strong results; the Russell 1000® Value Index rose 8.68%. However, performance varied widely in each quarter. Like the past several years, the familiar pattern of risk-on occurred during periods of optimism while risk-off occurred during periods of pessimism due to rising macro and political concerns. The period began with robust upward momentum as investors gained confidence in the strengthening U.S. economy and were comforted by stabilization in Europe; the Russell 1000® Value Index climbed 11.12% in the first quarter. Notably, investors differentiated based on underlying company fundamentals, a sound environment for active managers. However, during the second quarter, markets reversed course due to worries over U.S. economic growth, the re-intensified European debt crisis and continued slowing growth in emerging markets; the Russell 1000® Value Index fell 2.20% in the second quarter. In the latter period, volatility and stock correlations picked up; investors preferred low risk, defensives and domestically focused companies.
Portfolio Results
The William Blair Large Cap Value Fund Class N rose 9.15% surpassing the benchmark, the Russell 1000® Value Index. Stock selection in the first quarter drove the positive relative results. Importantly, most of our companies had good quarterly earnings reports, which assisted.
Our Financials stock selection contributed most to the overall return; Discover Financial Services and SunTrust Banks, Inc. ranked among the best performers. Discover Financial Services benefited from improving credit card trends as both losses and delinquencies declined as well as rising demand for credit; we expect these drivers to continue. SunTrust Banks, one of the largest U.S. commercial banking institutions, benefited from continued improvement in overall credit and recovery in the housing market. We believe this company has solid fundamentals and is well positioned to take advantage of further improvement in the domestic economy. Outside of Financials, Textron, Inc. in Industrials and Time Warner Cable, Inc. in Consumer Discretionary were also strong contributors. Textron was a standout primarily in the first quarter on better than expected fourth quarter earnings results and an improving outlook in its Cessna and Bell business divisions. Time Warner Cable’s stock price rose on solid financial results driven by positive subscriber trends. Also, it announced an increase in its dividend by 17% and a replenishment of its share repurchase program to $4 billion. In our view, this stock should continue to benefit from strong free cash flows and attractive stock valuation.
The portfolio had only a couple of notable stock detractors across various sectors. Our weakest stocks were Hewlett-Packard Co., Bank of America Corporation and Hess Corporation. In Information Technology, Hewlett-Packard declined on concerns over softening demand in the PC and printer divisions. The company is working through a multi-year restructuring of its business and will likely experience bumps along the way. Over time, we believe the firm will benefit from its recurring sales, cost cutting levers, and strong balance sheet. In Financials, Bank of America rose significantly in the first quarter. We added this stock to the portfolio in June on its attractive risk/reward combination after its substantial decline beginning in April over concerns on the global economic slowdown and weakness in capital markets. For the year-to-date period, the portfolio’s underweight in this stock relative to the benchmark in the first quarter detracted. In Energy, Hess came under pressure as the price of oil significantly dropped from $99 to $85 in the first half of 2012, as well as concerns about production growth.
June 30, 2012 | William Blair Funds 63 |
Outlook
While U.S. equity markets oscillate between optimism and pessimism from quarter to quarter, these moves seem more based on the latest macro or political news release than a change in the long-term trajectory for the U.S. economy. The Federal Reserve remains accommodative and stands ready to enact additional measures if necessary, which should be supportive of businesses and consumers. While in the second quarter unemployment ticked up and manufacturing modestly declined due to Europe’s recessionary environment, U.S. housing sales improved. Corporate balance sheets and operating margins in aggregate remain healthy. Falling commodity prices should provide some relief.
Typically, markets crave certainty; until clarity appears, volatility will likely remain elevated. Investors remain concerned over further deterioration in the European debt crisis and slowing emerging market growth, which in turn impacts U.S. exports. Also, in the U.S., stability of economic growth remains a primary focus, along with the November elections and the outcome for the fiscal cliff (i.e., expiration of the Bush-era tax cuts, coupled with mandatory federal spending cuts.)
As always, our concentration remains on our value philosophy, disciplined investment process, and deep fundamental research. We believe attractive returns with below-average risk are achieved by investing in undervalued, higher quality companies that are temporarily out-of-favor with the market. In terms of valuation, many stocks remain attractively priced while perceived “safe” stocks are elevated relative to history. In general, we continue to find attractive investment opportunities and use volatility to our advantage to invest in stocks with strong risk/reward profiles.
64 Semi-Annual Report | June 30, 2012 |
Large Cap Value Fund
Performance Highlights (Unaudited)
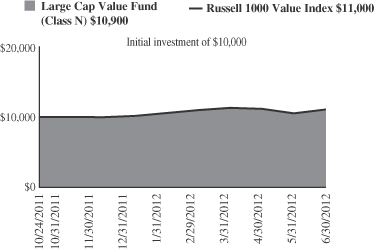
Average Annual Total Return at 6/30/2012
| | | | | | | | |
| | | Year To
Date | | | Since
Inception(a) | |
Class N | | | 9.15 | % | | | 8.93 | % |
Class I | | | 9.35 | % | | | 9.13 | |
Russell 1000® Value Index | | | 8.68 | % | | | 10.48 | |
| | (a) | | For the period from October 24, 2011 (Commencement of Operations) to June 30, 2012. |
Performance cited represents past performance. Past performance does not guarantee future results and current performance may be lower or higher than the data quoted. Results shown are average annual total returns, which assume reinvestment of dividends and capital gains. Investment returns and principal will fluctuate and you may have a gain or loss when you sell shares. For the most current month-end performance information, please call 1-800-742-7272, or visit our Web site at www.williamblairfunds.com. From time to time, the investment advisor may waive fees or reimburse expenses for the Fund. Without these waivers, performance would be lower. Class N shares are available to the general public without a sales load. Class I shares are available to certain institutional investors and advisory clients of William Blair & Company, L.L.C., without a sales load or distribution (12b-1) or service fees.
The performance highlights and graph presented above do not reflect the deduction of taxes that a shareholder would pay on fund distributions or the redemption of fund shares.
The Russell 1000® Value Index consists of large capitalization companies with above average price-to-book ratios and forecasted growth rates.
This report identifies the Fund’s investments on June 30, 2012. These holdings are subject to change. Not all stocks in the Fund performed the same, nor is there any guarantee that these stocks will perform as well in the future. Market forecasts provided in this report may not necessarily come to pass.
Sector Diversification (Unaudited)
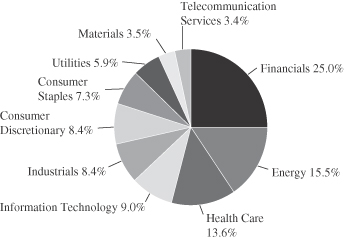
The sector diversification shown is based on the total long-term securities.
June 30, 2012 | William Blair Funds 65 |
Large Cap Value Fund
Portfolio of Investments, June 30, 2012 (all dollar amounts in thousands) (unaudited)
| | | | | | | | |
Issuer | | Shares | | | Value | |
| | |
Common Stocks | | | | | | | | |
Financials—24.7% | | | | | | | | |
American Tower Corporation | | | 895 | | | $ | 63 | |
Bank of America Corporation | | | 1,440 | | | | 12 | |
*CBRE Group, Inc. | | | 1,519 | | | | 25 | |
Citigroup, Inc. | | | 1,980 | | | | 54 | |
CNA Financial Corporation | | | 992 | | | | 27 | |
Discover Financial Services | | | 1,440 | | | | 50 | |
JPMorgan Chase & Co. | | | 2,420 | | | | 86 | |
Lazard, Ltd. Class “A”† | | | 2,087 | | | | 54 | |
Lincoln National Corporation | | | 1,129 | | | | 25 | |
Prudential Financial, Inc. | | | 657 | | | | 32 | |
Regions Financial Corporation | | | 4,391 | | | | 30 | |
State Street Corporation | | | 865 | | | | 39 | |
SunTrust Banks, Inc. | | | 1,833 | | | | 44 | |
The Allstate Corporation | | | 1,275 | | | | 45 | |
The Goldman Sachs Group, Inc. | | | 282 | | | | 27 | |
US Bancorp | | | 1,489 | | | | 48 | |
Wells Fargo & Co. | | | 2,752 | | | | 92 | |
Zions BanCorp. | | | 2,124 | | | | 41 | |
| | | | | | | | |
| | | | | | | 794 | |
| | | | | | | | |
Energy—15.2% | | | | | | | | |
Anadarko Petroleum Corporation | | | 642 | | | | 43 | |
Baker Hughes, Inc. | | | 1,056 | | | | 43 | |
Chevron Corporation | | | 620 | | | | 65 | |
ConocoPhillips | | | 819 | | | | 46 | |
Devon Energy Corporation | | | 617 | | | | 36 | |
Exxon Mobil Corporation | | | 1,447 | | | | 124 | |
Hess Corporation | | | 839 | | | | 36 | |
Occidental Petroleum Corporation | | | 603 | | | | 52 | |
Schlumberger, Ltd.† | | | 320 | | | | 21 | |
*Southwestern Energy Co. | | | 735 | | | | 23 | |
| | | | | | | | |
| | | | | | | 489 | |
| | | | | | | | |
Health Care—13.4% | | | | | | | | |
Amgen, Inc. | | | 361 | | | | 26 | |
Baxter International, Inc. | | | 880 | | | | 47 | |
Cardinal Health, Inc. | | | 1,409 | | | | 59 | |
*Express Scripts Holding Co. | | | 646 | | | | 36 | |
Merck & Co., Inc. | | | 1,616 | | | | 68 | |
Pfizer, Inc. | | | 4,210 | | | | 97 | |
UnitedHealth Group, Inc. | | | 767 | | | | 45 | |
Zimmer Holdings, Inc. | | | 813 | | | | 52 | |
| | | | | | | | |
| | | | | | | 430 | |
| | | | | | | | |
Information Technology—8.9% | | | | | | | | |
*Adobe Systems, Inc. | | | 1,497 | | | | 49 | |
*BMC Software, Inc. | | | 852 | | | | 36 | |
*Broadcom Corporation Class “A” | | | 789 | | | | 27 | |
Corning, Inc. | | | 1,181 | | | | 15 | |
Hewlett-Packard Co. | | | 2,407 | | | | 48 | |
Intel Corporation | | | 783 | | | | 21 | |
Microsoft Corporation | | | 1,285 | | | | 39 | |
*NetApp, Inc. | | | 620 | | | | 20 | |
*Symantec Corporation | | | 2,141 | | | | 31 | |
| | | | | | | | |
| | | | | | | 286 | |
| | | | | | | | |
Industrials—8.3% | | | | | | | | |
Gardner Denver, Inc. | | | 526 | | | | 28 | |
General Electric Co. | | | 4,082 | | | | 85 | |
Honeywell International, Inc. | | | 278 | | | | 15 | |
| | |
Common Stocks—(continued) | | | | | | | | |
Industrials—(continued) | | | | | | | | |
Kansas City Southern | | | 631 | | | $ | 44 | |
Rockwell Automation, Inc. | | | 103 | | | | 7 | |
SPX Corporation | | | 376 | | | | 25 | |
Textron, Inc. | | | 1,856 | | | | 46 | |
Union Pacific Corporation | | | 137 | | | | 16 | |
| | | | | | | | |
| | | | | | | 266 | |
| | | | | | | | |
Consumer Discretionary—8.2% | | | | | | | | |
*Big Lots, Inc. | | | 910 | | | | 37 | |
Brunswick Corporation | | | 1,036 | | | | 23 | |
*General Motors Co. | | | 1,289 | | | | 26 | |
Lear Corporation | | | 644 | | | | 24 | |
Marriott International, Inc. Class “A” | | | 519 | | | | 20 | |
*MGM Resorts International | | | 1,776 | | | | 20 | |
*Saks, Inc. | | | 2,193 | | | | 24 | |
The Walt Disney Co. | | | 767 | | | | 37 | |
Time Warner Cable, Inc. | | | 660 | | | | 54 | |
| | | | | | | | |
| | | | | | | 265 | |
| | | | | | | | |
Consumer Staples—7.2% | | | | | | | | |
General Mills, Inc. | | | 1,282 | | | | 49 | |
Kimberly-Clark Corporation | | | 466 | | | | 39 | |
Molson Coors Brewing Co. Class “B” | | | 633 | | | | 26 | |
Philip Morris International, Inc. | | | 637 | | | | 56 | |
The Procter & Gamble Co. | | | 973 | | | | 60 | |
| | | | | | | | |
| | | | | | | 230 | |
| | | | | | | | |
Utilities—5.8% | | | | | | | | |
CMS Energy Corporation | | | 2,338 | | | | 55 | |
NextEra Energy, Inc. | | | 875 | | | | 60 | |
Wisconsin Energy Corporation | | | 1,811 | | | | 72 | |
| | | | | | | | |
| | | | | | | 187 | |
| | | | | | | | |
Materials—3.5% | | | | | | | | |
Alcoa, Inc. | | | 3,093 | | | | 27 | |
Freeport-McMoRan Copper & Gold, Inc. | | | 1,398 | | | | 48 | |
Rockwood Holdings, Inc. | | | 350 | | | | 15 | |
The Dow Chemical Co. | | | 654 | | | | 21 | |
| | | | | | | | |
| | | | | | | 111 | |
| | | | | | | | |
Telecommunication Services—3.3% | | | | | | | | |
AT&T, Inc. | | | 1,305 | | | | 47 | |
CenturyLink, Inc. | | | 1,152 | | | | 45 | |
Verizon Communications, Inc. | | | 348 | | | | 15 | |
| | | | | | | | |
| | | | | | | 107 | |
| | | | | | | | |
Total Common Stocks—98.5%
(cost $2,977) | | | | 3,165 | |
| | | | | | | | |
Total Investments—98.5%
(cost $2,977) | | | | 3,165 | |
Cash and other assets, less liabilities—1.5% | | | | 47 | |
| | | | | | | | |
Net assets—100.0% | | | $ | 3,212 | |
| | | | | | | | |
* Non-income producing securities
† = U.S. listed foreign security
See accompanying Notes to Portfolio of Investments.
66 Semi-Annual Report | June 30, 2012 |

Chad M. Kilmer

Mark T. Leslie

David S. Mitchell
SMALL CAP VALUE FUND
The Small Cap Value Fund seeks long-term capital appreciation.
AN OVERVIEW FROM THE PORTFOLIO MANAGERS
The Small Cap Value Fund posted a 5.46% increase on a total return basis (Class N shares) during the six months ended June 30, 2012. By comparison, the Russell 2000® Value Index rose 8.23%.
After a nearly 30% advance over the previous two quarters, U.S. equities corrected in the second quarter. Strong first quarter returns primarily were driven by improving economic data points on employment, housing and overall industrial production. However, in the second quarter, investors refocused their attention on negative headline news from Europe. While news from Greece continued in earnest, the elevated fear in the market revolved around more substantial European countries, with particular emphasis on stabilizing the Spanish banking system and its impact on Spanish government borrowing capacity. At the highest level, investors grappled with the region’s ability to preserve the single-currency bloc.
The slowdown was felt worldwide; China’s growth has notably decelerated, joined by other emerging economies, due in part to developed nations’ decreased demand for exports. In the end, the U.S. was not immune. U.S. companies with direct business exposure to these regions, combined with declining U.S. business confidence due to the barrage of negative global headlines, translated into slowing business investment and worsening economic data at home. There was a string of disappointing data points: Employment growth slowed significantly from earlier this year, consumer confidence declined, and manufacturing activity slowed.
Broadly speaking, investors gravitated to stocks of companies with less economic sensitivity. For the second quarter, defensive sectors held up better than cyclical sectors, with Utilities (+3.68%), Health Care (+1.34%), and Consumer Staples (-0.18%) outperforming the overall small cap value market. The only other sector to outperform was Financials (+0.92%), driven primarily by REITs (+3.5%), which make up roughly 15% of the benchmark and approximately 36% of the sector. Sectors that derive higher proportions of revenues from non-US markets were hit due to the uncertainty in Europe, with Information Technology and Materials being the sectors in the Russell 2000® Value Index that have the highest percentage of foreign sales. Also, while quality rebounded somewhat relative to its first quarter performance, companies with the lowest Return on Invested Capital (ROIC) outperformed the market, while higher-ROIC companies lagged. Low quality outperformance is even more striking from a year-to-date perspective.
Year-to-date, the Fund gained 5.46%, trailing its benchmark, the Russell 2000® Value Index, which rose 8.23%. The Fund’s underperformance year-to-date resulted from a style headwind coupled with negative stock selection. The Fund typically has a higher quality bias than the benchmark and tends to be more heavily weighted in companies with larger market capitalizations. Stock selection within Energy detracted from relative returns, dragged down by Key Energy Services Inc., Northern Oil & Gas Inc., and Bill Barrett Corporation. Partially offsetting these negatives, stock selection in Information Technology (Monolithic Power Systems Inc.) and Industrials (G&K Services, Inc. and ESCO Technologies Inc.) contributed to the Fund’s relative performance.
Relative performance for the quarter has a similar narrative. Style headwinds negatively impacted our excess returns, as did stock selection. Investments within Financials (Safeguard Scientifics, Hancock Holding Co.) and Energy (Key Energy Services, Inc., Magnum Hunter Resources Corporation) detracted from relative returns. The effect was moderated by investments in AFC Enterprises, Inc (Consumer Discretionary), Hawaiian Holdings, Inc. and G&K Services, Inc.(both Industrials).
June 30, 2012 | William Blair Funds 67 |
While the recovery works to regain traction, there are a few positive developments to highlight: the stubborn housing market finally seems to be reversing course, with positive data on home prices and sales trends. Gas prices have come in from their April highs, although savings at the pump have yet to translate into higher confidence among consumers. Improving loan demand and banks’ willingness to lend are encouraging trends as well. Regarding the stock market specifically, while fundamentals are at a critical juncture given the current pause in business confidence, valuations appear attractive, coming in below historical averages.
Today’s unresolved issues make for a cloudy outlook as the world waits to see how the next chapter of the euro zone will read. Much attention will be focused on U.S. politics leading up to the November elections, the potential fiscal cliff (expiration of the Bush-era tax cuts, coupled with mandatory federal spending cuts), and the overall state of economic recovery. While this quarter’s market pullback resembles the past two years’ mid-year slumps, the global easing cycle along with a strengthening housing market will hopefully serve as tailwinds unique to 2012.
In the end, while we factor various economic scenarios into our stock picking, we focus our time on constructing the fund from a bottom-up perspective. As always, we remain focused on finding quality companies at discount prices and corporate transformation opportunities. We believe building a fund with these types of companies should produce solid investment results over the long term.
68 Semi-Annual Report | June 30, 2012 |
Small Cap Value Fund
Performance Highlights (Unaudited)
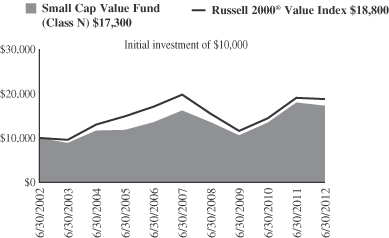
Average Annual Total Return at 6/30/2012
| | | | | | | | | | | | | | | | | | | | |
| | | Year
To Date | | | 1
Year | | | 3
Year | | | 5
Year | | | 10
Year | |
Class N | | | 5.46 | % | | | (3.97 | )% | | | 17.74 | % | | | 1.31 | % | | | 5.62 | % |
Class I | | | 5.53 | | | | (3.80 | ) | | | 17.99 | | | | 1.52 | | | | 5.83 | |
Russell 2000® Value Index | | | 8.23 | | | | (1.44 | ) | | | 17.43 | | | | (1.05 | ) | | | 6.50 | |
Performance cited represents past performance. Past performance does not guarantee future results and current performance may be lower or higher than the data quoted. Results shown are average annual total returns, which assume reinvestment of dividends and capital gains. Investment returns and principal will fluctuate and you may have a gain or loss when you sell shares. For the most current month-end performance information, please call 1-800-742-7272, or visit our Web site at www.williamblairfunds.com. Investing in smaller companies involves special risks, including higher volatility and lower liquidity. Smaller Capitalization stocks are also more sensitive to purchase/sale transactions and changes in the issuer’s financial condition. From time to time, the investment advisor may waive fees or reimburse expenses for the Fund. Without these waivers, performance would be lower. Class N shares are available to the general public without a sales load. Class I shares are available to certain institutional investors and advisory clients of William Blair & Company, L.L.C., without a sales load or distribution (12b-1) or service fees.
The performance highlights and graph presented above do not reflect the deduction of taxes that a shareholder would pay on fund distributions or the redemption of fund shares.
The Russell 2000® Value Index consists of small-capitalization companies with below average price-to-book ratios and forecasted growth rates.
This report identifies the Fund’s investments on June 30, 2012. These holdings are subject to change. Not all stocks in the Fund performed the same, nor is there any guarantee that these stocks will perform as well in the future. Market forecasts provided in this report may not necessarily come to pass.
Sector Diversification (Unaudited)
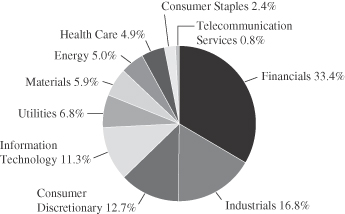
The sector diversification shown is based on the total long-term securities.
June 30, 2012 | William Blair Funds 69 |
Small Cap Value Fund
Portfolio of Investments, June 30, 2012 (all dollar amounts in thousands) (unaudited)
| | | | | | | | |
Issuer | | Shares | | | Value | |
| | |
Common Stocks | | | | | | | | |
Financials—33.0% | | | | | | | | |
Alterra Capital Holdings, Ltd.† | | | 144,330 | | | $ | 3,370 | |
Bank of the Ozarks, Inc. | | | 78,985 | | | | 2,376 | |
Berkshire Hills Bancorp, Inc. | | | 109,035 | | | | 2,399 | |
BioMed Realty Trust, Inc. | | | 127,310 | | | | 2,378 | |
CoBiz Financial, Inc. | | | 294,020 | | | | 1,841 | |
Coresite Realty Corporation | | | 59,100 | | | | 1,526 | |
CVB Financial Corporation | | | 112,350 | | | | 1,309 | |
*Eagle Bancorp, Inc. | | | 161,997 | | | | 2,551 | |
East West Bancorp, Inc. | | | 137,150 | | | | 3,217 | |
EastGroup Properties, Inc. | | | 46,830 | | | | 2,496 | |
Education Realty Trust, Inc. | | | 288,880 | | | | 3,201 | |
*Forest City Enterprises, Inc. Class “A” | | | 186,420 | | | | 2,722 | |
Hancock Holding Co. | | | 84,719 | | | | 2,579 | |
Highwoods Properties, Inc. | | | 92,080 | | | | 3,098 | |
LaSalle Hotel Properties | | | 93,457 | | | | 2,723 | |
Mid-America Apartment Communities, Inc. | | | 39,550 | | | | 2,699 | |
*National Financial Partners Corporation | | | 175,205 | | | | 2,348 | |
National Retail Properties, Inc. | | | 110,305 | | | | 3,120 | |
Old National Bancorp | | | 270,506 | | | | 3,249 | |
PacWest Bancorp | | | 118,728 | | | | 2,810 | |
Pebblebrook Hotel Trust | | | 105,079 | | | | 2,449 | |
ProAssurance Corporation | | | 27,250 | | | | 2,428 | |
Prosperity Bancshares, Inc. | | | 71,640 | | | | 3,011 | |
*Safeguard Scientifics, Inc. | | | 207,741 | | | | 3,216 | |
Sandy Spring Bancorp, Inc. | | | 120,710 | | | | 2,173 | |
Susquehanna Bancshares, Inc. | | | 270,875 | | | | 2,790 | |
The Hanover Insurance Group, Inc. | | | 68,545 | | | | 2,682 | |
Webster Financial Corporation | | | 150,570 | | | | 3,261 | |
*West Coast Bancorp | | | 80,460 | | | | 1,581 | |
*Western Alliance Bancorp | | | 356,325 | | | | 3,335 | |
| | | | | | | | |
| | | | | | | 78,938 | |
| | | | | | | | |
Industrials—16.6% | | | | | | | | |
Belden, Inc. | | | 93,600 | | | | 3,122 | |
Cubic Corporation | | | 53,540 | | | | 2,574 | |
EMCOR Group, Inc. | | | 116,166 | | | | 3,232 | |
ESCO Technologies, Inc. | | | 90,082 | | | | 3,283 | |
G&K Services, Inc. | | | 94,673 | | | | 2,953 | |
*Hawaiian Holdings, Inc. | | | 248,836 | | | | 1,620 | |
Interface, Inc. | | | 141,920 | | | | 1,934 | |
John Bean Technologies Corporation | | | 97,787 | | | | 1,327 | |
*Kadant, Inc. | | | 89,801 | | | | 2,106 | |
*Moog, Inc. | | | 77,450 | | | | 3,203 | |
*Northwest Pipe Co. | | | 73,955 | | | | 1,794 | |
*Polypore International, Inc. | | | 63,805 | | | | 2,577 | |
Quanex Building Products Corporation | | | 129,770 | | | | 2,320 | |
Robbins & Myers, Inc. | | | 67,075 | | | | 2,805 | |
TAL International Group, Inc. | | | 68,355 | | | | 2,289 | |
*Tetra Tech, Inc. | | | 98,467 | | | | 2,568 | |
| | | | | | | | |
| | | | | | | 39,707 | |
| | | | | | | | |
Issuer | | Shares | | | Value | |
| | |
Common Stocks—(continued) | | | | | | | | |
Consumer Discretionary—12.5% | | | | | | | | |
*AFC Enterprises, Inc. | | | 107,126 | | | $ | 2,479 | |
Chico’s FAS, Inc. | | | 169,905 | | | | 2,521 | |
Core-Mark Holding Co., Inc. | | | 41,125 | | | | 1,980 | |
Matthews International Corporation | | | 99,035 | | | | 3,218 | |
Meredith Corporation | | | 95,280 | | | | 3,043 | |
PEP Boys-Manny, Moe & Jack | | | 125,135 | | | | 1,239 | |
Pier 1 Imports, Inc. | | | 181,780 | | | | 2,986 | |
*Pinnacle Entertainment, Inc. | | | 269,330 | | | | 2,591 | |
Regis Corporation | | | 165,775 | | | | 2,977 | |
*The Children’s Place Retail Stores, Inc. | | | 48,000 | | | | 2,392 | |
The Men’s Wearhouse, Inc. | | | 90,290 | | | | 2,541 | |
*WMS Industries, Inc. | | | 101,300 | | | | 2,021 | |
| | | | | | | | |
| | | | | | | 29,988 | |
| | | | | | | | |
Information Technology—11.2% | | | | | | | | |
ADTRAN, Inc. | | | 101,315 | | | | 3,059 | |
*Cadence Design Systems, Inc. | | | 163,595 | | | | 1,798 | |
*Digital River, Inc. | | | 111,740 | | | | 1,857 | |
Earthlink, Inc. | | | 461,330 | | | | 3,432 | |
*Integrated Device Technology, Inc. | | | 467,542 | | | | 2,628 | |
j2 Global Communications, Inc. | | | 91,645 | | | | 2,421 | |
*Monolithic Power Systems, Inc. | | | 154,162 | | | | 3,063 | |
*Parametric Technology Corporation | | | 119,200 | | | | 2,498 | |
*Progress Software Corporation | | | 95,345 | | | | 1,990 | |
*Silicon Laboratories, Inc. | | | 61,860 | | | | 2,345 | |
*Ultra Clean Holdings | | | 249,612 | | | | 1,605 | |
| | | | | | | | |
| | | | | | | 26,696 | |
| | | | | | | | |
Utilities—6.7% | | | | | | | | |
ALLETE, Inc. | | | 64,880 | | | | 2,712 | |
Chesapeake Utilities Corporation | | | 45,405 | | | | 1,985 | |
Cleco Corporation | | | 80,065 | | | | 3,349 | |
Northwest Natural Gas Co. | | | 50,925 | | | | 2,424 | |
Southwest Gas Corporation | | | 66,060 | | | | 2,884 | |
WGL Holdings, Inc. | | | 67,330 | | | | 2,676 | |
| | | | | | | | |
| | | | | | | 16,030 | |
| | | | | | | | |
Materials—5.8% | | | | | | | | |
Minerals Technologies, Inc. | | | 45,670 | | | | 2,913 | |
PolyOne Corporation | | | 220,515 | | | | 3,017 | |
*RTI International Metals, Inc. | | | 88,475 | | | | 2,002 | |
Sensient Technologies Corporation | | | 82,420 | | | | 3,027 | |
Silgan Holdings, Inc. | | | 70,465 | | | | 3,008 | |
| | | | | | | | |
| | | | | | | 13,967 | |
| | | | | | | | |
Energy—4.9% | | | | | | | | |
Berry Petroleum Co. | | | 39,793 | | | | 1,578 | |
*Key Energy Services, Inc. | | | 228,790 | | | | 1,739 | |
*Magnum Hunter Resources Corporation | | | 531,166 | | | | 2,220 | |
*Northern Oil and Gas, Inc. | | | 108,133 | | | | 1,724 | |
*Swift Energy Co. | | | 121,670 | | | | 2,264 | |
See accompanying Notes to Portfolio of Investments.
70 Semi-Annual Report June 30, 2012 | |
Small Cap Value Fund
Portfolio of Investments, June 30, 2012 (all dollar amounts in thousands) (unaudited)
| | | | | | | | |
Issuer | | Shares or
Principal
Amount | | | Value | |
| | |
Common Stocks—(continued) | | | | | | | | |
Energy—(continued) | | | | | | | | |
*TETRA Technologies, Inc. | | | 311,685 | | | $ | 2,223 | |
| | | | | | | | |
| | | | | | | 11,748 | |
| | | | | | | | |
Health Care—4.8% | | | | | | | | |
CONMED Corporation | | | 90,255 | | | | 2,497 | |
*Greatbatch, Inc. | | | 104,065 | | | | 2,363 | |
*HealthSouth Corporation | | | 88,430 | | | | 2,057 | |
*Magellan Health Services, Inc. | | | 42,365 | | | | 1,921 | |
*Mednax, Inc. | | | 40,048 | | | | 2,745 | |
| | | | | | | | |
| | | | | | | 11,583 | |
| | | | | | | | |
Consumer Staples—2.4% | | | | | | | | |
J&J Snack Foods Corporation | | | 43,967 | | | | 2,598 | |
Spartan Stores, Inc. | | | 167,949 | | | | 3,045 | |
| | | | | | | | |
| | | | | | | 5,643 | |
| | | | | | | | |
Telecommunication Services—0.7% | | | | | | | | |
*tw telecom, Inc. | | | 69,005 | | | | 1,771 | |
| | | | | | | | |
Total Common Stocks—98.6%
(cost $216,449) | | | | | | | 236,071 | |
| | | | | | | | |
| | |
Repurchase Agreement | | | | | | | | |
Fixed Income Clearing Corporation, 0.100% dated 6/29/12, due 7/2/12, repurchase price $4,569, collateralized by FNMA,
5.00%, due 4/15/2015 | | $ | 4,569 | | | | 4,569 | |
| | | | | | | | |
Total Repurchase Agreement—1.9%
(cost $4,569) | | | | 4,569 | |
| | | | | | | | |
Total Investments—100.5%
(cost $221,018) | | | | 240,640 | |
Liabilities, plus cash and other assets—(0.5)% | | | | (1,134 | ) |
| | | | | | | | |
Net assets—100.0% | | | $ | 239,506 | |
| | | | | | | | |
† = U.S. listed foreign security
* Non-income producing securities
See accompanying Notes to Portfolio of Investments.
June 30, 2012 | William Blair Funds 71 |
Chad M. Kilmer
Mark T. Leslie
David S. Mitchell
MID CAP VALUE FUND
The Mid Cap Value Fund seeks long-term capital appreciation.
AN OVERVIEW FROM THE PORTFOLIO MANAGERS
The Mid Cap Value Fund posted a 4.68% increase on a total return basis (Class N Shares) during the six months ended June 30, 2012. By comparison, the Fund’s benchmark the Russell Midcap® Value Index, rose 7.78%.
After a nearly 30% advance over the previous two quarters, U.S. equities corrected in the second quarter. Strong first quarter returns primarily were driven by improving economic data points on employment, housing and overall industrial production. However, in the second quarter, investors refocused their attention on negative headline news from Europe. While news from Greece continued in earnest, the elevated fear in the market revolved around more substantial European countries, with particular emphasis on stabilizing the Spanish banking system and its impact on Spanish government borrowing capacity. At the highest level, investors grappled with the region’s ability to preserve the single-currency bloc.
The slowdown was felt worldwide; China’s growth has notably decelerated, joined by other emerging economies, due in part to developed nations’ decreased demand for exports. In the end, the U.S. was not immune. U.S. companies with direct business exposure to these regions, combined with declining U.S. business confidence due to the barrage of negative global headlines, translated into slowing business investment and worsening economic data at home. There was a string of disappointing data points: Employment growth slowed significantly from earlier this year, consumer confidence declined, and manufacturing activity slowed.
Broadly speaking, investors gravitated to stocks of companies with less economic sensitivity. For the second quarter, defensive sectors held up better than cyclical sectors, with Utilities (+6.36%) and Consumer Staples (+2.63%) outperforming the overall mid cap value market. The only other sector to outperform was Financials (-1.85%), driven primarily by REITs (+3%), which make up roughly 12% of the benchmark and approximately 35% of the sector. Sectors that derive higher proportions of revenues from non-US markets were hit due to the uncertainty in Europe, and Information Technology returns (-10.46%) reflected the sector’s dominant position in terms of foreign revenues. Also, while quality rebounded somewhat relative to its first quarter performance, companies with the lowest Return on Invested Capital (ROIC) outperformed the market, while higher-ROIC companies lagged. Low quality outperformance is even more striking from a year-to-date perspective.
Year-to-date, the Fund gained 4.68%, trailing its benchmark, the Russell Midcap® Value Index, which rose 7.78%. The Fund’s underperformance year-to-date resulted from a style headwind coupled with negative stock selection. The Fund typically has a higher quality bias than the benchmark and tends to lag benchmark returns when low quality outperforms. Investments within Energy (SM Energy Co. and Superior Energy Services Inc.) and Consumer Staples (Ingredion Inc. and Kroger Co.) detracted from relative returns. The effect was moderated by investments in Financials (Discover Financial Services) and Consumer Discretionary (Wyndham Worldwide Corp.).
Relative performance for the second quarter has a similar narrative. Style headwinds negatively impacted our excess returns, as did stock selection. Stock selection within Energy detracted from relative returns, pulled down by SM Energy Co., Pioneer Natural Resources Co. and Whiting Petroleum Corp. Helping to partially offset these negatives, stock selection in Information Technology (VeriSign Inc.) and Telecommunication Services (tw telecom inc.) contributed to the Fund’s relative performance.
72 Semi-Annual Report | June 30, 2012 |
While the recovery works to regain traction, there are a few positive developments to highlight: the stubborn housing market finally seems to be reversing course, with positive data on home prices and sales trends. Gas prices have come in from their April highs, although savings at the pump have yet to translate into higher confidence among consumers. Improving loan demand and banks’ willingness to lend are encouraging trends as well. Regarding the stock market specifically, while fundamentals are at a critical juncture given the current pause in business confidence, valuations appear attractive, coming in below historical averages.
Today’s unresolved issues make for a cloudy outlook as the world waits to see how the next chapter of the euro zone will read. Much attention will be focused on U.S. politics leading up to the November elections, the potential fiscal cliff (expiration of the Bush-era tax cuts, coupled with mandatory federal spending cuts), and the overall state of economic recovery. While this quarter’s market pullback resembles the past two years’ mid-year slumps, the global easing cycle along with a strengthening housing market will hopefully serve as tailwinds unique to 2012.
In the end, while we factor various economic scenarios into our stock picking, we focus our time on constructing the Fund from a bottom-up perspective. As always, we remain focused on finding quality companies at discount prices and corporate transformation opportunities. We believe building a fund with these types of companies should produce solid investment results over the long term.
June 30, 2012 | William Blair Funds 73 |
Mid Cap Value Fund
Performance Highlights (Unaudited)
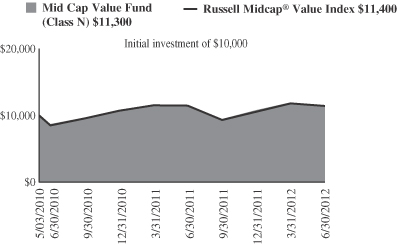
Average Annual Total Return at 6/30/2012
| | | | | | | | | | | | |
| | | Year
To Date | | | 1
Year | | | Since
Inception(a) | |
Class N | | | 4.68 | % | | | (1.46 | )% | | | 5.82 | % |
Class I | | | 4.77 | % | | | (1.27 | )% | | | 6.04 | |
Russell Midcap® Value Index | | | 7.78 | | | | (0.37 | ) | | | 6.21 | |
| | (a) | | For the period May 3, 2010 (Commencement of Operations) to June 30, 2012. |
Performance cited represents past performance. Past performance does not guarantee future results and current performance may be lower or higher than the data quoted. Results shown are average annual total returns, which assume reinvestment of dividends and capital gains. Investment returns and principal will fluctuate and you may have a gain or loss when you sell shares. For the most current month-end performance information, please call 1-800-742-7272, or visit our Web site at www.williamblairfunds.com. Investing in smaller and medium capitalization companies involves special risks, including higher volatility and lower liquidity. Medium Capitalization stocks are also more sensitive to purchase/sale transactions and changes in the issuer’s financial condition. From time to time, the investment advisor may waive fees or reimburse expenses for the Fund. Without these waivers, performance would be lower. Class N shares are available to the general public without a sales load. Class I shares are available to certain institutional investors and advisory clients of William Blair & Company, L.L.C., without a sales load or distribution (12b-1) or service fees.
The performance highlights and graph presented above do not reflect the deduction of taxes that a shareholder would pay on fund distributions or the redemption of fund shares.
The Russell Midcap® Value Index consists of Midcap-capitalization companies with below average price-to-book ratios and forecasted growth rates.
This report identifies the Fund’s investments on June 30, 2012. These holdings are subject to change. Not all stocks in the Fund performed the same, nor is there any guarantee that these stocks will perform as well in the future. Market forecasts provided in this report may not necessarily come to pass.
Sector Diversification (Unaudited)
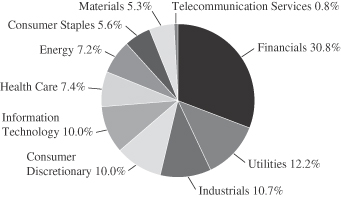
The sector diversification shown is based on the total long-term securities.
74 Semi-Annual Report | June 30, 2012 |
Mid Cap Value Fund
Portfolio of Investments, June 30, 2012 (all dollar amounts in thousands) (unaudited)
| | | | | | | | |
Issuer | | Shares | | | Value | |
| | |
Common Stocks | | | | | | | | |
Financials—29.6% | | | | | | | | |
Alexandria Real Estate Equities, Inc. | | | 940 | | | $ | 68 | |
Allied World Assurance Co. Holdings, Ltd.† | | | 695 | | | | 55 | |
American Campus Communities, Inc. | | | 1,170 | | | | 53 | |
Ameriprise Financial, Inc. | | | 1,900 | | | | 99 | |
Comerica, Inc. | | | 1,825 | | | | 56 | |
Discover Financial Services | | | 2,950 | | | | 102 | |
Duke Realty Corporation | | | 4,050 | | | | 59 | |
East West Bancorp, Inc. | | | 3,340 | | | | 78 | |
Equity Residential | | | 845 | | | | 53 | |
Fifth Third Bancorp | | | 4,285 | | | | 58 | |
*Forest City Enterprises, Inc. Class “A” | | | 4,525 | | | | 66 | |
Hancock Holding Co. | | | 1,742 | | | | 53 | |
Host Hotels & Resorts, Inc. | | | 4,010 | | | | 64 | |
Marsh & McLennan Cos., Inc. | | | 2,360 | | | | 76 | |
People’s United Financial, Inc. | | | 5,880 | | | | 68 | |
Realty Income Corporation | | | 2,085 | | | | 87 | |
SL Green Realty Corporation | | | 965 | | | | 78 | |
SunTrust Banks, Inc. | | | 1,785 | | | | 43 | |
The Hanover Insurance Group, Inc. | | | 1,385 | | | | 54 | |
Unum Group | | | 3,470 | | | | 67 | |
Validus Holdings, Ltd.† | | | 2,195 | | | | 70 | |
Ventas, Inc. | | | 1,030 | | | | 65 | |
| | | | | | | | |
| | | | | | | 1,472 | |
| | | | | | | | |
Utilities—11.7% | | | | | | | | |
American Water Works Co., Inc. | | | 2,210 | | | | 76 | |
Cleco Corporation | | | 1,190 | | | | 50 | |
DTE Energy Co. | | | 1,255 | | | | 74 | |
Northeast Utilities | | | 2,080 | | | | 81 | |
NV Energy, Inc. | | | 4,215 | | | | 74 | |
Southwest Gas Corporation | | | 1,665 | | | | 72 | |
Wisconsin Energy Corporation | | | 1,920 | | | | 76 | |
Xcel Energy, Inc. | | | 2,810 | | | | 80 | |
| | | | | | | | |
| | | | | | | 583 | |
| | | | | | | | |
Industrials—10.2% | | | | | | | | |
Cintas Corporation | | | 1,620 | | | | 63 | |
Eaton Corporation | | | 1,410 | | | | 56 | |
Hubbell, Inc. Class “B” | | | 975 | | | | 76 | |
Pall Corporation | | | 995 | | | | 54 | |
Parker Hannifin Corporation | | | 775 | | | | 60 | |
Robbins & Myers, Inc. | | | 1,055 | | | | 44 | |
Rockwell Automation, Inc. | | | 750 | | | | 49 | |
Rockwell Collins, Inc. | | | 1,005 | | | | 50 | |
Snap-On, Inc. | | | 925 | | | | 58 | |
| | | | | | | | |
| | | | | | | 510 | |
| | | | | | | | |
Consumer Discretionary—9.7% | | | | | | | | |
Autoliv, Inc. | | | 680 | | | | 37 | |
*Bed Bath & Beyond, Inc. | | | 660 | | | | 41 | |
Chico’s FAS, Inc. | | | 3,695 | | | | 55 | |
DISH Network Corporation | | | 2,085 | | | | 60 | |
H&R Block, Inc. | | | 3,130 | | | | 50 | |
Newell Rubbermaid, Inc. | | | 3,370 | | | | 61 | |
Staples, Inc. | | | 4,400 | | | | 58 | |
VF Corporation | | | 340 | | | | 45 | |
Wyndham Worldwide Corporation | | | 1,405 | | | | 74 | |
| | | | | | | | |
| | | | | | | 481 | |
| | | | | | | | |
† = U.S. listed foreign security
* Non-income producing securities
| | | | | | | | |
Issuer | | Shares or
Principal
Amount | | | Value | |
| | |
Common Stocks—(continued) | | | | | | | | |
Information Technology—9.6% | | | | | | | | |
*Atmel Corporation | | | 6,655 | | | $ | 44 | |
*Ingram Micro, Inc. Class “A” | | | 3,615 | | | | 63 | |
*Juniper Networks, Inc. | | | 2,930 | | | | 48 | |
Linear Technology Corporation | | | 1,615 | | | | 50 | |
*Parametric Technology Corporation | | | 2,415 | | | | 51 | |
TE Connectivity, Ltd.† | | | 2,450 | | | | 78 | |
*VeriSign, Inc. | | | 1,440 | | | | 63 | |
Xerox Corporation | | | 10,375 | | | | 82 | |
| | | | | | | | |
| | | | | | | 479 | |
| | | | | | | | |
Health Care—7.1% | | | | | | | | |
CIGNA Corporation | | | 1,765 | | | | 78 | |
Hill-Rom Holdings, Inc. | | | 1,950 | | | | 60 | |
*Laboratory Corporation of America Holdings | | | 805 | | | | 74 | |
*Mettler-Toledo International, Inc.† | | | 490 | | | | 76 | |
Zimmer Holdings, Inc. | | | 1,035 | | | | 67 | |
| | | | | | | | |
| | | | | | | 355 | |
| | | | | | | | |
Energy—6.9% | | | | | | | | |
Pioneer Natural Resources Co. | | | 815 | | | | 72 | |
*Rowan Cos. plc Class “A”† | | | 2,040 | | | | 66 | |
SM Energy Co. | | | 1,115 | | | | 55 | |
*Superior Energy Services, Inc. | | | 2,260 | | | | 46 | |
Valero Energy Corporation | | | 2,045 | | | | 49 | |
*Whiting Petroleum Corporation | | | 1,350 | | | | 55 | |
| | | | | | | | |
| | | | | | | 343 | |
| | | | | | | | |
Consumer Staples—5.4% | | | | | | | | |
ConAgra Foods, Inc. | | | 2,870 | | | | 75 | |
HJ Heinz Co. | | | 1,270 | | | | 69 | |
Ingredion, Inc. | | | 1,315 | | | | 65 | |
The Kroger Co. | | | 2,545 | | | | 59 | |
| | | | | | | | |
| | | | | | | 268 | |
| | | | | | | | |
Materials—5.1% | | | | | | | | |
Airgas, Inc. | | | 830 | | | | 70 | |
Carpenter Technology Corporation | | | 1,105 | | | | 53 | |
FMC Corporation | | | 1,490 | | | | 79 | |
Steel Dynamics, Inc. | | | 4,335 | | | | 51 | |
| | | | | | | | |
| | | | | | | 253 | |
| | | | | | | | |
Telecommunication Services—0.7% | | | | | | | | |
*tw telecom, Inc. | | | 1,435 | | | | 37 | |
| | | | | | | | |
Total Common Stocks—96.0%
(cost $4,525) | | | | | | | 4,781 | |
| | | | | | | | |
| | |
Repurchase Agreement | | | | | | | | |
Fixed Income Clearing Corporation, 0.100% dated 6/29/12, due 7/2/12, repurchase price $271, collateralized by FNMA, 5.000%, due 4/15/15 | | $ | 271 | | | | 271 | |
| | | | | | | | |
Total Repurchase Agreement—5.4%
(cost $271) | | | | | | | 271 | |
| | | | | | | | |
Total Investments—101.4%
(cost $4,796) | | | | | | | 5,052 | |
Liabilities, plus cash and other assets—(1.4)% | | | | (72 | ) |
| | | | | | | | |
Net assets—100.0% | | | $ | 4,980 | |
| | | | | | | | |
See accompanying Notes to Portfolio of Investments.
June 30, 2012 | William Blair Funds 75 |
Chad M. Kilmer
Mark T. Leslie
David S. Mitchell
SMALL-MID CAP VALUE FUND
The Small-Mid Cap Value Fund seeks long-term capital appreciation.
AN OVERVIEW FROM THE PORTFOLIO MANAGERS
The Small-Mid Cap Fund posted a 4.59% increase on a total return basis (Class N Shares) during the six month period ended June 30, 2012. By comparison, the Fund’s benchmark the Russell 2500® Value rose 8.15%.
After a nearly 30% advance over the previous two quarters, U.S. equities corrected in the second quarter. Strong first quarter returns primarily were driven by improving economic data points on employment, housing and overall industrial production. However, in the second quarter, investors refocused their attention on negative headline news from Europe. While news from Greece continued in earnest, the elevated fear in the market revolved around more substantial European countries, with particular emphasis on stabilizing the Spanish banking system and its impact on Spanish government borrowing capacity. At the highest level, investors grappled with the region’s ability to preserve the single-currency bloc.
The slowdown was felt worldwide; China’s growth has notably decelerated, joined by other emerging economies, due in part to developed nations’ decreased demand for exports. In the end, the U.S. was not immune. U.S. companies with direct business exposure to these regions, combined with declining U.S. business confidence due to the barrage of negative global headlines, translated into slowing business investment and worsening economic data at home. There was a string of disappointing data points: Employment growth slowed significantly from earlier this year, consumer confidence declined, and manufacturing activity slowed.
Broadly speaking, investors gravitated to stocks of companies with less economic sensitivity. For the second quarter, defensive sectors held up better than cyclical sectors, with Utilities (+4.74%) and Consumer Staples (+3.18%) outperforming the overall small-mid cap value market, and Health Care (-3.01%) performing in-line with the market. The only other sector to outperform was Financials (+0.08%), driven primarily by Real Estate Investment Trust (REITs) (+3.96%), which make up roughly 12% of the benchmark and approximately 35% of the sector. Sectors that derive higher proportions of revenues from non-U.S. markets were hit due to the uncertainty in Europe, with Information Technology and Materials being the sectors in the Russell 2500® Value Index that have the highest percentage of foreign sales. Also, while quality rebounded somewhat relative to its first quarter performance, companies with the lowest ROIC (Return on Invested Capital) outperformed the market, while higher-ROIC companies lagged. Low quality outperformance is even more striking from a year-to-date perspective.
Year-to-date, the Fund gained 4.59%, trailing its benchmark, the Russell 2500® Value Index, which rose 8.15%. The Fund’s underperformance year-to-date resulted from a style headwind coupled with negative stock selection. The Fund typically has a higher quality bias than the benchmark and tends to lag benchmark returns when low quality outperforms; this was definitely the case during the first half of the year. Looking at stock selection, investments within Energy (Key Energy Services Inc. and SM Energy Co.) and Financials (People’s United Financial Inc. and Meadowbrook Insurance Group Inc.) detracted from relative returns. The effect was moderated by investments in Consumer Discretionary (Pep Boys- Manny Moe & Jack and Wyndham Worldwide Corp.) and Industrials (G&K Services, Inc.).
Relative performance for the quarter has a similar narrative. Style headwinds negatively impacted our excess returns, as did stock selection. Stock selection within Energy detracted from relative returns, pulled down by Key Energy Services Inc., SM Energy Co., and
76 Semi-Annual Report | June 30, 2012 |
Magnum Hunter Resources Co. Partially offsetting these negatives, stock selection in Industrials (G&K Services, Inc.) and Telecommunication Services (tw telecom inc.) contributed to the Fund’s relative performance.
While the recovery works to regain traction, there are a few positive developments to highlight: the stubborn housing market finally seems to be reversing course, with positive data on home prices and sales trends. Gas prices have come in from their April highs, although savings at the pump have yet to translate into higher confidence among consumers. Improving loan demand and banks’ willingness to lend are encouraging trends as well. Regarding the stock market specifically, while fundamentals are at a critical juncture given the current pause in business confidence, valuations appear attractive, coming in below historical averages.
Today’s unresolved issues make for a cloudy outlook as the world waits to see how the next chapter of the euro zone will read. Much attention will be focused on U.S. politics leading up to the November elections, the potential fiscal cliff (expiration of the Bush-era tax cuts, coupled with mandatory federal spending cuts), and the overall state of economic recovery. While this quarter’s market pullback resembles the past two years’ mid-year slumps, the global easing cycle along with a strengthening housing market will hopefully serve as tailwinds unique to 2012.
In the end, while we factor various economic scenarios into our stock picking, we focus our time on constructing the fund from a bottom-up perspective. As always, we remain focused on finding quality companies at discount prices and corporate transformation opportunities. We believe building a fund with these types of companies should produce solid investment results over the long term.
June 30, 2012 William Blair Funds 77 | |
Small-Mid Cap Value Fund
Performance Highlights (Unaudited)
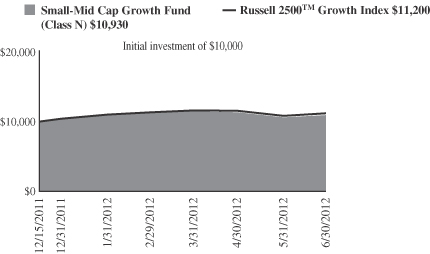
Average Annual Total Return at 6/30/2012
| | | | | | | | |
| | | Year
To Date | | | Since
Inception(a) | |
Class N | | | 4.59 | % | | | 9.30 | % |
Class I | | | 4.69 | | | | 9.40 | |
Russell 2500® Value Index | | | 8.15 | | | | 12.69 | |
| | (a) | | For the period from December 15, 2011 (Commencement of Operations) to June 30, 2012. | |
Performance cited represents past performance. Past performance does not guarantee future results and current performance may be lower or higher than the data quoted. Results shown are average annual total returns, which assume reinvestment of dividends and capital gains. Investment returns and principal will fluctuate and you may have a gain or loss when you sell shares. For the most current month-end performance information, please call 1-800-742-7272, or visit our Web site at www.williamblairfunds.com. Investing in smaller and medium capitalization companies involves special risks, including higher volatility and lower liquidity. Smaller and medium capitalization stocks are also more sensitive to purchase/sale transactions and changes in the issuer’s financial condition. From time to time, the investment advisor may waive fees or reimburse expenses for the Fund. Without these waivers, performance would be lower. Class N shares are available to the general public without a sales load. Class I shares are available to certain institutional investors and advisory clients of William Blair & Company, L.L.C., without a sales load or distribution (12b-1) or service fees.
The performance highlights and graph presented above do not reflect the deduction of taxes that a shareholder would pay on fund distributions or the redemption of fund shares.
Russell 2500® Value Index consists of Midcap-capitalization companies with below average price-to-book ratios and forecasted growth rates.
This report identifies the Fund’s investments on June 30, 2012. These holdings are subject to change. Not all stocks in the Fund performed the same, nor is there any guarantee that these stocks will perform as well in the future. Market forecasts provided in this report may not necessarily come to pass.
Sector Diversification (Unaudited)
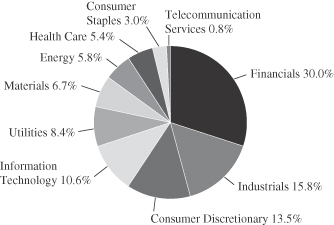
The sector diversification shown is based on the total long-term securities.
78 Semi-Annual Report | June 30, 2012 |
Small-Mid Cap Value Fund
Portfolio of Investments, June 30, 2012 (all dollar amounts in thousands) (unaudited)
| | | | | | | | |
Issuer | | Shares | | | Value | |
| | |
Common Stocks | | | | | | | | |
Financials—29.4% | | | | | | | | |
Alexandria Real Estate Equities, Inc. | | | 325 | | | $ | 24 | |
Allied World Assurance Co. Holdings, Ltd.† | | | 225 | | | | 18 | |
Alterra Capital Holdings, Ltd.† | | | 935 | | | | 22 | |
Bank of the Ozarks, Inc. | | | 565 | | | | 17 | |
BioMed Realty Trust, Inc. | | | 1,110 | | | | 21 | |
Comerica, Inc. | | | 825 | | | | 25 | |
CVB Financial Corporation | | | 1,060 | | | | 12 | |
East West Bancorp, Inc. | | | 945 | | | | 22 | |
EastGroup Properties, Inc. | | | 330 | | | | 18 | |
Education Realty Trust, Inc. | | | 1,840 | | | | 20 | |
*Forest City Enterprises, Inc. Class “A” | | | 1,315 | | | | 19 | |
Hancock Holding Co. | | | 664 | | | | 20 | |
Highwoods Properties, Inc. | | | 605 | | | | 20 | |
LaSalle Hotel Properties | | | 705 | | | | 21 | |
Mid-America Apartment Communities, Inc. | | | 320 | | | | 22 | |
*National Financial Partners Corporation | | | 1,245 | | | | 17 | |
National Retail Properties, Inc. | | | 910 | | | | 26 | |
Old National Bancorp | | | 2,205 | | | | 26 | |
PacWest Bancorp | | | 914 | | | | 22 | |
Pebblebrook Hotel Trust | | | 743 | | | | 17 | |
People’s United Financial, Inc. | | | 2,740 | | | | 32 | |
ProAssurance Corporation | | | 260 | | | | 23 | |
Prosperity Bancshares, Inc. | | | 555 | | | | 23 | |
Realty Income Corporation | | | 530 | | | | 22 | |
SL Green Realty Corporation | | | 430 | | | | 35 | |
Susquehanna Bancshares, Inc. | | | 1,935 | | | | 20 | |
The Hanover Insurance Group, Inc. | | | 390 | | | | 15 | |
Unum Group | | | 775 | | | | 15 | |
Validus Holdings, Ltd.† | | | 845 | | | | 27 | |
Webster Financial Corporation | | | 1,210 | | | | 26 | |
*Western Alliance Bancorp | | | 2,045 | | | | 19 | |
| | | | | | | | |
| | | | | | | 666 | |
| | | | | | | | |
Industrials—15.5% | | | | | | | | |
Belden, Inc. | | | 805 | | | | 27 | |
Cubic Corporation | | | 375 | | | | 18 | |
EMCOR Group, Inc. | | | 925 | | | | 26 | |
ESCO Technologies, Inc. | | | 770 | | | | 28 | |
G&K Services, Inc. | | | 650 | | | | 20 | |
Hubbell, Inc. Class “B” | | | 385 | | | | 30 | |
Interface, Inc. | | | 1,195 | | | | 16 | |
*Moog, Inc. | | | 715 | | | | 29 | |
Pall Corporation | | | 490 | | | | 27 | |
*Polypore International, Inc. | | | 590 | | | | 24 | |
Quanex Building Products Corporation | | | 1,070 | | | | 19 | |
Robbins & Myers, Inc. | | | 625 | | | | 26 | |
Snap-On, Inc. | | | 335 | | | | 21 | |
TAL International Group, Inc. | | | 465 | | | | 16 | |
*Tetra Tech, Inc. | | | 919 | | | | 24 | |
| | | | | | | | |
| | | | | | | 351 | |
| | | | | | | | |
Consumer Discretionary—13.3% | | | | | | | | |
Autoliv, Inc. | | | 365 | | | | 20 | |
Chico’s FAS, Inc. | | | 1,425 | | | | 21 | |
Core-Mark Holding Co., Inc. | | | 280 | | | | 13 | |
H&R Block, Inc. | | | 1,145 | | | | 18 | |
Matthews International Corporation | | | 750 | | | | 24 | |
Meredith Corporation | | | 755 | | | | 24 | |
Newell Rubbermaid, Inc. | | | 1,260 | | | | 23 | |
Pier 1 Imports, Inc. | | | 1,565 | | | | 26 | |
| | |
Common Stocks—(continued) | | | | | | | | |
Consumer Discretionary—(continued) | | | | | | | | |
*Pinnacle Entertainment, Inc. | | | 2,135 | | | $ | 20 | |
Regis Corporation | | | 1,255 | | | | 23 | |
*The Children’s Place Retail Stores, Inc. | | | 395 | | | | 20 | |
The Men’s Wearhouse, Inc. | | | 730 | | | | 21 | |
*WMS Industries, Inc. | | | 960 | | | | 19 | |
Wyndham Worldwide Corporation | | | 530 | | | | 28 | |
| | | | | | | | |
| | | | | | | 300 | |
| | | | | | | | |
Information Technology—10.3% | | | | | | | | |
ADTRAN, Inc. | | | 768 | | | | 23 | |
*Atmel Corporation | | | 2,290 | | | | 15 | |
*Cadence Design Systems, Inc. | | | 1,030 | | | | 11 | |
*Digital River, Inc. | | | 785 | | | | 13 | |
Earthlink, Inc. | | | 3,360 | | | | 25 | |
*Ingram Micro, Inc. Class “A” | | | 1,200 | | | | 21 | |
*Integrated Device Technology, Inc. | | | 4,000 | | | | 22 | |
j2 Global Communications, Inc. | | | 630 | | | | 17 | |
*Monolithic Power Systems, Inc. | | | 1,233 | | | | 25 | |
*Parametric Technology Corporation | | | 1,010 | | | | 21 | |
*Progress Software Corporation | | | 900 | | | | 19 | |
*VeriSign, Inc. | | | 500 | | | | 22 | |
| | | | | | | | |
| | | | | | | 234 | |
| | | | | | | | |
Utilities—8.2% | | | | | | | | |
ALLETE, Inc. | | | 525 | | | | 22 | |
American Water Works Co., Inc. | | | 830 | | | | 28 | |
Cleco Corporation | | | 640 | | | | 27 | |
Northwest Natural Gas Co. | | | 435 | | | | 21 | |
NV Energy, Inc. | | | 1,280 | | | | 22 | |
Southwest Gas Corporation | | | 620 | | | | 27 | |
WGL Holdings, Inc. | | | 480 | | | | 19 | |
Wisconsin Energy Corporation | | | 500 | | | | 20 | |
| | | | | | | | |
| | | | | | | 186 | |
| | | | | | | | |
Materials—6.6% | | | | | | | | |
Airgas, Inc. | | | 250 | | | | 21 | |
Carpenter Technology Corporation | | | 270 | | | | 13 | |
FMC Corporation | | | 460 | | | | 25 | |
Minerals Technologies, Inc. | | | 265 | | | | 17 | |
PolyOne Corporation | | | 1,210 | | | | 17 | |
*RTI International Metals, Inc. | | | 505 | | | | 11 | |
Sensient Technologies Corporation | | | 420 | | | | 15 | |
Silgan Holdings, Inc. | | | 485 | | | | 21 | |
Steel Dynamics, Inc. | | | 770 | | | | 9 | |
| | | | | | | | |
| | | | | | | 149 | |
| | | | | | | | |
Energy—5.7% | | | | | | | | |
Berry Petroleum Co. | | | 175 | | | | 7 | |
*Key Energy Services, Inc. | | | 1,825 | | | | 14 | |
*Magnum Hunter Resources Corporation | | | 3,266 | | | | 14 | |
*Northern Oil and Gas, Inc. | | | 760 | | | | 12 | |
*Rowan Cos. plc Class “A”† | | | 715 | | | | 23 | |
SM Energy Co. | | | 315 | | | | 16 | |
*Superior Energy Services, Inc. | | | 800 | | | | 16 | |
*Swift Energy Co. | | | 880 | | | | 16 | |
* TETRA Technologies, Inc. | | | 1,575 | | | | 11 | |
| | | | | | | | |
| | | | | | | 129 | |
| | | | | | | | |
Health Care—5.3% | | | | | | | | |
CONMED Corporation | | | 480 | | | | 13 | |
*Greatbatch, Inc. | | | 540 | | | | 12 | |
See accompanying Notes to Portfolio of Investments.
June 30, 2012 | William Blair Funds 79 |
Small-Mid Cap Value Fund
Portfolio of Investments, June 30, 2012 (all dollar amounts in thousands) (unaudited)
| | | | | | | | |
Issuer | | Shares | | | Value | |
| | |
Common Stocks—(continued) | | | | | | | | |
Health Care—(continued) | | | | | | | | |
*HealthSouth Corporation | | | 730 | | | $ | 17 | |
Hill-Rom Holdings, Inc. | | | 635 | | | | 20 | |
*Magellan Health Services, Inc. | | | 295 | | | | 14 | |
*Mednax, Inc. | | | 365 | | | | 25 | |
*Mettler-Toledo International, Inc. | | | 130 | | | | 20 | |
| | | | | | | | |
| | | | | | | 121 | |
| | | | | | | | |
Consumer Staples—2.9% | | | | | | | | |
Ingredion, Inc. | | | 565 | | | | 28 | |
J&J Snack Foods Corporation | | | 260 | | | | 16 | |
Spartan Stores, Inc. | | | 1,225 | | | | 22 | |
| | | | | | | | |
| | | | | | | 66 | |
| | | | | | | | |
Telecommunication Services—0.8% | | | | | | | | |
*tw telecom, Inc. | | | 650 | | | | 17 | |
| | | | | | | | |
Total Common Stocks—98.0%
(cost $2,067) | | | | 2,219 | |
Total Investments—98.0%
(cost $2,067) | | | | 2,219 | |
Cash and other assets, less liabilities—2.0% | | | | 46 | |
| | | | | | | | |
Net assets—100.0% | | | $ | 2,265 | |
| | | | | | | | |
† = U.S. listed foreign security
* Non-income producing securities
See accompanying Notes to Portfolio of Investments.
80 Semi-Annual Report | June 30, 2012 |
Fixed Income Markets Overview
Fixed Income Summary
The global capital markets continued to experience elevated levels of volatility during the first half of 2012 as investors focused on the ongoing European debt crisis. Despite the volatility, global equities have gained year-to-date, with U.S. stocks outperforming their non-U.S. counterparts. U.S. dollar-based, investment-grade fixed income instruments have also gained as interest rates declined to record-low levels as investors continue to flock to high-quality assets.
The European debt crisis took center stage during the second quarter and drove volatility as attention shifted to events in Greece and Spain. Greece held two elections to form a new government during the second quarter after a radical anti-austerity political bloc, the Syriza party, gained popularity and threatened to reverse the country’s austerity progress. Investors assigned an increased probability that Greece could exit the euro amid the uncertainty of the Greek elections. Ultimately, the pro-austerity New Democracy party emerged as the country’s preeminent political party. In Spain, the Spanish banking crisis added volatility as Spanish government officials sought financial aid packages to recapitalize its banks.
Within the U.S., it was revealed that the labor markets continued to show signs of weakness and hampered growth. The market is beginning to show signs of concern over the “fiscal cliff,” which refers to the automatic tax increases and spending cuts scheduled to start in the beginning of 2013 unless politicians agree to a compromise to extend the beginning of the tax increases and spending cuts. Another noteworthy event was the J.P. Morgan trading loss. The trading loss was not meaningful because of its size (initially reported at $2 billion), but it was meaningful because it highlighted the difficulties of monitoring activities at large banking institutions with regulations that seek to curb risk-taking at banks.
The Federal Open Market Committee (FOMC) remained accommodative and continued its unconventional easing programs. The FOMC continued to state that conditions “warrant exceptionally low levels for the federal funds rate at least through late-2014.” At its June 20 meeting, the FOMC announced plans to extend its “Operation Twist” program, which was scheduled to expire on June 30, through the end of the year. The FOMC also announced plans to continue to reinvest principal from its agency MBS portfolio.
Fixed income instruments have gained as investors continue to flock to safe haven assets amid the uncertainties in Europe and the U.S. High yield bonds and emerging market debt have been the strongest-performing segments of the bond market. Corporate bonds and Treasury Inflation-Protected Securities (TIPS) have been the best-performing segment of the investment-grade fixed-income market. The 10-year Treasury note yielded 1.65% at the end of June, 23 basis points lower year-to-date.
June 30, 2012 | William Blair Funds 81 |

Christopher T. Vincent

Paul J. Sularz
BOND FUND
The Bond Fund seeks to outperform the Barclays Capital U.S. Aggregate Bond Index by maximizing total return through a combination of income and capital appreciation.
AN OVERVIEW FROM THE PORTFOLIO MANAGERS
Year-to-date the Fund gained 3.93%, outpacing its benchmark, the Barclay’s Capital U.S. Aggregate Bond Index, which rose 2.37%.
Security selection has been the primary driver of performance year-to-date. Results were particularly strong among the Fund’s corporate bond holdings. The Fund has maintained an overweight exposure to financials that has been additive as investment-grade financials have been strong performers year-to-date. Positioning within the Industrial sector was also additive. Within the Industrials sector, we had exposure to high-yield issuers, and that allocation contributed to results as high-yield issuers have outperformed investment-grade issuers year-to-date.
In addition, security selection within the Fund’s mortgage-backed securities added value year-to-date. The pools owned provided incremental yield over Treasuries and experienced manageable prepayment speeds.
Another factor that affected performance favorably was the Fund’s allocation to longer-dated U.S. TIPS (Treasury Inflation-Protected Securities). These positions benefitted as interest rates declined and Treasury instruments benefitted from a global flight to quality.
Sector positioning has impacted performance favorably year-to-date. The William Blair Bond Fund is structured to be underweight to Treasury instruments, which have been the weakest-performing segment of the market, and to be overweight in corporate and mortgage-backed securities, both of which have outperformed Treasuries year-to-date.
Outlook and Positioning
We are positioned neutral on interest rates with the portfolio’s duration in-line with that of the benchmark. We believe that interest rates will remain range-bound at lower levels over the next two years, as the FOMC (Federal Open Market Committee) continues to state that current conditions “warrant exceptionally low levels for the federal funds rate at least through late 2014.”
We are overweight agency mortgage-backed securities. We seek pools with better-than-market convexity characteristics through favoring pools with above-market coupon rates comprised of either low loan balances or seasoned pools and avoiding the generic, current-coupon pools that dominate the Mortgage Index. We view specified pool mortgage-backed securities as a cheap alternative to agency debentures (to which we are underweight).
We are overweight investment-grade corporate bonds, as we believe the sector continues to offer good relative value. Within the sector, we are overweight industrials and financials. We emphasize companies with positive free cash flow and strong and experienced management teams. We believe that certain names in the financial sector offer value, and we are encouraged by the improvement of balance sheets within the sector despite the regulatory issues facing the industry. We hold an allocation to high yield bonds near its 10% maximum. We emphasize higher quality (BB- and B-rated) industrial issuers.
We hold an allocation to TIPS, as we find its embedded option on unexpected inflation to be an appealing feature versus owning nominal Treasury notes.
82 Semi-Annual Report | June 30, 2012 |
Bond Fund
Performance Highlights (Unaudited)
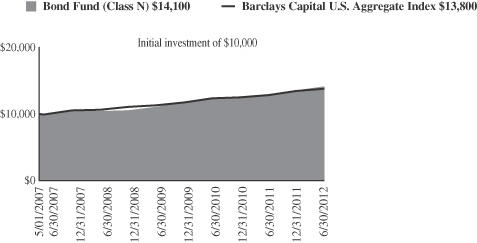
Average Annual Total Return at 6/30/2012
| | | | | | | | | | | | | | | | | | | | |
| | | Year
To Date | | | 1
year | | | 3
year | | | 5
year | | | Since
Inception(a) | |
Class N | | | 3.93 | % | | | 8.49 | % | | | 8.42 | % | | | 7.30 | % | | | 6.81 | % |
Class I | | | 4.03 | | | | 8.60 | | | | 8.59 | | | | 7.46 | | | | 6.97 | |
Barclays Capital U.S. Aggregate Bond Index | | | 2.37 | | | | 7.47 | | | | 6.93 | | | | 6.79 | | | | 6.35 | |
| | (a) | | For the period from May 1, 2007 (Commencement of Operations) to June 30, 2012. | |
Performance cited represents past performance. Past performance does not guarantee future results and current performance may be lower or higher than the data quoted. Results shown are average annual total returns, which assume reinvestment of dividends and capital gains. Investment returns and principal will fluctuate and you may have a gain or loss when you sell shares. For the most current month-end performance information, please call 1-800-742-7272, or visit our Web site at www.williamblairfunds.com. From time to time, the investment advisor may waive fees or reimburse expenses for the Fund. Without these waivers, performance would be lower. Class N shares are available to the general public without a sales load. Class I shares are available to certain institutional investors and advisory clients of William Blair & Company, L.L.C., without a sales load or distribution (12b-1) fees.
The performance highlights and graph presented above do not reflect the deduction of taxes that a shareholder would pay on fund distributions or the redemption of fund shares.
The Barclays Capital U.S. Aggregate Bond Index indicates broad intermediate government/corporate bond market performance.
This report identifies the Fund’s investments on June 30, 2012. These holdings are subject to change. Not all investments in the Fund performed the same, nor is there any guarantee that these investments will perform as well in the future. Market forecasts provided in this report may not necessarily come to pass.
Sector Diversification (Unaudited)
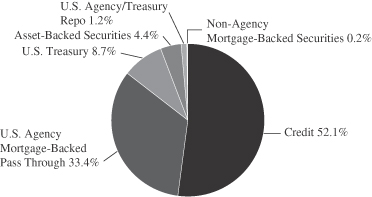
The sector diversification shown is based on the total investments.
June 30, 2012 | William Blair Funds 83 |
Bond Fund
Portfolio of Investments, June 30, 2012 (all amounts in thousands) (unaudited)
| | | | | | | | | | |
Issuer | | Principal
Amount | | | Value | |
|
U.S. Government and U.S. Government Agency—42.2% | |
U.S. Treasury Inflation Indexed Notes/Bonds—7.7% | | | | | | | | | | |
U.S. Treasury Inflation Indexed Note, 2.375%, due 1/15/17 | | | | $ | 5,881 | | | $ | 6,788 | |
U.S. Treasury Inflation Indexed Bond, 3.875%, due 4/15/29 | | | | | 8,538 | | | | 13,795 | |
| | | | | | | | | | |
Total U.S. Treasury Inflation Indexed Notes/Bonds | | | | | | | | | 20,583 | |
| | | | | | | | | | |
U.S. Treasury—1.1% | | | | | | | | | | |
U.S. Treasury Bond,
3.125%, due 2/15/42 | | | | | 525 | | | | 564 | |
U.S. Treasury Strip Principal,
0.000%, due 5/15/20 | | | | | 2,575 | | | | 2,319 | |
| | | | | | | | | | |
Total U.S. Treasury Obligations | | | | | | | | | 2,883 | |
| | | | | | | | | | |
Government National Mortgage Association (GNMA)—3.3% | | | | | | | | | | |
#344834, 6.250%, due 7/15/13 | | | | | 5 | | | | 5 | |
#344902, 6.250%, due 3/15/14 | | | | | 6 | | | | 6 | |
#623162, 6.500%, due 7/15/18 | | | | | 41 | | | | 46 | |
#616250, 6.000%, due 2/15/24 | | | | | 10 | | | | 11 | |
#422470, 7.500%, due 3/15/26 | | | | | 1 | | | | 1 | |
#509405, 7.500%, due 8/15/29 | | | | | 1 | | | | 1 | |
GNR 2004-2 M5,
4.891%, due 7/16/34 | | | | | 125 | | | | 138 | |
GNR 2006-67 GB,
4.741%, due 9/16/34, VRN | | | | | 1,620 | | | | 1,679 | |
#699118, 6.000%, due 9/15/38 | | | | | 6,152 | | | | 6,964 | |
| | | | | | | | | | |
Total GNMA Mortgage Obligations | | | | | | | | | 8,851 | |
| | | | | | | | | | |
Federal Home Loan Mortgage Corp. (FHLMC)—8.2% | | | | | | | | | | |
#G90024, 7.000%, due 1/20/13 | | | | | 3 | | | | 3 | |
#J14232, 3.500%, due 1/1/21 | | | | | 1,345 | | | | 1,416 | |
#J16051, 4.500%, due 7/1/26 | | | | | 1,338 | | | | 1,457 | |
#G01728, 7.500%, due 7/1/32 | | | | | 273 | | | | 334 | |
#C01385, 6.500%, due 8/1/32 | | | | | 278 | | | | 316 | |
#C01623, 5.500%, due 9/1/33 | | | | | 409 | | | | 449 | |
#A15039, 5.500%, due 10/1/33 | | | | | 7 | | | | 8 | |
#G01843, 6.000%, due 6/1/35 | | | | | 77 | | | | 87 | |
#G02141, 6.000%, due 3/1/36 | | | | | 1,573 | | | | 1,756 | |
#A62179, 6.000%, due 6/1/37 | | | | | 818 | | | | 914 | |
#A63539, 6.000%, due 7/1/37 | | | | | 1,035 | | | | 1,156 | |
#A62858, 6.500%, due 7/1/37 | | | | | 558 | | | | 631 | |
#G03170, 6.500%, due 8/1/37 | | | | | 1,275 | | | | 1,441 | |
#A66843, 6.500%, due 10/1/37 | | | | | 1,919 | | | | 2,188 | |
#A78138, 5.500%, due 6/1/38 | | | | | 1,147 | | | | 1,279 | |
#G04544, 6.000%, due 8/1/38 | | | | | 3,614 | | | | 4,010 | |
#A81799, 6.500%, due 9/1/38 | | | | | 2,334 | | | | 2,661 | |
#C03665, 9.000%, due 4/1/41 | | | | | 1,672 | | | | 2,080 | |
| | | | | | | | | | |
Total FHLMC Mortgage Obligations | | | | | | | | | 22,186 | |
| | | | | | | | | | |
Federal National Mortgage Association (FNMA)—21.9% | | | | | | | | | | |
#124947, 7.000%, due 7/1/13 | | | | | 1 | | | | 1 | |
#576553, 8.000%, due 2/1/16 | | | | | 10 | | | | 11 | |
#580793, 6.000%, due 4/1/16 | | | | | 2 | | | | 2 | |
#624506, 6.000%, due 1/1/17 | | | | | 2 | | | | 3 | |
| | |
U.S. Government and U.S. Government Agency—42.2%—(continued) | | | | | | | | |
Federal National Mortgage Association (FNMA)—(continued) | | | | | | | | | | |
#679247, 7.000%, due 8/1/17 | | | | $ | 9 | | | $ | 10 | |
#689612, 5.000%, due 5/1/18 | | | | | 263 | | | | 287 | |
#695910, 5.000%, due 5/1/18 | | | | | 551 | | | | 602 | |
#697593, 5.000%, due 5/1/18 | | | | | 479 | | | | 523 | |
#770395, 5.000%, due 4/1/19 | | | | | 9 | | | | 10 | |
#745735, 5.000%, due 3/1/21 | | | | | 600 | | | | 653 | |
#900725, 6.000%, due 8/1/21 | | | | | 137 | | | | 151 | |
#893325, 7.000%, due 9/1/21 | | | | | 9 | | | | 10 | |
#AA2924, 4.500%, due 4/1/24 | | | | | 920 | | | | 1,010 | |
#AD8164, 4.000%, due 8/1/25 | | | | | 63 | | | | 69 | |
#255956, 5.500%, due 10/1/25 | | | | | 62 | | | | 68 | |
#AB2256, 3.500%, due 2/1/26 | | | | | 1,294 | | | | 1,394 | |
#890329, 4.000%, due 4/1/26 | | | | | 518 | | | | 562 | |
#AI9811, 4.500%, due 8/1/26 | | | | | 550 | | | | 604 | |
#AH9564, 3.500%, due 9/1/26 | | | | | 1,126 | | | | 1,213 | |
#AJ8149, 3.500%, due 12/1/26 | | | | | 1,358 | | | | 1,462 | |
#AB4818, 4.000%, due 4/1/27 | | | | | 1,274 | | | | 1,390 | |
#252925, 7.500%, due 12/1/29 | | | | | 3 | | | | 3 | |
#535977, 6.500%, due 4/1/31 | | | | | 24 | | | | 28 | |
#253907, 7.000%, due 7/1/31 | | | | | 4 | | | | 5 | |
#587849, 6.500%, due 11/1/31 | | | | | 35 | | | | 40 | |
#545437, 7.000%, due 2/1/32 | | | | | 139 | | | | 162 | |
#545759, 6.500%, due 7/1/32 | | | | | 1,511 | | | | 1,730 | |
#678007, 6.000%, due 9/1/32 | | | | | 27 | | | | 30 | |
#254548, 5.500%, due 12/1/32 | | | | | 68 | | | | 75 | |
#684601, 6.000%, due 3/1/33 | | | | | 1,479 | | | | 1,665 | |
#708993, 5.000%, due 6/1/33 | | | | | 86 | | | | 96 | |
#190340, 5.000%, due 9/1/33 | | | | | 218 | | | | 237 | |
#254868, 5.000%, due 9/1/33 | | | | | 22 | | | | 24 | |
#739243, 6.000%, due 9/1/33 | | | | | 1,653 | | | | 1,861 | |
#739331, 6.000%, due 9/1/33 | | | | | 787 | | | | 886 | |
#555800, 5.500%, due 10/1/33 | | | | | 237 | | | | 261 | |
#555946, 5.500%, due 11/1/33 | | | | | 715 | | | | 800 | |
#756153, 5.500%, due 11/1/33 | | | | | 1,739 | | | | 1,932 | |
#725017, 5.500%, due 12/1/33 | | | | | 83 | | | | 93 | |
#725205, 5.000%, due 3/1/34 | | | | | 2,779 | | | | 3,024 | |
#725232, 5.000%, due 3/1/34 | | | | | 3,010 | | | | 3,275 | |
#725238, 5.000%, due 3/1/34 | | | | | 1,042 | | | | 1,134 | |
#763798, 5.500%, due 3/1/34 | | | | | 322 | | | | 358 | |
#725611, 5.500%, due 6/1/34 | | | | | 357 | | | | 393 | |
#783786, 5.500%, due 7/1/34 | | | | | 294 | | | | 329 | |
#786546, 6.000%, due 7/1/34 | | | | | 734 | | | | 825 | |
#787816, 6.000%, due 7/1/34 | | | | | 769 | | | | 865 | |
#190353, 5.000%, due 8/1/34 | | | | | 322 | | | | 350 | |
#794474, 6.000%, due 10/1/34 | | | | | 159 | | | | 179 | |
#745092, 6.500%, due 7/1/35 | | | | | 1,054 | | | | 1,206 | |
#357944, 6.000%, due 9/1/35 | | | | | 89 | | | | 100 | |
#829306, 6.000%, due 9/1/35 | | | | | 1,197 | | | | 1,340 | |
#836140, 5.500%, due 10/1/35 | | | | | 118 | | | | 132 | |
#843487, 6.000%, due 10/1/35 | | | | | 225 | | | | 252 | |
#849191, 6.000%, due 1/1/36 | | | | | 491 | | | | 550 | |
#848782, 6.500%, due 1/1/36 | | | | | 661 | | | | 750 | |
#745349, 6.500%, due 2/1/36 | | | | | 922 | | | | 1,054 | |
#888305, 7.000%, due 3/1/36 | | | | | 25 | | | | 29 | |
#895637, 6.500%, due 5/1/36 | | | | | 375 | | | | 426 | |
#831540, 6.000%, due 6/1/36 | | | | | 139 | | | | 155 | |
#745802, 6.000%, due 7/1/36 | | | | | 496 | | | | 555 | |
See accompanying Notes to Portfolio of Investments.
84 Semi-Annual Report | June 30, 2012 |
Bond Fund
Portfolio of Investments, June 30, 2012 (all amounts in thousands) (unaudited)
| | | | | | | | | | | | |
Issuer | | NRSRO
Rating | | | Principal
Amount | | | Value | |
U.S. Government and U.S. Government
Agency—42.2%—(continued) | |
Federal National Mortgage Association (FNMA)—(continued) | | | | | | | | | | | | |
#886220, 6.000%, due 7/1/36 | | | | | | $ | 1,071 | | | $ | 1,199 | |
#893318, 6.500%, due 8/1/36 | | | | | | | 182 | | | | 207 | |
#902974, 6.000%, due 12/1/36 | | | | | | | 1,078 | | | | 1,202 | |
#909480, 6.000%, due 2/1/37 | | | | | | | 1,061 | | | | 1,188 | |
#938440, 6.000%, due 7/1/37 | | | | | | | 504 | | | | 562 | |
#928561, 6.000%, due 8/1/37 | | | | | | | 595 | | | | 666 | |
#948689, 6.000%, due 8/1/37 | | | | | | | 1,084 | | | | 1,206 | |
#946646, 6.000%, due 9/1/37 | | | | | | | 302 | | | | 338 | |
#888967, 6.000%, due 12/1/37 | | | | | | | 2,010 | | | | 2,250 | |
#889385, 6.000%, due 2/1/38 | | | | | | | 637 | | | | 713 | |
#962058, 6.500%, due 3/1/38 | | | | | | | 4,014 | | | | 4,598 | |
#934006, 6.500%, due 9/1/38 | | | | | | | 1,367 | | | | 1,566 | |
#986856, 6.500%, due 9/1/38 | | | | | | | 1,075 | | | | 1,221 | |
#991911, 7.000%, due 11/1/38 | | | | | | | 801 | | | | 916 | |
#931492, 6.000%, due 7/1/39 | | | | | | | 341 | | | | 382 | |
#AA6898, 6.000%, due 7/1/39 | | | | | | | 1,769 | | | | 1,980 | |
#AL0913, 6.000%, due 7/1/41 | | | | | | | 1,250 | | | | 1,393 | |
| | | | | | | | | | | | |
Total FNMA Mortgage Obligations | | | | | | | | | | | 58,831 | |
| | | | | | | | | | | | |
Non-Agency Mortgage-Backed Obligations—0.2% | | | | | | | | | | | | |
First Plus Home Loan Trust,
1997-4, Tranche M1,
7.640%, 9/11/23§** | | | D | | | | 199 | | | | 167 | |
First Horizon Asset Securities, Inc., 2004-AR4, Tranche 3A1,
2.660%, 8/25/34, VRN | | | AA | | | | 400 | | | | 368 | |
| | | | | | | | | | | | |
Total Non-Agency Mortgage-Backed Obligations | | | | | | | | | | | 535 | |
| | | | | | | | | | | | |
Asset-Backed Securities—3.0% | | | | | | | | | | | | |
Avis Budget Rental Car Funding AESOP LLC—144A,
2009-1A, Tranche A,
9.310%, 10/20/13 | | | Aa1 | | | | 1,500 | | | | 1,522 | |
Hertz Vehicle Financing LLC—144A, 2009-2A, Tranche A1,
4.260%, 3/25/14 | | | Aaa | | | | 2,280 | | | | 2,321 | |
Hertz Vehicle Financing LLC—144A, 2009-2A, Tranche A2,
5.290%, 3/25/16 | | | Aaa | | | | 600 | | | | 659 | |
Avis Budget Rental Car Funding AESOP LLC—144A,
2010-3A, Tranche A,
4.640%, 5/20/16 | | | Aaa | | | | 100 | | | | 108 | |
Centre Point Funding LLC—144A, 2010-1A, Tranche 1,
5.430%, 7/20/16 | | | A2 | | | | 2,274 | | | | 2,383 | |
Sierra Receivables Funding Co. LLC—144A,
2011-1A, Tranche A,
3.350%, 4/20/26 | | | A | | | | 1,129 | | | | 1,141 | |
| | | | | | | | | | | | |
Total Asset-Backed Securities | | | | | | | | | | | 8,134 | |
| | | | | | | | | | | | |
Corporate Obligations—52.9% | | | | | | | | | | | | |
Yum! Brands, Inc.,
6.250%, due 4/15/16 | | | BBB | | | | 1,400 | | | | 1,615 | |
Corporate Obligations—(continued) | | | | | | | | | | | | |
Supervalu, Inc.,
8.000%, due 5/1/16 | | | B | | | $ | 1,550 | | | $ | 1,569 | |
Ford Motor Credit Co. LLC—144A,
3.984%, due 6/15/16 | | | Baa3 | | | | 2,000 | | | | 2,060 | |
Petrobras International Finance Co.,
6.125%, due 10/6/16 | | | A3 | | | | 1,400 | | | | 1,566 | |
Ally Financial, Inc.,
5.500%, due 2/15/17 | | | BB- | | | | 1,788 | | | | 1,816 | |
American International Group, Inc.,
3.800%, due 3/22/17 | | | A- | | | | 2,375 | | | | 2,421 | |
Penske Truck Leasing Co. L.P.—144A,
3.750%, due 5/11/17 | | | BBB+ | | | | 2,000 | | | | 2,016 | |
ERP Operating L.P.,
5.750%, due 6/15/17 | | | BBB+ | | | | 2,075 | | | | 2,394 | |
JPMorgan Chase & Co.,
6.125%, due 6/27/17 | | | A | | | | 600 | | | | 668 | |
American Express Co.,
6.150%, due 8/28/17 | | | A+ | | | | 2,050 | | | | 2,429 | |
Capital One Financial Corporation,
6.750%, due 9/15/17 | | | A- | | | | 1,900 | | | | 2,254 | |
Exelon Generation Co. LLC,
6.200%, due 10/1/17 | | | Baa1 | | | | 1,160 | | | | 1,337 | |
Toll Brothers Finance Corporation,
8.910%, due 10/15/17 | | | BBB- | | | | 1,050 | | | | 1,291 | |
Motorola Solutions, Inc.,
6.000%, due 11/15/17 | | | BBB | | | | 2,050 | | | | 2,328 | |
Triumph Group, Inc.,
8.000%, due 11/15/17 | | | B+ | | | | 1,550 | | | | 1,689 | |
Kohl’s Corporation,
6.250%, due 12/15/17 | | | BBB+ | | | | 1,000 | | | | 1,200 | |
Cemex S.A.B. de C.V.—144A,
9.000%, due 1/11/18 | | | B+ | | | | 1,000 | | | | 893 | |
American Tower Corporation,
4.500%, due 1/15/18 | | | Baa3 | | | | 1,200 | | | | 1,268 | |
Morgan Stanley,
6.625%, due 4/1/18 | | | A | | | | 2,575 | | | | 2,692 | |
General Electric Capital Corporation,
5.625%, due 5/1/18 | | | AA+ | | | | 1,275 | | | | 1,466 | |
Simon Property Group L.P.,
6.125%, due 5/30/18 | | | A- | | | | 1,800 | | | | 2,130 | |
Petrohawk Energy Corporation,
7.250%, due 8/15/18 | | | A | | | | 1,050 | | | | 1,181 | |
Merrill Lynch & Co., Inc.,
6.875%, due 11/15/18 | | | A | | | | 1,100 | | | | 1,232 | |
CSX Corporation,
7.375%, due 2/1/19 | | | BBB | | | | 870 | | | | 1,110 | |
BHP Billiton Finance USA, Ltd.,
6.500%, due 4/1/19 | | | A+ | | | | 1,300 | | | | 1,655 | |
Owens Corning,
9.000%, due 6/15/19 | | | BBB- | | | | 1,050 | | | | 1,309 | |
Discovery Communications LLC,
5.625%, due 8/15/19 | | | BBB | | | | 550 | | | | 644 | |
Roper Industries, Inc.,
6.250%, due 9/1/19 | | | BBB | | | | 1,850 | | | | 2,202 | |
Republic Services, Inc.,
5.500%, due 9/15/19 | | | BBB | | | | 1,725 | | | | 1,996 | |
Boston Properties L.P.,
5.875%, due 10/15/19 | | | A- | | | | 1,575 | | | | 1,816 | |
Crown Castle International Corporation,
7.125%, due 11/1/19 | | | BB- | | | | 1,550 | | | | 1,662 | |
See accompanying Notes to Portfolio of Investments.
June 30, 2012 | William Blair Funds 85 |
Bond Fund
Portfolio of Investments, June 30, 2012 (all amounts in thousands) (unaudited)
| | | | | | | | | | | | |
Issuer | | NRSRO
Rating | | | Principal
Amount | | | Value | |
Corporate Obligations—(continued) | | | | | | | | | | | | |
Toll Brothers Finance Corporation,
6.750%, due 11/1/19 | | | BBB- | | | $ | 500 | | | $ | 554 | |
Ford Motor Credit Co. LLC,
8.125%, due 1/15/20 | | | Baa3 | | | | 2,050 | | | | 2,504 | |
Jarden Corporation,
7.500%, due 1/15/20 | | | B | | | | 1,550 | | | | 1,693 | |
JBS USA LLC—144A,
8.250%, due 2/1/20 | | | BB | | | | 1,000 | | | | 973 | |
Johnson Controls, Inc.,
5.000%, due 3/30/20 | | | BBB+ | | | | 1,675 | | | | 1,894 | |
The Goldman Sachs Group, Inc.,
6.000%, due 6/15/20 | | | A | | | | 2,575 | | | | 2,749 | |
Commonwealth Edison Co.,
4.000%, due 8/1/20 | | | A- | | | | 1,000 | | | | 1,112 | |
Citigroup, Inc.,
5.375%, due 8/9/20 | | | A | | | | 2,050 | | | | 2,215 | |
Alcoa, Inc.,
6.150%, due 8/15/20 | | | BBB- | | | | 2,050 | | | | 2,158 | |
Omnicom Group, Inc.,
4.450%, due 8/15/20 | | | BBB+ | | | | 2,075 | | | | 2,237 | |
The Goodyear Tire & Rubber Co.,
8.250%, due 8/15/20 | | | B+ | | | | 1,500 | | | | 1,588 | |
Georgia-Pacific LLC—144A,
5.400%, due 11/1/20 | | | A- | | | | 1,500 | | | | 1,741 | |
Progress Energy, Inc.,
4.400%, due 1/15/21 | | | BBB | | | | 1,675 | | | | 1,862 | |
Standard Pacific Corporation,
8.375%, due 1/15/21 | | | B | | | | 1,750 | | | | 1,899 | |
Petrobras International Finance Co.,
5.375%, due 1/27/21 | | | A3 | | | | 1,200 | | | | 1,293 | |
L-3 Communications Corporation,
4.950%, due 2/15/21 | | | BBB- | | | | 2,430 | | | | 2,628 | |
Wyndham Worldwide Corporation,
5.625%, due 3/1/21 | | | BBB- | | | | 1,000 | | | | 1,089 | |
Ball Corporation,
5.750%, due 5/15/21 | | | BB+ | | | | 1,550 | | | | 1,666 | |
Energizer Holdings, Inc.,
4.700%, due 5/19/21 | | | BBB- | | | | 2,050 | | | | 2,161 | |
Discovery Communications LLC,
4.375%, due 6/15/21 | | | BBB | | | | 1,000 | | | | 1,086 | |
O’Reilly Automotive, Inc.,
4.625%, due 9/15/21 | | | BBB | | | | 2,275 | | | | 2,378 | |
Corporation Nacional del Cobre de Chile—144A,
3.875%, due 11/3/21 | | | A1 | | | | 1,900 | | | | 1,999 | |
Itau Unibanco Holding S.A.—144A,
6.200%, due 12/21/21 | | | Baa2 | | | | 2,500 | | | | 2,600 | |
SABMiller Holdings, Inc.—144A,
3.750%, due 1/15/22 | | | BBB+ | | | | 2,000 | | | | 2,127 | |
SLM Corporation,
7.250%, due 1/25/22 | | | BBB- | | | | 2,075 | | | | 2,194 | |
Fresenius Medical Care US Finance II, Inc.—144A,
5.875%, due 1/31/22 | | | BB+ | | | | 1,000 | | | | 1,041 | |
Lamar Media Corp.—144A,
5.875%, due 2/1/22 | | | BB- | | | | 1,000 | | | | 1,025 | |
Masco Corporation,
5.950%, due 3/15/22 | | | BBB- | | | $ | 1,675 | | | $ | 1,724 | |
BE Aerospace, Inc.,
5.250%, due 4/1/22 | | | BB | | | | 1,550 | | | | 1,596 | |
Corporate Obligations—(continued) | | | | | | | | | | | | |
FMG Resources August 2006 Pty Ltd.—144A,
6.875%, due 4/1/22 | | | BB+ | | | $ | 1,050 | | | $ | 1,058 | |
Pinnacle Entertainment, Inc.,
7.750%, due 4/1/22 | | | B | | | | 1,315 | | | | 1,405 | |
Kraft Foods Group, Inc.—144A,
3.500%, due 6/6/22 | | | Baa2 | | | | 1,900 | | | | 1,950 | |
Embraer S.A.,
5.150%, due 6/15/22 | | | BBB- | | | | 2,500 | | | | 2,566 | |
Comcast Corporation,
3.125%, due 7/15/22 | | | BBB+ | | | | 1,000 | | | | 1,005 | |
Continental Airlines 2012-1 Class A Pass Thru Trusts,
4.150%, due 10/11/25 | | | A- | | | | 2,375 | | | | 2,333 | |
The Kroger Co.,
8.000%, due 9/15/29 | | | BBB | | | | 450 | | | | 586 | |
Conoco Funding Co.,
7.250%, due 10/15/31 | | | A1 | | | | 450 | | | | 650 | |
Kohl’s Corporation,
6.000%, due 1/15/33 | | | BBB+ | | | | 1,065 | | | | 1,195 | |
Wisconsin Electric Power Co.,
5.700%, due 12/1/36 | | | A+ | | | | 525 | | | | 667 | |
Comcast Corporation,
6.450%, due 3/15/37 | | | BBB+ | | | | 650 | | | | 790 | |
Yum! Brands, Inc.,
6.875%, due 11/15/37 | | | BBB | | | | 625 | | | | 828 | |
JPMorgan Chase & Co.,
6.400%, due 5/15/38 | | | A+ | | | | 1,470 | | | | 1,767 | |
COX Communications, Inc.—144A,
6.950%, due 6/1/38 | | | BBB | | | | 370 | | | | 446 | |
General Electric Capital Corporation,
6.875%, due 1/10/39 | | | AA+ | | | | 750 | | | | 968 | |
Abbott Laboratories,
6.000%, due 4/1/39 | | | AA | | | | 2,250 | | | | 2,982 | |
Burlington Northern Santa Fe LLC,
5.750%, due 5/1/40 | | | A3 | | | | 1,565 | | | | 1,866 | |
Illinois Tool Works, Inc.,
4.875%, due 9/15/41 | | | A1 | | | | 900 | | | | 1,025 | |
Union Pacific Corporation,
4.750%, due 9/15/41 | | | A- | | | | 1,450 | | | | 1,573 | |
Aristotle Holding, Inc.—144A,
6.125%, due 11/15/41 | | | BBB+ | | | | 2,500 | | | | 3,038 | |
Philip Morris International, Inc.,
4.375%, due 11/15/41 | | | A | | | | 2,075 | | | | 2,140 | |
Gilead Sciences, Inc.,
5.650%, due 12/1/41 | | | A- | | | | 1,775 | | | | 2,069 | |
Citigroup, Inc.,
5.875%, due 1/30/42 | | | A | | | | 750 | | | | 819 | |
Bank of America Corporation,
5.875%, due 2/7/42 | | | A | | | | 2,375 | | | | 2,602 | |
CSX Corporation,
4.750%, due 5/30/42 | | | BBB | | | | 1,225 | | | | 1,263 | |
Odebrecht Finance Ltd.—144A,
7.125%, due 6/26/42 | | | BBB- | | | $ | 1,000 | | | $ | 995 | |
| | | | | | | | | | | | |
Total Corporate Obligations | | | | | | | | | | | 142,281 | |
| | | | | | | | | | | | |
Total Long-Term Investments—98.3%
(cost $247,901) | | | | 264,284 | |
| | | | | | | | | | | | |
See accompanying Notes to Portfolio of Investments.
86 Semi-Annual Report | June 30, 2012 |
Bond Fund
Portfolio of Investments, June 30, 2012 (all dollar amounts in thousands) (unaudited)
| | | | | | | | | | | | |
Issuer | | NRSRO
Rating | | | Principal
Amount | | | Value | |
| | |
U.S. Government and U.S. Government Agency—42.2%—(continued) | | | | | | | | | |
| | | |
Repurchase Agreement | | | | | | | | | | | | |
Fixed Income Clearing Corporation, 0.100% dated 6/29/12, due 7/2/12, repurchase price $3,157, collateralized by FHLB,
3.650%, due 2/24/32 | | | Aaa | | | $ | 3,157 | | | $ | 3,157 | |
| | | | | | | | | | | | |
Total Repurchase Agreement—1.2%
(cost $3,157) | | | | 3,157 | |
| | | | | | | | | | | | |
Total Investments—99.5%
(cost $251,058) | | | | 267,441 | |
Cash and other assets, less liabilities—0.5% | | | | 1,398 | |
| | | | | | | | | | | | |
Net assets—100.0% | | | $ | 268,839 | |
| | | | | | | | | | | | |
NRSRO = Nationally Recognized Statistical Rating Organization—The credit quality ratings of the securities in the Fund reflect the highest category rating by either Fitch Ratings, Moody’s Investors Service Inc., or Standard & Poor’s, a division of the McGraw-Hill Companies, Inc.
The obligations of certain U. S. Government-sponsored securities are neither issued nor guaranteed by the U. S. Treasury.
VRN = Variable Rate Note
§ = Deemed illiquid pursuant to Liquidity Procedures approved by the Board of Trustees. This holding represents 0.06% of the net assets at June 30, 2012.
** = Fair valued pursuant to Valuation Procedures adopted by the Board of Trustees. This holding represents 0.06% of the Fund’s net assets at June 30, 2012.
See accompanying Notes to Portfolio of Investments.
June 30, 2012 | William Blair Funds 87 |
Christopher T. Vincent
INCOME FUND
The Income Fund seeks a high level of current income with relative stability of principal.
AN OVERVIEW FROM THE PORTFOLIO MANAGER
Year-to-date, the Fund gained 2.94%, outpacing its benchmark, the Barclay’s Capital U.S. Intermediate Government/Credit Bond Index, which rose 2.10%.
Security selection has been the primary driver of performance year-to-date. Results were particularly strong among the Fund’s corporate bond holdings. The Fund has maintained an overweight exposure to financials that has been additive as investment-grade financials have been strong performers year-to-date. Positioning within the industrial sector was also additive.
In addition, security selection within the Fund’s mortgage-backed securities added value year-to-date. The pools owned provided incremental yield over Treasuries and experienced manageable prepayment speeds.
Another factor that affected performance favorably was the Fund’s allocation to longer-dated U.S. TIPS (Treasury Inflation-Protected Security). These positions benefitted as interest rates declined and Treasury instruments benefitted from a global flight to quality.
Sector positioning has impacted performance favorably year-to-date. The William Blair Income Fund is structured to be underweight to Treasury instruments, which have been the weakest-performing segment of the market, and to be overweight to corporate and mortgage-backed securities, both of which have outperformed Treasuries year-to-date.
Outlook and Positioning
We are positioned underweight on interest rates with the portfolio’s duration shorter than that of its benchmark. We believe that interest rates will remain range-bound at lower levels over the next two years, as the FOMC (Federal Open Market Committee) continues to state that current conditions “warrant exceptionally low levels for the federal funds rate at least through late 2014.”
We are overweight agency mortgage-backed securities. We seek pools with better-than-market convexity characteristics through favoring pools with above-market coupon rates comprised of either low loan balances or seasoned pools and avoiding the generic, current-coupon pools that dominate the Mortgage Index. We view specified pool mortgage-backed securities as a cheap alternative to agency debentures (to which we are underweight).
We are overweight investment-grade corporate bonds, as we believe the sector continues to offer good relative value. Within the sector, we are overweight industrials and financials. We emphasize companies with positive free cash flow and strong and experienced management teams. We believe that certain names in the financial sector offer value, and we are encouraged by the improvement of balance sheets within the sector despite the regulatory issues facing the industry.
We hold an allocation to TIPS, as we find its embedded option on unexpected inflation to be an appealing feature versus owning nominal Treasury notes.
88 Semi-Annual Report | June 30, 2012 |
Income Fund
Performance Highlights (Unaudited)
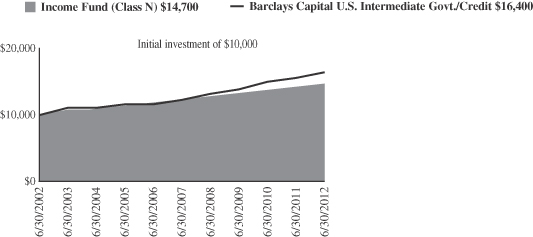
Average Annual Total Return at 6/30/2012
| | | | | | | | | | | | | | | | | | | | |
| | | Year
To Date | | | 1
year | | | 3
year | | | 5
year | | | 10
year | |
Class N | | | 2.94 | % | | | 5.68 | % | | | 6.30 | % | | | 4.37 | % | | | 3.91 | % |
Class I | | | 3.08 | | | | 5.95 | | | | 6.52 | | | | 4.58 | | | | 4.10 | |
Barclays Capital Intermediate Government/Credit Bond Index | | | 2.10 | | | | 5.42 | | | | 5.81 | | | | 6.01 | | | | 5.08 | |
Performance cited represents past performance. Past performance does not guarantee future results and current performance may be lower or higher than the data quoted. Results shown are average annual total returns, which assume reinvestment of dividends and capital gains. Investment returns and principal will fluctuate and you may have a gain or loss when you sell shares. For the most current month-end performance information, please call 1-800-742-7272, or visit our Web site at www.williamblairfunds.com. From time to time, the investment advisor may waive fees or reimburse expenses for the Fund. Without these waivers, performance would be lower. Class N shares are available to the general public without a sales load. Class I shares are available to certain institutional investors and advisory clients of William Blair & Company, L.L.C., without a sales load or distribution (12b-1) or service fees.
The performance highlights and graph presented above do not reflect the deduction of taxes that a shareholder would pay on fund distributions or the redemption of fund shares.
The Barclays Capital Intermediate Government/Credit Bond Index indicates broad intermediate government/corporate bond market performance.
This report identifies the Fund’s investments on June 30, 2012. These holdings are subject to change. Not all investments in the Fund performed the same, nor is there any guarantee that these investments will perform as well in the future. Market forecasts provided in this report may not necessarily come to pass.
Sector Diversification (Unaudited)
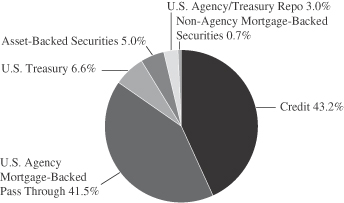
The sector diversification shown is based on the total investments.
June 30, 2012 | William Blair Funds 89 |
Income Fund
Portfolio of Investments, June 30, 2012 (all dollar amounts in thousands) (unaudited)
| | | | | | | | |
Issuer | | Principal
Amount | | | Value | |
|
U.S. Government and U.S. Government Agency—48.4% | |
U.S. Treasury Inflation Indexed Notes/Bonds—5.8% | |
U.S. Treasury Inflation Indexed Note,
2.375%, due 1/15/17 | | $ | 3,993 | | | $ | 4,608 | |
U.S. Treasury Inflation Indexed Note,
1.125%, due 1/15/21 | | | 2,630 | | | | 3,026 | |
| | | | | | | | |
Total U.S. Treasury Inflation Indexed Notes/Bonds | | | | | | | 7,634 | |
| | | | | | | | |
U.S. Treasury—0.8% | | | | | | | | |
U.S. Treasury Strip Principal, 0.000%, due 5/15/20 | | | 1,185 | | | | 1,067 | |
| | | | | | | | |
Government National Mortgage Association (GNMA)—0.1% | |
#780405, 9.500%, due 11/15/17 | | | 95 | | | | 102 | |
#357322, 7.000%, due 9/15/23 | | | 68 | | | | 80 | |
| | | | | | | | |
Total GNMA Mortgage Obligations | | | | | | | 182 | |
| | | | | | | | |
Federal Home Loan Mortgage Corp. (FHLMC)—10.2% | |
#E72924, 7.000%, due 10/1/13 | | | 95 | | | | 95 | |
#E81703, 7.000%, due 5/1/15 | | | 148 | | | | 152 | |
#E81697, 8.000%, due 5/1/15 | | | 382 | | | | 409 | |
#E81908, 8.500%, due 12/1/15 | | | 27 | | | | 28 | |
#J02184, 8.000%, due 4/1/16 | | | 233 | | | | 247 | |
#G90022, 8.000%, due 9/17/16 | | | 122 | | | | 125 | |
#M30028, 5.500%, due 5/1/17 | | | 19 | | | | 20 | |
#E90398, 7.000%, due 5/1/17 | | | 399 | | | | 431 | |
#E96536, 5.000%, due 3/1/18 | | | 403 | | | | 433 | |
#E97112, 4.000%, due 5/1/18 | | | 202 | | | | 218 | |
#B13459, 4.500%, due 4/1/19 | | | 131 | | | | 140 | |
#J14232, 3.500%, due 1/1/21 | | | 1,347 | | | | 1,417 | |
#C67537, 9.500%, due 8/1/21 | | | 2 | | | | 2 | |
#D95621, 6.500%, due 7/1/22 | | | 1,395 | | | | 1,562 | |
#E02913, 5.000%, due 6/1/26 | | | 716 | | | | 770 | |
#J16051, 4.500%, due 7/1/26 | | | 2,480 | | | | 2,700 | |
#A45790, 7.500%, due 5/1/35 | | | 241 | | | | 296 | |
#G02141, 6.000%, due 3/1/36 | | | 787 | | | | 879 | |
#A66843, 6.500%, due 10/1/37 | | | 868 | | | | 990 | |
#A81799, 6.500%, due 9/1/38 | | | 1,309 | | | | 1,492 | |
#C03665, 9.000%, due 4/1/41 | | | 811 | | | | 1,009 | |
| | | | | | | | |
Total FHLMC Mortgage Obligations | | | | | | | 13,415 | |
| | | | | | | | |
Federal National Mortgage Association (FNMA)—31.5% | |
#254788, 6.500%, due 4/1/13 | | | 1 | | | | 1 | |
#725315, 8.000%, due 5/1/13 | | | 11 | | | | 11 | |
#593561, 9.500%, due 8/1/14 | | | 54 | | | | 57 | |
#567027, 7.000%, due 9/1/14 | | | 229 | | | | 235 | |
#567026, 6.500%, due 10/1/14 | | | 156 | | | | 160 | |
#458124, 7.000%, due 12/15/14 | | | 38 | | | | 40 | |
#576554, 8.000%, due 1/1/16 | | | 424 | | | | 459 | |
#576553, 8.000%, due 2/1/16 | | | 606 | | | | 656 | |
#555747, 8.000%, due 5/1/16 | | | 46 | | | | 49 | |
#735569, 8.000%, due 10/1/16 | | | 302 | | | | 326 | |
#725410, 7.500%, due 4/1/17 | | | 130 | | | | 138 | |
#643217, 6.500%, due 6/1/17 | | | 140 | | | | 152 | |
#679247, 7.000%, due 8/1/17 | | | 551 | | | | 609 | |
#685194, 4.500%, due 3/1/18 | | | 707 | | | | 761 | |
#689334, 5.000%, due 3/1/18 | | | 93 | | | | 101 | |
#695910, 5.000%, due 5/1/18 | | | 473 | | | | 516 | |
#740847, 6.000%, due 10/1/18 | | | 329 | | | | 362 | |
#323501, 6.500%, due 1/1/19 | | | 104 | | | | 117 | |
| | | | | | | | | | | | |
Issuer | | NRSRO
Rating | | | Principal
Amount | | | Value | |
|
U.S. Government and U.S. Government
Agency—48.4%—(continued) | |
Federal National Mortgage Association (FNMA)—(continued) | |
#751313, 5.000%, due 3/1/19 | | | | | | $ | 450 | | | $ | 491 | |
#255358, 5.000%, due 9/1/19 | | | | | | | 126 | | | | 137 | |
#852864, 7.000%, due 7/1/20 | | | | | | | 1,144 | | | | 1,269 | |
#458147, 10.000%, due 8/15/20 | | | | | | | 272 | | | | 313 | |
#835563, 7.000%, due 10/1/20 | | | | | | | 451 | | | | 497 | |
#735574, 8.000%, due 3/1/22 | | | | | | | 277 | | | | 322 | |
#679253, 6.000%, due 10/1/22 | | | | | | | 724 | | | | 795 | |
FNR G93-19 SH, 11.234%, due 4/25/23, VRN | | | | | | | 11 | | | | 15 | |
#982878, 4.500%, due 5/1/23 | | | | | | | 855 | | | | 939 | |
#AC5124, 4.000%, due 11/1/24 | | | | | | | 685 | | | | 747 | |
#AC6257, 4.000%, due 12/1/24 | | | | | | | 1,463 | | | | 1,595 | |
#AD8164, 4.000%, due 8/1/25 | | | | | | | 839 | | | | 915 | |
#AE1176, 4.000%, due 8/1/25 | | | | | | | 864 | | | | 942 | |
#255956, 5.500%, due 10/1/25 | | | | | | | 185 | | | | 203 | |
#AB2256, 3.500%, due 2/1/26 | | | | | | | 1,294 | | | | 1,394 | |
#890329, 4.000%, due 4/1/26 | | | | | | | 1,726 | | | | 1,875 | |
#AI4872, 4.500%, due 6/1/26 | | | | | | | 2,052 | | | | 2,252 | |
#AI9811, 4.500%, due 8/1/26 | | | | | | | 825 | | | | 906 | |
#AJ2322, 3.500%, due 10/1/26 | | | | | | | 942 | | | | 1,014 | |
#AJ3203, 4.000%, due 10/1/26 | | | | | | | 1,913 | | | | 2,086 | |
#AJ8149, 3.500%, due 12/1/26 | | | | | | | 2,688 | | | | 2,895 | |
#AJ7724, 4.000%, due 12/1/26 | | | | | | | 952 | | | | 1,038 | |
#256639, 5.000%, due 2/1/27 | | | | | | | 53 | | | | 58 | |
#AB4818, 4.000%, due 4/1/27 | | | | | | | 986 | | | | 1,075 | |
#806458, 8.000%, due 6/1/28 | | | | | | | 216 | | | | 265 | |
#880155, 8.500%, due 7/1/29 | | | | | | | 652 | | | | 814 | |
#797846, 7.000%, due 3/1/32 | | | | | | | 734 | | | | 816 | |
#745519, 8.500%, due 5/1/32 | | | | | | | 217 | | | | 272 | |
#654674, 6.500%, due 9/1/32 | | | | | | | 140 | | | | 160 | |
#733897, 6.500%, due 12/1/32 | | | | | | | 269 | | | | 314 | |
#254693, 5.500%, due 4/1/33 | | | | | | | 32 | | | | 35 | |
#555531, 5.500%, due 6/1/33 | | | | | | | 89 | | | | 98 | |
#555591, 5.500%, due 7/1/33 | | | | | | | 54 | | | | 59 | |
#725231, 5.000%, due 2/1/34 | | | | | | | 667 | | | | 726 | |
#725220, 5.000%, due 3/1/34 | | | | | | | 654 | | | | 711 | |
#725232, 5.000%, due 3/1/34 | | | | | | | 649 | | | | 707 | |
#725238, 5.000%, due 3/1/34 | | | | | | | 359 | | | | 390 | |
#725424, 5.500%, due 4/1/34 | | | | | | | 347 | | | | 381 | |
#255630, 5.000%, due 3/1/35 | | | | | | | 40 | | | | 43 | |
#886220, 6.000%, due 7/1/36 | | | | | | | 763 | | | | 854 | |
#928658, 6.500%, due 9/1/37 | | | | | | | 117 | | | | 133 | |
#889385, 6.000%, due 2/1/38 | | | | | | | 1,486 | | | | 1,664 | |
#962058, 6.500%, due 3/1/38 | | | | | | | 1,406 | | | | 1,611 | |
#991911, 7.000%, due 11/1/38 | | | | | | | 512 | | | | 585 | |
#AL0913, 6.000%, due 7/1/41 | | | | | | | 2,084 | | | | 2,322 | |
| | | | | | | | | | | | |
Total FNMA Mortgage Obligations | | | | | | | | | | | 41,483 | |
| | | | | | | | | | | | |
|
Non-Agency Mortgage-Backed Obligations—0.8% | |
First Plus Home Loan Trust,
1997-4, Tranche M1,
7.640%, 9/11/23**§ | | | D | | | | 676 | | | | 566 | |
First Plus Home Loan Trust,
1997-4, Tranche M2,
7.830%, 9/11/23**§ | | | D | | | | 143 | | | | 104 | |
See accompanying Notes to Portfolio of Investments.
90 Semi-Annual Report | June 30, 2012 |
Income Fund
Portfolio of Investments, June 30, 2012 (all dollar amounts in thousands) (unaudited)
| | | | | | | | | | | | |
Issuer | | NRSRO
Rating | | | Principal
Amount | | | Value | |
|
Non-Agency Mortgage-Backed
Obligations—0.8%—(continued) | |
First Plus Home Loan Trust,
1998-3, Tranche M2,
7.920%, 5/10/24**§ | | | Caa1 | | | $ | 256 | | | $ | 247 | |
Lehman Structured Securities
Corp.—144A,
2004-2, Tranche M1,
2.953%, 2/28/33, VRN§ | | | CCC | | | | 331 | | | | 151 | |
| | | | | | | | | | | | |
Total Non-Agency Mortgage-Backed Obligations | | | | | | | | | | | 1,068 | |
| | | | | | | | | | | | |
| | | |
Asset-Backed Securities—4.3% | | | | | | | | | | | | |
Avis Budget Rental Car Funding AESOP LLC—144A,
2009-1A, Tranche A,
9.310%, 10/20/13 | | | Aa1 | | | | 833 | | | | 846 | |
Hertz Vehicle Financing LLC—144A, 2009-2A, Tranche A1,
4.260%, 3/25/14 | | | Aaa | | | | 1,500 | | | | 1,526 | |
Nissan Auto Receivables Owner Trust, 2012-A, Tranche A2,
0.540%, 10/15/14 | | | Aaa | | | | 1,000 | | | | 1,000 | |
Centre Point Funding LLC—144A, 2010-1A, Tranche 1,
5.430%, 7/20/16 | | | A2 | | | | 1,164 | | | | 1,220 | |
Citibank Omni Master Trust—144A, 2009-A14A, Tranche A14,
2.992%, 8/15/18, VRN | | | Aaa | | | | 1,000 | | | | 1,050 | |
| | | | | | | | | | | | |
Total Asset-Backed Securities | | | | | | | | | | | 5,642 | |
| | | | | | | | | | | | |
| | | |
Corporate Obligations—44.2% | | | | | | | | | | | | |
Bank of America Corporation,
7.375%, due 5/15/14 | | | A | | | | 715 | | | | 769 | |
St. Jude Medical, Inc.,
3.750%, due 7/15/14 | | | A | | | | 500 | | | | 526 | |
American International Group, Inc.,
3.000%, due 3/20/15 | | | A- | | | | 1,000 | | | | 1,005 | |
The Goldman Sachs Group, Inc.,
3.300%, due 5/3/15 | | | A | | | | 600 | | | | 600 | |
General Electric Capital Corporation,
1.625%, due 7/2/15 | | | A1 | | | | 500 | | | | 500 | |
PepsiCo, Inc.,
2.500%, due 5/10/16 | | | Aa3 | | | | 700 | | | | 735 | |
Petrobras International Finance Co.,
6.125%, due 10/6/16 | | | A3 | | | | 1,000 | | | | 1,118 | |
PACCAR Financial Corporation,
1.600%, due 3/15/17 | | | A+ | | | | 1,000 | | | | 1,010 | |
BHP Billiton Finance USA, Ltd.,
5.400%, due 3/29/17 | | | A+ | | | | 1,000 | | | | 1,169 | |
Penske Truck Leasing Co. L.P.—144A,
3.750%, due 5/11/17 | | | BBB+ | | | | 500 | | | | 504 | |
JPMorgan Chase & Co.,
6.125%, due 6/27/17 | | | A | | | | 1,750 | | | | 1,948 | |
Kimberly-Clark Corporation,
6.125%, due 8/1/17 | | | A | | | | 1,000 | | | | 1,225 | |
American Express Co.,
6.150%, due 8/28/17 | | | A+ | | | | 1,500 | | | | 1,777 | |
IBM Corporation,
5.700%, due 9/14/17 | | | AA- | | | | 1,750 | | | | 2,104 | |
Capital One Financial Corporation,
6.750%, due 9/15/17 | | | A- | | | | 1,000 | | | | 1,186 | |
|
Corporate Obligations—44.2%—(continued) | |
Motorola Solutions, Inc.,
6.000%, due 11/15/17 | | | BBB | | | $ | 750 | | | $ | 852 | |
Abbott Laboratories,
5.600%, due 11/30/17 | | | AA | | | | 500 | | | | 605 | |
Wells Fargo & Co.,
5.625%, due 12/11/17 | | | AA- | | | | 750 | | | | 876 | |
American Tower Corporation,
4.500%, due 1/15/18 | | | Baa3 | | | | 500 | | | | 529 | |
Morgan Stanley,
6.625%, due 4/1/18 | | | A | | | | 1,250 | | | | 1,307 | |
General Electric Capital Corporation,
5.625%, due 5/1/18 | | | AA+ | | | | 1,725 | | | | 1,983 | |
Philip Morris International, Inc.,
5.650%, due 5/16/18 | | | A | | | | 1,250 | | | | 1,510 | |
Simon Property Group L.P.,
6.125%, due 5/30/18 | | | A- | | | | 1,000 | | | | 1,183 | |
John Deere Capital Corporation,
5.750%, due 9/10/18 | | | A | | | | 900 | | | | 1,092 | |
Honeywell International, Inc.,
5.000%, due 2/15/19 | | | A | | | | 1,225 | | | | 1,457 | |
The Procter & Gamble Co.,
4.700%, due 2/15/19 | | | AA- | | | | 500 | | | | 593 | |
Unilever Capital Corporation,
4.800%, due 2/15/19 | | | A+ | | | | 665 | | | | 779 | |
Burlington Northern Santa Fe LLC,
4.700%, due 10/1/19 | | | A3 | | | | 1,000 | | | | 1,123 | |
Boston Properties L.P.,
5.875%, due 10/15/19 | | | A- | | | | 1,350 | | | | 1,556 | |
The Goldman Sachs Group, Inc.,
6.000%, due 6/15/20 | | | A | | | | 1,250 | | | | 1,334 | |
Citigroup, Inc.,
5.375%, due 8/9/20 | | | A | | | | 1,000 | | | | 1,081 | |
Alcoa, Inc.,
6.150%, due 8/15/20 | | | BBB- | | | | 1,000 | | | | 1,053 | |
Georgia-Pacific LLC—144A,
5.400%, due 11/1/20 | | | A- | | | | 450 | | | | 522 | |
L-3 Communications Corporation,
4.950%, due 2/15/21 | | | BBB- | | | | 1,000 | | | | 1,081 | |
E.I. du Pont de Nemours & Co.,
4.250%, due 4/1/21 | | | A | | | | 1,000 | | | | 1,142 | |
Energizer Holdings, Inc.,
4.700%, due 5/19/21 | | | BBB- | | | | 750 | | | | 791 | |
Ford Motor Credit Co. LLC,
5.875%, due 8/2/21 | | | Baa3 | | | | 750 | | | | 834 | |
Praxair, Inc.,
3.000%, due 9/1/21 | | | A | | | | 1,000 | | | | 1,030 | |
The Coca-Cola Co.,
3.300%, due 9/1/21 | | | Aa3 | | | | 1,000 | | | | 1,073 | |
O’Reilly Automotive, Inc.,
4.625%, due 9/15/21 | | | BBB | | | | 700 | | | | 732 | |
Verizon Communications, Inc., 3.500%, due 11/1/21 | | | A | | | | 1,000 | | | | 1,065 | |
Corporation Nacional del Cobre de Chile—144A,
3.875%, due 11/3/21 | | | A1 | | | | 1,000 | | | | 1,052 | |
Aristotle Holding, Inc.—144A,
4.750%, due 11/15/21 | | | BBB+ | | | | 650 | | | | 719 | |
Gilead Sciences, Inc.,
4.400%, due 12/1/21 | | | A- | | | | 1,425 | | | | 1,573 | |
Itau Unibanco Holding S.A.—144A,
6.200%, due 12/21/21 | | | Baa2 | | | | 1,000 | | | | 1,040 | |
McDonald’s Corporation,
2.625%, due 1/15/22 | | | A | | | | 1,250 | | | | 1,273 | |
See accompanying Notes to Portfolio of Investments
June 30, 2012 | William Blair Funds 91 |
Income Fund
Portfolio of Investments, June 30, 2012 (all dollar amounts in thousands) (unaudited)
| | | | | | | | | | | | |
Issuer | | NRSRO
Rating | | | Principal
Amount | | | Value | |
|
Corporate Obligations—44.2%—(continued) | |
SLM Corporation,
7.250%, due 1/25/22 | | | BBB- | | | $ | 1,000 | | | $ | 1,057 | |
AT&T, Inc.,
3.000%, due 2/15/22 | | | A2 | | | | 1,500 | | | | 1,524 | |
Masco Corporation,
5.950%, due 3/15/22 | | | BBB- | | | | 1,000 | | | | 1,029 | |
Potomac Electric Power Co.,
3.050%, due 4/1/22 | | | A | | | | 1,000 | | | | 1,033 | |
Caterpillar Financial Services Corporation,
2.850%, due 6/1/22 | | | A | | | | 1,000 | | | | 1,004 | |
United Technologies Corporation,
3.100%, due 6/1/22 | | | A | | | | 1,000 | | | | 1,048 | |
BRF—Brasil Foods S.A.—144A,
5.875%, due 6/6/22 | | | BBB- | | | | 500 | | | | 515 | |
Embraer S.A.,
5.150%, due 6/15/22 | | | BBB- | | | | 1,000 | | | | 1,026 | |
Union Pacific Corporation,
2.950%, due 1/15/23 | | | A- | | | | 1,000 | | | | 1,003 | |
| | | | | | | | | | | | |
Total Corporate Obligations | | | | 58,255 | |
| | | | | | | | | | | | |
Total Long-Term Investments—97.7%
(cost $123,635) | | | | 128,746 | |
| | | | | | | | | | | | |
| | | |
Repurchase Agreement | | | | | | | | | | | | |
Fixed Income Clearing Corporation, 0.100% dated 6/29/12, due 7/2/12, repurchase price $4,056 collateralized by FHLB, 3.650%, due 2/24/32 | | | Aaa | | | | 4,056 | | | | 4,056 | |
| | | | | | | | | | | | |
Total Repurchase Agreement—3.1%
(cost $4,056) | | | | 4,056 | |
| | | | | | | | | | | | |
Total Investments—100.8%
(cost $127,691) | | | | 132,802 | |
Liabilities, plus cash and other assets—(0.8)% | | | | (991 | ) |
| | | | | | | | | | | | |
Net assets—100.0% | | | $ | 131,811 | |
| | | | | | | | | | | | |
NRSRO = Nationally Recognized Statistical Rating Organization—The credit quality ratings of the securities in the Fund reflect the highest category rating by either Fitch Ratings, Moody’s Investors Service Inc., or Standard & Poor’s, a division of the McGraw-Hill Companies, Inc.
The obligations of certain U. S. Government-sponsored securities are neither issued nor guaranteed by the U. S. Treasury.
VRN = Variable Rate Note
** = Fair valued pursuant to Valuation Procedures adopted by the Board of Trustees. These holdings represent 0.70% of the Fund’s net assets at June 30, 2012.
§ = Deemed illiquid pursuant to Liquidity Procedures approved by the Board of Trustees. These holdings represent 0.81% of the net assets at June 30, 2012.
See accompanying Notes to Portfolio of Investments.
92 Semi-Annual Report | June 30, 2012 |
Christopher T. Vincent
Paul J. Sularz
LOW DURATION FUND
The Low Duration Fund seeks to maximize total return. Total return includes both income and capital appreciation.
AN OVERVIEW FROM THE PORTFOLIO MANAGERS
Year-to-date, the Fund gained 1.59%, outpacing its benchmark, the Merrill Lynch 1-Year U.S. Treasuries Index, which rose 0.04%.
Security selection results in the mortgage-backed sector had the largest positive impact on performance year-to-date. The majority of the Fund is invested in seasoned agency (Fannie Mae and Freddie Mac) mortgage-backed securities. The pools employed by the Fund experienced manageable prepayment speeds and earned positive returns during the first quarter.
The Fund’s asset-backed securities (ABS) and corporate bonds were also additive to performance. Within both sectors, we emphasize both fixed- and floating-rate securities, all of which were rated “A” or better from a Nationally Recognized Statistical Rating Organization. These securities benefitted from the incremental yield they offer despite an increase in risk spreads during the quarter.
Finally, the Low Duration Fund has benefitted from the reduction in interest rates that has been experienced year-to-date.
Outlook and Positioning
The Low Duration Fund is structured to earn a competitive yield by taking a little more interest rate risk than money market instruments. Duration is managed within a band of 0.5 – 2.0 years, and all securities must carry a credit rating of “A” or better. Most of the securities we employ are amortizing instruments, meaning they make monthly payments of principal and interest; such a cash flow pattern allows for quicker reinvestment if interest rates were to rise.
Our primary emphasis remains in agency mortgage-backed securities. In the Low Duration Fund, we favor both seasoned and newer-vintage higher-coupon, low loan balance, 15-year pools. We believe these securities will generate steady, predictable cash flows and experience slower prepayment speeds in the current lower interest rate environment.
Within the asset-backed sector, we are allocated to short-dated auto and credit card loan receivable pools originated by “Tier 1” issuers. Some of our asset-backed holdings are floating-rate instruments, which help protect principal in a rising interest rate environment.
In the corporate sector, we favor short-dated, high-quality bonds of large, systemically important financial institutions as well as blue-chip industrials.
June 30, 2012 | William Blair Funds 93 |
Low Duration Fund
Performance Highlights (Unaudited)
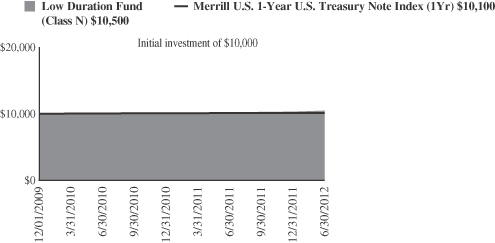
Average Annual Total Return at 6/30/2012
| | | | | | | | | | | | |
| | | Year
To Date | | | 1
year | | | Since
Inception(a) | |
Class N | | | 1.59 | % | | | 2.19 | % | | | 1.77 | % |
Class I | | | 1.67 | | | | 2.34 | | | | 1.91 | |
Merrill Lynch 1-Year U.S. Treasury Note Index | | | 0.04 | | | | 0.26 | | | | 0.50 | |
| | (a) | | For the period from December 1, 2009 (Commencement of Operations) to June 30, 2012. | |
Performance cited represents past performance. Past performance does not guarantee future results and current performance may be lower or higher than the data quoted. Results shown are average annual total returns, which assume reinvestment of dividends and capital gains. Investment returns and principal will fluctuate and you may have a gain or loss when you sell shares. For the most current month-end performance information, please call 1-800-742-7272, or visit our Web site at www.williamblairfunds.com. From time to time, the investment advisor may waive fees or reimburse expenses for the Fund. Without these waivers, performance would be lower. Class N shares are available to the general public without a sales load. Class I shares are available to certain institutional investors and advisory clients of William Blair & Company, L.L.C., without a sales load or distribution (12b-1) fees.
The performance highlights and graph presented above do not reflect the deduction of taxes that a shareholder would pay on fund distributions or the redemption of fund shares.
The Merrill Lynch 1-Year U.S. Treasury Note Index is comprised of a single U.S. Treasury Note issue purchased at the beginning of the month and held for a full month. Each month the index is rebalanced and the issue selected is the outstanding U.S. Treasury Note that matures closest to, but not beyond one year from the rebalancing date.
This report identifies the Fund’s investments on June 30, 2012. These holdings are subject to change. Not all investments in the Fund performed the same, nor is there any guarantee that these investments will perform as well in the future. Market forecasts provided in this report may not necessarily come to pass.
Sector Diversification (Unaudited)
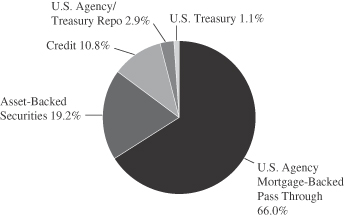
The sector diversification shown is based on the total investments.
94 Semi-Annual Report | June 30, 2012 |
Low Duration Fund
Portfolio of Investments, June 30, 2012 (all dollar amounts in thousands) (unaudited)
| | | | | | | | | | |
Issuer | | | | Principal
Amount | | | Value | |
|
U.S. Government and U.S. Government Agency—66.2% | |
U.S. Treasury Inflation Indexed Notes/Bonds—1.0% | |
U.S. Treasury Inflation Indexed Note, 2.375%, due 1/15/17 | | | | $ | 1,711 | | | $ | 1,975 | |
| | | | | | | | | | |
Government National Mortgage Association (GNMA)—1.5% | | | | | | | | | | |
#002584, 6.000%, due 4/20/13 | | | | | 14 | | | | 15 | |
#623159, 5.000%, due 11/15/13 | | | | | 50 | | | | 54 | |
#628400, 6.000%, due 11/15/13 | | | | | 74 | | | | 76 | |
#002682, 6.500%, due 11/20/13 | | | | | 26 | | | | 28 | |
#623182, 5.000%, due 12/15/13 | | | | | 66 | | | | 72 | |
#781010, 6.500%, due 4/15/14 | | | | | 46 | | | | 48 | |
#002761, 6.000%, due 5/20/14 | | | | | 32 | | | | 35 | |
#002787, 5.500%, due 7/20/14 | | | | | 5 | | | | 5 | |
#781275, 6.000%, due 10/15/14 | | | | | 123 | | | | 128 | |
GNR 2011-24 VA, 3.500%, due 2/20/16 | | | | | 1,427 | | | | 1,513 | |
#561031, 5.500%, due 9/15/16 | | | | | 227 | | | | 248 | |
#003180, 6.000%, due 1/20/17 | | | | | 33 | | | | 36 | |
#781567, 5.000%, due 2/15/18 | | | | | 86 | | | | 92 | |
#606406, 5.000%, due 4/15/18 | | | | | 118 | | | | 129 | |
#003438, 4.500%, due 9/20/18 | | | | | 209 | | | | 227 | |
#003465, 4.500%, due 11/20/18 | | | | | 70 | | | | 75 | |
| | | | | | | | | | |
Total GNMA Mortgage Obligations | | | | | | | | | 2,781 | |
| | | | | | | | | | |
Federal Home Loan Mortgage Corp. (FHLMC)—19.5% | |
#M80982, 5.000%, due 7/1/12 | | | | | 98 | | | | 100 | |
#B18053, 5.000%, due 3/1/15 | | | | | 46 | | | | 48 | |
#G11885, 5.000%, due 1/1/16 | | | | | 155 | | | | 166 | |
#E86134, 5.000%, due 11/1/16 | | | | | 175 | | | | 187 | |
#E96536, 5.000%, due 3/1/18 | | | | | 251 | | | | 270 | |
#E95355, 5.000%, due 4/1/18 | | | | | 338 | | | | 363 | |
#E01377, 4.500%, due 5/1/18 | | | | | 329 | | | | 349 | |
#G11618, 4.500%, due 5/1/18 | | | | | 1,508 | | | | 1,614 | |
#E96700, 5.000%, due 5/1/18 | | | | | 925 | | | | 994 | |
#E96962, 4.000%, due 6/1/18 | | | | | 161 | | | | 174 | |
#E01411, 5.000%, due 7/1/18 | | | | | 171 | | | | 183 | |
#G12024, 4.500%, due 8/1/18 | | | | | 431 | | | | 461 | |
#E99963, 4.500%, due 10/1/18 | | | | | 101 | | | | 108 | |
#E01488, 5.000%, due 10/1/18 | | | | | 375 | | | | 401 | |
#E99895, 5.000%, due 10/1/18 | | | | | 762 | | | | 818 | |
#G12093, 4.500%, due 12/1/18 | | | | | 465 | | | | 497 | |
#B11386, 5.000%, due 12/1/18 | | | | | 155 | | | | 167 | |
#B11362, 5.500%, due 12/1/18 | | | | | 24 | | | | 26 | |
#G13367, 5.500%, due 12/1/18 | | | | | 125 | | | | 136 | |
#E01545, 5.000%, due 1/1/19 | | | | | 211 | | | | 225 | |
#B12826, 4.500%, due 3/1/19 | | | | | 754 | | | | 811 | |
#G11766, 5.000%, due 3/1/19 | | | | | 151 | | | | 162 | |
#G18001, 4.500%, due 7/1/19 | | | | | 209 | | | | 223 | |
#G11596, 5.500%, due 8/1/19 | | | | | 186 | | | | 203 | |
#B16291, 5.000%, due 9/1/19 | | | | | 1,118 | | | | 1,201 | |
#G11605, 5.500%, due 9/1/19 | | | | | 94 | | | | 103 | |
#B17142, 4.500%, due 11/1/19 | | | | | 1,509 | | | | 1,635 | |
#G18045, 5.000%, due 3/1/20 | | | | | 165 | | | | 177 | |
#B19078, 5.000%, due 4/1/20 | | | | | 113 | | | | 121 | |
#G18048, 5.000%, due 4/1/20 | | | | | 110 | | | | 118 | |
#J08152, 5.000%, due 5/1/20 | | | | | 129 | | | | 139 | |
#G11720, 4.500%, due 8/1/20 | | | | | 35 | | | | 37 | |
#G12394, 5.000%, due 5/1/21 | | | | | 208 | | | | 224 | |
#G13296, 5.000%, due 5/1/21 | | | | | 564 | | | | 606 | |
#G12113, 5.500%, due 5/1/21 | | | | | 289 | | | | 316 | |
#G12286, 5.000%, due 7/1/21 | | | | | 113 | | | | 121 | |
| | | | | | | | | | |
Issuer | | | | Principal
Amount | | | Value | |
|
U.S. Government and U.S. Government
Agency—66.2%—(continued) | |
Federal Home Loan Mortgage Corp. (FHLMC)—(continued) | |
#E02322, 5.500%, due 5/1/22 | | | | $ | 77 | | | $ | 84 | |
#J06484, 5.500%, due 11/1/22 | | | | | 664 | | | | 724 | |
#C00351, 8.000%, due 7/1/24 | | | | | 120 | | | | 144 | |
#G13695, 4.000%, due 9/1/24 | | | | | 1,682 | | | | 1,823 | |
#G00363, 8.000%, due 6/1/25 | | | | | 155 | | | | 187 | |
#C80329, 8.000%, due 8/1/25 | | | | | 36 | | | | 44 | |
#J13022, 4.000%, due 9/1/25 | | | | | 3,141 | | | | 3,406 | |
#G14150, 4.500%, due 4/1/26 | | | | | 3,403 | | | | 3,706 | |
#E02912, 5.000%, due 6/1/26 | | | | | 1,541 | | | | 1,664 | |
#E02913, 5.000%, due 6/1/26 | | | | | 1,364 | | | | 1,468 | |
#J16051, 4.500%, due 7/1/26 | | | | | 4,595 | | | | 5,003 | |
#G04424, 6.000%, due 6/1/38 | | | | | 278 | | | | 309 | |
#G04778, 6.000%, due 7/1/38 | | | | | 256 | | | | 286 | |
#A81372, 6.000%, due 8/1/38 | | | | | 132 | | | | 146 | |
#G04544, 6.000%, due 8/1/38 | | | | | 1,807 | | | | 2,005 | |
#G04687, 6.000%, due 9/1/38 | | | | | 373 | | | | 416 | |
#G04745, 6.000%, due 9/1/38 | | | | | 207 | | | | 230 | |
#A81799, 6.500%, due 9/1/38 | | | | | 1,229 | | | | 1,401 | |
| | | | | | | | | | |
Total FHLMC Mortgage Obligations | | | | | | | | | 36,530 | |
| | | | | | | | | | |
Federal National Mortgage Association (FNMA)—44.2% | | | | | | | | | | |
#256224, 5.500%, due 4/1/16 | | | | | 29 | | | | 31 | |
#256559, 5.500%, due 1/1/17 | | | | | 15 | | | | 17 | |
#256606, 5.500%, due 2/1/17 | | | | | 20 | | | | 22 | |
#256646, 5.500%, due 3/1/17 | | | | | 15 | | | | 17 | |
#545898, 5.500%, due 9/1/17 | | | | | 460 | | | | 501 | |
#545899, 5.500%, due 9/1/17 | | | | | 521 | | | | 568 | |
#555029, 5.000%, due 11/1/17 | | | | | 65 | | | | 70 | |
#257067, 5.000%, due 1/1/18 | | | | | 72 | | | | 78 | |
#663692, 5.000%, due 1/1/18 | | | | | 219 | | | | 237 | |
#674713, 5.000%, due 1/1/18 | | | | | 15 | | | | 16 | |
#679305, 5.000%, due 1/1/18 | | | | | 69 | | | | 75 | |
#254591, 5.500%, due 1/1/18 | | | | | 347 | | | | 377 | |
#678938, 5.500%, due 2/1/18 | | | | | 35 | | | | 37 | |
#683100, 5.500%, due 2/1/18 | | | | | 453 | | | | 496 | |
#254684, 5.000%, due 3/1/18 | | | | | 24 | | | | 26 | |
#675717, 5.000%, due 3/1/18 | | | | | 299 | | | | 324 | |
#681361, 5.000%, due 3/1/18 | | | | | 113 | | | | 122 | |
#656564, 5.000%, due 4/1/18 | | | | | 1,614 | | | | 1,748 | |
#696677, 5.000%, due 4/1/18 | | | | | 108 | | | | 117 | |
#702888, 5.000%, due 4/1/18 | | | | | 171 | | | | 185 | |
#695838, 5.500%, due 4/1/18 | | | | | 99 | | | | 109 | |
#254721, 5.000%, due 5/1/18 | | | | | 268 | | | | 291 | |
#697593, 5.000%, due 5/1/18 | | | | | 255 | | | | 279 | |
#702332, 5.000%, due 5/1/18 | | | | | 58 | | | | 63 | |
#704049, 5.500%, due 5/1/18 | | | | | 962 | | | | 1,054 | |
#735357, 5.500%, due 5/1/18 | | | | | 1,383 | | | | 1,515 | |
#656573, 5.000%, due 6/1/18 | | | | | 267 | | | | 292 | |
#709848, 5.000%, due 6/1/18 | | | | | 222 | | | | 243 | |
#735003, 5.500%, due 7/1/18 | | | | | 1,501 | | | | 1,645 | |
#711991, 5.000%, due 8/1/18 | | | | | 202 | | | | 221 | |
#743183, 5.000%, due 10/1/18 | | | | | 93 | | | | 102 | |
#749596, 5.000%, due 11/1/18 | | | | | 331 | | | | 361 | |
#745237, 5.000%, due 12/1/18 | | | | | 72 | | | | 78 | |
#761267, 4.500%, due 2/1/19 | | | | | 771 | | | | 846 | |
#255079, 5.000%, due 2/1/19 | | | | | 62 | | | | 67 | |
#766276, 5.000%, due 3/1/19 | | | | | 503 | | | | 547 | |
#779363, 5.000%, due 6/1/19 | | | | | 102 | | | | 112 | |
See accompanying Notes to Portfolio of Investments.
June 30, 2012 | William Blair Funds 95 |
Low Duration Fund
Portfolio of Investments, June 30, 2012 (all dollar amounts in thousands) (unaudited)
| | | | | | | | | | | | |
Issuer | | NRSRO
Rating | | | Principal
Amount | | | Value | |
|
U.S. Government and U.S. Government
Agency—66.2%—(continued) | |
Federal National Mortgage Association (FNMA)—(continued) | |
#785259, 5.000%, due 8/1/19 | | | | | | $ | 392 | | | $ | 427 | |
#725953, 5.000%, due 10/1/19 | | | | | | | 116 | | | | 127 | |
#735401, 5.500%, due 3/1/20 | | | | | | | 274 | | | | 299 | |
#879607, 5.500%, due 4/1/21 | | | | | | | 138 | | | | 151 | |
#880993, 6.000%, due 1/1/22 | | | | | | | 41 | | | | 45 | |
#972934, 5.500%, due 2/1/23 | | | | | | | 432 | | | | 473 | |
#982878, 4.500%, due 5/1/23 | | | | | | | 710 | | | | 779 | |
#254908, 5.000%, due 9/1/23 | | | | | | | 84 | | | | 91 | |
#255165, 4.500%, due 3/1/24 | | | | | | | 109 | | | | 119 | |
#934808, 4.500%, due 3/1/24 | | | | | | | 134 | | | | 147 | |
#AA4519, 4.500%, due 3/1/24 | | | | | | | 2,474 | | | | 2,715 | |
#AA5028, 4.500%, due 4/1/24 | | | | | | | 583 | | | | 639 | |
#190988, 9.000%, due 6/1/24 | | | | | | | 181 | | | | 212 | |
#AC1520, 4.000%, due 9/1/24 | | | | | | | 189 | | | | 205 | |
#AC5124, 4.000%, due 11/1/24 | | | | | | | 1,370 | | | | 1,494 | |
#AC6600, 4.500%, due 11/1/24 | | | | | | | 101 | | | | 111 | |
#AC6257, 4.000%, due 12/1/24 | | | | | | | 1,414 | | | | 1,541 | |
#AC8857, 4.500%, due 12/1/24 | | | | | | | 93 | | | | 101 | |
#AC9560, 5.000%, due 1/1/25 | | | | | | | 4,259 | | | | 4,652 | |
#932449, 4.000%, due 2/1/25 | | | | | | | 582 | | | | 635 | |
#AD0855, 4.000%, due 3/1/25 | | | | | | | 300 | | | | 325 | |
#932723, 4.000%, due 4/1/25 | | | | | | | 693 | | | | 756 | |
#935995, 4.000%, due 6/1/25 | | | | | | | 214 | | | | 233 | |
#AD4677, 4.000%, due 6/1/25 | | | | | | | 2,287 | | | | 2,494 | |
#AD8164, 4.000%, due 8/1/25 | | | | | | | 2,601 | | | | 2,836 | |
#AE1176, 4.000%, due 8/1/25 | | | | | | | 972 | | | | 1,060 | |
#AB1459, 4.000%, due 9/1/25 | | | | | | | 389 | | | | 424 | |
#AH2671, 4.000%, due 1/1/26 | | | | | | | 1,745 | | | | 1,903 | |
#890329, 4.000%, due 4/1/26 | | | | | | | 1,726 | | | | 1,875 | |
#AI4856, 4.500%, due 6/1/26 | | | | | | | 2,111 | | | | 2,317 | |
#AI9811, 4.500%, due 8/1/26 | | | | | | | 3,082 | | | | 3,382 | |
#AH9564, 3.500%, due 9/1/26 | | | | | | | 4,233 | | | | 4,558 | |
#AB3497, 4.000%, due 9/1/26 | | | | | | | 2,065 | | | | 2,243 | |
#AB3608, 3.500%, due 10/1/26 | | | | | | | 3,703 | | | | 3,988 | |
#AI7363, 3.500%, due 10/1/26 | | | | | | | 1,260 | | | | 1,356 | |
#AJ2322, 3.500%, due 10/1/26 | | | | | | | 2,903 | | | | 3,126 | |
#AB3975, 3.500%, due 12/1/26 | | | | | | | 1,135 | | | | 1,223 | |
#AJ8149, 3.500%, due 12/1/26 | | | | | | | 3,301 | | | | 3,555 | |
#AJ7724, 4.000%, due 12/1/26 | | | | | | | 2,570 | | | | 2,802 | |
#AK2768, 3.500%, due 3/1/27 | | | | | | | 3,009 | | | | 3,240 | |
#AK7384, 4.000%, due 3/1/27 | | | | | | | 3,465 | | | | 3,778 | |
#AB4818, 4.000%, due 4/1/27 | | | | | | | 2,957 | | | | 3,224 | |
#829306, 6.000%, due 9/1/35 | | | | | | | 180 | | | | 202 | |
#889385, 6.000%, due 2/1/38 | | | | | | | 2,123 | | | | 2,377 | |
#975649, 6.000%, due 7/1/38 | | | | | | | 463 | | | | 516 | |
#935532, 4.500%, due 8/1/39 | | | | | | | 121 | | | | 134 | |
#AC6651, 4.500%, due 12/1/39 | | | | | | | 148 | | | | 164 | |
#AL0913, 6.000%, due 7/1/41 | | | | | | | 834 | | | | 929 | |
| | | | | | | | | | | | |
Total FNMA Mortgage Obligations | | | | | | | | | | | 82,872 | |
| | | | | | | | | | | | |
|
Asset-Backed Securities—19.1% | |
American Express Issuance Trust, 2007-2, Tranche A,
0.492%, 7/15/13, VRN | | | AAA | | | | 473 | | | | 473 | |
Avis Budget Rental Car Funding AESOP LLC—144A, 2009-1A, Tranche A,
9.310%, 10/20/13 | | | Aa1 | | | | 1,333 | | | | 1,353 | |
|
Asset-Backed Securities—19.1%—(continued) | |
Volkswagen Auto Loan Enhanced Trust, 2010-1, Tranche A3,
1.310%, 1/20/14 | | | AAA | | | $ | 158 | | | $ | 158 | |
Honda Auto Receivables Owner Trust, 2010-2, Tranche A3,
1.340%, 3/18/14 | | | Aaa | | | | 43 | | | | 43 | |
Hertz Vehicle Financing LLC—144A, 2009-2A, Tranche A1,
4.260%, 3/25/14 | | | Aaa | | | | 1,765 | | | | 1,797 | |
BMW Vehicle Owner Trust,
2010-A, Tranche A3,
1.390%, 4/25/14 | | | AAA | | | | 121 | | | | 121 | |
Ford Credit Auto Owner Trust, 2010-A, Tranche A3,
1.320%, 6/15/14 | | | AAA | | | | 196 | | | | 197 | |
Capital Auto Receivables Asset Trust, 2008-1, Tranche A4B,
1.592%, 7/15/14, VRN | | | AAA | | | | 73 | | | | 73 | |
CNH Equipment Trust,
2010-A, Tranche A3,
1.540%, 7/15/14 | | | AAA | | | | 70 | | | | 70 | |
Nissan Auto Receivables Owner Trust, 2010-A, Tranche A3,
0.870%, 7/15/14 | | | Aaa | | | | 399 | | | | 399 | |
Mercedes-Benz Auto Lease Trust—144A,
2011-B, Tranche A3,
1.070%, 8/15/14 | | | Aaa | | | | 1,500 | | | | 1,508 | |
Nissan Auto Receivables Owner Trust, 2009-1, Tranche A3,
5.000%, 9/15/14 | | | AAA | | | | 50 | | | | 50 | |
Nissan Auto Receivables Owner Trust, 2012-A, Tranche A2,
0.540%, 10/15/14 | | | Aaa | | | | 1,400 | | | | 1,400 | |
Nissan Master Owner Trust Receivables—144A,
2010-AA, Tranche A,
1.392%, 1/15/15, VRN | | | AAA | | | | 2,300 | | | | 2,313 | |
CarMax Auto Owner Trust,
2012-1, Tranche A2,
0.590%, 3/16/15 | | | AAA | | | | 1,000 | | | | 1,000 | |
CNH Equipment Trust,
2010-C, Tranche A3,
1.170%, 5/15/15 | | | AAA | | | | 484 | | | | 486 | |
Harley-Davidson Motorcycle Trust,
2011-2, Tranche A2,
0.710%, 5/15/15 | | | Aaa | | | | 1,403 | | | | 1,405 | |
Discover Card Master Trust,
2007-A2, Tranche A2,
0.808%, 6/15/15, VRN | | | AAA | | | | 292 | | | | 292 | |
Discover Card Master Trust I,
2005-4, Tranche A2,
0.332%, 6/16/15, VRN | | | AAA | | | | 77 | | | | 77 | |
FPL Recovery Funding LLC,
2007-A, Tranche A2,
5.044%, 8/1/15 | | | AAA | | | | 518 | | | | 531 | |
Bank of America Credit Card Trust,
2010-A1, Tranche A1,
0.542%, 9/15/15, VRN | | | AAA | | | | 2,000 | | | | 2,004 | |
Chase Issuance Trust,
2008-A13, Tranche A13,
1.968%, 9/15/15, VRN | | | AAA | | | | 100 | | | | 102 | |
See accompanying Notes to Portfolio of Investments.
96 Semi-Annual Report | June 30, 2012 |
Low Duration Fund
Portfolio of Investments, June 30, 2012 (all dollar amounts in thousands) (unaudited)
| | | | | | | | | | | | |
Issuer | | NRSRO
Rating | | | Principal
Amount | | | Value | |
|
Asset-Backed Securities—19.1%—(continued) | |
Discover Card Master Trust,
2010-A1, Tranche A1,
0.892%, 9/15/15, VRN | | | Aaa | | | $ | 447 | | | $ | 449 | |
USAA Auto Owner Trust,
2010-1, Tranche A4,
2.140%, 9/15/15 | | | AAA | | | | 685 | | | | 693 | |
American Express Credit Account Master Trust,
2010-1, Tranche A,
0.492%, 11/16/15, VRN | | | AAA | | | | 500 | | | | 501 | |
Honda Auto Receivables Owner Trust,
2012-1, Tranche A3,
0.770%, 1/15/16 | | | AAA | | | | 1,000 | | | | 1,001 | |
Ford Credit Floorplan Master Owner Trust,
2011-1, Tranche A2,
0.842%, 2/15/16, VRN | | | AAA | | | | 1,000 | | | | 1,005 | |
Hertz Vehicle Financing
LLC—144A, 2009-2A,
Tranche A2, 5.290%, 3/25/16 | | | Aaa | | | | 2,350 | | | | 2,580 | |
Ally Master Owner Trust,
2011-3, Tranche A1,
0.872%, 5/15/16, VRN | | | Aaa | | | | 1,100 | | | | 1,103 | |
CNH Equipment Trust,
2010-C, Tranche A4,
1.750%, 5/16/16 | | | AAA | | | | 60 | | | | 61 | |
Avis Budget Rental Car Funding
AESOP LLC—144A,
2010-3A, Tranche A,
4.640%, 5/20/16 | | | Aaa | | | | 1,400 | | | | 1,514 | |
Centre Point Funding
LLC—144A,
2010-1A, Tranche 1,
5.430%, 7/20/16 | | | A2 | | | | 1,589 | | | | 1,665 | |
CNH Equipment Trust,
2011-B, Tranche A3,
0.910%, 8/15/16 | | | AAA | | | | 500 | | | | 501 | |
Discover Card Master Trust,
2011-A1, Tranche A1,
0.592%, 8/15/16, VRN | | | Aaa | | | | 1,400 | | | | 1,406 | |
Enterprise Fleet Financing
LLC—144A,
2011-2, Tranche A2,
1.430%, 10/20/16 | | | AAA | | | | 1,780 | | | | 1,785 | |
GE Capital Credit Card Master Note Trust, 2011-1, Tranche A,
0.792%, 1/15/17, VRN | | | Aaa | | | | 500 | | | | 503 | |
GE Dealer Floorplan Master Note Trust,
2012-1, Tranche A,
0.814%, 2/20/17, VRN | | | Aaa | | | | 1,000 | | | | 1,002 | |
Discover Card Master Trust,
2010-A2, Tranche A2,
0.822%, 3/15/18, VRN | | | AAA | | | | 350 | | | | 354 | |
Citibank Omni Master Trust—144A,
2009-A14A, Tranche A14,
2.992%, 8/15/18, VRN | | | Aaa | | | | 2,000 | | | | 2,100 | |
Capital One Multi-Asset Execution Trust,
2007-A2, Tranche A2,
0.322%, 12/16/19, VRN | | | AAA | | | | 215 | | | | 211 | |
|
Asset-Backed Securities—19.1%—(continued) | |
MBNA Credit Card Master Note Trust,
2004-A3, Tranche A3,
0.502%, 8/16/21, VRN | | | AAA | | | $ | 475 | | | $ | 468 | |
Sierra Receivables Funding Co.
LLC—144A,
2011-1A,
Tranche A,
3.350%, 4/20/26 | | | A | | | | 941 | | | | 951 | |
| | | | | | | | | | | | |
Total Asset-Backed Securities | | | | | | | | | | | 35,705 | |
| | | | | | | | | | | | |
| | | |
Corporate Obligations—10.7% | | | | | | | | | | | | |
JPMorgan Chase & Co.,
1.266%, due 1/24/14, VRN | | | A+ | | | | 1,000 | | | | 1,003 | |
Morgan Stanley,
2.066%, due 1/24/14, VRN | | | A | | | | 1,000 | | | | 972 | |
Bank of America Corporation,
1.886%, due 1/30/14, VRN | | | A | | | | 1,000 | | | | 990 | |
Citigroup, Inc.,
1.391%, due 4/1/14, VRN | | | A | | | | 1,000 | | | | 984 | |
Morgan Stanley,
6.000%, due 5/13/14 | | | A | | | | 1,000 | | | | 1,036 | |
The Goldman Sachs Group, Inc.,
0.969%, due 1/12/15, VRN | | | A | | | | 1,000 | | | | 943 | |
General Dynamics Corporation,
1.375%, due 1/15/15 | | | A | | | | 1,000 | | | | 1,014 | |
The Goldman Sachs Group, Inc.,
5.125%, due 1/15/15 | | | A | | | | 1,000 | | | | 1,044 | |
AT&T, Inc.,
0.875%, due 2/13/15 | | | A2 | | | | 1,000 | | | | 999 | |
Wells Fargo & Co.,
1.250%, due 2/13/15 | | | AA- | | | | 2,250 | | | | 2,247 | |
Toyota Motor Credit Corporation,
1.000%, due 2/17/15 | | | AA- | | | | 1,000 | | | | 1,001 | |
The Bank of New York Mellon Corporation,
1.200%, due 2/20/15 | | | Aa3 | | | | 1,000 | | | | 1,005 | |
American International Group, Inc.,
3.000%, due 3/20/15 | | | A- | | | | 1,150 | | | | 1,156 | |
JPMorgan Chase & Co.,
1.875%, due 3/20/15 | | | A+ | | | | 1,300 | | | | 1,299 | |
The Goldman Sachs Group, Inc.,
3.300%, due 5/3/15 | | | A | | | | 800 | | | | 800 | |
Citigroup, Inc.,
4.700%, due 5/29/15 | | | A | | | | 1,100 | | | | 1,148 | |
John Deere Capital Corporation,
0.950%, due 6/29/15 | | | A | | | | 1,000 | | | | 1,002 | |
General Electric Capital Corporation,
1.625%, due 7/2/15 | | | A1 | | | | 1,425 | | | | 1,424 | |
| | | | | | | | | | | | |
Total Corporate Obligations | | | | | | | | | | | 20,067 | |
| | | | | | | | | | | | |
Total Long-Term Investments—96.0%
(cost $178,646) | | | | 179,930 | |
| | | | | | | | | | | | |
See accompanying Notes to Portfolio of Investments.
June 30, 2012 | William Blair Funds 97 |
Low Duration Fund
Portfolio of Investments, June 30, 2012 (all dollar amounts in thousands) (unaudited)
| | | | | | | | | | | | |
Issuer | | NRSRO
Rating | | | Principal
Amount | | | Value | |
| | | |
Repurchase Agreement | | | | | | | | | | | | |
Fixed Income Clearing Corporation, 0.100% dated 6/29/12, due 7/2/12, repurchase price $5,406, collateralized by FHLB, 3.650%, due 2/24/32 | | | Aaa | | | $ | 5,406 | | | $ | 5,406 | |
| | | | | | | | | | | | |
Total Repurchase Agreement—2.9%
(cost $5,406) | | | | 5,406 | |
| | | | | | | | | | | | |
Total Investments—98.9%
(cost $184,052) | | | | 185,336 | |
Cash and other assets, less liabilities—1.1% | | | | 2,078 | |
| | | | | | | | | | | | |
Net assets—100.0% | | | $ | 187,414 | |
| | | | | |
NRSRO = Nationally Recognized Statistical Rating Organization—The credit quality ratings of the securities in the Fund reflect the highest category rating by either Fitch Ratings, Moody’s Investors Service Inc., or Standard & Poor’s, a division of the McGraw-Hill Companies, Inc.
The obligations of certain U. S. Government-sponsored securities are neither issued nor guaranteed by the U. S. Treasury.
VRN = Variable Rate Note
See accompanying Notes to Portfolio of Investments.
98 Semi-Annual Report | June 30, 2012 |
Christopher T. Vincent

Kathleen M. Lynch
READY RESERVES FUND
AN OVERVIEW FROM THE PORTFOLIO MANAGERS
We continue to favor overnight repurchase agreements in an effort to maintain a high degree of overnight liquidity. The Fund is also invested in commercial paper issued by high-quality industrial companies. The Fund continues to maintain a relatively short average maturity. On June 30, 2012, the Fund’s average maturity was 32 days, shorter than the maximum allowable average maturity of 60 days as specified by the SEC’s Rule 2a-7 for money market funds.
As reported in the media, the regulatory debate continues in the money market space regarding whether additional reform is needed for money market funds. The Financial Stability Oversight Council (FSOC), created under the authority of The Dodd-Frank Wall Street Reform and Consumer Protection Act (Dodd-Frank), continues to put pressure on the SEC to enact more reform on 2a-7 funds beyond the 2010 reforms adopted by the SEC. The money market fund industry and mutual fund advocacy groups are proactively and aggressively arguing that the money market fund reforms implemented in 2010 have made money market funds safer and more liquid.
We understand that the SEC is likely to propose one or a combination of the following additional reforms: (1) floating net asset value, (2) holdback provision on redemptions and/or (3) capital buffers. Any further reform could drastically alter the money market fund industry landscape and could negatively impact the short-term funding markets. Participants are anxious for a resolution but the timing is unclear.
June 30, 2012 | William Blair Funds 99 |
Ready Reserves Fund
Performance Highlights (Unaudited)
The Fund’s 7 day yield on June 30, 2012 was 0.01%.
Average Annual Total Returns—Class N Shares period ended June 30, 2012.
| | | | | | | | | | | | | | | | | | | | |
| | | Year
To Date | | | 1
year | | | 3
year | | | 5
year | | | 10
year | |
Ready Reserves Fund Class N | | | 0.00 | % | | | 0.01 | % | | | 0.01 | % | | | 0.93 | % | | | 1.61 | % |
AAA Ready Money Market Funds | | | 0.01 | % | | | 0.01 | % | | | 0.02 | % | | | 0.94 | % | | | 1.57 | % |
Performance cited represents past performance. Past performance does not guarantee future results and current performance may be lower or higher than the data quoted. For the most current month-end performance information, please call 1-800-742-7272, or visit our Web site at www.williamblairfunds.com. Class N Shares are available to the general public without a sales load. Total return includes reinvestment of income. Yields fluctuate and are not guaranteed. An investment in the Fund is neither insured nor guaranteed by the Federal Deposit Insurance Corp. (FDIC) or any government agency. Although the Fund seeks to preserve the value of your investment at $1.00 per share, it is possible to lose money by investing in the Fund.
The AAA Rated Money Market Funds Average represents the average annual composite performance of all AAA rated First Tier Retail Money Market Funds listed by iMoneyNet data.
This report identifies the Fund’s investments on June 30, 2012. These holdings are subject to change. Not all fixed-income securities in the Fund performed the same, nor is there any guarantee that these fixed-income securities will perform as well in the future. Market forecasts provided in this report may not necessarily come to pass.
Sector Diversification (Unaudited)
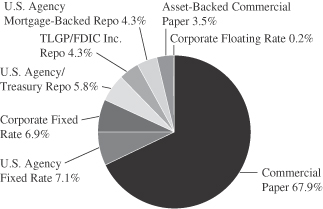
The sector diversification shown is based on the total Investments.
100 Semi-Annual Report | June 30, 2012 |
Ready Reserves Fund
Portfolio of Investments, June 30, 2012 (all dollar amounts in thousands)
| | | | | | | | |
Issuer | | Principal
Amount | | | Amortized
Cost | |
|
U.S. Government and U.S. Government Agency—7.0% | |
Federal Home Loan Mortgage Corp. (FHLMC)—2.7% | |
Federal Home Loan Mortgage Corporation, 1.125%-5.500%, 7/15/12-6/12/13 | | $ | 34,182 | | | $ | 34,460 | |
| | | | | | | | |
Total Federal Home Loan Mortgage Corp. (FHLMC) | | | | | | | 34,460 | |
| | | | | | | | |
Federal National Mortgage Association (FNMA)—4.3% | | | | | | | | |
Federal National Mortgage Association,
1.125%-4.750%, 7/30/12-11/19/12 | | | 55,879 | | | | 56,229 | |
| | | | | | | | |
Total Federal National Mortgage Association (FNMA) | | | | | | | 56,229 | |
| | | | | | | | |
Corporate Notes—7.0% | | | | | | | | |
Boeing Capital Corporation,
5.800%, 1/15/13 | | | 1,733 | | | | 1,783 | |
Boeing Co. (The),
1.875%, 11/20/12 | | | 10,019 | | | | 10,078 | |
Caterpillar Financial Services Corporation, 2.000%-4.850%, 12/7/12-4/5/13 | | | 10,799 | | | | 10,949 | |
Citigroup Funding, Inc.,
2.125%-2.250%, 7/12/12-12/10/12 | | | 14,223 | | | | 14,316 | |
General Electric Capital Corporation,
0.596%, 11/1/12, VRN | | | 2,000 | | | | 2,001 | |
General Electric Capital Corporation,
3.500%-5.250%, 8/13/12-10/19/12 | | | 17,173 | | | | 17,399 | |
International Business Machines Corporation, 2.100%-4.750%, 11/29/12-5/6/13 | | | 6,250 | | | | 6,349 | |
John Deere Capital Corporation,
4.950%-5.250%, 10/1/12-12/17/12 | | | 9,365 | | | | 9,495 | |
Johnson & Johnson,
5.150%, 8/15/12 | | | 1,510 | | | | 1,519 | |
Merck & Co., Inc.,
4.375%, 2/15/13 | | | 2,000 | | | | 2,051 | |
Oracle Corporation,
4.950%, 4/15/13 | | | 300 | | | | 311 | |
PepsiCo, Inc.,
4.650%, 2/15/13 | | | 1,646 | | | | 1,690 | |
Praxair, Inc.,
1.750%, 11/15/12 | | | 250 | | | | 251 | |
Procter & Gamble Co. (The),
1.375%, 8/1/12 | | | 11,606 | | | | 11,616 | |
Wal-Mart Stores, Inc.,
4.250%-4.550%, 4/15/13-5/1/13 | | | 1,006 | | | | 1,040 | |
| | | | | | | | |
Total Corporate Notes | | | | | | | 90,848 | |
| | | | | | | | |
Commercial Paper—68.1% | | | | | | | | |
American Honda Finance Corporation,
0.130%-0.140%, 7/5/12-7/25/12 | | | 32,000 | | | | 31,998 | |
Brown-Forman Corporation,
0.140%-0.180%, 7/9/12-7/25/12 | | | 35,500 | | | | 35,497 | |
Caterpillar Financial Services Corporation, 0.150%-0.250%, 8/27/12-12/5/12 | | | 26,000 | | | | 25,987 | |
Chevron Funding Corporation,
0.070%-0.100%, 7/2/12-7/12/12 | | | 39,000 | | | | 39,000 | |
Coca-Cola Co.,
0.100%-0.220%, 7/5/12-10/4/12 | | | 44,500 | | | | 44,489 | |
Colgate Palmolive Co.,
0.080%-0.100%, 7/3/12-7/11/12 | | | 40,000 | | | | 40,000 | |
ConocoPhillips,
0.120%-0.140%, 7/9/12-7/13/12 | | | 17,000 | | | | 17,000 | |
Commercial Paper—(continued) | | | | | | | | |
ConocoPhillips Qatar Funding, Ltd.,
0.130%-0.140%, 7/23/12-7/30/12 | | $ | 18,400 | | | $ | 18,397 | |
Deere & Co.,
0.140%, 7/3/12 | | | 10,000 | | | | 10,000 | |
EI DuPont,
0.150%-0.210%, 7/2/12-9/12/12 | | | 42,200 | | | | 42,195 | |
General Electric Capital Corporation,
0.050%-0.070%, 7/6/12-7/11/12 | | | 25,000 | | | | 25,000 | |
Illinois Tool Works, Inc.,
0.130%-0.140%, 7/2/12-7/18/12 | | | 41,826 | | | | 41,824 | |
John Deere Capital Corporation,
0.140%-0.150%, 7/16/12-7/23/12 | | | 19,500 | | | | 19,497 | |
Kimberly-Clark Corporation,
0.090%-0.110%, 7/9/12-7/13/12 | | | 23,458 | | | | 23,458 | |
Merck & Co., Inc.,
0.110%-0.120%, 7/3/12-7/17/12 | | | 24,000 | | | | 24,000 | |
Nestle Capital Corporation,
0.030%, 7/2/12-7/5/12 | | | 30,000 | | | | 30,000 | |
PACCAR Financial Corporation,
0.110%-0.150%, 7/18/12-8/3/12 | | | 34,300 | | | | 34,296 | |
PepsiCo, Inc.,
0.100%, 7/9/12-7/26/12 | | | 45,000 | | | | 45,000 | |
Pfizer, Inc.,
0.090%-0.110%, 7/17/12-7/25/12 | | | 28,000 | | | | 27,998 | |
Praxair, Inc.,
0.110%, 7/10/12-7/16/12 | | | 27,000 | | | | 27,000 | |
Private Export Funding,
0.120%-0.170%, 7/9/12-9/21/12 | | | 37,500 | | | | 37,491 | |
Procter & Gamble Co. (The),
0.120%, 7/6/12 | | | 10,000 | | | | 10,000 | |
Roche Holdings, Inc.,
0.120%-0.130%, 7/23/12-8/6/12 | | | 40,000 | | | | 39,995 | |
The Walt Disney Co.,
0.120%-0.140%, 7/9/12-8/16/12 | | | 27,000 | | | | 26,998 | |
Toyota Credit de Puerto Rico Corporation, 0.100%, 7/2/12-7/6/12 | | | 32,000 | | | | 32,000 | |
Toyota Motor Credit Corporation,
0.150%, 7/9/12-7/23/12 | | | 12,000 | | | | 11,999 | |
Unilever Capital Corporation,
0.140%-0.330%, 7/31/12-1/17/13 | | | 44,750 | | | | 44,730 | |
United Parcel Service, Inc.,
0.010%, 7/2/12-7/6/12 | | | 30,000 | | | | 30,000 | |
Wal-Mart Stores, Inc.,
0.090%-0.110%, 7/2/12-7/17/12 | | | 44,400 | | | | 44,400 | |
| | | | | | | | |
Total Commercial Paper | | | | | | | 880,249 | |
| | | | | | | | |
Asset-Backed Commercial Paper—3.5% | | | | | | | | |
Chariot Funding LLC,
0.080%-0.170%, 7/2/12-7/20/12 | | | 45,000 | | | | 44,997 | |
| | | | | | | | |
Total Asset-Backed Commercial Paper | | | | 44,997 | |
| | | | | | | | |
Repurchase Agreements—14.3% | | | | | | | | |
Bank of America, 0.130% dated 6/29/12, due 7/2/12, repurchase price $55,001, collateralized by FHLMC, 4.500%-6.000%, due 3/1/19-9/1/38 and FNMA, 3.500%-5.000%, due 6/1/31-5/1/42 | | | 55,000 | | | | 55,000 | |
Fixed Income Clearing Corporation, 0.100% dated 6/29/12, due 7/2/12, repurchase price $74,457, collateralized by FHLMC, 6.750%, due 3/15/31 and FNMA, 2.700%-7.125%, due 3/28/22-1/15/30 | | | 74,456 | | | | 74,456 | |
See accompanying Notes to Portfolio of Investments.
June 30, 2012 | William Blair Funds 101 |
Ready Reserves Fund
Portfolio of Investments, June 30, 2012 (all dollar amounts in thousands) (unaudited)
| | | | | | | | |
Issuer | | Principal
Amount | | | Amortized
Cost | |
|
U.S. Government and U.S. Government
Agency—7.0% —(continued) | |
Repurchase Agreements—(continued) | | | | | | | | |
Goldman Sachs, 0.160% dated 6/29/12, due 7/2/12, repurchase price $55,001, Collateralized by FNMA, 4.500%-5.000%, due 4/1/38-12/1/41 | | $ | 55,000 | | | $ | 55,000 | |
| | | | | | | | |
Total Repurchase Agreements | | | | 184,456 | |
| | | | | | | | |
Total Investments—99.9%
(cost $1,291,239) | | | | 1,291,239 | |
Cash and other assets, less liabilities—0.1% | | | | 1,350 | |
| | | | | | | | |
Net assets—100.0% | | | $ | 1,292,589 | |
| | | | | | | | |
Portfolio Weighted Average Maturity | | | | 32 days | |
VRN = Variable Rate Note
See accompanying Notes to Portfolio of Investments.
102 Semi-Annual Report | June 30, 2012 |
Statements of Assets and Liabilities
June 30, 2012 (dollar amounts in thousands) (unaudited)
| | | | | | | | | | | | | | | | |
| | | Growth
Fund | | | Large Cap
Growth
Fund | | | Small Cap
Growth
Fund | | | Mid Cap
Growth
Fund | |
Assets | | | | | | | | | | | | | | | | |
Investments in securities, at cost | | $ | 510,576 | | | $ | 21,163 | | | $ | 455,548 | | | $ | 336,944 | |
Investments in affiliated companies, at cost | | | — | | | | — | | | | 23,167 | | | | — | |
| | | | | | | | | | | | | | | | |
| | | | |
Investments in securities, at value | | $ | 612,382 | | | $ | 27,068 | | | $ | 513,164 | | | $ | 354,749 | |
Investments in affiliated companies, at value | | | — | | | | — | | | | 1,477 | | | | — | |
Receivable for securities sold | | | 14,144 | | | | — | | | | 6,971 | | | | — | |
Receivable for fund shares sold | | | 1,485 | | | | 20 | | | | 388 | | | | 1,874 | |
Receivable from Advisor | | | — | | | | 8 | | | | 73 | | | | 1 | |
Dividend and interest receivable | | | 295 | | | | 16 | | | | 46 | | | | 74 | |
| | | | | | | | | | | | | | | | |
Total assets | | | 628,306 | | | | 27,112 | | | | 522,119 | | | | 356,698 | |
Liabilities | | | | | | | | | | | | | | | | |
Payable for investment securities purchased | | | 9,262 | | | | 80 | | | | 5,143 | | | | 3,589 | |
Payable for fund shares redeemed | | | 4,889 | | | | — | | | | 804 | | | | 268 | |
Investment advisory fee payable | | | 371 | | | | 17 | | | | 449 | | | | 248 | |
Distribution fee payable | | | 41 | | | | 1 | | | | 32 | | | | 8 | |
Other accrued expenses | | | 180 | | | | 15 | | | | 255 | | | | 18 | |
| | | | | | | | | | | | | | | | |
Total liabilities | | | 14,743 | | | | 113 | | | | 6,683 | | | | 4,131 | |
| | | | | | | | | | | | | | | | |
Net Assets | | $ | 613,563 | | | $ | 26,999 | | | $ | 515,436 | | | $ | 352,567 | |
| | | | | | | | | | | | | | | | |
Capital | | | | | | | | | | | | | | | | |
Composition of Net Assets | | | | | | | | | | | | | | | | |
Par value of shares of beneficial interest | | $ | 51 | | | $ | 3 | | | $ | 23 | | | $ | 28 | |
Capital paid in excess of par value | | | 495,781 | | | | 23,568 | | | | 511,890 | | | | 331,926 | |
Accumulated net investment income (loss) | | | (1,505 | ) | | | (12 | ) | | | (2,784 | ) | | | (318 | ) |
Accumulated net realized gain (loss) | | | 17,430 | | | | (2,465 | ) | | | (29,619 | ) | | | 3,126 | |
Net unrealized appreciation (depreciation) of investments and foreign currencies | | | 101,806 | | | | 5,905 | | | | 35,926 | | | | 17,805 | |
| | | | | | | | | | | | | | | | |
Net Assets | | $ | 613,563 | | | $ | 26,999 | | | $ | 515,436 | | | $ | 352,567 | |
| | | | | | | | | | | | | | | | |
| | | | |
Class N Shares | | | | | | | | | | | | | | | | |
Net Assets | | $ | 202,015 | | | $ | 3,840 | | | $ | 161,021 | | | $ | 43,311 | |
Shares Outstanding | | | 17,286,758 | | | | 497,979 | | | | 7,324,533 | | | | 3,470,971 | |
Net Asset Value Per Share | | $ | 11.69 | | | $ | 7.71 | | | $ | 21.98 | | | $ | 12.48 | |
Class I Shares | | | | | | | | | | | | | | | | |
Net Assets | | $ | 411,548 | | | $ | 23,159 | | | $ | 354,415 | | | $ | 309,256 | |
Shares Outstanding | | | 33,730,874 | | | | 2,931,938 | | | | 15,502,377 | | | | 24,293,980 | |
Net Asset Value Per Share | | $ | 12.20 | | | $ | 7.90 | | | $ | 22.86 | | | $ | 12.73 | |
See accompanying Notes to Financial Statements.
June 30, 2012 | William Blair Funds 103 |
Statements of Operations
for the Period Ended June 30, 2012 (all amounts in thousands) (unaudited)
| | | | | | | | | | | | | | | | |
| | | Growth
Fund | | | Large Cap
Growth
Fund | | | Small Cap
Growth
Fund | | | Mid
Cap
Growth
Fund | |
Investment income | | | | | | | | | | | | | | | | |
Dividends . . | | $ | 1,558 | | | $ | 122 | | | $ | 739 | | | $ | 1,165 | |
Less foreign tax withheld | | | — | | | | (2 | ) | | | — | | | | — | |
Dividend income from affiliated companies | | | — | | | | — | | | | 217 | | | | — | |
Interest | | | 4 | | | | — | | | | 4 | | | | 3 | |
| | | | | | | | | | | | | | | | |
Total income | | | 1,562 | | | | 120 | | | | 960 | | | | 1,168 | |
Expenses | | | | | | | | | | | | | | | | |
Investment advisory fees | | | 2,342 | | | | 108 | | | | 3,094 | | | | 1,289 | |
Distribution fees | | | 265 | | | | 5 | | | | 231 | | | | 49 | |
Custodian fees | | | 12 | | | | 17 | | | | 19 | | | | 23 | |
Transfer agent fees | | | 79 | | | | 5 | | | | 51 | | | | 13 | |
Sub-transfer agent fees | | | | | | | | | | | | | | | | |
Class N | | | 150 | | | | 2 | | | | 149 | | | | 22 | |
Class I | | | 136 | | | | 4 | | | | 362 | | | | 44 | |
Professional fees | | | 20 | | | | 10 | | | | 25 | | | | 12 | |
Registration fees | | | 20 | | | | 21 | | | | 28 | | | | 21 | |
Shareholder reporting fees | | | 17 | | | | 1 | | | | 148 | | | | 12 | |
Trustee fees | | | 12 | | | | 1 | | | | 17 | | | | 3 | |
Other expenses | | | 14 | | | | 2 | | | | 15 | | | | 3 | |
| | | | | | | | | | | | | | | | |
Total expenses before waiver | | | 3,067 | | | | 176 | | | | 4,139 | | | | 1,491 | |
Expenses waived by the Advisor | | | — | | | | (44 | ) | | | (395 | ) | | | (5 | ) |
| | | | | | | | | | | | | | | | |
Net expenses | | | 3,067 | | | | 132 | | | | 3,744 | | | | 1,486 | |
| | | | | | | | | | | | | | | | |
Net investment income (loss) | | | (1,505 | ) | | | (12 | ) | | | (2,784 | ) | | | (318 | ) |
Realized and unrealized gain (loss) | | | | | | | | | | | | | | | | |
Net realized gain (loss) on transactions from investments | | | 14,474 | | | | 1,024 | | | | 39,596 | (a) | | | 3,715 | |
Change in net unrealized appreciation (depreciation) of investments | | | 38,293 | | | | 2,016 | | | | 14,880 | (a) | | | 6,699 | |
| | | | | | | | | | | | | | | | |
Net increase (decrease) in net assets resulting from operations | | $ | 51,262 | | | $ | 3,028 | | | $ | 51,692 | | | $ | 10,096 | |
| | | | | | | | | | | | | | | | |
| (a) | | Affiliated companies accounted for $12,069 of the net realized gain on investments and $(7) of the change in net unrealized (depreciation) on investments during the year. |
See accompanying Notes to Financial Statements.
104 Semi-Annual Report | June 30, 2012 |
Statements of Changes in Net Assets
for the Period Ended June 30, 2012 and the Year Ended December 31, 2011 (all amounts in thousands) (unaudited)
| | | | | | | | | | | | | | | | | | | | | | | | | | | | | | | | |
| | | Growth
Fund | | | Large Cap
Growth
Fund | | | Small Cap
Growth
Fund | | | Mid Cap
Growth
Fund | |
| | | 2012 | | | 2011 | | | 2012 | | | 2011 | | | 2012 | | | 2011 | | | 2012 | | | 2011 | |
Operations | | | | | | | | | | | | | | | | | | | | | | | | | | | | | | | | |
Net investment income (loss) | | $ | (1,505 | ) | | $ | (886 | ) | | $ | (12 | ) | | $ | 21 | | | $ | (2,784 | ) | | $ | (7,875 | ) | | $ | (318 | ) | | $ | (573 | ) |
Net realized gain (loss) on
investments | | | 14,474 | | | | 27,540 | | | | 1,024 | | | | 3,351 | | | | 39,596 | | | | 27,224 | | | | 3,715 | | | | 13,458 | |
Change in net unrealized appreciation (depreciation) on investments | | | 38,293 | | | | (38,002 | ) | | | 2,016 | | | | (4,038 | ) | | | 14,880 | | | | (110,707 | ) | | | 6,699 | | | | (12,060 | ) |
| | | | | | | | | | | | | | | | | | | | | | | | | | | | | | | | |
Net increase (decrease) in net assets resulting from operations | | | 51,262 | | | | (11,348 | ) | | | 3,028 | | | | (666 | ) | | | 51,692 | | | | (91,358 | ) | | | 10,096 | | | | 825 | |
Distributions to shareholders from | | | | | | | | | | | | | | | | | | | | | | | | | |
Net investment income | | | — | | | | (329 | ) | | | — | | | | (37 | ) | | | — | | | | — | | | | — | | | | — | |
Net realized gain | | | — | | | | (16,081 | ) | | | — | | | | — | | | | — | | | | — | | | | — | | | | (11,057 | ) |
| | | | | | | | | | | | | | | | | | | | | | | | | | | | | | | | |
| | | — | | | | (16,410 | ) | | | — | | | | (37 | ) | | | — | | | | — | | | | — | | | | (11,057 | ) |
Capital stock transactions | | | | | | | | | | | | | | | | | | | | | | | | | | | | | | | | |
Net proceeds from sale of shares | | | 61,262 | | | | 134,130 | | | | 2,144 | | | | 4,139 | | | | 51,684 | | | | 123,447 | | | | 220,220 | | | | 88,823 | |
Shares issued in reinvestment of income dividends and capital gain distributions | | | — | | | | 14,916 | | | | — | | | | 32 | | | | — | | | | — | | | | — | | | | 10,898 | |
Less cost of shares redeemed | | | (65,703 | ) | | | (130,159 | ) | | | (3,122 | ) | | | (10,554 | ) | | | (142,678 | ) | | | (368,940 | ) | | | (23,503 | ) | | | (44,983 | ) |
| | | | | | | | | | | | | | | | | | | | | | | | | | | | | | | | |
Net increase (decrease) in net assets resulting from capital share transactions | | | (4,441 | ) | | | 18,887 | | | | (978 | ) | | | (6,383 | ) | | | (90,994 | ) | | | (245,493 | ) | | | 196,717 | | | | 54,738 | |
| | | | | | | | | | | | | | | | | | | | | | | | | | | | | | | | |
Increase (decrease) in net assets | | | 46,821 | | | | (8,871 | ) | | | 2,050 | | | | (7,086 | ) | | | (39,302 | ) | | | (336,851 | ) | | | 206,813 | | | | 44,506 | |
Net assets | | | | | | | | | | | | | | | | | | | | | | | | | | | | | | | | |
Beginning of period | | | 566,742 | | | | 575,613 | | | | 24,949 | | | | 32,035 | | | | 554,738 | | | | 891,589 | | | | 145,754 | | | | 101,248 | |
| | | | | | | | | | | | | | | | | | | | | | | | | | | | | | | | |
End of period | | $ | 613,563 | | | $ | 566,742 | | | $ | 26,999 | | | $ | 24,949 | | | $ | 515,436 | | | $ | 554,738 | | | $ | 352,567 | | | $ | 145,754 | |
| | | | | | | | | | | | | | | | | | | | | | | | | | | | | | | | |
Undistributed net investment income (loss) at the end of the period | | $ | (1,505 | ) | | $ | — | | | $ | (12 | ) | | $ | — | | | $ | (2,784 | ) | | $ | — | | | $ | (318 | ) | | $ | — | |
| | | | | | | | | | | | | | | | | | | | | | | | | | | | | | | | |
See accompanying Notes to Financial Statements.
June 30, 2012 | William Blair Funds 105 |
Statements of Assets and Liabilities
June 30, 2012 (dollar amounts in thousands) (unaudited)
| | | | | | | | | | | | | | | | |
| | | Small-Mid Cap
Growth
Fund | | | Global
Growth
Fund | | | International
Growth
Fund | | | International
Equity
Fund | |
Assets | | | | | | | | | | | | | | | | |
Investments in securities, at cost | | $ | 315,227 | | | $ | 39,958 | | | $ | 3,099,276 | | | $ | 63,911 | |
| | | | | | | | | | | | | | | | |
| | | | |
Investments in securities, at value | | $ | 335,608 | | | $ | 46,683 | | | $ | 3,313,106 | | | $ | 69,107 | |
Foreign currency, at value (cost $—; $5; $3,812; $28) | | | — | | | | 5 | | | | 3,811 | | | | 28 | |
Receivable for securities sold | | | 16,948 | | | | 117 | | | | 78,764 | | | | 884 | |
Receivable for fund shares sold | | | 565 | | | | 3 | | | | 4,358 | | | | — | |
Receivable from Advisor | | | 66 | | | | 11 | | | | 18 | | | | 14 | |
Dividend and interest receivable | | | 34 | | | | 91 | | | | 8,418 | | | | 130 | |
Unrealized appreciation on forward foreign currency contracts | | | — | | | | — | | | | 19 | | | | — | |
| | | | | | | | | | | | | | | | |
Total assets | | | 353,221 | | | | 46,910 | | | | 3,408,494 | | | | 70,163 | |
Liabilities | | | | | | | | | | | | | | | | |
Payable for investment securities purchased | | | 14,883 | | | | 431 | | | | 77,053 | | | | 1,259 | |
Payable for fund shares redeemed | | | 95 | | | | 23 | | | | 3,452 | | | | 18 | |
Unrealized depreciation on forward foreign currency contracts | | | — | | | | — | | | | — | | | | 7 | |
Investment advisory fee payable | | | 268 | | | | 37 | | | | 2,704 | | | | 60 | |
Distribution fee payable | | | 9 | | | | 7 | | | | 239 | | | | 1 | |
Other accrued expenses | | | 171 | | | | 39 | | | | 1,391 | | | | 55 | |
| | | | | | | | | | | | | | | | |
Total liabilities | | | 15,426 | | | | 537 | | | | 84,839 | | | | 1,400 | |
| | | | | | | | | | | | | | | | |
Net Assets | | $ | 337,795 | | | $ | 46,373 | | | $ | 3,323,655 | | | $ | 68,763 | |
| | | | | | | | | | | | | | | | |
Capital | | | | | | | | | | | | | | | | |
Composition of Net Assets | | | | | | | | | | | | | | | | |
Par value of shares of beneficial interest | | $ | 24 | | | $ | 5 | | | $ | 163 | | | $ | 6 | |
Capital paid in excess of par value | | | 311,316 | | | | 56,053 | | | | 4,202,800 | | | | 154,367 | |
Accumulated net investment income (loss) | | | (676 | ) | | | 196 | | | | 64,383 | | | | 1,962 | |
Accumulated net realized gain (loss) | | | 6,750 | | | | (16,605 | ) | | | (1,157,795 | ) | | | (92,756 | ) |
Net unrealized appreciation (depreciation) of investments and foreign currencies | | | 20,381 | | | | 6,724 | | | | 214,104 | | | | 5,184 | |
| | | | | | | | | | | | | | | | |
Net Assets | | $ | 337,795 | | | $ | 46,373 | | | $ | 3,323,655 | | | $ | 68,763 | |
| | | | | | | | | | | | | | | | |
| | | | |
Class N Shares | | | | | | | | | | | | | | | | |
Net Assets | | $ | 46,690 | | | $ | 4,892 | | | $ | 1,185,288 | | | $ | 6,228 | |
Shares Outstanding | | | 3,420,330 | | | | 555,954 | | | | 58,930,526 | | | | 564,067 | |
Net Asset Value Per Share | | $ | 13.65 | | | $ | 8.80 | | | $ | 20.11 | | | $ | 11.04 | |
Class I Shares | | | | | | | | | | | | | | | | |
Net Assets | | $ | 291,105 | | | $ | 41,481 | | | $ | 2,138,367 | | | $ | 62,535 | |
Shares Outstanding | | | 20,800,608 | | | | 4,712,902 | | | | 103,862,302 | | | | 5,596,392 | |
Net Asset Value Per Share | | $ | 14.00 | | | $ | 8.80 | | | $ | 20.59 | | | $ | 11.17 | |
See accompanying Notes to Financial Statements.
106 Semi-Annual Report | June 30, 2012 |
Statements of Operations
for the Period Ended June 30, 2012 (all amounts in thousands) (unaudited)
| | | | | | | | | | | | | | | | |
| | | Small-Mid Cap
Growth
Fund | | | Global
Growth
Fund | | | International
Growth
Fund | | | International
Equity
Fund | |
Investment income | | | | | | | | | | | | | | | | |
Dividends | | | $1,137 | | | $ | 541 | | | $ | 64,560 | | | | $1,117 | |
Less foreign tax withheld | | | (3 | ) | | | (43 | ) | | | (6,283 | ) | | | (103 | ) |
Interest | | | 4 | | | | — | | | | 17 | | | | 1 | |
| | | | | | | | | | | | | | | | |
Total income | | | 1,138 | | | | 498 | | | | 58,294 | | | | 1,015 | |
Expenses | | | | | | | | | | | | | | | | |
Investment advisory fees | | | 1,592 | | | | 234 | | | | 17,294 | | | | 389 | |
Distribution fees | | | 56 | | | | 6 | | | | 1,614 | | | | 8 | |
Shareholder services fees | | | — | | | | 35 | | | | — | | | | — | |
Custodian fees | | | 20 | | | | 32 | | | | 284 | | | | 46 | |
Transfer agent fees | | | 23 | | | | 10 | | | | 204 | | | | 3 | |
Sub-transfer agent fees | | | | | | | | | | | | | | | | |
Class N | | | 66 | | | | 1 | | | | 884 | | | | 4 | |
Class I | | | 164 | | | | 5 | | | | 1,047 | | | | 26 | |
Professional fees | | | 11 | | | | 14 | | | | 119 | | | | 18 | |
Registration fees | | | 24 | | | | 23 | | | | 53 | | | | 21 | |
Shareholder reporting fees | | | 8 | | | | — | | | | 243 | | | | — | |
Trustee fees | | | 5 | | | | 1 | | | | 88 | | | | 3 | |
Other expenses | | | 7 | | | | 3 | | | | 68 | | | | 3 | |
| | | | | | | | | | | | | | | | |
Total expenses before waiver | | | 1,976 | | | | 364 | | | | 21,898 | | | | 521 | |
Expenses waived by the Advisor | | | (162 | ) | | | (65 | ) | | | (38 | ) | | | (89 | ) |
| | | | | | | | | | | | | | | | |
Net expenses | | | 1,814 | | | | 299 | | | | 21,860 | | | | 432 | |
| | | | | | | | | | | | | | | | |
Net investment income (loss) | | | (676 | ) | | | 199 | | | | 36,434 | | | | 583 | |
Realized and unrealized gain (loss) | | | | | | | | | | | | | | | | |
Net realized gain (loss) on transactions from: | | | | | | | | | | | | | | | | |
Investments | | | 5,641 | | | | 1,166 | | | | 37,905 | | | | 1,593 | |
Foreign currency transactions | | | — | | | | (6 | ) | | | 11,330 | | | | 30 | |
| | | | | | | | | | | | | | | | |
Total net realized gain (loss) | | | 5,641 | | | | 1,160 | | | | 49,235 | | | | 1,623 | |
Change in net unrealized appreciation (depreciation) of: | | | | | | | | | | | | | | | | |
Investments | | | 3,925 | | | | 2,307 | | | | 157,146 | | | | 1,313 | |
Foreign currency translations | | | — | | | | (1 | ) | | | 2,141 | | | | (5 | ) |
| | | | | | | | | | | | | | | | |
Total change in net unrealized appreciation (depreciation) | | | 3,925 | | | | 2,306 | | | | 159,287 | | | | 1,308 | |
| | | | | | | | | | | | | | | | |
Net increase (decrease) in net assets resulting from operations | | $ | 8,890 | | | $ | 3,665 | | | $ | 244,956 | | | $ | 3,514 | |
| | | | | | | | | | | | | | | | |
See accompanying Notes to Financial Statements.
June 30, 2012 | William Blair Funds 107 |
Statements of Changes in Net Assets
for the Period Ended June 30, 2012 and the Year Ended December 31, 2011 (all amounts in thousands) (unaudited)
| | | | | | | | | | | | | | | | | | | | | | | | | | | | | | | | |
| | | Small-Mid Cap
Growth
Fund | | | Global
Growth
Fund | | | International
Growth
Fund | | | International
Equity
Fund | |
| | | 2012 | | | 2011 | | | 2012 | | | 2011 | | | 2012 | | | 2011 | | | 2012 | | | 2011 | |
Operations | | | | | | | | | | | | | | | | | | | | | | | | | | | | | | | | |
Net investment income (loss) | | $ | (676 | ) | | $ | (1,387 | ) | | $ | 199 | | | $ | 225 | | | $ | 36,434 | | | $ | 56,294 | | | $ | 583 | | | $ | 1,890 | |
Net realized gain (loss) on investments and foreign currency transactions | | | 5,641 | | | | 27,339 | | | | 1,160 | | | | 4,570 | | | | 49,235 | | | | 347,948 | | | | 1,623 | | | | 22,846 | |
Change in net unrealized appreciation (depreciation) on investments and foreign currency translation | | | 3,925 | | | | (27,537 | ) | | | 2,306 | | | | (6,320 | ) | | | 159,287 | | | | (971,769 | ) | | | 1,308 | | | | (36,134 | ) |
| | | | | | | | | | | | | | | | | | | | | | | | | | | | | | | | |
Net increase (decrease) in net assets resulting from operations | | | 8,890 | | | | (1,585 | ) | | | 3,665 | | | | (1,525 | ) | | | 244,956 | | | | (567,527 | ) | | | 3,514 | | | | (11,398 | ) |
Distributions to shareholders from | | | | | | | | | | | | | | | | | | | | | | | | | | | | | | | | |
Net investment income | | | — | | | | — | | | | — | | | | (174 | ) | | | — | | | | (6,046 | ) | | | — | | | | — | |
Net realized gain | | | — | | | | (23,013 | ) | | | — | | | | — | | | | — | | | | — | | | | — | | | | — | |
| | | | | | | | | | | | | | | | | | | | | | | | | | | | | | | | |
| | | — | | | | (23,013 | ) | | | — | | | | (174 | ) | | | — | | | | (6,046 | ) | | | — | | | | — | |
Capital stock transactions | | | | | | | | | | | | | | | | | | | | | | | | | | | | | | | | |
Net proceeds from sale of shares | | | 95,971 | | | | 85,339 | | | | 2,305 | | | | 3,738 | | | | 393,606 | | | | 756,415 | | | | 2,160 | | | | 26,832 | |
Shares issued in reinvestment of income dividends and capital gain distributions | | | — | | | | 20,564 | | | | — | | | | 166 | | | | — | | | | 5,030 | | | | — | | | | — | |
Less cost of shares redeemed | | | (20,663 | ) | | | (35,773 | ) | | | (2,171 | ) | | | (4,508 | ) | | | (543,809 | ) | | | (2,041,149 | ) | | | (12,568 | ) | | | (117,832 | ) |
| | | | | | | | | | | | | | | | | | | | | | | | | | | | | | | | |
Net increase (decrease) in net assets resulting from capital share transactions | | | 75,308 | | | | 70,130 | | | | 134 | | | | (604 | ) | | | (150,203 | ) | | | (1,279,704 | ) | | | (10,408 | ) | | | (91,000 | ) |
| | | | | | | | | | | | | | | | | | | | | | | | | | | | | | | | |
Increase (decrease) in net assets | | | 84,198 | | | | 45,532 | | | | 3,799 | | | | (2,303 | ) | | | 94,753 | | | | (1,853,277 | ) | | | (6,894 | ) | | | (102,398 | ) |
Net assets | | | | | | | | | | | | | | | | | | | | | | | | | | | | | | | | |
Beginning of period | | | 253,597 | | | | 208,065 | | | | 42,574 | | | | 44,877 | | | | 3,228,902 | | | | 5,082,179 | | | | 75,657 | | | | 178,055 | |
| | | | | | | | | | | | | | | | | | | | | | | | | | | | | | | | |
End of period | | $ | 337,795 | | | $ | 253,597 | | | $ | 46,373 | | | $ | 42,574 | | | $ | 3,323,655 | | | $ | 3,228,902 | | | $ | 68,763 | | | $ | 75,657 | |
| | | | | | | | | | | | | | | | | | | | | | | | | | | | | | | | |
Undistributed net investment income (loss) at the end of the period | | $ | (676 | ) | | $ | — | | | $ | 196 | | | $ | (3 | ) | | $ | 64,383 | | | $ | 27,949 | | | $ | 1,962 | | | $ | 1,379 | |
| | | | | | | | | | | | | | | | | | | | | | | | | | | | | | | | |
See accompanying Notes to Financial Statements.
108 Semi-Annual Report | June 30, 2012 |
Statements of Assets and Liabilities
June 30, 2012 (dollar amounts in thousands) (unaudited)
| | | | | | | | | | | | | | | | |
| | | International
Small Cap
Growth
Fund | | | Emerging
Markets
Growth
Fund | | | Emerging
Leaders
Growth
Fund | | | Emerging
Markets
Small Cap
Growth
Fund | |
Assets | | | | | | | | | | | | | | | | |
Investments in securities, at cost | | $ | 607,513 | | | $ | 879,223 | | | $ | 42,440 | | | $ | 6,041 | |
| | | | | | | | | | | | | | | | |
| | | | |
Investments in securities, at value | | $ | 648,320 | | | $ | 923,975 | | | $ | 44,688 | | | $ | 6,494 | |
Cash | | | — | | | | — | | | | — | | | | 80 | |
Foreign currency, at value (cost $234; $5,846; $570; $3) | | | 233 | | | | 5,858 | | | | 571 | | | | 3 | |
Receivable for securities sold | | | 1,783 | | | | 30,628 | | | | 916 | | | | 6 | |
Receivable for fund shares sold | | | 1,285 | | | | 10 | | | | — | | | | 197 | |
Receivable from Advisor | | | — | | | | — | | | | 21 | | | | 14 | |
Dividend and interest receivable | | | 1,071 | | | | 2,228 | | | | 89 | | | | 16 | |
| | | | | | | | | | | | | | | | |
Total assets | | | 652,692 | | | | 962,699 | | | | 46,285 | | | | 6,810 | |
Liabilities | | | | | | | | | | | | | | | | |
Payable for investment securities purchased | | | 1,053 | | | | 4,394 | | | | — | | | | 82 | |
Payable for fund shares redeemed | | | 379 | | | | 258 | | | | — | | | | — | |
Payable to custodian | | | — | | | | 4,277 | | | | — | | | | — | |
Investment advisory fee payable | | | 518 | | | | 877 | | | | 43 | | | | 6 | |
Distribution fee payable | | | 45 | | | | 21 | | | | 3 | | | | 1 | |
Other accrued expenses | | | 175 | | | | 1,173 | | | | 1,273 | | | | 20 | |
| | | | | | | | | | | | | | | | |
Total liabilities | | | 2,170 | | | | 11,000 | | | | 1,319 | | | | 109 | |
| | | | | | | | | | | | | | | | |
Net Assets | | $ | 650,522 | | | $ | 951,699 | | | $ | 44,966 | | | $ | 6,701 | |
| | | | | | | | | | | | | | | | |
Capital | | | | | | | | | | | | | | | | |
Composition of Net Assets | | | | | | | | | | | | | | | | |
Par value of shares of beneficial interest | | $ | 53 | | | $ | 78 | | | $ | 5 | | | $ | 1 | |
Capital paid in excess of par value | | | 677,939 | | | | 944,952 | | | | 46,607 | | | | 6,431 | |
Accumulated net investment income (loss) | | | 9,353 | | | | 5,647 | | | | 378 | | | | 27 | |
Accumulated net realized gain (loss) | | | (77,620 | ) | | | (42,919 | ) | | | (4,271 | ) | | | (210 | ) |
Net unrealized appreciation (depreciation) of investments and foreign currencies | | | 40,797 | | | | 43,941 | | | | 2,247 | | | | 452 | |
| | | | | | | | | | | | | | | | |
Net Assets | | $ | 650,522 | | | $ | 951,699 | | | $ | 44,966 | | | $ | 6,701 | |
| | | | | | | | | | | | | | | | |
| | | | |
Class N Shares | | | | | | | | | | | | | | | | |
Net Assets | | $ | 14,814 | | | $ | 16,542 | | | $ | 154 | | | $ | 2,293 | |
Shares Outstanding | | | 1,228,658 | | | | 1,384,322 | | | | 18,737 | | | | 206,240 | |
Net Asset Value Per Share | | $ | 12.06 | | | $ | 11.95 | | | $ | 8.21 | | | $ | 11.12 | |
Class I Shares | | | | | | | | | | | | | | | | |
Net Assets | | $ | 337,714 | | | $ | 133,655 | | | $ | 23,769 | | | $ | 4,408 | |
Shares Outstanding | | | 27,718,542 | | | | 11,079,633 | | | | 2,901,306 | | | | 395,694 | |
Net Asset Value Per Share | | $ | 12.18 | | | $ | 12.07 | | | $ | 8.19 | | | $ | 11.14 | |
See accompanying Notes to Financial Statements.
June 30, 2012 | William Blair Funds 109 |
Statements of Operations
for the Period Ended June 30, 2012 (all amounts in thousands) (unaudited)
| | | | | | | | | | | | | | | | |
| | | International
Small Cap
Growth
Fund | | | Emerging
Markets
Growth
Fund | | | Emerging
Leaders
Growth
Fund | | | Emerging
Markets
Small Cap
Growth
Fund | |
Investment income | | | | | | | | | | | | | | | | |
Dividends | | $ | 9,998 | | | $ | 14,885 | | | $ | 816 | | | $ | 90 | |
Less foreign tax withheld | | | (933 | ) | | | (1,101 | ) | | | (59 | ) | | | (9 | ) |
Interest | | | 8 | | | | 8 | | | | — | | | | — | |
| | | | | | | | | | | | | | | | |
Total income | | | 9,073 | | | | 13,792 | | | | 757 | | | | 81 | |
Expenses | | | | | | | | | | | | | | | | |
Investment advisory fees | | | 3,544 | | | | 5,534 | | | | 305 | | | | 29 | |
Distribution fees | | | 20 | | | | 23 | | | | — | | | | 2 | |
Shareholder services fees | | | 288 | | | | 117 | | | | 19 | | | | 4 | |
Custodian fees | | | 115 | | | | 273 | | | | 64 | | | | 32 | |
Transfer agent fees | | | 18 | | | | 25 | | | | 10 | | | | 3 | |
Sub-transfer agent fees | | | | | | | | | | | | | | | | |
Class N | | | 12 | | | | 9 | | | | — | | | | — | |
Class I | | | 128 | | | | 34 | | | | — | | | | — | |
Professional fees | | | 37 | | | | 69 | | | | 28 | | | | 17 | |
Registration fees | | | 34 | | | | 34 | | | | 38 | | | | 11 | |
Shareholder reporting fees | | | 39 | | | | 34 | | | | — | | | | 1 | |
Trustee fees | | | 13 | | | | 21 | | | | 2 | | | | — | |
Other expenses | | | 14 | | | | 19 | | | | 5 | | | | 3 | |
| | | | | | | | | | | | | | | | |
Total expenses before waiver | | | 4,262 | | | | 6,192 | | | | 471 | | | | 102 | |
Expenses waived and reimbursed by the Advisor | | | — | | | | — | | | | (106 | ) | | | (61 | ) |
| | | | | | | | | | | | | | | | |
Net expenses | | | 4,262 | | | | 6,192 | | | | 365 | | | | 41 | |
| | | | | | | | | | | | | | | | |
Net investment income (loss) | | | 4,811 | | | | 7,600 | | | | 392 | | | | 40 | |
Realized and unrealized gain (loss) | | | | | | | | | | | | | | | | |
Net realized gain (loss) on transactions from: | | | | | | | | | | | | | | | | |
Investments | | | (14,939 | ) | | | (13,238 | ) | | | (1,591 | ) | | | (150 | ) |
Foreign currency transactions | | | 1,539 | | | | (1,245 | ) | | | (30 | ) | | | (2 | ) |
| | | | | | | | | | | | | | | | |
Total net realized gain (loss) | | | (13,400 | ) | | | (14,483 | ) | | | (1,621 | ) | | | (152 | ) |
Change in net unrealized appreciation (depreciation) of: | | | | | | | | | | | | | | | | |
Investments | | | 60,489 | | | | 63,746 | | | | 4,762 | | | | 470 | |
Foreign currency translations | | | 538 | | | | (494 | ) | | | 44 | | | | — | |
| | | | | | | | | | | | | | | | |
Total change in net unrealized appreciation (depreciation) | | | 61,027 | | | | 63,252 | | | | 4,806 | | | | 470 | |
| | | | | | | | | | | | | | | | |
Net increase (decrease) in net assets resulting from operations | | $ | 52,438 | | | $ | 56,369 | | | $ | 3,577 | | | $ | 358 | |
| | | | | | | | | | | | | | | | |
See accompanying Notes to Financial Statements.
110 Semi-Annual Report | June 30, 2012 |
Statements of Changes in Net Assets
for the Period Ended June 30, 2012 and the Year Ended December 31, 2011 (all amounts in thousands) (unaudited)
| | | | | | | | | | | | | | | | | | | | | | | | | | | | | | | | |
| | | International
Small Cap
Growth
Fund | | | Emerging
Markets
Growth
Fund | | | Emerging
Leaders
Growth
Fund | | | Emerging
Markets
Small Cap
Growth
Fund | |
| | | 2012 | | | 2011 | | | 2012 | | | 2011 | | | 2012 | | | 2011 | | | 2012 | | | 2011(a) | |
Operations | | | | | | | | | | | | | | | | | | | | | | | | | | | | | | | | |
Net investment income (loss) | | $ | 4,811 | | | $ | 6,857 | | | $ | 7,600 | | | $ | 8,885 | | | $ | 392 | | | $ | 701 | | | $ | 40 | | | $ | 2 | |
Net realized gain (loss) on investments and foreign currency transactions | | | (13,400 | ) | | | 60,435 | | | | (14,483 | ) | | | 127,536 | | | | (1,621 | ) | | | 112 | | | | (152 | ) | | | (75 | ) |
Change in net unrealized appreciation (depreciation) on investments and foreign currency translation | | | 61,027 | | | | (155,577 | ) | | | 63,252 | | | | (304,105 | ) | | | 4,806 | | | | (20,181 | ) | | | 470 | | | | (17 | ) |
| | | | | | | | | | | | | | | | | | | | | | | | | | | | | | | | |
Net increase (decrease) in net assets resulting from operations | | | 52,438 | | | | (88,285 | ) | | | 56,369 | | | | (167,684 | ) | | | 3,577 | | | | (19,368 | ) | | | 358 | | | | (90 | ) |
Distributions to shareholders from | | | | | | | | | | | | | | | | | | | | | | | | | | | | | | | | |
Net investment income | | | — | | | | (10,724 | ) | | | — | | | | (4,450 | ) | | | — | | | | (307 | ) | | | — | | | | — | |
Net realized gain | | | — | | | | — | | | | — | | | | (115,030 | ) | | | — | | | | (3,704 | ) | | | — | | | | — | |
Return of Capital | | | — | | | | — | | | | — | | | | — | | | | — | | | | (25 | ) | | | — | | | | — | |
| | | | | | | | | | | | | | | | | | | | | | | | | | | | | | | | |
| | | — | | | | (10,724 | ) | | | — | | | | (119,480 | ) | | | — | | | | (4,036 | ) | | | — | | | | — | |
Capital stock transactions | | | | | | | | | | | | | | | | | | | | | | | | | | | | | | | | |
Net proceeds from sale of shares | | | 66,178 | | | | 313,989 | | | | 194,763 | | | | 352,369 | | | | 10,538 | | | | 19,857 | | | | 3,326 | | | | 3,362 | |
Shares issued in reinvestment of income dividends and capital gain distributions | | | — | | | | 8,514 | | | | — | | | | 100,061 | | | | — | | | | 3,491 | | | | — | | | | — | |
Less cost of shares redeemed | | | (186,315 | ) | | | (152,224 | ) | | | (117,279 | ) | | | (597,963 | ) | | | (16,971 | ) | | | (47,023 | ) | | | (255 | ) | | | — | |
| | | | | | | | | | | | | | | | | | | | | | | | | | | | | | | | |
Net increase (decrease) in net assets resulting from capital share transactions | | | (120,137 | ) | | | 170,279 | | | | 77,484 | | | | (145,533 | ) | | | (6,433 | ) | | | (23,675 | ) | | | 3,071 | | | | 3,362 | |
| | | | | | | | | | | | | | | | | | | | | | | | | | | | | | | | |
Increase (decrease) in net assets | | | (67,699 | ) | | | 71,270 | | | | 133,853 | | | | (432,697 | ) | | | (2,856 | ) | | | (47,079 | ) | | | 3,429 | | | | 3,272 | |
Net assets | | | | | | | | | | | | | | | | | | | | | | | | | | | | | | | | |
Beginning of period | | | 718,221 | | | | 646,951 | | | | 817,846 | | | | 1,250,543 | | | | 47,822 | | | | 94,901 | | | | 3,272 | | | | — | |
| | | | | | | | | | | | | | | | | | | | | | | | | | | | | | | | |
End of period | | $ | 650,522 | | | $ | 718,221 | | | $ | 951,699 | | | $ | 817,846 | | | $ | 44,966 | | | $ | 47,822 | | | $ | 6,701 | | | $ | 3,272 | |
| | | | | | | | | | | | | | | | | | | | | | | | | | | | | | | | |
Undistributed net investment income (loss) at the end of the period | | $ | 9,353 | | | $ | 4,542 | | | $ | 5,647 | | | $ | (1,953 | ) | | $ | 378 | | | $ | (14 | ) | | $ | 27 | | | $ | (13 | ) |
| | | | | | | | | | | | | | | | | | | | | | | | | | | | | | | | |
| (a) | | For the period from October 24, 2011 (Commencement of Operations) to December 31,2011. |
See accompanying Notes to Financial Statements.
June 30, 2012 | William Blair Funds 111 |
Statements of Assets and Liabilities
June 30, 2012 (dollar amounts in thousands) (unaudited)
| | | | | | | | | | | | | | | | |
| | | Large Cap
Value
Fund | | | Small Cap
Value
Fund | | | Mid Cap
Value
Fund | | | Small-Mid Cap
Value
Fund | |
Assets | | | | | | | | | | | | | | | | |
Investments in securities, at cost | | $ | 2,977 | | | $ | 221,018 | | | $ | 4,796 | | | $ | 2,067 | |
| | | | | | | | | | | | | | | | |
| | | | |
Investments in securities, at value | | $ | 3,165 | | | $ | 240,640 | | | $ | 5,052 | | | $ | 2,219 | |
Cash | | | 25 | | | | — | | | | — | | | | 84 | |
Receivable for securities sold | | | 52 | | | | 1,166 | | | | — | | | | — | |
Receivable for fund shares sold | | | — | | | | 360 | | | | — | | | | — | |
Receivable from Advisor | | | 7 | | | | 22 | | | | 8 | | | | 9 | |
Dividend and interest receivable | | | 5 | | | | 141 | | | | 8 | | | | 2 | |
| | | | | | | | | | | | | | | | |
Total assets | | | 3,254 | | | | 242,329 | | | | 5,068 | | | | 2,314 | |
Liabilities | | | | | | | | | | | | | | | | |
Payable for investment securities purchased | | | 38 | | | | 2,381 | | | | 84 | | | | 35 | |
Payable for fund shares redeemed | | | — | | | | 147 | | | | — | | | | — | |
Investment advisory fee payable | | | 2 | | | | 209 | | | | 4 | | | | 2 | |
Distribution fee payable | | | — | | | | 8 | | | | — | | | | — | |
Other accrued expenses | | | 2 | | | | 78 | | | | — | | | | 12 | |
| | | | | | | | | | | | | | | | |
Total liabilities | | | 42 | | | | 2,823 | | | | 88 | | | | 49 | |
| | | | | | | | | | | | | | | | |
Net Assets | | $ | 3,212 | | | $ | 239,506 | | | $ | 4,980 | | | $ | 2,265 | |
| | | | | | | | | | | | | | | | |
Capital | | | | | | | | | | | | | | | | |
Composition of Net Assets | | | | | | | | | | | | | | | | |
Par value of shares of beneficial interest | | $ | 1 | | | $ | 18 | | | $ | 1 | | | $ | 1 | |
Capital paid in excess of par value | | | 3,007 | | | | 223,784 | | | | 4,656 | | | | 2,072 | |
Accumulated net investment income (loss) | | | 14 | | | | 2,191 | | | | 22 | | | | 16 | |
Accumulated net realized gain (loss) | | | 2 | | | | (6,109 | ) | | | 45 | | | | 24 | |
Net unrealized appreciation (depreciation) of investments and foreign currencies | | | 188 | | | | 19,622 | | | | 256 | | | | 152 | |
| | | | | | | | | | | | | | | | |
Net Assets | | $ | 3,212 | | | $ | 239,506 | | | $ | 4,980 | | | $ | 2,265 | |
| | | | | | | | | | | | | | | | |
| | | | |
Class N Shares | | | | | | | | | | | | | | | | |
Net Assets | | $ | 1,257 | | | $ | 42,463 | | | $ | 56 | | | $ | 916 | |
Shares Outstanding | | | 115,746 | | | | 3,285,075 | | | | 5,150 | | | | 83,807 | |
Net Asset Value Per Share | | $ | 10.86 | | | $ | 12.93 | | | $ | 10.97 | | | $ | 10.93 | |
Class I Shares | | | | | | | | | | | | | | | | |
Net Assets | | $ | 1,955 | | | $ | 197,043 | | | $ | 4,924 | | | $ | 1,349 | |
Shares Outstanding | | | 179,695 | | | | 14,968,538 | | | | 448,257 | | | | 123,292 | |
Net Asset Value Per Share | | $ | 10.88 | | | $ | 13.16 | | | $ | 10.98 | | | $ | 10.94 | |
See accompanying Notes to Financial Statements.
112 Semi-Annual Report | June 30, 2012 |
Statements of Operations
for the Period Ended June 30, 2012 (all amounts in thousands) (unaudited)
| | | | | | | | | | | | | | | | |
| | | Large Cap
Value
Fund | | | Small Cap
Value
Fund | | | Mid Cap
Value
Fund | | | Small-Mid
Cap Value
Fund | |
Investment income | | | | | | | | | | | | | | | | |
Dividends | | $ | 30 | | | $ | 3,637 | | | $ | 49 | | | $ | 30 | |
Interest | | | — | | | | 1 | | | | — | | | | — | |
| | | | | | | | | | | | | | | | |
Total income | | | 30 | | | | 3,638 | | | | 49 | | | | 30 | |
Expenses | | | | | | | | | | | | | | | | |
Investment advisory fees | | | 12 | | | | 1,339 | | | | 23 | | | | 11 | |
Distribution fees | | | 1 | | | | 54 | | | | — | | | | 1 | |
Custodian fees | | | 16 | | | | 27 | | | | 19 | | | | 19 | |
Transfer agent fees | | | 3 | | | | 21 | | | | 5 | | | | 3 | |
Sub-transfer agent fees | | | | | | | | | | | | | | | | |
Class N | | | — | | | | 32 | | | | — | | | | — | |
Class I | | | — | | | | 96 | | | | — | | | | — | |
Professional fees | | | 9 | | | | 14 | | | | 9 | | | | 7 | |
Registration fees | | | 5 | | | | 22 | | | | 19 | | | | 8 | |
Shareholder reporting fees | | | 1 | | | | 18 | | | | — | | | | — | |
Trustee fees | | | — | | | | 4 | | | | — | | | | — | |
Other expenses | | | 1 | | | | 10 | | | | 1 | | | | 8 | |
| | | | | | | | | | | | | | | | |
Total expenses before waiver | | | 48 | | | | 1,637 | | | | 76 | | | | 57 | |
Expenses waived and reimbursed by the Advisor | | | (32 | ) | | | (165 | ) | | | (49 | ) | | | (42 | ) |
| | | | | | | | | | | | | | | | |
Net expenses | | | 16 | | | | 1,472 | | | | 27 | | | | 15 | |
| | | | | | | | | | | | | | | | |
Net investment income (loss) | | | 14 | | | | 2,166 | | | | 22 | | | | 15 | |
Realized and unrealized gain (loss) | | | | | | | | | | | | | | | | |
Net realized gain (loss) on transactions from investments | | | 6 | | | | 560 | | | | 39 | | | | 27 | |
| | | | | | | | | | | | | | | | |
Change in net unrealized appreciation (depreciation) of investments | | | 195 | | | | 10,054 | | | | 158 | | | | 58 | |
| | | | | | | | | | | | | | | | |
Net increase (decrease) in net assets resulting from operations | | $ | 215 | | | $ | 12,780 | | | $ | 219 | | | $ | 100 | |
| | | | | | | | | | | | | | | | |
See accompanying Notes to Financial Statements.
June 30, 2012 | William Blair Funds 113 |
Statements of Changes in Net Assets
for the Period Ended June 30, 2012 and the Year Ended December 31, 2011 (all amounts in thousands) (unaudited)
| | | | | | | | | | | | | | | | | | | | | | | | | | | | | | | | |
| | | Large Cap
Value
Fund | | | Small Cap
Value
Fund | | | Mid Cap
Value
Fund | | | Small-Mid
Cap Value
Fund | |
| | | 2012 | | | 2011 (a) | | | 2012 | | | 2011 | | | 2012 | | | 2011 | | | 2012 | | | 2011 (b) | |
Operations | | | | | | | | | | | | | | | | | | | | | | | | | | | | | | | | |
Net investment income (loss) | | $ | 14 | | | $ | 7 | | | $ | 2,166 | | | $ | 440 | | | $ | 22 | | | $ | 46 | | | $ | 15 | | | $ | 1 | |
Net realized gain (loss) on investments | | | 6 | | | | (4 | ) | | | 560 | | | | 890 | | | | 39 | | | | 40 | | | | 27 | | | | (3 | ) |
Change in net unrealized appreciation (depreciation) on investments | | | 195 | | | | (7 | ) | | | 10,054 | | | | (16,890 | ) | | | 158 | | | | (92 | ) | | | 58 | | | | 94 | |
| | | | | | | | | | | | | | | | | | | | | | | | | | | | | | | | |
Net increase (decrease) in net assets resulting from operations | | | 215 | | | | (4 | ) | | | 12,780 | | | | (15,560 | ) | | | 219 | | | | (6 | ) | | | 100 | | | | 92 | |
Distributions to shareholders from | | | | | | | | | | | | | | | | | | | | | | | | | | | | | | | | |
Net investment income | | | — | | | | (7 | ) | | | — | | | | (489 | ) | | | — | | | | (48 | ) | | | — | | | | — | |
Net realized gain | | | — | | | | — | | | | — | | | | (8,188 | ) | | | — | | | | (51 | ) | | | — | | | | — | |
Return of Capital | | | — | | | | — | | | | — | | | | (333 | ) | | | — | | | | — | | | | — | | | | — | |
| | | | | | | | | | | | | | | | | | | | | | | | | | | | | | | | |
| | | | | | | (7 | ) | | | | | | | (9,010 | ) | | | | | | | (99 | ) | | | | | | | — | |
Capital stock transactions | | | | | | | | | | | | | | | | | | | | | | | | | | | | | | | | |
Net proceeds from sale of shares | | | 544 | | | | 2,457 | | | | 30,182 | | | | 162,792 | | | | 275 | | | | 1,698 | | | | 37 | | | | 2,064 | |
Shares issued in reinvestment of income dividends and capital gain distributions | | | — | | | | 7 | | | | — | | | | 8,075 | | | | — | | | | 85 | | | | — | | | | — | |
Less cost of shares redeemed | | | — | | | | — | | | | (34,854 | ) | | | (79,398 | ) | | | (87 | ) | | | (498 | ) | | | (28 | ) | | | — | |
| | | | | | | | | | | | | | | | | | | | | | | | | | | | | | | | |
Net increase (decrease) in net assets resulting from capital share transactions | | | 544 | | | | 2,464 | | | | (4,672 | ) | | | 91,469 | | | | 188 | | | | 1,285 | | | | 9 | | | | 2,064 | |
| | | | | | | | | | | | | | | | | | | | | | | | | | | | | | | | |
Increase (decrease) in net assets | | | 759 | | | | 2,453 | | | | 8,108 | | | | 66,899 | | | | 407 | | | | 1,180 | | | | 109 | | | | 2,156 | |
Net assets | | | | | | | | | | | | | | | | | | | | | | | | | | | | | | | | |
Beginning of period | | $ | 2,453 | | | $ | — | | | $ | 231,398 | | | $ | 164,499 | | | $ | 4,573 | | | $ | 3,393 | | | $ | 2,156 | | | $ | — | |
| | | | | | | | | | | | | | | | | | | | | | | | | | | | | | | | |
End of period | | $ | 3,212 | | | $ | 2,453 | | | $ | 239,506 | | | $ | 231,398 | | | $ | 4,980 | | | $ | 4,573 | | | $ | 2,265 | | | $ | 2,156 | |
| | | | | | | | | | | | | | | | | | | | | | | | | | | | | | | | |
Undistributed net investment income (loss) at the end of the period | | $ | 14 | | | $ | — | | | $ | 2,191 | | | $ | 25 | | | $ | 22 | | | $ | 3 | | | $ | 16 | | | $ | 1 | |
| | | | | | | | | | | | | | | | | | | | | | | | | | | | | | | | |
| (a) | | For the period from October 24, 2011 (Commencement of Operations) to December 31, 2011. |
| (b) | | For the period from December 15, 2011 (Commencement of Operations) to December 31, 2011. |
See accompanying Notes to Financial Statements.
114 Semi-Annual Report | June 30, 2012 |
Statements of Assets and Liabilities
June 30, 2012 (dollar amounts in thousands) (unaudited)
| | | | | | | | | | | | | | | | |
| | | Bond
Fund | | | Income
Fund | | | Low
Duration
Fund | | | Ready
Reserves
Fund | |
Assets | | | | | | | | | | | | | | | | |
Investments in securities, at cost | | $ | 251,058 | | | $ | 127,691 | | | $ | 184,052 | | | $ | 1,291,239 | |
| | | | | | | | | | | | | | | | |
| | | | |
Investments in securities, at value | | $ | 267,441 | | | $ | 132,802 | | | $ | 185,336 | | | $ | 1,291,239 | |
Receivable for fund shares sold | | | 297 | | | | 472 | | | | 3,340 | | | | — | |
Receivable from Advisor | | | 14 | | | | — | | | | 2 | | | | 491 | |
Dividend and interest receivable | | | 2,484 | | | | 880 | | | | 572 | | | | 1,515 | |
| | | | | | | | | | | | | | | | |
Total assets | | | 270,236 | | | | 134,154 | | | | 189,250 | | | | 1,293,245 | |
Liabilities | | | | | | | | | | | | | | | | |
Payable for investment securities purchased | | | 999 | | | | 1,989 | | | | 1,711 | | | | — | |
Payable for fund shares redeemed | | | 190 | | | | 230 | | | | — | | | | — | |
Investment advisory fee payable | | | 65 | | | | 44 | | | | 45 | | | | 263 | |
Distribution fee payable | | | 26 | | | | 7 | | | | 14 | | | | 371 | |
Other accrued expenses | | | 117 | | | | 73 | | | | 66 | | | | 22 | |
| | | | | | | | | | | | | | | | |
Total liabilities | | | 1,397 | | | | 2,343 | | | | 1,836 | | | | 656 | |
| | | | | | | | | | | | | | | | |
Net Assets | | $ | 268,839 | | | $ | 131,811 | | | $ | 187,414 | | | $ | 1,292,589 | |
| | | | | | | | | | | | | | | | |
Capital | | | | | | | | | | | | | | | | |
Composition of Net Assets | | | | | | | | | | | | | | | | |
Par value of shares of beneficial interest | | $ | 24 | | | $ | 14 | | | $ | 19 | | | $ | 1,292 | |
Capital paid in excess of par value | | | 250,394 | | | | 165,536 | | | | 189,501 | | | | 1,291,230 | |
Accumulated net investment income (loss) | | | (780 | ) | | | (462 | ) | | | (984 | ) | | | 108 | |
Accumulated net realized gain (loss) | | | 2,818 | | | | (38,388 | ) | | | (2,406 | ) | | | (41 | ) |
Net unrealized appreciation (depreciation) of investments and foreign currencies | | | 16,383 | | | | 5,111 | | | | 1,284 | | | | — | |
| | | | | | | | | | | | | | | | |
Net Assets | | $ | 268,839 | | | $ | 131,811 | | | $ | 187,414 | | | $ | 1,292,589 | |
| | | | | | | | | | | | | | | | |
| | | | |
Class N Shares | | | | | | | | | | | | | | | | |
Net Assets | | $ | 25,679 | | | $ | 56,975 | | | $ | 8,322 | | | $ | 1,292,589 | |
Shares Outstanding | | | 2,313,797 | | | | 6,047,933 | | | | 845,908 | | | | 1,292,646,032 | |
Net Asset Value Per Share | | $ | 11.10 | | | $ | 9.42 | | | $ | 9.84 | | | $ | 1.00 | |
Class I Shares | | | | | | | | | | | | | | | | |
Net Assets | | $ | 159,385 | | | $ | 74,836 | | | $ | 102,941 | | | | | |
Shares Outstanding | | | 14,502,673 | | | | 8,004,388 | | | | 10,463,006 | | | | | |
Net Asset Value Per Share | | $ | 10.99 | | | $ | 9.35 | | | $ | 9.84 | | | | | |
See accompanying Notes to Financial Statements.
June 30, 2012 | William Blair Funds 115 |
Statements of Operations
for the Period Ended June 30, 2012 (all amounts in thousands) (unaudited)
| | | | | | | | | | | | | | | | |
| | | Bond
Fund | | | Income
Fund | | | Low
Duration
Fund | | | Ready
Reserves
Fund | |
Investment income | | | | | | | | | | | | | | | | |
Interest | | $ | 5,340 | | | $ | 2,219 | | | $ | 1,963 | | | $ | 890 | |
| | | | | | | | | | | | | | | | |
Total income | | | 5,340 | | | | 2,219 | | | | 1,963 | | | | 890 | |
Expenses | | | | | | | | | | | | | | | | |
Investment advisory fees | | | 374 | | | | 256 | | | | 257 | | | | 1,524 | |
Distribution fees | | | 14 | | | | 38 | | | | 5 | | | | — | �� |
Shareholder services fees | | | 132 | | | | — | | | | 73 | | | | 2,226 | |
Custodian fees | | | 27 | | | | 25 | | | | 34 | | | | 19 | |
Transfer agent fees | | | 16 | | | | 16 | | | | 11 | | | | 18 | |
Sub-transfer agent fees | | | | | | | | | | | | | | | | |
Class N | | | 9 | | | | 29 | | | | 1 | | | | — | |
Class I | | | 20 | | | | 5 | | | | — | | | | — | |
Professional fees | | | 13 | | | | 7 | | | | 10 | | | | 47 | |
Registration fees | | | 29 | | | | 18 | | | | 31 | | | | 14 | |
Shareholder reporting fees | | | 2 | | | | 5 | | | | — | | | | 15 | |
Trustee fees | | | 5 | | | | 2 | | | | 3 | | | | 27 | |
Other expenses | | | 6 | | | | 3 | | | | 6 | | | | 21 | |
| | | | | | | | | | | | | | | | |
Total expenses before waiver | | | 647 | | | | 404 | | | | 431 | | | | 3,911 | |
Expenses waived and reimbursed by the Advisor | | | (64 | ) | | | — | | | | (10 | ) | | | (3,085 | ) |
| | | | | | | | | | | | | | | | |
Net expenses | | | 583 | | | | 404 | | | | 421 | | | | 826 | |
| | | | | | | | | | | | | | | | |
Net investment income (loss) | | | 4,757 | | | | 1,815 | | | | 1,542 | | | | 64 | |
Realized and unrealized gain (loss) | | | | | | | | | | | | | | | | |
Net realized gain (loss) on transactions from investments | | | 1,969 | | | | 1,499 | | | | 155 | | | | — | |
| | | | | | | | | | | | | | | | |
Change in net unrealized appreciation (depreciation) of investments | | | 2,990 | | | | 153 | | | | 1,025 | | | | — | |
| | | | | | | | | | | | | | | | |
Net increase (decrease) in net assets resulting from operations | | $ | 9,716 | | | $ | 3,467 | | | $ | 2,722 | | | $ | 64 | |
| | | | | | | | | | | | | | | | |
See accompanying Notes to Financial Statements.
116 Semi-Annual Report | June 30, 2012 |
Statements of Changes in Net Assets
for the Period Ended June 30, 2012 and the Year Ended December 31, 2011 (all amounts in thousands) (unaudited)
| | | | | | | | | | | | | | | | | | | | | | | | | | | | | | | | |
| | | Bond
Fund | | | Income
Fund | | | Low
Duration
Fund | | | Ready
Reserves
Fund | |
| | | 2012 | | | 2011 | | | 2012 | | | 2011 | | | 2012 | | | 2011 | | | 2012 | | | 2011 | |
Operations | | | | | | | | | | | | | | | | | | | | | | | | | | | | | | | | |
Net investment income (loss) | | $ | 4,757 | | | $ | 8,820 | | | $ | 1,815 | | | $ | 3,627 | | | $ | 1,542 | | | $ | 2,586 | | | $ | 64 | | | $ | 125 | |
Net realized gain (loss) on investments | | | 1,969 | | | | 3,325 | | | | 1,499 | | | | 2,582 | | | | 155 | | | | 59 | | | | — | | | | — | |
Change in net unrealized appreciation (depreciation) on investments | | | 2,990 | | | | 3,590 | | | | 153 | | | | (897 | ) | | | 1,025 | | | | 360 | | | | — | | | | — | |
| | | | | | | | | | | | | | | | | | | | | | | | | | | | | | | | |
Net increase (decrease) in net assets resulting from operations | | | 9,716 | | | | 15,735 | | | | 3,467 | | | | 5,312 | | | | 2,722 | | | | 3,005 | | | | 64 | | | | 125 | |
Distributions to shareholders from | | | | | | | | | | | | | | | | | | | | | | | | | | | | | | | | |
Net investment income | | | (5,539 | ) | | | (9,700 | ) | | | (2,277 | ) | | | (4,177 | ) | | | (2,526 | ) | | | (4,103 | ) | | | (64 | ) | | | (125 | ) |
Net realized gain | | | — | | | | (1,831 | ) | | | — | | | | — | | | | — | | | | — | | | | — | | | | — | |
| | | | | | | | | | | | | | | | | | | | | | | | | | | | | | | | |
| | | (5,539 | ) | | | (11,531 | ) | | | (2,277 | ) | | | (4,177 | ) | | | (2,526 | ) | | | (4,103 | ) | | | (64 | ) | | | (125 | ) |
Capital stock transactions | | | | | | | | | | | | | | | | | | | | | | | | | | | | | | | | |
Net proceeds from sale of shares | | | 47,896 | | | | 100,839 | | | | 38,088 | | | | 34,055 | | | | 55,396 | | | | 121,427 | | | | 363,966 | | | | 838,997 | |
Shares issued in reinvestment of income dividends and capital gain distributions | | | 4,205 | | | | 8,489 | | | | 1,881 | | | | 3,514 | | | | 1,963 | | | | 3,322 | | | | 64 | | | | 125 | |
Less cost of shares redeemed | | | (19,455 | ) | | | (74,292 | ) | | | (21,333 | ) | | | (39,996 | ) | | | (27,288 | ) | | | (109,974 | ) | | | (343,187 | ) | | | (783,919 | ) |
| | | | | | | | | | | | | | | | | | | | | | | | | | | | | | | | |
Net increase (decrease) in net assets resulting from capital share transactions | | | 32,646 | | | | 35,036 | | | | 18,636 | | | | (2,427 | ) | | | 30,071 | | | | 14,775 | | | | 20,843 | | | | 55,203 | |
| | | | | | | | | | | | | | | | | | | | | | | | | | | | | | | | |
Increase (decrease) in net assets | | | 36,823 | | | | 39,240 | | | | 19,826 | | | | (1,292 | ) | | | 30,267 | | | | 13,677 | | | | 20,843 | | | | 55,203 | |
Net assets | | | | | | | | | | | | | | | | | | | | | | | | | | | | | | | | |
Beginning of period | | | 232,016 | | | | 192,776 | | | | 111,985 | | | | 113,277 | | | | 157,147 | | | | 143,470 | | | | 1,271,746 | | | | 1,216,543 | |
| | | | | | | | | | | | | | | | | | | | | | | | | | | | | | | | |
End of period | | $ | 268,839 | | | $ | 232,016 | | | $ | 131,811 | | | $ | 111,985 | | | $ | 187,414 | | | $ | 157,147 | | | $ | 1,292,589 | | | $ | 1,271,746 | |
| | | | | | | | | | | | | | | | | | | | | | | | | | | | | | | | |
Undistributed net investment income (loss) at the end of the period | | $ | (780 | ) | | $ | 2 | | | $ | (462 | ) | | $ | — | | | $ | (984 | ) | | $ | — | | | $ | 108 | | | $ | 108 | |
| | | | | | | | | | | | | | | | | | | | | | | | | | | | | | | | |
See accompanying Notes to Financial Statements.
June 30, 2012 | William Blair Funds 117 |
Notes to Financial Statements
(1) Significant Accounting Policies
The following is a summary of William Blair Funds’ (the “Trust”) significant accounting policies in effect during the period covered by the financial statements, which are in accordance with U.S. generally accepted accounting principles.
(a) Description of the Trust
The Trust is a diversified mutual fund registered under the Investment Company Act of 1940 (the “1940 Act”), as amended, as an open-end management investment company. The Trust currently consists of the following twenty-four funds (the “Funds”), each with its own investment objective and policies. For each Fund, the number of shares authorized is unlimited.
| | |
Equity Funds Growth Large Cap Growth Small Cap Growth Mid Cap Growth Small-Mid Cap Growth Large Cap Value Small Cap Value Mid Cap Value Small-Mid Cap Value Global Equity Fund Global Growth Multi-Asset and Alternative Funds Macro Allocation Commodity Strategy Long/Short | | International Equity Funds International Growth International Equity Institutional International Growth Institutional International Equity International Small Cap Growth Emerging Markets Growth Emerging Leaders Growth Emerging Markets Small Cap Growth Fixed-Income Funds Bond Income Low Duration Money Market Fund Ready Reserves |
| |
| |
| |
| |
| |
| |
| |
| |
| |
| |
| |
| |
| |
The investment objectives of the Funds are as follows:
| | |
Equity | | Long-term capital appreciation. |
Global Equity | | Long-term capital appreciation. |
International Equity | | Long-term capital appreciation. |
Fixed-Income | | High level of current income with relative stability of principal.
(Maximize total return—Low Duration) |
Money Market | | Current income, a stable share price and daily liquidity. |
The Institutional International Growth Fund, the Institutional International Equity Fund and the Institutional Class of each of the International Small Cap Growth Fund, the Emerging Markets Growth Fund, the Emerging Leaders Growth Fund, the Bond Fund and the Low Duration Fund issue a separate report.
The Macro Allocation Fund and the Commodity Strategy Long/Short Fund have a fiscal year end of October 31, and issue a separate report.
(b) Share Classes
Three different classes of shares currently exist: N, I and Institutional. This report includes financial highlight information for Classes N and I. The table below describes the Class N shares and the Class I shares covered by this report:
| | |
Class | | Description |
| N | | Class N shares are sold to the general public, either directly through the Trust’s distributor or through a select number of financial intermediaries. Class N shares are sold without any sales load, and carry an annual 12b-1 distribution fee (0.25% for the Equity, Global Equity and International Equity Funds and 0.15% for the Fixed-Income Funds) or a service fee (0.35% for the Money Market Fund), a sub-transfer agent fee that is not a fixed rate and may vary by Fund and class, and an annual shareholder administration fee (0.15% for the Global Growth Fund, the International Small Cap Growth Fund, the Emerging Markets Growth Fund, the Emerging Leaders Growth Fund, the Emerging Markets Small Cap Growth Fund, the Bond Fund and the Low Duration Fund). |
118 Semi-Annual Report | June 30, 2012 |
| | |
Class | | Description |
| I | | Class I shares are sold to a limited group of investors. They do not carry any sales load or distribution fees and generally have lower ongoing expenses than the Class N shares. Class I shares have a sub-transfer agent fee that is not a fixed rate and may vary by Fund and class and the Global Growth Fund, the International Small Cap Growth Fund, the Emerging Markets Growth Fund, the Emerging Leaders Growth Fund, the Emerging Markets Small Cap Growth Fund, the Bond Fund and the Low Duration Fund carry an annual shareholder administration fee of 0.15%. |
Sub-transfer agent fees: The Funds may reimburse the Advisor for fees paid to intermediaries such as banks, broker-dealers, financial advisors or other financial institutions for sub-transfer agency, sub-administration and other services provided to investors whose shares are held of record in omnibus, other group accounts, retirement plans or accounts traded through registered securities clearing agents. These fees may vary based on, for example, the nature of services provided, but generally range up to 0.15% of the assets of the class serviced or maintained by the intermediary or up to $15 per sub-account maintained by the intermediary.
Investment income, realized and unrealized gains and losses, and certain Fund level expenses and expense reductions, if any, are allocated based on the relative net assets of each class, except for certain class specific expenses, which are charged directly to the appropriate class. Differences in class expenses may result in the payment of different per share dividends by class. All share classes of the Funds have equal rights with respect to voting subject to class specific arrangements.
(c) Investment Valuation
The market value of domestic equity securities is determined by valuing securities traded on national securities markets or in the over-the-counter markets at the last sale price or, if applicable, the official closing price or, in the absence of a recent sale on the date of determination, at the latest bid price.
The value of foreign equity securities is generally determined based upon the last sale price on the foreign exchange or market on which it is primarily traded and in the currency of that market as of the close of the appropriate exchange or, if there have been no sales during that day, at the latest bid price. The Board of Trustees has determined that the passage of time between when the foreign exchanges or markets close and when the Funds compute their net asset values could cause the value of foreign equity securities to no longer be representative or accurate and, as a result, may necessitate that such securities be fair valued. Accordingly, for foreign equity securities, the Funds may use an independent pricing service to fair value the security as of the close of regular trading on the New York Stock Exchange. As a result, a Fund’s value for a security may be different from the last sale price (or the latest bid price).
Fixed-income securities are valued by using market quotations or independent pricing services that use either prices provided by market-makers or matrices that produce estimates of market values obtained from yield data relating to instruments or securities with similar characteristics.
Securities, and other assets, for which a market price is not available or is deemed unreliable, (e.g., securities affected by unusual or extraordinary events, such as natural disasters or securities affected by market or economic events, such as bankruptcy filings), or the value of which is affected by a significant valuation event, are valued at a fair value as determined in good faith by, or under the direction of, the Board of Trustees and in accordance with the Trust’s Valuation Procedures. The value of fair valued securities may be different from the last sale price (or the latest bid price), and there is no guarantee that a fair valued security will be sold at the price at which a Fund is carrying the security.
Investments in other funds are valued at the underlying fund’s net asset value on the date of valuation. Securities held in the Ready Reserves Fund are valued at amortized cost, which approximates market value.
As of June 30, 2012, there were securities held in the International Growth, International Small Cap Growth, Emerging Markets Growth, Bond and Income Funds requiring fair valuation pursuant to the Funds’ Valuation Procedures.
(d) Investment income and transactions
Dividend income is recorded on the ex-dividend date, except for those dividends from certain foreign securities that are recorded when the information is available.
June 30, 2012 | William Blair Funds 119 |
Interest income is recorded on an accrual basis, adjusted for amortization of premium or discount. Variable rate bonds and floating rate notes earn interest at coupon rates that fluctuate at specific time intervals. The interest rates shown in the Portfolio of Investments for the Bond, Income, Low Duration and Ready Reserves Funds were the rates in effect on June 30, 2012. Put bonds may be redeemed at the discretion of the holder on specified dates prior to maturity.
Premiums and discounts are accreted and amortized on a straight-line basis for short-term investments and on an effective interest method for long-term investments.
Paydown gains and losses on mortgage and asset-backed securities are treated as an adjustment to interest income. For the period ended June 30, 2012, the Bond, Income and Low Duration Funds recognized a reduction of interest income and a decrease of net realized loss of $(462), $(786) and $(984), respectively (in thousands). This reclassification had no effect on the net asset value or the net assets of the Funds.
The Funds do not isolate that portion of the results of operations resulting from changes in foreign exchange rates on investments from the fluctuations arising from changes in market prices of securities held. Such fluctuations are included with the net realized and unrealized gain or loss from investments.
Reported net realized foreign currency gains or losses arise from disposition of foreign currency, the difference in the foreign exchange rates between the trade and settlement dates on securities transactions, and the difference between the amounts of dividends, interest and foreign withholding taxes recorded on the ex-date or accrual date and the U.S. dollar equivalent of the amounts actually received or paid. Net unrealized foreign exchange gains and losses arise from changes (due to the changes in the exchange rate) in the value of foreign currency and other assets and liabilities denominated in foreign currencies held at year end.
Security and shareholder transactions are accounted for no later than one business day following the trade date. However, for financial reporting purposes, security and shareholder transactions are accounted for on the trade date of the last business day of the reporting year. Realized gains and losses from securities transactions are recognized on a specifically identified cost basis.
Awards from class action litigation may be recorded as a reduction of cost. If the Funds no longer own the applicable securities, the proceeds are recorded as realized gains.
(e) Share Valuation and Distributions to Shareholders
Shares are sold and redeemed on a continuous basis at net asset value. The net asset value per share is determined separately for each class by dividing the Fund’s net assets attributable to that class by the number of shares of the class outstanding as of the close of regular trading on the New York Stock Exchange (the “Exchange”), which is generally 4:00 p.m. Eastern time, on each day the Exchange is open. Redemption fees may be applicable to redemptions or exchanges within 60 days of purchase. For both Class N and Class I shares, the Equity Funds assess a 1% redemption fee on shares sold or exchanged that have been owned 60 days or less and the Global Equity and International Equity Funds assess a 2% redemption fee on shares sold or exchanged that have been owned 60 days or less as disclosed within the Fund’s Prospectus. The redemption fees collected by the Fund are netted against the amount of redemptions for presentation on the Statements of Changes in Net Assets.
The redemption fees collected by the Funds were as follows (in thousands):
| | | | | | | | |
Fund | | Period Ended
June 30,
2012 | | | Year Ended
December 31,
2011 | |
Growth | | $ | 3 | | | $ | 11 | |
Large Cap Growth | | | — | | | | — | |
Small Cap Growth | | | 3 | | | | 15 | |
Mid Cap Growth | | | 5 | | | | 13 | |
Small-Mid Cap Growth | | | 5 | | | | 8 | |
Global Growth | | | — | | | | 1 | |
International Growth | | | 29 | | | | 107 | |
International Equity | | | — | | | | 4 | |
International Small Cap Growth | | | 13 | | | | 18 | |
120 Semi-Annual Report | June 30, 2012 |
| | | | | | | | |
Fund | | Period Ended
June 30,
2012 | | | Year Ended
December 31,
2011 | |
Emerging Markets Growth | | | — | | | | 4 | |
Emerging Leaders Growth | | | 1 | | | | 1 | |
Emerging Markets Small Cap Growth | | | — | | | | — | |
Large Cap Value | | | — | | | | — | |
Small Cap Value | | | 6 | | | | 48 | |
Mid Cap Value | | | — | | | | — | |
Small-Mid Cap Value | | | 1 | | | | — | |
Distributions from net investment income, if any, of the Growth, Large Cap Growth, Small Cap Growth, Mid Cap Growth, Small-Mid Cap Growth, Global Growth, International Growth, International Equity, International Small Cap Growth, Emerging Markets Growth, Emerging Leaders Growth, Emerging Markets Small Cap Growth, Large Cap Value, Small Cap Value, Mid Cap Value, and Small-Mid Cap Value Funds are declared and paid at least annually. Distributions from the Bond, Income, Low Duration and Ready Reserves Funds are declared daily and paid monthly. Capital gain distributions, if any, are declared and paid at least annually in December. Distributions payable to shareholders are recorded on the ex-dividend date.
(f) Foreign Currency Translation and Forward Foreign Currency Contracts
The Global Growth, International Growth, International Equity, International Small Cap Growth, Emerging Markets Growth, Emerging Leaders Growth, and Emerging Markets Small Cap Growth Funds may invest in securities denominated in foreign currencies. As such, assets and liabilities denominated in foreign currencies are translated into U.S. dollar amounts at the current exchange rate on the date of valuation. The values of foreign investments, open forward foreign currency contracts, and cash denominated in foreign currencies are translated into U.S. dollars using a spot market rate of exchange as of the time of the determination of each Fund’s Net Asset Value, typically 4:00 p.m. Eastern time on days when there is regular trading on the New York Stock Exchange. Payables and receivables for securities transactions, dividends, interest income and tax reclaims are translated into U.S. dollars using a spot market rate of exchange as of 4:00 p.m. Eastern time. Settlement of purchases and sales and dividend and interest receipts are translated into U.S. dollars using a spot market rate of exchange as of 11:00 a.m. Eastern time.
(g) Income Taxes
Each Fund intends to comply with the provisions of Subchapter M of the Internal Revenue Code available to regulated investment companies. Each Fund intends to make the requisite distributions of income and capital gains to its shareholders sufficient to relieve it from all, or substantially all, federal income and excise taxes. No provision for federal income and excise taxes has been made.
The Global Growth, International Growth, International Equity, International Small Cap Growth, Emerging Markets Growth, Emerging Leaders Growth and Emerging Market Small Cap Growth Funds may be subject to a tax imposed on net realized and unrealized gains on securities of certain foreign countries.
Management has evaluated all of the uncertain tax positions of the Funds and has determined that no liability is required to be recorded in the financial statements.
The statute of limitations on the Funds’ tax returns for each of the tax years in the four year period ended December 31, 2011, remains open and the returns are subject to examination.
The Funds have elected to mark-to-market their investments in Passive Foreign Investment Companies (“PFICs”) for federal income tax purposes. The Funds also treat the deferred loss associated with current and prior year wash sales as an adjustment to the cost of investments for tax purposes. The cost of investments for federal income tax purposes and related gross unrealized appreciation/(depreciation) and net unrealized appreciation (depreciation) at June 30, 2012, were as follows (in thousands):
| | | | | | | | | | | | | | | | |
Fund | | Cost of
Investments | | | Gross
Unrealized
Appreciation | | | Gross
Unrealized
Depreciation | | | Net
Unrealized
Appreciation/ Depreciation | |
Growth | | $ | 511,887 | | | $ | 118,966 | | | $ | 18,471 | | | $ | 100,495 | |
Large Cap Growth | | | 21,386 | | | | 6,063 | | | | 381 | | | | 5,682 | |
June 30, 2012 | William Blair Funds 121 |
| | | | | | | | | | | | | | | | |
Fund | | Cost of
Investments | | | Gross
Unrealized
Appreciation | | | Gross
Unrealized
Depreciation | | | Net
Unrealized
Appreciation/ Depreciation | |
Small Cap Growth | | $ | 487,187 | | | $ | 80,762 | | | $ | 53,308 | | | $ | 27,454 | |
Mid Cap Growth | | | 340,478 | | | | 28,076 | | | | 13,805 | | | | 14,271 | |
Small-Mid Cap Growth | | | 317,632 | | | | 35,989 | | | | 18,013 | | | | 17,976 | |
Global Growth | | | 39,999 | | | | 7,942 | | | | 1,259 | | | | 6,683 | |
International Growth | | | 3,114,293 | | | | 347,140 | | | | 148,327 | | | | 198,813 | |
International Equity | | | 64,587 | | | | 6,506 | | | | 1,986 | | | | 4,520 | |
International Small Cap Growth | | | 613,406 | | | | 69,552 | | | | 34,638 | | | | 34,914 | |
Emerging Markets Growth | | | 894,872 | | | | 70,072 | | | | 40,969 | | | | 29,103 | |
Emerging Leaders Growth | | | 44,328 | | | | 2,000 | | | | 1,640 | | | | 360 | |
Emerging Markets Small Cap Growth | | | 6,058 | | | | 629 | | | | 194 | | | | 435 | |
Large Cap Value | | | 2,980 | | | | 283 | | | | 98 | | | | 185 | |
Small Cap Value | | | 223,776 | | | | 22,938 | | | | 6,074 | | | | 16,864 | |
Mid Cap Value | | | 4,816 | | | | 427 | | | | 192 | | | | 235 | |
Small-Mid Cap Value | | | 2,067 | | | | 197 | | | | 45 | | | | 152 | |
Bond | | | 251,058 | | | | 16,751 | | | | 368 | | | | 16,383 | |
Income | | | 127,691 | | | | 5,695 | | | | 584 | | | | 5,111 | |
Low Duration | | | 184,052 | | | | 1,671 | | | | 387 | | | | 1,284 | |
Ready Reserves | | | 1,291,239 | | | | — | | | | — | | | | — | |
The timing and characterization of certain income and capital gain distributions are determined annually in accordance with federal income tax regulations that may differ from U.S. generally accepted accounting principles. As a result, net investment income or loss and net realized gain or loss for a reporting period may differ from the amount distributed during such period. In addition, the Funds may periodically record reclassifications among certain capital accounts to reflect differences between financial reporting and income tax basis distributions. The reclassifications were reported in order to reflect the tax treatment for certain permanent differences that exist between income tax regulations and U.S. generally accepted accounting principles. The reclassifications generally relate to net operating losses, Section 988 currency gains and losses, PFICs gains and losses, recharacterization of dividends received from investments in Real Estate Investment Trust, paydown gains and losses, expired capital loss carryforwards and redemptions in-kind. These reclassifications have no impact on the net asset values of the Funds. Accordingly, at December 31, 2011, the following reclassifications were recorded (in thousands):
| | | | | | | | | | | | |
Fund | | Accumulated Net
Investment
Income (Loss) | | | Accumulated
Net Realized
Gain (Loss) | | | Capital
Paid in Excess
of Par Value | |
Growth | | $ | 886 | | | $ | 2 | | | $ | (888 | ) |
Large Cap Growth | | | 16 | | | | — | | | | (16 | ) |
Small Cap Growth | | | 7,875 | | | | — | | | | (7,875 | ) |
Mid Cap Growth | | | 573 | | | | — | | | | (573 | ) |
Small-Mid Cap Growth | | | 1,387 | | | | (1,387 | ) | | | — | |
Global Growth | | | (53 | ) | | | 54 | | | | (1 | ) |
International Growth | | | (8,284 | ) | | | (106,774 | ) | | | 115,058 | |
International Equity | | | (269 | ) | | | 269 | | | | — | |
International Small Cap Growth | | | 8,995 | | | | (8,995 | ) | | | — | |
Emerging Markets Growth | | | 5,939 | | | | (24,168 | ) | | | 18,229 | |
Emerging Leaders Growth | | | (251 | ) | | | 276 | | | | (25 | ) |
Emerging Markets Small Cap Growth | | | (15 | ) | | | 15 | | | | — | |
Large Cap Value | | | — | | | | — | | | | — | |
Small Cap Value | | | 271 | | | | 62 | | | | (333 | ) |
Mid Cap Value | | | (2 | ) | | | 2 | | | | — | |
Small-Mid Cap Value | | | — | | | | — | | | | — | |
Bond | | | 879 | | | | (879 | ) | | | — | |
Income | | | 550 | | | | (550 | ) | | | — | |
Low Duration | | | 1,517 | | | | (1,517 | ) | | | — | |
Ready Reserves | | | 22 | | | | (19 | ) | | | (3 | ) |
122 Semi-Annual Report | June 30, 2012 |
Distributions from net realized gains for book purposes may include short-term capital gains, which are included as ordinary income for tax purposes. The tax character of distributions paid during 2011 and 2010 was as follows (in thousands):
| | | | | | | | | | | | | | | | | | | | | | | | | | | | | | | | | | | | | | | | |
| | | Distributions Paid in 2011 | | | Distributions Paid in 2010 | |
| | | Return of Capital | | | Ordinary Income | | | Long-Term Capital
Gains | | | Ordinary Income | | | Long-Term
Capital Gains | |
Fund | | Class N | | | Class I | | | Class N | | | Class I | | | Class N | | | Class I | | | Class N | | | Class I | | | Class N | | | Class I | |
Growth | | $ | — | | | $ | — | | | $ | — | | | $ | 329 | | | $ | 5,882 | | | $ | 10,199 | | | $ | — | | | $ | 13 | | | $ | — | | | $ | — | |
Large Cap Growth | | | — | | | | — | | | | — | | | | 37 | | | | — | | | | — | | | | — | | | | 33 | | | | — | | | | — | |
Small Cap Growth | | | — | | | | — | | | | — | | | | — | | | | — | | | | — | | | | — | | | | — | | | | — | | | | — | |
Mid Cap Growth | | | — | | | | — | | | | — | | | | — | | | | 2,378 | | | | 8,679 | | | | — | | | | — | | | | — | | | | — | |
Small-Mid Cap Growth | | | — | | | | — | | | | 595 | | | | 3,772 | | | | 2,542 | | | | 16,104 | | | | — | | | | — | | | | — | | | | — | |
Global Growth | | | — | | | | — | | | | 4 | | | | 170 | | | | — | | | | — | | | | — | | | | 12 | | | | — | | | | — | |
International Growth | | | — | | | | — | | | | — | | | | 6,046 | | | | — | | | | — | | | | 50,883 | | | | 50,550 | | | | — | | | | — | |
International Equity | | | — | | | | — | | | | — | | | | — | | | | — | | | | — | | | | 174 | | | | 2,404 | | | | — | | | | — | |
International Small Cap Growth | | | — | | | | — | | | | 193 | | | | 5,147 | | | | — | | | | — | | | | 37 | | | | 1,356 | | | | — | | | | — | |
Emerging Markets Growth | | | — | | | | — | | | | — | | | | 466 | | | | 2,577 | | | | 18,690 | | | | 269 | | | | 1,881 | | | | — | | | | — | |
Emerging Leaders Growth | | | — | | | | 12 | | | | — | | | | 581 | | | | 3 | | | | 1,287 | | | | 229 | | | | 26 | | | | 427 | | | | 78 | |
Emerging Markets Small Cap Growth | | | — | | | | — | | | | — | | | | — | | | | — | | | | — | | | | N/A | | | | N/A | | | | N/A | | | | N/A | |
Large Cap Value | | | — | | | | — | | | | 3 | | | | 4 | | | | — | | | | — | | | | N/A | | | | N/A | | | | N/A | | | | N/A | |
Small Cap Value | | | 60 | | | | 273 | | | | 6 | | | | 483 | | | | 1,471 | | | | 6,717 | | | | 31 | | | | 238 | | | | 27 | | | | 108 | |
Mid Cap Value | | | — | | | | — | | | | 1 | | | | 61 | | | | 1 | | | | 36 | | | | — | | | | 26 | | | | — | | | | — | |
Small-Mid Cap Value | | | — | | | | — | | | | — | | | | — | | | | — | | | | — | | | | N/A | | | | N/A | | | | N/A | | | | N/A | |
Bond | | | — | | | | — | | | | 229 | | | | 6,707 | | | | 66 | | | | 1,188 | | | | 179 | | | | 6,904 | | | | 11 | | | | 384 | |
Income | | | — | | | | — | | | | 1,377 | | | | 2,800 | | | | — | | | | — | | | | 1,559 | | | | 3,575 | | | | — | | | | — | |
Low Duration | | | — | | | | — | | | | 152 | | | | 2,098 | | | | — | | | | — | | | | 101 | | | | 1,816 | | | | — | | | | — | |
Ready Reserves | | | — | | | | — | | | | 125 | | | | — | | | | — | | | | — | | | | 126 | | | | — | | | | — | | | | — | |
As of December 31, 2011, the components of distributable earnings on a tax basis were as follows (in thousands):
| | | | | | | | | | | | | | | | |
Fund | | Undistributed
Ordinary
Income | | | Accumulated
Capital and
Other Losses | | | Undistributed
Long-Term
Capital Gain | | | Net
Unrealized
Appreciation
(Depreciation) | |
Growth | | $ | — | | | $ | (1,538 | ) | | $ | 6,611 | | | $ | 61,396 | |
Large Cap Growth | | | — | | | | (3,232 | ) | | | — | | | | 3,632 | |
Small Cap Growth | | | — | | | | (59,562 | ) | | | — | | | | 11,393 | |
Mid Cap Growth | | | — | | | | (1,452 | ) | | | 2,025 | | | | 9,944 | |
Small-Mid Cap Growth | | | 18 | | | | (2,331 | ) | | | 5,099 | | | | 14,779 | |
Global Growth | | | — | | | | (17,732 | ) | | | — | | | | 4,382 | |
International Growth | | | 30,132 | | | | (1,188,527 | ) | | | — | | | | 34,131 | |
International Equity | | | 1,407 | | | | (93,637 | ) | | | — | | | | 3,106 | |
International Small Cap Growth | | | 5,874 | | | | (59,252 | ) | | | — | | | | (26,530 | ) |
Emerging Markets Growth | | | — | | | | (13,506 | ) | | | — | | | | (36,194 | ) |
Emerging Leaders Growth | | | — | | | | (931 | ) | | | — | | | | (4,292 | ) |
June 30, 2012 | William Blair Funds 123 |
| | | | | | | | | | | | | | | | |
Fund | | Undistributed
Ordinary
Income | | | Accumulated
Capital and
Other Losses | | | Undistributed
Long-Term
Capital Gain | | | Net
Unrealized
Appreciation
(Depreciation) | |
Emerging Market Small Cap Growth | | $ | — | | | $ | (69 | ) | | $ | — | | | $ | (20 | ) |
Large Cap Value | | | — | | | | (4 | ) | | | — | | | | (7 | ) |
Small Cap Value | | | — | | | | (3,660 | ) | | | — | | | | 6,584 | |
Mid Cap Value | | | — | | | | — | | | | 22 | | | | 82 | |
Small-Mid Cap Value | | | 1 | | | | (3 | ) | | | — | | | | 94 | |
Bond | | | 2 | | | | (79 | ) | | | 928 | | | | 13,393 | |
Income | | | — | | | | (39,887 | ) | | | — | | | | 4,958 | |
Low Duration | | | — | | | | (2,561 | ) | | | — | | | | 259 | |
Ready Reserves | | | 108 | | | | (41 | ) | | | — | | | | — | |
As of December 31, 2011, the Funds have unused capital loss carryforwards available for federal income tax purposes to be applied against future capital gains, if any. If not applied, the carryforwards will expire as follows (in thousands):
| | | | | | | | | | | | | | | | | | | | | | | | | | | | | | | | |
Fund | | 2012 | | | 2013 | | | 2014 | | | 2015 | | | 2016 | | | 2017 | | | 2018 | | | Total | |
Large Cap Growth | | $ | — | | | $ | — | | | $ | — | | | $ | — | | | $ | — | | | $ | 2,854 | | | $ | — | | | $ | 2,854 | |
Small Cap Growth | | | — | | | | — | | | | — | | | | — | | | | — | | | | 55,317 | | | | — | | | | 55,317 | |
Global Growth | | | — | | | | — | | | | — | | | | — | | | | 4,371 | | | | 13,127 | | | | — | | | | 17,498 | |
International Growth | | | — | | | | — | | | | — | | | | — | | | | — | | | | 1,142,899 | | | | — | | | | 1,142,899 | |
International Equity | | | — | | | | — | | | | — | | | | — | | | | 10,691 | | | | 81,926 | | | | — | | | | 92,617 | |
International Small Cap Growth | | | — | | | | — | | | | — | | | | — | | | | — | | | | 55,999 | | | | — | | | | 55,999 | |
Income | | | 4,102 | | | | 3,398 | | | | 4,138 | | | | 9,190 | | | | 14,460 | | | | 4,577 | | | | — | | | | 39,865 | |
Low Duration | | | — | | | | — | | | | — | | | | — | | | | — | | | | — | | | | 955 | | | | 955 | |
Ready Reserves | | | 20 | | | | — | | | | — | | | | 2 | | | | — | | | | — | | | | — | | | | 22 | |
The Regulated Investment Company Modernization Act of 2010 (the “Act”) was enacted on December 22, 2010. Under the Act each Fund is permitted to carry forward capital losses incurred in taxable years beginning after the date of enactment for an unlimited period. However, any losses incurred in periods after enactment will be required to be utilized prior to the losses incurred in pre-enactment taxable years, which carry an expiration date. Each Fund has the following carry forward capital losses without expiration as of December 31, 2011 (in thousands):
| | | | | | | | |
Fund | | Short-
Term | | | Long-
Term | |
Emerging Markets Small Cap Growth | | $ | 1 | | | $ | — | |
Low Duration | | | 951 | | | | 406 | |
Ready Reserves | | | 17 | | | | — | |
For the period from November 1, 2011 through December 31, 2011, the following Funds incurred realized ordinary loss and capital losses. Ordinary Loss includes losses from currency transactions and PFICs. Each Fund intends to treat these losses as having occurred on the first day of fiscal year 2012 for federal income tax purposes (in thousands):
| | | | | | | | | | | | |
Fund | | Ordinary
Loss | | | Short-Term
Capital | | | Long-Term
Capital | |
Growth | | $ | — | | | $ | 1,539 | | | $ | — | |
Large Cap Growth | | | — | | | | 378 | | | | — | |
Small Cap Growth | | | — | | | | 6,244 | | | | — | |
Mid Cap Growth | | | — | | | | 1,452 | | | | — | |
Small-Mid Cap Growth | | | — | | | | 2,331 | | | | — | |
Global Growth | | | 3 | | | | 229 | | | | — | |
International Growth | | | — | | | | 45,561 | | | | — | |
International Equity | | | 25 | | | | 985 | | | | — | |
International Small Cap Growth | | | 537 | | | | 2,491 | | | | — | |
Emerging Markets Growth | | | 783 | | | | 9,852 | | | | 2,610 | |
Emerging Leaders Growth | | | 16 | | | | 791 | | | | 81 | |
Emerging Markets Small Cap Growth | | | 13 | | | | 55 | | | | — | |
Large Cap Value | | | — | | | | 4 | | | | — | |
Small Cap Value | | | — | | | | 2,504 | | | | 1,154 | |
Mid Cap Value | | | — | | | | — | | | | — | |
124 Semi-Annual Report | June 30, 2012 |
| | | | | | | | | | | | |
Fund | | Ordinary
Loss | | | Short-Term
Capital | | | Long-Term
Capital | |
Small-Mid Cap Value | | $ | — | | | $ | 4 | | | $ | — | |
Bond | | | — | | | | 78 | | | | — | |
Income | | | — | | | | 23 | | | | — | |
Low Duration | | | — | | | | 118 | | | | 132 | |
Ready Reserves | | | — | | | | 2 | | | | — | |
(h) Repurchase Agreements
In a repurchase agreement, a Fund buys a security at one price and at the time of sale, the seller agrees to repurchase the obligation at a mutually agreed upon time and price (usually within seven days). The repurchase agreement thereby determines the yield during the purchaser’s holding period, while the seller’s obligation to repurchase is secured by the value of the underlying security. William Blair & Company, L.L.C. (“William Blair” or the “Advisor”) will monitor, on an ongoing basis, the value of the underlying securities to ensure that the value always equals or exceeds the repurchase price plus accrued interest. Repurchase agreements could involve certain risks in the event of a default or insolvency of the other party to the agreement, including possible delays or restrictions upon a Fund’s ability to dispose of the underlying securities. The risk to a Fund is limited to the ability of the seller to pay the agreed upon sum on the delivery date. In the event of default, a repurchase agreement provides that a Fund is entitled to sell the underlying collateral. The loss, if any, to a Fund will be the difference between the proceeds from the sale and the repurchase price. However, if bankruptcy proceedings are commenced with respect to the seller of the security, disposition of the collateral by the Fund may be delayed or limited. Although no definitive creditworthiness criteria are used, the Advisor reviews the creditworthiness of the banks and non-bank dealers with which a Fund enters into repurchase agreements to evaluate those risks. A Fund may, for tax purposes, deem repurchase agreements collateralized by U.S. Government securities to be investments in U.S. Government securities.
(i) Use of Estimates
The preparation of financial statements in conformity with U.S. generally accepted accounting principles requires management to make estimates and assumptions that affect the amounts reported in the financial statements. Actual results may differ from those estimates.
(j) Indemnification
In the normal course of business, the Funds have entered into contracts in which the Funds agree to indemnify the other party or parties against various potential costs or liabilities. The Funds’ maximum exposure under these arrangements is unknown. No claim has been made for indemnification pursuant to any such agreement of the Funds.
(k) Fair Value Measurements
Fair value is defined as the price that a Fund would receive upon selling a security in an orderly transaction to an independent buyer in the principal or most advantageous market for the investment. Various inputs are used in determining the value of a Fund’s investments. A three-tier hierarchy of inputs is used to classify fair value measurements for disclosure purposes. The three-tier hierarchy of inputs is summarized in the three broad levels listed below:
| | • | | Level 1—Quoted prices (unadjusted) in active markets for an identical security. |
| | • | | Level 2—Prices determined using other significant observable inputs. Observable inputs are inputs that other market participants would use in pricing a security. These may include quoted prices for similar securities, interest rates, prepayment speeds, credit risk, and others. In addition, other observable inputs such as foreign exchange rates, benchmark securities indices and foreign futures contracts may be utilized in the valuation of certain foreign securities when significant events occur between the last sale on the foreign securities exchange and the time the net asset value of the Fund is calculated. |
| | • | | Level 3—Prices determined using significant unobservable inputs. In situations where quoted prices or observable inputs are unavailable (for example, when there is little or no market activity for an investment), unobservable inputs may be used. Unobservable inputs reflect the Fund’s own assumptions about the factors market participants would use in pricing an investment, and would be based on the best information available. |
June 30, 2012 | William Blair Funds 125 |
The inputs or methodology used for valuing an investment are not necessarily an indication of the risk associated with investing in those securities. For example, money market securities are valued using amortized cost, in accordance with rules under the 1940 Act. Generally, amortized cost approximates the current fair value of a security, but since the value is not obtained from a quoted price in an active market, such securities are reflected as Level 2.
Any transfers between Level 1 and Level 2 are disclosed, effective as of the beginning of the period, in the tables below with the reasons for the transfers disclosed in a note to the tables, if applicable.
As of June 30, 2012, the hierarchical input levels of securities in each Fund, segregated by security class, are as follows (in thousands):
| | | | | | | | | | | | | | | | | | | | | | | | |
Investments in securities | | Growth | | | Large Cap
Growth | | | Small Cap
Growth | | | Mid Cap
Growth | | | Small-Mid Cap
Growth | | | Global
Growth | |
Level 1—Quoted prices | | | | | | | | | | | | | | | | | | | | | | | | |
Common Stocks | | | 604,110 | | | | 26,601 | | | | 483,845 | | | | 335,377 | | | | 322,371 | | | | 46,000 | |
Exchange Traded Funds | | | — | | | | — | | | | 18,245 | | | | — | | | | — | | | | — | |
Level 2—Other significant observable inputs | | | | | | | | | | | | | | | | | | | | | | | | |
Short-Term Investments | | | 8,272 | | | | 467 | | | | 12,551 | | | | 19,372 | | | | 13,237 | | | | 683 | |
Level 3—Significant unobservable inputs | | | | | | | | | | | | | | | | | | | | | | | | |
None | | | — | | | | — | | | | — | | | | — | | | | — | | | | — | |
| | | | | | | | | | | | | | | | | | | | | | | | |
Total investments in securities | | $ | 612,382 | | | $ | 27,068 | | | $ | 514,641 | | | $ | 354,749 | | | $ | 335,608 | | | $ | 46,683 | |
| | | | | | | | | | | | | | | | | | | | | | | | |
| | | | | | | | | | | | | | | | | | | | | | | | |
Investments in securities | | International
Growth | | | International
Equity | | | International
Small Cap
Growth | | | Emerging
Markets
Growth | | | Emerging
Leaders
Growth | | | Emerging
Small Cap
Growth | |
Level 1—Quoted prices | | | | | | | | | | | | | | | | | | | | | | | | |
Common Stocks | | | 3,207,286 | | | | 65,307 | | | | 621,984 | | | | 904,808 | | | | 43,755 | | | | 6,438 | |
Preferred Stocks | | | — | | | | — | | | | — | | | | 18,748 | | | | 933 | | | | 56 | |
Level 2—Other significant observable inputs | | | | | | | | | | | | | | | | | | | | | | | | |
Short-Term Investments | | | 104,374 | | | | 3,800 | | | | 26,085 | | | | — | | | | — | | | | — | |
Level 3—Significant unobservable inputs | | | | | | | | | | | | | | | | | | | | | | | | |
Common stock | | | 695 | | | | — | | | | — | | | | — | | | | — | | | | — | |
Convertible bonds | | | 751 | | | | — | | | | 251 | | | | 419 | | | | — | | | | — | |
| | | | | | | | | | | | | | | | | | | | | | | | |
Total investments in securities | | $ | 3,313,106 | | | $ | 69,107 | | | $ | 648,320 | | | $ | 923,975 | | | $ | 44,688 | | | $ | 6,494 | |
| | | | | | | | | | | | | | | | | | | | | | | | |
Other financial instruments | | | | | | | | | | | | | | | | | | | | | | | | |
Level 2—Other significant observable inputs | | | | | | | | | | | | | | | | | | | | | | | | |
Forward foreign currency contracts | | $ | 19 | | | $ | (7 | ) | | | — | | | | — | | | | — | | | | — | |
| | | | | | | | | | | | | | | | | | | | | | | | |
| | | | | | | | | | | | | | | | |
Investments in securities | | Large Cap
Value | | | Small Cap
Value | | | Mid Cap
Value | | | Small-Mid Cap
Value | |
Level 1—Quoted prices | | | | | | | | | | | | | | | | |
Common Stocks | | | 3,165 | | | | 236,071 | | | | 4,781 | | | | 2,219 | |
Level 2—Other significant observable inputs | | | | | | | | | | | | | | | | |
Short-Term Investments | | | — | | | | 4,569 | | | | 271 | | | | — | |
Level 3—Significant unobservable inputs | | | | | | | | | | | | | | | | |
None | | | — | | | | — | | | | — | | | | — | |
| | | | | | | | | | | | | | | | |
Total investments in securities | | $ | 3,165 | | | $ | 240,640 | | | $ | 5,052 | | | $ | 2,219 | |
| | | | | | | | | | | | | | | | |
126 Semi-Annual Report | June 30, 2012 |
| | | | | | | | | | | | | | | | |
Investments in securities | | Bond | | | Income | | | Low Duration | | | Ready
Reserves | |
Level 1—Quoted Prices | | | | | | | | | | | | | | | | |
None | | | — | | | | — | | | | — | | | | — | |
Level 2—Other significant observable inputs | | | | | | | | | | | | | | | | |
US Government and Agency Bonds | | | 113,334 | | | | 63,781 | | | | 124,158 | | | | 90,689 | |
Corporate Bonds | | | 142,281 | | | | 58,255 | | | | 20,067 | | | | 90,848 | |
Asset Backed Bonds | | | 8,502 | | | | 5,793 | | | | 35,705 | | | | 44,997 | |
Commercial Paper | | | — | | | | — | | | | — | | | | 880,249 | |
Short-Term Investments | | | 3,157 | | | | 4,056 | | | | 5,406 | | | | 184,456 | |
Level 3—Significant unobservable inputs | | | | | | | | | | | | | | | | |
Asset Backed Bonds | | | 167 | | | | 917 | | | | — | | | | — | |
| | | | | | | | | | | | | | | | |
Total investments in securities | | $ | 267,441 | | | $ | 132,802 | | | $ | 185,336 | | | $ | 1,291,239 | |
| | | | | | | | | | | | | | | | |
There were no transfers between Level 1 and Level 2 during the period.
Level 1 Common Stocks are exchange-traded securities with a quoted price. See Portfolio of Investments for Sector Classification.
The fair value estimates for the Level 3 securities in the International Growth, International Small Cap Growth, Emerging Markets Growth, Bond and Income Funds were determined in good faith by the Pricing Committee in consultation with the Valuation Committee, pursuant to the Valuation Procedures adopted by the Board of Trustees. There were various factors considered in reaching this fair value determination, including, but not limited to, the following: the type of security, the extent of public trading of the security, information obtained from a broker-dealer for the security, analysis of the company’s performance, market trends that influence its performance and the potential for an adverse outcome in pending litigation. Level 3 securities represented 0.04%, 0.04%, 0.04%, 0.60% and 0.70% as a percentage of Net Assets in the Growth, International Small Cap Growth, Emerging Markets Growth, Bond and Income Funds, respectively. The change in net unrealized gain (loss) related to those securities held at June 30, 2012 is included in the change in net unrealized appreciation (depreciation) of investments on the Statement of Operations. There were no transfers from or to Level 3 during the period.
(2) Transactions with Affiliates
(a) Management and Expense Limitation Agreements
Each Fund has a management agreement with the Advisor for investment advisory, clerical, bookkeeping and administrative services. Each Fund pays the Advisor an annual fee, payable monthly, based on a specified percentage of its average daily net assets. A summary of the annual rates expressed as a percentage of average daily net assets is as follows:
| | | | | | | | | | |
Equity Funds | | | | | International Equity Funds | | | |
Growth | | | 0.75 | % | | International Growth: | | | | |
Large Cap Growth | | | 0.80 | % | | First $250 million | | | 1.10 | % |
Small Cap Growth | | | 1.10 | % | | Next $4.75 billion | | | 1.00 | % |
Mid Cap Growth | | | 0.95 | % | | Next $5 billion | | | 0.95 | % |
Small-Mid Cap Growth | | | 1.00 | % | | Next $5 billion | | | 0.925 | % |
Large Cap Value | | | 0.80 | % | | In excess of $15 billion | | | 0.90 | % |
Small Cap Value | | | 1.10 | % | | International Equity: | | | | |
Mid Cap Value | | | 0.95 | % | | First $250 million | | | 1.10 | % |
Small-Mid Cap Value | | | 1.00 | % | | In excess of $250 million | | | 1.00 | % |
| | | | | | International Small Cap Growth | | | 1.00 | % |
Global Equity Fund | | | | | | Emerging Markets Growth | | | 1.10 | % |
Global Growth | | | 1.00 | % | | Emerging Leaders Growth | | | 1.10 | % |
| | | | | | Emerging Markets Small Cap Growth | | | 1.10 | % |
| | | |
Fixed-Income Funds | | | | | Money Market Fund | | | |
Bond | | | 0.30 | % | | Ready Reserves: | | | | |
Low Duration | | | 0.30 | % | | First $250 million | | | 0.275 | % |
Income* | | | | | | Next $250 million | | | 0.250 | % |
First $250 million | | | 0.25 | % | | Next $2 billion | | | 0.225 | % |
In excess of $250 million | | | 0.20 | % | | In excess of $2.5 billion | | | 0.200 | % |
| | | | | | | | | | |
*Management fee also includes a charge of 5% of gross income. | | | | | | | |
June 30, 2012 | William Blair Funds 127 |
Some of the Funds have also entered into an Expense Limitation Agreement with the Advisor. Under the terms of the agreement, the Advisor will waive its management fee and/or reimburse the Fund for expenses in excess of the agreed upon rate. The amount the Advisor owes a Fund as of the reporting date is recorded as the Receivable from Advisor on the Statement of Assets and Liabilities. The Advisor reimburses the Funds on a monthly basis. Under the terms of the agreement, the Advisor has agreed to waive its advisory fees and/or absorb other operating expenses through April 30, 2013, if total expenses for each class of the following Funds exceed the following rates (as a percentage of average daily net assets):
| | | | | | | | | | | | | | | | |
| | | Class N | | | Class I | |
Fund | | Effective
May 1, 2012
through
April 30, 2013 | | | Effective
May 1, 2011
through
April 30, 2012 | | | Effective
May 1, 2012
through
April 30, 2013 | | | Effective
May 1, 2011
through
April 30, 2012 | |
Large Cap Growth | | | 1.20 | % | | | 1.20 | % | | | 0.95 | % | | | 0.95 | % |
Small Cap Growth | | | 1.50 | % | | | 1.50 | % | | | 1.25 | % | | | 1.25 | % |
Mid Cap Growth | | | 1.35 | % | | | 1.35 | % | | | 1.10 | % | | | 1.10 | % |
Small-Mid Cap Growth | | | 1.35 | % | | | 1.35 | % | | | 1.10 | % | | | 1.10 | % |
Global Growth | | | 1.50 | % | | | 1.50 | % | | | 1.25 | % | | | 1.25 | % |
International Growth | | | 1.45 | % | | | 1.45 | % | | | 1.20 | % | | | 1.20 | % |
International Equity | | | 1.45 | % | | | 1.45 | % | | | 1.20 | % | | | 1.20 | % |
International Small Cap Growth | | | 1.65 | % | | | 1.65 | % | | | 1.40 | % | | | 1.40 | % |
Emerging Markets Growth | | | 1.70 | % | | | 1.70 | % | | | 1.45 | % | | | 1.45 | % |
Emerging Leaders Growth | | | 1.65 | % | | | 1.65 | % | | | 1.40 | % | | | 1.40 | % |
Emerging Markets Small Cap Growth | | | 1.65 | % | | | 1.65 | % | | | 1.40 | % | | | 1.40 | % |
Large Cap Value | | | 1.20 | % | | | 1.20 | % | | | 0.95 | % | | | 0.95 | % |
Small Cap Value | | | 1.45 | % | | | 1.40 | % | | | 1.20 | % | | | 1.15 | % |
Mid Cap Value | | | 1.35 | % | | | 1.35 | % | | | 1.10 | % | | | 1.10 | % |
Small-Mid Cap Value | | | 1.40 | % | | | 1.40 | % | | | 1.15 | % | | | 1.15 | % |
Bond | | | 0.65 | % | | | 0.65 | % | | | 0.50 | % | | | 0.50 | % |
Income | | | 0.85 | % | | | 0.85 | % | | | 0.70 | % | | | 0.70 | % |
Low Duration | | | 0.70 | % | | | 0.70 | % | | | 0.55 | % | | | 0.55 | % |
For a period of three years subsequent to the commencement of operations, the Advisor is entitled to reimbursement for previously waived fees and reimbursed expenses to the extent the overall expense ratio remains below the expense limitation in place at the time the fee was waived and/or the expense was reimbursed. The total amount available for recapture at June 30, 2012 was (in thousands):
| | | | |
Fund | | Available for
Recapture | |
Emerging Markets Small Cap Growth | | $ | 109 | |
Large Cap Value | | | 61 | |
Mid Cap Value | | | 230 | |
Small-Mid Cap Value | | | 58 | |
Low Duration | | | 163 | |
The Advisor has agreed to voluntarily waive fees and reimburse expenses incurred for the Ready Reserves Fund in order to maintain a minimum yield given the current interest rate environment.
For the period ended June 30, 2012, the fee waivers and/or reimbursements for each Fund were as follows (in thousands):
| | | | | | | | | | | | | | | | |
Fund | | Fund
Level
Waiver | | | Class I
Specific
Waiver | | | Class N
Specific
Waiver | | | Total
Waiver | |
Growth | | $ | — | | | $ | — | | | $ | — | | | $ | — | |
Large Cap Growth | | | 37 | | | | 4 | | | | 3 | | | | 44 | |
Small Cap Growth | | | — | | | | 285 | | | | 110 | | | | 395 | |
Mid Cap Growth | | | — | | | | — | | | | 5 | | | | 5 | |
Small-Mid Cap Growth | | | — | | | | 105 | | | | 57 | | | | 162 | |
Global Growth | | | 59 | | | | 5 | | | | 1 | | | | 65 | |
International Growth | | | — | | | | — | | | | 38 | | | | 38 | |
International Equity | | | 59 | | | | 26 | | | | 4 | | | | 89 | |
128 Semi-Annual Report | June 30, 2012 |
| | | | | | | | | | | | | | | | |
Fund | | Fund
Level
Waiver | | | Class I
Specific
Waiver | | | Class N
Specific
Waiver | | | Total
Waiver | |
International Small Cap Growth | | $ | — | | | $ | — | | | $ | — | | | $ | — | |
Emerging Markets Growth | | | — | | | | — | | | | — | | | | — | |
Emerging Leaders Growth | | | 105 | | | | — | | | | 1 | | | | 106 | |
Emerging Markets Small Cap Growth | | | 61 | | | | — | | | | — | | | | 61 | |
Large Cap Value | | | 32 | | | | — | | | | — | | | | 32 | |
Small Cap Value | | | 111 | | | | 36 | | | | 18 | | | | 165 | |
Mid Cap Value | | | 49 | | | | — | | | | — | | | | 49 | |
Small-Mid Cap Value | | | 42 | | | | — | | | | — | | | | 42 | |
Bond | | | 35 | | | | 21 | | | | 8 | | | | 64 | |
Income | | | — | | | | — | | | | — | | | | — | |
Low Duration | | | 9 | | | | — | | | | 1 | | | | 10 | |
Ready Reserves | | | 3,085 | | | | — | | | | — | | | | 3,085 | |
(b) Underwriting, Distribution Services and Service Agreements
Each Fund, except the Ready Reserves Fund, has a Distribution Agreement with William Blair for distribution services to the Funds’ Class N shares. Each Fund pays William Blair an annual fee, payable monthly, based on a specified percentage of its average daily net assets of Class N shares. The annual rate expressed as a percentage of average daily net assets for Class N is 0.25% for all Funds except the Income, Bond and Low Duration Funds, which is 0.15%. Pursuant to the Distribution Agreement, William Blair enters into related selling group agreements with various firms at various rates for sales of the Funds’ Class N shares.
The Ready Reserves Fund has a Service Agreement with William Blair to provide shareholder services and automatic sweep services. The Fund pays William Blair an annual fee, payable monthly, based upon 0.35% of the average daily net assets of Class N shares. The Board of Trustees has determined that the amount payable for “service fees” (as defined by FINRA (Financial Industry Regulatory Authority)) will not exceed 0.25% of the average annual net assets attributable to Class N shares.
The Global Growth, International Small Cap Growth, Emerging Markets Growth, Emerging Leaders Growth, Emerging Markets Small Cap Growth, Bond and Low Duration Funds have a Shareholder Administration Agreement with William Blair to provide shareholder administration services. Class N and Class I shares of the Funds pay William Blair an annual fee, payable monthly, based upon 0.15% of average daily net assets attributable to each class, respectively. For the period ended June 30, 2012, the following fees were incurred (in thousands):
| | | | | | | | | | | | |
Fund | | Class N | | | Class I | | | Total | |
Global Growth | | $ | 3 | | | $ | 32 | | | $ | 35 | |
International Small Cap Growth | | | 12 | | | | 276 | | | | 288 | |
Emerging Markets Growth | | | 14 | | | | 103 | | | | 117 | |
Emerging Leaders Growth | | | — | | | | 19 | | | | 19 | |
Emerging Markets Small Cap Growth | | | 1 | | | | 3 | | | | 4 | |
Bond | | | 14 | | | | 118 | | | | 132 | |
Low Duration | | | 5 | | | | 68 | | | | 73 | |
(4) Investment Transactions
Investment transactions, excluding money market instruments, repurchase agreements and demand notes for the period ended June 30, 2012, were as follows (in thousands):
| | | | | | | | |
Fund | | Purchases | | | Sales | |
Growth | | $ | 219,218 | | | $ | (219,681 | ) |
Large Cap Growth | | | 6,136 | | | | (7,352 | ) |
Small Cap Growth | | | 266,797 | | | | (366,457 | ) |
Mid Cap Growth | | | 276,047 | | | | (94,348 | ) |
Small-Mid Cap Growth | | | 198,606 | | | | (127,550 | ) |
Global Growth | | | 11,082 | | | | (10,698 | ) |
June 30, 2012 | William Blair Funds 129 |
| | | | | | | | |
Fund | | Purchases | | | Sales | |
International Growth | | $ | 1,393,408 | | | | (1,582,097 | ) |
International Equity | | | 32,039 | | | | (43,833 | ) |
International Small Cap Growth | | | 247,693 | | | | (373,436 | ) |
Emerging Markets Growth | | | 550,693 | | | | (481,027 | ) |
Emerging Leaders Growth | | | 27,931 | | | | (34,782 | ) |
Emerging Markets Small Cap Growth | | | 4,351 | | | | (1,448 | ) |
Large Cap Value | | | 969 | | | | (419 | ) |
Small Cap Value | | | 68,496 | | | | (71,384 | ) |
Mid Cap Value | | | 1,513 | | | | (1,449 | ) |
Small-Mid Cap Value | | | 602 | | | | (590 | ) |
Bond | | | 76,529 | | | | (41,620 | ) |
Income | | | 42,362 | | | | (24,987 | ) |
Low Duration | | | 65,849 | | | | (38,607 | ) |
(5) Forward Foreign Currency Contracts
The Global Growth, International Growth, International Equity, International Small Cap Growth, Emerging Markets Growth, Emerging Markets Small Cap Growth and Emerging Leaders Growth Funds from time to time may enter into forward foreign currency contracts with the Fund's custodian and other counterparties in an attempt to hedge against a decline in the value of foreign currency against the U.S. dollar. The Funds bear the market risk that arises from changes in foreign currency rates and bear the credit risk if the counterparty fails to perform under the contract.
For the period ended June 30, 2012, the International Growth, International Equity, and International Small Cap Growth Funds engaged in forward foreign currency contracts with average notional volume (in thousands) of:
| | | | |
Fund | | Average Notional Value | |
International Growth | | $ | 336,828 | |
International Equity | | | 2,299 | |
International Small Cap Growth | | | 13,189 | |
The following tables present the value of forward foreign currency contracts as of June 30, 2012 and their respective location on the Statement of Assets and Liabilities (values in thousands):
| | | | | | | | | | | | |
| | | Assets | | | Liabilities | |
Fund | | Statement of Assets and Liabilities Location | | Value | | | Statement of Assets and Liabilities Location | | Value | |
International Growth | | Unrealized appreciation on foreign forward currency contracts | | $ | 19 | | | Unrealized depreciation on foreign forward currency contracts | | $ | — | |
International Equity | | Unrealized appreciation on foreign forward currency contracts | | $ | — | | | Unrealized depreciation on foreign forward currency contracts | | $ | 7 | |
The effect of forward contracts on the Statements of Operations for the period ended June 30, 2012 (values in thousands):
| | | | |
Realized gain (loss) recognized in foreign currency transactions | |
Fund | | Value | |
International Growth | | $ | 14,549 | |
International Equity | | | 49 | |
International Small Cap Growth | | | 1,901 | |
|
Change in unrealized gain (loss) recognized in foreign currency translations | |
Fund | | Value | |
International Growth | | $ | 1,818 | |
International Equity | | | (7 | ) |
International Small Cap Growth | | | 311 | |
130 Semi-Annual Report | June 30, 2012 |
The following table presents open forward foreign currency contracts as of June 30, 2012 (values in thousands):
| | | | | | | | | | | | | | | | | | |
International Growth | |
Counterparty | | Short Contracts | | Settlement
Date | | | Local
Currency | | | Current
Value | | | Unrealized Gain/(Loss) | |
State Street Bank and Trust | | Japanese Yen | | | 9/20/2012 | | | | ¥2,790,319 | | | $ | 34,945 | | | $ | 19 | |
|
International Equity | |
Counterparty | | Short Contracts | | Settlement
Date | | | Local
Currency | | | Current
Value | | | Unrealized Gain/(Loss) | |
Morgan Stanley and Company | | Euro Currency | | | 9/18/2012 | | | | €2,280 | | | $ | 2,887 | | | $ | (7 | ) |
(6) Fund Share Transactions
The following table summarizes the activity in capital shares of each Fund (in thousands):
| | | | | | | | | | | | | | | | | | | | | | | | |
| | | Sales (Dollars) | |
| | | Period Ended June 30, 2012 | | | Year Ended December 31, 2011 | |
Fund | | Class N | | | Class I | | | Total | | | Class N | | | Class I | | | Total | |
Growth | | $ | 18,168 | | | $ | 43,093 | | | $ | 61,261 | | | $ | 71,261 | | | $ | 62,869 | | | $ | 134,130 | |
Large Cap Growth | | | 532 | | | | 1,612 | | | | 2,144 | | | | — | | | | 3,239 | | | | 4,139 | |
Small Cap Growth | | | 7,359 | | | | 44,325 | | | | 51,684 | | | | 30,204 | | | | 93,243 | | | | 123,447 | |
Mid Cap Growth | | | 17,805 | | | | 202,415 | | | | 220,220 | | | | 21,824 | | | | 66,999 | | | | 88,823 | |
Small Mid-Cap Growth | | | 16,487 | | | | 79,484 | | | | 95,971 | | | | 14,552 | | | | 70,787 | | | | 85,339 | |
Global Growth | | | 1,303 | | | | 1,002 | | | | 2,305 | | | | 475 | | | | 3,263 | | | | 3,738 | |
International Growth | | | 110,209 | | | | 283,397 | | | | 393,606 | | | | 280,122 | | | | 476,293 | | | | 756,415 | |
International Equity | | | 76 | | | | 2,084 | | | | 2,160 | | | | 693 | | | | 26,139 | | | | 26,832 | |
International Small Cap Growth | | | 1,112 | | | | 36,980 | | | | 38,092 | | | | 5,220 | | | | 163,897 | | | | 169,117 | |
Emerging Markets Growth | | | 199 | | | | 7,972 | | | | 8,171 | | | | 1,576 | | | | 24,982 | | | | 26,558 | |
Emerging Leaders Growth | | | 106 | | | | 4,495 | | | | 4,601 | | | | 34 | | | | 19,823 | | | | 19,857 | |
Emerging Markets Small Cap Growth (a) | | | 1,468 | | | | 1,858 | | | | 3,326 | | | | 1,040 | | | | 2,322 | | | | 3,362 | |
Large Cap Value (a) | | | 171 | | | | 373 | | | | 544 | | | | 1,000 | | | | 1,457 | | | | 2,457 | |
Small Cap Value | | | 7,973 | | | | 22,209 | | | | 30,182 | | | | 42,726 | | | | 120,066 | | | | 162,792 | |
Mid Cap Value | | | — | | | | 275 | | | | 275 | | | | 81 | | | | 1,617 | | | | 1,698 | |
Small-Mid Cap Value (b) | | | 17 | | | | 20 | | | | 37 | | | | 823 | | | | 1,241 | | | | 2,064 | |
Bond | | | 19,821 | | | | 13,111 | | | | 32,932 | | | | 4,585 | | | | 41,430 | | | | 46,015 | |
Income | | | 23,479 | | | | 14,609 | | | | 38,088 | | | | 25,156 | | | | 8,899 | | | | 34,055 | |
Low Duration | | | 4,821 | | | | 36,048 | | | | 40,869 | | | | 2,975 | | | | 56,988 | | | | 59,963 | |
Ready Reserves | | | 363,966 | | | | — | | | | 363,966 | | | | 838,997 | | | | — | | | | 838,997 | |
| | | | | | | | | | | | | | | | | | | | | | | | |
| | | Reinvested Distributions (Dollars) | |
| | | Period Ended June 30, 2012 | | | Year Ended December 31, 2011 | |
Fund | | Class N | | | Class I | | | Total | | | Class N | | | Class I | | | Total | |
Growth | | $ | — | | | $ | — | | | $ | — | | | $ | 5,705 | | | $ | 9,211 | | | $ | 14,916 | |
Large Cap Growth | | | — | | | | — | | | | — | | | | — | | | | 32 | | | | 32 | |
Small Cap Growth | | | — | | | | — | | | | — | | | | — | | | | — | | | | — | |
Mid Cap Growth | | | — | | | | — | | | | — | | | | 2,354 | | | | 8,544 | | | | 10,898 | |
Small Mid-Cap Growth | | | — | | | | — | | | | — | | | | 3,020 | | | | 17,544 | | | | 20,564 | |
Global Growth | | | — | | | | — | | | | — | | | | 4 | | | | 162 | | | | 166 | |
International Growth | | | — | | | | — | | | | — | | | | — | | | | 5,030 | | | | 5,030 | |
International Equity | | | — | | | | — | | | | — | | | | — | | | | — | | | | — | |
International Small Cap Growth | | | — | | | | — | | | | — | | | | 182 | | | | 3,176 | | | | 3,358 | |
Emerging Markets Growth | | | — | | | | — | | | | — | | | | 2,055 | | | | 13,471 | | | | 15,526 | |
Emerging Leaders Growth | | | — | | | | — | | | | — | | | | 3 | | | | 1,336 | | | | 1,339 | |
Emerging Markets Small Cap Growth (a) | | | — | | | | — | | | | — | | | | — | | | | — | | | | — | |
Large Cap Value (a) | | | — | | | | — | | | | — | | | | 3 | | | | 4 | | | | 7 | |
June 30, 2012 | William Blair Funds 131 |
| | | | | | | | | | | | | | | | | | | | | | | | |
| | | Reinvested Distributions (Dollars) | |
| | | Period Ended June 30, 2012 | | | Year Ended December 31, 2011 | |
Fund | | Class N | | | Class I | | | Total | | | Class N | | | Class I | | | Total | |
Small Cap Value | | $ | — | | | $ | — | | | $ | — | | | $ | 1,502 | | | $ | 6,573 | | | $ | 8,075 | |
Mid Cap Value | | | — | | | | — | | | | — | | | | 1 | | | | 84 | | | | 85 | |
Small-Mid Cap Value (b) | | | — | | | | — | | | | — | | | | — | | | | — | | | | — | |
Bond | | | 363 | | | | 2,545 | | | | 2,908 | | | | 219 | | | | 5,706 | | | | 5,925 | |
Income | | | 829 | | | | 1,052 | | | | 1,881 | | | | 1,249 | | | | 2,265 | | | | 3,514 | |
Low Duration | | | 44 | | | | 844 | | | | 888 | | | | 80 | | | | 1,426 | | | | 1,506 | |
Ready Reserves | | | 64 | | | | — | | | | 64 | | | | 125 | | | | — | | | | 125 | |
| |
| | | Redemptions (Dollars) | |
| | | Period Ended June 30, 2012 | | | Year Ended December 31, 2011 | |
Fund | | Class N | | | Class I | | | Total | | | Class N | | | Class I | | | Total | |
Growth | | $ | 39,293 | | | $ | 26,410 | | | $ | 65,703 | | | $ | 61,036 | | | $ | 69,123 | | | $ | 130,159 | |
Large Cap Growth | | | 481 | | | | 2,641 | | | | 3,122 | | | | 4,715 | | | | 5,839 | | | | 10,554 | |
Small Cap Growth | | | 68,293 | | | | 74,385 | | | | 142,678 | | | | 188,253 | | | | 180,687 | | | | 368,940 | |
Mid Cap Growth | | | 6,426 | | | | 17,077 | | | | 23,503 | | | | 6,014 | | | | 38,969 | | | | 44,983 | |
Small Mid-Cap Growth | | | 5,460 | | | | 15,203 | | | | 20,663 | | | | 7,153 | | | | 28,620 | | | | 35,773 | |
Global Growth | | | 440 | | | | 1,731 | | | | 2,171 | | | | 1,725 | | | | 2,783 | | | | 4,508 | |
International Growth | | | 300,268 | | | | 243,541 | | | | 543,809 | | | | 1,472,224 | | | | 568,925 | | | | 2,041,149 | |
International Equity | | | 951 | | | | 11,617 | | | | 12,568 | | | | 6,340 | | | | 111,492 | | | | 117,832 | |
International Small Cap Growth | | | 6,357 | | | | 89,463 | | | | 95,820 | | | | 5,634 | | | | 95,320 | | | | 100,954 | |
Emerging Markets Growth | | | 2,436 | | | | 7,895 | | | | 10,331 | | | | 12,534 | | | | 59,984 | | | | 72,518 | |
Emerging Leaders Growth | | | 4 | | | | 3,844 | | | | 3,848 | | | | 30 | | | | 8,683 | | | | 8,713 | |
Emerging Markets Small Cap Growth (a) | | | 255 | | | | — | | | | 255 | | | | — | | | | — | | | | — | |
Large Cap Value (a) | | | — | | | | — | | | | — | | | | — | | | | — | | | | — | |
Small Cap Value | | | 8,530 | | | | 26,324 | | | | 34,854 | | | | 33,678 | | | | 45,720 | | | | 79,398 | |
Mid Cap Value | | | 5 | | | | 82 | | | | 87 | | | | 24 | | | | 474 | | | | 498 | |
Small-Mid Cap Value (b) | | | — | | | | 28 | | | | 28 | | | | — | | | | — | | | | — | |
Bond | | | 3,098 | | | | 13,180 | | | | 16,278 | | | | 1,033 | | | | 43,605 | | | | 44,638 | |
Income | | | 12,622 | | | | 8,711 | | | | 21,333 | | | | 17,730 | | | | 22,266 | | | | 39,996 | |
Low Duration | | | 2,808 | | | | 16,888 | | | | 19,696 | | | | 3,689 | | | | 63,525 | | | | 67,214 | |
Ready Reserves | | | 343,187 | | | | — | | | | 343,187 | | | | 783,918 | | | | — | | | | 783,918 | |
| |
| | | Net Change in Net Assets relating to Fund Share Activity (Dollars) | |
| | | Period Ended June 30, 2012 | | | Year Ended December 31, 2011 | |
Fund | | Class N | | | Class I | | | Total | | | Class N | | | Class I | | | Total | |
Growth | | $ | (21,125 | ) | | $ | 16,683 | | | $ | (4,442 | ) | | $ | 15,930 | | | $ | 2,957 | | | $ | 18,887 | |
Large Cap Growth | | | 51 | | | | (1,029 | ) | | | (978 | ) | | | (3,815 | ) | | | (2,568 | ) | | | (6,383 | ) |
Small Cap Growth | | | (60,934 | ) | | | (30,060 | ) | | | (90,994 | ) | | | (158,049 | ) | | | (87,444 | ) | | | (245,493 | ) |
Mid Cap Growth | | | 11,379 | | | | 185,338 | | | | 196,717 | | | | 18,164 | | | | 36,574 | | | | 54,738 | |
Small Mid-Cap Growth | | | 11,027 | | | | 64,281 | | | | 75,308 | | | | 10,419 | | | | 59,711 | | | | 70,130 | |
Global Growth | | | 863 | | | | (729 | ) | | | 134 | | | | (1,246 | ) | | | 642 | | | | (604 | ) |
International Growth | | | (190,059 | ) | | | 39,856 | | | | (150,203 | ) | | | (1,192,102 | ) | | | (87,602 | ) | | | (1,279,704 | ) |
International Equity | | | (875 | ) | | | (9,533 | ) | | | (10,408 | ) | | | (5,647 | ) | | | (85,353 | ) | | | (91,000 | ) |
International Small Cap Growth | | | (5,245 | ) | | | (52,483 | ) | | | (57,728 | ) | | | (232 | ) | | | 71,753 | | | | 71,521 | |
Emerging Markets Growth | | | (2,237 | ) | | | 77 | | | | (2,160 | ) | | | (8,903 | ) | | | (21,531 | ) | | | (30,434 | ) |
Emerging Leaders Growth | | | 102 | | | | 651 | | | | 753 | | | | 7 | | | | 12,476 | | | | 12,483 | |
Emerging Markets Small Cap Growth (a) | | | 1,213 | | | | 1,858 | | | | 3,071 | | | | 1,040 | | | | 2,322 | | | | 3,362 | |
132 Semi-Annual Report | June 30, 2012 |
| | | | | | | | | | | | | | | | | | | | | | | | |
| | | Net Change in Net Assets relating to Fund Share Activity (Dollars) | |
| | | Period Ended June 30, 2012 | | | Year Ended December 31, 2011 | |
Fund | | Class N | | | Class I | | | Total | | | Class N | | | Class I | | | Total | |
Large Cap Value (a) | | $ | 171 | | | $ | 373 | | | $ | 544 | | | $ | 1,003 | | | $ | 1,461 | | | $ | 2,464 | |
Small Cap Value | | | (557 | ) | | | (4,115 | ) | | | (4,672 | ) | | | 10,550 | | | | 80,919 | | | | 91,469 | |
Mid Cap Value | | | (5 | ) | | | 193 | | | | 188 | | | | 58 | | | | 1,227 | | | | 1,285 | |
Small-Mid Cap Value (b) | | | 17 | | | | (8 | ) | | | 9 | | | | 823 | | | | 1,241 | | | | 2,064 | |
Bond | | | 17,086 | | | | 2,476 | | | | 19,562 | | | | 3,771 | | | | 3,531 | | | | 7,302 | |
Income | | | 11,686 | | | | 6,950 | | | | 18,636 | | | | 8,675 | | | | (11,102 | ) | | | (2,427 | ) |
Low Duration | | | 2,057 | | | | 20,004 | | | | 22,061 | | | | (634 | ) | | | (5,111 | ) | | | (5,745 | ) |
Ready Reserves | | | 20,843 | | | | — | | | | 20,843 | | | | 55,204 | | | | — | | | | 55,204 | |
| (a) | | For the period from October 24, 2011 (Commencement of Operations) to December 31, 2011. |
| (b) | | For the period from December 15, 2011 (Commencement of Operations) to December 31, 2011. |
| | | | | | | | | | | | | | | | | | | | | | | | |
| | | Sales (Shares) | |
| | | Period Ended June 30, 2012 | | | Year Ended December 31, 2011 | |
Fund | | Class N | | | Class I | | | Total | | | Class N | | | Class I | | | Total | |
Growth | | | 1,538 | | | | 3,497 | | | | 5,035 | | | | 6,242 | | | | 5,321 | | | | 11,563 | |
Large Cap Growth | | | 70 | | | | 206 | | | | 276 | | | | 125 | | | | 451 | | | | 576 | |
Small Cap Growth | | | 332 | | | | 1,954 | | | | 2,286 | | | | 1,396 | | | | 4,242 | | | | 5,638 | |
Mid Cap Growth | | | 1,413 | | | | 15,876 | | | | 17,289 | | | | 1,734 | | | | 5,091 | | | | 6,825 | |
Small Mid-Cap Growth | | | 1,184 | | | | 5,375 | | | | 6,559 | | | | 997 | | | | 4,690 | | | | 5,687 | |
Global Growth | | | 144 | | | | 111 | | | | 255 | | | | 59 | | | | 378 | | | | 437 | |
International Growth | | | 5,467 | | | | 13,544 | | | | 19,011 | | | | 13,859 | | | | 22,239 | | | | 36,098 | |
International Equity | | | 7 | | | | 185 | | | | 192 | | | | 58 | | | | 2,177 | | | | 2,235 | |
International Small Cap Growth | | | 89 | | | | 2,982 | | | | 3,071 | | | | 409 | | | | 12,634 | | | | 13,043 | |
Emerging Markets Growth | | | 15 | | | | 639 | | | | 654 | | | | 110 | | | | 1,744 | | | | 1,854 | |
Emerging Leaders Growth | | | 14 | | | | 552 | | | | 566 | | | | 3 | | | | 2,073 | | | | 2,076 | |
Emerging Markets Small Cap Growth (a) | | | 125 | | | | 164 | | | | 289 | | | | 104 | | | | 232 | | | | 336 | |
Large Cap Value (a) | | | 16 | | | | 34 | | | | 50 | | | | 100 | | | | 145 | | | | 245 | |
Small Cap Value | | | 620 | | | | 1,683 | | | | 2,303 | | | | 3,200 | | | | 8,897 | | | | 12,097 | |
Mid Cap Value | | | — | | | | 25 | | | | 25 | | | | 8 | | | | 151 | | | | 159 | |
Small-Mid Cap Value (b) | | | 2 | | | | 2 | | | | 4 | | | | 82 | | | | 124 | | | | 206 | |
Bond | | | 1,798 | | | | 1,203 | | | | 3,001 | | | | 421 | | | | 3,871 | | | | 4,292 | |
Income | | | 2,496 | | | | 1,565 | | | | 4,061 | | | | 2,705 | | | | 967 | | | | 3,672 | |
Low Duration | | | 489 | | | | 3,658 | | | | 4,147 | | | | 301 | | | | 5,769 | | | | 6,070 | |
Ready Reserves | | | 363,966 | | | | — | | | | 363,966 | | | | 838,996 | | | | — | | | | 838,996 | |
| | | | | | | | | | | | | | | | | | | | | | | | |
| | | Reinvested Distributions (Shares) | |
| | | Period Ended June 30,
2012 | | | Year Ended December 31, 2011 | |
Fund | | Class N | | | Class I | | | Total | | | Class N | | | Class I | | | Total | |
Growth | | | — | | | | — | | | | — | | | | 552 | | | | 854 | | | | 1,406 | |
Large Cap Growth | | | — | | | | — | | | | — | | | | — | | | | 5 | | | | 5 | |
Small Cap Growth | | | — | | | | — | | | | — | | | | — | | | | — | | | | — | |
Mid Cap Growth | | | — | | | | — | | | | — | | | | 208 | | | | 742 | | | | 950 | |
Small Mid-Cap Growth | | | — | | | | — | | | | — | | | | 239 | | | | 1,356 | | | | 1,595 | |
Global Growth | | | — | | | | — | | | | — | | | | — | | | | 21 | | | | 21 | |
International Growth | | | — | | | | — | | | | — | | | | — | | | | 271 | | | | 271 | |
International Equity | | | — | | | | — | | | | — | | | | — | | | | — | | | | — | |
International Small Cap Growth | | | — | | | | — | | | | — | | | | 17 | | | | 286 | | | | 303 | |
Emerging Markets Growth | | | — | | | | — | | | | — | | | | 188 | | | | 1,225 | | | | 1,413 | |
Emerging Leaders Growth | | | — | | | | — | | | | — | | | | 1 | | | | 178 | | | | 179 | |
Emerging Markets Small Cap Growth (a) | | | — | | | | — | | | | — | | | | — | | | | — | | | | — | |
Large Cap Value (a) | | | — | | | | — | | | | — | | | | — | | | | 1 | | | | 1 | |
Small Cap Value | | | — | | | | — | | | | — | | | | 128 | | | | 550 | | | | 678 | |
Mid Cap Value | | | — | | | | — | | | | — | | | | — | | | | 8 | | | | 8 | |
Small-Mid Cap Value (b) | | | — | | | | — | | | | — | | | | — | | | | — | | | | — | |
Bond | | | 32 | | | | 233 | | | | 265 | | | | 20 | | | | 533 | | | | 553 | |
June 30, 2012 | William Blair Funds 133 |
| | | | | | | | | | | | | | | | | | | | | | | | |
| | | Reinvested Distributions (Shares) | |
| | | Period Ended June 30, 2012 | | | Year Ended December 31, 2011 | |
Fund | | Class N | | | Class I | | | Total | | | Class N | | | Class I | | | Total | |
Income | | | 88 | | | | 113 | | | | 201 | | | | 135 | | | | 246 | | | | 381 | |
Low Duration | | | 4 | | | | 86 | | | | 90 | | | | 8 | | | | 145 | | | | 153 | |
Ready Reserves | | | 64 | | | | — | | | | 64 | | | | 125 | | | | — | | | | 125 | |
| |
| | | Redemptions (Shares) | |
| | | Period Ended June 30, 2012 | | | Year Ended December 31, 2011 | |
Fund | | Class N | | | Class I | | | Total | | | Class N | | | Class I | | | Total | |
Growth | | | 3,308 | | | | 2,157 | | | | 5,465 | | | | 5,345 | | | | 5,968 | | | | 11,313 | |
Large Cap Growth | | | 64 | | | | 339 | | | | 403 | | | | 633 | | | | 802 | | | | 1,435 | |
Small Cap Growth | | | 3,056 | | | | 3,302 | | | | 6,358 | | | | 8,432 | | | | 7,958 | | | | 16,390 | |
Mid Cap Growth | | | 523 | | | | 1,322 | | | | 1,845 | | | | 465 | | | | 2,990 | | | | 3,455 | |
Small Mid-Cap Growth | | | 388 | | | | 1,055 | | | | 1,443 | | | | 478 | | | | 1,908 | | | | 2,386 | |
Global Growth | | | 50 | | | | 199 | | | | 249 | | | | 204 | | | | 334 | | | | 538 | |
International Growth | | | 14,911 | | | | 11,854 | | | | 26,765 | | | | 68,547 | | | | 27,431 | | | | 95,978 | |
International Equity | | | 85 | | | | 1,045 | | | | 1,130 | | | | 549 | | | | 9,168 | | | | 9,717 | |
International Small Cap Growth | | | 532 | | | | 7,073 | | | | 7,605 | | | | 431 | | | | 7,627 | | | | 8,058 | |
Emerging Markets Growth | | | 197 | | | | 647 | | | | 844 | | | | 911 | | | | 4,152 | | | | 5,063 | |
Emerging Leaders Growth | | | 1 | | | | 474 | | | | 475 | | | | 3 | | | | 1,006 | | | | 1,009 | |
Emerging Markets Small Cap
Growth (a) | | | 23 | | | | — | | | | 23 | | | | — | | | | — | | | | — | |
Large Cap Value (a) | | | — | | | | — | | | | — | | | | — | | | | — | | | | — | |
Small Cap Value | | | 655 | | | | 2,001 | | | | 2,656 | | | | 2,509 | | | | 3,505 | | | | 6,014 | |
Mid Cap Value | | | 1 | | | | 8 | | | | 9 | | | | 2 | | | | 43 | | | | 45 | |
Small-Mid Cap Value (b) | | | — | | | | 3 | | | | 3 | | | | — | | | | — | | | | — | |
Bond | | | 281 | | | | 1,208 | | | | 1,489 | | | | 95 | | | | 4,083 | | | | 4,178 | |
Income | | | 1,341 | | | | 935 | | | | 2,276 | | | | 1,913 | | | | 2,423 | | | | 4,336 | |
Low Duration | | | 284 | | | | 1,714 | | | | 1,998 | | | | 373 | | | | 6,432 | | | | 6,805 | |
Ready Reserves | | | 343,187 | | | | — | | | | 343,187 | | | | 783,918 | | | | — | | | | 783,918 | |
| | | | | | | | | | | | | | | | | | | | | | | | |
| | | Net Change in Shares Outstanding relating to Fund Share Activity (Shares) | |
| | | Period Ended June 30, 2012 | | | Year Ended December 31, 2011 | |
Fund | | Class N | | | Class I | | | Total | | | Class N | | | Class I | | | Total | |
Growth | | | (1,770 | ) | | | 1,340 | | | | (430 | ) | | | 1,449 | | | | 207 | | | | 1,656 | |
Large Cap Growth | | | 6 | | | | (133 | ) | | | (127 | ) | | | (508 | ) | | | (346 | ) | | | (854 | ) |
Small Cap Growth | | | (2,724 | ) | | | (1,348 | ) | | | (4,072 | ) | | | (7,036 | ) | | | (3,716 | ) | | | (10,752 | ) |
Mid Cap Growth | | | 890 | | | | 14,554 | | | | 15,444 | | | | 1,477 | | | | 2,843 | | | | 4,320 | |
Small Mid-Cap Growth | | | 796 | | | | 4,320 | | | | 5,116 | | | | 758 | | | | 4,138 | | | | 4,896 | |
Global Growth | | | 94 | | | | (88 | ) | | | 6 | | | | (145 | ) | | | 65 | | | | (80 | ) |
International Growth | | | (9,444 | ) | | | 1,690 | | | | (7,754 | ) | | | (54,688 | ) | | | (4,921 | ) | | | (59,609 | ) |
International Equity | | | (78 | ) | | | (860 | ) | | | (938 | ) | | | (491 | ) | | | (6,991 | ) | | | (7,482 | ) |
International Small Cap Growth | | | (443 | ) | | | (4,091 | ) | | | (4,534 | ) | | | (5 | ) | | | 5,293 | | | | 5,288 | |
Emerging Markets Growth | | | (182 | ) | | | (8 | ) | | | (190 | ) | | | (613 | ) | | | (1,183 | ) | | | (1,796 | ) |
Emerging Leaders Growth | | | 13 | | | | 78 | | | | 91 | | | | 1 | | | | 1,245 | | | | 1,246 | |
Emerging Markets Small Cap Growth (a) | | | 102 | | | | 164 | | | | 266 | | | | 104 | | | | 232 | | | | 336 | |
Large Cap Value (a) | | | 16 | | | | 34 | | | | 50 | | | | 100 | | | | 146 | | | | 246 | |
Small Cap Value | | | (35 | ) | | | (318 | ) | | | (353 | ) | | | 819 | | | | 5,942 | | | | 6,761 | |
Mid Cap Value | | | (1 | ) | | | 17 | | | | 16 | | | | 6 | | | | 116 | | | | 122 | |
Small-Mid Cap Value (b) | | | 2 | | | | (1 | ) | | | 1 | | | | 82 | | | | 124 | | | | 206 | |
Bond | | | 1,549 | | | | 228 | | | | 1,777 | | | | 346 | | | | 321 | | | | 667 | |
Income | | | 1,243 | | | | 743 | | | | 1,986 | | | | 927 | | | | (1,210 | ) | | | (283 | ) |
Low Duration | | | 209 | | | | 2,030 | | | | 2,239 | | | | (64 | ) | | | (518 | ) | | | (582 | ) |
Ready Reserves | | | 20,843 | | | | — | | | | 20,843 | | | | 55,203 | | | | — | | | | 55,203 | |
| (a) | | For the period from October 24, 2011 (Commencement of Operations) to December 31, 2011. |
| (b) | | For the period from December 15, 2011 (Commencement of Operations) to December 31, 2011. |
134 Semi-Annual Report | June 30, 2012 |
Financial Highlights
Growth Fund
| | | | | | | | | | | | | | | | | | | | | | | | |
| | | Class N | |
| | | Period Ended
June 30, | | | Years Ended December 31, | |
| | | 2012 | | | 2011 | | | 2010 | | | 2009 | | | 2008 | | | 2007 | |
Net asset value, beginning of year | | $ | 10.73 | | | $ | 11.28 | | | $ | 9.89 | | | $ | 7.12 | | | $ | 11.70 | | | $ | 11.42 | |
Income (loss) from investment operations: | | | | | | | | | | | | | | | | | | | | | | | | |
Net investment income (loss) | | | (0.04 | ) | | | (0.04 | ) | | | (0.01 | ) | | | (0.02 | ) | | | (0.05 | ) | | | (0.04 | ) |
Net realized and unrealized gain (loss) on investments | | | 1.00 | | | | (0.19 | ) | | | 1.40 | | | | 2.79 | | | | (4.35 | ) | | | 1.53 | |
| | | | | | | | | | | | | | | | | | | | | | | | |
Total from investment operations | | | 0.96 | | | | (0.23 | ) | | | 1.39 | | | | 2.77 | | | | (4.40 | ) | | | 1.49 | |
Less distributions from: | | | | | | | | | | | | | | | | | | | | | | | | |
Net investment income | | | — | | | | — | | | | — | | | | — | | | | — | | | | — | |
Net realized gain | | | — | | | | 0.32 | | | | — | | | | — | | | | 0.18 | | | | 1.21 | |
| | | | | | | | | | | | | | | | | | | | | | | | |
Total distributions | | | — | | | | 0.32 | | | | — | | | | — | | | | 0.18 | | | | 1.21 | |
| | | | | | | | | | | | | | | | | | | | | | | | |
Net asset value, end of year | | $ | 11.69 | | | $ | 10.73 | | | $ | 11.28 | | | $ | 9.89 | | | $ | 7.12 | | | $ | 11.70 | |
| | | | | | | | | | | | | | | | | | | | | | | | |
Total Return (%)* | | | 8.95 | | | | (1.93 | ) | | | 14.05 | | | | 38.90 | | | | (37.61 | ) | | | 13.17 | |
Ratios to average daily net assets (%):** | | | | | | | | | | | | | | | | | | | | | | | | |
Expenses | | | 1.19 | | | | 1.21 | | | | 1.16 | | | | 1.23 | | | | 1.17 | | | | 1.22 | |
Net investment income (loss) | | | (0.69 | ) | | | (0.37 | ) | | | (0.13 | ) | | | (0.20 | ) | | | (0.54 | ) | | | (0.35 | ) |
Net assets at end of year (in thousands) | | $ | 202,015 | | | $ | 204,476 | | | $ | 198,622 | | | $ | 153,987 | | | $ | 85,142 | | | $ | 125,601 | |
Portfolio turnover rate (%)* | | | 36 | | | | 59 | | | | 66 | | | | 67 | | | | 60 | | | | 72 | |
| |
| | | Class I | |
| | | Period Ended
June 30, | | | Years Ended December 31, | |
| | | 2012 | | | 2011 | | | 2010 | | | 2009 | | | 2008 | | | 2007 | |
Net asset value, beginning of year | | $ | 11.18 | | | $ | 11.71 | | | $ | 10.24 | | | $ | 7.35 | | | $ | 12.02 | | | $ | 11.66 | |
Income (loss) from investment operations: | | | | | | | | | | | | | | | | | | | | | | | | |
Net investment income (loss) | | | (0.02 | ) | | | 0.00 | ^ | | | 0.02 | | | | 0.01 | | | | (0.02 | ) | | | 0.00 | ^ |
Net realized and unrealized gain (loss) on investments | | | 1.04 | | | | (0.20 | ) | | | 1.45 | | | | 2.88 | | | | (4.47 | ) | | | 1.57 | |
| | | | | | | | | | | | | | | | | | | | | | | | |
Total from investment operations | | | 1.02 | | | | (0.20 | ) | | | 1.47 | | | | 2.89 | | | | (4.49 | ) | | | 1.57 | |
Less distributions from: | | | | | | | | | | | | | | | | | | | | | | | | |
Net investment income | | | — | | | | 0.01 | | | | 0.00 | ^ | | | 0.00 | ^ | | | — | | | | — | |
Net realized gain | | | — | | | | 0.32 | | | | — | | | | — | | | | 0.18 | | | | 1.21 | |
| | | | | | | | | | | | | | | | | | | | | | | | |
Total distributions | | | — | | | | 0.33 | | | | 0.00 | ^ | | | 0.00 | ^ | | | 0.18 | | | | 1.21 | |
| | | | | | | | | | | | | | | | | | | | | | | | |
Net asset value, end of year | | $ | 12.20 | | | $ | 11.18 | | | $ | 11.71 | | | $ | 10.24 | | | $ | 7.35 | | | $ | 12.02 | |
| | | | | | | | | | | | | | | | | | | | | | | | |
Total Return (%)* | | | 9.12 | | | | (1.60 | ) | | | 14.36 | | | | 39.34 | | | | (37.35 | ) | | | 13.59 | |
Ratios to average daily net assets (%):** | | | | | | | | | | | | | | | | | | | | | | | | |
Expenses | | | 0.87 | | | | 0.86 | | | | 0.84 | | | | 0.89 | | | | 0.85 | | | | 0.87 | |
Net investment income (loss) | | | (0.37 | ) | | | (0.03 | ) | | | 0.20 | | | | 0.14 | | | | (0.22 | ) | | | 0.00 | |
Net assets at end of year (in thousands) | | $ | 411,548 | | | $ | 362,266 | | | $ | 376,991 | | | $ | 265,533 | | | $ | 153,444 | | | $ | 244,043 | |
Portfolio turnover rate (%)* | | | 36 | | | | 59 | | | | 66 | | | | 67 | | | | 60 | | | | 72 | |
| * | | Rates not annualized for periods that are less than a year. |
| ** | | Rates are annualized for periods that are less than a year. |
| ^ | | Amount is less than $0.005 per share. |
Redemption fees represent less than $0.005 per share for all periods.
Note: Net investment income (loss) per share is based on the average shares outstanding during the year.
Performance cited represents past performance. Past performance does not guarantee future results and current performance may be lower or higher than the data quoted. Results shown are annual returns, which assume reinvestment of dividends and capital gains. Investment returns and principal will fluctuate and you may have a gain or loss when you sell shares. For the most current month-end performance information, please call 1-800-742-7272 or visit our Web site at www.williamblairfunds.com.
June 30, 2012 | William Blair Funds 135 |
Financial Highlights
Large Cap Growth Fund
| | | | | | | | | | | | | | | | | | | | | | | | |
| | | Class N | |
| | | Period Ended
June 30, | | | Years Ended December 31, | |
| | | 2012 | | | 2011 | | | 2010 | | | 2009 | | | 2008 | | | 2007 | |
Net asset value, beginning of year | | $ | 6.88 | | | $ | 7.14 | | | $ | 6.16 | | | $ | 4.68 | | | $ | 7.52 | | | $ | 6.88 | |
Income (loss) from investment operations: | | | | | | | | | | | | | | | | | | | | | | | | |
Net investment income (loss) | | | (0.01 | ) | | | (0.01 | ) | | | (0.00 | )^ | | | (0.01 | ) | | | (0.02 | ) | | | (0.01 | ) |
Net realized and unrealized gain (loss) on investments | | | 0.84 | | | | (0.25 | ) | | | 0.98 | | | | 1.49 | | | | (2.82 | ) | | | 0.65 | |
| | | | | | | | | | | | | | | | | | | | | | | | |
Total from investment operations | | | 0.83 | | | | (0.26 | ) | | | 0.98 | | | | 1.48 | | | | (2.84 | ) | | | 0.64 | |
Less distributions from: | | | | | | | | | | | | | | | | | | | | | | | | |
Net investment income | | | — | | | | — | | | | — | | | | — | | | | 0.00 | ^ | | | — | |
Net realized gain | | | — | | | | — | | | | — | | | | — | | | | — | | | | — | |
| | | | | | | | | | | | | | | | | | | | | | | | |
Total distributions | | | — | | | | — | | | | — | | | | — | | | | 0.00 | ^ | | | — | |
| | | | | | | | | | | | | | | | | | | | | | | | |
Net asset value, end of year | | $ | 7.71 | | | $ | 6.88 | | | $ | 7.14 | | | $ | 6.16 | | | $ | 4.68 | | | $ | 7.52 | |
| | | | | | | | | | | | | | | | | | | | | | | | |
Total Return (%)* | | | 12.06 | | | | (3.64 | ) | | | 15.91 | | | | 31.62 | | | | (37.76 | ) | | | 9.30 | |
Ratios to average daily net assets (%):** | | | | | | | | | | | | | | | | | | | | | | | | |
Expenses, net of waivers and reimbursements | | | 1.20 | | | | 1.20 | | | | 1.21 | | | | 1.23 | | | | 1.23 | | | | 1.23 | |
Expenses, before waivers and reimbursements | | | 1.60 | | | | 1.51 | | | | 1.53 | | | | 2.28 | | | | 1.85 | | | | 1.50 | |
Net investment income (loss), net of waivers and reimbursements | | | (0.30 | ) | | | (0.13 | ) | | | (0.08 | ) | | | (0.13 | ) | | | (0.29 | ) | | | (0.16 | ) |
Net investment income (loss), before waivers and reimbursements | | | (0.70 | ) | | | (0.44 | ) | | | (0.40 | ) | | | (1.18 | ) | | | (0.91 | ) | | | (0.43 | ) |
Net assets at end of year (in thousands) | | $ | 3,840 | | | $ | 3,387 | | | $ | 7,135 | | | $ | 5,952 | | | $ | 4,842 | | | $ | 7,307 | |
Portfolio turnover rate (%)* | | | 23 | | | | 67 | | | | 54 | | | | 88 | | | | 85 | | | | 60 | |
| |
| | | Class I | |
| | | Period Ended
June 30, | | | Years Ended December 31, | |
| | | 2012 | | | 2011 | | | 2010 | | | 2009 | | | 2008 | | | 2007 | |
Net asset value, beginning of year | | $ | 7.03 | | | $ | 7.30 | | | $ | 6.30 | | | $ | 4.77 | | | $ | 7.64 | | | $ | 6.99 | |
Income (loss) from investment operations: | | | | | | | | | | | | | | | | | | | | | | | | |
Net investment income (loss) | | | 0.00 | ^ | | | 0.01 | | | | 0.01 | | | | 0.01 | | | | 0.00 | ^ | | | 0.01 | |
Net realized and unrealized gain (loss) on investments | | | 0.87 | | | | (0.27 | ) | | | 1.00 | | | | 1.52 | | | | (2.87 | ) | | | 0.64 | |
| | | | | | | | | | | | | | | | | | | | | | | | |
Total from investment operations | | | 0.87 | | | | (0.26 | ) | | | 1.01 | | | | 1.53 | | | | (2.87 | ) | | | 0.65 | |
Less distributions from: | | | | | | | | | | | | | | | | | | | | | | | | |
Net investment income | | | — | | | | 0.01 | | | | 0.01 | | | | 0.00 | ^ | | | 0.00 | ^ | | | 0.00 | ^ |
Net realized gain | | | — | | | | — | | | | — | | | | — | | | | — | | | | — | |
| | | | | | | | | | | | | | | | | | | | | | | | |
Total distributions | | | — | | | | 0.01 | | | | 0.01 | | | | 0.00 | ^ | | | 0.00 | ^ | | | 0.00 | ^ |
| | | | | | | | | | | | | | | | | | | | | | | | |
Net asset value, end of year | | $ | 7.90 | | | $ | 7.03 | | | $ | 7.30 | | | $ | 6.30 | | | $ | 4.77 | | | $ | 7.64 | |
| | | | | | | | | | | | | | | | | | | | | | | | |
Total Return (%)* | | | 12.38 | | | | (3.54 | ) | | | 16.03 | | | | 32.17 | | | | (37.56 | ) | | | 9.36 | |
Ratios to average daily net assets (%):** | | | | | | | | | | | | | | | | | | | | | | | | |
Expenses, net of waivers and reimbursements | | | 0.95 | | | | 0.95 | | | | 0.96 | | | | 0.98 | | | | 0.98 | | | | 0.98 | |
Expenses, before waivers and reimbursements | | | 1.26 | | | | 1.16 | | | | 1.16 | | | | 1.26 | | | | 1.21 | | | | 1.20 | |
Net investment income (loss), net of waivers and reimbursements | | | (0.05 | ) | | | 0.11 | | | | 0.16 | | | | 0.12 | | | | (0.04 | ) | | | 0.18 | |
Net investment income (loss), before waivers and reimbursements | | | (0.36 | ) | | | (0.10 | ) | | | (0.04 | ) | | | (0.16 | ) | | | (0.27 | ) | | | (0.04 | ) |
Net assets at end of year (in thousands) | | $ | 23,159 | | | $ | 21,562 | | | $ | 24,900 | | | $ | 24,359 | | | $ | 18,437 | | | $ | 26,360 | |
Portfolio turnover rate (%)* | | | 23 | | | | 67 | | | | 54 | | | | 88 | | | | 85 | | | | 60 | |
| * | | Rates not annualized for periods that are less than a year. |
| ** | | Rates are annualized for periods that are less than a year. |
| ^ | | Amount is less than $0.005 per share. |
Redemption fees represent less than $0.005 per share for all periods.
Note: Net investment income (loss) per share is based on the average shares outstanding during the year.
Performance cited represents past performance. Past performance does not guarantee future results and current performance may be lower or higher than the data quoted. Results shown are annual returns, which assume reinvestment of dividends and capital gains. Investment returns and principal will fluctuate and you may have a gain or loss when you sell shares. For the most current month-end performance information, please call 1-800-742-7272 or visit our Web site at www.williamblairfunds.com.
136 Semi-Annual Report | June 30, 2012 |
Financial Highlights
Small Cap Growth Fund
| | | | | | | | | | | | | | | | | | | | | | | | |
| | | Class N | |
| | | Period Ended
June 30, | | | Years Ended December 31, | |
| | | 2012 | | | 2011 | | | 2010 | | | 2009 | | | 2008 | | | 2007 | |
Net asset value, beginning of year | | $ | 20.13 | | | $ | 23.22 | | | $ | 19.99 | | | $ | 11.79 | | | $ | 23.30 | | | $ | 25.41 | |
Income (loss) from investment operations: | | | | | | | | | | | | | | | | | | | | | | | | |
Net investment income (loss) | | | (0.13 | ) | | | (0.28 | ) | | | (0.21 | ) | | | (0.15 | ) | | | (0.19 | ) | | | (0.33 | ) |
Net realized and unrealized gain (loss) on investments | | | 1.98 | | | | (2.81 | ) | | | 3.44 | | | | 8.35 | | | | (10.73 | ) | | | (0.25 | ) |
| | | | | | | | | | | | | | | | | | | | | | | | |
Total from investment operations | | | 1.85 | | | | (3.09 | ) | | | 3.23 | | | | 8.20 | | | | (10.92 | ) | | | (0.58 | ) |
Less distributions from: | | | | | | | | | | | | | | | | | | | | | | | | |
Net investment income | | | — | | | | — | | | | — | | | | — | | | | — | | | | — | |
Net realized gain | | | — | | | | — | | | | — | | | | — | | | | 0.59 | | | | 1.53 | |
| | | | | | | | | | | | | | | | | | | | | | | | |
Total distributions | | | — | | | | — | | | | — | | | | — | | | | 0.59 | | | | 1.53 | |
| | | | | | | | | | | | | | | | | | | | | | | | |
Net asset value, end of year | | $ | 21.98 | | | $ | 20.13 | | | $ | 23.22 | | | $ | 19.99 | | | $ | 11.79 | | | $ | 23.30 | |
| | | | | | | | | | | | | | | | | | | | | | | | |
Total Return (%) * | | | 9.19 | | | | (13.31 | ) | | | 16.16 | | | | 69.55 | | | | (46.85 | ) | | | (2.15 | ) |
Ratios to average daily net assets (%): ** | | | | | | | | | | | | | | | | | | | | | | | | |
Expenses, net of waivers and reimbursements | | | 1.50 | | | | 1.50 | | | | 1.50 | | | | 1.50 | | | | 1.50 | | | | 1.49 | |
Expenses, before waivers and reimbursements | | | 1.61 | | | | 1.59 | | | | 1.52 | | | | 1.55 | | | | 1.50 | | | | 1.49 | |
Net investment income (loss), net of waivers and reimbursements | | | (1.16 | ) | | | (1.25 | ) | | | (1.03 | ) | | | (0.93 | ) | | | (1.05 | ) | | | (1.24 | ) |
Net investment income (loss), before waivers and reimbursements | | | (1.27 | ) | | | (1.34 | ) | | | (1.05 | ) | | | (0.98 | ) | | | (1.05 | ) | | | (1.24 | ) |
Net assets at end of year (in thousands) | | $ | 161,021 | | | $ | 202,341 | | | $ | 396,767 | | | $ | 469,746 | | | $ | 224,612 | | | $ | 540,137 | |
Portfolio turnover rate (%)* | | | 49 | | | | 97 | | | | 117 | | | | 122 | | | | 135 | | | | 97 | |
| |
| | | Class I | |
| | | Period Ended
June 30, | | | Years Ended December 31, | |
| | | 2012 | | | 2011 | | | 2010 | | | 2009 | | | 2008 | | | 2007 | |
Net asset value, beginning of year | | $ | 20.91 | | | $ | 24.07 | | | $ | 20.64 | | | $ | 12.14 | | | $ | 23.89 | | | $ | 25.94 | |
Income (loss) from investment operations: | | | | | | | | | | | | | | | | | | | | | | | | |
Net investment income (loss) | | | (0.10 | ) | | | (0.23 | ) | | | (0.16 | ) | | | (0.11 | ) | | | (0.14 | ) | | | (0.25 | ) |
Net realized and unrealized gain (loss) on investments | | | 2.05 | | | | (2.93 | ) | | | 3.59 | | | | 8.61 | | | | (11.02 | ) | | | (0.27 | ) |
| | | | | | | | | | | | | | | | | | | | | | | | |
Total from investment operations | | | 1.95 | | | | (3.16 | ) | | | 3.43 | | | | 8.50 | | | | (11.16 | ) | | | (0.52 | ) |
Less distributions from: | | | | | | | | | | | | | | | | | | | | | | | | |
Net investment income | | | — | | | | — | | | | — | | | | — | | | | — | | | | — | |
Net realized gain | | | — | | | | — | | | | — | | | | — | | | | 0.59 | | | | 1.53 | |
| | | | | | | | | | | | | | | | | | | | | | | | |
Total distributions | | | — | | | | — | | | | — | | | | — | | | | 0.59 | | | | 1.53 | |
| | | | | | | | | | | | | | | | | | | | | | | | |
Net asset value, end of year | | $ | 22.86 | | | $ | 20.91 | | | $ | 24.07 | | | $ | 20.64 | | | $ | 12.14 | | | $ | 23.89 | |
| | | | | | | | | | | | | | | | | | | | | | | | |
Total Return (%) * | | | 9.33 | | | | (13.13 | ) | | | 16.62 | | | | 70.02 | | | | (46.70 | ) | | | (1.88 | ) |
Ratios to average daily net assets (%): ** | | | | | | | | | | | | | | | | | | | | | | | | |
Expenses, net of waivers and reimbursements | | | 1.25 | | | | 1.25 | | | | 1.25 | | | | 1.20 | | | | 1.20 | | | | 1.20 | |
Expenses, before waivers and reimbursements | | | 1.41 | | | | 1.35 | | | | 1.25 | | | | 1.20 | | | | 1.20 | | | | 1.20 | |
Net investment income (loss), net of waivers and reimbursements | | | (0.90 | ) | | | (1.00 | ) | | | (0.76 | ) | | | (0.63 | ) | | | (0.75 | ) | | | (0.94 | ) |
Net investment income (loss), before waivers and reimbursements | | | (1.06 | ) | | | (1.10 | ) | | | (0.76 | ) | | | (0.63 | ) | | | (0.75 | ) | | | (0.94 | ) |
Net assets at end of year (in thousands) | | $ | 354,415 | | | $ | 352,397 | | | $ | 494,822 | | | $ | 293,052 | | | $ | 177,015 | | | $ | 554,282 | |
Portfolio turnover rate (%)* | | | 49 | | | | 97 | | | | 117 | | | | 122 | | | | 135 | | | | 97 | |
| * | Rates not annualized for periods that are less than a year. |
| ** | Rates are annualized for periods that are less than a year. |
Redemption fees represent less than $0.005 per share for all periods.
Note: Net investment income (loss) per share is based on the average shares outstanding during the year.
Performance cited represents past performance. Past performance does not guarantee future results and current performance may be lower or higher than the data quoted. Results shown are annual returns, which assume reinvestment of dividends and capital gains. Investment returns and principal will fluctuate and you may have a gain or loss when you sell shares. For the most current month-end performance information, please call 1-800-742-7272 or visit our Web site at www.williamblairfunds.com.
June 30, 2012 | William Blair Funds 137 |
Financial Highlights
Mid Cap Growth Fund
| | | | | | | | | | | | | | | | | | | | | | | | |
| | | Class N | |
| | | Period Ended
June 30, | | | Years Ended December 31, | |
| | | 2012 | | | 2011 | | | 2010 | | | 2009 | | | 2008 | | | 2007 | |
Net asset value, beginning of year | | $ | 11.66 | | | $ | 12.50 | | | $ | 10.08 | | | $ | 7.41 | | | $ | 11.35 | | | $ | 10.46 | |
Income (loss) from investment operations: | | | | | | | | | | | | | | | | | | | | | | | | |
Net investment income (loss) | | | (0.03 | ) | | | (0.08 | ) | | | (0.05 | ) | | | (0.04 | ) | | | (0.07 | ) | | | (0.07 | ) |
Net realized and unrealized gain (loss) on investments | | | 0.85 | | | | 0.25 | | | | 2.47 | | | | 2.71 | | | | (3.87 | ) | | | 1.59 | |
| | | | | | | | | | | | | | | | | | | | | | | | |
Total from investment operations | | | 0.82 | | | | 0.17 | | | | 2.42 | | | | 2.67 | | | | (3.94 | ) | | | 1.52 | |
Less distributions from: | | | | | | | | | | | | | | | | | | | | | | | | |
Net investment income | | | — | | | | — | | | | — | | | | — | | | | — | | | | — | |
Net realized gain | | | — | | | | 1.01 | | | | — | | | | — | | | | 0.00 | ^ | | | 0.63 | |
| | | | | | | | | | | | | | | | | | | | | | | | |
Total distributions | | | — | | | | 1.01 | | | | — | | | | — | | | | 0.00 | ^ | | | 0.63 | |
| | | | | | | | | | | | | | | | | | | | | | | | |
Net asset value, end of year | | $ | 12.48 | | | $ | 11.66 | | | $ | 12.50 | | | $ | 10.08 | | | $ | 7.41 | | | $ | 11.35 | |
| | | | | | | | | | | | | | | | | | | | | | | | |
Total Return (%)* | | | 7.03 | | | | 1.65 | | | | 24.01 | | | | 36.03 | | | | (34.71 | ) | | | 14.62 | |
Ratios to average daily net assets (%):** | | | | | | | | | | | | | | | | | | | | | | | | |
Expenses, net of waivers and reimbursements | | | 1.35 | | | | 1.35 | | | | 1.35 | | | | 1.36 | | | | 1.36 | | | | 1.38 | |
Expenses, before waivers and reimbursements | | | 1.37 | | | | 1.43 | | | | 1.42 | | | | 2.13 | | | | 2.03 | | | | 1.67 | |
Net investment income (loss), net of waivers and reimbursements | | | (0.51 | ) | | | (0.65 | ) | | | (0.42 | ) | | | (0.51 | ) | | | (0.76 | ) | | | (0.58 | ) |
Net investment income (loss), before waivers and reimbursements | | | (0.53 | ) | | | (0.73 | ) | | | (0.49 | ) | | | (1.28 | ) | | | (1.43 | ) | | | (0.87 | ) |
Net assets at end of year (in thousands) | | $ | 43,311 | | | $ | 30,093 | | | $ | 13,802 | | | $ | 10,379 | | | $ | 4,803 | | | $ | 7,272 | |
Portfolio turnover rate (%)* | | | 35 | | | | 70 | | | | 73 | | | | 87 | | | | 76 | | | | 66 | |
| |
| | | Class I | |
| | | Period Ended
June 30, | | | Years Ended December 31, | |
| | | 2012 | | | 2011 | | | 2010 | | | 2009 | | | 2008 | | | 2007 | |
Net asset value, beginning of year | | $ | 11.87 | | | $ | 12.68 | | | $ | 10.20 | | | $ | 7.48 | | | $ | 11.42 | | | $ | 10.49 | |
Income (loss) from investment operations: | | | | | | | | | | | | | | | | | | | | | | | | |
Net investment income (loss) | | | (0.01 | ) | | | (0.05 | ) | | | (0.02 | ) | | | (0.02 | ) | | | (0.05 | ) | | | (0.04 | ) |
Net realized and unrealized gain (loss) on investments | | | 0.87 | | | | 0.25 | | | | 2.50 | | | | 2.74 | | | | (3.89 | ) | | | 1.60 | |
| | | | | | | | | | | | | | | | | | | | | | | | |
Total from investment operations | | | 0.86 | | | | 0.20 | | | | 2.48 | | | | 2.72 | | | | (3.94 | ) | | | 1.56 | |
Less distributions from: | | | | | | | | | | | | | | | | | | | | | | | | |
Net investment income | | | — | | | | — | | | | — | | | | — | | | | — | | | | — | |
Net realized gain | | | — | | | | 1.01 | | | | — | | | | — | | | | 0.00 | ^ | | | 0.63 | |
| | | | | | | | | | | | | | | | | | | | | | | | |
Total distributions | | | — | | | | 1.01 | | | | — | | | | — | | | | 0.00 | ^ | | | 0.63 | |
| | | | | | | | | | | | | | | | | | | | | | | | |
Net asset value, end of year | | $ | 12.73 | | | $ | 11.87 | | | $ | 12.68 | | | $ | 10.20 | | | $ | 7.48 | | | $ | 11.42 | |
| | | | | | | | | | | | | | | | | | | | | | | | |
Total Return (%)* | | | 7.25 | | | | 1.86 | | | | 24.31 | | | | 36.36 | | | | (34.50 | ) | | | 14.95 | |
Ratios to average daily net assets (%):** | | | | | | | | | | | | | | | | | | | | | | | | |
Expenses, net of waivers and reimbursements | | | 1.05 | | | | 1.10 | | | | 1.10 | | | | 1.11 | | | | 1.11 | | | | 1.12 | |
Expenses, before waivers and reimbursements | | | 1.05 | | | | 1.13 | | | | 1.15 | | | | 1.28 | | | | 1.23 | | | | 1.37 | |
Net investment income (loss), net of waivers and reimbursements | | | (0.19 | ) | | | (0.42 | ) | | | (0.14 | ) | | | (0.26 | ) | | | (0.51 | ) | | | (0.32 | ) |
Net investment income (loss), before waivers and reimbursements | | | (0.19 | ) | | | (0.45 | ) | | | (0.19 | ) | | | (0.43 | ) | | | (0.63 | ) | | | (0.57 | ) |
Net assets at end of year (in thousands) | | $ | 309,256 | | | $ | 115,661 | | | $ | 87,446 | | | $ | 60,455 | | | $ | 35,723 | | | $ | 38,121 | |
Portfolio turnover rate (%)* | | | 35 | | | | 70 | | | | 73 | | | | 87 | | | | 76 | | | | 66 | |
| * | Rates not annualized for periods that are less than a year. |
| ** | Rates are annualized for periods that are less than a year. |
| ^ | Amount is less than $0.005 per share. |
Redemption fees represent less than $0.005 per share for all periods.
Note: Net investment income (loss) per share is based on the average shares outstanding during the year.
Performance cited represents past performance. Past performance does not guarantee future results and current performance may be lower or higher than the data quoted. Results shown are annual returns, which assume reinvestment of dividends and capital gains. Investment returns and principal will fluctuate and you may have a gain or loss when you sell shares. For the most current month-end performance information, please call 1-800-742-7272 or visit our Web site at www.williamblairfunds.com.
138 Semi-Annual Report | June 30, 2012 |
Financial Highlights
Small-Mid Cap Growth Fund
| | | | | | | | | | | | | | | | | | | | | | | | |
| | | Class N | |
| | | Period Ended
June 30, | | | Years Ended December 31, | |
| | | 2012 | | | 2011 | | | 2010 | | | 2009 | | | 2008 | | | 2007 | |
Net asset value, beginning of year | | $ | 13.00 | | | $ | 14.40 | | | $ | 11.73 | | | $ | 8.16 | | | $ | 13.10 | | | $ | 12.96 | |
Income (loss) from investment operations: | | | | | | | | | | | | | | | | | | | | | | | | |
Net investment income (loss) | | | (0.04 | ) | | | (0.11 | ) | | | (0.09 | ) | | | (0.06 | ) | | | (0.03 | ) | | | (0.12 | ) |
Net realized and unrealized gain (loss) on investments | | | 0.69 | | | | 0.03 | | | | 2.76 | | | | 3.63 | | | | (4.91 | ) | | | 1.71 | |
| | | | | | | | | | | | | | | | | | | | | | | | |
Total from investment operations | | | 0.65 | | | | (0.08 | ) | | | 2.67 | | | | 3.57 | | | | (4.94 | ) | | | 1.59 | |
Less distributions from: | | | | | | | | | | | | | | | | | | | | | | | | |
Net investment income | | | — | | | | — | | | | — | | | | — | | | | — | | | | — | |
Net realized gain | | | — | | | | 1.32 | | | | — | | | | — | | | | 0.00 | ^ | | | 1.45 | |
| | | | | | | | | | | | | | | | | | | | | | | | |
Total distributions | | | — | | | | 1.32 | | | | — | | | | — | | | | 0.00 | ^ | | | 1.45 | |
| | | | | | | | | | | | | | | | | | | | | | | | |
Net asset value, end of year | | $ | 13.65 | | | $ | 13.00 | | | $ | 14.40 | | | $ | 11.73 | | | $ | 8.16 | | | $ | 13.10 | |
| | | | | | | | | | | | | | | | | | | | | | | | |
Total Return (%)* | | | 5.00 | | | | (0.27 | ) | | | 22.76 | | | | 43.75 | | | | (37.71 | ) | | | 12.34 | |
Ratios to average daily net assets (%):** | | | | | | | | | | | | | | | | | | | | | | | | |
Expenses, net of waivers and reimbursements | | | 1.35 | | | | 1.35 | | | | 1.35 | | | | 1.36 | | | | 1.36 | | | | 1.36 | |
Expenses, before waivers and reimbursements | | | 1.60 | | | | 1.46 | | | | 1.46 | | | | 1.49 | | | | 1.41 | | | | 1.42 | |
Net investment income (loss), net of waivers and reimbursements | | | (0.64 | ) | | | (0.77 | ) | | | (0.76 | ) | | | (0.60 | ) | | | (0.26 | ) | | | (0.79 | ) |
Net investment income (loss), before waivers and reimbursements | | | (0.89 | ) | | | (0.88 | ) | | | (0.87 | ) | | | (0.73 | ) | | | (0.31 | ) | | | (0.85 | ) |
Net assets at end of year (in thousands) | | $ | 46,690 | | | $ | 34,123 | | | $ | 26,876 | | | $ | 23,576 | | | $ | 7,954 | | | $ | 17,074 | |
Portfolio turnover rate (%)* | | | 42 | | | | 76 | | | | 93 | | | | 112 | | | | 77 | | | | 80 | |
| |
| | | Class I | |
| | | Period Ended
June 30, | | | Years Ended December 31, | |
| | | 2012 | | | 2011 | | | 2010 | | | 2009 | | | 2008 | | | 2007 | |
Net asset value, beginning of year | | $ | 13.32 | | | $ | 14.68 | | | $ | 11.93 | | | $ | 8.27 | | | $ | 13.24 | | | $ | 13.06 | |
Income (loss) from investment operations: | | | | | | | | | | | | | | | | | | | | | | | | |
Net investment income (loss) | | | (0.03 | ) | | | (0.08 | ) | | | (0.06 | ) | | | (0.03 | ) | | | 0.00 | ^ | | | (0.08 | ) |
Net realized and unrealized gain (loss) on investments | | | 0.71 | | | | 0.04 | | | | 2.81 | | | | 3.69 | | | | (4.97 | ) | | | 1.71 | |
| | | | | | | | | | | | | | | | | | | | | | | | |
Total from investment operations | | | 0.68 | | | | (0.04 | ) | | | 2.75 | | | | 3.66 | | | | (4.97 | ) | | | 1.63 | |
Less distributions from: | | | | | | | | | | | | | | | | | | | | | | | | |
Net investment income | | | — | | | | — | | | | — | | | | 0.00 | ^ | | | — | | | | — | |
Net realized gain | | | — | | | | 1.32 | | | | — | | | | — | | | | 0.00 | ^ | | | 1.45 | |
| | | | | | | | | | | | | | | | | | | | | | | | |
Total distributions | | | — | | | | 1.32 | | | | — | | | | 0.00 | ^ | | | 0.00 | ^ | | | 1.45 | |
| | | | | | | | | | | | | | | | | | | | | | | | |
Net asset value, end of year | | $ | 14.00 | | | $ | 13.32 | | | $ | 14.68 | | | $ | 11.93 | | | $ | 8.27 | | | $ | 13.24 | |
| | | | | | | | | | | | | | | | | | | | | | | | |
Total Return (%)* | | | 5.11 | | | | 0.01 | | | | 23.05 | | | | 44.26 | | | | (37.54 | ) | | | 12.54 | |
Ratios to average daily net assets (%):** | | | | | | | | | | | | | | | | | | | | | | | | |
Expenses, net of waivers and reimbursements | | | 1.10 | | | | 1.10 | | | | 1.10 | | | | 1.11 | | | | 1.11 | | | | 1.11 | |
Expenses, before waivers and reimbursements | | | 1.18 | | | | 1.12 | | | | 1.11 | | | | 1.18 | | | | 1.17 | | | | 1.17 | |
Net investment income (loss), net of waivers and reimbursements | | | (0.39 | ) | | | (0.54 | ) | | | (0.50 | ) | | | (0.33 | ) | | | 0.03 | | | | (0.54 | ) |
Net investment income (loss), before waivers and reimbursements | | | (0.47 | ) | | | (0.56 | ) | | | (0.51 | ) | | | (0.40 | ) | | | (0.03 | ) | | | (0.60 | ) |
Net assets at end of year (in thousands) | | $ | 291,105 | | | $ | 219,474 | | | $ | 181,189 | | | $ | 123,252 | | | $ | 75,525 | | | $ | 107,427 | |
Portfolio turnover rate (%)* | | | 42 | | | | 76 | | | | 93 | | | | 112 | | | | 77 | | | | 80 | |
| * | Rates not annualized for periods that are less than a year. |
| ** | Rates are annualized for periods that are less than a year. |
| ^ | Amount is less than $0.005 per share. |
Redemption fees represent less than $0.005 per share for all periods.
Note: Net investment income (loss) per share is based on the average shares outstanding during the year.
Performance cited represents past performance. Past performance does not guarantee future results and current performance may be lower or higher than the data quoted. Results shown are annual returns, which assume reinvestment of dividends and capital gains. Investment returns and principal will fluctuate and you may have a gain or loss when you sell shares. For the most current month-end performance information, please call 1-800-742-7272 or visit our Web site at www.williamblairfunds.com.
June 30, 2012 | William Blair Funds 139 |
Financial Highlights
Global Growth Fund
| | | | | | | | | | | | | | | | | | | | | | | | |
| | Class N | |
| | | Period Ended
June 30, | | | Years Ended December 31, | |
| | | 2012 | | | 2011 | | | 2010 | | | 2009 | | | 2008 | | | 2007(a) | |
Net asset value, beginning of year | | $ | 8.10 | | | $ | 8.40 | | | $ | 6.97 | | | $ | 4.96 | | | $ | 9.89 | | | $ | 10.00 | |
Income (loss) from investment operations: | | | | | | | | | | | | | | | | | | | | | | | | |
Net investment income (loss) (b) | | | 0.03 | | | | 0.02 | | | | (0.01 | ) | | | (0.01 | ) | | | 0.08 | | | | 0.00 | ^ |
Net realized and unrealized gain (loss) on investments | | | 0.67 | | | | (0.31 | ) | | | 1.44 | | | | 2.02 | | | | (4.98 | ) | | | (0.11 | ) |
| | | | | | | | | | | | | | | | | | | | | | | | |
Total from investment operations | | | 0.70 | | | | (0.29 | ) | | | 1.43 | | | | 2.01 | | | | (4.90 | ) | | | (0.11 | ) |
Less distributions from: | | | | | | | | | | | | | | | | | | | | | | | | |
Net investment income | | | — | | | | 0.01 | | | | — | | | | — | | | | 0.03 | | | | 0.00 | ^ |
Net realized gain | | | — | | | | — | | | | — | | | | — | | | | — | | | | — | |
| | | | | | | | | | | | | | | | | | | | | | | | |
Total distributions | | | — | | | | 0.01 | | | | — | | | | — | | | | 0.03 | | | | 0.00 | ^ |
| | | | | | | | | | | | | | | | | | | | | | | | |
Net asset value, end of year | | $ | 8.80 | | | $ | 8.10 | | | $ | 8.40 | | | $ | 6.97 | | | $ | 4.96 | | | $ | 9.89 | |
| | | | | | | | | | | | | | | | | | | | | | | | |
Total Return (%) * | | | 8.64 | | | | (3.47 | ) | | | 20.52 | | | | 40.52 | | | | (49.52 | ) | | | (1.10 | ) |
Ratios to average daily net assets (%): ** | | | | | | | | | | | | | | | | | | | | | | | | |
Expenses, net of waivers and reimbursements | | | 1.50 | | | | 1.50 | | | | 1.52 | | | | 1.55 | | | | 1.55 | | | | 1.55 | |
Expenses, before waivers and reimbursements | | | 1.79 | | | | 1.82 | | | | 1.93 | | | | 2.61 | | | | 2.17 | | | | 2.14 | |
Net investment income (loss), net of waivers and reimbursements | | | 0.63 | | | | 0.29 | | | | (0.09 | ) | | | (0.17 | ) | | | 0.98 | | | | (0.08 | ) |
Net investment income (loss), before waivers and reimbursements | | | 0.34 | | | | (0.03 | ) | | | (0.50 | ) | | | (1.23 | ) | | | 0.36 | | | | (0.67 | ) |
Net assets at end of year (in thousands) | | $ | 4,892 | | | $ | 3,740 | | | $ | 5,101 | | | $ | 4,721 | | | $ | 3,652 | | | $ | 9,089 | |
Portfolio turnover rate (%)* | | | 23 | | | | 75 | | | | 96 | | | | 133 | | | | 124 | | | | 63 | |
| | | | | | | | | | | | | | | | | | | | | | | | |
| | Class I | |
| | | Period Ended
June 30, | | | Years Ended December 31, | |
| | | 2012 | | | 2011 | | | 2010 | | | 2009 | | | 2008 | | | 2007(a) | |
Net asset value, beginning of year | | $ | 8.09 | | | $ | 8.40 | | | $ | 6.96 | | | $ | 4.94 | | | $ | 9.91 | | | $ | 10.00 | |
Income (loss) from investment operations: | | | | | | | | | | | | | | | | | | | | | | | | |
Net investment income (loss) (b) | | | 0.04 | | | | 0.04 | | | | 0.01 | | | | 0.00 | ^ | | | 0.08 | | | | 0.00 | ^ |
Net realized and unrealized gain (loss) on investments | | | 0.67 | | | | (0.31 | ) | | | 1.43 | | | | 2.02 | | | | (4.98 | ) | | | (0.09 | ) |
| | | | | | | | | | | | | | | | | | | | | | | | |
Total from investment operations | | | 0.71 | | | | (0.27 | ) | | | 1.44 | | | | 2.02 | | | | (4.90 | ) | | | (0.09 | ) |
Less distributions from: | | | | | | | | | | | | | | | | | | | | | | | | |
Net investment income | | | — | | | | 0.04 | | | | 0.00 | ^ | | | 0.00 | ^ | | | 0.07 | | | | 0.00 | ^ |
Net realized gain | | | — | | | | — | | | | — | | | | — | | | | — | | | | — | |
| | | | | | | | | | | | | | | | | | | | | | | | |
Total distributions | | | — | | | | 0.04 | | | | 0.00 | ^ | | | 0.00 | ^ | | | 0.07 | | | | 0.00 | ^ |
| | | | | | | | | | | | | | | | | | | | | | | | |
Net asset value, end of year | | $ | 8.80 | | | $ | 8.09 | | | $ | 8.40 | | | $ | 6.96 | | | $ | 4.94 | | | $ | 9.91 | |
| | | | | | | | | | | | | | | | | | | | | | | | |
Total Return (%) * | | | 8.78 | | | | (3.26 | ) | | | 20.73 | | | | 40.90 | | | | (49.41 | ) | | | (0.85 | ) |
Ratios to average daily net assets (%): ** | | | | | | | | | | | | | | | | | | | | | | | | |
Expenses, net of waivers and reimbursements | | | 1.25 | | | | 1.25 | | | | 1.27 | | | | 1.30 | | | | 1.30 | | | | 1.30 | |
Expenses, before waivers and reimbursements | | | 1.52 | | | | 1.55 | | | | 1.62 | | | | 1.62 | | | | 1.74 | | | | 1.89 | |
Net investment income (loss), net of waivers and reimbursements | | | 0.87 | | | | 0.52 | | | | 0.16 | | | | 0.05 | | | | 1.05 | | | | 0.14 | |
Net investment income (loss), before waivers and reimbursements | | | 0.60 | | | | 0.22 | | | | (0.19 | ) | | | (0.27 | ) | | | 0.61 | | | | (0.45 | ) |
Net assets at end of year (in thousands) | | $ | 41,481 | | | $ | 38,834 | | | $ | 39,776 | | | $ | 33,566 | | | $ | 24,353 | | | $ | 36,487 | |
Portfolio turnover rate (%)* | | | 23 | | | | 75 | | | | 96 | | | | 133 | | | | 124 | | | | 63 | |
| (a) | | For the period October 15, 2007 (Commencement of Operations) to December 31, 2007. |
| (b) | | Excludes $0.00, $0.00, $0.00 $0.00 and $0.00 of PFIC mark to market which is treated as ordinary income for Federal tax purposes for the years 2011, 2010, 2009, 2008 and 2007, respectively. |
| * | | Rates not annualized for periods that are less than a year. |
| ** | | Rates are annualized for periods that are less than a year. |
| ^ | | Amount is less than $0.005 per share. |
Redemption fees represent less than $0.005 per share for all periods.
Note: Net investment income (loss) per share is based on the average shares outstanding during the year.
Performance cited represents past performance. Past performance does not guarantee future results and current performance may be lower or higher than the data quoted. Results shown are annual returns, which assume reinvestment of dividends and capital gains. Investment returns and principal will fluctuate and you may have a gain or loss when you sell shares. For the most current month-end performance information, please call 1-800-742-7272 or visit our Web site at www.williamblairfunds.com.
140 Semi-Annual Report | June 30, 2012 |
Financial Highlights
International Growth Fund
| | | | | | | | | | | | | | | | | | | | | | | | |
| | | Class N | |
| | | Period Ended
June 30, | | | Years Ended December 31, | |
| | | 2012 | | | 2011 | | | 2010 | | | 2009 | | | 2008 | | | 2007 | |
Net asset value, beginning of year | | $ | 18.68 | | | $ | 21.85 | | | $ | 18.55 | | | $ | 13.12 | | | $ | 29.12 | | | $ | 27.70 | |
Income (loss) from investment operations: | | | | | | | | | | | | | | | | | | | | | | | | |
Net investment income (loss) (a) | | | 0.19 | | | | 0.26 | | | | 0.14 | | | | 0.07 | | | | 0.29 | | | | 0.12 | |
Net realized and unrealized gain (loss) on investments | | | 1.24 | | | | (3.43 | ) | | | 3.58 | | | | 5.47 | | | | (15.54 | ) | | | 4.77 | |
| | | | | | | | | | | | | | | | | | | | | | | | |
Total from investment operations | | | 1.43 | | | | (3.17 | ) | | | 3.72 | | | | 5.54 | | | | (15.25 | ) | | | 4.89 | |
Less distributions from: | | | | | | | | | | | | | | | | | | | | | | | | |
Net investment income | | | — | | | | — | | | | 0.42 | | | | 0.11 | | | | — | | | | 0.34 | |
Net realized gain | | | — | | | | — | | | | — | | | | — | | | | 0.75 | | | | 3.13 | |
| | | | | | | | | | | | | | | | | | | | | | | | |
Total distributions | | | — | | | | — | | | | 0.42 | | | | 0.11 | | | | 0.75 | | | | 3.47 | |
| | | | | | | | | | | | | | | | | | | | | | | | |
Net asset value, end of year | | $ | 20.11 | | | $ | 18.68 | | | $ | 21.85 | | | $ | 18.55 | | | $ | 13.12 | | | $ | 29.12 | |
| | | | | | | | | | | | | | | | | | | | | | | | |
Total Return (%) * | | | 7.66 | | | | (14.51 | ) | | | 20.09 | | | | 42.27 | | | | (52.33 | ) | | | 18.13 | |
Ratios to average daily net assets (%): ** | | | | | | | | | | | | | | | | | | | | | | | | |
Expenses, net of waivers and reimbursements | | | 1.45 | | | | 1.45 | | | | 1.43 | | | | 1.45 | | | | 1.39 | | | | 1.40 | |
Expenses, before waivers and reimbursements | | | 1.45 | | | | 1.46 | | | | 1.43 | | | | 1.46 | | | | 1.39 | | | | 1.40 | |
Net investment income (loss), net of waivers and reimbursements | | | 1.91 | | | | 1.22 | | | | 0.73 | | | | 0.48 | | | | 1.29 | | | | 0.38 | |
Net investment income (loss), before waivers and reimbursements | | | 1.91 | | | | 1.21 | | | | 0.73 | | | | 0.47 | | | | 1.29 | | | | 0.38 | |
Net assets at end of year (in thousands) | | $ | 1,185,288 | | | $ | 1,277,534 | | | $ | 2,689,417 | | | $ | 2,539,596 | | | $ | 1,980,750 | | | $ | 5,161,753 | |
Portfolio turnover rate (%)* | | | 42 | | | | 103 | | | | 99 | | | | 121 | | | | 91 | | | | 56 | |
| |
| | | Class I | |
| | | Period Ended
June 30, | | | Years Ended December 31, | |
| | | 2012 | | | 2011 | | | 2010 | | | 2009 | | | 2008 | | | 2007 | |
Net asset value, beginning of year | | $ | 19.10 | | | $ | 22.34 | | | $ | 18.95 | | | $ | 13.40 | | | $ | 29.61 | | | $ | 28.10 | |
Income (loss) from investment operations: | | | | | | | | | | | | | | | | | | | | | | | | |
Net investment income (loss) (a) | | | 0.23 | | | | 0.30 | | | | 0.20 | | | | 0.12 | | | | 0.37 | | | | 0.21 | |
Net realized and unrealized gain (loss) on investments | | | 1.26 | | | | (3.48 | ) | | | 3.67 | | | | 5.59 | | | | (15.83 | ) | | | 4.86 | |
| | | | | | | | | | | | | | | | | | | | | | | | |
Total from investment operations | | | 1.49 | | | | (3.18 | ) | | | 3.87 | | | | 5.71 | | | | (15.46 | ) | | | 5.07 | |
Less distributions from: | | | | | | | | | | | | | | | | | | | | | | | | |
Net investment income | | | — | | | | 0.06 | | | | 0.48 | | | | 0.16 | | | | — | | | | 0.43 | |
Net realized gain | | | — | | | | — | | | | — | | | | — | | | | 0.75 | | | | 3.13 | |
| | | | | | | | | | | | | | | | | | | | | | | | |
Total distributions | | | — | | | | 0.06 | | | | 0.48 | | | | 0.16 | | | | 0.75 | | | | 3.56 | |
| | | | | | | | | | | | | | | | | | | | | | | | |
Net asset value, end of year | | $ | 20.59 | | | $ | 19.10 | | | $ | 22.34 | | | $ | 18.95 | | | $ | 13.40 | | | $ | 29.61 | |
| | | | | | | | | | | | | | | | | | | | | | | | |
Total Return (%) * | | | 7.80 | | | | (14.23 | ) | | | 20.47 | | | | 42.63 | | | | (52.17 | ) | | | 18.53 | |
Ratios to average daily net assets (%): ** | | | | | | | | | | | | | | | | | | | | | | | | |
Expenses | | | 1.16 | | | | 1.15 | | | | 1.14 | | | | 1.17 | | | | 1.08 | | | | 1.09 | |
Net investment income (loss) | | | 2.25 | | | | 1.40 | | | | 0.99 | | | | 0.74 | | | | 1.58 | | | | 0.69 | |
Net assets at end of year (in thousands) | | $ | 2,138,367 | | | $ | 1,951,368 | | | $ | 2,392,762 | | | $ | 1,933,812 | | | $ | 1,150,188 | | | $ | 2,886,901 | |
Portfolio turnover rate (%)* | | | 42 | | | | 103 | | | | 99 | | | | 121 | | | | 91 | | | | 56 | |
| * | | Rates not annualized for periods that are less than a year. |
| ** | | Rates are annualized for periods that are less than a year. |
Redemption fees represent less than $0.005 per share for all periods.
Note: Net investment income (loss) per share is based on the average shares outstanding during the year.
Performance cited represents past performance. Past performance does not guarantee future results and current performance may be lower or higher than the data quoted. Results shown are annual returns, which assume reinvestment of dividends and capital gains. Investment returns and principal will fluctuate and you may have a gain or loss when you sell shares. For the most current month-end performance information, please call 1-800-742-7272 or visit our Web site at www.williamblairfunds.com.
June 30, 2012 | William Blair Funds 141 |
Financial Highlights
International Equity Fund
| | | | | | | | | | | | | | | | | | | | | | | | |
| | | Class N | |
| | | Period Ended
June 30, | | | Years Ended December 31, | |
| | | 2012 | | | 2011 | | | 2010 | | | 2009 | | | 2008 | | | 2007 | |
Net asset value, beginning of year | | $ | 10.56 | | | $ | 12.12 | | | $ | 11.07 | | | $ | 8.35 | | | $ | 16.53 | | | $ | 15.21 | |
Income (loss) from investment operations: | | | | | | | | | | | | | | | | | | | | | | | | |
Net investment income (loss) (a) | | | 0.08 | | | | 0.13 | | | | 0.06 | | | | 0.09 | | | | 0.10 | | | | 0.09 | |
Net realized and unrealized gain (loss) on investments | | | 0.40 | | | | (1.69 | ) | | | 1.15 | | | | 2.64 | | | | (8.16 | ) | | | 2.55 | |
| | | | | | | | | | | | | | | | | | | | | | | | |
Total from investment operations | | | 0.48 | | | | (1.56 | ) | | | 1.21 | | | | 2.73 | | | | (8.06 | ) | | | 2.64 | |
Less distributions from: | | | | | | | | | | | | | | | | | | | | | | | | |
Net investment income | | | — | | | | — | | | | 0.16 | | | | 0.01 | | | | — | | | | 0.14 | |
Net realized gain | | | — | | | | — | | | | — | | | | — | | | | 0.12 | | | | 1.18 | |
| | | | | | | | | | | | | | | | | | | | | | | | |
Total distributions | | | — | | | | — | | | | 0.16 | | | | 0.01 | | | | 0.12 | | | | 1.32 | |
| | | | | | | | | | | | | | | | | | | | | | | | |
Net asset value, end of year | | $ | 11.04 | | | $ | 10.56 | | | $ | 12.12 | | | $ | 11.07 | | | $ | 8.35 | | | $ | 16.53 | |
| | | | | | | | | | | | | | | | | | | | | | | | |
Total Return (%) * | | | 4.55 | | | | (12.87 | ) | | | 10.92 | | | | 32.69 | | | | (48.75 | ) | | | 17.68 | |
Ratios to average daily net assets (%): ** | | | | | | | | | | | | | | | | | | | | | | | | |
Expenses, net of waivers and reimbursements | | | 1.45 | | | | 1.45 | | | | 1.45 | | | | 1.45 | | | | 1.45 | | | | 1.45 | |
Expenses, before waivers and reimbursements | | | 1.74 | | | | 1.60 | | | | 1.66 | | | | 1.59 | | | | 1.45 | | | | 1.47 | |
Net investment income (loss), net of waivers and reimbursements | | | 1.43 | | | | 1.09 | | | | 0.55 | | | | 1.03 | | | | 0.80 | | | | 0.52 | |
Net investment income (loss, before waivers and reimbursements) | | | 1.14 | | | | 0.94 | | | | 0.34 | | | | 0.89 | | | | 0.80 | | | | 0.50 | |
Net assets at end of year (in thousands) | | $ | 6,228 | | | $ | 6,773 | | | $ | 13,733 | | | $ | 15,436 | | | $ | 42,824 | | | $ | 60,058 | |
Portfolio turnover rate (%)* | | | 46 | | | | 99 | | | | 71 | | | | 88 | | | | 92 | | | | 70 | |
| |
| | | Class I | |
| | | Period Ended
June 30, | | | Years Ended December 31, | |
| | | 2012 | | | 2011 | | | 2010 | | | 2009 | | | 2008 | | | 2007 | |
Net asset value, beginning of year | | $ | 10.67 | | | $ | 12.22 | | | $ | 11.16 | | | $ | 8.44 | | | $ | 16.66 | | | $ | 15.31 | |
Income (loss) from investment operations: | | | | | | | | | | | | | | | | | | | | | | | | |
Net investment income (loss) (a) | | | 0.09 | | | | 0.17 | | | | 0.10 | | | | 0.08 | | | | 0.15 | | | | 0.13 | |
Net realized and unrealized gain (loss) on investments | | | 0.41 | | | | (1.72 | ) | | | 1.15 | | | | 2.70 | | | | (8.25 | ) | | | 2.57 | |
| | | | | | | | | | | | | | | | | | | | | | | | |
Total from investment operations | | | 0.50 | | | | (1.55 | ) | | | 1.25 | | | | 2.78 | | | | (8.10 | ) | | | 2.70 | |
Less distributions from: | | | | | | | | | | | | | | | | | | | | | | | | |
Net investment income | | | — | | | | — | | | | 0.19 | | | | 0.06 | | | | — | | | | 0.17 | |
Net realized gain | | | — | | | | — | | | | — | | | | — | | | | 0.12 | | | | 1.18 | |
| | | | | | | | | | | | | | | | | | | | | | | | |
Total distributions | | | — | | | | — | | | | 0.19 | | | | 0.06 | | | | 0.12 | | | | 1.35 | |
| | | | | | | | | | | | | | | | | | | | | | | | |
Net asset value, end of year | | $ | 11.17 | | | $ | 10.67 | | | $ | 12.22 | | | $ | 11.16 | | | $ | 8.44 | | | $ | 16.66 | |
| | | | | | | | | | | | | | | | | | | | | | | | |
Total Return (%) * | | | 4.69 | | | | (12.68 | ) | | | 11.19 | | | | 32.93 | | | | (48.61 | ) | | | 17.97 | |
Ratios to average daily net assets (%): ** | | | | | | | | | | | | | | | | | | | | | | | | |
Expenses, net of waivers and reimbursements | | | 1.20 | | | | 1.20 | | | | 1.20 | | | | 1.20 | | | | 1.20 | | | | 1.20 | |
Expenses, before waivers and reimbursements | | | 1.45 | | | | 1.33 | | | | 1.28 | | | | 1.39 | | | | 1.22 | | | | 1.25 | |
Net investment income (loss), net of waivers and reimbursements | | | 1.67 | | | | 1.43 | | | | 0.88 | | | | 0.86 | | | | 1.12 | | | | 0.76 | |
Net investment income (loss), before waivers and reimbursements | | | 1.42 | | | | 1.30 | | | | 0.80 | | | | 0.67 | | | | 1.10 | | | | 0.71 | |
Net assets at end of year (in thousands) | | $ | 62,535 | | | $ | 68,884 | | | $ | 164,322 | | | $ | 282,732 | | | $ | 185,662 | | | $ | 348,551 | |
Portfolio turnover rate (%)* | | | 46 | | | | 99 | | | | 71 | | | | 88 | | | | 92 | | | | 70 | |
| (a) | | Excludes $0.00, $0.04, $0.00, $0.00, and $(0.07) of PFIC mark to market which is treated as ordinary income for Federal tax purposes for the years 2011, 2010, 2009, 2008, and 2007 respectively. |
| * | | Rates not annualized for periods that are less than a year. |
| ** | | Rates are annualized for periods that are less than a year. |
Redemption fees represent less than $0.005 per share for all periods.
Note: Net investment income (loss) per share is based on the average shares outstanding during the year.
Performance cited represents past performance. Past performance does not guarantee future results and current performance may be lower or higher than the data quoted. Results shown are annual returns, which assume reinvestment of dividends and capital gains. Investment returns and principal will fluctuate and you may have a gain or loss when you sell shares. For the most current month-end performance information, please call 1-800-742-7272 or visit our Web site at www.williamblairfunds.com.
142 Semi-Annual Report | June 30, 2012 |
Financial Highlights
International Small Cap Growth Fund
| | | | | | | | | | | | | | | | | | | | | | | | |
| | | Class N | |
| | | Period Ended
June 30, | | | Years Ended December 31, | |
| | | 2012 | | | 2011 | | | 2010 | | | 2009 | | | 2008 | | | 2007 | |
Net asset value, beginning of year | | $ | 11.36 | | | $ | 13.07 | | | $ | 10.40 | | | $ | 6.62 | | | $ | 13.98 | | | $ | 13.37 | |
Income (loss) from investment operations: | | | | | | | | | | | | | | | | | | | | | | | | |
Net investment income (loss) (a) | | | 0.06 | | | | 0.07 | | | | 0.03 | | | | (0.01 | ) | | | (0.02 | ) | | | (0.02 | ) |
Net realized and unrealized gain (loss) on investments | | | 0.64 | | | | (1.66 | ) | | | 2.66 | | | | 3.79 | | | | (7.22 | ) | | | 1.72 | |
| | | | | | | | | | | | | | | | | | | | | | | | |
Total from investment operations | | | 0.70 | | | | (1.59 | ) | | | 2.69 | | | | 3.78 | | | | (7.24 | ) | | | 1.70 | |
Less distributions from: | | | | | | | | | | | | | | | | | | | | | | | | |
Net investment income | | | — | | | | 0.12 | | | | 0.02 | | | | — | | | | — | | | | 0.05 | |
Net realized gain | | | — | | | | — | | | | — | | | | — | | | | 0.12 | | | | 1.04 | |
| | | | | | | | | | | | | | | | | | | | | | | | |
Total distributions | | | — | | | | 0.12 | | | | 0.02 | | | | — | | | | 0.12 | | | | 1.09 | |
| | | | | | | | | | | | | | | | | | | | | | | | |
Net asset value, end of year | | $ | 12.06 | | | $ | 11.36 | | | $ | 13.07 | | | $ | 10.40 | | | $ | 6.62 | | | $ | 13.98 | |
| | | | | | | | | | | | | | | | | | | | | | | | |
Total Return (%) * | | | 6.16 | | | | (12.16 | ) | | | 25.88 | | | | 57.10 | | | | (51.82 | ) | | | 13.06 | |
Ratios to average daily net assets (%): ** | | | | | | | | | | | | | | | | | | | | | | | | |
Expenses, net of waivers and reimbursements | | | 1.63 | | | | 1.64 | | | | 1.55 | | | | 1.65 | | | | 1.65 | | | | 1.60 | |
Expenses, before waivers and reimbursements | | | 1.63 | | | | 1.64 | | | | 1.55 | | | | 1.83 | | | | 1.62 | | | | 1.60 | |
Net investment income (loss), net of waivers and reimbursements | | | 0.95 | | | | 0.55 | | | | 0.30 | | | | (0.16 | ) | | | (0.20 | ) | | | (0.16 | ) |
Net investment income (loss), before waivers and reimbursements | | | 0.95 | | | | 0.55 | | | | 0.30 | | | | (0.34 | ) | | | (0.17 | ) | | | (0.16 | ) |
Net assets at end of year (in thousands) | | $ | 14,814 | | | $ | 18,991 | | | $ | 21,916 | | | $ | 14,854 | | | $ | 11,363 | | | $ | 21,905 | |
Portfolio turnover rate (%)* | | | 36 | | | | 85 | | | | 85 | | | | 136 | | | | 78 | | | | 88 | |
| |
| | | Class I | |
| | | Period Ended
June 30, | | | Years Ended December 31, | |
| | | 2012 | | | 2011 | | | 2010 | | | 2009 | | | 2008 | | | 2007 | |
Net asset value, beginning of year | | $ | 11.46 | | | $ | 13.19 | | | $ | 10.49 | | | $ | 6.67 | | | $ | 14.01 | | | $ | 13.41 | |
Income (loss) from investment operations: | | | | | | | | | | | | | | | | | | | | | | | | |
Net investment income (loss) (a) | | | 0.08 | | | | 0.12 | | | | 0.07 | | | | 0.01 | | | | 0.01 | | | | 0.03 | |
Net realized and unrealized gain (loss) on investments | | | 0.64 | | | | (1.69 | ) | | | 2.68 | | | | 3.83 | | | | (7.23 | ) | | | 1.71 | |
| | | | | | | | | | | | | | | | | | | | | | | | |
Total from investment operations | | | 0.72 | | | | (1.57 | ) | | | 2.75 | | | | 3.84 | | | | (7.22 | ) | | | 1.74 | |
Less distributions from: | | | | | | | | | | | | | | | | | | | | | | | | |
Net investment income | | | — | | | | 0.16 | | | | 0.05 | | | | 0.02 | | | | — | | | | 0.10 | |
Net realized gain | | | — | | | | — | | | | — | | | | — | | | | 0.12 | | | | 1.04 | |
| | | | | | | | | | | | | | | | | | | | | | | | |
Total distributions | | | — | | | | 0.16 | | | | 0.05 | | | | 0.02 | | | | 0.12 | | | | 1.14 | |
| | | | | | | | | | | | | | | | | | | | | | | | |
Net asset value, end of year | | $ | 12.18 | | | $ | 11.46 | | | $ | 13.19 | | | $ | 10.49 | | | $ | 6.67 | | | $ | 14.01 | |
| | | | | | | | | | | | | | | | | | | | | | | | |
Total Return (%) * | | | 6.28 | | | | (11.84 | ) | | | 26.24 | | | | 57.51 | | | | (51.56 | ) | | | 13.34 | |
Ratios to average daily net assets (%): ** | | | | | | | | | | | | | | | | | | | | | | | | |
Expenses, net of waivers and reimbursements | | | 1.29 | | | | 1.28 | | | | 1.25 | | | | 1.31 | | | | 1.31 | | | | 1.29 | |
Expenses, before waivers and reimbursements | | | 1.29 | | | | 1.28 | | | | 1.25 | | | | 1.31 | | | | 1.28 | | | | 1.29 | |
Net investment income (loss), net of waivers and reimbursements | | | 1.29 | | | | 0.92 | | | | 0.61 | | | | 0.11 | | | | 0.11 | | | | 0.18 | |
Net investment income (loss), before waivers and reimbursements | | | 1.29 | | | | 0.92 | | | | 0.61 | | | | 0.11 | | | | 0.14 | | | | 0.18 | |
Net assets at end of year (in thousands) | | $ | 337,714 | | | $ | 364,574 | | | $ | 349,679 | | | $ | 210,561 | | | $ | 89,452 | | | $ | 148,839 | |
Portfolio turnover rate (%)* | | | 36 | | | | 85 | | | | 85 | | | | 136 | | | | 78 | | | | 88 | |
| (a) | | Excludes $0.00, $0.15, $0.01, $(0.02), and $0.05 of PFIC mark to market which is treated as ordinary income for Federal tax purposes for the years 2011, 2010, 2009, 2008, and 2007 respectively. |
| * | | Rates not annualized for periods that are less than a year. |
| ** | | Rates are annualized for periods that are less than a year. |
Redemption fees represent less than $0.005 per share for all periods.
Note: Net investment income (loss) per share is based on the average shares outstanding during the year.
Performance cited represents past performance. Past performance does not guarantee future results and current performance may be lower or higher than the data quoted. Results shown are annual returns, which assume reinvestment of dividends and capital gains. Investment returns and principal will fluctuate and you may have a gain or loss when you sell shares. For the most current month-end performance information, please call 1-800-742-7272 or visit our Web site at www.williamblairfunds.com.
June 30, 2012 | William Blair Funds 143 |
Financial Highlights
Emerging Markets Growth Fund
| | | | | | | | | | | | | | | | | | | | | | | | |
| | | Class N | |
| | | Period Ended
June 30, | | | Years Ended December 31, | |
| | | 2012 | | | 2011 | | | 2010 | | | 2009 | | | 2008 | | | 2007 | |
Net asset value, beginning of year | | $ | 11.16 | | | $ | 15.76 | | | $ | 12.87 | | | $ | 7.46 | | | $ | 21.92 | | | $ | 19.42 | |
Income (loss) from investment operations: | | | | | | | | | | | | | | | | | | | | | | | | |
Net investment income (loss) (a) | | | 0.06 | | | | 0.07 | | | | (0.01 | ) | | | 0.00 | ^ | | | 0.11 | | | | (0.10 | ) |
Net realized and unrealized gain (loss) on investments | | | 0.73 | | | | (2.84 | ) | | | 3.02 | | | | 5.51 | | | | (13.63 | ) | | | 7.23 | |
| | | | | | | | | | | | | | | | | | | | | | | | |
Total from investment operations | | | 0.79 | | | | (2.77 | ) | | | 3.01 | | | | 5.51 | | | | (13.52 | ) | | | 7.13 | |
Less distributions from: | | | | | | | | | | | | | | | | | | | | | | | | |
Net investment income | | | — | | | | — | | | | 0.12 | | | | 0.10 | | | | — | | | | 0.09 | |
Net realized gain | | | — | | | | 1.83 | | | | — | | | | — | | | | 0.94 | | | | 4.54 | |
| | | | | | | | | | | | | | | | | | | | | | | | |
Total distributions | | | — | | | | 1.83 | | | | 0.12 | | | �� | 0.10 | | | | 0.94 | | | | 4.63 | |
| | | | | | | | | | | | | | | | | | | | | | | | |
Net asset value, end of year | | $ | 11.95 | | | $ | 11.16 | | | $ | 15.76 | | | $ | 12.87 | | | $ | 7.46 | | | $ | 21.92 | |
| | | | | | | | | | | | | | | | | | | | | | | | |
Total Return (%) * | | | 7.08 | | | | (17.29 | ) | | | 23.44 | | | | 73.85 | | | | (61.71 | ) | | | 37.75 | |
Ratios to average daily net assets (%): ** | | | | | | | | | | | | | | | | | | | | | | | | |
Expenses, net of waivers and reimbursements | | | 1.69 | | | | 1.68 | | | | 1.63 | | | | 1.70 | | | | 1.67 | | | | 1.65 | |
Expenses, before waivers and reimbursements | | | 1.69 | | | | 1.68 | | | | 1.63 | | | | 1.81 | | | | 1.65 | | | | 1.69 | |
Net investment income (loss), net of waivers and reimbursements | | | 0.98 | | | | 0.48 | | | | (0.05 | ) | | | 0.04 | | | | 0.65 | | | | (0.45 | ) |
Net investment income (loss), before waivers and reimbursements | | | 0.98 | | | | 0.48 | | | | (0.05 | ) | | | (0.07 | ) | | | 0.67 | | | | (0.49 | ) |
Net assets at end of year (in thousands) | | $ | 16,542 | | | $ | 17,474 | | | $ | 34,324 | | | $ | 27,271 | | | $ | 16,486 | | | $ | 76,413 | |
Portfolio turnover rate (%)* | | | 50 | | | | 104 | | | | 121 | | | | 113 | | | | 118 | | | | 100 | |
| |
| | | Class I | |
| | | Period Ended
June 30, | | | Years Ended December 31, | |
| | | 2012 | | | 2011 | | | 2010 | | | 2009 | | | 2008 | | | 2007 | |
Net asset value, beginning of year | | $ | 11.25 | | | $ | 15.87 | | | $ | 12.95 | | | $ | 7.51 | | | $ | 21.99 | | | $ | 19.47 | |
Income (loss) from investment operations: | | | | | | | | | | | | | | | | | | | | | | | | |
Net investment income (loss) (a) | | | 0.08 | | | | 0.11 | | | | 0.04 | | | | 0.03 | | | | 0.15 | | | | (0.04 | ) |
Net realized and unrealized gain (loss) on investments | | | 0.74 | | | | (2.85 | ) | | | 3.03 | | | | 5.54 | | | | (13.69 | ) | | | 7.26 | |
| | | | | | | | | | | | | | | | | | | | | | | | |
Total from investment operations | | | 0.82 | | | | (2.74 | ) | | | 3.07 | | | | 5.57 | | | | (13.54 | ) | | | 7.22 | |
Less distributions from: | | | | | | | | | | | | | | | | | | | | | | | | |
Net investment income | | | — | | | | 0.05 | | | | 0.15 | | | | 0.13 | | | | — | | | | 0.16 | |
Net realized gain | | | — | | | | 1.83 | | | | — | | | | — | | | | 0.94 | | | | 4.54 | |
| | | | | | | | | | | | | | | | | | | | | | | | |
Total distributions | | | — | | | | 1.88 | | | | 0.15 | | | | 0.13 | | | | 0.94 | | | | 4.70 | |
| | | | | | | | | | | | | | | | | | | | | | | | |
Net asset value, end of year | | $ | 12.07 | | | $ | 11.25 | | | $ | 15.87 | | | $ | 12.95 | | | $ | 7.51 | | | $ | 21.99 | |
| | | | | | | | | | | | | | | | | | | | | | | | |
Total Return (%) * | | | 7.29 | | | | (17.00 | ) | | | 23.77 | | | | 74.18 | | | | (61.60 | ) | | | 38.13 | |
Ratios to average daily net assets (%): ** | | | | | | | | | | | | | | | | | | | | | | | | |
Expenses, net of waivers and reimbursements | | | 1.39 | | | | 1.38 | | | | 1.36 | | | | 1.41 | | | | 1.41 | | | | 1.40 | |
Expenses, before waivers and reimbursements | | | 1.39 | | | | 1.38 | | | | 1.36 | | | | 1.41 | | | | 1.39 | | | | 1.40 | |
Net investment income (loss), net of waivers and reimbursements | | | 1.31 | | | | 0.77 | | | | 0.26 | | | | 0.31 | | | | 0.91 | | | | (0.20 | ) |
Net investment income (loss), before waivers and reimbursements | | | 1.31 | | | | 0.77 | | | | 0.26 | | | | 0.31 | | | | 0.93 | | | | (0.20 | ) |
Net assets at end of year (in thousands) | | $ | 133,655 | | | $ | 124,739 | | | $ | 194,763 | | | $ | 180,329 | | | $ | 69,363 | | | $ | 280,370 | |
Portfolio turnover rate (%)* | | | 50 | | | | 104 | | | | 121 | | | | 113 | | | | 118 | | | | 100 | |
| (a) | | Excludes $0.00, $0.11, $0.15, $(0.09), and $0.21 of PFIC mark to market which is treated as ordinary income for Federal tax purposes for the years 2011, 2010, 2009, 2008, and 2007 respectively. |
| * | | Rates not annualized for periods that are less than a year. |
| ** | | Rates are annualized for periods that are less than a year. |
| ^ | | Amount is less than $0.005 per share. |
Redemption fees represent less than $0.005 per share for all periods.
Note: Net investment income (loss) per share is based on the average shares outstanding during the year.
Performance cited represents past performance. Past performance does not guarantee future results and current performance may be lower or higher than the data quoted. Results shown are annual returns, which assume reinvestment of dividends and capital gains. Investment returns and principal will fluctuate and you may have a gain or loss when you sell shares. For the most current month-end performance information, please call 1-800-742-7272 or visit our Web site at www.williamblairfunds.com.
144 Semi-Annual Report | June 30, 2012 |
Financial Highlights
Emerging Leaders Growth Fund
| | | | | | | | | | | | |
| | | Class N | |
| | | Period Ended
June 30, | | | Periods Ended
December 31, | |
| | | 2012 | | | 2011 | | | 2010(a) | |
Net asset value, beginning of period | | $ | 7.68 | | | $ | 10.34 | | | $ | 8.80 | |
Income (loss) from investment operations: | | | | | | | | | | | | |
Net investment income (loss) (c) | | | 0.04 | | | | 0.04 | | | | (0.02 | ) |
Net realized and unrealized gain (loss) on investments | | | 0.49 | | | | (2.08 | ) | | | 1.64 | |
| | | | | | | | | | | | |
Total from investment operations | | | 0.53 | | | | (2.04 | ) | | | 1.62 | |
Less distributions from: | | | | | | | | | | | | |
Net investment income | | | — | | | | — | | | | 0.02 | |
Net realized gain | | | — | | | | 0.62 | | | | 0.06 | |
| | | | | | | | | | | | |
Total distributions | | | — | | | | 0.62 | | | | 0.08 | |
| | | | | | | | | | | | |
Net asset value, end of period | | $ | 8.21 | | | $ | 7.68 | | | $ | 10.34 | |
| | | | | | | | | | | | |
Total Return (%)* | | | 6.90 | | | | (19.55 | ) | | | 18.43 | |
Ratios to average daily net assets (%):** | | | | | | | | | | | | |
Expenses, net of waivers and reimbursements | | | 1.65 | | | | 1.65 | | | | 1.65 | |
Expenses, before waivers and reimbursements | | | 2.10 | | | | 1.83 | | | | 1.71 | |
Net investment income (loss), net of waivers and reimbursements | | | 1.02 | | | | 0.44 | | | | (0.38 | ) |
Net investment income (loss), before waivers and reimbursements | | | 0.57 | | | | 0.26 | | | | (0.44 | ) |
Net assets at end of year (in thousands) | | $ | 154 | | | $ | 46 | | | $ | 53 | |
Portfolio turnover rate (%)* | | | 52 | | | | 142 | | | | 176 | |
| | | | | | | | | | | | | | | | | | | | |
| | | Class I | |
| | | Period Ended
June 30, | | | Periods Ended December 31, | |
| | | 2012 | | | 2011 | | | 2010 | | | 2009 | | | 2008(b) | |
Net asset value, beginning of period | | $ | 7.66 | | | $ | 10.35 | | | $ | 8.43 | | | $ | 4.79 | | | $ | 10.00 | |
Income (loss) from investment operations: | | | | | | | | | | | | | | | | | | | | |
Net investment income (loss) (c) | | | 0.06 | | | | 0.06 | | | | 0.02 | | | | 0.02 | | | | 0.04 | |
Net realized and unrealized gain (loss) on investments | | | 0.47 | | | | (2.08 | ) | | | 1.98 | | | | 3.73 | | | | (5.25 | ) |
| | | | | | | | | | | | | | | | | | | | |
Total from investment operations | | | 0.53 | | | | (2.02 | ) | | | 2.00 | | | | 3.75 | | | | (5.21 | ) |
Less distributions from: | | | | | | | | | | | | | | | | | | | | |
Net investment income | | | — | | | | 0.05 | | | | 0.02 | | | | 0.11 | | | | 0.00 | ^ |
Net realized gain | | | — | | | | 0.62 | | | | 0.06 | | | | — | | | | — | |
Return of capital | | | — | | | | 0.00 | ^ | | | — | | | | — | | | | — | |
| | | | | | | | | | | | | | | | | | | | |
Total distributions | | | — | | | | 0.67 | | | | 0.08 | | | | 0.11 | | | | 0.00^ | |
| | | | | | | | | | | | | | | | | | | | |
Net asset value, end of period | | $ | 8.19 | | | $ | 7.66 | | | $ | 10.35 | | | $ | 8.43 | | | $ | 4.79 | |
| | | | | | | | | | | | | | | | | | | | |
Total Return (%)* | | | 6.92 | | | | (19.34 | ) | | | 23.70 | | | | 78.38 | | | | (52.09 | ) |
Ratios to average daily net assets (%):** | | | | | | | | | | | | | | | | | | | | |
Expenses, net of waivers and reimbursements | | | 1.40 | | | | 1.40 | | | | 1.40 | | | | 1.40 | | | | 1.40 | |
Expenses, before waivers and reimbursements | | | 1.78 | | | | 1.58 | | | | 1.52 | | | | 1.54 | | | | 1.56 | |
Net investment income (loss), net of waivers and reimbursements | | | 1.36 | | | | 0.69 | | | | 0.25 | | | | 0.37 | | | | 0.70 | |
Net investment income (loss), before waivers and reimbursements | | | 0.98 | | | | 0.51 | | | | 0.13 | | | | 0.23 | | | | 0.54 | |
Net assets at end of year (in thousands) | | $ | 23,769 | | | $ | 21,610 | | | $ | 16,332 | | | $ | 8,823 | | | $ | 2,914 | |
Portfolio turnover rate (%)* | | | 52 | | | | 142 | | | | 176 | | | | 176 | | | | 151 | |
| (a) | | For the period May 3, 2010 (Commencement of Operations) to December 31, 2010. |
| (b) | | For the period March 26, 2008 (Commencement of Operations) to December 31, 2008. |
| (c) | | Excludes $0.00, $0.96, $1.29, and $0.00 of PFIC mark to market which is treated as ordinary income for Federal tax purposes for the years 2011, 2010, 2009, and 2008 respectively. |
| * | | Rates not annualized for periods that are less than a year. |
| ** | | Rates are annualized for periods that are less than a year. |
| ^ | | Amount is less than $0.005 per share. |
Redemption fees represent less than $0.005 per share for all periods.
Note: Net investment income (loss) per share is based on the average shares outstanding during the year.
Performance cited represents past performance. Past performance does not guarantee future results and current performance may be lower or higher than the data quoted. Results shown are annual returns, which assume reinvestment of dividends and capital gains. Investment returns and principal will fluctuate and you may have a gain or loss when you sell shares. For the most current month-end performance information, please call 1-800-742-7272 or visit our Web site at www.williamblairfunds.com.
June 30, 2012 | William Blair Funds 145 |
Financial Highlights
Emerging Markets Small Cap Growth Fund
| | | | | | | | |
| | | Class N | |
| | | Period Ended
June 30, | | | Period Ended
December 31, | |
| | | 2012 | | | 2011(a) | |
Net asset value, beginning of period | | $ | 9.73 | | | $ | 10.00 | |
Income (loss) from investment operations: | | | | | | | | |
Net investment income (loss) (b) | | | 0.08 | | | | 0.00 | ^ |
Net realized and unrealized gain (loss) on investments | | | 1.31 | | | | (0.27 | ) |
| | | | | | | | |
Total from investment operations | | | 1.39 | | | | (0.27 | ) |
Less distributions from: | | | | | | | | |
Net investment income | | | — | | | | — | |
Net realized gain | | | — | | | | — | |
| | | | | | | | |
Total distributions | | | — | | | | — | |
| | | | | | | | |
Net asset value, end of period | | $ | 11.12 | | | $ | 9.73 | |
| | | | | | | | |
Total Return (%)* | | | 14.29 | | | | (2.70 | ) |
Ratios to average daily net assets (%):** | | | | | | | | |
Expenses, net of waivers and reimbursements | | | 1.65 | | | | 1.65 | |
Expenses, before waivers and reimbursements | | | 3.92 | | | | 9.53 | |
Net investment income (loss), net of waivers and reimbursements | | | 1.47 | | | | 0.08 | |
Net investment income (loss), before waivers and reimbursements | | | (0.80 | ) | | | (7.80 | ) |
Net assets at end of year (in thousands) | | $ | 2,293 | | | $ | 1,012 | |
Portfolio turnover rate (%)* | | | 27 | | | | 17 | |
| |
| | | Class I | |
| | | Period Ended
June 30, | | | Period Ended
December 31, | |
| | | 2012 | | | 2011(a) | |
Net asset value, beginning of period | | $ | 9.73 | | | $ | 10.00 | |
Income (loss) from investment operations: | | | | | | | | |
Net investment income (loss) (b) | | | 0.08 | | | | 0.01 | |
Net realized and unrealized gain (loss) on investments | | | 1.33 | | | | (0.28 | ) |
| | | | | | | | |
Total from investment operations | | | 1.41 | | | | (0.27 | ) |
Less distributions from: | | | | | | | | |
Net investment income | | | — | | | | — | |
Net realized gain | | | — | | | | — | |
| | | | | | | | |
Total distributions | | | — | | | | — | |
| | | | | | | | |
Net asset value, end of period | | $ | 11.14 | | | $ | 9.73 | |
| | | | | | | | |
Total Return (%)* | | | 14.49 | | | | (2.70 | ) |
Ratios to average daily net assets (%):** | | | | | | | | |
Expenses, net of waivers and reimbursements | | | 1.40 | | | | 1.40 | |
Expenses, before waivers and reimbursements | | | 3.65 | | | | 9.28 | |
Net investment income (loss), net of waivers and reimbursements | | | 1.49 | | | | 0.33 | |
Net investment income (loss), before waivers and reimbursements | | | (0.76 | ) | | | (7.55 | ) |
Net assets at end of year (in thousands) | | $ | 4,408 | | | $ | 2,260 | |
Portfolio turnover rate (%)* | | | 27 | | | | 17 | |
| (a) | | For the period October 24, 2011 (Commencement of Operations) to December 31, 2011. |
| (b) | | Excludes $0.00, of PFIC mark to market which is treated as ordinary income for Federal tax purposes for the year 2011 |
| * | | Rates not annualized for periods that are less than a year. |
| ** | | Rates are annualized for periods that are less than a year. |
| ^ | | Amount is less than $0.005 per share. |
Redemption fees represent less than $0.005 per share for all periods.
Note: Net investment income (loss) per share is based on the average shares outstanding during the year.
Performance cited represents past performance. Past performance does not guarantee future results and current performance may be lower or higher than the data quoted. Results shown are annual returns, which assume reinvestment of dividends and capital gains. Investment returns and principal will fluctuate and you may have a gain or loss when you sell shares. For the most current month-end performance information, please call 1-800-742-7272 or visit our Web site at www.williamblairfunds.com.
146 Semi-Annual Report | June 30, 2012 |
Financial Highlights
Large Cap Value Fund
| | | | | | | | |
| | | Class N | |
| | | Period Ended
June 30, | | | Period Ended
December 31, | |
| | | 2012 | | | 2011(a) | |
Net asset value, beginning of period | | $ | 9.95 | | | $ | 10.00 | |
Income (loss) from investment operations: | | | | | | | | |
Net investment income (loss) | | | 0.05 | | | | 0.03 | |
Net realized and unrealized gain (loss) on investments | | | 0.86 | | | | (0.05 | ) |
| | | | | | | | |
Total from investment operations | | | 0.91 | | | | (0.02 | ) |
Less distributions from: | | | | | | | | |
Net investment income | | | — | | | | 0.03 | |
Net realized gain | | | — | | | | 0.00 | ^ |
| | | | | | | | |
Total distributions | | | — | | | | 0.03 | |
| | | | | | | | |
Net asset value, end of period | | $ | 10.86 | | | $ | 9.95 | |
| | | | | | | | |
Total Return (%)* | | | 9.15 | | | | (0.19 | ) |
Ratios to average daily net assets (%):** | | | | | | | | |
Expenses, net of waivers and reimbursements | | | 1.20 | | | | 1.20 | |
Expenses, before waivers and reimbursements | | | 3.38 | | | | 7.83 | |
Net investment income (loss), net of waivers and reimbursements | | | 0.89 | | | | 1.41 | |
Net investment income (loss), before waivers and reimbursements | | | (1.29 | ) | | | (5.22 | ) |
Net assets at end of year (in thousands) | | $ | 1,257 | | | $ | 998 | |
Portfolio turnover rate (%)* | | | 15 | | | | 5 | |
| |
| | | Class I | |
| | | Period Ended
June 30, | | | Period Ended
December 31, | |
| | | 2012 | | | 2011(a) | |
Net asset value, beginning of period | | $ | 9.95 | | | $ | 10.00 | |
Income (loss) from investment operations: | | | | | | | | |
Net investment income (loss) | | | 0.06 | | | | 0.03 | |
Net realized and unrealized gain (loss) on investments | | | 0.87 | | | | (0.05 | ) |
| | | | | | | | |
Total from investment operations | | | 0.93 | | | | (0.02 | ) |
Less distributions from: | | | | | | | | |
Net investment income | | | — | | | | 0.03 | |
Net realized gain | | | — | | | | 0.00 | ^ |
| | | | | | | | |
Total distributions | | | — | | | | 0.03 | |
| | | | | | | | |
Net asset value, end of period | | $ | 10.88 | | | $ | 9.95 | |
| | | | | | | | |
Total Return (%)* | | | 9.35 | | | | (0.19 | ) |
Ratios to average daily net assets (%):** | | | | | | | | |
Expenses, net of waivers and reimbursements | | | 0.95 | | | | 0.95 | |
Expenses, before waivers and reimbursements | | | 3.14 | | | | 7.58 | |
Net investment income (loss), net of waivers and reimbursements | | | 1.15 | | | | 1.66 | |
Net investment income (loss), before waivers and reimbursements | | | (1.04 | ) | | | (4.97 | ) |
Net assets at end of year (in thousands) | | $ | 1,955 | | | $ | 1,455 | |
Portfolio turnover rate (%)* | | | 15 | | | | 5 | |
| (a) | | For the period October 24, 2011 (Commencement of Operations) to December 31, 2011. |
| * | | Rates not annualized for periods that are less than a year. |
| ** | | Rates are annualized for periods that are less than a year. |
| ^ | | Amount is less than $0.005 per share. |
Redemption fees represent less than $0.005 per share for all periods.
Note: Net investment income (loss) per share is based on the average shares outstanding during the year.
Performance cited represents past performance. Past performance does not guarantee future results and current performance may be lower or higher than the data quoted. Results shown are annual returns, which assume reinvestment of dividends and capital gains. Investment returns and principal will fluctuate and you may have a gain or loss when you sell shares. For the most current month-end performance information, please call 1-800-742-7272 or visit our Web site at www.williamblairfunds.com.
June 30, 2012 | William Blair Funds 147 |
Financial Highlights
Small Cap Value Fund
| | | | | | | | | | | | | | | | | | | | | | | | |
| | | Class N | |
| | | Period Ended
June 30, | | | Years Ended December 31, | |
| | | 2012 | | | 2011 | | | 2010 | | | 2009 | | | 2008 | | | 2007 | |
Net asset value, beginning of year | | $ | 12.26 | | | $ | 13.71 | | | $ | 10.49 | | | $ | 8.33 | | | $ | 11.31 | | | $ | 16.27 | |
Income (loss) from investment operations: | | | | | | | | | | | | | | | | | | | | | | | | |
Net investment income (loss) | | | 0.10 | | | | 0.00 | ^ | | | 0.03 | | | | 0.06 | | | | 0.09 | | | | 0.02 | |
Net realized and unrealized gain (loss) on investments | | | 0.57 | | | | (0.97 | ) | | | 3.22 | | | | 2.13 | | | | (3.02 | ) | | | (0.96 | ) |
| | | | | | | | | | | | | | | | | | | | | | | | |
Total from investment operations | | | 0.67 | | | | (0.97 | ) | | | 3.25 | | | | 2.19 | | | | (2.93 | ) | | | (0.94 | ) |
Less distributions from: | | | | | | | | | | | | | | | | | | | | | | | | |
Net investment income | | | — | | | | 0.02 | | | | 0.03 | | | | 0.03 | | | | 0.05 | | | | — | |
Net realized gain | | | — | | | | 0.46 | | | | — | | | | — | | | | — | | | | 4.02 | |
Return of capital | | | — | | | | 0.00 | ^ | | | — | | | | — | | | | — | | | | — | |
| | | | | | | | | | | | | | | | | | | | | | | | |
Total distributions | | | — | | | | 0.48 | | | | 0.03 | | | | 0.03 | | | | 0.05 | | | | 4.02 | |
| | | | | | | | | | | | | | | | | | | | | | | | |
Net asset value, end of year | | $ | 12.93 | | | $ | 12.26 | | | $ | 13.71 | | | $ | 10.49 | | | $ | 8.33 | | | $ | 11.31 | |
| | | | | | | | | | | | | | | | | | | | | | | | |
Total Return (%)* | | | 5.46 | | | | (6.95 | ) | | | 30.94 | | | | 26.24 | | | | (25.85 | ) | | | (5.54 | ) |
Ratios to average daily net assets (%):** | | | | | | | | | | | | | | | | | | | | | | | | |
Expenses, net of waivers and reimbursements | | | 1.41 | | | | 1.38 | | | | 1.33 | | | | 1.29 | | | | 1.29 | | | | 1.33 | |
Expenses, before waivers and reimbursements | | | 1.59 | | | | 1.60 | | | | 1.57 | | | | 1.78 | | | | 1.82 | | | | 1.66 | |
Net investment income (loss), net of waivers and reimbursements | | | 1.59 | | | | (0.01 | ) | | | 0.25 | | | | 0.68 | | | | 0.84 | | | | 0.10 | |
Net investment income (loss), before waivers and reimbursements | | | 1.41 | | | | (0.23 | ) | | | 0.01 | | | | 0.19 | | | | 0.31 | | | | (0.23 | ) |
Net assets at end of year (in thousands) | | $ | 42,463 | | | $ | 40,712 | | | $ | 34,285 | | | $ | 7,745 | | | $ | 7,061 | | | $ | 11,791 | |
Portfolio turnover rate (%)* | | | 28 | | | | 65 | | | | 71 | | | | 62 | | | | 87 | | | | 102 | |
| |
| | | Class I | |
| | | Period Ended
June 30, | | | Years Ended December 31, | |
| | | 2012 | | | 2011 | | | 2010 | | | 2009 | | | 2008 | | | 2007 | |
Net asset value, beginning of year | | $ | 12.47 | | | $ | 13.93 | | | $ | 10.65 | | | $ | 8.45 | | | $ | 11.50 | | | $ | 16.51 | |
Income (loss) from investment operations: | | | | | | | | | | | | | | | | | | | | | | | | |
Net investment income (loss) | | | 0.12 | | | | 0.03 | | | | 0.05 | | | | 0.08 | | | | 0.11 | | | | 0.09 | |
Net realized and unrealized gain (loss) on investments | | | 0.57 | | | | (0.98 | ) | | | 3.27 | | | | 2.16 | | | | (3.08 | ) | | | (1.01 | ) |
| | | | | | | | | | | | | | | | | | | | | | | | |
Total from investment operations | | | 0.69 | | | | (0.95 | ) | | | 3.32 | | | | 2.24 | | | | (2.97 | ) | | | (0.92 | ) |
Less distributions from: | | | | | | | | | | | | | | | | | | | | | | | | |
Net investment income | | | — | | | | 0.03 | | | | 0.04 | | | | 0.04 | | | | 0.08 | | | | 0.07 | |
Net realized gain | | | — | | | | 0.46 | | | | — | | | | — | | | | — | | | | 4.02 | |
Return of capital | | | — | | | | 0.02 | | | | — | | | | — | | | | — | | | | — | |
| | | | | | | | | | | | | | | | | | | | | | | | |
Total distributions | | | — | | | | 0.51 | | | | 0.04 | | | | 0.04 | | | | 0.08 | | | | 4.09 | |
| | | | | | | | | | | | | | | | | | | | | | | | |
Net asset value, end of year | | $ | 13.16 | | | $ | 12.47 | | | $ | 13.93 | | | $ | 10.65 | | | $ | 8.45 | | | $ | 11.50 | |
| | | | | | | | | | | | | | | | | | | | | | | | |
Total Return (%)* | | | 5.53 | | | | (6.68 | ) | | | 31.16 | | | | 26.56 | | | | (25.77 | ) | | | (5.31 | ) |
Ratios to average daily net assets (%):** | | | | | | | | | | | | | | | | | | | | | | | | |
Expenses, net of waivers and reimbursements | | | 1.16 | | | | 1.14 | | | | 1.10 | | | | 1.09 | | | | 1.09 | | | | 1.09 | |
Expenses, before waivers and reimbursements | | | 1.29 | | | | 1.30 | | | | 1.29 | | | | 1.50 | | | | 1.57 | | | | 1.37 | |
Net investment income (loss), net of waivers and reimbursements | | | 1.82 | | | | 0.26 | | | | 0.43 | | | | 0.86 | | | | 1.06 | | | | 0.52 | |
Net investment income (loss), before waivers and reimbursements | | | 1.69 | | | | 0.10 | | | | 0.24 | | | | 0.45 | | | | 0.58 | | | | 0.24 | |
Net assets at end of year (in thousands) | | $ | 197,043 | | | $ | 190,686 | | | $ | 130,214 | | | $ | 47,114 | | | $ | 29,188 | | | $ | 35,327 | |
Portfolio turnover rate (%)* | | | 28 | | | | 65 | | | | 71 | | | | 62 | | | | 87 | | | | 102 | |
| * | | Rates not annualized for periods that are less than a year. |
| ** | | Rates are annualized for periods that are less than a year. |
| ^ | | Amount is less than $0.005 per share. |
Redemption fees represent less than $0.005 per share for all periods.
Note: Net investment income (loss) per share is based on the average shares outstanding during the year.
Performance cited represents past performance. Past performance does not guarantee future results and current performance may be lower or higher than the data quoted. Results shown are annual returns, which assume reinvestment of dividends and capital gains. Investment returns and principal will fluctuate and you may have a gain or loss when you sell shares. For the most current month-end performance information, please call 1-800-742-7272 or visit our Web site at www.williamblairfunds.com.
148 Semi-Annual Report | June 30, 2012 |
Financial Highlights
Mid Cap Value Fund
| | | | | | | | | | | | |
| | | Class N | |
| | | Period Ended
June 30, | | | Periods Ended
December 31, | |
| | | 2012 | | | 2011 | | | 2010(a) | |
Net asset value, beginning of period | | $ | 10.48 | | | $ | 10.75 | | | $ | 10.00 | |
Income (loss) from investment operations: | | | | | | | | | | | | |
Net investment income (loss) | | | 0.04 | | | | 0.12 | | | | 0.09 | |
Net realized and unrealized gain (loss) on investments | | | 0.45 | | | | (0.17 | ) | | | 0.74 | |
| | | | | | | | | | | | |
Total from investment operations | | | 0.49 | | | | (0.05 | ) | | | 0.83 | |
Less distributions from: | | | | | | | | | | | | |
Net investment income | | | — | | | | 0.09 | | | | 0.06 | |
Net realized gain | | | — | | | | 0.13 | | | | 0.02 | |
| | | | | | | | | | | | |
Total distributions | | | — | | | | 0.22 | | | | 0.08 | |
| | | | | | | | | | | | |
Net asset value, end of period | | $ | 10.97 | | | $ | 10.48 | | | $ | 10.75 | |
| | | | | | | | | | | | |
Total Return (%)* | | | 4.68 | | | | (0.34 | ) | | | 8.36 | |
Ratios to average daily net assets (%):** | | | | | | | | | | | | |
Expenses, net of waivers and reimbursements | | | 1.35 | | | | 1.35 | | | | 1.35 | |
Expenses, before waivers and reimbursements | | | 3.32 | | | | 3.85 | | | | 5.09 | |
Net investment income (loss), net of waivers and reimbursements | | | 0.65 | | | | 1.15 | | | | 0.92 | |
Net investment income (loss), before waivers and reimbursements | | | (1.32 | ) | | | (1.35 | ) | | | (2.82 | ) |
Net assets at end of year (in thousands) | | $ | 56 | | | $ | 58 | | | $ | 4 | |
Portfolio turnover rate (%)* | | | 30 | | | | 69 | | | | 35 | |
| |
| | | Class I | |
| | | Period Ended
June 30, | | | Periods Ended
December 31, | |
| | | 2012 | | | 2011 | | | 2010(a) | |
Net asset value, beginning of period | | $ | 10.48 | | | $ | 10.76 | | | $ | 10.00 | |
Income (loss) from investment operations: | | | | | | | | | | | | |
Net investment income (loss) | | | 0.05 | | | | 0.13 | | | | 0.11 | |
Net realized and unrealized gain (loss) on investments | | | 0.45 | | | | (0.17 | ) | | | 0.75 | |
| | | | | | | | | | | | |
Total from investment operations | | | 0.50 | | | | (0.04 | ) | | | 0.86 | |
Less distributions from: | | | | | | | | | | | | |
Net investment income | | | — | | | | 0.11 | | | | 0.08 | |
Net realized gain | | | — | | | | 0.13 | | | | 0.02 | |
| | | | | | | | | | | | |
Total distributions | | | — | | | | 0.24 | | | | 0.10 | |
| | | | | | | | | | | | |
Net asset value, end of period | | $ | 10.98 | | | $ | 10.48 | | | $ | 10.76 | |
| | | | | | | | | | | | |
Total Return (%)* | | | 4.77 | | | | (0.25 | ) | | | 8.66 | |
Ratios to average daily net assets (%):** | | | | | | | | | | | | |
Expenses, net of waivers and reimbursements | | | 1.10 | | | | 1.10 | | | | 1.10 | |
Expenses, before waivers and reimbursements | | | 3.08 | | | | 3.60 | | | | 4.92 | |
Net investment income (loss), net of waivers and reimbursements | | | 0.90 | | | | 1.20 | | | | 1.10 | |
Net investment income (loss), before waivers and reimbursements | | | (1.08 | ) | | | (1.30 | ) | | | (2.72 | ) |
Net assets at end of year (in thousands) | | $ | 4,924 | | | $ | 4,515 | | | $ | 3,389 | |
Portfolio turnover rate (%)* | | | 30 | | | | 69 | | | | 35 | |
| (a) | | For the period May 3, 2010 (Commencement of Operations) to December 31, 2010. |
| * | | Rates not annualized for periods that are less than a year. |
| ** | | Rates are annualized for periods that are less than a year. |
Redemption fees represent less than $0.005 per share for all periods.
Note: Net investment income (loss) per share is based on the average shares outstanding during the year.
Performance cited represents past performance. Past performance does not guarantee future results and current performance may be lower or higher than the data quoted. Results shown are annual returns, which assume reinvestment of dividends and capital gains. Investment returns and principal will fluctuate and you may have a gain or loss when you sell shares. For the most current month-end performance information, please call 1-800-742-7272 or visit our Web site at www.williamblairfunds.com.
June 30, 2012 | William Blair Funds 149 |
Financial Highlights
Small-Mid Cap Value Fund
| | | | | | | | |
| | | Class N | |
| | | Period Ended
June 30, | | | Period Ended
December 31, | |
| | | 2012 | | | 2011 (a) | |
Net asset value, beginning of period | | $ | 10.45 | | | $ | 10.00 | |
Income (loss) from investment operations: | | | | | | | | |
Net investment income (loss) | | | 0.06 | | | | 0.00 | ^ |
Net realized and unrealized gain (loss) on investments | | | 0.42 | | | | 0.45 | |
| | | | | | | | |
Total from investment operations | | | 0.48 | | | | 0.45 | |
Less distributions from: | | | | | | | | |
Net investment income | | | — | | | | — | |
Net realized gain | | | — | | | | — | |
| | | | | | | | |
Total distributions | | | — | | | | — | |
| | | | | | | | |
Net asset value, end of period | | $ | 10.93 | | | $ | 10.45 | |
| | | | | | | | |
Total Return (%) * | | | 4.59 | | | | 4.50 | |
Ratios to average daily net assets (%): ** | | | | | | | | |
Expenses, net of waivers and reimbursements | | | 1.40 | | | | 1.40 | |
Expenses, before waivers and reimbursements | | | 5.13 | | | | 18.68 | |
Net investment income (loss), net of waivers and reimbursements | | | 1.05 | | | | 0.53 | |
Net investment income (loss), before waivers and reimbursements | | | (2.68 | ) | | | (16.75 | ) |
Net assets at end of year (in thousands) | | $ | 916 | | | $ | 860 | |
Portfolio turnover rate (%)* | | | 26 | | | | 1 | |
| |
| | | Class I | |
| | | Period Ended
June 30, | | | Period Ended
December 31, | |
| | | 2012 | | | 2011(a) | |
Net asset value, beginning of period | | $ | 10.45 | | | $ | 10.00 | |
Income (loss) from investment operations: | | | | | | | | |
Net investment income (loss) | | | 0.07 | | | | 0.00 | ^ |
Net realized and unrealized gain (loss) on investments | | | 0.42 | | | | 0.45 | |
| | | | | | | | |
Total from investment operations | | | 0.49 | | | | 0.45 | |
Less distributions from: | | | | | | | | |
Net investment income | | | — | | | | — | |
Net realized gain | | | — | | | | — | |
| | | | | | | | |
Total distributions | | | — | | | | — | |
| | | | | | | | |
Net asset value, end of period | | $ | 10.94 | | | $ | 10.45 | |
| | | | | | | | |
Total Return (%) * | | | 4.69 | | | | 4.50 | |
Ratios to average daily net assets (%): ** | | | | | | | | |
Expenses, net of waivers and reimbursements | | | 1.15 | | | | 1.15 | |
Expenses, before waivers and reimbursements | | | 4.89 | | | | 18.43 | |
Net investment income (loss), net of waivers and reimbursements | | | 1.30 | | | | 0.79 | |
Net investment income (loss), before waivers and reimbursements | | | (2.44 | ) | | | (16.49 | ) |
Net assets at end of year (in thousands) | | $ | 1,349 | | | $ | 1,296 | |
Portfolio turnover rate (%)* | | | 216 | | | | 1 | |
| (a) | | For the period December 15, 2011 (Commencement of Operations) to December 31, 2011. |
| * | | Rates not annualized for periods that are less than a year. |
| ** | | Rates are annualized for periods that are less than a year. |
| ^ | | Amount is less than $0.005 per share. |
Redemption fees represent less than $0.005 per share for all periods.
Note: Net investment income (loss) per share is based on the average shares outstanding during the year.
Performance cited represents past performance. Past performance does not guarantee future results and current performance may be lower or higher than the data quoted. Results shown are annual returns, which assume reinvestment of dividends and capital gains. Investment returns and principal will fluctuate and you may have a gain or loss when you sell shares. For the most current month-end performance information, please call 1-800-742-7272 or visit our Web site at www.williamblairfunds.com.
150 Semi-Annual Report | June 30, 2012 |
Financial Highlights
Bond Fund
| | | | | | | | | | | | | | | | | | | | | | | | |
| | | Class N | |
| | | Period Ended
June 30, | | | Periods Ended December 31, | |
| | | 2012 | | | 2011 | | | 2010 | | | 2009 | | | 2008 | | | 2007 (a) | |
Net asset value, beginning of period | | $ | 10.91 | | | $ | 10.70 | | | $ | 10.40 | | | $ | 9.82 | | | $ | 10.07 | | | $ | 10.00 | |
Income (loss) from investment operations: | | | | | | | | | | | | | | | | | | | | | | | | |
Net investment income (loss) | | | 0.20 | | | | 0.43 | | | | 0.46 | | | | 0.48 | | | | 0.47 | | | | 0.31 | |
Net realized and unrealized gain (loss) on investments | | | 0.22 | | | | 0.34 | | | | 0.35 | | | | 0.59 | | | | (0.31 | ) | | | 0.02 | |
| | | | | | | | | | | | | | | | | | | | | | | | |
Total from investment operations | | | 0.42 | | | | 0.77 | | | | 0.81 | | | | 1.07 | | | | 0.16 | | | | 0.33 | |
Less distributions from: | | | | | | | | | | | | | | | | | | | | | | | | |
Net investment income | | | 0.23 | | | | 0.47 | | | | 0.48 | | | | 0.49 | | | | 0.41 | | | | 0.26 | |
Net realized gain | | | — | | | | 0.09 | | | | 0.03 | | | | — | | | | — | | | | — | |
| | | | | | | | | | | | | | | | | | | | | | | | |
Total distributions | | | 0.23 | | | | 0.56 | | | | 0.51 | | | | 0.49 | | | | 0.41 | | | | 0.26 | |
| | | | | | | | | | | | | | | | | | | | | | | | |
Net asset value, end of period | | $ | 11.10 | | | $ | 10.91 | | | $ | 10.70 | | | $ | 10.40 | | | $ | 9.82 | | | $ | 10.07 | |
| | | | | | | | | | | | | | | | | | | | | | | | |
Total Return (%) * | | | 3.93 | | | | 7.41 | | | | 7.86 | | | | 11.11 | | | | 1.64 | | | | 3.38 | |
Ratios to average daily net assets (%): ** | | | | | | | | | | | | | | | | | | | | | | | | |
Expenses, net of waivers and reimbursements | | | 0.65 | | | | 0.65 | | | | 0.65 | | | | 0.65 | | | | 0.65 | | | | 0.65 | |
Expenses, before waivers and reimbursements | | | 0.77 | | | | 0.76 | | | | 0.70 | | | | 1.40 | | | | 2.47 | | | | 0.81 | |
Net investment income (loss), net of waivers and reimbursements | | | 3.63 | | | | 3.97 | | | | 4.25 | | | | 4.76 | | | | 4.69 | | | | 4.80 | |
Net investment income (loss), before waivers and reimbursements | | | 3.51 | | | | 3.86 | | | | 4.20 | | | | 4.01 | | | | 2.87 | | | | 4.64 | |
Net assets at end of year (in thousands) | | $ | 25,679 | | | $ | 8,345 | | | $ | 4,479 | | | $ | 3,580 | | | $ | 407 | | | $ | 736 | |
Portfolio turnover rate (%)* | | | 12 | | | | 28 | | | | 25 | | | | 29 | | | | 52 | | | | 38 | |
| |
| | | Class I | |
| | | Period Ended
June 30, | | | Periods Ended December 31, | |
| | | 2012 | | | 2011 | | | 2010 | | | 2009 | | | 2008 | | | 2007 (a) | |
Net asset value, beginning of period | | $ | 10.80 | | | $ | 10.59 | | | $ | 10.31 | | | $ | 9.72 | | | $ | 10.04 | | | $ | 10.00 | |
Income (loss) from investment operations: | | | | | | | | | | | | | | | | | | | | | | | | |
Net investment income (loss) | | | 0.21 | | | | 0.45 | | | | 0.47 | | | | 0.49 | | | | 0.48 | | | | 0.32 | |
Net realized and unrealized gain (loss) on investments | | | 0.22 | | | | 0.33 | | | | 0.33 | | | | 0.59 | | | | (0.31 | ) | | | 0.02 | |
| | | | | | | | | | | | | | | | | | | | | | | | |
Total from investment operations | | | 0.43 | | | | 0.78 | | | | 0.80 | | | | 1.08 | | | | 0.17 | | | | 0.34 | |
Less distributions from: | | | | | | | | | | | | | | | | | | | | | | | | |
Net investment income | | | 0.24 | | | | 0.48 | | | | 0.49 | | | | 0.49 | | | | 0.49 | | | | 0.30 | |
Net realized gain | | | — | | | | 0.09 | | | | 0.03 | | | | — | | | | — | | | | — | |
| | | | | | | | | | | | | | | | | | | | | | | | |
Total distributions | | | 0.24 | | | | 0.57 | | | | 0.52 | | | | 0.49 | | | | 0.49 | | | | 0.30 | |
| | | | | | | | | | | | | | | | | | | | | | | | |
Net asset value, end of period | | $ | 10.99 | | | $ | 10.80 | | | $ | 10.59 | | | $ | 10.31 | | | $ | 9.72 | | | $ | 10.04 | |
| | | | | | | | | | | | | | | | | | | | | | | | |
Total Return (%) * | | | 4.03 | | | | 7.62 | | | | 7.89 | | | | 11.40 | | | | 1.72 | | | | 3.50 | |
Ratios to average daily net assets (%): ** | | | | | | | | | | | | | | | | | | | | | | | | |
Expenses, net of waivers and reimbursements | | | 0.50 | | | | 0.50 | | | | 0.50 | | | | 0.50 | | | | 0.50 | | | | 0.50 | |
Expenses, before waivers and reimbursements | | | 0.56 | | | | 0.55 | | | | 0.55 | | | | 0.58 | | | | 0.71 | | | | 0.67 | |
Net investment income (loss), net of waivers and reimbursements | | | 3.78 | | | | 4.17 | | | | 4.41 | | | | 4.92 | | | | 4.90 | | | | 4.95 | |
Net investment income (loss), before waivers and reimbursements | | | 3.72 | | | | 4.12 | | | | 4.36 | | | | 4.84 | | | | 4.69 | | | | 4.78 | |
Net assets at end of year (in thousands) | | $ | 159,385 | | | $ | 154,224 | | | $ | 147,807 | | | $ | 127,538 | | | $ | 63,763 | | | $ | 55,873 | |
Portfolio turnover rate (%)* | | | 12 | | | | 28 | | | | 25 | | | | 29 | | | | 52 | | | | 38 | |
| (a) | | For the period May 1, 2007 (Commencement of Operations) to December 31, 2007. |
| * | | Rates not annualized for periods that are less than a year. |
| ** | | Rates are annualized for periods that are less than a year. |
Note: Net investment income (loss) per share is based on the average shares outstanding during the year.
Performance cited represents past performance. Past performance does not guarantee future results and current performance may be lower or higher than the data quoted. Results shown are annual returns, which assume reinvestment of dividends and capital gains. Investment returns and principal will fluctuate and you may have a gain or loss when you sell shares. For the most current month-end performance information, please call 1-800-742-7272 or visit our Web site at www.williamblairfunds.com.
June 30, 2012 | William Blair Funds 151 |
Financial Highlights
Income Fund
| | | | | | | | | | | | | | | | | | | | | | | | |
| | | Class N | |
| | | Period Ended
June 30, | | | Years Ended December 31, | |
| | | 2012 | | | 2011 | | | 2010 | | | 2009 | | | 2008 | | | 2007 | |
Net asset value, beginning of year | | $ | 9.32 | | | $ | 9.22 | | | $ | 9.07 | | | $ | 8.69 | | | $ | 9.29 | | | $ | 9.74 | |
Income (loss) from investment operations: | | | | | | | | | | | | | | | | | | | | | | | | |
Net investment income (loss) | | | 0.13 | | | | 0.32 | | | | 0.35 | | | | 0.40 | | | | 0.37 | | | | 0.45 | |
Net realized and unrealized gain (loss) on investments | | | 0.14 | | | | 0.15 | | | | 0.19 | | | | 0.44 | | | | (0.59 | ) | | | (0.35 | ) |
| | | | | | | | | | | | | | | | | | | | | | | | |
Total from investment operations | | | 0.27 | | | | 0.47 | | | | 0.54 | | | | 0.84 | | | | (0.22 | ) | | | 0.10 | |
| | | | | | |
Less distributions from: | | | | | | | | | | | | | | | | | | | | | | | | |
Net investment income | | | 0.17 | | | | 0.37 | | | | 0.39 | | | | 0.46 | | | | 0.38 | | | | 0.55 | |
Net realized gain | | | — | | | | — | | | | — | | | | — | | | | — | | | | — | |
| | | | | | | | | | | | | | | | | | | | | | | | |
Total distributions | | | 0.17 | | | | 0.37 | | | | 0.39 | | | | 0.46 | | | | 0.38 | | | | 0.55 | |
| | | | | | | | | | | | | | | | | | | | | | | | |
Net asset value, end of year | | $ | 9.42 | | | $ | 9.32 | | | $ | 9.22 | | | $ | 9.07 | | | $ | 8.69 | | | $ | 9.29 | |
| | | | | | | | | | | | | | | | | | | | | | | | |
Total Return (%) * | | | 2.94 | | | | 5.21 | | | | 6.04 | | | | 9.88 | | | | (2.46 | ) | | | 1.08 | |
Ratios to average daily net assets (%): ** | | | | | | | | | | | | | | | | | | | | | | | | |
Expenses, net of waivers and reimbursements | | | 0.82 | | | | 0.85 | | | | 0.85 | | | | 0.85 | | | | 0.90 | | | | 0.79 | |
Expenses, before waivers and reimbursements | | | 0.82 | | | | 0.91 | | | | 0.85 | | | | 0.93 | | | | 0.93 | | | | 0.81 | |
Net investment income (loss), net of waivers and reimbursements | | | 2.88 | | | | 3.40 | | | | 3.79 | | | | 4.48 | | | | 4.38 | | | | 4.73 | |
Net investment income (loss), before waivers and reimbursements | | | 2.88 | | | | 3.34 | | | | 3.79 | | | | 4.41 | | | | 4.35 | | | | 4.71 | |
Net assets at end of year (in thousands) | | $ | 56,975 | | | $ | 44,802 | | | $ | 35,755 | | | $ | 37,567 | | | $ | 47,009 | | | $ | 75,188 | |
Portfolio turnover rate (%)* | | | 16 | | | | 39 | | | | 29 | | | | 40 | | | | 38 | | | | 34 | |
| |
| | | Class I | |
| | | Period Ended
June 30, | | | Years Ended December 31, | |
| | | 2012 | | | 2011 | | | 2010 | | | 2009 | | | 2008 | | | 2007 | |
Net asset value, beginning of year | | $ | 9.25 | | | $ | 9.15 | | | $ | 9.00 | | | $ | 8.64 | | | $ | 9.30 | | | $ | 9.69 | |
Income (loss) from investment operations: | | | | | | | | | | | | | | | | | | | | | | | | |
Net investment income (loss) | | | 0.15 | | | | 0.34 | | | | 0.37 | | | | 0.41 | | | | 0.39 | | | | 0.47 | |
Net realized and unrealized gain (loss) on investments | | | 0.13 | | | | 0.15 | | | | 0.19 | | | | 0.43 | | | | (0.59 | ) | | | (0.34 | ) |
| | | | | | | | | | | | | | | | | | | | | | | | |
Total from investment operations | | | 0.28 | | | | 0.49 | | | | 0.56 | | | | 0.84 | | | | (0.20 | ) | | | 0.13 | |
| | | | | | |
Less distributions from: | | | | | | | | | | | | | | | | | | | | | | | | |
Net investment income | | | 0.18 | | | | 0.39 | | | | 0.41 | | | | 0.48 | | | | 0.46 | | | | 0.52 | |
Net realized gain | | | — | | | | — | | | | — | | | | — | | | | — | | | | — | |
| | | | | | | | | | | | | | | | | | | | | | | | |
Total distributions | | | 0.18 | | | | 0.39 | | | | 0.41 | | | | 0.48 | | | | 0.46 | | | | 0.52 | |
| | | | | | | | | | | | | | | | | | | | | | | | |
Net asset value, end of year | | $ | 9.35 | | | $ | 9.25 | | | $ | 9.15 | | | $ | 9.00 | | | $ | 8.64 | | | $ | 9.30 | |
| | | | | | | | | | | | | | | | | | | | | | | | |
Total Return (%) * | | | 3.08 | | | | 5.46 | | | | 6.33 | | | | 9.89 | | | | (2.26 | ) | | | 1.36 | |
Ratios to average daily net assets (%): ** | | | | | | | | | | | | | | | | | | | | | | | | |
Expenses, net of waivers and reimbursements | | | 0.57 | | | | 0.64 | | | | 0.63 | | | | 0.66 | | | | 0.72 | | | | 0.60 | |
Net investment income (loss), net of waivers and reimbursements | | | 3.13 | | | | 3.66 | | | | 4.01 | | | | 4.67 | | | | 4.57 | | | | 4.91 | |
Net assets at end of year (in thousands) | | $ | 74,836 | | | $ | 67,183 | | | $ | 77,522 | | | $ | 80,041 | | | $ | 93,426 | | | $ | 129,442 | |
Portfolio turnover rate (%)* | | | 16 | | | | 39 | | | | 29 | | | | 40 | | | | 38 | | | | 34 | |
| * | | Rates not annualized for periods that are less than a year. |
| ** | | Rates are annualized for periods that are less than a year. |
Note: Net investment income (loss) per share is based on the average shares outstanding during the year.
Performance cited represents past performance. Past performance does not guarantee future results and current performance may be lower or higher than the data quoted. Results shown are annual returns, which assume reinvestment of dividends and capital gains. Investment returns and principal will fluctuate and you may have a gain or loss when you sell shares. For the most current month-end performance information, please call 1-800-742-7272 or visit our Web site at www.williamblairfunds.com.
152 Semi-Annual Report | June 30, 2012 |
Financial Highlights
Low Duration Fund
| | | | | | | | | | | | | | | | |
| | | Class N | |
| | | Period Ended
June 30, | | | Periods Ended December 31, | |
| | | 2012 | | | 2011 | | | 2010 | | | 2009(a) | |
Net asset value, beginning of period | | $ | 9.82 | | | $ | 9.90 | | | $ | 9.93 | | | $ | 10.00 | |
Income (loss) from investment operations: | | | | | | | | | | | | | | | | |
Net investment income (loss) | | | 0.08 | | | | 0.15 | | | | 0.13 | | | | 0.01 | |
Net realized and unrealized gain (loss) on investments | | | 0.08 | | | | 0.02 | | | | 0.05 | | | | (0.07 | ) |
| | | | | | | | | | | | | | | | |
Total from investment operations | | | 0.16 | | | | 0.17 | | | | 0.18 | | | | (0.06 | ) |
Less distributions from: | | | | | | | | | | | | | | | | |
Net investment income | | | 0.14 | | | | 0.25 | | | | 0.21 | | | | 0.01 | |
Net realized gain | | | — | | | | — | | | | — | | | | — | |
| | | | | | | | | | | | | | | | |
Total distributions | | | 0.14 | | | | 0.25 | | | | 0.21 | | | | 0.01 | |
| | | | | | | | | | | | | | | | |
Net asset value, end of period | | $ | 9.84 | | | $ | 9.82 | | | $ | 9.90 | | | $ | 9.93 | |
| | | | | | | | | | | | | | | | |
Total Return (%) * | | | 1.59 | | | | 1.73 | | | | 1.86 | | | | (0.60 | ) |
Ratios to average daily net assets (%): ** | | | | | | | | | | | | | | | | |
Expenses, net of waivers and reimbursements | | | 0.70 | | | | 0.70 | | | | 0.70 | | | | 0.70 | |
Expenses, before waivers and reimbursements | | | 0.73 | | | | 0.73 | | | | 0.78 | | | | 0.94 | |
Net investment income (loss), net of waivers and reimbursements | | | 1.58 | | | | 1.52 | | | | 1.33 | | | | 1.27 | |
Net investment income (loss), before waivers and reimbursements | | | 1.55 | | | | 1.49 | | | | 1.25 | | | | 1.03 | |
Net assets at end of year (in thousands) | | $ | 8,322 | | | $ | 6,260 | | | $ | 6,937 | | | $ | 1,861 | |
Portfolio turnover rate (%)* | | | 12 | | | | 43 | | | | 51 | | | | — | |
| |
| | | Class I | |
| | | Period Ended
June 30, | | | Periods Ended December 31, | |
| | | 2012 | | | 2011 | | | 2010 | | | 2009(a) | |
Net asset value, beginning of period | | $ | 9.82 | | | $ | 9.89 | | | $ | 9.93 | | | $ | 10.00 | |
Income (loss) from investment operations: | | | | | | | | | | | | | | | | |
Net investment income (loss) | | | 0.08 | | | | 0.17 | | | | 0.15 | | | | 0.01 | |
Net realized and unrealized gain (loss) on investments | | | 0.08 | | | | 0.02 | | | | 0.04 | | | | (0.07 | ) |
| | | | | | | | | | | | | | | | |
Total from investment operations | | | 0.16 | | | | 0.19 | | | | 0.19 | | | | (0.06 | ) |
Less distributions from: | | | | | | | | | | | | | | | | |
Net investment income | | | 0.14 | | | | 0.26 | | | | 0.23 | | | | 0.01 | |
Net realized gain | | | — | | | | — | | | | — | | | | — | |
| | | | | | | | | | | | | | | | |
Total distributions | | | 0.14 | | | | 0.26 | | | | 0.23 | | | | 0.01 | |
| | | | | | | | | | | | | | | | |
Net asset value, end of period | | $ | 9.84 | | | $ | 9.82 | | | $ | 9.89 | | | $ | 9.93 | |
| | | | | | | | | | | | | | | | |
Total Return (%) * | | | 1.67 | | | | 1.99 | | | | 1.89 | | | | (0.59 | ) |
Ratios to average daily net assets (%): ** | | | | | | | | | | | | | | | | |
Expenses, net of waivers and reimbursements | | | 0.55 | | | | 0.55 | | | | 0.55 | | | | 0.55 | |
Expenses, before waivers and reimbursements | | | 0.56 | | | | 0.58 | | | | 0.63 | | | | 0.79 | |
Net investment income (loss), net of waivers and reimbursements | | | 1.73 | | | | 1.67 | | | | 1.46 | | | | 1.39 | |
Net investment income (loss), before waivers and reimbursements | | | 1.72 | | | | 1.64 | | | | 1.38 | | | | 1.15 | |
Net assets at end of year (in thousands) | | $ | 102,941 | | | $ | 82,828 | | | $ | 88,568 | | | $ | 79,773 | |
Portfolio turnover rate (%)* | | | 12 | | | | 43 | | | | 51 | | | | — | |
| (a) | | For the period December 1, 2009 (Commencement of Operations) to December 31, 2009. |
| * | | Rates not annualized for periods that are less than a year. |
| ** | | Rates are annualized for periods that are less than a year. |
Note: Net investment income (loss) per share is based on the average shares outstanding during the year.
Performance cited represents past performance. Past performance does not guarantee future results and current performance may be lower or higher than the data quoted. Results shown are annual returns, which assume reinvestment of dividends and capital gains. Investment returns and principal will fluctuate and you may have a gain or loss when you sell shares. For the most current month-end performance information, please call 1-800-742-7272 or visit our Web site at www.williamblairfunds.com.
June 30, 2012 | William Blair Funds 153 |
Financial Highlights
Ready Reserve Fund
| | | | | | | | | | | | | | | | | | | | | | | | |
| | | Class N | |
| | | Period Ended
June 30, | | | Years Ended December 31, | |
| | | 2012 | | | 2011 | | | 2010 | | | 2009 | | | 2008 | | | 2007 | |
Net asset value, beginning of year | | $ | 1.00 | | | $ | 1.00 | | | $ | 1.00 | | | $ | 1.00 | | | $ | 1.00 | | | $ | 1.00 | |
Income (loss) from investment operations: | | | | | | | | | | | | | | | | | | | | | | | | |
Net investment income (loss) | | | 0.00 | ^ | | | 0.00 | ^ | | | 0.00 | ^ | | | 0.00 | ^ | | | 0.02 | | | | 0.05 | |
Net realized and unrealized gain (loss) on investments | | | — | | | | — | | | | — | | | | — | | | | — | | | | — | |
| | | | | | | | | | | | | | | | | | | | | | | | |
Total from investment operations | | | 0.00 | ^ | | | 0.00 | ^ | | | 0.00 | ^ | | | 0.00 | ^ | | | 0.02 | | | | 0.05 | |
Less distributions from: | | | | | | | | | | | | | | | | | | | | | | | | |
Net investment income | | | 0.00 | ^ | | | 0.00 | ^ | | | 0.00 | ^ | | | 0.00 | ^ | | | 0.02 | | | | 0.05 | |
Net realized gain | | | — | | | | — | | | | — | | | | — | | | | — | | | | — | |
| | | | | | | | | | | | | | | | | | | | | | | | |
Total distributions | | | 0.00 | ^ | | | 0.00 | ^ | | | 0.00 | ^ | | | 0.00 | ^ | | | 0.02 | | | | 0.05 | |
| | | | | | | | | | | | | | | | | | | | | | | | |
Net asset value, end of year | | $ | 1.00 | | | $ | 1.00 | | | $ | 1.00 | | | $ | 1.00 | | | $ | 1.00 | | | $ | 1.00 | |
| | | | | | | | | | | | | | | | | | | | | | | | |
Total Return (%) * | | | 0.00 | | | | 0.01 | | | | 0.01 | | | | 0.10 | | | | 2.20 | | | | 4.75 | |
Ratios to average daily net assets (%): ** | | | | | | | | | | | | | | | | | | | | | | | | |
Expenses, net of waivers and reimbursements | | | 0.13 | | | | 0.14 | | | | 0.24 | | | | 0.46 | | | | 0.60 | | | | 0.63 | |
Expenses, before waivers and reimbursements | | | 0.62 | | | | 0.62 | | | | 0.61 | | | | 0.66 | | | | 0.60 | | | | 0.63 | |
Net investment income (loss), net of waivers and reimbursements | | | 0.01 | | | | 0.01 | | | | 0.01 | | | | 0.11 | | | | 2.12 | | | | 4.63 | |
Net investment income (loss), before waivers and reimbursements | | | (0.48 | ) | | | (0.47 | ) | | | (0.36 | ) | | | (0.09 | ) | | | 2.12 | | | | 4.63 | |
Net assets at end of year (in thousands) | | $ | 1,292,589 | | | $ | 1,271,746 | | | $ | 1,216,543 | | | $ | 1,352,901 | | | $ | 1,841,189 | | | $ | 1,399,537 | |
| * | | Rates not annualized for periods that are less than a year. |
| ** | | Rates are annualized for periods that are less than a year. |
| ^ | | Amount is less than $0.005 per share. |
Note: Net investment income (loss) per share is based on the average shares outstanding during the year.
Performance cited represents past performance. Past performance does not guarantee future results and current performance may be lower or higher than the data quoted. Results shown are annual returns, which assume reinvestment of dividends and capital gains. Investment returns and principal will fluctuate and you may have a gain or loss when you sell shares. For the most current month-end performance information, please call 1-800-742-7272 or visit our Web site at www.williamblairfunds.com.
154 Semi-Annual Report | June 30, 2012 |
Trustees and Officers (Unaudited). The trustees and officers of the William Blair Funds, their year of birth, their principal occupations during the last five years, their affiliations, if any, with William Blair & Company, L.L.C., and other significant affiliations are set forth below. The address of each trustee and officer is 222 West Adams Street, Chicago, Illinois 60606.
| | | | | | | | | | |
Name and Year of Birth | | Position(s)
Held with
Fund | | Term of
Office and
Length of
Time
Served(1) | | Principal Occupation(s) During Past 5 Years(2) | | Number of
Portfolios
in Fund
Complex
Overseen
by Trustee | | Other Directorships Held by Trustee/Officer |
Interested Trustees | | | | | | | | | | |
Michelle R. Seitz,
1965* | | Chairperson of the Board of Trustees and President | | Trustee since 2002; Chairperson since 2010 Since 2007 | | Partner, William Blair & Company, L.L.C.; Limited Partner, WB Holdings, L.P. (since November 2008); Member, WBC GP, L.L.P. (since November 2008) | | 25 | | Director, William Blair SICAV; Financial Accounting Foundation (FAF) |
| | | | | |
Richard W. Smirl,
1967* | | Trustee and Senior Vice President | | Trustee since 2010 and Senior Vice President Since 2007 | | Partner, William Blair & Company, L.L.C. | | 25 | | Director, William Blair SICAV |
| | | | |
Non-Interested Trustees | | | | | | | | |
Phillip O. Peterson,
1944 | | Trustee | | Since 2007 | | Retired; formerly, President, Strong Mutual Funds, 2004-2005; formerly, Partner, KPMG LLP | | 25 | | The Hartford Group of Mutual Funds (87 portfolios); Symetra Mutual Funds Trust (variable annuity funds) (14 portfolios) |
| | | | | |
Lisa A. Pollina,
1965 | | Trustee | | Since 2011 | | Senior Advisor to head of RBC Financial Group’s International Banking and Insurance division since 2010; formerly, Bank of America Corporation, Global Financial Institutions Executive from 2006-2008 and multiple Advisory from 2008-2010; prior thereto roles, Managing Partner, Bordeaux Capital from 2002-2006. | | 25 | | Darkstrand, high-speed fiber optic network provider (2009 to 2010); Jane Addams Hull House Association, Board of Trustees (2003 to 2009) |
| | | | | |
Donald J. Reaves,
1946 | | Trustee | | Since 2004 | | Chancellor, Winston-Salem State University since 2007; formerly, Vice President for Administration and Chief Financial Officer, University of Chicago 2002-2007. | | 25 | | American Student Assistance Corp., guarantor of student loans; Amica Mutual Insurance Company |
| | | | | |
Donald L. Seeley,
1944 | | Trustee | | Since 2003 | | Retired; formerly, Director, Applied Investment Management Program, University of Arizona Department of Finance, prior thereto, Vice Chairman and Chief Financial Officer, True North Communications, Inc., marketing communications and advertising firm | | 25 | | Warnaco Group, Inc., intimate apparel, sportswear, and swimwear manufacturer; Center for Furniture Craftsmanship (not-for-profit) |
June 30, 2012 | William Blair Funds 155 |
| | | | | | | | | | |
Name and Year of Birth | | Position(s)
Held with
Fund | | Term of
Office and
Length of
Time
Served(1) | | Principal Occupation(s) During Past 5 Years(2) | | Number of
Portfolios
in Fund
Complex
Overseen
by Trustee | | Other Directorships Held by Trustee/Officer |
Thomas J. Skelly,
1951 | | Trustee | | Since 2007 | | Advisory Board Member for various U.S. Companies; Director and Investment Committee Chairman of the US Accenture Foundation, Inc.; prior to 2005, Managing Partner of various divisions at Accenture | | 25 | | Mutual Trust Financial Group, provider of insurance and investment products; Board Member First MetLife Investors Insurance Company, NY Chartered Company for Metropolitan Life Insurance |
| | | | | |
Officers | | | | | | | | | | |
Michael P. Balkin,
1959 | | Senior Vice President Vice President | | Since 2009 2008-2009 | | Partner, William Blair & Company, L.L.C. Associate, William Blair & Company, L.L.C.; former Partner, Magnetar Capital | | | | N/A |
| | | | | |
Karl W. Brewer,
1966 | | Senior Vice President | | Since 2000 | | Partner, William Blair & Company, L.L.C. | | | | N/A |
| | | | | |
David C. Fording,
1967 | | Senior Vice President Vice President | | Since 2009 2006-2009 | | Partner, William Blair & Company, L.L.C. Associate, William Blair & Company, L.L.C.; former Portfolio Manager, TIAA-CREF. | | | | N/A |
| | | | | |
James S. Golan,
1961 | | Senior Vice President | | Since 2005 | | Partner, William Blair & Company, L.L.C. | | | | N/A |
| | | | | |
W. George Greig,
1952 | | Senior Vice President | | Since 1996 | | Partner, William Blair & Company, L.L.C. | | | | N/A |
| | | | | |
Michael A. Jancosek,
1959 | | Senior Vice President | | Since 2004 | | Partner, William Blair & Company L.L.C. | | | | N/A |
| | | | | |
John F. Jostrand,
1954 | | Senior Vice President | | Since 1999 | | Partner, William Blair & Company, L.L.C. | | | | N/A |
| | | | | |
Chad M. Kilmer,
1975 | | Senior Vice President Vice President | | Since 2011 2006-2011 | | Partner, William Blair & Company, L.L.C. Associate, William Blair & Company, L.L.C.; former analyst and Portfolio Manager U.S. Bancorp Asset Management. | | | | N/A |
| | | | | |
Robert C. Lanphier, IV,
1956 | | Senior Vice President | | Since 2003 | | Partner, William Blair & Company, L.L.C. | | | | Chairman, AG. Med, Inc. |
| | | | | |
Mark T. Leslie,
1967 | | Senior Vice President Vice President | | Since 2008 2005-2008 | | Partner, William Blair & Company, L.L.C. Associate, William Blair & Company, L.L.C. | | | | N/A |
| | | | | |
Matthew A. Litfin,
1972 | | Senior Vice President | | Since 2008 | | Partner, William Blair & Company, L.L.C. | | | | N/A |
| | | | | |
Kenneth J. McAtamney
1966 | | Senior Vice President | | Since 2008 | | Partner, William Blair & Company, L.L.C. | | | | N/A |
156 Semi-Annual Report | June 30, 2012 |
| | | | | | | | |
Name and Year of Birth | | Position(s) Held with Fund | | Term of
Office and
Length of Time
Served(1) | | Principal Occupation(s) During Past 5 Years(2) | | Other Directorships Held by Trustee/Officer |
Todd M. McClone,
1968 | | Senior Vice President Vice President | | Since 2006 2005-2006 | | Partner, William Blair & Company, L.L.C. Associate, William Blair & Company, L.L.C. | | N/A N/A |
| | | | |
David Merjan,
1960 | | Senior Vice President | | Since 2008 | | Partner, William Blair & Company, L.L.C. | | N/A |
| | | | |
David S. Mitchell,
1960 | | Senior Vice President | | Since 2004 | | Partner, William Blair & Company, L.L.C. | | N/A |
| | | | |
David P. Ricci,
1958 | | Senior Vice President | | Since 2006 | | Partner, William Blair & Company, L.L.C. | | N/A |
| | | | |
Brian D. Singer,
1960 | | Senior Vice President Vice President | | Since 2012 2011-2012 | | Partner, William Blair & Company, L.L.C. Associate, William Blair & Company, L.L.C. (since 2011); prior thereto, Managing Partner, Singer Partners, LLC (2009-2011); prior thereto, UBS Global Asset Management (Americas) Inc. (2003-2007) | | N/A |
| | | | |
Paul J. Sularz,
1967 | | Senior Vice President Vice President | | Since 2012 2009-2012 | | Partner, William Blair & Company, L.L.C. Associate, William Blair & Company, L.L.C.; Vice President, J.P. Morgan Securities, Inc. | | N/A |
| | | | |
Jeffrey A. Urbina,
1955 | | Senior Vice President | | Since 1998 | | Partner, William Blair & Company, L.L.C. | | N/A |
| | | | |
Christopher T. Vincent,
1956 | | Senior Vice President | | Since 2004 | | Partner, William Blair & Company, L.L.C. | | N/A |
| | | | |
Kathleen M. Lynch,
1971 | | Vice President | | Since 2010 | | Associate, William Blair & Company, L.L.C. | | N/A |
| | | | |
David F. Hone,
1967 | | Vice President | | Since 2011 | | Associate, William Blair & Company, L.L.C. (since 2011); prior thereto, Portfolio Manager Large Cap Value, Deutsche Asset Management (2002-2010) | | N/A |
| | | | |
John Abunassar,
1967 | | Vice President | | Since 2011 | | Associate, William Blair & Company, L.L.C. (since 2011); prior thereto, Principal, Guidance Capital LLC (2009-2011); prior thereto. President and CEO of Allegiant Asset | | N/A |
| | | | |
Peter Carl,
1967 | | Vice President | | Since 2011 | | Associate, William Blair & Company L.L.C. (since 2011); prior thereto, Portfolio Manager, Guidance Capital LLC (2006-2011) | | N/A |
| | | | |
D. Trowbridge Elliman III, 1957 | | Vice President | | Since 2011 | | Associate, William Blair & Company L.L.C. (since 2011); prior thereto, Principal, Guidance Capital LLC (2001-2011) | | N/A |
June 30, 2012 | William Blair Funds 157 |
| | | | | | | | |
Name and Year of Birth | | Position(s) Held with Fund | | Term of
Office and
Length of Time
Served(1) | | Principal Occupation(s) During Past 5 Years(2) | | Other Directorships Held by Trustee/Officer |
Christopher Walvoord,
1966 | | Vice President | | Since 2011 | | Associate, William Blair & Company, L.L.C. (since 2011); prior thereto, Principal, Guidance Capital LLC (2002-2011) | | N/A |
| | | | |
Brian Ziv,
1957 | | Vice President | | Since 2011 | | Associate, William Blair & Company, L.L.C. (since 2011); prior thereto, Principal, Guidance Capital LLC (2001-2011) | | N/A |
| | | | |
Edwin Denson,
1967 | | Vice President | | Since 2011 | | Associate, William Blair & Company, L.L.C. (since 2011); prior thereto, Managing Partner, Singer Partners, LLC (2009-2011); prior thereto, UBS Global Asset Management (Americas) Inc. (2001-2009) | | N/A |
| | | | |
Thomas Clarke,
1968 | | Vice President | | Since 2011 | | Associate, William Blair & Company, L.L.C. (since 2011); prior thereto, Managing Partner, Singer Partners, LLC (2009-2011); prior thereto, UBS Global Asset Management (Americas) Inc. (2000-2009) | | N/A |
| | | | |
Walter R. Randall, Jr.,
1960 | | Chief Compliance Officer and Assistant Secretary | | Since 2009 | | Associate, William Blair & Company, L.L.C.; Associate Counsel and Chief Compliance Officer, Calamos Investments; Assistant General Counsel, American Century Investments. | | N/A |
| | | | |
Colette M. Garavalia,
1961 | | Treasurer | | Since 2009 | | Associate, William Blair & Company, L.L.C. | | N/A |
| | | | |
| | Secretary | | 2000-2009 | | Associate, William Blair & Company, L.L.C. | | N/A |
| | | | |
Andrew T. Pfau,
1970 | | Secretary | | Since 2009 | | Associate, William Blair & Company, L.L.C.; Associate, Bell, Boyd & Lloyd, LLP; Associate, Sidley Austin LLP | | N/A |
| | | | |
John M. Raczek,
1970 | | Assistant Treasurer | | Since 2010 | | Associate, William Blair & Company, L.L.C.; Manager, Calamos Investments | | N/A |
| * | | Ms. Seitz and Mr. Smirl are interested persons of the William Blair Funds because each is a partner of William Blair & Company, L.L.C., the Fund’s investment advisor, principal underwriter and distributor. |
| (1) | | Each Trustee serves until the election and qualification of a successor, or until death, resignation or retirement or removal as provided in the Fund’s Declaration of Trust. Retirement for non-interested Trustees occurs no later than at the conclusion of the first regularly scheduled Board meeting of the Fund’s fiscal year that occurs after the earlier of (a) the non-interested Trustee’s 72nd birthday or (b) the 15th anniversary of the date that the non-interested Trustee was first elected or appointed as a member of the Board of Trustees. The Fund’s officers, except the Chief Compliance Officer, are elected annually by the Trustees. The Fund’s Chief Compliance Officer is designated by the Board of Trustees and may only be removed by action of the Board of Trustees, including a majority of the non-interested Trustees. |
| (2) | | In November 2008, all partners of William Blair & Company, L.L.C. also became limited partners in WB Holdings, L.P. |
The Statement of Additional Information for the William Blair Funds includes additional information about the trustees and is available without charge by calling 1-800-635-2886 (in Massachusetts 1-800-635-2840) or by writing the Fund.
158 Semi-Annual Report | June 30, 2012 |
Renewal of the Trust’s Management Agreement
On April 24, 2012, the Board of Trustees (the “Board”) of the William Blair Funds (the “Trust”), including the Trustees who are not “interested persons” of the Trust as defined in the Investment Company Act of 1940, as amended (the “Independent Trustees”), approved the renewal for an additional one-year term of the Trust’s Management Agreement with William Blair & Company, L.L.C. (the “Advisor”), on behalf of each of the William Blair Growth Fund, the William Blair Large Cap Growth Fund, the William Blair Small Cap Growth Fund, the William Blair Mid Cap Growth Fund, the William Blair Small-Mid Cap Growth Fund, the William Blair Global Growth Fund, the William Blair International Growth Fund, the William Blair International Equity Fund, the William Blair International Small Cap Growth Fund, the William Blair Emerging Markets Growth Fund, the William Blair Emerging Leaders Growth Fund, the William Blair Small Cap Value Fund, the William Blair Mid Cap Value Fund, the William Blair Bond Fund, the William Blair Income Fund, the William Blair Low Duration Fund and the William Blair Ready Reserves Fund (each, a “Fund” and collectively, the “Funds”). In deciding to approve the renewal of the Management Agreement, the Board did not identify any single factor or group of factors as all important or controlling and considered all factors together.
The information in this summary outlines the Board’s considerations associated with its renewal of the Management Agreement. In connection with its deliberations regarding the continuation of the Management Agreement, the Board considered such information and factors as it believed to be relevant. As described below, the Board considered the nature, extent and quality of the services performed by the Advisor under the existing Management Agreement; comparative management fees and expense ratios as prepared by an independent provider (Lipper Inc.); the estimated profits realized by the Advisor; the extent to which the Advisor realizes economies of scale as a Fund grows; and whether any fall-out benefits are being realized by the Advisor. In addition, the Independent Trustees discussed the renewal of the Management Agreement with Fund management and in private sessions with independent legal counsel at which no representatives of the Advisor were present.
The Board, including the Independent Trustees, considered the renewal of the Management Agreement pursuant to a process that concluded at the Board’s April 24, 2012 meeting. In preparation for the review process, the Independent Trustees met with independent legal counsel and discussed the type and nature of information to be requested and independent legal counsel sent a formal request for information to Trust management. The Advisor provided extensive information in response to the request. After reviewing the information received, the Independent Trustees requested supplemental information, which the Advisor provided in writing and/or orally. The Independent Trustees reviewed comparative performance and comparative advisory fees and expense ratios for a peer group and a peer universe of funds provided by Lipper for each Fund. In addition, the Independent Trustees considered: (i) materials describing the nature, quality and extent of services provided by the Advisor; (ii) information comparing the performance of each Fund to one or more relevant securities indexes; (iii) information comparing advisory fees of each Fund to fees charged by the Advisor to other funds and client accounts with similar investment strategies; (iv) the estimated allocated direct or indirect costs of services provided and estimated profits realized by the Advisor for both the Trust as a whole and each Fund individually; and (v) information describing other benefits to the Advisor resulting from its relationship with the Funds. The Independent Trustees also noted that they receive information from the Advisor regarding the Funds throughout the year in connection with regular Board meetings, including presentations from portfolio managers. The Independent Trustees also received a memorandum from independent legal counsel advising them of their duties and responsibilities in connection with the review of the Management Agreement. Finally, the Advisor made an in-person presentation to the Independent Trustees regarding the contract review information, including addressing the supplemental information requests, and answered questions from the Independent Trustees.
On April 16, 23 and 24, 2012, the Independent Trustees met independently of Trust management and of the interested Trustees to review and discuss with independent legal counsel the information provided by the Advisor, Lipper and independent legal counsel. The Independent Trustees noted that in evaluating the Management Agreement, they were taking into account their accumulated experience as Board members in working with the Advisor on matters relating to the Funds. Based on their review, the Independent Trustees concluded that it was in the best interest of each Fund to renew the Management Agreement and recommended to the Board the renewal of the Management Agreement. The Board considered the recommendation of the Independent Trustees along with the other factors that the Board deemed relevant.
Nature, Quality and Extent of Services. In evaluating the nature, quality and extent of the services provided by the Advisor to the Funds, the Board noted that the Advisor is a quality firm with a reputation for integrity and honesty that employs high quality people and has a long association with the Funds, in each case other than the Growth Fund, since the inception of the Funds. The Trustees believe that a long-term relationship with a capable, conscientious advisor is in the best interests of shareholders and that shareholders have invested in the Funds knowing that the Advisor managed the Funds and knowing the
June 30, 2012 | William Blair Funds 159 |
investment advisory fee. The Board considered biographical information about the Trust’s officers and the Funds’ portfolio managers, including information on the portfolio managers’ investments in the Funds. The Board also considered the administrative services performed by the Advisor, financial information regarding the Advisor, the Advisor’s execution quality and use of soft dollars, the compliance regime overseen by the Advisor, and the Advisor’s expense limitations in place for certain Funds. The Board was also provided with information pertaining to the Advisor’s organizational structure and senior management. The Board noted that the Advisor pays the compensation of all of the officers and the interested Trustees of the Trust.
The Board reviewed information on the annualized total returns of each Fund for the one, three, five and ten year periods ended December 31, 2011, as applicable, along with annualized total return information for the Lipper performance peer universe of funds and one or more relevant securities indexes. The Lipper performance peer universe for each Fund included all funds with a similar investment style as classified by Lipper regardless of asset size or primary channel of distribution. With respect to the comparative performance information generally, the Board considered the Advisor’s statement that it is committed to managing each Fund consistently with the Fund’s stated investment strategies through all market environments and that, as a result, the Funds’ relative performance compared to the Lipper performance peer universe and relevant securities indexes from year to year will be affected by whether the market environment favors or disfavors certain of the Advisor’s investment strategies, but that the Advisor seeks to provide superior performance over the long term. The Trustees reviewed each Fund’s ranking in its Lipper performance peer universe during the applicable periods, and based on that review, requested and discussed with the Advisor additional information regarding the performance of the International Equity Fund, the Large Cap Growth Fund, the Small Cap Growth Fund and the Small Cap Value Fund. With respect to the International Equity Fund, the Board considered the Advisor’s statement that the Fund’s lower allocations to emerging markets and small-cap securities relative to its peer funds had contributed to relative underperformance in recent periods. With respect to the Large Cap Growth Fund, the Board considered the changes made by the Advisor in the Fund’s portfolio management team and the recent improved performance of the Fund. With respect to the Small Cap Growth Fund, the Board noted the Fund’s recent underperformance relative to its Lipper performance peer universe and discussed the Fund’s performance with the Advisor. The Board also considered the Fund’s longer-term performance, noting that the Fund’s annualized total returns over the three- and ten-year periods ended December 31, 2011 were above the average of its Lipper performance peer universe, but that the Fund’s annualized total return over the five-year period ended December 31, 2011 was below the average of its Lipper performance peer universe. With respect to the Small Cap Value Fund, the Board noted the Fund’s recent underperformance relative to its Lipper performance peer universe and discussed the Fund’s performance with the Advisor. The Board also considered the Fund’s longer-term performance, noting that, while the Fund’s annualized total return over the three-year period ended December 31, 2011 was slightly below the average of its Lipper performance peer universe, its annualized total returns over the five- and ten-year periods ended December 31, 2011 were above the average of its Lipper performance peer universe.
Based upon all relevant factors, the Board concluded that the nature, quality and extent of the services provided by the Advisor to each Fund were satisfactory.
Fees and Expenses. The Board reviewed each Fund’s advisory fee and expense ratio and reviewed information comparing the advisory fee and expense ratio to those of a Lipper expense peer group and Lipper expense peer universe for each Fund. The Lipper expense peer group for each Fund consisted of a group of funds with a similar investment style as classified by Lipper, distribution channel and asset size as the Fund. The Lipper expense peer universe for each Fund consisted of all funds with a similar investment style as classified by Lipper and distribution channel as the Fund. For each Fund, the Board also reviewed amounts charged by the Advisor to other pooled investment vehicles, including other registered funds for which the Advisor acts as a subadvisor, and the Advisor’s fee schedule for institutional separate accounts. With respect to other pooled investment vehicles and institutional separate accounts, the Board considered the Advisor’s statement that both the mix of services provided to the Funds and the additional regulatory responsibilities associated with sponsoring registered investment companies were greater as compared to the work involved for other pooled investment vehicles and separate accounts. In addition, the Board considered the Advisor’s statement that institutional separate accounts are distributed differently, operate under different investment and regulatory structures and have different business risks as compared to the Funds.
In considering the Lipper information, the Board noted that the contractual advisory fees for the Growth Fund, the International Small Cap Growth Fund, the Emerging Markets Growth Fund, the Bond Fund, the Income Fund, the Low Duration Fund and the Ready Reserves Fund were at or below the average advisory fees of their Lipper expense peer group. The Board also noted that the contractual advisory fees for the Large Cap Growth Fund, the Small Cap Growth Fund, the Mid Cap Growth Fund, the Small-Mid Cap Growth Fund, the Global Growth Fund, the International Growth Fund, the International Equity Fund, the Emerging Leaders Growth Fund, the Small Cap Value Fund and the Mid Cap Value Fund
160 Semi-Annual Report | June 30, 2012 |
were above the average advisory fees of their Lipper expense peer group, but that each Fund’s advisory fee was within range of the average advisory fees of its Lipper expense peer group. The Board also considered that the Advisor had proposed to contractually limit total expenses for the Large Cap Growth Fund, the Small Cap Growth Fund, the Mid Cap Growth Fund, the Small-Mid Cap Growth Fund, the Global Growth Fund, the International Growth Fund, the International Equity Fund, the International Small Cap Growth Fund, the Emerging Markets Growth Fund, the Emerging Leaders Growth Fund, the Small Cap Value Fund, the Mid Cap Value Fund, the Bond Fund, the Income Fund and the Low Duration Fund. The Board also considered that the Advisor intended to continue to voluntarily waive or reimburse certain operating expenses of the Ready Reserves Fund to maintain a positive yield for the Fund. On the basis of the information provided, the Board concluded that each Fund’s advisory fee, coupled with applicable expense limitations, was reasonable.
Profitability. With respect to the profitability of the Management Agreement to the Advisor, the Board considered the overall fees paid under the Management Agreement, including the estimated allocated costs of the services provided and profits realized by the Advisor from its relationship with the Trust as a whole and each Fund individually. The Board concluded that the estimated profits realized by the Advisor were not unreasonable.
Economies of Scale. The Board considered the extent to which economies of scale would be realized as the Funds grow and whether fee levels reflect these economies of scale for the benefit of investors. The Board noted the Advisor’s representation that certain Fund expenses are relatively fixed and unrelated to asset size and that the Advisor may enjoy some economies of scale as a Fund’s assets grow. The Board also noted that the Advisor increased the number of personnel working on Fund matters during 2011. In considering whether fee levels reflect economies of scale for the benefit of Fund investors, the Board reviewed each Fund’s asset size, breakpoints for those Funds with breakpoints in the advisory fee schedule, the Fund’s total and net expense ratios and the expense limitations in place and/or proposed, and concluded that in the aggregate they reasonably reflect appropriate recognition of any economies of scale.
Other Benefits to the Advisor. The Board considered benefits derived by the Advisor from its relationship with the Funds, including (i) non-advisory fee revenue from the Funds in the form of shareholder administration fees, service fees and/or distribution fees and the payment of some or all of those revenues to affiliates or third parties, (ii) soft dollars, which pertain primarily to the Funds investing in equity securities, and (iii) favorable media coverage. The Board concluded that, taking into account these benefits, each Fund’s advisory fee was reasonable.
Conclusion. Based upon all of the information considered and the conclusions reached, the Board determined that the terms of the Management Agreement continue to be fair and reasonable and that the continuation of the Management Agreement is in the best interests of each Fund.
June 30, 2012 | William Blair Funds 161 |
(unaudited)
Proxy Voting
A description of the policies and procedures that the Fund uses to determine how to vote proxies relating to portfolio securities and information regarding how the Fund voted proxies relating to portfolio securities for the most recent 12-month period ended June 30 are available without charge, upon request, by calling 1-800-635-2886 (in Massachusetts 1-800-635-2840), at www.williamblairfunds.com and on the SEC’s website at http://www.sec.gov.
Quarterly Portfolio Schedules
Each Portfolio files its complete schedule of portfolio holdings with the SEC for the first and third fiscal quarters of each fiscal year (quarters ended March 31 and September 30) on Form N-Q. The Fund’s Forms N-Q are available on the SEC’s website at http://www.sec.gov and may be reviewed and copied at the SEC’s Public Reference Room in Washington, D.C. Information on the operation of the SEC’s Public Reference Room may be obtained by calling 1-800-SEC-0330. The Fund’s Forms N-Q are also available on the Fund’s website at www.williamblairfunds.com.
Additional Federal Income Tax Information: (unaudited)
Under Section 852(b)(3)(C) of the Code, the Funds hereby designate the following amounts as capital gain dividends for the fiscal year ended December 31, 2011:
| | | | | | |
| | | |
Growth | | Mid Cap Growth | | Small-Mid Cap Growth | | Emerging Markets Growth |
$16,081,067 | | $11,056,640 | | $18,645,732 | | $115,030,166 |
| | | |
Bond | | Emerging Leaders Growth | | Small Cap Value | | Mid Cap Value |
$1,831,187 | | $2,732,548 | | $8,247,756 | | $36,445 |
The following table provides the percentage of the 2011 year-end distributions that qualify for the dividend received deduction, and the qualified dividend income percentage:
| | | | | | | | |
Portfolio | | Dividend
Received
Deduction% | | | Qualified
Dividend
Income% | |
Growth | | | 100.00 | % | | | 100.00 | % |
Large Cap Growth | | | 100.00 | % | | | 100.00 | % |
Small Cap Growth | | | 0.00 | % | | | 0.00 | % |
Mid Cap Growth | | | 0.00 | % | | | 0.00 | % |
Small-Mid Cap Growth | | | 29.37 | % | | | 31.29 | % |
Global Growth | | | 100.00 | % | | | 100.00 | % |
International Growth | | | 0.00 | % | | | 100.00 | % |
International Equity | | | 0.00 | % | | | 0.00 | % |
International Small Cap Growth | | | 0.00 | % | | | 100.00 | % |
Emerging Markets Growth | | | 0.10 | % | | | 100.00 | % |
Emerging Leaders Growth | | | 0.00 | % | | | 100.00 | % |
Emerging Markets Small Cap Growth | | | 0.00 | % | | | 0.00 | % |
Large Cap Value | | | 100.00 | % | | | 100.00 | % |
Small Cap Value | | | 100.00 | % | | | 100.00 | % |
Mid Cap Value | | | 92.41 | % | | | 100.00 | % |
Small-Mid Cap Value | | | 0.00 | % | | | 0.00 | % |
Bond | | | 0.00 | % | | | 0.00 | % |
Income | | | 0.00 | % | | | 0.00 | % |
Low Duration | | | 0.00 | % | | | 0.00 | % |
Ready Reserves | | | 0.00 | % | | | 0.00 | % |
In January 2012, you were notified on IRS Form 1099-Div or substitute 1099 DIV as to the Federal tax status of the distributions received by you in the calendar year 2011.
162 Semi-Annual Report | June 30, 2012 |
Useful Information About Your Report (unaudited)
Please refer to this information when reviewing the Expense Example for each Fund.
Expense Example
As a shareholder of a Fund, you incur two types of costs: (1) transaction costs such as redemption fees and (2) ongoing costs, including management fees, distribution (12b-1) fees (for Class N shares except for the Ready Reserves Fund), service fees (for Class N shares of the Ready Reserves Fund), shareholder administration fees (for Class N and Class I shares of the Global Growth Fund, the International Small Cap Growth Fund, the Emerging Markets Growth Fund, the Emerging Leaders Growth Fund, the Emerging Markets Small Cap Growth Fund, the Bond Fund and the Low Duration Fund) and other Fund expenses. The example is intended to help you understand your ongoing costs (in dollars) of investing in the Fund and to compare these costs with the ongoing costs of investing in other mutual funds. To do so, compare the Fund’s 5% hypothetical example with the 5% hypothetical examples that appear in the shareholder reports of other funds. The example is based on an investment of $1,000 invested at the beginning of the period and held for the entire six-month period from January 1, 2012 to June 30, 2012.
Actual Expenses
In each example, the first line for each share class in the table provides information about the actual account values and actual expenses. These expenses reflect the effect of any expense cap applicable to the share class during the period. Without this expense cap, the costs shown in the table would have been higher. You may use the information in this line, together with the amount you invested, to estimate the expenses that you paid over the period. Simply divide your account value by $1,000 (example, an $8,600 account value divided by $1,000 = 8.6), then multiply the result by the number in the first line under the heading entitled “Expenses Paid During the Period” to estimate the expenses you paid on your account during the period.
Hypothetical Example for Comparison Purposes
In each example, the second line for each share class in the table provides information about hypothetical account values and hypothetical expenses based on the Fund’s actual expense ratio and an assumed rate of return of 5% per year before expenses. This is not the Fund’s actual return. The hypothetical account values and expenses may not be used to estimate the actual ending account balance or expenses you paid for the period. You may use this information to compare the ongoing costs of investing in the Fund to other funds. To do so, compare this 5% hypothetical example with the 5% hypothetical examples that appear in the shareholder reports of other funds.
Please note that the expenses shown in both examples are meant to highlight your ongoing costs only and do not reflect any transactional costs or account type fees, such as redemption fees and IRA Fiduciary Administration fees, respectively. These fees are fully described in the prospectus. Therefore, the second line of each share class in the table is useful in comparing ongoing costs only and will not help you determine the relative costs of owning different funds. In addition, if these transactional costs or account fees were included, your costs would have been higher.
June 30, 2012 | William Blair Funds 163 |
Fund Expenses (unaudited)
The examples below show you the ongoing costs (in dollars) of investing in your fund and allows you to compare these costs with those of other mutual funds. Please refer to the previous page for a detailed explanation of the information presented on this chart.
| | | | | | | | | | | | | | | | |
Expense Example | | Beginning
Account Value
1/1/2012 | | | Ending
Account Value
6/30/2012 | | | Expenses Paid
During
the Period(a) | | | Annualized
Expense Ratio | |
Growth Fund | | | | | | | | | | | | | | | | |
Class N—actual return | | $ | 1,000.00 | | | $ | 1,089.50 | | | $ | 6.20 | | | | 1.19 | % |
Class N—hypothetical 5% return | | | 1,000.00 | | | | 1,018.93 | | | | 5.99 | | | | 1.19 | |
Class I—actual return | | | 1,000.00 | | | | 1,091.20 | | | | 4.52 | | | | 0.87 | |
Class I—hypothetical 5% return | | | 1,000.00 | | | | 1,020.54 | | | | 4.37 | | | | 0.87 | |
Large Cap Growth Fund | | | | | | | | | | | | | | | | |
Class N—actual return | | | 1,000.00 | | | | 1,120.60 | | | | 6.33 | | | | 1.20 | |
Class N—hypothetical 5% return | | | 1,000.00 | | | | 1,018.90 | | | | 6.02 | | | | 1.20 | |
Class I—actual return | | | 1,000.00 | | | | 1,123.80 | | | | 5.02 | | | | 0.95 | |
Class I—hypothetical 5% return | | | 1,000.00 | | | | 1,020.14 | | | | 4.77 | | | | 0.95 | |
Small Cap Growth Fund | | | | | | | | | | | | | | | | |
Class N—actual return | | | 1,000.00 | | | | 1,091.90 | | | | 7.80 | | | | 1.50 | |
Class N—hypothetical 5% return | | | 1,000.00 | | | | 1,017.40 | | | | 7.52 | | | | 1.50 | |
Class I—actual return | | | 1,000.00 | | | | 1,093.30 | | | | 6.51 | | | | 1.25 | |
Class I—hypothetical 5% return | | | 1,000.00 | | | | 1,018.65 | | | | 6.27 | | | | 1.25 | |
Mid Cap Growth Fund | | | | | | | | | | | | | | | | |
Class N—actual return | | | 1,000.00 | | | | 1,070.30 | | | | 6.95 | | | | 1.35 | |
Class N—hypothetical 5% return | | | 1,000.00 | | | | 1,018.15 | | | | 6.77 | | | | 1.35 | |
Class I—actual return | | | 1,000.00 | | | | 1,072.50 | | | | 5.41 | | | | 1.05 | |
Class I—hypothetical 5% return | | | 1,000.00 | | | | 1,019.64 | | | | 5.27 | | | | 1.05 | |
Small-Mid Cap Growth Fund | | | | | | | | | | | | | | | | |
Class N—actual return | | | 1,000.00 | | | | 1,050.00 | | | | 6.88 | | | | 1.35 | |
Class N—hypothetical 5% return | | | 1,000.00 | | | | 1,018.15 | | | | 6.77 | | | | 1.35 | |
Class I—actual return | | | 1,000.00 | | | | 1,051.10 | | | | 5.61 | | | | 1.10 | |
Class I—hypothetical 5% return | | | 1,000.00 | | | | 1,019.39 | | | | 5.52 | | | | 1.10 | |
Global Growth Fund | | | | | | | | | | | | | | | | |
Class N—actual return | | | 1,000.00 | | | | 1,086.40 | | | | 7.78 | | | | 1.50 | |
Class N—hypothetical 5% return | | | 1,000.00 | | | | 1,017.40 | | | | 7.52 | | | | 1.50 | |
Class I—actual return | | | 1,000.00 | | | | 1,087.80 | | | | 6.49 | | | | 1.25 | |
Class I—hypothetical 5% return | | | 1,000.00 | | | | 1,018.65 | | | | 6.27 | | | | 1.25 | |
International Growth Fund | | | | | | | | | | | | | | | | |
Class N—actual return | | | 1,000.00 | | | | 1,076.60 | | | | 7.49 | | | | 1.45 | |
Class N—hypothetical 5% return | | | 1,000.00 | | | | 1,017.65 | | | | 7.27 | | | | 1.45 | |
Class I—actual return | | | 1,000.00 | | | | 1,078.00 | | | | 6.01 | | | | 1.16 | |
Class I—hypothetical 5% return | | | 1,000.00 | | | | 1,019.08 | | | | 5.84 | | | | 1.16 | |
International Equity Fund | | | | | | | | | | | | | | | | |
Class N—actual return | | | 1,000.00 | | | | 1,045.50 | | | | 7.37 | | | | 1.45 | |
Class N—hypothetical 5% return | | | 1,000.00 | | | | 1,017.65 | | | | 7.27 | | | | 1.45 | |
Class I—actual return | | | 1,000.00 | | | | 1,046.90 | | | | 6.11 | | | | 1.20 | |
Class I—hypothetical 5% return | | | 1,000.00 | | | | 1,018.90 | | | | 6.02 | | | | 1.20 | |
International Small Cap Growth Fund | | | | | | | | | | | | | | | | |
Class N—actual return | | | 1,000.00 | | | | 1,061.60 | | | | 8.33 | | | | 1.63 | |
Class N—hypothetical 5% return | | | 1,000.00 | | | | 1,016.78 | | | | 8.15 | | | | 1.63 | |
Class I—actual return | | | 1,000.00 | | | | 1,062.80 | | | | 6.63 | | | | 1.29 | |
Class I—hypothetical 5% return | | | 1,000.00 | | | | 1,018.44 | | | | 6.48 | | | | 1.29 | |
| (a) | | Expenses are equal to the annualized expense ratio, multiplied by the average account value over the period, multiplied by the number of days in the period 182, and divided by 366 (to reflect the one-half year period). |
164 Semi-Annual Report | June 30, 2012 |
| | | | | | | | | | | | | | | | |
Expense Example | | Beginning
Account Value
1/1/2012 | | | Ending
Account Value
6/30/2012 | | | Expenses Paid
During
the Period(a) | | | Annualized
Expense Ratio | |
Emerging Markets Growth Fund | | | | | | | | | | | | | | | | |
Class N—actual return | | $ | 1,000.00 | | | $ | 1,070.80 | | | $ | 8.68 | | | | 1.69 | % |
Class N—hypothetical 5% return | | | 1,000.00 | | | | 1,016.48 | | | | 8.45 | | | | 1.69 | |
Class I—actual return | | | 1,000.00 | | | | 1,072.90 | | | | 7.17 | | | | 1.39 | |
Class I—hypothetical 5% return | | | 1,000.00 | | | | 1,017.94 | | | | 6.98 | | | | 1.39 | |
Emerging Leaders Growth Fund | | | | | | | | | | | | | | | | |
Class N—actual return | | | 1,000.00 | | | | 1,069.00 | | | | 8.49 | | | | 1.65 | |
Class N—hypothetical 5% return | | | 1,000.00 | | | | 1,016.66 | | | | 8.27 | | | | 1.65 | |
Class I—actual return | | | 1,000.00 | | | | 1,069.20 | | | | 7.20 | | | | 1.40 | |
Class I—hypothetical 5% return | | | 1,000.00 | | | | 1,017.90 | | | | 7.02 | | | | 1.40 | |
Emerging Markets Small Cap Growth Fund | | | | | | | | | | | | | | | | |
Class N—actual return | | | 1,000.00 | | | | 1,142.90 | | | | 8.79 | | | | 1.65 | |
Class N—hypothetical 5% return | | | 1,000.00 | | | | 1,016.66 | | | | 8.27 | | | | 1.65 | |
Class I—actual return | | | 1,000.00 | | | | 1,144.90 | | | | 7.47 | | | | 1.40 | |
Class I—hypothetical 5% return | | | 1,000.00 | | | | 1,017.90 | | | | 7.02 | | | | 1.40 | |
Large Cap Value Fund | | | | | | | | | | | | | | | | |
Class N—actual return | | | 1,000.00 | | | | 1,091.50 | | | | 6.24 | | | | 1.20 | |
Class N—hypothetical 5% return | | | 1,000.00 | | | | 1,018.90 | | | | 6.02 | | | | 1.20 | |
Class I—actual return | | | 1,000.00 | | | | 1,093.50 | | | | 4.94 | | | | 0.95 | |
Class I—hypothetical 5% return | | | 1,000.00 | | | | 1,020.14 | | | | 4.77 | | | | 0.95 | |
Small Cap Value Fund | | | | | | | | | | | | | | | | |
Class N—actual return | | | 1,000.00 | | | | 1,054.60 | | | | 7.20 | | | | 1.41 | |
Class N—hypothetical 5% return | | | 1,000.00 | | | | 1,017.65 | | | | 7.07 | | | | 1.41 | |
Class I—actual return | | | 1,000.00 | | | | 1,055.30 | | | | 5.93 | | | | 1.16 | |
Class I—hypothetical 5% return | | | 1,000.00 | | | | 1,019.14 | | | | 5.82 | | | | 1.16 | |
Mid Cap Value Fund | | | | | | | | | | | | | | | | |
Class N—actual return | | | 1,000.00 | | | | 1,046.80 | | | | 6.87 | | | | 1.35 | |
Class N—hypothetical 5% return | | | 1,000.00 | | | | 1,018.15 | | | | 6.77 | | | | 1.35 | |
Class I—actual return | | | 1,000.00 | | | | 1,047.70 | | | | 5.60 | | | | 1.10 | |
Class I—hypothetical 5% return | | | 1,000.00 | | | | 1,019.39 | | | | 5.52 | | | | 1.10 | |
Small-Mid Cap Value Fund | | | | | | | | | | | | | | | | |
Class N—actual return | | | 1,000.00 | | | | 1,045.90 | | | | 7.12 | | | | 1.40 | |
Class N—hypothetical 5% return | | | 1,000.00 | | | | 1,017.90 | | | | 7.02 | | | | 1.40 | |
Class I—actual return | | | 1,000.00 | | | | 1,046.90 | | | | 5.85 | | | | 1.15 | |
Class I—hypothetical 5% return | | | 1,000.00 | | | | 1,019.14 | | | | 5.77 | | | | 1.15 | |
Bond Fund | | | | | | | | | | | | | | | | |
Class N—actual return | | | 1,000.00 | | | | 1,039.30 | | | | 3.30 | | | | 0.65 | |
Class N—hypothetical 5% return | | | 1,000.00 | | | | 1,021.63 | | | | 3.27 | | | | 0.65 | |
Class I—actual return | | | 1,000.00 | | | | 1,040.30 | | | | 2.54 | | | | 0.50 | |
Class I—hypothetical 5% return | | | 1,000.00 | | | | 1,022.38 | | | | 2.51 | | | | 0.50 | |
Income Fund | | | | | | | | | | | | | | | | |
Class N—actual return | | | 1,000.00 | | | | 1,029.40 | | | | 4.12 | | | | 0.82 | |
Class N—hypothetical 5% return | | | 1,000.00 | | | | 1,020.81 | | | | 4.10 | | | | 0.82 | |
Class I—actual return | | | 1,000.00 | | | | 1,030.80 | | | | 2.88 | | | | 0.57 | |
Class I—hypothetical 5% return | | | 1,000.00 | | | | 1,022.02 | | | | 2.87 | | | | 0.57 | |
Low Duration Fund | | | | | | | | | | | | | | | | |
Class N—actual return | | | 1,000.00 | | | | 1,015.90 | | | | 3.51 | | | | 0.70 | |
Class N—hypothetical 5% | | | 1,000.00 | | | | 1,021.38 | | | | 3.52 | | | | 0.70 | |
Class I—actual return | | | 1,000.00 | | | | 1,016.70 | | | | 2.76 | | | | 0.55 | |
Class I—hypothetical 5% | | | 1,000.00 | | | | 1,022.13 | | | | 2.77 | | | | 0.55 | |
Ready Reserve Fund | | | | | | | | | | | | | | | | |
Class N—actual return | | | 1,000.00 | | | | 1,000.00 | | | | 0.62 | | | | 0.13 | |
Class N—hypothetical 5% return | | | 1,000.00 | | | | 1,024.24 | | | | 0.63 | | | | 0.13 | |
| (a) | | Expenses are equal to the annualized expense ratio, multiplied by the average account value over the period, multiplied by the number of days in the period 182, and divided by 366 (to reflect the one-half year period). |
June 30, 2012 | William Blair Funds 165 |
BOARD OF TRUSTEES
Phillip O. Peterson
Retired Partner, KPMG LLP
Lisa A. Pollina
Senior Advisor to RBC Financial Group—International Banking and Insurance Division
Donald J. Reaves
Chancellor, Winston-Salem State University
Donald L. Seeley
Retired Adjunct Lecturer and Director, University of Arizona Department of Finance
Michelle R. Seitz, Chairman and President
Partner, William Blair & Company, L.L.C.,
Thomas J. Skelly
Retired Managing Partner, Accenture U.S.
Richard W. Smirl, Senior Vice President
Partner, William Blair & Company L.L.C.
Officers
Michael P. Balkin, Senior Vice President
Karl W. Brewer, Senior Vice President
David C. Fording, Senior Vice President
James S. Golan, Senior Vice President
W. George Greig, Senior Vice President
Michael A. Jancosek, Senior Vice President
John F. Jostrand, Senior Vice President
Chad M. Kilmer, Senior Vice President
Robert C. Lanphier, IV, Senior Vice President
Mark T. Leslie, Senior Vice President
Matthew A. Litfin, Senior Vice President
Kenneth J. McAtamney, Senior Vice President
Todd M. McClone, Senior Vice President
David Merjan, Senior Vice President
David S. Mitchell, Senior Vice President
David P. Ricci, Senior Vice President
Brian D. Singer, Senior Vice President
Paul J. Sularz, Senior Vice President
Jeffrey A. Urbina, Senior Vice President
Christopher T. Vincent, Senior Vice President
Kathleen M. Lynch, Vice President
David F. Hone, Vice President
John Abunassar, Vice President
Peter Carl, Vice President
D. Trowbridge Elliman III, Vice President
Christopher Walvoord, Vice President
Brian Ziv, Vice President
Edwin Denson, Vice President
Thomas Clarke, Vice President
Walter R. Randall, Jr., Chief Compliance Officer and Assistant Secretary
Colette M. Garavalia, Treasurer
Andrew T. Pfau, Secretary
John M. Raczek, Assistant Treasurer
Investment Advisor
William Blair & Company, L.L.C.
Independent Registered Public Accounting Firm
Ernst & Young LLP
Legal Counsel
Vedder Price P.C.
Transfer Agent
Boston Financial Data Services, Inc.
P.O. Box 8506
Boston, MA 02266-8506
For customer assistance, call 1-800-635-2886
(Massachusetts 1-800-635-2840)
166 Semi-Annual Report | June 30, 2012 |
William Blair Funds
| | | | |
EQUITY | | GLOBAL EQUITY | | FIXED-INCOME |
Growth Fund | | Global Growth Fund | | Bond Fund |
Large Cap Growth Fund | | | | Income Fund |
Small Cap Growth Fund | | INTERNATIONAL EQUITY | | Low Duration Fund |
Mid Cap Growth Fund | | International Growth Fund | | |
Small-Mid Cap Growth Fund | | International Equity Fund | | MONEY MARKET |
Large Cap Value Fund | | International Small Cap Growth Fund | | Ready Reserves Fund |
Small Cap Value Fund | | Emerging Markets Growth Fund | | |
Mid Cap Value Fund | | Emerging Leaders Growth Fund | | |
Small-Mid Cap Value Fund | | Emerging Markets Small Cap Growth Fund | | |
| | | | |
| | | | ©William Blair & Company, L.L.C., distributor |
 | | +1 800 742 7272 williamblairfunds.com | | 222 West Adams Street Chicago, Illinois 60606 |

William Blair Funds
Institutional
Semiannual Report
June 30, 2012
Table of Contents
The views expressed in the commentary for each Fund reflect those of the portfolio management team only through the end of the period of the report as stated on the cover. The portfolio management team’s views are subject to change at any time based on market and other conditions and should not be construed as a recommendation. Statements involving predictions, assessments, analyses, or outlook for individual securities, industries, market sectors, and/or markets involve risks and uncertainties, and there is no guarantee they will come to pass.
This report is submitted for the general information of the shareholders of the William Blair Funds. It is not authorized for distribution to prospective investors unless accompanied or preceded by a prospectus of the William Blair Funds. Please consider the Funds’ investment objectives, risks, charges, and expenses before investing. This and other information is contained in the Funds’ prospectus, which you may obtain by calling 1-800-742-7272. Read it carefully before you invest or send money. William Blair & Company, LLC., distributor.
June 30, 2012 | William Blair Funds 1 |
GLOBAL MARKETS OVERVIEW
The global growth scare that began in March continued through the second quarter, leading equity markets into negative territory. In addition, increased concerns about the viability of the Eurozone and remedies for significant bank and sovereign debt, a volatile Greek election cycle, and doubts about the wherewithal and will of European governments to forge tighter fiscal and monetary integration, weighed on the equity markets. Following a significant decline in March through May, the markets rebounded in June on expectations of a broad agreement on the European Stability Mechanism (ESM) lending directly to banks without seniority, more discussions of a pan-European regulator and deposit insurance, and the prospects for growth-oriented measures through the EIB (European Investment Bank). Despite the nearly 5% rally in June, the MSCI ACWI IMI fell 5.68% during the second quarter, paring year to date gains to 5.76%. High quality companies outperformed during the second quarter, as did those with strong earnings trends, price momentum, and good growth prospects. Year to date companies with lower valuations performed well, due to a rally in these companies during the beginning of the year, along with those exhibiting higher quality and growth characteristics.
Most sectors retreated during the second quarter with the Resources sectors—Materials and Energy—leading the decline, falling 11.16% and 9.58%, respectively, on expectations of slower emerging markets infrastructure spending and resources demand, coupled with recessionary pressures in Europe. Telecom Services and Healthcare each had positive returns, rising 2.55% and 1.32%, respectively, while Utilities and Staples were each slightly negative. Despite negative second quarter results, most sectors remained in solid positive territory year to date, with Information Technology (IT), Healthcare, and Discretionary up 9.91%, 9.88% and 9.67%, respectively, while Energy and Materials underperformed, falling 4.85% and 1.65%, respectively.
The MSCI World Index IMI fell 5.23% during the second quarter, resulting in a year to date return of 5.98%. The U.S. Dollar was strong relative to most other currencies during the period, as the U.S. was viewed as a relative safe haven. The U.S. led developed market regions during the quarter, falling 3.33%, per the MSCI developed markets national (IMI) indices. Europe Ex-U.K. was the worst performing developed region, falling 9.49%, as Greece and Portugal fell over 20% and 17%, respectively, and as core European markets also lagged. The natural-resource oriented Canadian market fell 8.48% during the period. Year to date, the U.S. rose 9.01%, significantly outpacing other developed market regions, although all regions except Canada had positive returns. While Europe Ex-U.K. rose 2.14% during the first half of the year, this result masked significantly different results by country, as Greece, Portugal and Spain all fell between 12-16%, while countries such as Denmark and Belgium were each up approximately the same amount. While the MSCI World Index Small Cap fell 6.31% during the second quarter, underperforming their larger cap counterparts across most regions, with the exception of Japan, they outpaced large cap stocks year to date, rising 6.34%, led by the UK and the US.
After outpacing developed markets during the first quarter, the MSCI Emerging Markets IMI lagged during the second, falling 8.79%, reducing year to date returns to 4.31%. Latin America fell over 13%, dragged down by Brazil, which fell 18.64%, on concerns about slowing growth amidst lower resource oriented demand, and a weakening Real. Conversely, Mexico performed relatively well, falling just over 1%. Emerging Europe, Mid-East, and Africa (EMEA) fell 8.14% during the second quarter, as Russia (14.67%) led the decline both on resource demand concerns and amidst USD appreciation, which more than offset the 0.71% Turkey return. Asia fell 7.43%, as weaker results in India and Taiwan were partially offset by a positive 4.71% Philippines return, and -5-6% returns for China and Thailand. Year to date all emerging markets regions posted positive results, with EMEA rising 6.81%, as Egypt rose nearly 34% despite ongoing political unrest and as Turkey rose over 29%. Emerging Asia was up just over 5%, as the Philippines and Thailand posted double digit returns and as India outperformed during the first quarter. Latin America eked out a slightly positive return, despite the -6.93% Brazilian market return, given strong market performance in Chile, Mexico and Peru.
2 Semi-Annual Report | June 30, 2012 |
As doubts about sovereign debt and banking solvency were alleviated in the first quarter, markets rallied. But apprehension quickly reasserted itself in the second quarter, with weakening growth replacing balance sheet woes as the focus of concern. Austerity and falling business confidence in Europe, combined with an industrial slowdown in China that seemed to spread out to the rest of the emerging world, lowered expectations for global growth and eroded belief in the effectiveness of policy.
The Eurozone is almost certainly in recession already, with the latest industrial production reading down by more than 2%. Weakness in the Euro periphery was already beginning to take a toll on growth in the core, and the more recent slowdown in emerging economies has only added to the problem. Deleveraging in the banking system and the overhang of prolonged uncertainty in the debt markets have exacerbated the problem, and ongoing weakness in Europe and China has become somewhat synergistic as trade flow growth decelerates.
In China, the landing is fairly soft at the reported real GDP level, but more pronounced in specific areas of output. Primary, extractive, and heavy industry generally are bearing the brunt of the economy’s slowdown. The pace of growth in new industrial capacity and infrastructure investment has slowed, and with it the demand for basic materials and commodities. In turn, softer commodity markets are impacting growth in areas that had been profiting from the resource boom, while India, Brazil, and Russia are all being restrained, ironically, by infrastructure shortfalls.
The picture that emerges is one of ‘Japanization’ in debt-burdened developed markets combined with a downshift and awkward growth transition in developing economies. Even if the narrative gets exaggerated in a downturn, there’s still a core of plausibility to the contention that the growth potential of the global economy may be subdued in the next several years.
In these circumstances, challenges to corporate performance multiply. The customer base—whether household, business or public sector—is squeezed, suppliers are under pressure, and the cost/quality/service equation is harder to solve than ever. It’s not a 2008-style collapse, but it looks like a competitive environment with fewer winners and more also-rans. We are finding increasing evidence of this phenomenon in instances of sharply differentiated growth and/or profitability between peer groups companies previously considered to be fairly comparable in performance. Our strategy in the most basic sense is to invest in that differentiation—to select more rigorously for organic value creation at the company level.
June 30, 2012 | William Blair Funds 3 |

W. George Greig
INSTITUTIONAL INTERNATIONAL GROWTH FUND
The Institutional International Growth Fund seeks long-term capital appreciation.
AN OVERVIEW FROM THE PORTFOLIO MANAGER
The Institutional International Growth Fund posted a 7.99% increase for the six months ended June 30, 2012. By comparison, the Fund’s benchmark, the MSCI All Country World Ex-U.S. IMI Index (net), increased 2.93%.
Performance was due to strong stock selection across sectors, coupled with a focus on high quality companies with good earnings and price trends. In addition, industry and country weightings also contributed to results. Stock selection was particularly strong in Consumer, Financials and Industrials. In particular, Media performance was strong within Discretionary, along with Luxury and Retail, while the Food/Staples weighting and stock selection augmented Staples results as did strong performance by Diageo, the global spirits company. Commercial Banks stock selection was strong, given the sale in Barclays in early February following its strong rally, along with Japanese and emerging markets performance. The Fund’s focus on core Europe at the expense of peripheral countries, overweighting in the strongly performing UK market, and underweighting in natural resource-oriented economies enhanced performance. Somewhat detracting from year to date results was the Fund’s underweighting in Utilities, along with Japanese stock selection, due to underperformance by internet-related holdings.
During the six month period we increased Discretionary from approximately 14% to over 18%, due to higher Autos and Media exposure, which more than offset a decline in Auto Components. As a result, at quarter end, the portfolio was 7.6% overweighted in Discretionary. Staples, Healthcare, and Industrials also increased during the period. These increases were funded by a decrease in Financials from 22.4% to 22.1%, remaining below the 23.5% Index weighting, due to a reduction and underweighting in European Capital Markets and Commercial Banks in early February, following their strong performance run to start 2012. We also decreased the Resources sectors primarily in Energy E&P (Exploration and Production) companies as well as Metals/Mining on a slower growth outlook. Both were underweighted versus the Index at June 30, with Materials representing under 5% of the portfolio, well below the 11.2% Index weighting due to the lower Metals/Mining exposure. Regionally, we increased emerging markets from approximately 21% as of year end to 24.4%, above the 23.8% Index weighting, on an improving growth outlook at the beginning of the year, bolstered by lower inflationary pressure and valuation support. This increase was funded by a reduction in the UK from 23.8% to 19.2%, although it remained well above the 14.0% Index weighting. Developed Asia remained significantly underweighted versus the Index at a combined 13.9%, well below the 24.9% Index weighting, due to lower exposure across the region.
4 Semi-Annual Report | June 30, 2012 |
Institutional International Growth Fund
Performance Highlights (unaudited)
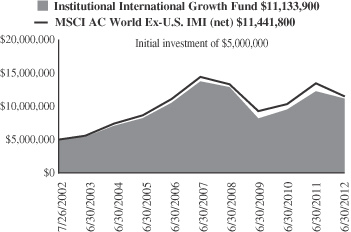
Average Annual Total Return at 6/30/2012
| | | | | | | | | | | | | | | | | | | | |
| | | Year
To Date | | | 1
Year | | | 3
Year | | | 5
Year | | | Since
Inception(a) | |
Institutional
International
Growth Fund | |
| 7.99
| %
| | | -8.73 | % | | | 10.99 | % | | | -4.05 | % | | | 8.37 | % |
MSCI All Country World Ex-U.S.
IMI (net) | | | 2.93 | | | | (14.79 | ) | | | 7.36 | | | | (4.46 | ) | | | 8.69 | |
| | (a) | | For the period July 26, 2002 (Commencement of Operations) to June 30, 2012. | |
Performance cited represents past performance. Past performance does not guarantee future results and current performance may be lower or higher than the data quoted. Results shown are average annual returns, which assume reinvestment of dividends and capital gains. Investment returns and principal will fluctuate and you may have a gain or loss when you sell shares. For the most current month-end performance information, please call 1-800-742-7272, or visit our Web site at www.williamblairfunds.com. International investing involves special risk considerations, including currency fluctuations, lower liquidity, economic and political risk.
The performance highlights and graph presented above do not reflect the deduction of taxes that a shareholder would pay on fund distributions or the redemption of fund shares.
The Morgan Stanley Capital International (MSCI) All Country World Ex-U.S. Investable Market Index (IMI) (net) is a free float-adjusted market capitalization weighted index that is designed to measure the equity market performance of developed and emerging markets, excluding the United States. This series approximates the minimum possible dividend reinvestment.
This report identifies the Fund’s investments on June 30, 2012. These holdings are subject to change. Not all stocks in the Fund performed the same, nor is there any guarantee that these stocks will perform as well in the future. Market forecasts provided in this report may not necessarily come to pass.
Sector Diversification (unaudited)
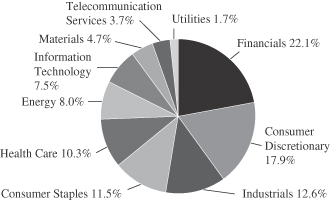
The sector diversification shown is based on the total long-term securities.
June 30, 2012 | William Blair Funds 5 |
Institutional International Growth Fund
Portfolio of Investments, June 30, 2012 (all dollar amounts in thousands) (unaudited)
| | | | | | | | |
Issuer | | Shares | | | Value | |
| | |
Common Stocks | | | | | | | | |
| | |
Europe, Mid-East—33.6% | | | | | | | | |
Austria—0.6% | | | | | | | | |
Andritz AG (Machinery) | | | 190,729 | | | $ | 9,780 | |
| | | | | | | | |
Denmark—1.6% | | | | | | | | |
CHR Hansen Holding A/S (Chemicals) | | | 154,015 | | | | 3,951 | |
Coloplast A/S Class “B” (Health care equipment & supplies) | | | 60,873 | | | | 10,921 | |
SimCorp A/S (Software) | | | 14,342 | | | | 2,463 | |
*William Demant Holding A/S (Health care equipment & supplies) | | | 102,791 | | | | 9,212 | |
| | | | | | | | |
| | | | | | | 26,547 | |
| | | | | | | | |
Finland—1.0% | | | | | | | | |
Kone Oyj (Machinery) | | | 163,087 | | | | 9,830 | |
Nokian Renkaat Oyj (Auto components) | | | 169,811 | | | | 6,417 | |
| | | | | | | | |
| | | | | | | 16,247 | |
| | | | | | | | |
France—8.2% | | | | | | | | |
Arkema S.A. (Chemicals) | | | 121,290 | | | | 7,913 | |
AXA S.A. (Insurance) | | | 2,034,064 | | | | 26,977 | |
BNP Paribas S.A. (Commercial banks) | | | 928,544 | | | | 35,646 | |
Christian Dior S.A. (Textiles, apparel & luxury goods) | | | 114,658 | | | | 15,707 | |
Essilor International S.A. (Health care equipment & supplies) | | | 90,550 | | | | 8,399 | |
L’Oreal S.A. (Personal products) | | | 61,093 | | | | 7,131 | |
Sanofi (Pharmaceuticals) | | | 408,887 | | | | 30,912 | |
Zodiac Aerospace (Aerospace & defense) | | | 53,141 | | | | 5,386 | |
| | | | | | | | |
| | | | | | | 138,071 | |
| | | | | | | | |
Germany—4.2% | | | | | | | | |
Bayer AG (Pharmaceuticals) | | | 376,877 | | | | 27,080 | |
Bayerische Motoren Werke AG (Automobiles) | | | 277,168 | | | | 19,969 | |
Brenntag AG (Trading companies & distributors) | | | 44,899 | | | | 4,954 | |
Deutsche Bank AG (Capital markets) | | | 94,530 | | | | 3,409 | |
Gerry Weber International AG (Textiles, apparel & luxury goods) | | | 111,887 | | | | 4,607 | |
Hugo Boss AG (Textiles, apparel & luxury goods) | | | 23,033 | | | | 2,269 | |
MTU Aero Engines Holding AG (Aerospace & defense) | | | 105,553 | | | | 7,739 | |
Pfeiffer Vacuum Technology AG (Machinery) | | | 14,828 | | | | 1,508 | |
| | | | | | | | |
| | | | | | | 71,535 | |
| | | | | | | | |
Ireland—0.7% | | | | | | | | |
Paddy Power plc (Hotels, restaurants & leisure) | | | 78,860 | | | | 5,145 | |
Shire plc (Pharmaceuticals) | | | 234,845 | | | | 6,738 | |
| | | | | | | | |
| | | | | | | 11,883 | |
| | | | | | | | |
Israel—0.3% | | | | | | | | |
*Check Point Software Technologies, Ltd. (Software)† | | | 108,720 | | | | 5,391 | |
| | | | | | | | |
Italy—0.3% | | | | | | | | |
Pirelli & C. SpA (Auto components) | | | 522,069 | | | | 5,480 | |
| | | | | | | | |
Luxembourg—0.6% | | | | | | | | |
Millicom International Cellular S.A. (Wireless telecommunication services) | | | 115,147 | | | | 10,837 | |
| | | | | | | | |
|
Common Stocks—Europe, Mid-East—33.6%—(continued) | |
Netherlands—4.5% | | | | | | | | |
ASML Holding N.V. (Semiconductors & semiconductor equipment) | | | 309,710 | | | $ | 15,703 | |
Royal Dutch Shell plc Class “B” (Oil, gas & consumable fuels) | | | 860,614 | | | | 29,990 | |
Unilever N.V. (Food products) | | | 929,213 | | | | 31,026 | |
| | | | | | | | |
| | | | | | | 76.719 | |
| | | | | | | | |
Norway—2.5% | | | | | | | | |
*Norwegian Air Shuttle ASA (Airlines) | | | 146,600 | | | | 2,662 | |
Schibsted ASA (Media) | | | 125,983 | | | | 4,079 | |
Statoil ASA (Oil, gas & consumable fuels) | | | 771,749 | | | | 18,344 | |
Telenor ASA (Diversified telecommunication services) | | | 980,.930 | | | | 16,309 | |
| | | | | | | | |
| | | | | | | 41,394 | |
| | | | | | | | |
Spain—1.8% | | | | | | | | |
Inditex S.A. (Specialty retail) | | | 252,664 | | | | 26,069 | |
Viscofan S.A. (Food products) | | | 104,690 | | | | 4,495 | |
| | | | | | | | |
| | | | | | | 30,564 | |
| | | | | | | | |
Sweden—2.0% | | | | | | | | |
Atlas Copco AB Class “A” (Machinery) | | | 753,614 | | | | 16,167 | |
Axis Communications AB (Communications equipment) | | | 90,856 | | | | 1,970 | |
Getinge AB (Health care equipment & supplies) | | | 538,308 | | | | 13,307 | |
JM AB (Household durables) | | | 140,075 | | | | 2,465 | |
NIBE Industrier AB (Building products) | | | 24,176 | | | | 330 | |
| | | | | | | | |
| | | | | | | 34,239 | |
| | | | | | | | |
Switzerland—5.3% | | | | | | | | |
*Geberit AG (Building products) | | | 56,809 | | | | 11,174 | |
Glencore International plc (Metals & mining) | | | 1,973,497 | | | | 9,135 | |
Nestle S.A. (Food products) | | | 663,881 | | | | 39,554 | |
*Orascom Development Holding AG (Hotels, restaurants & leisure) | | | 27,188 | | | | 432 | |
Partners Group Holding AG (Capital markets) | | | 42,248 | | | | 7,505 | |
SGS S.A. (Professional services) | | | 3,602 | | | | 6,736 | |
Sika AG (Chemicals) | | | 1,444 | | | | 2,781 | |
Syngenta AG (Chemicals) | | | 37,134 | | | | 12,649 | |
| | | | | | | | |
| | | | | | | 89,966 | |
| | | | | | | | |
| | |
United Kingdom—19.2% | | | | | | | | |
Abcam plc (Biotechnology) | | | 1,019,413 | | | | 6,662 | |
AMEC plc (Energy equipment & services) | | | 616,604 | | | | 9,676 | |
Amlin plc (Insurance) | | | 999,760 | | | | 5,541 | |
ARM Holdings plc (Semiconductors & semiconductor equipment) | | | 683,306 | | | | 5,410 | |
Ashmore Group plc (Capital markets) | | | 1,180,943 | | | | 6,446 | |
Babcock International Group plc (Commercial services & supplies) | | | 993,392 | | | | 13,279 | |
Croda International plc (Chemicals) | | | 169,798 | | | | 6,018 | |
Derwent London plc (Real estate investment trusts (REITs)) | | | 180,902 | | | | 5,250 | |
Diageo plc (Beverages) | | | 1,326,694 | | | | 34,118 | |
Dunelm Group plc (Specialty retail) | | | 539,817 | | | | 4,392 | |
Elementis plc (Chemicals) | | | 1,062,176 | | | | 3,302 | |
Experian plc (Professional services) | | | 647,625 | | | | 9,134 | |
Halma plc (Electronic equipment, instruments & components) | | | 714,191 | | | | 4,671 | |
Hiscox, Ltd. (Insurance) | | | 488,991 | | | | 3,272 | |
IG Group Holdings plc (Diversified financial services) | | | 669,429 | | | | 5,022 | |
See accompanying Notes to Portfolio of Investments.
6 Semi-Annual Report | June 30, 2012 |
Institutional International Growth Fund
Portfolio of Investments, June 30, 2012 (all dollar amounts in thousands) (unaudited)
| | | | | | | | |
Issuer | | Shares | | | Value | |
|
Common Stocks—United Kingdom—19.2%—(continued) | |
InterContinental Hotels Group plc (Hotels, restaurants & leisure) | | | 189,942 | | | $ | 4,566 | |
ITV plc (Media) | | | 5,384,442 | | | | 6,460 | |
John Wood Group plc (Energy equipment & services) | | | 612,360 | | | | 6,574 | |
Johnson Matthey plc (Chemicals) | | | 412,616 | | | | 14,268 | |
Jupiter Fund Management plc (Capital markets) | | | 801,626 | | | | 2,702 | |
Kingfisher plc (Specialty retail) | | | 1,296,216 | | | | 5,834 | |
Lancashire Holdings, Ltd. (Insurance) | | | 568,999 | | | | 7,098 | |
Meggitt plc (Aerospace & defense) | | | 1,004,681 | | | | 6,063 | |
Moneysupermarket.com Group plc (Internet software & services) | | | 909,451 | | | | 1,783 | |
Next plc (Multiline retail) | | | 153,796 | | | | 7,705 | |
*Ocado Group plc (Internet & catalog retail) | | | 1,754,917 | | | | 2,136 | |
Pearson plc (Media) | | | 714,220 | | | | 14,161 | |
Petrofac, Ltd. (Energy equipment & services) | | | 204,149 | | | | 4,438 | |
Prudential plc (Insurance) | | | 1,166,453 | | | | 13,482 | |
Rightmove plc (Media) | | | 218,251 | | | | 5,442 | |
*Rolls-Royce Holdings plc (Aerospace & defense) | | | 1,862,411 | | | | 25,026 | |
Rotork plc (Machinery) | | | 150,156 | | | | 4,633 | |
RPS Group plc (Commercial services & supplies) | | | 548,859 | | | | 1,792 | |
Scottish & Southern Energy plc (Electric utilities) | | | 1,045,468 | | | | 22,776 | |
Spirax-Sarco Engineering plc (Machinery) | | | 105,203 | | | | 3,272 | |
*Sports Direct International plc (Specialty retail) | | | 347,718 | | | | 1,665 | |
St James’s Place plc (Insurance) | | | 475,105 | | | | 2,487 | |
Standard Chartered plc (Commercial banks) | | | 532,145 | | | | 11,539 | |
*The Berkeley Group Holdings plc (Household durables) | | | 461,384 | | | | 10,181 | |
The Weir Group plc (Machinery) | | | 188,829 | | | | 4,525 | |
Tullow Oil plc (Oil, gas & consumable fuels) | | | 376,615 | | | | 8,671 | |
Victrex plc (Chemicals) | | | 196,747 | | | | 3,916 | |
| | | | | | | | |
| | | | | | | 325,388 | |
| | | | | | | | |
| | |
Emerging Asia—13.1% | | | | | | | | |
China—3.1% | | | | | | | | |
China BlueChemical, Ltd. (Chemicals) | | | 4,974,000 | | | | 2,821 | |
China Overseas Land & Investment, Ltd. (Real estate management & development) | | | 2,840,000 | | | | 6,582 | |
CNOOC, Ltd. (Oil, gas & consumable fuels) | | | 7,914,000 | | | | 15,710 | |
Dongyue Group (Chemicals) | | | 1,171,000 | | | | 542 | |
Great Wall Motor Co., Ltd. (Automobiles) | | | 1,055,000 | | | | 2,091 | |
Hainan International Holdings, Ltd. (Machinery) | | | 1,669,000 | | | | 1,648 | |
*Hollysys Automation Technologies, Ltd. (Electronic equipment, instruments & components)† | | | 165,542 | | | | 1,410 | |
Lenovo Group, Ltd. (Computers & peripherals) | | | 15,322,000 | | | | 12,916 | |
Spreadtrum Communications, Inc.—ADR (Semiconductors & semiconductor equipment) | | | 131,873 | | | | 2,328 | |
Sun Art Retail Group, Ltd. (Food & staples retailing) | | | 1,910,500 | | | | 2,091 | |
|
Common Stocks—Emerging Asia—13.1%—(continued) | |
China—(continued) | | | | | | | | |
*WuXi PharmaTech Cayman, Inc.—ADR (Life sciences tools & services) | | | 124,200 | | | $ | 1,754 | |
Yingde Gases (Chemicals) | | | 2,149,000 | | | | 1,956 | |
| | | | | | | | |
| | | | | | | 51,849 | |
| | | | | | | | |
India—3.3% | | | | | | | | |
CRISIL, Ltd. (Diversified financial services) | | | 45,076 | | | | 867 | |
HDFC Bank, Ltd. (Commercial banks) | | | 860,147 | | | | 8,682 | |
IndusInd Bank, Ltd. (Commercial banks) | | | 244,781 | | | | 1,492 | |
Ipca Laboratories, Ltd. (Pharmaceuticals) | | | 269,667 | | | | 1,732 | |
Lupin, Ltd. (Pharmaceuticals) | | | 389,094 | | | | 3,743 | |
Oberoi Realty, Ltd. (Real estate management & development) | | | 344,892 | | | | 1,503 | |
Sun Pharmaceutical Industries, Ltd. (Pharmaceuticals) | | | 622,490 | | | | 7,088 | |
Tata Consultancy Services, Ltd. (IT services) | | | 751,410 | | | | 17,191 | |
Tata Motors, Ltd. (Automobiles) | | | 2,387,930 | | | | 10,369 | |
Yes Bank, Ltd. (Commercial banks) | | | 474,891 | | | | 2,887 | |
| | | | | | | | |
| | | | | | | 55,554 | |
| | | | | | | | |
Indonesia—1.0% | | | | | | | | |
PT Alam Sutera Realty Tbk (Real estate management & development) | | | 28,653,000 | | | | 1,495 | |
PT Kalbe Farma Tbk (Pharmaceuticals) | | | 10,867,500 | | | | 4,368 | |
PT Media Nusantara Citra Tbk (Media) | | | 11,523,000 | | | | 2,441 | |
PT United Tractors Tbk (Machinery) | | | 3,670,151 | | | | 8,343 | |
| | | | | | | | |
| | | | | | | 16,647 | |
| | | | | | | | |
Philippines—0.3% | | | | | | | | |
International Container Terminal Services, Inc. (Transportation infrastructure) | | | 1,099,240 | | | | 1,918 | |
SM Prime Holdings, Inc. (Real estate management & development) | | | 10,725,575 | | | | 3,314 | |
| | | | | | | | |
| | | | | | | 5,232 | |
| | | | | | | | |
South Korea—3.8% | | | | | | | | |
Celltrion, Inc. (Pharmaceuticals) | | | 237,352 | | | | 6,279 | |
Hyundai Motor Co. (Automobiles) | | | 96,656 | | | | 19,620 | |
Samsung Electronics Co., Ltd. (Semiconductors & semiconductor equipment) | | | 29,139 | | | | 30,555 | |
Samsung Heavy Industries Co., Ltd. (Machinery) | | | 244,200 | | | | 7,953 | |
| | | | | | | | |
| | | | | | | 64,407 | |
| | | | | | | | |
Thailand—1.6% | | | | | | | | |
Advanced Info Service PCL (Wireless telecommunication services) | | | 1,709,000 | | | | 9,928 | |
BEC World PCL (Media) | | | 1,626,100 | | | | 2,585 | |
CP ALL PCL (Food & staples retailing) | | | 5,950,900 | | | | 6,652 | |
Kasikornbank PCL (Commercial banks) | | | 1,654,600 | | | | 8,596 | |
| | | | | | | | |
| | | | | | | 27,761 | |
| | | | | | | | |
| | |
Japan—10.1% | | | | | | | | |
Ain Pharmaciez, Inc. (Food & staples retailing) | | | 36,200 | | | | 2,171 | |
Cosmos Pharmaceutical Corporation (Food & staples retailing) | | | 2,000 | | | | 132 | |
CyberAgent, Inc. (Media) | | | 1,811 | | | | 4,606 | |
Daito Trust Construction Co., Ltd. (Real estate management & development) | | | 99,700 | | | | 9,417 | |
See accompanying Notes to Portfolio of Investments.
June 30, 2012 | William Blair Funds 7 |
Institutional International Growth Fund
Portfolio of Investments, June 30, 2012 (all dollar amounts in thousands) (unaudited)
| | | | | | | | |
Issuer | | Shares | | | Value | |
|
Common Stocks—Japan—10.1%—(continued) | |
Exedy Corporation (Auto components) | | | 110,300 | | | $ | 2,372 | |
FamilyMart Co., Ltd. (Food & staples retailing) | | | 146,700 | | | | 6,699 | |
Fast Retailing Co., Ltd. (Specialty retail) | | | 61,200 | | | | 12,158 | |
*Gree, Inc. (Internet software & services) | | | 322,400 | | | | 6,377 | |
Lawson, Inc. (Food & staples retailing) | | | 112,200 | | | | 7,832 | |
Miraca Holdings, Inc. (Health care providers & services) | | | 72,900 | | | | 3,014 | |
*Nexon Co., Ltd. (Software) | | | 162,900 | | | | 3,159 | |
Nikon Corporation (Leisure equipment & products) | | | 878,300 | | | | 26,392 | |
Nitori Co., Ltd. (Specialty retail) | | | 133,280 | | | | 12,572 | |
ORIX Corporation (Diversified financial services) | | | 249,500 | | | | 23,004 | |
Ship Healthcare Holdings, Inc. (Health care providers & services) | | | 105,400 | | | | 2,525 | |
Softbank Corporation (Wireless telecommunication services) | | | 222,600 | | | | 8,223 | |
Sumitomo Mitsui Financial Group, Inc. (Commercial banks) | | | 1,067,900 | | | | 34,895 | |
Sundrug Co., Ltd. (Food & staples retailing) | | | 45,400 | | | | 1,472 | |
Tsuruha Holdings, Inc. (Food & staples retailing) | | | 23,000 | | | | 1,426 | |
United Arrows, Ltd. (Specialty retail) | | | 80,200 | | | | 1,989 | |
| | | | | | | | |
| | | | | | | 170,435 | |
| | | | | | | | |
| | |
Emerging Latin America—6.4% | | | | | | | | |
Brazil—3.2% | | | | | | | | |
BR Malls Participacoes S.A. (Real estate management & development) | | | 500,400 | | | | 5,730 | |
BR Properties S.A. (Real estate management & development) | | | 425,500 | | | | 5,021 | |
CETIP S.A.—Balcao Organizado de Ativos e Derivativos (Capital markets) | | | 249,646 | | | | 3,120 | |
Cia de Concessoes Rodoviarias (Transportation infrastructure) | | | 956,300 | | | | 7,775 | |
Cia Hering (Specialty retail) | | | 315,300 | | | | 5,981 | |
Cielo S.A. (IT services) | | | 235,200 | | | | 6,918 | |
Iochpe-Maxion S.A. (Machinery) | | | 78,500 | | | | 915 | |
OdontoPrev S.A. (Health care providers & services) | | | 450,300 | | | | 2,287 | |
Petroleo Brasileiro S.A. (Oil, gas & consumable fuels) | | | 658,600 | | | | 6,197 | |
*Qualicorp S.A. (Professional services) | | | 203,300 | | | | 1,777 | |
T4F Entretenimento S.A. (Media) | | | 296,200 | | | | 2,455 | |
Tractebel Energia S.A. (Independent power producers & energy traders) | | | 264,300 | | | | 4,889 | |
Valid Solucoes e Servicos de Seguranca em Meios de Pagamento e Identificacao S.A. (Commercial services & supplies) | | | 118,200 | | | | 1,766 | |
| | | | | | | | |
| | | | | | | 54,831 | |
| | | | | | | | |
Chile—1.7% | | | | | | | | |
Banco Santander Chile—ADR (Commercial banks) | | | 90,886 | | | | 7,043 | |
CFR Pharmaceuticals S.A. (Pharmaceuticals) | | | 12,731,968 | | | | 2,860 | |
|
Common Stocks—Emerging Latin America—6.4%—(continued) | |
Chile—(continued) | | | | | | | | |
ENTEL Chile S.A. (Wireless telecommunication services) | | | 321,056 | | | $ | 6,091 | |
Parque Arauco S.A. (Real estate management & development) | | | 2,745,066 | | | | 4,879 | |
Sociedad Quimica y Minera de Chile S.A.—ADR (Chemicals) | | | 117,161 | | | | 6,522 | |
Sonda S.A. (IT services) | | | 807,384 | | | | 2,269 | |
| | | | | | | | |
| | | | | | | 29,664 | |
| | | | | | | | |
Colombia—0.5% | | | | | | | | |
Ecopetrol S.A. (Oil, gas & consumable fuels) | | | 2,829,647 | | | | 7,911 | |
| | | | | | | | |
Panama—0.3% | | | | | | | | |
Copa Holdings S.A. (Airlines)† | | | 63,173 | | | | 5,211 | |
| | | | | | | | |
Peru—0.7% | | | | | | | | |
Credicorp, Ltd. (Commercial banks)† | | | 89,109 | | | | 11,218 | |
| | | | | | | | |
| | |
Emerging Europe, Mid-East, Africa—4.9% | | | | | | | | |
Nigeria—0.2% | | | | | | | | |
Guaranty Trust Bank plc (Commercial banks) | | | 31,707,972 | | | | 2,923 | |
| | | | | | | | |
South Africa—4.0% | | | | | | | | |
*Aspen Pharmacare Holdings, Ltd. (Pharmaceuticals) | | | 444,348 | | | | 6,841 | |
Bidvest Group, Ltd. (Industrial conglomerates) | | | 376,464 | | | | 8,381 | |
FirstRand, Ltd. (Diversified financial services) | | | 3,107,498 | | | | 10,031 | |
Life Healthcare Group Holdings Pte, Ltd. (Health care providers & services) | | | 1,545,845 | | | | 5,887 | |
Mr Price Group, Ltd. (Specialty retail) | | | 56,975 | | | | 780 | |
Naspers, Ltd. (Media) | | | 166,526 | | | | 8,861 | |
Sasol, Ltd. (Oil, gas & consumable fuels) | | | 186,267 | | | | 7,802 | |
Shoprite Holdings, Ltd. (Food & staples retailing) | | | 398,113 | | | | 7,337 | |
The Foschini Group, Ltd. (Specialty retail) | | | 420,685 | | | | 6,587 | |
Tiger Brands, Ltd. (Food products) | | | 167,947 | | | | 5,033 | |
| | | | | | | | |
| | | | | | | 67,540 | |
| | | | | | | | |
Turkey—0.7% | | | | | | | | |
BIM Birlesik Magazalar A.S. (Food & staples retailing) | | | 173,078 | | | | 7,130 | |
Turkiye Halk Bankasi A.S. (Commercial banks) | | | 734,966 | | | | 5,750 | |
| | | | | | | | |
| | | | | | | 12,880 | |
| | | | | | | | |
| | |
Western Hemisphere—4.8% | | | | | | | | |
Bermuda—0.2% | | | | | | | | |
RenaissanceRe Holdings, Ltd. (Insurance)† | | | 34,231 | | | | 2,602 | |
| | | | | | | | |
Canada—4.6% | | | | | | | | |
Alimentation Couche Tard, Inc. (Food & staples retailing) | | | 328,956 | | | | 14,365 | |
Brookfield Asset Management, Inc. Class “A” (Real estate management & development)† | | | 695,355 | | | | 23,016 | |
CI Financial Corporation (Capital markets) | | | 326,988 | | | | 7,092 | |
Dollarama, Inc. (Multiline retail) | | | 128,580 | | | | 7,727 | |
Metro, Inc. (Food & staples retailing) | | | 166,065 | | | | 8,503 | |
Peyto Exploration & Development Corporation (Oil, gas & consumable fuels) | | | 442,016 | | | | 8,353 | |
See accompanying Notes to Portfolio of Investments.
8 Semi-Annual Report | June 30, 2012 |
Institutional International Growth Fund
Portfolio of Investments, June 30, 2012 (all dollar amounts in thousands) (unaudited)
| | | | | | | | |
Issuer | | Shares or
Principal
Amount | | | Value | |
|
Common Stocks—Western Hemisphere—4.8%—(continued) | |
Canada—(continued) | | | | | | | | |
* Precision Drilling Corporation (Energy equipment & services) | | | 882,498 | | | $ | 6,007 | |
Tim Hortons, Inc. (Hotels, restaurants & leisure) | | | 57,143 | | | | 3,012 | |
| | | | | | | | |
| | | | | | | 78,075 | |
| | | | | | | | |
| | |
Asia—3.8% | | | | | | | | |
Australia—0.3% | | | | | | | | |
Cochlear, Ltd. (Health care equipment & supplies) | | | 76,351 | | | | 5,145 | |
| | | | | | | | |
Hong Kong—2.0% | | | | | | | | |
AIA Group, Ltd. (Insurance) | | | 6,215,800 | | | | 21,232 | |
China High Precision Automation Group, Ltd. (Electronic equipment, instruments & components)**§ | | | 1,127,000 | | | | 299 | |
Hutchison Telecommunications Hong Kong Holdings, Ltd. (Diversified telecommunication services) | | | 10,146,000 | | | | 4,695 | |
Sa Sa International Holdings, Ltd. (Specialty retail) | | | 3,524,000 | | | | 2,203 | |
SmarTone Telecommunications Holdings, Ltd. (Wireless telecommunication services) | | | 2,114,500 | | | | 4,061 | |
Value Partners Group, Ltd. (Capital markets) | | | 3,840,000 | | | | 1,847 | |
| | | | | | | | |
| | | | | | | 34.337 | |
| | | | | | | | |
Singapore—1.5% | | | | | | | | |
*Global Logistic Properties, Ltd. (Real estate management & development) | | | 5,681,000 | | | | 9,373 | |
Keppel Corporation, Ltd. (Industrial conglomerates) | | | 1,897,300 | | | | 15,397 | |
| | | | | | | | |
| | | | | | | 24,770 | |
| | | | | | | | |
Total Common Stocks—95.9%
(cost $1,525,150) | | | | | | | 1,623,033 | |
| | | | | | | | |
| | |
Convertible Bond | | | | | | | | |
Brazil—0.0% | | | | | | | | |
Lupatech S.A., 6.500%, due 4/15/18 (Machinery)**§ | | $ | 941 | | | | 246 | |
| | | | | | | | |
Total Convertible Bond—0.0%
(cost $488) | | | | | | | 246 | |
| | | | | | | | |
| | |
Repurchase Agreement | | | | | | | | |
Fixed Income Clearing Corporation, 0.100% dated 6/29/12, due 7/2/12, repurchase price $55,989, collateralized by U.S. Treasury Notes, 0.375%, due 4/15/15 | | | 55,989 | | | | 55,989 | |
| | | | | | | | |
Total Repurchase Agreement—3.3%
(cost $55,989) | | | | | | | 55,989 | |
| | | | | | | | |
Total Investments—99.2%
(cost $1,581,627) | | | | | | | 1,679,268 | |
Cash and other assets, less liabilities—0.8% | | | | | | | 13,756 | |
| | | | | | | | |
Net assets—100.0% | | | | | | $ | 1,693,024 | |
| | | | | | | | |
ADR = American Depository Receipt
* Non-income producing securities
† = U.S. listed foreign security
** = Fair valued pursuant to Valuation Procedures adopted by the Board of Trustees. These holdings represent 0.03% of the Fund’s net assets at June 30, 2012.
§ = Deemed illiquid pursuant to Liquidity Procedures approved by the Board of Trustees. These holdings represent 0.03% of the net assets at June 30, 2012.
For securities primarily traded on exchanges or markets that close before the close of regular trading on the New York Stock Exchange, the Fund may use an independent pricing service to fair value price the securities pursuant to Valuation Procedures approved by the Board of Trustees.
At June 30, 2012, the Fund’s Portfolio of Investments includes the following industry categories:
| | | | |
Financials | | | 22.1 | % |
Consumer Discretionary | | | 17.9 | % |
Industrials | | | 12.6 | % |
Consumer Staples | | | 11.5 | % |
Health Care | | | 10.3 | % |
Energy | | | 8.0 | % |
Information Technology | | | 7.5 | % |
Materials | | | 4.7 | % |
Telecommunication Services | | | 3.7 | % |
Utilities | | | 1.7 | % |
| | | | |
Total | | | 100.0 | % |
| | | | |
At June 30, 2012, the Fund’s Portfolio of Investments includes the following currency categories:
| | | | |
British Pound Sterling | | | 22.9 | % |
Euro | | | 19.9 | % |
Japanese Yen | | | 10.5 | % |
Hong Kong Dollar | | | 5.2 | % |
Swiss Franc | | | 5.0 | % |
South African Rand | | | 4.2 | % |
South Korean Won | | | 4.0 | % |
U.S. Dollar | | | 3.8 | % |
Indian Rupee | | | 3.4 | % |
Brazilian Real | | | 3.4 | % |
Canadian Dollar | | | 3.4 | % |
Swedish Krona | | | 2.8 | % |
Norwegian Krone | | | 2.6 | % |
Thai Baht | | | 1.7 | % |
Danish Krone | | | 1.6 | % |
Singapore Dollar | | | 1.5 | % |
Indonesian Rupiah | | | 1.0 | % |
All Other Currencies | | | 3.1 | % |
| | | | |
Total | | | 100.0 | % |
| | | | |
See accompanying Notes to Portfolio of Investments.
June 30, 2012 | William Blair Funds 9 |

David Merjan
INSTITUTIONAL INTERNATIONAL EQUITY FUND
The Institutional International Equity Fund seeks long-term capital appreciation.
AN OVERVIEW FROM THE PORTFOLIO MANAGER
The Institutional International Equity Fund posted a 4.96% increase for the six months ended June 30, 2012. By comparison, the Fund’s benchmark, the MSCI World Ex-U.S. (net) Index increased 2.43%.
This performance was enhanced by positive stock selection across a number of sectors, coupled with the underweighting in Metals/Mining. During the period, the Fund’s Information Technology (IT) stocks were up 12.7%, well ahead of -3% Index return, ASML Holding N.V.’s performance was enhanced by rumors of a corporate breakup, while SAP AG and Samsung Electronics Co., Ltd. performed well in the first quarter on strong results. European Healthcare holdings bolstered that sector’s return, while Aerospace/Defense holdings and Keppel Corporation, Ltd. boosted Industrials performance. Somewhat detracting from first half performance was the Fund’s Staples underweighting, along with Financials and Utilities performance.
During the six month period, Consumer decreased by 3.3% in favor of Healthcare and Materials. As of period end, the Fund remained the most overweighted in Industrials and IT, which totaled 16.1% and 8.8%, respectively. While Financials represented 20.7% of the portfolio, it was below the 23.9% Index weighting, due to limited Developed Asia and Europe Ex-U.K. exposure. Regionally, Europe represented 37.9% of the Fund, due to an over 12% Healthcare weighting. The U.K. totaled 21.8%, slightly ahead of the Index weighting, while emerging markets represented 10.8%, a reduction from year end, when it represented 14.2%.
10 Semi-Annual Report | June 30, 2012 |
Institutional International Equity Fund
Performance Highlights (unaudited)

Average Annual Total Return 6/30/2012
| | | | | | | | | | | | | | | | | | | | |
| | | Year
To Date | | | 1
Year | | | 3
Year | | | 5
Year | | | Since
Inception(a) | |
Institutional International Equity Fund | | | 4.96 | % | | | -10.98 | % | | | 7.37 | % | | | -5.78 | % | | | 2.23 | % |
MSCI World
Ex-U.S. (net) | | | 2.43 | | | | (14.13 | ) | | | 6.20 | | | | (5.67 | ) | | | 2.86 | |
| | (a) | | For the period December 1, 2004 (Commencement of Operations) to June 30, 2012. |
Performance cited represents past performance. Past performance does not guarantee future results and current performance may be lower or higher than the data quoted. Results shown are average annual returns, which assume reinvestment of dividends and capital gains. Investment returns and principal will fluctuate and you may have a gain or loss when you sell shares. For the most current month-end performance information, please call 1-800-742-7272, or visit our Web site at www.williamblairfunds.com. From time to time, the investment advisor may waive fees or reimburse expenses for the Fund. Without these waivers, performance would be lower. International investing involves special risk considerations, including currency fluctuations, lower liquidity, economic and political risk.
The performance highlights and graph presented above do not reflect the deduction of taxes that a shareholder would pay on fund distributions or the redemption of fund shares.
The Morgan Stanley Capital International (MSCI) World Ex-U.S. (net) is a free float-adjusted market capitalization weighted index that is designed to measure the equity market performance of developed markets, excluding the United States. This series approximates the minimum possible dividend reinvestment.
This report identifies the Fund’s investments on June 30, 2012. These holdings are subject to change. Not all stocks in the Fund performed the same, nor is there any guarantee that these stocks will perform as well in the future. Market forecasts provided in this report may not necessarily come to pass.
Sector Diversification (unaudited)
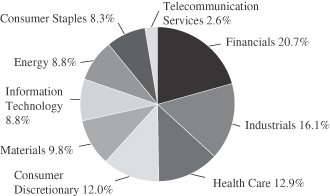
The sector diversification shown is based on the total long-term securities.
June 30, 2012 | William Blair Funds 11 |
Institutional International Equity Fund
Portfolio of Investments, June 30, 2012 (all dollar amounts in thousands) (unaudited)
| | | | | | | | |
Issuer | | Shares | | | Value | |
| | |
Common Stocks | | | | | | | | |
| | |
Europe, Mid-East—38.2% | | | | | | | | |
Denmark—2.1% | | | | | | | | |
Novo Nordisk A/S (Pharmaceuticals) | | | 16,457 | | | $ | 2,377 | |
| | | | | | | | |
France—11.0% | | | | | | | | |
AXA S.A. (Insurance) | | | 96,252 | | | | 1,276 | |
BNP Paribas S.A. (Commercial banks) | | | 36,339 | | | | 1,395 | |
Christian Dior S.A. (Textiles, apparel & luxury goods) | | | 9,520 | | | | 1,304 | |
Dassault Systemes S.A. (Software) | | | 16,684 | | | | 1,561 | |
Essilor International S.A. (Health care equipment & supplies) | | | 26,290 | | | | 2,439 | |
L’Oreal S.A. (Personal products) | | | 12,062 | | | | 1,408 | |
Sanofi (Pharmaceuticals) | | | 30,289 | | | | 2,290 | |
Technip S.A. (Energy equipment & services) | | | 9,031 | | | | 936 | |
| | | | | | | | |
| | | | | | | 12,609 | |
| | | | | | | | |
Germany—7.0% | | | | | | | | |
BASF SE (Chemicals) | | | 26,592 | | | | 1,841 | |
Bayer AG (Pharmaceuticals) | | | 24,356 | | | | 1,750 | |
Fresenius SE & Co. KGaA (Health care providers & services) | | | 21,822 | | | | 2,258 | |
Infineon Technologies AG (Semiconductors & semiconductor equipment) | | | 83,719 | | | | 565 | |
SAP AG (Software) | | | 27,264 | | | | 1,606 | |
| | | | | | | | |
| | | | | | | 8,020 | |
| | | | | | | | |
Ireland—2.9% | | | | | | | | |
*Ryanair Holdings plc—ADR (Airlines) | | | 45,783 | | | | 1,392 | |
Shire plc (Pharmaceuticals) | | | 69,450 | | | | 1,992 | |
| | | | | | | | |
| | | | | | | 3,384 | |
| | | | | | | | |
Israel—0.9% | | | | | | | | |
Teva Pharmaceutical Industries, Ltd.—ADR (Pharmaceuticals) | | | 26,824 | | | | 1,058 | |
| | | | | | | | |
Italy—1.1% | | | | | | | | |
Saipem SpA (Energy equipment & services) | | | 28,816 | | | | 1,276 | |
| | | | | | | | |
Netherlands—4.1% | | | | | | | | |
ASML Holding N.V. (Semiconductors & semiconductor equipment) | | | 29,377 | | | | 1,489 | |
Royal Dutch Shell plc Class “A” (Oil, gas & consumable fuels) | | | 385 | | | | 13 | |
Royal Dutch Shell plc Class “B” (Oil, gas & consumable fuels) | | | 32,186 | | | | 1,122 | |
Unilever N.V. (Food products) | | | 62,643 | | | | 2,092 | |
| | | | | | | | |
| | | | | | | 4,716 | |
| | | | | | | | |
Norway—1.4% | | | | | | | | |
Telenor ASA (Diversified telecommunication services) | | | 96,535 | | | | 1,605 | |
| | | | | | | | |
Spain—1.5% | | | | | | | | |
Inditex S.A. (Specialty retail) | | | 17,276 | | | | 1,782 | |
| | | | | | | | |
Sweden—1.3% | | | | | | | | |
Atlas Copco AB Class “A” (Machinery) | | | 69,907 | | | | 1,500 | |
| | | | | | | | |
Switzerland—4.9% | | | | | | | | |
*Geberit AG (Building products) | | | 6,566 | | | | 1,292 | |
Nestle S.A. (Food products) | | | 29,443 | | | | 1,754 | |
Syngenta AG (Chemicals) | | | 7,454 | | | | 2,539 | |
| | | | | | | | |
| | | | | | | 5,585 | |
| | | | | | | | |
| | |
Common Stocks—(continued) | | | | | | | | |
| | |
United Kingdom—20.8% | | | | | | | | |
Barclays plc (Commercial banks) | | | 270,465 | | | $ | 690 | |
BG Group plc (Oil, gas & consumable fuels) | | | 62,141 | | | | 1,265 | |
Burberry Group plc (Textiles, apparel & luxury goods) | | | 77,020 | | | | 1,598 | |
Compass Group plc (Hotels, restaurants & leisure) | | | 230,104 | | | | 2,411 | |
Diageo plc (Beverages) | | | 88,707 | | | | 2,281 | |
Experian plc (Professional services) | | | 108,356 | | | | 1,528 | |
HSBC Holdings plc (Commercial banks) | | | 176,278 | | | | 1,558 | |
Johnson Matthey plc (Chemicals) | | | 51,099 | | | | 1,767 | |
Pearson plc (Media) | | | 101,202 | | | | 2,007 | |
Petrofac, Ltd. (Energy equipment & services) | | | 78,182 | | | | 1,699 | |
Prudential plc (Insurance) | | | 127,777 | | | | 1,477 | |
*Rolls-Royce Holdings plc (Aerospace & defense) | | | 189,100 | | | | 2,541 | |
Standard Chartered plc (Commercial banks) | | | 88,587 | | | | 1,921 | |
Tullow Oil plc (Oil, gas & consumable fuels) | | | 51,254 | | | | 1,180 | |
| | | | | | | | |
| | | | | | | 23,923 | |
| | | | | | | | |
| | |
Japan—14.0% | | | | | | | | |
Chiyoda Corporation (Construction & engineering) | | | 71,000 | | | | 861 | |
Daito Trust Construction Co., Ltd. (Real estate management & development) | | | 21,100 | | | | 1,993 | |
FamilyMart Co., Ltd. (Food & staples retailing) | | | 35,000 | | | | 1,598 | |
Fanuc Corporation (Machinery) | | | 12,400 | | | | 2,009 | |
Keyence Corporation (Electronic equipment, instruments & components) | | | 5,800 | | | | 1,423 | |
Nikon Corporation (Leisure equipment & products) | | | 56,700 | | | | 1,704 | |
Nitori Co., Ltd. (Specialty retail) | | | 13,100 | | | | 1,236 | |
ORIX Corporation (Diversified financial services) | | | 18,120 | | | | 1,671 | |
Sumitomo Mitsui Financial Group, Inc. (Commercial banks) | | | 43,700 | | | | 1,428 | |
Suruga Bank, Ltd. (Commercial banks) | | | 95,000 | | | | 967 | |
THK Co., Ltd. (Machinery) | | | 66,500 | | | | 1,241 | |
| | | | | | | | |
| | | | | | | 16,131 | |
| | | | | | | | |
| | |
Canada—7.1% | | | | | | | | |
Brookfield Asset Management, Inc. Class “A” (Real estate management & development)† | | | 57,864 | | | | 1,915 | |
Canadian National Railway Co. (Road & rail)† | | | 19,485 | | | | 1,644 | |
Goldcorp, Inc. (Metals & mining)† | | | 28,563 | | | | 1,073 | |
The Toronto-Dominion Bank (Commercial banks) | | | 30,570 | | | | 2,393 | |
Tim Hortons, Inc. (Hotels, restaurants & leisure) | | | 22,535 | | | | 1,188 | |
| | | | | | | | |
| | | | | | | 8,213 | |
| | | | | | | | |
| | |
Emerging Asia—5.6% | | | | | | | | |
China—2.2% | | | | | | | | |
China Mobile, Ltd. (Wireless telecommunication services) | | | 113,000 | | | | 1,235 | |
CNOOC, Ltd. (Oil, gas & consumable fuels) | | | 647,000 | | | | 1,284 | |
| | | | | | | | |
| | | | | | | 2,519 | |
| | | | | | | | |
India—0.8% | | | | | | | | |
Tata Consultancy Services, Ltd. (IT services) | | | 40,992 | | | | 938 | |
| | | | | | | | |
See accompanying Notes to Portfolio of Investments.
12 Semi-Annual Report | June 30, 2012 |
Institutional International Equity Fund
Portfolio of Investments, June 30, 2012 (all dollar amounts in thousands) (unaudited)
| | | | | | | | |
Issuer | | Shares or
Principal
Amount | | | Value | |
| | |
Common Stocks—(continued) | | | | | | | | |
| | |
Emerging Asia—5.6%—(continued) | | | | | | | | |
Papua New Guinea—0.8% | | | | | | | | |
Oil Search, Ltd. (Oil, gas & consumable fuels) | | | 127,500 | | | $ | 858 | |
| | | | | | | | |
South Korea—1.8% | | | | | | | | |
Samsung Electronics Co., Ltd. (Semiconductors & semiconductor equipment) | | | 1,994 | | | | 2,091 | |
| | | | | | | | |
| | |
Asia—5.0% | | | | | | | | |
Australia—1.6% | | | | | | | | |
BHP Billiton, Ltd.—ADR (Metals & mining) | | | 28,069 | | | | 1,833 | |
| | | | | | | | |
Hong Kong—2.1% | | | | | | | | |
AIA Group, Ltd. (Insurance) | | | 701,600 | | | | 2,397 | |
| | | | | | | | |
Singapore—1.3% | | | | | | | | |
Keppel Corporation, Ltd. (Industrial conglomerates) | | | 193,000 | | | | 1,566 | |
| | | | | | | | |
| | |
Emerging Latin America—3.4% | | | | | | | | |
Brazil—1.0% | | | | | | | | |
Embraer S.A.—ADR (Aerospace & defense) | | | 41,660 | | | | 1,105 | |
| | | | | | | | |
Chile—1.5% | | | | | | | | |
Sociedad Quimica y Minera de Chile S.A.—ADR (Chemicals) | | | 31,185 | | | | 1,736 | |
| | | | | | | | |
Panama—0.9% | | | | | | | | |
Copa Holdings S.A. (Airlines)† | | | 12,914 | | | | 1,065 | |
| | | | | | | | |
| | |
Emerging Europe, Mid-East, Africa—1.4% | | | | | | | | |
South Africa—1.4% | | | | | | | | |
FirstRand, Ltd. (Diversified financial services) | | | 491,768 | | | | 1,588 | |
| | | | | | | | |
Total Common Stocks—95.5%
(cost $99,116) | | | | 109,875 | |
| | | | | | | | |
| | |
Repurchase Agreement | | | | | | | | |
Fixed Income Clearing Corporation, 0.100% dated 6/29/12, due 7/2/12, repurchase
price $5,659, collateralized by FNMA, 5.000%, due 4/15/15 | | $ | 5,659 | | | | 5,659 | |
| | | | | | | | |
Total Repurchase Agreement—4.9%
(cost $5,659) | | | | 5,659 | |
| | | | | | | | |
Total Investments—100.4%
(cost $104,775) | | | | 115,534 | |
Liabilities, plus cash and other assets—(0.4)% | | | | (413 | ) |
| | | | | | | | |
Net assets—100.0% | | | $ | 115,121 | |
| | | | | | | | |
ADR = American Depository Receipt
* Non-income producing securities
† = U.S. listed foreign security
For securities primarily traded on exchanges or markets that close before the close of regular trading on the New York Stock Exchange, the Fund may use an independent pricing service to fair value price the securities pursuant to Valuation Procedures approved by the Board of Trustees.
At June 30, 2012, the Fund’s Portfolio of Investments includes the following industry categories:
| | | | | | |
Financials | | | 20.7 | % |
Industrials | | | 16.1 | % |
Health Care | | | 12.9 | % |
Consumer Discretionary | | | 12.0 | % |
Materials | | | 9.8 | % |
Information Technology | | | 8.8 | % |
Energy | | | 8.8 | % |
Consumer Staples | | | 8.3 | % |
Telecommunication Services | | | 2.6 | % |
| | | | | | |
Total | | | 100.0 | % |
| | | | | | |
At June 30, 2012, the Fund’s Portfolio of Investments includes the following currency categories:
| | | | | | |
Euro | | | 24.8 | % |
British Pound Sterling | | | 23.2 | % |
Japanese Yen | | | 14.7 | % |
U.S. Dollar | | | 11.7 | % |
Hong Kong Dollar | | | 5.9 | % |
Swiss Franc | | | 5.1 | % |
Canadian Dollar | | | 3.2 | % |
Danish Krone | | | 2.2 | % |
South Korean Won | | | 1.9 | % |
Norwegian Krone | | | 1.5 | % |
South African Rand | | | 1.4 | % |
Singapore Dollar | | | 1.4 | % |
Swedish Krona | | | 1.4 | % |
All Other Currencies | | | 1.6 | % |
| | | | | | |
Total | | | 100.0 | % |
| | | | | | |
See accompanying Notes to Portfolio of Investments.
June 30, 2012 | William Blair Funds 13 |

Jeffrey A. Urbina
INTERNATIONAL SMALL CAP GROWTH FUND
The International Small Cap Growth Fund seeks long-term capital appreciation.
AN OVERVIEW FROM THE PORTFOLIO MANAGER
The International Small Cap Growth Fund posted a 6.43% increase \(Institutional Class Shares) for the six months ended June 30, 2012. By comparison, the Fund’s benchmark, the MSCI All Country Ex-U.S. Small Cap Index (net), increased 4.09%.
Performance was driven by strong stock selection across a number of sectors, along with a focus on high quality companies with good growth prospects. In addition, the Fund’s sector/industry exposures were positive given the significant Metals/Mining underweighting and Consumer overweighting. Within Discretionary, Nokian Renkaat (Tyres), the Finnish tire company, added to results on strong demand from its important Russian end market, while Salvatore Ferragamo Italia SpA, the Italian luxury goods company, rose on strong sales trends across most regions and distribution channels. Dollarama, Inc. also performed well over the period. Somewhat detracting from results was K’s Holdings Corporation, the Japanese electronics retailer, which had weak TV sales as incentives expired. Financials stock selection was bolstered by conservative Commercial Banks positioning coupled with strong results in Insurance and Real Estate. Defensive positioning within Industrials added value as well. Somewhat detracting from results was weak performance in Energy, as Legacy Oil & Gas, Inc. detracted from results on lower production growth and reserves than the market expected, and as Celtic Exploration Ltd. and Peyto Exploration & Development Corporation each underperformed on concerns of lower natural gas prices and slowing production growth.
The Fund maintained its significant Consumer focus, representing 35.8% as of June 30, approximately 10% above the Index weighting. At June 30, the Fund remained significantly overweighted in Health Care, which totaled 12.5%, well above the 5% Index weighting, although below the 15.8% weighting as of year end. Conversely, Resources, Industrials and Financials were significantly underweighted. Overall regional positioning did not change appreciably during the six month period, as the Fund maintained its significant weighting in the UK at the expense of Developed Asia and Canada. Emerging markets totaled 22.2% as of June 30, below the 23.1% Index weighting and a reduction from year end, due to lower exposure in Emerging Asia, given slowing growth in that region.
14 Semi-Annual Report | June 30, 2012 |
International Small Cap Growth Fund
Performance Highlights (unaudited)
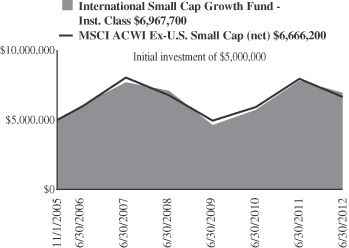
Average Annual Total Return at 6/30/2012
| | | | | | | | | | | | | | | | | | | | |
| | | Year
To Date | | | 1
Year | | | 3
Year | | | 5
Year | | | Since
Inception(a) | |
Institutional
Class | | | 6.43 | % | | | -11.09 | % | | | 14.48 | % | | | -2.05 | % | | | 5.11 | % |
MSCI ACWI
Ex-U.S.
Small Cap (net) | | | 4.09 | | | | (16.43 | ) | | | 10.41 | | | | (3.74 | ) | | | 4.41 | |
| | (a) | | For the period November 1, 2005 (Commencement of Operations) to June 30, 2012. |
Performance cited represents past performance. Past performance does not guarantee future results and current performance may be lower or higher than the data quoted. Results shown are average annual returns, which assume reinvestment of dividends and capital gains. Investment returns and principal will fluctuate and you may have a gain or loss when you sell shares. For the most current month-end performance information, please call 1-800-742-7272, or visit our Web site at www.williamblairfunds.com. Investing in smaller companies involves special risks, including higher volatility and lower liquidity. Smaller capitalization stocks are also more sensitive to purchase/sale transactions and changes in the issuer’s financial condition. From time to time, the investment advisor may waive fees or reimburse expenses for the Fund. Without these waivers, performance would be lower. International investing involves special risk considerations, including currency fluctuations, lower liquidity, economic and political risk.
The performance highlights and graph presented above do not reflect the deduction of taxes that a shareholder would pay on fund distributions or the redemption of fund shares.
The Morgan Stanley Capital International (MSCI) All Country World Ex-U.S. Small Cap Index (net) is a free float-adjusted market capitalization weighted index that is designed to measure the equity market performance of small capitalization developed and emerging markets, excluding the United States. This series approximates the minimum possible dividend reinvestment.
This report identifies the Fund’s investments on June 30, 2012. These holdings are subject to change. Not all stocks in the Fund performed the same, nor is there any guarantee that these stocks will perform as well in the future. Market forecasts provided in this report may not necessarily come to pass.
Sector Diversification (unaudited)
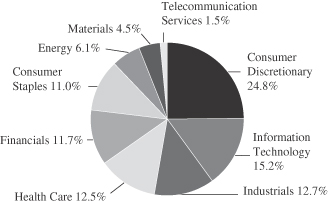
The sector diversification shown is based on the total long-term securities.
June 30, 2012 | William Blair Funds 15 |
International Small Cap Growth Fund
Portfolio of Investments, June 30, 2012 (all dollar amounts in thousands) (unaudited)
| | | | | | | | |
Issuer | | Shares | | | Value | |
|
Common Stocks | |
| | |
United Kingdom—22.1% | | | | | | | | |
Abcam plc (Biotechnology) | | | 962,205 | | | $ | 6,288 | |
*ASOS plc (Internet & catalog retail) | | | 118,426 | | | | 3,292 | |
Aveva Group plc (Software) | | | 265,190 | | | | 6,770 | |
Babcock International Group plc (Commercial services & supplies) | | | 1,107,282 | | | | 14,801 | |
Booker Group plc (Food & staples retailing) | | | 8,352,829 | | | | 11,904 | |
Croda International plc (Chemicals) | | | 398,298 | | | | 14,116 | |
Domino’s Pizza Group plc (Hotels, restaurants & leisure) | | | 313,120 | | | | 2,523 | |
Dunelm Group plc (Specialty retail) | | | 445,908 | | | | 3,628 | |
Elementis plc (Chemicals) | | | 1,427,404 | | | | 4,438 | |
*EnQuest plc (Oil, gas & consumable fuels) | | | 1,476,078 | | | | 2,490 | |
Fidessa Group plc (Software) | | | 122,805 | | | | 2,981 | |
Halma plc (Electronic equipment, instruments & components) | | | 878,060 | | | | 5,743 | |
Hiscox, Ltd. (Insurance) | | | 488,558 | | | | 3,269 | |
IG Group Holdings plc (Diversified financial services) | | | 1,272,904 | | | | 9,549 | |
*Imagination Technologies Group plc (Computers & peripherals) | | | 903,107 | | | | 6,600 | |
Lancashire Holdings, Ltd. (Insurance) | | | 927,090 | | | | 11,565 | |
Moneysupermarket.com Group plc (Internet software & services) | | | 1,770,555 | | | | 3,472 | |
*Salamander Energy plc (Oil, gas & consumable fuels) | | | 1,680,109 | | | | 4,492 | |
Spirax-Sarco Engineering plc (Machinery) | | | 211,563 | | | | 6,580 | |
*Sports Direct International plc (Specialty retail) | | | 1,338,244 | | | | 6,409 | |
St James’s Place plc (Insurance) | | | 636,618 | | | | 3,333 | |
Synergy Health plc (Health care providers & services) | | | 207,366 | | | | 2,928 | |
*Telecity Group plc (Internet software & services) | | | 491,879 | | | | 6,186 | |
| | | | | | | | |
| | | | | | | 143,357 | |
| | | | | | | | |
| | |
Europe—20.7% | | | | | | | | |
Denmark—0.9% | | | | | | | | |
CHR Hansen Holding A/S (Chemicals) | | | 225,500 | | | | 5,785 | |
| | | | | | | | |
Germany—7.0% | | | | | | | | |
Aixtron AG (Semiconductors & semiconductor equipment) | | | 306,454 | | | | 4,367 | |
Delticom AG (Specialty retail) | | | 30,200 | | | | 1,983 | |
ElringKlinger AG (Auto components) | | | 191,003 | | | | 4,537 | |
Gerry Weber International AG (Textiles, apparel & luxury goods) | | | 145,938 | | | | 6,009 | |
MTU Aero Engines Holding AG (Aerospace & defense) | | | 169,142 | | | | 12,402 | |
Pfeiffer Vacuum Technology AG (Machinery) | | | 58,801 | | | | 5,980 | |
Wincor Nixdorf AG (Computers & peripherals) | | | 197,352 | | | | 6,988 | |
Wirecard AG (IT services) | | | 184,136 | | | | 3,563 | |
| | | | | | | | |
| | | | | | | 45,829 | |
| | | | | | | | |
Ireland—1.4% | | | | | | | | |
Paddy Power plc (Hotels, restaurants & leisure) | | | 143,495 | | | | 9,361 | |
| | | | | | | | |
Italy—3.2% | | | | | | | | |
De’Longhi SpA (Household durables) | | | 391,776 | | | | 3,760 | |
Recordati SpA (Pharmaceuticals) | | | 397,789 | | | | 2,829 | |
|
Common Stocks—Europe—20.7%—(continued) | |
Italy—(continued) | |
Salvatore Ferragamo Italia SpA (Textiles, apparel & luxury goods) | | | 299,415 | | | $ | 6,214 | |
Tod’s SpA (Textiles, apparel & luxury goods) | | | 50,442 | | | | 5,040 | |
*Yoox SpA (Internet & catalog retail) | | | 201,285 | | | | 2,899 | |
| | | | | | | | |
| | | | | | | 20,742 | |
| | | | | | | | |
Norway—1.9% | | | | | | | | |
Opera Software ASA (Internet software & services) | | | 533,186 | | | | 3,756 | |
Schibsted ASA (Media) | | | 271,063 | | | | 8,776 | |
| | | | | | | | |
| | | | | | | 12,532 | |
| | | | | | | | |
Spain—2.3% | | | | | | | | |
Viscofan S.A. (Food products) | | | 341,795 | | | | 14,676 | |
| | | | | | | | |
Sweden—3.0% | | | | | | | | |
Axis Communications AB (Communications equipment) | | | 351,804 | | | | 7,629 | |
JM AB (Household durables) | | | 280,780 | | | | 4,942 | |
Mekonomen AB (Specialty retail) | | | 130,585 | | | | 3,992 | |
NIBE Industrier AB (Building products) | | | 211,658 | | | | 2,884 | |
| | | | | | | | |
| | | | | | | 19,447 | |
| | | | | | | | |
Switzerland—1.0% | | | | | | | | |
Partners Group Holding AG (Capital markets) | | | 36,436 | | | | 6,472 | |
| | | | | | | | |
| | |
Japan—16.2% | | | | | | | | |
Ain Pharmaciez, Inc. (Food & staples retailing) | | | 112,400 | | | | 6,742 | |
Cosmos Pharmaceutical Corporation (Food & staples retailing) | | | 60,600 | | | | 4,010 | |
CyberAgent, Inc. (Media) | | | 3,535 | | | | 8,991 | |
F.C.C. Co., Ltd. (Auto components) | | | 326,709 | | | | 5,436 | |
FamilyMart Co., Ltd. (Food & staples retailing) | | | 320,900 | | | | 14,653 | |
Kakaku.com, Inc. (Internet software & services) | | | 93,000 | | | | 3,143 | |
M3, Inc. (Health care technology) | | | 812 | | | | 3,870 | |
Miraca Holdings, Inc. (Health care providers & services) | | | 262,600 | | | | 10,858 | |
MISUMI Group, Inc. (Trading companies & distributors) | | | 278,100 | | | | 6,499 | |
Sawai Pharmaceutical Co., Ltd. (Pharmaceuticals) | | | 30,100 | | | | 3,231 | |
Ship Healthcare Holdings, Inc. (Health care providers & services) | | | 209,000 | | | | 5,007 | |
Start Today Co., Ltd. (Internet & catalog retail) | | | 284,300 | | | | 3,951 | |
Suruga Bank, Ltd. (Commercial banks) | | | 1,017,000 | | | | 10,356 | |
THK Co., Ltd. (Machinery) | | | 472,200 | | | | 8,814 | |
United Arrows, Ltd. (Specialty retail) | | | 167,700 | | | | 4,158 | |
Xebio Co., Ltd. (Specialty retail) | | | 257,300 | | | | 5,849 | |
| | | | | | | | |
| | | | | | | 105,568 | |
| | | | | | | | |
| | |
Emerging Asia—11.1% | | | | | | | | |
China—4.9% | | | | | | | | |
AAC Technologies Holdings, Inc. (Communications equipment) | | | 2,111,559 | | | | 6,070 | |
Dongyue Group (Chemicals) | | | 3,435,000 | | | | 1,590 | |
See accompanying Notes to Portfolio of Investments.
16 Semi-Annual Report | June 30, 2012 |
International Small Cap Growth Fund
Portfolio of Investments, June 30, 2012 (all dollar amounts in thousands) (unaudited)
| | | | | | | | |
Issuer | | Shares | | | Value | |
|
Common Stocks—Emerging Asia—11.1%—(continued) | |
|
China—(continued) | |
*Haier Electronics Group Co., Ltd. (Household durables) | | | 8,292,000 | | | $ | 9,876 | |
Haitian International Holdings, Ltd. (Machinery) | | | 3,820,496 | | | | 3,772 | |
Minth Group, Ltd. (Auto components) | | | 2,728,000 | | | | 2,929 | |
Spreadtrum Communications, Inc.—ADR (Semiconductors & semiconductor equipment)† | | | 209,135 | | | | 3,691 | |
*WuXi PharmaTech Cayman, Inc.—ADR (Life sciences tools & services)† | | | 261,262 | | | | 3,689 | |
| | | | | | | | |
| | | | | | | 31,617 | |
| | | | | | | | |
India—2.0% | | | | | | | | |
CRISIL, Ltd. (Diversified financial services) | | | 181,617 | | | | 3,492 | |
eClerx Services, Ltd. (Professional services) | | | 160,640 | | | | 1,745 | |
Ipca Laboratories, Ltd. (Pharmaceuticals) | | | 300,246 | | | | 1,929 | |
*Jubilant Foodworks, Ltd. (Hotels, restaurants & leisure) | | | 112,272 | | | | 2,351 | |
Motherson Sumi Systems, Ltd. (Auto components) | | | 715,247 | | | | 2,094 | |
Oberoi Realty, Ltd. (Real estate management & development) | | | 344,191 | | | | 1,500 | |
| | | | | | | | |
| | | | | | | 13,111 | |
| | | | | | | | |
Indonesia—1.6% | | | | | | | | |
PT Harum Energy Tbk (Oil, gas & consumable fuels) | | | 2,587,500 | | | | 1,570 | |
PT Kalbe Farma Tbk (Pharmaceuticals) | | | 6,134,500 | | | | 2,466 | |
PT Media Nusantara Citra Tbk (Media) | | | 12,923,000 | | | | 2,738 | |
PT Perusahaan Perkebunan London Sumatra Indonesia Tbk (Food products) | | | 12,969,500 | | | | 3,694 | |
| | | | | | | | |
| | | | | | | 10,468 | |
| | | | | | | | |
South Korea—0.6% | | | | | | | | |
Daum Communications Corporation (Internet software & services) | | | 44,148 | | | | 3,943 | |
| | | | | | | | |
Taiwan—1.1% | | | | | | | | |
Hiwin Technologies Corporation (Machinery) | | | 370,000 | | | | 3,739 | |
Simplo Technology Co., Ltd. (Computers & peripherals) | | | 524,500 | | | | 3,571 | |
| | | | | | | | |
| | | | | | | 7,310 | |
| | | | | | | | |
Thailand—0.9% | | | | | | | | |
Bangkok Dusit Medical Services PCL (Health care providers & services) | | | 831,500 | | | | 2,552 | |
Siam Makro PCL (Food & staples retailing) | | | 267,900 | | | | 3,003 | |
| | | | | | | | |
| | | | | | | 5,555 | |
| | | | | | | | |
| | |
Asia—9.0% | | | | | | | | |
Australia—3.0% | | | | | | | | |
Cochlear, Ltd. (Health care equipment & supplies) | | | 196,219 | | | | 13,222 | |
Seek, Ltd. (Professional services) | | | 929,525 | | | | 6,032 | |
| | | | | | | | |
| | | | | | | 19,254 | |
| | | | | | | | |
Hong Kong—4.6% | | | | | | | | |
ASM Pacific Technology, Ltd. (Semiconductors & semiconductor equipment) | | | 1,249,300 | | | | 15,854 | |
Sa Sa International Holdings, Ltd. (Specialty retail) | | | 5,746,000 | | | | 3,592 | |
|
Common Stocks—Asia—9.0%—(continued) | |
| | |
Hong Kong—(continued) | | | | | | | | |
SmarTone Telecommunications Holdings, Ltd. (Wireless telecommunication services) | | | 4,925,500 | | | $ | 9,460 | |
Value Partners Group, Ltd. (Capital markets) | | | 1,968,000 | | | | 946 | |
| | | | | | | | |
| | | | | | | 29,852 | |
| | | | | | | | |
Singapore—1.4% | | | | | | | | |
*Biosensors International Group, Ltd. (Health care equipment & supplies) | | | 3,011,000 | | | | 2,698 | |
First Resources, Ltd. (Food products) | | | 4,340,000 | | | | 6,578 | |
| | | | | | | | |
| | | | | | | 9,276 | |
| | | | | | | | |
| | |
Canada—6.5% | | | | | | | | |
Canadian Energy Services & Technology Corporation (Energy equipment & services) | | | 202,155 | | | | 1,944 | |
Canadian Western Bank (Commercial banks) | | | 83,749 | | | | 2,173 | |
*Celtic Exploration, Ltd. (Oil, gas & consumable fuels) | | | 510,250 | | | | 6,901 | |
Dollarama, Inc. (Multiline retail) | | | 197,301 | | | | 11,856 | |
*Legacy Oil + Gas, Inc. (Oil, gas & consumable fuels) | | | 831,220 | | | | 4,588 | |
Major Drilling Group International, Inc. (Metals & mining) | | | 195,191 | | | | 2,257 | |
Petrominerales, Ltd. (Oil, gas & consumable fuels) | | | 158,581 | | | | 1,791 | |
Peyto Exploration & Development Corporation (Oil, gas & consumable fuels) | | | 327,812 | | | | 6,195 | |
*Precision Drilling Corporation (Energy equipment & services) | | | 417,208 | | | | 2,840 | |
Total Energy Services, Inc. (Energy equipment & services) | | | 128,308 | | | | 1,814 | |
| | | | | | | | |
| | | | | | | 42,359 | |
| | | | | | | | |
| | |
Emerging Europe, Mid-East, Africa—6.3% | | | | | | | | |
Poland—1.0% | | | | | | | | |
Eurocash S.A. (Food & staples retailing) | | | 235,146 | | | | 2,894 | |
Lubelski Wegiel Bogdanka S.A. (Oil, gas & consumable fuels) | | | 97,701 | | | | 3,577 | |
| | | | | | | | |
| | | | | | | 6,471 | |
| | | | | | | | |
Russia—0.4% | | | | | | | | |
*Etalon Group Ltd.—144A—GDR (Real estate management & development)† | | | 419,810 | | | | 2,288 | |
| | | | | | | | |
South Africa—3.5% | | | | | | | | |
Capitec Bank Holdings, Ltd. (Commercial banks) | | | 271,332 | | | | 7,053 | |
Coronation Fund Managers, Ltd. (Capital markets) | | | 1,036,290 | | | | 3,508 | |
Life Healthcare Group Holdings Pte, Ltd. (Health care providers & services) | | | 2,264,242 | | | | 8,622 | |
Mr Price Group, Ltd. (Specialty retail) | | | 256,068 | | | | 3,506 | |
| | | | | | | | |
| | | | | | | 22,689 | |
| | | | | | | | |
Turkey—1.4% | | | | | | | | |
Tofas Turk Otomobil Fabrikasi A.S. (Automobiles) | | | 945,477 | | | | 4,047 | |
Turkiye Sinai Kalkinma Bankasi A.S. (Commercial banks) | | | 5,205,656 | | | | 5,296 | |
| | | | | | | | |
| | | | | | | 9,343 | |
| | | | | | | | |
See accompanying Notes to Portfolio of Investments.
June 30, 2012 | William Blair Funds 17 |
International Small Cap Growth Fund
Portfolio of Investments, June 30, 2012 (all dollar amounts in thousands) (unaudited)
| | | | | | | | |
Issuer | | Principal
Amount | | | Value | |
|
Common Stocks—(continued) | |
| | |
Emerging Latin America—3.8% | | | | | | | | |
Brazil—2.7% | | | | | | | | |
Arezzo Industria e Comercio S.A. (Textiles, apparel & luxury goods) | | | 268,796 | | | $ | 4,002 | |
CETIP S.A.—Balcao Organizado de Ativos e Derivativos (Capital markets) | | | 148,542 | | | | 1,856 | |
Iochpe-Maxion S.A. (Machinery) | | | 166,500 | | | | 1,940 | |
OdontoPrev S.A. (Health care providers & services) | | | 837,700 | | | | 4,254 | |
Restoque Comercio e Confeccoes de Roupas S.A. (Textiles, apparel & luxury goods) | | | 439,800 | | | | 2,251 | |
T4F Entretenimento S.A. (Media) | | | 413,800 | | | | 3,430 | |
| | | | | | | | |
| | | | | | | 17,733 | |
| | | | | | | | |
Chile—0.5% | | | | | | | | |
CFR Pharmaceuticals S.A. (Pharmaceuticals) | | | 14,169,396 | | | | 3,183 | |
| | | | | | | | |
Panama—0.6% | | | | | | | | |
Copa Holdings S.A. (Airlines)† | | | 45,616 | | | | 3,763 | |
| | | | | | | | |
Total Common Stocks—95.7%
(cost $580,931) | | | | 621,984 | |
| | | | | | | | |
| | |
Convertible Bond | | | | | | | | |
Brazil—0.0% | | | | | | | | |
Lupatech S.A., 6.500%, due 4/15/18 (Machinery)**§ | | $ | 959 | | | | 251 | |
| | | | | | | | |
Total Convertible Bond—0.0%
(cost $497) | | | | 251 | |
| | | | | | | | |
| | |
Repurchase Agreement | | | | | | | | |
Fixed Income Clearing Corporation, 0.100% dated 6/29/12, due 7/2/12, repurchase price $26,085, collateralized by FNMA, 5.000%, due 4/15/15 | | | 26,085 | | | | 26,085 | |
| | | | | | | | |
Total Repurchase Agreement—4.0%
(cost $26,085) | | | | 26,085 | |
| | | | | | | | |
Total Investments—99.7%
(cost $607,513) | | | | 648,320 | |
Cash and other assets, less liabilities—0.3% | | | | 2,202 | |
| | | | | | | | |
Net assets—100.0% | | | $ | 650,522 | |
| | | | | | | | |
ADR = American Depository Receipt
GDR = Global Depository Receipt
* Non-income producing securities
† = U.S. listed foreign security
** = Fair valued pursuant to Valuation Procedures adopted by the Board of Trustees. This holding represents 0.04% of the Fund’s net assets at June 30, 2012.
§ = Deemed illiquid pursuant to Liquidity Procedures approved by the Board of Trustees. This holding represents 0.04% of the net assets at June 30, 2012.
For securities primarily traded on exchanges or markets that close before the close of regular trading on the New York Stock Exchange, the Fund may use an independent pricing service to fair value price the securities pursuant to Valuation Procedures approved by the Board of Trustees.
At June 30, 2012, the Fund’s Portfolio of Investments includes the following industry categories:
| | | | | | |
Consumer Discretionary | | | 24.8% | |
Information Technology | | | 15.2% | |
Industrials | | | 12.7% | |
Health Care | | | 12.5% | |
Financials | | | 11.7% | |
Consumer Staples | | | 11.0% | |
Energy | | | 6.1% | |
Materials | | | 4.5% | |
Telecommunication Services | | | 1.5% | |
| | | | | | |
Total | | | 100.0% | |
| | | | | | |
At June 30, 2012, the Fund’s Portfolio of Investments includes the following currency categories:
| | | | | | |
British Pound Sterling | | | 23.0% | |
Japanese Yen | | | 17.0% | |
Euro | | | 15.6% | |
Hong Kong Dollar | | | 9.9% | |
Canadian Dollar | | | 6.8% | |
South African Rand | | | 3.7% | |
Swedish Krona | | | 3.1% | |
Australian Dollar | | | 3.1% | |
Brazilian Real | | | 2.9% | |
Indian Rupee | | | 2.1% | |
Norwegian Krone | | | 2.0% | |
Indonesian Rupiah | | | 1.7% | |
Turkish Lira | | | 1.5% | |
Singapore Dollar | | | 1.5% | |
New Taiwan Dollar | | | 1.2% | |
Swiss Franc | | | 1.0% | |
All Other Currencies | | | 3.9% | |
| | | | | | |
Total | | | 100.0% | |
| | | | | | |
See accompanying Notes to Portfolio of Investments.
18 Semi-Annual Report | June 30, 2012 |

Todd M. McClone
Jeffrey A. Urbina
EMERGING MARKETS GROWTH FUND
The Emerging Markets Growth Fund seeks long-term capital appreciation.
AN OVERVIEW FROM THE PORTFOLIO MANAGERS
The Emerging Markets Growth Fund posted a 7.33% increase (Institutional Class Shares) for the six months ended June 30, 2012. By comparison, the Fund’s benchmark, the MSCI Emerging Markets IMI Index (net), increased 4.31%.
Year-to-date, performance was strong. The Fund’s significant outperformance was driven by stock selection, coupled with the its focus on high quality companies with good growth prospects. In addition, the Fund’s industry positioning augmented performance during the period. Staples stock selection was strong, with good performance in Food/Staples Retailing and Food Products. In particular Magnit OJSC, the Russian grocery store chain was additive to results on strong same store sales, while CP ALL Public Company Limited, the Thai convenience store operator, also reported better than expected results on strong same store sales growth. BIM Birlesik Magazalar A.S., the hard discounter in Turkey, reported strong sales growth during the period. Financials stock selection was strong, supported by Turkiye Garanti Bankasi A.S., the Turkish bank specializing in lending. Somewhat detracting from performance was Information Technology (IT) stock selection, given weakness in HTC Corporation, the Taiwan smartphone producer, and Infosys Technologies Limited, the Indian IT and software company.
Consumer was reduced during the six month period to approximately 26% of the portfolio, with a tilt towards Staples, yet remained significantly overweighted versus the 17.5% Index weighting, given higher Autos, Media, Retailing and Food/Staples Retailing weightings. This decrease funded a slight increase in Resources, although it remained significantly underweighted versus the 23.8% Index weighting, due primarily to the significant underweighting in Mining, given concerns about slowing infrastructure spending growth and the impact on commodity prices prospectively. Regionally, the portfolio’s positioning did not change significantly during the six month period and remained relatively similar to the Index, despite significant country weighting variances. Within Emerging Asia, the 8.2% India weighting and 4.4% weighting in Indonesia, was offset by lower Korean and Taiwanese exposure, while in Emerging Europe, Mid East, and Africa (EMEA), limited Eastern Europe and Russian exposure was offset by higher weightings in South Africa and Turkey. Emerging Latin America totaled 23.7% as of quarter end, above the 24.5% Index weighting given larger weights in Chile, Colombia and Peru, which offset lower Mexican exposure.
June 30, 2012 | William Blair Funds 19 |
Emerging Markets Growth Fund
Performance Highlights (unaudited)
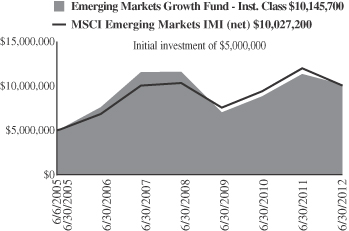
Average Annual Total Return at 6/30/2012
| | | | | | | | | | | | | | | | | | | | |
| | | Year
To Date | | | 1
Year | | | 3
Year | | | 5
Year | | | Since
Inception(a) | |
Institutional Class | | | 7.33 | % | | | -10.32 | % | | | 13.17 | % | | | -2.56 | % | | | 10.53 | % |
MSCI Emerging
Markets
IMI (net) | | | 4.31 | | | | (16.29 | ) | | | 9.97 | | | | (0.01 | ) | | | 10.34 | |
| | (a) | | For the period June 6, 2005 (Commencement of Operations) to June 30, 2012. |
Performance cited represents past performance. Past performance does not guarantee future results and current performance may be lower or higher than the data quoted. Results shown are average annual returns, which assume reinvestment of dividends and capital gains. Investment returns and principal will fluctuate and you may have a gain or loss when you sell shares. For the most current month-end performance information, please call 1-800-742-7272, or visit our Web site at www.williamblairfunds.com. From time to time, the investment advisor may waive fees or reimburse expenses for the Fund. Without these waivers, performance would be lower. International investing involves special risk considerations, including currency fluctuations, lower liquidity, economic and political risk.
The performance highlights and graph presented above do not reflect the deduction of taxes that a shareholder would pay on fund distributions or the redemption of fund shares.
The Morgan Stanley Capital International (MSCI) Emerging Markets Investable Market Index (IMI) (net) is a free float-adjusted market capitalization weighted index that is designed to measure the equity market performance of emerging markets. This series approximates the minimum possible dividend reinvestment.
This report identifies the Fund’s investments on June 30, 2012. These holdings are subject to change. Not all stocks in the Fund performed the same, nor is there any guarantee that these stocks will perform as well in the future. Market forecasts provided in this report may not necessarily come to pass.
Sector Diversification (unaudited)
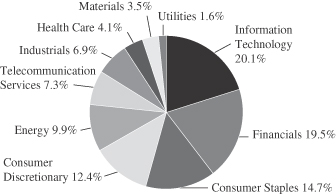
The sector diversification shown is based on the total long-term securities.
20 Semi-Annual Report | June 30, 2012 |
Emerging Markets Growth Fund
Portfolio of Investments, June 30, 2012 (all dollar amounts in thousands) (unaudited)
| | | | | | | | |
Issuer | | Shares | | | Value | |
| | |
Common Stocks | | | | | | | | |
| | |
Emerging Asia—53.7% | | | | | | | | |
China—19.4% | | | | | | | | |
AAC Technologies Holdings, Inc. (Communications equipment) | | | 1,157,959 | | | $ | 3,329 | |
*Baidu, Inc.—ADR (Internet software & services) | | | 151,291 | | | | 17,395 | |
Belle International Holdings, Ltd. (Specialty retail) | | | 2,638,610 | | | | 4,462 | |
China BlueChemical, Ltd. (Chemicals) | | | 4,060,609 | | | | 2,303 | |
China Mobile, Ltd. (Wireless telecommunication services) | | | 3,218,755 | | | | 35,163 | |
China Shenhua Energy Co., Ltd. (Oil, gas & consumable fuels) | | | 2,218,304 | | | | 7,735 | |
CNOOC, Ltd. (Oil, gas & consumable fuels) | | | 12,063,601 | | | | 23,947 | |
Comba Telecom Systems Holdings, Ltd. (Communications equipment) | | | 4,121,361 | | | | 1,711 | |
Dongfeng Motor Group Co., Ltd. (Automobiles) | | | 7,888,186 | | | | 12,100 | |
Dongyue Group (Chemicals) | | | 2,825,287 | | | | 1,307 | |
Golden Eagle Retail Group, Ltd.
(Multiline retail) | | | 1,130,547 | | | | 2,294 | |
*Haier Electronics Group Co., Ltd.
(Household durables) | | | 5,423,000 | | | | 6,459 | |
Haitian International Holdings, Ltd. (Machinery) | | | 2,617,870 | | | | 2,585 | |
Lenovo Group, Ltd. (Computers & peripherals) | | | 15,137,014 | | | | 12,761 | |
*NetEase, Inc.—ADR (Internet software & services) | | | 76,617 | | | | 4,509 | |
Ping An Insurance Group Co. of China, Ltd. Class “H” (Insurance) | | | 1,261,449 | | | | 10,032 | |
Spreadtrum Communications, Inc.—ADR (Semiconductors & semiconductor equipment) | | | 163,268 | | | | 2,882 | |
Sun Art Retail Group, Ltd. (Food & staples retailing) | | | 8,773,245 | | | | 9,601 | |
Tencent Holdings, Ltd. (Internet software & services) | | | 310,335 | | | | 9,040 | |
Want Want China Holdings, Ltd. (Food products) | | | 7,076,217 | | | | 8,665 | |
*WuXi PharmaTech Cayman, Inc.—ADR
(Life sciences tools & services) | | | 162,514 | | | | 2,295 | |
Yingde Gases (Chemicals) | | | 2,319,981 | | | | 2,111 | |
*Youku.com, Inc.—ADR (Internet software & services) | | | 80,097 | | | | 1,736 | |
| | | | | | | | |
| | | | | | | 184,422 | |
| | | | | | | | |
India—8.2% | | | | | | | | |
Asian Paints, Ltd. (Chemicals) | | | 45,181 | | | | 3,147 | |
Bajaj Auto, Ltd. (Automobiles) | | | 168,227 | | | | 4,739 | |
HDFC Bank, Ltd. (Commercial banks) | | | 998,051 | | | | 10,073 | |
Housing Development Finance Corporation (Thrifts & mortgage finance) | | | 803,261 | | | | 9,397 | |
IndusInd Bank, Ltd. (Commercial banks) | | | 476,422 | | | | 2,903 | |
ITC, Ltd. (Tobacco) | | | 3,557,037 | | | | 16,494 | |
*Jubilant Foodworks, Ltd. (Hotels, restaurants & leisure) | | | 120,928 | | | | 2,532 | |
Lupin, Ltd. (Pharmaceuticals) | | | 234,955 | | | | 2,260 | |
Motherson Sumi Systems, Ltd. (Auto components) | | | 640,080 | | | | 1,874 | |
Nestle India, Ltd. (Food products) | | | 28,797 | | | | 2,341 | |
|
Common Stocks—Emerging Asia—53.7%—(continued) | |
India—(continued) | |
Sun Pharmaceutical Industries, Ltd. (Pharmaceuticals) | | | 430,529 | | | $ | 4,903 | |
Tata Consultancy Services, Ltd. (IT services) | | | 370,963 | | | | 8,487 | |
Tata Motors, Ltd. (Automobiles) | | | 2,149,801 | | | | 9,335 | |
| | | | | | | | |
| | | | | | | 78,485 | |
| | | | | | | | |
Indonesia—4.4% | | | | | | | | |
PT Astra International Tbk (Automobiles) | | | 13,191,240 | | | | 9,620 | |
PT Bank Rakyat Indonesia (Commercial banks) | | | 17,979,821 | | | | 12,156 | |
PT Indo Tambangraya Megah (Oil, gas & consumable fuels) | | | 986,224 | | | | 3,775 | |
PT Jasa Marga Persero Tbk (Transportation infrastructure) | | | 2,980,500 | | | | 1,713 | |
PT Kalbe Farma Tbk (Pharmaceuticals) | | | 6,336,283 | | | | 2,547 | |
PT Perusahaan Perkebunan London Sumatra Indonesia Tbk (Food products) | | | 9,279,728 | | | | 2,643 | |
PT Unilever Indonesia Tbk (Household products) | | | 2,696,997 | | | | 6,576 | |
PT United Tractors Tbk (Machinery) | | | 1,036,273 | | | | 2,355 | |
| | | | | | | | |
| | | | | | | 41,385 | |
| | | | | | | | |
Malaysia—1.0% | | | | | | | | |
CIMB Group Holdings Bhd (Commercial banks) | | | 4,167,287 | | | | 9,934 | |
| | | | | | | | |
Papua New Guinea—1.0% | | | | | | | | |
Oil Search, Ltd. (Oil, gas & consumable fuels) | | | 1,471,402 | | | | 9,910 | |
| | | | | | | | |
Philippines—0.1% | | | | | | | | |
Alliance Global Group, Inc. (Industrial conglomerates) | | | 1,862,972 | | | | 510 | |
| | | | | | | | |
South Korea—8.2% | | | | | | | | |
Celltrion, Inc. (Pharmaceuticals) | | | 171,765 | | | | 4,544 | |
Hyundai Motor Co. (Automobiles) | | | 82,330 | | | | 16,713 | |
LG Household & Health Care, Ltd. (Household products) | | | 8,178 | | | | 4,405 | |
Samsung Electronics Co., Ltd. (Semiconductors & semiconductor equipment) | | | 31,001 | | | | 32,507 | |
Samsung Engineering Co., Ltd. (Construction & engineering) | | | 45,297 | | | | 7,099 | |
Samsung Fire & Marine Insurance Co., Ltd. (Insurance) | | | 38,338 | | | | 7,565 | |
Samsung Heavy Industries Co., Ltd. (Machinery) | | | 152,914 | | | | 4,980 | |
| | | | | | | | |
| | | | | | | 77,813 | |
| | | | | | | | |
Taiwan—6.4% | | | | | | | | |
Asustek Computer, Inc. (Computers & peripherals) | | | 1,218,000 | | | | 11,065 | |
Catcher Technology Co., Ltd. (Computers & peripherals) | | | 609,064 | | | | 4,046 | |
Hiwin Technologies Corporation (Machinery) | | | 260,742 | | | | 2,635 | |
Hon Hai Precision Industry Co., Ltd. (Electronic equipment, instruments & components) | | | 6,635,994 | | | | 19,851 | |
HTC Corporation (Communications equipment) | | | 499,800 | | | | 6,514 | |
MediaTek, Inc. (Semiconductors & semiconductor equipment) | | | 754,064 | | | | 6,888 | |
See accompanying Notes to Portfolio of Investments.
June 30, 2012 | William Blair Funds 21 |
Emerging Markets Growth Fund
Portfolio of Investments, June 30, 2012 (all dollar amounts in thousands) (unaudited)
| | | | | | | | |
Issuer | | Shares | | | Value | |
|
Common Stocks—Emerging Asia—53.7% (continued) | |
Taiwan—(continued) | | | | | | | | |
Simplo Technology Co., Ltd. (Computers & peripherals) | | | 618,122 | | | $ | 4,209 | |
TPK Holding Co., Ltd. (Electronic equipment, instruments & components) | | | 442,979 | | | | 5,544 | |
TSRC Corporation (Chemicals) | | | 111,708 | | | | 274 | |
| | | | | | | | |
| | | | | | | 61,026 | |
| | | | | | | | |
Thailand—5.0% | | | | | | | | |
Advanced Info Service PCL (Wireless telecommunication services) | | | 2,656,362 | | | | 15,431 | |
BEC World PCL (Media) | | | 2,929,000 | | | | 4,657 | |
CP ALL PCL (Food & staples retailing) | | | 8,589,718 | | | | 9,601 | |
Kasikornbank PCL (Commercial banks) | | | 2,772,682 | | | | 14,405 | |
Siam Makro PCL (Food & staples retailing) | | | 304,532 | | | | 3,414 | |
| | | | | | | | |
| | | | | | | 47,508 | |
| | | | | | | | |
| | |
Emerging Latin America—21.8% | | | | | | | | |
Argentina—0.5% | | | | | | | | |
MercadoLibre, Inc. (Internet software & services) | | | 64,031 | | | | 4,853 | |
| | | | | | | | |
Brazil—10.2% | | | | | | | | |
BR Malls Participacoes S.A. (Real estate management & development) | | | 596,190 | | | | 6,827 | |
BR Properties S.A. (Real estate management & development) | | | 309,597 | | | | 3,653 | |
CETIP S.A.—Balcao Organizado de Ativos e Derivativos (Capital markets) | | | 153,548 | | | | 1,919 | |
Cia de Bebidas das Americas—ADR (Beverages) | | | 498,098 | | | | 19,092 | |
Cia de Concessoes Rodoviarias (Transportation infrastructure) | | | 652,489 | | | | 5,305 | |
Cia Hering (Specialty retail) | | | 229,116 | | | | 4,346 | |
Cielo S.A. (IT services) | | | 498,800 | | | | 14,672 | |
CPFL Energia S.A.—ADR (Electric utilities) | | | 274,394 | | | | 6,857 | |
Embraer S.A.—ADR (Aerospace & defense) | | | 358,522 | | | | 9,512 | |
Iochpe-Maxion S.A. (Machinery) | | | 188,500 | | | | 2,196 | |
Lojas Renner S.A. (Multiline retail) | | | 168,222 | | | | 4,720 | |
OdontoPrev S.A. (Health care providers & services) | | | 504,566 | | | | 2,562 | |
*OGX Petroleo e Gas Participacoes S.A. (Oil, gas & consumable fuels) | | | 811,289 | | | | 2,222 | |
Raia Drogasil S.A. (Food & staples retailing) | | | 246,545 | | | | 2,486 | |
Totvs S.A. (Software) | | | 124,732 | | | | 2,403 | |
Tractebel Energia S.A. (Independent power producers & energy traders) | | | 435,038 | | | | 8,047 | |
| | | | | | | | |
| | | | | | | 96,819 | |
| | | | | | | | |
Chile—3.4% | | | | | | | | |
Banco Santander Chile—ADR (Commercial banks) | | | 119,420 | | | | 9,254 | |
CFR Pharmaceuticals S.A. (Pharmaceuticals) | | | 10,378,475 | | | | 2,332 | |
ENTEL Chile S.A. (Wireless telecommunication services) | | | 349,425 | | | | 6,629 | |
S.A.C.I. Falabella (Multiline retail) | | | 768,693 | | | | 7,023 | |
Sociedad Quimica y Minera de Chile S.A.—ADR (Chemicals) | | | 82,591 | | | | 4,598 | |
Sonda S.A. (IT services) | | | 902,990 | | | | 2,537 | |
| | | | | | | | |
| | | | | | | 32,373 | |
| | | | | | | | |
|
Common Stocks—Emerging Latin America—21.8% (continued) | |
Colombia—2.3% | | | | | | | | |
Ecopetrol S.A. (Oil, gas & consumable fuels) | | | 5,554,705 | | | $ | 15,530 | |
Pacific Rubiales Energy Corporation (Oil, gas & consumable fuels) | | | 285,240 | | | | 6,041 | |
| | | | | | | | |
| | | | | | | 21,571 | |
| | | | | | | | |
Mexico—4.5% | | | | | | | | |
Coca-Cola Femsa S.A.B. de C.V.—ADR (Beverages) | | | 37,395 | | | | 4,894 | |
*Genomma Lab Internacional S.A.B. de C.V. (Pharmaceuticals) | | | 1,239,169 | | | | 2,448 | |
Grupo Financiero Banorte S.A.B. de C.V. (Commercial banks) | | | 3,187,010 | | | | 16,471 | |
Grupo Mexico S.A.B. de C.V. Series “B” (Metals & mining) | | | 6,411,812 | | | | 19,058 | |
| | | | | | | | |
| | | | | | | 42,871 | |
| | | | | | | | |
Peru—0.9% | | | | | | | | |
Credicorp, Ltd. (Commercial banks)† | | | 71,223 | | | | 8,966 | |
| | | | | | | | |
|
Emerging Europe, Mid-East, Africa—19.6% | |
Nigeria—0.3% | | | | | | | | |
Guaranty Trust Bank plc (Commercial banks) | | | 32,723,983 | | | | 3,016 | |
| | | | | | | | |
Poland—0.6% | | | | | | | | |
Eurocash S.A. (Food & staples retailing) | | | 466,227 | | | | 5,738 | |
| | | | | | | | |
Qatar—1.5% | | | | | | | | |
Industries Qatar QSC (Industrial conglomerates) | | | 412,537 | | | | 14,161 | |
| | | | | | | | |
Russia—2.7% | | | | | | | | |
* Etalon Group Ltd.—144A—GDR (Real estate management & development) | | | 473,600 | | | | 2,581 | |
Magnit OAO (Food & staples retailing)† | | | 120,783 | | | | 14,526 | |
*Mail.ru Group, Ltd.—GDR (Internet software & services) | | | 78,415 | | | | 2,658 | |
*Yandex N.V. Class “A” (Internet software & services)† | | | 328,102 | | | | 6,250 | |
| | | | | | | | |
| | | | | | | 26,015 | |
| | | | | | | | |
South Africa—10.5% | | | | | | | | |
*Aspen Pharmacare Holdings, Ltd. (Pharmaceuticals) | | | 319,257 | | | | 4,915 | |
AVI, Ltd. (Food products) | | | 771,245 | | | | 4,717 | |
Bidvest Group, Ltd. (Industrial conglomerates) | | | 457,034 | | | | 10,175 | |
FirstRand, Ltd. (Diversified financial services) | | | 4,552,014 | | | | 14,694 | |
Life Healthcare Group Holdings Pte, Ltd. (Health care providers & services) | | | 2,323,740 | | | | 8,849 | |
Mr Price Group, Ltd. (Specialty retail) | | | 188,991 | | | | 2,587 | |
MTN Group, Ltd. (Wireless telecommunication services) | | | 584,575 | | | | 10,077 | |
Naspers, Ltd. (Media) | | | 188,266 | | | | 10,018 | |
Sasol, Ltd. (Oil, gas & consumable fuels) | | | 407,706 | | | | 17,076 | |
Shoprite Holdings, Ltd. (Food & staples retailing) | | | 385,753 | | | | 7,110 | |
Tiger Brands, Ltd. (Food products) | | | 137,081 | | | | 4,108 | |
Truworths International, Ltd. (Specialty retail) | | | 472,654 | | | | 5,176 | |
| | | | | | | | |
| | | | | | | 99,502 | |
| | | | | | | | |
See accompanying Notes to Portfolio of Investments.
22 Semi-Annual Report | June 30, 2012 |
Emerging Markets Growth Fund
Portfolio of Investments, June 30, 2011 (all dollar amounts in thousands) (unaudited)
| | | | | | | | |
Issuer | | Shares or
Principal
Amount | | | Value | |
|
Common Stocks—Emerging Europe, Mid-East,
Africa—19.6%—(continued) | |
Turkey—4.0% | | | | | | | | |
Arcelik A.S. (Household durables) | | | 576,339 | | | $ | 2,913 | |
BIM Birlesik Magazalar A.S. (Food & staples retailing) | | | 220,658 | | | | 9,090 | |
Tofas Turk Otomobil Fabrikasi A.S. (Automobiles) | | | 718,901 | | | | 3,076 | |
Turkiye Halk Bankasi A.S. (Commercial banks) | | | 2,920,553 | | | | 22,851 | |
| | | | | | | | |
| | | | | | | 37,930 | |
| | | | | | | | |
Total Common Stocks—95.1%
(cost $858,643) | | | | 904,808 | |
| | | | | | | | |
| | |
Preferred Stocks | | | | | | | | |
Brazil—2.0% | | | | | | | | |
Itau Unibanco Holding S.A. (Commercial banks) | | | 983,041 | | | | 13,846 | |
Petroleo Brasileiro S.A. (Oil, gas & consumable fuels) | | | 539,525 | | | | 4,902 | |
| | | | | | | | |
| | | | | | | 18,748 | |
| | | | | | | | |
Total Preferred Stocks—2.0%
(cost $19,749) | | | | 18,748 | |
| | | | | | | | |
Convertible Bond | | | | | | | | |
Brazil—0.0% | | | | | | | | |
Lupatech S.A., 6.500%, due 4/15/18 (Machinery)**§ | | $ | 1,602 | | | | 419 | |
| | | | | | | | |
Total Convertible Bond—0.0%
(cost $831) | | | | 419 | |
| | | | | | | | |
Total Investments—97.1%
(cost $879,223) | | | | 923,975 | |
Cash and other assets, less liabilities—2.9% | | | | 27,724 | |
| | | | | | | | |
Net assets—100.0% | | | $ | 951,699 | |
| | | | | | | | |
ADR = American Depository Receipt
GDR = Global Depository Receipt
* Non-income producing securities
† = U.S. listed foreign security
** = Fair valued pursuant to Valuation Procedures adopted by the Board of Trustees. This holding represents 0.04% of the Fund’s net assets at June 30, 2012.
§ = Deemed illiquid pursuant to Liquidity Procedures approved by the Board of Trustees. This holding represents 0.04% of the net assets at June 30, 2012.
For securities primarily traded on exchanges or markets that close before the close of regular trading on the New York Stock Exchange, the Fund may use an independent pricing service to fair value price the securities pursuant to Valuation Procedures approved by the Board of Trustees.
At June 30, 2012, the Fund’s Portfolio of Investments includes the following industry categories:
| | | | |
Information Technology | | | 20.1% | |
Financials | | | 19.5% | |
Consumer Staples | | | 14.7% | |
Consumer Discretionary | | | 12.4% | |
Energy | | | 9.9% | |
Telecommunication Services | | | 7.3% | |
Industrials | | | 6.9% | |
Health Care | | | 4.1% | |
Materials | | | 3.5% | |
Utilities | | | 1.6% | |
| | | | |
Total | | | 100.0% | |
| | | | |
At June 30, 2012, the Fund’s Portfolio of Investments includes the following currency categories:
| | | | |
Hong Kong Dollar | | | 17.4% | |
U.S. Dollar | | | 12.5% | |
South African Rand | | | 10.8% | |
Brazilian Real | | | 8.7% | |
Indian Rupee | | | 8.5% | |
South Korean Won | | | 8.4% | |
New Taiwan Dollar | | | 6.6% | |
Thai Baht | | | 5.1% | |
Indonesian Rupiah | | | 4.5% | |
Mexican Peso | | | 4.1% | |
Turkish Lira | | | 4.1% | |
Chilean Peso | | | 2.0% | |
Colombian Peso | | | 1.7% | |
Qatari Rial | | | 1.5% | |
Malaysian Ringgit | | | 1.1% | |
Australian Dollar | | | 1.1% | |
All Other Currencies | | | 1.9% | |
| | | | |
Total | | | 100.0% | |
| | | | |
See accompanying Notes to Portfolio of Investments.
June 30, 2012 | William Blair Funds 23 |
Todd M. McClone
Jeffrey A. Urbina
EMERGING LEADERS GROWTH FUND
The Emerging Leaders Growth Fund seeks long-term capital appreciation.
AN OVERVIEW FROM THE PORTFOLIO MANAGERS
The Emerging Leaders Growth Fund posted a 7.06% increase (Institutional Class Shares) for the six months ended June 30, 2012. By comparison, the Fund’s benchmark, the MSCI Emerging Markets Large Cap Index (net) increased 3.60% during the same period.
Year-to-date, performance was strong. The Fund’s significant outperformance was driven by stock selection, coupled with the Fund’s focus on high quality companies with good growth prospects. The overweighting in Staples along with good stock selection bolstered performance, as Magnit OJSC, the Russian grocery store chain, was additive to results on strong same store sales growth, while CP All, the Thai convenience store operator, also reported better than expected results on strong same store sales growth. Financials performance was bolstered by Banorte, which continued to generate strong results. Redecard, the Brazilian payment processing company, was up significantly on Itau Unibanco’s tender for outstanding shares. We sold the company as a result. Resources stock selection was also strong, driven by good performance in Oil/Gas and Metals/Mining holdings. Somewhat detracting from results was the Fund’s underperformance in IT and Industrials.
Consumer was reduced during the six month period to approximately 28% of the portfolio, with a tilt towards Staples, yet remained significantly overweighted versus the 14.7% Index weighting, given higher Autos, Retailing and Food/Staples Retailing weightings. This decrease funded a 2.5% increase in Resources, although it remained significantly underweighted versus the 26.7% Index weighting, due primarily to the significant underweighting in Mining, given concerns about slowing infrastructure spending growth and the impact on commodity prices prospectively. Regionally, the portfolio’s positioning did not change significantly during the three month period. EM Asia was slightly underweighted versus the Index as of June 30, due to lower Korean and Taiwanese exposure, which more than offset a 3% overweighting in India and slightly higher Chinese and Indonesian exposure. In EMEA, limited Eastern Europe and Russian exposure was offset by a 5% overweighting in South Africa. Latin America totaled 23.8% as of quarter end, above the 22.8% Index weighting given larger weights in Chile, Colombia and Peru, which offset lower Brazilian and Mexican exposure.
24 Semi-Annual Report | June 30, 2012 |
Emerging Leaders Growth Fund
Performance Highlights (unaudited)
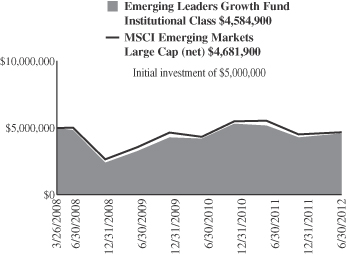
Average Annual Total Return at 6/30/2012
| | | | | | | | | | | | | | | | |
| | | Year
To Date | | | 1
Year | | | 3
Year | | | Since
Inception(a) | |
Institutional Class | | | 7.06 | % | | | -11.55 | % | | | 12.02 | % | | | -2.01 | % |
MSCI Emerging Markets
Large Cap (net) | | | 3.60 | | | | (15.51 | ) | | | 9.62 | | | | (1.53 | ) |
| | (a) | | For the period March 26, 2008 (Commencement of Operations) to June 30, 2012. |
Performance cited represents past performance. Past performance does not guarantee future results and current performance may be lower or higher than the data quoted. Results shown are average annual total returns, which assume reinvestment of dividends and capital gains. Investment returns and principal will fluctuate and you may have a gain or loss when you sell shares. For the most current month-end performance information, please call 1-800-742-7272, or visit our Web site at www.williamblairfunds.com. International investing includes special risk considerations, including currency fluctuations, lower liquidity, economic and political risk. From time to time, the investment advisor may waive fees or reimburse expenses for the Fund. Without these waivers, performance would be lower.
The performance highlights and graph presented above do not reflect the deduction of taxes that a shareholder would pay on fund distributions or the redemption of fund shares.
The Morgan Stanley Capital International (MSCI) Emerging Markets Large Cap Index (net) is a free float-adjusted market capitalization weighted index that is designed to measure market performance of large capitalization on stocks in emerging markets. This series approximates the minimum possible dividend reinvestment.
This report identifies the Fund’s investments on June 30, 2012. These holdings are subject to change. Not all stocks in the Fund performed the same, nor is there any guarantee that these stocks will perform as well in the future. Market forecasts provided in this report may not necessarily come to pass.
Sector Diversification (unaudited)
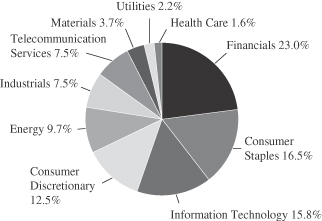
The sector diversification shown is based on the total long-term securities.
June 30, 2012 | William Blair Funds 25 |
Emerging Leaders Growth Fund
Portfolio of Investments, June 30, 2012 (all dollar amounts in thousands) (unaudited)
| | | | | | | | |
Issuer | | Shares | | | Value | |
| | |
Common Stocks | | | | | | | | |
| | |
Emerging Asia—55.9% | | | | | | | | |
China—20.0% | | | | | | | | |
* Baidu, Inc.—ADR (Internet software & services) | | | 8,786 | | | $ | 1,010 | |
Belle International Holdings, Ltd. (Specialty retail) | | | 244,000 | | | | 413 | |
China Mobile, Ltd. (Wireless telecommunication services) | | | 177,500 | | | | 1,939 | |
China Shenhua Energy Co., Ltd. (Oil, gas & consumable fuels) | | | 102,000 | | | | 356 | |
CNOOC, Ltd. (Oil, gas & consumable fuels) | | | 750,000 | | | | 1,489 | |
Dongfeng Motor Group Co., Ltd. (Automobiles) | | | 484,000 | | | | 742 | |
Lenovo Group, Ltd. (Computers & peripherals) | | | 836,000 | | | | 705 | |
* NetEase, Inc.—ADR (Internet software & services) | | | 3,908 | | | | 230 | |
Ping An Insurance Group Co. of China, Ltd. Class “H” (Insurance) | | | 73,000 | | | | 581 | |
Sun Art Retail Group, Ltd. (Food & staples retailing) | | | 514,000 | | | | 562 | |
Tencent Holdings, Ltd. (Internet software & services) | | | 18,700 | | | | 545 | |
Want Want China Holdings, Ltd. (Food products) | | | 327,000 | | | | 400 | |
| | | | | | | | |
| | | | | | | 8,972 | |
| | | | | | | | |
India—10.1% | | | | | | | | |
Bajaj Auto, Ltd. (Automobiles) | | | 15,682 | | | | 442 | |
HDFC Bank, Ltd. (Commercial banks) | | | 67,729 | | | | 684 | |
Housing Development Finance Corporation (Thrifts & mortgage finance) | | | 42,550 | | | | 498 | |
ITC, Ltd. (Tobacco) | | | 165,531 | | | | 767 | |
Nestle India, Ltd. (Food products) | | | 2,736 | | | | 222 | |
Sun Pharmaceutical Industries, Ltd. (Pharmaceuticals) | | | 63,475 | | | | 723 | |
Tata Consultancy Services, Ltd. (IT services) | | | 22,902 | | | | 524 | |
Tata Motors, Ltd. (Automobiles) | | | 161,854 | | | | 703 | |
| | | | | | | | |
| | | | | | | 4,563 | |
| | | | | | | | |
Indonesia—5.5% | | | | | | | | |
PT Astra International Tbk (Automobiles) | | | 1,225,500 | | | | 894 | |
PT Bank Rakyat Indonesia (Commercial banks) | | | 1,153,000 | | | | 779 | |
PT Unilever Indonesia Tbk (Household products) | | | 232,000 | | | | 566 | |
PT United Tractors Tbk (Machinery) | | | 108,500 | | | | 247 | |
| | | | | | | | |
| | | | | | | 2,486 | |
| | | | | | | | |
Malaysia—1.8% | | | | | | | | |
CIMB Group Holdings Bhd (Commercial banks) | | | 330,200 | | | | 787 | |
| | | | | | | | |
South Korea—8.8% | | | | | | | | |
Hyundai Motor Co. (Automobiles) | | | 4,437 | | | | 901 | |
LG Household & Health Care, Ltd. (Household products) | | | 1,063 | | | | 572 | |
Samsung Electronics Co., Ltd. (Semiconductors & semiconductor equipment) | | | 1,769 | | | | 1,855 | |
Samsung Engineering Co., Ltd. (Construction & engineering) | | | 4,091 | | | | 641 | |
| | | | | | | | |
| | | | | | | 3,969 | |
| | | | | | | | |
| | | | | | | | |
Issuer | | Shares | | | Value | |
|
Common Stocks—Emerging Asia—55.9%—(continued) | |
Taiwan—3.4% | | | | | | | | |
Asustek Computer, Inc. (Computers & peripherals) | | | 41,000 | | | $ | 372 | |
Hon Hai Precision Industry Co., Ltd. (Electronic equipment, instruments & components) | | | 380,700 | | | | 1,139 | |
| | | | | | | | |
| | | | | | | 1,511 | |
| | | | | | | | |
Thailand—6.3% | | | | | | | | |
Advanced Info Service PCL (Wireless telecommunication services) | | | 164,800 | | | | 957 | |
CP ALL PCL (Food & staples retailing) | | | 965,700 | | | | 1,080 | |
Kasikornbank PCL (Commercial banks) | | | 155,800 | | | | 809 | |
| | | | | | | | |
| | | | | | | 2,846 | |
| | | | | | | | |
| | |
Emerging Latin America—21.8% | | | | | | | | |
Brazil—9.9% | | | | | | | | |
BR Malls Participacoes S.A. (Real estate management & development) | | | 63,300 | | | | 725 | |
Cia de Bebidas das Americas—ADR (Beverages) | | | 28,876 | | | | 1,107 | |
Cia de Concessoes Rodoviarias (Transportation infrastructure) | | | 63,100 | | | | 513 | |
Cielo S.A. (IT services) | | | 23,300 | | | | 685 | |
CPFL Energia S.A.—ADR (Electric utilities) | | | 16,614 | | | | 415 | |
Embraer S.A.—ADR (Aerospace & defense) | | | 15,600 | | | | 414 | |
Tractebel Energia S.A. (Independent power producers & energy traders) | | | 31,400 | | | | 581 | |
| | | | | | | | |
| | | | | | | 4,440 | |
| | | | | | | | |
Chile—3.7% | | | | | | | | |
Banco Santander Chile—ADR (Commercial banks) | | | 10,225 | | | | 792 | |
S.A.C.I. Falabella (Multiline retail) | | | 52,314 | | | | 478 | |
Sociedad Quimica y Minera de Chile S.A.—ADR (Chemicals) | | | 7,336 | | | | 409 | |
| | | | | | | | |
| | | | | | | 1,679 | |
| | | | | | | | |
Colombia—2.5% | | | | | | | | |
Ecopetrol S.A. (Oil, gas & consumable fuels) | | | 394,565 | | | | 1,103 | |
| | | | | | | | |
Mexico—4.9% | | | | | | | | |
Grupo Financiero Banorte S.A.B. de C.V. (Commercial banks) | | | 184,600 | | | | 954 | |
Grupo Mexico S.A.B. de C.V. Series “B” (Metals & mining) | | | 420,200 | | | | 1,249 | |
| | | | | | | | |
| | | | | | | 2,203 | |
| | | | | | | | |
Peru—0.8% | | | | | | | | |
Credicorp, Ltd. (Commercial banks)† | | | 3,045 | | | | 383 | |
| | | | | | | | |
| | |
Emerging Europe, Mid-East, Africa—19.6% | | | | | | | | |
| | |
Qatar—1.9% | | | | | | | | |
Industries Qatar QSC (Industrial conglomerates) | | | 24,491 | | | | 841 | |
| | | | | | | | |
Russia—3.6% | | | | | | | | |
Magnit OAO (Food & staples retailing)† | | | 924 | | | | 111 | |
* Magnit OJSC—144A—GDR (Food & staples retailing)† | | | 21,877 | | | | 658 | |
Sberbank of Russian Federation (Commercial banks)† | | | 316,195 | | | | 844 | |
| | | | | | | | |
| | | | | | | 1,613 | |
| | | | | | | | |
See accompanying Notes to Portfolio of Investments.
26 Semi-Annual Report | June 30, 2012 |
Emerging Leaders Growth Fund
Portfolio of Investments, June 30, 2012 (all dollar amounts in thousands) (unaudited)
| | | | | | | | |
Issuer | | Shares | | | Value | |
|
Common Stocks—Emerging Europe, Mid-East,
Africa—19.6%—(continued) | |
South Africa—12.3% | | | | | | | | |
Bidvest Group, Ltd. (Industrial conglomerates) | | | 31,864 | | | $ | 709 | |
FirstRand, Ltd. (Diversified financial services) | | | 283,763 | | | | 916 | |
MTN Group, Ltd. (Wireless telecommunication services) | | | 27,421 | | | | 473 | |
Naspers, Ltd. (Media) | | | 9,621 | | | | 512 | |
Sasol, Ltd. (Oil, gas & consumable fuels) | | | 25,709 | | | | 1,077 | |
Shoprite Holdings, Ltd. (Food & staples retailing) | | | 48,720 | | | | 898 | |
Tiger Brands, Ltd. (Food products) | | | 14,106 | | | | 423 | |
Truworths International, Ltd. (Specialty retail) | | | 47,800 | | | | 523 | |
| | | | | | | | |
| | | | | | | 5,531 | |
| | | | | | | | |
Turkey—1.8% | | | | | | | | |
Turkiye Garanti Bankasi A.S. (Commercial banks) | | | 210,924 | | | | 828 | |
| | | | | | | | |
Total Common Stocks—97.3%
(cost $41,454) | | | | | | | 43,755 | |
| | | | | | | | |
| | |
Preferred Stocks | | | | | | | | |
Brazil—2.1% | | | | | | | | |
Itau Unibanco Holding S.A. (Commercial banks) | | | 45,600 | | | | 642 | |
Petroleo Brasileiro S.A. (Oil, gas & consumable fuels) | | | 32,055 | | | | 291 | |
| | | | | | | | |
| | | | | | | 933 | |
| | | | | | | | |
Total Preferred Stocks—2.1%
(cost $986) | | | | 933 | |
| | | | | | | | |
Total Investments—99.4%
(cost $42,440) | | | | 44,688 | |
Cash and other assets, less liabilities—0.6% | | | | 278 | |
| | | | | | | | |
Net assets—100.0% | | | $ | 44,966 | |
| | | | | | | | |
ADR = American Depository Receipt
GDR = Global Depository Receipt
* Non-income producing securities
† = U.S. listed foreign security
For securities primarily traded on exchanges or markets that close before the close of regular trading on the New York Stock Exchange, the Fund may use an independent pricing service to fair value price the securities pursuant to Valuation Procedures approved by the Board of Trustees.
At June 30, 2012, the Fund’s Portfolio of Investments includes the following industry categories:
| | | | |
Financials | | | 23.0 | % |
Consumer Staples | | | 16.5 | % |
Information Technology | | | 15.8 | % |
Consumer Discretionary | | | 12.5 | % |
Energy | | | 9.7 | % |
Telecommunication Services | | | 7.5 | % |
Industrials | | | 7.5 | % |
Materials | | | 3.7 | % |
Utilities | | | 2.2 | % |
Health Care | | | 1.6 | % |
| | | | |
Total | | | 100.0 | % |
| | | | |
At June 30, 2012, the Fund’s Portfolio of Investments includes the following currency categories:
| | | | |
Hong Kong Dollar | | | 17.3 | % |
U.S. Dollar | | | 14.2 | % |
South African Rand | | | 12.4 | % |
Indian Rupee | | | 10.2 | % |
South Korean Won | | | 8.9 | % |
Brazilian Real | | | 7.7 | % |
Thai Baht | | | 6.4 | % |
Indonesian Rupiah | | | 5.6 | % |
Mexican Peso | | | 4.9 | % |
New Taiwan Dollar | | | 3.4 | % |
Colombian Peso | | | 2.5 | % |
Qatari Rial | | | 1.9 | % |
Turkish Lira | | | 1.8 | % |
Malaysian Ringgit | | | 1.7 | % |
Chilean Peso | | | 1.1 | % |
| | | | |
Total | | | 100.0 | % |
| | | | |
See accompanying Notes to Portfolio of Investments.
June 30, 2012 | William Blair Funds 27 |
FIXED-INCOME MARKETS OVERVIEW
Fixed Income Summary
The global capital markets continued to experience elevated levels of volatility during the first half of 2012 as investors focused on the ongoing European debt crisis. Despite the volatility, global equities have gained year-to-date, with U.S. stocks outperforming their non-U.S. counterparts. U.S. dollar-based, investment-grade fixed income instruments have also gained as interest rates declined to record-low levels as investors continue to flock to high-quality assets.
The European debt crisis took center stage during the second quarter and drove volatility as attention shifted to events in Greece and Spain. Greece held two elections to form a new government during the second quarter after a radical anti-austerity political bloc, the Syriza party, gained popularity and threatened to reverse the country’s austerity progress. Investors assigned an increased probability that Greece could exit the euro amid the uncertainty of the Greek elections. Ultimately, the pro-austerity New Democracy party emerged as the country’s preeminent political party. In Spain, the Spanish banking crisis added volatility as Spanish government officials sought financial aid packages to recapitalize its banks.
Within the U.S., it was revealed that the labor markets continued to show signs of weakness and hampered growth. The market is beginning to show signs of concern over the “fiscal cliff,” which refers to the automatic tax increases and spending cuts scheduled to start in the beginning of 2013 unless politicians agree to a compromise to extend the beginning of the tax increases and spending cuts. Another noteworthy event was the J.P. Morgan trading loss. The trading loss was not meaningful because of its size (initially reported at $2 billion), but it was meaningful because it highlighted the difficulties of monitoring activities at large banking institutions with regulations that seek to curb risk-taking at banks.
The Federal Open Market Committee (FOMC) remained accommodative and continued its unconventional easing programs. The FOMC continued to state that conditions “warrant exceptionally low levels for the federal funds rate at least through late-2014.” At its June 20 meeting, the FOMC announced plans to extend its “Operation Twist” program, which was scheduled to expire on June 30, through the end of the year. The FOMC also announced plans to continue to reinvest principal from its agency MBS portfolio.
Fixed income instruments have gained as investors continue to flock to safe haven assets amid the uncertainties in Europe and the U.S. High yield bonds and emerging market debt have been the strongest-performing segments of the bond market. Corporate bonds and Treasury Inflation-Protected Securities (TIPS) have been the best-performing segment of the investment-grade fixed-income market. The 10-year Treasury note yielded 1.65% at the end of June, 23 basis points lower year-to-date.
28 Semi-Annual Report | June 30, 2012 |

Christopher T. Vincent

Paul J. Sularz
BOND FUND
The Bond Fund seeks to outperform the Barclays Capital U.S. Aggregate Bond Index by maximizing total return through a combination of income and capital appreciation.
AN OVERVIEW FROM THE PORTFOLIO MANAGERS
Year-to-date the Fund gained 4.01%, outpacing its benchmark, the Barclay’s Capital U.S. Aggregate Bond Index, which rose 2.37%.
Security selection has been the primary driver of performance year-to-date. Results were particularly strong among the Fund’s corporate bond holdings. The Fund has maintained an overweight exposure to financials that has been additive as investment-grade financials have been strong performers year-to-date. Positioning within the Industrial sector was also additive. Within the Industrials sector, we had exposure to high-yield issuers, and that allocation contributed to results as high-yield issuers have outperformed investment-grade issuers year-to-date.
In addition, security selection within the Fund’s mortgage-backed securities added value year-to-date. The pools owned provided incremental yield over Treasuries and experienced manageable prepayment speeds.
Another factor that affected performance favorably was the Fund’s allocation to longer-dated U.S. TIPS (Treasury Inflation-Protected Securities). These positions benefitted as interest rates declined and Treasury instruments benefitted from a global flight to quality.
Sector positioning has impacted performance favorably year-to-date. The William Blair Bond Fund is structured to be underweight to Treasury instruments, which have been the weakest-performing segment of the market, and to be overweight in corporate and mortgage-backed securities, both of which have outperformed Treasuries year-to-date.
Outlook and Positioning
We are positioned neutral on interest rates with the portfolio’s duration in-line with that of the benchmark. We believe that interest rates will remain range-bound at lower levels over the next two years, as the FOMC (Federal Open Market Committee) continues to state that current conditions “warrant exceptionally low levels for the federal funds rate at least through late 2014.”
We are overweight agency mortgage-backed securities. We seek pools with better-than-market convexity characteristics through favoring pools with above-market coupon rates comprised of either low loan balances or seasoned pools and avoiding the generic, current-coupon pools that dominate the Mortgage Index. We view specified pool mortgage-backed securities as a cheap alternative to agency debentures (to which we are underweight).
We are overweight investment-grade corporate bonds, as we believe the sector continues to offer good relative value. Within the sector, we are overweight industrials and financials. We emphasize companies with positive free cash flow and strong and experienced management teams. We believe that certain names in the financial sector offer value, and we are encouraged by the improvement of balance sheets within the sector despite the regulatory issues facing the industry. We hold an allocation to high yield bonds near its 10% maximum. We emphasize higher quality (BB- and B-rated) industrial issuers.
We hold an allocation to TIPS, as we find its embedded option on unexpected inflation to be an appealing feature versus owning nominal Treasury notes.
June 30, 2012 | William Blair Funds 29 |
Bond Fund
Performance Highlights (unaudited)
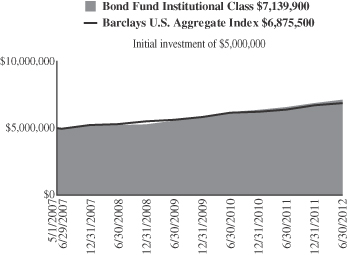
Average Annual Total Return at 6/30/2012
| | | | | | | | | | | | | | | | | | | | |
| | | Year
To Date | | | 1
Year | | | 3
Year | | | 5
Year | | | Since
Inception(a) | |
Institutional Class | | | 4.01 | % | | | 8.76 | % | | | 8.73 | % | | | 7.62 | % | | | 7.13 | % |
Barclays Capital U.S. Aggregate Bond Index | | | 2.37 | | | | 7.47 | | | | 6.93 | | | | 6.79 | | | | 6.35 | |
| | (a) | | For the period May 1, 2007 (Commencement of Operations) to June 30, 2012. |
Performance cited represents past performance. Past performance does not guarantee future results and current performance may be lower or higher than the data quoted. Results shown are average annual total returns, which assume reinvestment of dividends and capital gains. Investment returns and principal will fluctuate and you may have a gain or loss when you sell shares. For the most current month-end performance information, please call 1-800-742-7272, or visit our Web site at www.williamblairfunds.com. From time to time, the investment advisor may waive fees or reimburse expenses for the Fund. Without these waivers, performance would be lower.
The performance highlights and graph presented above do not reflect the deduction of taxes that a shareholder would pay on fund distributions or the redemption of fund shares.
The Barclays Capital U.S. Aggregate Bond Index indicates broad intermediate government/corporate bond market performance.
This report identifies the Fund’s investments on June 30, 2012. These holdings are subject to change. Not all investments in the Fund performed the same, nor is there any guarantee that these investments will perform as well in the future. Market forecasts provided in this report may not necessarily come to pass.
Sector Diversification (unaudited)
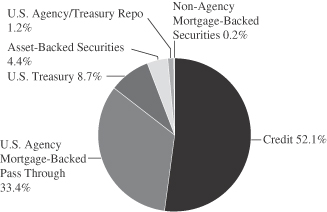
The sector diversification shown is based on the total investments.
30 Semi-Annual Report | June 30, 2012 |
Bond Fund
Portfolio of Investments, June 30, 2012 (all dollar amounts in thousands) (unaudited)
| | | | | | | | |
Issuer | | Principal
Amount | | | Value | |
|
U.S. Government and U.S. Government Agency—42.2% | |
U.S. Treasury Inflation Indexed Notes/Bonds—7.7% | |
U.S. Treasury Inflation Indexed Note, 2.375%,
due 1/15/17 | | $ | 5,881 | | | $ | 6,788 | |
U.S. Treasury Inflation Indexed Bond, 3.875%,
due 4/15/29 | | | 8,538 | | | | 13,795 | �� |
| | | | | | | | |
Total U.S. Treasury Inflation Indexed Notes/Bonds | | | | 20,583 | |
| | | | | | | | |
U.S. Treasury—1.1% | | | | | | | | |
U.S. Treasury Bond, 3.125%, due 2/15/42 | | | 525 | | | | 564 | |
U.S. Treasury Strip Principal, 0.000%,
due 5/15/20 | | | 2,575 | | | | 2,319 | |
| | | | | | | | |
Total U.S. Treasury Obligations | | | | | | | 2,883 | |
| | | | | | | | |
Government National Mortgage Association (GNMA)—3.3% | |
#344834, 6.250%, due 7/15/13 | | | 5 | | | | 5 | |
#344902, 6.250%, due 3/15/14 | | | 6 | | | | 6 | |
#623162, 6.500%, due 7/15/18 | | | 41 | | | | 46 | |
#616250, 6.000%, due 2/15/24 | | | 10 | | | | 11 | |
#422470, 7.500%, due 3/15/26 | | | 1 | | | | 1 | |
#509405, 7.500%, due 8/15/29 | | | 1 | | | | 1 | |
GNR 2004-2 M5, 4.891%, due 7/16/34 | | | 125 | | | | 138 | |
GNR 2006-67 GB, 4.741%, due 9/16/34, VRN | | | 1,620 | | | | 1,679 | |
#699118, 6.000%, due 9/15/38 | | | 6,152 | | | | 6,964 | |
| | | | | | | | |
Total GNMA Mortgage Obligations | | | | 8,851 | |
| | | | | | | | |
Federal Home Loan Mortgage Corp. (FHLMC)—8.2% | |
#G90024, 7.000%, due 1/20/13 | | | 3 | | | | 3 | |
#J14232, 3.500%, due 1/1/21 | | | 1,345 | | | | 1,416 | |
#J16051, 4.500%, due 7/1/26 | | | 1,338 | | | | 1,457 | |
#G01728, 7.500%, due 7/1/32 | | | 273 | | | | 334 | |
#C01385, 6.500%, due 8/1/32 | | | 278 | | | | 316 | |
#C01623, 5.500%, due 9/1/33 | | | 409 | | | | 449 | |
#A15039, 5.500%, due 10/1/33 | | | 7 | | | | 8 | |
#G01843, 6.000%, due 6/1/35 | | | 77 | | | | 87 | |
#G02141, 6.000%, due 3/1/36 | | | 1,573 | | | | 1,756 | |
#A62179, 6.000%, due 6/1/37 | | | 818 | | | | 914 | |
#A63539, 6.000%, due 7/1/37 | | | 1,035 | | | | 1,156 | |
#A62858, 6.500%, due 7/1/37 | | | 558 | | | | 631 | |
#G03170, 6.500%, due 8/1/37 | | | 1,275 | | | | 1,441 | |
#A66843, 6.500%, due 10/1/37 | | | 1,919 | | | | 2,188 | |
#A78138, 5.500%, due 6/1/38 | | | 1,147 | | | | 1,279 | |
#G04544, 6.000%, due 8/1/38 | | | 3,614 | | | | 4,010 | |
#A81799, 6.500%, due 9/1/38 | | | 2,334 | | | | 2,661 | |
#C03665, 9.000%, due 4/1/41 | | | 1,672 | | | | 2,080 | |
| | | | | | | | |
Total FHLMC Mortgage Obligations | | | | 22,186 | |
| | | | | | | | |
Federal National Mortgage Association (FNMA)—21.9% | |
#124947, 7.000%, due 7/1/13 | | | 1 | | | | 1 | |
#576553, 8.000%, due 2/1/16 | | | 10 | | | | 11 | |
#580793, 6.000%, due 4/1/16 | | | 2 | | | | 2 | |
#624506, 6.000%, due 1/1/17 | | | 2 | | | | 3 | |
#679247, 7.000%, due 8/1/17 | | | 9 | | | | 10 | |
#689612, 5.000%, due 5/1/18 | | | 263 | | | | 287 | |
#695910, 5.000%, due 5/1/18 | | | 551 | | | | 602 | |
#697593, 5.000%, due 5/1/18 | | | 479 | | | | 523 | |
#770395, 5.000%, due 4/1/19 | | | 9 | | | | 10 | |
#745735, 5.000%, due 3/1/21 | | | 600 | | | | 653 | |
#900725, 6.000%, due 8/1/21 | | | 137 | | | | 151 | |
#893325, 7.000%, due 9/1/21 | | | 9 | | | | 10 | |
#AA2924, 4.500%, due 4/1/24 | | | 920 | | | | 1,010 | |
#AD8164, 4.000%, due 8/1/25 | | | 63 | | | | 69 | |
|
U.S. Government and U.S. Government Agency—(continued) | |
Federal National Mortgage Association (FNMA)—(continued) | |
#255956, 5.500%, due 10/1/25 | | $ | 62 | | | $ | 68 | |
#AB2256, 3.500%, due 2/1/26 | | | 1,294 | | | | 1,394 | |
#890329, 4.000%, due 4/1/26 | | | 518 | | | | 562 | |
#AI9811, 4.500%, due 8/1/26 | | | 550 | | | | 604 | |
#AH9564, 3.500%, due 9/1/26 | | | 1,126 | | | | 1,213 | |
#AJ8149, 3.500%, due 12/1/26 | | | 1,358 | | | | 1,462 | |
#AB4818, 4.000%, due 4/1/27 | | | 1,274 | | | | 1,390 | |
#252925, 7.500%, due 12/1/29 | | | 3 | | | | 3 | |
#535977, 6.500%, due 4/1/31 | | | 24 | | | | 28 | |
#253907, 7.000%, due 7/1/31 | | | 4 | | | | 5 | |
#587849, 6.500%, due 11/1/31 | | | 35 | | | | 40 | |
#545437, 7.000%, due 2/1/32 | | | 139 | | | | 162 | |
#545759, 6.500%, due 7/1/32 | | | 1,511 | | | | 1,730 | |
#678007, 6.000%, due 9/1/32 | | | 27 | | | | 30 | |
#254548, 5.500%, due 12/1/32 | | | 68 | | | | 75 | |
#684601, 6.000%, due 3/1/33 | | | 1,479 | | | | 1,665 | |
#708993, 5.000%, due 6/1/33 | | | 86 | | | | 96 | |
#190340, 5.000%, due 9/1/33 | | | 218 | | | | 237 | |
#254868, 5.000%, due 9/1/33 | | | 22 | | | | 24 | |
#739243, 6.000%, due 9/1/33 | | | 1,653 | | | | 1,861 | |
#739331, 6.000%, due 9/1/33 | | | 787 | | | | 886 | |
#555800, 5.500%, due 10/1/33 | | | 237 | | | | 261 | |
#555946, 5.500%, due 11/1/33 | | | 715 | | | | 800 | |
#756153, 5.500%, due 11/1/33 | | | 1,739 | | | | 1,932 | |
#725017, 5.500%, due 12/1/33 | | | 83 | | | | 93 | |
#725205, 5.000%, due 3/1/34 | | | 2,779 | | | | 3,024 | |
#725232, 5.000%, due 3/1/34 | | | 3,010 | | | | 3,275 | |
#725238, 5.000%, due 3/1/34 | | | 1,042 | | | | 1,134 | |
#763798, 5.500%, due 3/1/34 | | | 322 | | | | 358 | |
#725611, 5.500%, due 6/1/34 | | | 357 | | | | 393 | |
#783786, 5.500%, due 7/1/34 | | | 294 | | | | 329 | |
#786546, 6.000%, due 7/1/34 | | | 734 | | | | 825 | |
#787816, 6.000%, due 7/1/34 | | | 769 | | | | 865 | |
#190353, 5.000%, due 8/1/34 | | | 322 | | | | 350 | |
#794474, 6.000%, due 10/1/34 | | | 159 | | | | 179 | |
#745092, 6.500%, due 7/1/35 | | | 1,054 | | | | 1,206 | |
#357944, 6.000%, due 9/1/35 | | | 89 | | | | 100 | |
#829306, 6.000%, due 9/1/35 | | | 1,197 | | | | 1,340 | |
#836140, 5.500%, due 10/1/35 | | | 118 | | | | 132 | |
#843487, 6.000%, due 10/1/35 | | | 225 | | | | 252 | |
#849191, 6.000%, due 1/1/36 | | | 491 | | | | 550 | |
#848782, 6.500%, due 1/1/36 | | | 661 | | | | 750 | |
#745349, 6.500%, due 2/1/36 | | | 922 | | | | 1,054 | |
#888305, 7.000%, due 3/1/36 | | | 25 | | | | 29 | |
#895637, 6.500%, due 5/1/36 | | | 375 | | | | 426 | |
#831540, 6.000%, due 6/1/36 | | | 139 | | | | 155 | |
#745802, 6.000%, due 7/1/36 | | | 496 | | | | 555 | |
#886220, 6.000%, due 7/1/36 | | | 1,071 | | | | 1,199 | |
#893318, 6.500%, due 8/1/36 | | | 182 | | | | 207 | |
#902974, 6.000%, due 12/1/36 | | | 1,078 | | | | 1,202 | |
#909480, 6.000%, due 2/1/37 | | | 1,061 | | | | 1,188 | |
#938440, 6.000%, due 7/1/37 | | | 504 | | | | 562 | |
#928561, 6.000%, due 8/1/37 | | | 595 | | | | 666 | |
#948689, 6.000%, due 8/1/37 | | | 1,084 | | | | 1,206 | |
#946646, 6.000%, due 9/1/37 | | | 302 | | | | 338 | |
#888967, 6.000%, due 12/1/37 | | | 2,010 | | | | 2,250 | |
#889385, 6.000%, due 2/1/38 | | | 637 | | | | 713 | |
#962058, 6.500%, due 3/1/38 | | | 4,014 | | | | 4,598 | |
#934006, 6.500%, due 9/1/38 | | | 1,367 | | | | 1,566 | |
#986856, 6.500%, due 9/1/38 | | | 1,075 | | | | 1,221 | |
See accompanying Notes to Portfolio of Investments.
June 30, 2012 | William Blair Funds 31 |
Bond Fund
Portfolio of Investments, June 30, 2012 (all dollar amounts in thousands) (unaudited)
| | | | | | | | | | | | |
Issuer | | NRSRO
Rating | | | Principal
Amount | | | Value | |
|
U.S. Government and U.S. Government Agency—(continued) | |
Federal National Mortgage Association (FNMA)—(continued) | |
#991911, 7.000%, due 11/1/38 | | | $ | 801 | | | $ | 916 | |
#931492, 6.000%, due 7/1/39 | | | | 341 | | | | 382 | |
#AA6898, 6.000%, due 7/1/39 | | | | 1,769 | | | | 1,980 | |
#AL0913, 6.000%, due 7/1/41 | | | | 1,250 | | | | 1,393 | |
| | | | | | | | | | | | |
Total FNMA Mortgage Obligations | | | | 58,831 | |
| | | | | | | | | | | | |
|
Non-Agency Mortgage-Backed Obligations—0.2% | |
First Plus Home Loan Trust, 1997-4, Tranche M1, 7.640%, 9/11/23§** | | | D | | | | 199 | | | | 167 | |
First Horizon Asset Securities, Inc., 2004-AR4, Tranche 3A1, 2.660%, 8/25/34, VRN | | | AA | | | | 400 | | | | 368 | |
| | | | | | | | | | | | |
Total Non-Agency Mortgage-Backed Obligations | | | | | | | | | | | 535 | |
| | | | | | | | | | | | |
| | | |
Asset-Backed Securities—3.0% | | | | | | | | | | | | |
Avis Budget Rental Car Funding AESOP LLC—144A, 2009-1A, Tranche A, 9.310%, 10/20/13 | | | Aa1 | | | | 1,500 | | | | 1,522 | |
Hertz Vehicle Financing LLC—144A, 2009-2A, Tranche A1, 4.260%, 3/25/14 | | | Aaa | | | | 2,280 | | | | 2,321 | |
Hertz Vehicle Financing LLC—144A, 2009-2A, Tranche A2, 5.290%, 3/25/16 | | | Aaa | | | | 600 | | | | 659 | |
Avis Budget Rental Car Funding AESOP LLC—144A, 2010-3A, Tranche A, 4.640%, 5/20/16 | | | Aaa | | | | 100 | | | | 108 | |
Centre Point Funding LLC—144A, 2010-1A, Tranche 1, 5.430%, 7/20/16 | | | A2 | | | | 2,274 | | | | 2,383 | |
Sierra Receivables Funding Co. LLC—144A, 2011-1A, Tranche A, 3.350%, 4/20/26 | | | A | | | | 1,129 | | | | 1,141 | |
| | | | | | | | | | | | |
Total Asset-Backed Securities | | | | | | | | | | | 8,134 | |
| | | | | | | | | | | | |
| | | |
Corporate Obligations—52.9% | | | | | | | | | | | | |
Yum! Brands, Inc., 6.250%, due 4/15/16 | | | BBB | | | | 1,400 | | | | 1,615 | |
Supervalu, Inc., 8.000%, due 5/1/16 | | | B | | | | 1,550 | | | | 1,569 | |
Ford Motor Credit Co. LLC—144A, 3.984%, due 6/15/16 | | | Baa3 | | | | 2,000 | | | | 2,060 | |
Petrobras International Finance Co., 6.125%, due 10/6/16 | | | A3 | | | | 1,400 | | | | 1,566 | |
Ally Financial, Inc., 5.500%, due 2/15/17 | | | BB- | | | | 1,788 | | | | 1,816 | |
American International Group, Inc., 3.800%, due 3/22/17 | | | A- | | | | 2,375 | | | | 2,421 | |
Penske Truck Leasing Co. L.P.—144A, 3.750%, due 5/11/17 | | | BBB+ | | | | 2,000 | | | | 2,016 | |
ERP Operating L.P., 5.750%, due 6/15/17 | | | BBB+ | | | | 2,075 | | | | 2,394 | |
JPMorgan Chase & Co., 6.125%, due 6/27/17 | | | A | | | | 600 | | | | 668 | |
American Express Co., 6.150%, due 8/28/17 | | | A+ | | | | 2,050 | | | | 2,429 | |
Capital One Financial Corporation, 6.750%, due 9/15/17 | | | A- | | | | 1,900 | | | | 2,254 | |
|
Corporate Obligations—(continued) | |
Exelon Generation Co. LLC, 6.200%, due 10/1/17 | | | Baa1 | | | $ | 1,160 | | | $ | 1,337 | |
Toll Brothers Finance Corporation, 8.910%, due 10/15/17 | | | BBB- | | | | 1,050 | | | | 1,291 | |
Motorola Solutions, Inc., 6.000%, due 11/15/17 | | | BBB | | | | 2,050 | | | | 2,328 | |
Triumph Group, Inc., 8.000%, due 11/15/17 | | | B+ | | | | 1,550 | | | | 1,689 | |
Kohl’s Corporation, 6.250%, due 12/15/17 | | | BBB+ | | | | 1,000 | | | | 1,200 | |
Cemex S.A.B. de C.V.—144A, 9.000%, due 1/11/18 | | | B+ | | | | 1,000 | | | | 893 | |
American Tower Corporation, 4.500%, due 1/15/18 | | | Baa3 | | | | 1,200 | | | | 1,268 | |
Morgan Stanley, 6.625%, due 4/1/18 | | | A | | | | 2,575 | | | | 2,692 | |
General Electric Capital Corporation, 5.625%, due 5/1/18 | | | AA+ | | | | 1,275 | | | | 1,466 | |
Simon Property Group L.P.,
6.125%, due 5/30/18 | | | A- | | | | 1,800 | | | | 2,130 | |
Petrohawk Energy Corporation, 7.250%, due 8/15/18 | | | A | | | | 1,050 | | | | 1,181 | |
Merrill Lynch & Co., Inc.,
6.875%, due 11/15/18 | | | A | | | | 1,100 | | | | 1,232 | |
CSX Corporation, 7.375%,
due 2/1/19 | | | BBB | | | | 870 | | | | 1,110 | |
BHP Billiton Finance USA,
Ltd., 6.500%, due 4/1/19 | | | A+ | | | | 1,300 | | | | 1,655 | |
Owens Corning, 9.000%,
due 6/15/19 | | | BBB- | | | | 1,050 | | | | 1,309 | |
Discovery Communications
LLC, 5.625%, due 8/15/19 | | | BBB | | | | 550 | | | | 644 | |
Roper Industries, Inc., 6.250%,
due 9/1/19 | | | BBB | | | | 1,850 | | | | 2,202 | |
Republic Services, Inc., 5.500%,
due 9/15/19 | | | BBB | | | | 1,725 | | | | 1,996 | |
Boston Properties L.P., 5.875%, due 10/15/19 | | | A- | | | | 1,575 | | | | 1,816 | |
Crown Castle International Corporation, 7.125%, due 11/1/19 | | | BB- | | | | 1,550 | | | | 1,662 | |
Toll Brothers Finance Corporation, 6.750%, due 11/1/19 | | | BBB- | | | | 500 | | | | 554 | |
Ford Motor Credit Co. LLC, 8.125%, due 1/15/20 | | | Baa3 | | | | 2,050 | | | | 2,504 | |
Jarden Corporation, 7.500%, due 1/15/20 | | | B | | | | 1,550 | | | | 1,693 | |
JBS USA LLC—144A, 8.250%, due 2/1/20 | | | BB | | | | 1,000 | | | | 973 | |
Johnson Controls, Inc., 5.000%, due 3/30/20 | | | BBB+ | | | | 1,675 | | | | 1,894 | |
The Goldman Sachs Group, Inc., 6.000%, due 6/15/20 | | | A | | | | 2,575 | | | | 2,749 | |
Commonwealth Edison Co., 4.000%, due 8/1/20 | | | A- | | | | 1,000 | | | | 1,112 | |
Citigroup, Inc., 5.375%, due 8/9/20 | | | A | | | | 2,050 | | | | 2,215 | |
Alcoa, Inc., 6.150%, due 8/15/20 | | | BBB- | | | | 2,050 | | | | 2,158 | |
Omnicom Group, Inc., 4.450%, due 8/15/20 | | | BBB+ | | | | 2,075 | | | | 2,237 | |
The Goodyear Tire & Rubber Co., 8.250%, due 8/15/20 | | | B+ | | | | 1,500 | | | | 1,588 | |
Georgia-Pacific LLC—144A, 5.400%, due 11/1/20 | | | A- | | | | 1,500 | | | | 1,741 | |
See accompanying Notes to Portfolio of Investments.
32 Semi-Annual Report | June 30, 2012 |
Bond Fund
Portfolio of Investments, June 30, 2012 (all dollar amounts in thousands) (unaudited)
| | | | | | | | | | | | |
Issuer | | NRSRO
Rating | | | Principal
Amount | | | Value | |
| |
Corporate Obligations—(continued) | | | | | |
Progress Energy, Inc., 4.400%, due 1/15/21 | | | BBB | | | $ | 1,675 | | | $ | 1,862 | |
Simon Property Group L.P., 6.125%, due 5/30/18 | | | A- | | | | 1,800 | | | | 2,130 | |
Petrohawk Energy Corporation, 7.250%, due 8/15/18 | | | A | | | | 1,050 | | | | 1,181 | |
Merrill Lynch & Co., Inc., 6.875%, due 11/15/18 | | | A | | | | 1,100 | | | | 1,232 | |
CSX Corporation, 7.375%, due 2/1/19 | | | BBB | | | | 870 | | | | 1,110 | |
BHP Billiton Finance USA, Ltd., 6.500%, due 4/1/19 | | | A+ | | | | 1,300 | | | | 1,655 | |
Owens Corning, 9.000%, due 6/15/19 | | | BBB- | | | | 1,050 | | | | 1,309 | |
Discovery Communications LLC, 5.625%, due 8/15/19 | | | BBB | | | | 550 | | | | 644 | |
Roper Industries, Inc., 6.250%, due 9/1/19 | | | BBB | | | | 1,850 | | | | 2,202 | |
Republic Services, Inc., 5.500%, due 9/15/19 | | | BBB | | | | 1,725 | | | | 1,996 | |
Boston Properties L.P., 5.875%, due 10/15/19 | | | A- | | | | 1,575 | | | | 1,816 | |
Crown Castle International Corporation, 7.125%, due 11/1/19 | | | BB- | | | | 1,550 | | | | 1,662 | |
Toll Brothers Finance Corporation, 6.750%, due 11/1/19 | | | BBB- | | | | 500 | | | | 554 | |
Ford Motor Credit Co. LLC, 8.125%, due 1/15/20 | | | Baa3 | | | | 2,050 | | | | 2,504 | |
Jarden Corporation, 7.500%, due 1/15/20 | | | B | | | | 1,550 | | | | 1,693 | |
JBS USA LLC—144A, 8.250%, due 2/1/20 | | | BB | | | | 1,000 | | | | 973 | |
Johnson Controls, Inc., 5.000%, due 3/30/20 | | | BBB+ | | | | 1,675 | | | | 1,894 | |
The Goldman Sachs Group, Inc., 6.000%, due 6/15/20 | | | A | | | | 2,575 | | | | 2,749 | |
Commonwealth Edison Co., 4.000%, due 8/1/20 | | | A- | | | | 1,000 | | | | 1,112 | |
Citigroup, Inc., 5.375%, due 8/9/20 | | | A | | | | 2,050 | | | | 2,215 | |
Alcoa, Inc., 6.150%, due 8/15/20 | | | BBB- | | | | 2,050 | | | | 2,158 | |
Omnicom Group, Inc., 4.450%, due 8/15/20 | | | BBB+ | | | | 2,075 | | | | 2,237 | |
The Goodyear Tire & Rubber Co., 8.250%, due 8/15/20 | | | B+ | | | | 1,500 | | | | 1,588 | |
Georgia-Pacific LLC—144A, 5.400%, due 11/1/20 | | | A- | | | | 1,500 | | | | 1,741 | |
Progress Energy, Inc., 4.400%, due 1/15/21 | | | BBB | | | | 1,675 | | | | 1,862 | |
Standard Pacific Corporation, 8.375%, due 1/15/21 | | | B | | | | 1,750 | | | | 1,899 | |
Petrobras International Finance Co., 5.375%, due 1/27/21 | | | A3 | | | | 1,200 | | | | 1,293 | |
L-3 Communications Corporation, 4.950%, due 2/15/21 | | | BBB- | | | | 2,430 | | | | 2,628 | |
Wyndham Worldwide Corporation, 5.625%, due 3/1/21 | | | BBB- | | | | 1,000 | | | | 1,089 | |
Ball Corporation, 5.750%, due 5/15/21 | | | BB+ | | | | 1,550 | | | | 1,666 | |
Energizer Holdings, Inc., 4.700%, due 5/19/21 | | | BBB- | | | | 2,050 | | | | 2,161 | |
Discovery Communications LLC, 4.375%, due 6/15/21 | | | BBB | | | | 1,000 | | | | 1,086 | |
O’Reilly Automotive, Inc., 4.625%, due 9/15/21 | | | BBB | | | | 2,275 | | | | 2,378 | |
| |
Corporate Obligations—(continued) | | | | | |
Corporation Nacional del Cobre de Chile—144A, 3.875%, due 11/3/21 | | | A1 | | | $ | 1,900 | | | $ | 1,999 | |
Itau Unibanco Holding S.A.—144A, 6.200%, due 12/21/21 | | | Baa2 | | | | 2,500 | | | | 2,600 | |
SABMiller Holdings, Inc.—144A, 3.750%, due 1/15/22 | | | BBB+ | | | | 2,000 | | | | 2,127 | |
SLM Corporation, 7.250%, due 1/25/22 | | | BBB- | | | | 2,075 | | | | 2,194 | |
Fresenius Medical Care US Finance II, Inc.—144A, 5.875%, due 1/31/22 | | | BB+ | | | | 1,000 | | | | 1,041 | |
Lamar Media Corp.—144A, 5.875%, due 2/1/22 | | | BB- | | | | 1,000 | | | | 1,025 | |
Masco Corporation, 5.950%, due 3/15/22 | | | BBB- | | | | 1,675 | | | | 1,724 | |
BE Aerospace, Inc., 5.250%, due 4/1/22 | | | BB | | | | 1,550 | | | | 1,596 | |
FMG Resources August 2006 Pty Ltd.—144A, 6.875%, due 4/1/22 | | | BB+ | | | | 1,050 | | | | 1,058 | |
Pinnacle Entertainment, Inc., 7.750%, due 4/1/22 | | | B | | | | 1,315 | | | | 1,405 | |
Kraft Foods Group, Inc.—144A, 3.500%, due 6/6/22 | | | Baa2 | | | | 1,900 | | | | 1,950 | |
Embraer S.A., 5.150%, due 6/15/22 | | | BBB- | | | | 2,500 | | | | 2,566 | |
Comcast Corporation, 3.125%, due 7/15/22 | | | BBB+ | | | | 1,000 | | | | 1,005 | |
Continental Airlines 2012-1 Class A Pass Thru Trusts, 4.150%, due 10/11/25 | | | A- | | | | 2,375 | | | | 2,333 | |
The Kroger Co., 8.000%, due 9/15/29 | | | BBB | | | | 450 | | | | 586 | |
Conoco Funding Co., 7.250%, due 10/15/31 | | | A1 | | | | 450 | | | | 650 | |
Kohl’s Corporation, 6.000%, due 1/15/33 | | | BBB+ | | | | 1,065 | | | | 1,195 | |
Wisconsin Electric Power Co., 5.700%, due 12/1/36 | | | A+ | | | | 525 | | | | 667 | |
Comcast Corporation, 6.450%, due 3/15/37 | | | BBB+ | | | | 650 | | | | 790 | |
Yum! Brands, Inc., 6.875%, due 11/15/37 | | | BBB | | | | 625 | | | | 828 | |
JPMorgan Chase & Co., 6.400%, due 5/15/38 | | | A+ | | | | 1,470 | | | | 1,767 | |
COX Communications, Inc.—144A, 6.950%, due 6/1/38 | | | BBB | | | | 370 | | | | 446 | |
General Electric Capital Corporation, 6.875%, due 1/10/39 | | | AA+ | | | | 750 | | | | 968 | |
Abbott Laboratories, 6.000%, due 4/1/39 | | | AA | | | | 2,250 | | | | 2,982 | |
Burlington Northern Santa Fe LLC, 5.750%, due 5/1/40 | | | A3 | | | | 1,565 | | | | 1,866 | |
Illinois Tool Works, Inc., 4.875%, due 9/15/41 | | | A1 | | | | 900 | | | | 1,025 | |
Union Pacific Corporation, 4.750%, due 9/15/41 | | | A- | | | | 1,450 | | | | 1,573 | |
Aristotle Holding, Inc.—144A, 6.125%, due 11/15/41 | | | BBB+ | | | | 2,500 | | | | 3,038 | |
Philip Morris International, Inc., 4.375%, due 11/15/41 | | | A | | | | 2,075 | | | | 2,140 | |
Gilead Sciences, Inc., 5.650%, due 12/1/41 | | | A- | | | | 1,775 | | | | 2,069 | |
Citigroup, Inc., 5.875%, due 1/30/42 | | | A | | | | 750 | | | | 819 | |
Bank of America Corporation, 5.875%, due 2/7/42 | | | A | | | | 2,375 | | | | 2,602 | |
See accompanying Notes to Portfolio of Investments.
June 30, 2012 | William Blair Funds 33 |
Bond Fund
Portfolio of Investments, June 30, 2012 (all dollar amounts in thousands) (unaudited)
| | | | | | | | | | | | |
Issuer | | NRSRO
Rating | | | Principal
Amount | | | Value | |
| |
Corporate Obligations—(continued) | | | | | |
CSX Corporation, 4.750%, due 5/30/42 | | | BBB | | | $ | 1,225 | | | $ | 1,263 | |
Odebrecht Finance Ltd.—144A, 7.125%, due 6/26/42 | | | BBB- | | | | 1,000 | | | | 995 | |
| | | | | | | | | | | | |
Total Corporate Obligations | | | | | | | | | | | 142,281 | |
| | | | | | | | | | | | |
Total Long-Term Investments—98.3%
(cost $247,901) | | | | 264,284 | |
| | | | | | | | | | | | |
| | | |
Repurchase Agreement | | | | | | | | | | | | |
Fixed Income Clearing Corporation, 0.100% dated 6/29/12, due 7/2/12, repurchase price $3,157, collateralized by FHLB, 3.650%, due 2/24/32 | | | Aaa | | | | 3,157 | | | | 3,157 | |
| | | | | | | | | | | | |
Total Repurchase Agreement—1.2%
(cost $3,157) | | | | 3,157 | |
| | | | | | | | | | | | |
Total Investments—99.5%
(cost $251,058) | | | | 267,441 | |
Cash and other assets, less liabilities—0.5% | | | | 1,398 | |
| | | | | | | | | | | | |
Net assets—100.0% | | | $ | 268,839 | |
| | | | | | | | | | | | |
NRSRO = Nationally Recognized Statistical Rating Organization—The credit quality ratings of the securities in the Fund reflect the highest category rating by either Fitch Ratings, Moody’s Investors Service Inc., or Standard & Poor’s, a division of the McGraw-Hill Companies, Inc.
The obligations of certain U. S. Government-sponsored securities are neither issued nor guaranteed by the U. S. Treasury.
VRN = Variable Rate Note
§ = Deemed illiquid pursuant to Liquidity Procedures approved by the Board of Trustees. This holding represents 0.06% of the net assets at June 30, 2012.
** = Fair valued pursuant to Valuation Procedures adopted by the Board of Trustees. This holding represents 0.06% of the Fund’s net assets at June 30, 2012.
See accompanying Notes to Portfolio of Investments.
34 Semi-Annual Report | June 30, 2012 |
Christopher T. Vincent
Paul J. Sularz
LOW DURATION FUND
The Low Duration Fund seeks to maximize total return. Total return includes both income and capital appreciation.
AN OVERVIEW FROM THE PORTFOLIO MANAGERS
Year-to-date, the Fund gained 1.64%, outpacing its benchmark, the Merrill Lynch 1-Year U.S. Treasuries Index, which rose 0.04%.
Security selection results in the mortgage-backed sector had the largest positive impact on performance year-to-date. The majority of the Fund is invested in seasoned agency (Fannie Mae and Freddie Mac) mortgage-backed securities. The pools employed by the Fund experienced manageable prepayment speeds and earned positive returns during the first quarter.
The Fund’s asset-backed securities (ABS) and corporate bonds were also additive to performance. Within both sectors, we emphasize both fixed- and floating-rate securities, all of which were rated “A” or better from a Nationally Recognized Statistical Rating Organization. These securities benefitted from the incremental yield they offer despite an increase in risk spreads during the quarter.
Finally, the Low Duration Fund has benefitted from the reduction in interest rates that has been experienced year-to-date.
Outlook and Positioning
The Low Duration Fund is structured to earn a competitive yield by taking a little more interest rate risk than money market instruments. Duration is managed within a band of 0.5 – 2.0 years, and all securities must carry a credit rating of “A” or better. Most of the securities we employ are amortizing instruments, meaning they make monthly payments of principal and interest; such a cash flow pattern allows for quicker reinvestment if interest rates were to rise.
Our primary emphasis remains in agency mortgage-backed securities. In the Low Duration Fund, we favor both seasoned and newer-vintage higher-coupon, low loan balance, 15-year pools. We believe these securities will generate steady, predictable cash flows and experience slower prepayment speeds in the current lower interest rate environment.
Within the asset-backed sector, we are allocated to short-dated auto and credit card loan receivable pools originated by “Tier 1” issuers. Some of our asset-backed holdings are floating-rate instruments, which help protect principal in a rising interest rate environment.
In the corporate sector, we favor short-dated, high-quality bonds of large, systemically important financial institutions as well as blue-chip industrials.
June 30, 2012 | William Blair Funds 35 |
Low Duration Fund
Performance Highlights (unaudited)
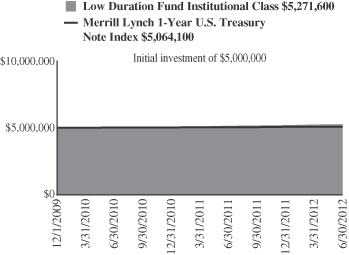
Average Annual Total Return at 6/30/2012
| | | | | | | | | | | | |
| | | Year
To Date | | | 1
Year | | | Since
Inception(a) | |
Institutional Class | | | 1.64 | % | | | 2.39 | % | | | 2.07 | % |
Merrill Lynch 1-Year U.S.
Treasury Note Index | |
| 0.04
|
| | | 0.26 | | | | 0.50 | |
| | (a) | | For the period December 1, 2009 (Commencement of Operations to June 30, 2012. |
Performance cited represents past performance. Past performance does not guarantee future results and current performance may be lower or higher than the data quoted. Results shown are average annual total returns, which assume reinvestment of dividends and capital gains. Investment returns and principal will fluctuate and you may have a gain or loss when you sell shares. For the most current month-end performance information, please call 1-800-742-7272, or visit our Web site at www.williamblairfunds.com. From time to time, the investment advisor may waive fees or reimburse expenses for the Fund. Without these waivers, performance would be lower.
The performance highlights and graph presented above do not reflect the deduction of taxes that a shareholder would pay on fund distributions or the redemption of fund shares.
The Merrill Lynch 1-Year U.S. Treasury Note Index is comprised of a single U.S. Treasury Note issue purchased at the beginning of the month and held for a full month. Each month the index is rebalanced and the issue selected is the outstanding U.S. Treasury Note that matures closest to, but not beyond one year from the rebalancing date.
This report identifies the Fund’s investments on June 30, 2012. These holdings are subject to change. Not all investments in the Fund performed the same, nor is there any guarantee that these investments will perform as well in the future. Market forecasts provided in this report may not necessarily come to pass.
Sector Diversification (unaudited)
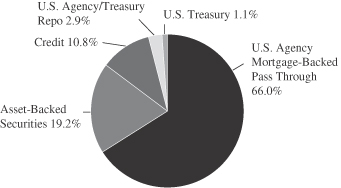
The sector diversification shown is based on the total investments.
36 Semi-Annual Report | June 30, 2012 |
Low Duration Fund
Portfolio of Investments, June 30, 2012 (all dollar amounts in thousands) (unaudited)
| | | | | | | | | | |
Issuer | | | | Principal
Amount | | | Value | |
|
U.S. Government and U.S. Government Agency—66.2% | |
U.S. Treasury Inflation Indexed Notes/Bonds—1.0% | | | | | | | | | | |
U.S. Treasury Inflation Indexed Note, 2.375%, due 1/15/17 | | | | $ | 1,711 | | | $ | 1,975 | |
| | | | | | | | | | |
Government National Mortgage Association (GNMA)—1.5% | | | | | | | | | | |
#002584, 6.000%, due 4/20/13 | | | | | 14 | | | | 15 | |
#623159, 5.000%, due 11/15/13 | | | | | 50 | | | | 54 | |
#628400, 6.000%, due 11/15/13 | | | | | 74 | | | | 76 | |
#002682, 6.500%, due 11/20/13 | | | | | 26 | | | | 28 | |
#623182, 5.000%, due 12/15/13 | | | | | 66 | | | | 72 | |
#781010, 6.500%, due 4/15/14 | | | | | 46 | | | | 48 | |
#002761, 6.000%, due 5/20/14 | | | | | 32 | | | | 35 | |
#002787, 5.500%, due 7/20/14 | | | | | 5 | | | | 5 | |
#781275, 6.000%, due 10/15/14 | | | | | 123 | | | | 128 | |
GNR 2011-24 VA, 3.500%, due 2/20/16 | | | | | 1,427 | | | | 1,513 | |
#561031, 5.500%, due 9/15/16 | | | | | 227 | | | | 248 | |
#003180, 6.000%, due 1/20/17 | | | | | 33 | | | | 36 | |
#781567, 5.000%, due 2/15/18 | | | | | 86 | | | | 92 | |
#606406, 5.000%, due 4/15/18 | | | | | 118 | | | | 129 | |
#003438, 4.500%, due 9/20/18 | | | | | 209 | | | | 227 | |
#003465, 4.500%, due 11/20/18 | | | | | 70 | | | | 75 | |
| | | | | | | | | | |
Total GNMA Mortgage Obligations | | | | | | | | | 2,781 | |
| | | | | | | | | | |
Federal Home Loan Mortgage Corp. (FHLMC)—19.5% | | | | | | | | | | |
#M80982, 5.000%, due 7/1/12 | | | | | 98 | | | | 100 | |
#B18053, 5.000%, due 3/1/15 | | | | | 46 | | | | 48 | |
#G11885, 5.000%, due 1/1/16 | | | | | 155 | | | | 166 | |
#E86134, 5.000%, due 11/1/16 | | | | | 175 | | | | 187 | |
#E96536, 5.000%, due 3/1/18 | | | | | 251 | | | | 270 | |
#E95355, 5.000%, due 4/1/18 | | | | | 338 | | | | 363 | |
#E01377, 4.500%, due 5/1/18 | | | | | 329 | | | | 349 | |
#G11618, 4.500%, due 5/1/18 | | | | | 1,508 | | | | 1,614 | |
#E96700, 5.000%, due 5/1/18 | | | | | 925 | | | | 994 | |
#E96962, 4.000%, due 6/1/18 | | | | | 161 | | | | 174 | |
#E01411, 5.000%, due 7/1/18 | | | | | 171 | | | | 183 | |
#G12024, 4.500%, due 8/1/18 | | | | | 431 | | | | 461 | |
#E99963, 4.500%, due 10/1/18 | | | | | 101 | | | | 108 | |
#E01488, 5.000%, due 10/1/18 | | | | | 375 | | | | 401 | |
#E99895, 5.000%, due 10/1/18 | | | | | 762 | | | | 818 | |
#G12093, 4.500%, due 12/1/18 | | | | | 465 | | | | 497 | |
#B11386, 5.000%, due 12/1/18 | | | | | 155 | | | | 167 | |
#B11362, 5.500%, due 12/1/18 | | | | | 24 | | | | 26 | |
#G13367, 5.500%, due 12/1/18 | | | | | 125 | | | | 136 | |
#E01545, 5.000%, due 1/1/19 | | | | | 211 | | | | 225 | |
#B12826, 4.500%, due 3/1/19 | | | | | 754 | | | | 811 | |
#G11766, 5.000%, due 3/1/19 | | | | | 151 | | | | 162 | |
#G18001, 4.500%, due 7/1/19 | | | | | 209 | | | | 223 | |
#G11596, 5.500%, due 8/1/19 | | | | | 186 | | | | 203 | |
#B16291, 5.000%, due 9/1/19 | | | | | 1,118 | | | | 1,201 | |
#G11605, 5.500%, due 9/1/19 | | | | | 94 | | | | 103 | |
#B17142, 4.500%, due 11/1/19 | | | | | 1,509 | | | | 1,635 | |
#G18045, 5.000%, due 3/1/20 | | | | | 165 | | | | 177 | |
#B19078, 5.000%, due 4/1/20 | | | | | 113 | | | | 121 | |
#G18048, 5.000%, due 4/1/20 | | | | | 110 | | | | 118 | |
#J08152, 5.000%, due 5/1/20 | | | | | 129 | | | | 139 | |
#G11720, 4.500%, due 8/1/20 | | | | | 35 | | | | 37 | |
|
U.S. Government and U.S. Government Agency—(continued) | |
Federal Home Loan Mortgage Corp. (FHLMC)—(continued) | | | | | | | | | | |
#G12394, 5.000%, due 5/1/21 | | | | $ | 208 | | | $ | 224 | |
#G13296, 5.000%, due 5/1/21 | | | | | 564 | | | | 606 | |
#G12113, 5.500%, due 5/1/21 | | | | | 289 | | | | 316 | |
#G12286, 5.000%, due 7/1/21 | | | | | 113 | | | | 121 | |
#E02322, 5.500%, due 5/1/22 | | | | | 77 | | | | 84 | |
#J06484, 5.500%, due 11/1/22 | | | | | 664 | | | | 724 | |
#C00351, 8.000%, due 7/1/24 | | | | | 120 | | | | 144 | |
#G13695, 4.000%, due 9/1/24 | | | | | 1,682 | | | | 1,823 | |
#G00363, 8.000%, due 6/1/25 | | | | | 155 | | | | 187 | |
#C80329, 8.000%, due 8/1/25 | | | | | 36 | | | | 44 | |
#J13022, 4.000%, due 9/1/25 | | | | | 3,141 | | | | 3,406 | |
#G14150, 4.500%, due 4/1/26 | | | | | 3,403 | | | | 3,706 | |
#E02912, 5.000%, due 6/1/26 | | | | | 1,541 | | | | 1,664 | |
#E02913, 5.000%, due 6/1/26 | | | | | 1,364 | | | | 1,468 | |
#J16051, 4.500%, due 7/1/26 | | | | | 4,595 | | | | 5,003 | |
#G04424, 6.000%, due 6/1/38 | | | | | 278 | | | | 309 | |
#G04778, 6.000%, due 7/1/38 | | | | | 256 | | | | 286 | |
#A81372, 6.000%, due 8/1/38 | | | | | 132 | | | | 146 | |
#G04544, 6.000%, due 8/1/38 | | | | | 1,807 | | | | 2,005 | |
#G04687, 6.000%, due 9/1/38 | | | | | 373 | | | | 416 | |
#G04745, 6.000%, due 9/1/38 | | | | | 207 | | | | 230 | |
#A81799, 6.500%, due 9/1/38 | | | | | 1,229 | | | | 1,401 | |
| | | | | | | | | | |
Total FHLMC Mortgage Obligations | | | | | | | | | 36,530 | |
| | | | | | | | | | |
Federal National Mortgage Association (FNMA)—44.2% | | | | | | | | | | |
#256224, 5.500%, due 4/1/16 | | | | | 29 | | | | 31 | |
#256559, 5.500%, due 1/1/17 | | | | | 15 | | | | 17 | |
#256606, 5.500%, due 2/1/17 | | | | | 20 | | | | 22 | |
#256646, 5.500%, due 3/1/17 | | | | | 15 | | | | 17 | |
#545898, 5.500%, due 9/1/17 | | | | | 460 | | | | 501 | |
#545899, 5.500%, due 9/1/17 | | | | | 521 | | | | 568 | |
#555029, 5.000%, due 11/1/17 | | | | | 65 | | | | 70 | |
#257067, 5.000%, due 1/1/18 | | | | | 72 | | | | 78 | |
#663692, 5.000%, due 1/1/18 | | | | | 219 | | | | 237 | |
#674713, 5.000%, due 1/1/18 | | | | | 15 | | | | 16 | |
#679305, 5.000%, due 1/1/18 | | | | | 69 | | | | 75 | |
#254591, 5.500%, due 1/1/18 | | | | | 347 | | | | 377 | |
#678938, 5.500%, due 2/1/18 | | | | | 35 | | | | 37 | |
#683100, 5.500%, due 2/1/18 | | | | | 453 | | | | 496 | |
#254684, 5.000%, due 3/1/18 | | | | | 24 | | | | 26 | |
#675717, 5.000%, due 3/1/18 | | | | | 299 | | | | 324 | |
#681361, 5.000%, due 3/1/18 | | | | | 113 | | | | 122 | |
#656564, 5.000%, due 4/1/18 | | | | | 1,614 | | | | 1,748 | |
#696677, 5.000%, due 4/1/18 | | | | | 108 | | | | 117 | |
#702888, 5.000%, due 4/1/18 | | | | | 171 | | | | 185 | |
#695838, 5.500%, due 4/1/18 | | | | | 99 | | | | 109 | |
#254721, 5.000%, due 5/1/18 | | | | | 268 | | | | 291 | |
#697593, 5.000%, due 5/1/18 | | | | | 255 | | | | 279 | |
#702332, 5.000%, due 5/1/18 | | | | | 58 | | | | 63 | |
#704049, 5.500%, due 5/1/18 | | | | | 962 | | | | 1,054 | |
#735357, 5.500%, due 5/1/18 | | | | | 1,383 | | | | 1,515 | |
#656573, 5.000%, due 6/1/18 | | | | | 267 | | | | 292 | |
#709848, 5.000%, due 6/1/18 | | | | | 222 | | | | 243 | |
#735003, 5.500%, due 7/1/18 | | | | | 1,501 | | | | 1,645 | |
#711991, 5.000%, due 8/1/18 | | | | | 202 | | | | 221 | |
See accompanying Notes to Portfolio of Investments.
June 30, 2012 | William Blair Funds 37 |
Low Duration Fund
Portfolio of Investments, June 30, 2012 (all dollar amounts in thousands) (unaudited)
| | | | | | | | | | |
Issuer | | | | Principal
Amount | | | Value | |
|
U.S. Government and U.S. Government Agency—(continued) | |
Federal National Mortgage Association (FNMA)—(continued) | | | | | | | | | | |
#743183, 5.000%, due 10/1/18 | | | | $ | 93 | | | $ | 102 | |
#749596, 5.000%, due 11/1/18 | | | | | 331 | | | | 361 | |
#745237, 5.000%, due 12/1/18 | | | | | 72 | | | | 78 | |
#761267, 4.500%, due 2/1/19 | | | | | 771 | | | | 846 | |
#255079, 5.000%, due 2/1/19 | | | | | 62 | | | | 67 | |
#766276, 5.000%, due 3/1/19 | | | | | 503 | | | | 547 | |
#779363, 5.000%, due 6/1/19 | | | | | 102 | | | | 112 | |
#785259, 5.000%, due 8/1/19 | | | | | 392 | | | | 427 | |
#725953, 5.000%, due 10/1/19 | | | | | 116 | | | | 127 | |
#735401, 5.500%, due 3/1/20 | | | | | 274 | | | | 299 | |
#879607, 5.500%, due 4/1/21 | | | | | 138 | | | | 151 | |
#880993, 6.000%, due 1/1/22 | | | | | 41 | | | | 45 | |
#972934, 5.500%, due 2/1/23 | | | | | 432 | | | | 473 | |
#982878, 4.500%, due 5/1/23 | | | | | 710 | | | | 779 | |
#254908, 5.000%, due 9/1/23 | | | | | 84 | | | | 91 | |
#255165, 4.500%, due 3/1/24 | | | | | 109 | | | | 119 | |
#934808, 4.500%, due 3/1/24 | | | | | 134 | | | | 147 | |
#AA4519, 4.500%, due 3/1/24 | | | | | 2,474 | | | | 2,715 | |
#AA5028, 4.500%, due 4/1/24 | | | | | 583 | | | | 639 | |
#190988, 9.000%, due 6/1/24 | | | | | 181 | | | | 212 | |
#AC1520, 4.000%, due 9/1/24 | | | | | 189 | | | | 205 | |
#AC5124, 4.000%, due 11/1/24 | | | | | 1,370 | | | | 1,494 | |
#AC6600, 4.500%, due 11/1/24 | | | | | 101 | | | | 111 | |
#AC6257, 4.000%, due 12/1/24 | | | | | 1,414 | | | | 1,541 | |
#AC8857, 4.500%, due 12/1/24 | | | | | 93 | | | | 101 | |
#AC9560, 5.000%, due 1/1/25 | | | | | 4,259 | | | | 4,652 | |
#932449, 4.000%, due 2/1/25 | | | | | 582 | | | | 635 | |
#AD0855, 4.000%, due 3/1/25 | | | | | 300 | | | | 325 | |
#932723, 4.000%, due 4/1/25 | | | | | 693 | | | | 756 | |
#935995, 4.000%, due 6/1/25 | | | | | 214 | | | | 233 | |
#AD4677, 4.000%, due 6/1/25 | | | | | 2,287 | | | | 2,494 | |
#AD8164, 4.000%, due 8/1/25 | | | | | 2,601 | | | | 2,836 | |
#AE1176, 4.000%, due 8/1/25 | | | | | 972 | | | | 1,060 | |
#AB1459, 4.000%, due 9/1/25 | | | | | 389 | | | | 424 | |
#AH2671, 4.000%, due 1/1/26 | | | | | 1,745 | | | | 1,903 | |
#890329, 4.000%, due 4/1/26 | | | | | 1,726 | | | | 1,875 | |
#AI4856, 4.500%, due 6/1/26 | | | | | 2,111 | | | | 2,317 | |
#AI9811, 4.500%, due 8/1/26 | | | | | 3,082 | | | | 3,382 | |
#AH9564, 3.500%, due 9/1/26 | | | | | 4,233 | | | | 4,558 | |
#AB3497, 4.000%, due 9/1/26 | | | | | 2,065 | | | | 2,243 | |
#AB3608, 3.500%, due 10/1/26 | | | | | 3,703 | | | | 3,988 | |
#AI7363, 3.500%, due 10/1/26 | | | | | 1,260 | | | | 1,356 | |
#AJ2322, 3.500%, due 10/1/26 | | | | | 2,903 | | | | 3,126 | |
#AB3975, 3.500%, due 12/1/26 | | | | | 1,135 | | | | 1,223 | |
#AJ8149, 3.500%, due 12/1/26 | | | | | 3,301 | | | | 3,555 | |
#AJ7724, 4.000%, due 12/1/26 | | | | | 2,570 | | | | 2,802 | |
#AK2768, 3.500%, due 3/1/27 | | | | | 3,009 | | | | 3,240 | |
#AK7384, 4.000%, due 3/1/27 | | | | | 3,465 | | | | 3,778 | |
#AB4818, 4.000%, due 4/1/27 | | | | | 2,957 | | | | 3,224 | |
#829306, 6.000%, due 9/1/35 | | | | | 180 | | | | 202 | |
#889385, 6.000%, due 2/1/38 | | | | | 2,123 | | | | 2,377 | |
#975649, 6.000%, due 7/1/38 | | | | | 463 | | | | 516 | |
#935532, 4.500%, due 8/1/39 | | | | | 121 | | | | 134 | |
#AC6651, 4.500%, due 12/1/39 | | | | | 148 | | | | 164 | |
#AL0913, 6.000%, due 7/1/41 | | | | | 834 | | | | 929 | |
| | | | | | | | | | |
Total FNMA Mortgage Obligations | | | | | | | | | 82,872 | |
| | | | | | | | | | |
Issuer | | NRSRO
Rating | | | Principal
Amount | | | Value | |
|
Asset-Backed Securities—19.1% | |
American Express Issuance Trust, 2007-2, Tranche A, 0.492%, 7/15/13, VRN | | | AAA | | | $ | 473 | | | $ | 473 | |
Avis Budget Rental Car Funding AESOP LLC—144A, 2009-1A, Tranche A, 9.310%, 10/20/13 | | | Aa1 | | | | 1,333 | | | | 1,353 | |
Volkswagen Auto Loan Enhanced Trust, 2010-1, Tranche A3, 1.310%, 1/20/14 | | | AAA | | | | 158 | | | | 158 | |
Honda Auto Receivables Owner Trust, 2010-2, Tranche A3, 1.340%, 3/18/14 | | | Aaa | | | | 43 | | | | 43 | |
Hertz Vehicle Financing LLC—144A, 2009-2A, Tranche A1, 4.260%, 3/25/14 | | | Aaa | | | | 1,765 | | | | 1,797 | |
BMW Vehicle Owner Trust, 2010-A, Tranche A3, 1.390%, 4/25/14 | | | AAA | | | | 121 | | | | 121 | |
Ford Credit Auto Owner Trust, 2010-A, Tranche A3, 1.320%, 6/15/14 | | | AAA | | | | 196 | | | | 197 | |
Capital Auto Receivables Asset Trust, 2008-1, Tranche A4B, 1.592%, 7/15/14, VRN | | | AAA | | | | 73 | | | | 73 | |
CNH Equipment Trust, 2010-A, Tranche A3, 1.540%, 7/15/14 | | | AAA | | | | 70 | | | | 70 | |
Nissan Auto Receivables Owner Trust, 2010-A, Tranche A3, 0.870%, 7/15/14 | | | Aaa | | | | 399 | | | | 399 | |
Mercedes-Benz Auto Lease Trust—144A, 2011-B, Tranche A3, 1.070%, 8/15/14 | | | Aaa | | | | 1,500 | | | | 1,508 | |
Nissan Auto Receivables Owner Trust, 2009-1, Tranche A3, 5.000%, 9/15/14 | | | AAA | | | | 50 | | | | 50 | |
Nissan Auto Receivables Owner Trust, 2012-A, Tranche A2, 0.540%, 10/15/14 | | | Aaa | | | | 1,400 | | | | 1,400 | |
Nissan Master Owner Trust Receivables—144A, 2010-AA, Tranche A, 1.392%, 1/15/15, VRN | | | AAA | | | | 2,300 | | | | 2,313 | |
CarMax Auto Owner Trust, 2012-1, Tranche A2, 0.590%, 3/16/15 | | | AAA | | | | 1,000 | | | | 1,000 | |
CNH Equipment Trust, 2010-C, Tranche A3, 1.170%, 5/15/15 | | | AAA | | | | 484 | | | | 486 | |
Harley-Davidson Motorcycle Trust, 2011-2, Tranche A2, 0.710%, 5/15/15 | | | Aaa | | | | 1,403 | | | | 1,405 | |
Discover Card Master Trust, 2007-A2, Tranche A2, 0.808%, 6/15/15, VRN | | | AAA | | | | 292 | | | | 292 | |
Discover Card Master Trust I, 2005-4, Tranche A2, 0.332%, 6/16/15, VRN | | | AAA | | | | 77 | | | | 77 | |
FPL Recovery Funding LLC, 2007-A, Tranche A2, 5.044%, 8/1/15 | | | AAA | | | | 518 | | | | 531 | |
Bank of America Credit Card Trust, 2010-A1, Tranche A1, 0.542%, 9/15/15, VRN | | | AAA | | | | 2,000 | | | | 2,004 | |
See accompanying Notes to Portfolio of Investments.
38 Semi-Annual Report | June 30, 2012 |
Low Duration Fund
Portfolio of Investments, June 30, 2012 (all dollar amounts in thousands) (unaudited)
| | | | | | | | | | | | |
Issuer | | NRSRO
Rating | | | Principal
Amount | | | Value | |
|
Asset-Backed Securities—(continued) | |
Chase Issuance Trust, 2008-A13, Tranche A13, 1.968%, 9/15/15, VRN | | | AAA | | | $ | 100 | | | $ | 102 | |
Discover Card Master Trust, 2010-A1, Tranche A1, 0.892%, 9/15/15, VRN | | | Aaa | | | | 447 | | | | 449 | |
USAA Auto Owner Trust, 2010-1, Tranche A4, 2.140%, 9/15/15 | | | AAA | | | | 685 | | | | 693 | |
American Express Credit Account Master Trust, 2010-1, Tranche A, 0.492%, 11/16/15, VRN | | | AAA | | | | 500 | | | | 501 | |
Honda Auto Receivables Owner Trust, 2012-1, Tranche A3, 0.770%, 1/15/16 | | | AAA | | | | 1,000 | | | | 1,001 | |
Ford Credit Floorplan Master Owner Trust, 2011-1, Tranche A2, 0.842%, 2/15/16, VRN | | | AAA | | | | 1,000 | | | | 1,005 | |
Hertz Vehicle Financing LLC—144A, 2009-2A, Tranche A2, 5.290%, 3/25/16 | | | Aaa | | | | 2,350 | | | | 2,580 | |
Ally Master Owner Trust, 2011-3, Tranche A1, 0.872%, 5/15/16, VRN | | | Aaa | | | | 1,100 | | | | 1,103 | |
CNH Equipment Trust, 2010-C, Tranche A4, 1.750%, 5/16/16 | | | AAA | | | | 60 | | | | 61 | |
Avis Budget Rental Car Funding AESOP LLC—144A, 2010-3A, Tranche A, 4.640%, 5/20/16 | | | Aaa | | | | 1,400 | | | | 1,514 | |
Centre Point Funding LLC—144A, 2010-1A, Tranche 1, 5.430%, 7/20/16 | | | A2 | | | | 1,589 | | | | 1,665 | |
CNH Equipment Trust, 2011-B, Tranche A3, 0.910%, 8/15/16 | | | AAA | | | | 500 | | | | 501 | |
Discover Card Master Trust, 2011-A1, Tranche A1, 0.592%, 8/15/16, VRN | | | Aaa | | | | 1,400 | | | | 1,406 | |
Enterprise Fleet Financing LLC—144A, 2011-2, Tranche A2, 1.430%, 10/20/16 | | | AAA | | | | 1,780 | | | | 1,785 | |
GE Capital Credit Card Master Note Trust, 2011-1, Tranche A, 0.792%, 1/15/17, VRN | | | Aaa | | | | 500 | | | | 503 | |
GE Dealer Floorplan Master Note Trust, 2012-1, Tranche A, 0.814%, 2/20/17, VRN | | | Aaa | | | | 1,000 | | | | 1,002 | |
Discover Card Master Trust, 2010-A2, Tranche A2, 0.822%, 3/15/18, VRN | | | AAA | | | | 350 | | | | 354 | |
Citibank Omni Master Trust—144A, 2009-A14A, Tranche A14, 2.992%, 8/15/18, VRN | | | Aaa | | | | 2,000 | | | | 2,100 | |
Capital One Multi-Asset Execution Trust, 2007-A2, Tranche A2, 0.322%, 12/16/19, VRN | | | AAA | | | | 215 | | | | 211 | |
MBNA Credit Card Master Note Trust, 2004-A3, Tranche A3, 0.502%, 8/16/21, VRN | | | AAA | | | | 475 | | | | 468 | |
Sierra Receivables Funding Co. LLC—144A, 2011-1A, Tranche A, 3.350%, 4/20/26 | | | A | | | | 941 | | | | 951 | |
| | | | | | | | | | | | |
Total Asset-Backed Securities | | | | | | | | | | | 35,705 | |
| | | | | | | | | | | | |
| | |
Corporate Obligations—10.7% | | | | | | | | | |
JPMorgan Chase & Co., 1.266%, due 1/24/14, VRN | | | A+ | | | $ | 1,000 | | | $ | 1,003 | |
Morgan Stanley, 2.066%, due 1/24/14, VRN | | | A | | | | 1,000 | | | | 972 | |
Bank of America Corporation, 1.886%, due 1/30/14, VRN | | | A | | | | 1,000 | | | | 990 | |
Citigroup, Inc., 1.391%, due 4/1/14, VRN | | | A | | | | 1,000 | | | | 984 | |
Morgan Stanley, 6.000%, due 5/13/14 | | | A | | | | 1,000 | | | | 1,036 | |
The Goldman Sachs Group, Inc., 0.969%, due 1/12/15, VRN | | | A | | | | 1,000 | | | | 943 | |
General Dynamics Corporation, 1.375%, due 1/15/15 | | | A | | | | 1,000 | | | | 1,014 | |
The Goldman Sachs Group, Inc., 5.125%, due 1/15/15 | | | A | | | | 1,000 | | | | 1,044 | |
AT&T, Inc., 0.875%, due 2/13/15 | | | A2 | | | | 1,000 | | | | 999 | |
Wells Fargo & Co., 1.250%, due 2/13/15 | | | AA- | | | | 2,250 | | | | 2,247 | |
Toyota Motor Credit Corporation, 1.000%, due 2/17/15 | | | AA- | | | | 1,000 | | | | 1,001 | |
The Bank of New York Mellon Corporation, 1.200%, due 2/20/15 | | | Aa3 | | | | 1,000 | | | | 1,005 | |
American International Group, Inc., 3.000%, due 3/20/15 | | | A- | | | | 1,150 | | | | 1,156 | |
JPMorgan Chase & Co., 1.875%, due 3/20/15 | | | A+ | | | | 1,300 | | | | 1,299 | |
The Goldman Sachs Group, Inc., 3.300%, due 5/3/15 | | | A | | | | 800 | | | | 800 | |
Citigroup, Inc., 4.700%, due 5/29/15 | | | A | | | | 1,100 | | | | 1,148 | |
John Deere Capital Corporation, 0.950%, due 6/29/15 | | | A | | | | 1,000 | | | | 1,002 | |
General Electric Capital Corporation, 1.625%, due 7/2/15 | | | A1 | | | | 1,425 | | | | 1,424 | |
| | | | | | | | | | | | |
Total Corporate Obligations | | | | | | | | | | | 20,067 | |
| | | | | | | | | | | | |
Total Long-Term Investments—96.0%
(cost $178,646) | | | | 179,930 | |
| | | | | | | | | | | | |
| | | |
Repurchase Agreement | | | | | | | | | | | | |
Fixed Income Clearing Corporation, 0.100% dated 6/29/12, due 7/2/12, repurchase price $5,406, collateralized by FHLB, 3.650%, due 2/24/32 | | | Aaa | | | | 5,406 | | | | 5,406 | |
| | | | | | | | | | | | |
Total Repurchase Agreement—2.9%
(cost $5,406) | | | | 5,406 | |
| | | | | | | | | | | | |
Total Investments—98.9%
(cost $184,052) | | | | 185,336 | |
Cash and other assets, less liabilities—1.1% | | | | 2,078 | |
| | | | | | | | | | | | |
Net assets—100.0% | | | $ | 187,414 | |
| | | | | | | | | | | | |
NRSRO = Nationally Recognized Statistical Rating Organization—The credit quality ratings of the securities in the Fund reflect the highest category rating by either Fitch Ratings, Moody’s Investors Service Inc., or Standard & Poor’s, a division of the McGraw-Hill Companies, Inc.
The obligations of certain U. S. Government-sponsored securities are neither issued nor guaranteed by the U. S. Treasury.
VRN = Variable Rate Note
See accompanying Notes to Portfolio of Investments.
June 30, 2012 | William Blair Funds 39 |
Statements of Assets and Liabilities
June 30, 2012 (dollar amounts in thousands)
| | | | | | | | | | | | |
| | | Institutional
International
Growth
Fund | | | Institutional
International
Equity
Fund | | | International
Small Cap
Growth
Fund | |
Assets | | | | | | | | | | | | |
Investments in securities, at cost | | $ | 1,581,627 | | | $ | 104,775 | | | $ | 607,513 | |
| | | | | | | | | | | | |
| | | |
Investments in securities, at value | | $ | 1,679,268 | | | $ | 115,534 | | | $ | 648,320 | |
Foreign currency, at value (cost $2,043; $46; $234) | | | 2,042 | | | | 46 | | | | 233 | |
Receivable for securities sold | | | 39,698 | | | | 1,501 | | | | 1,783 | |
Receivable for fund shares sold | | | 9,874 | | | | — | | | | 1,285 | |
Receivable from Advisor | | | — | | | | 37 | | | | — | |
Dividend and interest receivable | | | 2,636 | | | | 219 | | | | 1,071 | |
Unrealized appreciation on forward foreign currency contracts | | | 9 | | | | — | | | | — | |
| | | | | | | | | | | | |
Total assets | | | 1,733,527 | | | | 117,337 | | | | 652,692 | |
Liabilities | | | | | | | | | | | | |
Payable for investment securities purchased | | | 38,968 | | | | 2,064 | | | | 1,053 | |
Payable for fund shares redeemed | | | 95 | | | | — | | | | 379 | |
Unrealized depreciation on forward foreign currency contracts | | | — | | | | 11 | | | | — | |
Investment advisory fee payable | | | 1,275 | | | | 91 | | | | 518 | |
Distribution and shareholder service fee payable | | | — | | | | — | | | | 45 | |
Other payables and accrued expenses | | | 165 | | | | 50 | | | | 175 | |
| | | | | | | | | | | | |
Total liabilities | | | 40,503 | | | | 2,216 | | | | 2,170 | |
| | | | | | | | | | | | |
Net Assets | | $ | 1,693,024 | | | $ | 115,121 | | | $ | 650,522 | |
| | | | | | | | | | | | |
Capital | | | | | | | | | | | | |
Composition of Net Assets | | | | | | | | | | | | |
Par value of shares of beneficial interest | | $ | 127 | | | $ | 12 | | | $ | 53 | |
Capital paid in excess of par value | | | 1,747,740 | | | | 230,454 | | | | 677,939 | |
Accumulated net investment income (loss) | | | 36,355 | | | | 1,009 | | | | 9,353 | |
Accumulated net realized gain (loss) | | | (188,752 | ) | | | (127,093 | ) | | | (77,620 | ) |
Net unrealized appreciation (depreciation) of investments and foreign currencies | | | 97,554 | | | | 10,739 | | | | 40,797 | |
| | | | | | | | | | | | |
Net Assets | | $ | 1,693,024 | | | $ | 115,121 | | | $ | 650,522 | |
| | | | | | | | | | | | |
| | | |
Net Assets | | $ | 1,693,024 | | | $ | 115,121 | | | | | |
Shares Outstanding | | | 126,568,937 | | | | 11,827,202 | | | | | |
Net Asset Value Per Share | | | 13.38 | | | | 9.73 | | | | | |
Institutional Share Class | | | | | | | | | | | | |
Net Assets | | | | | | | | | | | 297,994 | |
Shares Outstanding | | | | | | | | | | | 24,327,664 | |
Net Asset Value Per Share | | | | | | | | | | $ | 12.25 | |
See accompanying Notes to Financial Statements.
40 Semi-Annual Report | June 30, 2012 |
Statements of Operations
for the Period Ended June 30, 2012 (all amounts in thousands)
| | | | | | | | | | | | |
| | | Institutional
International
Growth
Fund | | | Institutional
International
Equity
Fund | | | International
Small Cap
Growth
Fund | |
Investment income | | | | | | | | | | | | |
Dividends | | $ | 31,754 | | | $ | 1,847 | | | $ | 9,998 | |
Less foreign tax withheld | | | (3,116 | ) | | | (170 | ) | | | (933 | ) |
Interest | | | 11 | | | | 1 | | | | 8 | |
| | | | | | | | | | | | |
Total income | | | 28,649 | | | | 1,678 | | | | 9,073 | |
Expenses | | | | | | | | | | | | |
Investment advisory fees | | | 7,987 | | | | 586 | | | | 3,544 | |
Distribution fees | | | — | | | | — | | | | 20 | |
Shareholder services fees | | | — | | | | — | | | | 288 | |
Custodian fees | | | 149 | | | | 49 | | | | 115 | |
Transfer agent fees | | | 19 | | | | 2 | | | | 18 | |
Sub-transfer agent fees | | | | | | | | | | | | |
Class N | | | — | | | | — | | | | 12 | |
Class I | | | — | | | | — | | | | 128 | |
Professional fees | | | 57 | | | | 21 | | | | 37 | |
Registration fees | | | 31 | | | | 12 | | | | 34 | |
Shareholder reporting fees | | | 3 | | | | — | | | | 39 | |
Trustee fees | | | 36 | | | | 5 | | | | 13 | |
Other expenses | | | 27 | | | | 6 | | | | 14 | |
| | | | | | | | | | | | |
Total expenses | | | 8,309 | | | | 681 | | | | 4,262 | |
| | | | | | | | | | | | |
Expenses reimbursed to (waived or absorbed by) the Advisor | | | — | | | | (37 | ) | | | — | |
| | | | | | | | | | | | |
Net expenses | | | 8,309 | | | | 644 | | | | 4,262 | |
| | | | | | | | | | | | |
Net investment income (loss) | | | 20,340 | | | | 1,034 | | | | 4,811 | |
Realized and unrealized gain (loss) | | | | | | | | | | | | |
Net realized gain (loss) on transactions from: | | | | | | | | | | | | |
Investments | | | 12,716 | | | | 2,261 | | | | (14,939 | ) |
Foreign currency transactions | | | 5,464 | | | | 37 | | | | 1,539 | |
| | | | | | | | | | | | |
Total net realized gain (loss) | | | 18,180 | | | | 2,298 | | | | (13,400 | ) |
Change in net unrealized appreciation (depreciation) of: | | | | | | | | | | | | |
Investments | | | 81,718 | | | | 2,500 | | | | 60,489 | |
Foreign currency translations | | | 987 | | | | (10 | ) | | | 538 | |
| | | | | | | | | | | | |
Total change in net unrealized appreciation (depreciation) | | | 82,705 | | | | 2,490 | | | | 61,027 | |
| | | | | | | | | | | | |
Net increase (decrease) in net assets resulting from operations | | $ | 121,225 | | | $ | 5,822 | | | $ | 52,438 | |
| | | | | | | | | | | | |
See accompanying Notes to Financial Statements.
June 30, 2012 | William Blair Funds 41 |
Statements of Changes in Net Assets
for the Period Ended June 30, 2012 and the Year Ended December 31, 2011 (all amounts in thousands)
| | | | | | | | | | | | | | | | | | | | | | | | |
| | | Institutional
International
Growth
Fund | | | Institutional
International
Equity
Fund | | | International
Small Cap
Growth
Fund | |
| | | 2012 | | | 2011 | | | 2012 | | | 2011 | | | 2012 | | | 2011 | |
Operations | | | | | | | | | | | | | | | | | | | | | | | | |
Net investment income (loss) | | $ | 20,340 | | | $ | 25,588 | | | $ | 1,034 | | | $ | 3,338 | | | $ | 4,811 | | | $ | 6,857 | |
Net realized gain (loss) on investments and foreign currency transactions | | | 18,180 | | | | 68,491 | | | | 2,298 | | | | 29,945 | | | | (13,400 | ) | | | 60,435 | |
Change in net unrealized appreciation (depreciation) on investments and foreign currency transactions | | | 82,705 | | | | (329,733 | ) | | | 2,490 | | | | (61,430 | ) | | | 61,027 | | | | (155,577 | ) |
| | | | | | | | | | | | | | | | | | | | | | | | |
Net increase (decrease) in net assets resulting from operations | | | 121,225 | | | | (235,654 | ) | | | 5,822 | | | | (28,147 | ) | | | 52,438 | | | | (88,285 | ) |
Distributions to shareholders from | | | | | | | | | | | | | | | | | | | | | | | | |
Net investment income | | | — | | | | (1,997 | ) | | | — | | | | (2,326 | ) | | | — | | | | (10,724 | ) |
Net realized gain | | | — | | | | — | | | | — | | | | — | | | | — | | | | — | |
| | | | | | | | | | | | | | | | | | | | | | | | |
| | | — | | | | (1,997 | ) | | | — | | | | (2,326 | ) | | | — | | | | (10,724 | ) |
Capital stock transactions | | | | | | | | | | | | | | | | | | | | | | | | |
Net proceeds from sale of shares | | | 125,366 | | | | 357,122 | | | | 4,556 | | | | 12,843 | | | | 66,178 | | | | 313,989 | |
Shares issued in reinvestment of income dividends and capital gain distributions | | | — | | | | 1,885 | | | | — | | | | 2,328 | | | | — | | | | 8,514 | |
Less cost of shares redeemed | | | (96,161 | ) | | | (464,979 | ) | | | (6,731 | ) | | | (164,692 | ) | | | (186,315 | ) | | | (152,224 | ) |
| | | | | | | | | | | | | | | | | | | | | | | | |
Net increase (decrease) in net assets resulting from capital share transactions | | | 29,205 | | | | (105,972 | ) | | | (2,175 | ) | | | (149,521 | ) | | | (120,137 | ) | | | 170,279 | |
| | | | | | | | | | | | | | | | | | | | | | | | |
Increase (decrease) in net assets | | | 150,430 | | | | (343,623 | ) | | | 3,647 | | | | (179,994 | ) | | | (67,699 | ) | | | 71,270 | |
Net assets | | | | | | | | | | | | | | | | | | | | | | | | |
Beginning of period | | $ | 1,542,594 | | | $ | 1,886,217 | | | $ | 111,474 | | | $ | 291,468 | | | $ | 718,221 | | | $ | 646,951 | |
| | | | | | | | | | | | | | | | | | | | | | | | |
End of period | | $ | 1,693,024 | | | $ | 1,542,594 | | | $ | 115,121 | | | $ | 111,474 | | | $ | 650,522 | | | $ | 718,221 | |
| | | | | | | | | | | | | | | | | | | | | | | | |
Accumulated net investment income (loss) at the end of the period | | $ | 36,355 | | | $ | 18,657 | | | $ | 1,009 | | | $ | 655 | | | $ | 9,353 | | | $ | (4,453 | ) |
| | | | | | | | | | | | | | | | | | | | | | | | |
See accompanying Notes to Financial Statements.
42 Semi-Annual Report | June 30, 2012 |
Statements of Assets and Liabilities
June 30, 2012 (dollar amounts in thousands)
| | | | | | | | | | | | | | | | |
| | | Emerging
Markets
Growth
Fund | | | Emerging
Leaders
Fund | | | Bond
Fund | | | Low
Duration
Fund | |
Assets | | | | | | | | | | | | | | | | |
Investments in securities, at cost | | $ | 879,223 | | | $ | 42,440 | | | $ | 251,058 | | | $ | 184,052 | |
| | | | | | | | | | | | | | | | |
| | | | |
Investments in securities, at value | | $ | 923,975 | | | $ | 44,688 | | | $ | 267,441 | | | $ | 185,336 | |
Foreign currency, at value (cost $5,846; $570; $-; $-) | | | 5,858 | | | | 571 | | | | — | | | | — | |
Receivable for securities sold | | | 30,628 | | | | 916 | | | | — | | | | — | |
Receivable for fund shares sold | | | 10 | | | | — | | | | 297 | | | | 3,340 | |
Receivable from Advisor | | | — | | | | 21 | | | | 14 | | | | 2 | |
Dividend and interest receivable | | | 2,228 | | | | 89 | | | | 2,484 | | | | 572 | |
| | | | | | | | | | | | | | | | |
Total assets | | | 962,699 | | | | 46,285 | | | | 270,236 | | | | 189,250 | |
Liabilities | | | | | | | | | | | | | | | | |
Payable for investment securities purchased | | | 4,394 | | | | — | | | | 999 | | | | 1,711 | |
Payable for fund shares redeemed | | | 258 | | | | — | | | | 190 | | | | — | |
Payble to custodian | | | 4,277 | | | | — | | | | — | | | | — | |
Investment advisory fee payable | | | 877 | | | | 43 | | | | 65 | | | | 45 | |
Distribution and shareholder service fee payable | | | 21 | | | | 3 | | | | 26 | | | | 14 | |
Other payables and accrued expenses | | | 1,173 | | | | 1,273 | | | | 117 | | | | 66 | |
| | | | | | | | | | | | | | | | |
Total liabilities | | | 11,000 | | | | 1,319 | | | | 1,397 | | | | 1,836 | |
| | | | | | | | | | | | | | | | |
Net Assets | | $ | 951,699 | | | $ | 44,966 | | | $ | 268,839 | | | $ | 187,414 | |
| | | | | | | | | | | | | | | | |
Capital | | | | | | | | | | | | | | | | |
Composition of Net Assets | | | | | | | | | | | | | | | | |
Par value of shares of beneficial interest | | $ | 78 | | | $ | 5 | | | $ | 24 | | | $ | 19 | |
Capital paid in excess of par value | | | 944,952 | | | | 46,607 | | | | 250,394 | | | | 189,501 | |
Accumulated net investment income (loss) | | | 5,647 | | | | 378 | | | | (780 | ) | | | (984 | ) |
Accumulated net realized gain (loss) | | | (42,919 | ) | | | (4,271 | ) | | | 2,818 | | | | (2,406 | ) |
Net unrealized appreciation (depreciation) of investments and foreign currencies | | | 43,941 | | | | 2,247 | | | | 16,383 | | | | 1,284 | |
| | | | | | | | | | | | | | | | |
Net Assets | | $ | 951,699 | | | $ | 44,966 | | | $ | 268,839 | | | $ | 187,414 | |
| | | | | | | | | | | | | | | | |
| | | | |
Institutional Share Class | | | | | | | | | | | | | | | | |
Net Assets | | $ | 801,502 | | | $ | 21,043 | | | $ | 83,775 | | | $ | 76,151 | |
Shares Outstanding | | | 65,989,169 | | | | 2,567,844 | | | | 7,628,817 | | | | 7,737,804 | |
Net Asset Value Per Share | | $ | 12.15 | | | $ | 8.19 | | | $ | 10.98 | | | $ | 9.84 | |
See accompanying Notes to Financial Statements.
June 30, 2012 | William Blair Funds 43 |
Statements of Operations
for the Period Ended June 30, 2012 (all amounts in thousands)
| | | | | | | | | | | | | | | | |
| | | Emerging
Markets
Growth
Fund | | | Emerging
Leaders
Fund | | | Bond
Fund | | | Low
Duration
Fund | |
Investment income | | | | | | | | | | | | | | | | |
Dividends | | $ | 14,885 | | | $ | 816 | | | $ | — | | | $ | — | |
Less foreign tax withheld | | | (1,101 | ) | | | (59 | ) | | | — | | | | — | |
Interest | | | 8 | | | | — | | | | 5,340 | | | | 1,963 | |
| | | | | | | | | | | | | | | | |
Total income | | | 13,792 | | | | 757 | | | | 5,340 | | | | 1,963 | |
Expenses | | | | | | | | | | | | | | | | |
Investment advisory fees | | | 5,534 | | | | 305 | | | | 374 | | | | 257 | |
Distribution fees | | | 23 | | | | — | | | | 14 | | | | 5 | |
Shareholder services fees | | | 117 | | | | 19 | | | | 132 | | | | 73 | |
Custodian fees | | | 273 | | | | 64 | | | | 27 | | | | 34 | |
Transfer agent fees | | | 25 | | | | 10 | | | | 16 | | | | 11 | |
Sub-transfer agent fees | | | | | | | | | | | | | | | | |
Class N | | | 9 | | | | — | | | | 9 | | | | 1 | |
Class I | | | 34 | | | | — | | | | 20 | | | | — | |
Professional fees | | | 69 | | | | 28 | | | | 13 | | | | 10 | |
Registration fees | | | 34 | | | | 38 | | | | 29 | | | | 31 | |
Shareholder reporting fees | | | 34 | | | | — | | | | 2 | | | | — | |
Trustee fees | | | 21 | | | | 2 | | | | 5 | | | | 3 | |
Other expenses | | | 19 | | | | 5 | | | | 6 | | | | 6 | |
| | | | | | | | | | | | | | | | |
Total expenses before waiver | | | 6,192 | | | | 471 | | | | 647 | | | | 431 | |
Expenses waived by the Advisor | | | — | | | | (106 | ) | | | (64 | ) | | | (10 | ) |
| | | | | | | | | | | | | | | | |
Net expenses | | | 6,192 | | | | 365 | | | | 583 | | | | 421 | |
| | | | | | | | | | | | | | | | |
Net investment income (loss) | | | 7,600 | | | | 392 | | | | 4,757 | | | | 1,542 | |
Realized and unrealized gain (loss) | | | | | | | | | | | | | | | | |
Net realized gain (loss) on transactions from: | | | | | | | | | | | | | | | | |
Investments | | | (13,238 | ) | | | (1,591 | ) | | | 1,969 | | | | 155 | |
Foreign currency transactions | | | (1,245 | ) | | | (30 | ) | | | — | | | | — | |
| | | | | | | | | | | | | | | | |
Total net realized gain (loss) | | | (14,483 | ) | | | (1,621 | ) | | | 1,969 | | | | 155 | |
Change in net unrealized appreciation (depreciation) of: | | | | | | | | | | | | | | | | |
Investments | | | 63,746 | | | | 4,762 | | | | 2,990 | | | | 1,025 | |
Foreign currency translations | | | (494 | ) | | | 44 | | | | — | | | | — | |
| | | | | | | | | | | | | | | | |
Total change in net unrealized appreciation (depreciation) | | | 63,252 | | | | 4,806 | | | | 2,990 | | | | 1,025 | |
| | | | | | | | | | | | | | | | |
Net increase (decrease) in net assets resulting from operations | | $ | 56,369 | | | $ | 3,577 | | | $ | 9,716 | | | $ | 2,722 | |
| | | | | | | | | | | | | | | | |
See accompanying Notes to Financial Statements.
44 Semi-Annual Report | June 30, 2012 |
Statements of Changes in Net Assets
for the Period Ended June 30, 2012 and the Year Ended December 31, 2011 (all amounts in thousands)
| | | | | | | | | | | | | | | | | | | | | | | | | | | | | | | | |
| | | Emerging
Markets
Growth
Fund | | | Emerging
Leaders
Fund | | | Bond
Fund | | | Low
Duration
Fund | |
| | | 2012 | | | 2011 | | | 2012 | | | 2011 | | | 2012 | | | 2011 | | | 2012 | | | 2011 | |
Operations | | | | | | | | | | | | | | | | | | | | | | | | | | | | | | | | |
Net investment income (loss) | | $ | 7,600 | | | $ | 8,885 | | | $ | 392 | | | $ | 701 | | | $ | 4,757 | | | $ | 8,820 | | | $ | 1,542 | | | $ | 2,586 | |
Net realized gain (loss) on investments and foreign currency transactions | | | (14,483 | ) | | | 127,536 | | | | (1,621 | ) | | | 112 | | | | 1,969 | | | | 3,325 | | | | 155 | | | | 59 | |
Change in net unrealized appreciation (depreciation) on investments and foreign currency transactions | | | 63,252 | | | | (304,105 | ) | | | 4,806 | | | | (20,181 | ) | | | 2,990 | | | | 3,590 | | | | 1,025 | | | | 360 | |
| | | | | | | | | | | | | | | | | | | | | | | | | | | | | | | | |
Net increase (decrease) in net assets resulting from
operations | | | 56,369 | | | | (167,684 | ) | | | 3,577 | | | | (19,368 | ) | | | 9,716 | | | | 15,735 | | | | 2,722 | | | | 3,005 | |
Distributions to shareholders from | | | | | | | | | | | | | | | | | | | | | | | | | | | | | | | | |
Net investment income | | | — | | | | (4,450 | ) | | | — | | | | (332 | ) | | | (5,539 | ) | | | (9,700 | ) | | | (2,526 | ) | | | (4,103 | ) |
Net realized gain | | | — | | | | (115,030 | ) | | | — | | | | (3,704 | ) | | | — | | | | (1,831 | ) | | | — | | | | — | |
| | | | | | | | | | | | | | | | | | | | | | | | | | | | | | | | |
| | | — | | | | (119,480 | ) | | | — | | | | (4,036 | ) | | | (5,539 | ) | | | (11,531 | ) | | | (2,526 | ) | | | (4,103 | ) |
Capital stock transactions | | | | | | | | | | | | | | | | | | | | | | | | | | | | | | | | |
Net proceeds from sale of shares | | | 194,763 | | | | 352,369 | | | | 10,538 | | | | 19,857 | | | | 47,896 | | | | 109,328 | | | | 55,396 | | | | 124,749 | |
Shares issued in reinvestment of income dividends and capital gain distributions | | | — | | | | 100,061 | | | | — | | | | 3,491 | | | | 4,205 | | | | — | | | | 1,963 | | | | — | |
Less cost of shares redeemed | | | (117,279 | ) | | | (597,963 | ) | | | (16,971 | ) | | | (47,023 | ) | | | (19,455 | ) | | | (74,292 | ) | | | (27,288 | ) | | | (109,974 | ) |
| | | | | | | | | | | | | | | | | | | | | | | | | | | | | | | | |
Net increase (decrease) in net assets resulting from capital share transactions | | | 77,484 | | | | (145,533 | ) | | | (6,433 | ) | | | (23,675 | ) | | | 32,646 | | | | 35,036 | | | | 30,071 | | | | 14,775 | |
| | | | | | | | | | | | | | | | | | | | | | | | | | | | | | | | |
Increase (decrease) in net
assets | | | 133,853 | | | | (432,697 | ) | | | (2,856 | ) | | | (47,079 | ) | | | 36,823 | | | | 39,240 | | | | 30,267 | | | | 13,677 | |
Net assets | | | | | | | | | | | | | | | | | | | | | | | | | | | | | | | | |
Beginning of period | | $ | 817,846 | | | $ | 1,250,543 | | | $ | 47,822 | | | $ | 94,901 | | | $ | 232,016 | | | $ | 192,776 | | | $ | 157,147 | | | $ | 143,470 | |
| | | | | | | | | | | | | | | | | | | | | | | | | | | | | | | | |
End of period | | $ | 951,699 | | | $ | 817,846 | | | $ | 44,966 | | | $ | 47,822 | | | $ | 268,839 | | | $ | 232,016 | | | $ | 187,414 | | | $ | 157,147 | |
| | | | | | | | | | | | | | | | | | | | | | | | | | | | | | | | |
Accumulated net investment income (loss) at the end of the period | | $ | 5,647 | | | $ | (7,892 | ) | | $ | 378 | | | $ | 238 | | | $ | (780 | ) | | $ | (879 | ) | | $ | (984 | ) | | $ | (1,517 | ) |
| | | | | | | | | | | | | | | | | | | | | | | | | | | | | | | | |
See accompanying Notes to Financial Statements.
June 30, 2012 | William Blair Funds 45 |
Notes to Financial Statements
(1) Significant Accounting Policies
The following is a summary of William Blair Funds’ (the “Trust”) significant accounting policies in effect during the year covered by the financial statements, which are in accordance with U.S. generally accepted accounting principles.
(a) Description of the Fund
The Fund is a diversified mutual fund registered under the Investment Company Act of 1940 (the “1940 Act”), as amended, as an open-end management investment company. The number of shares authorized for this Trust is unlimited. The Trust currently consists of the following twenty-four funds (the “Funds”), each with its own investment objective and policies. For each Fund, the number of shares authorized is unlimited.
| | |
Equity Funds | | International Equity Funds |
Growth Large Cap Growth Small Cap Growth Mid Cap Growth Small-Mid Cap Growth Large Cap Value Small Cap Value Mid Cap Value Small-Mid Cap Value Global Equity Fund Global Growth Multi-Asset and Alternative Funds Macro Allocation Commodity Strategy Long/Short | | International Growth International Equity Institutional International Growth Institutional International Equity International Small Cap Growth Emerging Markets Growth Emerging Leaders Growth Emerging Markets Small Cap Growth Fixed-Income Funds Bond Income Low Duration Money Market Fund Ready Reserves |
The investment objectives of the Funds are as follows:
| | |
Equity | | Long-term capital appreciation. |
Global Equity | | Long-term capital appreciation. |
International Equity | | Long-term capital appreciation. |
Fixed-Income | | High level of current income with relative stability of principal.
(Maximize total return—Low Duration) |
Money Market | | Current income, a stable share price and daily liquidity. |
The Institutional International Growth Fund, the Institutional International Equity Fund and the Institutional Share Classes of the International Small Cap Growth Fund, the Emerging Markets Growth Fund, the Emerging Leaders Growth Fund, Bond Fund, and the Low Duration Fund are the only Funds covered in this report.
The Macro Allocation Fund and the Commodity Strategy Long/Short Fund have a fiscal year end of October 31, and issue a separate report.
(b) Share Classes
Three different classes of shares of the Global Growth, International Small Cap Growth, Emerging Markets Growth, Emerging Leaders Growth, Emerging Markets Small Cap Growth, Bond and the Low Duration Funds currently exist: N, I and Institutional. This report includes financial information for only the Institutional Class. The Institutional share class is sold to institutional investors, including but not limited to employee benefit plans, endowments, foundations, trusts and corporations, who are able to meet the Fund’s high minimum investment requirement. The minimum initial investment required is $5 million. The Global Growth and Emerging Markets Small Cap Growth Funds do not have any shareholders in the Institutional Class as of June 30, 2012.
46 Semi-Annual Report | June 30, 2012 |
Investment income realized and unrealized gains and losses, and certain Fund level expenses and expense reductions, if any, are allocated based on the relative net assets of each class, except for certain class specific expenses, which are charged directly to the appropriate class. Differences in class expenses may result in the payment of different per share dividends by class. All share classes of the Funds have equal rights with respect to voting subject to class specific arrangements.
(c) Investment Valuation
The market value of domestic equity securities is determined by valuing securities traded on national securities markets or in the over-the-counter markets at the last sale price or, if applicable, the official closing price or, in the absence of a recent sale on the date of determination, at the latest bid price.
The value of foreign equity securities is generally determined based upon the last sale price on the foreign exchange or market on which it is primarily traded and in the currency of that market as of the close of the appropriate exchange or, if there have been no sales during that day, at the latest bid price. The Board of Trustees has determined that the passage of time between when the foreign exchanges or markets close and when the Funds compute their net asset values could cause the value of foreign equity securities to no longer be representative or accurate, and as a result, may necessitate that such securities be fair valued. Accordingly, for foreign equity securities, the Funds may use an independent pricing service to fair value the security as of the close of regular trading on the New York Stock Exchange. As a result, a Fund’s value for a security may be different from the last sale price (or the latest bid price).
Fixed-income securities are valued by using market quotations or independent pricing services that use either prices provided by market-makers or matrices that produce estimates of market values obtained from yield data relating to instruments or securities with similar characteristics.
Securities, and other assets, for which a market price is not available or is deemed unreliable, (e.g., securities affected by unusual or extraordinary events, such as natural disasters or securities affected by market or economic events, such as bankruptcy filings), or the value of which is affected by a significant valuation event, are valued at a fair value as determined in good faith by, or under the direction of, the Board of Trustees and in accordance with the Trust’s valuation procedures. The value of fair valued securities may be different from the last sale price (or the latest bid price), and there is no guarantee that a fair valued security will be sold at the price at which a Fund is carrying the security.
Investments in other funds are valued at the underlying fund’s net asset value on the date of valuation. As of June 30, 2012, there were securities held in the Institutional International Growth, International Small Cap Growth, Emerging Markets Growth and Bond Funds requiring fair valuation pursuant to the Funds’ Valuation Procedures.
(d) Investment income and transactions
Dividend income is recorded on the ex-dividend date, except for those dividends from certain foreign securities that are recorded when the information is available.
Interest income is recorded on an accrual basis, adjusted for amortization of premium or discount. Variable rate bonds and floating rate notes earn interest at coupon rates that fluctuate at specific time intervals. The interest rate shown on the Portfolio of Investments for the Bond Fund and Low Duration Fund were the rates in effect on June 30, 2012. Put bonds may be redeemed at the discretion of the holder on specified dates prior to maturity.
Premiums and discounts are accreted and amortized on a straight-line basis for short-term investments and on an effective interest method for long-term investments.
Paydown gains and losses on mortgage and asset-backed securities are treated as an adjustment to interest income. For the period ended June 30, 2012, the Bond and Low Duration Funds recognized an increase of interest income and a decrease of net realized loss of $(786) and $(984), respectively (in thousands). This reclassification had no effect on the net asset value or the net assets of the Funds.
The Funds do not isolate that portion of the results of operations resulting from changes in foreign exchange rates on investments from the fluctuations arising from changes in market prices of securities held. Such fluctuations are included with the net realized and unrealized gain or loss from investments.
June 30, 2012 | William Blair Funds 47 |
Reported net realized foreign currency gains or losses arise from disposition of foreign currency, the difference in the foreign exchange rates between the trade and settlement dates on securities transactions, and the difference between the amounts of dividends, interest and foreign withholding taxes recorded on the ex-date or accrual date and the U.S. dollar equivalent of the amounts actually received or paid. Net unrealized foreign exchange gains and losses arise from changes (due to the changes in the exchange rate) in the value of foreign currency and other assets and liabilities denominated in foreign currencies held at year end.
Security and shareholder transactions are accounted for no later than one business day following the trade date. However, for financial reporting purposes, security and shareholder transactions are accounted for on the trade date of the last business day of the reporting period. Realized gains and losses from securities transactions are recognized on a specifically identified cost basis.
Awards from class action litigation may be recorded as a reduction of cost. If the Funds no longer own the applicable securities, the proceeds are recorded as realized gains.
(e) Share Valuation and Dividends to Shareholders
Shares are sold and redeemed on a continuous basis at net asset value. The net asset value per share is determined by dividing the Fund’s net assets by the number of shares outstanding as of the close of regular trading on the New York Stock Exchange, which is generally 4:00 p.m. Eastern time, on each day the Exchange is open.
Dividends from net investment income, if any, are declared at least annually for the Institutional International Growth, Institutional International Equity, International Small Cap Growth, Emerging Markets Growth and Emerging Leaders Growth Funds. Dividends from the Bond and Low Duration Funds are declared daily and paid monthly. Dividends payable to shareholders are recorded on the ex-dividend date.
(f) Foreign Currency Translation and Foreign Currency Forward Contracts
The Funds (excluding the Bond and Low Duration Funds) may invest in securities denominated in foreign currencies. As such, assets and liabilities denominated in foreign currencies are translated into U.S. dollar amounts at the current exchange rate on the date of valuation. The values of foreign investments, forward open foreign currency contracts, and cash denominated in foreign currencies are translated into U.S. dollars using a spot market rate of exchange as of the time of the determination of each Fund’s net asset value, typically 4:00 p.m. Eastern time on days when there is regular trading on the New York Stock Exchange (the “Exchange”). Payables and receivables for securities transactions, dividends, interest income and tax reclaims are translated into U.S. dollars using a spot market rate of exchange as of 4:00 p.m. Eastern time. Settlement of purchases and sales and dividend and interest receipts are translated into U.S. dollars using a spot market rate of exchange as of 11:00 a.m. Eastern time.
(g) Income Taxes
Each Fund intends to comply with the provisions of Subchapter M of the Internal Revenue Code available to regulated investment companies. Each Fund intends to make the requisite distributions of income and capital gains to its shareholders sufficient to relieve it from all, or substantially all, federal income and excise taxes. No provision for federal income and excise taxes has been made.
The Institutional International Growth, Institutional International Equity, International Small Cap Growth, Emerging Markets Growth, and Emerging Leaders Growth Funds may be subject to a tax imposed on net realized and unrealized gains on securities of certain foreign countries.
Management has evaluated all of the uncertain tax positions of the Funds and has determined that no liability is required to be recorded in the financial statements.
The statute of limitations on the Funds’ tax returns for each of the tax years in the four year period ended December 31, 2011 remains open and the returns are subject to examination.
48 Semi-Annual Report | June 30, 2012 |
The Funds have elected to mark-to-market their investments in Passive Foreign Investment Companies (“PFICs”) for federal income tax purposes. The Funds also treat the deferred loss associated with current and prior year wash sales as an adjustment to the cost of investments for tax purposes. The cost of investments for federal income tax purposes and related gross unrealized appreciation (depreciation) and net unrealized appreciation (depreciation) at June 30, 2012 were as follows (in thousands):
| | | | | | | | | | | | | | | | |
Fund | | Cost of
Investments | | | Gross
Unrealized
Appreciation | | | Gross
Unrealized
Depreciation | | | Net
Unrealized
Appreciation
(Depreciation) | |
Institutional International Growth | | | 1,585,567 | | | | 165,144 | | | | 71,443 | | | | 93,701 | |
Institutional International Equity | | | 106,321 | | | | 12,491 | | | | 3,277 | | | | 9,214 | |
International Small Cap Growth | | | 613,406 | | | | 69,552 | | | | 34,638 | | | | 34,914 | |
Emerging Markets Growth | | | 894,872 | | | | 70,072 | | | | 40,969 | | | | 29,103 | |
Emerging Leaders Growth | | | 44,328 | | | | 2,000 | | | | 1,640 | | | | 360 | |
Bond | | | 184,052 | | | | 1,671 | | | | 387 | | | | 1,284 | |
Low Duration | | | 251,058 | | | | 16,751 | | | | 368 | | | | 16,383 | |
The timing and characterization of certain income and capital gain distributions are determined annually in accordance with federal income tax regulations that may differ from U.S. generally accepted accounting principles. As a result, net investment income or loss and net realized gain or loss for a reporting period may differ from the amount distributed during such period. In addition, the Funds may periodically record reclassifications among certain capital accounts to reflect differences between financial reporting and income tax basis distributions. The reclassifications were reported in order to reflect the tax treatment for certain permanent differences that exist between income tax regulations and U.S. generally accepted accounting principles. The reclassifications generally relate to Section 988 currency gains and losses, PFIC gains and losses, paydown gains and losses and redemptions in-kind. These reclassifications have no impact on the net asset values of the Funds. Accordingly, at December 31, 2011, the following reclassifications were recorded (in thousands):
| | | | | | | | | | | | |
Fund | | Accumulated Net
Investment Income (Loss) | | | Accumulated Net Realized Gain (Loss) | | | Capital Paid in Excess of Par Value | |
Institutional International Growth | | $ | (2,642 | ) | | $ | 2,642 | | | $ | — | |
Institutional International Equity | | | (679 | ) | | | 701 | | | | (22 | ) |
International Small Cap Growth | | | 8,995 | | | | (8,995 | ) | | | — | |
Emerging Markets Growth | | | 5,939 | | | | (24,168 | ) | | | 18,229 | |
Emerging Leaders Growth | | | (251 | ) | | | 276 | | | | (25 | ) |
Bond | | | 879 | | | | (879 | ) | | | — | |
Low Duration | | | 1,517 | | | | (1,517 | ) | | | — | |
Distributions from net realized gains for book purposes may include short-term capital gains, which are included as ordinary income for tax purposes. The tax character of distributions paid during 2011 and 2010 was as follows (in thousands):
| | | | | | | | | | | | | | | | | | | | | | | | |
| | | Distributions Paid in 2011 | | | Distributions Paid in 2010 | |
Fund | | Return of
Capital | | | Ordinary
Income | | | Long-Term
Capital Gains | | | Return of
Capital | | | Ordinary
Income | | | Long-Term
Capital Gains | |
Institutional International Growth | | $ | — | | | $ | 1,997 | | | $ | — | | | $ | — | | | $ | 35,383 | | | $ | — | |
Institutional International Equity | | | — | | | | 2,306 | | | | — | | | | — | | | | 4,059 | | | | — | |
International Small Cap Growth | | | — | | | | 5,384 | | | | — | | | | — | | | | 1,388 | | | | — | |
Emerging Markets Growth | | | — | | | | 3,984 | | | | 93,763 | | | | — | | | | 11,311 | | | | — | |
Emerging Leaders Growth | | | 13 | | | | 697 | | | | 1,443 | | | | — | | | | — | | | | — | |
Bond | | | — | | | | 2,764 | | | | 577 | | | | — | | | | 1,483 | | | | 99 | |
Low Duration | | | — | | | | 1,853 | | | | — | | | | — | | | | 1,041 | | | | — | |
As of December 31, 2011, the components of distributable earnings on a tax basis were as follows (in thousands):
| | | | | | | | | | | | | | | | |
Fund | | Undistributed Ordinary Income | | | Accumulated Capital and Other Losses | | | Undistributed Long-Term Capital Gain | | | Net Unrealized Appreciation (Depreciation) | |
Institutional International Growth | | $ | 17,088 | | | $ | (202,354 | ) | | $ | — | | | $ | 9,198 | |
Institutional International Equity | | | — | | | | (127,316 | ) | | | — | | | | 6,149 | |
International Small Cap Growth | | | 5,874 | | | | (59,252 | ) | | | — | | | | (26,530 | ) |
Emerging Markets Growth | | | — | | | | (13,506 | ) | | | — | | | | (36,194 | ) |
June 30, 2012 | William Blair Funds 49 |
| | | | | | | | | | | | | | | | |
Fund | | Undistributed Ordinary Income | | | Accumulated Capital and Other Losses | | | Undistributed Long-Term Capital Gain | | | Net Unrealized Appreciation (Depreciation) | |
Emerging Leaders Growth | | $ | — | | | $ | (931 | ) | | $ | — | | | $ | (4,292 | ) |
Bond | | | 2 | | | | (79 | ) | | | 928 | | | | 13,393 | |
Low Duration | | | — | | | | (2,561 | ) | | | — | | | | 259 | |
As of December 31, 2011, the Funds have unused capital loss carry forwards available for federal income tax purposes to be applied against future gains, if any. If not applied, the carryforward will expire as follows (in thousands):
| | | | | | | | | | | | | | | | |
Fund | | 2016 | | | 2017 | | | 2018 | | | Total | |
Institutional International Growth | | $ | — | | | $ | 182,481 | | | $ | — | | | $ | 182,481 | |
Institutional International Equity | | | 13,581 | | | | 113,087 | | | | — | | | | 126,668 | |
International Small Cap Growth | | | — | | | | 55,999 | | | | — | | | | 55,999 | |
Low Duration | | | — | | | | — | | | | 955 | | | | 955 | |
The Regulated Investment Company Modernization Act of 2010 (the “Act”) was enacted on December 22, 2010. Under the Act each Fund is permitted to carry forward capital losses incurred in taxable years beginning after the date of enactment for an unlimited period. However, any losses incurred in periods after enactment will be required to be utilized prior to the losses incurred in pre-enactment taxable years, which carry an expiration date. Each Fund has the following carry forward capital losses without expiration as of December 31, 2011 (in thousands):
| | | | | | | | |
Fund | | Short
Term | | | Long
Term | |
Low Duration | | $ | 951 | | | $ | 406 | |
For the period from November 1, 2011 through December 31, 2011, the following Funds incurred realized ordinary loss and capital losses. Ordinary Loss includes losses from currency transactions and PFICs. Each Fund intends to treat these losses as having occurred on the first day of fiscal year 2012 for federal income tax purposes (in thousands):
| | | | | | | | | | | | |
Fund | | Ordinary Loss | | | Short-Term Capital | | | Long-Term Capital | |
Institutional International Growth | | $ | — | | | $ | 19,637 | | | $ | — | |
Institutional International Equity | | | 19 | | | | 613 | | | | — | |
International Small Cap Growth | | | 537 | | | | 2,491 | | | | — | |
Emerging Markets Growth | | | 783 | | | | 9,852 | | | | 2,610 | |
Emerging Leaders Growth | | | 16 | | | | 791 | | | | 81 | |
Bond | | | — | | | | 78 | | | | — | |
Low Duration | | | — | | | | 118 | | | | 132 | |
(h) Repurchase Agreements
In a repurchase agreement, a Fund buys a security at one price and at the time of sale, the seller agrees to repurchase the obligation at a mutually agreed upon time and price (usually within seven days). The repurchase agreement thereby determines the yield during the purchaser’s holding period, while the seller’s obligation to repurchase is secured by the value of the underlying security. William Blair & Company, L.L.C. (the “Advisor”) will monitor, on an ongoing basis, the value of the underlying securities to ensure that the value always equals or exceeds the repurchase price plus accrued interest. Repurchase agreements could involve certain risks in the event of a default or insolvency of the other party to the agreement, including possible delays or restrictions upon a Fund’s ability to dispose of the underlying securities. The risk to a Fund is limited to the ability of the seller to pay the agreed upon sum on the delivery date. In the event of default, a repurchase agreement provides that a Fund is entitled to sell the underlying collateral. The loss, if any, to a Fund will be the difference between the proceeds from the sale and the repurchase price. However, if bankruptcy proceedings are commenced with respect to the seller of the security, disposition of the collateral by the Fund may be delayed or limited. Although no definitive creditworthiness criteria are used, the Advisor reviews the creditworthiness of the banks and non-bank dealers with which a Fund enters into repurchase agreements to evaluate those risks. A Fund may, for tax purposes, deem repurchase agreements collateralized by U.S. Government securities to be investments in U.S. Government securities.
50 Semi-Annual Report | June 30, 2012 |
(i) Use of Estimates
The preparation of financial statements in conformity with U.S. generally accepted accounting principles requires management to make estimates and assumptions that affect the amounts reported in the financial statements. Actual results may differ from those estimates.
(j) Indemnification
In the normal course of business, the Funds have entered into contracts in which the Funds agree to indemnify the other party or parties against various potential costs or liabilities. The Fund’s maximum exposure under these arrangements is unknown. No claim has been made for indemnification pursuant to any such agreement of the Funds.
(k) Fair Value Measurements
Fair value is defined as the price that a Fund would receive upon selling a security in an orderly transaction to an independent buyer in the principal or most advantageous market for the investment. Various inputs are used in determining the value of a Fund’s investments. A three-tier hierarchy of inputs is used to classify fair value measurements for disclosure purposes. The three-tier hierarchy of inputs is summarized in the three broad levels listed below.
| | • | | Level 1—Quoted prices (unadjusted) in active markets for an identical security. |
| | • | | Level 2—Prices determined using other significant observable inputs. Observable inputs are inputs that other market participants would use in pricing a security. These may include quoted prices for similar securities, interest rates, prepayment speeds, credit risk, and others. In addition, other observable inputs such as foreign exchange rates, benchmark securities indices and foreign futures contracts may be utilized in the valuation of certain foreign securities when significant events occur between the last sale on the foreign securities exchange and the time the net asset value of the Fund is calculated. |
| | • | | Level 3—Prices determined using significant unobservable inputs. In situations where quoted prices or observable inputs are unavailable (for example, when there is little or no market activity for an investment), unobservable inputs may be used. Unobservable inputs reflect the Fund’s own assumptions about the factors market participants would use in pricing an investment, and would be based on the best information available. |
The inputs or methodology used for valuing an investment are not necessarily an indication of the risk associated with investing in those securities. For example, money market securities are valued using amortized cost, in accordance with rules under the 1940 Act. Generally, amortized cost approximates the current fair value of a security, but since the value is not obtained from a quoted price in an active market, such securities are reflected as Level 2.
Any transfers between Level 1 and Level 2 are disclosed, effective as of the beginning of the year, in the tables below with the reasons for the transfers disclosed in a note to the tables, if applicable.
As of June 30, 2012, the hierarchical input levels of securities in each Fund, segregated by security class, are as follows (in thousands):
| | | | | | | | | | | | | | | | | | | | |
| | | Institutional
International
Growth | | | Institutional
International
Equity | | | International
Small Cap
Growth | | | Emerging
Markets
Growth | | | Emerging
Leaders
Growth | |
Investments in securities | | | | | | | | | | | | | | | | | | | | |
Level 1—Quoted prices | | | | | | | | | | | | | | | | | | | | |
Common Stocks | | $ | 1,622,734 | | | $ | 109,875 | | | $ | 621,984 | | | $ | 904,808 | | | $ | 43,755 | |
Preferred Stocks | | | — | | | | — | | | | — | | | | 18,748 | | | | 933 | |
Level 2—Other significant observable inputs | | | | | | | | | | | | | | | | | | | | |
Short-Term Investments | | | 55,989 | | | | 5,659 | | | | 26,085 | | | | — | | | | — | |
Level 3—Significant unobservable inputs | | | | | | | | | | | | | | | | | | | | |
Common Stock | | | 299 | | | | — | | | | — | | | | — | | | | — | |
Convertible Bonds | | | 246 | | | | — | | | | 251 | | | | 419 | | | | — | |
| | | | | | | | | | | | | | | | | | | | |
Total investments in securities | | $ | 1,679,268 | | | $ | 115,534 | | | $ | 648,320 | | | $ | 923,975 | | | $ | 44,688 | |
| | | | | | | | | | | | | | | | | | | | |
Other financial instruments—Liabilities | | | | | | | | | | | | | | | | | | | | |
Level 2—Other significant observable inputs | | | | | | | | | | | | | | | | | | | | |
| | | | | | | | | | | | | | | | | | | | |
Forward foreign currency contracts | | $ | 9 | | | $ | (11 | ) | | | — | | | | — | | | | — | |
| | | | | | | | | | | | | | | | | | | | |
June 30, 2012 | William Blair Funds 51 |
| | | | | | | | |
| | | Bond | | | Low
Duration | |
Investments in securities | | | | | | | | |
Level 1—Quoted Prices | | | | | | | | |
None | | | — | | | | — | |
Level 2—Other significant observable inputs | | | | | | | | |
U.S. Government and Agency Bonds | | | 113,334 | | | | 124,158 | |
Corporate Bonds | | | 142,281 | | | | 20,067 | |
Asset Backed Bonds | | | 8,502 | | | | 35,705 | |
Short-Term Investments | | | 3,157 | | | | 5,406 | |
Level 3—Significant unobservable inputs | | | | | | | | |
Asset Backed Bonds | | | 167 | | | | — | |
| | | | | | | | |
Total investments in securities | | $ | 267,441 | | | $ | 185,336 | |
| | | | | | | | |
There were no transfers between Level 1 and Level 2 during the year.
Level 1 Common Stocks are exchange-traded securities with a quoted price. See Portfolio of Investments for Sector Classification.
The fair value estimates for the Level 3 securities in the Institutional International Growth, International Small Cap Growth, Emerging Markets Growth and Bond Funds were determined in good faith by the Pricing Committee in consultation with the Valuation Committee, pursuant to the Valuation Procedures adopted by the Board of Trustees. There were various factors considered in reaching this fair value determination, including, but not limited to, the following: the type of security, the extent of public trading of the security, information obtained from a broker-dealer for the security, analysis of the company’s performance, market trends that influence its performance and the potential for an adverse outcome in pending litigation. Level 3 securities represented 0.04%, 0.04%, 0.04%, 0.60% and 0.70% as a percentage of Net Assets in the Growth, International Small Cap Growth, Emerging Markets Growth, Bond and Income Funds, respectively. The change in net unrealized gain (loss) related to those securities held at June 30, 2012 is included in the change in net unrealized appreciation (depreciation) of investments on the Statement of Operations. There were no transfers from or to Level 3 during the period.
(2) Transactions with Affiliates
(a) Management and Expense Limitation Agreements
Each Fund has a management agreement with the Advisor for investment advisory, clerical, bookkeeping and administrative services. Each Fund pays the Advisor an annual fee, payable monthly, based on a specified percentage of its average daily net assets. A summary of the annual rates expressed as a percentage of average daily net assets is as follows:
| | | | | | | | | | |
International Funds: | | | | | Fixed-Income Funds | | | |
Institutional International Growth: | | | | | | Bond | | | 0.30% | |
First $500 million | | | 1.00% | | | Low Duration | | | 0.30% | |
Next $500 million | | | 0.95% | | | | | | | |
Next $1.5 billion | | | 0.90% | | | | | | | |
Next $2.5 billion | | | 0.875% | | | | | | | |
Next $5 billion | | | 0.85% | | | | | | | |
Next $5 billion | | | 0.825% | | | | | | | |
In excess of $15 billion | | | 0.80% | | | | | | | |
Institutional International Equity: | | | | | | | | | | |
First $500 million | | | 1.000% | | | | | | | |
Next $500 million | | | 0.950% | | | | | | | |
In excess of $1 billion | | | 0.900% | | | | | | | |
International Small Cap Growth | | | 1.00% | | | | | | | |
Emerging Markets Growth | | | 1.10% | | | | | | | |
Emerging Leaders Growth | | | 1.10% | | | | | | | |
All of the Funds, except Institutional International Growth, have also entered into Expense Limitation Agreements with the Advisor. Under the terms of these agreements, the Advisor will waive its management fee and/or reimburse the Fund for expenses in excess of the agreed upon rate. The amount the Advisor owes a Fund as of the report date is recorded as the
52 Semi-Annual Report | June 30, 2012 |
Receivable from Advisor on the Statement of Assets and Liabilities. The Advisor reimburses the Funds on an monthly basis. Under the terms of these agreements, the Advisor has agreed to waive its advisory fees and/or absorb other operating expenses through April 30, 2013, if total expenses of the Funds exceed the following rates (as a percentage of average daily net assets):
| | | | | | | | |
Fund | | Effective
May 1, 2012
through
April 30, 2013 | | | Effective
May 1, 2011
through
April 30, 2012 | |
Institutional International Equity | | | 1.10 | % | | | 1.10 | % |
International Small Cap Growth | | | 1.25 | % | | | 1.25 | % |
Emerging Markets Growth | | | 1.30 | % | | | 1.30 | % |
Emerging Leaders Growth | | | 1.25 | % | | | 1.25 | % |
Bond | | | 0.35 | % | | | 0.35 | % |
Low Duration | | | 0.40 | % | | | 0.40 | % |
For a period of three years subsequent to the Commencement of Operations of the Fund, the Advisor is entitled to reimbursement from the Emerging Leaders Growth and Low Duration Funds for previously waived fees and expenses to the extent the overall expense ratio remains below the percentages indicated. The total amount available for recapture at June 30, 2012 is $163 (in thousands) for the Low Duration Fund. As a result, the total expense ratio for a Fund during the period the agreement is in effect will not fall below the percentage indicated.
For the period ended June 30, 2012, the fees waivers and/or reimbursements for each Fund were as follows (in thousands):
| | | | | | | | | | | | |
Fund | | Fund
Level
Waiver | | | Class
Specific
Waiver* | | | Total
Waiver | |
Institutional International Equity | | $ | 37 | | | $ | — | | | $ | 37 | |
Emerging Leaders Growth | | | 105 | | | | 1 | | | | 106 | |
Bond | | | 35 | | | | 29 | | | | 64 | |
Low Duration | | | 9 | | | | 1 | | | | 10 | |
| * | | Class specific waivers include waivers on Class N and Class I, which are included in a separate report. |
(3) Investment Transactions
Investment transactions, excluding money market instruments, repurchase agreements and demand notes for the period ended June 30, 2012 were as follows (in thousands):
| | | | | | | | |
Fund | | Purchases | | | Sales | |
Institutional International Growth | | | 727,714 | | | | (711,614 | ) |
Institutional International Equity | | | 55,249 | | | | (59,377 | ) |
International Small Cap Growth | | | 247,693 | | | | (373,436 | ) |
Emerging Markets Growth | | | 550,693 | | | | (481,027 | ) |
Emerging Leaders Growth | | | 27,931 | | | | (34,782 | ) |
Bond | | | 76,529 | | | | (41,620 | ) |
Low Duration | | | 65,849 | | | | (38,607 | ) |
(4) Forward Foreign Currency Contracts
The Funds (excluding the Bond and Low Duration Funds) from time to time may enter into forward foreign currency contracts with the Fund’s custodian and other counterparties in an attempt to hedge against a decline in the value of foreign currency against the U.S. dollar. The Funds bear the market risk that arises from changes in foreign currency rates and bear the credit risk if the counterparty fails to perform under the contract.
June 30, 2012 | William Blair Funds 53 |
For the period ended June 30, 2012, the Institutional International Growth, Institutional International Equity, and International Small Cap Growth Funds engaged in forward foreign currency contracts with average notional volume (in thousands) of:
| | | | |
Fund | | Average
Notional
Value | |
Institutional International Growth | | $ | 162,356 | |
Institutional International Equity | | | 2,299 | |
International Small Cap Growth | | | 3,775 | |
The following tables present the value of forward foreign currency contracts as of June 30, 2012 and their respective location on the Statement of Assets and Liabilities (values in thousands):
| | | | | | | | | | | | |
| | | Assets | | | Liabilities | |
Fund | | Statement of Assets and
Liabilities Location | | Value | | | Statement of Assets and
Liabilities Location | | Value | |
Institutional International Growth | | Unrealized appreciation on foreign
forward currency contracts | | $ | 9 | | | Unrealized depreciation on foreign
forward currency contracts | | | — | |
Institutional International equity | | Unrealized appreciation on foreign
forward currency contracts | | | — | | | Unrealized depreciation on foreign
forward currency contracts | | $ | 11 | |
The effect of forward contracts on the Statements of Operations for the period ended June 30, 2012 (values in thousands):
| | | | |
Realized gain (loss) recognized in foreign currency transactions | |
Fund | | Value | |
Institutional International Growth | | $ | 4,859 | |
Institutional International Equity | | | 82 | |
International Small Cap Growth | | | 1,901 | |
|
Change in unrealized gain (loss) recognized in foreign currency translations | |
Fund | | Value | |
Institutional International Growth | | | $856 | |
Institutional International Equity | | | (11 | ) |
International Small Cap Growth | | | 311 | |
The following table presents open forward foreign currency contracts as of June 30, 2012 (values in thousands):
| | | | | | | | | | | | | | | | | | |
Institutional International Growth | |
Counterparty | | Short Contracts | | Settlement
Date | | | Local
Currency | | | Current
Value | | | Unrealized Gain/Loss | |
State Street Bank and Trust | | Japanese Yen | | | 9/20/2012 | | | ¥ | 1,408,553 | | | $ | 17,640 | | | | $9 | |
|
Institutional International Equity | |
Counterparty | | Short Contracts | | Settlement
Date | | | Local
Currency | | | Current
Value | | | Unrealized Gain/Loss | |
Morgan Stanley and Company | | Euro Currency | | | 9/18/2012 | | | | €3,893 | | | | $4,862 | | | | (11 | ) |
54 Semi-Annual Report | June 30, 2012 |
(5) Fund Share Transactions
The following table summarizes the activity in capital shares for Institutional Classes of each Fund (in thousands):
| | | | | | | | | | | | | | | | |
| | | Dollars | |
| | | For the period ended June 30, 2012 | |
Fund | | Sales | | | Reinvested
Distributions | | | Redemptions | | | Net change in Net
Assets relating to
fund share activity | |
Institutional International Growth | | $ | 125,367 | | | $ | — | | | $ | 96,161 | | | $ | 29,206 | |
Institutional International Equity | | | 4,556 | | | | — | | | | 6,731 | | | | (2,175 | ) |
International Small Cap Growth | | | 28,086 | | | | — | | | | 90,495 | | | | (62,409 | ) |
Emerging Markets Growth | | | 186,592 | | | | — | | | | 106,948 | | | | 79,644 | |
Emerging Leaders Growth | | | 5,937 | | | | — | | | | 13,123 | | | | (7,186 | ) |
Bond | | | 14,964 | | | | 1,297 | | | | 3,177 | | | | 13,084 | |
Low Duration . | | | 14,527 | | | | 1,075 | | | | 7,592 | | | | 8,010 | |
| |
| | | Dollars | |
| | | For the year ended December 31, 2011 | |
Fund | | Sales | | | Reinvested
Distributions | | | Redemptions | | | Net change in Net
Assets relating to
fund share activity | |
Institutional International Growth | | $ | 357,122 | | | $ | 1,885 | | | $ | 464,979 | | | $ | (105,972 | ) |
Institutional International Equity | | | 12,843 | | | | 2,328 | | | | 164,692 | | | | (149,521 | ) |
International Small Cap Growth | | | 144,872 | | | | 5,156 | | | | 51,270 | | | | 98,758 | |
Emerging Markets Growth | | | 325,811 | | | | 84,535 | | | | 525,445 | | | | (115,099 | ) |
Emerging Leaders Growth | | | — | | | | 2,152 | | | | 38,310 | | | | (36,158 | ) |
Bond | | | 54,824 | | | | 2,564 | | | | 29,654 | | | | 27,734 | |
Low Duration. | | | 61,464 | | | | 1,816 | | | | 42,760 | | | | 20,520 | |
| |
| | | Shares | |
| | | For the period ended June 30, 2012 | |
Fund | | Sales | | | Reinvested
Distributions | | | Redemptions | | | Net change in Net
Assets relating to
fund share activity | |
Institutional International Growth | | | 9,269 | | | | — | | | | 7,175 | | | | 2,094 | |
Institutional International Equity | | | 470 | | | | — | | | | 667 | | | | (197 | ) |
International Small Cap Growth | | | 2,332 | | | | — | | | | 7,081 | | | | (4,749 | ) |
Emerging Markets Growth | | | 14,838 | | | | — | | | | 8,558 | | | | 6,280 | |
Emerging Leaders Growth | | | 729 | | | | — | | | | 1,581 | | | | (852 | ) |
Bond | | | 1,369 | | | | 119 | | | | 292 | | | | 1,196 | |
Low Duration. | | | 1,473 | | | | 109 | | | | 771 | | | | 811 | |
| |
| | | Shares | |
| | | For the year ended December 31, 2011 | |
Fund | | Sales | | | Reinvested
Distributions | | | Redemptions | | | Net change in Net
Assets relating to
fund share activity | |
Institutional International Growth | | | 26,212 | | | | 156 | | | | 33,111 | | | | (6,743 | ) |
Institutional International Equity | | | 1,239 | | | | 259 | | | | 16,514 | | | | (15,016 | ) |
International Small Cap Growth | | | 11,931 | | | | 463 | | | | 4,109 | | | | 8,285 | |
Emerging Markets Growth | | | 22,569 | | | | 7,644 | | | | 34,501 | | | | (4,288 | ) |
Emerging Leaders Growth | | | — | | | | 288 | | | | 4,453 | | | | (4,165 | ) |
Bond | | | 5,142 | | | | 239 | | | | 2,774 | | | | 2,607 | |
Low Duration. | | | 6,225 | | | | 184 | | | | 4,328 | | | | 2,081 | |
June 30, 2012 | William Blair Funds 55 |
Financial Highlights
Institutional International Growth Fund
| | | | | | | | | | | | | | | | | | | | | | | | | | |
| | | Period Ended
June 30, | | | | | Years Ended December 31, | |
| | | 2012 | | | | | 2011 | | | 2010 | | | 2009 | | | 2008 | | | 2007 | |
Net asset value, beginning of year | | $ | 12.39 | | | | | $ | 14.37 | | | $ | 12.20 | | | $ | 8.66 | | | $ | 19.20 | | | $ | 19.39 | |
Income (loss) from investment operations: | | | | | | | | | | | | | | | | | | | | | | | | | | |
Net investment income (loss) (a) | | | 0.16 | | | | | | 0.21 | | | | 0.14 | | | | 0.10 | | | | 0.25 | | | | 0.15 | |
Net realized and unrealized gain (loss) on investments | | | 0.83 | | | | | | (2.17 | ) | | | 2.31 | | | | 3.61 | | | | (10.24 | ) | | | 3.30 | |
| | | | | | | | | | | | | | | | | | | | | | | | | | |
Total from investment operations | | | 0.99 | | | | | | (1.96 | ) | | | 2.45 | | | | 3.71 | | | | (9.99 | ) | | | 3.45 | |
Less distributions from: | | | | | | | | | | | | | | | | | | | | | | | | | | |
Net investment income | | | — | | | | | | 0.02 | | | | 0.28 | | | | 0.17 | | | | — | | | | 0.35 | |
Net realized gain | | | — | | | | | | — | | | | — | | | | — | | | | 0.55 | | | | 3.29 | |
| | | | | | | | | | | | | | | | | | | | | | | | | | |
Total distributions | | | — | | | | | | 0.02 | | | | 0.28 | | | | 0.17 | | | | 0.55 | | | | 3.64 | |
| | | | | | | | | | | | | | | | | | | | | | | | | | |
Net asset value, end of year | | $ | 13.38 | | | | | $ | 12.39 | | | $ | 14.37 | | | $ | 12.20 | | | $ | 8.66 | | | $ | 19.20 | |
| | | | | | | | | | | | | | | | | | | | | | | | | | |
Total Return (%)* | | | 7.99 | | | | | | (13.66 | ) | | | 20.10 | | | | 42.83 | | | | (51.99 | ) | | | 18.49 | |
Ratios to average daily net assets (%): | | | | | | | | | | | | | | | | | | | | | | | | | | |
Expenses, before waivers and reimbursements | | | 0.98 | | | | | | 0.99 | | | | 0.99 | | | | 1.01 | | | | 0.98 | | | | 1.02 | |
Net investment income (loss), before waivers and reimbursements | | | 2.40 | | | | | | 1.51 | | | | 1.12 | | | | 0.95 | | | | 1.68 | | | | 0.74 | |
| | | | | | | |
Net assets at end of year (in thousands) | | $ | 1,693,024 | | | | | $ | 1,542,594 | | | $ | 1,886,217 | | | $ | 1,375,848 | | | $ | 998,266 | | | $ | 2,145,312 | |
Portfolio turnover rate (%) | | | 43 | | | | | | 111 | | | | 99 | | | | 125 | | | | 86 | | | | 61 | |
| (a) | | Excludes $0.00, $0.09, $0.05, $(0.10), and $0.06 of PFIC mark to market which is treated as ordinary income for Federal tax purposes for the years 2011, 2010, 2009, 2008, and 2007 respectively. |
| * | | Rates not annualized for periods that are less than a year. |
| ** | | Rates are annualized for periods that are less than a year. |
| ^ | | Amount is less than $0.005 per share. |
Redemption fees represent less than $0.005 per share for all periods.
Performance cited represents past performance. Past performance does not guarantee future results and current performance may be lower or higher than the data quoted. Results shown are annual returns, which assume reinvestment of dividends and capital gains. Investment returns and principal will fluctuate and you may have a gain or loss when you sell shares. For the most current month-end performance information, please call 1-800-742-7272 or visit our Web site at www.williamblairfunds.com.
Note: Net investment income (loss) per share is based on the average shares outstanding during the year.
56 Semi-Annual Report | June 30, 2012 |
Financial Highlights
Institutional International Equity Fund
| | | | | | | | | | | | | | | | | | | | | | | | | | |
| | | Period Ended
June 30, | | | | | Years Ended December 31, | |
| | | 2012 | | | | | 2011 | | | 2010 | | | 2009 | | | 2008 | | | 2007 | |
| | | | | | | | | | | | | | | | | | | | | | | | | | |
Net asset value, beginning of year | | $ | 9.27 | | | | | $ | 10.78 | | | $ | 9.84 | | | $ | 7.44 | | | $ | 15.03 | | | $ | 14.27 | |
Income (loss) from investment operations: | | | | | | | | | | | | | | | | | | | | | | | | | | |
Net investment income (loss)(a) | | | 0.09 | | | | | | 0.16 | | | | 0.10 | | | | 0.09 | | | | 0.15 | | | | 0.13 | |
Net realized and unrealized gain (loss) on investments | | | 0.37 | | | | | | (1.47 | ) | | | 0.99 | | | | 2.38 | | | | (7.60 | ) | | | 2.42 | |
| | | | | | | | | | | | | | | | | | | | | | | | | | |
Total from investment operations | | | 0.46 | | | | | | (1.31 | ) | | | 1.09 | | | | 2.47 | | | | (7.45 | ) | | | 2.55 | |
Less distributions from: | | | | | | | | | | | | | | | | | | | | | | | | | | |
Net investment income | | | — | | | | | | 0.20 | | | | 0.15 | | | | 0.07 | | | | — | | | | 0.22 | |
Net realized gain | | | — | | | | | | — | | | | — | | | | — | | | | 0.14 | | | | 1.57 | |
| | | | | | | | | | | | | | | | | | | | | | | | | | |
Total distributions | | | — | | | | | | 0.20 | | | | 0.15 | | | | 0.07 | | | | 0.14 | | | | 1.79 | |
| | | | | | | | | | | | | | | | | | | | | | | | | | |
Net asset value, end of year | | $ | 9.73 | | | | | $ | 9.27 | | | $ | 10.78 | | | $ | 9.84 | | | $ | 7.44 | | | $ | 15.03 | |
| | | | | | | | | | | | | | | | | | | | | | | | | | |
Total Return (%)* | | | 4.96 | | | | | | (12.12 | ) | | | 11.12 | | | | 33.27 | | | | (49.57 | ) | | | 18.36 | |
Ratios to average daily net assets (%):** | | | | | | | | | | | | | | | | | | | | | | | | | | |
Expenses, net of waivers and reimbursements | | | 1.10 | | | | | | 1.10 | | | | 1.07 | | | | 1.09 | | | | 1.05 | | | | 1.09 | |
Expenses, before waivers and reimbursements | | | 1.16 | | | | | | 1.10 | | | | 1.07 | | | | 1.09 | | | | 1.05 | | | | 1.06 | |
Net investment income (loss), net of waivers and reimbursements | | | 1.77 | | | | | | 1.48 | | | | 0.97 | | | | 1.04 | | | | 1.26 | | | | 0.86 | |
Net investment income (loss), before waivers and reimbursements | | | 1.71 | | | | | | 1.48 | | | | 0.97 | | | | 1.04 | | | | 1.26 | | | | 0.89 | |
| | | | | | | |
Net assets at end of year (in thousands) | | $ | 115,133 | | | | | $ | 111,474 | | | $ | 291,468 | | | $ | 365,271 | | | $ | 360,451 | | | $ | 618,179 | |
Portfolio turnover rate (%) | | | 48 | | | | | | 91 | | | | 73 | | | | 78 | | | | 91 | | | | 66 | |
| (a) | | Excludes $0.00, $0.04, $0.00, $0.00, and $(0.07) of PFIC mark to market which is treated as ordinary income for Federal tax purposes for the years 2011, 2010, 2009, 2008, and 2007 respectively. |
| * | | Rates not annualized for periods that are less than a year. |
| ** | | Rates are annualized for periods that are less than a year. |
| ^ | | Amount is less than $0.005 per share. |
Redemption fees represent less than $0.005 per share for all periods.
Performance cited represents past performance. Past performance does not guarantee future results and current performance may be lower or higher than the data quoted. Results shown are annual returns, which assume reinvestment of dividends and capital gains. Investment returns and principal will fluctuate and you may have a gain or loss when you sell shares. For the most current month-end performance information, please call 1-800-742-7272 or visit our Web site at www.williamblairfunds.com.
Note: Net investment income (loss) per share is based on the average shares outstanding during the year.
June 30, 2012 | William Blair Funds 57 |
Financial Highlights
International Small Cap Growth Fund
| | | | | | | | | | | | | | | | | | | | | | | | | | |
| | | | | | | | Institutional Class Shares | |
| | | Period Ended
June 30, | | | | | Years Ended December 31, | |
| | | 2012 | | | | | 2011 | | | 2010 | | | 2009 | | | 2008 | | | 2007 | |
Net asset value, beginning of year | | $ | 11.51 | | | | | $ | 13.24 | | | $ | 10.53 | | | $ | 6.69 | | | $ | 14.04 | | | $ | 13.43 | |
Income (loss) from investment operations: | | | | | | | | | | | | | | | | | | | | | | | | | | |
Net investment income (loss) (a) | | | 0.09 | | | | | | 0.14 | | | | 0.09 | | | | 0.04 | | | | 0.03 | | | | 0.05 | |
Net realized and unrealized gain (loss) on investments | | | 0.65 | | | | | | (1.68 | ) | | | 2.69 | | | | 3.83 | | | | (7.26 | ) | | | 1.72 | |
| | | | | | | | | | | | | | | | | | | | | | | | | | |
Total from investment operations | | | 0.74 | | | | | | (1.54 | ) | | | 2.78 | | | | 3.87 | | | | (7.23 | ) | | | 1.77 | |
Less distributions from: | | | | | | | | | | | | | | | | | | | | | | | | | | |
Net investment income | | | — | | | | | | 0.19 | | | | 0.07 | | | | 0.03 | | | | — | | | | 0.12 | |
Net realized gain | | | — | | | | | | — | | | | — | | | | — | | | | 0.12 | | | | 1.04 | |
| | | | | | | | | | | | | | | | | | | | | | | | | | |
Total distributions | | | — | | | | | | 0.19 | | | | 0.07 | | | | 0.03 | | | | 0.12 | | | | 1.16 | |
| | | | | | | | | | | | | | | | | | | | | | | | | | |
Net asset value, end of year | | $ | 12.25 | | | | | $ | 11.51 | | | $ | 13.24 | | | $ | 10.53 | | | $ | 6.69 | | | $ | 14.04 | |
| | | | | | | | | | | | | | | | | | | | | | | | | | |
Total Return (%)* | | | 6.43 | | | | | | (11.60 | ) | | | 26.40 | | | | 57.84 | | | | (51.53 | ) | | | 13.53 | |
Ratios to average daily net assets (%):** | | | | | | | | | | | | | | | | | | | | | | | | | | |
Expenses, net of waivers and reimbursements | | | 1.07 | | | | | | 1.08 | | | | 1.08 | | | | 1.13 | | | | 1.14 | | | | 1.14 | |
Expenses, before waivers and reimbursements | | | 1.07 | | | | | | 1.08 | | | | 1.08 | | | | 1.13 | | | | 1.11 | | | | 1.14 | |
Net investment income (loss), net of waivers and reimbursements | | | 1.45 | | | | | | 1.10 | | | | 0.77 | | | | 0.48 | | | | 0.28 | | | | 0.32 | |
Net investment income (loss), before waivers and reimbursements | | | 1.45 | | | | | | 1.10 | | | | 0.77 | | | | 0.48 | | | | 0.31 | | | | 0.32 | |
| | | | | | | |
Net assets at end of year (in thousands) | | $ | 297,994 | | | | | $ | 334,656 | | | $ | 275,356 | | | $ | 165,436 | | | $ | 191,173 | | | $ | 230,715 | |
Portfolio turnover rate (%) | | | 36 | | | | | | 85 | | | | 85 | | | | 136 | | | | 78 | | | | 88 | |
| (a) | | Excludes $0.00, $0.15, $0.01, $(0.02), and $0.05 of PFIC mark to market which is treated as ordinary income for Federal tax purposes for the years 2011, 2010, 2009, 2008, and 2007 respectively. |
| * | | Rates not annualized for periods that are less than a year. |
| ** | | Rates are annualized for periods that are less than a year. |
Redemption fees represent less than $0.005 per share for all periods.
Performance cited represents past performance. Past performance does not guarantee future results and current performance may be lower or higher than the data quoted. Results shown are annual returns, which assume reinvestment of dividends and capital gains. Investment returns and principal will fluctuate and you may have a gain or loss when you sell shares. For the most current month-end performance information, please call 1-800-742-7272 or visit our Web site at www.williamblairfunds.com.
Note: Net investment income (loss) per share is based on the average shares outstanding during the year.
58 Semi-Annual Report | June 30, 2012 |
Financial Highlights
Emerging Markets Growth Fund
| | | | | | | | | | | | | | | | | | | | | | | | | | |
| | | Period Ended
June 30, | | | | | Years Ended December 31, | |
| | | 2012 | | | | | 2011 | | | 2010 | | | 2009 | | | 2008 | | | 2007 | |
Net asset value, beginning of year | | $ | 11.32 | | | | | $ | 15.96 | | | $ | 13.03 | | | $ | 7.56 | | | $ | 22.07 | | | $ | 19.54 | |
Income (loss) from investment operations: | | | | | | | | | | | | | | | | | | | | | | | | | | |
Net investment income (loss)(a) | | | 0.10 | | | | | | 0.14 | | | | 0.06 | | | | 0.06 | | | | 0.17 | | | | (0.01 | ) |
Net realized and unrealized gain (loss) on investments | | | 0.73 | | | | | | (2.87 | ) | | | 3.05 | | | | 5.55 | | | | (13.74 | ) | | | 7.27 | |
| | | | | | | | | | | | | | | | | | | | | | | | | | |
Total from investment operations | | | 0.83 | | | | | | (2.73 | ) | | | 3.11 | | | | 5.61 | | | | (13.57 | ) | | | 7.26 | |
Less distributions from: | | | | | | | | | | | | | | | | | | | | | | | | | | |
Net investment income | | | — | | | | | | 0.08 | | | | 0.18 | | | | 0.14 | | | | — | | | | 0.19 | |
Net realized gain | | | — | | | | | | 1.83 | | | | — | | | | — | | | | 0.94 | | | | 4.54 | |
| | | | | | | | | | | | | | | | | | | | | | | | | | |
Total distributions | | | — | | | | | | 1.91 | | | | 0.18 | | | | 0.14 | | | | 0.94 | | | | 4.73 | |
| | | | | | | | | | | | | | | | | | | | | | | | | | |
Net asset value, end of year | | $ | 12.15 | | | | | $ | 11.32 | | | $ | 15.96 | | | $ | 13.03 | | | $ | 7.56 | | | $ | 22.07 | |
| | | | | | | | | | | | | | | | | | | | | | | | | | |
Total Return (%)* | | | 7.33 | | | | | | (16.82 | ) | | | 23.91 | | | | 74.33 | | | | (61.51 | ) | | | 38.21 | |
Ratios to average daily net assets (%):** | | | | | | | | | | | | | | | | | | | | | | | | | | |
Expenses, net of waivers and reimbursements | | | 1.19 | | | | | | 1.19 | | | | 1.17 | | | | 1.22 | | | | 1.22 | | | | 1.25 | |
Expenses, before waivers and reimbursements | | | 1.19 | | | | | | 1.19 | | | | 1.17 | | | | 1.22 | | | | 1.20 | | | | 1.25 | |
Net investment income (loss), net of waivers and reimbursements | | | 1.55 | | | | | | 0.93 | | | | 0.43 | | | | 0.54 | | | | 1.08 | | | | (0.05 | ) |
Net investment income (loss), before waivers and reimbursements | | | 1.55 | | | | | | 0.93 | | | | 0.43 | | | | 0.54 | | | | 1.10 | | | | (0.05 | ) |
| | | | | | | |
Net assets at end of year (in thousands) | | $ | 801,502 | | | | | $ | 675,633 | | | $ | 1,021,456 | | | $ | 830,660 | | | $ | 299,739 | | | $ | 809,071 | |
Portfolio turnover rate (%)* | | | 50 | | | | | | 104 | | | | 121 | | | | 113 | | | | 118 | | | | 100 | |
| (a) | | Excludes $0.00, $0.11, $0.15, $(0.09), and $0.21 of PFIC mark to market which is treated as ordinary income for Federal tax purposes for the years 2011, 2010, 2009, 2008, and 2007 respectively. |
| * | | Rates not annualized for periods that are less than a year. |
| ** | | Rates are annualized for periods that are less than a year. |
Redemption fees represent less than $0.005 per share for all periods.
Performance cited represents past performance. Past performance does not guarantee future results and current performance may be lower or higher than the data quoted. Results shown are annual returns, which assume reinvestment of dividends and capital gains. Investment returns and principal will fluctuate and you may have a gain or loss when you sell shares. For the most current month-end performance information, please call 1-800-742-7272 or visit our Web site at www.williamblairfunds.com.
Note: Net investment income (loss) per share is based on the average shares outstanding during the year.
June 30, 2012 | William Blair Funds 59 |
Financial Highlights
Emerging Leaders Growth Fund
| | | | | | | | | | | | | | | | | | | | | | |
| | | Period Ended
June 30, | | | | | Periods Ended December 31, | |
| | | 2012 | | | | | 2011 | | | 2010 | | | 2009 | | | 2008(a) | |
Net asset value, beginning of year | | $ | 7.65 | | | | | $ | 10.35 | | | $ | 8.43 | | | $ | 4.78 | | | $ | 10.00 | |
Income (loss) from investment operations: | | | | | | | | | | | | | | | | | | | | | | |
Net investment income (loss) (b) | | | 0.06 | | | | | | 0.09 | | | | 0.04 | | | | 0.04 | | | | 0.04 | |
Net realized and unrealized gain (loss) on investments | | | 0.48 | | | | | | (2.10 | ) | | | 1.97 | | | | 3.73 | | | | (5.26 | ) |
| | | | | | | | | | | | | | | | | | | | | | |
Total from investment operations | | | 0.54 | | | | | | (2.01 | ) | | | 2.01 | | | | 3.77 | | | | (5.22 | ) |
Less distributions from: | | | | | | | | | | | | | | | | | | | | | | |
Net investment income | | | — | | | | | | 0.06 | | | | 0.03 | | | | 0.12 | | | | 0.00 | ^ |
Net realized gain | | | — | | | | | | 0.63 | | | | 0.06 | | | | — | | | | — | |
Return of capital | | | — | | | | | | 0.00 | ^ | | | — | | | | — | | | | — | |
| | | | | | | | | | | | | | | | | | | | | | |
Total distributions | | | — | | | | | | 0.69 | | | | 0.09 | | | | 0.12 | | | | 0.00 | ^ |
| | | | | | | | | | | | | | | | | | | | | | |
Net asset value, end of year | | $ | 8.19 | | | | | $ | 7.65 | | | $ | 10.35 | | | $ | 8.43 | | | $ | 4.78 | |
| | | | | | | | | | | | | | | | | | | | | | |
Total Return (%)* | | | 7.06 | | | | | | (19.30 | ) | | | 23.84 | | | | 78.93 | | | | (52.11 | ) |
Ratios to average daily net assets (%):** | | | | | | | | | | | | | | | | | | | | | | |
Expenses, net of waivers and reimbursements | | | 1.25 | | | | | | 1.25 | | | | 1.26 | | | | 1.25 | | | | 1.25 | |
Expenses, before waivers and reimbursements | | | 1.62 | | | | | | 1.41 | | | | 1.35 | | | | 1.36 | | | | 1.41 | |
Net investment income (loss), net of waivers and reimbursements | | | 1.46 | | | | | | 0.90 | | | | 0.50 | | | | 0.58 | | | | 0.70 | |
Net investment income (loss), before waivers and reimbursements | | | 1.09 | | | | | | 0.74 | | | | 0.41 | | | | 0.47 | | | | 0.54 | |
| | | | | | |
Net assets at end of year (in thousands) | | $ | 21,043 | | | | | $ | 26,166 | | | $ | 78,516 | | | $ | 106,313 | | | $ | 43,762 | |
Portfolio turnover rate (%) | | | 52 | | | | | | 142 | | | | 176 | | | | 176 | | | | 151 | |
| (a) | | For the period March 26, 2008 (Commencement of Operations) to December 31, 2008. |
| (b) | | Excludes $0.00, $0.96, $1.29, and $0.00 of PFIC mark to market which is treated as ordinary income for Federal tax purposes for the years 2011, 2010, 2009, and 2008 respectively. |
| * | | Rates not annualized for periods that are less than a year. |
| ** | | Rates are annualized for periods that are less than a year. |
| ^ | | Amount is less than $0.005 per share. |
Redemption fees represent less than $0.005 per share for all periods.
Performance cited represents past performance. Past performance does not guarantee future results and current performance may be lower or higher than the data quoted. Results shown are annual returns, which assume reinvestment of dividends and capital gains. Investment returns and principal will fluctuate and you may have a gain or loss when you sell shares. For the most current month-end performance information, please call 1-800-742-7272 or visit our Web site at www.williamblairfunds.com.
Note: Net investment income (loss) per share is based on the average shares outstanding during the year.
60 Semi-Annual Report | June 30, 2012 |
Financial Highlights
Bond Fund
| | | | | | | | | | | | | | | | | | | | | | | | | | |
| | | Institutional Class Shares | |
| | | Period Ended
June 30, | | | | | Periods Ended December 31, | |
| | | 2012 | | | | | 2011 | | | 2010 | | | 2009 | | | 2008 | | | 2007(a) | |
Net asset value, beginning of year | | $ | 10.80 | | | | | $ | 10.58 | | | $ | 10.30 | | | $ | 9.72 | | | $ | 10.00 | | | $ | 10.00 | |
Income (loss) from investment operations: | | | | | | | | | | | | | | | | | | | | | | | | | | |
Net investment income (loss) | | | 0.21 | | | | | | 0.45 | | | | 0.48 | | | | 0.51 | | | | 0.50 | | | | 0.32 | |
Net realized and unrealized gain (loss) on investments | | | 0.22 | | | | | | 0.36 | | | | 0.34 | | | | 0.58 | | | | (0.31 | ) | | | 0.03 | |
| | | | | | | | | | | | | | | | | | | | | | | | | | |
Total from investment operations | | | 0.43 | | | | | | 0.81 | | | | 0.82 | | | | 1.09 | | | | 0.19 | | | | 0.35 | |
Less distributions from: | | | | | | | | | | | | | | | | | | | | | | | | | | |
Net investment income | | | 0.25 | | | | | | 0.50 | | | | 0.51 | | | | 0.51 | | | | 0.47 | | | | 0.35 | |
Net realized gain | | | — | | | | | | 0.09 | | | | 0.03 | | | | — | | | | — | | | | — | |
| | | | | | | | | | | | | | | | | | | | | | | | | | |
Total distributions | | | 0.25 | | | | | | 0.59 | | | | 0.54 | | | | 0.51 | | | | 0.47 | | | | 0.35 | |
| | | | | | | | | | | | | | | | | | | | | | | | | | |
Net asset value, end of year | | $ | 10.98 | | | | | $ | 10.80 | | | $ | 10.58 | | | $ | 10.30 | | | $ | 9.72 | | | $ | 10.00 | |
| | | | | | | | | | | | | | | | | | | | | | | | | | |
Total Return (%)* | | | 4.01 | | | | | | 7.88 | | | | 8.06 | | | | 11.47 | | | | 1.95 | | | | 3.57 | |
Ratios to average daily net assets (%):** | | | | | | | | | | | | | | | | | | | | | | | | | | |
Expenses, net of waivers and reimbursements | | | 0.35 | | | | | | 0.35 | | | | 0.35 | | | | 0.34 | | | | 0.35 | | | | 0.35 | |
Expenses, before waivers and reimbursements | | | 0.38 | | | | | | 0.39 | | | | 0.40 | | | | 0.43 | | | | 0.56 | | | | 0.52 | |
Net investment income (loss), net of waivers and reimbursements | | | 3.93 | | | | | | 4.24 | | | | 4.54 | | | | 5.07 | | | | 5.04 | | | | 5.09 | |
Net investment income (loss), before waivers and reimbursements | | | 3.90 | | | | | | 4.20 | | | | 4.49 | | | | 4.98 | | | | 4.83 | | | | 4.92 | |
| | | | | | | |
Net assets at end of year (in thousands) | | $ | 83,775 | | | | | $ | 69,447 | | | $ | 40,490 | | | $ | 16,226 | | | $ | 10,443 | | | $ | 11,874 | |
Portfolio turnover rate (%)* | | | 12 | | | | | | 28 | | | | 25 | | | | 29 | | | | 52 | | | | 38 | |
| (a) | | For the period May 1, 2007 (Commencement of Operations) to December 31, 2007. |
| * | | Rates not annualized for periods that are less than a year. |
| ** | | Rates are annualized for periods that are less than a year. |
Performance cited represents past performance. Past performance does not guarantee future results and current performance may be lower or higher than the data quoted. Results shown are annual returns, which assume reinvestment of dividends and capital gains. Investment returns and principal will fluctuate and you may have a gain or loss when you sell shares. For the most current month-end performance information, please call 1-800-742-7272 or visit our Web site at www.williamblairfunds.com.
Note: Net investment income (loss) per share is based on the average shares outstanding during the year.
June 30, 2012 | William Blair Funds 61 |
Financial Highlights
Low Duration Bond Fund
| | | | | | | | | | | | | | | | | | |
| | | | | | | | Institutional Class Shares | |
| | | Period Ended
June 30, | | | | | Periods Ended December 31, | |
| | | 2012 | | | | | 2011 | | | 2010 | | | 2009(a) | |
Net asset value, beginning of year | | $ | 9.83 | | | | | $ | 9.90 | | | $ | 9.93 | | | $ | 10.00 | |
Income (loss) from investment operations: | | | | | | | | | | | | | | | | | | |
Net investment income (loss) | | | 0.09 | | | | | | 0.18 | | | | 0.16 | | | | 0.01 | |
Net realized and unrealized gain (loss) on investments | | | 0.07 | | | | | | 0.03 | | | | 0.05 | | | | (0.07 | ) |
| | | | | | | | | | | | | | | | | | |
Total from investment operations | | | 0.16 | | | | | | 0.21 | | | | 0.21 | | | | (0.06 | ) |
Less distributions from: | | | | | | | | | | | | | | | | | | |
Net investment income | | | 0.15 | | | | | | 0.28 | | | | 0.24 | | | | 0.01 | |
Net realized gain | | | — | | | | | | — | | | | — | | | | — | |
| | | | | | | | | | | | | | | | | | |
Total distributions | | | 0.15 | | | | | | 0.28 | | | | 0.24 | | | | 0.01 | |
| | | | | | | | | | | | | | | | | | |
Net asset value, end of year | | $ | 9.84 | | | | | $ | 9.83 | | | $ | 9.90 | | | $ | 9.93 | |
| | | | | | | | | | | | | | | | | | |
Total Return (%)* | | | 1.64 | | | | | | 2.14 | | | | 2.15 | | | | (0.58 | ) |
Ratios to average daily net assets (%):** | | | | | | | | | | | | | | | | | | |
Expenses, net of waivers and reimbursements | | | 0.40 | | | | | | 0.40 | | | | 0.40 | | | | 0.40 | |
Expenses, before waivers and reimbursements | | | 0.41 | | | | | | 0.42 | | | | 0.48 | | | | 0.64 | |
Net investment income (loss), net of waivers and reimbursements | | | 1.89 | | | | | | 1.81 | | | | 1.61 | | | | 1.54 | |
Net investment income (loss), before waivers and reimbursements | | | 1.88 | | | | | | 1.79 | | | | 1.53 | | | | 1.30 | |
| | | | | |
Net assets at end of year (in thousands) | | $ | 76,151 | | | | | $ | 68,059 | | | $ | 47,965 | | | $ | 13,500 | |
Portfolio turnover rate (%)* | | | 12 | | | | | | 43 | | | | 51 | | | | — | |
| (a) | | For the period December 1, 2009 (Commencement of Operations) to December 31, 2009. |
| * | | Rates not annualized for periods that are less than a year. |
| ** | | Rates are annualized for periods that are less than a year. |
| ^ | | Amount is less than $0.005 per share. |
Performance cited represents past performance. Past performance does not guarantee future results and current performance may be lower or higher than the data quoted. Results shown are annual returns, which assume reinvestment of dividends and capital gains. Investment returns and principal will fluctuate and you may have a gain or loss when you sell shares. For the most current month-end performance information, please call 1-800-742-7272 or visit our Web site at www.williamblairfunds.com.
Note: Net investment income (loss) per share is based on the average shares outstanding during the year.
62 Semi-Annual Report | June 30, 2012 |
Trustees and Officers (Unaudited). The trustees and officers of the William Blair Funds, their year of birth, their principal occupations during the last five years, their affiliations, if any, with William Blair & Company, L.L.C., and other significant affiliations are set forth below. The address of each trustee and officer is 222 West Adams Street, Chicago, Illinois 60606.
| | | | | | | | | | |
Name and Year of Birth | | Position(s)
Held with
Fund | | Term of
Office and
Length of
Time
Served(1) | | Principal Occupation(s) During Past 5 Years(2) | | Number of
Portfolios
in Fund
Complex
Overseen
by Trustee | | Other Directorships Held by Trustee/Officer |
Interested Trustees | | | | | | | | | | |
Michelle R. Seitz,
1965* | | Chairperson of the Board of Trustees and President | | Trustee since 2002; Chairperson since 2010 Since 2007 | | Partner, William Blair & Company, L.L.C.; Limited Partner, WB Holdings, L.P. (since November 2008); Member, WBC GP, L.L.P. (since November 2008) | | 25 | | Director, William Blair SICAV; Financial Accounting Foundation (FAF) |
| | | | | |
Richard W. Smirl,
1967* | | Trustee and Senior Vice President | | Trustee since 2010 and Senior Vice President Since 2007 | | Partner, William Blair & Company, L.L.C. | | 25 | | Director, William Blair SICAV |
| | | | |
Non-Interested Trustees | | | | | | | | |
Phillip O. Peterson,
1944 | | Trustee | | Since 2007 | | Retired; formerly, President, Strong Mutual Funds, 2004-2005; formerly, Partner, KPMG LLP | | 25 | | The Hartford Group of Mutual Funds (87 portfolios); Symetra Mutual Funds Trust (variable annuity funds) (14 portfolios) |
| | | | | |
Lisa A. Pollina,
1965 | | Trustee | | Since 2011 | | Senior Advisor to head of RBC Financial Group’s International Banking and Insurance division since 2010; formerly, Bank of America Corporation, Global Financial Institutions Executive from 2006-2008 and multiple Advisory from 2008-2010; prior thereto roles, Managing Partner, Bordeaux Capital from 2002-2006. | | 25 | | Darkstrand, high-speed fiber optic network provider (2009 to 2010); Jane Addams Hull House Association, Board of Trustees (2003 to 2009) |
| | | | | |
Donald J. Reaves,
1946 | | Trustee | | Since 2004 | | Chancellor, Winston-Salem State University since 2007; formerly, Vice President for Administration and Chief Financial Officer, University of Chicago 2002-2007. | | 25 | | American Student Assistance Corp., guarantor of student loans; Amica Mutual Insurance Company |
| | | | | |
Donald L. Seeley,
1944 | | Trustee | | Since 2003 | | Retired; formerly, Director, Applied Investment Management Program, University of Arizona Department of Finance, prior thereto, Vice Chairman and Chief Financial Officer, True North Communications, Inc., marketing communications and advertising firm | | 25 | | Warnaco Group, Inc., intimate apparel, sportswear, and swimwear manufacturer; Center for Furniture Craftsmanship (not-for-profit) |
June 30, 2012 | William Blair Funds 63 |
| | | | | | | | | | |
Name and Year of Birth | | Position(s)
Held with
Fund | | Term of
Office and
Length of
Time
Served(1) | | Principal Occupation(s) During Past 5 Years(2) | | Number of
Portfolios
in Fund
Complex
Overseen
by Trustee | | Other Directorships Held by Trustee/Officer |
Thomas J. Skelly,
1951 | | Trustee | | Since 2007 | | Advisory Board Member for various U.S. Companies; Director and Investment Committee Chairman of the US Accenture Foundation, Inc.; prior to 2005, Managing Partner of various divisions at Accenture | | 25 | | Mutual Trust Financial Group, provider of insurance and investment products; Board Member First MetLife Investors Insurance Company, NY Chartered Company for Metropolitan Life Insurance |
| | | | | |
Officers | | | | | | | | | | |
Michael P. Balkin,
1959 | | Senior Vice President Vice President | | Since 2009 2008-2009 | | Partner, William Blair & Company, L.L.C. Associate, William Blair & Company, L.L.C.; former Partner, Magnetar Capital | | | | N/A |
| | | | | |
Karl W. Brewer,
1966 | | Senior Vice President | | Since 2000 | | Partner, William Blair & Company, L.L.C. | | | | N/A |
| | | | | |
David C. Fording,
1967 | | Senior Vice President Vice President | | Since 2009 2006-2009 | | Partner, William Blair & Company, L.L.C. Associate, William Blair & Company, L.L.C.; former Portfolio Manager, TIAA-CREF. | | | | N/A |
| | | | | |
James S. Golan,
1961 | | Senior Vice President | | Since 2005 | | Partner, William Blair & Company, L.L.C. | | | | N/A |
| | | | | |
W. George Greig,
1952 | | Senior Vice President | | Since 1996 | | Partner, William Blair & Company, L.L.C. | | | | N/A |
| | | | | |
Michael A. Jancosek,
1959 | | Senior Vice President | | Since 2004 | | Partner, William Blair & Company L.L.C. | | | | N/A |
| | | | | |
John F. Jostrand,
1954 | | Senior Vice President | | Since 1999 | | Partner, William Blair & Company, L.L.C. | | | | N/A |
| | | | | |
Chad M. Kilmer,
1975 | | Senior Vice President Vice President | | Since 2011 2006-2011 | | Partner, William Blair & Company, L.L.C. Associate, William Blair & Company, L.L.C.; former analyst and Portfolio Manager U.S. Bancorp Asset Management. | | | | N/A |
| | | | | |
Robert C. Lanphier, IV,
1956 | | Senior Vice President | | Since 2003 | | Partner, William Blair & Company, L.L.C. | | | | Chairman, AG. Med, Inc. |
| | | | | |
Mark T. Leslie,
1967 | | Senior Vice President Vice President | | Since 2008 2005-2008 | | Partner, William Blair & Company, L.L.C. Associate, William Blair & Company, L.L.C. | | | | N/A |
| | | | | |
Matthew A. Litfin,
1972 | | Senior Vice President | | Since 2008 | | Partner, William Blair & Company, L.L.C. | | | | N/A |
| | | | | |
Kenneth J. McAtamney
1966 | | Senior Vice President | | Since 2008 | | Partner, William Blair & Company, L.L.C. | | | | N/A |
64 Semi-Annual Report | June 30, 2012 |
| | | | | | | | |
Name and Year of Birth | | Position(s) Held with Fund | | Term of
Office and
Length of Time
Served(1) | | Principal Occupation(s) During Past 5 Years(2) | | Other Directorships Held by Trustee/Officer |
Todd M. McClone,
1968 | | Senior Vice President Vice President | | Since 2006 2005-2006 | | Partner, William Blair & Company, L.L.C. Associate, William Blair & Company, L.L.C. | | N/A N/A |
| | | | |
David Merjan,
1960 | | Senior Vice President | | Since 2008 | | Partner, William Blair & Company, L.L.C. | | N/A |
| | | | |
David S. Mitchell,
1960 | | Senior Vice President | | Since 2004 | | Partner, William Blair & Company, L.L.C. | | N/A |
| | | | |
David P. Ricci,
1958 | | Senior Vice President | | Since 2006 | | Partner, William Blair & Company, L.L.C. | | N/A |
| | | | |
Brian D. Singer,
1960 | | Senior Vice President Vice President | | Since 2012 2011-2012 | | Partner, William Blair & Company, L.L.C. Associate, William Blair & Company, L.L.C. (since 2011); prior thereto, Managing Partner, Singer Partners, LLC (2009-2011); prior thereto, UBS Global Asset Management (Americas) Inc. (2003-2007) | | N/A |
| | | | |
Paul J. Sularz,
1967 | | Senior Vice President Vice President | | Since 2012 2009-2012 | | Partner, William Blair & Company, L.L.C. Associate, William Blair & Company, L.L.C.; Vice President, J.P. Morgan Securities, Inc. | | N/A |
| | | | |
Jeffrey A. Urbina,
1955 | | Senior Vice President | | Since 1998 | | Partner, William Blair & Company, L.L.C. | | N/A |
| | | | |
Christopher T. Vincent,
1956 | | Senior Vice President | | Since 2004 | | Partner, William Blair & Company, L.L.C. | | N/A |
| | | | |
Kathleen M. Lynch,
1971 | | Vice President | | Since 2010 | | Associate, William Blair & Company, L.L.C. | | N/A |
| | | | |
David F. Hone,
1967 | | Vice President | | Since 2011 | | Associate, William Blair & Company, L.L.C. (since 2011); prior thereto, Portfolio Manager Large Cap Value, Deutsche Asset Management (2002-2010) | | N/A |
| | | | |
John Abunassar,
1967 | | Vice President | | Since 2011 | | Associate, William Blair & Company, L.L.C. (since 2011); prior thereto, Principal, Guidance Capital LLC (2009-2011); prior thereto. President and CEO of Allegiant Asset | | N/A |
| | | | |
Peter Carl,
1967 | | Vice President | | Since 2011 | | Associate, William Blair & Company L.L.C. (since 2011); prior thereto, Portfolio Manager, Guidance Capital LLC (2006-2011) | | N/A |
| | | | |
D. Trowbridge Elliman III, 1957 | | Vice President | | Since 2011 | | Associate, William Blair & Company L.L.C. (since 2011); prior thereto, Principal, Guidance Capital LLC (2001-2011) | | N/A |
June 30, 2012 | William Blair Funds 65 |
| | | | | | | | |
Name and Year of Birth | | Position(s) Held with Fund | | Term of
Office and
Length of Time
Served(1) | | Principal Occupation(s) During Past 5 Years(2) | | Other Directorships Held by Trustee/Officer |
Christopher Walvoord,
1966 | | Vice President | | Since 2011 | | Associate, William Blair & Company, L.L.C. (since 2011); prior thereto, Principal, Guidance Capital LLC (2002-2011) | | N/A |
| | | | |
Brian Ziv,
1957 | | Vice President | | Since 2011 | | Associate, William Blair & Company, L.L.C. (since 2011); prior thereto, Principal, Guidance Capital LLC (2001-2011) | | N/A |
| | | | |
Edwin Denson,
1967 | | Vice President | | Since 2011 | | Associate, William Blair & Company, L.L.C. (since 2011); prior thereto, Managing Partner, Singer Partners, LLC (2009-2011); prior thereto, UBS Global Asset Management (Americas) Inc. (2001-2009) | | N/A |
| | | | |
Thomas Clarke,
1968 | | Vice President | | Since 2011 | | Associate, William Blair & Company, L.L.C. (since 2011); prior thereto, Managing Partner, Singer Partners, LLC (2009-2011); prior thereto, UBS Global Asset Management (Americas) Inc. (2000-2009) | | N/A |
| | | | |
Walter R. Randall, Jr.,
1960 | | Chief Compliance Officer and Assistant Secretary | | Since 2009 | | Associate, William Blair & Company, L.L.C.; Associate Counsel and Chief Compliance Officer, Calamos Investments; Assistant General Counsel, American Century Investments. | | N/A |
| | | | |
Colette M. Garavalia,
1961 | | Treasurer | | Since 2009 | | Associate, William Blair & Company, L.L.C. | | N/A |
| | | | |
| | Secretary | | 2000-2009 | | Associate, William Blair & Company, L.L.C. | | N/A |
| | | | |
Andrew T. Pfau,
1970 | | Secretary | | Since 2009 | | Associate, William Blair & Company, L.L.C.; Associate, Bell, Boyd & Lloyd, LLP; Associate, Sidley Austin LLP | | N/A |
| | | | |
John M. Raczek,
1970 | | Assistant Treasurer | | Since 2010 | | Associate, William Blair & Company, L.L.C.; Manager, Calamos Investments | | N/A |
| * | | Ms. Seitz and Mr. Smirl are interested persons of the William Blair Funds because each is a partner of William Blair & Company, L.L.C., the Fund’s investment advisor, principal underwriter and distributor. |
| (1) | | Each Trustee serves until the election and qualification of a successor, or until death, resignation or retirement or removal as provided in the Fund’s Declaration of Trust. Retirement for non-interested Trustees occurs no later than at the conclusion of the first regularly scheduled Board meeting of the Fund’s fiscal year that occurs after the earlier of (a) the non-interested Trustee’s 72nd birthday or (b) the 15th anniversary of the date that the non-interested Trustee was first elected or appointed as a member of the Board of Trustees. The Fund’s officers, except the Chief Compliance Officer, are elected annually by the Trustees. The Fund’s Chief Compliance Officer is designated by the Board of Trustees and may only be removed by action of the Board of Trustees, including a majority of the non-interested Trustees. |
| (2) | | In November 2008, all partners of William Blair & Company, L.L.C. also became limited partners in WB Holdings, L.P. |
��
The Statement of Additional Information for the William Blair Funds includes additional information about the trustees and is available without charge by calling 1-800-635-2886 (in Massachusetts 1-800-635-2840) or by writing the Fund.
66 Semi-Annual Report | June 30, 2012 |
Renewal of the Trust’s Management Agreement
On April 24, 2012, the Board of Trustees (the “Board”) of the William Blair Funds (the “Trust”), including the Trustees who are not “interested persons” of the Trust as defined in the Investment Company Act of 1940, as amended (the “Independent Trustees”), approved the renewal for an additional one-year term of the Trust’s Management Agreement with William Blair & Company, L.L.C. (the “Advisor”), on behalf of each of the William Blair Global Growth Fund, the William Blair Institutional International Growth Fund, the William Blair Institutional International Equity Fund, the William Blair International Small Cap Growth Fund, the William Blair Emerging Markets Growth Fund, the William Blair Emerging Leaders Growth Fund, the William Blair Bond Fund and the William Blair Low Duration Fund (each, a “Fund” and collectively, the “Funds”). In deciding to approve the renewal of the Management Agreement, the Board did not identify any single factor or group of factors as all important or controlling and considered all factors together.
The information in this summary outlines the Board’s considerations associated with its renewal of the Management Agreement. In connection with its deliberations regarding the continuation of the Management Agreement, the Board considered such information and factors as it believed to be relevant. As described below, the Board considered the nature, extent and quality of the services performed by the Advisor under the existing Management Agreement; comparative management fees and expense ratios as prepared by an independent provider (Lipper Inc.); the estimated profits realized by the Advisor; the extent to which the Advisor realizes economies of scale as a Fund grows; and whether any fall-out benefits are being realized by the Advisor. In addition, the Independent Trustees discussed the renewal of the Management Agreement with Fund management and in private sessions with independent legal counsel at which no representatives of the Advisor were present.
The Board, including the Independent Trustees, considered the renewal of the Management Agreement pursuant to a process that concluded at the Board’s April 24, 2012 meeting. In preparation for the review process, the Independent Trustees met with independent legal counsel and discussed the type and nature of information to be requested and independent legal counsel sent a formal request for information to Trust management. The Advisor provided extensive information in response to the request. After reviewing the information received, the Independent Trustees requested supplemental information, which the Advisor provided in writing and/or orally. The Independent Trustees reviewed comparative performance and comparative advisory fees and expense ratios for a peer group and a peer universe of funds provided by Lipper for each Fund. In addition, the Independent Trustees considered: (i) materials describing the nature, quality and extent of services provided by the Advisor; (ii) information comparing the performance of each Fund to one or more relevant securities indexes; (iii) information comparing advisory fees of each Fund to fees charged by the Advisor to other funds and client accounts with similar investment strategies; (iv) the estimated allocated direct or indirect costs of services provided and estimated profits realized by the Advisor for both the Trust as a whole and each Fund individually; and (v) information describing other benefits to the Advisor resulting from its relationship with the Funds. The Independent Trustees also noted that they receive information from the Advisor regarding the Funds throughout the year in connection with regular Board meetings, including presentations from portfolio managers. The Independent Trustees also received a memorandum from independent legal counsel advising them of their duties and responsibilities in connection with the review of the Management Agreement. Finally, the Advisor made an in-person presentation to the Independent Trustees regarding the contract review information, including addressing the supplemental information requests, and answered questions from the Independent Trustees.
On April 16, 23 and 24, 2012, the Independent Trustees met independently of Trust management and of the interested Trustees to review and discuss with independent legal counsel the information provided by the Advisor, Lipper and independent legal counsel. The Independent Trustees noted that in evaluating the Management Agreement, they were taking into account their accumulated experience as Board members in working with the Advisor on matters relating to the Funds. Based on their review, the Independent Trustees concluded that it was in the best interest of each Fund to renew the Management Agreement and recommended to the Board the renewal of the Management Agreement. The Board considered the recommendation of the Independent Trustees along with the other factors that the Board deemed relevant.
Nature, Quality and Extent of Services. In evaluating the nature, quality and extent of the services provided by the Advisor to the Funds, the Board noted that the Advisor is a quality firm with a reputation for integrity and honesty that employs high quality people and has a long association with the Funds, in each case other than the Growth Fund, since the inception of the Funds. The Trustees believe that a long-term relationship with a capable, conscientious advisor is in the best interests of shareholders and that shareholders have invested in the Funds knowing that the Advisor managed the Funds and knowing the investment advisory fee. The Board considered biographical information about the Trust’s officers and the Funds’ portfolio managers, including information on the portfolio managers’ investments in the Funds. The Board also considered the administrative services performed by the Advisor, financial information regarding the Advisor, the Advisor’s execution
June 30, 2012 | William Blair Funds 67 |
quality and use of soft dollars, the compliance regime overseen by the Advisor, and the Advisor’s expense limitations in place for certain Funds. The Board was also provided with information pertaining to the Advisor’s organizational structure and senior management. The Board noted that the Advisor pays the compensation of all of the officers and the interested Trustees of the Trust.
The Board reviewed information on the annualized total returns of each Fund for the one, three, five and ten year periods ended December 31, 2011, as applicable, along with annualized total return information for the Lipper performance peer universe of funds and one or more relevant securities indexes. The Lipper performance peer universe for each Fund included all funds with a similar investment style as classified by Lipper regardless of asset size or primary channel of distribution. With respect to the comparative performance information generally, the Board considered the Advisor’s statement that it is committed to managing each Fund consistently with the Fund’s stated investment strategies through all market environments and that, as a result, the Funds’ relative performance compared to the Lipper performance peer universe and relevant securities indexes from year to year will be affected by whether the market environment favors or disfavors certain of the Advisor’s investment strategies, but that the Advisor seeks to provide superior performance over the long term. The Trustees reviewed each Fund’s ranking in its Lipper performance peer universe during the applicable periods, and based on that review, requested and discussed with the Advisor additional information regarding the performance of the Institutional International Equity Fund. With respect to the Institutional International Equity Fund, the Board considered the Advisor’s statement that the Fund’s lower allocations to emerging markets and small-cap securities relative to its peer funds had contributed to relative underperformance in recent periods.
Based upon all relevant factors, the Board concluded that the nature, quality and extent of the services provided by the Advisor to each Fund were satisfactory.
Fees and Expenses. The Board reviewed each Fund’s advisory fee and expense ratio and reviewed information comparing the advisory fee and expense ratio to those of a Lipper expense peer group and Lipper expense peer universe for each Fund. The Lipper expense peer group for each Fund consisted of a group of funds with a similar investment style as classified by Lipper, distribution channel and asset size as the Fund. The Lipper expense peer universe for each Fund consisted of all funds with a similar investment style as classified by Lipper and distribution channel as the Fund. For each Fund, the Board also reviewed amounts charged by the Advisor to other pooled investment vehicles, including other registered funds for which the Advisor acts as a subadvisor, and the Advisor’s fee schedule for institutional separate accounts. With respect to other pooled investment vehicles and institutional separate accounts, the Board considered the Advisor’s statement that both the mix of services provided to the Funds and the additional regulatory responsibilities associated with sponsoring registered investment companies were greater as compared to the work involved for other pooled investment vehicles and separate accounts. In addition, the Board considered the Advisor’s statement that institutional separate accounts are distributed differently, operate under different investment and regulatory structures and have different business risks as compared to the Funds.
In considering the Lipper information, the Board noted that the contractual advisory fees for the International Small Cap Growth Fund, the Emerging Markets Growth Fund, the Bond Fund and the Low Duration Fund were at or below the average advisory fees of their Lipper expense peer group. The Board also noted that the contractual advisory fees for the Global Growth Fund, the Institutional International Growth Fund, the Institutional International Equity Fund and the Emerging Leaders Growth Fund were above the average advisory fees of their Lipper expense peer group, but that each Fund’s advisory fee was within range of the average advisory fees of its Lipper expense peer group. The Board also considered that the Advisor had proposed to contractually limit total expenses for the Global Growth Fund, the Institutional International Equity Fund, the International Small Cap Growth Fund, the Emerging Markets Growth Fund, the Emerging Leaders Growth Fund, the Bond Fund and the Low Duration Fund. On the basis of the information provided, the Board concluded that each Fund’s advisory fee, coupled with applicable expense limitations, was reasonable.
Profitability. With respect to the profitability of the Management Agreement to the Advisor, the Board considered the overall fees paid under the Management Agreement, including the estimated allocated costs of the services provided and profits realized by the Advisor from its relationship with the Trust as a whole and each Fund individually. The Board concluded that the estimated profits realized by the Advisor were not unreasonable.
Economies of Scale. The Board considered the extent to which economies of scale would be realized as the Funds grow and whether fee levels reflect these economies of scale for the benefit of investors. The Board noted the Advisor’s representation that certain Fund expenses are relatively fixed and unrelated to asset size and that the Advisor may enjoy some economies of scale as a Fund’s assets grow. The Board also noted that the Advisor increased the number of personnel working on Fund matters during 2011. In considering whether fee levels reflect economies of scale for the benefit of Fund investors, the Board
68 Semi-Annual Report | June 30, 2012 |
reviewed each Fund’s asset size, breakpoints for those Funds with breakpoints in the advisory fee schedule, the Fund’s total and net expense ratios and the expense limitations in place and/or proposed, and concluded that in the aggregate they reasonably reflect appropriate recognition of any economies of scale.
Other Benefits to the Advisor. The Board considered benefits derived by the Advisor from its relationship with the Funds, including (i) non-advisory fee revenue from the Funds in the form of shareholder administration fees, service fees and/or distribution fees and the payment of some or all of those revenues to affiliates or third parties, (ii) soft dollars, which pertain primarily to the Funds investing in equity securities, and (iii) favorable media coverage. The Board concluded that, taking into account these benefits, each Fund’s advisory fee was reasonable.
Conclusion. Based upon all of the information considered and the conclusions reached, the Board determined that the terms of the Management Agreement continue to be fair and reasonable and that the continuation of the Management Agreement is in the best interests of each Fund.
June 30, 2012 | William Blair Funds 69 |
(unaudited)
Proxy Voting
A description of the policies and procedures that the Fund uses to determine how to vote proxies relating to portfolio securities and information regarding how the Fund voted proxies relating to portfolio securities for the most recent 12-month period ended December 31 are available without charge, upon request, by calling 1-800-635-2886 (in Massachusetts 1-800-635-2840), at www.williamblairfunds.com and on the SEC’s website at http://www.sec.gov.
Quarterly Portfolio Schedules
Each Portfolio files its complete schedule of portfolio holdings with the SEC for the first and third fiscal quarters of each fiscal year (quarters ended March 31 and September 30) on Form N-Q. The Fund’s Forms N-Q are available on the SEC’s website at http://www.sec.gov and may be reviewed and copied at the SEC’s Public Reference Room in Washington, D.C. Information on the operation of the SEC’s Public Reference Room may be obtained by calling 1-800-SEC-0330. The Fund’s Forms N-Q are also available on the Fund’s website at www.williamblairfunds.com.
Additional Federal Income Tax Information: (unaudited)
Under Section 852(b)(3)(C) of the Code, the Funds hereby designate the following amounts as capital gain dividends for the fiscal year ended December 31, 2011:
| | | | |
Emerging Markets Growth | | Emerging Leaders Growth | | Bond |
$115,030,166 | | $2,732,548 | | $1,831,187 |
The following table provides the percentage of the 2011 year-end distributions that qualify for the dividend received deduction, and the qualified dividend income percentage:
| | | | | | | | |
Fund | | Dividend
Received
Deduction% | | | Qualified
Dividend
Income% | |
Institutional International Growth | | | 0.00 | % | | | 80.38 | % |
Institutional International Equity | | | 0.00 | % | | | 100.00 | % |
International Small Cap Growth | | | 0.00 | % | | | 100.00 | % |
Emerging Markets Growth | | | 0.10 | % | | | 100.00 | % |
Emerging Leaders Growth | | | 0.00 | % | | | 100.00 | % |
Bond | | | 0.00 | % | | | 0.00 | % |
Low Duration | | | 0.00 | % | | | 0.00 | % |
In January 2012, you were notified on IRS Form 1099-Div or substitute 1099 DIV as to the Federal tax status of the distributions received by you in the calendar year 2011.
70 Semi-Annual Report | June 30, 2012 |
Useful Information About Your Report (unaudited)
Please refer to this information when reviewing the Expense Example for each Portfolio.
Expense Example
As a shareholder of a Fund, you incur ongoing costs, including management fees and other Portfolio expenses. The example is intended to help you understand your ongoing costs (in dollars) of investing in the Portfolio and to compare these costs with the ongoing costs of investing in other mutual funds. To do so, compare the Fund’s 5% hypothetical example with the 5% hypothetical examples that appear in the shareholder reports of other funds. The example is based on an investment of $1,000 invested at the beginning of the period and held for the entire six-month period from January 1, 2012 to June 30, 2012.
Actual Expenses
In each example, the first line for each share class in the table provides information about the actual account values and actual expenses. These expenses reflect the effect of any expense cap applicable to the share class during the period. Without this expense cap, the costs shown in the table would have been higher. You may use the information in this line, together with the amount you invested, to estimate the expenses that you paid over the period. Simply divide your account value by $1,000 (example, an $8,600 account value divided by $1,000 = 8.6), then multiply the result by the number in the first line under the heading entitled “Expenses Paid During the Period” to estimate the expenses you paid on your account during the period.
Hypothetical Example for Comparison Purposes
In each example, the second line for each share class in the table provides information about hypothetical account values and hypothetical expenses based on the Portfolio’s actual expense ratio and an assumed rate of return of 5% per year before expenses. This is not the Portfolio’s actual return. The hypothetical account values and expenses may not be used to estimate the actual ending account balance or expenses you paid for the period. You may use this information to compare the ongoing costs of investing in the to other funds. To do so, compare this 5% hypothetical example with the 5% hypothetical examples that appear in the shareholder reports of other funds.
Please note that the expenses shown in both examples are meant to highlight your ongoing costs only and do not reflect any transactional costs or account type fees. These fees are fully described in the prospectus. Therefore, the second line of each share class in the table is useful in comparing ongoing costs only and will not help you determine the relative costs of owning different funds.
June 30, 2012 | William Blair Funds 71 |
Fund Expenses; (unaudited)
The example below shows you the ongoing costs (in dollars) of investing in your fund and allows you to compare these costs with those of other mutual funds. Please refer to the previous page for a detailed explanation of the information presented in these charts.
| | | | | | | | | | | | | | | | | | |
Expense Example | | Beginning
Account Value
1/1/2012 | | | Ending
Account Value
6/30/2012 | | | Expenses Paid
During the
Period (a) | | | Annualized
Expense Ratio | |
Institutional International Growth Fund | | | | | | | | | | | | | | | | |
Institutional Class—actual return | | $ | 1,000.00 | | | $ | 1,079.90 | | | $ | 5.07 | | | | 0.98 | % |
Institutional Class—hypothetical 5% return | | $ | 1,000.00 | | | $ | 1,019.99 | | | $ | 4.92 | | | | 0.98 | |
Institutional International Equity Fund | | | | | | | | | | | | | | | | |
Class I—actual return | | $ | 1,000.00 | | | $ | 1,049.60 | | | $ | 5.61 | | | | 1.10 | |
Institutional Class—hypothetical 5% return | | $ | 1,000.00 | | | $ | 1,019.39 | | | $ | 5.52 | | | | 1.10 | |
International Small Cap Growth Fund | | | | | | | | | | | | | | | | |
Institutional Class—actual return | | $ | 1,000.00 | | | $ | 1,064.30 | | | $ | 5.49 | | | | 1.07 | |
Institutional Class—hypothetical 5% return | | $ | 1,000.00 | | | $ | 1,019.54 | | | $ | 5.37 | | | | 1.07 | |
Emerging Markets Growth Fund | | | | | | | | | | | | | | | | |
Institutional Class—actual return | | $ | 1,000.00 | | | $ | 1,073.30 | | | $ | 6.13 | | | | 1.19 | |
Institutional Class—hypothetical 5% return | | $ | 1,000.00 | | | $ | 1,018.95 | | | $ | 5.97 | | | | 1.19 | |
Emerging Leaders Growth Fund | | | | | | | | | | | | | | | | |
Institutional Class—actual return | | $ | 1,000.00 | | | $ | 1,070.60 | | | $ | 6.44 | | | | 1.25 | |
Institutional Class—hypothetical 5% return | | $ | 1,000.00 | | | $ | 1,018.65 | | | $ | 6.27 | | | | 1.25 | |
Bond Fund | | | | | | | | | | | | | | | | |
Institutional Class—actual return | | $ | 1,000.00 | | | $ | 1,040.10 | | | $ | 1.78 | | | | 0.35 | |
Institutional Class—hypothetical 5% return | | $ | 1,000.00 | | | $ | 1,023.12 | | | $ | 1.76 | | | | 0.35 | |
Low Duration Fund | | | | | | | | | | | | | | | | |
Institutional Class—actual return | | $ | 1,000.00 | | | $ | 1,016.40 | | | $ | 2.01 | | | | 0.40 | |
Institutional Class—hypothetical 5% return | | $ | 1,000.00 | | | $ | 1,022.87 | | | $ | 2.01 | | | | 0.40 | |
| (a) | | Expenses are equal to the annualized expense ratio, multiplied by the average account value over the period, multiplied by the number of days in the period 182, and divided by 366 (to reflect the one-half year period). |
72 Semi-Annual Report | June 30, 2012 |
BOARD OF TRUSTEES
Phillip O. Peterson
Retired Partner, KPMG LLP
Lisa A. Pollina
Senior Advisor to RBC Financial Group—International Banking and Insurance Division
Donald J. Reaves
Chancellor, Winston-Salem State University
Donald L. Seeley
Retired Adjunct Lecturer and Director, University of Arizona Department of Finance
Michelle R. Seitz, Chairman and President
Partner, William Blair & Company, L.L.C.,
Thomas J. Skelly
Retired Managing Partner, Accenture U.S.
Richard W. Smirl, Senior Vice President
Partner, William Blair & Company L.L.C.
Officers
Michael P. Balkin, Senior Vice President
Karl W. Brewer, Senior Vice President
David C. Fording, Senior Vice President
James S. Golan, Senior Vice President
W. George Greig, Senior Vice President
Michael A. Jancosek, Senior Vice President
John F. Jostrand, Senior Vice President
Chad M. Kilmer, Senior Vice President
Robert C. Lanphier, IV, Senior Vice President
Mark T. Leslie, Senior Vice President
Matthew A. Litfin, Senior Vice President
Kenneth J. McAtamney, Senior Vice President
Todd M. McClone, Senior Vice President
David Merjan, Senior Vice President
David S. Mitchell, Senior Vice President
David P. Ricci, Senior Vice President
Brian D. Singer, Senior Vice President
Paul J. Sularz, Senior Vice President
Jeffrey A. Urbina, Senior Vice President
Christopher T. Vincent, Senior Vice President
Kathleen M. Lynch, Vice President
David F. Hone, Vice President
John Abunassar, Vice President
Peter Carl, Vice President
D. Trowbridge Elliman III, Vice President
Christopher Walvoord, Vice President
Brian Ziv, Vice President
Edwin Denson, Vice President
Thomas Clarke, Vice President
Walter R. Randall, Jr., Chief Compliance Officer and Assistant Secretary
Colette M. Garavalia, Treasurer
Andrew T. Pfau, Secretary
John M. Raczek, Assistant Treasurer
Investment Advisor
William Blair & Company, L.L.C.
Independent Registered Public Accounting Firm
Ernst & Young LLP
Legal Counsel
Vedder Price P.C.
Transfer Agent
Boston Financial Data Services, Inc.
P.O. Box 8506
Boston, MA 02266-8506
For customer assistance, call 1-800-635-2886
(Massachusetts 1-800-635-2840)
June 30, 2012 | William Blair Funds 73 |
William Blair Funds
| | |
INTERNATIONAL EQUITY | | FIXED-INCOME |
Institutional International Growth Fund | | Bond Fund - Institutional Class Shares |
Institutional International Equity Fund | | Low Duration Fund - Institutional Class Shares |
International Small Cap Growth Fund - Institutional Class Shares | | |
Emerging Markets Growth Fund - Institutional Class Shares | | |
Emerging Leaders Growth Fund - Institutional Class Shares | | |
| | | | |
| | | | ©William Blair & Company, L.L.C., distributor |
 | | +1 800 742 7272 williamblairfunds.com | | 222 West Adams Street Chicago, Illinois 60606 |
Not applicable to this filing.
| Item 3. | Audit Committee Financial Expert |
Not applicable to this filing.
| Item 4. | Principal Accountant Fees and Services |
Not applicable to this filing.
| Item 5. | Audit Committee of Listed Registrants |
Not Applicable to this Registrant, insofar as the Registrant is not a listed company.
| Item 6. | Schedule of Investments |
See Schedule of Investments in Item 1
| Item 7. | Disclosure of Proxy Voting Policies and Procedures for Closed-End Management Investment Companies |
Not applicable to this Registrant, insofar as the Registrant is not a closed-end management investment company.
| Item 8. | Portfolio Managers of Closed Investment Companies |
Not applicable to this Registrant, insofar as the Registrant is not a closed-end management investment company.
| Item 9. | Purchase of Equity Securities by Closed-End Management Investment Companies and Affiliated Purchasers |
Not applicable to this Registrant, insofar as the Registrant is not a closed-end management investment company.
| Item 10. | Submission of Matters to a Vote of Security Holders |
There have been no material changes to the procedures by which shareholders may recommend nominees to the Registrant’s Board of Trustees since the Registrant last provided disclosure in response to this item.
Controls and Procedures
(a) The Registrant’s principal executive and principal financial officer, or persons performing similar functions, have concluded that the Registrant’s Disclosure Controls and Procedures (as defined in Rule 30a-3(c) under the Investment Company Act of 1940, as amended (the “1940 Act”) (17 CFR 270.30a-3(c)) are effective, as of a date within 90 days of the filing date of this report that includes the disclosure required by this paragraph, based on their evaluation of these controls and procedures required by Rule 30a-3 (b) under the 1940 Act (17 CFR 270.30a-3(b) and Rules 13a-15(b) or 15d-15(b) under the Exchange Act (17 CFR 240.13a-15(b) or 240.15d-15(b)).
(b) There were no changes in the Registrant’s internal control over financial reporting (as defined in Rule 30a-3(d) under the 1940 Act (17 CFR 270.30a-3(d)) that occurred during the final quarter of the period covered by this report that has materially affected, or is reasonably likely to materially affect, the Registrant’s internal control over financial reporting.
12. (a) (1) Code of Ethics
Not applicable because it is posted on Registrant’s website.
12. (a) (2) (1)
Certification of Principal Executive Officer Required by Rule 30a-2(a) of the Investment Company Act
12. (a) (2) (2)
Certification of Principal Financial Officer Required by Rule 30a-2(a) of the Investment Company Act.
12. (a) (3)
Not applicable to this Registrant.
12. (b)
Certification of Chief Executive Officer and Certification of Chief Financial Officer Required by Rule 30a-2(b) of the Investment Company Act
Signatures
Pursuant to the requirements of the Securities Exchange Act of 1934 and the Investment Company Act of 1940, the Registrant has duly caused this report to be signed on its behalf by the undersigned, thereunto duly authorized.
| | |
| | | William Blair Funds |
| |
| | | /s/ Michelle R. Seitz |
| By: | | Michelle R. Seitz |
| | | President (Chief Executive Officer) |
Date: August 16, 2012
Pursuant to the requirements of the Securities Exchange Act of 1934 and the Investment Company Act of 1940, this report has been signed below by the following persons on behalf of the Registrant and in the capacities and on the dates indicated
| | |
| By: | | Michelle R. Seitz |
| | | President (Chief Executive Officer) |
Date: August 16, 2012
| | |
| By: | | Colette M. Garavalia |
| | | Treasurer (Chief Financial Officer) |
Date: August 16, 2012