UNITED STATES
SECURITIES AND EXCHANGE COMMISSION
Washington, D.C. 20549
Form N-CSR
CERTIFIED SHAREHOLDER REPORT OF REGISTERED
MANAGEMENT INVESTMENT COMPANIES
Investment Company Act File Number 811-5344
William Blair Funds
(Exact name of registrant as specified in charter)
| | |
| 222 West Adams Street, Chicago, IL | | 60606 |
| (Address of principal executive offices) | | (Zip Code) |
Michelle R. Seitz
William Blair Funds
222 West Adams Street, Chicago, IL 60606
(Name and address of agent for service)
Registrant’s telephone number, including area code: 312-236-1600
Date of fiscal year end: December 31
Date of reporting period: June 30, 2011
Form N-CSR is to be used by management investment companies to file reports with the Commission not later than 10 days after the transmission to stockholders of any report that is required to be transmitted to stockholders under Rule 30e-1 under the Investment Company Act of 1940 (17 CFR 270.30e-1). The Commission may use the information provided on Form N-CSR in its regulatory, disclosure review, inspection, and policymaking roles.
A registrant is required to disclose the information specified by Form N-CSR, and the Commission will make this information public. A Registrant is not required to respond to the collection of information contained in Form N-CSR unless the form displays a currently valid Office of Management and Budget (“OMB”) control number. Please direct comments concerning the accuracy of the information collection burden estimates and any suggestions for reducing the burden to Secretary, Securities and Exchange Commission, 450 Fifth Street, NW, Washington, DC 20549-0609. The OMB has reviewed this collection of information under the clearance requirements of 44 U.S.C. (ss) 3507.
| Item 1. | June 30, 2011 Annual Reports transmitted to shareholders. |

SEMI-ANNUAL REPORT
JUNE 30, 2011
Table of Contents
The views expressed in the commentary for each Fund reflect those of the portfolio management team only through the end of the period of the report as stated on the cover. The portfolio management team’s views are subject to change at any time based on market and other conditions and should not be construed as a recommendation. Statements involving predictions, assessments, analyses, or outlook for individual securities, industries, market sectors, and/or markets involve risks and uncertainties, and there is no guarantee they will come to pass.
This report is submitted for the general information of the shareholders of the William Blair Funds. It is not authorized for distribution to prospective investors unless accompanied or preceded by a prospectus of the William Blair Funds. Please carefully consider the Funds’ investment objectives, risks, charges, and expenses before investing. This and other information is contained in the Funds’ prospectus, which you may obtain by calling 1-800-742-7272. Read it carefully before you invest or send money.
June 30, 2011 | William Blair Funds 1 |
PERFORMANCE AS OF JUNE 30, 2011—CLASS N SHARES (unaudited)
| | | | | | | | | | | | | | | | | | | | | | | | |
| | | Year
To Date | | | 1 Yr. | | | 3 Yr. | | | 5 Yr. | | | 10 Yr
(or since
inception) | | | Inception
Date | | Overall
Morningstar
Rating |
Growth Fund | | | | | | | | | | | | | | | | | | | | | | | | |
Class N | | | 5.67 | | | | 31.13 | | | | 3.99 | | | | 5.36 | | | | 3.31 | | | 3/20/1946 | | ««««
Among 1,476 Large Growth Funds |
Morningstar Large Growth | | | 5.65 | | | | 33.08 | | | | 3.02 | | | | 4.07 | | | | 2.24 | | | | |
Russell 3000® Growth | | | 6.98 | | | | 35.68 | | | | 5.28 | | | | 5.36 | | | | 2.43 | | | | |
Standard & Poor’s 500 | | | 6.02 | | | | 30.69 | | | | 3.34 | | | | 2.94 | | | | 2.72 | | | | | |
| | | | | | | |
Large Cap Growth Fund | | | | | | | | | | | | | | | | | | | | | | | | |
Class N | | | 3.64 | | | | 31.21 | | | | 2.46 | | | | 2.91 | | | | 0.43 | | | 12/27/1999 | | «««
Among 1,476 Large Growth Funds |
Morningstar Large Growth | | | 5.65 | | | | 33.08 | | | | 3.02 | | | | 4.07 | | | | 2.24 | | | | |
Russell 1000® Growth | | | 6.83 | | | | 35.01 | | | | 5.01 | | | | 5.33 | | | | 2.24 | | | | |
| | | | | | | |
Small Cap Growth Fund | | | | | | | | | | | | | | | | | | | | | | | | |
Class N | | | 1.38 | | | | 22.22 | | | | 8.25 | | | | 2.28 | | | | 7.96 | | | 12/27/1999 | | «««
Among 666 Small Growth Funds |
Morningstar Small Growth | | | 9.35 | | | | 42.52 | | | | 7.81 | | | | 5.08 | | | | 5.05 | | | | |
Russell 2000® Growth | | | 8.59 | | | | 43.50 | | | | 8.35 | | | | 5.79 | | | | 4.63 | | | | |
Russell 2000® | | | 6.21 | | | | 37.41 | | | | 7.77 | | | | 4.08 | | | | 6.27 | | | | | |
| | | | | | | |
Mid Cap Growth Fund | | | | | | | | | | | | | | | | | | | | | | | | |
Class N | | | 12.00 | | | | 42.57 | | | | 10.06 | | | | 8.20 | | | | 7.50 | | | 2/1/2006 | | ««««
Among 681 Mid-Cap Growth Funds |
Morningstar Mid-Cap Growth | | | 8.08 | | | | 39.49 | | | | 5.18 | �� | | | 5.59 | | | | — | | | | |
Russell MidCap® Growth | | | 9.59 | | | | 43.25 | | | | 6.58 | | | | 6.28 | | | | 5.11 | | | | |
| | | | | | | |
Small-Mid Cap Growth Fund | | | | | | | | | | | | | | | | | | | | | | | | |
Class N | | | 11.53 | | | | 41.25 | | | | 11.84 | | | | 7.53 | | | | 8.83 | | | 12/29/2003 | | ««««
Among 681 Mid-Cap Growth Funds |
Morningstar Mid-Cap Growth | | | 8.08 | | | | 39.49 | | | | 5.18 | | | | 5.59 | | | | — | | | | |
Russell 2500TM Growth | | | 10.25 | | | | 44.71 | | | | 8.51 | | | | 6.67 | | | | 8.01 | | | | |
| | | | | | | |
Global Growth Fund | | | | | | | | | | | | | | | | | | | | | | | | |
Class N | | | 6.19 | | | | 35.77 | | | | (0.52 | ) | | | — | | | | (2.86 | ) | | 10/15/2007 | | ««
Among 683 World Stock Funds |
Morningstar World Stock | | | 4.72 | | | | 30.18 | | | | 1.70 | | | | — | | | | — | | | | |
MSCI All Country World IMI (net) | | | 4.66 | | | | 31.00 | | | | 1.74 | | | | — | | | | (2.81 | ) | | | |
| | | | | | | |
International Growth Fund | | | | | | | | | | | | | | | | | | | | | | | | |
Class N | | | 1.97 | | | | 27.83 | | | | (2.04 | ) | | | 2.65 | | | | 7.06 | | | 10/1/1992 | | «««
Among 209 Foreign Large Growth Funds |
Morningstar Foreign Large Growth | | | 4.05 | | | | 31.68 | | | | (0.10 | ) | | | 3.49 | | | | 6.09 | | | | |
MSCI All Country World Ex-U.S. IMI (net) | | | 3.52 | | | | 30.26 | | | | 0.31 | | | | 3.96 | | | | 8.05 | | | | |
| | | | | | | |
International Equity Fund | | | | | | | | | | | | | | | | | | | | | | | | |
Class N | | | 3.22 | | | | 26.11 | | | | (4.36 | ) | | | 0.98 | | | | 4.99 | | | 5/24/2004 | | ««
Among 209 Foreign Large Growth Funds |
Morningstar Foreign Large Growth | | | 4.05 | | | | 31.68 | | | | (0.10 | ) | | | 3.49 | | | | — | | | | |
MSCI World Ex-U.S. (net) | | | 4.72 | | | | 30.33 | | | | (1.56 | ) | | | 2.02 | | | | 7.63 | | | | |
MSCI All Country World Ex-U.S. IMI (net) | | | 3.52 | | | | 30.26 | | | | 0.31 | | | | 3.96 | | | | 9.54 | | | | | |
| | | | | |
International Small Cap Growth Fund | | | | | | | | | | | | | | | | | |
Class N | | | 5.43 | | | | 35.85 | | | | 2.71 | | | | 4.72 | | | | 7.74 | | | 11/1/2005 | | «««
Among 129 Foreign Small/Mid Growth Funds |
Morningstar Foreign Small/Mid Growth | | | 3.47 | | | | 36.50 | | | | 2.30 | | | | 4.02 | | | | — | | | | |
MSCI All Country World Ex-U.S. Small Cap (net) | | | 1.51 | | | | 34.24 | | | | 5.56 | | | | 5.92 | | | | 8.57 | | | | |
Please see the next page for important disclosure information.
2 Semi-Annual Report | June 30, 2011 |
PERFORMANCE AS OF JUNE 30, 2011—CLASS N SHARES—CONTINUED (unaudited)
| | | | | | | | | | | | | | | | | | | | | | | | |
| | | Year
To Date | | | 1 Yr. | | | 3 Yr. | | | 5 Yr. | | | 10 Yr
(or since
inception) | | | Inception
Date | | Overall
Morningstar
Rating |
Emerging Markets Growth Fund | | | | | | | | | | | | | | | | | |
Class N | | | (0.70 | ) | | | 28.05 | | | | (1.15 | ) | | | 7.92 | | | | 13.95 | | | 6/6/2005 | | ««
Among 291 Diversified Emerging Markets Funds |
Morningstar Diversified Emerging Markets | | | (0.42 | ) | | | 26.76 | | | | 1.97 | | | | 9.54 | | | | — | | | | |
MSCI Emerging Markets IMI (net) | | | 0.32 | | | | 27.53 | | | | 5.13 | | | | 11.90 | | | | 15.43 | | | | |
| | | | | |
Emerging Leaders Growth Fund | | | | | | | | | | | | | | | | | |
Class N | | | (2.42 | ) | | | 23.12 | | | | — | | | | — | | | | 13.20 | | | 5/3/2010 | | Not rated. |
Morningstar Diversified Emerging Markets | | | (0.42 | ) | | | 26.76 | | | | — | | | | — | | | | — | | | | |
MSCI Emerging Markets Large Cap (net) | | | 0.97 | | | | 27.87 | | | | — | | | | — | | | | 14.22 | | | | |
| | | | | |
Small Cap Value | | | | | | | | | | | | | | | | | |
Class N | | | 2.19 | | | | 33.30 | | | | 9.91 | | | | 5.83 | | | | 7.36 | | | 12/23/1996 | | ««««
Among 305 Small Value Funds |
Morningstar Small Value | | | 4.58 | | | | 32.28 | | | | 8.73 | | | | 3.49 | | | | 8.31 | | | | |
Russell 2000® Value | | | 3.77 | | | | 31.35 | | | | 7.09 | | | | 2.24 | | | | 7.53 | | | | |
| | | | | |
Mid Cap Value Fund | | | | | | | | | | | | | | | | | |
Class N | | | 5.86 | | | | 32.15 | | | | — | | | | — | | | | 12.47 | | | 5/3/2010 | | Not rated. |
Morningstar Short-term Bond | | | 6.16 | | | | 32.92 | | | | — | | | | — | | | | — | | | | | |
Russell Midcap® Value Index | | | 6.69 | | | | 34.28 | | | | — | | | | — | | | | 12.17 | | | | |
| | | | | |
Bond Fund | | | | | | | | | | | | | | | | | |
Class N | | | 2.90 | | | | 5.43 | | | | 7.51 | | | | — | | | | 6.41 | | | 5/1/2007 | | ««««
Among 1,017 Intermediate-Term Bond Funds |
Morningstar Intermediate-term Bond | | | 2.84 | | | | 5.33 | | | | 6.69 | | | | — | | | | — | | | | |
Barclays Capital U.S. Aggregate Bond Index | | | 2.72 | | | | 3.90 | | | | 6.46 | | | | — | | | | 6.07 | | | | |
| | | | | |
Income Fund | | | | | | | | | | | | | | | | | |
Class N | | | 2.48 | | | | 4.56 | | | | 5.26 | | | | 4.13 | | | | 4.03 | | | 10/1/1990 | | ««««
Among 376 Short-Term Bond Funds |
Morningstar Short-term Bond | | | 1.42 | | | | 3.02 | | | | 3.93 | | | | 3.98 | | | | 3.67 | | | | |
Barclays Capital Intermediate Govt./Credit Bond Index | | | 2.47 | | | | 3.77 | | | | 5.76 | | | | 6.08 | | | | 5.35 | | | | |
| | | | | |
Low Duration Fund | | | | | | | | | | | | | | | | | |
Class N | | | 1.13 | | | | 1.56 | | | | — | | | | — | | | | 1.51 | | | 12/1/2009 | | Not rated. |
Morningstar Ultra Short Bond | | | 0.62 | | | | 1.63 | | | | — | | | | — | | | | — | | | | | |
Merrill Lynch 1-Year U.S. Treasury Note Index | | | 0.35 | | | | 0.67 | | | | — | | | | — | | | | 0.65 | | | | |
Performance cited represents past performance. Past performance does not guarantee future results and current performance may be lower or higher than the data quoted. Results shown are average annual total returns, which assume reinvestment of dividends and capital gains. Investment returns and principal will fluctuate and you may have a gain or a loss when you sell shares. For the most current month-end performance information, please call 1-800-742-7272, or visit our Web site at www.williamblairfunds.com. From time to time, the investment advisor may waive fees or reimburse expenses for the Fund. Without these waivers, performance would be lower. Investing in smaller companies involves special risks, including higher volatility and lower liquidity. International and emerging markets investing involves special risk considerations, including currency fluctuations, lower liquidity, economic and political risk. As interest rates rise, bond prices will fall and bond funds may become more volatile. Class N shares are available to the general public without a sales load.
June 30, 2011 | William Blair Funds 3 |
PERFORMANCE AS OF JUNE 30, 2011—CLASS N SHARES—CONTINUED (unaudited)
Morningstar RatingsTM are as of 6/30/2011 and are subject to change every month. The ratings are based on a risk-adjusted return measure that accounts for variation in a fund’s monthly performance, placing more emphasis on downward variations and rewarding consistent performance. The top 10% of funds in each Category receive 5 stars, the next 22.5% receive 4 stars, the middle 35% receive 3 stars, the next 22.5% receive 2 stars, and the bottom 10% receive 1 star. The Overall Morningstar Rating for a fund is derived from a weighted-average of the performance figures associated with its three-, five- and ten-year (if applicable) Morningstar Rating metrics. The 3/5/10 year Morningstar ratings were as follows: Growth Fund «««/««««/««««, and Large Cap Growth Fund «««/«««/««, out of 1,476/1,276/803 large growth funds; Small Cap Growth Fund «««/««/««««, out of 666/565/358 small growth funds; Mid Cap Growth Fund «««««/««««/NA and Small-Mid Cap Growth Fund «««««/««««/NA out of 681/609/NA mid cap growth funds; Global Growth Fund ««/NA/NA out of 683/NA/NA world stocks; International Growth Fund «««/«««/««« and International Equity Fund ««/««/NA out of 209/168/103 foreign large growth funds; International Small Cap Growth Fund «««/«««/NA out of 129/104/NA foreign small/mid growth funds; Emerging Markets Growth Fund ««/««/NA out of 291/225/NA diversified emerging markets growth funds; Small Cap Value Fund ««««/««««/««« out of 305/255/141 small value funds; Income Fund ««««/«««/«««« out of 376/323/189 short-term bond funds; Bond Fund ««««/NA/NA out of 1,017/NA/NA intermediate-term bond fund.
Please carefully consider the Funds’ investment objectives, risks, charges, and expenses before investing. This and other information is contained in the Funds’ prospectus, which you may obtain by calling 1-800-742-7272. Read it carefully before you invest or send money.
See accompanying Notes to Financial Statements.
4 Semi-Annual Report | June 30, 2011 |

David C. Fording

John F. Jostrand
GROWTH FUND
The Growth Fund seeks long-term capital appreciation.
AN OVERVIEW FROM THE PORTFOLIO MANAGERS
The Growth Fund posted an 5.67% increase (Class N Shares) for the six months ended June 30, 2011. By comparison, the Fund’s benchmark, the Russell 3000® Growth Index, gained 6.98%.
Our quality growth approach assisted during May and June when the market declined, but stock picking challenges in both Energy and Information Technology have held back year-to-date relative returns.
Overcoming several major shocks, the U.S. equity markets finished with solid gains in the first half of 2011. Most of these gains occurred in the first quarter on better-than-expected corporate earnings and positive economic reports including unemployment, which dropped below 9% for the first time in almost two years. The Russell 3000® Growth climbed 6.3%. Generally, investors had a growing level of confidence that the economic recovery had become self-sustaining. In fact, the upward market momentum could not be deterred by the political turmoil in the Middle East and North Africa (MENA), the natural disasters in Japan, and re-emergence of the debt crisis in Europe. In the second quarter, U.S. stocks retracted and market volatility picked up, as investors reacted to several concerns. First, U.S. and global economic growth saw some deceleration driven by China’s monetary tightening and sluggish developed market consumer spending due to continued deleveraging and inflationary pressures such as high gas prices and food costs. Helping to slow global economic growth further, Japan’s economic output slipped for several months due to the earthquake and tsunami, which caused supply chain disruptions throughout the world. We view this event as temporary. Sovereign debt issues in Europe flared up as well, particularly in Greece. Also, QE2 (the second round of U.S. quantitative easing) ended in June, which increased speculation about a potential rise in rates and the need for QE3. Lastly, investors were worried over the slow recovery in employment as initial claims increased and job growth decelerated. Surprisingly, the Russell 3000® Growth Index gained ground at 0.64% in the second quarter, after being down nearly 8% intra-quarter.
Given the uncertainty, the markets returned to a familiar risk on/risk off pattern with investor confidence bolstered only by the last macro data point or political resolution announced. Year-to-date, the more defensive sectors benefited including Utilities and Health Care. Despite the weakness in the second quarter, Energy stocks were strong due to high oil prices, continued demand, and potential supply issues with the turmoil in the MENA region. Conversely, the weaker relative performers were Telecommunication, Materials and Information Technology. In terms of capitalization, mid capitalization stocks were best followed by small caps and then large caps. The Russell Mid Cap Growth Index increased 9.59%, the Russell 2000® Growth Index rose 8.59%, and the Russell 1000® Growth climbed 6.83%.
The Fund’s greatest sector detractor to performance was Energy due to both stock selection and an underweight in a strong performing group. Most of the difficulty occurred in the first quarter. We did not own Exxon Mobil, the largest benchmark stock, which performed well and hurt relative results. Also, we held E&P (exploration and production) companies that had exposure to the Middle East and North Africa; as a result, Occidental Petroleum and Apache had more muted relative results. Lastly, Weatherford struggled as it announced plans to restate taxes, a near term issue. Another sector with weak relative results was Information Technology due to primarily stock selection and to a lesser extent, an overweight in a poor
June 30, 2011 | William Blair Funds 5 |
performing group. Notably, a few of our large cap stocks trailed the group average. Google, one of our top positions, declined after reporting better than expected revenues, which were offset by higher operating costs. Its management set a more aggressive tone on pursuing growth opportunities such as mobile, social and local advertising by increasing its investments, primarily in people. In our view, the company continues to have a strong market position, and is well positioned to benefit from an increase in ad spending as the economy recovers. Microsoft was a relative laggard as well despite its attractive earnings reports that beat analyst expectations driven by its business division (Office 2010) and entertainment and devices group (Xbox 360 console and Kinect). While Microsoft has nicely exceeded street expectations since the Fund bought the stock in mid-2009, on very strong product cycles and disciplined cost management, we believed there were signs of waning financial discipline as well as questionable strategic moves (e.g. Skype purchase) in the second quarter. As a result, the Fund eliminated the stock in June. Also, Dolby came under pressure on reduced 2011 revenue guidance due to weakness in the PC end market. The Fund has added to its position in Dolby as its valuation has become much more attractive.
Turning to the portfolio’s strengths, consumer sectors were standouts among the contributors. The best performing stock overall was Green Mountain Coffee Roasters, Inc., a specialty coffee company and leader in the single-serve segment through its Keurig brand. This staples stock rallied on an announcement that Starbucks plans to make its coffee and Tazo tea available as single-serve K-Cup portion packs for use in the Keurig brewing system. Starbucks will be their exclusive super premium licensed coffee brand. In Consumer Discretionary, Tempur-Pedic International, Inc. and McDonald’s Corporation also showed strength. Tempur-Pedic benefited from strong sales momentum and margin leverage. In our view, the company should see further upside to earnings as a result of its differentiated products, increasing brand awareness, strong channel relationships, and recent launch of new products including the Cloud line in Europe and the Contour line in the U.S. McDonald’s stock rose due to better-than-expected quarterly sales in both the U.S. and Europe. The company continues to drive traffic with strong execution, advertising, and broad price selections on its menu, which helps offset macroeconomic headwinds of rising commodity prices and austerity in Europe. Select Information Technology stocks were additive to results as well. Atheros Communications, a leading innovator in Wi-Fi connectivity, announced it would be acquired by Qualcomm. The stock rallied substantially, and the Fund sold the stock. Also, we did not own shares of Cisco, which declined in the quarter and helped relative results. Lastly, in Industrials, TransDigm Group rose on continued strength in the commercial aircraft aftermarket, as well as the continued execution of its acquisition strategy.
On the outlook for the U.S. economy, we are cautiously optimistic. As the year progresses, we expect to see acceleration in economic growth, driven by Japan coming back on-line with lessening of supply chain disruptions and the growing likelihood of China halting its monetary tightening, thus moderating an existing headwind to global economic activity. In addition, some lessening of commodity cost inflationary pressures should be a positive for spending while a low interest rate environment in the developed markets should continue to assist businesses and consumers. Also, the increased clarity of regulatory framework in the banking system is another positive and we have already seen modest year-over-year growth in banking loans. In combination, these trends should be good for equity markets as well.
However, macro uncertainty remains and volatility may continue as investors seek resolution of outstanding concerns. On sovereign debt, we may have continued flare-ups, but European government officials are likely to respond adequately in order to avoid a crisis. In regard to U.S. employment, it is not a surprise that a return to more normal trends has been slow given the greater efficiency in corporate America and the changing skill set required for America’s workforce. Further recovery will be important for improvements in consumer spending and the housing market. Moreover, the price of gas may stay at elevated levels due to global demand, especially from emerging markets, which may temper consumer discretionary purchases. Finally, political events remain at the forefront of investor’s minds. Given the fragile state of both consumer and business confidence, the resolution of important issues such as the Greek debt crisis and the U.S. debt ceiling negotiations (to name a few) are
6 Semi-Annual Report | June 30, 2011 |
critical to averting the much feared double dip recession. Handicapping such political outcomes is more difficult and, as such, uncertainty is likely to persist for some time.
In a slower growth environment, our quality growth investment discipline should benefit in our view. Leading companies with superior and sustainable earnings growth and strong management teams will be able to navigate the market challenges and be rewarded while less attractive firms wane. Our focus will continue to be intensive fundamental research seeking quality companies, which have durable business franchises with sustainable competitive advantages, strong management teams, healthy cash flows and balance sheets, as well as outstanding execution; these companies should be exceptional investment opportunities over time in our view.
June 30, 2011 | William Blair Funds 7 |
Growth Fund
Performance Highlights (unaudited)
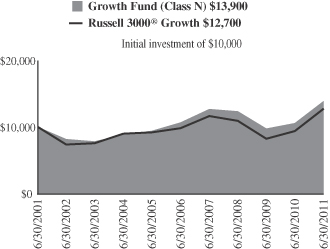
Average Annual Total Return at 6/30/2011
| | | | | | | | | | | | | | | | | | | | |
| | | Year
To Date | | | 1
Year | | | 3
Year | | | 5
Year | | | 10
Year | |
Class N | | | 5.67 | % | | | 31.13 | % | | | 3.99 | % | | | 5.36 | % | | | 3.31 | % |
Class I | | | 5.89 | | | | 31.64 | | | | 4.36 | | | | 5.70 | | | | 3.61 | |
Russell 3000® Growth Index | | | 6.98 | | | | 35.68 | | | | 5.28 | | | | 5.36 | | | | 2.43 | |
S&P 500 Index | | | 6.02 | | | | 30.69 | | | | 3.34 | | | | 2.94 | | | | 2.72 | |
Performance cited represents past performance. Past performance does not guarantee future results and current performance may be lower or higher than the data quoted. Results shown are average annual returns, which assume reinvestment of dividends and capital gains. Investment returns and principal will fluctuate and you may have a gain or loss when you sell shares. For the most current month-end performance information, please call 1-800-742-7272, or visit our Web site at www.williamblairfunds.com. Class N shares are available to the general public without a sales load. Class I shares are available to certain institutional investors and advisory clients of William Blair & Company L.L.C. without a sales load or distribution (12b-1) or service fees.
The performance highlights and graph presented above do not reflect the deduction of taxes that a shareholder would pay on fund distributions or the redemption of fund shares.
The Russell 3000® Growth Index consists of large, medium, and small capitalization companies with above average price-to-book ratios and forecasted growth rates. The index is weighted by market capitalization and large/medium/small companies make up approximately 80%/15%/5% of the index.
The S&P 500 Index indicates broad larger capitalization equity market performance.
This report identifies the Fund’s investments on June 30, 2011. These holdings are subject to change. Not all stocks in the Fund performed the same, nor is there any guarantee that these stocks will perform as well in the future. Market forecasts provided in this report may not necessarily come to pass.
Sector Diversification (unaudited)
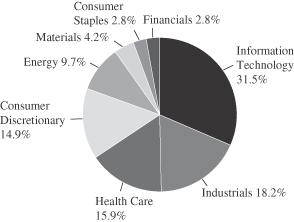
The sector diversification shown is based on the total long-term securities.
8 Semi-Annual Report | June 30, 2011 |
Growth Fund
Portfolio of Investments, June 30, 2011 (all dollar amounts in thousands) (unaudited)
| | | | | | | | |
Issuer | | Shares | | | Value | |
| | |
Common Stocks | | | | | | | | |
Information Technology—31.0% | | | | | | | | |
*Apple, Inc. | | | 89,685 | | | $ | 30,105 | |
*Broadcom Corporation Class “A” | | | 288,000 | | | | 9,688 | |
*Dolby Laboratories, Inc. Class “A” | | | 225,000 | | | | 9,553 | |
FLIR Systems, Inc. | | | 269,000 | | | | 9,068 | |
*Fusion-io, Inc. | | | 15,007 | | | | 452 | |
*Genpact, Ltd.† | | | 636,518 | | | | 10,974 | |
*Google, Inc. Class “A” | | | 51,805 | | | | 26,233 | |
*Juniper Networks, Inc. | | | 242,800 | | | | 7,648 | |
*Monolithic Power Systems, Inc. | | | 649,400 | | | | 10,014 | |
QUALCOMM, Inc. | | | 307,740 | | | | 17,476 | |
*RightNow Technologies, Inc. | | | 193,156 | | | | 6,258 | |
*Silicon Laboratories, Inc. | | | 320,840 | | | | 13,238 | |
Solera Holdings, Inc. | | | 159,300 | | | | 9,424 | |
TE Connectivity, Ltd.† | | | 362,600 | | | | 13,329 | |
*Trimble Navigation, Ltd. | | | 323,300 | | | | 12,816 | |
VeriSign, Inc. | | | 306,000 | | | | 10,239 | |
| | | | | | | | |
| | | | | | | 196,515 | |
| | | | | | | | |
Industrials—17.8% | | | | | | | | |
CH Robinson Worldwide, Inc. | | | 113,800 | | | | 8,972 | |
*Corrections Corporation of America | | | 242,700 | | | | 5,254 | |
Fastenal Co. | | | 331,858 | | | | 11,943 | |
Flowserve Corporation | | | 66,300 | | | | 7,286 | |
Goodrich Corporation | | | 95,300 | | | | 9,101 | |
*IHS, Inc. Class “A” | | | 222,720 | | | | 18,579 | |
*Jacobs Engineering Group, Inc. | | | 318,200 | | | | 13,762 | |
Manpower, Inc. | | | 161,000 | | | | 8,638 | |
The Corporate Executive Board Co. | | | 291,339 | | | | 12,717 | |
*TransDigm Group, Inc. | | | 109,580 | | | | 9,993 | |
*Trimas Corporation | | | 279,781 | | | | 6,925 | |
| | | | | | | | |
| | | | | | | 113,170 | |
| | | | | | | | |
Health Care—15.6% | | | | | | | | |
*Align Technology, Inc. | | | 271,300 | | | | 6,186 | |
Allergan, Inc. | | | 122,600 | | | | 10,206 | |
*Celgene Corporation | | | 156,380 | | | | 9,433 | |
*Cerner Corporation | | | 163,600 | | | | 9,997 | |
*DaVita, Inc. | | | 146,700 | | | | 12,706 | |
*Gilead Sciences, Inc. | | | 213,035 | | | | 8,822 | |
*Haemonetics Corporation | | | 117,000 | | | | 7,531 | |
*Hologic, Inc. | | | 298,300 | | | | 6,017 | |
*IDEXX Laboratories, Inc. | | | 130,230 | | | | 10,101 | |
*Illumina, Inc. | | | 133,100 | | | | 10,002 | |
*NxStage Medical, Inc. | | | 393,915 | | | | 8,201 | |
| | | | | | | | |
| | | | | | | 99,202 | |
| | | | | | | | |
Consumer Discretionary—14.6% | | | | | | | | |
Harley-Davidson, Inc. | | | 162,999 | | | | 6,678 | |
Johnson Controls, Inc. | | | 435,900 | | | | 18,159 | |
*K12, Inc. | | | 227,788 | | | | 7,549 | |
McDonald’s Corporation | | | 352,064 | | | | 29,686 | |
*Tempur-Pedic International, Inc. | | | 182,700 | | | | 12,391 | |
*Urban Outfitters, Inc. | | | 213,000 | | | | 5,996 | |
*Valassis Communications, Inc. | | | 400,800 | | | | 12,144 | |
| | | | | | | | |
| | | | | | | 92,603 | |
| | | | | | | | |
*Non-income producing securities
† = U.S. listed foreign security
| | | | | | | | |
Issuer | | Shares or
Principal
Amount | | | Value | |
| | |
Common Stocks—(continued) | | | | | | | | |
Energy—9.5% | | | | | | | | |
*Cameron International Corporation | | | 122,147 | | | $ | 6,143 | |
Occidental Petroleum Corporation | | | 165,300 | | | | 17,198 | |
Schlumberger, Ltd.† | | | 235,400 | | | | 20,339 | |
Suncor Energy, Inc.† | | | 255,100 | | | | 9,974 | |
*Weatherford International, Ltd.† | | | 343,800 | | | | 6,446 | |
| | | | | | | | |
| | | | | | | 60,100 | |
| | | | | | | | |
Materials—4.1% | | | | | | | | |
Airgas, Inc. | | | 94,500 | | | | 6,619 | |
Ecolab, Inc. | | | 256,320 | | | | 14,451 | |
*Stillwater Mining Co. | | | 227,900 | | | | 5,016 | |
| | | | | | | | |
| | | | | | | 26,086 | |
| | | | | | | | |
Consumer Staples—2.8% | | | | | | | | |
*Green Mountain Coffee Roasters, Inc. | | | 197,659 | | | | 17,643 | |
| | | | | | | | |
Financials—2.7% | | | | | | | | |
*IntercontinentalExchange, Inc. | | | 95,800 | | | | 11,947 | |
The Charles Schwab Corporation | | | 336,075 | | | | 5,529 | |
| | | | | | | | |
| | | | | | | 17,476 | |
| | | | | | | | |
Total Common Stocks—98.1%
(cost $514,813) | | | | 622,795 | |
| | | | | | | | |
| |
Repurchase Agreement | | | | | |
Fixed Income Clearing Corporation, 0.010%
dated 6/30/11, due 7/1/11, repurchase price
$10,350, collateralized by FHLMC, 2.000%, due 12/3/15 | | $ | 10,350 | | | | 10,350 | |
| | | | | | | | |
Total Repurchase Agreement—1.6%
(cost $10,350) | | | | 10,350 | |
| | | | | | | | |
Total Investments—99.7%
(cost $525,163) | | | | 633,145 | |
Cash and other assets, less liabilities—0.3% | | | | 1,636 | |
| | | | | | | | |
Net assets—100.0% | | | $ | 634,781 | |
| | | | | | | | |
See accompanying Notes to Financial Statements.
June 30, 2011 | William Blair Funds 9 |

James S. Golan

Tracy McCormick
LARGE CAP GROWTH FUND
The Large Cap Growth Fund seeks long-term capital appreciation.
AN OVERVIEW FROM THE PORTFOLIO MANAGERS
The Large Cap Growth Fund posted a 3.64% increase (Class N Shares) for the six months ended June 30, 2011. By comparison, the Fund’s benchmark, the Russell 1000® Growth Index, increased 6.83%.
In the first six months of 2011, the William Blair Large Cap Growth Fund trailed its benchmark primarily due to results in the first quarter; major cross currents in the marketplace were a headwind. Notably, our quality growth approach assisted during May and June when the market declined.
Overcoming several major shocks, the U.S. equity markets finished with solid gains in the first half of 2011. Most of these gains occurred in the first quarter on better-than-expected corporate earnings and positive economic reports including unemployment, which dropped below 9% for the first time in almost two years. The Russell 1000® Growth climbed 6.0%. Generally, investors had a growing level of confidence that the economic recovery had become self-sustaining. In fact, the upward market momentum could not be deterred by the political turmoil in the Middle East and North Africa (MENA), the natural disasters in Japan, and re-emergence of the debt crisis in Europe. In the second quarter, U.S. stocks retracted and market volatility picked up, as investors reacted to several concerns. First, U.S. and global economic growth saw some deceleration driven by China’s monetary tightening and sluggish developed market consumer spending due to continued deleveraging and inflationary pressures such as high gas prices and food costs. Helping to slow global economic growth further, Japan’s economic output slipped for several months due to the earthquake and tsunami, which caused supply chain disruptions throughout the world. We view this event as temporary. Sovereign debt issues in Europe flared up as well, particularly in Greece. Also, QE2 (the second round of U.S. quantitative easing) ended in June, which increased speculation about a potential rise in rates and the need for QE3. Lastly, investors were worried over the slow recovery in employment as initial claims increased and job growth decelerated. Surprisingly, the Russell 1000® Growth Index gained ground at 0.76% in the second quarter, after being down more than 7% intra-quarter.
Given the uncertainty, the markets returned to a familiar risk on/risk off pattern with investor confidence bolstered only by the last macro data point or political resolution announced. Year-to-date, the more defensive sectors benefited including Utilities and Health Care. Despite the weakness in the second quarter, Energy stocks were strong due to high oil prices, continued demand, and potential supply issues with the turmoil in the MENA region. Conversely, the weaker relative performers were Telecommunication Services, Materials and Information Technology (IT). In terms of capitalization, mid capitalization stocks were best followed by small caps and then large caps. The Russell Mid Cap® Growth Index increased 9.59% while the Russell 2000® Growth Index rose 8.59%.
We were disappointed with the portfolio results in the semi-annual period. Headwinds were challenging for active managers as investors relied more heavily on the macroeconomic environment, especially in the first quarter, and had less of a commitment to underlying fundamentals. However, we were encouraged by the relative outperformance from our stock positions in the second quarter as the macro influences subsided to a lesser degree.
The Fund’s greatest sector laggard was Consumer Discretionary where Marriott International, Inc. came under pressure on softness in North America revenue per available room (RevPAR); we view this as a near-term issue. The Energy sector was also challenging. Most
10 Semi-Annual Report | June 30, 2011 |
of the difficulty occurred in the first quarter. The Fund did not own Exxon Mobil Corporation, the largest benchmark stock at 5.1%, which performed well and hurt results. Also, we held E&P (exploration and production) companies that had exposure to the Middle East and North Africa; as a result, Occidental Petroleum Corporation and Apache Corporation had more muted relative results. The Fund continues to own Occidental due to its attractive long-term growth profile, but the Fund sold Apache on its higher exposure to this region. Lastly, Information Technology stock performance was mixed. Some of our large cap technology holdings lagged such as Microsoft Corporation and Google, Inc. Microsoft was a relative laggard despite its attractive earnings reports that beat analyst expectations driven by its business division (Office 2010) and entertainment and devices group (Xbox 360 console and Kinect). From a research perspective, we had the earnings view correct; however, the market was unwilling to reward the stock due to concerns over slowing PC sales especially in consumer and competition from tablets (i.e. iPads). As a result, the Fund sold the stock in May. Google, one of the Fund’s top positions, declined after reporting better than expected revenues, which were offset by higher operating costs. Its management set a more aggressive tone on pursuing growth opportunities such as mobile, social and local advertising by increasing its investments, primarily in people. In our view, the company continues to have a strong market position, and is well positioned to benefit from an increase in ad spend as the economy recovers. Also, Dolby Laboratories, Inc. came under pressure on reduced 2011 revenue guidance due to weakness in the PC end market. We believe the longer-term thesis remains unchanged. The consumption of entertainment from a variety of consumer electronics devices is beneficial for Dolby’s license streams.
Turning to the portfolio’s strengths, Materials and Health Care were standouts among the sector contributors. In Materials, the portfolio benefited from good stock selection with more defensive companies such as Praxair, Inc., and lacked any exposure to metals and mining stocks, which performed poorly as global growth showed signs of slowing. In Health Care, Agilent Technologies, Inc., a leading global provider of measurement tools and services to the bioanalytical and electronic marketplaces, was best. It had a strong above expectation earnings report and significantly raised guidance for fiscal year 2011. The Electronic Measurement Group had impressive revenues that were up 18% organically; it benefited from share gains as well as market adoption of smart phones and 3G networks. In our view, demand from its end markets remains attractive and it should continue to benefit from a cyclical recovery, exposure to growing Asian economies, and potential for additional acquisition activity. Notably, select stocks in other sectors also were strong contributors. In Industrials, Rockwell Automation, Inc. shined with the continued recovery in industrial activity. In Information Technology, Accenture plc, a leading global IT consulting firm, reported robust demand for its services as corporations continued to upgrade IT systems with new technology in order to improve business efficiency and find new avenues for growth. Also, the Fund did not own shares of Cisco Systems, Inc. and Hewlett-Packard Co., which declined and helped relative results. Lastly, in Financials, American Express Co. performed well as credit trends and business spending continued to improve.
On the outlook for the U.S. economy, we are cautiously optimistic. As the year progresses, we expect to see acceleration in economic growth, driven by Japan coming back on-line with lessening of supply chain disruptions and the growing likelihood of China halting its monetary tightening, thus moderating an existing headwind to global economic activity. In addition, some lessening of commodity cost inflationary pressures should be a positive for spending while a low interest rate environment in the developed markets should continue to assist businesses and consumers. Also, the increased clarity of regulatory framework in the banking system is another positive and we have already seen modest year-over-year growth in banking loans. In combination, these trends should be good for equity markets as well.
However, macro uncertainty remains and volatility may continue as investors seek resolution of outstanding concerns. On sovereign debt, we may have continued flare-ups, but European government officials are likely to respond adequately in order to avoid a crisis. In regard to U.S. employment, it is not a surprise that a return to more normal trends has been slow given the greater efficiency in corporate America and the changing skill set required for America’s
June 30, 2011 | William Blair Funds 11 |
workforce. Further recovery will be important for improvements in consumer spending and the housing market. Moreover, the price of gas may stay at elevated levels due to global demand, especially from emerging markets, which may temper consumer discretionary purchases. Finally, political events remain at the forefront of investor’s minds. Given the fragile state of both consumer and business confidence, the resolution of important issues such as the Greek debt crisis and the U.S. debt ceiling negotiations (to name a few) are critical to averting the much feared double dip recession. Handicapping such political outcomes is more difficult and, as such, uncertainty is likely to persist for some time.
In a slower growth environment, our quality growth investment discipline should benefit in our view. Leading companies with superior and sustainable earnings growth and strong management teams will be able to navigate the market challenges and be rewarded while less attractive firms wane. Our focus will continue to be intensive fundamental research seeking quality companies, which have durable business franchises with sustainable competitive advantages, strong management teams, healthy cash flows and balance sheets, as well as outstanding execution; these companies should be exceptional investment opportunities over time in our view.
12 Semi-Annual Report | June 30, 2011 |
Large Cap Growth Fund
Performance Highlights (unaudited)
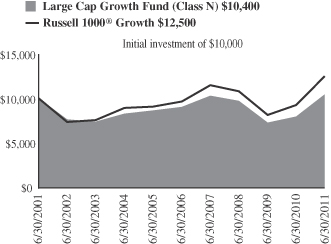
Average Annual Total Return at 6/30/2011
| | | | | | | | | | | | | | | | | | | | |
| | | Year
To Date | | | 1
Year | | | 3
Year | | | 5
Year | | | 10
Year | |
Class N | | | 3.64 | % | | | 31.21 | % | | | 2.46 | % | | | 2.91 | % | | | 0.43 | % |
Class I | | | 3.84 | | | | 31.77 | | | | 2.76 | | | | 3.18 | | | | 0.65 | |
Russell 1000® Growth Index | | | 6.83 | | | | 35.01 | | | | 5.01 | | | | 5.33 | | | | 2.24 | |
Performance cited represents past performance. Past performance does not guarantee future results and current performance may be lower or higher than the data quoted. Results shown are average annual total returns, which assume reinvestment of dividends and capital gains. Investment returns and principal will fluctuate and you may have a gain or loss when you sell shares. For the most current month-end performance information, please call 1-800-742-7272, or visit our Web site at www.williamblairfunds.com. From time to time, the investment advisor may waive fees or reimburse expenses for the Fund. Without these waivers, performance would be lower. Class N shares are available to the general public without a sales load. Class I shares are available to certain institutional investors and advisory clients of William Blair & Company, L.L.C., without a sales load or distribution (12b-1) or service fees.
The performance highlights and graph presented above do not reflect the deduction of taxes that a shareholder would pay on fund distributions or the redemption of fund shares.
The Russell 1000® Growth Index consists of large capitalization companies with above average price-to-book ratios and forecasted growth rates.
This report identifies the Fund’s investments on June 30, 2011. These holdings are subject to change. Not all stocks in the Fund performed the same, nor is there any guarantee that these stocks will perform as well in the future. Market forecasts provided in this report may not necessarily come to pass.
Sector Diversification (unaudited)
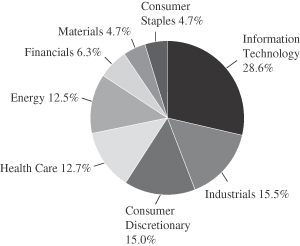
The sector diversification shown is based on the total long-term securities.
June 30, 2011 | William Blair Funds 13 |
Large Cap Growth Fund
Portfolio of Investments, June 30, 2011 (all dollar amounts in thousands) (unaudited)
| | | | | | | | |
Issuer | | Shares | | | Value | |
| | |
Common Stocks | | | | | | | | |
Information Technology—28.1% | | | | | | | | |
Accenture plc Class “A”† | | | 15,200 | | | $ | 918 | |
*Apple, Inc. | | | 4,275 | | | | 1,435 | |
*Citrix Systems, Inc. | | | 7,250 | | | | 580 | |
*Dolby Laboratories, Inc. Class “A” | | | 7,050 | | | | 299 | |
*eBay, Inc. | | | 26,800 | | | | 865 | |
*EMC Corporation | | | 19,750 | | | | 544 | |
*Google, Inc. Class “A” | | | 1,633 | | | | 827 | |
*Juniper Networks, Inc. | | | 10,850 | | | | 342 | |
QUALCOMM, Inc. | | | 17,765 | | | | 1,009 | |
TE Connectivity, Ltd.† | | | 19,140 | | | | 704 | |
*Trimble Navigation, Ltd. | | | 9,850 | | | | 390 | |
| | | | | | | | |
| | | | | | | 7,913 | |
| | | | | | | | |
Industrials—15.3% | | | | | | | | |
CH Robinson Worldwide, Inc. | | | 5,580 | | | | 440 | |
Danaher Corporation | | | 13,544 | | | | 718 | |
Goodrich Corporation | | | 6,200 | | | | 592 | |
*Jacobs Engineering Group, Inc. | | | 13,850 | | | | 599 | |
Rockwell Automation, Inc. | | | 5,100 | | | | 442 | |
*Stericycle, Inc. | | | 4,370 | | | | 389 | |
United Parcel Service, Inc. Class “B” | | | 8,620 | | | | 629 | |
W.W. Grainger, Inc. | | | 3,160 | | | | 486 | |
| | | | | | | | |
| | | | | | | 4,295 | |
| | | | | | | | |
Consumer Discretionary—14.7% | | | | | | | | |
*Discovery Communications, Inc. | | | 6,100 | | | | 250 | |
Harley-Davidson, Inc. | | | 15,652 | | | | 641 | |
Johnson Controls, Inc. | | | 18,650 | | | | 777 | |
Marriott International, Inc. Class “A” | | | 20,300 | | | | 721 | |
NIKE, Inc. Class “B” | | | 8,350 | | | | 751 | |
Scripps Networks Interactive, Inc. Class “A” | | | 8,735 | | | | 427 | |
Starbucks Corporation | | | 14,330 | | | | 566 | |
| | | | | | | | |
| | | | | | | 4,133 | |
| | | | | | | | |
Health Care—12.5% | | | | | | | | |
*Agilent Technologies, Inc. | | | 13,450 | | | | 688 | |
Allergan, Inc. | | | 5,815 | | | | 484 | |
Cardinal Health, Inc. | | | 16,950 | | | | 770 | |
Covidien plc† | | | 9,900 | | | | 527 | |
*DaVita, Inc. | | | 7,150 | | | | 619 | |
*Gilead Sciences, Inc. | | | 10,100 | | | | 418 | |
| | | | | | | | |
| | | | | | | 3,506 | |
| | | | | | | | |
Energy—12.3% | | | | | | | | |
National Oilwell Varco, Inc. | | | 8,550 | | | | 669 | |
Occidental Petroleum Corporation | | | 9,750 | | | | 1,014 | |
Schlumberger, Ltd.† | | | 13,930 | | | | 1,203 | |
Suncor Energy, Inc.† | | | 14,850 | | | | 581 | |
| | | | | | | | |
| | | | | | | 3,467 | |
| | | | | | | | |
Financials—6.2% | | | | | | | | |
*Affiliated Managers Group, Inc. | | | 2,750 | | | | 279 | |
American Express Co. | | | 15,300 | | | | 791 | |
*Non-income producing securities
ADR = American Depository Receipt
† = U.S. listed foreign security
| | | | | | | | |
Issuer | | Shares or
Principal
Amount | | | Value | |
| | |
Common Stocks—(continued) | | | | | | | | |
Financials—(continued) | | | | | | | | |
CME Group, Inc. | | | 2,250 | | | $ | 656 | |
| | | | | | | | |
| | | | | | | 1,726 | |
| | | | | | | | |
Materials—4.6% | | | | | | | | |
Praxair, Inc. | | | 7,325 | | | | 794 | |
Syngenta AG—ADR | | | 7,530 | | | | 509 | |
| | | | | | | | |
| | | | | | | 1,303 | |
| | | | | | | | |
Consumer Staples—4.6% | | | | | | | | |
Anheuser-Busch InBev N.V.—ADR | | | 10,750 | | | | 624 | |
Mead Johnson Nutrition Co. | | | 9,850 | | | | 665 | |
| | | | | | | | |
| | | | | | | 1,289 | |
| | | | | | | | |
Total Common Stocks—98.3%
(cost $21,536) | | | | 27,632 | |
| | | | | | | | |
| | |
Repurchase Agreement | | | | | | | | |
State Street Bank and Trust Company, 0.010% dated 6/30/11, due 7/1/11, repurchase price $659, collateralized by U.S. Treasury Bill, 0.020%, due 8/11/11 | | $ | 659 | | | | 659 | |
| | | | | | | | |
Total Repurchase Agreement—2.3%
(cost $659) | | | | 659 | |
| | | | | | | | |
Total Investments—100.6%
(cost $22,195) | | | | 28,291 | |
Liabilities, plus cash and other assets—(0.6)% | | | | (158 | ) |
| | | | | | | | |
Net assets—100.0% | | | $ | 28,133 | |
| | | | | | | | |
See accompanying Notes to Financial Statements.
14 Semi-Annual Report | June 30, 2011 |

Michael P. Balkin

Karl W. Brewer
SMALL CAP GROWTH FUND
The Small Cap Growth Fund seeks long-term capital appreciation.
AN OVERVIEW FROM THE PORTFOLIO MANAGERS
The Small Cap Growth Fund posted a 1.38% increase (Class N Shares) for the six months ended June 30, 2011. By comparison, the Fund’s benchmark, the Russell 2000® Growth Index, gained 8.59%.
After a near-uninterrupted rally since last August, U.S. equities stumbled during May and June. Small cap growth stocks, as measured by the Russell 2000® Growth Index, corrected over 10% during that period, but rallied in late-June to close the quarter near breakeven and to remain solidly in positive territory for the year-to-date period. The Fund finished just behind its Russell 2000® Growth benchmark during the second quarter. For the first half of the year, the strategy has underperformed given poor relative performance in the first quarter.
The first four months of 2011 witnessed a continuation of the upward trend in stock prices. This was primarily driven by solid corporate fundamentals and reasonable stock valuations. But 2011 to date has mirrored 2010: a strong start to the year followed by a mid-year correction primarily due to disappointing economic data and European sovereign debt woes. Specifically, the most recent correction came on the heels of heightened Greek sovereign debt concerns, sluggish jobs data in the U.S., a potential Chinese housing market downturn, the U.S. government debt ceiling negotiations, uncertainty around the end of the Federal Reserves’ quantitative easing (QE2) and a U.S. housing market that remains on life support. While the negatives are plentiful, the market’s ability to remain relatively flat in the second quarter and up over 8% as measured by the Russell 2000® Growth for the year is telling. Investors continue to focus on healthy corporate fundamentals and on an economy that is slowly recovering, albeit in fits and starts.
From a style perspective during the first half of the year, the small cap growth market witnessed outperformance by larger market cap, higher price momentum and more expensive stocks, primarily due to the magnitude of these dynamics in the first quarter. From a sector perspective, there was little disparity in performance during the first half of the year. Most sectors returned 7-9% during the period including Financials, Materials, Consumer Discretionary, Information Technology (IT) and Energy. Two of the more defensive sectors, Health Care (+10.60 %) and Consumer Staples (+14.93%), outperformed, while Industrials (+4.97%) narrowly trailed the overall small cap growth market during the six-month period.
The Fund’s underperformance over the first half of the year was due to a combination of style factors and stock selection. The vast majority of the negative year-to-date performance occurred in the first quarter. During the first quarter, some of the largest individual stock detractors and the style headwinds during that period, namely our contrarian bias, valuation sensitivity and smaller market cap bias. Information Technology and Consumer Discretionary stock selection have been the most troublesome, while Industrials and Energy stock selection has helped relative results.
In the second quarter specifically, style factors were muted and somewhat offsetting stock picks translated into modest underperformance relative to our benchmark. Favorable stock picks in Industrials, Energy and Information Technology were outweighed by disappointing stock performances in Financials and Consumer Discretionary.
The second quarter correction has kept the broad equity market valuation in check while corporate fundamentals continue to improve. Because of this and despite the macroeconomic and geopolitical headwinds, we believe the market remains relatively balanced looking forward. We believe investors will continue to differentiate between true growth businesses
June 30, 2011 | William Blair Funds 15 |
and those that benefitted primarily from the initial economic recovery. Investors already may be making this distinction as stock correlations have fallen from the elevated levels seen over the past few years. This should bode well for our style of investing and for active management in general. While we factor various economic scenarios into our stock picking, we focus our time on constructing the portfolio from a bottom-up perspective. We continue to find good ideas across sectors, and are confident the Fund consists of great companies with solid competitive positions whose stocks are at attractive valuations compared to the growth and consistency of their business.
Detractors from Return during the Second Quarter:
Demand Media, Inc. develops and acquires professional content to help its clients place more targeted advertisements. Two of the company’s largest online properties are eHow.com and livestrong.com. Reason for underperformance: Recent changes by Google to its search algorithms have decreased traffic to Demand Media’s content sites, and therefore has the potential to impact the company’s value proposition to advertisers. Action: The Fund continues to hold a position in the stock.
Horsehead Holding Corporation is a leading producer of specialty zinc and a manufacturer of value-added zinc products including zinc oxide and zinc powder. The company is a low-cost producer in the industry as much of its raw materials come from recycled sources such as electric arc furnace dust created in the steel manufacturing process. Reason for underperformance: Given the company benefits from increased steel production (lower raw materials cost) and rising zinc pricing (top line benefit), global growth concerns and falling commodity prices sank investor confidence in Horsehead’s fundamental outlook. Action: The Fund maintained its position in the stock given the company’s competitive position and longer-term growth outlook.
National Financial Partners Corporation is a financial services firm that offers high net worth individuals and corporations a variety of financial services such as life insurance and wealth transfer, corporate and executive benefits, and investment advisory. Reason for underperformance: The company announced disappointing earnings during the quarter in part due to weakness in their Individual Client Group. More generally, during the second quarter market correction, the stock likely underperformed given National Financial Partners exposure to individual life insurance sales which has been more discretionary than other financial services over past few years. Action: The Fund maintained its position in the stock as we believe the long-term growth opportunity for the company remains intact despite the near term selloff in the stock.
ChinaCast Education Corporation is a post-secondary and e-Learning services provider. Reason for underperformance: The stock underperformed primarily due to reduced investor confidence in US-listed Chinese companies given accounting concerns at other US-listed Chinese companies unrelated to ChinaCast Education. Action: The Fund liquidated its shares given the increased uncertainty.
QuinStreet, Inc. is an online direct marketing firm, primarily focused on lead generation for the education and financial services industries. Reason for underperformance: The company is experiencing significant pricing pressure from its auto insurance clients as evolving consumer behavior on the internet puts into question the amount an auto insurer client is willing to pay QuinStreet for an online lead. Action: The Fund exited its position as the company’s value proposition is more unknown, causing us to question the total market opportunity for QuinStreet given the importance of its auto insurance clients to the company’s diversification and growth strategy.
Contributors to Return during the Second Quarter:
ICF International, Inc. provides management, technology and policy consulting and implementation services to government and commercial entities. Its key consulting practices
16 Semi-Annual Report | June 30, 2011 |
include: defense and homeland security, energy, environmental and infrastructure and health and human services. Reason for outperformance: In April, the company reiterated its forward earnings guidance, easing investor concerns from the first quarter over the potential impact from government budget cuts and delays. In addition, another government consulting firm was purchased by a private equity firm during the quarter at an attractive valuation, representing the second such transaction in the industry in the past year and giving support to ICF International’s valuation. Action: The Fund continues to hold the stock as we believe the company is exposed to high priority government initiatives such as energy efficiency, education, climate change, healthcare, infrastructure and housing. In addition, we believe these areas of expertise represent a large international opportunity for the company and that the market also underestimates the growth potential of ICF International’s commercial (non-government) business.
TriMas Corporation manufacturers and distributes a diversified portfolio of products for the commercial, industrial and consumer markets. Reason for outperformance: The company reported better-than-expected earnings and increased forward earnings guidance, in part a reflection of the new management team’s efforts to more effectively manage and deploy capital between TriMas’s five segments. Action: The Fund continues to hold a position in the stock as we believe investors still underestimate the management team and earnings power of the company.
Quidel Corporation is a leading provider of point of care diagnostic tests primarily for infectious diseases, women’s health and gastrointestinal diseases. Reason for outperformance: The company reported solid earnings as the business continues to reaccelerate. More importantly, management outlined several new products that it expects to launch both domestically and abroad. Action: The Fund continues to hold a position in the stock as we believe Quidel’s pipeline of products will drive earnings growth and diversify the business beyond its historical dependence on flu tests, thereby supporting a higher valuation as well.
ValueClick, Inc. is a leading online marketing services firm. Reason for outperformance: The company’s growth is reaccelerating faster than expected due to management execution, a rebound in advertising generally and advertising increasing appetite for digital advertising. Action: The Fund continues to hold as we believe ValueClick’s service offering continues to expand, enabling it to serve the increasingly complex needs of advertisers and ad agencies.
Steven Madden, Ltd. designs and markets handbags and accessories, as well as footwear for women, men and children. Reason for outperformance: Business trends continue to surprise investors as demand for Steven Madden’s shoes and accessories increases. In addition, the company’s recently announced acquisitions give investors confidence in the duration of growth given multiple brands and products available for distribution in the US and abroad. Action: The Fund maintained its position in the stock as we believe management execution will continue to be strong as it integrates recent acquisitions and expands sales of its core brands.
June 30, 2011 | William Blair Funds 17 |
Small Cap Growth Fund
Performance Highlights (unaudited)
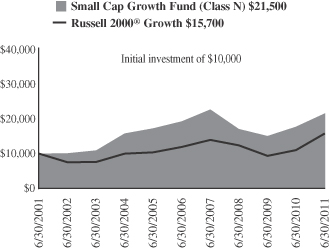
Average Annual Total Return at 6/30/2011
| | | | | | | | | | | | | | | | | | | | |
| | | Year
To Date | | | 1
Year | | | 3
Year | | | 5
Year | | | 10
Year | |
Class N | | | 1.38 | % | | | 22.22 | % | | | 8.25 | % | | | 2.28 | % | | | 7.96 | % |
Class I | | | 1.45 | | | | 22.59 | | | | 8.58 | | | | 2.58 | | | | 8.26 | |
Russell 2000® Growth Index | | | 8.59 | | | | 43.50 | | | | 8.35 | | | | 5.79 | | | | 4.63 | |
Performance cited represents past performance. Past performance does not guarantee future results and current performance may be lower or higher than the data quoted. Results shown are average annual total returns, which assume reinvestment of dividends and capital gains. Investment returns and principal will fluctuate and you may have a gain or loss when you sell shares. For the most current month-end performance information, please call 1-800-742-7272, or visit our Web site at www.williamblairfunds.com. Investing in smaller companies involves special risks, including higher volatility and lower liquidity. Smaller Capitalization stocks are also more sensitive to purchase/sale transactions and changes in the issuer’s financial condition. From time to time, the investment advisor may waive fees or reimburse expenses for the Fund. Without these waivers, performance would be lower. Class N shares are available to the general public without a sales load. Class I shares are available to certain institutional investors and advisory clients of William Blair & Company, L.L.C., without a sales load or distribution (12b-1) or service fees.
The performance highlights and graph presented above do not reflect the deduction of taxes that a shareholder would pay on fund distributions or the redemption of fund shares.
The Russell 2000® Growth Index is an unmanaged composite of the smallest 2000 stocks of the Russell 3000® Growth Index.
This report identifies the Fund’s investments on June 30, 2011. These holdings are subject to change. Not all stocks in the Fund performed the same, nor is there any guarantee that these stocks will perform as well in the future. Market forecasts provided in this report may not necessarily come to pass.
Sector Diversification (unaudited)
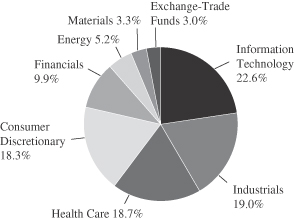
The sector diversification shown is based on the total long-term securities.
18 Semi-Annual Report | June 30, 2011 |
Small Cap Growth Fund
Portfolio of Investments, June 30, 2011 (all dollar amounts in thousands) (unaudited)
| | | | | | | | |
Issuer | | Shares | | | Value | |
| | |
Common Stocks | | | | | | | | |
Information Technology—22.4% | | | | | | | | |
*Cavium, Inc. | | | 237,210 | | | $ | 10,340 | |
*Demand Media, Inc. | | | 467,620 | | | | 6,336 | |
*ExlService Holdings, Inc. | | | 384,140 | | | | 8,874 | |
iGate Corporation | | | 409,390 | | | | 6,681 | |
*Inuvo, Inc. | | | 861,747 | | | | 1,810 | |
*j2 Global Communications, Inc. | | | 332,408 | | | | 9,384 | |
*KIT Digital, Inc. | | | 608,766 | | | | 7,269 | |
*MaxLinear, Inc. Class “A” | | | 669,331 | | | | 5,796 | |
*Monolithic Power Systems, Inc. | | | 765,980 | | | | 11,811 | |
*RealD, Inc. | | | 192,140 | | | | 4,494 | |
*RightNow Technologies, Inc. | | | 395,230 | | | | 12,805 | |
*Silicon Laboratories, Inc. | | | 422,707 | | | | 17,441 | |
Syntel, Inc. | | | 131,690 | | | | 7,786 | |
*TeleTech Holdings, Inc. | | | 726,680 | | | | 15,318 | |
*Ultimate Software Group, Inc. | | | 127,876 | | | | 6,960 | |
United Online, Inc. | | | 1,183,275 | | | | 7,135 | |
*ValueClick, Inc. | | | 990,110 | | | | 16,436 | |
*Vertro, Inc. | | | 847,343 | | | | 1,907 | |
*Volterra Semiconductor Corporation | | | 498,530 | | | | 12,294 | |
| | | | | | | | |
| | | | | | | 170,877 | |
| | | | | | | | |
Industrials—18.9% | | | | | | | | |
*Cenveo, Inc. | | | 2,371,622 | | | | 15,178 | |
*Clean Harbors, Inc. | | | 81,490 | | | | 8,414 | |
*CoStar Group, Inc. | | | 103,643 | | | | 6,144 | |
*Dolan Media Co. | | | 93,004 | | | | 788 | |
*Franklin Covey Co. | | | 891,660 | | | | 8,631 | |
*GrafTech International, Ltd. | | | 352,760 | | | | 7,150 | |
Healthcare Services Group, Inc. | | | 537,220 | | | | 8,730 | |
*Heritage-Crystal Clean, Inc. | | | 96,032 | | | | 1,842 | |
*Higher One Holdings, Inc. | | | 299,130 | | | | 5,659 | |
*Huron Consulting Group, Inc. | | | 342,663 | | | | 10,352 | |
*ICF International, Inc. | | | 521,296 | | | | 13,230 | |
*Navigant Consulting, Inc. | | | 227,933 | | | | 2,391 | |
*On Assignment, Inc. | | | 1,296,309 | | | | 12,743 | |
*Polypore International, Inc. | | | 124,280 | | | | 8,431 | |
The Corporate Executive Board Co. | | | 133,530 | | | | 5,829 | |
*TransDigm Group, Inc. | | | 133,224 | | | | 12,149 | |
*Trimas Corporation | | | 665,163 | | | | 16,463 | |
| | | | | | | | |
| | | | | | | 144,124 | |
| | | | | | | | |
Health Care—18.5% | | | | | | | | |
*Air Methods Corporation | | | 149,351 | | | | 11,162 | |
*Align Technology, Inc. | | | 337,802 | | | | 7,702 | |
*Brookdale Senior Living, Inc. | | | 567,790 | | | | 13,769 | |
*ExamWorks Group, Inc. | | | 437,994 | | | | 11,121 | |
*Haemonetics Corporation | | | 112,055 | | | | 7,213 | |
*HealthSouth Corporation | | | 431,580 | | | | 11,329 | |
*Integra LifeSciences Holdings Corporation | | | 257,918 | | | | 12,331 | |
*Kensey Nash Corporation | | | 460,668 | | | | 11,623 | |
*Natus Medical, Inc. | | | 363,690 | | | | 5,510 | |
*NxStage Medical, Inc. | | | 431,917 | | | | 8,992 | |
*Quidel Corporation | | | 678,886 | | | | 10,285 | |
*SXC Health Solutions Corporation† | | | 128,540 | | | | 7,574 | |
*Team Health Holdings, Inc. | | | 181,100 | | | | 4,076 | |
*The Providence Service Corporation | | | 490,903 | | | | 6,210 | |
Trinity Biotech plc—ADR | | | 1,290,428 | | | | 12,827 | |
| | | | | | | | |
| | | | | | | 141,724 | |
| | | | | | | | |
| | | | | | | | |
Issuer | | Shares | | | Value | |
| | |
Common Stocks—(continued) | | | | | | | | |
Consumer Discretionary—18.1% | | | | | | | | |
*Amerigon, Inc. | | | 779,240 | | | $ | 13,543 | |
*Career Education Corporation | | | 505,196 | | | | 10,685 | |
DeVry, Inc. | | | 140,761 | | | | 8,323 | |
*Dreams, Inc. | | | 2,811,849 | | | | 7,311 | |
*Genesco, Inc. | | | 139,752 | | | | 7,281 | |
*Grand Canyon Education, Inc. | | | 289,606 | | | | 4,106 | |
Jarden Corporation | | | 320,547 | | | | 11,062 | |
*Kona Grill, Inc. | | | 1,019,792 | | | | 5,731 | |
MDC Partners, Inc. Class “A”† | | | 661,756 | | | | 11,951 | |
*Office Depot, Inc. | | | 2,514,870 | | | | 10,613 | |
*ReachLocal, Inc. | | | 203,304 | | | | 4,235 | |
*Steven Madden, Ltd. | | | 258,255 | | | | 9,687 | |
*U.S. Auto Parts Network, Inc. | | | 1,340,459 | | | | 10,268 | |
*Valassis Communications, Inc. | | | 426,000 | | | | 12,908 | |
*Vitacost.com, Inc. | | | 406,139 | | | | 1,966 | |
*WMS Industries, Inc. | | | 275,480 | | | | 8,463 | |
| | | | | | | | |
| | | | | | | 138,133 | |
| | | | | | | | |
Financials—9.8% | | | | | | | | |
*Cowen Group, Inc. | | | 3,435,800 | | | | 12,919 | |
*Financial Engines, Inc. | | | 265,451 | | | | 6,880 | |
*First Cash Financial Services, Inc. | | | 241,040 | | | | 10,121 | |
*FirstService Corporation† | | | 475,041 | | | | 16,408 | |
*ICG Group, Inc. | | | 1,224,755 | | | | 14,979 | |
*Marlin Business Services Corporation | | | 359,465 | | | | 4,547 | |
*National Financial Partners Corporation | | | 787,246 | | | | 9,085 | |
| | | | | | | | |
| | | | | | | 74,939 | |
| | | | | | | | |
Energy—5.1% | | | | | | | | |
*Dresser-Rand Group, Inc. | | | 107,719 | | | | 5,790 | |
*Dril-Quip, Inc. | | | 56,280 | | | | 3,818 | |
*Goodrich Petroleum Corporation | | | 390,545 | | | | 7,190 | |
*Northern Oil and Gas, Inc. | | | 204,790 | | | | 4,536 | |
*Oasis Petroleum, Inc. | | | 131,770 | | | | 3,911 | |
*Oil States International, Inc. | | | 173,700 | | | | 13,880 | |
| | | | | | | | |
| | | | | | | 39,125 | |
| | | | | | | | |
Materials—3.3% | | | | | | | | |
*Horsehead Holding Corporation | | | 730,430 | | | | 9,730 | |
PolyOne Corporation | | | 379,390 | | | | 5,869 | |
*Stillwater Mining Co. | | | 438,850 | | | | 9,659 | |
| | | | | | | | |
| | | | | | | 25,258 | |
| | | | | | | | |
Total Common Stocks—96.1%
(cost $615,106) | | | | | | | 734,180 | |
| | | | | | | | |
| | |
Exchange-Traded Fund | | | | | | | | |
iShares Russell 2000 Growth Index Fund | | | 239,830 | | | | 22,748 | |
| | | | | | | | |
Total Exchange-Traded Fund—3.0%
(cost $22,478) | | | | 22,748 | |
| | | | | | | | |
| | |
Investment in Warrants | | | | | | | | |
*Motorcar Parts of American, Inc. 2010, $0.00 | | | 111,575 | | | | 1 | |
| | | | | | | | |
Total Warrants—0.0%
(cost $0) | | | | 1 | |
| | | | | | | | |
See accompanying Notes to Financial Statements.
June 30, 2011 | William Blair Funds 19 |
Small Cap Growth Fund
Portfolio of Investments, June 30, 2011 (all dollar amounts in thousands) (unaudited)
| | | | | | | | |
Issuer | | Principal
Amount | | | Value | |
| | |
Repurchase Agreement | | | | | | | | |
Fixed Income Clearing Corporation, 0.010% dated 6/30/11, due 7/1/11, repurchase price $5,126, collateralized by FHLMC, 2.000%, due 12/3/15 | | $ | 5,126 | | | | 5,126 | |
| | | | | | | | |
Total Repurchase Agreement—0.7%
(cost $5,126) | | | | 5,126 | |
| | | | | | | | |
Total Investments—99.8%
(cost $642,710) | | | | 762,055 | |
Cash and other assets, less liabilities—0.2% | | | | 1,422 | |
| | | | | | | | |
Net assets—100.0% | | | $ | 763,477 | |
| | | | | | | | |
ADR = American Depository Receipt
* Non-income producing securities
† = U.S. listed foreign security
If the Fund’s portfolio holdings represent ownership of 5% or more of the voting securities of a company, the company is deemed to be an affiliate as defined in the Investment Company Act of 1940. The Small Cap Growth Fund had the following transactions during the period ended June 30, 2011 with companies deemed affiliated during the period or at June 30, 2011.
| | | | | | | | | | | | | | | | | | | | | | | | |
| | | Share Activity | | | Period Ended
June 30, 2011 | |
| | | | | | | | | | | | | | | (in thousands) | |
Security Name | | Balance
12/31/2010 | | | Purchases | | | Sales | | | Balance
6/30/2011 | | | Value | | | Dividends
Included
in Income | |
pDreams, Inc. | | | 3,285,457 | | | | 126,038 | | | | 599,646 | | | | 2,811,849 | | | $ | 7,311 | | | $ | — | |
Duckwall-ALCO Stores, Inc. | | | 429,693 | | | | — | | | | 429,693 | | | | — | | | | — | | | | — | |
pFranklin Covey, Co | | | 758,841 | | | | 132,819 | | | | — | | | | 891,660 | | | | 8,631 | | | | — | |
Gaiam, Inc. Class “A” | | | 1,050,272 | | | | — | | | | 1,050,272 | | | | — | | | | — | | | | — | |
pInuvo, Inc. | | | 861,747 | | | | — | | | | — | | | | 861,747 | | | | 1,810 | | | | — | |
pKensey Nash Corporation | | | 424,466 | | | | 55,292 | | | | 19,090 | | | | 460,668 | | | | 11,623 | | | | — | |
pKona Grill, Inc. | | | 1,019,792 | | | | — | | | | — | | | | 1,019,792 | | | | 5,731 | | | | — | |
Marlin Business Services Corporation | | | 718,870 | | | | — | | | | 359,405 | | | | 359,465 | | | | 4,547 | | | | — | |
On Assignment Inc | | | 2,248,382 | | | | 61,860 | | | | 1,013,933 | | | | 1,296,309 | | | | 12,743 | | | | — | |
Princeton Review, Inc. | | | 3,519,896 | | | | — | | | | 3,519,896 | | | | — | | | | — | | | | — | |
pTrinity Biotech plc | | | 1,903,563 | | | | — | | | | 613,135 | | | | 1,290,428 | | | | 12,827 | | | | 144 | |
United Western Bancorp, Inc. | | | 2,290,015 | | | | — | | | | 2,290,015 | | | | — | | | | — | | | | — | |
U.S. Autoparts Network, Inc. | | | 1,448,391 | | | | 170,447 | | | | 278,379 | | | | 1,340,459 | | | | 10,268 | | | | — | |
pVertro, Inc. | | | 847,343 | | | | — | | | | — | | | | 847,343 | | | | 1,907 | | | | — | |
| | | | | | | | | | | | | | | | | | | | | | | | |
| | | | | | | | | | | | | | | | | | $ | 77,398 | | | $ | 144 | |
| | | | | | | | | | | | | | | | | | | | | | | | |
p Affiliated company at June 30, 2011. The Small Cap Growth Fund’s total value in companies deemed to be affiliated at June 30, 2011 was $49,840 (thousands).
See accompanying Notes to Financial Statements.
20 Semi-Annual Report | June 30, 2011 |

Robert C. Lanphier, IV

David P. Ricci
MID CAP GROWTH FUND
The Mid Cap Growth Fund seeks long-term capital appreciation.
AN OVERVIEW FROM THE PORTFOLIO MANAGERS
The Mid Cap Growth Fund posted a 12.00% increase (Class N Shares) for the six months ended June 30, 2011. By comparison, the Fund’s benchmark, the Russell Midcap® Growth Index, gained 9.59%.
After a near-uninterrupted rally since last August, US equities stumbled during May and June. Mid cap growth stocks, as measured by the Russell Midcap® Growth Index, corrected nearly 8% during that period, but rallied in late-June to close the quarter near breakeven and to remain solidly in positive territory for the year-to-date period. The Fund outperformed its Russell Midcap® Growth benchmark during the second quarter and for the first half of the year.
The first four months of 2011 witnessed a continuation of the upward trend in the stock prices, primarily driven by solid corporate fundamentals and reasonable stock valuations. But 2011 to date has mirrored 2010: a strong start to the year followed by a mid-year correction primarily due to sluggish economic data and European sovereign debt woes. Specifically, the most recent correction came on the heels of slowing GDP growth, heightened Greek sovereign debt concerns, sluggish jobs data in the U.S., a potential Chinese housing market downturn, the US government debt ceiling negotiations, uncertainty around the end of the Federal Reserve’s quantitative easing (QE2) and a US housing market that remains on life support. While the negatives are plentiful, the market’s ability to remain relatively flat in the second quarter and up over 9% for the year is telling. Investors continue to focus on healthy corporate profitability and on an economy that is slowly recovering, albeit in fits and starts.
From a style perspective during the first half of the year, the mid cap growth market was characterized by higher quality and lower beta stocks outperforming, primarily driven by the second quarter market environment. Lower market cap stocks also outperformed, stemming from their strong outperformance during the first quarter. From a sector perspective, some of the more defensive sectors outperformed during the second quarter and the year-to-date period. Consumer Staples (+22.79%) and Health Care (+15.15%) were the two strongest sectors during the first half of the year. Consumer Discretionary also performed well, (+13.55%). After Energy’s second quarter correction (–9.81%) on falling crude oil prices, the sector returned 5.15% for the first half of the year. Information Technology and Industrials, two of the largest sectors in the Russell Midcap® Growth Index, underperformed given their 5.50% and 5.15% returns for the half-year period, respectively.
The Fund’s outperformance during the first half of the year was primarily attributable to solid stock selection. The Fund’s bias toward smaller market cap stocks relative to the Russell Midcap Growth® Index and our typical lower beta, especially in the second quarter, modestly helped relative performance as well. Green Mountain Coffee Roasters, Inc. within Consumer Staples was the leading contributor to return over the six month period, but solid picks in Health Care (e.g., American Medical Systems Holdings, Inc.), Industrials (e.g., Transdigm Group, Inc.) and Information Technology (e.g., Atheros Communications, Inc.) contributed positively as well. The main areas of weakness were in Consumer Discretionary (e.g., WMS Industries) and Financials (e.g., Greenhill & Co., Inc).
For the second quarter specifically, the Fund’s outperformance was driven by stock selection and our typical bias to lower beta stocks. Consumer Staples stock selection, namely Green Mountain Coffee Roasters, Inc., was the largest contributor to relative performance during the quarter. Fastenal Co. within Industrials and Ecolab, Inc. within Materials were also positive contributors. Holding back relative performance was stock selection in Consumer Discretionary (e.g., Dick’s Sporting Goods, Inc.) and Financials (e.g., Invesco, Ltd.).
June 30, 2011 | William Blair Funds 21 |
The second quarter correction has kept the broad equity market valuation in check while corporate fundamentals continue to improve. Because of this and despite the obvious macroeconomic and geopolitical headwinds, we believe the market remains relatively balanced. We believe investors will continue to differentiate between true growth businesses and those that benefitted primarily from the initial economic recovery. It appears investors are making this distinction as stock correlations have fallen from the elevated levels seen over the past few years. This should bode well for our style of investing and for active management generally. In the end, while we factor various economic scenarios into our stock picking, we focus our time on constructing the portfolio from a bottom-up perspective. We continue to find good ideas across sectors, and are confident the Fund consists of well-managed companies with solid competitive positions whose stocks are at attractive valuations compared to the growth and consistency of their business.
22 Semi-Annual Report | June 30, 2011 |
Mid Cap Growth Fund
Performance Highlights (unaudited)
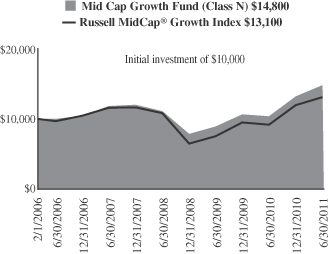
Average Annual Total Return at 6/30/2011
| | | | | | | | | | | | | | | | | | | | |
| | | Year
To Date | | | 1
Year | | | 3
Year | | | 5
Year | | | Since
Inception(a) | |
Class N | | | 12.00 | % | | | 42.57 | % | | | 10.06 | % | | | 8.20 | % | | | 7.50 | % |
Class I | | | 12.07 | | | | 42.81 | | | | 10.33 | | | | 8.50 | | | | 7.79 | |
Russell MidCap® Growth Index | | | 9.59 | | | | 43.25 | | | | 6.58 | | | | 6.28 | | | | 5.11 | |
| | (a) | | For the period from February 1, 2006 (Commencement of Operations) to June 30, 2011. |
Performance cited represents past performance. Past performance does not guarantee future results and current performance may be lower or higher than the data quoted. Results shown are average annual total returns, which assume reinvestment of dividends and capital gains. Investment returns and principal will fluctuate and you may have a gain or loss when you sell shares. For the most current month-end performance information, please call 1-800-742-7272, or visit our Web site at www.williamblairfunds.com. Investing in medium capitalization companies involves special risks, including higher volatility and lower liquidity. Medium Capitalization stocks are also more sensitive to purchase/sale transactions and changes in the issuer’s financial condition. From time to time, the investment advisor may waive fees or reimburse expenses for the Fund. Without these waivers, performance would be lower. Class N shares are available to the general public without a sales load. Class I shares are available to certain institutional investors and advisory clients of William Blair & Company, L.L.C., without a sales load or distribution (12b-1) or service fees.
The performance highlights and graph presented above do not reflect the deduction of taxes that a shareholder would pay on fund distributions or the redemption of fund shares.
The Russell MidCap® Growth Index is an index that is constructed to provide a comprehensive and unbiased barometer of the mid-cap growth market.
This report identifies the Fund’s investments on June 30, 2011. These holdings are subject to change. Not all stocks in the Fund performed the same, nor is there any guarantee that these stocks will perform as well in the future. Market forecasts provided in this report may not necessarily come to pass.
Sector Diversification (unaudited)
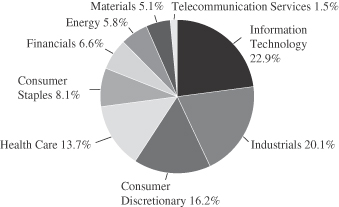
The sector diversification shown is based on the total long-term securities.
June 30, 2011 | William Blair Funds 23 |
Mid Cap Growth Fund
Portfolio of Investments, June 30, 2011 (all dollar amounts in thousands) (unaudited)
| | | | | | | | |
Issuer | | Shares | | | Value | |
| | |
Common Stocks | | | | | | | | |
Information Technology—22.3% | | | | | | | | |
Amphenol Corporation Class “A” | | | 35,100 | | | $ | 1,895 | |
*Cavium, Inc. | | | 69,400 | | | | 3,025 | |
*Citrix Systems, Inc. | | | 28,500 | | | | 2,280 | |
*Concur Technologies, Inc. | | | 29,030 | | | | 1,453 | |
*Dolby Laboratories, Inc. Class “A” | | | 30,370 | | | | 1,289 | |
FLIR Systems, Inc. | | | 79,400 | | | | 2,677 | |
*Genpact, Ltd.† | | | 176,288 | | | | 3,039 | |
*Informatica Corporation | | | 29,400 | | | | 1,718 | |
*Silicon Laboratories, Inc. | | | 81,110 | | | | 3,347 | |
Solera Holdings, Inc. | | | 54,692 | | | | 3,236 | |
TE Connectivity, Ltd.† | | | 56,000 | | | | 2,059 | |
*Trimble Navigation, Ltd. | | | 89,000 | | | | 3,528 | |
VeriSign, Inc. | | | 76,000 | | | | 2,543 | |
| | | | | | | | |
| | | | | | | 32,089 | |
| | | | | | | | |
Industrials—19.5% | | | | | | | | |
CH Robinson Worldwide, Inc. | | | 21,500 | | | | 1,695 | |
Dover Corporation | | | 26,700 | | | | 1,810 | |
Expeditors International of Washington, Inc. | | | 31,700 | | | | 1,623 | |
Fastenal Co. | | | 131,050 | | | | 4,717 | |
Gardner Denver, Inc. | | | 28,900 | | | | 2,429 | |
*Jacobs Engineering Group, Inc. | | | 39,900 | | | | 1,726 | |
Manpower, Inc. | | | 34,090 | | | | 1,829 | |
*MSC Industrial Direct Co. Class “A” | | | 31,200 | | | | 2,069 | |
*Polypore International, Inc. | | | 11,200 | | | | 760 | |
Ritchie Bros. Auctioneers, Inc.† | | | 24,165 | | | | 664 | |
Rockwell Automation, Inc. | | | 43,100 | | | | 3,739 | |
*Stericycle, Inc. | | | 16,330 | | | | 1,455 | |
*TransDigm Group, Inc. | | | 39,450 | | | | 3,597 | |
| | | | | | | | |
| | | | | | | 28,113 | |
| | | | | | | | |
Consumer Discretionary—15.8% | | | | | | | | |
*Bed Bath & Beyond, Inc. | | | 39,660 | | | | 2,315 | |
*CarMax, Inc. | | | 158,670 | | | | 5,247 | |
*Chipotle Mexican Grill, Inc. | | | 2,750 | | | | 847 | |
DeVry, Inc. | | | 38,510 | | | | 2,277 | |
*Dick’s Sporting Goods, Inc. | | | 72,629 | | | | 2,793 | |
Gentex Corporation | | | 101,080 | | | | 3,056 | |
Harman International Industries, Inc. | | | 27,706 | | | | 1,262 | |
*O’Reilly Automotive, Inc. | | | 57,380 | | | | 3,759 | |
Scripps Networks Interactive, Inc. Class “A” | | | 24,200 | | | | 1,183 | |
| | | | | | | | |
| | | | | | | 22,739 | |
| | | | | | | | |
Health Care—13.3% | | | | | | | | |
*CareFusion Corporation | | | 55,239 | | | | 1,501 | |
*Cerner Corporation | | | 49,400 | | | | 3,019 | |
*DaVita, Inc. | | | 24,300 | | | | 2,105 | |
*HMS Holdings Corporation | | | 38,800 | | | | 2,982 | |
*IDEXX Laboratories, Inc. | | | 38,172 | | | | 2,961 | |
*Illumina, Inc. | | | 39,020 | | | | 2,932 | |
Perrigo Co. | | | 26,300 | | | | 2,311 | |
*Non-income producing securities
† = U.S. listed foreign security
| | | | | | | | |
Issuer | | Shares or
Principal
Amount | | | Value | |
| | |
Common Stocks—(continued) | | | | | | | | |
Health Care—(continued) | | | | | | | | |
*ResMed, Inc. | | | 44,000 | | | $ | 1,362 | |
| | | | | | | | |
| | | | | | | 19,173 | |
| | | | | | | | |
Consumer Staples—7.9% | | | | | | | | |
Church & Dwight Co., Inc. | | | 33,600 | | | | 1,362 | |
*Green Mountain Coffee Roasters, Inc. | | | 64,746 | | | | 5,779 | |
McCormick & Co., Inc. | | | 41,800 | | | | 2,072 | |
Mead Johnson Nutrition Co. | | | 31,900 | | | | 2,155 | |
| | | | | | | | |
| | | | | | | 11,368 | |
| | | | | | | | |
Financials—6.4% | | | | | | | | |
*Affiliated Managers Group, Inc. | | | 19,175 | | | | 1,945 | |
*IntercontinentalExchange, Inc. | | | 15,750 | | | | 1,964 | |
Invesco, Ltd.† | | | 93,300 | | | | 2,183 | |
*LPL Investment Holdings, Inc. | | | 40,800 | | | | 1,396 | |
TD Ameritrade Holding Corporation | | | 92,300 | | | | 1,801 | |
| | | | | | | | |
| | | | | | | 9,289 | |
| | | | | | | | |
Energy—5.7% | | | | | | | | |
*Cameron International Corporation | | | 32,500 | | | | 1,635 | |
*Denbury Resources, Inc. | | | 98,770 | | | | 1,975 | |
*Newfield Exploration Co. | | | 32,230 | | | | 2,192 | |
Range Resources Corporation | | | 23,000 | | | | 1,277 | |
*Southwestern Energy Co. | | | 25,470 | | | | 1,092 | |
| | | | | | | | |
| | | | | | | 8,171 | |
| | | | | | | | |
Materials—5.0% | | | | | | | | |
Airgas, Inc. | | | 48,000 | | | | 3,362 | |
Ecolab, Inc. | | | 67,000 | | | | 3,777 | |
| | | | | | | | |
| | | | | | | 7,139 | |
| | | | | | | | |
Telecommunication Services—1.5% | | | | | | | | |
*SBA Communications Corporation Class “A” | | | 56,400 | | | | 2,154 | |
| | | | | | | | |
Total Common Stocks—97.4%
(cost $111,102) | | | | 140,235 | |
| | | | | | | | |
| | |
Repurchase Agreement | | | | | | | | |
Fixed Income Clearing Corporation, 0.010% dated 6/30/11, due 07/01/2011, repurchase price $3,499, collateralized by FHLMC, 2.000%, due 12/3/15 | | $ | 3,499 | | | | 3,499 | |
| | | | | | | | |
Total Repurchase Agreement—2.4%
(cost $3,499) | | | | 3,499 | |
| | | | | | | | |
Total Investments—99.8%
(cost $114,601) | | | | 143,734 | |
Cash and other assets, less liabilities—0.2% | | | | 300 | |
| | | | | | | | |
Net assets—100.0% | | | $ | 144,034 | |
| | | | | | | | |
See accompanying Notes to Financial Statements.
24 Semi-Annual Report | June 30, 2011 |
Karl W. Brewer
Robert C. Lanphier, IV

Matthew A. Litfin
SMALL-MID CAP GROWTH FUND
The Small-Mid Cap Growth Fund seeks long-term capital appreciation.
AN OVERVIEW FROM THE PORTFOLIO MANAGERS
The Small-Mid Cap Growth Fund posted an 11.53% gain (Class N Shares) for the six months ended June 30, 2011. By comparison, the Fund’s benchmark, the Russell 2500™ Growth Index, increased 10.25% for the same period.
After a near-uninterrupted rally since last August, U.S. equities stumbled during May and June. Small and mid cap growth stocks, as measured by the Russell 2500™ Growth Index, corrected over 9% during that period, but rallied in late-June to close the quarter near breakeven and to remain solidly in positive territory for the year-to-date period. The Fund outperformed its Russell 2500™ Growth benchmark during the second quarter and for the first half of the year.
The first four months of 2011 witnessed a continuation of the upward trend in stock prices. This was primarily driven by solid corporate fundamentals and reasonable stock valuations. But 2011 to date has mirrored 2010: a strong start to the year followed by a mid-year correction primarily due to disappointing economic data and European sovereign debt woes. Specifically, the most recent correction came on the heels of heightened Greek sovereign debt concerns, sluggish jobs data in the U.S., a potential Chinese housing market downturn, the U.S. government debt ceiling negotiations, uncertainty around the end of the Federal Reserve’s quantitative easing (QE2) and a U.S. housing market that remains on life support. While the negatives are plentiful, the market’s ability to remain relatively flat in the second quarter and up over 10% for the year is telling. Investors continue to focus on healthy corporate fundamentals and on an economy that is slowly recovering, albeit in fits and starts.
From a style perspective during the first half of the year, the small-mid cap growth market was characterized by higher quality and lower beta stocks outperforming, primarily driven by the second quarter market environment. From a sector perspective, there was little disparity in performance during the first half of the year. Most sectors returned 8-10% during the period including Information Technology, Health Care, Materials and Energy. Consumer Discretionary narrowly outperformed (+11.98 %) while Industrials (+6.75%) and Financials (+4.87%) modestly underperformed.
The Fund’s outperformance during the first six months of 2011 was primarily driven by strong stock selection. Relative performance was also helped on the margin by the Fund’s bias to higher quality, higher growth and larger market cap stocks. Consumer Staples (Green Mountain Coffee Roasters, Inc.), Materials (Celanese Corporation) and Health Care (Perrigo Co. and SXC Health Solutions Corporation) were the biggest contributors to positive stock selection. On the other hand, Consumer Discretionary (Urban Outfitters, Inc.) which the Fund sold during the period, and Information Technology (QuinStreet, Inc.) stock selection detracted from relative performance.
For the second quarter specifically, the Fund’s outperformance is attributable to positive stock selection and our biases to higher quality and lower beta stocks. Stock selection in Industrials (TriMas Corporation and ICF International, Inc.) and Materials (Celanese Corporation) were the largest positive contributors, while certain stocks in Financials (First Horizon National Corporation) and Health Care (Brookdale Senior Living, Inc.) offset some of the outperformance. The Fund sold its position in First Horizon during the period.
The second quarter correction has kept the broad equity market valuation in check while corporate fundamentals continue to improve. Because of this and despite the macroeconomic
June 30, 2011 | William Blair Funds 25 |
and geopolitical headwinds, we believe the market remains relatively balanced looking forward. We believe investors will continue to differentiate between true growth businesses and those that benefitted primarily from the initial economic recovery. Investors already may be making this distinction as stock correlations have fallen from the elevated levels seen over the past few years. This should bode well for our style of investing and for active management generally. In the end, while we factor various economic scenarios into our stock picking, we focus our time on constructing the portfolio from a bottom-up perspective. We continue to find good ideas across sectors, and are confident the Fund consists of great companies with solid competitive positions whose stocks are at attractive valuations compared to the growth and consistency of their business.
26 Semi-Annual Report | June 30, 2011 |
Small-Mid Cap Growth Fund
Performance Highlights (unaudited)
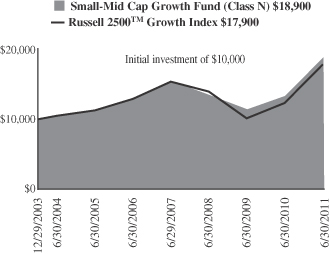
Average Annual Total Return at 6/30/2011
| | | | | | | | | | | | | | | | | | | | |
| | | Year
To Date | | | 1
Year | | | 3
Year | | | 5
Year | | | Since
Inception(a) | |
Class N | | | 11.53 | % | | | 41.25 | % | | | 11.84 | % | | | 7.53 | % | | | 8.83 | % |
Class I | | | 11.72 | | | | 41.62 | | | | 12.17 | | | | 7.83 | | | | 9.11 | |
Russell 2500™ Growth Index | | | 10.25 | | | | 44.71 | | | | 8.51 | | | | 6.67 | | | | 8.01 | |
| | (a) | | For the period from December 29, 2003 (Commencement of Operations) to June 30, 2011. | |
Performance cited represents past performance. Past performance does not guarantee future results and current performance may be lower or higher than the data quoted. Results shown are average annual total returns, which assume reinvestment of dividends and capital gains. Investment returns and principal will fluctuate and you may have a gain or loss when you sell shares. For the most current month-end performance information, please call 1-800-742-7272, or visit our Web site at www.williamblairfunds.com. Investing in smaller and medium capitalization companies involves special risks, including higher volatility and lower liquidity. Smaller and medium capitalization stocks are also more sensitive to purchase/sale transactions and changes in the issuer’s financial condition. From time to time, the investment advisor may waive fees or reimburse expenses for the Fund. Without these waivers, performance would be lower. Class N shares are available to the general public without a sales load. Class I shares are available to certain institutional investors and advisory clients of William Blair & Company, L.L.C., without a sales load or distribution (12b-1) or service fees.
The performance highlights and graph presented above do not reflect the deduction of taxes that a shareholder would pay on fund distributions or the redemption of fund shares.
The Russell 2500™ Growth Index measures the performance of those Russell 2500 companies with above average price-to-book ratios and forecasted growth rates.
This report identifies the Fund’s investments on June 30, 2011. These holdings are subject to change. Not all stocks in the Fund performed the same, nor is there any guarantee that these stocks will perform as well in the future. Market forecasts provided in this report may not necessarily come to pass.
Sector Diversification (unaudited)
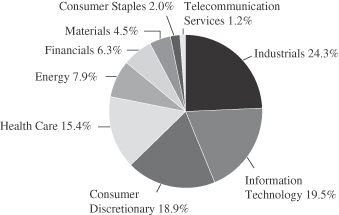
The sector diversification shown is based on the total long-term securities.
June 30, 2011 | William Blair Funds 27 |
Small-Mid Cap Growth Fund
Portfolio of Investments, June 30, 2011 (all dollar amounts in thousands) (unaudited)
| | | | | | | | |
Issuer | | Shares | | | Value | |
| | |
Common Stocks | | | | | | | | |
Industrials—24.1% | | | | | | | | |
*Allegiant Travel Co. | | | 48,865 | | | $ | 2,419 | |
*BE Aerospace, Inc. | | | 90,953 | | | | 3,712 | |
*Corrections Corporation of America | | | 113,455 | | | | 2,456 | |
*CoStar Group, Inc. | | | 60,058 | | | | 3,560 | |
Fastenal Co. | | | 141,670 | | | | 5,099 | |
*GrafTech International, Ltd. | | | 235,906 | | | | 4,782 | |
Healthcare Services Group, Inc. | | | 144,400 | | | | 2,346 | |
*Huron Consulting Group, Inc. | | | 112,600 | | | | 3,402 | |
*ICF International, Inc. | | | 124,269 | | | | 3,154 | |
*Korn/Ferry International | | | 162,500 | | | | 3,573 | |
Manpower, Inc. | | | 64,950 | | | | 3,484 | |
Ritchie Bros. Auctioneers, Inc.† | | | 125,600 | | | | 3,453 | |
Robert Half International, Inc. | | | 140,095 | | | | 3,787 | |
Roper Industries, Inc. | | | 50,300 | | | | 4,190 | |
*Stericycle, Inc. | | | 54,070 | | | | 4,819 | |
The Corporate Executive Board Co. | | | 65,877 | | | | 2,875 | |
*TransDigm Group, Inc. | | | 26,008 | | | | 2,372 | |
*Trimas Corporation | | | 179,788 | | | | 4,450 | |
| | | | | | | | |
| | | | | | | 63,933 | |
| | | | | | | | |
Information Technology—19.3% | | | | | | | | |
*Aruba Networks, Inc. | | | 92,000 | | | | 2,718 | |
Blackbaud, Inc. | | | 59,798 | | | | 1,658 | |
*Booz Allen Hamilton Holding Corporation | | | 220,865 | | | | 4,221 | |
*Cavium, Inc. | | | 85,373 | | | | 3,721 | |
*Concur Technologies, Inc. | | | 42,800 | | | | 2,143 | |
*Informatica Corporation | | | 63,300 | | | | 3,699 | |
*j2 Global Communications, Inc. | | | 65,575 | | | | 1,851 | |
*MICROS Systems, Inc. | | | 59,100 | | | | 2,938 | |
Molex, Inc. | | | 100,928 | | | | 2,601 | |
NIC, Inc. | | | 219,600 | | | | 2,956 | |
*Polycom, Inc. | | | 48,700 | | | | 3,131 | |
*RealPage, Inc. | | | 116,200 | | | | 3,076 | |
*RightNow Technologies, Inc. | | | 127,313 | | | | 4,125 | |
*Silicon Laboratories, Inc. | | | 84,160 | | | | 3,472 | |
*Trimble Navigation, Ltd. | | | 83,800 | | | | 3,322 | |
*Ultimate Software Group, Inc. | | | 36,225 | | | | 1,972 | |
*VistaPrint N.V.† | | | 73,157 | | | | 3,500 | |
| | | | | | | | |
| | | | | | | 51,104 | |
| | | | | | | | |
Consumer Discretionary—18.7% | | | | | | | | |
*CarMax, Inc. | | | 90,900 | | | | 3,006 | |
DeVry, Inc. | | | 55,097 | | | | 3,258 | |
*Dick’s Sporting Goods, Inc. | | | 94,890 | | | | 3,649 | |
*Education Management Corporation | | | 137,055 | | | | 3,281 | |
Gentex Corporation | | | 120,300 | | | | 3,637 | |
Jarden Corporation | | | 119,700 | | | | 4,131 | |
*K12, Inc. | | | 109,850 | | | | 3,640 | |
*Life Time Fitness, Inc. | | | 69,400 | | | | 2,770 | |
*O’Reilly Automotive, Inc. | | | 65,150 | | | | 4,268 | |
*Steiner Leisure, Ltd.† | | | 19,976 | | | | 913 | |
Strayer Education, Inc. | | | 26,500 | | | | 3,349 | |
*Tempur-Pedic International, Inc. | | | 40,600 | | | | 2,753 | |
Tractor Supply Co. | | | 52,900 | | | | 3,538 | |
*Under Armour, Inc. Class “A” | | | 53,060 | | | | 4,102 | |
*Urban Outfitters, Inc. | | | 116,800 | | | | 3,288 | |
| | | | | | | | |
| | | | | | | 49,583 | |
| | | | | | | | |
* Non-income producing securities
† = U.S. listed foreign security
| | | | | | | | |
Issuer | | Shares or
Principal
Amount | | | Value | |
| | |
Common Stocks—(continued) | | | | | | | | |
Health Care—15.3% | | | | | | | | |
*athenahealth, Inc. | | | 63,240 | | | $ | 2,599 | |
*Brookdale Senior Living, Inc. | | | 140,576 | | | | 3,409 | |
*Cerner Corporation | | | 62,400 | | | | 3,813 | |
*Covance, Inc. | | | 60,600 | | | | 3,598 | |
*HealthSouth Corporation | | | 139,900 | | | | 3,672 | |
*HMS Holdings Corporation | | | 44,600 | | | | 3,429 | |
*Hologic, Inc. | | | 200,100 | | | | 4,036 | |
*IDEXX Laboratories, Inc. | | | 33,505 | | | | 2,599 | |
*Illumina, Inc. | | | 57,100 | | | | 4,291 | |
Perrigo Co. | | | 49,400 | | | | 4,341 | |
*SXC Health Solutions Corporation† | | | 80,297 | | | | 4,731 | |
| | | | | | | | |
| | | | | | | 40,518 | |
| | | | | | | | |
Energy—7.9% | | | | | | | | |
Cabot Oil & Gas Corporation | | | 44,500 | | | | 2,951 | |
Core Laboratories N.V.† | | | 27,500 | | | | 3,067 | |
*Dresser-Rand Group, Inc. | | | 53,100 | | | | 2,854 | |
*KiOR, Inc. Class “A” | | | 138,899 | | | | 2,104 | |
Oceaneering International, Inc. | | | 75,200 | | | | 3,046 | |
*Oil States International, Inc. | | | 48,700 | | | | 3,892 | |
*Petrohawk Energy Corporation | | | 121,300 | | | | 2,992 | |
| | | | | | | | |
| | | | | | | 20,906 | |
| | | | | | | | |
Financials—6.3% | | | | | | | | |
*Affiliated Managers Group, Inc. | | | 46,130 | | | | 4,680 | |
*Financial Engines, Inc. | | | 130,908 | | | | 3,393 | |
*FirstService Corporation† | | | 81,075 | | | | 2,800 | |
Invesco, Ltd.† | | | 92,200 | | | | 2,158 | |
Jones Lang LaSalle, Inc. | | | 38,000 | | | | 3,583 | |
| | | | | | | | |
| | | | | | | 16,614 | |
| | | | | | | | |
Materials—4.4% | | | | | | | | |
Airgas, Inc. | | | 40,000 | | | | 2,801 | |
Celanese Corporation | | | 87,200 | | | | 4,649 | |
*Rockwood Holdings, Inc. | | | 78,800 | | | | 4,357 | |
| | | | | | | | |
| | | | | | | 11,807 | |
| | | | | | | | |
Consumer Staples—2.0% | | | | | | | | |
*Green Mountain Coffee Roasters, Inc. | | | 58,526 | | | | 5,224 | |
| | | | | | | | |
Telecommunication Services—1.2% | | | | | | | | |
*SBA Communications Corporation Class “A” | | | 80,800 | | | | 3,086 | |
| | | | | | | | |
Total Common Stocks—99.2%
(cost $208,256) | | | | | | | 262,775 | |
| | | | | | | | |
| | |
Repurchase Agreement | | | | | | | | |
Fixed Income Clearing Corporation, 0.010% dated 6/30/11, due 7/1/11, repurchase price $2,120, collateralized by FHLMC, 2.000%, due 12/3/15 | | $ | 2,120 | | | | 2,120 | |
| | | | | | | | |
Total Repurchase Agreement—0.8%
(cost $2,120) | | | | 2,120 | |
| | | | | | | | |
Total Investments—100.0%
(cost $210,376) | | | | 264,895 | |
Cash and other assets, less liabilities—0.0% | | | | 18 | |
| | | | | | | | |
Net assets—100.0% | | | $ | 264,913 | |
| | | | | | | | |
See accompanying Notes to Financial Statements.
28 Semi-Annual Report | June 30, 2011 |
GLOBAL MARKETS OVERVIEW
Summary
Despite rallying earlier in the second quarter, the global market fell in June on concerns about the sustainability of the recovery as many developed economies hit a “soft patch.” This growth slowdown was exacerbated by supply chain disruptions and reduced growth expectations following the Japanese earthquake and tsunami, resurfacing European sovereign debt concerns, U.S. debt ceiling worries, and continued inflationary pressures in emerging markets. As a result, the global equity market was virtually flat during the second quarter, returning 0.13%, with developed markets up 0.33% as measured by the MSCI World IMI (the “World Index”), while emerging markets fell 1.13%.
During the second quarter the World Index return benefited from U.S. dollar weakness versus most developed market currencies, coupled with strength in Europe and the U.K. In particular, Germany and France performed well, benefiting from strong export demand coupled with improved consumer confidence and spending. These positives more than offset market weakness in a number of the peripheral European countries on debt concerns. Canada also underperformed, falling 4.96%, as Energy prices eased. Within emerging markets, Asia outperformed, falling 0.16%, as Indonesia, Korea, and Taiwan rallied, offsetting negative returns in China and India on inflation and growth concerns. Emerging Latin America and Emerging Europe Middle East and Asia each fell over 2% during the quarter, hampered by concerns about rising interest rates and inflationary pressures in Brazil, along with weakness in Turkey and a weakening Russian ruble. Healthcare was the strongest sector globally during the second quarter, up approximately 7%, followed by Consumer Discretionary. Conversely, Energy fell over 5% after prices subsided following spikes earlier in the year.
Year to date the global equity market rose 4.66%, led by Continental Europe and the U.S., which were particularly strong during the first quarter, on reduced European debt concerns and an improving outlook at the outset of 2011. Japan was the worst performing developed market, falling nearly 4%, due largely to concerns arising from the March earthquake. Emerging markets eked out a 0.32% return during the first half, led by approximately 8% and 9% returns in Korea and Russia, respectively, which somewhat offset weakness in India, Turkey, Brazil, and South Africa. Year to date, non-U.S. developed small cap stocks trailed their larger cap counterparts, due to second quarter relative weakness in Canada and Continental Europe. All sectors had positive returns during the first half of 2011, led by strength in Healthcare, which rose over 12%, along with Consumer, Energy, and Telecommunication Services, which were each up approximately 7%. Conversely, Information Technology returned 0.6%, while Financials and Materials each rose just over 1%.
Outlook
Over the last several months, the global investment agenda has been plagued by macroeconomic concerns of perceived threats to global growth and/or financial stability. Specifically, there are increasing concerns regarding the sustainability of Chinese growth, an increased potential for the slowdown to transition to a harder landing, and the implication for asset quality within the Financials sector. We believe that China’s development is the most important input into global economic growth and any slowdown in that economy would have significant effects on sustainable growth in this cycle.
Europe is facing more clear cut challenges regarding public sector fiscal sustainability. This is what the market has been focused on—peripheral European public sector debt and the attendant risks on the Financial system and, by implication, global growth. Despite these fears, core European economies have been relatively strong and corporate performance has been sound. The details surrounding a deal for peripheral European public sector debt will continue to be debated and we expect that these questions will be more elongated than investors would like. The U.S. is facing similar public sector finance issues as Europe, which
June 30, 2011 | William Blair Funds 29 |
will be noisier over the short term, but will likely be resolved more quickly, given a more straightforward set of tradeoffs.
Global growth has been led by emerging markets post the 2008 financial crisis. There are now clear signs of a global growth plateau, as the global growth impulse is not feeding through the economy. As a result, economic growth and earnings growth expectations no longer are increasing, which has been exemplified in negative earnings revisions across regions and sectors. However, macroeconomic concerns have depressed equity valuations globally relative to historic norms and interest rates. The European uncertainly in particular may extend through the third quarter before there is a satisfactory outcome. This will be an opportunity for market appreciation particularly during the latter part of the year.
We believe this framework suggests a market environment favoring high quality companies that can deliver strong performance in a weaker growth environment where there are no longer cyclical tailwinds creating earnings surprises quarterly. The companies that outperform in even a sluggish environment will be rewarded with better valuations. From a short term strategy perspective, the less cyclical regions have outperformed more recently—U.S. and Japan. We believe that if there is a resolution to the European financial crisis and moderating Chinese inflation, these areas could outperform at the expense of the U.S. and Japan.
Long Term Strategy Considerations
In terms of long term strategy, equities remain attractive versus fixed income. The trade towards safe government bonds and money market instruments has led investors to neglect alternative income and growth investment opportunities in favor of fixed value and fixed income opportunities. This has created significant opportunities for equities and other income producing assets, as the prospective return and yield differentials have increased. Secondly, following a cycle that favored small cap companies over larger cap, we believe that we may be at a point where large cap equities are poised to do better, particularly if the financial outlook stabilizes. Our portfolio strategies generally reflect this trend, with a higher allocation than normal to large cap companies at the expense of smaller cap holdings. Finally, we believe there is a favorable outlook for developed markets versus emerging markets over the long term. Emerging markets have outperformed consistently over the last decade or so. As a result, emerging markets are currently at a similar peak in relative performance as they were in 1993, after the late 1980s-early 1990s emerging markets bubble. Clearly, emerging markets are in a significantly different position in the world than in the early 1990s given improved corporate returns and significant growth; however, there are underlying structural risks in emerging markets that continue to this day. Over the long term, these risks will need to be addressed, which may result in underperformance vis-à-vis developed markets over a period of several years.
30 Semi-Annual Report | June 30, 2011 |

W. George Greig

Kenneth J. McAtamney
GLOBAL GROWTH FUND
The Global Growth Fund seeks long-term capital appreciation.
AN OVERVIEW FROM THE PORTFOLIO MANAGERS
The Global Growth Fund posted a 6.19% increase (Class N Shares) for the six months ended June 30, 2011. By comparison, the Fund’s benchmark, the MSCI All Country World IMI Index (net) gained 4.66%.
Year to date outperformance was driven by strong stock selection across most sectors and regions. Particular value added came from the Fund’s focus in auto-related and luxury holdings amidst strong fundamental results, coupled with strong performance in the U.S. Information Technology (IT) stock selection was also a key alpha driver during the period, due to strong results by Japanese social media holdings, coupled with good stock selection in U.S. and Asian tech. Somewhat offsetting these positive effects was Energy stock selection, along with Emerging Europe, Mid-East, Africa and Latin American performance. Energy stock selection was hampered by underperformance in the U.S., as well as a lack of Russian Energy holdings, which outperformed. Turkiye Garanti Bankasi A.S., the leading Turkish bank, was also a drag on results in the first part of the year as its stock price was impaired due to increasing interest rate concerns. We sold the company in the first quarter on a slower growth outlook. Latin America stock selection was hampered by underperformance in Consumer Staples on increased pricing pressure, coupled with weakness in Industrials.
The Global Growth Fund maintained its focus on Consumer Discretionary holdings during the six month period, although the weighting moderated from 22% to 15%. Within Discretionary, the Fund was focused on auto-related holdings and luxury retailers, as well as select specialty retailers, with the most significant exposure in the U.S. Conversely, the Fund’s Financials weighting approximated 16% during the period, below the 21% market weighting on lower developed market bank exposure. Financials weightings were focused on asset management and, to some extent, insurance companies. Industrials approximated 17% during the period, due to higher exposure in machinery/capital equipment and transport names, while the higher IT exposure reflected solid fundamentals due to improved corporate spending, social media gains, and consumer demand for smartphones and tablets. Conversely, the Energy and Materials sectors were underweighted on lower exploration and production and mining exposure. During the period, U.S. holdings increased from approximately 30% of the Fund to near market weight on improving economic and company fundamentals, while emerging markets decreased from 20% to 13% on inflationary and growth concerns and the impact on corporate margins and earnings growth outlook.
June 30, 2011 | William Blair Funds 31 |
Global Growth Fund
Performance Highlights (unaudited)
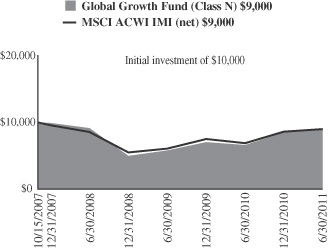
Average Annual Total Return at 6/30/2011
| | | | | | | | | | | | | | | | |
| | | Year
To Date | | | 1
Year | | | 3
Year | | | Since
Inception(a) | |
Class N | | | 6.19 | % | | | 35.77 | % | | | (0.52 | )% | | | (2.86 | )% |
Class I | | | 6.31 | | | | 35.96 | | | | (0.30 | ) | | | (2.59 | ) |
MSCI All Country World IMI (net) | | | 4.66 | | | | 31.00 | | | | 1.74 | | | | (2.81 | ) |
| | (a) | | For the period from October 15, 2007 (Commencement of Operations) to June 30, 2011. |
Performance cited represents past performance. Past performance does not guarantee future results and current performance may be lower or higher than the data quoted. Results shown are average annual total returns, which assume reinvestment of dividends and capital gains. Investment returns and principal will fluctuate and you may have a gain or loss when you sell shares. For the most current month-end performance information, please call 1-800-742-7272, or visit our Web site at www.williamblairfunds.com. Investing in smaller and medium capitalization companies involves special risks, including higher volatility and lower liquidity. Smaller and medium capitalization stocks are also more sensitive to purchase/sale transactions and changes in the issuer’s financial condition. International investing involves special risk considerations, including currency fluctuations, lower liquidity, economic and political risk. From time to time, the investment advisor may waive fees or reimburse expenses for the Fund. Without these waivers, performance would be lower. Class N shares are available to the general public without a sales load. Class I shares are available to certain institutional investors and advisory clients of William Blair & Company, L.L.C., without a sales load or distribution fees (12b-1).
The performance highlights and graph presented above do not reflect the deduction of taxes that a shareholder would pay on fund distributions or the redemption of fund shares.
The Morgan Stanley Capital International (MSCI) All Country World Investable Market Index (IMI) (net) is a free float-adjusted market capitalization weighted index that is designed to measure the equity market of developed and emerging markets. This series approximates the minimum possible dividend reinvestment.
This report identifies the Fund’s investments on June 30, 2011. These holdings are subject to change. Not all stocks in the Fund performed the same, nor is there any guarantee that these stocks will perform as well in the future. Market forecasts provided in this report may not necessarily come to pass.
Sector Diversification (unaudited)
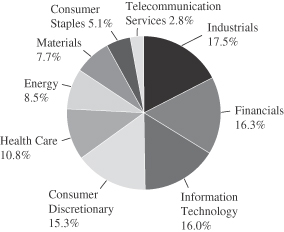
The sector diversification shown is based on the total long-term securities.
32 Semi-Annual Report | June 30, 2011 |
Global Growth Fund
Portfolio of Investments, June 30, 2011 (all dollar amounts in thousands) (unaudited)
| | | | | | | | |
Issuer | | Shares | | | Value | |
| | |
Common Stocks | | | | | | | | |
| | |
Western Hemisphere—44.0% | | | | | | | | |
Canada—2.9% | | | | | | | | |
Brookfield Asset Management, Inc. Class “A” (Real estate management & development)† | | | 19,832 | | | $ | 658 | |
Saputo, Inc. (Food products) | | | 14,974 | | | | 722 | |
| | | | | | | | |
| | | | | | | 1,380 | |
| | | | | | | | |
United States—41.1% | | | | | | | | |
*Affiliated Managers Group, Inc. (Capital markets) | | | 5,027 | | | | 510 | |
American Express Co. (Consumer finance) | | | 16,173 | | | | 836 | |
AMETEK, Inc. (Electrical equipment) | | | 11,017 | | | | 495 | |
*Apple, Inc. (Computers & peripherals) | | | 3,638 | | | | 1,221 | |
*Bed Bath & Beyond, Inc. (Specialty retail) | | | 9,484 | | | | 554 | |
*Cerner Corporation (Health care technology) | | | 9,202 | | | | 562 | |
CH Robinson Worldwide, Inc. (Air freight & logistics) | | | 7,386 | | | | 582 | |
*Citrix Systems, Inc. (Software) | | | 7,778 | | | | 622 | |
*Clean Harbors, Inc. (Commercial services & supplies) | | | 2,354 | | | | 243 | |
CR Bard, Inc. (Health care equipment & supplies) | | | 4,986 | | | | 548 | |
*DaVita, Inc. (Health care providers & services) | | | 7,015 | | | | 608 | |
Exxon Mobil Corporation (Oil, gas & consumable fuels) | | | 11,200 | | | | 911 | |
*Google, Inc. Class “A” (Internet software & services) | | | 1,513 | | | | 766 | |
*Hansen Natural Corporation (Beverages) | | | 8,216 | | | | 665 | |
*IDEXX Laboratories, Inc. (Health care equipment & supplies) | | | 7,105 | | | | 551 | |
International Business Machines Corporation (IT services) | | | 5,085 | | | | 872 | |
*j2 Global Communications, Inc. (Internet software & services) | | | 8,240 | | | | 233 | |
JPMorgan Chase & Co. (Diversified financial services) | | | 19,315 | | | | 791 | |
Marriott International, Inc. Class “A” (Hotels, restaurants & leisure) | | | 17,474 | | | | 620 | |
McCormick & Co., Inc. (Food products) | | | 9,742 | | | | 483 | |
*Newfield Exploration Co. (Oil, gas & consumable fuels) | | | 7,183 | | | | 489 | |
NIKE, Inc. Class “B” (Textiles, apparel & luxury goods) | | | 8,100 | | | | 729 | |
*O’Reilly Automotive, Inc. (Specialty retail) | | | 7,259 | | | | 475 | |
QUALCOMM, Inc. (Communications equipment) | | | 12,847 | | | | 730 | |
Starbucks Corporation (Hotels, restaurants & leisure) | | | 20,859 | | | | 824 | |
*Tempur-Pedic International, Inc. (Household durables) | | | 8,176 | | | | 554 | |
The Walt Disney Co. (Media) | | | 16,713 | | | | 652 | |
*Thermo Fisher Scientific, Inc. (Life sciences tools & services) | | | 11,330 | | | | 730 | |
United Parcel Service, Inc. Class “B” (Air freight & logistics) | | | 10,607 | | | | 774 | |
W.W. Grainger, Inc. (Trading companies & distributors) | | | 3,400 | | | | 522 | |
Yum! Brands, Inc. (Hotels, restaurants & leisure) | | | 13,712 | | | | 757 | |
| | | | | | | | |
| | | | | | | 19,909 | |
| | | | | | | | |
| | | | | | | | |
Issuer | | Shares | | | Value | |
| | |
Europe—17.6% | | | | | | | | |
Belgium—1.2% | | | | | | | | |
Anheuser-Busch InBev N.V. (Beverages) | | | 9,557 | | | $ | 555 | |
| | | | | | | | |
Denmark—3.0% | | | | | | | | |
Coloplast A/S (Health care equipment & supplies) | | | 1,662 | | | | 252 | |
Novo Nordisk A/S (Pharmaceuticals) | | | 6,300 | | | | 791 | |
Novozymes A/S (Chemicals) | | | 2,372 | | | | 386 | |
| | | | | | | | |
| | | | | | | 1,429 | |
| | | | | | | | |
France—1.2% | | | | | | | | |
Essilor International S.A. (Health care equipment & supplies) | | | 7,253 | | | | 588 | |
| | | | | | | | |
Germany—4.4% | | | | | | | | |
Aixtron AG (Semiconductors & semiconductor equipment) | | | 6,288 | | | | 215 | |
BASF SE (Chemicals) | | | 9,788 | | | | 959 | |
SAP AG (Software) | | | 16,070 | | | | 973 | |
| | | | | | | | |
| | | | | | | 2,147 | |
| | | | | | | | |
Italy—2.6% | | | | | | | | |
Saipem SpA (Energy equipment & services) | | | 17,660 | | | | 912 | |
Tod’s SpA (Textiles, apparel & luxury goods) | | | 2,627 | | | | 351 | |
| | | | | | | | |
| | | | | | | 1,263 | |
| | | | | | | | |
Sweden—2.9% | | | | | | | | |
Atlas Copco AB (Machinery) | | | 29,541 | | | | 778 | |
*Hexagon AB (Machinery) | | | 25,757 | | | | 634 | |
| | | | | | | | |
| | | | | | | 1,412 | |
| | | | | | | | |
Switzerland—2.3% | | | | | | | | |
Partners Group Holding AG (Capital markets) | | | 3,147 | | | | 557 | |
*Syngenta AG (Chemicals) | | | 1,701 | | | | 574 | |
| | | | | | | | |
| | | | | | | 1,131 | |
| | | | | | | | |
United Kingdom—13.8% | | | | | | | | |
Abcam plc (Biotechnology) | | | 36,073 | | | | 241 | |
Amlin plc (Insurance) | | | 52,980 | | | | 345 | |
Ashmore Group plc (Capital markets) | | | 67,482 | | | | 432 | |
*Autonomy Corporation plc (Software) | | | 12,123 | | | | 332 | |
Babcock International Group plc (Commercial services & supplies) | | | 27,755 | | | | 317 | |
BG Group plc (Oil, gas & consumable fuels) | | | 32,675 | | | | 742 | |
BHP Billiton plc (Metals & mining) | | | 25,590 | | | | 1,007 | |
Burberry Group plc (Textiles, apparel & luxury goods) | | | 16,375 | | | | 381 | |
Hargreaves Lansdown plc (Capital markets) | | | 28,898 | | | | 282 | |
Michael Page International plc (Professional services) | | | 30,678 | | | | 263 | |
*Rolls-Royce Holdings plc (Aerospace & defense) | | | 67,353 | | | | 697 | |
Standard Chartered plc (Commercial banks) | | | 25,813 | | | | 679 | |
The Weir Group plc (Machinery) | | | 13,357 | | | | 456 | |
Vodafone Group plc (Wireless telecommunication services) | | | 194,397 | | | | 516 | |
| | | | | | | | |
| | | | | | | 6,690 | |
| | | | | | | | |
| | |
Emerging Asia—8.7% | | | | | | | | |
China—4.0% | | | | | | | | |
China Vanke Co., Ltd. (Real estate management & development) | | | 399,900 | | | | 539 | |
See accompanying Notes to Financial Statements.
June 30, 2011 | William Blair Funds 33 |
Global Growth Fund
Portfolio of Investments, June 30, 2011 (all dollar amounts in thousands) (unaudited)
| | | | | | | | |
Issuer | | Shares | | | Value | |
| | |
Common Stocks—(continued) | | | | | | | | |
| | |
Emerging Asia—8.7%—(continued) | | | | | | | | |
China—4.0%—(continued) | | | | | | | | |
CNOOC, Ltd. (Oil, gas & consumable fuels) | | | 207,000 | | | $ | 483 | |
Haitian International Holdings, Ltd. (Machinery) | | | 154,000 | | | | 199 | |
Industrial and Commercial Bank of China, Ltd. Class “H” (Commercial banks) | | | 931,185 | | | | 707 | |
| | | | | | | | |
| | | | | | | 1,928 | |
| | | | | | | | |
Indonesia—1.1% | | | | | | | | |
PT Bank Rakyat Indonesia (Commercial banks) | | | 730,500 | | | | 554 | |
| | | | | | | | |
South Korea—2.4% | | | | | | | | |
Hyundai Motor Co. (Automobiles) | | | 5,205 | | | | 1,155 | |
| | | | | | | | |
Taiwan—1.2% | | | | | | | | |
HTC Corporation (Communications equipment) | | | 17,000 | | | | 572 | |
| | | | | | | | |
Japan—8.4% | | | | | | | | |
Dena Co., Ltd. (Internet & catalog retail) | | | 13,700 | | | | 588 | |
Exedy Corporation (Auto components) | | | 5,900 | | | | 201 | |
Fanuc, Ltd. (Machinery) | | | 5,100 | | | | 848 | |
Gree, Inc. (Internet software & services) | | | 20,000 | | | | 435 | |
Komatsu, Ltd. (Machinery) | | | 15,400 | | | | 478 | |
Makita Corporation (Machinery) | | | 10,000 | | | | 463 | |
Miraca Holdings, Inc. (Health care providers & services) | | | 5,700 | | | | 230 | |
Softbank Corporation (Wireless telecommunication services) | | | 21,200 | | | | 798 | |
| | | | | | | | |
| | | | | | | 4,041 | |
| | | | | | | | |
| | |
Emerging Latin America—3.2% | | | | | | | | |
Brazil—1.1% | | | | | | | | |
BR Malls Participacoes S.A. (Real estate management & development) | | | 45,200 | | | | 517 | |
| | | | | | | | |
Chile—0.7% | | | | | | | | |
Banco Santander Chile—ADR (Commercial banks) | | | 3,445 | | | | 323 | |
| | | | | | | | |
Mexico—1.4% | | | | | | | | |
Grupo Mexico S.A.B. de C.V. Series “B” (Metals & mining) | | | 211,400 | | | | 698 | |
| | | | | | | | |
| | |
Asia—1.1% | | | | | | | | |
Singapore—1.1% | | | | | | | | |
Keppel Corporation, Ltd. (Industrial conglomerates) | | | 60,500 | | | | 546 | |
| | | | | | | | |
|
Emerging Europe, Mid-East, Africa—1.0% | |
South Africa—1.0% | | | | | | | | |
Sasol, Ltd. (Oil, gas & consumable fuels) | | | 9,579 | | | | 504 | |
| | | | | | | | |
Total Common Stocks—97.8%
(cost $38,230) | | | | 47,342 | |
| | | | | | | | |
| | | | | | | | |
Issuer | | Shares or
Principal
Amount | | | Value | |
| | |
Repurchase Agreement | | | | | | | | |
Fixed Income Clearing Corporation, 0.010% dated 6/30/11, due 7/1/11, repurchase price $450, collateralized by FHLMC, 2.000%, due 12/3/15 | | $ | 450 | | | $ | 450 | |
| | | | | | | | |
Total Repurchase Agreement—0.9%
(cost $450) | | | | 450 | |
| | | | | | | | |
Total Investments—98.7%
(cost $38,680) | | | | 47,792 | |
Cash and other assets, less liabilities—1.3% | | | | 643 | |
| | | | | | | | |
Net assets—100.0% | | | $ | 48,435 | |
| | | | | | | | |
*Non-income producing securities
† = U.S. listed foreign security
ADR = American Depository Receipt
For securities primarily traded on exchanges or markets that close before the close of regular trading on the New York Stock Exchange, the Fund may use an independent pricing service to fair value price the securities pursuant to Valuation Procedures approved by the Board of Trustees.
At June 30, 2011, the Fund’s Portfolio of Investments includes the following industry categories:
| | | | |
Industrials | | | 17.5% | |
Financials | | | 16.3% | |
Information Technology | | | 16.0% | |
Consumer Discretionary | | | 15.3% | |
Health Care | | | 10.8% | |
Energy | | | 8.5% | |
Materials | | | 7.7% | |
Consumer Staples | | | 5.1% | |
Telecommunication Services | | | 2.8% | |
| | | | |
Total | | | 100.0% | |
| | | | |
At June 30, 2011, the Fund’s Portfolio of Investments includes the following currency categories:
| | | | |
U.S. Dollar | | | 44.1% | |
British Pound Sterling | | | 14.1% | |
Euro | | | 9.6% | |
Japanese Yen | | | 8.5% | |
Hong Kong Dollar | | | 4.1% | |
Danish Krone | | | 3.0% | |
Swedish Krona | | | 3.0% | |
South Korean Won | | | 2.4% | |
Swiss Franc | | | 2.4% | |
Canadian Dollar | | | 1.5% | |
Mexican Peso | | | 1.5% | |
New Taiwan Dollar | | | 1.2% | |
Indonesian Rupiah | | | 1.2% | |
Singapore Dollar | | | 1.2% | |
Brazilian Real | | | 1.1% | |
South African Rand | | | 1.1% | |
| | | | |
Total | | | 100.0% | |
| | | | |
See accompanying Notes to Financial Statements.
34 Semi-Annual Report | June 30, 2011 |
W. George Greig
INTERNATIONAL GROWTH FUND
The International Growth Fund seeks long-term capital appreciation.
AN OVERVIEW FROM THE PORTFOLIO MANAGER
The International Growth Fund posted a 1.97% increase (Class N Shares) for the six months ended June 30, 2011. By comparison, the Fund’s benchmark, the MSCI All Country World ex-U.S. IMI Index (net), gained 3.52%.
Despite strong results the majority of the year, the Fund underperformed the Index year to date due to weakness in January and February, coupled with the Fund’s currency hedges, as the USD depreciated versus most currencies year to date. Key detractors from return included the Fund’s U.K. Consumer Staples holdings, which underperformed during the first quarter on rising raw materials costs and slower than expected revenue growth. Emerging Latin America also detracted from results on pricing pressure. Energy stock selection was negative due to a focus on services holdings, lack of European and Russian integrated oil exposure, and Latin American stock selection. Financials stock selection detracted from performance during the first two months of the year and, therefore, year to date due to weakness in Singaporean real estate holdings, overweighted Japanese Financials exposure, and residual Egyptian and Turkish bank exposure. Somewhat offsetting these negative relative results were the overweighting and stock selection in Consumer Discretionary, along with Industrials, Information Technology, Materials and Utilities stock selection. Regionally, stock selection was additive in Japan, Europe Ex-U.K., Canada and Emerging Asia, but was offset by weakness in Pacific Ex-Japan, the U.K. and Emerging Europe, Middle-East, and Africa.
Over the six month period the emerging markets weighting was reduced from approximately 25% as of year end to 19% as of June 30, due largely to a decline in Latin America near the beginning of the year on inflationary and growth concerns. Conversely Japanese exposure, which totaled approximately 14.6% as of year end, increased during the first quarter on growth and valuation opportunities, and then after the March earthquake on opportunistic valuation opportunities. Subsequent to first quarter end, we reduced Japanese Financial and Industrials exposure on a valuation recovery, coupled with lower growth expectations as the reconstruction began. From a sector perspective, the Fund maintained its focus in the Discretionary and Industrials sectors as of June 30, albeit at lower weightings than December 31. Within Consumer Discretionary the focus remained on auto-related and luxury holdings, while Industrials positioning was largely the result of capital equipment and machinery names. The Fund remained underweighted in Financials during the period, approximating 20% of the Fund, although European exposure was reduced during the period in favor of emerging Asian financials following a series of interest rate hikes. Energy and Materials exposures remained underweighted during the six month period, due to lower energy exploration and production and mining exposures, and despite a focus on energy services and chemicals. From a capitalization perspective, the Fund was at the lower end of its small capitalization range, as growth expectations and valuations favored larger cap peers.
June 30, 2011 | William Blair Funds 35 |
International Growth Fund
Performance Highlights (unaudited)
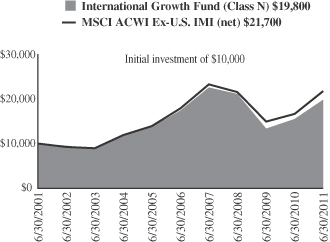
Average Annual Total Return at 6/30/2011
| | | | | | | | | | | | | | | | | | | | |
| | | Year
To Date | | | 1
Year | | | 3
Year | | | 5
Year | | | 10
Year | |
Class N | | | 1.97 | % | | | 27.82 | % | | | (2.04 | )% | | | 2.65 | % | | | 7.06 | % |
Class I | | | 2.10 | | | | 28.14 | | | | (1.76 | ) | | | 2.95 | | | | 7.35 | |
MSCI All Country World Ex-U.S. IMI (net) | | | 3.52 | | | | 30.26 | | | | 0.31 | | | | 3.96 | | | | 8.05 | |
Performance cited represents past performance. Past performance does not guarantee future results and current performance may be lower or higher than the data quoted. Results shown are average annual total returns, which assume reinvestment of dividends and capital gains. Investment returns and principal will fluctuate and you may have a gain or loss when you sell shares. For the most current month-end performance information, please call 1-800-742-7272, or visit our Web site at www.williamblairfunds.com. From time to time, the investment advisor may waive fees or reimburse expenses for the Fund. Without these waivers, performance would be lower. International investing involves special risk considerations, including currency fluctuations, lower liquidity, economic and political risk. Class N shares are available to the general public without a sales load. Class I shares are available to certain institutional investors and advisory clients of William Blair & Company, L.L.C., without a sales load or distribution (12b-1) or service fees.
The performance highlights and graph presented above do not reflect the deduction of taxes that a shareholder would pay on fund distributions or the redemption of fund shares.
The Morgan Stanley Capital International (MSCI) All Country World Ex-U.S. Investable Market Index (IMI) (net) is a free float-adjusted market capitalization weighted index that is designed to measure the equity market performance of developed and emerging markets, excluding the United States. This series approximates the minimum possible dividend reinvestment.
This report identifies the Fund’s investments on June 30, 2011. These holdings are subject to change. Not all stocks in the Fund performed the same, nor is there any guarantee that these stocks will perform as well in the future. Market forecasts provided in this report may not necessarily come to pass.
Sector Diversification (unaudited)

The sector diversification shown is based on the total long-term securities.
36 Semi-Annual Report | June 30, 2011 |
International Growth Fund
Portfolio of Investments, June 30, 2011 (all dollar amounts in thousands) (unaudited)
| | | | | | | | |
Issuer | | Shares | | | Value | |
| | |
Common Stocks | | | | | | | | |
| | |
Europe, Mid-East—30.9% | | | | | | | | |
Austria—0.1% | | | | | | | | |
Schoeller-Bleckmann Oilfield Equipment AG (Energy equipment & services) | | | 78,889 | | | $ | 6,833 | |
| | | | | | | | |
Belgium—1.4% | | | | | | | | |
Anheuser-Busch InBev N.V. (Beverages) | | | 825,930 | | | | 47,909 | |
Colruyt S.A. (Food & staples retailing) | | | 368,611 | | | | 18,442 | |
| | | | | | | | |
| | | | | | | 66,351 | |
| | | | | | | | |
Denmark—1.4% | | | | | | | | |
Coloplast A/S (Health care equipment & supplies) | | | 157,883 | | | | 23,974 | |
Novo Nordisk A/S (Pharmaceuticals) | | | 268,550 | | | | 33,703 | |
SimCorp A/S (Software) | | | 38,510 | | | | 7,599 | |
| | | | | | | | |
| | | | | | | 65,276 | |
| | | | | | | | |
Finland—1.5% | | | | | | | | |
Kone Oyj (Machinery) | | | 473,589 | | | | 29,758 | |
Nokian Renkaat Oyj (Auto components) | | | 381,983 | | | | 19,166 | |
UPM-Kymmene Oyj (Paper & forest products) | | | 1,276,417 | | | | 23,341 | |
| | | | | | | | |
| | | | | | | 72,265 | |
| | | | | | | | |
France—7.0% | | | | | | | | |
Air Liquide S.A. (Chemicals) | | | 183,301 | | | | 26,273 | |
*Arkema S.A. (Chemicals) | | | 190,964 | | | | 19,659 | |
AXA S.A. (Insurance) | | | 2,173,465 | | | | 49,389 | |
BNP Paribas (Commercial banks) | | | 775,946 | | | | 59,896 | |
Essilor International S.A. (Health care equipment & supplies) | | | 584,741 | | | | 47,427 | |
L’Oreal S.A. (Personal products) | | | 487,996 | | | | 63,379 | |
Schneider Electric S.A. (Electrical equipment) | | | 234,276 | | | | 39,138 | |
SEB S.A. (Household durables) | | | 122,591 | | | | 12,844 | |
Suez Environnement Co. (Multi-utilities) | | | 953,974 | | | | 19,029 | |
| | | | | | | | |
| | | | | | | 337,034 | |
| | | | | | | | |
Germany—7.2% | | | | | | | | |
Aixtron AG (Semiconductors & semiconductor equipment) | | | 326,505 | | | | 11,141 | |
BASF SE (Chemicals) | | | 718,444 | | | | 70,398 | |
Bayer AG (Pharmaceuticals) | | | 854,378 | | | | 68,689 | |
*Bayerische Motoren Werke AG (Automobiles) | | | 548,417 | | | | 54,724 | |
Gerry Weber International AG (Textiles, apparel & luxury goods) | | | 130,592 | | | | 8,574 | |
Infineon Technologies AG (Semiconductors & semiconductor equipment) | | | 2,762,025 | | | | 31,049 | |
Lanxess AG (Chemicals) | | | 251,461 | | | | 20,639 | |
MTU Aero Engines Holding AG (Aerospace & defense) | | | 220,862 | | | | 17,641 | |
SAP AG (Software) | | | 771,571 | | | | 46,714 | |
Wincor Nixdorf AG (Computers & peripherals) | | | 178,069 | | | | 12,869 | |
| | | | | | | | |
| | | | | | | 342,438 | |
| | | | | | | | |
Ireland—0.5% | | | | | | | | |
Paddy Power plc (Hotels, restaurants & leisure) | | | 238,079 | | | | 12,944 | |
| | | | | | | | |
Issuer | | Shares | | | Value | |
| |
Common Stocks—Europe, Mid-East—30.9%—(continued) | | | | | |
Ireland—(continued) | | | | | | | | |
Shire plc (Pharmaceuticals) | | | 274,511 | | | $ | 8,569 | |
| | | | | | | | |
| | | | | | | 21,513 | |
| | | | | | | | |
Israel—1.7% | | | | | | | | |
*Check Point Software Technologies, Ltd. (Software)† | | | 367,919 | | | | 20,916 | |
Israel Chemicals, Ltd. (Chemicals) | | | 1,684,687 | | | | 26,741 | |
Teva Pharmaceutical Industries, Ltd.—ADR (Pharmaceuticals) | | | 659,708 | | | | 31,811 | |
| | | | | | | | |
| | | | | | | 79,468 | |
| | | | | | | | |
Italy—1.2% | | | | | | | | |
Ansaldo STS SpA (Transportation infrastructure) | | | 731,533 | | | | 10,253 | |
DiaSorin SpA (Health care equipment & supplies) | | | 244,818 | | | | 11,751 | |
Saipem SpA (Energy equipment & services) | | | 704,041 | | | | 36,347 | |
| | | | | | | | |
| | | | | | | 58,351 | |
| | | | | | | | |
Luxembourg—0.0% | | | | | | | | |
*L’Occitane International S.A. (Specialty retail) | | | 600,250 | | | | 1,604 | |
| | | | | | | | |
Netherlands—0.6% | | | | | | | | |
*ASML Holding N.V. (Semiconductors & semiconductor equipment) | | | 804,229 | | | | 29,623 | |
| | | | | | | | |
Norway—0.2% | | | | | | | | |
*Norwegian Air Shuttle ASA (Airlines) | | | 393,500 | | | | 7,257 | |
Opera Software ASA (Internet software & services) | | | 617,811 | | | | 3,882 | |
| | | | | | | | |
| | | | | | | 11,139 | |
| | | | | | | | |
Spain—1.4% | | | | | | | | |
Banco Santander S.A. (Commercial banks) | | | 3,529,707 | | | | 40,759 | |
Prosegur Cia de Seguridad S.A. (Commercial services & supplies) | | | 205,994 | | | | 10,954 | |
Tecnicas Reunidas S.A. (Energy equipment & services) | | | 81,289 | | | | 4,171 | |
*Viscofan S.A. (Food products) | | | 212,089 | | | | 8,443 | |
| | | | | | | | |
| | | | | | | 64,327 | |
| | | | | | | | |
Sweden—2.3% | | | | | | | | |
Atlas Copco AB (Machinery) | | | 1,458,534 | | | | 38,393 | |
Elekta AB (Health care equipment & supplies) | | | 358,396 | | | | 16,976 | |
*Hexagon AB (Machinery) | | | 1,525,262 | | | | 37,570 | |
JM AB (Household durables) | | | 377,995 | | | | 8,919 | |
Mekonomen AB (Specialty retail) | | | 72,223 | | | | 2,501 | |
NIBE Industrier AB (Building products) | | | 285,607 | | | | 4,944 | |
| | | | | | | | |
| | | | | | | 109,303 | |
| | | | | | | | |
Switzerland—4.4% | | | | | | | | |
*ABB, Ltd. (Electrical equipment) | | | 1,850,611 | | | | 47,985 | |
Cie Financiere Richemont S.A. (Textiles, apparel & luxury goods) | | | 323,597 | | | | 21,188 | |
*Glencore International plc (Metals & mining) | | | 686,807 | | | | 5,412 | |
*Julius Baer Group, Ltd. (Capital markets) | | | 390,344 | | | | 16,125 | |
*Meyer Burger Technology AG (Machinery) | | | 173,871 | | | | 7,683 | |
See accompanying Notes to Financial Statements.
June 30, 2011 | William Blair Funds 37 |
International Growth Fund
Portfolio of Investments, June 30, 2011 (all dollar amounts in thousands) (unaudited)
| | | | | | | | |
Issuer | | Shares | | | Value | |
| |
Common Stocks— Europe, Mid-East—30.9%—(continued) | | | | | |
Switzerland—(continued) | | | | | | | | |
*Orascom Development Holding AG (Hotels, restaurants & leisure) | | | 205,113 | | | $ | 6,758 | |
Partners Group Holding AG (Capital markets) | | | 110,185 | | | | 19,501 | |
SGS S.A. (Professional services) | | | 13,710 | | | | 26,026 | |
Sika AG (Chemicals) | | | 6,783 | | | | 16,353 | |
Xstrata plc (Metals & mining) | | | 1,994,156 | | | | 43,895 | |
| | | | | | | | |
| | | | | | | 210,926 | |
| | | | | | | | |
United Kingdom—20.6% | | | | | | | | |
Abcam plc (Biotechnology) | | | 2,100,667 | | | | 14,051 | |
Admiral Group plc (Insurance) | | | 727,725 | | | | 19,400 | |
Aggreko plc (Commercial services & supplies) | | | 581,501 | | | | 18,003 | |
AMEC plc (Energy equipment & services) | | | 1,612,007 | | | | 28,149 | |
Amlin plc (Insurance) | | | 2,578,148 | | | | 16,804 | |
Antofagasta plc (Metals & mining) | | | 790,892 | | | | 17,695 | |
Ashmore Group plc (Capital markets) | | | 1,938,785 | | | | 12,397 | |
*Autonomy Corporation plc (Software) | | | 637,846 | | | | 17,475 | |
Babcock International Group plc (Commercial services & supplies) | | | 2,582,246 | | | | 29,508 | |
BG Group plc (Oil, gas & consumable fuels) | | | 2,144,277 | | | | 48,662 | |
BHP Billiton plc (Metals & mining) | | | 2,059,165 | | | | 81,035 | |
Britvic plc (Beverages) | | | 1,546,151 | | | | 9,789 | |
Burberry Group plc (Textiles, apparel & luxury goods) | | | 848,815 | | | | 19,753 | |
*Cairn Energy plc (Oil, gas & consumable fuels) | | | 1,663,632 | | | | 11,075 | |
*Carphone Warehouse Group plc (Specialty retail) | | | 2,855,984 | | | | 19,389 | |
Centrica plc (Multi-utilities) | | | 13,476,310 | | | | 69,926 | |
Diageo plc (Beverages) | | | 3,058,620 | | | | 62,491 | |
Dunelm Group plc (Specialty retail) | | | 1,412,965 | | | | 8,821 | |
*EnQuest plc (Oil, gas & consumable fuels) | | | 2,224,301 | | | | 4,391 | |
Halma plc (Electronic equipment, instruments & components) | | | 1,405,039 | | | | 9,343 | |
Hargreaves Lansdown plc (Capital markets) | | | 938,617 | | | | 9,152 | |
Hiscox, Ltd. (Insurance) | | | 1,303,179 | | | | 8,761 | |
IG Group Holdings plc (Diversified financial services) | | | 1,728,502 | | | | 12,106 | |
*John Wood Group plc (Energy equipment & services) | | | 1,439,780 | | | | 14,962 | |
Johnson Matthey plc (Chemicals) | | | 1,175,981 | | | | 37,106 | |
Jupiter Fund Management plc (Capital markets) | | | 1,542,958 | | | | 6,263 | |
Lancashire Holdings, Ltd. (Insurance) | | | 1,288,590 | | | | 13,494 | |
Meggitt plc (Aerospace & defense) | | | 1,890,704 | | | | 11,577 | |
Michael Page International plc (Professional services) | | | 889,678 | | | | 7,639 | |
Next plc (Multiline retail) | | | 752,593 | | | | 28,083 | |
*Ocado Group plc (Internet & catalog retail) | | | 2,662,532 | | | | 7,790 | |
Petrofac, Ltd. (Energy equipment & services) | | | 1,904,175 | | | | 46,269 | |
Restaurant Group plc (Hotels, restaurants & leisure) | | | 975,441 | | | | 4,603 | |
*Rolls-Royce Holdings plc (Aerospace & defense) | | | 3,409,856 | | | | 35,299 | |
Rotork plc (Machinery) | | | 557,718 | | | | 15,092 | |
RPS Group plc (Commercial services & supplies) | | | 2,323,241 | | | | 9,143 | |
| | | | | | | | |
Issuer | | Shares | | | Value | |
| |
Common Stocks—United Kingdom—20.6%—(continued) | | | | | |
United Kingdom—(continued) | | | | | | | | |
Scottish & Southern Energy plc (Electric utilities) | | | 2,107,530 | | | $ | 47,118 | |
Spirax-Sarco Engineering plc (Machinery) | | | 470,319 | | | | 15,104 | |
St James’s Place plc (Insurance) | | | 1,184,677 | | | | 6,465 | |
*Telecity Group plc (Internet software & services) | | | 1,371,660 | | | | 12,196 | |
*The Berkeley Group Holdings plc (Household durables) | | | 1,019,861 | | | | 21,082 | |
The Weir Group plc (Machinery) | | | 826,729 | | | | 28,222 | |
Tullow Oil plc (Oil, gas & consumable fuels) | | | 719,644 | | | | 14,322 | |
Ultra Electronics Holdings plc (Aerospace & defense) | | | 169,863 | | | | 4,678 | |
Victrex plc (Chemicals) | | | 514,437 | | | | 12,385 | |
Vodafone Group plc (Wireless telecommunication services) | | | 6,792,065 | | | | 18,019 | |
Whitbread plc (Hotels, restaurants & leisure) | | | 797,840 | | | | 20,680 | |
| | | | | | | | |
| | | | | | | 985,767 | |
| | | | | | | | |
Japan—16.7% | | | | | | | | |
Asics Corporation (Textiles, apparel & luxury goods) | | | 799,000 | | | | 11,880 | |
CyberAgent, Inc. (Media) | | | 4,817 | | | | 16,808 | |
Daito Trust Construction Co., Ltd. (Real estate management & development) | | | 258,900 | | | | 21,901 | |
Dena Co., Ltd. (Internet & catalog retail) | | | 674,700 | | | | 28,956 | |
Dr Ci:Labo Co., Ltd. (Personal products) | | | 1,168 | | | | 5,963 | |
Exedy Corporation (Auto components) | | | 443,400 | | | | 15,146 | |
F.C.C. Co., Ltd. (Auto components) | | | 318,303 | | | | 7,615 | |
Fanuc, Ltd. (Machinery) | | | 308,400 | | | | 51,256 | |
Fast Retailing Co., Ltd. (Specialty retail) | | | 238,100 | | | | 38,360 | |
Gree, Inc. (Internet software & services) | | | 1,264,100 | | | | 27,494 | |
K’s Holdings Corporation (Specialty retail) | | | 501,100 | | | | 21,630 | |
Kakaku.com, Inc. (Internet software & services) | | | 2,203 | | | | 15,461 | |
Kaken Pharmaceutical Co., Ltd. (Pharmaceuticals) | | | 533,000 | | | | 7,462 | |
Keyence Corporation (Electronic equipment, instruments & components) | | | 178,000 | | | | 50,279 | |
Komatsu, Ltd. (Machinery) | | | 1,525,800 | | | | 47,325 | |
Makita Corporation (Machinery) | | | 575,600 | | | | 26,669 | |
Miraca Holdings, Inc. (Health care providers & services) | | | 263,900 | | | | 10,670 | |
MISUMI Group, Inc. (Trading companies & distributors) | | | 499,800 | | | | 12,895 | |
Murata Manufacturing Co., Ltd. (Electronic equipment, instruments & components) | | | 418,600 | | | | 27,818 | |
Nitori Co., Ltd. (Specialty retail) | | | 347,420 | | | | 32,927 | |
Nitto Denko Corporation (Chemicals) | | | 369,800 | | | | 18,673 | |
ORIX Corporation (Diversified financial services) | | | 417,200 | | | | 40,370 | |
Osaka Securities Exchange Co., Ltd. (Diversified financial services) | | | 991 | | | | 4,413 | |
Sawai Pharmaceutical Co., Ltd. (Pharmaceuticals) | | | 97,700 | | | | 10,279 | |
SMC Corporation (Machinery) | | | 182,700 | | | | 32,770 | |
Softbank Corporation (Wireless telecommunication services) | | | 2,090,200 | | | | 78,670 | |
Sumitomo Mitsui Financial Group, Inc. (Commercial banks) | | | 1,809,300 | | | | 55,467 | |
See accompanying Notes to Financial Statements.
38 Semi-Annual Report | June 30, 2011 |
International Growth Fund
Portfolio of Investments, June 30, 2011 (all dollar amounts in thousands) (unaudited)
| | | | | | | | |
Issuer | | Shares | | | Value | |
| |
Common Stocks—Japan—16.7%—(continued) | | | | | |
Japan—(continued) | | | | | | | | |
United Arrows, Ltd. (Specialty retail) | | | 41,600 | | | $ | 878 | |
Yahoo! Japan Corporation (Internet software & services) | | | 156,368 | | | | 53,609 | |
Yamada Denki Co., Ltd. (Specialty retail) | | | 339,830 | | | | 27,565 | |
| | | | | | | | |
| | | | | | | 801,209 | |
| | | | | | | | |
| | |
Emerging Asia—11.7% | | | | | | | | |
China—4.4% | | | | | | | | |
AAC Technologies Holdings, Inc. (Communications equipment) | | | 2,630,000 | | | | 6,124 | |
Ajisen China Holdings, Ltd. (Hotels, restaurants & leisure) | | | 3,516,000 | | | | 7,284 | |
*China Minzhong Food Corporation, Ltd. (Food products) | | | 2,752,000 | | | | 3,361 | |
China Overseas Land & Investment, Ltd. (Real estate management & development) | | | 15,614,000 | | | | 33,469 | |
China Shenhua Energy Co., Ltd. (Oil, gas & consumable fuels) | | | 5,549,000 | | | | 26,455 | |
CNOOC, Ltd. (Oil, gas & consumable fuels) | | | 19,600,000 | | | | 45,740 | |
Haitian International Holdings, Ltd. (Machinery) | | | 5,537,000 | | | | 7,172 | |
*Hollysys Automation Technologies, Ltd. (Electronic equipment, instruments & components)† | | | 396,788 | | | | 3,698 | |
Industrial and Commercial Bank of China, Ltd. Class “H” (Commercial banks) | | | 91,981,000 | | | | 69,857 | |
Lonking Holdings, Ltd. (Machinery) | | | 16,117,000 | | | | 8,802 | |
| | | | | | | | |
| | | | | | | 211,962 | |
| | | | | | | | |
India—1.4% | | | | | | | | |
Axis Bank, Ltd. (Commercial banks) | | | 491,466 | | | | 14,178 | |
HDFC Bank, Ltd. (Commercial banks) | | | 224,856 | | | | 12,653 | |
Infosys Technologies, Ltd. (IT services) | | | 194,420 | | | | 12,658 | |
Shriram Transport Finance Co., Ltd. (Consumer finance) | | | 590,882 | | | | 8,151 | |
Tata Consultancy Services, Ltd. (IT services) | | | 754,521 | | | | 19,988 | |
| | | | | | | | |
| | | | | | | 67,628 | |
| | | | | | | | |
Indonesia—2.1% | | | | | �� | | | |
PT Bank Rakyat Indonesia (Commercial banks) | | | 26,892,000 | | | | 20,383 | |
PT Indo Tambangraya Megah (Oil, gas & consumable fuels) | | | 2,726,500 | | | | 14,228 | |
PT Indofood Sukses Makmur Tbk (Food products) | | | 32,072,000 | | | | 21,505 | |
PT Kalbe Farma Tbk (Pharmaceuticals) | | | 28,556,000 | | | | 11,238 | |
PT United Tractors Tbk (Machinery) | | | 11,671,606 | | | | 33,890 | |
| | | | | | | | |
| | | | | | | 101,244 | |
| | | | | | | | |
Philippines—0.2% | | | | | | | | |
Alliance Global Group, Inc. (Industrial conglomerates) | | | 45,713,800 | | | | 11,541 | |
| | | | | | | | |
South Korea—2.3% | | | | | | | | |
Halla Climate Control Corporation (Auto components) | | | 251,762 | | | | 6,060 | |
Hyundai Mobis (Auto components) | | | 63,371 | | | | 23,742 | |
Hyundai Motor Co. (Automobiles) | | | 157,984 | | | | 35,070 | |
| | | | | | | | |
Issuer | | Shares | | | Value | |
| |
Common Stocks—Emerging Asia—11.7%—(continued) | | | | | |
South Korea—(continued) | | | | | | | | |
Samsung Engineering Co., Ltd. (Construction & engineering) | | | 97,275 | | | $ | 23,233 | |
Samsung Fire & Marine Insurance Co., Ltd. (Insurance) | | | 98,398 | | | | 22,857 | |
| | | | | | | | |
| | | | | | | 110,962 | |
| | | | | | | | |
Taiwan—0.8% | | | | | | | | |
HTC Corporation (Communications equipment) | | | 574,000 | | | | 19,304 | |
Powertech Technology, Inc. (Semiconductors & semiconductor equipment) | | | 2,088,000 | | | | 7,007 | |
*TPK Holding Co., Ltd. (Electronic equipment, instruments & components) | | | 306,000 | | | | 9,322 | |
| | | | | | | | |
| | | | | | | 35,633 | |
| | | | | | | | |
Thailand—0.5% | | | | | | | | |
Bangkok Dusit Medical Services PCL (Health care providers & services) | | | 2,617,500 | | | | 4,494 | |
Kasikornbank PCL (Commercial banks) | | | 4,347,700 | | | | 17,688 | |
| | | | | | | | |
| | | | | | | 22,182 | |
| | | | | | | | |
Canada—6.3% | | | | | | | | |
Alimentation Couche Tard, Inc. (Food & staples retailing) | | | 853,194 | | | | 24,876 | |
*Bankers Petroleum, Ltd. (Oil, gas & consumable fuels) | | | 929,116 | | | | 6,628 | |
Brookfield Asset Management, Inc. Class “A” (Real estate management & development)† | | | 1,967,019 | | | | 65,246 | |
Canadian Western Bank (Commercial banks) | | | 404,532 | | | | 12,919 | |
CI Financial Corporation (Capital markets) | | | 626,649 | | | | 14,879 | |
Crescent Point Energy Corporation (Oil, gas & consumable fuels) | | | 412,841 | | | | 19,079 | |
Gildan Activewear, Inc. (Textiles, apparel & luxury goods) | | | 490,000 | | | | 17,269 | |
Home Capital Group, Inc. (Thrifts & mortgage finance) | | | 92,807 | | | | 4,980 | |
Intact Financial Corporation (Insurance) | | | 289,733 | | | | 16,609 | |
Laurentian Bank of Canada (Commercial banks) | | | 126,017 | | | | 5,822 | |
National Bank of Canada (Commercial banks) | | | 347,573 | | | | 28,189 | |
PetroBakken Energy, Ltd. Class “A” (Oil, gas & consumable fuels) | | | 860,850 | | | | 11,818 | |
Petrominerales, Ltd. (Oil, gas & consumable fuels) | | | 309,190 | | | | 9,076 | |
Peyto Exploration & Development Corporation (Oil, gas & consumable fuels) | | | 575,412 | | | | 12,827 | |
Saputo, Inc. (Food products) | | | 510,358 | | | | 24,612 | |
Tim Hortons, Inc. (Hotels, restaurants & leisure) | | | 492,843 | | | | 24,063 | |
| | | | | | | | |
| | | | | | | 298,892 | |
| | | | | | | | |
| | |
Emerging Latin America—4.4% | | | | | | | | |
Brazil—2.3% | | | | | | | | |
BM&F BOVESPA S.A. (Diversified financial services) | | | 64,100 | | | | 424 | |
BR Malls Participacoes S.A. (Real estate management & development) | | | 1,270,100 | | | | 14,527 | |
See accompanying Notes to Financial Statements.
June 30, 2011 | William Blair Funds 39 |
International Growth Fund
Portfolio of Investments, June 30, 2011 (all dollar amounts in thousands) (unaudited)
| | | | | | | | |
Issuer | | Shares | | | Value | |
| |
Common Stocks—Emerging Latin America—4.4%—(continued) | | | | | |
Brazil—(continued) | | | | | | | | |
BR Properties S.A. (Real estate management & development) | | | 701,400 | | | $ | 7,865 | |
Cia de Concessoes Rodoviarias (Transportation infrastructure) | | | 634,700 | | | | 18,891 | |
Cia Hering (Specialty retail) | | | 542,800 | | | | 12,486 | |
Drogasil S.A. (Food & staples retailing) | | | 448,300 | | | | 3,059 | |
Iochpe-Maxion S.A. (Machinery) | | | 506,900 | | | | 6,918 | |
Mills Estruturas e Servicos de Engenharia S.A. (Trading companies & distributors) | | | 420,042 | | | | 6,056 | |
Natura Cosmeticos S.A. (Personal products) | | | 232,500 | | | | 5,810 | |
OdontoPrev S.A. (Health care providers & services) | | | 695,100 | | | | 11,580 | |
*OGX Petroleo e Gas Participacoes S.A. (Oil, gas & consumable fuels) | | | 1,386,600 | | | | 12,963 | |
Sul America S.A. (Insurance) | | | 794,700 | | | | 9,981 | |
*T4F Entretenimento S.A. (Media) | | | 99,900 | | | | 899 | |
| | | | | | | | |
| | | | | | | 111,459 | |
| | | | | | | | |
Chile—0.7% | | | | | | | | |
Banco Santander Chile—ADR (Commercial banks) | | | 189,303 | | | | 17,758 | |
*CFR Pharmaceuticals S.A. (Pharmaceuticals) | | | 29,062,823 | | | | 7,898 | |
Parque Arauco S.A. (Real estate management & development) | | | 3,256,624 | | | | 7,282 | |
| | | | | | | | |
| | | | | | | 32,938 | |
| | | | | | | | |
Colombia—0.5% | | | | | | | | |
Pacific Rubiales Energy Corporation (Oil, gas & consumable fuels) | | | 809,517 | | | | 21,697 | |
| | | | | | | | |
Mexico—0.5% | | | | | | | | |
Compartamos S.A.B. de C.V. (Consumer finance) | | | 6,401,900 | | | | 11,619 | |
*Genomma Lab Internacional S.A.B. de C.V. (Pharmaceuticals) | | | 3,375,256 | | | | 8,590 | |
Grupo Mexico S.A.B. de C.V. Series “B” (Metals & mining) | | | 525,700 | | | | 1,736 | |
| | | | | | | | |
| | | | | | | 21,945 | |
| | | | | | | | |
Peru—0.4% | | | | | | | | |
Credicorp, Ltd. (Commercial banks)† | | | 231,109 | | | | 19,899 | |
| | | | | | | | |
| | |
Asia—2.8% | | | | | | | | |
Australia—0.2% | | | | | | | | |
Iluka Resources, Ltd. (Metals & mining) | | | 579,618 | | | | 10,432 | |
| | | | | | | | |
Hong Kong—1.1% | | | | | | | | |
China High Precision Automation Group, Ltd. (Electronic equipment, instruments & components) | | | 4,031,000 | | | | 3,155 | |
Hutchison Telecommunications Hong Kong Holdings, Ltd. (Diversified telecommunication services) | | | 26,454,000 | | | | 8,159 | |
Noble Group, Ltd. (Trading companies & distributors) | | | 16,221,000 | | | | 26,016 | |
SmarTone Telecommunications Holdings, Ltd. (Wireless telecommunication services) | | | 2,922,000 | | | | 4,348 | |
Value Partners Group, Ltd. (Capital markets) | | | 11,196,000 | | | | 9,582 | |
| | | | | | | | |
| | | | | | | 51,260 | |
| | | | | | | | |
| | | | | | | | |
Issuer | | Shares or
Principal
Amount | | | Value | |
| |
Common Stocks—Asia—2.8%—(continued) | | | | | |
Singapore—1.5% | | | | | | | | |
CapitaMalls Asia, Ltd. (Real estate management & development) | | | 14,672,000 | | | $ | 17,559 | |
*Global Logistic Properties, Ltd. (Real estate management & development) | | | 14,782,000 | | | | 24,791 | |
Keppel Corporation, Ltd. (Industrial conglomerates) | | | 3,349,300 | | | | 30,213 | |
Midas Holdings, Ltd. (Metals & mining) | | | 849,000 | | | | 449 | |
| | | | | | | | |
| | | | | | | 73,012 | |
| | | | | | | | |
| |
Emerging Europe, Mid-East, Africa—2.5% | | | | | |
Egypt—0.3% | | | | | | | | |
Commercial International Bank Egypt S.A.E. (Commercial banks) | | | 1,442,921 | | | | 7,195 | |
Egyptian Financial Group-Hermes Holding (Capital markets) | | | 1,977,640 | | | | 6,660 | |
| | | | | | | | |
| | | | | | | 13,855 | |
| | | | | | | | |
South Africa—1.8% | | | | | | | | |
Clicks Group, Ltd. (Multiline retail) | | | 1,847,256 | | | | 11,542 | |
Life Healthcare Group Holdings, Ltd. (Health care providers & services) | | | 4,043,077 | | | | 10,518 | |
Sasol, Ltd. (Oil, gas & consumable fuels) | | | 401,853 | | | | 21,156 | |
Shoprite Holdings, Ltd. (Food & staples retailing) | | | 1,205,696 | | | | 18,152 | |
*The Foschini Group, Ltd. (Specialty retail) | | | 1,114,973 | | | | 14,545 | |
Wilson Bayly Holmes-Ovcon, Ltd. (Construction & engineering) | | | 500,516 | | | | 8,142 | |
| | | | | | | | |
| | | | | | | 84,055 | |
| | | | | | | | |
Turkey—0.4% | | | | | | | | |
Tofas Turk Otomobil Fabrikasi A.S. (Automobiles) | | | 1,597,643 | | | | 7,284 | |
Turkiye Halk Bankasi A.S. (Commercial banks) | | | 1,779,477 | | | | 13,322 | |
| | | | | | | | |
| | | | | | | 20,606 | |
| | | | | | | | |
Total Common Stocks—95.9%
(cost $3,804,430) | | | | 4,584,629 | |
| | | | | | | | |
| | |
Convertible Bond | | | | | | | | |
Brazil—0.0% | | | | | | | | |
Lupatech S.A., 6.500%, due 4/15/18 (Machinery)**§ | | $ | 2,875 | | | | 1,893 | |
| | | | | | | | |
Total Convertible Bond—0.0%
(cost $1,491) | | | | | | | 1,893 | |
| | | | | | | | |
| | |
Exchange-Traded Fund | | | | | | | | |
China—0.8% | | | | | | | | |
iShares FTSE/Xinhua A50 China Index | | | 23,133,000 | | | | 38,468 | |
| | | | | | | | |
Total Exchange-Traded Fund—0.8%
(cost $38,838) | | | | 38,468 | |
| | | | | | | | |
See accompanying Notes to Financial Statements.
40 Semi-Annual Report | June 30, 2011 |
International Growth Fund
Portfolio of Investments, June 30, 2011 (all dollar amounts in thousands) (unaudited)
| | | | | | | | |
Issuer | | Principal
Amount | | | Value | |
| | |
Repurchase Agreement | | | | | | | | |
Fixed Income Clearing Corporation, 0.010% dated 6/30/11, due 7/1/11, repurchase price $68,519, collateralized by FHLMC, 2.000%, due 12/3/15 | | $ | 68,519 | | | $ | 68,519 | |
| | | | | | | | |
Total Repurchase Agreement—1.4%
(cost $68,519) | | | | 68,519 | |
| | | | | | | | |
Total Investments—98.1%
(cost $3,913,278) | | | | 4,693,509 | |
Cash and other assets, less liabilities—1.9% | | | | 91,114 | |
| | | | | | | | |
Net assets—100.0% | | | $ | 4,784,623 | |
| | | | | | | | |
* Non-income producing securities
ADR = American Depository Receipt
† = U.S. listed foreign security
** = Fair valued pursuant to Valuation Procedures adopted by the Board of Trustees. This holding represents 0.04% of the Fund’s net assets at June 30, 2011.
§ = Deemed illiquid pursuant to Liquidity Procedures approved by the Board of Trustees. This holding represents 0.04% of the net assets at June 30, 2011.
For securities primarily traded on exchanges or markets that close before the close of regular trading on the New York Stock Exchange, the Fund may use an independent pricing service to fair value price the securities pursuant to Valuation Procedures approved by the Board of Trustees.
June 30, 2011 | William Blair Funds 41 |
International Growth Fund
Portfolio of Investments, June 30, 2011 (all dollar amounts in thousands) (unaudited)
At June 30, 2011, the Fund’s Portfolio of Investments includes the following industry categories:
| | | | |
Financials | | | 20.1% | |
Industrials | | | 17.4% | |
Consumer Discretionary | | | 13.2% | |
Information Technology | | | 10.5% | |
Materials | | | 9.4% | |
Energy | | | 9.0% | |
Health Care | | | 7.4% | |
Consumer Staples | | | 6.9% | |
Utilities | | | 2.9% | |
Telecommunication Services | | | 2.4% | |
Exchange-Traded Funds | | | 0.8% | |
| | | | |
Total | | | 100.0% | |
| | | | |
At June 30, 2011, the Fund’s Portfolio of Investments includes the following currency categories:
| | | | |
British Pound Sterling | | | 22.6% | |
Euro | | | 21.4% | |
Japanese Yen | | | 17.3% | |
Hong Kong Dollar | | | 5.8% | |
Canadian Dollar | | | 5.5% | |
Swiss Franc | | | 3.5% | |
U.S. Dollar | | | 3.4% | |
Brazilian Real | | | 2.5% | |
South Korean Won | | | 2.4% | |
Swedish Krona | | | 2.4% | |
Singapore Dollar | | | 2.2% | |
Indonesian Rupiah | | | 2.2% | |
South African Rand | | | 1.8% | |
Indian Rupee | | | 1.5% | |
Danish Krone | | | 1.4% | |
All Other Currencies | | | 4.1% | |
| | | | |
Total | | | 100.0% | |
| | | | |
See accompanying Notes to Financial Statements.
42 Semi-Annual Report | June 30, 2011 |

David Merjan
INTERNATIONAL EQUITY FUND
The International Equity Fund seeks long-term capital appreciation.
AN OVERVIEW FROM THE PORTFOLIO MANAGER
The International Equity Fund posted a 3.22% increase (Class N Shares) for the six months ended June 30, 2011. By comparison, the Fund’s benchmark, the MSCI World Ex-U.S. (net) Index, increased 4.72%.
Year to date, the Fund trailed the MSCI World Ex-U.S. (net) Index, due primarily to the Fund’s emerging markets exposure, which detracted approximately 1% from relative results. The other primary detractor from performance during the six month period was Healthcare stock selection, as Sonova Holding AG underperformed on concerns about lower demand prospectively, while Terumo Corporation underperformed on production delays; as a result, we sold these stocks. Teva Pharmaceutical Industries, Ltd. also underperformed on concerns about slowing revenue growth and concerns about potential generic competition to its blockbuster drug, Copaxone. Somewhat offsetting these effects were strong stock selection in Japan and Canada, coupled with outperformance in European Industrials holdings.
Over the six month period the Fund’s emerging markets exposure was reduced from 19.3% to 15.8%, largely through a reduction in Latin America early in the year on interest rate and growth concerns. This decrease was invested in European and Canadian holdings. European exposure increased particularly in Financials, Information Technology and Materials, which more than offset a reduction in Consumer Discretionary and Industrials. From a sector perspective, Industrials remained the most overweighted throughout the six month period, approximating 22%, well ahead of the 12% Index weighting, due to a focus in capital equipment and machinery names, as well as holdings in low-cost airlines. Financials was underweighted during the entire period, although developed markets increased at the expense of emerging markets. The Fund was underweighted in the Materials sector for the entire six month period on lower mining exposure, despite exposure in chemicals and fertilizer.
June 30, 2011 | William Blair Funds 43 |
International Equity Fund
Performance Highlights (unaudited)
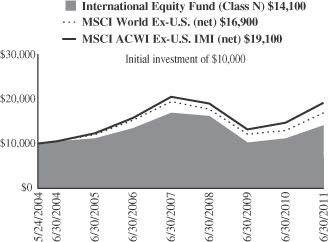
Average Annual Total Return at 6/30/2011
| | | | | | | | | | | | | | | | | | | | |
| | | Year
To Date | | | 1
Year | | | 3
Year | | | 5
Year | | | Since
Inception(a) | |
Class N | | | 3.22 | % | | | 26.11 | % | | | (4.36 | )% | | | 0.98 | % | | | 4.99 | % |
Class I | | | 3.36 | | | | 26.35 | | | | (4.12 | ) | | | 1.22 | | | | 5.27 | |
MSCI World
Ex-U.S. (net) | | | 4.72 | | | | 30.33 | | | | (1.56 | ) | | | 2.02 | | | | 7.63 | |
MSCI All Country World Ex-U.S. IMI (net) | | | 3.52 | | | | 30.26 | | | | 0.31 | | | | 3.96 | | | | 9.54 | |
| | (a) | | For the period from May 24, 2004 (Commencement of Operations) to June 30, 2011. | |
Performance cited represents past performance. Past performance does not guarantee future results and current performance may be lower or higher than the data quoted. Results shown are average annual returns, which assume reinvestment of dividends and capital gains. Investment returns and principal will fluctuate and you may have a gain or loss when you sell shares. For the most current month-end performance information, please call 1-800-742-7272, or visit our Web site at www.williamblairfunds.com. From time to time the investment advisor may waive fees or reimburse expenses for the Fund. Without these waivers, performance would be lower. International investing involves special risk considerations, including currency fluctuations, lower liquidity, economic and political risk. Class N shares are available to the general public without a sales load. Class I shares are available to certain institutional investors and advisory clients of William Blair & Company L.L.C. without a sales load or distribution (12b-1) or service fees.
The performance highlights and graph presented above do not reflect the deduction of taxes that a shareholder would pay on fund distributions or the redemption of fund shares.
The Morgan Stanley Capital International (MSCI) World Ex-U.S. (net) is a free float-adjusted market capitalization weighted index that is designed to measure the equity market performance of developed markets, excluding the United States. This series approximates the minimum possible dividend reinvestment.
The Morgan Stanley Capital International (MSCI) All Country World Ex-U.S. Investable Market Index (IMI) (net) is a free float-adjusted market capitalization weighted index that is designed to measure the equity market performance of developed and emerging markets, excluding the United States. This series approximates the minimum possible dividend reinvestment.
On May 1, 2011, the Fund’s benchmark changed from the MSCI All Country World Ex-U.S. IMI (net) to the MSCI World Ex-U.S. (net). The primary reason for this change is to compare the Fund to a benchmark that more closely reflects the market capitalization focus the Fund uses in its investment strategy.
This report identifies the Fund’s investments on June 30, 2011. These holdings are subject to change. Not all stocks in the Fund performed the same, nor is there any guarantee that these stocks will perform as well in the future. Market forecasts provided in this report may not necessarily come to pass.
Sector Diversification (unaudited)
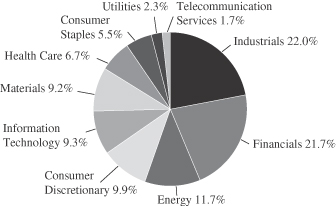
The sector diversification shown is based on the total long-term securities.
44 Semi-Annual Report | June 30, 2011 |
International Equity Fund
Portfolio of Investments, June 30, 2011 (all dollar amounts in thousands) (unaudited)
| | | | | | | | |
Issuer | | Shares | | | Value | |
| | |
Common Stocks | | | | | | | | |
| | |
Europe, Mid-East—32.4% | | | | | | | | |
Belgium—1.8% | | | | | | | | |
Anheuser-Busch InBev N.V. (Beverages) | | | 34,499 | | | $ | 2,001 | |
| | | | | | | | |
Denmark—1.6% | | | | | | | | |
Novo Nordisk A/S (Pharmaceuticals) | | | 14,589 | | | | 1,831 | |
| | | | | | | | |
Finland—0.5% | | | | | | | | |
Kone Oyj (Machinery) | | | 8,480 | | | | 533 | |
| | | | | | | | |
France—7.5% | | | | | | | | |
Air Liquide S.A. (Chemicals) | | | 3,090 | | | | 443 | |
AXA S.A. (Insurance) | | | 63,886 | | | | 1,452 | |
BNP Paribas (Commercial banks) | | | 31,525 | | | | 2,433 | |
Cie Generale des Etablissements Michelin (Auto components) | | | 12,188 | | | | 1,192 | |
L’Oreal S.A. (Personal products) | | | 13,248 | | | | 1,721 | |
Schneider Electric S.A. (Electrical equipment) | | | 7,204 | | | | 1,203 | |
| | | | | | | | |
| | | | | | | 8,444 | |
| | | | | | | | |
Germany—8.6% | | | | | | | | |
BASF SE (Chemicals) | | | 7,339 | | | | 719 | |
Bayer AG (Pharmaceuticals) | | | 26,282 | | | | 2,113 | |
Fresenius Medical Care AG & Co. KGaA (Health care providers & services) | | | 25,693 | | | | 1,921 | |
Infineon Technologies AG (Semiconductors & semiconductor equipment) | | | 81,439 | | | | 915 | |
MAN SE (Machinery) | | | 8,322 | | | | 1,110 | |
Muenchener Rueckversicherungs AG (Insurance) | | | 9,159 | | | | 1,401 | |
SAP AG (Software) | | | 26,219 | | | | 1,587 | |
| | | | | | | | |
| | | | | | | 9,766 | |
| | | | | | | | |
Ireland—1.3% | | | | | | | | |
Ryanair Holdings plc—ADR (Airlines) | | | 49,326 | | | | 1,447 | |
| | | | | | | | |
Israel—2.3% | | | | | | | | |
*Check Point Software Technologies, Ltd. (Software)† | | | 20,258 | | | | 1,152 | |
Teva Pharmaceutical Industries, Ltd.—ADR (Pharmaceuticals) | | | 31,003 | | | | 1,495 | |
| | | | | | | | |
| | | | | | | 2,647 | |
| | | | | | | | |
Italy—2.1% | | | | | | | | |
Saipem SpA (Energy equipment & services) | | | 46,310 | | | | 2,391 | |
| | | | | | | | |
Spain—1.1% | | | | | | | | |
Banco Santander S.A. (Commercial banks) | | | 103,539 | | | | 1,195 | |
| | | | | | | | |
Sweden—1.7% | | | | | | | | |
Atlas Copco AB (Machinery) | | | 44,390 | | | | 1,169 | |
*Hexagon AB (Machinery) | | | 33,216 | | | | 818 | |
| | | | | | | | |
| | | | | | | 1,987 | |
| | | | | | | | |
Switzerland—3.9% | | | | | | | | |
*ABB, Ltd. (Electrical equipment) | | | 55,902 | | | | 1,450 | |
*Julius Baer Group, Ltd. (Capital markets) | | | 24,386 | | | | 1,007 | |
*Syngenta AG (Chemicals) | | | 4,745 | | | | 1,602 | |
Xstrata plc (Metals & mining) | | | 17,501 | | | | 385 | |
| | | | | | | | |
| | | | | | | 4,444 | |
| | | | | | | | |
| | | | | | | | |
Issuer | | Shares | | | Value | |
| | |
Common Stocks—(continued) | | | | | | | | |
United Kingdom—21.7% | | | | | | | | |
Amlin plc (Insurance) | | | 88,205 | | | $ | 575 | |
*Autonomy Corporation plc (Software) | | | 42,462 | | | | 1,163 | |
Barclays plc (Commercial banks) | | | 205,396 | | | | 845 | |
BG Group plc (Oil, gas & consumable fuels) | | | 91,174 | | | | 2,069 | |
British Sky Broadcasting Group plc (Media) | | | 87,940 | | | | 1,195 | |
Burberry Group plc (Textiles, apparel & luxury goods) | | | 67,920 | | | | 1,581 | |
Centrica plc (Multi-utilities) | | | 272,242 | | | | 1,413 | |
Compass Group plc (Hotels, restaurants & leisure) | | | 116,001 | | | | 1,119 | |
Experian plc (Professional services) | | | 95,552 | | | | 1,217 | |
HSBC Holdings plc (Commercial banks) | | | 128,903 | | | | 1,276 | |
Johnson Matthey plc (Chemicals) | | | 35,413 | | | | 1,117 | |
Pearson plc (Media) | | | 61,473 | | | | 1,160 | |
Petrofac, Ltd. (Energy equipment & services) | | | 55,697 | | | | 1,353 | |
Prudential plc (Insurance) | | | 195,579 | | | | 2,260 | |
*Rolls-Royce Holdings plc (Aerospace & defense) | | | 166,753 | | | | 1,726 | |
Rotork plc (Machinery) | | | 17,653 | | | | 478 | |
Scottish & Southern Energy plc (Electric utilities) | | | 51,192 | | | | 1,145 | |
Standard Chartered plc (Commercial banks) | | | 56,163 | | | | 1,476 | |
Tullow Oil plc (Oil, gas & consumable fuels) | | | 67,166 | | | | 1,337 | |
| | | | | | | | |
| | | | | | | 24,505 | |
| | | | | | | | |
Canada—12.5% | | | | | | | | |
Agrium, Inc. (Chemicals)† | | | 12,029 | | | | 1,056 | |
Brookfield Asset Management, Inc. Class “A” (Real estate management & development)† | | | 51,025 | | | | 1,692 | |
Canadian National Railway Co. (Road & rail)† | | | 28,885 | | | | 2,308 | |
Goldcorp, Inc. (Metals & mining)† | | | 30,920 | | | | 1,493 | |
National Bank of Canada (Commercial banks) | | | 17,138 | | | | 1,390 | |
Potash Corporation of Saskatchewan, Inc. (Chemicals)† | | | 12,780 | | | | 728 | |
Saputo, Inc. (Food products) | | | 20,285 | | | | 978 | |
The Toronto-Dominion Bank (Commercial banks) | | | 26,958 | | | | 2,286 | |
Thomson Reuters Corporation (Media) | | | 23,068 | | | | 866 | |
Tim Hortons, Inc. (Hotels, restaurants & leisure) | | | 28,715 | | | | 1,402 | |
| | | | | | | | |
| | | | | | | 14,199 | |
| | | | | | | | |
Japan—12.4% | | | | | | | | |
Chiyoda Corporation (Construction & engineering) | | | 57,000 | | | | 654 | |
Fanuc, Ltd. (Machinery) | | | 9,800 | | | | 1,629 | |
Keyence Corporation (Electronic equipment, instruments & components) | | | 5,500 | | | | 1,554 | |
Komatsu, Ltd. (Machinery) | | | 53,200 | | | | 1,650 | |
Mitsubishi Corporation (Trading companies & distributors) | | | 65,700 | | | | 1,632 | |
Mitsubishi Electric Corporation (Electrical equipment) | | | 94,000 | | | | 1,086 | |
Mitsubishi UFJ Financial Group, Inc. (Commercial banks) | | | 355,700 | | | | 1,723 | |
Nitori Co., Ltd. (Specialty retail) | | | 6,450 | | | | 611 | |
Nitto Denko Corporation (Chemicals) | | | 17,000 | | | | 858 | |
Softbank Corporation (Wireless telecommunication services) | | | 50,000 | | | | 1,882 | |
Sony Financial Holdings, Inc. (Insurance) | | | 44,900 | | | | 808 | |
| | | | | | | | |
| | | | | | | 14,087 | |
| | | | | | | | |
See accompanying Notes to Financial Statements.
June 30, 2011 | William Blair Funds 45 |
International Equity Fund
Portfolio of Investments, June 30, 2011 (all dollar amounts in thousands) (unaudited)
| | | | | | | | |
Issuer | | Shares | | | Value | |
| | |
Common Stocks—(continued) | | | | | | | | |
Emerging Asia—10.1% | | | | | | | | |
China—3.0% | | | | | | | | |
China Overseas Land & Investment, Ltd. (Real estate management & development) | | | 416,000 | | | $ | 891 | |
China Shenhua Energy Co., Ltd. (Oil, gas & consumable fuels) | | | 225,000 | | | | 1,073 | |
CNOOC, Ltd. (Oil, gas & consumable fuels) | | | 596,000 | | | | 1,391 | |
| | | | | | | | |
| | | | | | | 3,355 | |
| | | | | | | | |
India—1.4% | | | | | | | | |
Infosys Technologies, Ltd. (IT services) | | | 23,688 | | | | 1,542 | |
| | | | | | | | |
Indonesia—0.8% | | | | | | | | |
PT Bank Rakyat Indonesia (Commercial banks) | | | 1,194,000 | | | | 905 | |
| | | | | | | | |
South Korea—4.0% | | | | | | | | |
Hyundai Motor Co. (Automobiles) | | | 7,639 | | | | 1,696 | |
Samsung Electronics Co., Ltd. (Semiconductors & semiconductor equipment) | | | 1,772 | | | | 1,371 | |
Samsung Engineering Co., Ltd. (Construction & engineering) | | | 5,940 | | | | 1,419 | |
| | | | | | | | |
| | | | | | | 4,486 | |
| | | | | | | | |
Taiwan—0.9% | | | | | | | | |
HTC Corporation (Communications equipment) | | | 29,000 | | | | 975 | |
| | | | | | | | |
Emerging Latin America—3.6% | | | | | | | | |
Brazil—1.9% | | | | | | | | |
BM&F BOVESPA S.A. (Diversified financial services) | | | 28,700 | | | | 190 | |
Embraer S.A.—ADR (Aerospace & defense) | | | 27,578 | | | | 849 | |
Petroleo Brasileiro S.A.—ADR (Oil, gas & consumable fuels) | | | 26,510 | | | | 898 | |
Weg S.A. (Machinery) | | | 18,500 | | | | 211 | |
| | | | | | | | |
| | | | | | | 2,148 | |
| | | | | | | | |
Mexico—1.1% | | | | | | | | |
Wal-Mart de Mexico S.A.B. de C.V. (Food & staples retailing) | | | 435,400 | | | | 1,292 | |
| | | | | | | | |
Panama—0.6% | | | | | | | | |
Copa Holdings S.A. Class “A” (Airlines)† | | | 9,984 | | | | 666 | |
| | | | | | | | |
Asia—2.2% | | | | | | | | |
Australia—1.5% | | | | | | | | |
BHP Billiton, Ltd.—ADR (Metals & mining) | | | 18,225 | | | | 1,725 | |
| | | | | | | | |
Hong Kong—0.7% | | | | | | | | |
Noble Group, Ltd. (Trading companies & distributors) | | | 528,727 | | | | 848 | |
| | | | | | | | |
Emerging Europe, Mid-East, Africa—0.9% | | | | | | | | |
South Africa—0.9% | | | | | | | | |
Sasol, Ltd. (Oil, gas & consumable fuels) | | | 18,803 | | | | 990 | |
| | | | | | | | |
Total Common Stocks—95.8%
(cost $88,430) | | | | 108,409 | |
| | | | | | | | |
| | | | | | | | |
Issuer | | Shares or
Principal
Amount | | | Value | |
| | |
Preferred Stock | | | | | | | | |
Brazil—1.2% | | | | | | | | |
Petroleo Brasileiro S.A. (Oil, gas & consumable fuels) | | | 85,493 | | | $ | 1,299 | |
| | | | | | | | |
Total Preferred Stock—1.2%
(cost $1,180) | | | | 1,299 | |
| | | | | | | | |
| | |
Repurchase Agreement | | | | | | | | |
Fixed Income Clearing Corporation, 0.010% dated 6/30/11, due 7/1/11, repurchase price $6,708, collateralized by FHLMC, 2.000%, due 12/03/15 | | $ | 6,708 | | | | 6,708 | |
| | | | | | | | |
Total Repurchase Agreement—5.9%
(cost $6,708) | | | | 6,708 | |
| | | | | | | | |
Total Investments—102.9%
(cost $96,318) | | | | 116,416 | |
Liabilities, plus cash and other assets—(2.9)% | | | | (3,277 | ) |
| | | | | | | | |
Net assets—100.0% | | | $ | 113,139 | |
| | | | | | | | |
ADR = American Depository Receipt
*Non-income producing securities
† = U.S. listed foreign security
For securities primarily traded on exchanges or markets that close before the close of regular trading on the New York Stock Exchange, the Fund may use an independent pricing service to fair value price the securities pursuant to Valuation Procedures approved by the Board of Trustees.
At June 30, 2011, the Fund’s Portfolio of Investments includes the following industry categories:
| | | | |
Industrials | | | 22.0% | |
Financials | | | 21.7% | |
Energy | | | 11.7% | |
Consumer Discretionary | | | 9.9% | |
Information Technology | | | 9.3% | |
Materials | | | 9.2% | |
Health Care | | | 6.7% | |
Consumer Staples | | | 5.5% | |
Utilities | | | 2.3% | |
Telecommunication Services | | | 1.7% | |
| | | | |
Total | | | 100.0% | |
| | | | |
See accompanying Notes to Financial Statements.
46 Semi-Annual Report | June 30, 2011 |
International Equity Fund
Portfolio of Investments, June 30, 2011 (all dollar amounts in thousands) (unaudited)
At June 30, 2011, the Fund’s Portfolio of Investments includes the following currency categories:
| | | | |
Euro | | | 22.2% | |
British Pound Sterling | | | 21.5% | |
U.S. Dollar | | | 14.1% | |
Japanese Yen | | | 12.8% | |
Canadian Dollar | | | 6.3% | |
Hong Kong Dollar | | | 4.2% | |
South Korean Won | | | 4.1% | |
Swiss Franc | | | 3.7% | |
Swedish Krona | | | 1.8% | |
Danish Krone | | | 1.7% | |
Brazilian Real | | | 1.6% | |
Indian Rupee | | | 1.4% | |
Mexican Peso | | | 1.2% | |
All Other Currencies | | | 3.4% | |
| | | | |
Total | | | 100.0% | |
| | | | |
See accompanying Notes to Financial Statements.
June 30, 2011 | William Blair Funds 47 |

Jeffrey A. Urbina
INTERNATIONAL SMALL CAP GROWTH FUND
The International Small Cap Growth Fund seeks long-term capital appreciation.
AN OVERVIEW FROM THE PORTFOLIO MANAGER
The International Small Cap Growth Fund increased 5.43% (Class N Shares) for the six months ended June 30, 2011. By comparison, the Fund’s benchmark, the MSCI All Country World Ex-U.S. Small Cap Index (net), gained 1.51%.
Year to date performance was augmented by strong Discretionary, Industrials, Information Technology (IT) and Materials performance. Japanese Discretionary holdings performed particularly well, with social media and retailers rallying strongly. Auto-related and luxury holdings also performed well on strong operational results and IPO activity within the luxury arena. Industrials stock selection was bolstered by strong testing, defense and transportation performance. IT stock selection was strong across regions, with particular value added in Japan, as the Fund’s IT stocks were up over 50%, compared to the -2.46% Index return. U.K. and Emerging Asian stock selection was strong within Materials during the first half of the year. Somewhat detracting from year to date results was Pacific Ex-Japan performance, coupled with underperformance by the Fund’s European Financials holdings.
The Fund maintained its significant focus on Consumer Discretionary holdings during the six month period, averaging 25% invested across auto-related companies, luxury and specialty retailers, and approximately 40% of the sector weighting invested directly in emerging markets. IT was also significantly overweighted at approximately 17% on average during the period, due to a focus on suppliers to smartphone and tablet manufacturers, social networking and business services companies. Healthcare was another area of focus versus the market, while Financials and Materials were significantly underweighted throughout the period: Financials due to the lower Japan and European banking exposure and Materials due to a lack of mining opportunities. Portfolio positioning did not change substantially at a regional level, with emerging markets averaging 26% over the period, above the market weighting. The U.K. at 20% was significantly overweighted due largely to U.K. Industrials holdings, while Pacific Ex-Japan had minimal exposure throughout the period.
48 Semi-Annual Report | June 30, 2011 |
International Small Cap Growth Fund
Performance Highlights (unaudited)
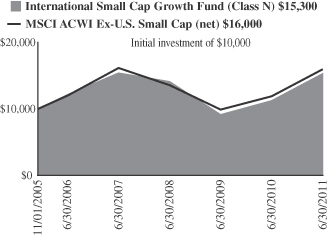
Average Annual Total Return at 6/30/2011
| | | | | | | | | | | | | | | | | | | | |
| | | Year To
Date | | | 1
Year | | | 3
Year | | | 5
Year | | | Since
Inception(a) | |
Class N | | | 5.43 | % | | | 35.85 | % | | | 2.71 | % | | | 4.72 | % | | | 7.74 | % |
Class I | | | 5.69 | | | | 36.41 | | | | 3.11 | | | | 5.08 | | | | 8.09 | |
MSCI AC World Ex-U.S. Small Cap Index (net) | | | 1.51 | | | | 34.24 | | | | 5.56 | | | | 5.92 | | | | 8.57 | |
| | (a) | | For the period from November 1, 2005 (Commencement of Operations) to June 30, 2011. |
Performance cited represents past performance. Past performance does not guarantee future results and current performance may be lower or higher than the data quoted. Results shown are average annual returns, which assume reinvestment of dividends and capital gains. Investment returns and principal will fluctuate and you may have a gain or loss when you sell shares. For the most current month-end performance information, please call 1-800-742-7272, or visit our Web site at www.williamblairfunds.com. From time to time, the investment advisor may waive fees or reimburse expenses for the Fund. Without these waivers, performance would be lower. International investing involves special risk considerations, including currency fluctuations, lower liquidity, economic and political risk. Class N shares are available to the general public without a sales load. Class I shares are available to certain institutional investors and advisory clients of William Blair & Company L.L.C. without a sales load or distribution (12b-1) fees.
The performance highlights and graph presented above do not reflect the deduction of taxes that a shareholder would pay on fund distributions or the redemption of fund shares.
The Morgan Stanley Capital International (MSCI) All Country World Ex-U.S. Small Cap Index (net) is a free float-adjusted market capitalization weighted index that is designed to measure the equity market performance of small capitalization developed and emerging markets, excluding the United States. This series approximates the minimum possible dividend reinvestment.
This report identifies the Fund’s investments on June 30, 2011. These holdings are subject to change. Not all stocks in the Fund performed the same, nor is there any guarantee that these stocks will perform as well in the future. Market forecasts provided in this report may not necessarily come to pass.
Sector Diversification (unaudited)
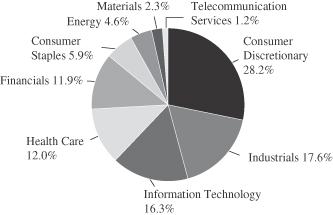
The sector diversification shown is based on the total long-term securities.
June 30, 2011 | William Blair Funds 49 |
International Small Cap Growth Fund
Portfolio of Investments, June 30, 2011 (all dollar amounts in thousands) (unaudited)
| | | | | | | | |
Issuer | | Shares | | | Value | |
| | |
Common Stocks | | | | | | | | |
| | |
Europe—24.6% | | | | | | | | |
Finland—1.3% | | | | | | | | |
Nokian Renkaat Oyj (Auto components) | | | 202,154 | | | $ | 10,143 | |
| | | | | | | | |
Germany—6.3% | | | | | | | | |
Aixtron AG (Semiconductors & semiconductor equipment) | | | 395,468 | | | | 13,494 | |
Gerry Weber International AG (Textiles, apparel & luxury goods) | | | 75,381 | | | | 4,949 | |
MTU Aero Engines Holding AG (Aerospace & defense) | | | 190,585 | | | | 15,223 | |
Wincor Nixdorf AG (Computers & peripherals) | | | 144,441 | | | | 10,439 | |
Wirecard AG (IT services) | | | 262,235 | | | | 4,687 | |
| | | | | | | | |
| | | | | | | 48,792 | |
| | | | | | | | |
Ireland—1.9% | | | | | | | | |
Paddy Power plc (Hotels, restaurants & leisure) | | | 269,904 | | | | 14,674 | |
| | | | | | | | |
Italy—3.6% | | | | | | | | |
De’Longhi SpA (Household durables) | | | 288,832 | | | | 3,365 | |
DiaSorin SpA (Health care equipment & supplies) | | | 145,433 | | | | 6,981 | |
*Salvatore Ferragamo Italia SpA | | | 380,979 | | | | 5,691 | |
Tod’s SpA (Textiles, apparel & luxury goods) | | | 85,472 | | | | 11,434 | |
| | | | | | | | |
| | | | | | | 27,471 | |
| | | | | | | | |
Luxembourg—0.9% | | | | | | | | |
*L’Occitane International S.A. (Specialty retail) | | | 2,733,000 | | | | 7,305 | |
| | | | | | | | |
Netherlands—1.1% | | | | | | | | |
BinckBank N.V. (Capital markets) | | | 142,650 | | | | 1,956 | |
Gemalto N.V. (Computers & peripherals) | | | 139,461 | | | | 6,669 | |
| | | | | | | | |
| | | | | | | 8,625 | |
| | | | | | | | |
Norway—0.2% | | | | | | | | |
Opera Software ASA (Internet software & services) | | | 187,687 | | | | 1,179 | |
| | | | | | | | |
Spain—2.7% | | | | | | | | |
Prosegur Cia de Seguridad S.A. (Commercial services & supplies) | | | 120,842 | | | | 6,426 | |
*Viscofan S.A. (Food products) | | | 362,597 | | | | 14,434 | |
| | | | | | | | |
| | | | | | | 20,860 | |
| | | | | | | | |
Sweden—3.6% | | | | | | | | |
Elekta AB (Health care equipment & supplies) | | | 197,373 | | | | 9,349 | |
JM AB (Household durables) | | | 409,940 | | | | 9,673 | |
Mekonomen AB (Specialty retail) | | | 78,944 | | | | 2,733 | |
NIBE Industrier AB (Building products) | | | 322,100 | | | | 5,576 | |
| | | | | | | | |
| | | | | | | 27,331 | |
| | | | | | | | |
Switzerland—3.0% | | | | | | | | |
*Meyer Burger Technology AG (Machinery) | | | 168,546 | | | | 7,447 | |
*Orascom Development Holding AG (Hotels, restaurants & leisure) | | | 11,402 | | | | 376 | |
Partners Group Holding AG (Capital markets) | | | 85,024 | | | | 15,048 | |
| | | | | | | | |
| | | | | | | 22,871 | |
| | | | | | | | |
| | | | | | | | |
Issuer | | Shares | | | Value | |
| | |
Common Stocks—(continued) | | | | | | | | |
| | |
United Kingdom—19.8% | | | | | | | | |
Abcam plc (Biotechnology) | | | 1,010,249 | | | $ | 6,757 | |
Aveva Group plc (Software) | | | 274,468 | | | | 7,546 | |
Babcock International Group plc (Commercial services & supplies) | | | 1,505,734 | | | | 17,206 | |
*Blinkx plc (Internet software & services) | | | 1,381,166 | | | | 2,660 | |
*Carphone Warehouse Group plc (Specialty retail) | | | 874,590 | | | | 5,938 | |
Dunelm Group plc (Specialty retail) | | | 474,514 | | | | 2,963 | |
*EnQuest plc (Oil, gas & consumable fuels) | | | 1,883,379 | | | | 3,718 | |
Fenner plc (Machinery) | | | 785,623 | | | | 5,062 | |
Fidessa Group plc (Software) | | | 103,193 | | | | 3,208 | |
Halma plc (Electronic equipment, instruments & components) | | | 561,801 | | | | 3,736 | |
Hargreaves Lansdown plc (Capital markets) | | | 489,823 | | | | 4,776 | |
Hikma Pharmaceuticals plc (Pharmaceuticals) | | | 303,744 | | | | 3,705 | |
IG Group Holdings plc (Diversified financial services) | | | 427,893 | | | | 2,997 | |
*Imagination Technologies Group plc (Computers & peripherals) | | | 543,044 | | | | 3,287 | |
Intertek Group plc (Professional services) | | | 131,284 | | | | 4,157 | |
Lancashire Holdings, Ltd. (Insurance) | | | 1,147,411 | | | | 12,016 | |
Meggitt plc (Aerospace & defense) | | | 1,091,027 | | | | 6,680 | |
Michael Page International plc (Professional services) | | | 440,010 | | | | 3,778 | |
Moneysupermarket.com Group plc (Internet software & services) | | | 2,199,545 | | | | 3,590 | |
*Ocado Group plc (Internet & catalog retail) | | | 382,267 | | | | 1,118 | |
Restaurant Group plc (Hotels, restaurants & leisure) | | | 716,015 | | | | 3,379 | |
*Salamander Energy plc (Oil, gas & consumable fuels) | | | 172,514 | | | | 777 | |
Serco Group plc (Commercial services & supplies) | | | 797,509 | | | | 7,072 | |
Spirax-Sarco Engineering plc (Machinery) | | | 294,154 | | | | 9,447 | |
*Sports Direct International plc (Specialty retail) | | | 1,052,913 | | | | 3,993 | |
St James’s Place plc (Insurance) | | | 996,070 | | | | 5,435 | |
*Telecity Group plc (Internet software & services) | | | 434,970 | | | | 3,868 | |
Ultra Electronics Holdings plc (Aerospace & defense) | | | 281,141 | | | | 7,743 | |
Victrex plc (Chemicals) | | | 238,318 | | | | 5,737 | |
| | | | | | | | |
| | | | | | | 152,349 | |
| | | | | | | | |
| | |
Emerging Asia—17.5% | | | | | | | | |
| | |
China—8.8% | | | | | | | | |
AAC Technologies Holdings, Inc. (Communications equipment) | | | 3,409,559 | | | | 7,939 | |
Ajisen China Holdings, Ltd. (Hotels, restaurants & leisure) | | | 4,434,429 | | | | 9,186 | |
China Shanshui Cement Group, Ltd. (Construction materials) | | | 4,109,000 | | | | 4,747 | |
Comba Telecom Systems Holdings, Ltd. (Communications equipment) | | | 2,717,526 | | | | 2,864 | |
Great Wall Motor Co., Ltd. (Automobiles) | | | 4,394,250 | | | | 7,228 | |
Haitian International Holdings, Ltd. (Machinery) | | | 6,451,496 | | | | 8,357 | |
Hengdeli Holdings, Ltd. (Specialty retail) | | | 13,632,000 | | | | 7,200 | |
See accompanying Notes to Financial Statements.
50 Semi-Annual Report | June 30, 2011 |
International Small Cap Growth Fund
Portfolio of Investments, June 30, 2011 (all dollar amounts in thousands) (unaudited)
| | | | | | | | |
Issuer | | Shares | | | Value | |
| |
Common Stocks—Emerging Asia—17.5%—(continued) | | | | | |
China—(continued) | | | | | | | | |
*Hollysys Automation Technologies, Ltd. (Electronic equipment, instruments & components)† | | | 217,113 | | | $ | 2,024 | |
Lonking Holdings, Ltd. (Machinery) | | | 15,078,000 | | | | 8,235 | |
Minth Group, Ltd. (Auto components) | | | 3,241,384 | | | | 5,240 | |
*Noah Holdings, Ltd.—ADR (Capital markets) | | | 106,979 | | | | 1,202 | |
*Simcere Pharmaceutical Group—ADR (Pharmaceuticals) | | | 82,832 | | | | 809 | |
*WuXi PharmaTech Cayman, Inc.—ADR (Life sciences tools & services) | | | 153,713 | | | | 2,699 | |
| | | | | | | | |
| | | | | | | 67,730 | |
| | | | | | | | |
India—2.6% | | | | | | | | |
eClerx Services, Ltd. (Professional services) | | | 257,570 | | | | 4,864 | |
Ipca Laboratories, Ltd. (Pharmaceuticals) | | | 565,748 | | | | 4,357 | |
*Jubilant Foodworks, Ltd. (Hotels, restaurants & leisure) | | | 253,570 | | | | 5,406 | |
Motherson Sumi Systems, Ltd. (Auto components) | | | 752,786 | | | | 3,797 | |
Oberoi Realty, Ltd. (Real estate management & development) | | | 294,587 | | | | 1,583 | |
| | | | | | | | |
| | | | | | | 20,007 | |
| | | | | | | | |
Indonesia—2.7% | | | | | | | | |
PT Harum Energy Tbk (Oil, gas & consumable fuels) | | | 6,983,000 | | | | 7,777 | |
PT Indofood CBP Sukses Makmur Tbk (Food products) | | | 4,792,000 | | | | 3,017 | |
PT Kalbe Farma Tbk (Pharmaceuticals) | | | 15,742,500 | | | | 6,196 | |
PT Perusahaan Perkebunan London Sumatra Indonesia Tbk (Food products) | | | 14,399,500 | | | | 3,904 | |
| | | | | | | | |
| | | | | | | 20,894 | |
| | | | | | | | |
South Korea—0.5% | | | | | | | | |
Daum Communications Corporation (Internet software & services) | | | 39,833 | | | | 4,141 | |
| | | | | | | | |
Taiwan—2.5% | | | | | | | | |
Powertech Technology, Inc. (Semiconductors & semiconductor equipment) | | | 1,690,000 | | | | 5,672 | |
Simplo Technology Co., Ltd. (Computers & peripherals) | | | 375,000 | | | | 3,022 | |
Tripod Technology Corporation (Electronic equipment, instruments & components) | | | 313,000 | | | | 1,297 | |
TSRC Corporation (Chemicals) | | | 2,224,000 | | | | 6,542 | |
TXC Corporation (Electronic equipment, instruments & components) | | | 1,362,269 | | | | 2,381 | |
| | | | | | | | |
| | | | | | | 18,914 | |
| | | | | | | | |
Thailand—0.4% | | | | | | | | |
Bangkok Dusit Medical Services PCL (Health care providers & services) | | | 1,588,700 | | | | 2,728 | |
| | | | | | | | |
Japan—15.7% | | | | | | | | |
Ain Pharmaciez, Inc. (Food & staples retailing) | | | 119,900 | | | | 4,915 | |
Asics Corporation (Textiles, apparel & luxury goods) | | | 384,000 | | | | 5,709 | |
CyberAgent, Inc. (Media) | | | 2,802 | | | | 9,777 | |
| | | | | | | | |
Issuer | | Shares | | | Value | |
| | |
Common Stocks—Japan—15.7% —(continued) | | | | | | | | |
Japan—(continued) | | | | | | | | |
Dr Ci:Labo Co., Ltd. (Personal products) | | | 1,011 | | | $ | 5,161 | |
Exedy Corporation (Auto components) | | | 496,800 | | | | 16,970 | |
F.C.C. Co., Ltd. (Auto components) | | | 346,509 | | | | 8,290 | |
Gree, Inc. (Internet software & services) | | | 723,430 | | | | 15,735 | |
K’s Holdings Corporation (Specialty retail) | | | 206,500 | | | | 8,914 | |
Kakaku.com, Inc. (Internet software & services) | | | 780 | | | | 5,474 | |
Miraca Holdings, Inc. (Health care providers & services) | | | 398,600 | | | | 16,116 | |
Nabtesco Corporation (Machinery) | | | 173,000 | | | | 4,165 | |
Nitori Co., Ltd. (Specialty retail) | | | 59,950 | | | | 5,682 | |
Osaka Securities Exchange Co., Ltd. (Diversified financial services) | | | 585 | | | | 2,605 | |
Sawai Pharmaceutical Co., Ltd. (Pharmaceuticals) | | | 83,800 | | | | 8,817 | |
United Arrows, Ltd. (Specialty retail) | | | 101,100 | | | | 2,135 | |
| | | | | | | | |
| | | | | | | 120,465 | |
| | | | | | | | |
Emerging Europe, Mid-East, Africa—5.5% | | | | | | | | |
Poland—0.5% | | | | | | | | |
* Lubelski Wegiel Bogdanka S.A. (Oil, gas & consumable fuels) | | | 84,808 | | | | 3,553 | |
| | | | | | | | |
Russia—0.3% | | | | | | | | |
* Etalon Group Ltd.—144A—GDR (Real estate management & development)† | | | 366,337 | | | | 2,524 | |
| | | | | | | | |
South Africa—3.2% | | | | | | | | |
Capitec Bank Holdings, Ltd. (Commercial banks) | | | 135,119 | | | | 3,617 | |
Clicks Group, Ltd. (Multiline retail) | | | 1,606,486 | | | | 10,038 | |
Coronation Fund Managers, Ltd. (Capital markets) | | | 941,647 | | | | 2,687 | |
Mr Price Group, Ltd. (Specialty retail) | | | 791,515 | | | | 7,983 | |
| | | | | | | | |
| | | | | | | 24,325 | |
| | | | | | | | |
Turkey—1.1% | | | | | | | | |
Tofas Turk Otomobil Fabrikasi A.S. (Automobiles) | | | 992,081 | | | | 4,523 | |
Turkiye Sinai Kalkinma Bankasi A.S. (Commercial banks) | | | 2,300,672 | | | | 3,686 | |
| | | | | | | | |
| | | | | | | 8,209 | |
| | | | | | | | |
United Arab Emirates—0.4% | | | | | | | | |
Aramex Co. (Air freight & logistics) | | | 7,033,580 | | | | 3,370 | |
| | | | | | | | |
Canada—4.9% | | | | | | | | |
Canadian Western Bank (Commercial banks) | | | 381,300 | | | | 12,177 | |
Dollarama, Inc. (Multiline retail) | | | 61,408 | | | | 2,080 | |
Home Capital Group, Inc. (Thrifts & mortgage finance) | | | 94,036 | | | | 5,046 | |
* Legacy Oil + Gas, Inc. (Oil, gas & consumable fuels) | | | 360,301 | | | | 4,375 | |
Petrominerales, Ltd. (Oil, gas & consumable fuels) | | | 240,600 | | | | 7,062 | |
Peyto Exploration & Development Corporation (Oil, gas & consumable fuels) | | | 293,282 | | | | 6,538 | |
| | | | | | | | |
| | | | | | | 37,278 | |
| | | | | | | | |
See accompanying Notes to Financial Statements.
June 30, 2011 | William Blair Funds 51 |
International Small Cap Growth Fund
Portfolio of Investments, June 30, 2011 (all dollar amounts in thousands) (unaudited)
| | | | | | | | |
Issuer | | Shares or
Principal
Amount | | | Value | |
| | |
Common Stocks—(continued) | | | | | | | | |
| | |
Emerging Latin America—4.6% | | | | | | | | |
Brazil—3.1% | | | | | | | | |
*Arezzo Industria e Comercio S.A. (Textiles, apparel & luxury goods) | | | 246,596 | | | $ | 3,453 | |
CETIP S.A. - Balcao Organizado de Ativos e Derivativos (Capital markets) | | | 333,400 | | | | 5,159 | |
Drogasil S.A. (Food & staples retailing) | | | 423,500 | | | | 2,890 | |
OdontoPrev S.A. (Health care providers & services) | | | 362,500 | | | | 6,039 | |
Restoque Comercio e Confeccoes de Roupas S.A. (Textiles, apparel & luxury goods) | | | 201,200 | | | | 2,578 | |
*T4F Entretenimento S.A. (Media) | | | 146,500 | | | | 1,319 | |
Tegma Gestao Logistica S.A. (Road & rail) | | | 147,300 | | | | 2,383 | |
| | | | | | | | |
| | | | | | | 23,821 | |
| | | | | | | | |
Chile—0.5% | | | | | | | | |
*CFR Pharmaceuticals S.A. (Pharmaceuticals) | | | 14,325,161 | | | | 3,893 | |
| | | | | | | | |
Mexico—1.0% | | | | | | | | |
Compartamos S.A.B. de C.V. (Consumer finance) | | | 665,828 | | | | 1,208 | |
*Genomma Lab Internacional S.A.B. de C.V. (Pharmaceuticals) | | | 1,830,020 | | | | 4,658 | |
Grupo Comercial Chedraui S.A. de C.V. (Food & staples retailing) | | | 626,187 | | | | 1,965 | |
| | | | | | | | |
| | | | | | | 7,831 | |
| | | | | | | | |
| | |
Asia—3.2% | | | | | | | | |
Australia—1.4% | | | | | | | | |
Cochlear, Ltd. (Health care equipment & supplies) | | | 68,660 | | | | 5,302 | |
Iress Market Technology, Ltd. (IT services) | | | 547,781 | | | | 5,294 | |
| | | | | | | | |
| | | | | | | 10,596 | |
| | | | | | | | |
Hong Kong—1.6% | | | | | | | | |
SmarTone Telecommunications Holdings, Ltd. (Wireless telecommunication services) | | | 6,073,000 | | | | 9,037 | |
Value Partners Group, Ltd. (Capital markets) | | | 3,943,000 | | | | 3,375 | |
| | | | | | | | |
| | | | | | | 12,412 | |
| | | | | | | | |
Singapore—0.2% | | | | | | | | |
Goodpack, Ltd. (Air freight & logistics) | | | 1,228,000 | | | | 1,829 | |
| | | | | | | | |
Total Common Stocks—95.8%
(cost $619,128) | | | | | | | 736,120 | |
| | | | | | | | |
| | |
Rights | | | | | | | | |
Brazil—0.0% | | | | | | | | |
*CETIP S.A. - Balcao Organizado de Ativos e Derivativos (Capital markets) | | | 2,455 | | | | 37 | |
| | | | | | | | |
Total Rights—0.0%
(cost $34) | | | | | | | 37 | |
| | | | | | | | |
| | | | | | | | |
Issuer | | Shares or
Principal
Amount | | | Value | |
| | |
| | | | | | | | |
| | |
Convertible Bond | | | | | | | | |
Brazil—0.1% | | | | | | | | |
Lupatech S.A., 6.500%, due 4/15/18 (Machinery)**§ | | $ | 959 | | | $ | 632 | |
| | | | | | | | |
Total Convertible Bond—0.1%
(cost $497) | | | | | | | 632 | |
| | | | | | | | |
| | |
Repurchase Agreement | | | | | | | | |
Fixed Income Clearing Corporation, 0.010% dated 6/30/11, due 7/1/11, repurchase price $21,114, collateralized by FHLMC, 2.000%, due 12/3/15 | | | 21,114 | | | | 21,114 | |
| | | | | | | | |
Total Repurchase Agreement—2.7%
(cost $21,114) | | | | 21,114 | |
| | | | | | | | |
Total Investments—98.6%
(cost $640,773) | | | | 757,903 | |
Cash and other assets, less liabilities—1.4% | | | | 10,696 | |
| | | | | | | | |
Net assets—100.0% | | | $ | 768,599 | |
| | | | | | | | |
*Non-income producing securities
ADR = American Depository Receipt
† = U.S. listed foreign security
** = Fair valued pursuant to Valuation Procedures adopted by the Board of Trustees. This holding represents 0.08% of the Fund’s net assets at June 30, 2011.
§ = Deemed illiquid pursuant to Liquidity Procedures approved by the Board of Trustees. This holding represents 0.08% of the net assets at June 30, 2011.
For securities primarily traded on exchanges or markets that close before the close of regular trading on the New York Stock Exchange, the Fund may use an independent pricing service to fair value price the securities pursuant to Valuation Procedures approved by the Board of Trustees.
At June 30, 2011, the Fund’s Portfolio of Investments includes the following industry categories:
| | | | |
Consumer Discretionary | | | 28.2% | |
Industrials | | | 17.6% | |
Information Technology | | | 16.3% | |
Health Care | | | 12.0% | |
Financials | | | 11.9% | |
Consumer Staples | | | 5.9% | |
Energy | | | 4.6% | |
Materials | | | 2.3% | |
Telecommunication Services | | | 1.2% | |
| | | | |
Total | | | 100.0% | |
| | | | |
See accompanying Notes to Financial Statements.
52 Semi-Annual Report | June 30, 2011 |
International Small Cap Growth Fund
Portfolio of Investments, June 30, 2011 (all dollar amounts in thousands) (unaudited)
At June 30, 2011, the Fund’s Portfolio of Investments includes the following currency categories:
| | | | |
British Pound Sterling | | | 20.7% | |
Euro | | | 17.7% | |
Japanese Yen | | | 16.3% | |
Hong Kong Dollar | | | 11.0% | |
Canadian Dollar | | | 5.1% | |
Swedish Krona | | | 3.7% | |
Brazilian Real | | | 3.3% | |
South African Rand | | | 3.3% | |
Swiss Franc | | | 3.1% | |
Indonesian Rupiah | | | 2.8% | |
Indian Rupee | | | 2.7% | |
New Taiwan Dollar | | | 2.6% | |
Australian Dollar | | | 1.4% | |
U.S. Dollar | | | 1.3% | |
Turkish Lira | | | 1.1% | |
Mexican Peso | | | 1.1% | |
All Other Currencies | | | 2.8% | |
| | | | |
Total | | | 100.0% | |
| | | | |
June 30, 2011 | William Blair Funds 53 |

Todd M. McClone
Jeffrey A. Urbina
EMERGING MARKETS GROWTH FUND
The Emerging Markets Growth Fund seeks long-term capital appreciation.
AN OVERVIEW FROM THE PORTFOLIO MANAGERS
The Emerging Markets Growth Fund posted a 0.70% decrease (Class N Shares) for the six months ended June 30, 2011. By comparison, the Fund’s benchmark, the MSCI Emerging Markets IMI Index (net), increased 0.32%.
Despite strong second quarter results, the Fund slightly trailed the Index year to date, due to underperformance in January and February. In particular, the Fund’s lack of Russian energy holdings detracted approximately 0.50% from relative results year to date, while a focus on higher growth exploration companies also detracted from results, as lower growth integrated oils outperformed. Moreover, Pacific Rubiales Energy Corp., the Colombian oil and gas company, lagged on production delays. In addition, the Fund’s investment in Commercial International Bank in Egypt detracted from results as the government was overthrown, along with Turkish Banks, which underperformed the broader market on monetary policy tightening. Somewhat offsetting these effects was the Fund’s weighting and stock selection in Consumer Discretionary, on auto-related and retail strength, coupled with strong Emerging Asian Financial performance on positive commercial bank, real estate and insurance stock selection. Information Technology (IT) and Materials also outperformed on strong performance by Baidu, Inc., the Chinese web search company, on good results and a positive outlook, coupled with a focus on chemicals.
Over the six month period, the Fund maintained its significant exposure to Consumer stocks, well ahead of the Index weighting, due largely to auto-related exposure and a higher Consumer Staples weighting. Conversely, the Energy and Materials sectors were significantly underweighted as the Fund had lower exposure in mining shares as well as Energy exploration and production companies. Financials were also underweighted during the period, given the increasing interest rate environment amidst inflationary concerns, and the impact on net interest margins and profitability. Information Technology increased during the period from approximately 11% to 17% as corporate fundamentals improved, given increased smart phone and tablet demand and a positive product cycle. Regionally, the Fund had a higher exposure than the Index in Latin America holdings, due largely to Brazil, at the expense of Emerging Europe, Middle East, and Africa, where there was no exposure in Resources and limited Russian and Eastern European holdings. Emerging Asia, while underweighted during the entire period, increased as the Fund invested in additional Korean companies on improving outlooks, Taiwanese tech on improving demand, and incrementally in China as its central bank moved further along in the tightening cycle.
54 Semi-Annual Report | June 30, 2011 |
Emerging Markets Growth Fund
Performance Highlights (unaudited)
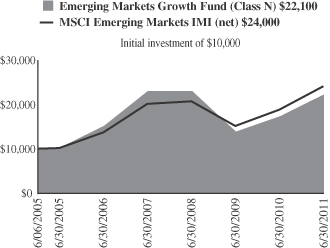
Average Annual Total Return at 6/30/2011
| | | | | | | | | | | | | | | | | | | | |
| | | Year To
Date | | | 1
Year | | | 3
Year | | | 5
Year | | | Since
Inception(a) | |
Class N | | | (0.70 | )% | | | 28.05 | % | | | (1.15 | )% | | | 7.92 | % | | | 13.95 | % |
Class I | | | (0.57 | ) | | | 28.32 | | | | (0.92 | ) | | | 8.17 | | | | 14.22 | |
MSCI Emerging Markets IMI (net) | | | 0.32 | | | | 27.53 | | | | 5.13 | | | | 11.90 | | | | 15.43 | |
| | (a) | | For the period from June 6, 2005 (Commencement of Operations) to June 30, 2011. |
Performance cited represents past performance. Past performance does not guarantee future results and current performance may be lower or higher than the data quoted. Results shown are average annual returns, which assume reinvestment of dividends and capital gains. Investment returns and principal will fluctuate and you may have a gain or loss when you sell shares. For the most current month-end performance information, please call 1-800-742-7272, or visit our Web site at www.williamblairfunds.com. From time to time, the investment advisor may waive fees or reimburse expenses for the Fund. Without these waivers, performance would be lower. International investing involves special risk considerations, including currency fluctuations, lower liquidity, economic and political risk. Class N shares are available to the general public without a sales load. Class I shares are available to certain institutional investors and advisory clients of William Blair & Company L.L.C. without a sales load or distribution (12b-1) fees.
The performance highlights and graph presented above do not reflect the deduction of taxes that a shareholder would pay on fund distributions or the redemption of fund shares.
The Morgan Stanley Capital International (MSCI) Emerging Markets Investable Market Index (IMI) (net) is a free float-adjusted market capitalization weighted index that is designed to measure the equity market performance of emerging markets. This series approximates the minimum possible dividend reinvestment.
This report identifies the Fund’s investments on June 30, 2011. These holdings are subject to change. Not all stocks in the Fund performed the same, nor is there any guarantee that these stocks will perform as well in the future. Market forecasts provided in this report may not necessarily come to pass.
Sector Diversification (unaudited)
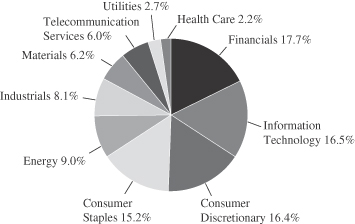
The sector diversification shown is based on the total long-term securities.
June 30, 2011 | William Blair Funds 55 |
Emerging Markets Growth Fund
Portfolio of Investments, June 30, 2011 (all dollar amounts in thousands) (unaudited)
| | | | | | | | |
Issuer | | Shares | | | Value | |
| |
Common Stocks—Emerging Asia—57.3% | | | | | |
China—15.5% | | | | | | | | |
AAC Technologies Holdings, Inc. (Communications equipment) | | | 1,205,949 | | | $ | 2,808 | |
Ajisen China Holdings, Ltd. (Hotels, restaurants & leisure) | | | 1,500,078 | | | | 3,107 | |
Anhui Conch Cement Co., Ltd. (Construction materials) | | | 2,124,500 | | | | 9,938 | |
Anta Sports Products, Ltd. (Textiles, apparel & luxury goods) | | | 1,306,000 | | | | 2,333 | |
*Baidu, Inc.—ADR (Internet software & services) | | | 106,759 | | | | 14,960 | |
Belle International Holdings, Ltd. (Specialty retail) | | | 4,757,000 | | | | 10,025 | |
China Shanshui Cement Group, Ltd. (Construction materials) | | | 1,909,000 | | | | 2,205 | |
China Vanke Co., Ltd. (Real estate management & development) | | | 5,594,249 | | | | 7,534 | |
China Yurun Food Group, Ltd. (Food products) | | | 1,232,000 | | | | 3,467 | |
CNOOC, Ltd. (Oil, gas & consumable fuels) | | | 7,413,000 | | | | 17,300 | |
Comba Telecom Systems Holdings, Ltd. (Communications equipment) | | | 2,084,496 | | | | 2,197 | |
Dongfeng Motor Group Co., Ltd. (Automobiles) | | | 5,748,000 | | | | 10,858 | |
Great Wall Motor Co., Ltd. (Automobiles) | | | 1,620,500 | | | | 2,666 | |
Haitian International Holdings, Ltd. (Machinery) | | | 1,460,185 | | | | 1,891 | |
Hengdeli Holdings, Ltd. (Specialty retail) | | | 5,724,000 | | | | 3,023 | |
Industrial and Commercial Bank of China, Ltd. Class “H” (Commercial banks) | | | 22,936,580 | | | | 17,420 | |
Lonking Holdings, Ltd. (Machinery) | | | 5,675,000 | | | | 3,099 | |
Minth Group, Ltd. (Auto components) | | | 724,000 | | | | 1,170 | |
Tencent Holdings, Ltd. (Internet software & services) | | | 166,600 | | | | 4,522 | |
Want Want China Holdings, Ltd.
(Food products) | | | 4,894,000 | | | | 4,748 | |
Weichai Power Co., Ltd. (Machinery) | | | 578,088 | | | | 3,373 | |
*WuXi PharmaTech Cayman, Inc.—ADR (Life sciences tools & services) | | | 96,496 | | | | 1,695 | |
*Youku.com, Inc.—ADR (Internet software & services) | | | 102,085 | | | | 3,507 | |
Zhuzhou CSR Times Electric Co., Ltd. (Electrical equipment) | | | 658,861 | | | | 2,223 | |
| | | | | | | | |
| | | | | | | 136,069 | |
| | | | | | | | |
India—9.4% | | | | | | | | |
Asian Paints, Ltd. (Chemicals) | | | 70,630 | | | | 5,033 | |
Axis Bank, Ltd. (Commercial banks) | | | 222,205 | | | | 6,410 | |
Bajaj Auto, Ltd. (Automobiles) | | | 116,007 | | | | 3,652 | |
Bharat Heavy Electricals, Ltd. (Electrical equipment) | | | 148,377 | | | | 6,806 | |
Dabur India, Ltd. (Personal products) | | | 867,230 | | | | 2,212 | |
Housing Development Finance Corporation (Thrifts & mortgage finance) | | | 272,951 | | | | 4,313 | |
IndusInd Bank, Ltd. (Commercial banks) | | | 346,602 | | | | 2,109 | |
Infosys Technologies, Ltd. (IT services) | | | 310,940 | | | | 20,244 | |
ITC, Ltd. (Tobacco) | | | 1,602,902 | | | | 7,277 | |
*Jubilant Foodworks, Ltd. (Hotels, restaurants & leisure) | | | 157,714 | | | | 3,362 | |
| | | | | | | | |
Issuer | | Shares | | | Value | |
|
Common Stocks— Emerging Asia—57.3%—(continued) | |
India—9.4%—(continued) | | | | | | | | |
Lupin, Ltd. (Pharmaceuticals) | | | 301,509 | | | $ | 3,030 | |
Motherson Sumi Systems, Ltd. (Auto components) | | | 467,205 | | | | 2,356 | |
Nestle India, Ltd. (Food products) | | | 59,028 | | | | 5,425 | |
Shriram Transport Finance Co., Ltd. (Consumer finance) | | | 92,800 | | | | 1,280 | |
Tata Consultancy Services, Ltd. (IT services) | | | 191,892 | | | | 5,083 | |
Tata Motors, Ltd. (Machinery) | | | 191,020 | | | | 4,248 | |
| | | | | | | | |
| | | | | | | 82,840 | |
| | | | | | | | |
Indonesia—6.2% | | | | | | | | |
PT Astra International Tbk (Automobiles) | | | 2,169,000 | | | | 16,074 | |
PT Bank Rakyat Indonesia (Commercial banks) | | | 13,474,500 | | | | 10,213 | |
PT Indo Tambangraya Megah (Oil, gas & consumable fuels) | | | 1,376,500 | | | | 7,183 | |
PT Indofood Sukses Makmur Tbk (Food products) | | | 6,788,000 | | | | 4,551 | |
PT Kalbe Farma Tbk (Pharmaceuticals) | | | 8,234,500 | | | | 3,241 | |
PT Perusahaan Gas Negara (Gas utilities) | | | 9,405,500 | | | | 4,415 | |
PT Unilever Indonesia Tbk (Household products) | | | 2,572,000 | | | | 4,469 | |
PT United Tractors Tbk (Machinery) | | | 967,257 | | | | 2,808 | |
PT XL Axiata Tbk (Diversified telecommunication services) | | | 2,409,500 | | | | 1,728 | |
| | | | | | | | |
| | | | | | | 54,682 | |
| | | | | | | | |
Malaysia—3.5% | | | | | | | | |
Axiata Group Bhd (Wireless telecommunication services) | | | 5,319,900 | | | | 8,827 | |
CIMB Group Holdings Bhd (Commercial banks) | | | 4,764,300 | | | | 14,090 | |
Genting Bhd (Hotels, restaurants & leisure) | | | 1,154,300 | | | | 4,289 | |
Kuala Lumpur Kepong Bhd (Food products) | | | 450,800 | | | | 3,309 | |
| | | | | | | | |
| | | | | | | 30,515 | |
| | | | | | | | |
Papua New Guinea—1.2% | | | | | | | | |
Oil Search, Ltd. (Oil, gas & consumable fuels) | | | 1,479,460 | | | | 10,552 | |
| | | | | | | | |
Philippines—0.2% | | | | | | | | |
Alliance Global Group, Inc. (Industrial conglomerates) | | | 8,233,100 | | | | 2,078 | |
| | | | | | | | |
South Korea—11.2% | | | | | | | | |
Honam Petrochemical Corporation (Chemicals) | | | 12,098 | | | | 4,482 | |
Hyundai Mobis (Auto components) | | | 45,849 | | | | 17,178 | |
Hyundai Motor Co. (Automobiles) | | | 79,477 | | | | 17,642 | |
LG Household & Health Care, Ltd. (Household products) | | | 19,445 | | | | 8,360 | |
Samsung Electronics Co., Ltd. (Semiconductors & semiconductor equipment) | | | 33,315 | | | | 25,775 | |
Samsung Engineering Co., Ltd. (Construction & engineering) | | | 64,433 | | | | 15,389 | |
Samsung Fire & Marine Insurance Co., Ltd. (Insurance) | | | 31,780 | | | | 7,382 | |
Samsung Heavy Industries Co., Ltd. (Machinery) | | | 54,491 | | | | 2,429 | |
| | | | | | | | |
| | | | | | | 98,637 | |
| | | | | | | | |
See accompanying Notes to Financial Statements.
56 Semi-Annual Report | June 30, 2011 |
Emerging Markets Growth Fund
Portfolio of Investments, June 30, 2011 (all dollar amounts in thousands) (unaudited)
| | | | | | | | |
Issuer | | Shares | | | Value | |
|
Common Stocks— Emerging Asia—57.3%—(continued) | |
Taiwan—7.8% | | | | | | | | |
Hon Hai Precision Industry Co., Ltd. (Electronic equipment, instruments & components) | | | 5,860,992 | | | $ | 20,099 | |
HTC Corporation (Communications equipment) | | | 580,000 | | | | 19,506 | |
Powertech Technology, Inc. (Semiconductors & semiconductor equipment) | | | 1,080,000 | | | | 3,625 | |
Simplo Technology Co., Ltd. (Computers & peripherals) | | | 793,000 | | | | 6,391 | |
*TPK Holding Co., Ltd. (Electronic equipment, instruments & components) | | | 241,000 | | | | 7,341 | |
Tripod Technology Corporation (Electronic equipment, instruments & components) | | | 190,000 | | | | 787 | |
TSRC Corporation (Chemicals) | | | 1,324,000 | | | | 3,895 | |
Yuanta Financial Holding Co., Ltd. (Capital markets) | | | 9,877,000 | | | | 6,843 | |
| | | | | | | | |
| | | | | | | 68,487 | |
| | | | | | | | |
Thailand—2.3% | | | | | | | | |
CP ALL PCL (Food & staples retailing) | | | 7,411,100 | | | | 10,673 | |
Kasikornbank PCL (Commercial banks) | | | 2,192,700 | | | | 8,921 | |
Minor International PCL (Hotels, restaurants & leisure) | | | 1,966,700 | | | | 730 | |
| | | | | | | | |
| | | | | | | 20,324 | |
| | | | | | | | |
| | |
Emerging Latin America—24.1% | | | | | | | | |
Brazil—13.7% | | | | | | | | |
BR Malls Participacoes S.A. (Real estate management & development) | | | 602,300 | | | | 6,889 | |
BR Properties S.A. (Real estate management & development) | | | 187,345 | | | | 2,101 | |
CETIP S.A.—Balcao Organizado de Ativos e Derivativos (Capital markets) | | | 299,600 | | | | 4,636 | |
Cia de Bebidas das Americas—ADR (Beverages) | | | 811,836 | | | | 27,383 | |
Cia de Concessoes Rodoviarias (Transportation infrastructure) | | | 229,300 | | | | 6,825 | |
Cia Hering (Specialty retail) | | | 234,400 | | | | 5,392 | |
CPFL Energia S.A.—ADR (Electric utilities) | | | 101,881 | | | | 8,853 | |
Drogasil S.A. (Food & staples retailing) | | | 261,600 | | | | 1,785 | |
Embraer S.A.—ADR (Aerospace & defense) | | | 311,752 | | | | 9,596 | |
Lojas Renner S.A. (Multiline retail) | | | 201,300 | | | | 7,675 | |
Natura Cosmeticos S.A. (Personal products) | | | 29,100 | | | | 727 | |
OdontoPrev S.A. (Health care providers & services) | | | 142,900 | | | | 2,381 | |
*OGX Petroleo e Gas Participacoes S.A. (Oil, gas & consumable fuels) | | | 410,900 | | | | 3,841 | |
Sul America S.A. (Insurance) | | | 197,257 | | | | 2,477 | |
Totvs S.A. (Software) | | | 198,000 | | | | 3,654 | |
Tractebel Energia S.A. (Independent power producers & energy traders) | | | 565,300 | | | | 9,961 | |
Vale S.A.—ADR (Metals & mining) | | | 500,156 | | | | 15,980 | |
| | | | | | | | |
| | | | | | | 120,156 | |
| | | | | | | | |
Chile—2.8% | | | | | | | | |
Banco Santander Chile—ADR (Commercial banks) | | | 154,427 | | | | 14,487 | |
*CFR Pharmaceuticals S.A. (Pharmaceuticals) | | | 8,816,489 | | | | 2,396 | |
Sociedad Quimica y Minera de Chile S.A.—ADR (Chemicals) | | | 71,213 | | | | 4,609 | |
| | | | | | | | |
Issuer | | Shares | | | Value | |
|
Common Stocks— Emerging Latin America—24.1%—(continued) | |
Chile—2.8%—(continued) | | | | | | | | |
Sonda S.A. (IT services) | | | 1,079,025 | | | $ | 2,976 | |
| | | | | | | | |
| | | | | | | 24,468 | |
| | | | | | | | |
Colombia—0.6% | | | | | | | | |
Pacific Rubiales Energy Corporation (Oil, gas & consumable fuels) | | | 215,522 | | | | 5,777 | |
| | | | | | | | |
Mexico—6.5% | | | | | | | | |
America Movil S.A.B. de C.V. (Wireless telecommunication services) | | | 16,570,500 | | | | 22,347 | |
Coca-Cola Femsa S.A.B. de C.V.—ADR (Beverages) | | | 65,200 | | | | 6,064 | |
*Genomma Lab Internacional S.A.B. de C.V. (Pharmaceuticals) | | | 1,266,134 | | | | 3,222 | |
Grupo Comercial Chedraui S.A. de C.V. (Food & staples retailing) | | | 360,966 | | | | 1,133 | |
Grupo Mexico S.A.B. de C.V. Series “B” (Metals & mining) | | | 1,763,228 | | | | 5,822 | |
Mexichem S.A.B. de C.V. (Chemicals) | | | 398,400 | | | | 1,614 | |
Wal-Mart de Mexico S.A.B. de C.V. (Food & staples retailing) | | | 5,621,700 | | | | 16,685 | |
| | | | | | | | |
| | | | | | | 56,887 | |
| | | | | | | | |
Peru—0.5% | | | | | | | | |
Credicorp, Ltd. (Commercial banks)† | | | 49,504 | | | | 4,262 | |
| | | | | | | | |
|
Emerging Europe, Mid-East, Africa—14.2% | |
Poland—0.4% | | | | | | | | |
Eurocash S.A. (Food & staples retailing) | | | 388,230 | | | | 4,176 | |
| | | | | | | | |
Qatar—1.7% | | | | | | | | |
Industries Qatar QSC (Industrial conglomerates) | | | 229,427 | | | | 8,581 | |
Qatar National Bank S.A.Q. (Commercial banks) | | | 162,184 | | | | 6,280 | |
| | | | | | | | |
| | | | | | | 14,861 | |
| | | | | | | | |
Russia—1.9% | | | | | | | | |
*Etalon Group Ltd.—144A—GDR (Real estate management & development) | | | 328,708 | | | | 2,265 | |
Magnit OAO (Food & staples retailing)† | | | 73,220 | | | | 9,858 | |
*X5 Retail Group N.V.—GDR (Food & staples retailing) | | | 113,593 | | | | 4,441 | |
| | | | | | | | |
| | | | | | | 16,564 | |
| | | | | | | | |
South Africa—8.9% | | | | | | | | |
Clicks Group, Ltd. (Multiline retail) | | | 956,170 | | | | 5,974 | |
Life Healthcare Group Holdings, Ltd. (Health care providers & services) | | | 1,256,331 | | | | 3,268 | |
Mr Price Group, Ltd. (Specialty retail) | | | 466,397 | | | | 4,704 | |
MTN Group, Ltd. (Wireless telecommunication services) | | | 915,239 | | | | 19,478 | |
Naspers, Ltd. (Media) | | | 118,109 | | | | 6,672 | |
Sasol, Ltd. (Oil, gas & consumable fuels) | | | 293,110 | | | | 15,431 | |
Shoprite Holdings, Ltd. (Food & staples retailing) | | | 348,941 | | | | 5,253 | |
Standard Bank Group, Ltd. (Commercial banks) | | | 451,232 | | | | 6,671 | |
*The Foschini Group, Ltd. (Specialty retail) | | | 353,142 | | | | 4,607 | |
See accompanying Notes to Financial Statements.
June 30, 2011 | William Blair Funds 57 |
Emerging Markets Growth Fund
Portfolio of Investments, June 30, 2011 (all dollar amounts in thousands) (unaudited)
| | | | | | | | |
Issuer | | Shares or
Principal
Amount | | | Value | |
|
Common Stocks— Emerging Europe, Mid-East,
Africa—14.2%—(continued) | |
South Africa—8.9%—(continued) | | | | | | | | |
Truworths International, Ltd. (Specialty retail) | | | 579,601 | | | $ | 6,282 | |
| | | | | | | | |
| | | | | | | 78,340 | |
| | | | | | | | |
Turkey—1.3% | | | | | | | | |
Tofas Turk Otomobil Fabrikasi A.S. (Automobiles) | | | 630,894 | | | | 2,877 | |
Turkiye Halk Bankasi A.S. (Commercial banks) | | | 1,121,029 | | | | 8,392 | |
| | | | | | | | |
| | | | | | | 11,269 | |
| | | | | | | | |
Total Common Stocks—95.6%
(cost $719,150) | | | | | | | 840,944 | |
| | | | | | | | |
| | |
Preferred Stocks | | | | | | | | |
Brazil—3.1% | | | | | | | | |
Itau Unibanco Holding S.A. (Commercial banks) | | | 393,254 | | | | 9,185 | |
Petroleo Brasileiro S.A. (Oil, gas & consumable fuels) | | | 1,178,615 | | | | 17,913 | |
| | | | | | | | |
| | | | | | | 27,098 | |
| | | | | | | | |
Total Preferred Stocks—3.1%
(cost $26,521) | | | | | | | 27,098 | |
| | | | | | | | |
| | |
Rights | | | | | | | | |
Brazil—0.0% | | | | | | | | |
*CETIP S.A.—Balcao Organizado de Ativos e Derivativos (Capital markets) | | | 2,889 | | | | 43 | |
| | | | | | | | |
Total Rights—0.0%
(cost $40) | | | | | | | 43 | |
| | | | | | | | |
| | |
Convertible Bond | | | | | | | | |
Brazil—0.1% | | | | | | | | |
Lupatech S.A., 6.500%, due 4/15/18 (Machinery)**§ | | $ | 1,602 | | | | 1,055 | |
| | | | | | | | |
Total Convertible Bond—0.1%
(cost $831) | | | | | | | 1,055 | |
| | | | | | | | |
Total Investments—98.8%
(cost $746,542) | | | | | | | 869,140 | |
Cash and other assets, less liabilities—1.2% | | | | | | | 10,449 | |
| | | | | | | | |
Net assets—100.0% | | | | | | $ | 879,589 | |
| | | | | | | | |
ADR = American Depository Receipt
GDR = Global Depository Receipt
* Non-income producing securities
† = U.S. listed foreign security
** = Fair valued pursuant to Valuation Procedures adopted by the Board of Trustees. This holding represents 0.12% of the Fund’s net assets at June 30, 2011.
§ = Deemed illiquid pursuant to Liquidity Procedures approved by the Board of Trustees. This holding represents 0.12% of the net assets at June 30, 2011.
For securities primarily traded on exchanges or markets that close before the close of regular trading on the New York Stock Exchange, the Fund may use an independent pricing service to fair value price the securities pursuant to Valuation Procedures approved by the Board of Trustees.
At June 30, 2011, the Fund’s Portfolio of Investments includes the following industry categories:
| | | | |
Financials | | | 17.7% | |
Information Technology | | | 16.5% | |
Consumer Discretionary | | | 16.4% | |
Consumer Staples | | | 15.2% | |
Energy | | | 9.0% | |
Industrials | | | 8.1% | |
Materials | | | 6.2% | |
Telecommunication Services | | | 6.0% | |
Utilities | | | 2.7% | |
Health Care | | | 2.2% | |
| | | | |
Total | | | 100.0% | |
| | | | |
At June 30, 2011, the Fund’s Portfolio of Investments includes the following currency categories:
| | | | |
U.S. Dollar | | | 14.7% | |
Hong Kong Dollar | | | 13.3% | |
South Korean Won | | | 11.4% | |
Brazilian Real | | | 10.0% | |
Indian Rupee | | | 9.5% | |
South African Rand | | | 9.0% | |
New Taiwan Dollar | | | 7.9% | |
Indonesian Rupiah | | | 6.3% | |
Mexican Peso | | | 5.9% | |
Malaysian Ringgit | | | 3.5% | |
Thai Baht | | | 2.3% | |
Qatari Rial | | | 1.7% | |
Turkish Lira | | | 1.3% | |
Australian Dollar | | | 1.2% | |
All Other Currencies | | | 2.0% | |
| | | | |
Total | | | 100.0% | |
| | | | |
See accompanying Notes to Financial Statements.
58 Semi-Annual Report | June 30, 2011 |
Todd M. McClone
Jeffrey A. Urbina
EMERGING LEADERS GROWTH FUND
The Emerging Leaders Growth Fund seeks long-term capital appreciation.
AN OVERVIEW FROM THE PORTFOLIO MANAGERS
The Emerging Leaders Growth Fund posted a 2.42% decrease (Class N Shares) for the six months ended June 30, 2011. By comparison, the Fund’s benchmark, the MSCI Emerging Markets Large Cap Index (net) increased by 0.97%.
Despite second quarter outperformance, the Emerging Leaders Growth Fund trailed the Index year to date, due to underperformance at the outset of 2011. Underperformance was largely driven by Energy and Financials stock selection. Within Energy, the Fund’s lack of Russian Energy exposure during the first quarter was a key detractor, costing approximately 0.65% in relative performance year to date. In addition, production delays by Pacific Rubiales Energy Corporation, one of the top holdings of the Fund, also contributed approximately 0.55% to underperformance during the period. The Fund sold the company in the second quarter on an uncertain production growth outlook. Financials underperformed across regions.
Over the six month period, the Fund maintained significant exposure in Consumer stocks, well ahead of the Index weighting, due largely to auto-related exposure and Consumer Staples weightings, in addition to select specialty retailers, as these companies benefited from increased disposable income as wages increased. Conversely, the Fund was underweighted in Financials, given tightening monetary policy on inflationary concerns and the impact on net interest margins and profitability. During the six month period, we reduced Energy and Materials holdings. The Energy reduction followed the spike in energy prices earlier in the year and as valuations increased, while Materials was reduced largely due to individual company issues, although also resulting from moderating commodity prices. Conversely, Information Technology (IT) increased from approximately 10% as of year end to 16% mid year, as corporate fundamentals improved given increased smart phone and tablet demand and a consumer driven product cycle. Regionally, the Fund remained overweighted in Latin America throughout the six month period, with a lower exposure in Emerging Europe, Middle East, and Africa as there were no Energy and Materials holdings in the region, coupled with lower Eastern European and Russian weightings. Emerging Asia increased during the period due to higher IT weightings.
June 30, 2011 | William Blair Funds 59 |
Emerging Leaders Growth Fund
Performance Highlights (unaudited)
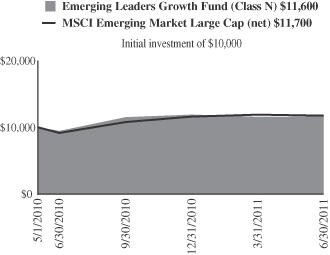
Average Annual Total Return at 6/30/2011
| | | | | | | | | | | | | | | | |
| | | Year
To Date | | | 1
Year | | | 3
Year | | | Since
Inception | |
Class N | | | (2.42 | )% | | | 23.12 | % | | | N/A | | | | 13.20 | %(a) |
MSCI Emerging Markets Large Cap Index (net) | | | 0.97 | | | | 27.87 | | | | N/A | | | | 14.22 | (a) |
Class I | | | (2.42 | ) | | | 23.19 | | | | 2.32 | % | | | 0.96 | (b) |
MSCI Emerging Markets Large Cap Index (net) | | | 0.97 | | | | 27.87 | | | | 3.41 | | | | 3.19 | (b) |
| | (a) | | For the period from May 3, 2010 (Commencement of Operations) to June 30, 2011. | |
| | (b) | | For the period from March 26, 2008 (Commencement of Operations) to June 30, 2011. | |
Performance cited represents past performance. Past performance does not guarantee future results and current performance may be lower or higher than the data quoted. Results shown are average annual total returns, which assume reinvestment of dividends and capital gains. Investment returns and principal will fluctuate and you may have a gain or loss when you sell shares. For the most current month-end performance information, please call 1-800-742-7272, or visit our Web site at www.williamblairfunds.com. International investing involves special risk considerations, including currency fluctuations, lower liquidity, economic and political risk. From time to time, the investment advisor may waive fees or reimburse expenses for the Fund. Without these waivers, performance would be lower. Class N shares are available to the general public without a sales load. Class I shares are available to certain institutional investors and advisory clients of William Blair & Company, L.L.C., without a sales load or distribution fees (12b-1).
The performance highlights and graph presented above do not reflect the deduction of taxes that a shareholder would pay on fund distributions or the redemption of fund shares.
The Morgan Stanley Capital International (MSCI) Emerging Markets Large Cap Index (net) is a free float-adjusted market capitalization weighted index that is designed to measure market performance of large capitalization stocks in emerging markets. This series approximates the minimum possible dividend reinvestment.
This report identifies the Fund’s investments on June 30, 2011. These holdings are subject to change. Not all stocks in the Fund performed the same, nor is there any guarantee that these stocks will perform as well in the future. Market forecasts provided in this report may not necessarily come to pass.
Sector Diversification (unaudited)
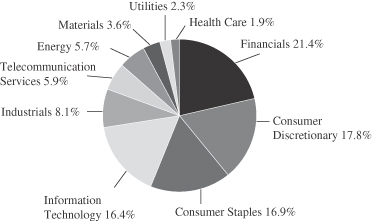
The sector diversification shown is based on the total long-term securities.
60 Semi-Annual Report | June 30, 2011 |
Emerging Leaders Growth Fund
Portfolio of Investments, June 30, 2011 (all dollar amounts in thousands) (unaudited)
| | | | | | | | |
Issuer | | Shares | | | Value | |
| | |
Common Stocks—Emerging Asia—55.6% | | | | | | | | |
China—16.6% | | | | | | | | |
*Baidu, Inc.—ADR (Internet software & services) | | | 21,584 | | | $ | 3,025 | |
Belle International Holdings, Ltd. (Specialty retail) | | | 921,973 | | | | 1,943 | |
China Vanke Co., Ltd. (Real estate management & development) | | | 633,771 | | | | 853 | |
CNOOC, Ltd. (Oil, gas & consumable fuels) | | | 811,000 | | | | 1,893 | |
Dongfeng Motor Group Co., Ltd. (Automobiles) | | | 1,018,790 | | | | 1,924 | |
Industrial and Commercial Bank of China, Ltd. Class “H” (Commercial banks) | | | 2,513,000 | | | | 1,909 | |
Ping An Insurance Group Co. of China, Ltd. Class “H” (Insurance) | | | 145,609 | | | | 1,503 | |
Shandong Weigao Group Medical Polymer Co., Ltd. (Health care equipment & supplies) | | | 280,000 | | | | 404 | |
Tencent Holdings, Ltd. (Internet software & services) | | | 68,905 | | | | 1,870 | |
Want Want China Holdings, Ltd. (Food products) | | | 1,428,948 | | | | 1,386 | |
| | | | | | | | |
| | | | | | | 16,710 | |
| | | | | | | | |
India—13.6% | | | | | | | | |
Bajaj Auto, Ltd. (Automobiles) | | | 15,628 | | | | 492 | |
HDFC Bank, Ltd. (Commercial banks) | | | 26,533 | | | | 1,493 | |
Housing Development Finance Corporation (Thrifts & mortgage finance) | | | 64,930 | | | | 1,026 | |
Infosys Technologies, Ltd. (IT services) | | | 28,535 | | | | 1,858 | |
ITC, Ltd. (Tobacco) | | | 437,650 | | | | 1,987 | |
Larsen & Toubro, Ltd. (Construction & engineering) | | | 37,647 | | | | 1,536 | |
Nestle India, Ltd. (Food products) | | | 5,046 | | | | 463 | |
Sun Pharmaceutical Industries, Ltd. (Pharmaceuticals) | | | 128,025 | | | | 1,426 | |
Tata Consultancy Services, Ltd. (IT services) | | | 74,018 | | | | 1,961 | |
Tata Motors, Ltd. (Machinery) | | | 64,514 | | | | 1,435 | |
| | | | | | | | |
| | | | | | | 13,677 | |
| | | | | | | | |
Indonesia—5.9% | | | | | | | | |
PT Astra International Tbk (Automobiles) | | | 387,500 | | | | 2,872 | |
PT Bank Rakyat Indonesia (Commercial banks) | | | 2,470,000 | | | | 1,872 | |
PT Indofood Sukses Makmur Tbk (Food products) | | | 1,707,500 | | | | 1,145 | |
| | | | | | | | |
| | | | | | | 5,889 | |
| | | | | | | | |
Malaysia—1.9% | | | | | | | | |
CIMB Group Holdings Bhd (Commercial banks) | | | 646,457 | | | | 1,912 | |
| | | | | | | | |
South Korea—11.6% | | | | | | | | |
Hyundai Mobis (Auto components) | | | 7,009 | | | | 2,626 | |
Hyundai Motor Co. (Automobiles) | | | 12,804 | | | | 2,842 | |
LG Household & Health Care, Ltd. (Household products) | | | 3,331 | | | | 1,432 | |
Samsung Electronics Co., Ltd. (Semiconductors & semiconductor equipment) | | | 3,601 | | | | 2,786 | |
Samsung Engineering Co., Ltd. (Construction & engineering) | | | 8,192 | | | | 1,957 | |
| | | | | | | | |
| | | | | | | 11,643 | |
| | | | | | | | |
| | | | | | | | |
Issuer | | Shares | | | Value | |
| |
Common Stocks— Emerging Asia—55.6%—(continued) | | | | | |
Taiwan—4.6% | | | | | | | | |
Hon Hai Precision Industry Co., Ltd. (Electronic equipment, instruments & components) | | | 605,000 | | | $ | 2,075 | |
HTC Corporation (Communications equipment) | | | 76,000 | | | | 2,556 | |
| | | | | | | | |
| | | | | | | 4,631 | |
| | | | | | | | |
Thailand—1.4% | | | | | | | | |
CP ALL PCL (Food & staples retailing) | | | 959,300 | | | | 1,381 | |
| | | | | | | | |
| | |
Emerging Latin America—22.9% | | | | | | | | |
Brazil—10.4% | | | | | | | | |
BR Malls Participacoes S.A. (Real estate management & development) | | | 127,800 | | | | 1,462 | |
Cia de Bebidas das Americas—ADR (Beverages) | | | 95,253 | | | | 3,213 | |
Cia de Concessoes Rodoviarias (Transportation infrastructure) | | | 32,100 | | | | 955 | |
CPFL Energia S.A.—ADR (Electric utilities) | | | 11,178 | | | | 971 | |
Embraer S.A.—ADR (Aerospace & defense) | | | 31,129 | | | | 958 | |
Natura Cosmeticos S.A. (Personal products) | | | 3,000 | | | | 75 | |
Tractebel Energia S.A. (Independent power producers & energy traders) | | | 73,600 | | | | 1,297 | |
Vale S.A.—ADR (Metals & mining) | | | 46,249 | | | | 1,478 | |
| | | | | | | | |
| | | | | | | 10,409 | |
| | | | | | | | |
Chile—4.1% | | | | | | | | |
Banco Santander Chile—ADR (Commercial banks) | | | 20,583 | | | | 1,931 | |
S.A.C.I. Falabella (Multiline retail) | | | 115,302 | | | | 1,214 | |
Sociedad Quimica y Minera de Chile S.A.—ADR (Chemicals) | | | 15,360 | | | | 994 | |
| | | | | | | | |
| | | | | | | 4,139 | |
| | | | | | | | |
Mexico—7.9% | | | | | | | | |
America Movil S.A.B. de C.V.—ADR (Wireless telecommunication services) | | | 54,908 | | | | 2,958 | |
Grupo Financiero Banorte S.A.B. de C.V. (Commercial banks) | | | 425,200 | | | | 1,931 | |
Grupo Mexico S.A.B. de C.V. Series “B” (Metals & mining) | | | 329,626 | | | | 1,088 | |
Wal-Mart de Mexico S.A.B. de C.V. (Food & staples retailing) | | | 668,500 | | | | 1,984 | |
| | | | | | | | |
| | | | | | | 7,961 | |
| | | | | | | | |
Peru—0.5% | | | | | | | | |
Credicorp, Ltd. (Commercial banks)† | | | 5,443 | | | | 469 | |
| | | | | | | | |
| |
Emerging Europe, Mid-East, Africa—15.2% | | | | | |
Qatar—1.0% | | | | | | | | |
Industries Qatar QSC (Industrial conglomerates) | | | 28,493 | | | | 1,066 | |
| | | | | | | | |
Russia—3.1% | | | | | | | | |
Magnit OJSC—144A—GDR (Food & staples retailing)† | | | 44,538 | | | | 1,200 | |
Sberbank of Russian Federation (Commercial banks)† | | | 272,972 | | | | 1,004 | |
*X5 Retail Group N.V.—GDR (Food & staples retailing) | | | 23,074 | | | | 902 | |
| | | | | | | | |
| | | | | | | 3,106 | |
| | | | | | | | |
See accompanying Notes to Financial Statements.
June 30, 2011 | William Blair Funds 61 |
Emerging Leaders Growth Fund
Portfolio of Investments, June 30, 2011 (all dollar amounts in thousands) (unaudited)
| | | | | | | | |
Issuer | | Shares | | | Value | |
| | |
Common Stocks—Emerging Europe, Mid-East, Africa—15.2%—(continued) | | | | | | | | |
South Africa—9.4% | | | | | | | | |
MTN Group, Ltd. (Wireless telecommunication services) | | | 135,628 | | | $ | 2,886 | |
Naspers, Ltd. (Media) | | | 44,803 | | | | 2,531 | |
Sasol, Ltd. (Oil, gas & consumable fuels) | | | 29,140 | | | | 1,534 | |
Shoprite Holdings, Ltd. (Food & staples retailing) | | | 95,140 | | | | 1,432 | |
Truworths International, Ltd. (Specialty retail) | | | 96,000 | | | | 1,041 | |
| | | | | | | | |
| | | | | | | 9,424 | |
| | | | | | | | |
Turkey—1.7% | | | | | | | | |
Turkiye Garanti Bankasi A.S. (Commercial banks) | | | 379,052 | | | | 1,719 | |
| | | | | | | | |
Total Common Stocks—93.7%
(cost $84,854) | | | | | | | 94,136 | |
| | | | | | | | |
| | |
Preferred Stocks | | | | | | | | |
Brazil—4.1% | | | | | | | | |
Itau Unibanco Holding S.A. (Commercial banks) | | | 84,485 | | | | 1,973 | |
Petroleo Brasileiro S.A. (Oil, gas & consumable fuels) | | | 141,655 | | | | 2,153 | |
| | | | | | | | |
| | | | | | | 4,126 | |
| | | | | | | | |
Total Preferred Stocks—4.1%
(cost $3,865) | | | | | | | 4,126 | |
| | | | | | | | |
| | | | | | | | |
Issuer | | Principal
Amount | | | Value | |
| | |
Repurchase Agreement | | | | | | | | |
Fixed Income Clearing Corporation, 0.010% dated 6/30/11, due 7/1/11, repurchase price $174, collateralized by FHLMC, 2.000%, due 12/3/15 | | $ | 174 | | | $ | 174 | |
| | | | | | | | |
Total Repurchase Agreement—0.2%
(cost $174) | | | | 174 | |
| | | | | | | | |
Total Investments—98.0%
(cost $88,893) | | | | 98,436 | |
Cash and other assets, less liabilities—2.0% | | | | 1,966 | |
| | | | | | | | |
Net assets—100.0% | | | $ | 100,402 | |
| | | | | | | | |
ADR = American Depository Receipt
GDR = Global Depository Receipt
* Non-income producing securities
† = U.S. listed foreign security
For securities primarily traded on exchanges or markets that close before the close of regular trading on the New York Stock Exchange, the Fund may use an independent pricing service to fair value price the securities pursuant to Valuation Procedures approved by the Board of Trustees.
At June 30, 2011, the Fund’s Portfolio of Investments includes the following industry categories:
| | | | |
Financials | | | 21.4% | |
Consumer Discretionary | | | 17.8% | |
Consumer Staples | | | 16.9% | |
Information Technology | | | 16.4% | |
Industrials | | | 8.1% | |
Telecommunication Services | | | 5.9% | |
Energy | | | 5.7% | |
Materials | | | 3.6% | |
Utilities | | | 2.3% | |
Health Care | | | 1.9% | |
| | | | |
Total | | | 100.0% | |
| | | | |
At June 30, 2011, the Fund’s Portfolio of Investments includes the following currency categories:
| | | | |
U.S. Dollar | | | 19.4% | |
Hong Kong Dollar | | | 13.9% | |
Indian Rupee | | | 13.9% | |
South Korean Won | | | 11.9% | |
South African Rand | | | 9.6% | |
Brazilian Real | | | 8.1% | |
Indonesian Rupiah | | | 6.0% | |
Mexican Peso | | | 5.1% | |
New Taiwan Dollar | | | 4.7% | |
Malaysian Ringgit | | | 1.9% | |
Turkish Lira | | | 1.8% | |
Thai Baht | | | 1.4% | |
Chilean Peso | | | 1.2% | |
Qatari Rial | | | 1.1% | |
| | | | |
Total | | | 100.0% | |
| | | | |
See accompanying Notes to Financial Statements.
62 Semi-Annual Report | June 30, 2011 |

Chad M. Kilmer

Mark T. Leslie

David S. Mitchell
SMALL CAP VALUE FUND
The Small Cap Value Fund seeks long-term capital appreciation.
AN OVERVIEW FROM THE PORTFOLIO MANAGERS
The Small Cap Value Fund posted a 2.19% increase (Class N Shares) for the six months ended June 30, 2011. By comparison, the Fund’s benchmark, the Russell 2000® Value Index, gained 3.77%.
The Fund outperformed its Russell 2000® Value benchmark during the second quarter, but finished slightly behind the benchmark for the year-to-date period. After a near-uninterrupted rally since August of last year, US equities stumbled during May and June. Small cap value stocks, as measured by the Russell 2000® Value Index, corrected over 9% during that period, but rallied in late-June to close the quarter down modestly and to remain in positive territory for the year-to-date period.
The first four months of 2011 witnessed a continuation of the upward trend in stock prices, primarily driven by solid corporate fundamentals and reasonable stock valuations. But 2011 to date has mirrored 2010: a strong start to the year followed by a mid-year correction primarily due to disappointing economic data and European sovereign debt woes. Specifically, the most recent correction came on the heels of heightened Greek sovereign debt concerns, sluggish jobs data in the US, a potential Chinese housing market downturn, the US government debt ceiling negotiations, uncertainty around the end of the Federal Reserve’s quantitative easing (QE2) and a US housing market that remains on life support. While the negatives are plentiful, the market’s ability to produce positive returns for the year is telling. Investors continue to focus on healthy corporate fundamentals and on an economy that is slowly recovering, albeit in fits and starts.
From a sector perspective during the first half of the year, the typically defensive Health Care sector was the standout performer, up 21.94%. Energy was the next strongest sector 11.17% year-to-date, despite its 7% selloff during the second quarter. Utilities also outperformed 9.18%. Financials, the largest weight in the Russell 2000® Value, was the weakest performer with a –0.16% return. Industrials 1.61%, Information Technology 3.35%, Consumer Discretionary 1.21% and Materials 4.23% performed basically in-line with the small cap value market during the six-month period.
The Small Cap Value Fund’s underperformance for the first half of the year is attributable to stock selection (both stocks we did own and some we did not). Health Care was the sector detracting the most from relative performance, which was entirely the result of not owning the sector’s strongest performers in our benchmark, the Russell 2000® Value Index. Consumer Discretionary, partly due to Pacific Sunwear, and Financials, partly due to The Hanover Group, also detracted from relative results. On the other hand, positive stock selection in Industrials (e.g., Robbins & Myers, Inc.) and Materials (e.g., RTI International Metals, Inc.) helped buoy relative performance.
For the second quarter specifically, the Fund’s outperformance was the result of positive stock selection. This was most prevalent in Materials (e.g., RTI International Metals, Inc.), Industrials (e.g., Kadant, Inc.) and Consumer Staples (e.g., Spartan Stores, Inc.). Financial sector stock selection detracted modestly in part due to underperformance by The Hanover Group.
The second quarter correction has kept the broad equity market valuation in check while corporate fundamentals continue to improve. Because of this and despite the macroeconomic and geopolitical headwinds, we believe the market remains relatively balanced looking
June 30, 2011 | William Blair Funds 63 |
forward. We believe investors will continue to differentiate between quality businesses and those that benefitted primarily from the initial economic recovery. Investors already may be making this distinction as stock correlations have fallen from the elevated levels seen over the past few years. This should bode well for our style of investing and for active management generally. In the end, however, while we factor various economic scenarios into our stock picking, we devote our time on constructing the portfolio from a bottom-up perspective. As always, we remain focused on finding quality companies at discount prices and corporate transformation opportunities. We believe building a portfolio with these types of companies should produce solid investment results over the long term.
64 Semi-Annual Report | June 30, 2011 |
Small Cap Value Fund
Performance Highlights (unaudited)
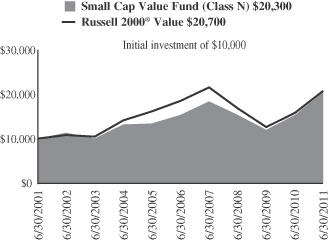
Average Annual Total Return at 6/30/2011
| | | | | | | | | | | | | | | | | | | | |
| | | Year
To Date | | | 1
Year | | | 3
Year | | | 5
Year | | | 10
Year | |
Class N | | | 2.19 | % | | | 33.30 | % | | | 9.91 | % | | | 5.83 | % | | | 7.36 | % |
Class I | | | 2.37 | | | | 33.63 | | | | 10.13 | | | | 6.05 | | | | 7.59 | |
Russell 2000® Value | | | 3.77 | | | | 31.35 | | | | 7.09 | | | | 2.24 | | | | 7.53 | |
Performance cited represents past performance. Past performance does not guarantee future results and current performance may be lower or higher than the data quoted. Results shown are average annual total returns, which assume reinvestment of dividends and capital gains. Investment returns and principal will fluctuate and you may have a gain or loss when you sell shares. For the most current month-end performance information, please call 1-800-742-7272, or visit our Web site at www.williamblairfunds.com. Investing in smaller companies involves special risks, including higher volatility and lower liquidity. Smaller Capitalization stocks are also more sensitive to purchase/sale transactions and changes in the issuer’s financial condition. From time to time, the investment advisor may waive fees or reimburse expenses for the Fund. Without these waivers, performance would be lower. Class N shares are available to the general public without a sales load. Class I shares are available to certain institutional investors and advisory clients of William Blair & Company, L.L.C., without a sales load or distribution (12b-1) or service fees.
The performance highlights and graph presented above do not reflect the deduction of taxes that a shareholder would pay on fund distributions or the redemption of fund shares.
The Russell 2000® Value Index consists of small-capitalization companies with below average price-to-book ratios and forecasted growth rates.
This report identifies the Fund’s investments on June 30, 2011. These holdings are subject to change. Not all stocks in the Fund performed the same, nor is there any guarantee that these stocks will perform as well in the future. Market forecasts provided in this report may not necessarily come to pass.
Sector Diversification (unaudited)
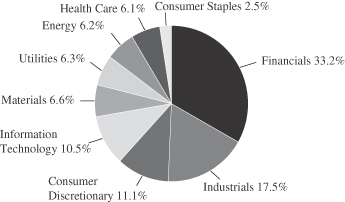
The sector diversification shown is based on the total long-term securities.
June 30, 2011 | William Blair Funds 65 |
Small Cap Value Fund
Portfolio of Investments, June 30, 2011 (all dollar amounts in thousands) (unaudited)
| | | | | | | | |
Issuer | | Shares | | | Value | |
| | |
Common Stocks | | | | | | | | |
Financials—32.1% | | | | | | | | |
Associated Banc-Corp | | | 122,660 | | | $ | 1,705 | |
Berkshire Hills Bancorp, Inc. | | | 108,015 | | | | 2,418 | |
BioMed Realty Trust, Inc. | | | 158,225 | | | | 3,044 | |
Brandywine Realty Trust | | | 189,150 | | | | 2,192 | |
CoBiz Financial, Inc. | | | 360,515 | | | | 2,358 | |
DuPont Fabros Technology, Inc. | | | 122,320 | | | | 3,082 | |
*Eagle Bancorp, Inc. | | | 200,282 | | | | 2,664 | |
Education Realty Trust, Inc. | | | 385,255 | | | | 3,302 | |
Excel Trust, Inc. | | | 250,650 | | | | 2,765 | |
First Potomac Realty Trust | | | 141,132 | | | | 2,161 | |
FirstMerit Corporation | | | 195,557 | | | | 3,229 | |
Hancock Holding Co. | | | 105,955 | | | | 3,282 | |
Highwoods Properties, Inc. | | | 66,615 | | | | 2,207 | |
LaSalle Hotel Properties | | | 107,972 | | | | 2,844 | |
Meadowbrook Insurance Group, Inc. | | | 261,560 | | | | 2,592 | |
Mid-America Apartment Communities, Inc. | | | 37,410 | | | | 2,524 | |
*National Financial Partners Corporation | | | 163,980 | | | | 1,892 | |
National Retail Properties, Inc. | | | 105,610 | | | | 2,589 | |
Old National Bancorp | | | 255,717 | | | | 2,762 | |
Platinum Underwriters Holdings, Ltd.† | | | 58,540 | | | | 1,946 | |
*ProAssurance Corporation | | | 40,460 | | | | 2,832 | |
Prosperity Bancshares, Inc. | | | 66,015 | | | | 2,893 | |
*Safeguard Scientifics, Inc. | | | 181,625 | | | | 3,429 | |
Sandy Spring Bancorp, Inc. | | | 155,390 | | | | 2,795 | |
*SVB Financial Group | | | 41,830 | | | | 2,498 | |
The Hanover Insurance Group, Inc. | | | 74,775 | | | | 2,820 | |
Webster Financial Corporation | | | 126,870 | | | | 2,667 | |
WSFS Financial Corporation | | | 55,492 | | | | 2,200 | |
| | | | | | | | |
| | | | | | | 73,692 | |
| | | | | | | | |
Industrials—16.9% | | | | | | | | |
Ameron International Corporation | | | 34,224 | | | | 2,248 | |
Belden, Inc. | | | 60,045 | | | | 2,093 | |
Cubic Corporation | | | 46,125 | | | | 2,352 | |
*EMCOR Group, Inc. | | | 112,261 | | | | 3,290 | |
ESCO Technologies, Inc. | | | 98,055 | | | | 3,608 | |
G&K Services, Inc. Class “A” | | | 114,375 | | | | 3,873 | |
*Hawaiian Holdings, Inc. | | | 323,365 | | | | 1,843 | |
*Kadant, Inc. | | | 103,189 | | | | 3,252 | |
Kaydon Corporation | | | 93,070 | | | | 3,473 | |
L.B. Foster Co. Class “A” | | | 60,045 | | | | 1,976 | |
Marten Transport, Ltd. | | | 82,035 | | | | 1,772 | |
Quanex Building Products Corporation | | | 108,490 | | | | 1,778 | |
Robbins & Myers, Inc. | | | 66,960 | | | | 3,539 | |
*School Specialty, Inc. | | | 83,795 | | | | 1,206 | |
TAL International Group, Inc. | | | 75,590 | | | | 2,610 | |
| | | | | | | | |
| | | | | | | 38,913 | |
| | | | | | | | |
Consumer Discretionary—10.7% | | | | | | | | |
*AFC Enterprises, Inc. | | | 128,486 | | | | 2,114 | |
Ameristar Casinos, Inc. | | | 102,182 | | | | 2,423 | |
Chico’s FAS, Inc. | | | 169,475 | | | | 2,581 | |
*Core-Mark Holding Co., Inc. | | | 45,955 | | | | 1,641 | |
*Gaylord Entertainment Co. | | | 51,540 | | | | 1,546 | |
Meredith Corporation | | | 60,815 | | | | 1,893 | |
PEP Boys-Manny Moe & Jack | | | 255,477 | | | | 2,792 | |
*Pinnacle Entertainment, Inc. | | | 172,010 | | | | 2,563 | |
Regis Corporation | | | 94,559 | | | | 1,449 | |
Ryland Group, Inc. | | | 82,805 | | | | 1,369 | |
The Jones Group, Inc. | | | 176,820 | | | | 1,918 | |
| | | | | | | | |
| | | | |
Issuer | | Shares | | | Value | |
| | |
Common Stocks—(continued) | | | | | | | | |
Consumer Discretionary—(continued) | | | | | | | | |
The Men’s Wearhouse, Inc. | | | 66,470 | | | $ | 2,240 | |
| | | | | | | | |
| | | | | | | 24,529 | |
| | | | | | | | |
Information Technology—10.2% | | | | | | | | |
ADTRAN, Inc. | | | 63,555 | | | | 2,460 | |
*Avid Technology, Inc. | | | 148,812 | | | | 2,804 | |
*Digital River, Inc. | | | 90,965 | | | | 2,925 | |
Earthlink, Inc. | | | 375,805 | | | | 2,892 | |
*Integrated Device Technology, Inc. | | | 347,845 | | | | 2,734 | |
*j2 Global Communications, Inc. | | | 103,505 | | | | 2,922 | |
*Monolithic Power Systems, Inc. | | | 162,705 | | | | 2,509 | |
*Parametric Technology Corporation | | | 107,570 | | | | 2,466 | |
*Ultra Clean Holdings | | | 185,876 | | | | 1,688 | |
| | | | | | | | |
| | | | | | | 23,400 | |
| | | | | | | | |
Materials—6.4% | | | | | | | | |
Minerals Technologies, Inc. | | | 45,055 | | | | 2,987 | |
PolyOne Corporation | | | 223,655 | | | | 3,460 | |
*RTI International Metals, Inc. | | | 79,885 | | | | 3,065 | |
Sensient Technologies Corporation | | | 66,140 | | | | 2,452 | |
Silgan Holdings, Inc. | | | 66,315 | | | | 2,717 | |
| | | | | | | | |
| | | | | | | 14,681 | |
| | | | | | | | |
Utilities—6.1% | | | | | | | | |
Chesapeake Utilities Corporation | | | 59,270 | | | | 2,373 | |
El Paso Electric Co. | | | 91,620 | | | | 2,959 | |
Portland General Electric Co. | | | 118,495 | | | | 2,996 | |
UIL Holdings Corporation | | | 87,185 | | | | 2,820 | |
WGL Holdings, Inc. | | | 74,300 | | | | 2,860 | |
| | | | | | | | |
| | | | | | | 14,008 | |
| | | | | | | | |
Energy—6.0% | | | | | | | | |
Berry Petroleum Co. Class “A” | | | 44,794 | | | | 2,380 | |
*Complete Production Services, Inc. | | | 72,285 | | | | 2,411 | |
*Forest Oil Corporation | | | 89,128 | | | | 2,381 | |
*Key Energy Services, Inc. | | | 131,980 | | | | 2,376 | |
*Magnum Hunter Resources Corporation | | | 366,931 | | | | 2,480 | |
*Northern Oil and Gas, Inc. | | | 80,923 | | | | 1,792 | |
| | | | | | | | |
| | | | | | | 13,820 | |
| | | | | | | | |
Health Care—5.9% | | | | | | | | |
*CONMED Corporation | | | 81,345 | | | | 2,316 | |
*Greatbatch, Inc. | | | 84,780 | | | | 2,274 | |
Invacare Corporation | | | 82,765 | | | | 2,747 | |
*Magellan Health Services, Inc. | | | 64,980 | | | | 3,557 | |
*Mednax, Inc. | | | 35,348 | | | | 2,552 | |
| | | | | | | | |
| | | | | | | 13,446 | |
| | | | | | | | |
Consumer Staples—2.4% | | | | | | | | |
J&J Snack Foods Corporation | | | 35,817 | | | | 1,786 | |
Spartan Stores, Inc. | | | 192,025 | | | | 3,750 | |
| | | | | | | | |
| | | | | | | 5,536 | |
| | | | | | | | |
Total Common Stocks—96.7%
(cost $201,516) | | | | 222,025 | |
| | | | | | | | |
See accompanying Notes to Financial Statements.
66 Semi-Annual Report | June 30, 2011 |
Small Cap Value Fund
Portfolio of Investments, June 30, 2011 (all dollar amounts in thousands) (unaudited)
| | | | | | | | |
Issuer | | Principal
Amount | | | Value | |
| | |
Repurchase Agreement | | | | | | | | |
Fixed Income Clearing Corporation, 0.010% dated 6/30/11, due 7/1/11, repurchase price $5,922, collateralized by FHLMC, 2.000%, due 12/3/15 | | $ | 5,922 | | | $ | 5,922 | |
| | | | | | | | |
Total Repurchase Agreement—2.6%
(cost $5,922) | | | | 5,922 | |
| | | | | | | | |
Total Investments—99.3%
(cost $207,438) | | | | 227,947 | |
Cash and other assets, less liabilities—0.7% | | | | 1,496 | |
| | | | | | | | |
Net assets—100.0% | | | $ | 229,443 | |
| | | | | | | | |
*Non-income producing securities
† = U.S. listed foreign security
See accompanying Notes to Financial Statements.
June 30, 2011 | William Blair Funds 67 |
Chad M. Kilmer
Mark T. Leslie
David S. Mitchell
MID CAP VALUE FUND
The Mid Cap Value Fund seeks long-term capital appreciation.
AN OVERVIEW FROM THE PORTFOLIO MANAGERS
The Mid Cap Value Fund posted a 5.86% increase for the six months ended June 30, 2011. By comparison, the Fund’s benchmark, the Russell Midcap® Value Index, gained 6.69%.
The Fund narrowly trailed its Russell Midcap® Value benchmark during the year-to-date period. After a near-uninterrupted rally since August of last year, U.S. equities stumbled during May and June. Mid cap value stocks, as measured by the Russell Midcap® Value Index, corrected 7% during that period, but rallied in late-June to close the quarter down modestly and to remain in positive territory for the year-to-date period.
The first four months of 2011 witnessed a continuation of the upward trend in stock prices, primarily driven by solid corporate fundamentals and reasonable stock valuations. But 2011 to date has mirrored 2010: a strong start to the year followed by a mid-year correction primarily due to disappointing economic data and European sovereign debt woes. Specifically, the most recent correction came on the heels of heightened Greek sovereign debt concerns, sluggish jobs data in the U.S., a potential Chinese housing market downturn, the U.S. government debt ceiling negotiations, uncertainty around the end of the Federal Reserve’s quantitative easing (QE2) and a U.S. housing market that remains on life support. While the negatives are plentiful, the market’s ability to produce positive returns for the year is telling. Investors continue to focus on healthy corporate fundamentals and on an economy that is slowly recovering, albeit in fits and starts.
From a sector perspective during the first half of the year, the typically defensive Health Care sector was the standout performer, up 19.43%. Consumer Discretionary (+10.17%), Consumer Staples (+11.80%) and Utilities (+11.47%) also outperformed. Energy modestly outperformed (+8.46%) year-to-date, despite its 7% selloff during the second quarter. Financials, the largest weight in the Russell Midcap® Value Index, returned only 2.92%, while Information Technology was the weakest performer with a -0.78% return.
The Fund’s modest underperformance for the first half of the year is attributable to stock selection. The Financials sector pulled down relative results with underperformance by Fifth Third Bancorp and The Hanover Insurance Group, Inc. Industrials stock selection also lagged due to Oshkosh Corporation. On the upside, Materials stock selection boosted relative performance with both Carpenter Technology Corporation and Lubrizol Corporation outperforming.
For the second quarter specifically, the Fund’s narrow underperformance was the result of somewhat offsetting stock selection dynamics across sectors. Specifically, we had positive stock selection in Materials (e.g., Carpenter Technology Corporation) and Health Care (e.g., Hill-Rom Holdings, Inc.). Information Technology stock selection was also positive as we did not own some of the sector’s biggest underperformers during the quarter. However, Energy (e.g., Forest Oil Corporation) and Financials (e.g., The Hanover Group) stock selection pulled our relative return into the red.
The second quarter correction has kept the broad equity market valuation in check while corporate fundamentals continue to improve. Because of this and despite the macroeconomic and geopolitical headwinds, we believe the market remains relatively balanced looking forward. We believe investors will continue to differentiate between quality businesses and those that benefitted primarily from the initial economic recovery. Investors already may be making this distinction as stock correlations have fallen from the elevated levels seen over the
68 Semi-Annual Report | June 30, 2011 |
past few years. This should bode well for our style of investing and for active management generally. In the end, however, while we factor various economic scenarios into our stock picking, we devote our time on constructing the portfolio from a bottom-up perspective. As always, we remain focused on finding quality companies at discount prices and corporate transformation opportunities. We believe building a portfolio with these types of companies should produce solid investment results over the long term.
June 30, 2011 | William Blair Funds 69 |
Mid Cap Value Fund
Performance Highlights (unaudited)
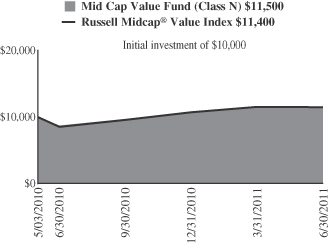
Average Annual Total Return at 6/30/2011
| | | | | | | | | | | | |
| | | Year
To Date | | | 1 Yr | | | Since
Inception(a) | |
Class N | | | 5.86 | % | | | 32.15 | % | | | 12.47 | % |
Class I | | | 5.86 | | | | 32.36 | | | | 12.74 | |
Russell Midcap® Value Index | | | 6.69 | | | | 34.28 | | | | 12.17 | |
| | (a) | | For the period May 3, 2010 (Commencement of Operations) to June 30, 2011. | |
Performance cited represents past performance. Past performance does not guarantee future results and current performance may be lower or higher than the data quoted. Results shown are average annual total returns, which assume reinvestment of dividends and capital gains. Investment returns and principal will fluctuate and you may have a gain or loss when you sell shares. For the most current month-end performance information, please call 1-800-742-7272, or visit our Web site at www.williamblairfunds.com. Investing in smaller and medium capitalization companies involves special risks, including higher volatility and lower liquidity. Medium Capitalization stocks are also more sensitive to purchase/sale transactions and changes in the issuer’s financial condition. From time to time, the investment advisor may waive fees or reimburse expenses for the Fund. Without these waivers, performance would be lower. Class N shares are available to the general public without a sales load. Class I shares are available to certain institutional investors and advisory clients of William Blair & Company, L.L.C., without a sales load or distribution (12b-1) or service fees.
The performance highlights and graph presented above do not reflect the deduction of taxes that a shareholder would pay on fund distributions or the redemption of fund shares.
The Russell Midcap® Value Index consists of Midcap-capitalization companies with below average price-to-book ratios and forecasted growth rates.
This report identifies the Fund’s investments on June 30, 2011. These holdings are subject to change. Not all stocks in the Fund performed the same, nor is there any guarantee that these stocks will perform as well in the future. Market forecasts provided in this report may not necessarily come to pass.
Sector Diversification (unaudited)
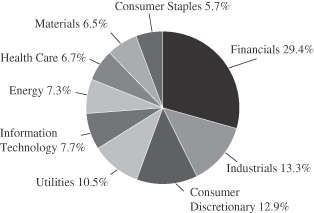
The sector diversification shown is based on the total long-term securities.
70 Semi-Annual Report | June 30, 2011 |
Mid Cap Value Fund
Portfolio of Investments, June 30, 2011 (all dollar amounts in thousands) (unaudited)
| | | | | | | | |
Issuer | | Shares | | | Value | |
| | |
Common Stocks | | | | | | | | |
Financials—28.1% | | | | | | | | |
Alexandria Real Estate Equities, Inc. | | | 715 | | | $ | 55 | |
Allied World Assurance Co. Holdings, Ltd.† | | | 960 | | | | 55 | |
Ameriprise Financial, Inc. | | | 1,425 | | | | 82 | |
Apartment Investment & Management Co. | | | 2,150 | | | | 55 | |
Brandywine Realty Trust | | | 5,075 | | | | 59 | |
Discover Financial Services | | | 3,605 | | | | 97 | |
Fifth Third Bancorp | | | 7,615 | | | | 97 | |
*Forest City Enterprises, Inc. Class “A” | | | 3,395 | | | | 64 | |
Hancock Holding Co. | | | 1,915 | | | | 59 | |
Host Hotels & Resorts, Inc. | | | 3,000 | | | | 51 | |
New York Community Bancorp, Inc. | | | 3,210 | | | | 48 | |
PartnerRe, Ltd.† | | | 595 | | | | 41 | |
People’s United Financial, Inc. | | | 5,880 | | | | 79 | |
Realty Income Corporation | | | 1,560 | | | | 52 | |
SL Green Realty Corporation | | | 690 | | | | 57 | |
The Hanover Insurance Group, Inc. | | | 1,400 | | | | 53 | |
Unum Group | | | 2,600 | | | | 66 | |
Validus Holdings, Ltd.† | | | 1,640 | | | | 51 | |
Ventas, Inc. | | | 790 | | | | 42 | |
| | | | | | | | |
| | | | | | | 1,163 | |
| | | | | | | | |
Industrials—12.8% | | | | | | | | |
Cintas Corporation | | | 2,260 | | | | 75 | |
Eaton Corporation | | | 1,115 | | | | 57 | |
*Oshkosh Corporation | | | 1,065 | | | | 31 | |
Parker Hannifin Corporation | | | 710 | | | | 64 | |
Republic Services, Inc. | | | 2,675 | | | | 82 | |
Rockwell Collins, Inc. | | | 1,080 | | | | 66 | |
Snap-On, Inc. | | | 685 | | | | 43 | |
Southwest Airlines Co. | | | 4,195 | | | | 48 | |
*URS Corporation | | | 1,390 | | | | 62 | |
| | | | | | | | |
| | | | | | | 528 | |
| | | | | | | | |
Consumer Discretionary—12.3% | | | | | | | | |
Autoliv, Inc. | | | 520 | | | | 41 | |
Chico’s FAS, Inc. | | | 3,790 | | | | 58 | |
*DISH Network Corporation | | | 1,710 | | | | 52 | |
Genuine Parts Co. | | | 1,280 | | | | 70 | |
International Game Technology | | | 3,585 | | | | 63 | |
Meredith Corporation | | | 1,240 | | | | 38 | |
Newell Rubbermaid, Inc. | | | 4,045 | | | | 64 | |
VF Corporation | | | 610 | | | | 66 | |
Wyndham Worldwide Corporation | | | 1,700 | | | | 57 | |
| | | | | | | | |
| | | | | | | 509 | |
| | | | | | | | |
Utilities—10.1% | | | | | | | | |
DTE Energy Co. | | | 1,210 | | | | 60 | |
Northeast Utilities | | | 1,610 | | | | 57 | |
PPL Corporation | | | 2,485 | | | | 69 | |
TECO Energy, Inc. | | | 2,890 | | | | 54 | |
WGL Holdings, Inc. | | | 1,265 | | | | 49 | |
Wisconsin Energy Corporation | | | 1,935 | | | | 61 | |
Xcel Energy, Inc. | | | 2,795 | | | | 68 | |
| | | | | | | | |
| | | | | | | 418 | |
| | | | | | | | |
† = U.S. listed foreign security
*Non-income producing securities
| | | | | | | | |
Issuer | | Shares or
Principal
Amount | | | Value | |
| | |
Common Stocks—(continued) | | | | | | | | |
Information Technology—7.3% | | | | | | | | |
*Atmel Corporation | | | 2,090 | | | $ | 29 | |
*Ingram Micro, Inc. Class “A” | | | 2,705 | | | | 49 | |
TE Connectivity, Ltd.† | | | 1,840 | | | | 68 | |
VeriSign, Inc. | | | 2,195 | | | | 73 | |
Xerox Corporation | | | 8,035 | | | | 84 | |
| | | | | | | | |
| | | | | | | 303 | |
| | | | | | | | |
Energy—7.0% | | | | | | | | |
Patterson-UTI Energy, Inc. | | | 1,675 | | | | 53 | |
*Petrohawk Energy Corporation | | | 1,355 | | | | 33 | |
Pioneer Natural Resources Co. | | | 625 | | | | 56 | |
*Rowan Cos., Inc. | | | 1,095 | | | | 43 | |
SM Energy Co. | | | 755 | | | | 56 | |
*Whiting Petroleum Corporation | | | 885 | | | | 50 | |
| | | | | | | | |
| | | | | | | 291 | |
| | | | | | | | |
Health Care—6.3% | | | | | | | | |
CIGNA Corporation | | | 1,320 | | | | 68 | |
Hill-Rom Holdings, Inc. | | | 1,520 | | | | 70 | |
*Laboratory Corporation of America Holdings | | | 615 | | | | 59 | |
*Mettler-Toledo International, Inc.† | | | 390 | | | | 66 | |
| | | | | | | | |
| | | | | | | 263 | |
| | | | | | | | |
Materials—6.2% | | | | | | | | |
Airgas, Inc. | | | 800 | | | | 56 | |
Carpenter Technology Corporation | | | 970 | | | | 56 | |
FMC Corporation | | | 650 | | | | 56 | |
Sonoco Products Co. | | | 1,440 | | | | 51 | |
Steel Dynamics, Inc. | | | 2,250 | | | | 37 | |
| | | | | | | | |
| | | | | | | 256 | |
| | | | | | | | |
Consumer Staples—5.5% | | | | | | | | |
ConAgra Foods, Inc. | | | 2,385 | | | | 61 | |
Corn Products International, Inc. | | | 915 | | | | 51 | |
HJ Heinz Co. | | | 1,240 | | | | 66 | |
The Kroger Co. | | | 1,970 | | | | 49 | |
| | | | | | | | |
| | | | | | | 227 | |
| | | | | | | | |
Total Common Stocks—95.6%
(cost $3,595) | | | | 3,958 | |
| | | | | | | | |
| | |
Repurchase Agreement | | | | | | | | |
State Street Bank and Trust Company, 0.010% dated 6/30/11, due 7/1/11, repurchase price $150, collateralized by U.S. Treasury Bill, 0.020%, due 8/11/11 | | $ | 150 | | | | 150 | |
| | | | | | | | |
Total Repurchase Agreement—3.6%
(cost $150) | | | | 150 | |
| | | | | | | | |
Total Investments—99.2%
(cost $3,745) | | | | 4,108 | |
Cash and other assets, less liabilities—0.8% | | | | 35 | |
| | | | | | | | |
Net assets—100.0% | | | $ | 4,143 | |
| | | | | | | | |
See accompanying Notes to Financial Statements.
June 30, 2011 | William Blair Funds 71 |
Fixed Income Markets Overview
Summary
The first half of 2011 was marked by market volatility, as geopolitical events during the first quarter and renewed concerns over the European sovereign debt crisis during the second quarter weighed on capital markets.
During the first quarter, improvements in the U.S. economy offset concerns stemming from geopolitical events, continued concern about the fiscal situations in certain European countries, and the U.S. budget deficit. The markets reacted favorably to U.S. economic data released during the quarter, which revealed that growth continued, the labor market had improved, and inflation expectations remained in check. However, global events had a mitigating effect on the market’s optimism. The seminal event during the quarter was the Japanese earthquake and tsunami that caused explosions at nuclear power plants in northern Japan. Political unrest throughout Northern Africa and the Middle East resulted in heightened market volatility and a spike in oil prices. The markets remained concerned over the precarious fiscal situation of Portugal, Ireland, Greece, and Spain, and the potential growth-hindering impact that austerity measures might have on the Eurozone region.
The Greek debt crisis took center stage during the second quarter, although concerns over other European countries continued. A string of disappointing economic data releases rekindled fears of a “double-dip” recession in the U.S. New figures on employment, housing, manufacturing, consumer spending, and other indicators pointed to a slowdown in growth from relatively modest first-quarter levels.
Interest rates rose during the first quarter but fell during the second. Year-to-date, interest rates have declined and fixed income instruments generated positive returns. The 10-year Treasury note yielded 3.17% at the end of June, compared to 3.47% at the end of March, and 3.29% at the end of 2010.
Outlook
The Federal Reserve Board’s Quantitative Easing II program expired with a whimper, not a bang. We believe the program was a successful endeavor on the part of the Fed to “reflate” the economy and to prevent deflation. At its meeting on June 22, The Federal Reserve’s Federal Open Market Committee (“FOMC”) left the Federal Funds target rate unchanged at a range of 0.00% - 0.25%.
The FOMC views the recent spike in food and energy prices to be a temporary aberration. In fact, the Fed said that it expects inflation to “subside to levels at or below those consistent with the Committee’s dual mandate.”
U.S. economic data continues to show very modest economic growth. Unemployment remains stubbornly high, and until there is improvement in job creation, the housing market is likely to remain in a depressed state.
Until fundamentals in the economy show significant signs of improvement—including gains in employment and strength in the housing market—and until inflation picks up, we believe the Fed will leave its Federal Funds target rate at that level, which may remain the case through the balance of 2011 and into next year.
72 Semi-Annual Report | June 30, 2011 |

Christopher T. Vincent

Paul J. Sularz
BOND FUND
The Bond Fund seeks to outperform the Barclays Capital U.S. Aggregate Bond Index by maximizing total return through a combination of income and capital appreciation.
AN OVERVIEW FROM THE PORTFOLIO MANAGERS
Bond Fund
The Bond Fund posted a 2.90% increase on a total return basis (Class N Shares) for the six months ended June 30, 2011. By comparison, the Fund’s benchmark, the Barclays Capital Aggregate Index, gained 2.72%.
The Fund posted positive performance results, in spite of what could be considered headwinds to our style of investing. Security selection was the main driver of Fund performance.
The Fund has been defensively positioned against rising interest rates, which worked well for the Fund in the first quarter but worked against it during the second.
U.S. Treasury securities were the best performing asset class during the second quarter. The “spread” between U.S. Treasury securities and Corporate bonds widened as interest rates fell during the second quarter. High yield bonds underperformed investment grade securities by 1.25% over this time period.
The Fund typically overweights Corporate bonds and underweights U.S. Treasury securities, so the Fund’s investment style proved challenging to relative performance during the quarter. However, security selection results in the Corporate and Mortgage-Backed sectors mitigated the magnitude of the Fund’s relative underperformance.
Several of the Fund’s Corporate bond holdings had a positive impact on performance during the quarter. Motorola Solutions, Inc. continued to be a stellar performer for the Fund. In addition, positions in Georgia-Pacific LLC, Comcast Corporation, JPMorgan Chase & Co., and Anheuser-Busch InBev Worldwide, Inc. were additive to performance as their incremental yield offset the impact of widening risk spreads during the quarter.
The Fund’s Mortgage-Backed securities holdings were another source of value during the quarter. The Fund emphasizes specified pools with low loan balances, seasoning, or above-market coupon rates in an attempt to earn a yield advantage while experiencing slower-than-expected prepayment speeds. During the second quarter, the Fund’s holdings in such securities had a positive effect on performance.
We believe the Fund’s investment strategy is designed to help the Fund hold its ground in market conditions such as those just experienced in the first half of the year, and the Fund did just that.
Security selection within the Mortgage-backed and Corporate bond sectors—which provide more yield than U.S. Treasury securities—provided a solid underpinning to the Fund. On the other hand, the Fund’s defensive interest rate positioning was a limiting factor as interest rates have declined since the start of the year.
The Fund’s holdings of High Yield Corporate bonds performed strongly, as did its holdings of investment grade Corporate securities. The Fund’s holdings of longer-dated TIPS (Treasury Inflation Protected Securities) also benefitted the Fund.
June 30, 2011 | William Blair Funds 73 |
Motorola Solutions was a standout performer for the Fund. Motorola Solutions represents one of the two units of Motorola spun off by the company this year (the other being Motorola Mobility). Motorola Solutions represents the more commercial mobile phone handset business, whose customers include police and fire departments, while Motorola Mobility makes retail phone handsets. We believe Motorola Solutions has a more stable, predictable business, while Motorola Mobility’s business is much more cyclical in nature. Confusion about these new yet different business units resulted in conflicting opinions about the ratings of Motorola Solution’s bonds from different rating agencies, with the company actually receiving both investment grade as well as high yield ratings on its newly-issued bonds.
We, however, conduct our own research about every company whose bonds we buy, and do not exclusively rely on the rating agencies. We identified Motorola Solution’s Bonds—overlooked by the largest fix income managers because of the divergent opinions of the rating agencies and the relatively small $400 million size of the offering—as an attractive value. The convergence of positive opinions by the rating agencies about Motorola Solutions resulted in price appreciation for its bonds, and a success for our research efforts.
The Fund continues to maintain its overweight position—versus its benchmark—to “spread” products: Corporate Bonds, Mortgage-backed securities and Asset-backed securities. The Fund maintains its exposure to Treasury Securities through its holdings of TIPs (Treasury Inflation-Protected Securities).
In particular, the Fund maintains an overweight allocation to Corporate Bonds. In the current low growth, low inflation environment, corporate balance sheets have improved drastically, which improves the quality profile of corporate bonds. Investment ratings on some securities have risen. We believe that U.S. GDP growth will likely remain subpar due to structural unemployment in the U.S. economy. We believe this current environment is one that should remain favorable for Corporate bonds.
Within our Mortgage-backed securities holdings, we favor securities that we believe are less likely to be refinanced through emphasizing specified pools with low loan balances and above-market coupon rates. Put simply, we are seeking pools least likely to be “called away,” or pre-paid as interest rates decline and refinancings increase. The Fund has benefitted from this strategy, especially given the fact that lenders have more stringent financial criteria in place for borrowers to refinance their existing mortgages. Higher coupon mortgages, in turn, provide a cushion through better convexity characteristics, because they typically do not decline as much when interest rates fall. Finally, this strategy enables the Fund to generate and maintain the Fund’s cash flow and current income.
74 Semi-Annual Report | June 30, 2011 |
Bond Fund
Performance Highlights (unaudited)
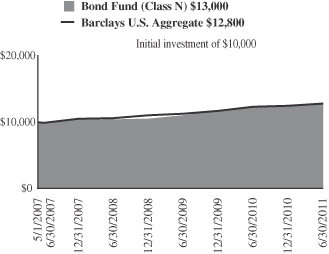
Average Annual Total Return at 6/30/2011
| | | | | | | | | | | | | | | | |
| | | Year
To Date | | | 1
Year | | | 3
Year | | | Since
Inception(a) | |
Class N | | | 2.90 | % | | | 5.43 | % | | | 7.51 | % | | | 6.41 | % |
Class I | | | 3.09 | | | | 5.64 | | | | 7.68 | | | | 6.59 | |
Barclays Capital U.S. Aggregate Bond Index | | | 2.72 | | | | 3.90 | | | | 6.46 | | | | 6.07 | |
| | (a) | | For the period from May 1, 2007 (Commencement of Operations) to June 30, 2011. | |
Performance cited represents past performance. Past performance does not guarantee future results and current performance may be lower or higher than the data quoted. Results shown are average annual total returns, which assume reinvestment of dividends and capital gains. Investment returns and principal will fluctuate and you may have a gain or loss when you sell shares. For the most current month-end performance information, please call 1-800-742-7272, or visit our Web site at www.williamblairfunds.com. From time to time, the investment advisor may waive fees or reimburse expenses for the Fund. Without these waivers, performance would be lower. Class N shares are available to the general public without a sales load. Class I shares are available to certain institutional investors and advisory clients of William Blair & Company, L.L.C., without a sales load or distribution fees (12b-1).
The performance highlights and graph presented above do not reflect the deduction of taxes that a shareholder would pay on fund distributions or the redemption of fund shares.
The Barclays Capital U.S. Aggregate Bond Index indicates broad intermediate government/corporate bond market performance.
This report identifies the Fund’s investments on June 30, 2011. These holdings are subject to change. Not all investments in the Fund performed the same, nor is there any guarantee that these investments will perform as well in the future. Market forecasts provided in this report may not necessarily come to pass.
Sector Diversification (unaudited)
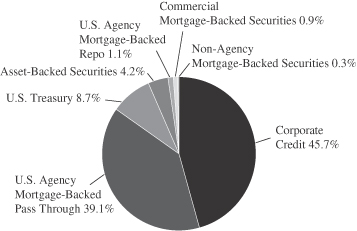
The sector diversification shown is based on the total investments.
June 30, 2011 | William Blair Funds 75 |
Bond Fund
Portfolio of Investments, June 30, 2011 (all amounts in thousands) (unaudited)
| | | | | | | | | | |
Issuer | | | | Principal
Amount | | | Value | |
|
U.S. Government and U.S. Government Agency—49.0% | |
U.S. Treasury Inflation Indexed Notes/Bonds—7.8% | | | | | | | | | | |
U.S. Treasury Inflation Indexed Bond, 3.875%, due 4/15/29 | | | | $ | 8,207 | | | $ | 11,245 | |
U.S. Treasury Inflation Indexed Note, 1.875%, due 7/15/13 | | | | | 735 | | | | 781 | |
U.S. Treasury Inflation Indexed Note, 2.375%, due 1/15/17 | | | | | 3,345 | | | | 3,816 | |
| | | | | | | | | | |
Total U.S. Treasury Inflation Indexed Notes/Bonds | | | | | | | | | 15,842 | |
| | | | | | | | | | |
U.S. Treasury—1.0% | | | | | | | | | | |
U.S. Treasury Bond, 3.875%, due 8/15/40 | | | | | 500 | | | | 458 | |
U.S. Treasury Strip Principal, 0.000%, due 5/15/20 | | | | | 2,000 | | | | 1,512 | |
| | | | | | | | | | |
Total U.S. Treasury Obligations | | | | | | | | | 1,970 | |
| | | | | | | | | | |
Government National Mortgage
Association (GNMA)—4.6% | | | | | | | | | | |
GNR 2004-2 M5, 4.891%, due 7/16/34 | | | | | 125 | | | | 136 | |
GNR 2006-67 GB, 4.588%, due 9/16/34, VRN | | | | | 1,540 | | | | 1,663 | |
#699118, 6.000%, due 9/15/38 | | | | | 6,702 | | | | 7,527 | |
| | | | | | | | | | |
Total GNMA Mortgage Obligations | | | | | | | | | 9,326 | |
| | | | | | | | | | |
Federal Home Loan Mortgage
Corp. (FHLMC)—9.0% | | | | | | | | | | |
#G90024, 7.000%, due 1/20/13 | | | | | 22 | | | | 23 | |
#G30093, 7.000%, due 12/1/17 | | | | | 34 | | | | 38 | |
#G30255, 7.000%, due 7/1/21 | | | | | 73 | | | | 84 | |
#G12792, 4.500%, due 12/1/21 | | | | | 391 | | | | 418 | |
#D95897, 5.500%, due 3/1/23 | | | | | 205 | | | | 221 | |
#G30372, 5.000%, due 9/1/27 | | | | | 512 | | | | 551 | |
#G01728, 7.500%, due 7/1/32 | | | | | 290 | | | | 339 | |
#C01385, 6.500%, due 8/1/32 | | | | | 346 | | | | 392 | |
#G02141, 6.000%, due 3/1/36 | | | | | 1,714 | | | | 1,909 | |
#A62179, 6.000%, due 6/1/37 | | | | | 971 | | | | 1,082 | |
#A63539, 6.000%, due 7/1/37 | | | | | 1,175 | | | | 1,309 | |
#A62858, 6.500%, due 7/1/37 | | | | | 622 | | | | 702 | |
#G03170, 6.500%, due 8/1/37 | | | | | 1,654 | | | | 1,867 | |
#A66843, 6.500%, due 10/1/37 | | | | | 2,303 | | | | 2,620 | |
#A78138, 5.500%, due 6/1/38 | | | | | 1,264 | | | | 1,384 | |
#A81799, 6.500%, due 9/1/38 | | | | | 2,771 | | | | 3,153 | |
#C03665, 9.000%, due 4/1/41 | | | | | 1,916 | | | | 2,357 | |
| | | | | | | | | | |
Total FHLMC Mortgage Obligations | | | | | | | | | 18,449 | |
| | | | | | | | | | |
Federal National Mortgage
Association (FNMA)—26.6% | | | | | | | | | | |
#535559, 7.500%, due 9/1/12 | | | | | 31 | | | | 31 | |
#689612, 5.000%, due 5/1/18 | | | | | 360 | | | | 387 | |
#695910, 5.000%, due 5/1/18 | | | | | 744 | | | | 809 | |
#747903, 4.500%, due 6/1/19 | | | | | 330 | | | | 353 | |
#745735, 5.000%, due 3/1/21 | | | | | 801 | | | | 867 | |
#253847, 6.000%, due 5/1/21 | | | | | 215 | | | | 236 | |
#900725, 6.000%, due 8/1/21 | | | | | 184 | | | | 202 | |
#AD8164, 4.000%, due 8/1/25 | | | | | 1,267 | | | | 1,330 | |
#545437, 7.000%, due 2/1/32 | | | | | 181 | | | | 209 | |
#545759, 6.500%, due 7/1/32 | | | | | 1,927 | | | | 2,193 | |
#254548, 5.500%, due 12/1/32 | | | | | 761 | | | | 829 | |
| | | | | | | | | | | | |
Issuer | | NRSRO
Rating | | | Principal
Amount | | | Value | |
|
U.S. Government and U.S. Government Agency—(continued) | |
Federal National Mortgage Association (FNMA)—(continued) | | | | | | | | | | | | |
#684601, 6.000%, due 3/1/33 | | | | | | $ | 1,946 | | | $ | 2,184 | |
#190340, 5.000%, due 9/1/33 | | | | | | | 1,627 | | | | 1,739 | |
#254868, 5.000%, due 9/1/33 | | | | | | | 806 | | | | 861 | |
#739243, 6.000%, due 9/1/33 | | | | | | | 1,814 | | | | 2,023 | |
#739331, 6.000%, due 9/1/33 | | | | | | | 844 | | | | 941 | |
#555800, 5.500%, due 10/1/33 | | | | | | | 341 | | | | 371 | |
#725027, 5.000%, due 11/1/33 | | | | | | | 635 | | | | 678 | |
#555880, 5.500%, due 11/1/33 | | | | | | | 410 | | | | 447 | |
#555946, 5.500%, due 11/1/33 | | | | | | | 763 | | | | 837 | |
#756153, 5.500%, due 11/1/33 | | | | | | | 2,126 | | | | 2,330 | |
#725231, 5.000%, due 2/1/34 | | | | | | | 662 | | | | 708 | |
#725205, 5.000%, due 3/1/34 | | | | | | | 1,417 | | | | 1,514 | |
#725220, 5.000%, due 3/1/34 | | | | | | | 610 | | | | 652 | |
#725232, 5.000%, due 3/1/34 | | | | | | | 3,049 | | | | 3,259 | |
#725238, 5.000%, due 3/1/34 | | | | | | | 1,412 | | | | 1,509 | |
#763798, 5.500%, due 3/1/34 | | | | | | | 445 | | | | 486 | |
#725424, 5.500%, due 4/1/34 | | | | | | | 441 | | | | 480 | |
#725611, 5.500%, due 6/1/34 | | | | | | | 433 | | | | 472 | |
#786546, 6.000%, due 7/1/34 | | | | | | | 843 | | | | 935 | |
#787816, 6.000%, due 7/1/34 | | | | | | | 875 | | | | 975 | |
#190353, 5.000%, due 8/1/34 | | | | | | | 465 | | | | 497 | |
#357883, 5.000%, due 5/1/35 | | | | | | | 994 | | | | 1,062 | |
#745092, 6.500%, due 7/1/35 | | | | | | | 1,024 | | | | 1,165 | |
#357944, 6.000%, due 9/1/35 | | | | | | | 113 | | | | 125 | |
#829306, 6.000%, due 9/1/35 | | | | | | | 308 | | | | 341 | |
#843487, 6.000%, due 10/1/35 | | | | | | | 260 | | | | 289 | |
#849191, 6.000%, due 1/1/36 | | | | | | | 162 | | | | 180 | |
#848782, 6.500%, due 1/1/36 | | | | | | | 732 | | | | 831 | |
#745349, 6.500%, due 2/1/36 | | | | | | | 1,065 | | | | 1,213 | |
#895637, 6.500%, due 5/1/36 | | | | | | | 448 | | | | 508 | |
#831540, 6.000%, due 6/1/36 | | | | | | | 183 | | | | 203 | |
#745802, 6.000%, due 7/1/36 | | | | | | | 603 | | | | 672 | |
#886220, 6.000%, due 7/1/36 | | | | | | | 1,250 | | | | 1,393 | |
#893318, 6.500%, due 8/1/36 | | | | | | | 228 | | | | 259 | |
#909480, 6.000%, due 2/1/37 | | | | | | | 1,295 | | | | 1,436 | |
#928561, 6.000%, due 8/1/37 | | | | | | | 726 | | | | 809 | |
#948689, 6.000%, due 8/1/37 | | | | | | | 1,681 | | | | 1,857 | |
#888967, 6.000%, due 12/1/37 | | | | | | | 1,651 | | | | 1,840 | |
#962058, 6.500%, due 3/1/38 | | | | | | | 4,293 | | | | 4,907 | |
#934006, 6.500%, due 9/1/38 | | | | | | | 1,512 | | | | 1,728 | |
#986856, 6.500%, due 9/1/38 | | | | | | | 987 | | | | 1,120 | |
#991911, 7.000%, due 11/1/38 | | | | | | | 724 | | | | 848 | |
| | | | | | | | | | | | |
Total FNMA Mortgage Obligations | | | | | | | | | | | 54,130 | |
| | | | | | | | | | | | |
| | | |
Non-Agency Mortgage-Backed Obligations—0.3% | | | | | | | | | | | | |
First Plus Home Loan Trust, 1997-4, Tranche M1, 7.640%, 9/11/23§** | | | D | | | | 199 | | | | 179 | |
First Horizon Asset Securities, Inc., 2004-AR4, Tranche 3A1,
3.815%, 8/25/34, VRN | | | AAA | | | | 432 | | | | 386 | |
| | | | | | | | | | | | |
Total Non-Agency Mortgage-Backed Obligations | | | | | | | | | | | 565 | |
| | | | | | | | | | | | |
See accompanying Notes to Financial Statements.
76 Semi-Annual Report | June 30, 2011 |
Bond Fund
Portfolio of Investments, June 30, 2011 (all amounts in thousands) (unaudited)
| | | | | | | | | | | | |
Issuer | | NRSRO
Rating | | | Principal
Amount | | | Value | |
| | | |
Asset-Backed Securities—4.2% | | | | | | | | | | | | |
Avis Budget Rental Car Funding AESOP LLC—144A, 2009-1A, Tranche A, 9.310%, 10/20/13 | | | Aa1 | | | $ | 2,000 | | | $ | 2,167 | |
Hertz Vehicle Financing LLC—144A, 2009-2A, Tranche A1, 4.260%, 3/25/14 | | | Aaa | | | | 2,230 | | | | 2,330 | |
Centre Point Funding LLC—144A, 2010-1A, Tranche 1, 5.430%, 7/20/16 | | | A2 | | | | 2,255 | | | | 2,395 | |
Sierra Receivables Funding Co. LLC—144A, 2011-1A, Tranche A, 3.350%, 4/20/26 | | | A | | | | 1,712 | | | | 1,717 | |
| | | | | | | | | | | | |
Total Asset-Backed Securities | | | | | | | | | | | 8,609 | |
| | | | | | | | | | | | |
| |
Corporate Obligations—45.5% | | | | | |
CME Group, Inc.,
5.750%, due 2/15/14 | | | AA | | | | 700 | | | | 778 | |
Bank of America Corporation,
7.375%, due 5/15/14 | | | A+ | | | | 700 | | | | 787 | |
American Express Co.,
7.250%, due 5/20/14 | | | A+ | | | | 500 | | | | 572 | |
AT&T, Inc.,
5.100%, due 9/15/14 | | | A2 | | | | 1,250 | | | | 1,374 | |
D.R. Horton, Inc.,
5.625%, due 9/15/14 | | | BB | | | | 1,500 | | | | 1,556 | |
Corporation Nacional del Cobre de Chile—144A,
4.750%, due 10/15/14 | | | A1 | | | | 1,350 | | | | 1,447 | |
The Kroger Co.,
4.950%, due 1/15/15 | | | BBB | | | | 1,175 | | | | 1,291 | |
Yum! Brands, Inc.,
4.250%, due 9/15/15 | | | BBB- | | | | 350 | | | | 372 | |
Yum! Brands, Inc.,
6.250%, due 4/15/16 | | | BBB- | | | | 700 | | | | 803 | |
Owens-Brockway Glass Container, Inc.,
7.375%, due 5/15/16 | | | BB+ | | | | 1,250 | | | | 1,359 | |
Fiserv, Inc.,
3.125%, due 6/15/16 | | | Baa2 | | | | 1,825 | | | | 1,815 | |
FUEL Trust—144A,
3.984%, due 6/15/16 | | | Baa2 | | | | 2,000 | | | | 1,984 | |
SABMiller plc—144A,
6.500%, due 7/1/16 | | | BBB+ | | | | 700 | | | | 810 | |
Petrobras International Finance Co.,
6.125%, due 10/6/16 | | | A3 | | | | 1,350 | | | | 1,503 | |
EI du Pont de Nemours & Co.,
5.250%, due 12/15/16 | | | A | | | | 500 | | | | 565 | |
Comcast Corporation,
6.500%, due 1/15/17 | | | BBB+ | | | | 350 | | | | 408 | |
Corrections Corporation of America,
7.750%, due 6/1/17 | | | Ba1 | | | | 1,250 | | | | 1,361 | |
ERP Operating L.P.,
5.750%, due 6/15/17 | | | BBB+ | | | | 2,000 | | | | 2,217 | |
JPMorgan Chase & Co.,
6.125%, due 6/27/17 | | | A1 | | | | 600 | | | | 670 | |
Smithfield Foods, Inc.,
7.750%, due 7/1/17 | | | B+ | | | | 1,000 | | | | 1,037 | |
American Express Co.,
6.150%, due 8/28/17 | | | A+ | | | | 1,000 | | | | 1,140 | |
Capital One Financial Corporation,
6.750%, due 9/15/17 | | | A- | | | | 1,775 | | | | 2,052 | |
Exelon Generation Co. LLC,
6.200%, due 10/1/17 | | | A3 | | | | 1,100 | | | | 1,241 | |
| | | | | | | | | | | | |
Issuer | | NRSRO
Rating | | | Principal
Amount | | | Value | |
| |
Corporate Obligations—(continued) | | | | | |
Toll Brothers Finance Corporation,
8.910%, due 10/15/17 | | | BBB- | | | $ | 1,000 | | | $ | 1,172 | |
Motorola Solutions, Inc.,
6.000%, due 11/15/17 | | | BBB | | | | 1,500 | | | | 1,707 | |
Triumph Group, Inc.,
8.000%, due 11/15/17 | | | B+ | | | | 1,500 | | | | 1,579 | |
Union Pacific Corporation,
5.750%, due 11/15/17 | | | BBB+ | | | | 800 | | | | 919 | |
Wells Fargo & Co.,
5.625%, due 12/11/17 | | | AA- | | | | 1,000 | | | | 1,105 | |
Kohl’s Corporation,
6.250%, due 12/15/17 | | | BBB+ | | | | 350 | | | | 411 | |
American Tower Corporation,
4.500%, due 1/15/18 | | | Baa3 | | | | 1,150 | | | | 1,149 | |
Morgan Stanley,
6.625%, due 4/1/18 | | | A | | | | 2,000 | | | | 2,203 | |
General Electric Capital Corporation,
5.625%, due 5/1/18 | | | AA+ | | | | 1,250 | | | | 1,367 | |
Philip Morris International, Inc.,
5.650%, due 5/16/18 | | | A | | | | 1,000 | | | | 1,125 | |
Simon Property Group L.P.,
6.125%, due 5/30/18 | | | A- | | | | 1,750 | | | | 1,962 | |
Time Warner Cable, Inc.,
6.750%, due 7/1/18 | | | BBB | | | | 1,000 | | | | 1,160 | |
Petrohawk Energy Corporation,
7.250%, due 8/15/18 | | | B+ | | | | 1,000 | | | | 1,026 | |
Merrill Lynch & Co., Inc.,
6.875%, due 11/15/18 | | | A+ | | | | 1,075 | | | | 1,179 | |
Anheuser-Busch InBev Worldwide, Inc.,
7.750%, due 1/15/19 | | | A- | | | | 1,000 | | | | 1,258 | |
FedEx Corporation,
8.000%, due 1/15/19 | | | BBB | | | | 750 | | | | 943 | |
CSX Corporation,
7.375%, due 2/1/19 | | | BBB | | | | 800 | | | | 975 | |
Honeywell International, Inc.,
5.000%, due 2/15/19 | | | A | | | | 1,000 | | | | 1,099 | |
Pfizer, Inc.,
6.200%, due 3/15/19 | | | AA | | | | 1,250 | | | | 1,462 | |
BHP Billiton Finance USA, Ltd.,
6.500%, due 4/1/19 | | | A+ | | | | 1,300 | | | | 1,556 | |
Owens Corning,
9.000%, due 6/15/19 | | | BBB- | | | | 1,000 | | | | 1,194 | |
Discovery Communications LLC,
5.625%, due 8/15/19 | | | BBB | | | | 500 | | | | 553 | |
Roper Industries, Inc.,
6.250%, due 9/1/19 | | | Baa2 | | | | 1,225 | | | | 1,387 | |
Republic Services, Inc.,
5.500%, due 9/15/19 | | | BBB | | | | 1,650 | | | | 1,799 | |
Boston Properties L.P.,
5.875%, due 10/15/19 | | | A- | | | | 1,500 | | | | 1,643 | |
Crown Castle International Corporation,
7.125%, due 11/1/19 | | | BB- | | | | 1,000 | | | | 1,052 | |
Toll Brothers Finance Corporation,
6.750%, due 11/1/19 | | | BBB- | | | | 500 | | | | 517 | |
Ford Motor Credit Co. LLC,
8.125%, due 1/15/20 | | | Ba2 | | | | 1,515 | | | | 1,755 | |
Jarden Corporation,
7.500%, due 1/15/20 | | | B | | | | 1,500 | | | | 1,560 | |
Johnson Controls, Inc.,
5.000%, due 3/30/20 | | | BBB+ | | | | 1,625 | | | | 1,727 | |
United Technologies Corporation,
4.500%, due 4/15/20 | | | A+ | | | | 1,500 | | | | 1,588 | |
See accompanying Notes to Financial Statements.
June 30, 2011 | William Blair Funds 77 |
Bond Fund
Portfolio of Investments, June 30, 2011 (all amounts in thousands) (unaudited)
| | | | | | | | | | | | |
Issuer | | NRSRO
Rating | | | Principal
Amount | | | Value | |
| |
Corporate Obligations—(continued) | | | | | |
The Goldman Sachs Group, Inc.,
6.000%, due 6/15/20 | | | A1 | | | $ | 1,800 | | | $ | 1,937 | |
Commonwealth Edison Co.,
4.000%, due 8/1/20 | | | A- | | | | 1,000 | | | | 990 | |
Alcoa, Inc.,
6.150%, due 8/15/20 | | | BBB- | | | | 1,775 | | | | 1,880 | |
Omnicom Group, Inc.,
4.450%, due 8/15/20 | | | A- | | | | 2,000 | | | | 1,984 | |
The Goodyear Tire & Rubber Co.,
8.250%, due 8/15/20 | | | B+ | | | | 1,000 | | | | 1,080 | |
BE Aerospace, Inc.,
6.875%, due 10/1/20 | | | BB | | | | 1,000 | | | | 1,047 | |
Georgia-Pacific LLC—144A,
5.400%, due 11/1/20 | | | BBB | | | | 1,500 | | | | 1,529 | |
Progress Energy, Inc.,
4.400%, due 1/15/21 | | | BBB | | | | 1,625 | | | | 1,643 | |
Wyndham Worldwide Corporation,
5.625%, due 3/1/21 | | | BBB- | | | | 1,000 | | | | 997 | |
Ball Corporation,
5.750%, due 5/15/21 | | | BB+ | | | | 1,000 | | | | 1,003 | |
Energizer Holdings, Inc.—144A,
4.700%, due 5/19/21 | | | BBB- | | | | 2,000 | | | | 1,975 | |
Discovery Communications LLC,
4.375%, due 6/15/21 | | | BBB | | | | 1,000 | | | | 990 | |
Southwest Airlines Co. 2007-1 Pass Through Trust,
6.150%, due 8/1/22 | | | A2 | | | | 649 | | | | 701 | |
The Kroger Co.,
8.000%, due 9/15/29 | | | BBB | | | | 425 | | | | 533 | |
Conoco Funding Co.,
7.250%, due 10/15/31 | | | A1 | | | | 400 | | | | 493 | |
Kohl’s Corporation,
6.000%, due 1/15/33 | | | BBB+ | | | | 1,000 | | | | 1,034 | |
NRSRO = Nationally Recognized Statistical Rating Organization—The credit quality ratings of the securities in the Fund reflect the highest category rating by either Fitch Ratings, Moody’s Investors Service Inc., or Standard & Poor’s, a division of the McGraw-Hill Companies, Inc. The obligations of certain U. S. Government-sponsored securities are neither issued nor guaranteed by the U. S. Treasury.
VRN = Variable Rate Note
§ = Deemed illiquid pursuant to Liquidity Procedures approved by the Board of Trustees. This holding represents 0.09% of the net assets at June 30, 2011.
** = Fair valued pursuant to Valuation Procedures adopted by the Board of Trustees. This holding represents 0.09% of the Fund’s net assets at June 30, 2011.
| | | | | | | | | | | | |
Issuer | | NRSRO
Rating | | | Principal
Amount | | | Value | |
| |
Corporate Obligations—(continued) | | | | | |
Wisconsin Electric Power Co.,
5.700%, due 12/1/36 | | | A+ | | | $ | 500 | | | $ | 530 | |
Comcast Corporation,
6.450%, due 3/15/37 | | | BBB+ | | | | 650 | | | | 695 | |
Yum! Brands, Inc.,
6.875%, due 11/15/37 | | | BBB- | | | | 600 | | | | 681 | |
JPMorgan Chase & Co.,
6.400%, due 5/15/38 | | | Aa3 | | | | 900 | | | | 1,016 | |
COX Communications, Inc.— 144A,
6.950%, due 6/1/38 | | | Baa2 | | | | 350 | | | | 394 | |
General Electric Capital Corporation,
6.875%, due 1/10/39 | | | AA+ | | | | 750 | | | | 849 | |
Burlington Northern Santa Fe LLC,
5.750%, due 5/1/40 | | | A3 | | | | 1,515 | | | | 1,561 | |
| | | | | | | | | | | | |
Total Corporate Obligations | | | | | | | | | | | 92,816 | |
| | | | | | | | | | | | |
Total Long-Term Investments—99.0%
(cost $191,646) | | | | 201,707 | |
| | | | | | | | | | | | |
| | | |
Repurchase Agreement | | | | | | | | | | | | |
Fixed Income Clearing Corporation, 0.010% dated 6/30/11, due 7/1/11, repurchase price $2,256, collateralized by Federal National Mortgage Association, 3.420%, due 11/24/20 | | | AAA | | | | 2,256 | | | | 2,256 | |
| | | | | | | | | | | | |
Total Repurchase Agreement—1.1%
(cost $2,256) | | | | 2,256 | |
| | | | | | | | | | | | |
Total Investments—100.1%
(cost $193,902) | | | | 203,963 | |
Liabilities, plus cash and other assets—(0.1)% | | | | (155 | ) |
| | | | | | | | | | | | |
Net assets—100.0% | | | $ | 203,808 | |
| | | | | | | | | | | | |
See accompanying Notes to Financial Statements.
78 Semi-Annual Report | June 30, 2011 |
Christopher T. Vincent
INCOME FUND
The Income Fund seeks a high level of current income with relative stability of principal.
AN OVERVIEW FROM THE PORTFOLIO MANAGER
The Income Fund posted a 2.48% increase on a total return basis (Class N Shares) for the six months ended June 30, 2011. By comparison, the Fund’s benchmark, the Barclays Capital Intermediate Government/Credit Bond Index, gained 2.47%.
The Fund posted positive performance results, in spite of what could be considered headwinds to our style of investing. Security selection was the main driver of Fund performance.
The Fund has been defensively positioned against rising interest rates, which worked well for the Fund in the first quarter but worked against it during the second.
U.S. Treasury securities were the best performing asset class during the second quarter. The “spread” between U.S. Treasury securities and Corporate bonds widened as interest rates fell during the second quarter. High yield bonds underperformed investment grade securities by 1.25% over this time period.
The Fund typically overweights Corporate bonds and underweights U.S. Treasury securities, so the Fund’s investment style proved challenging to relative performance during the quarter. However, security selection in the Corporate and Mortgage-backed sectors mitigated the magnitude of the Fund’s relative underperformance.
Several of the Fund’s Corporate bond holdings had a positive impact on performance during the quarter. In addition, positions in Georgia-Pacific LLC, Comcast Corporation, J.P. Morgan Chase & Co., and Anheuser-Busch/InBev Worldwide, Inc. were additive to performance as their incremental yield offset the impact of widening risk spreads during the quarter.
The Fund’s Mortgage-Backed securities holdings were another source of value during the quarter. The Fund emphasizes specified pools with low loan balances, seasoning, or above-market coupon rates in an attempt to earn a yield advantage while experiencing slower-than-expected prepayment speeds. During the second quarter, the Fund’s holdings in such securities had a positive effect on performance.
We believe the Fund’s investment strategy is designed to help the Fund hold its ground in market conditions such as those just experienced in the first half of the year, and the Fund did just that.
Security selection within the Mortgage-backed and Corporate bond sectors—which provide more yield than U.S. Treasury securities—provided a solid underpinning to the Fund. On the other hand, the Fund’s defensive interest rate positioning was a limiting factor as interest rates have declined since the start of the year.
An allocation to longer-dated TIPS (Treasury Inflation Protected Securities) also benefitted the Fund. TIPS have been the strongest-performing segment of the investment-grade bond market year-to-date. We find appeal in TIPS because they offer protection against unexpected inflation as well as diversification benefits.
June 30, 2011 | William Blair Funds 79 |
Income Fund
Performance Highlights (unaudited)
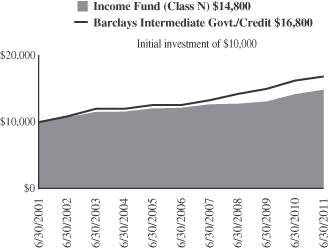
Average Annual Total Return at 6/30/2011
| | | | | | | | | | | | | | | | | | | | |
| | | Year
to
Date | | | 1
Year | | | 3
Year | | | 5
Year | | | 10
Year | |
Class N | | | 2.48 | % | | | 4.56 | % | | | 5.26 | % | | | 4.13 | % | | | 4.03 | % |
Class I | | | 2.60 | | | | 4.83 | | | | 5.47 | | | | 4.33 | | | | 4.20 | |
Barclays Capital Intermediate Government/Credit Bond Index | | | 2.47 | | | | 3.77 | | | | 5.76 | | | | 6.08 | | | | 5.35 | |
Performance cited represents past performance. Past performance does not guarantee future results and current performance may be lower or higher than the data quoted. Results shown are average annual total returns, which assume reinvestment of dividends and capital gains. Investment returns and principal will fluctuate and you may have a gain or loss when you sell shares. For the most current month-end performance information, please call 1-800-742-7272, or visit our Web site at www.williamblairfunds.com. From time to time, the investment advisor may waive fees or reimburse expenses for the Fund. Without these waivers, performance would be lower. Class N shares are available to the general public without a sales load. Class I shares are available to certain institutional investors and advisory clients of William Blair & Company, L.L.C., without a sales load or distribution (12b-1) or service fees.
The performance highlights and graph presented above do not reflect the deduction of taxes that a shareholder would pay on fund distributions or the redemption of fund shares.
The Barclays Capital Intermediate Government/Credit Bond Index indicates broad intermediate government/corporate bond market performance.
This report identifies the Fund’s investments on June 30, 2011. These holdings are subject to change. Not all investments in the Fund performed the same, nor is there any guarantee that these investments will perform as well in the future. Market forecasts provided in this report may not necessarily come to pass.
Sector Diversification (unaudited)
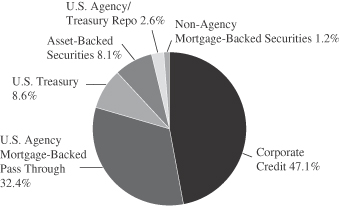
The sector diversification shown is based on the total investments.
80 Semi-Annual Report | June 30, 2011 |
Income Fund
Portfolio of Investments, June 30, 2011 (all amounts in thousands) (unaudited)
| | | | | | | | | | |
Issuer | | Principal
Amount | | | Value | |
|
U.S. Government and U.S. Government Agency—41.7% | |
U.S. Treasury Inflation Indexed Notes/Bonds—4.7% | | | | | | | | | | |
U.S. Treasury Inflation Indexed Note,
2.375%, due 1/15/17 | | | | $ | 3,903 | | | $ | 4,452 | |
| | | | | | | | | | |
U.S. Treasury—4.0% | | | | | | | | | | |
U.S. Treasury Note,
3.125%, due 5/15/19 | | | | | 500 | | | | 516 | |
U.S. Treasury Note,
2.625%, due 8/15/20 | | | | | 2,500 | | | | 2,420 | |
U.S. Treasury Strip Principal,
0.000%, due 5/15/20 | | | | | 1,185 | | | | 896 | |
| | | | | | | | | | |
Total U.S. Treasury Obligations | | | | | | | | | 3,832 | |
| | | | | | | | | | |
Government National Mortgage Association (GNMA)—0.2% | | | | | | | | | | |
#780405, 9.500%, due 11/15/17 | | | | | 128 | | | | 139 | |
#357322, 7.000%, due 9/15/23 | | | | | 83 | | | | 96 | |
| | | | | | | | | | |
Total GNMA Mortgage Obligations | | | | | | | | | 235 | |
| | | | | | | | | | |
Federal Home Loan Mortgage Corp. (FHLMC)—11.8% | | | | | | | | | | |
#G10708, 6.500%, due 8/1/12 | | | | | 13 | | | | 13 | |
#E72924, 7.000%, due 10/1/13 | | | | | 184 | | | | 190 | |
#E81703, 7.000%, due 5/1/15 | | | | | 235 | | | | 248 | |
#E81697, 8.000%, due 5/1/15 | | | | | 566 | | | | 622 | |
#E81908, 8.500%, due 12/1/15 | | | | | 35 | | | | 40 | |
#J02184, 8.000%, due 4/1/16 | | | | | 361 | | | | 387 | |
#G90022, 8.000%, due 9/17/16 | | | | | 189 | | | | 202 | |
#M30028, 5.500%, due 5/1/17 | | | | | 30 | | | | 31 | |
#E90398, 7.000%, due 5/1/17 | | | | | 551 | | | | 604 | |
#E96536, 5.000%, due 3/1/18 | | | | | 627 | | | | 678 | |
#E97112, 4.000%, due 5/1/18 | | | | | 287 | | | | 304 | |
#B13459, 4.500%, due 4/1/19 | | | | | 199 | | | | 212 | |
#C67537, 9.500%, due 8/1/21 | | | | | 6 | | | | 6 | |
#D95621, 6.500%, due 7/1/22 | | | | | 1,721 | | | | 1,940 | |
#A45790, 7.500%, due 5/1/35 | | | | | 343 | | | | 401 | |
#G02141, 6.000%, due 3/1/36 | | | | | 953 | | | | 1,062 | |
#A66843, 6.500%, due 10/1/37 | | | | | 1,066 | | | | 1,213 | |
#A81799, 6.500%, due 9/1/38 | | | | | 1,640 | | | | 1,866 | |
#C03665, 9.000%, due 4/1/41 | | | | | 976 | | | | 1,200 | |
| | | | | | | | | | |
Total FHLMC Mortgage Obligations | | | | | | | | | 11,219 | |
| | | | | | | | | | |
Federal National Mortgage Association (FNMA)—21.0% | | | | | | | | | | |
#577395, 10.000%, due 8/1/11 | | | | | 1 | | | | 1 | |
#254788, 6.500%, due 4/1/13 | | | | | 41 | | | | 42 | |
#725315, 8.000%, due 5/1/13 | | | | | 55 | | | | 57 | |
#593561, 9.500%, due 8/1/14 | | | | | 91 | | | | 99 | |
#567027, 7.000%, due 9/1/14 | | | | | 455 | | | | 480 | |
#567026, 6.500%, due 10/1/14 | | | | | 314 | | | | 328 | |
#458124, 7.000%, due 12/15/14 | | | | | 59 | | | | 63 | |
#576554, 8.000%, due 1/1/16 | | | | | 540 | | | | 594 | |
#576553, 8.000%, due 2/1/16 | | | | | 808 | | | | 908 | |
#555747, 8.000%, due 5/1/16 | | | | | 72 | | | | 75 | |
#735569, 8.000%, due 10/1/16 | | | | | 463 | | | | 508 | |
#725410, 7.500%, due 4/1/17 | | | | | 253 | | | | 263 | |
#643217, 6.500%, due 6/1/17 | | | | | 166 | | | | 182 | |
#679247, 7.000%, due 8/1/17 | | | | | 677 | | | | 760 | |
#685194, 4.500%, due 3/1/18 | | | | | 993 | | | | 1,063 | |
#689334, 5.000%, due 3/1/18 | | | | | 148 | | | | 160 | |
| | | | | | | | | | | | |
Issuer | | NRSRO
Rating | | | Principal
Amount | | | Value | |
|
U.S. Government and U.S. Government Agency—(continued) | |
Federal National Mortgage Association (FNMA)—(continued) | | | | | | | | | | | | |
#695910, 5.000%, due 5/1/18 | | | | | | $ | 638 | | | $ | 694 | |
#740847, 6.000%, due 10/1/18 | | | | | | | 396 | | | | 434 | |
#323501, 6.500%, due 1/1/19 | | | | | | | 129 | | | | 146 | |
#255358, 5.000%, due 9/1/19 | | | | | | | 185 | | | | 200 | |
#852864, 7.000%, due 7/1/20 | | | | | | | 1,433 | | | | 1,640 | |
#458147, 10.000%, due 8/15/20 | | | | | | | 347 | | | | 391 | |
#835563, 7.000%, due 10/1/20 | | | | | | | 612 | | | | 688 | |
#735574, 8.000%, due 3/1/22 | | | | | | | 372 | | | | 444 | |
#679253, 6.000%, due 10/1/22 | | | | | | | 895 | | | | 981 | |
FNR G93-19 SH, 11.234%, due 4/25/23, VRN | | | | | | | 11 | | | | 12 | |
#AD8164, 4.000%, due 8/1/25 | | | | | | | 938 | | | | 985 | |
#AE1176, 4.000%, due 8/1/25 | | | | | | | 948 | | | | 995 | |
#255956, 5.500%, due 10/1/25 | | | | | | | 242 | | | | 264 | |
#806458, 8.000%, due 6/1/28 | | | | | | | 298 | | | | 350 | |
#880155, 8.500%, due 7/1/29 | | | | | | | 730 | | | | 861 | |
#797846, 7.000%, due 3/1/32 | | | | | | | 843 | | | | 957 | |
#745519, 8.500%, due 5/1/32 | | | | | | | 227 | | | | 268 | |
#654674, 6.500%, due 9/1/32 | | | | | | | 176 | | | | 201 | |
#733897, 6.500%, due 12/1/32 | | | | | | | 276 | | | | 316 | |
#886220, 6.000%, due 7/1/36 | | | | | | | 891 | | | | 992 | |
#962058, 6.500%, due 3/1/38 | | | | | | | 1,628 | | | | 1,861 | |
#991911, 7.000%, due 11/1/38 | | | | | | | 579 | | | | 677 | |
| | | | | | | | | | | | |
Total FNMA Mortgage Obligations | | | | | | | | | | | 19,940 | |
| | | | | | | | | | | | |
| | | |
Non-Agency Mortgage-Backed Obligations—1.2% | | | | | | | | | | | | |
First Plus Home Loan Trust, 1997-4, Tranche M1,
7.640%, 9/11/23**§ | | | D | | | | 676 | | | | 609 | |
First Plus Home Loan Trust, 1997-4, Tranche M2,
7.830%, 9/11/23**§ | | | D | | | | 143 | | | | 108 | |
First Plus Home Loan Trust, 1998-3, Tranche M2,
7.920%, 5/10/24**§ | | | Caa1 | | | | 256 | | | | 247 | |
Lehman Structured Securities Corp.—144A, 2004-2, Tranche M1,
2.705%, 2/28/33, VRN§ | | | CCC | | | | 398 | | | | 182 | |
| | | | | | | | | | | | |
Total Non-Agency Mortgage-Backed Obligations | | | | | | | | | | | 1,146 | |
| | | | | | | | | | | | |
| | | |
Asset-Backed Securities—8.3% | | | | | | | | | | | | |
John Deere Owner Trust, 2009-A, Tranche A3,
2.590%, 10/15/13 | | | AAA | | | | 102 | | | | 103 | |
Avis Budget Rental Car Funding AESOP LLC—144A, 2009-1A, Tranche A,
9.310%, 10/20/13 | | | Aa1 | | | | 1,000 | | | | 1,083 | |
Harley-Davidson Motorcycle Trust, 2009-1, Tranche A3,
3.190%, 11/15/13 | | | AAA | | | | 309 | | | | 312 | |
Mercedes-Benz Auto Receivables Trust, 2009-1, Tranche A3,
1.670%, 1/15/14 | | | AAA | | | | 341 | | | | 343 | |
Hertz Vehicle Financing LLC—144A, 2009-2A, Tranche A1,
4.260%, 3/25/14 | | | AAA | | | | 1,500 | | | | 1,567 | |
See accompanying Notes to Financial Statements.
June 30, 2011 | William Blair Funds 81 |
Income Fund
Portfolio of Investments, June 30, 2011 (all amounts in thousands) (unaudited)
| | | | | | | | | | | | |
Issuer | | NRSRO
Rating | | | Principal
Amount | | | Value | |
|
Asset-Backed Securities—(continued) | |
Chase Issuance Trust, 2008-A10, Tranche A10,
0.937%, 8/17/15, VRN | | | AAA | | | $ | 1,500 | | | $ | 1,519 | |
Chase Issuance Trust, 2008-A3, Tranche A,
1.287%, 3/15/16, VRN | | | AAA | | | | 250 | | | | 257 | |
Centre Point Funding LLC—144A, 2010-1A, Tranche 1,
5.430%, 7/20/16 | | | A2 | | | | 1,503 | | | | 1,597 | |
Citibank Omni Master Trust—144A, 2009-A14A, Tranche A14,
2.937%, 8/15/18, VRN | | | AAA | | | | 1,000 | | | | 1,051 | |
| | | | | | | | | | | | |
Total Asset-Backed Securities | | | | | | | | | | | 7,832 | |
| | | | | | | | | | | | |
| | | |
Corporate Obligations—47.5% | | | | | | | | | | | | |
Citigroup, Inc.,
5.500%, due 4/11/13 | | | A+ | | | | 1,000 | | | | 1,062 | |
Novartis Capital Corporation,
4.125%, due 2/10/14 | | | Aa2 | | | | 1,000 | | | | 1,078 | |
CME Group, Inc.,
5.750%, due 2/15/14 | | | AA | | | | 1,000 | | | | 1,111 | |
PACCAR, Inc.,
6.875%, due 2/15/14 | | | A+ | | | | 1,000 | | | | 1,142 | |
PepsiAmericas, Inc.,
4.375%, due 2/15/14 | | | Aa3 | | | | 500 | | | | 541 | |
Coca-Cola Enterprises, Inc.,
7.375%, due 3/3/14 | | | A+ | | | | 900 | | | | 1,045 | |
Bank of America Corporation,
7.375%, due 5/15/14 | | | A+ | | | | 500 | | | | 562 | |
St. Jude Medical, Inc.,
3.750%, due 7/15/14 | | | A | | | | 500 | | | | 532 | |
AT&T, Inc.,
5.100%, due 9/15/14 | | | A2 | | | | 1,250 | | | | 1,374 | |
Corporation Nacional del Cobre de Chile—144A,
4.750%, due 10/15/14 | | | A1 | | | | 1,000 | | | | 1,072 | |
EI du Pont de Nemours & Co.,
3.250%, due 1/15/15 | | | A | | | | 700 | | | | 733 | |
United Technologies Corporation,
4.875%, due 5/1/15 | | | A+ | | | | 1,000 | | | | 1,112 | |
Petrobras International Finance Co.,
6.125%, due 10/6/16 | | | A3 | | | | 1,000 | | | | 1,113 | |
BHP Billiton Finance USA, Ltd.,
5.400%, due 3/29/17 | | | A+ | | | | 1,000 | | | | 1,137 | |
ERP Operating L.P.,
5.750%, due 6/15/17 | | | BBB+ | | | | 1,000 | | | | 1,109 | |
JPMorgan Chase & Co.,
6.125%, due 6/27/17 | | | A1 | | | | 1,750 | | | | 1,956 | |
Kimberly-Clark Corporation,
6.125%, due 8/1/17 | | | A | | | | 1,000 | | | | 1,180 | |
American Express Co.,
6.150%, due 8/28/17 | | | A+ | | | | 1,500 | | | | 1,709 | |
IBM Corporation,
5.700%, due 9/14/17 | | | Aa3 | | | | 1,750 | | | | 2,035 | |
Capital One Financial Corporation,
6.750%, due 9/15/17 | | | A- | | | | 1,000 | | | | 1,156 | |
Exelon Generation Co. LLC,
6.200%, due 10/1/17 | | | A3 | | | | 1,000 | | | | 1,128 | |
Tesco plc—144A,
5.500%, due 11/15/17 | | | A- | | | | 1,000 | | | | 1,131 | |
Abbott Laboratories,
5.600%, due 11/30/17 | | | AA | | | | 500 | | | | 579 | |
| | | | | | | | | | | | |
Issuer | | NRSRO
Rating | | | Principal
Amount | | | Value | |
Wells Fargo & Co.,
5.625%, due 12/11/17 | | | AA- | | | $ | 750 | | | $ | 828 | |
American Tower Corporation,
4.500%, due 1/15/18 | | | Baa3 | | | | 500 | | | | 500 | |
Morgan Stanley,
6.625%, due 4/1/18 | | | A | | | | 750 | | | | 826 | |
General Electric Capital Corporation,
5.625%, due 5/1/18 | | | AA+ | | | | 1,725 | | | | 1,891 | |
Philip Morris International, Inc.,
5.650%, due 5/16/18 | | | A | | | | 1,250 | | | | 1,406 | |
Simon Property Group L.P.,
6.125%, due 5/30/18 | | | A- | | | | 1,000 | | | | 1,121 | |
Time Warner Cable, Inc.,
6.750%, due 7/1/18 | | | BBB | | | | 750 | | | | 870 | |
FedEx Corporation,
8.000%, due 1/15/19 | | | BBB | | | | 750 | | | | 942 | |
Honeywell International, Inc.,
5.000%, due 2/15/19 | | | A | | | | 1,225 | | | | 1,347 | |
The Procter & Gamble Co.,
4.700%, due 2/15/19 | | | AA- | | | | 500 | | | | 552 | |
Unilever Capital Corporation,
4.800%, due 2/15/19 | | | A+ | | | | 500 | | | | 548 | |
Pfizer, Inc.,
6.200%, due 3/15/19 | | | AA | | | | 1,000 | | | | 1,170 | |
Boston Properties L.P.,
5.875%, due 10/15/19 | | | A- | | | | 1,350 | | | | 1,479 | |
The Goldman Sachs Group, Inc.,
6.000%, due 6/15/20 | | | A1 | | | | 1,000 | | | | 1,076 | |
Alcoa, Inc.,
6.150%, due 8/15/20 | | | A- | | | | 750 | | | | 795 | |
Omnicom Group, Inc.,
4.450%, due 8/15/20 | | | BBB+ | | | | 750 | | | | 744 | |
Georgia-Pacific LLC—144A,
5.400%, due 11/1/20 | | | BBB | | | | 450 | | | | 459 | |
Progress Energy, Inc.,
4.400%, due 1/15/21 | | | BBB | | | | 750 | | | | 758 | |
Energizer Holdings, Inc.—144A,
4.700%, due 5/19/21 | | | BBB- | | | | 750 | | | | 741 | |
Southwest Airlines Co. 2007-1 Pass Through Trust,
6.150%, due 2/1/24 | | | A2 | | | | 1,428 | | | | 1,542 | |
| | | | | | | | | | | | |
Total Corporate Obligations | | | | | | | | | | | 45,192 | |
| | | | | | | | | | | | |
Total Long-Term Investments—98.7%
(cost $88,998) | | | | 93,848 | |
| | | | | | | | | | | | |
| | | |
Repurchase Agreement | | | | | | | | | | | | |
State Street Bank and Trust Company, 0.010% dated 6/30/11, due 7/1/11, repurchase price $2,481, collateralized by U.S. Treasury Bill, 0.020%, due 8/11/11 | | | | | | | 2,481 | | | | 2,481 | |
| | | | | | | | | | | | |
Total Repurchase Agreement—2.6%
(cost $2,481) | | | | 2,481 | |
| | | | | | | | | | | | |
Total Investments—101.3%
(cost $91,479) | | | | 96,329 | |
Liabilities, plus cash and other assets—(1.3)% | | | | (1,201 | ) |
| | | | | | | | | | | | |
Net assets—100.0% | | | $ | 95,128 | |
| | | | | | | | | | | | |
See accompanying Notes to Financial Statements.
82 Semi-Annual Report | June 30, 2011 |
Income Fund
Portfolio of Investments, June 30, 2011 (all amounts in thousands) (unaudited)
NRSRO = Nationally Recognized Statistical Rating Organization—The credit quality ratings of the securities in the Fund reflect the highest category rating by either Fitch Ratings, Moody’s Investors Service Inc., or Standard & Poor’s, a division of the McGraw-Hill Companies, Inc.
The obligations of certain U. S. Government-sponsored securities are neither issued nor guaranteed by the U. S. Treasury.
VRN = Variable Rate Note
** = Fair valued pursuant to Valuation Procedures adopted by the Board of Trustees. These holdings represent 1.01% of the Fund’s net assets at June 30, 2011.
§ = Deemed illiquid pursuant to Liquidity Procedures approved by the Board of Trustees. These holdings represent 1.20% of the net assets at June 30, 2011.
See accompanying Notes to Financial Statements.
June 30, 2011 | William Blair Funds 83 |
Christopher T. Vincent
Paul J. Sularz
LOW DURATION FUND
The Low Duration Fund seeks to maximize total return. Total return includes both income and capital appreciation.
AN OVERVIEW FROM THE PORTFOLIO MANAGERS
The Low Duration Fund posted a 1.13% increase on a total return basis (Class N Shares) for the six months ended June 30, 2011. By comparison, the Fund’s benchmark, the Merrill Lynch 1-Year U.S. Treasury Note Index, gained 0.35%.
The Fund had a positive first half of 2011, with the Fund outperforming its Merrill Lynch 1-Year U.S. Treasury Note Index benchmark. We believe the Fund has been able to accomplish this objective without sacrificing credit quality. The Fund does not own securities with a rating below “A” from a Nationally Recognized Statistical Rating Organization (“NRSRO”).
The majority of the Fund’s portfolio is invested in seasoned U.S. Government-guaranteed short duration Mortgage-backed Fannie Mae and Freddie Mac securities. This is the Fund’s major sector emphasis. We favor such securities because they are high quality instruments, provide excellent liquidity, and pay monthly principal and interest, which we then are able to reinvest. The benefits of this strategy are evident in a rising rate environment such as the one we experienced during the first quarter.
Asset-backed Securities are another segment of the market in which we invest that offers monthly payment of principal and interest. We continued to invest in credit card securitizations issued by top-tier banking institutions. As mentioned, all Asset-backed Securities held in the Fund must maintain a rating above “A.”
Since the beginning of this year we have increased the Fund’s holdings of Asset-backed Securities whose coupons are reset monthly and are tied to LIBOR—the London Interbank Offered Rate. The income from these securities will rise with any increase in rates and will protect the Fund against falling prices. The percentage of these floating-rate securities in the Fund’s portfolio rose from approximately 15% at the beginning of 2011 to 17% at the end of June.
The Fund purchased TIPS (Treasury Inflation-Protected Securities) earlier this year. TIPS have been the strongest-performing investment grade security. We believe in holding TIPS instead of nominal Treasuries, as TIPS provide protection against unexpected inflation and diversification benefits.
The Fund kept its exposure to cash and cash equivalents extremely low, given the very low rates currently available from money market instruments.
Assets in this Fund continued to build since the Fund’s inception on December 1, 2009, with assets increasing to a new high “watermark” of approximately $155 million at the end of the first quarter.
84 Semi-Annual Report | June 30, 2011 |
Low Duration Fund
Performance Highlights (unaudited)
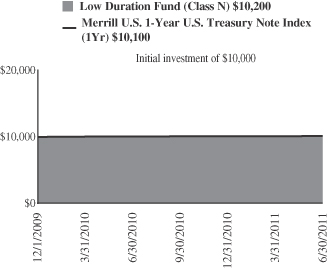
Average Annual Total Return at 6/30/2011
| | | | | | | | | | | | |
| | | Year
To
Date | | | 1
Year | | | Since
Inception(a) | |
Class N | | | 1.13 | % | | | 1.56 | % | | | 1.51 | % |
Class I | | | 1.31 | | | | 1.71 | | | | 1.64 | |
Merrill Lynch 1-Year U.S. Treasury Note Index | | | 0.35 | | | | 0.67 | | | | 0.65 | |
| | (a) | | For the period from December 1, 2009 (Commencement of Operations) to June 30, 2011. | |
Performance cited represents past performance. Past performance does not guarantee future results and current performance may be lower or higher than the data quoted. Results shown are average annual total returns, which assume reinvestment of dividends and capital gains. Investment returns and principal will fluctuate and you may have a gain or loss when you sell shares. For the most current month-end performance information, please call 1-800-742-7272, or visit our Web site at www.williamblairfunds.com. From time to time, the investment advisor may waive fees or reimburse expenses for the Fund. Without these waivers, performance would be lower. Class N shares are available to the general public without a sales load. Class I shares are available to certain institutional investors and advisory clients of William Blair & Company, L.L.C., without a sales load or distribution fees (12b-1).
The performance highlights and graph presented above do not reflect the deduction of taxes that a shareholder would pay on fund distributions or the redemption of fund shares.
The Merrill Lynch 1-Year U.S. Treasury Note Index is comprised of a single U.S. Treasury Note issue purchased at the beginning of the month and held for a full month. Each month the index is rebalanced and the issue selected is the outstanding U.S. Treasury Note that matures closest to, but not beyond one year from the rebalancing date.
This report identifies the Fund’s investments on June 30, 2011. These holdings are subject to change. Not all investments in the Fund performed the same, nor is there any guarantee that these investments will perform as well in the future. Market forecasts provided in this report may not necessarily come to pass.
Sector Diversification (unaudited)
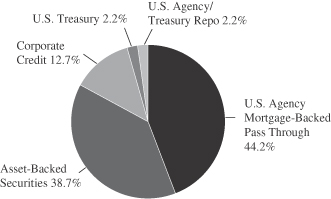
The sector diversification shown is based on the total investments.
June 30, 2011 | William Blair Funds 85 |
Low Duration Fund
Portfolio of Investments, June 30, 2011 (all dollar amounts in thousands) (unaudited)
| | | | | | | | | | |
Issuer | | Principal
Amount | | | Value | |
|
U.S. Government and U.S. Government Agency—47.2% | |
U.S. Treasury Inflation Indexed Notes/Bonds—2.2% | | | | | | | | |
U.S. Treasury Inflation Indexed Note,
2.000%, due 7/15/14 | | $ | 2,982 | | | $ | 3,252 | |
| | | | | | | | | | |
Government National Mortgage Association (GNMA)—0.5% | | | | | | | | | | |
#781567, 5.000%, due 2/15/18 | | | 118 | | | | 127 | |
#606406, 5.000%, due 4/15/18 | | | 183 | | | | 198 | |
#003438, 4.500%, due 9/20/18 | | | 293 | | | | 316 | |
#003465, 4.500%, due 11/20/18 | | | 87 | | | | 93 | |
| | | | | | | | | | |
Total GNMA Mortgage Obligations | | | | | | | | | 734 | |
| | | | | | | | | | |
Federal Home Loan Mortgage Corp. (FHLMC)—13.1% | | | | | | | | |
#M80931, 5.500%, due 8/1/11 | | | 9 | | | | 9 | |
#M80953, 4.000%, due 12/1/11 | | | 221 | | | | 224 | |
#M80970, 4.500%, due 5/1/12 | | | 44 | | | | 44 | |
#B18053, 5.000%, due 3/1/15 | | | 80 | | | | 84 | |
#G11885, 5.000%, due 1/1/16 | | | 251 | | | | 269 | |
#E86134, 5.000%, due 11/1/16 | | | 231 | | | | 248 | |
#E96536, 5.000%, due 3/1/18 | | | 391 | | | | 423 | |
#E95355, 5.000%, due 4/1/18 | | | 492 | | | | 531 | |
#E01377, 4.500%, due 5/1/18 | | | 486 | | | | 517 | |
#G11618, 4.500%, due 5/1/18 | | | 2,288 | | | | 2,445 | |
#E01411, 5.000%, due 7/1/18 | | | 246 | | | | 264 | |
#E01424, 4.000%, due 8/1/18 | | | 6 | | | | 7 | |
#E99963, 4.500%, due 10/1/18 | | | 140 | | | | 150 | |
#E01488, 5.000%, due 10/1/18 | | | 524 | | | | 564 | |
#E99895, 5.000%, due 10/1/18 | | | 1,027 | | | | 1,110 | |
#G12093, 4.500%, due 12/1/18 | | | 630 | | | | 673 | |
#B11386, 5.000%, due 12/1/18 | | | 227 | | | | 246 | |
#B11362, 5.500%, due 12/1/18 | | | 33 | | | | 35 | |
#G13367, 5.500%, due 12/1/18 | | | 182 | | | | 198 | |
#E01545, 5.000%, due 1/1/19 | | | 300 | | | | 323 | |
#B12826, 4.500%, due 3/1/19 | | | 429 | | | | 459 | |
#G11766, 5.000%, due 3/1/19 | | | 214 | | | | 231 | |
#G18001, 4.500%, due 7/1/19 | | | 280 | | | | 299 | |
#G11596, 5.500%, due 8/1/19 | | | 240 | | | | 261 | |
#B16291, 5.000%, due 9/1/19 | | | 1,803 | | | | 1,949 | |
#G11690, 4.000%, due 2/1/20 | | | 41 | | | | 44 | |
#G18045, 5.000%, due 3/1/20 | | | 234 | | | | 253 | |
#G11892, 4.000%, due 4/1/20 | | | 248 | | | | 263 | |
#B19078, 5.000%, due 4/1/20 | | | 158 | | | | 171 | |
#G18048, 5.000%, due 4/1/20 | | | 158 | | | | 171 | |
#J08152, 5.000%, due 5/1/20 | | | 201 | | | | 217 | |
#G11720, 4.500%, due 8/1/20 | | | 51 | | | | 55 | |
#G12394, 5.000%, due 5/1/21 | | | 298 | | | | 322 | |
#G13296, 5.000%, due 5/1/21 | | | 794 | | | | 858 | |
#G12113, 5.500%, due 5/1/21 | | | 395 | | | | 431 | |
#G12286, 5.000%, due 7/1/21 | | | 164 | | | | 177 | |
#E02322, 5.500%, due 5/1/22 | | | 44 | | | | 49 | |
#J06484, 5.500%, due 11/1/22 | | | 927 | | | | 1,011 | |
#C00351, 8.000%, due 7/1/24 | | | 145 | | | | 172 | |
#G00363, 8.000%, due 6/1/25 | | | 175 | | | | 208 | |
#C80329, 8.000%, due 8/1/25 | | | 44 | | | | 52 | |
#J13022, 4.000%, due 9/1/25 | | | 2,936 | | | | 3,081 | |
| | | | | | | | | | |
Total FHLMC Mortgage Obligations | | | | | | | | | 19,098 | |
| | | | | | | | | | |
| | | | | | | | | | |
Issuer | | Principal
Amount | | | Value | |
|
U.S. Government and U.S. Government Agency—(contunued) | |
Federal National Mortgage Association (FNMA)—31.4% | | | | | | | | |
#255325, 4.500%, due 7/1/11 | | | | $ | 41 | | | $ | 41 | |
#256224, 5.500%, due 4/1/16 | | | | | 44 | | | | 48 | |
#256559, 5.500%, due 1/1/17 | | | | | 24 | | | | 25 | |
#256606, 5.500%, due 2/1/17 | | | | | 32 | | | | 34 | |
#256646, 5.500%, due 3/1/17 | | | | | 23 | | | | 26 | |
#545898, 5.500%, due 9/1/17 | | | | | 668 | | | | 726 | |
#545899, 5.500%, due 9/1/17 | | | | | 765 | | | | 831 | |
#257067, 5.000%, due 1/1/18 | | | | | 111 | | | | 117 | |
#663692, 5.000%, due 1/1/18 | | | | | 317 | | | | 343 | |
#674713, 5.000%, due 1/1/18 | | | | | 25 | | | | 27 | |
#679305, 5.000%, due 1/1/18 | | | | | 107 | | | | 116 | |
#254591, 5.500%, due 1/1/18 | | | | | 499 | | | | 540 | |
#677680, 4.500%, due 2/1/18 | | | | | 18 | | | | 19 | |
#681310, 4.500%, due 2/1/18 | | | | | 405 | | | | 434 | |
#683100, 5.500%, due 2/1/18 | | | | | 623 | | | | 681 | |
#254684, 5.000%, due 3/1/18 | | | | | 35 | | | | 38 | |
#675717, 5.000%, due 3/1/18 | | | | | 481 | | | | 520 | |
#681361, 5.000%, due 3/1/18 | | | | | 125 | | | | 135 | |
#656564, 5.000%, due 4/1/18 | | | | | 2,288 | | | | 2,473 | |
#696677, 5.000%, due 4/1/18 | | | | | 164 | | | | 178 | |
#702888, 5.000%, due 4/1/18 | | | | | 154 | | | | 167 | |
#929388, 4.500%, due 5/1/18 | | | | | 595 | | | | 634 | |
#254721, 5.000%, due 5/1/18 | | | | | 380 | | | | 410 | |
#702332, 5.000%, due 5/1/18 | | | | | 80 | | | | 87 | |
#704049, 5.500%, due 5/1/18 | | | | | 1,167 | | | | 1,279 | |
#735357, 5.500%, due 5/1/18 | | | | | 1,899 | | | | 2,079 | |
#254785, 4.000%, due 6/1/18 | | | | | 292 | | | | 309 | |
#555622, 4.500%, due 6/1/18 | | | | | 498 | | | | 533 | |
#656573, 5.000%, due 6/1/18 | | | | | 331 | | | | 358 | |
#709848, 5.000%, due 6/1/18 | | | | | 292 | | | | 316 | |
#713380, 4.000%, due 7/1/18 | | | | | 273 | | | | 289 | |
#254802, 4.500%, due 7/1/18 | | | | | 413 | | | | 442 | |
#713807, 4.500%, due 7/1/18 | | | | | 243 | | | | 260 | |
#735003, 5.500%, due 7/1/18 | | | | | 1,781 | | | | 1,949 | |
#254840, 4.000%, due 8/1/18 | | | | | 137 | | | | 145 | |
#711991, 5.000%, due 8/1/18 | | | | | 277 | | | | 299 | |
#254919, 4.000%, due 9/1/18 | | | | | 35 | | | | 37 | |
#740444, 4.500%, due 9/1/18 | | | | | 395 | | | | 422 | |
#734741, 4.000%, due 10/1/18 | | | | | 27 | | | | 29 | |
#743183, 5.000%, due 10/1/18 | | | | | 120 | | | | 130 | |
#255003, 4.000%, due 11/1/18 | | | | | 17 | | | | 18 | |
#747823, 4.000%, due 11/1/18 | | | | | 734 | | | | 777 | |
#749596, 5.000%, due 11/1/18 | | | | | 424 | | | | 458 | |
#745237, 5.000%, due 12/1/18 | | | | | 101 | | | | 109 | |
#725171, 4.000%, due 1/1/19 | | | | | 17 | | | | 18 | |
#255079, 5.000%, due 2/1/19 | | | | | 50 | | | | 54 | |
#766276, 5.000%, due 3/1/19 | | | | | 524 | | | | 566 | |
#MA0045, 4.000%, due 4/1/19 | | | | | 613 | | | | 648 | |
#255233, 4.000%, due 5/1/19 | | | | | 625 | | | | 661 | |
#725445, 4.500%, due 5/1/19 | | | | | 1,123 | | | | 1,202 | |
#785259, 5.000%, due 8/1/19 | | | | | 522 | | | | 565 | |
#725953, 5.000%, due 10/1/19 | | | | | 146 | | | | 159 | |
#745240, 4.500%, due 12/1/19 | | | | | 646 | | | | 691 | |
#735401, 5.500%, due 3/1/20 | | | | | 401 | | | | 436 | |
#735646, 4.500%, due 7/1/20 | | | | | 764 | | | | 817 | |
#745440, 4.500%, due 7/1/20 | | | | | 14 | | | | 14 | |
#825912, 4.000%, due 9/1/20 | | | | | 78 | | | | 82 | |
#MA0517, 4.000%, due 9/1/20 | | | | | 1,278 | | | | 1,352 | |
See accompanying Notes to Financial Statements.
86 Semi-Annual Report | June 30, 2011 |
Low Duration Fund
Portfolio of Investments, June 30, 2011 (all dollar amounts in thousands) (unaudited)
| | | | | | | | | | | | |
Issuer | | NRSRO
Rating | | | Principal
Amount | | | Value | |
|
U.S. Government and U.S. Government Agency—(contunued) | |
Federal National Mortgage Association (FNMA)—(contunued) | | | | | | | | | |
#836016, 4.500%, due 9/1/20 | | | | | | $ | 994 | | | $ | 1,063 | |
#MA0548, 3.500%, due 10/1/20 | | | | | | | 2,311 | | | | 2,407 | |
#879607, 5.500%, due 4/1/21 | | | | | | | 170 | | | | 186 | |
#881284, 4.500%, due 12/1/21 | | | | | | | 1,434 | | | | 1,529 | |
#190988, 9.000%, due 6/1/24 | | | | | | | 227 | | | | 268 | |
#AC9560, 5.000%, due 1/1/25 | | | | | | | 4,815 | | | | 5,217 | |
#AD0855, 4.000%, due 3/1/25 | | | | | | | 196 | | | | 206 | |
#932723, 4.000%, due 4/1/25 | | | | | | | 881 | | | | 925 | |
#935995, 4.000%, due 6/1/25 | | | | | | | 247 | | | | 259 | |
#AD4677, 4.000%, due 6/1/25 | | | | | | | 1,997 | | | | 2,097 | |
#AD8164, 4.000%, due 8/1/25 | | | | | | | 2,157 | | | | 2,265 | |
#AE1176, 4.000%, due 8/1/25 | | | | | | | 1,066 | | | | 1,120 | |
#AH2671, 4.000%, due 1/1/26 | | | | | | | 2,025 | | | | 2,127 | |
| | | | | | | | | | | | |
Total FNMA Mortgage Obligations | | | | | | | | | | | 45,822 | |
| | | | | | | | | | | | |
| | |
Asset-Backed Securities—39.4% | | | | | | | | | |
Volkswagen Auto Lease Trust, 2009-A, Tranche A3, 3.410%, 4/16/12 | | | AAA | | | | 342 | | | | 343 | |
Ford Credit Auto Owner Trust, 2007-B, Tranche A4A, 5.240%, 7/15/12 | | | AAA | | | | 226 | | | | 228 | |
Daimler Chrysler Auto Trust, 2008-B, Tranche A3A, 4.710%, 9/10/12 | | | AAA | | | | 31 | | | | 31 | |
BMW Vehicle Lease Trust, 2010-1, Tranche A2, 0.580%, 9/17/12 | | | Aaa | | | | 428 | | | | 428 | |
BMW Vehicle Owner Trust, 2010-A, Tranche A2, 0.680%, 9/25/12 | | | AAA | | | | 406 | | | | 406 | |
Capital Auto Receivables Asset Trust, 2008-2, Tranche A3B, 1.637%, 10/15/12, VRN | | | AAA | | | | 200 | | | | 200 | |
Ford Credit Auto Owner Trust, 2010-B, Tranche A2, 0.650%, 12/15/12 | | | Aaa | | | | 736 | | | | 736 | |
Chrysler Financial Auto Securitization Trust, 2010-A, Tranche A2, 0.690%, 1/8/13 | | | AAA | | | | 878 | | | | 879 | |
Honda Auto Receivables Owner Trust, 2009-2, Tranche A3, 2.790%, 1/15/13 | | | AAA | | | | 398 | | | | 401 | |
CarMax Auto Owner Trust, 2009-1, Tranche A3, 4.120%, 3/15/13 | | | AAA | | | | 197 | | | | 199 | |
Nissan Auto Lease Trust, 2010-A, Tranche A2, 1.100%, 3/15/13 | | | AAA | | | | 345 | | | | 345 | |
Ford Credit Auto Owner Trust, 2009-A, Tranche A3A, 3.960%, 5/15/13 | | | AAA | | | | 215 | | | | 217 | |
Ford Credit Auto Owner Trust, 2009-A, Tranche A3B, 2.687%, 5/15/13, VRN | | | AAA | | | | 538 | | | | 541 | |
Harley-Davidson Motorcycle Trust, 2007-1, Tranche A4, 5.210%, 6/17/13 | | | AAA | | | | 383 | | | | 387 | |
USAA Auto Owner Trust, 2009-1, Tranche A3, 3.020%, 6/17/13 | | | AAA | | | | 392 | | | | 395 | |
American Express Issuance Trust, 2007-2, Tranche A, 0.437%, 7/15/13, VRN | | | AAA | | | | 373 | | | | 373 | |
Ally Auto Receivables Trust, 2010-3, Tranche A2, 0.287%, 8/15/13, VRN | | | AAA | | | | 726 | | | | 726 | |
| | | | | | | | | | | | |
Issuer | | NRSRO
Rating | | | Principal
Amount | | | Value | |
| | |
Asset-Backed Securities—(contunued) | | | | | | | | | |
BMW Vehicle Lease Trust, 2009-1, Tranche A4, 3.660%, 8/15/13 | | | AAA | | | $ | 500 | | | $ | 502 | |
Ford Credit Auto Owner Trust, 2009-B, Tranche A3, 2.790%, 8/15/13 | | | AAA | | | | 308 | | | | 311 | |
Ford Credit Auto Owner Trust, 2009-D, Tranche A3, 2.170%, 10/15/13 | | | AAA | | | | 791 | | | | 798 | |
John Deere Owner Trust, 2009-A, Tranche A3, 2.590%, 10/15/13 | | | AAA | | | | 712 | | | | 716 | |
John Deere Owner Trust, 2009-B, Tranche A3, 1.570%, 10/15/13 | | | AAA | | | | 540 | | | | 542 | |
Avis Budget Rental Car Funding AESOP LLC—144A, 2009-1A, Tranche A, 9.310%, 10/20/13 | | | Aa1 | | | | 2,000 | | | | 2,166 | |
Harley-Davidson Motorcycle Trust, 2009-1, Tranche A3, 3.190%, 11/15/13 | | | AAA | | | | 1,272 | | | | 1,282 | |
CNH Equipment Trust, 2009-C, Tranche A3, 1.850%, 12/16/13 | | | AAA | | | | 222 | | | | 222 | |
Volkswagen Auto Loan Enhanced Trust, 2010-1, Tranche A3, 1.310%, 1/20/14 | | | AAA | | | | 864 | | | | 868 | |
USAA Auto Owner Trust, 2008-3, Tranche A4, 4.710%, 2/18/14 | | | AAA | | | | 45 | | | | 45 | |
Harley-Davidson Motorcycle Trust, 2009-2, Tranche A3, 2.620%, 3/15/14 | | | AAA | | | | 496 | | | | 500 | |
Citibank Credit Card Issuance Trust, 2009-A1, Tranche A1, 1.937%, 3/17/14, VRN | | | AAA | | | | 200 | | | | 202 | |
Volkswagen Auto Lease Trust, 2009-A, Tranche A4, 4.590%, 3/17/14 | | | AAA | | | | 2,000 | | | | 2,013 | |
Hertz Vehicle Financing LLC—144A, 2009-2A, Tranche A1, 4.260%, 3/25/14 | | | Aaa | | | | 1,765 | | | | 1,844 | |
BMW Vehicle Owner Trust, 2010-A, Tranche A3, 1.390%, 4/25/14 | | | AAA | | | | 300 | | | | 302 | |
Citibank Credit Card Issuance Trust, 2009-A2, Tranche A2, 1.737%, 5/15/14, VRN | | | AAA | | | | 500 | | | | 506 | |
Ford Credit Auto Owner Trust, 2010-A, Tranche A3, 1.320%, 6/15/14 | | | AAA | | | | 500 | | | | 503 | |
Chase Issuance Trust, 2007-A9, Tranche A, 3.151%, 6/16/14, VRN | | | AAA | | | | 2,000 | | | | 1,999 | |
Nissan Auto Receivables Owner Trust, 2008-A, Tranche A4, 4.280%, 6/16/14 | | | AAA | | | | 71 | | | | 72 | |
Capital Auto Receivables Asset Trust, 2008-1, Tranche A4B, 1.537%, 7/15/14, VRN | | | AAA | | | | 605 | | | | 608 | |
CNH Equipment Trust, 2010-A, Tranche A3, 1.540%, 7/15/14 | | | AAA | | | | 837 | | | | 841 | |
Nissan Auto Receivables Owner Trust, 2010-A, Tranche A3, 0.870%, 7/15/14 | | | Aaa | | | | 500 | | | | 500 | |
Daimler Chrysler Auto Trust, 2008-A, Tranche A4, 4.480%, 8/8/14 | | | AAA | | | | 1,495 | | | | 1,513 | |
American Express Credit Account Master Trust, 2009-1, Tranche A, 1.537%, 12/15/14, VRN | | | AAA | | | | 450 | | | | 455 | |
See accompanying Notes to Financial Statements.
June 30, 2011 | William Blair Funds 87 |
Low Duration Fund
Portfolio of Investments, June 30, 2011 (all dollar amounts in thousands) (unaudited)
| | | | | | | | | | | | |
Issuer | | NRSRO
Rating | | | Principal
Amount | | | Value | |
| | |
Asset-Backed Securities—(contunued) | | | | | | | | | |
Nissan Master Owner Trust Receivables—144A, 2010-AA, Tranche A, 1.337%, 1/15/15, VRN | | | AAA | | | $ | 2,000 | | | $ | 2,022 | |
Capital One Multi-Asset Execution Trust, 2007-A4, Tranche A4, 0.217%, 3/16/15, VRN | | | AAA | | | | 1,778 | | | | 1,776 | |
CNH Equipment Trust, 2010-C, Tranche A3, 1.170%, 5/15/15 | | | AAA | | | | 500 | | | | 502 | |
Discover Card Master Trust, 2007-A2, Tranche A2, 0.587%, 6/15/15, VRN | | | AAA | | | | 192 | | | | 193 | |
MBNA Credit Card Master Note Trust, 2006-A2, Tranche A2, 0.247%, 6/15/15, VRN | | | AAA | | | | 200 | | | | 200 | |
Discover Card Master Trust I, 2005-4, Tranche A2, 0.277%, 6/16/15, VRN | | | AAA | | | | 77 | | | | 77 | |
FPL Recovery Funding LLC, 2007-A, Tranche A2, 5.044%, 8/1/15 | | | AAA | | | | 852 | | | | 893 | |
Chase Issuance Trust, 2008-A10, Tranche A10, 0.937%, 8/17/15, VRN | | | AAA | | | | 2,000 | | | | 2,026 | |
Bank of America Credit Card Trust, 2010-A1, Tranche A1, 0.487%, 9/15/15, VRN | | | AAA | | | | 2,000 | | | | 2,005 | |
Discover Card Master Trust, 2010-A1, Tranche A1, 0.837%, 9/15/15, VRN | | | Aaa | | | | 347 | | | | 350 | |
Ford Credit Floorplan Master Owner Trust, 2010-A5, Tranche A2, 0.887%, 9/15/15, VRN | | | AAA | | | | 1,800 | | | | 1,806 | |
USAA Auto Owner Trust, 2010-1, Tranche A4, 2.140%, 9/15/15 | | | AAA | | | | 685 | | | | 700 | |
American Express Credit Account Master Trust, 2010-1, Tranche A, 0.437%, 11/16/15, VRN | | | AAA | | | | 500 | | | | 501 | |
Ford Credit Floorplan Master Owner Trust, 2011-1, Tranche A2, 0.787%, 2/15/16, VRN | | | AAA | | | | 1,000 | | | | 996 | |
Chase Issuance Trust, 2008-A3, Tranche A, 1.287%, 3/15/16, VRN | | | AAA | | | | 2,000 | | | | 2,051 | |
Hertz Vehicle Financing LLC—144A, 2009-2A, Tranche A2, 5.290%, 3/25/16 | | | Aaa | | | | 2,250 | | | | 2,467 | |
Ally Master Owner Trust, 2011-3, Tranche A1, 0.817%, 5/15/16, VRN | | | Aaa | | | | 1,100 | | | | 1,100 | |
CNH Equipment Trust, 2010-C, Tranche A4, 1.750%, 5/16/16 | | | AAA | | | | 60 | | | | 60 | |
Avis Budget Rental Car Funding AESOP LLC—144A, 2010-3A, Tranche A, 4.640%, 5/20/16 | | | Aaa | | | | 1,400 | | | | 1,506 | |
Centre Point Funding LLC—144A, 2010-1A, Tranche 1, 5.430%, 7/20/16 | | | A2 | | | | 1,721 | | | | 1,828 | |
Discover Card Master Trust, 2011-A1, Tranche A1, 0.537%, 8/15/16, VRN | | | Aaa | | | | 1,400 | | | | 1,405 | |
Enterprise Fleet Financing LLC—144A, 2011-2, Tranche A2, 1.430%, 10/20/16 | | | AAA | | | | 2,000 | | | | 2,000 | |
GE Capital Credit Card Master Note Trust, 2011-1, Tranche A, 0.737%, 1/15/17, VRN | | | Aaa | | | | 500 | | | | 503 | |
Discover Card Master Trust, 2010-A2, Tranche A2, 0.767%, 3/15/18, VRN | | | AAA | | | | 350 | | | | 353 | |
| | | | | | | | | | | | |
Issuer | | NRSRO
Rating | | | Principal
Amount | | | Value | |
| | |
Asset-Backed Securities—(contunued) | | | | | | | | | |
Citibank Omni Master Trust—144A, 2009-A14A, Tranche A14, 2.937%, 8/15/18, VRN | | | Aaa | | | $ | 2,000 | | | $ | 2,103 | |
Capital One Multi-Asset Execution Trust, 2007-A2, Tranche A2, 0.267%, 12/16/19, VRN | | | AAA | | | | 215 | | | | 212 | |
MBNA Credit Card Master Note Trust, 2004-A3, Tranche A3, 0.447%, 8/16/21, VRN | | | AAA | | | | 300 | | | | 298 | |
Sierra Receivables Funding Co. LLC—144A, 2011-1A, Tranche A, 3.350%, 4/20/26 | | | A | | | | 1,498 | | | | 1,502 | |
| | | | | | | | | | | | |
Total Asset-Backed Securities | | | | | | | | | | | 57,580 | |
| | | | | | | | | | | | |
|
Corporate Obligations—12.9% | |
American Express Bank FSB, 0.316%, due 5/29/12, VRN | | | A+ | | | | 500 | | | | 499 | |
General Electric Capital Corporation, 3.500%, due 8/13/12 | | | AA+ | | | | 1,000 | | | | 1,030 | |
Bank of America Corporation, 5.375%, due 9/11/12 | | | A+ | | | | 1,000 | | | | 1,048 | |
ConocoPhillips, 4.750%, due 10/15/12 | | | A1 | | | | 1,000 | | | | 1,052 | |
Citigroup, Inc., 5.300%, due 10/17/12 | | | A+ | | | | 1,000 | | | | 1,050 | |
Wells Fargo & Co., 5.250%, due 10/23/12 | | | AA- | | | | 1,000 | | | | 1,055 | |
The Procter & Gamble Co., 0.301%, due 11/14/12, VRN | | | AA- | | | | 700 | | | | 701 | |
The Walt Disney Co., 4.700%, due 12/1/12 | | | A | | | | 1,000 | | | | 1,056 | |
Hewlett-Packard Co., 4.500%, due 3/1/13 | | | A+ | | | | 1,000 | | | | 1,059 | |
General Electric Capital Corporation, 0.418%, due 5/8/13, VRN | | | AA+ | | | | 1,000 | | | | 996 | |
American Express Co., 4.875%, due 7/15/13 | | | A+ | | | | 1,000 | | | | 1,063 | |
Barclays Bank plc, 1.323%, due 1/13/14, VRN | | | AA- | | | | 500 | | | | 502 | |
JPMorgan Chase & Co., 1.074%, due 1/24/14, VRN | | | Aa3 | | | | 1,000 | | | | 1,003 | |
Morgan Stanley, 1.874%, due 1/24/14, VRN | | | A | | | | 1,000 | | | | 1,007 | |
Bank of America Corporation, 1.693%, due 1/30/14, VRN | | | A+ | | | | 1,000 | | | | 1,002 | |
MetLife, Inc., 2.375%, due 2/6/14 | | | A- | | | | 1,000 | | | | 1,019 | |
The Boeing Co., 5.000%, due 3/15/14 | | | A | | | | 375 | | | | 412 | |
Shell International Finance BV, 4.000%, due 3/21/14 | | | Aa1 | | | | 1,142 | | | | 1,229 | |
Citigroup, Inc., 1.176%, due 4/1/14, VRN | | | A | | | | 1,000 | | | | 986 | |
Morgan Stanley, 6.000%, due 5/13/14 | | | A | | | | 1,000 | | | | 1,089 | |
| | | | | | | | | | | | |
Total Corporate Obligations | | | | | | | | | | | 18,858 | |
| | | | | | | | | | | | |
Total Long-Term Investments—99.5%
(cost $144,761) | | | | 145,344 | |
| | | | | | | | | | | | |
See accompanying Notes to Financial Statements.
88 Semi-Annual Report | June 30, 2011 |
Low Duration Fund
Portfolio of Investments, June 30, 2011 (all dollar amounts in thousands) (unaudited)
| | | | | | | | | | | | |
Issuer | | NRSRO
Rating | | | Principal
Amount | | | Value | |
| | | |
Repurchase Agreement | | | | | | | | | | | | |
State Street Bank and Trust Company, 0.010% dated 6/30/11, due 7/1/11, repurchase price $3,243, collateralized by U.S. Treasury Bill, 0.020%, due 8/11/11 | | | AAA | | | $ | 3,243 | | | $ | 3,243 | |
| | | | | | | | | | | | |
Total Repurchase Agreement—2.2%
(cost $3,243) | | | | 3,243 | |
| | | | | | | | | | | | |
Total Investments—101.7%
(cost $148,004) | | | | 148,587 | |
Liabilities, plus cash and other assets—(1.7)% | | | | (2,552 | ) |
| | | | | | | | | | | | |
Net assets—100.0% | | | $ | 146,035 | |
| | | | | | | | | | | | |
NRSRO = Nationally Recognized Statistical Rating Organization—The credit quality ratings of the securities in the Fund reflect the highest category rating by either Fitch Ratings, Moody’s Investors Service Inc., or Standard & Poor’s, a division of the McGraw-Hill Companies, Inc.
The obligations of certain U. S. Government-sponsored securities are neither issued nor guaranteed by the U. S. Treasury.
VRN = Variable Rate Note
See accompanying Notes to Financial Statements.
June 30, 2011 | William Blair Funds 89 |
Christopher T. Vincent

Kathleen M. Lynch
READY RESERVES FUND
AN OVERVIEW FROM THE PORTFOLIO MANAGERS
The return for the six months ended June 30, 2011, of the Fund’s Class N Shares was 0.00%, versus the 0.01% return of the Fund’s benchmark, the AAA-Rated Money Market Funds Average. Total assets were $1.26 billion, compared to $1.21 billion at December 31, 2010 and $1.27 billion at June 30, 2010.
The minutes from the June 22, 2011 meeting of the Federal Open Market Committee (FOMC)—which is comprised of members of the Federal Reserve’s board of governors and selected presidents of the regional Federal Reserve banks—indicated that the majority of the committee members believe that the recent spike in food and energy prices has been a temporary aberration.
The FOMC said that it believed the recent rise in inflation would “prove transitory” and that over the medium term inflation would “be subdued as long as commodity prices did not continue to rise rapidly and longer-term inflation expectations remained stable.” Furthermore, the Fed said that it expects inflation to “subside to levels at or below those consistent with the Committee’s dual mandate.”
Federal Reserve policy makers disagreed on whether additional monetary stimulus would be required, even if the outlook for economic growth remained weak, minutes of their meeting showed.
“A few members noted that, depending on how economic conditions evolve, the committee might have to consider providing additional monetary stimulus, especially if economic growth remained too slow to meaningfully reduce the unemployment rate in the medium run,” the FOMC said.
“On the other hand, a few members viewed the increase in inflation risks as suggesting that economic conditions might well evolve in a way that would warrant the committee taking steps to begin removing policy accommodation sooner than currently anticipated.”
Some Fed watchers maintain that a divided FOMC means officials are likely to prolong their low interest-rate policy.
We believe that until fundamentals in the economy show significant signs of improvement—including gains in employment and strength in the housing market—and until inflation picks up, the Fed will leave its Federal Funds target rate at the current level, which may remain the case through the balance of 2011 and into next year.
We continue to favor overnight repurchase agreements, in an effort to maintain a high degree of overnight liquidity.
The Fund also continues to maintain a relatively short Average Maturity. On June 30, 2011, the Fund’s Average Maturity was approximately 33 days, compared to 40 days on December 31, 2010, and 38 days on June 30, 2010.
90 Semi-Annual Report | June 30, 2011 |
Ready Reserves Fund
Performance Highlights (unaudited)
The Fund’s 7 day yield on June 30, 2011 was 0.01%.
Average Annual Total Returns—Class N Shares period ended June 30, 2011.
| | | | | | | | | | | | | | | | | | | | |
| | | Year
To Date | | | 1
Year | | | 3
Year | | | 5
Year | | | 10
Year | |
Ready Reserves Fund Class N | | | 0.00 | % | | | 0.01 | % | | | 0.31 | % | | | 1.87 | % | | | 1.81 | % |
AAA Ready Money Market Funds | | | 0.01 | % | | | 0.02 | % | | | 0.36 | % | | | 1.86 | % | | | 1.76 | % |
Performance cited represents past performance. Past performance does not guarantee future results and current performance may be lower or higher than the data quoted. For the most current month-end performance information, please call 1-800-742-7272, or visit our Web site at www.williamblairfunds.com. Class N Shares are available to the general public without a sales load. Total return includes reinvestment of income. Yields fluctuate and are not guaranteed. An investment in the Fund is neither insured nor guaranteed by the Federal Deposit Insurance Corp. (FDIC) or any government agency. Although the Fund seeks to preserve the value of your investment at $1.00 per share, it is possible to lose money by investing in the Fund.
The AAA Rated Money Market Funds Average represents the average annual composite performance of all AAA rated First Tier Retail Money Market Funds listed by iMoneyNet data.
This report identifies the Fund’s investments on June 30, 2011. These holdings are subject to change. Not all fixed-income securities in the Fund performed the same, nor is there any guarantee that these fixed-income securities will perform as well in the future. Market forecasts provided in this report may not necessarily come to pass.
Sector Diversification (unaudited)
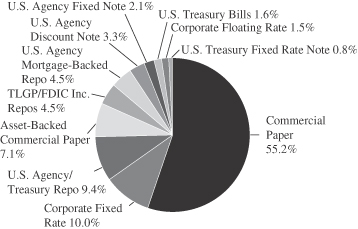
The sector diversification shown is based on the total Investments.
June 30, 2011 | William Blair Funds 91 |
Ready Reserves Fund
Portfolio of Investments, June 30, 2011 (all dollar amounts in thousands) (unaudited)
| | | | | | | | |
Issuer | | Principal
Amount | | | Amortized
Cost | |
|
U.S. Government and U.S. Government Agency—7.8% | |
Federal Home Loan Mortgage Corp. (FHLMC)—2.6% | |
Federal Home Loan Mortgage Corporation,
0.070%-5.500%, 7/25/11-12/15/11 | | $ | 32,397 | | | $ | 32,532 | |
| | | | | | | | |
Total Federal Home Loan
Mortgage Corp. (FHLMC) | | | | | | | 32,532 | |
| | | | | | | | |
Federal National Mortgage Association (FNMA)—2.8% | |
Federal National Mortgage Association,
0.065%-2.000%, 7/7/11-1/9/12 | | | 35,000 | | | | 35,057 | |
| | | | | | | | |
Total Federal National Mortgage Association (FNMA) | | | | | | | 35,057 | |
| | | | | | | | |
U.S. Treasury—2.4% | |
U.S. Treasury Bills,
0.080%-0.090%, 7/28/11-8/11/11 | | | 20,000 | | | | 19,999 | |
U.S. Treasury Note, 1.000%, 8/31/11 | | | 10,000 | | | | 10,014 | |
| | | | | | | | |
Total U.S. Treasury | | | | | | | 30,013 | |
| | | | | | | | |
Corporate Notes—11.4% | |
Brown-Forman Corporation,
5.200%, 4/1/12 | | | 1,100 | | | | 1,139 | |
Caterpillar Financial Services Corporation,
5.125%-5.750%, 10/12/11-2/15/12 | | | 8,815 | | | | 8,951 | |
Citibank NA,
1.375%-1.500%, 7/12/11-8/10/11 | | | 10,060 | | | | 10,068 | |
Eli Lilly & Co., 3.550%, 3/6/12 | | | 10,000 | | | | 10,209 | |
General Electric Capital Corporation,
5.000%-5.875%, 11/15/11-4/10/12 | | | 20,500 | | | | 21,035 | |
Hewlett-Packard Co., 4.250%, 2/24/12 | | | 7,000 | | | | 7,176 | |
International Business Machines Corporation,
0.277%-0.853%, 7/28/11-6/15/12, VRN | | | 18,575 | | | | 18,584 | |
John Deere Capital Corporation,
5.400%-5.650%, 7/25/11-10/17/11 | | | 1,250 | | | | 1,261 | |
Kimberly-Clark Corporation,
5.625%, 2/15/12 | | | 500 | | | | 516 | |
Pfizer, Inc., 4.450%, 3/15/12 | | | 6,912 | | | | 7,108 | |
Praxair, Inc., 6.375%, 4/1/12 | | | 3,731 | | | | 3,897 | |
Procter & Gamble International Funding,
1.350%, 8/26/11 | | | 15,489 | | | | 15,512 | |
Shell International Finance BV,
1.300%, 9/22/11 | | | 10,000 | | | | 10,022 | |
U.S. Bank NA, 6.375%, 8/1/11 | | | 12,045 | | | | 12,105 | |
Wells Fargo & Co., 5.300%, 8/26/11 | | | 15,000 | | | | 15,112 | |
| | | | | | | | |
Total Corporate Notes | | | | | | | 142,695 | |
| | | | | | | | |
Foreign Government Notes—0.6% | |
Canadian Wheat Board, 0.040%, 7/11/11 | | | 7,000 | | | | 7,000 | |
| | | | | | | | |
Total Foreign Government Notes | | | | | | | 7,000 | |
| | | | | | | | |
Commercial Paper—54.9% | |
Abbott Laboratories,
0.070%-0.150%, 7/11/11-8/30/11 | | | 38,450 | | | | 38,448 | |
Caterpillar Financial Services Corporation,
0.060%-0.110%, 7/1/11-8/9/11 | | | 34,000 | | | | 33,999 | |
Chevron Funding Corporation,
0.020%-0.060%, 7/5/11-7/7/11 | | | 31,000 | | | | 31,000 | |
Coca-Cola Co.,
0.090%-0.220%, 7/22/11-12/5/11 | | | 40,500 | | | | 40,487 | |
Colgate-Palmolive Co., 0.060%, 7/28/11 | | | 8,000 | | | | 8,000 | |
| | | | | | | | |
Issuer | | Principal
Amount | | | Amortized
Cost | |
|
U.S. Government and U.S. Government Agency—(continued) | |
Commercial Paper—(continued) | |
ConocoPhillips Qatar Funding, Ltd.,
0.100%-0.140%, 7/6/11-8/8/11 | | $ | 44,450 | | | $ | 44,447 | |
Deere & Co., 0.110%, 7/8/11 | | | 5,850 | | | | 5,850 | |
General Electric Capital Corporation,
0.090%-0.120%, 7/1/11-8/11/11 | | | 24,000 | | | | 23,998 | |
Hewlett-Packard Co.,
0.080%-0.090%, 7/12/11-7/18/11 | | | 35,000 | | | | 35,000 | |
IBM Corporation,
0.060%, 7/12/11-7/20/11 | | | 26,000 | | | | 26,000 | |
Illinois Tool Works, Inc.,
0.080%-0.100%, 7/5/11-8/3/11 | | | 37,200 | | | | 37,198 | |
John Deere Credit, Inc.,
0.050%-0.110%, 7/1/11-8/5/11 | | | 36,336 | | | | 36,336 | |
Kimberly-Clark Corporation,
0.070%, 7/11/11-7/15/11 | | | 17,000 | | | | 17,000 | |
Merck & Co.,
0.080%-0.110%, 8/1/11-8/29/11 | | | 26,805 | | | | 26,801 | |
Nestle Capital Corporation,
0.050%-0.190%, 7/13/11-9/26/11 | | | 30,000 | | | | 29,994 | |
PACCAR Financial Corporation,
0.100%-0.130%, 7/5/11-7/28/11 | | | 40,000 | | | | 39,999 | |
Pfizer, Inc., 0.060%, 7/6/11-7/12/11 | | | 29,000 | | | | 29,000 | |
Private Export Funding,
0.070%-0.200%, 7/11/11-12/1/11 | | | 44,000 | | | | 43,993 | |
Procter & Gamble Co. (The),
0.070%-0.080%, 7/5/11-7/15/11 | | | 28,000 | | | | 28,000 | |
Roche Holding, Inc.,
0.080%-0.100%, 7/21/11-8/3/11 | | | 42,000 | | | | 41,996 | |
Shell International Finance BV,
0.080%-0.260%, 7/11/11-7/14/11 | | | 9,600 | | | | 9,599 | |
United Parcel Service, Inc.,
0.010%-0.020%, 7/1/11-7/6/11 | | | 13,500 | | | | 13,500 | |
United Technologies Corporation,
0.030%-0.090%, 7/1/11-7/21/11 | | | 26,000 | | | | 26,000 | |
Wal-Mart Stores, Inc.,
0.060%-0.080%, 7/1/11-7/26/11 | | | 24,000 | | | | 24,000 | |
| | | | | | | | |
Total Commercial Paper | | | | | | | 690,645 | |
| | | | | | | | |
Asset-Backed Commercial Paper—7.1% | |
Chariot Funding L.L.C.,
0.130%, 7/8/11-7/18/11 | | | 46,000 | | | | 45,999 | |
Govco L.L.C,
0.120%-0.133%, 7/8/11-7/29/11 | | | 44,000 | | | | 43,997 | |
| | | | | | | | |
Total Asset-Backed Commercial Paper | | | | | | | 89,996 | |
| | | | | | | | |
Repurchase Agreements—18.5% | |
Bank of America, 0.040% dated 6/30/11,
due 7/1/11, repurchase price $57,000, collateralized by U.S. Government
Agency securities, 0.470%-1.125%,
due 11/30/11-9/17/13 | | | 57,000 | | | | 57,000 | |
Barclays Capital, 0.040% dated 6/30/11,
due 7/1/11, repurchase price $57,000, collateralized by FDIC guaranteed security, 1.875%, due 10/22/12 | | | 57,000 | | | | 57,000 | |
Fixed Income Clearing Corporation,
0.010% dated 6/30/11, due 7/1/11, repurchase price $62,209, collateralized
by FNMA, 3.420%, due 11/24/20 | | | 62,209 | | | | 62,209 | |
See accompanying Notes to Financial Statements.
92 Semi-Annual Report | June 30, 2011 |
Ready Reserves Fund
Portfolio of Investments, June 30, 2011 (all dollar amounts in thousands) (unaudited)
| | | | | | | | |
Issuer | | Principal
Amount | | | Amortized
Cost | |
Repurchase Agreements—(continued) | |
Goldman Sachs, 0.060% dated 6/30/11,
due 7/7/11, repurchase price $57,000, collateralized by GNMA, 3.500%-6.000%, due 10/15/33-2/15/41 | | $ | 57,000 | | | $ | 57,000 | |
| | | | | | | | |
Total Repurchase Agreements | | | | | | | 233,209 | |
| | | | | | | | |
Total Investments—100.3%
(cost $1,261,147) | | | | 1,261,147 | |
Liabilities, plus cash and other assets—(0.3)% | | | | (3,329 | ) |
| | | | | | | | |
Net assets—100.0% | | | $ | 1,257,818 | |
| | | | | | | | |
Portfolio Weighted Average Maturity | | | | | | | 33 Days | |
VRN = Variable Rate Note
See accompanying Notes to Financial Statements.
June 30, 2011 | William Blair Funds 93 |
Statements of Assets and Liabilities
June 30, 2011 (dollar amounts in thousands) (unaudited)
| | | | | | | | | | | | | | | | |
| | | Growth
Fund | | | Large Cap
Growth
Fund | | | Small Cap
Growth
Fund | | | Mid Cap
Growth
Fund | |
Assets | | | | | | | | | | | | | | | | |
Investments in securities, at cost | | $ | 525,163 | | | $ | 22,195 | | | $ | 580,764 | | | $ | 114,601 | |
Investments in affiliated companies, at cost | | | — | | | | — | | | | 61,946 | | | | — | |
| | | | | | | | | | | | | | | | |
| | | | |
Investments in securities, at value | | $ | 633,145 | | | $ | 28,291 | | | $ | 684,657 | | | $ | 143,734 | |
Investments in affiliated companies, at value | | | — | | | | — | | | | 77,398 | | | | — | |
Receivable for securities sold | | | 2,183 | | | | — | | | | 4,957 | | | | 108 | |
Receivable for fund shares sold | | | 281 | | | | 20 | | | | 1,062 | | | | 354 | |
Receivable from Advisor | | | — | | | | 8 | | | | 105 | | | | 3 | |
Dividend and interest receivable | | | 331 | | | | 27 | | | | 40 | | | | 31 | |
| | | | | | | | | | | | | | | | |
Total assets | | | 635,940 | | | | 28,346 | | | | 768,219 | | | | 144,230 | |
Liabilities | | | | | | | | | | | | | | | | |
Payable for investment securities purchased | | | — | | | | 141 | | | | 1,536 | | | | — | |
Payable for fund shares redeemed | | | 648 | | | | 35 | | | | 2,094 | | | | 62 | |
Investment advisory fee payable | | | 378 | | | | 18 | | | | 668 | | | | 106 | |
Distribution fee payable | | | 46 | | | | 1 | | | | 64 | | | | 3 | |
Other accrued expenses | | | 87 | | | | 18 | | | | 380 | | | | 25 | |
| | | | | | | | | | | | | | | | |
Total liabilities | | | 1,159 | | | | 213 | | | | 4,742 | | | | 196 | |
| | | | | | | | | | | | | | | | |
Net Assets | | $ | 634,781 | | | $ | 28,133 | | | $ | 763,477 | | | $ | 144,034 | |
| | | | | | | | | | | | | | | | |
Capital | | | | | | | | | | | | | | | | |
Composition of Net Assets | | | | | | | | | | | | | | | | |
Par value of shares of beneficial interest | | $ | 52 | | | $ | 4 | | | $ | 32 | | | $ | 10 | |
Capital paid in excess of par value | | | 506,813 | | | | 25,798 | | | | 717,482 | | | | 110,786 | |
Accumulated net investment income (loss) | | | 568 | | | | 22 | | | | (4,602 | ) | | | (187 | ) |
Accumulated net realized gain (loss) | | | 19,366 | | | | (3,787 | ) | | | (68,780 | ) | | | 4,292 | |
Net unrealized appreciation (depreciation) of investments and foreign currencies | | | 107,982 | | | | 6,096 | | | | 119,345 | | | | 29,133 | |
| | | | | | | | | | | | | | | | |
Net Assets | | $ | 634,781 | | | $ | 28,133 | | | $ | 763,477 | | | $ | 144,034 | |
| | | | | | | | | | | | | | | | |
| | | | |
Class N Shares | | | | | | | | | | | | | | | | |
Net Assets | | $ | 227,488 | | | $ | 3,511 | | | $ | 320,578 | | | $ | 16,125 | |
Shares Outstanding | | | 19,080,764 | | | | 474,354 | | | | 13,619,458 | | | | 1,152,114 | |
Net Asset Value Per Share | | $ | 11.92 | | | $ | 7.40 | | | $ | 23.54 | | | $ | 14.00 | |
Class I Shares | | | | | | | | | | | | | | | | |
Net Assets | | $ | 407,293 | | | $ | 24,622 | | | $ | 442,899 | | | $ | 127,909 | |
Shares Outstanding | | | 32,842,571 | | | | 3,249,767 | | | | 18,138,543 | | | | 8,998,183 | |
Net Asset Value Per Share | | $ | 12.40 | | | $ | 7.58 | | | $ | 24.42 | | | $ | 14.21 | |
See accompanying Notes to Financial Statements.
94 Semi-Annual Report | June 30, 2011 |
Statements of Operations
for the Period Ended June 30, 2011 (all amounts in thousands) (unaudited)
| | | | | | | | | | | | | | | | |
| | | Growth
Fund | | | Large Cap
Growth
Fund | | | Small Cap
Growth
Fund | | | Mid Cap
Growth
Fund | |
Investment income | | | | | | | | | | | | | | | | |
Dividends | | $ | 3,177 | | | $ | 181 | | | $ | 975 | | | $ | 471 | |
Less foreign tax withheld | | | (4 | ) | | | (2 | ) | | | (36 | ) | | | — | |
Interest | | | 3 | | | | — | | | | 5 | | | | 1 | |
| | | | | | | | | | | | | | | | |
Total income | | | 3,176 | | | | 179 | | | | 944 | | | | 472 | |
Expenses | | | | | | | | | | | | | | | | |
Investment advisory fees | | | 2,295 | | | | 124 | | | | 4,506 | | | | 554 | |
Distribution fees | | | 276 | | | | 8 | | | | 440 | | | | 18 | |
Custodian fees | | | 12 | | | | 17 | | | | 17 | | | | 19 | |
Transfer agent fees | | | 67 | | | | 5 | | | | 46 | | | | 7 | |
Sub-transfer agent fees | | | | | | | | | | | | | | | | |
Class N | | | 140 | | | | 4 | | | | 279 | | | | 8 | |
Class I | | | 68 | | | | 1 | | | | 336 | | | | 26 | |
Professional fees | | | 18 | | | | 14 | | | | 24 | | | | 14 | |
Registration fees | | | 18 | | | | 16 | | | | 39 | | | | 23 | |
Shareholder reporting fees | | | 22 | | | | 1 | | | | 122 | | | | 6 | |
Trustee fees | | | 9 | | | | 1 | | | | 16 | | | | 2 | |
Other expenses | | | 12 | | | | 3 | | | | 19 | | | | 3 | |
| | | | | | | | | | | | | | | | |
Total expenses before waiver | | | 2,937 | | | | 194 | | | | 5,844 | | | | 680 | |
Expenses waived by the Advisor | | | — | | | | (37 | ) | | | (298 | ) | | | (21 | ) |
| | | | | | | | | | | | | | | | |
Net expenses | | | 2,937 | | | | 157 | | | | 5,546 | | | | 659 | |
| | | | | | | | | | | | | | | | |
Net investment income (loss) | | | 239 | | | | 22 | | | | (4,602 | ) | | | (187 | ) |
Realized and unrealized gain (loss) | | | | | | | | | | | | | | | | |
Net realized gain (loss) on transactions from investments | | | 27,871 | | | | 3,054 | | | | 27,659 | | | | 7,281 | |
| | | | | | | | | | | | | | | | |
Change in net unrealized appreciation (depreciation) of investments | | | 6,467 | | | | (1,831 | ) | | | (12,408 | ) | | | 5,967 | |
| | | | | | | | | | | | | | | | |
Net increase (decrease) in net assets resulting from operations | | $ | 34,577 | | | $ | 1,245 | | | $ | 10,649 | | | $ | 13,061 | |
| | | | | | | | | | | | | | | | |
See accompanying Notes to Financial Statements.
June 30, 2011 | William Blair Funds 95 |
Statements of Changes in Net Assets
for the Period Ended June 30, 2011 (unaudited) and the Year Ended December 31, 2010 (all amounts in thousands)
| | | | | | | | | | | | | | | | | | | | | | | | | | | | | | | | |
| | | Growth
Fund | | | Large Cap
Growth
Fund | | | Small Cap
Growth
Fund | | | Mid Cap
Growth
Fund | |
| | | 2011 | | | 2010 | | | 2011 | | | 2010 | | | 2011 | | | 2010 | | | 2011 | | | 2010 | |
Operations | | | | | | | | | | | | | | | | | | | | | | | | | | | | | | | | |
Net investment income (loss) | | $ | 239 | | | $ | 329 | | | $ | 22 | | | $ | 32 | | | $ | (4,602 | ) | | $ | (7,283 | ) | | $ | (187 | ) | | $ | (147 | ) |
Net realized gain (loss) on
investments | | | 27,871 | | | | 29,431 | | | | 3,054 | | | | 1,167 | | | | 27,659 | | | | 98,419 | | | | 7,281 | | | | 9,349 | |
Change in net unrealized appreciation (depreciation) on investments | | | 6,467 | | | | 35,328 | | | | (1,831 | ) | | | 3,134 | | | | (12,408 | ) | | | 32,801 | | | | 5,967 | | | | 10,074 | |
| | | | | | | | | | | | | | | | | | | | | | | | | | | | | | | | |
Net increase (decrease) in net assets resulting from operations | | | 34,577 | | | | 65,088 | | | | 1,245 | | | | 4,333 | | | | 10,649 | | | | 123,937 | | | | 13,061 | | | | 19,276 | |
Distributions to shareholders from | | | | | | | | | | | | | | | | | | | | | | | | | |
Net investment income | | | — | | | | (13 | ) | | | — | | | | (33 | ) | | | — | | | | — | | | | — | | | | — | |
Net realized gain | | | — | | | | — | | | | — | | | | — | | | | — | | | | — | | | | — | | | | — | |
| | | | | | | | | | | | | | | | | | | | | | | | | | | | | | | | |
| | | — | | | | (13 | ) | | | — | | | | (33 | ) | | | — | | | | — | | | | — | | | | — | |
Capital stock transactions | | | | | | | | | | | | | | | | | | | | | | | | | | | | | | | | |
Net proceeds from sale of shares | | | 88,482 | | | | 176,362 | | | | 2,322 | | | | 3,077 | | | | 55,731 | | | | 364,595 | | | | 40,841 | | | | 24,389 | |
Shares issued in reinvestment of income dividends and capital gain distributions | | | — | | | | 11 | | | | — | | | | 29 | | | | — | | | | — | | | | — | | | | — | |
Less cost of shares redeemed | | | (63,891 | ) | | | (85,355 | ) | | | (7,469 | ) | | | (5,682 | ) | | | (194,492 | ) | | | (359,741 | ) | | | (11,116 | ) | | | (13,251 | ) |
| | | | | | | | | | | | | | | | | | | | | | | | | | | | | | | | |
Net increase (decrease) in net assets resulting from capital share transactions | | | 24,591 | | | | 91,018 | | | | (5,147 | ) | | | (2,576 | ) | | | (138,761 | ) | | | 4,854 | | | | 29,725 | | | | 11,138 | |
| | | | | | | | | | | | | | | | | | | | | | | | | | | | | | | | |
Increase (decrease) in net assets | | | 59,168 | | | | 156,093 | | | | (3,902 | ) | | | 1,724 | | | | (128,112 | ) | | | 128,791 | | | | 42,786 | | | | 30,414 | |
Net assets | | | | | | | | | | | | | | | | | | | | | | | | | | | | | | | | |
Beginning of period | | | 575,613 | | | | 419,520 | | | | 32,035 | | | | 30,311 | | | | 891,589 | | | | 762,798 | | | | 101,248 | | | | 70,834 | |
| | | | | | | | | | | | | | | | | | | | | | | | | | | | | | | | |
End of period | | $ | 634,781 | | | $ | 575,613 | | | $ | 28,133 | | | $ | 32,035 | | | $ | 763,477 | | | $ | 891,589 | | | $ | 144,034 | | | $ | 101,248 | |
| | | | | | | | | | | | | | | | | | | | | | | | | | | | | | | | |
Undistributed net investment income (loss) at the end of the period | | $ | 568 | | | $ | 329 | | | $ | 22 | | | $ | — | | | $ | (4,602 | ) | | $ | — | | | $ | (187 | ) | | $ | — | |
| | | | | | | | | | | | | | | | | | | | | | | | | | | | | | | | |
See accompanying Notes to Financial Statements.
96 Semi-Annual Report | June 30, 2011 |
Statements of Assets and Liabilities
June 30, 2011 (dollar amounts in thousands) (unaudited)
| | | | | | | | | | | | | | | | |
| | | Small-Mid Cap
Growth
Fund | | | Global
Growth
Fund | | | International
Growth
Fund | | | International
Equity
Fund | |
Assets | | | | | | | | | | | | | | | | |
Investments in securities, at cost | | $ | 210,376 | | | $ | 38,680 | | | $ | 3,913,278 | | | $ | 96,318 | |
| | | | | | | | | | | | | | | | |
| | | | |
Investments in securities, at value | | $ | 264,895 | | | $ | 47,792 | | | $ | 4,693,509 | | | $ | 116,416 | |
Foreign currency, at value (cost $—; $302; $20,549; $307) | | | — | | | | 304 | | | | 20,570 | | | | 308 | |
Receivable for securities sold | | | 3,651 | | | | 159 | | | | 72,159 | | | | 67,199 | |
Receivable for fund shares sold | | | 376 | | | | 200 | | | | 13,483 | | | | 49 | |
Receivable from Advisor | | | 1 | | | | 12 | | | | — | | | | 12 | |
Dividend and interest receivable | | | 29 | | | | 77 | | | | 18,387 | | | | 345 | |
Unrealized appreciation on forward foreign currency contracts | | | — | | | | — | | | | 6,120 | | | | — | |
| | | | | | | | | | | | | | | | |
Total assets | | | 268,952 | | | | 48,544 | | | | 4,824,228 | | | | 184,329 | |
Liabilities | | | | | | | | | | | | | | | | |
Payable for investment securities purchased | | | 3,717 | | | | — | | | | 27,769 | | | | 1,276 | |
Payable for fund shares redeemed | | | 81 | | | | 21 | | | | 3,277 | | | | 69,622 | |
Unrealized depreciation on forward foreign currency contracts | | | — | | | | — | | | | 2,037 | | | | 14 | |
Investment advisory fee payable | | | 208 | | | | 39 | | | | 3,904 | | | | 163 | |
Distribution fee payable | | | 6 | | | | 7 | | | | 461 | | | | 2 | |
Other accrued expenses | | | 27 | | | | 42 | | | | 2,157 | | | | 113 | |
| | | | | | | | | | | | | | | | |
Total liabilities | | | 4,039 | | | | 109 | | | | 39,605 | | | | 71,190 | |
| | | | | | | | | | | | | | | | |
Net Assets | | $ | 264,913 | | | $ | 48,435 | | | $ | 4,784,623 | | | $ | 113,139 | |
| | | | | | | | | | | | | | | | |
Capital | | | | | | | | | | | | | | | | |
Composition of Net Assets | | | | | | | | | | | | | | | | |
Par value of shares of beneficial interest | | $ | 16 | | | $ | 5 | | | $ | 212 | | | $ | 9 | |
Capital paid in excess of par value | | | 195,997 | | | | 57,186 | | | | 5,119,954 | | | | 185,316 | |
Accumulated net investment income (loss) | | | (723 | ) | | | 209 | | | | 32,775 | | | | 1,494 | |
Accumulated net realized gain (loss) | | | 15,104 | | | | (18,079 | ) | | | (1,153,920 | ) | | | (93,736 | ) |
Net unrealized appreciation (depreciation) of investments and foreign currencies | | | 54,519 | | | | 9,114 | | | | 785,602 | | | | 20,056 | |
| | | | | | | | | | | | | | | | |
Net Assets | | $ | 264,913 | | | $ | 48,435 | | | $ | 4,784,623 | | | $ | 113,139 | |
| | | | | | | | | | | | | | | | |
| | | | |
Class N Shares | | | | | | | | | | | | | | | | |
Net Assets | | $ | 29,917 | | | $ | 4,892 | | | $ | 2,276,957 | | | $ | 12,080 | |
Shares Outstanding | | | 1,862,389 | | | | 548,252 | | | | 102,219,527 | | | | 967,449 | |
Net Asset Value Per Share | | $ | 16.06 | | | $ | 8.92 | | | $ | 22.28 | | | $ | 12.51 | |
Class I Shares | | | | | | | | | | | | | | | | |
Net Assets | | $ | 234,996 | | | $ | 43,543 | | | $ | 2,507,666 | | | $ | 101,059 | |
Shares Outstanding | | | 14,333,276 | | | | 4,873,673 | | | | 109,944,287 | | | | 8,016,517 | |
Net Asset Value Per Share | | $ | 16.40 | | | $ | 8.93 | | | $ | 22.81 | | | $ | 12.63 | |
See accompanying Notes to Financial Statements.
June 30, 2011 | William Blair Funds 97 |
Statements of Operations
for the Period Ended June 30, 2011 (all amounts in thousands) (unaudited)
| | | | | | | | | | | | | | | | |
| | | Small-Mid Cap
Growth
Fund | | | Global
Growth
Fund | | | International
Growth
Fund | | | International
Equity
Fund | |
Investment income | | | | | | | | | | | | | | | | |
Dividends | | $ | 671 | | | $ | 545 | | | $ | 85,255 | | | $ | 3,069 | |
Less foreign tax withheld | | | — | | | | (38 | ) | | | (7,246 | ) | | | (258 | ) |
Interest | | | 1 | | | | — | | | | 268 | | | | 1 | |
| | | | | | | | | | | | | | | | |
Total income | | | 672 | | | | 507 | | | | 78,277 | | | | 2,812 | |
Expenses | | | | | | | | | | | | | | | | |
Investment advisory fees | | | 1,238 | | | | 232 | | | | 24,559 | | | | 971 | |
Distribution fees | | | 36 | | | | 6 | | | | 3,101 | | | | 17 | |
Shareholder services fees | | | — | | | | 35 | | | | — | | | | — | |
Custodian fees | | | 21 | | | | 35 | | | | 339 | | | | 47 | |
Transfer agent fees | | | 18 | | | | 9 | | | | 197 | | | | 4 | |
Sub-transfer agent fees | | | | | | | | | | | | | | | | |
Class N | | | 17 | | | | 1 | | | | 1,649 | | | | 7 | |
Class I | | | 28 | | | | 1 | | | | 795 | | | | 53 | |
Professional fees | | | 17 | | | | 22 | | | | 97 | | | | 29 | |
Registration fees | | | 27 | | | | 20 | | | | 48 | | | | 19 | |
Shareholder reporting fees | | | 5 | | | | — | | | | 486 | | | | — | |
Trustee fees | | | 3 | | | | 1 | | | | 88 | | | | 5 | |
Other expenses | | | 5 | | | | 4 | | | | 127 | | | | 8 | |
| | | | | | | | | | | | | | | | |
Total expenses before waiver | | | 1,415 | | | | 366 | | | | 31,486 | | | | 1,160 | |
Expenses waived by the Advisor | | | (20 | ) | | | (70 | ) | | | — | | | | (84 | ) |
| | | | | | | | | | | | | | | | |
Net expenses | | | 1,395 | | | | 296 | | | | 31,486 | | | | 1,076 | |
| | | | | | | | | | | | | | | | |
Net investment income (loss) | | | (723 | ) | | | 211 | | | | 46,791 | | | | 1,736 | |
Realized and unrealized gain (loss) | | | | | | | | | | | | | | | | |
Net realized gain (loss) on transactions from: | | | | | | | | | | | | | | | | |
Investments | | | 16,934 | | | | 4,332 | | | | 336,096 | | | | 23,909 | |
Foreign currency transactions | | | — | | | | (23 | ) | | | (41,812 | ) | | | (151 | ) |
| | | | | | | | | | | | | | | | |
Total net realized gain (loss) | | | 16,934 | | | | 4,309 | | | | 294,284 | | | | 23,758 | |
Change in net unrealized appreciation (depreciation) of: | | | | | | | | | | | | | | | | |
Investments | | | 10,526 | | | | (1,624 | ) | | | (245,480 | ) | | | (19,902 | ) |
Foreign currency translations | | | — | | | | — | | | | 4,497 | | | | (52 | ) |
| | | | | | | | | | | | | | | | |
Total change in net unrealized appreciation (depreciation) | | | 10,526 | | | | (1,624 | ) | | | (240,983 | ) | | | (19,954 | ) |
| | | | | | | | | | | | | | | | |
Net increase (decrease) in net assets resulting from operations | | $ | 26,737 | | | $ | 2,896 | | | $ | 100,092 | | | $ | 5,540 | |
| | | | | | | | | | | | | | | | |
See accompanying Notes to Financial Statements.
98 Semi-Annual Report | June 30, 2011 |
Statements of Changes in Net Assets
for the Period Ended June 30, 2011 (unaudited) and the Year Ended December 31, 2010 (all amounts in thousands)
| | | | | | | | | | | | | | | | | | | | | | | | | | | | | | | | |
| | | Small-Mid
Cap Growth
Fund | | | Global
Growth
Fund | | | International
Growth
Fund | | | International
Equity
Fund | |
| | | 2011 | | | 2010 | | | 2011 | | | 2010 | | | 2011 | | | 2010 | | | 2011 | | | 2010 | |
Operations | | | | | | | | | | | | | | | | | | | | | | | | | | | | | | | | |
Net investment income (loss) | | $ | (723 | ) | | $ | (871 | ) | | $ | 211 | | | $ | 51 | | | $ | 46,791 | | | $ | 38,496 | | | $ | 1,736 | | | $ | 2,202 | |
Net realized gain (loss) on investments and foreign currency transactions | | | 16,934 | | | | 22,299 | | | | 4,309 | | | | 3,989 | | | | 294,284 | | | | 706,043 | | | | 23,758 | | | | 30,531 | |
Change in net unrealized appreciation (depreciation) on investments and foreign currency translation | | | 10,526 | | | | 16,762 | | | | (1,624 | ) | | | 3,533 | | | | (240,983 | ) | | | 122,523 | | | | (19,954 | ) | | | (21,798 | ) |
| | | | | | | | | | | | | | | | | | | | | | | | | | | | | | | | |
Net increase (decrease) in net assets resulting from operations | | | 26,737 | | | | 38,190 | | | | 2,896 | | | | 7,573 | | | | 100,092 | | | | 867,062 | | | | 5,540 | | | | 10,935 | |
Distributions to shareholders from | | | | | | | | | | | | | | | | | | | | | | | | | | | | | | | | |
Net investment income | | | — | | | | — | | | | — | | | | (12 | ) | | | — | | | | (101,433 | ) | | | — | | | | (2,578 | ) |
Net realized gain | | | — | | | | — | | | | — | | | | — | | | | — | | | | — | | | | — | | | | — | |
| | | | | | | | | | | | | | | | | | | | | | | | | | | | | | | | |
| | | — | | | | — | | | | — | | | | (12 | ) | | | — | | | | (101,433 | ) | | | — | | | | (2,578 | ) |
Capital stock transactions | | | | | | | | | | | | | | | | | | | | | | | | | | | | | | | | |
Net proceeds from sale of shares | | | 49,639 | | | | 51,303 | | | | 2,725 | | | | 4,844 | | | | 441,345 | | | | 1,498,589 | | | | 20,107 | | | | 59,843 | |
Shares issued in reinvestment of income dividends and capital gain distributions | | | — | | | | — | | | | — | | | | 11 | | | | — | | | | 92,533 | | | | — | | | | 2,452 | |
Less cost of shares redeemed | | | (19,528 | ) | | | (28,256 | ) | | | (2,063 | ) | | | (5,826 | ) | | | (838,993 | ) | | | (1,747,980 | ) | | | (90,563 | ) | | | (190,765 | ) |
| | | | | | | | | | | | | | | | | | | | | | | | | | | | | | | | |
Net increase (decrease) in net assets resulting from capital share transactions | | | 30,111 | | | | 23,047 | | | | 662 | | | | (971 | ) | | | (397,648 | ) | | | (156,858 | ) | | | (70,456 | ) | | | (128,470 | ) |
| | | | | | | | | | | | | | | | | | | | | | | | | | | | | | | | |
Increase (decrease) in net assets | | | 56,848 | | | | 61,237 | | | | 3,558 | | | | 6,590 | | | | (297,556 | ) | | | 608,771 | | | | (64,916 | ) | | | (120,113 | ) |
Net assets | | | | | | | | | | | | | | | | | | | | | | | | | | | | | | | | |
Beginning of period | | $ | 208,065 | | | $ | 146,828 | | | $ | 44,877 | | | $ | 38,287 | | | $ | 5,082,179 | | | $ | 4,473,408 | | | $ | 178,055 | | | $ | 298,168 | |
| | | | | | | | | | | | | | | | | | | | | | | | | | | | | | | | |
End of period | | $ | 264,913 | | | $ | 208,065 | | | $ | 48,435 | | | $ | 44,877 | | | $ | 4,784,623 | | | $ | 5,082,179 | | | $ | 113,139 | | | $ | 178,055 | |
| | | | | | | | | | | | | | | | | | | | | | | | | | | | | | | | |
Undistributed net investment income (loss) at the end of the period | | $ | (723 | ) | | $ | — | | | $ | 209 | | | $ | (2 | ) | | $ | 32,775 | | | $ | (14,016 | ) | | $ | 1,494 | | | $ | (242 | ) |
| | | | | | | | | | | | | | | | | | | | | | | | | | | | | | | | |
See accompanying Notes to Financial Statements.
June 30, 2011 | William Blair Funds 99 |
Statements of Assets and Liabilities
June 30, 2011 (dollar amounts in thousands) (unaudited)
| | | | | | | | | | | | |
| | | International
Small Cap
Growth
Fund | | | Emerging
Markets
Growth
Fund | | | Emerging
Leaders
Growth
Fund | |
Assets | | | | | | | | | | | | |
Investments in securities, at cost | | $ | 640,773 | | | $ | 746,542 | | | $ | 88,893 | |
| | | | | | | | | | | | |
| | | |
Investments in securities, at value | | $ | 757,903 | | | $ | 869,140 | | | $ | 98,436 | |
Foreign currency, at value (cost $5,547; $4,854; $2,617) | | | 5,572 | | | | 4,854 | | | | 2,629 | |
Receivable for securities sold | | | 7,313 | | | | 16,083 | | | | 2,138 | |
Receivable for fund shares sold | | | 2,434 | | | | 101 | | | | 99 | |
Receivable from Advisor | | | — | | | | — | | | | 11 | |
Dividend and interest receivable | | | 1,350 | | | | 2,645 | | | | 286 | |
Unrealized appreciation on forward foreign currency contracts | | | — | | | | — | | | | — | |
| | | | | | | | | | | | |
Total assets | | | 774,572 | | | | 892,823 | | | | 103,599 | |
Liabilities | | | | | | | | | | | | |
Payable for investment securities purchased | | | 4,890 | | | | 9,754 | | | | 2,937 | |
Payable for fund shares redeemed | | | 231 | | | | 1,015 | | | | 112 | |
Payable to custodian | | | — | | | | 1,102 | | | | — | |
Unrealized depreciation on forward foreign currency contracts | | | 30 | | | | — | | | | — | |
Investment advisory fee payable | | | 610 | | | | 963 | | | | 86 | |
Distribution fee payable | | | 60 | | | | 32 | | | | 4 | |
Other accrued expenses | | | 152 | | | | 368 | | | | 58 | |
| | | | | | | | | | | | |
Total liabilities | | | 5,973 | | | | 13,234 | | | | 3,197 | |
| | | | | | | | | | | | |
Net Assets | | $ | 768,599 | | | $ | 879,589 | | | $ | 100,402 | |
| | | | | | | | | | | | |
Capital | | | | | | | | | | | | |
Composition of Net Assets | | | | | | | | | | | | |
Par value of shares of beneficial interest | | $ | 55 | | | $ | 56 | | | $ | 10 | |
Capital paid in excess of par value | | | 709,028 | | | | 644,901 | | | | 84,117 | |
Accumulated net investment income (loss) | | | 4,319 | | | | (5,429 | ) | | | 336 | |
Accumulated net realized gain (loss) | | | (61,930 | ) | | | 117,446 | | | | 6,390 | |
Net unrealized appreciation (depreciation) of investments and foreign currencies | | | 117,127 | | | | 122,615 | | | | 9,549 | |
| | | | | | | | | | | | |
Net Assets | | $ | 768,599 | | | $ | 879,589 | | | $ | 100,402 | |
| | | | | | | | | | | | |
| | | |
Class N Shares | | | | | | | | | | | | |
Net Assets | | $ | 22,415 | | | $ | 29,687 | | | $ | 50 | |
Shares Outstanding | | | 1,626,233 | | | | 1,897,450 | | | | 4,989 | |
Net Asset Value Per Share | | $ | 13.78 | | | $ | 15.65 | | | $ | 10.09 | |
Class I Shares | | | | | | | | | | | | |
Net Assets | | $ | 441,132 | | | $ | 173,639 | | | $ | 32,417 | |
Shares Outstanding | | | 31,650,384 | | | | 11,000,289 | | | | 3,208,667 | |
Net Asset Value Per Share | | $ | 13.94 | | | $ | 15.78 | | | $ | 10.10 | |
See accompanying Notes to Financial Statements.
100 Semi-Annual Report | June 30, 2011 |
Statements of Operations
for the Period Ended June 30, 2011 (all amounts in thousands) (unaudited)
| | | | | | | | | | | | |
| | | International
Small Cap
Growth
Fund | | | Emerging
Markets
Growth
Fund | | | Emerging
Leaders
Growth
Fund | |
Investment income | | | | | | | | | | | | |
Dividends | | $ | 9,805 | | | $ | 14,909 | | | $ | 1,185 | |
Less foreign tax withheld | | | (816 | ) | | | (1,112 | ) | | | (99 | ) |
Interest | | | 90 | | | | 148 | | | | — | |
| | | | | | | | | | | | |
Total income | | | 9,079 | | | | 13,945 | | | | 1,086 | |
Expenses | | | | | | | | | | | | |
Investment advisory fees | | | 3,524 | | | | 6,374 | | | | 530 | |
Distribution fees | | | 28 | | | | 39 | | | | — | |
Shareholder services fees | | | 313 | | | | 164 | | | | 18 | |
Custodian fees | | | 93 | | | | 258 | | | | 66 | |
Transfer agent fees | | | 15 | | | | 24 | | | | 7 | |
Sub-transfer agent fees | | | | | | | | | | | | |
Class N | | | 17 | | | | 14 | | | | — | |
Class I | | | 57 | | | | 28 | | | | — | |
Professional fees | | | 33 | | | | 58 | | | | 34 | |
Registration fees | | | 48 | | | | 28 | | | | 27 | |
Shareholder reporting fees | | | 24 | | | | 11 | | | | 1 | |
Trustee fees | | | 9 | | | | 21 | | | | 2 | |
Other expenses | | | 13 | | | | 28 | | | | 4 | |
| | | | | | | | | | | | |
Total expenses before waiver | | | 4,174 | | | | 7,047 | | | | 689 | |
Expenses waived by the Advisor | | | — | | | | — | | | | (70 | ) |
| | | | | | | | | | | | |
Net expenses | | | 4,174 | | | | 7,047 | | | | 619 | |
| | | | | | | | | | | | |
Net investment income (loss) | | | 4,905 | | | | 6,898 | | | | 467 | |
Realized and unrealized gain (loss) | | | | | | | | | | | | |
Net realized gain (loss) on transactions from: | | | | | | | | | | | | |
Investments | | | 51,734 | | | | 135,105 | | | | 5,902 | |
Foreign currency transactions | | | 1,996 | | | | (885 | ) | | | (177 | ) |
| | | | | | | | | | | | |
Total net realized gain (loss) | | | 53,730 | | | | 134,220 | | | | 5,725 | |
Change in net unrealized appreciation (depreciation) of: | | | | | | | | | | | | |
Investments | | | (18,159 | ) | | | (162,150 | ) | | | (8,084 | ) |
Foreign currency translations | | | (61 | ) | | | (29 | ) | | | 11 | |
| | | | | | | | | | | | |
Total change in net unrealized appreciation (depreciation) | | | (18,220 | ) | | | (162,179 | ) | | | (8,073 | ) |
| | | | | | | | | | | | |
Net increase (decrease) in net assets resulting from operations | | $ | 40,415 | | | $ | (21,061 | ) | | $ | (1,881 | ) |
| | | | | | | | | | | | |
See accompanying Notes to Financial Statements.
June 30, 2011 | William Blair Funds 101 |
Statements of Changes in Net Assets
for the Period Ended June 30, 2011 (unaudited) and the Year Ended December 31, 2010 (all amounts in thousands)
| | | | | | | | | | | | | | | | | | | | | | | | |
| | | International
Small Cap
Growth
Fund | | | Emerging
Markets
Growth
Fund | | | Emerging
Leaders
Growth
Fund | |
| | | 2011 | | | 2010 | | | 2011 | | | 2010 | | | 2011 | | | 2010 | |
Operations | | | | | | | | | | | | | | | | | | | | | | | | |
Net investment income (loss) | | $ | 4,905 | | | $ | 3,235 | | | $ | 6,898 | | | $ | 4,305 | | | $ | 467 | | | $ | 468 | |
Net realized gain (loss) on investments and foreign currency transactions | | | 53,730 | | | | 57,094 | | | | 134,220 | | | | 245,341 | | | | 5,725 | | | | 33,656 | |
Change in net unrealized appreciation (depreciation) on investments and foreign currency translation | | | (18,220 | ) | | | 62,315 | | | | (162,179 | ) | | | 13,556 | | | | (8,073 | ) | | | (16,315 | ) |
| | | | | | | | | | | | | | | | | | | | | | | | |
Net increase (decrease) in net assets resulting from operations | | | 40,415 | | | | 122,644 | | | | (21,061 | ) | | | 263,202 | | | | (1,881 | ) | | | 17,809 | |
Distributions to shareholders from | | | | | | | | | | | | | | | | | | | | | | | | |
Net investment income | | | — | | | | (2,781 | ) | | | — | | | | (13,461 | ) | | | — | | | | (255 | ) |
Net realized gain | | | — | | | | — | | | | — | | | | — | | | | — | | | | (505 | ) |
| | | | | | | | | | | | | | | | | | | | | | | | |
| | | — | | | | (2,781 | ) | | | — | | | | (13,461 | ) | | | — | | | | (760 | ) |
Capital stock transactions | | | | | | | | | | | | | | | | | | | | | | | | |
Net proceeds from sale of shares | | | 136,913 | | | | 222,392 | | | | 125,492 | | | | 357,761 | | | | 17,588 | | | | 14,224 | |
Shares issued in reinvestment of income dividends and capital gain distributions | | | — | | | | 2,417 | | | | — | | | | 12,072 | | | | — | | | | 681 | |
Less cost of shares redeemed | | | (55,680 | ) | | | (88,572 | ) | | | (475,385 | ) | | | (407,291 | ) | | | (10,206 | ) | | | (52,189 | ) |
| | | | | | | | | | | | | | | | | | | | | | | | |
Net increase (decrease) in net assets resulting from capital share transactions | | | 81,233 | | | | 136,237 | | | | (349,893 | ) | | | (37,458 | ) | | | 7,382 | | | | (37,284 | ) |
| | | | | | | | | | | | | | | | | | | | | | | | |
Increase (decrease) in net assets | | | 121,648 | | | | 256,100 | | | | (370,954 | ) | | | 212,283 | | | | 5,501 | | | | (20,235 | ) |
Net assets | | | | | | | | | | | | | | | | | | | | | | | | |
Beginning of period | | $ | 646,951 | | | $ | 390,851 | | | $ | 1,250,543 | | | $ | 1,038,260 | | | $ | 94,901 | | | $ | 115,136 | |
| | | | | | | | | | | | | | | | | | | | | | | | |
End of period | | $ | 768,599 | | | $ | 646,951 | | | $ | 879,589 | | | $ | 1,250,543 | | | $ | 100,402 | | | $ | 94,901 | |
| | | | | | | | | | | | | | | | | | | | | | | | |
Undistributed net investment income (loss) at the end of the period | | $ | 4,319 | | | $ | (586 | ) | | $ | (5,429 | ) | | $ | (12,327 | ) | | $ | 336 | | | $ | (131 | ) |
| | | | | | | | | | | | | | | | | | | | | | | | |
See accompanying Notes to Financial Statements.
102 Semi-Annual Report | June 30, 2011 |
Statements of Assets and Liabilities
June 30, 2011 (dollar amounts in thousands) (unaudited)
| | | | | | | | |
| | | Small Cap
Value
Fund | | | Mid Cap
Value
Fund | |
Assets | | | | | | | | |
Investments in securities, at cost | | $ | 207,438 | | | $ | 3,745 | |
| | | | | | | | |
| | |
Investments in securities, at value | | $ | 227,947 | | | $ | 4,108 | |
Receivable for securities sold | | | 1,538 | | | | 123 | |
Receivable for fund shares sold | | | 3,252 | | | | 25 | |
Receivable from Advisor | | | 28 | | | | 10 | |
Dividend and interest receivable | | | 231 | | | | 6 | |
| | | | | | | | |
Total assets | | | 232,996 | | | | 4,272 | |
Liabilities | | | | | | | | |
Payable for investment securities purchased | | | 3,294 | | | | 120 | |
Payable for fund shares redeemed | | | 24 | | | | — | |
Investment advisory fee payable | | | 197 | | | | 3 | |
Distribution fee payable | | | 8 | | | | — | |
Other accrued expenses | | | 30 | | | | 6 | |
| | | | | | | | |
Total liabilities | | | 3,553 | | | | 129 | |
| | | | | | | | |
Net Assets | | $ | 229,443 | | | $ | 4,143 | |
| | | | | | | | |
Capital | | | | | | | | |
Composition of Net Assets | | | | | | | | |
Par value of shares of beneficial interest | | $ | 17 | | | $ | — | |
Capital paid in excess of par value | | | 198,266 | | | | 3,719 | |
Accumulated net investment income (loss) | | | 402 | | | | 22 | |
Accumulated net realized gain (loss)
| | | 10,249 | | | | 39 | |
Net unrealized appreciation (depreciation) of investments | | | 20,509 | | | | 363 | |
| | | | | | | | |
Net Assets | | $ | 229,443 | | | $ | 4,143 | |
| | | | | | | | |
| | |
Class N Shares | | | | | | | | |
Net Assets | | $ | 42,765 | | | $ | 47 | |
Shares Outstanding | | | 3,052,044 | | | | 4,163 | |
Net Asset Value Per Share | | $ | 14.01 | | | $ | 11.38 | |
Class I Shares | | | | | | | | |
Net Assets | | $ | 186,678 | | | $ | 4,096 | |
Shares Outstanding | | | 13,089,611 | | | | 359,619 | |
Net Asset Value Per Share | | $ | 14.26 | | | $ | 11.39 | |
See accompanying Notes to Financial Statements.
June 30, 2011 | William Blair Funds 103 |
Statements of Operations
for the Period Ended June 30, 2011 (all amounts in thousands) (unaudited)
| | | | | | | | |
| | | Small Cap
Value
Fund | | | Mid Cap
Value
Fund | |
Investment income | | | | | | | | |
Dividends | | $ | 1,412 | | | $ | 36 | |
Interest | | | 1 | | | | — | |
| | | | | | | | |
Total income | | | 1,413 | | | | 36 | |
Expenses | | | | | | | | |
Investment advisory fees | | | 1,072 | | | | 17 | |
Distribution fees | | | 48 | | | | — | |
Custodian fees | | | 38 | | | | 20 | |
Transfer agent fees | | | 16 | | | | 2 | |
Sub-transfer agent fees | | | | | | | | |
Class N | | | 21 | | | | — | |
Class I | | | 51 | | | | — | |
Professional fees | | | 13 | | | | 13 | |
Registration fees | | | 17 | | | | 17 | |
Shareholder reporting fees | | | 9 | | | | — | |
Trustee fees | | | 2 | | | | — | |
Other expenses | | | 3 | | | | 1 | |
| | | | | | | | |
Total expenses before waiver | | | 1,290 | | | | 70 | |
Expenses waived and reimbursed by the Advisor | | | (152 | ) | | | (51 | ) |
| | | | | | | | |
Net expenses | | | 1,138 | | | | 19 | |
| | | | | | | | |
Net investment income (loss) | | | 275 | | | | 17 | |
Realized and unrealized gain (loss) | | | | | | | | |
Net realized gain (loss) on transactions from investments | | | 9,673 | | | | 25 | |
| | | | | | | | |
Change in net unrealized appreciation (depreciation) of investments | | | (5,949 | ) | | | 173 | |
| | | | | | | | |
Net increase (decrease) in net assets resulting from operations | | $ | 3,999 | | | $ | 215 | |
| | | | | | | | |
See accompanying Notes to Financial Statements.
104 Semi-Annual Report | June 30, 2011 |
Statements of Changes in Net Assets
for the Period Ended June 30, 2011 (unaudited) and the Year Ended December 31, 2010 (all amounts in thousands)
| | | | | | | | | | | | | | | | |
| | | Small Cap
Value
Fund | | | Mid Cap
Value
Fund | |
| | | 2011 | | | 2010 | | | 2011 | | | 2010(a) | |
Operations | | | | | | | | | | | | | | | | |
Net investment income (loss) | | $ | 275 | | | $ | 411 | | | $ | 17 | | | $ | 26 | |
Net realized gain (loss) on investments | | | 9,673 | | | | 9,981 | | | | 25 | | | | 19 | |
Change in net unrealized appreciation (depreciation) on investments | | | (5,949 | ) | | | 20,721 | | | | 173 | | | | 190 | |
| | | | | | | | | | | | | | | | |
Net increase (decrease) in net assets resulting from operations | | | 3,999 | | | | 31,113 | | | | 215 | | | | 235 | |
Distributions to shareholders from | | | | | | | | | | | | | | | | |
Net investment income | | | — | | | | (404 | ) | | | — | | | | (21 | ) |
Net realized gain | | | — | | | | — | | | | — | | | | (5 | ) |
| | | | | | | | | | | | | | | | |
| | | — | | | | (404 | ) | | | — | | | | (26 | ) |
Capital stock transactions | | | | | | | | | | | | | | | | |
Net proceeds from sale of shares | | | 101,754 | | | | 92,468 | | | | 769 | | | | 3,163 | |
Shares issued in reinvestment of income dividends and capital gain distributions | | | — | | | | 354 | | | | — | | | | 26 | |
Less cost of shares redeemed | | | (40,809 | ) | | | (13,891 | ) | | | (234 | ) | | | (5 | ) |
| | | | | | | | | | | | | | | | |
Net increase (decrease) in net assets resulting from capital share transactions | | | 60,945 | | | | 78,931 | | | | 535 | | | | 3,184 | |
| | | | | | | | | | | | | | | | |
Increase (decrease) in net assets | | | 64,944 | | | | 109,640 | | | | 750 | | | | 3,393 | |
Net assets | | | | | | | | | | | | | | | | |
Beginning of period | | $ | 164,499 | | | $ | 54,859 | | | $ | 3,393 | | | $ | — | |
| | | | | | | | | | | | | | | | |
End of period | | $ | 229,443 | | | $ | 164,499 | | | $ | 4,143 | | | $ | 3,393 | |
| | | | | | | | | | | | | | | | |
Undistributed net investment income (loss) at the end of the period | | $ | 402 | | | $ | 127 | | | $ | 22 | | | $ | 5 | |
| | | | | | | | | | | | | | | | |
| (a) | | For the period from May 3, 2010 (Commencement of Operations) to December 31, 2010. |
See accompanying Notes to Financial Statements.
June 30, 2011 | William Blair Funds 105 |
Statements of Assets and Liabilities
June 30, 2011 (dollar amounts in thousands) (unaudited)
| | | | | | | | | | | | | | | | |
| | | Bond
Fund | | | Income
Fund | | | Low
Duration
Fund | | | Ready
Reserves
Fund | |
Assets | | | | | | | | | | | | | | | | |
Investments in securities, at cost | | $ | 193,902 | | | $ | 91,479 | | | $ | 148,004 | | | $ | 1,261,147 | |
| | | | | | | | | | | | | | | | |
| | | | |
Investments in securities, at value | | $ | 203,963 | | | $ | 96,329 | | | $ | 148,587 | | | $ | 1,261,147 | |
Receivable for securities sold | | | 252 | | | | 1,859 | | | | 1,061 | | | | — | |
Receivable for fund shares sold | | | 1,071 | | | | 62 | | | | — | | | | — | |
Receivable from Advisor | | | 12 | | | | 3 | | | | 5 | | | | 506 | |
Dividend and interest receivable | | | 1,862 | | | | 870 | | | | 486 | | | | 1,828 | |
| | | | | | | | | | | | | | | | |
Total assets | | | 207,160 | | | | 99,123 | | | | 150,139 | | | | 1,263,481 | |
Liabilities | | | | | | | | | | | | | | | | |
Payable for investment securities purchased | | | 2,167 | | | | 3,800 | | | | 3,209 | | | | 4,997 | |
Payable for fund shares redeemed | | | 1,044 | | | | 92 | | | | 798 | | | | — | |
Investment advisory fee payable | | | 50 | | | | 38 | | | | 36 | | | | 250 | |
Distribution fee payable | | | 19 | | | | 4 | | | | 10 | | | | 365 | |
Other accrued expenses | | | 72 | | | | 61 | | | | 51 | | | | 51 | |
| | | | | | | | | | | | | | | | |
Total liabilities | | | 3,352 | | | | 3,995 | | | | 4,104 | | | | 5,663 | |
| | | | | | | | | | | | | | | | |
Net Assets | | $ | 203,808 | | | $ | 95,128 | | | $ | 146,035 | | | $ | 1,257,818 | |
| | | | | | | | | | | | | | | | |
Capital | | | | | | | | | | | | | | | | |
Composition of Net Assets | | | | | | | | | | | | | | | | |
Par value of shares of beneficial interest | | $ | 19 | | | $ | 10 | | | $ | 15 | | | $ | 1,258 | |
Capital paid in excess of par value | | | 192,598 | | | | 130,881 | | | | 147,214 | | | | 1,256,497 | |
Accumulated net investment income (loss) | | | (388 | ) | | | (261 | ) | | | (710 | ) | | | 86 | |
Accumulated net realized gain (loss) | | | 1,518 | | | | (40,352 | ) | | | (1,067 | ) | | | (23 | ) |
Net unrealized appreciation (depreciation) of investments | | | 10,061 | | | | 4,850 | | | | 583 | | | | — | |
| | | | | | | | | | | | | | | | |
Net Assets | | $ | 203,808 | | | $ | 95,128 | | | $ | 146,035 | | | $ | 1,257,818 | |
| | | | | | | | | | | | | | | | |
| | | | |
Class N Shares | | | | | | | | | | | | | | | | |
Net Assets | | $ | 4,939 | | | $ | 30,526 | | | $ | 5,931 | | | $ | 1,257,818 | |
Shares Outstanding | | | 458,971 | | | | 3,301,286 | | | | 599,410 | | | | 1,257,875,022 | |
Net Asset Value Per Share | | $ | 10.76 | | | $ | 9.25 | | | $ | 9.89 | | | $ | 1.00 | |
Class I Shares | | | | | | | | | | | | | | | | |
Net Assets | | $ | 145,432 | | | $ | 64,602 | | | $ | 70,409 | | | $ | — | |
Shares Outstanding | | | 13,648,936 | | | | 7,039,967 | | | | 7,115,870 | | | | — | |
Net Asset Value Per Share | | $ | 10.66 | | | $ | 9.18 | | | $ | 9.89 | | | $ | — | |
See accompanying Notes to Financial Statements.
106 Semi-Annual Report | June 30, 2011 |
Statements of Operations
for the Period Ended June 30, 2011 (all amounts in thousands) (unaudited)
| | | | | | | | | | | | | | | | |
| | | Bond
Fund | | | Income
Fund | | | Low
Duration
Fund | | | Ready
Reserves
Fund | |
Investment income | | | | | | | | | | | | | | | | |
Interest | | $ | 4,839 | | | $ | 2,270 | | | $ | 1,623 | | | $ | 1,144 | |
| | | | | | | | | | | | | | | | |
Total income | | | 4,839 | | | | 2,270 | | | | 1,623 | | | | 1,144 | |
Expenses | | | | | | | | | | | | | | | | |
Investment advisory fees | | | 294 | | | | 239 | | | | 220 | | | | 1,492 | |
Distribution fees | | | 4 | | | | 24 | | | | 5 | | | | — | |
Shareholder services fees | | | 113 | | | | — | | | | 64 | | | | 2,176 | |
Custodian fees | | | 27 | | | | 25 | | | | 30 | | | | 4 | |
Transfer agent fees | | | 11 | | | | 12 | | | | 8 | | | | 14 | |
Sub-transfer agent fees | | | | | | | | | | | | | | | | |
Class N | | | 2 | | | | 24 | | | | — | | | | — | |
Class I | | | 4 | | | | 1 | | | | — | | | | — | |
Professional fees | | | 17 | | | | 17 | | | | 14 | | | | 28 | |
Registration fees | | | 28 | | | | 16 | | | | 42 | | | | 13 | |
Shareholder reporting fees | | | 4 | | | | 6 | | | | 2 | | | | 26 | |
Trustee fees | | | 3 | | | | 2 | | | | 2 | | | | 24 | |
Other expenses | | | 8 | | | | 4 | | | | 6 | | | | 36 | |
| | | | | | | | | | | | | | | | |
Total expenses before waiver | | | 515 | | | | 370 | | | | 393 | | | | 3,813 | |
Expenses waived and reimbursed by the Advisor | | | (55 | ) | | | (16 | ) | | | (32 | ) | | | (2,731 | ) |
| | | | | | | | | | | | | | | | |
Net expenses | | | 460 | | | | 354 | | | | 361 | | | | 1,082 | |
| | | | | | | | | | | | | | | | |
Net investment income (loss) | | | 4,379 | | | | 1,916 | | | | 1,262 | | | | 62 | |
Realized and unrealized gain (loss) | | | | | | | | | | | | | | | | |
Net realized gain (loss) on transactions from investments | | | 1,281 | | | | 1,567 | | | | 37 | | | | — | |
| | | | | | | | | | | | | | | | |
Change in net unrealized appreciation (depreciation) of investments | | | 258 | | | | (1,005 | ) | | | 683 | | | | — | |
| | | | | | | | | | | | | | | | |
Net increase (decrease) in net assets resulting from operations | | $ | 5,918 | | | $ | 2,478 | | | $ | 1,982 | | | $ | 62 | |
| | | | | | | | | | | | | | | | |
See accompanying Notes to Financial Statements.
June 30, 2011 | William Blair Funds 107 |
Statements of Changes in Net Assets
for the Period Ended June 30, 2011 (unaudited) and the Year Ended December 31, 2010 (all amounts in thousands)
| | | | | | | | | | | | | | | | | | | | | | | | | | | | | | | | |
| | | Bond
Fund | | | Income
Fund | | | Low
Duration
Fund | | | Ready
Reserves
Fund | |
| | | 2011 | | | 2010 | | | 2011 | | | 2010 | | | 2011 | | | 2010 | | | 2011 | | | 2010 | |
Operations | | | | | | | | | | | | | | | | | | | | | | | | | | | | | | | | |
Net investment income (loss) | | $ | 4,379 | | | $ | 8,051 | | | $ | 1,916 | | | $ | 4,613 | | | $ | 1,262 | | | $ | 1,915 | | | $ | 62 | | | $ | 126 | |
Net realized gain (loss) on investments | | | 1,281 | | | | 2,212 | | | | 1,567 | | | | 2,316 | | | | 37 | | | | (60 | ) | | | — | | | | — | |
Change in net unrealized appreciation (depreciation) on investments | | | 258 | | | | 3,290 | | | | (1,005 | ) | | | 202 | | | | 683 | | | | 468 | | | | — | | | | — | |
| | | | | | | | | | | | | | | | | | | | | | | | | | | | | | | | |
Net increase (decrease) in net assets resulting from operations | | | 5,918 | | | | 13,553 | | | | 2,478 | | | | 7,131 | | | | 1,982 | | | | 2,323 | | | | 62 | | | | 126 | |
Distributions to shareholders from | | | | | | | | | | | | | | | | | | | | | | | | | | | | | | | | |
Net investment income | | | (4,768 | ) | | | (8,566 | ) | | | (2,177 | ) | | | (5,134 | ) | | | (1,972 | ) | | | (2,958 | ) | | | (62 | ) | | | (126 | ) |
Net realized gain | | | — | | | | (494 | ) | | | — | | | | — | | | | — | | | | — | | | | — | | | | — | |
| | | | | | | | | | | | | | | | | | | | | | | | | | | | | | | | |
| | | (4,768 | ) | | | (9,060 | ) | | | (2,177 | ) | | | (5,134 | ) | | | (1,972 | ) | | | (2,958 | ) | | | (62 | ) | | | (126 | ) |
Capital stock transactions | | | | | | | | | | | | | | | | | | | | | | | | | | | | | | | | |
Net proceeds from sale of shares | | | 51,086 | | | | 90,709 | | | | 4,748 | | | | 15,385 | | | | 69,555 | | | | 149,882 | | | | 449,947 | | | | 670,783 | |
Shares issued in reinvestment of income dividends and capital gain distributions | | | 3,450 | | | | 6,013 | | | | 1,845 | | | | 4,350 | | | | 1,574 | | | | 2,297 | | | | 62 | | | | 126 | |
Less cost of shares redeemed | | | (44,654 | ) | | | (55,783 | ) | | | (25,043 | ) | | | (26,063 | ) | | | (68,574 | ) | | | (103,208 | ) | | | (408,734 | ) | | | (807,267 | ) |
| | | | | | | | | | | | | | | | | | | | | | | | | | | | | | | | |
Net increase (decrease) in net assets resulting from capital share transactions | | | 9,882 | | | | 40,939 | | | | (18,450 | ) | | | (6,328 | ) | | | 2,555 | | | | 48,971 | | | | 41,275 | | | | (136,358 | ) |
| | | | | | | | | | | | | | | | | | | | | | | | | | | | | | | | |
Increase (decrease) in net assets | | | 11,032 | | | | 45,432 | | | | (18,149 | ) | | | (4,331 | ) | | | 2,565 | | | | 48,336 | | | | 41,275 | | | | (136,358 | ) |
Net assets | | | | | | | | | | | | | | | | | | | | | | | | | | | | | | | | |
Beginning of period | | $ | 192,776 | | | $ | 147,344 | | | $ | 113,277 | | | $ | 117,608 | | | $ | 143,470 | | | $ | 95,134 | | | $ | 1,216,543 | | | $ | 1,352,901 | |
| | | | | | | | | | | | | | | | | | | | | | | | | | | | | | | | |
End of period | | $ | 203,808 | | | $ | 192,776 | | | $ | 95,128 | | | $ | 113,277 | | | $ | 146,035 | | | $ | 143,470 | | | $ | 1,257,818 | | | $ | 1,216,543 | |
| | | | | | | | | | | | | | | | | | | | | | | | | | | | | | | | |
Undistributed net investment income (loss) at the end of the period | | $ | (388 | ) | | $ | 1 | | | $ | (261 | ) | | $ | — | | | $ | (710 | ) | | $ | — | | | $ | 86 | | | $ | 86 | |
| | | | | | | | | | | | | | | | | | | | | | | | | | | | | | | | |
See accompanying Notes to Financial Statements.
108 Semi-Annual Report | June 30, 2011 |
Notes to Financial Statements
(1) Significant Accounting Policies
The following is a summary of William Blair Funds’ (the “Fund”) significant accounting policies in effect during the period covered by the financial statements, which are in accordance with U.S. generally accepted accounting principles.
(a) Description of the Fund
The Fund is a diversified mutual fund registered under the Investment Company Act of 1940 (the “1940 Act”), as amended, as an open-end management investment company. The Fund currently consists of the following nineteen portfolios (the “Portfolios”), each with its own investment objective and policies. For each portfolio, the number of shares authorized is unlimited.
| | |
Equity Portfolios Growth Large Cap Growth Small Cap Growth Mid Cap Growth Small-Mid Cap Growth Small Cap Value Mid Cap Value Global Equity Portfolio Global Growth | | International Equity Portfolios International Growth International Equity Institutional International Growth Institutional International Equity International Small Cap Growth Emerging Markets Growth Emerging Leaders Growth Fixed-Income Portfolios Bond Income Low Duration Money Market Portfolio Ready Reserves |
| |
| |
| |
| |
| |
| |
| |
| |
| |
| |
| |
| |
| |
The investment objectives of the Portfolios are as follows:
| | |
Equity | | Long-term capital appreciation. |
Global Equity | | Long-term capital appreciation. |
International Equity | | Long-term capital appreciation. |
Fixed-Income | | High level of current income with relative stability of principal.
(Maximize total return—Low Duration) |
Money Market | | Current income, a stable share price and daily liquidity. |
The Institutional International Growth Portfolio, the Institutional International Equity Portfolio and the Institutional Class of the International Small Cap Growth Portfolio, the Emerging Markets Growth Portfolio, the Emerging Leaders Growth Portfolio, the Bond Portfolio and the Low Duration Portfolio issue a separate report.
(b) Share Classes
Three different classes of shares currently exist: N, I and Institutional. This report includes financial highlight information for Classes N and I. The table below describes the Class N shares and the Class I shares covered by this report:
| | |
Class | | Description |
| N | | Class N shares are sold to the general public, either directly through the Fund’s distributor or through a select number of financial intermediaries. Class N shares are sold without any sales load, and carry an annual 12b-1 distribution fee (0.25% for the Equity, Global Equity and International Equity Portfolios and 0.15% for the Fixed-Income Portfolios) or a service fee (0.35% for the Money Market Portfolio), a Sub-transfer agent expense which is not a fixed rate and may vary by Portfolio and class, and an annual shareholder administration fee (0.15% for the Global Growth Portfolio, the International Small Cap Growth Portfolio, the Emerging Markets Growth Portfolio, the Emerging Leaders Growth Portfolio, the Bond Portfolio and the Low Duration Portfolio). |
| I | | Class I shares are sold to a limited group of investors. They do not carry any sales load or distribution fees and generally have lower ongoing expenses than the Class N shares. Class I shares have a Sub-transfer agent expense which is not a fixed rate and may vary by Portfolio and class and the Global Growth Portfolio, the International Small Cap Growth Portfolio, the Emerging Markets Growth Portfolio, the Emerging Leaders Growth Portfolio, the Bond Portfolio and the Low Duration Portfolio carry an annual shareholder administration fee of 0.15%. |
June 30, 2011 | William Blair Funds 109 |
Sub-transfer: The Portfolios may reimburse the Advisor for fees paid to intermediaries such as banks, broker-dealers, financial advisors or other financial institutions for sub-administration, sub-transfer agency and other services provided to investors whose shares are held of record in omnibus, other group accounts, retirement plans or accounts traded through registered securities clearing agents. These fees may vary based on, for example, the nature of services provided, but generally range up to 0.15% of the assets of the class serviced or maintained by the intermediary or up to $15 per shareholder account.
Investment income, realized and unrealized gains and losses, and certain Portfolio level expenses and expense reductions, if any, are allocated based on the relative net assets of each class, except for certain class specific expenses, which are charged directly to the appropriate class. Differences in class expenses may result in the payment of different per share dividends by class. All share classes of the Portfolios have equal rights with respect to voting subject to class specific arrangements.
(c) Investment Valuation
The market value of domestic equity securities is determined by valuing securities traded on national securities markets or in the over-the-counter markets at the last sale price or, if applicable, the official closing price or, in the absence of a recent sale on the date of determination, at the latest bid price.
The value of foreign equity securities is generally determined based upon the last sale price on the foreign exchange or market on which it is primarily traded and in the currency of that market as of the close of the appropriate exchange or, if there have been no sales during that day, at the latest bid price. The Board of Trustees has determined that the passage of time between when the foreign exchanges or markets close and when the Portfolios compute their net asset values could cause the value of foreign equity securities to no longer be representative or accurate and, as a result, may necessitate that such securities be fair valued. Accordingly, for foreign equity securities, the Portfolios may use an independent pricing service to fair value the security as of the close of regular trading on the New York Stock Exchange. As a result, a Portfolio’s value for a security may be different from the last sale price (or the latest bid price).
Fixed-income securities are valued by using market quotations or independent pricing services that use either prices provided by market-makers or matrixes that produce estimates of market values obtained from yield data relating to instruments or securities with similar characteristics.
Other securities, and all other assets, including securities for which a market price is not available or is deemed unreliable, (e.g., securities affected by unusual or extraordinary events, such as natural disasters or securities affected by market or economic events, such as bankruptcy filings), or the value of which is affected by a significant valuation event, are valued at a fair value as determined in good faith by, or under the direction of, the Board of Trustees and in accordance with the Fund’s Valuation Procedures. The value of fair valued securities may be different from the last sale price (or the latest bid price), and there is no guarantee that a fair valued security will be sold at the price at which a Portfolio is carrying the security.
Investments in other funds are valued at the underlying fund’s net asset value on the date of valuation. Securities held in the Ready Reserves Portfolio are valued at amortized cost, which approximates market value.
As of June 30, 2011, there were securities held in the International Growth, International Small Cap Growth, Emerging Markets Growth, Bond and Income Portfolios requiring fair valuation pursuant to the Funds’ Valuation Procedures.
(d) Investment income and transactions
Dividend income is recorded on the ex-dividend date, except for those dividends from certain foreign securities that are recorded when the information is available.
Interest income is recorded on an accrual basis, adjusted for amortization of premium or discount. Variable rate bonds and floating rate notes earn interest at coupon rates that fluctuate at specific time intervals. The interest rates shown in the Portfolio of Investments for the Bond, Income, Low Duration and Ready Reserves Portfolios were the rates in effect on June 30, 2011. Put bonds may be redeemed at the discretion of the holder on specified dates prior to maturity.
Premiums and discounts are accreted and amortized on a straight-line basis for short-term investments and on an effective interest method for long-term investments.
Paydown gains and losses on mortgage and asset-backed securities are treated as an adjustment to interest income. For the period ended June 30, 2011, the Bond, Income and Low Duration Portfolios recognized a reduction of interest
110 Semi-Annual Report | June 30, 2011 |
income and a decrease of net realized loss of $(390), $(261) and $(709), respectively (in thousands). This reclassification had no effect on the net asset value or the net assets of the Portfolios.
The Funds do not isolate that portion of the results of operations resulting from changes in foreign exchange rates on investments from the fluctuations arising from changes in market prices of securities held. Such fluctuations are included with the net realized and unrealized gain or loss from investments.
Reported net realized foreign currency gains or losses arise from disposition of foreign currency, the difference in the foreign exchange rates between the trade and settlement dates on securities transactions, and the difference between the amounts of dividends, interest and foreign withholding taxes recorded on the ex-date or accrual date and the U.S. dollar equivalent of the amounts actually received or paid. Net unrealized foreign exchange gains and losses arise from changes (due to the changes in the exchange rate) in the value of foreign currency and other assets and liabilities denominated in foreign currencies held at period end.
Security and shareholder transactions are accounted for no later than one business day following the trade date. However, for financial reporting purposes, security and shareholder transactions are accounted for on the trade date of the last business day of the reporting period. Realized gains and losses from securities transactions are recognized on a specifically identified cost basis.
(e) Share Valuation and Dividends to Shareholders
Shares are sold and redeemed on a continuous basis at net asset value. The net asset value per share is determined separately for each class by dividing the Portfolio’s net assets attributable to that class by the number of shares of the class outstanding as of the close of regular trading on the New York Stock Exchange (the “Exchange”), which is generally 4:00 p.m. Eastern time, on each day the Exchange is open. Redemption fees may be applicable to redemptions or exchanges within 60 days of purchase. For both Class N and Class I shares, the William Blair domestic equity portfolios assess a 1% redemption fee on shares sold or exchanged that have been owned 60 days or less and the William Blair global equity and international equity portfolios assess a 2% redemption fee on shares sold or exchanged that have been owned 60 days or less as disclosed within the Fund’s Prospectus. The redemption fees collected by the Portfolio are netted against the amount of redemptions for presentation on the Statement of Changes in Net Assets.
The redemption fees collected by the Portfolios were as follows (in thousands):
| | | | | | | | |
| | | Period Ended
June 30,
2011 | | | Year Ended
December 31,
2010 | |
Growth | | $ | 3 | | | $ | 10 | |
Large Cap Growth | | | — | | | | 1 | |
Small Cap Growth | | | 10 | | | | 78 | |
Mid Cap Growth | | | 4 | | | | 2 | |
Small-Mid Cap Growth | | | 4 | | | | — | |
Global Growth | | | — | | | | — | |
International Growth | | | 52 | | | | 149 | |
International Equity | | | 4 | | | | 7 | |
International Small Cap Growth | | | 7 | | | | 3 | |
Emerging Markets Growth | | | 4 | | | | 18 | |
Emerging Leaders Growth | | | — | | | | — | |
Small Cap Value | | | 33 | | | | 20 | |
Mid Cap Value | | | — | | | | — | |
Dividends from net investment income, if any, of the Growth, Large Cap Growth, Small Cap Growth, Mid Cap Growth, Small-Mid Cap Growth, Global Growth, International Growth, International Equity, International Small Cap Growth, Emerging Markets Growth, Emerging Leaders Growth, Small Cap Value and Mid Cap Value Portfolios are declared and paid at least annually. Dividends from the Income, Bond, Low Duration and Ready Reserves Portfolios are declared daily and paid monthly. Capital gain distributions, if any, are declared and paid at least annually in December. Dividends payable to shareholders are recorded on the ex-dividend date.
June 30, 2011 | William Blair Funds 111 |
(f) Foreign Currency Translation and Forward Foreign Currency Contracts
The Global Growth, International Growth, International Equity, International Small Cap Growth, Emerging Markets Growth and Emerging Leaders Growth Portfolios may invest in securities denominated in foreign currencies. As such, assets and liabilities denominated in foreign currencies are translated into U.S. dollar amounts at the current exchange rate on the date of valuation. The values of foreign investments, open forward foreign currency contracts, and cash denominated in foreign currencies are translated into U.S. dollars using a spot market rate of exchange as of the time of the determination of each Portfolio’s Net Asset Value, typically 4:00 p.m. Eastern time on days when there is regular trading on the New York Stock Exchange. Payables and receivables for securities transactions, dividends, interest income and tax reclaims are translated into U.S. dollars using a spot market rate of exchange as of 4:00 p.m. Eastern time. Settlement of purchases and sales and dividend and interest receipts are translated into U.S. dollars using a spot market rate of exchange as of 11:00 a.m. Eastern time.
(g) Income Taxes
Each Portfolio intends to comply with the provisions of Subchapter M of the Internal Revenue Code available to regulated investment companies. Each portfolio intends to make the requisite distributions of income and capital gains to its shareholders sufficient to relieve it from all, or substantially all, federal income and excise taxes. No provision for federal income and excise taxes has been made.
The Global Growth, International Growth, International Equity, International Small Cap Growth, Emerging Markets Growth and Emerging Leaders Growth Portfolios may be subject to a tax imposed on net realized gains on securities of certain foreign countries.
Each Portfolio is subject to the provisions of Accounting Standards Codification (“ASC”) 740, Income Taxes. ASC 740 provides guidance for how uncertain tax positions should be recognized, measured, presented and disclosed in the financial statements. Management has evaluated the implications of ASC 740 and all of the uncertain tax positions of the Portfolios and has determined that no liability is required to be recorded in the financial statements.
The statute of limitations on the Portfolios’ tax returns for each of the tax years in the four year period ended December 31, 2010, remains open and the returns are subject to examination.
The Global Growth, International Growth, International Equity, International Small Cap Growth, Emerging Markets Growth and Emerging Leaders Growth Portfolios have elected to mark-to-market their investments in Passive Foreign Investment Companies (“PFICs”) for federal income tax purposes. The Portfolios also treat the deferred loss associated with current and prior year wash sales as an adjustment to the cost of investments for tax purposes. The cost of investments for federal income tax purposes and related gross unrealized appreciation/(depreciation) and net unrealized appreciation/(depreciation) at June 30, 2011, were as follows (in thousands):
| | | | | | | | | | | | | | | | |
Portfolio | | Cost of
Investments | | | Gross
Unrealized
Appreciation | | | Gross
Unrealized
Depreciation | | | Net
Unrealized
Appreciation/
Depreciation | |
Growth | | $ | 526,569 | | | $ | 118,412 | | | $ | 11,836 | | | $ | 106,576 | |
Large Cap Growth | | | 22,491 | | | | 6,143 | | | | 343 | | | | 5,800 | |
Small Cap Growth | | | 651,552 | | | | 148,517 | | | | 38,014 | | | | 110,503 | |
Mid Cap Growth | | | 114,872 | | | | 29,727 | | | | 865 | | | | 28,862 | |
Small-Mid Cap Growth | | | 212,110 | | | | 54,780 | | | | 1,995 | | | | 52,785 | |
Global Growth | | | 38,710 | | | | 9,599 | | | | 515 | | | | 9,084 | |
International Growth | | | 3,922,154 | | | | 861,359 | | | | 84,633 | | | | 776,726 | |
International Equity | | | 97,122 | | | | 19,971 | | | | 719 | | | | 19,252 | |
International Small Cap Growth | | | 641,583 | | | | 124,962 | | | | 8,645 | | | | 116,317 | |
Emerging Markets Growth | | | 753,870 | | | | 127,720 | | | | 12,433 | | | | 115,287 | |
Emerging Leaders Growth | | | 89,549 | | | | 9,746 | | | | 853 | | | | 8,893 | |
Small Cap Value | | | 208,911 | | | | 23,310 | | | | 4,274 | | | | 19,036 | |
Mid Cap Value | | | 3,756 | | | | 400 | | | | 48 | | | | 352 | |
Bond | | | 193,902 | | | | 10,501 | | | | 440 | | | | 10,061 | |
Income | | | 91,479 | | | | 5,503 | | | | 653 | | | | 4,850 | |
Low Duration | | | 148,004 | | | | 918 | | | | 335 | | | | 583 | |
Ready Reserves | | | 1,261,134 | | | | 13 | | | | — | | | | 13 | |
112 Semi-Annual Report | June 30, 2011 |
The timing and characterization of certain income and capital gain distributions are determined annually in accordance with federal income tax regulations that may differ from U.S. generally accepted accounting principles. As a result, net investment income or loss and net realized gain or loss for a reporting period may differ from the amount distributed during such period. In addition, the Portfolios may periodically record reclassifications among certain capital accounts to reflect differences between financial reporting and income tax basis distributions. The reclassifications were reported in order to reflect the tax treatment for certain permanent differences that exist between income tax regulations and U.S. generally accepted accounting principles. The reclassifications generally relate to net operating losses, Section 988 currency gains and losses, PFICs gains and losses, recharacterization of dividends received from investments in REITs, expired capital loss carryforwards and redemptions in-kind. These reclassifications have no impact on the net asset values of the Portfolios. Accordingly, at December 31, 2010, (the Funds’ most recent fiscal year end) the following reclassifications were recorded (in thousands):
| | | | | | | | | | | | |
Portfolio | | Accumulated Net
Investment
Income (Loss) | | | Accumulated
Net Realized
Gain/(Loss) | | | Capital
Paid in Excess
of Par Value | |
Growth | | $ | — | | | $ | — | | | $ | — | |
Large Cap Growth | | | — | | | | 472 | | | | (472 | ) |
Small Cap Growth | | | 7,283 | | | | (6,138 | ) | | | (1,145 | ) |
Mid Cap Growth | | | 147 | | | | — | | | | (147 | ) |
Small-Mid Cap Growth | | | 871 | | | | — | | | | (871 | ) |
Global Growth | | | (51 | ) | | | 60 | | | | (9 | ) |
International Growth | | | 62,698 | | | | (62,698 | ) | | | — | |
International Equity | | | 173 | | | | (163 | ) | | | (10 | ) |
International Small Cap Growth | | | (849 | ) | | | 849 | | | | — | |
Emerging Markets Growth | | | 4,413 | | | | (33,541 | ) | | | 29,128 | |
Emerging Leaders Growth | | | (47 | ) | | | 51 | | | | (4 | ) |
Small Cap Value | | | 102 | | | | (30 | ) | | | (72 | ) |
Mid Cap Value | | | — | | | | — | | | | — | |
Bond | | | 516 | | | | (516 | ) | | | — | |
Income | | | 521 | | | | (517 | ) | | | (4 | ) |
Low Duration | | | 1,043 | | | | (1,043 | ) | | | — | |
Ready Reserves | | | 2 | | | | 930 | | | | (932 | ) |
Distributions from net realized gains for book purposes may include short-term capital gains, which are included as ordinary income for tax purposes. The tax character of distributions paid during 2010 and 2009 was as follows (in thousands):
| | | | | | | | | | | | | | | | | | | | | | | | |
| | | Distributions Paid in 2010 | | | Distributions Paid in 2009 | |
Portfolio | | Ordinary
Income | | | Long-Term
Capital Gains | | | Total
Distributions | | | Ordinary
Income | | | Long-Term
Capital Gains | | | Total
Distributions | |
Growth | | $ | 13 | | | $ | — | | | $ | 13 | | | $ | 43 | | | $ | — | | | $ | 43 | |
Large Cap Growth | | | 33 | | | | — | | | | 33 | | | | 16 | | | | — | | | | 16 | |
Small Cap Growth | | | — | | | | — | | | | — | | | | — | | | | — | | | | — | |
Mid Cap Growth | | | — | | | | — | | | | — | | | | — | | | | — | | | | — | |
Small-Mid Cap Growth | | | — | | | | — | | | | — | | | | — | | | | — | | | | — | |
Global Growth | | | 12 | | | | — | | | | 12 | | | | 3 | | | | — | | | | 3 | |
International Growth | | | 101,433 | | | | — | | | | 101,433 | | | | 31,541 | | | | — | | | | 31,541 | |
International Equity | | | 2,578 | | | | — | | | | 2,578 | | | | 1,449 | | �� | | — | | | | 1,449 | |
International Small Cap Growth | | | 2,781 | | | | — | | | | 2,781 | | | | 778 | | | | — | | | | 778 | |
Emerging Markets Growth | | | 13,461 | | | | — | | | | 13,461 | | | | 11,127 | | | | — | | | | 11,127 | |
Emerging Leaders Growth | | | 255 | | | | 505 | | | | 760 | | | | 1,588 | | | | — | | | | 1,588 | |
Small Cap Value | | | 269 | | | | 135 | | | | 404 | | | | 213 | | | | — | | | | 213 | |
Mid Cap Value | | | 26 | | | | — | | | | 26 | | | | N/A | | | | N/A | | | | N/A | |
Bond | | | 8,566 | | | | 494 | | | | 9,060 | | | | 6,213 | | | | — | | | | 6,213 | |
Income | | | 5,134 | | | | — | | | | 5,134 | | | | 6,533 | | | | — | | | | 6,533 | |
Low Duration | | | 2,958 | | | | — | | | | 2,958 | | | | 86 | | | | — | | | | 86 | |
Ready Reserves | | | 126 | | | | — | | | | 126 | | | | 1,639 | | | | — | | | | 1,639 | |
June 30, 2011 | William Blair Funds 113 |
As of December 31, 2010, the components of distributable earnings on a tax basis were as follows (in thousands):
| | | | | | | | | | | | | | | | |
Portfolio | | Undistributed
Ordinary
Income | | | Accumulated
Capital and
Other Losses | | | Undistributed
Long-Term
Capital Gain | | | Net
Unrealized
Appreciation/
Depreciation | |
Growth | | $ | 329 | | | $ | (7,557 | ) | | $ | — | | | $ | 100,567 | |
Large Cap Growth | | | — | | | | (6,323 | ) | | | — | | | | 7,409 | |
Small Cap Growth | | | — | | | | (87,410 | ) | | | — | | | | 122,724 | |
Mid Cap Growth | | | — | | | | (2,637 | ) | | | — | | | | 22,814 | |
Small-Mid Cap Growth | | | — | | | | — | | | | 401 | | | | 41,762 | |
Global Growth | | | — | | | | (22,357 | ) | | | — | | | | 10,705 | |
International Growth | | | 6,047 | | | | (1,421,884 | ) | | | — | | | | 980,202 | |
International Equity | | | — | | | | (116,060 | ) | | | — | | | | 38,334 | |
International Small Cap Growth | | | 5,932 | | | | (113,021 | ) | | | — | | | | 126,190 | |
Emerging Markets Growth | | | — | | | | (5,861 | ) | | | — | | | | 261,554 | |
Emerging Leaders Growth | | | 987 | | | | (14 | ) | | | 539 | | | | 16,644 | |
Small Cap Value | | | — | | | | — | | | | 1,617 | | | | 25,544 | |
Mid Cap Value | | | 21 | | | | — | | | | — | | | | 188 | |
Bond | | | 2 | | | | — | | | | 236 | | | | 9,803 | |
Income | | | — | | | | (41,771 | ) | | | — | | | | 5,707 | |
Low Duration | | | — | | | | (1,104 | ) | | | — | | | | (100 | ) |
Ready Reserves | | | 86 | | | | (23 | ) | | | — | | | | — | |
As of December 31, 2010, the Portfolios have unused capital loss carryforwards available for federal income tax purposes to be applied against future capital gains, if any. If not applied, the carryforwards will expire as follows (in thousands):
| | | | | | | | | | | | | | | | | | | | | | | | | | | | | | | | | | | | |
Portfolio | | 2011 | | | 2012 | | | 2013 | | | 2014 | | | 2015 | | | 2016 | | | 2017 | | | 2018 | | | Total | |
Growth | | $ | — | | | $ | — | | | $ | — | | | $ | — | | | $ | — | | | $ | — | | | $ | 7,557 | | | $ | — | | | $ | 7,557 | |
Large Cap Growth | | | 769 | | | | — | | | | — | | | | — | | | | — | | | | 1,709 | | | | 3,845 | | | | — | | | | 6,323 | |
Small Cap Growth | | | — | | | | — | | | | — | | | | — | | | | — | | | | — | | | | 72,368 | | | | — | | | | 72,368 | |
Mid Cap Growth | | | — | | | | — | | | | — | | | | — | | | | — | | | | — | | | | 2,638 | | | | — | | | | 2,638 | |
Small-Mid Cap Growth | | | — | | | | — | | | | — | | | | — | | | | — | | | | — | | | | — | | | | — | | | | — | |
Global Growth | | | — | | | | — | | | | — | | | | — | | | | — | | | | 9,230 | | | | 13,127 | | | | — | | | | 22,357 | |
International Growth | | | — | | | | — | | | | — | | | | — | | | | — | | | | 224,515 | | | | 1,198,096 | | | | — | | | | 1,422,611 | |
International Equity | | | — | | | | — | | | | — | | | | — | | | | — | | | | 34,279 | | | | 81,926 | | | | — | | | | 116,205 | |
International Small Cap Growth | | | — | | | | — | | | | — | | | | — | | | | — | | | | 26,723 | | | | 86,330 | | | | — | | | | 113,053 | |
Emerging Markets Growth | | | — | | | | — | | | | — | | | | — | | | | — | | | | — | | | | 5,572 | | | | — | | | | 5,572 | |
Emerging Leaders Growth | | | — | | | | — | | | | — | | | | — | | | | — | | | | — | | | | — | | | | — | | | | — | |
Small Cap Value | | | — | | | | — | | | | — | | | | — | | | | — | | | | — | | | | — | | | | — | | | | — | |
Mid Cap Value | | | — | | | | — | | | | — | | | | — | | | | — | | | | — | | | | — | | | | — | | | | — | |
Bond | | | — | | | | — | | | | — | | | | — | | | | — | | | | — | | | | — | | | | — | | | | — | |
Income | | | 1,578 | | | | 4,431 | | | | 3,398 | | | | 4,138 | | | | 9,190 | | | | 14,459 | | | | 4,577 | | | | — | | | | 41,771 | |
Low Duration | | | — | | | | — | | | | — | | | | — | | | | — | | | | — | | | | — | | | | 955 | | | | 955 | |
Ready Reserves | | | — | | | | 20 | | | | — | | | | — | | | | 3 | | | | — | | | | — | | | | — | | | | 23 | |
114 Semi-Annual Report | June 30, 2011 |
For the period from November 1, 2010 through December 31, 2010, the following Portfolios incurred net realized capital losses or foreign currency losses. Each Portfolio intends to treat this loss as having occurred in fiscal year 2011 for federal income tax purposes (in thousands):
| | | | | | | | |
Portfolio | | Capital
Amount | | | Currency
Amount | |
Growth | | $ | — | | | $ | — | |
Large Cap Growth | | | — | | | | — | |
Small Cap Growth | | | 15,042 | | | | — | |
Mid Cap Growth | | | — | | | | — | |
Small-Mid Cap Growth | | | — | | | | — | |
Global Growth | | | — | | | | 2 | |
International Growth | | | — | | | | — | |
International Equity | | | — | | | | — | |
International Small Cap Growth | | | — | | | | — | |
Emerging Markets Growth | | | — | | | | 324 | |
Emerging Leaders Growth | | | — | | | | — | |
Small Cap Value | | | — | | | | — | |
Mid Cap Value | | | — | | | | — | |
Bond | | | — | | | | — | |
Income | | | — | | | | — | |
Low Duration | | | 149 | | | | — | |
Ready Reserves | | | — | | | | — | |
(h) Repurchase Agreements
In a repurchase agreement, a Portfolio buys a security at one price and at the time of sale, the seller agrees to repurchase the obligation at a mutually agreed upon time and price (usually within seven days). The repurchase agreement thereby determines the yield during the purchaser’s holding period, while the seller’s obligation to repurchase is secured by the value of the underlying security. William Blair & Company, L.L.C. (“William Blair” or the “Advisor”) will monitor, on an ongoing basis, the value of the underlying securities to ensure that the value always equals or exceeds the repurchase price plus accrued interest. Repurchase agreements could involve certain risks in the event of a default or insolvency of the other party to the agreement, including possible delays or restrictions upon a Portfolio’s ability to dispose of the underlying securities. The risk to a Portfolio is limited to the ability of the seller to pay the agreed upon sum on the delivery date. In the event of default, a repurchase agreement provides that a Portfolio is entitled to sell the underlying collateral. The loss, if any, to a Portfolio will be the difference between the proceeds from the sale and the repurchase price. However, if bankruptcy proceedings are commenced with respect to the seller of the security, disposition of the collateral by the Portfolio may be delayed or limited. Although no definitive creditworthiness criteria are used, the Advisor reviews the creditworthiness of the banks and non-bank dealers with which a Portfolio enters into repurchase agreements to evaluate those risks. A Portfolio may, for tax purposes, deem repurchase agreements collateralized by U.S. Government securities to be investments in U.S. Government securities.
(i) Use of Estimates
The preparation of financial statements in conformity with U.S. generally accepted accounting principles requires management to make estimates and assumptions that affect the amounts reported in the financial statements. Actual results may differ from those estimates.
(j) Fair Value Measurements
The Portfolios are subject to ASC 820, Fair Value measurement and Disclosures. In accordance with ASC 820, “fair value” is defined as the price that a Portfolio would receive upon selling a security in an orderly transaction to an independent buyer in the principal or most advantageous market for the investment. Various inputs are used in determining the value of a Portfolio’s investments. ASC 820 establishes a three-tier hierarchy of inputs to classify fair value measurements for disclosure purposes. The three-tier hierarchy of inputs is summarized in the three broad levels listed below.
| | • | | Level 1—Quoted prices in active markets for an identical security. |
| | • | | Level 2—Prices determined using other significant observable inputs. Observable inputs are inputs that other market participants would use in pricing a security. These may include quoted prices for similar securities, interest rates, prepayment speeds, credit risk, and others. In addition, other observable inputs such as foreign exchange rates, |
June 30, 2011 | William Blair Funds 115 |
| | benchmark securities indices and foreign futures contracts may be utilized in the valuation of certain foreign securities when significant events occur between the last sale on the foreign securities exchange and the time the net asset value of the Portfolio is calculated. |
| | • | | Level 3—Prices determined using significant unobservable inputs. In situations where quoted prices or observable inputs are unavailable (for example, when there is little or no market activity for an investment), unobservable inputs may be used. Unobservable inputs reflect the Portfolio’s own assumptions about the factors market participants would use in pricing an investment, and would be based on the best information available. |
The inputs or methodology used for valuing an investment are not necessarily an indication of the risk associated with investing in those securities. For example, money market securities are valued using amortized cost, in accordance with rules under the 1940 Act. Generally, amortized cost approximates the current fair value of a security, but since the value is not obtained from a quoted price in an active market, such securities are reflected as Level 2.
Any transfers between Level 1 and Level 2 are disclosed, effective beginning of the period, in the tables below with the reasons for the transfers disclosed in a note to the tables, if applicable.
At June 30, 2011, the Portfolios held no other financial instruments, such as options or futures, that required fair valuation.
As of June 30, 2011, the hierarchical input levels of securities in each Portfolio, segregated by security class, are as follows (in thousands):
| | | | | | | | | | | | | | | | | | | | | | | | |
| | | Growth | | | Large Cap
Growth | | | Small Cap
Growth | | | Mid Cap
Growth | | | Small-
Mid Cap
Growth | | | Global
Growth | |
Investments in securities | | | | | �� | | | | | | | | | | | | | | | | | | | |
Level 1—Quoted prices | | | | | | | | | | | | | | | | | | | | | | | | |
Common Stocks | | $ | 622,795 | | | $ | 27,632 | | | $ | 734,180 | | | $ | 140,235 | | | $ | 262,775 | | | $ | 47,342 | |
Exchange Traded Funds | | | — | | | | — | | | | 22,748 | | | | — | | | | — | | | | — | |
Level 2—Other significant observable inputs | | | | | | | | | | | | | | | | | | | | | | | | |
Warrants | | | — | | | | — | | | | 1 | | | | — | | | | — | | | | — | |
Short-Term Investments | | | 10,350 | | | | 659 | | | | 5,126 | | | | 3,499 | | | | 2,120 | | | | 450 | |
Level 3—Significant unobservable inputs | | | | | | | | | | | | | | | | | | | | | | | | |
None | | | — | | | | — | | | | — | | | | — | | | | — | | | | — | |
| | | | | | | | | | | | | | | | | | | | | | | | |
Total investments in securities | | $ | 633,145 | | | $ | 28,291 | | | $ | 762,055 | | | $ | 143,734 | | | $ | 264,895 | | | $ | 47,792 | |
| | | | | | | | | | | | | | | | | | | | | | | | |
116 Semi-Annual Report | June 30, 2011 |
| | | | | | | | | | | | | | | | | | | | | | | | | | | | |
| | | International
Growth | | | International
Equity | | | International
Small Cap
Growth | | | Emerging
Markets
Growth | | | Emerging
Leaders
Growth | | | Small Cap
Value | | | Mid Cap
Value | |
Investments in securities | | | | | | | | | | | | | | | | | | | | | | | | | | | | |
Level 1—Quoted prices | | | | | | | | | | | | | | | | | | | | | | | | | | | | |
Common Stocks | | $ | 4,584,629 | | | $ | 108,409 | | | $ | 736,120 | | | $ | 840,987 | | | $ | 94,136 | | | $ | 222,025 | | | $ | 3,958 | |
Preferred Stocks | | | — | | | | 1,299 | | | | — | | | | 27,098 | | | | 4,126 | | | | — | | | | — | |
Exchange Traded Funds | | | 38,468 | | | | — | | | | — | | | | — | | | | — | | | | — | | | | — | |
Rights | | | — | | | | — | | | | 37 | | | | 43 | | | | — | | | | — | | | | — | |
Level 2—Other significant observable inputs | | | | | | | | | | | | | | | | | | | | | | | | | | | | |
Convertible Bonds | | | 1,893 | | | | — | | | | 632 | | | | 1,055 | | | | — | | | | — | | | | — | |
Short-Term Investments | | | 68,519 | | | | 6,708 | | | | 21,114 | | | | — | | | | 174 | | | | 5,922 | | | | 150 | |
Level 3—Significant unobservable inputs None | | | — | | | | — | | | | — | | | | — | | | | — | | | | — | | | | — | |
| | | | | | | | | | | | | | | | | | | | | | | | | | | | |
Total investments in securities | | $ | 4,693,509 | | | $ | 116,416 | | | $ | 757,903 | | | $ | 869,140 | | | $ | 98,436 | | | $ | 227,947 | | | $ | 4,108 | |
| | | | | | | | | | | | | | | | | | | | | | | | | | | | |
Other financial instruments — Assets | | | | | | | | | | | | | | | | | | | | | | | | | | | | |
Level 2—Other significant observable inputs | | | | | | | | | | | | | | | | | | | | | | | | | | | | |
Forward foreign currency contracts | | $ | 6,120 | | | | — | | | | — | | | | — | | | | — | | | | — | | | | | |
| | | | | | | | | | | | | | | | | | | | | | | | | | | | |
Other financial instruments — Liabilities | | | | | | | | | | | | | | | | | | | | | | | | | | | | |
Level 2—Other significant observable inputs | | | | | | | | | | | | | | | | | | | | | | | | | | | | |
Forward foreign currency contracts | | $ | 2,037 | | | $ | 14 | | | $ | 30 | | | | — | | | | — | | | | — | | | | | |
| | | | | | | | | | | | | | | | | | | | | | | | | | | | |
| | | | | | | |
| | | Bond | | | Income | | | Low Duration | | | Ready
Reserves* | | | | | | | | | | |
Investments in securities | | | | | | | | | | | | | | | | | | | | | | | | | | | | |
Level 1—Quoted Prices | | | | | | | | | | | | | | | | | | | | | | | | | | | | |
None | | $ | — | | | $ | — | | | $ | — | | | $ | — | | | | | | | | | | | | | |
Level 2—Other significant observable inputs | | | | | | | | | | | | | | | | | | | | | | | | | | | | |
US Government and Agency Bonds | | | 99,717 | | | | 39,678 | | | | 68,906 | | | | 97,602 | | | | | | | | | | | | | |
Foreign Government Notes | | | | | | | | | | | | | | | 7,000 | | | | | | | | | | | | | |
Corporate Bonds | | | 92,816 | | | | 45,192 | | | | 18,858 | | | | 142,695 | | | | | | | | | | | | | |
Asset Backed Bonds | | | 8,995 | | | | 8,014 | | | | 57,580 | | | | | | | | | | | | | | | | | |
Commercial Paper | | | — | | | | — | | | | — | | | | 780,641 | | | | | | | | | | | | | |
Short-Term Investments | | | 2,256 | | | | 2,481 | | | | 3,243 | | | | 233,209 | | | | | | | | | | | | | |
Level 3—Significant unobservable inputs | | | | | | | | | | | | | | | | | | | | | | | | | | | | |
Asset Backed Bonds | | | 179 | | | | 964 | | | | — | | | | — | | | | | | | | | | | | | |
| | | | | | | | | | | | | | | | | | | | | | | | | | | | |
Total investments in securities | | $ | 203,963 | | | $ | 96,329 | | | $ | 148,587 | | | $ | 1,261,147 | | | | | | | | | | | | | |
| | | | | | | | | | | | | | | | | | | | | | | | | | | | |
| * | All of the investments held by Ready Reserves are short-term investments. |
Level 1 Common Stocks are exchange-traded securities with a quoted price. See Portfolio of Investments for Sector Classification.
June 30, 2011 | William Blair Funds 117 |
The following is a reconciliation of Level 3 securities for which significant unobservable inputs were used to determine fair value:
| | | | | | | | | | | | | | | | | | | | | | | | | | | | | | | | |
| | | Balance
January 1, 2011 | | | Purchases | | | Sales | | | Transfers to Level 3 | | | Transfers
from
Level 3 | | | Change in
Unrealized
Gain (Loss) | | | Realized
Gain (Loss) | | | Balance
June 30, 2011 | |
Small Cap Growth | | $ | 1,109 | | | $ | — | | | $ | — | | | | — | | | $ | (1,109 | ) | | $ | — | | | $ | — | | | $ | — | |
Bond | | | 170 | | | | — | | | | — | | | | — | | | | — | | | | 9 | | | | — | | | | 179 | |
Income | | | 918 | | | | — | | | | — | | | | — | | | | — | | | | 46 | | | | — | | | | 964 | |
The fair value estimates for the Level 3 securities in the Bond and Income Portfolios were determined in good faith by the Pricing Committee in consultation with the Valuation Committee, pursuant to the Valuation Procedures adopted by the Board of Trustees. There were various factors considered in reaching this fair value determination, including, but not limited to, the following: the type of security, the extent of public trading of the security, information obtained from a broker-dealer for the security, analysis of the company’s performance, market trends that influence its performance and the potential for an adverse outcome in pending litigation. At June 30, 2011, these securities represented 0.09% and 1.01% of the net assets of the Bond and Income Portfolios, respectively. The change in unrealized gain (loss) related to those securities held at June 30, 2011 was $55, in thousands, and is included in the change in net unrealized appreciation (depreciation) of investments on the Statement of Operations.
Vitacost.com held in the Small Cap Growth Portfolio moved from Level 3 to Level 1 due to a change in observable inputs. The First Plus Home Loan Trust bonds held in the Bond and Income Portfolios remained in Level 3 during the period due to the lack of significant other observable inputs.
(k) Redemptions In-Kind
In accordance with the Fund’s prospectus, the Portfolios may distribute portfolio securities rather than cash as payment for a redemption of fund shares (in-kind redemption). For financial reporting purposes, the Portfolio recognizes a gain or loss on the transfer of securities depending on the market value of those securities on the date of redemption. Gains and losses realized on in-kind redemptions are not recognized for tax purposes and are reclassified from undistributed realized gain (loss) to paid-in capital. During the period ended June 30, 2011, the Emerging Markets Growth Portfolio redeemed in-kind (in thousands) $91,525, with a realized gain of $20,249.
(2) Accounting Pronouncement and Regulations
On December 22, 2010, the Regulated Investment Company Modernization Act of 2010 (the “Act”) was enacted, which changed various technical rules governing the tax treatment of regulated investment companies. The changes are generally effective for taxable years beginning after the date of enactment. One of the more prominent changes addresses capital loss carryforwards. Under the Act, each fund will be permitted to carry forward capital losses incurred in taxable years beginning after the date of enactment for an unlimited period. However, any losses incurred during those future taxable years will be required to be utilized prior to the losses incurred in pre-enactment taxable years, which carry an expiration date. As a result of this ordering rule, pre-enactment capital loss carryforwards may be more likely to expire unused. Additionally, post-enactment capital loss carryforwards will retain their character as either short-term or long-term capital losses rather than being considered all short-term as permitted under previous regulation.
In April 2011, the FASB issued ASU 2011-03 Reconsideration of Effective Control for Repurchase Agreements. ASU 2011-03 amends ASC 860, Transfers and Servicing, in relation to the accounting for repurchase agreements and similar agreements that both entitle and obligate a transferor to repurchase or redeem financial assets before their maturity. ASU 2011-03 modifies the criteria for determining effective control of transferred assets and as a result certain agreements may not be accounted for as secured borrowings. ASU 2011-03 is effective prospectively for new transfers and existing transitions that are modified in the first interim or annual period beginning on or after December 15, 2011. At this time, management is evaluating the implication of this change and its impact on the financial statements has not been determined.
On May 12, 2011, the Financial Accounting Standards Board (“FASB”) issued Accounting Standard Update (“ASU”) 2011-04, modifying Topic 820, Fair Value Measurements and Disclosures. The ASU requires reporting entities to disclose (i) the amounts of any transfers between Level 1 and Level 2, and the reasons for the transfers, (ii) for Level 3 fair value measurements, quantitative information about significant unobservable inputs used, (iii) a description of the valuation processes used by the reporting entity and, (iv) a narrative description of the sensitivity of the fair value measurement to changes in unobservable inputs if a change in those inputs might result in a significantly higher or lower fair value measurement. The effective date of ASU 2011-04 is for interim and annual periods beginning after December 15, 2011. At this time, management is evaluating the implication of this change and its impact on the financial statements has not been determined.
118 Semi-Annual Report | June 30, 2011 |
(3) Transactions with Affiliates
(a) Management and Expense Limitation Agreements
Each Portfolio has a management agreement with the “Advisor” for investment advisory, clerical, bookkeeping and administrative services. Each Portfolio pays the Advisor an annual fee, payable monthly, based on a specified percentage of its average daily net assets. A summary of the annual rates expressed as a percentage of average daily net assets is as follows:
| | | | | | | | | | |
Equity Portfolios | | | | | International Portfolios | | | |
Growth | | | 0.75 | % | | International Growth: | | | | |
Large Cap Growth | | | 0.80 | % | | First $250 million | | | 1.10 | % |
Small Cap Growth | | | 1.10 | % | | Next $4.75 billion | | | 1.00 | % |
Mid Cap Growth | | | 0.95 | % | | Next $5 billion | | | 0.95 | % |
Small-Mid Cap Growth | | | 1.00 | % | | Next $5 billion | | | 0.925 | % |
Small Cap Value | | | 1.10 | % | | In excess of $15 billion | | | 0.90 | % |
Mid Cap Value | | | 0.95 | % | | International Equity | | | | |
| | | | | | First $250 million | | | 1.10 | % |
Global Portfolio | | | | | | In excess of $250 million | | | 1.00 | % |
Global Growth | | | 1.00 | % | | International Small Cap Growth | | | 1.00 | % |
| | | | | | Emerging Markets Growth | | | 1.10 | % |
| | | | | | Emerging Leaders Growth | | | 1.10 | % |
| | | |
Fixed-Income Portfolios | | | | | Money Market Portfolio | | | |
Bond | | | 0.30 | % | | Ready Reserves | | | | |
Low Duration | | | 0.30 | % | | First $250 million | | | 0.275 | % |
Income* | | | | | | Next $250 million | | | 0.250 | % |
First $250 million | | | 0.25 | % | | Next $2 billion | | | 0.225 | % |
In excess of $250 million | | | 0.20 | % | | In excess of $2.5 billion | | | 0.200 | % |
| | | | | | | | | | |
*Management fee also includes a charge of 5% of gross income. | | | | | | | | | | |
Some of the Portfolios have also entered into an Expense Limitation Agreement with the Advisor. Under the terms of the Agreement, the Advisor will waive its management fee and/or reimburse the Portfolio for expenses in excess of the agreed upon rate. The amount the Advisor owes a Portfolio as of the reporting date is recorded as the Receivable from Advisor on the Statement of Assets and Liabilities. The Advisor reimburses the Portfolios on a monthly basis. Under the terms of the Agreement, the Advisor has agreed to waive its advisory fees and/or absorb other operating expenses through April 30, 2012, if total expenses for each class of the following Portfolios exceed the following rates (as a percentage of average daily net assets):
| | | | | | | | | | | | | | | | |
| | | Class N | | | | | | Class I | | | | |
Portfolio | | Effective
May 1, 2011
through
April 30, 2012 | | | Effective
May 1, 2010
through
April 30, 2011 | | | Effective
May 1, 2011
through
April 30, 2012 | | | Effective
May 1, 2010
through
April 30, 2011 | |
Large Cap Growth | | | 1.20 | % | | | 1.20 | % | | | 0.95 | % | | | 0.95 | % |
Small Cap Growth | | | 1.50 | % | | | 1.50 | % | | | 1.25 | % | | | 1.25 | % |
Mid Cap Growth | | | 1.35 | % | | | 1.35 | % | | | 1.10 | % | | | 1.10 | % |
Small-Mid Cap Growth | | | 1.35 | % | | | 1.35 | % | | | 1.10 | % | | | 1.10 | % |
Global Growth | | | 1.50 | % | | | 1.50 | % | | | 1.25 | % | | | 1.25 | % |
International Growth | | | 1.45 | % | | | 1.45 | % | | | 1.20 | % | | | 1.20 | % |
International Equity | | | 1.45 | % | | | 1.45 | % | | | 1.20 | % | | | 1.20 | % |
International Small Cap Growth | | | 1.65 | % | | | 1.65 | % | | | 1.40 | % | | | 1.40 | % |
Emerging Markets Growth | | | 1.70 | % | | | 1.70 | % | | | 1.45 | % | | | 1.45 | % |
Emerging Leaders Growth | | | 1.65 | % | | | 1.65 | % | | | 1.40 | % | | | 1.40 | % |
Small Cap Value | | | 1.40 | % | | | 1.35 | % | | | 1.15 | % | | | 1.10 | % |
Mid Cap Value | | | 1.35 | % | | | 1.35 | % | | | 1.10 | % | | | 1.10 | % |
Bond | | | 0.65 | % | | | 0.65 | % | | | 0.50 | % | | | 0.50 | % |
Income | | | 0.85 | % | | | 0.85 | % | | | 0.70 | % | | | 0.70 | % |
Low Duration | | | 0.70 | % | | | 0.70 | % | | | 0.55 | % | | | 0.55 | % |
June 30, 2011 | William Blair Funds 119 |
For a period of three years subsequent to the commencement of operations of the Mid Cap Value and Low Duration Portfolios, the Advisor is entitled to reimbursement for previously waived fees and reimbursed expenses to the extent the overall expense ratio remains below the expense limitation in place at the time the fee was waived and/or the expense was reimbursed. The total amount available for recapture at June 30, 2011 was $139 (in thousands) for the Mid Cap Value Portfolio and $144 for the Low Duration Portfolio.
The Advisor has agreed to voluntarily waive fees and reimburse expenses incurred for the Ready Reserves Portfolio in order to maintain a minimum yield given the current interest rate environment.
For the period ended June 30, 2011, the fees incurred by the Portfolios and related fee waivers and/or reimbursements were as follows (in thousands):
| | | | | | | | | | | | | | | | |
Portfolio | | Fund
Level
Waiver | | | Class I
Specific
Waiver | | | Class N
Specific
Waiver | | | Total
Waiver | |
Growth | | $ | — | | | $ | — | | | $ | — | | | $ | — | |
Large Cap Growth | | | 32 | | | | 1 | | | | 4 | | | | 37 | |
Small Cap Growth | | | — | | | | 162 | | | | 136 | | | | 298 | |
Mid Cap Growth | | | — | | | | 14 | | | | 7 | | | | 21 | |
Small-Mid Cap Growth | | | — | | | | 6 | | | | 14 | | | | 20 | |
Global Growth | | | 68 | | | | 1 | | | | 1 | | | | 70 | |
International Growth | | | — | | | | — | | | | — | | | | — | |
International Equity | | | 24 | | | | 53 | | | | 7 | | | | 84 | |
International Small Cap Growth | | | — | | | | — | | | | — | | | | — | |
Emerging Markets Growth | | | — | | | | — | | | | — | | | | — | |
Emerging Leaders Growth | | | 70 | | | | — | | | | — | | | | 70 | |
Small Cap Value | | | 99 | | | | 35 | | | | 18 | | | | 152 | |
Mid Cap Value | | | 51 | | | | — | | | | — | | | | 51 | |
Bond | | | 48 | | | | 5 | | | | 2 | | | | 55 | |
Income | | | — | | | | — | | | | 16 | | | | 16 | |
Low Duration | | | 31 | | | | 1 | | | | — | | | | 32 | |
Ready Reserves | | | 2,731 | | | | — | | | | — | | | | 2,731 | |
(b) Underwriting, Distribution Services and Service Agreement
Each Portfolio, except the Ready Reserves Portfolio, has a Distribution Agreement with William Blair for distribution services to the Portfolios’ Class N shares. Each Portfolio pays William Blair an annual fee, payable monthly, based on a specified percentage of its average daily net assets of Class N shares. The annual rate expressed as a percentage of average daily net assets for Class N is 0.25% for all Portfolios except the Income, Bond and Low Duration Portfolios, which is 0.15%. Pursuant to the Distribution Agreement, William Blair enters into related selling group agreements with various firms at various rates for sales of the Portfolios’ Class N shares.
The Ready Reserves Portfolio has a Service Agreement with William Blair to provide shareholder services and automatic sweep services. The Portfolio pays William Blair an annual fee, payable monthly, based upon 0.35% of the average daily net assets of Class N shares. The Board of Trustees has determined that the amount payable for “service fees” (as defined by FINRA (Financial Industry Regulatory Authority)) will not exceed 0.25% of the average annual net assets attributable to Class N shares.
The Global Growth, International Small Cap Growth, Emerging Markets Growth, Emerging Leaders Growth, Bond and Low Duration Portfolios have a Shareholder Administration Agreement with William Blair to provide shareholder administration services. Class N and Class I shares of the Portfolios pay William Blair an annual fee, payable monthly, based upon 0.15% of average daily net assets attributable to each class, respectively. For the period ended June 30, 2011, the following fees were incurred (in thousands):
| | | | | | | | | | | | |
Portfolio | | Class N | | | Class I | | | Total | |
Global Growth | | $ | 4 | | | $ | 31 | | | $ | 35 | |
International Small Cap Growth | | | 17 | | | | 296 | | | | 313 | |
Emerging Markets Growth | | | 23 | | | | 141 | | | | 164 | |
Emerging Leaders Growth | | | — | | | | 18 | | | | 18 | |
Bond | | | 4 | | | | 109 | | | | 113 | |
Low Duration | | | 5 | | | | 59 | | | | 64 | |
120 Semi-Annual Report | June 30, 2011 |
(4) Investment Transactions
Investment transactions, excluding money market instruments, repurchase agreements and demand notes for the period ended June 30, 2011, were as follows (in thousands):
| | | | | | | | |
Portfolio | | Purchases | | | Sales | |
Growth | | $ | 256,293 | | | $ | (184,778 | ) |
Large Cap Growth | | | 10,593 | | | | (15,675 | ) |
Small Cap Growth | | | 368,579 | | | | (485,169 | ) |
Mid Cap Growth | | | 56,738 | | | | (28,758 | ) |
Small-Mid Cap Growth | | | 125,991 | | | | (96,468 | ) |
Global Growth | | | 21,640 | | | | (20,315 | ) |
International Growth | | | 2,528,393 | | | | (2,934,198 | ) |
International Equity | | | 80,141 | | | | (145,994 | ) |
International Small Cap Growth | | | 372,888 | | | | (304,131 | ) |
Emerging Markets Growth | | | 571,199 | | | | (879,959 | ) |
Emerging Leaders Growth | | | 105,072 | | | | (98,650 | ) |
Small Cap Value | | | 120,603 | | | | (64,658 | ) |
Mid Cap Value | | | 1,830 | | | | (1,432 | ) |
Bond | | | 52,814 | | | | (40,488 | ) |
Income | | | 15,682 | | | | (32,420 | ) |
Low Duration | | | 59,628 | | | | (50,537 | ) |
(5) Forward Foreign Currency Contracts
The Global Growth, International Growth, International Equity, International Small Cap Growth, Emerging Markets Growth and Emerging Leaders Growth Portfolios from time to time may enter into forward foreign currency contracts with the Fund’s custodian and other counterparties in an attempt to hedge against a decline in the value of foreign currency against the U.S. dollar. The Portfolios bear the market risk that arises from changes in foreign currency rates and bear the credit risk if the counterparty fails to perform under the contract.
For the period ended June 30, 2011, the International Growth, International Equity, and International Small Cap Growth Portfolios engaged in forward foreign currency contracts with notional volume (in thousands) of $8,085,193, $69,682 and $222,182, respectively.
The following tables present the value of forward foreign currency contracts as of June 30, 2011 and their respective location on the Statement of Assets and Liabilities (values in thousands):
| | | | | | | | | | | | |
| | | Assets | | | Liabilities | |
Portfolio | | Statement of Assets and
Liabilities Location | | Value | | | Statement of Assets and
Liabilities Location | | Value | |
International Growth | | Unrealized appreciation on foreign forward currency contracts | | $ | 6,120 | | | Unrealized depreciation on foreign forward currency contracts | | $ | 2,037 | |
International Equity | | Unrealized appreciation on foreign forward currency contracts | | | — | | | Unrealized depreciation on foreign forward currency contracts | | | 14 | |
International Small Cap Growth | | Unrealized appreciation on foreign forward currency contracts | | | — | | | Unrealized depreciation on foreign forward currency contracts | | | 30 | |
The effect of forward contracts on the Statements of Operations for the period ended June 30, 2011 (values in thousands) are as follows:
| | | | |
Realized gain (loss) recognized in foreign currency transactions | | | |
Portfolio | | Value | |
International Growth | | $ | (32,492 | ) |
International Equity | | | (163 | ) |
International Small Cap Growth | | | 2,660 | |
| |
Change in unrealized gain (loss) recognized in foreign currency translations | | | |
Portfolio | | Value | |
International Growth | | $ | 4,083 | |
International Equity | | | 121 | |
International Small Cap Growth | | | (30 | ) |
June 30, 2011 | William Blair Funds 121 |
The following table presents open forward foreign currency contracts as of June 30, 2011 (values in thousands):
| | | | | | | | | | | | | | | | | | |
International Growth | | | | | | | | | | | | | | |
Counterparty | | Short Contracts | | Settlement
Date | | | Local
Currency | | | Current
Value | | | Unrealized
Gain/(Loss) | |
State Street Bank and Trust | | Canadian Dollar | | | 9/22/2011 | | | | 66,909 | | | $ | 69,239 | | | $ | (1,082 | ) |
Northern Trust Corporation | | Swiss Franc | | | 9/20/2011 | | | | 54,801 | | | | 65,213 | | | | (15 | ) |
State Street Bank and Trust | | European Monetary Unit | | | 9/19/2011 | | | | 229,686 | | | | 332,366 | | | | (940 | ) |
Morgan Stanley and Company | | Great British Pound | | | 9/23/2011 | | | | 195,317 | | | | 313,169 | | | | 5,755 | |
Bank of New York | | Japanese Yen | | | 9/21/2011 | | | | 30,382,242 | | | | 377,561 | | | | 365 | |
| | | | | |
International Equity | | | | | | | | | | | | | | |
Counterparty | | Short Contracts | | Settlement
Date | | | Local
Currency | | | Current
Value | | | Unrealized
Gain/(Loss) | |
Northern Trust Corporation | | Japanese Yen | | | 7/20/2011 | | | | 435,304 | | | | 5,408 | | | | (14 | ) |
| | | | | |
International Small Cap Growth | | | | | | | | | | | | | | |
Counterparty | | Short Contracts | | Settlement
Date | | | Local
Currency | | | Current
Value | | | Unrealized
Gain/(Loss) | |
Northern Trust Corporation | | Swiss Franc | | | 9/20/2011 | | | | 2,402 | | | | 2,858 | | | | (9 | ) |
Bank of New York | | Japanese Yen | | | 9/21/2011 | | | | 2,314,926 | | | | 28,768 | | | | (21 | ) |
(6) Fund Share Transactions
| | | | | | | | | | | | | | | | | | | | | | | | |
| | | Sales (Dollars) | |
| | | Period Ended June 30, 2011 | | | Year Ended December 31, 2010 | |
Portfolio | | Class N | | | Class I | | | Total | | | Class N | | | Class I | | | Total | |
Growth | | $ | 53,599 | | | $ | 34,883 | | | $ | 88,482 | | | $ | 68,365 | | | $ | 107,997 | | | $ | 176,362 | |
Large Cap Growth | | | 616 | | | | 1,706 | | | | 2,322 | | | | 1,142 | | | | 1,935 | | | | 3,077 | |
Small Cap Growth | | | 16,906 | | | | 38,825 | | | | 55,731 | | | | 108,310 | | | | 256,285 | | | | 364,595 | |
Mid Cap Growth | | | 3,771 | | | | 37,070 | | | | 40,841 | | | | 2,798 | | | | 21,591 | | | | 24,389 | |
Small Mid-Cap Growth | | | 4,238 | | | | 45,401 | | | | 49,639 | | | | 3,028 | | | | 48,275 | | | | 51,303 | |
Global Growth | | | 236 | | | | 2,489 | | | | 2,725 | | | | 1,046 | | | | 3,798 | | | | 4,844 | |
International Growth | | | 127,675 | | | | 313,670 | | | | 441,345 | | | | 876,749 | | | | 621,840 | | | | 1,498,589 | |
International Equity | | | 612 | | | | 19,495 | | | | 20,107 | | | | 1,093 | | | | 58,750 | | | | 59,843 | |
International Small Cap Growth | | | 2,616 | | | | 101,266 | | | | 103,882 | | | | 7,838 | | | | 138,435 | | | | 146,273 | |
Emerging Markets Growth | | | 1,041 | | | | 15,357 | | | | 16,398 | | | | 6,588 | (a) | | | 51,960 | | | | 58,548 | |
Emerging Leaders Growth | | | 28 | | | | 17,560 | | | | 17,588 | | | | 49 | | | | 11,564 | | | | 11,613 | |
Small Cap Value | | | 30,938 | | | | 70,816 | | | | 101,754 | | | | 24,765 | | | | 67,703 | | | | 92,468 | |
Mid Cap Value | | | 67 | | | | 702 | | | | 769 | | | | 4 | (b) | | | 3,158 | (b) | | | 3,162 | (b) |
Bond | | | 902 | | | | 20,326 | | | | 21,228 | | | | 1,759 | | | | 65,749 | | | | 67,508 | |
Income | | | 2,975 | | | | 1,773 | | | | 4,748 | | | | 8,860 | | | | 6,525 | | | | 15,385 | |
Low Duration | | | 1,085 | | | | 24,582 | | | | 25,667 | | | | 6,671 | | | | 77,708 | | | | 84,379 | |
Ready Reserves | | | 449,947 | | | | — | | | | 449,947 | | | | 670,783 | | | | — | | | | 670,783 | |
| | | | | | | | | | | | | | | | | | | | | | | | |
| | | Reinvested Distributions (Dollars) | |
| | | Period Ended June 30, 2011 | | | Year Ended December 31, 2010 | |
Portfolio | | Class N | | | Class I | | | Total | | | Class N | | | Class I | | | Total | |
Growth | | $ | — | | | $ | — | | | $ | — | | | $ | — | | | $ | 11 | | | $ | 11 | |
Large Cap Growth | | | — | | | | — | | | | — | | | | — | | | | 29 | | | | 29 | |
Small Cap Growth | | | — | | | | — | | | | — | | | | — | | | | — | | | | — | |
Mid Cap Growth | | | — | | | | — | | | | — | | | | — | | | | — | | | | — | |
Small Mid-Cap Growth | | | — | | | | — | | | | — | | | | — | | | | — | | | | — | |
Global Growth | | | — | | | | — | | | | — | | | | — | | | | 11 | | | | 11 | |
International Growth | | | — | | | | — | | | | — | | | | 50,365 | | | | 42,168 | | | | 92,533 | |
International Equity | | | — | | | | — | | | | — | | | | 174 | | | | 2,278 | | | | 2,452 | |
International Small Cap Growth | | | — | | | | — | | | | — | | | | 38 | | | | 1,078 | | | | 1,116 | |
Emerging Markets Growth | | | — | | | | — | | | | — | | | | 234 | | | | 1,348 | | | | 1,582 | |
Emerging Leaders Growth | | | — | | | | — | | | | — | | | | — | (a) | | | 79 | | | | 79 | |
Small Cap Value | | | — | | | | — | | | | — | | | | 58 | | | | 296 | | | | 354 | |
Mid Cap Value | | | — | | | | — | | | | — | | | | — | (b) | | | 27 | (b) | | | 27 | (b) |
Bond | | | 76 | | | | 2,499 | | | | 2,575 | | | | 126 | | | | 4,728 | | | | 4,854 | |
Income | | | 642 | | | | 1,203 | | | | 1,845 | | | | 1,462 | | | | 2,888 | | | | 4,350 | |
Low Duration | | | 44 | | | | 710 | | | | 754 | | | | 54 | | | | 1,211 | | | | 1,265 | |
Ready Reserves | | | 62 | | | | — | | | | 62 | | | | 126 | | | | — | | | | 126 | |
122 Semi-Annual Report | June 30, 2011 |
| | | | | | | | | | | | | | | | | | | | | | | | |
| | | Redemptions (Dollars) | |
| | | Period Ended June 30, 2011 | | | Year Ended December 31, 2010 | |
Portfolio | | Class N | | | Class I | | | Total | | | Class N | | | Class I | | | Total | |
Growth | | $ | 36,984 | | | $ | 26,907 | | | $ | 63,891 | | | $ | 47,695 | | | $ | 37,660 | | | $ | 85,355 | |
Large Cap Growth | | | 4,546 | | | | 2,923 | | | | 7,469 | | | | 925 | | | | 4,757 | | | | 5,682 | |
Small Cap Growth | | | 97,720 | | | | 96,772 | | | | 194,492 | | | | 235,001 | | | | 124,740 | | | | 359,741 | |
Mid Cap Growth | | | 3,159 | | | | 7,957 | | | | 11,116 | | | | 2,034 | | | | 11,217 | | | | 13,251 | |
Small Mid-Cap Growth | | | 4,257 | | | | 15,271 | | | | 19,528 | | | | 4,809 | | | | 23,447 | | | | 28,256 | |
Global Growth | | | 754 | | | | 1,309 | | | | 2,063 | | | | 1,468 | | | | 4,358 | | | | 5,826 | |
International Growth | | | 588,109 | | | | 250,884 | | | | 838,993 | | | | 1,196,684 | | | | 551,296 | | | | 1,747,980 | |
International Equity | | | 2,701 | | | | 87,862 | | | | 90,563 | | | | 4,139 | | | | 186,626 | | | | 190,765 | |
International Small Cap Growth | | | 3,350 | | | | 31,738 | | | | 35,088 | | | | 5,438 | | | | 62,241 | | | | 67,679 | |
Emerging Markets Growth | | | 5,279 | | | | 35,437 | | | | 40,716 | | | | 5,661 | | | | 70,448 | | | | 76,109 | |
Emerging Leaders Growth | | | 30 | | | | 1,543 | | | | 1,573 | | | | — | (a) | | | 6,692 | | | | 6,692 | |
Small Cap Value | | | 23,310 | | | | 17,499 | | | | 40,809 | | | | 2,617 | | | | 11,274 | | | | 13,891 | |
Mid Cap Value | | | 24 | | | | 210 | | | | 234 | | | | — | (b) | | | 5 | (b) | | | 5 | (b) |
Bond | | | 543 | | | | 26,059 | | | | 26,602 | | | | 1,085 | | | | 54,078 | | | | 55,163 | |
Income | | | 8,941 | | | | 16,102 | | | | 25,043 | | | | 12,781 | | | | 13,282 | | | | 26,063 | |
Low Duration | | | 2,133 | | | | 43,404 | | | | 45,537 | | | | 1,607 | | | | 69,878 | | | | 71,485 | |
Ready Reserves | | | 408,734 | | | | — | | | | 408,734 | | | | 807,267 | | | | — | | | | 807,267 | |
| | | | | | | | | | | | | | | | | | | | | | | | |
| | | Net Change in Net Assets
relating to Fund Share Activity (Dollars) | |
| | | Period Ended June 30, 2011 | | | Year Ended December 31, 2010 | |
Portfolio | | Class N | | | Class I | | | Total | | | Class N | | | Class I | | | Total | |
Growth | | $ | 16,615 | | | $ | 7,976 | | | $ | 24,591 | | | $ | 20,670 | | | $ | 70,348 | | | $ | 91,018 | |
Large Cap Growth | | | (3,930 | ) | | | (1,217 | ) | | | (5,147 | ) | | | 217 | | | | (2,793 | ) | | | (2,576 | ) |
Small Cap Growth | | | (80,814 | ) | | | (57,947 | ) | | | (138,761 | ) | | | (126,691 | ) | | | 131,545 | | | | 4,854 | |
Mid Cap Growth | | | 612 | | | | 29,113 | | | | 29,725 | | | | 764 | | | | 10,374 | | | | 11,138 | |
Small Mid-Cap Growth | | | (19 | ) | | | 30,130 | | | | 30,111 | | | | (1,781 | ) | | | 24,828 | | | | 23,047 | |
Global Growth | | | (518 | ) | | | 1,180 | | | | 662 | | | | (422 | ) | | | (549 | ) | | | (971 | ) |
International Growth | | | (460,434 | ) | | | 62,786 | | | | (397,648 | ) | | | (269,570 | ) | | | 112,712 | | | | (156,858 | ) |
International Equity | | | (2,089 | ) | | | (68,367 | ) | | | (70,456 | ) | | | (2,872 | ) | | | (125,598 | ) | | | (128,470 | ) |
International Small Cap Growth | | | (734 | ) | | | 69,528 | | | | 68,794 | | | | 2,438 | | | | 77,272 | | | | 79,710 | |
Emerging Markets Growth | | | (4,238 | ) | | | (20,080 | ) | | | (24,318 | ) | | | 1,161 | | | | (17,140 | ) | | | (15,979 | ) |
Emerging Leaders Growth | | | (2 | ) | | | 16,017 | | | | 16,015 | | | | 49 | (a) | | | 4,951 | | | | 5,000 | |
Small Cap Value | | | 7,628 | | | | 53,317 | | | | 60,945 | | | | 22,206 | | | | 56,725 | | | | 78,931 | |
Mid Cap Value | | | 43 | | | | 492 | | | | 535 | | | | 4 | (b) | | | 3,180 | (b) | | | 3,184 | (b) |
Bond | | | 435 | | | | (3,234 | ) | | | (2,799 | ) | | | 800 | | | | 16,399 | | | | 17,199 | |
Income | | | (5,324 | ) | | | (13,126 | ) | | | (18,450 | ) | | | (2,459 | ) | | | (3,869 | ) | | | (6,328 | ) |
Low Duration | | | (1,004 | ) | | | (18,112 | ) | | | (19,116 | ) | | | 5,118 | | | | 9,041 | | | | 14,159 | |
Ready Reserves | | | 41,275 | | | | — | | | | 41,275 | | | | (136,358 | ) | | | — | | | | (136,358 | ) |
| |
| | | Sales (Shares) | |
| | | Period Ended June 30, 2011 | | | Year Ended December 31, 2010 | |
Portfolio | | Class N | | | Class I | | | Total | | | Class N | | | Class I | | | Total | |
Growth | | | 4,628 | | | | 2,881 | | | | 7,509 | | | | 6,808 | | | | 9,829 | | | | 16,637 | |
Large Cap Growth | | | 84 | | | | 230 | | | | 314 | | | | 182 | | | | 299 | | | | 481 | |
Small Cap Growth | | | 723 | | | | 1,605 | | | | 2,328 | | | | 5,035 | | | | 12,133 | | | | 17,168 | |
Mid Cap Growth | | | 282 | | | | 2,689 | | | | 2,971 | | | | 261 | | | | 1,998 | | | | 2,259 | |
Small Mid-Cap Growth | | | 273 | | | | 2,960 | | | | 3,233 | | | | 242 | | | | 3,846 | | | | 4,088 | |
Global Growth | | | 28 | | | | 288 | | | | 316 | | | | 139 | | | | 526 | | | | 665 | |
International Growth | | | 5,860 | | | | 14,055 | | | | 19,915 | | | | 45,601 | | | | 31,294 | | | | 76,895 | |
International Equity | | | 49 | | | | 1,562 | | | | 1,611 | | | | 96 | | | | 5,289 | | | | 5,385 | |
International Small Cap Growth | | | 197 | | | | 7,483 | | | | 7,680 | | | | 729 | | | | 12,221 | | | | 12,950 | |
Emerging Markets Growth | | | 67 | | | | 1,020 | | | | 1,087 | | | | 467 | | | | 3,722 | | | | 4,189 | |
Emerging Leaders Growth | | | 3 | | | | 1,787 | | | | 1,790 | | | | 5 | (a) | | | 1,252 | | | | 1,257 | |
Small Cap Value | | | 2,225 | | | | 4,983 | | | | 7,208 | | | | 1,978 | | | | 5,844 | | | | 7,822 | |
Mid Cap Value | | | 6 | | | | 64 | | | | 70 | | | | — | (b) | | | 313 | (b) | | | 313 | (b) |
Bond | | | 84 | | | | 1,915 | | | | 1,999 | | | | 164 | | | | 6,220 | | | | 6,384 | |
Income | | | 322 | | | | 194 | | | | 516 | | | | 957 | | | | 713 | | | | 1,670 | |
Low Duration | | | 110 | | | | 2,485 | | | | 2,595 | | | | 670 | | | | 7,796 | | | | 8,466 | |
Ready Reserves | | | 449,947 | | | | — | | | | 449,947 | | | | 670,783 | | | | — | | | | 670,783 | |
| (a) | | For Class N shares the period from May 3, 2010 (Commencement of Operations) to December 31, 2010. |
| (b) | | For the period from May 3, 2010 (Commencement of Operations) to December 31, 2010. |
June 30, 2011 | William Blair Funds 123 |
| | | | | | | | | | | | | | | | | | | | | | | | |
| | | Reinvested Distributions (Shares) | |
| | | Period Ended June 30, 2011 | | | Year Ended December 31, 2010 | |
Portfolio | | Class N | | | Class I | | | Total | | | Class N | | | Class I | | | Total | |
Growth | | | — | | | | — | | | | — | | | | — | | | | 1 | | | | 1 | |
Large Cap Growth | | | — | | | | — | | | | — | | | | — | | | | 4 | | | | 4 | |
Small Cap Growth | | | — | | | | — | | | | — | | | | — | | | | — | | | | — | |
Mid Cap Growth | | | — | | | | — | | | | — | | | | — | | | | — | | | | — | |
Small Mid-Cap Growth | | | — | | | | — | | | | — | | | | — | | | | — | | | | — | |
Global Growth | | | — | | | | — | | | | — | | | | — | | | | 1 | | | | 1 | |
International Growth | | | — | | | | — | | | | — | | | | 2,343 | | | | 1,918 | | | | 4,261 | |
International Equity | | | — | | | | — | | | | — | | | | 15 | | | | 189 | | | | 204 | |
International Small Cap Growth | | | — | | | | — | | | | — | | | | 3 | | | | 83 | | | | 86 | |
Emerging Markets Growth | | | — | | | | — | | | | — | | | | 15 | | | | 87 | | | | 102 | |
Emerging Leaders Growth | | | — | | | | — | | | | — | | | | — | (a) | | | 8 | | | | 8 | |
Small Cap Value | | | — | | | | — | | | | — | | | | 4 | | | | 22 | | | | 26 | |
Mid Cap Value | | | — | | | | — | | | | — | | | | — | (b) | | | 3 | (b) | | | 3 | (b) |
Bond | | | 7 | | | | 235 | | | | 242 | | | | 12 | | | | 447 | | | | 459 | |
Income | | | 69 | | | | 131 | | | | 200 | | | | 159 | | | | 315 | | | | 474 | |
Low Duration | | | 4 | | | | 72 | | | | 76 | | | | 5 | | | | 122 | | | | 127 | |
Ready Reserves | | | 62 | | | | — | | | | 62 | | | | 126 | | | | — | | | | 126 | |
| |
| | | Redemptions (Shares) | |
| | | Period Ended June 30, 2011 | | | Year Ended December 31, 2010 | |
Portfolio | | Class N | | | Class I | | | Total | | | Class N | | | Class I | | | Total | |
Growth | | | 3,155 | | | | 2,222 | | | | 5,377 | | | | 4,775 | | | | 3,591 | | | | 8,366 | |
Large Cap Growth | | | 610 | | | | 391 | | | | 1,001 | | | | 148 | | | | 761 | | | | 909 | |
Small Cap Growth | | | 4,189 | | | | 4,032 | | | | 8,221 | | | | 11,449 | | | | 5,763 | | | | 17,212 | |
Mid Cap Growth | | | 234 | | | | 588 | | | | 822 | | | | 187 | | | | 1,030 | | | | 1,217 | |
Small Mid-Cap Growth | | | 277 | | | | 970 | | | | 1,247 | | | | 386 | | | | 1,836 | | | | 2,222 | |
Global Growth | | | 87 | | | | 150 | | | | 237 | | | | 209 | | | | 615 | | | | 824 | |
International Growth | | | 26,703 | | | | 11,204 | | | | 37,907 | | | | 61,789 | | | | 28,153 | | | | 89,942 | |
International Equity | | | 215 | | | | 6,992 | | | | 7,207 | | | | 373 | | | | 17,372 | | | | 17,745 | |
International Small Cap Growth | | | 248 | | | | 2,350 | | | | 2,598 | | | | 483 | | | | 5,850 | | | | 6,333 | |
Emerging Markets Growth | | | 349 | | | | 2,291 | | | | 2,640 | | | | 422 | | | | 5,459 | | | | 5,881 | |
Emerging Leaders Growth | | | 3 | | | | 156 | | | | 159 | | | | — | (a) | | | 728 | | | | 728 | |
Small Cap Value | | | 1,674 | | | | 1,238 | | | | 2,912 | | | | 219 | | | | 945 | | | | 1,164 | |
Mid Cap Value | | | 2 | | | | 19 | | | | 21 | | | | — | (b) | | | 1 | (b) | | | 1 | (b) |
Bond | | | 51 | | | | 2,455 | | | | 2,506 | | | | 101 | | | | 5,087 | | | | 5,188 | |
Income | | | 968 | | | | 1,756 | | | | 2,724 | | �� | | 1,382 | | | | 1,449 | | | | 2,831 | |
Low Duration | | | 216 | | | | 4,392 | | | | 4,608 | | | | 161 | | | | 7,002 | | | | 7,163 | |
Ready Reserves | | | 408,734 | | | | — | | | | 408,734 | | | | 807,267 | | | | — | | | | 807,267 | |
| (a) | | For Class N shares the period from May 3, 2010 (Commencement of Operations) to December 31, 2010. |
| (b) | | For the period from May 3, 2010 (Commencement of Operations) to December 31, 2010. |
124 Semi-Annual Report | June 30, 2011 |
| | | | | | | | | | | | | | | | | | | | | | | | |
| | | Net Change in Shares Outstanding
relating to Fund Share Activity (Shares) | |
| | | Period Ended June 30, 2011 | | | Year Ended December 31, 2010 | |
Portfolio | | Class N | | | Class I | | | Total | | | Class N | | | Class I | | | Total | |
Growth | | | 1,473 | | | | 659 | | | | 2,132 | | | | 2,033 | | | | 6,239 | | | | 8,272 | |
Large Cap Growth | | | (526 | ) | | | (161 | ) | | | (687 | ) | | | 34 | | | | (458 | ) | | | (424 | ) |
Small Cap Growth | | | (3,466 | ) | | | (2,427 | ) | | | (5,893 | ) | | | (6,414 | ) | | | 6,370 | | | | (44 | ) |
Mid Cap Growth | | | 48 | | | | 2,101 | | | | 2,149 | | | | 74 | | | | 968 | | | | 1,042 | |
Small Mid-Cap Growth | | | (4 | ) | | | 1,990 | | | | 1,986 | | | | (144 | ) | | | 2,010 | | | | 1,866 | |
Global Growth | | | (59 | ) | | | 138 | | | | 79 | | | | (70 | ) | | | (88 | ) | | | (158 | ) |
International Growth | | | (20,843 | ) | | | 2,851 | | | | (17,992 | ) | | | (13,845 | ) | | | 5,059 | | | | (8,786 | ) |
International Equity | | | (166 | ) | | | (5,430 | ) | | | (5,596 | ) | | | (262 | ) | | | (11,894 | ) | | | (12,156 | ) |
International Small Cap Growth | | | (51 | ) | | | 5,133 | | | | 5,082 | | | | 249 | | | | 6,454 | | | | 6,703 | |
Emerging Markets Growth | | | (282 | ) | | | (1,271 | ) | | | (1,553 | ) | | | 60 | | | | (1,650 | ) | | | (1,590 | ) |
Emerging Leaders Growth | | | — | | | | 1,631 | | | | 1,631 | | | | 5 | (a) | | | 532 | | | | 537 | |
Small Cap Value | | | 551 | | | | 3,745 | | | | 4,296 | | | | 1,763 | | | | 4,921 | | | | 6,684 | |
Mid Cap Value | | | 4 | | | | 45 | | | | 49 | | | | — | (b) | | | 315 | (b) | | | 315 | (b) |
Bond | | | 40 | | | | (305 | ) | | | (265 | ) | | | 75 | | | | 1,580 | | | | 1,655 | |
Income | | | (577 | ) | | | (1,431 | ) | | | (2,008 | ) | | | (266 | ) | | | (421 | ) | | | (687 | ) |
Low Duration | | | (102 | ) | | | (1,835 | ) | | | (1,937 | ) | | | 514 | | | | 916 | | | | 1,430 | |
Ready Reserves | | | 41,275 | | | | — | | | | 41,275 | | | | (136,358 | ) | | | — | | | | (136,358 | ) |
| (a) | | For Class N shares the period from May 3, 2010 (Commencement of Operations) to December 31, 2010. |
| (b) | | For the period from May 3, 2010 (Commencement of Operations) to December 31, 2010. |
June 30, 2011 | William Blair Funds 125 |
Financial Highlights
Growth Fund
| | | | | | | | | | | | | | | | | | | | | | | | |
| | | Class N | |
| | | Period Ended
June 30, | | | Years Ended December 31, | |
| | | 2011 | | | 2010 | | | 2009 | | | 2008 | | | 2007 | | | 2006 | |
Net asset value, beginning of year | | $ | 11.28 | | | $ | 9.89 | | | $ | 7.12 | | | $ | 11.70 | | | $ | 11.42 | | | $ | 11.33 | |
Income (loss) from investment operations: | | | | | | | | | | | | | | | | | | | | | | | | |
Net investment income (loss) | | | (0.01 | ) | | | (0.01 | ) | | | (0.02 | ) | | | (0.05 | ) | | | (0.04 | ) | | | (0.06 | ) |
Net realized and unrealized gain (loss) on investments | | | 0.65 | | | | 1.40 | | | | 2.79 | | | | (4.35 | ) | | | 1.53 | | | | 1.48 | |
| | | | | | | | | | | | | | | | | | | | | | | | |
Total from investment operations | | | 0.64 | | | | 1.39 | | | | 2.77 | | | | (4.40 | ) | | | 1.49 | | | | 1.42 | |
Less distributions from: | | | | | | | | | | | | | | | | | | | | | | | | |
Net investment income | | | — | | | | — | | | | — | | | | — | | | | — | | | | — | |
Net realized gain | | | — | | | | — | | | | — | | | | 0.18 | | | | 1.21 | | | | 1.33 | |
| | | | | | | | | | | | | | | | | | | | | | | | |
Total distributions | | | — | | | | — | | | | — | | | | 0.18 | | | | 1.21 | | | | 1.33 | |
| | | | | | | | | | | | | | | | | | | | | | | | |
Net asset value, end of year | | $ | 11.92 | | | $ | 11.28 | | | $ | 9.89 | | | $ | 7.12 | | | $ | 11.70 | | | $ | 11.42 | |
| | | | | | | | | | | | | | | | | | | | | | | | |
Total Return (%)* | | | 5.67 | | | | 14.05 | | | | 38.90 | | | | (37.61 | ) | | | 13.17 | | | | 12.42 | |
Ratios to average daily net assets (%):** | | | | | | | | | | | | | | | | | | | | | | | | |
Expenses | | | 1.18 | | | | 1.16 | | | | 1.23 | | | | 1.17 | | | | 1.22 | | | | 1.17 | |
Net investment income (loss) | | | (0.14 | ) | | | (0.13 | ) | | | (0.20 | ) | | | (0.54 | ) | | | (0.35 | ) | | | (0.49 | ) |
| | | | | | | | | | | | | | | | | | | | | | | | |
| | | Class I | |
| | | Period Ended
June 30, | | | Years Ended December 31, | |
| | | 2011 | | | 2010 | | | 2009 | | | 2008 | | | 2007 | | | 2006 | |
Net asset value, beginning of year | | $ | 11.71 | | | $ | 10.24 | | | $ | 7.35 | | | $ | 12.02 | | | $ | 11.66 | | | $ | 11.52 | |
Income (loss) from investment operations: | | | | | | | | | | | | | | | | | | | | | | | | |
Net investment income (loss) | | | 0.01 | | | | 0.02 | | | | 0.01 | | | | (0.02 | ) | | | 0.00^ | | | | (0.02) | |
Net realized and unrealized gain (loss) on investments | | | 0.68 | | | | 1.45 | | | | 2.88 | | | | (4.47 | ) | | | 1.57 | | | | 1.49 | |
| | | | | | | | | | | | | | | | | | | | | | | | |
Total from investment operations | | | 0.69 | | | | 1.47 | | | | 2.89 | | | | (4.49 | ) | | | 1.57 | | | | 1.47 | |
Less distributions from: | | | | | | | | | | | | | | | | | | | | | | | | |
Net investment income | | | — | | | | 0.00 | ^ | | | 0.00 | ^ | | | — | | | | — | | | | — | |
Net realized gain | | | — | | | | — | | | | — | | | | 0.18 | | | | 1.21 | | | | 1.33 | |
| | | | | | | | | | | | | | | | | | | | | | | | |
Total distributions | | | — | | | | 0.00 | ^ | | | 0.00 | ^ | | | 0.18 | | | | 1.21 | | | | 1.33 | |
| | | | | | | | | | | | | | | | | | | | | | | | |
Net asset value, end of year | | $ | 12.40 | | | $ | 11.71 | | | $ | 10.24 | | | $ | 7.35 | | | $ | 12.02 | | | $ | 11.66 | |
| | | | | | | | | | | | | | | | | | | | | | | | |
Total Return (%)* | | | 5.89 | | | | 14.36 | | | | 39.34 | | | | (37.35 | ) | | | 13.59 | | | | 12.64 | |
Ratios to average daily net assets (%):** | | | | | | | | | | | | | | | | | | | | | | | | |
Expenses | | | 0.84 | | | | 0.84 | | | | 0.89 | | | | 0.85 | | | | 0.87 | | | | 0.89 | |
Net investment income (loss) | | | 0.20 | | | | 0.20 | | | | 0.14 | | | | (0.22 | ) | | | 0.00 | | | | (0.20 | ) |
| | | | | | | | | | | | | | | | | | | | | | | | |
| | | Period Ended
June 30, | | | Years Ended December 31, | |
| | | 2011 | | | 2010 | | | 2009 | | | 2008 | | | 2007 | | | 2006 | |
Supplemental data for all classes: | | | | | | | | | | | | | | | | | | | | | | | | |
Net assets at end of year (in thousands) | | $ | 634,781 | | | $ | 575,613 | | | $ | 419,520 | | | $ | 238,586 | | | $ | 369,644 | | | $ | 264,525 | |
Portfolio turnover rate (%)* | | | 30 | | | | 66 | | | | 67 | | | | 60 | | | | 72 | | | | 61 | |
| * | | Rates not annualized for periods that are less than a year. |
| ** | | Rates are annualized for periods that are less than a year. |
| ^ | | Amount is less than $0.005 per share. |
Performance cited represents past performance. Past performance does not guarantee future results and current performance may be lower or higher than the data quoted. Results shown are annual returns, which assume reinvestment of dividends and capital gains. Investment returns and principal will fluctuate and you may have a gain or loss when you sell shares. For the most current month-end performance information, please call 1-800-742-7272 or visit our Web site at www.williamblairfunds.com.
Note: Net investment income (loss) per share is based on the average shares outstanding during the year.
126 Semi-Annual Report | June 30, 2011 |
Financial Highlights
Large Cap Growth Fund
| | | | | | | | | | | | | | | | | | | | | | | | |
| | | Class N | |
| | | Period Ended
June 30, | | | Years Ended December 31, | |
| | | 2011 | | | 2010 | | | 2009 | | | 2008 | | | 2007 | | | 2006 | |
Net asset value, beginning of year | | $ | 7.14 | | | $ | 6.16 | | | $ | 4.68 | | | $ | 7.52 | | | $ | 6.88 | | | $ | 6.47 | |
Income (loss) from investment operations: | | | | | | | | | | | | | | | | | | | | | | | | |
Net investment income (loss) | | | 0.00 | ^ | | | (0.00 | )^ | | | (0.01 | ) | | | (0.02 | ) | | | (0.01 | ) | | | (0.02 | ) |
Net realized and unrealized gain (loss) on investments | | | 0.26 | | | | 0.98 | | | | 1.49 | | | | (2.82 | ) | | | 0.65 | | | | 0.43 | |
| | | | | | | | | | | | | | | | | | | | | | | | |
Total from investment operations | | | 0.26 | | | | 0.98 | | | | 1.48 | | | | (2.84 | ) | | | 0.64 | | | | 0.41 | |
Less distributions from: | | | | | | | | | | | | | | | | | | | | | | | | |
Net investment income | | | — | | | | — | | | | — | | | | 0.00 | ^ | | | — | | | | — | |
Net realized gain | | | — | | | | — | | | | — | | | | — | | | | — | | | | — | |
| | | | | | | | | | | | | | | | | | | | | | | | |
Total distributions | | | — | | | | — | | | | — | | | | 0.00 | ^ | | | — | | | | — | |
| | | | | | | | | | | | | | | | | | | | | | | | |
Net asset value, end of year | | $ | 7.40 | | | $ | 7.14 | | | $ | 6.16 | | | $ | 4.68 | | | $ | 7.52 | | | $ | 6.88 | |
| | | | | | | | | | | | | | | | | | | | | | | | |
Total Return (%)* | | | 3.64 | | | | 15.91 | | | | 31.62 | | | | (37.76 | ) | | | 9.30 | | | | 6.34 | |
Ratios to average daily net assets (%):** | | | | | | | | | | | | | | | | | | | | | | | | |
Expenses, net of waivers and reimbursements | | | 1.20 | | | | 1.21 | | | | 1.23 | | | | 1.23 | | | | 1.23 | | | | 1.24 | |
Expenses, before waivers and reimbursements | | | 1.52 | | | | 1.53 | | | | 2.28 | | | | 1.85 | | | | 1.50 | | | | 1.63 | |
Net investment income (loss), net of waivers and reimbursements | | | (0.07 | ) | | | (0.08 | ) | | | (0.13 | ) | | | (0.29 | ) | | | (0.16 | ) | | | (0.29 | ) |
Net investment income (loss), before waivers and reimbursements | | | (0.39 | ) | | | (0.40 | ) | | | (1.18 | ) | | | (0.91 | ) | | | (0.43 | ) | | | (0.68 | ) |
| | | | | | | | | | | | | | | | | | | | | | | | |
| | | Class I | |
| | | Period Ended
June 30, | | | Years Ended December 31, | |
| | | 2011 | | | 2010 | | | 2009 | | | 2008 | | | 2007 | | | 2006 | |
Net asset value, beginning of year | | $ | 7.30 | | | $ | 6.30 | | | $ | 4.77 | | | $ | 7.64 | | | $ | 6.99 | | | $ | 6.56 | |
Income (loss) from investment operations: | | | | | | | | | | | | | | | | | | | | | | | | |
Net investment income (loss) | | | 0.01 | | | | 0.02 | | | | 0.01 | | | | 0.00 ^ | | | | 0.01 | | | | 0.00 | |
Net realized and unrealized gain (loss) on investments | | | 0.27 | | | | 1.00 | | | | 1.52 | | | | (2.87 | ) | | | 0.64 | | | | 0.43 | |
| | | | | | | | | | | | | | | | | | | | | | | | |
Total from investment operations | | | 0.28 | | | | 1.01 | | | | 1.53 | | | | (2.87 | ) | | | 0.65 | | | | 0.43 | |
Less distributions from: | | | | | | | | | | | | | | | | | | | | | | | | |
Net investment income | | | — | | | | 0.01 | | | | 0.00 | ^ | | | 0.00 | ^ | | | 0.00 | ^ | | | — | |
Net realized gain | | | — | | | | — | | | | — | | | | — | | | | — | | | | — | |
| | | | | | | | | | | | | | | | | | | | | | | | |
Total distributions | | | — | | | | 0.01 | | | | 0.00 | ^ | | | 0.00 | ^ | | | 0.00 | ^ | | | — | |
| | | | | | | | | | | | | | | | | | | | | | | | |
Net asset value, end of year | | $ | 7.58 | | | $ | 7.30 | | | $ | 6.30 | | | $ | 4.77 | | | $ | 7.64 | | | $ | 6.99 | |
| | | | | | | | | | | | | | | | | | | | | | | | |
Total Return (%)* | | | 3.84 | | | | 16.03 | | | | 32.17 | | | | (37.56 | ) | | | 9.36 | | | | 6.55 | |
Ratios to average daily net assets (%):** | | | | | | | | | | | | | | | | | | | | | | | | |
Expenses, net of waivers and reimbursements | | | 0.95 | | | | 0.96 | | | | 0.98 | | | | 0.98 | | | | 0.98 | | | | 0.99 | |
Expenses, before waivers and reimbursements | | | 1.17 | | | | 1.16 | | | | 1.26 | | | | 1.21 | | | | 1.20 | | | | 1.38 | |
Net investment income (loss), net of waivers and reimbursements | | | 0.20 | | | | 0.16 | | | | 0.12 | | | | (0.04 | ) | | | 0.18 | | | | (0.04 | ) |
Net investment income (loss), before waivers and reimbursements | | | (0.02 | ) | | | (0.04 | ) | | | (0.16 | ) | | | (0.27 | ) | | | (0.04 | ) | | | (0.43 | ) |
| | | | | | | | | | | | | | | | | | | | | | | | |
| | | Period Ended
June 30, | | | Years Ended December 31, | |
| | | 2011 | | | 2010 | | | 2009 | | | 2008 | | | 2007 | | | 2006 | |
Supplemental data for all classes: | | | | | | | | | | | | | | | | | | | | | | | | |
Net assets at end of year (in thousands) | | $ | 28,133 | | | $ | 32,035 | | | $ | 30,311 | | | $ | 23,279 | | | $ | 33,667 | | | $ | 20,191 | |
Portfolio turnover rate (%)* | | | 34 | | | | 54 | | | | 88 | | | | 85 | | | | 60 | | | | 53 | |
| * | | Rates not annualized for periods that are less than a year. |
| ** | | Rates are annualized for periods that are less than a year. |
| ^ | | Amount is between $(0.005) and $0.005 per share. |
Performance cited represents past performance. Past performance does not guarantee future results and current performance may be lower or higher than the data quoted. Results shown are annual returns, which assume reinvestment of dividends and capital gains. Investment returns and principal will fluctuate and you may have a gain or loss when you sell shares. For the most current month-end performance information, please call 1-800-742-7272 or visit our Web site at www.williamblairfunds.com.
Note: Net investment income (loss) per share is based on the average shares outstanding during the year.
June 30, 2011 | William Blair Funds 127 |
Financial Highlights
Small Cap Growth Fund
| | | | | | | | | | | | | | | | | | | | | | | | |
| | | Class N | |
| | | Period Ended
June 30, | | | Years Ended December 31, | |
| | | 2011 | | | 2010 | | | 2009 | | | 2008 | | | 2007 | | | 2006 | |
Net asset value, beginning of year | | $ | 23.22 | | | $ | 19.99 | | | $ | 11.79 | | | $ | 23.30 | | | $ | 25.41 | | | $ | 23.76 | |
Income (loss) from investment operations: | | | | | | | | | | | | | | | | | | | | | | | | |
Net investment income (loss) | | | (0.15 | ) | | | (0.21 | ) | | | (0.15 | ) | | | (0.19 | ) | | | (0.33 | ) | | | (0.29 | ) |
Net realized and unrealized gain (loss) on investments | | | 0.47 | | | | 3.44 | | | | 8.35 | | | | (10.73 | ) | | | (0.25 | ) | | | 3.65 | |
| | | | | | | | | | | | | | | | | | | | | | | | |
Total from investment operations | | | 0.32 | | | | 3.23 | | | | 8.20 | | | | (10.92 | ) | | | (0.58 | ) | | | 3.36 | |
Less distributions from: | | | | | | | | | | | | | | | | | | | | | | | | |
Net investment income | | | — | | | | — | | | | — | | | | — | | | | — | | | | — | |
Net realized gain | | | — | | | | — | | | | — | | | | 0.59 | | | | 1.53 | | | | 1.71 | |
| | | | | | | | | | | | | | | | | | | | | | | | |
Total distributions | | | — | | | | — | | | | — | | | | 0.59 | | | | 1.53 | | | | 1.71 | |
| | | | | | | | | | | | | | | | | | | | | | | | |
Net asset value, end of year | | $ | 23.54 | | | $ | 23.22 | | | $ | 19.99 | | | $ | 11.79 | | | $ | 23.30 | | | $ | 25.41 | |
| | | | | | | | | | | | | | | | | | | | | | | | |
Total Return (%)* | | | 1.38 | | | | 16.16 | | | | 69.55 | | | | (46.85 | ) | | | (2.15 | ) | | | 14.12 | |
Ratios to average daily net assets (%):** | | | | | | | | | | | | | | | | | | | | | | | | |
Expenses, net of waivers and reimbursements | | | 1.50 | | | | 1.50 | | | | 1.50 | | | | 1.50 | | | | 1.49 | | | | 1.48 | |
Expenses, before waivers and reimbursements | | | 1.58 | | | | 1.52 | | | | 1.55 | | | | 1.50 | | | | 1.49 | | | | 1.48 | |
Net investment income (loss), net of waivers and reimbursements | | | (1.27 | ) | | | (1.03 | ) | | | (0.93 | ) | | | (1.05 | ) | | | (1.24 | ) | | | (1.14 | ) |
Net investment income (loss), before waivers and reimbursements | | | (1.35 | ) | | | (1.05 | ) | | | (0.98 | ) | | | (1.05 | ) | | | (1.24 | ) | | | (1.14 | ) |
| | | | | | | | | | | | | | | | | | | | | | | | |
| | | Class I | |
| | | Period Ended
June 30, | | | Years Ended December 31, | |
| | | 2011 | | | 2010 | | | 2009 | | | 2008 | | | 2007 | | | 2006 | |
Net asset value, beginning of year | | $ | 24.07 | | | $ | 20.64 | | | $ | 12.14 | | | $ | 23.89 | | | $ | 25.94 | | | $ | 24.16 | |
Income (loss) from investment operations: | | | | | | | | | | | | | | | | | | | | | | | | |
Net investment income (loss) | | | (0.12 | ) | | | (0.16 | ) | | | (0.11 | ) | | | (0.14 | ) | | | (0.25 | ) | | | (0.22 | ) |
Net realized and unrealized gain (loss) on investments | | | 0.47 | | | | 3.59 | | | | 8.61 | | | | (11.02 | ) | | | (0.27 | ) | | | 3.71 | |
| | | | | | | | | | | | | | | | | | | | | | | | |
Total from investment operations | | | 0.35 | | | | 3.43 | | | | 8.50 | | | | (11.16 | ) | | | (0.52 | ) | | | 3.49 | |
Less distributions from: | | | | | | | | | | | | | | | | | | | | | | | | |
Net investment income | | | — | | | | — | | | | — | | | | — | | | | — | | | | — | |
Net realized gain | | | — | | | | — | | | | — | | | | 0.59 | | | | 1.53 | | | | 1.71 | |
| | | | | | | | | | | | | | | | | | | | | | | | |
Total distributions | | | — | | | | — | | | | — | | | | 0.59 | | | | 1.53 | | | | 1.71 | |
| | | | | | | | | | | | | | | | | | | | | | | | |
Net asset value, end of year | | $ | 24.42 | | | $ | 24.07 | | | $ | 20.64 | | | $ | 12.14 | | | $ | 23.89 | | | $ | 25.94 | |
| | | | | | | | | | | | | | | | | | | | | | | | |
Total Return (%)* | | | 1.45 | | | | 16.62 | | | | 70.02 | | | | (46.70 | ) | | | (1.88 | ) | | | 14.42 | |
Ratios to average daily net assets (%):** | | | | | | | | | | | | | | | | | | | | | | | | |
Expenses, net of waivers and reimbursements | | | 1.25 | | | | 1.25 | | | | 1.20 | | | | 1.20 | | | | 1.20 | | | | 1.21 | |
Expenses, before waivers and reimbursements | | | 1.31 | | | | 1.25 | | | | 1.20 | | | | 1.20 | | | | 1.20 | | | | 1.21 | |
Net investment income (loss), net of waivers and reimbursements | | | (1.01 | ) | | | (0.76 | ) | | | (0.63 | ) | | | (0.75 | ) | | | (0.94 | ) | | | (0.87 | ) |
Net investment income (loss), before waivers and reimbursements | | | (1.07 | ) | | | (0.76 | ) | | | (0.63 | ) | | | (0.75 | ) | | | (0.94 | ) | | | (0.87 | ) |
| | | | | | | | | | | | | | | | | | | | | | | | |
| | | | |
| | | Period Ended
June 30, | | | Years Ended December 31, | |
| | | 2011 | | | 2010 | | | 2009 | | | 2008 | | | 2007 | | | 2006 | |
Supplemental data for all classes: | | | | | | | | | | | | | | | | | | | | | | | | |
Net assets at end of year (in thousands) | | $ | 763,477 | | | $ | 891,589 | | | $ | 762,798 | | | $ | 401,627 | | | $ | 1,094,419 | | | $ | 1,261,174 | |
Portfolio turnover rate (%)* | | | 46 | | | | 117 | | | | 122 | | | | 135 | | | | 97 | | | | 105 | |
| * | | Rates not annualized for periods that are less than a year. |
| ** | | Rates are annualized for periods that are less than a year. |
Performance cited represents past performance. Past performance does not guarantee future results and current performance may be lower or higher than the data quoted. Results shown are annual returns, which assume reinvestment of dividends and capital gains. Investment returns and principal will fluctuate and you may have a gain or loss when you sell shares. For the most current month-end performance information, please call 1-800-742-7272 or visit our Web site at www.williamblairfunds.com.
Note: Net investment income (loss) per share is based on the average shares outstanding during the year.
128 Semi-Annual Report | June 30, 2011 |
Financial Highlights
Mid Cap Growth Fund
| | | | | | | | | | | | | | | | | | | | | | | | |
| | | Class N | |
| | | Period Ended
June 30, | | | Periods Ended December 31, | |
| | | 2011 | | | 2010 | | | 2009 | | | 2008 | | | 2007 | | | 2006(a) | |
Net asset value, beginning of year | | $ | 12.50 | | | $ | 10.08 | | | $ | 7.41 | | | $ | 11.35 | | | $ | 10.46 | | | $ | 10.00 | |
Income (loss) from investment operations: | | | | | | | | | | | | | | | | | | | | | | | | |
Net investment income (loss) | | | (0.04 | ) | | | (0.05 | ) | | | (0.04 | ) | | | (0.07 | ) | | | (0.07 | ) | | | (0.07 | ) |
Net realized and unrealized gain (loss) on investments | | | 1.54 | | | | 2.47 | | | | 2.71 | | | | (3.87 | ) | | | 1.59 | | | | 0.53 | |
| | | | | | | | | | | | | | | | | | | | | | | | |
Total from investment operations | | | 1.50 | | | | 2.42 | | | | 2.67 | | | | (3.94 | ) | | | 1.52 | | | | 0.46 | |
Less distributions from: | | | | | | | | | | | | | | | | | | | | | | | | |
Net investment income | | | — | | | | — | | | | — | | | | — | | | | — | | | | — | |
Net realized gain | | | — | | | | — | | | | — | | | | 0.00 | ^ | | | 0.63 | | | | — | |
| | | | | | | | | | | | | | | | | | | | | | | | |
Total distributions | | | — | | | | — | | | | — | | | | 0.00 | ^ | | | 0.63 | | | | — | |
| | | | | | | | | | | | | | | | | | | | | | | | |
Net asset value, end of year | | $ | 14.00 | | | $ | 12.50 | | | $ | 10.08 | | | $ | 7.41 | | | $ | 11.35 | | | $ | 10.46 | |
| | | | | | | | | | | | | | | | | | | | | | | | |
Total Return (%)* | | | 12.00 | | | | 24.01 | | | | 36.03 | | | | (34.71 | ) | | | 14.62 | | | | 4.60 | |
Ratios to average daily net assets (%):** | | | | | | | | | | | | | | | | | | | | | | | | |
Expenses, net of waivers and reimbursements | | | 1.35 | | | | 1.35 | | | | 1.36 | | | | 1.36 | | | | 1.38 | | | | 1.40 | |
Expenses, before waivers and reimbursements | | | 1.44 | | | | 1.42 | | | | 2.13 | | | | 2.03 | | | | 1.67 | | | | 2.35 | |
Net investment income (loss), net of waivers and reimbursements | | | (0.53 | ) | | | (0.42 | ) | | | (0.51 | ) | | | (0.76 | ) | | | (0.58 | ) | | | (0.70 | ) |
Net investment income (loss), before waivers and reimbursements | | | (0.62 | ) | | | (0.49 | ) | | | (1.28 | ) | | | (1.43 | ) | | | (0.87 | ) | | | (1.65 | ) |
| | | | | | | | | | | | | | | | | | | | | | | | |
| | | Class I | |
| | | Period Ended
June 30, | | | Periods Ended December 31, | |
| | | 2011 | | | 2010 | | | 2009 | | | 2008 | | | 2007 | | | 2006(a) | |
Net asset value, beginning of year | | $ | 12.68 | | | $ | 10.20 | | | $ | 7.48 | | | $ | 11.42 | | | $ | 10.49 | | | $ | 10.00 | |
Income (loss) from investment operations: | | | | | | | | | | | | | | | | | | | | | | | | |
Net investment income (loss) | | | (0.02 | ) | | | (0.02 | ) | | | (0.02 | ) | | | (0.05 | ) | | | (0.04 | ) | | | (0.04 | ) |
Net realized and unrealized gain (loss) on investments | | | 1.55 | | | | 2.50 | | | | 2.74 | | | | (3.89 | ) | | | 1.60 | | | | 0.53 | |
| | | | | | | | | | | | | | | | | | | | | | | | |
Total from investment operations | | | 1.53 | | | | 2.48 | | | | 2.72 | | | | (3.94 | ) | | | 1.56 | | | | 0.49 | |
Less distributions from: | | | | | | | | | | | | | | | | | | | | | | | | |
Net investment income | | | — | | | | — | | | | — | | | | — | | | | — | | | | ��� | |
Net realized gain | | | — | | | | — | | | | — | | | | 0.00 | ^ | | | 0.63 | | | | — | |
| | | | | | | | | | | | | | | | | | | | | | | | |
Total distributions | | | — | | | | — | | | | — | | | | 0.00 | ^ | | | 0.63 | | | | — | |
| | | | | | | | | | | | | | | | | | | | | | | | |
Net asset value, end of year | | $ | 14.21 | | | $ | 12.68 | | | $ | 10.20 | | | $ | 7.48 | | | $ | 11.42 | | | $ | 10.49 | |
| | | | | | | | | | | | | | | | | | | | | | | | |
Total Return (%)* | | | 12.07 | | | | 24.31 | | | | 36.36 | | | | (34.50 | ) | | | 14.95 | | | | 4.90 | |
Ratios to average daily net assets (%):** | | | | | | | | | | | | | | | | | | | | | | | | |
Expenses, net of waivers and reimbursements | | | 1.10 | | | | 1.10 | | | | 1.11 | | | | 1.11 | | | | 1.12 | | | | 1.15 | |
Expenses, before waivers and reimbursements | | | 1.13 | | | | 1.15 | | | | 1.28 | | | | 1.23 | | | | 1.37 | | | | 2.10 | |
Net investment income (loss), net of waivers and reimbursements | | | (0.29 | ) | | | (0.14 | ) | | | (0.26 | ) | | | (0.51 | ) | | | (0.32 | ) | | | (0.43 | ) |
Net investment income (loss), before waivers and reimbursements | | | (0.32 | ) | | | (0.19 | ) | | | (0.43 | ) | | | (0.63 | ) | | | (0.57 | ) | | | (1.38 | ) |
| | | | | | | | | | | | | | | | | | | | | | | | |
| | | | |
| | | Period Ended
June 30, | | | Periods Ended December 31, | |
| | | 2011 | | | 2010 | | | 2009 | | | 2008 | | | 2007 | | | 2006(a) | |
Supplemental data for all classes: | | | | | | | | | | | | | | | | | | | | | | | | |
Net assets at end of year (in thousands) | | $ | 144,034 | | | $ | 101,248 | | | $ | 70,834 | | | $ | 40,526 | | | $ | 45,393 | | | $ | 19,639 | |
Portfolio turnover rate (%)* | | | 24 | | | | 73 | | | | 87 | | | | 76 | | | | 66 | | | | 56 | |
| (a) | | For the period February 1, 2006 (Commencement of Operations) to December 31, 2006. |
| * | | Rates not annualized for periods that are less than a year. |
| ** | | Rates are annualized for periods that are less than a year. |
| ^ | | Amount is less than $0.005 per share. |
Performance cited represents past performance. Past performance does not guarantee future results and current performance may be lower or higher than the data quoted. Results shown are annual returns, which assume reinvestment of dividends and capital gains. Investment returns and principal will fluctuate and you may have a gain or loss when you sell shares. For the most current month-end performance information, please call 1-800-742-7272 or visit our Web site at www.williamblairfunds.com.
Note: Net investment income (loss) per share is based on the average shares outstanding during the year.
June 30, 2011 | William Blair Funds 129 |
Financial Highlights
Small-Mid Cap Growth Fund
| | | | | | | | | | | | | | | | | | | | | | | | |
| | | Class N | |
| | | Period Ended
June 30, | | | Years Ended December 31, | |
| | | 2011 | | | 2010 | | | 2009 | | | 2008 | | | 2007 | | | 2006 | |
Net asset value, beginning of year | | $ | 14.40 | | | $ | 11.73 | | | $ | 8.16 | | | $ | 13.10 | | | $ | 12.96 | | | $ | 12.40 | |
Income (loss) from investment operations: | | | | | | | | | | | | | | | | | | | | | | | | |
Net investment income (loss) | | | (0.06 | ) | | | (0.09 | ) | | | (0.06 | ) | | | (0.03 | ) | | | (0.12 | ) | | | (0.11 | ) |
Net realized and unrealized gain (loss) on investments | | | 1.72 | | | | 2.76 | | | | 3.63 | | | | (4.91 | ) | | | 1.71 | | | | 1.32 | |
| | | | | | | | | | | | | | | | | | | | | | | | |
Total from investment operations | | | 1.66 | | | | 2.67 | | | | 3.57 | | | | (4.94 | ) | | | 1.59 | | | | 1.21 | |
Less distributions from: | | | | | | | | | | | | | | | | | | | | | | | | |
Net investment income | | | — | | | | — | | | | — | | | | — | | | | — | | | | — | |
Net realized gain | | | — | | | | — | | | | — | | | | 0.00 | ^ | | | 1.45 | | | | 0.65 | |
| | | | | | | | | | | | | | | | | | | | | | | | |
Total distributions | | | — | | | | — | | | | — | | | | 0.00 | ^ | | | 1.45 | | | | 0.65 | |
| | | | | | | | | | | | | | | | | | | | | | | | |
Net asset value, end of year | | $ | 16.06 | | | $ | 14.40 | | | $ | 11.73 | | | $ | 8.16 | | | $ | 13.10 | | | $ | 12.96 | |
| | | | | | | | | | | | | | | | | | | | | | | | |
Total Return (%)* | | | 11.53 | | | | 22.76 | | | | 43.75 | | | | (37.71 | ) | | | 12.34 | | | | 9.68 | |
Ratios to average daily net assets (%):** | | | | | | | | | | | | | | | | | | | | | | | | |
Expenses, net of waivers and reimbursements | | | 1.35 | | | | 1.35 | | | | 1.36 | | | | 1.36 | | | | 1.36 | | | | 1.38 | |
Expenses, before waivers and reimbursements | | | 1.44 | | | | 1.46 | | | | 1.49 | | | | 1.41 | | | | 1.42 | | | | 1.45 | |
Net investment income (loss), net of waivers and reimbursements | | | (0.80 | ) | | | (0.76 | ) | | | (0.60 | ) | | | (0.26 | ) | | | (0.79 | ) | | | (0.86 | ) |
Net investment income (loss), before waivers and reimbursements | | | (0.90 | ) | | | (0.87 | ) | | | (0.73 | ) | | | (0.31 | ) | | | (0.85 | ) | | | (0.93 | ) |
| | | | | | | | | | | | | | | | | | | | | | | | |
| | | Class I | |
| | | Period Ended
June 30, | | | Years Ended December 31, | |
| | | 2011 | | | 2010 | | | 2009 | | | 2008 | | | 2007 | | | 2006 | |
Net asset value, beginning of year | | $ | 14.68 | | | $ | 11.93 | | | $ | 8.27 | | | $ | 13.24 | | | $ | 13.06 | | | $ | 12.46 | |
Income (loss) from investment operations: | | | | | | | | | | | | | | | | | | | | | | | | |
Net investment income (loss) | | | (0.04 | ) | | | (0.06 | ) | | | (0.03 | ) | | | 0.00 | ^ | | | (0.08 | ) | | | (0.08 | ) |
Net realized and unrealized gain (loss) on investments | | | 1.76 | | | | 2.81 | | | | 3.69 | | | | (4.97 | ) | | | 1.71 | | | | 1.33 | |
| | | | | | | | | | | | | | | | | | | | | | | | |
Total from investment operations | | | 1.72 | | | | 2.75 | | | | 3.66 | | | | (4.97 | ) | | | 1.63 | | | | 1.25 | |
Less distributions from: | | | | | | | | | | | | | | | | | | | | | | | | |
Net investment income | | | — | | | | — | | | | 0.00 | ^ | | | — | | | | — | | | | — | |
Net realized gain | | | — | | | | — | | | | — | | | | 0.00 | ^ | | | 1.45 | | | | 0.65 | |
| | | | | | | | | | | | | | | | | | | | | | | | |
Total distributions | | | — | | | | — | | | | 0.00 | ^ | | | 0.00 | ^ | | | 1.45 | | | | 0.65 | |
| | | | | | | | | | | | | | | | | | | | | | | | |
Net asset value, end of year | | $ | 16.40 | | | $ | 14.68 | | | $ | 11.93 | | | $ | 8.27 | | | $ | 13.24 | | | $ | 13.06 | |
| | | | | | | | | | | | | | | | | | | | | | | | |
Total Return (%)* | | | 11.72 | | | | 23.05 | | | | 44.26 | | | | (37.54 | ) | | | 12.54 | | | | 9.95 | |
Ratios to average daily net assets (%):** | | | | | | | | | | | | | | | | | | | | | | | | |
Expenses, net of waivers and reimbursements | | | 1.10 | | | | 1.10 | | | | 1.11 | | | | 1.11 | | | | 1.11 | | | | 1.13 | |
Expenses, before waivers and reimbursements | | | 1.10 | | | | 1.11 | | | | 1.18 | | | | 1.17 | | | | 1.17 | | | | 1.20 | |
Net investment income (loss), net of waivers and reimbursements | | | (0.55 | ) | | | (0.50 | ) | | | (0.33 | ) | | | 0.03 | | | | (0.54 | ) | | | (0.61 | ) |
Net investment income (loss), before waivers and reimbursements | | | (0.55 | ) | | | (0.51 | ) | | | (0.40 | ) | | | (0.03 | ) | | | (0.60 | ) | | | (0.68 | ) |
| | | | | | | | | | | | | | | | | | | | | | | | |
| | | | |
| | | Period Ended
June 30, | | | Years Ended December 31, | |
| | | 2011 | | | 2010 | | | 2009 | | | 2008 | | | 2007 | | | 2006 | |
Supplemental data for all classes: | | | | | | | | | | | | | | | | | | | | | | | | |
Net assets at end of year (in thousands) | | $ | 264,913 | | | $ | 208,065 | | | $ | 146,828 | | | $ | 83,479 | | | $ | 124,501 | | | $ | 92,766 | |
Portfolio turnover rate (%)* | | | 39 | | | | 93 | | | | 112 | | | | 77 | | | | 80 | | | | 68 | |
| * | | Rates not annualized for periods that are less than a year. |
| ** | | Rates are annualized for periods that are less than a year. |
| ^ | | Amount is less than $0.005 per share. |
Performance cited represents past performance. Past performance does not guarantee future results and current performance may be lower or higher than the data quoted. Results shown are annual returns, which assume reinvestment of dividends and capital gains. Investment returns and principal will fluctuate and you may have a gain or loss when you sell shares. For the most current month-end performance information, please call 1-800-742-7272 or visit our Web site at www.williamblairfunds.com.
Note: Net investment income (loss) per share is based on the average shares outstanding during the year.
130 Semi-Annual Report | June 30, 2011 |
Financial Highlights
Global Growth Fund
| | | | | | | | | | | | | | | | | | | | |
| | | Class N | |
| | | Period Ended
June 30, | | | Periods Ended December 31, | |
| | | 2011 | | | 2010 | | | 2009 | | | 2008 | | | 2007(a) | |
Net asset value, beginning of year | | $ | 8.40 | | | $ | 6.97 | | | $ | 4.96 | | | $ | 9.89 | | | $ | 10.00 | |
Income (loss) from investment operations: | | | | | | | | | | | | | | | | | | | | |
Net investment income (loss) (b) | | | 0.03 | | | | (0.01 | ) | | | (0.01 | ) | | | 0.08 | | | | 0.00 | ^ |
Net realized and unrealized gain (loss) on investments | | | 0.49 | | | | 1.44 | | | | 2.02 | | | | (4.98 | ) | | | (0.11 | ) |
| | | | | | | | | | | | | | | | | | | | |
Total from investment operations | | | 0.52 | | | | 1.43 | | | | 2.01 | | | | (4.90 | ) | | | (0.11 | ) |
Less distributions from: | | | | | | | | | | | | | | | | | | | | |
Net investment income | | | — | | | | — | | | | — | | | | 0.03 | | | | 0.00 | ^ |
Net realized gain | | | — | | | | — | | | | — | | | | — | | | | — | |
| | | | | | | | | | | | | | | | | | | | |
Total distributions | | | — | | | | — | | | | — | | | | 0.03 | | | | 0.00 | ^ |
| | | | | | | | | | | | | | | | | | | | |
Net asset value, end of year | | $ | 8.92 | | | $ | 8.40 | | | $ | 6.97 | | | $ | 4.96 | | | $ | 9.89 | |
| | | | | | | | | | | | | | | | | | | | |
Total Return (%)* | | | 6.19 | | | | 20.52 | | | | 40.52 | | | | (49.52 | ) | | | (1.10 | ) |
Ratios to average daily net assets (%):** | | | | | | | | | | | | | | | | | | | | |
Expenses, net of waivers and reimbursements | | | 1.50 | | | | 1.52 | | | | 1.55 | | | | 1.55 | | | | 1.55 | |
Expenses, before waivers and reimbursements | | | 1.82 | | | | 1.93 | | | | 2.61 | | | | 2.17 | | | | 2.14 | |
Net investment income (loss), net of waivers and reimbursements | | | 0.67 | | | | (0.09 | ) | | | (0.17 | ) | | | 0.98 | | | | (0.08 | ) |
Net investment income (loss), before waivers and reimbursements | | | 0.35 | | | | (0.50 | ) | | | (1.23 | ) | | | 0.36 | | | | (0.67 | ) |
| | | | | | | | | | | | | | | | | | | | |
| | | Class I | |
| | | Period Ended
June 30, | | | Periods Ended December 31, | |
| | | 2011 | | | 2010 | | | 2009 | | | 2008 | | | 2007(a) | |
Net asset value, beginning of year | | $ | 8.40 | | | $ | 6.96 | | | $ | 4.94 | | | $ | 9.91 | | | $ | 10.00 | |
Income (loss) from investment operations: | | | | | | | | | | | | | | | | | | | | |
Net investment income (loss) (b) | | | 0.04 | | | | 0.01 | | | | 0.00 | ^ | | | 0.08 | | | | 0.00 | ^ |
Net realized and unrealized gain (loss) on investments | | | 0.49 | | | | 1.43 | | | | 2.02 | | | | (4.98 | ) | | | (0.09 | ) |
| | | | | | | | | | | | | | | | | | | | |
Total from investment operations | | | 0.53 | | | | 1.44 | | | | 2.02 | | | | (4.90 | ) | | | (0.09 | ) |
Less distributions from: | | | | | | | | | | | | | | | | | | | | |
Net investment income | | | — | | | | 0.00 | ^ | | | 0.00 | ^ | | | 0.07 | | | | 0.00 | ^ |
Net realized gain | | | — | | | | — | | | | — | | | | — | | | | — | |
| | | | | | | | | | | | | | | | | | | | |
Total distributions | | | — | | | | 0.00 | ^ | | | 0.00 | ^ | | | 0.07 | | | | 0.00 | ^ |
| | | | | | | | | | | | | | | | | | | | |
Net asset value, end of year | | $ | 8.93 | | | $ | 8.40 | | | $ | 6.96 | | | $ | 4.94 | | | $ | 9.91 | |
| | | | | | | | | | | | | | | | | | | | |
Total Return (%)* | | | 6.31 | | | | 20.73 | | | | 40.90 | | | | (49.41 | ) | | | (0.85 | ) |
Ratios to average daily net assets (%):** | | | | | | | | | | | | | | | | | | | | |
Expenses, net of waivers and reimbursements | | | 1.25 | | | | 1.27 | | | | 1.30 | | | | 1.30 | | | | 1.30 | |
Expenses, before waivers and reimbursements | | | 1.55 | | | | 1.62 | | | | 1.62 | | | | 1.74 | | | | 1.89 | |
Net investment income (loss), net of waivers and reimbursements | | | 0.94 | | | | 0.16 | | | | 0.05 | | | | 1.05 | | | | 0.14 | |
Net investment income (loss), before waivers and reimbursements | | | 0.64 | | | | (0.27 | ) | | | (0.27 | ) | | | 0.61 | | | | (0.45 | ) |
| | | | | | | | | | | | | | | | | | | | |
| | | | |
| | | Period Ended
June 30, | | | Periods Ended December 31, | |
| | | 2011 | | | 2010 | | | 2009 | | | 2008 | | | 2007(a) | |
Supplemental data for all classes: | | | | | | | | | | | | | | | | | | | | |
Net assets at end of year (in thousands) | | $ | 48,435 | | | $ | 44,877 | | | $ | 38,287 | | | $ | 28,005 | | | $ | 45,576 | |
Portfolio turnover rate (%)* | | | 44 | | | | 96 | | | | 133 | | | | 124 | | | | 63 | |
| (a) | | For the period October 15, 2007 (Commencement of Operations) to December 31, 2007. |
| (b) | | Excludes $0.00, $0.00, $0.00 and $0.00 of PFIC mark to market which is treated as ordinary income for Federal tax purposes for the years 2010, 2009, 2008 and 2007, respectively. |
| * | | Rates not annualized for periods that are less than a year. |
| ** | | Rates are annualized for periods that are less than a year. |
| ^ | | Amount is less than $0.005 per share. |
Performance cited represents past performance. Past performance does not guarantee future results and current performance may be lower or higher than the data quoted. Results shown are annual returns, which assume reinvestment of dividends and capital gains. Investment returns and principal will fluctuate and you may have a gain or loss when you sell shares. For the most current month-end performance information, please call 1-800-742-7272 or visit our Web site at www.williamblairfunds.com.
Note: Net investment income (loss) per share is based on the average shares outstanding during the year.
June 30, 2011 | William Blair Funds 131 |
Financial Highlights
International Growth Fund
| | | | | | | | | | | | | | | | | | | | | | | | |
| | | Class N | |
| | | Period Ended
June 30, | | | Years Ended December 31, | |
| | | 2011 | | | 2010 | | | 2009 | | | 2008 | | | 2007 | | | 2006 | |
Net asset value, beginning of year | | $ | 21.85 | | | $ | 18.55 | | | $ | 13.12 | | | $ | 29.12 | | | $ | 27.70 | | | $ | 25.22 | |
Income (loss) from investment operations: | | | | | | | | | | | | | | | | | | | | | | | | |
Net investment income (loss) (a) | | | 0.19 | | | | 0.14 | | | | 0.07 | | | | 0.29 | | | | 0.12 | | | | 0.05 | |
Net realized and unrealized gain (loss) on investments | | | 0.24 | | | | 3.58 | | | | 5.47 | | | | (15.54 | ) | | | 4.77 | | | | 5.71 | |
| | | | | | | | | | | | | | | | | | | | | | | | |
Total from investment operations | | | 0.43 | | | | 3.72 | | | | 5.54 | | | | (15.25 | ) | | | 4.89 | | | | 5.76 | |
Less distributions from: | | | | | | | | | | | | | | | | | | | | | | | | |
Net investment income | | | — | | | | 0.42 | | | | 0.11 | | | | — | | | | 0.34 | | | | 0.37 | |
Net realized gain | | | — | | | | — | | | | — | | | | 0.75 | | | | 3.13 | | | | 2.91 | |
| | | | | | | | | | | | | | | | | | | | | | | | |
Total distributions | | | — | | | | 0.42 | | | | 0.11 | | | | 0.75 | | | | 3.47 | | | | 3.28 | |
| | | | | | | | | | | | | | | | | | | | | | | | |
Net asset value, end of year | | $ | 22.28 | | | $ | 21.85 | | | $ | 18.55 | | | $ | 13.12 | | | $ | 29.12 | | | $ | 27.70 | |
| | | | | | | | | | | | | | | | | | | | | | | | |
Total Return (%)* | | | 1.97 | | | | 20.09 | | | | 42.27 | | | | (52.33 | ) | | | 18.13 | | | | 23.06 | |
Ratios to aveage daily net assets (%):** | | | | | | | | | | | | | | | | | | | | | | | | |
Expenses, net of waivers and reimbursements | | | 1.45 | | | | 1.42 | | | | 1.45 | | | | 1.39 | | | | 1.40 | | | | 1.42 | |
Expenses, before waivers and reimbursements | | | 1.45 | | | | 1.43 | | | | 1.46 | | | | 1.39 | | | | 1.40 | | | | 1.42 | |
Net investment income (loss), net of waivers and reimbursements | | | 1.75 | | | | 0.73 | | | | 0.48 | | | | 1.29 | | | | 0.38 | | | | 0.19 | |
Net investment income (loss), before waivers and reimbursements | | | 1.75 | | | | 0.73 | | | | 0.47 | | | | 1.29 | | | | 0.38 | | | | 0.19 | |
| |
| | | Class I | |
| | | Period Ended
June 30, | | | Years Ended December 31, | |
| | | 2011 | | | 2010 | | | 2009 | | | 2008 | | | 2007 | | | 2006 | |
Net asset value, beginning of year | | $ | 22.34 | | | $ | 18.95 | | | $ | 13.40 | | | $ | 29.61 | | | $ | 28.10 | | | $ | 25.55 | |
Income (loss) from investment operations: | | | | | | | | | | | | | | | | | | | | | | | | |
Net investment income (loss) (a) | | | 0.23 | | | | 0.20 | | | | 0.12 | | | | 0.37 | | | | 0.21 | | | | 0.13 | |
Net realized and unrealized gain (loss) on investments | | | 0.24 | | | | 3.67 | | | | 5.59 | | | | (15.83 | ) | | | 4.86 | | | | 5.78 | |
| | | | | | | | | | | | | | | | | | | | | | | | |
Total from investment operations | | | 0.47 | | | | 3.87 | | | | 5.71 | | | | (15.46 | ) | | | 5.07 | | | | 5.91 | |
Less distributions from: | | | | | | | | | | | | | | | | | | | | | | | | |
Net investment income | | | — | | | | 0.48 | | | | 0.16 | | | | — | | | | 0.43 | | | | 0.45 | |
Net realized gain | | | — | | | | — | | | | — | | | | 0.75 | | | | 3.13 | | | | 2.91 | |
| | | | | | | | | | | | | | | | | | | | | | | | |
Total distributions | | | — | | | | 0.48 | | | | 0.16 | | | | 0.75 | | | | 3.56 | | | | 3.36 | |
| | | | | | | | | | | | | | | | | | | | | | | | |
Net asset value, end of year | | $ | 22.81 | | | $ | 22.34 | | | $ | 18.95 | | | $ | 13.40 | | | $ | 29.61 | | | $ | 28.10 | |
| | | | | | | | | | | | | | | | | | | | | | | | |
Total Return (%)* | | | 2.10 | | | | 20.47 | | | | 42.63 | | | | (52.17 | ) | | | 18.53 | | | | 23.35 | |
Ratios to aveage daily net assets (%):** | | | | | | | | | | | | | | | | | | | | | | | | |
Expenses | | | 1.13 | | | | 1.14 | | | | 1.17 | | | | 1.08 | | | | 1.09 | | | | 1.11 | |
Net investment income (loss) | | | 2.09 | | | | 0.99 | | | | 0.74 | | | | 1.58 | | | | 0.69 | | | | 0.45 | |
| | | | | | | | | | | | | | | | | | | | | | | | |
| | | | |
| | | Period Ended
June 30, | | | Years Ended December 31, | |
| | | 2011 | | | 2010 | | | 2009 | | | 2008 | | | 2007 | | | 2006 | |
Supplemental data for all classes: | | | | | | | | | | | | | | | | | | | | | | | | |
Net assets at end of year (in thousands) | | $ | 4,784,623 | | | $ | 5,082,179 | | | $ | 4,473,408 | | | $ | 3,130,938 | | | $ | 8,048,654 | | | $ | 6,267,126 | |
Portfolio turnover rate (%)* | | | 52 | | | | 99 | | | | 121 | | | | 91 | | | | 56 | | | | 72 | |
| (a) | | Excludes $0.13,$0.08, $(0.18), $0.09, and $0.42 of PFIC mark to market which is treated as ordinary income for Federal tax purposes for the years 2010, 2009, 2008, 2007, and 2006, respectively. |
| * | | Rates not annualized for periods that are less than a year. |
| ** | | Rates are annualized for periods that are less than a year. |
Performance cited represents past performance. Past performance does not guarantee future results and current performance may be lower or higher than the data quoted. Results shown are annual returns, which assume reinvestment of dividends and capital gains. Investment returns and principal will fluctuate and you may have a gain or loss when you sell shares. For the most current month-end performance information, please call 1-800-742-7272 or visit our Web site at www.williamblairfunds.com.
Note: Net investment income (loss) per share is based on the average shares outstanding during the year.
132 Semi-Annual Report | June 30, 2011 |
Financial Highlights
International Equity Fund
| | | | | | | | | | | | | | | | | | | | | | | | |
| | | Class N | |
| | | Period Ended
June 30, | | | Years Ended December 31, | |
| | | 2011 | | | 2010 | | | 2009 | | | 2008 | | | 2007 | | | 2006 | |
Net asset value, beginning of year | | $ | 12.12 | | | $ | 11.07 | | | $ | 8.35 | | | $ | 16.53 | | | $ | 15.21 | | | $ | 12.86 | |
Income (loss) from investment operations: | | | | | | | | | | | | | | | | | | | | | | | | |
Net investment income (loss) (a) | | | 0.11 | | | | 0.06 | | | | 0.09 | | | | 0.10 | | | | 0.09 | | | | 0.04 | |
Net realized and unrealized gain (loss) on investments | | | 0.28 | | | | 1.15 | | | | 2.64 | | | | (8.16 | ) | | | 2.55 | | | | 2.52 | |
| | | | | | | | | | | | | | | | | | | | | | | | |
Total from investment operations | | | 0.39 | | | | 1.21 | | | | 2.73 | | | | (8.06 | ) | | | 2.64 | | | | 2.56 | |
Less distributions from: | | | | | | | | | | | | | | | | | | | | | | | | |
Net investment income | | | — | | | | 0.16 | | | | 0.01 | | | | — | | | | 0.14 | | | | 0.19 | |
Net realized gain | | | — | | | | — | | | | — | | | | 0.12 | | | | 1.18 | | | | 0.02 | |
| | | | | | | | | | | | | | | | | | | | | | | | |
Total distributions | | | — | | | | 0.16 | | | | 0.01 | | | | 0.12 | | | | 1.32 | | | | 0.21 | |
| | | | | | | | | | | | | | | | | | | | | | | | |
Net asset value, end of year | | $ | 12.51 | | | $ | 12.12 | | | $ | 11.07 | | | $ | 8.35 | | | $ | 16.53 | | | $ | 15.21 | |
| | | | | | | | | | | | | | | | | | | | | | | | |
Total Return (%)* | | | 3.22 | | | | 10.92 | | | | 32.69 | | | | (48.75 | ) | | | 17.68 | | | | 19.96 | |
Ratios to aveage daily net assets (%):** | | | | | | | | | | | | | | | | | | | | | | | | |
Expenses, net of waivers and reimbursements | | | 1.45 | | | | 1.45 | | | | 1.45 | | | | 1.45 | | | | 1.45 | | | | 1.46 | |
Expenses, before waivers and reimbursements | | | 1.58 | | | | 1.66 | | | | 1.59 | | | | 1.45 | | | | 1.47 | | | | 1.56 | |
Net investment income (loss), net of waivers and reimbursements | | | 1.75 | | | | 0.55 | | | | 1.03 | | | | 0.80 | | | | 0.52 | | | | 0.26 | |
Net investment income (loss), before waivers and reimbursements | | | 1.62 | | | | 0.34 | | | | 0.89 | | | | 0.80 | | | | 0.50 | | | | 0.16 | |
| |
| | | Class I | |
| | | Period Ended
June 30, | | | Years Ended December 31, | |
| | | 2011 | | | 2010 | | | 2009 | | | 2008 | | | 2007 | | | 2006 | |
Net asset value, beginning of year | | $ | 12.22 | | | $ | 11.16 | | | $ | 8.44 | | | $ | 16.66 | | | $ | 15.31 | | | $ | 12.94 | |
Income (loss) from investment operations: | | | | | | | | | | | | | | | | | | | | | | | | |
Net investment income (loss) (a) | | | 0.12 | | | | 0.10 | | | | 0.08 | | | | 0.15 | | | | 0.13 | | | | 0.06 | |
Net realized and unrealized gain (loss) on investments | | | 0.29 | | | | 1.15 | | | | 2.70 | | | | (8.25 | ) | | | 2.57 | | | | 2.55 | |
| | | | | | | | | | | | | | | | | | | | | | | | |
Total from investment operations | | | 0.41 | | | | 1.25 | | | | 2.78 | | | | (8.10 | ) | | | 2.70 | | | | 2.61 | |
Less distributions from: | | | | | | | | | | | | | | | | | | | | | | | | |
Net investment income | | | — | | | | 0.19 | | | | 0.06 | | | | — | | | | 0.17 | | | | 0.22 | |
Net realized gain | | | — | | | | — | | | | — | | | | 0.12 | | | | 1.18 | | | | 0.02 | |
| | | | | | | | | | | | | | | | | | | | | | | | |
Total distributions | | | — | | | | 0.19 | | | | 0.06 | | | | 0.12 | | | | 1.35 | | | | 0.24 | |
| | | | | | | | | | | | | | | | | | | | | | | | |
Net asset value, end of year | | $ | 12.63 | | | $ | 12.22 | | | $ | 11.16 | | | $ | 8.44 | | | $ | 16.66 | | | $ | 15.31 | |
| | | | | | | | | | | | | | | | | | | | | | | | |
Total Return (%)* | | | 3.36 | | | | 11.19 | | | | 32.93 | | | | (48.61 | ) | | | 17.97 | | | | 20.22 | |
Ratios to aveage daily net assets (%):** | | | | | | | | | | | | | | | | | | | | | | | | |
Expenses, net of waivers and reimbursements | | | 1.20 | | | | 1.20 | | | | 1.20 | | | | 1.20 | | | | 1.20 | | | | 1.21 | |
Expenses, before waivers and reimbursements | | | 1.29 | | | | 1.28 | | | | 1.39 | | | | 1.22 | | | | 1.25 | | | | 1.35 | |
Net investment income (loss), net of waivers and reimbursements | | | 1.98 | | | | 0.88 | | | | 0.86 | | | | 1.12 | | | | 0.76 | | | | 0.46 | |
Net investment income (loss), before waivers and reimbursements | | | 1.89 | | | | 0.80 | | | | 0.67 | | | | 1.10 | | | | 0.71 | | | | 0.32 | |
| | | | | | | | | | | | | | | | | | | | | | | | |
| | | | |
| | | Period Ended
June 30, | | | Years Ended December 31, | |
| | | 2011 | | | 2010 | | | 2009 | | | 2008 | | | 2007 | | | 2006 | |
Supplemental data for all classes: | | | | | | | | | | | | | | | | | | | | | | | | |
Net assets at end of year (in thousands) | | $ | 113,139 | | | $ | 178,055 | | | $ | 298,168 | | | $ | 228,486 | | | $ | 408,609 | | | $ | 297,716 | |
Portfolio turnover rate (%)* | | | 49 | | | | 71 | | | | 88 | | | | 92 | | | | 70 | | | | 83 | |
| (a) | | Excludes $0.04, $0.00, $0.00, $(0.07), and $0.01 of PFIC mark to market which is treated as ordinary income for Federal tax purposes for the years 2010, 2009, 2008, 2007 and 2006, respectively. |
| * | | Rates not annualized for periods that are less than a year. |
| ** | | Rates are annualized for periods that are less than a year. |
Performance cited represents past performance. Past performance does not guarantee future results and current performance may be lower or higher than the data quoted. Results shown are annual returns, which assume reinvestment of dividends and capital gains. Investment returns and principal will fluctuate and you may have a gain or loss when you sell shares. For the most current month-end performance information, please call 1-800-742-7272 or visit our Web site at www.williamblairfunds.com.
Note: Net investment income (loss) per share is based on the average shares outstanding during the year.
June 30, 2011 | William Blair Funds 133 |
Financial Highlights
International Small Cap Growth Fund
| | | | | | | | | | | | | | | | | | | | | | | | |
| | | Class N | |
| | | Period Ended
June 30, | | | Years Ended December 31, | |
| | | 2011 | | | 2010 | | | 2009 | | | 2008 | | | 2007 | | | 2006 | |
Net asset value, beginning of year | | $ | 13.07 | | | $ | 10.40 | | | $ | 6.62 | | | $ | 13.98 | | | $ | 13.37 | | | $ | 11.16 | |
Income (loss) from investment operations: | | | | | | | | | | | | | | | | | | | | | | | | |
Net investment income (loss) (a) | | | 0.06 | | | | 0.03 | | | | (0.01 | ) | | | (0.02 | ) | | | (0.02 | ) | | | (0.05 | ) |
Net realized and unrealized gain (loss) on investments | | | 0.65 | | | | 2.66 | | | | 3.79 | | | | (7.22 | ) | | | 1.72 | | | | 2.32 | |
| | | | | | | | | | | | | | | | | | | | | | | | |
Total from investment operations | | | 0.71 | | | | 2.69 | | | | 3.78 | | | | (7.24 | ) | | | 1.70 | | | | 2.27 | |
Less distributions from: | | | | | | | | | | | | | | | | | | | | | | | | |
Net investment income | | | — | | | | 0.02 | | | | — | | | | — | | | | 0.05 | | | | 0.01 | |
Net realized gain | | | — | | | | — | | | | — | | | | 0.12 | | | | 1.04 | | | | 0.05 | |
| | | | | | | | | | | | | | | | | | | | | | | | |
Total distributions | | | — | | | | 0.02 | | | | — | | | | 0.12 | | | | 1.09 | | | | 0.06 | |
| | | | | | | | | | | | | | | | | | | | | | | | |
Net asset value, end of year | | $ | 13.78 | | | $ | 13.07 | | | $ | 10.40 | | | $ | 6.62 | | | $ | 13.98 | | | $ | 13.37 | |
| | | | | | | | | | | | | | | | | | | | | | | | |
Total Return (%)* | | | 5.43 | | | | 25.88 | | | | 57.10 | | | | (51.82 | ) | | | 13.06 | | | | 20.32 | |
Ratios to aveage daily net assets (%):** | | | | | | | | | | | | | | | | | | | | | | | | |
Expenses, net of waivers and reimbursements | | | 1.61 | | | | 1.55 | | | | 1.65 | | | | 1.65 | | | | 1.60 | | | | 1.65 | |
Expenses, before waivers and reimbursements | | | 1.61 | | | | 1.55 | | | | 1.83 | | | | 1.62 | | | | 1.60 | | | | 1.71 | |
Net investment income (loss), net of waivers and reimbursements | | | 0.92 | | | | 0.30 | | | | (0.16 | ) | | | (0.20 | ) | | | (0.16 | ) | | | (0.40 | ) |
Net investment income (loss), before waivers and reimbursements | | | 0.92 | | | | 0.30 | | | | (0.34 | ) | | | (0.17 | ) | | | (0.16 | ) | | | (0.46 | ) |
| | | | | | | | | | | | | | | | | | | | | | | | |
| | | Class I | |
| | | Period Ended
June 30, | | | Years Ended December 31, | |
| | | 2011 | | | 2010 | | | 2009 | | | 2008 | | | 2007 | | | 2006 | |
Net asset value, beginning of year | | $ | 13.19 | | | $ | 10.49 | | | $ | 6.67 | | | $ | 14.01 | | | $ | 13.41 | | | $ | 11.16 | |
Income (loss) from investment operations: | | | | | | | | | | | | | | | | | | | | | | | | |
Net investment income (loss) (a) | | | 0.09 | | | | 0.07 | | | | 0.01 | | | | 0.01 | | | | 0.03 | | | | (0.03 | ) |
Net realized and unrealized gain (loss) on investments | | | 0.66 | | | | 2.68 | | | | 3.83 | | | | (7.23 | ) | | | 1.71 | | | | 2.34 | |
| | | | | | | | | | | | | | | | | | | | | | | | |
Total from investment operations | | | 0.75 | | | | 2.75 | | | | 3.84 | | | | (7.22 | ) | | | 1.74 | | | | 2.31 | |
Less distributions from: | | | | | | | | | | | | | | | | | | | | | | | | |
Net investment income | | | — | | | | 0.05 | | | | 0.02 | | | | — | | | | 0.10 | | | | 0.01 | |
Net realized gain | | | — | | | | — | | | | — | | | | 0.12 | | | | 1.04 | | | | 0.05 | |
| | | | | | | | | | | | | | | | | | | | | | | | |
Total distributions | | | — | | | | 0.05 | | | | 0.02 | | | | 0.12 | | | | 1.14 | | | | 0.06 | |
| | | | | | | | | | | | | | | | | | | | | | | | |
Net asset value, end of year | | $ | 13.94 | | | $ | 13.19 | | | $ | 10.49 | | | $ | 6.67 | | | $ | 14.01 | | | $ | 13.41 | |
| | | | | | | | | | | | | | | | | | | | | | | | |
Total Return (%)* | | | 5.69 | | | | 26.24 | | | | 57.51 | | | | (51.56 | ) | | | 13.34 | | | | 20.68 | |
Ratios to aveage daily net assets (%):** | | | | | | | | | | | | | | | | | | | | | | | | |
Expenses, net of waivers and reimbursements | | | 1.25 | | | | 1.25 | | | | 1.31 | | | | 1.31 | | | | 1.29 | | | | 1.40 | |
Expenses, before waivers and reimbursements | | | 1.25 | | | | 1.25 | | | | 1.31 | | | | 1.28 | | | | 1.29 | | | | 1.46 | |
Net investment income (loss), net of waivers and reimbursements | | | 1.34 | | | | 0.61 | | | | 0.11 | | | | 0.11 | | | | 0.18 | | | | (0.25 | ) |
Net investment income (loss), before waivers and reimbursements | | | 1.34 | | | | 0.61 | | | | 0.11 | | | | 0.14 | | | | 0.18 | | | | (0.31 | ) |
| | | | | | | | | | | | | | | | | | | | | | | | |
| | | | |
| | | Period Ended
June 30, | | | Years Ended December 31, | |
| | | 2011 | | | 2010 | | | 2009 | | | 2008 | | | 2007 | | | 2006 | |
Supplemental data for all classes: | | | | | | | | | | | | | | | | | | | | | | | | |
Net assets at end of year (in thousands) | | $ | 768,599 | | | $ | 646,951 | | | $ | 390,851 | | | $ | 291,988 | | | $ | 401,459 | | | $ | 231,969 | |
Portfolio turnover rate (%)* | | | 44 | | | | 85 | | | | 136 | | | | 78 | | | | 88 | | | | 109 | |
| (a) | | Excludes $0.15, $0.01, $(0.02), $0.05, and $0.00 of PFIC mark to market which is treated as ordinary income for Federal tax purposes for the years 2010, 2009, 2008, 2007, and 2006, respectively. |
| * | | Rates not annualized for periods that are less than a year. |
| ** | | Rates are annualized for periods that are less than a year. |
Performance cited represents past performance. Past performance does not guarantee future results and current performance may be lower or higher than the data quoted. Results shown are annual returns, which assume reinvestment of dividends and capital gains. Investment returns and principal will fluctuate and you may have a gain or loss when you sell shares. For the most current month-end performance information, please call 1-800-742-7272 or visit our Web site at www.williamblairfunds.com.
Note: Net investment income (loss) per share is based on the average shares outstanding during the year.
134 Semi-Annual Report | June 30, 2011 |
Financial Highlights
Emerging Markets Growth Fund
| | | | | | | | | | | | | | | | | | | | | | | | |
| | | Class N | |
| | | Period Ended
June 30, | | | Years Ended December 31, | |
| | | 2011 | | | 2010 | | | 2009 | | | 2008 | | | 2007 | | | 2006 | |
Net asset value, beginning of year | | $ | 15.76 | | | $ | 12.87 | | | $ | 7.46 | | | $ | 21.92 | | | $ | 19.42 | | | $ | 14.17 | |
Income (loss) from investment operations: | | | | | | | | | | | | | | | | | | | | | | | | |
Net investment income (loss) (a) | | | 0.06 | | | | (0.01 | ) | | | 0.00 | ^ | | | 0.11 | | | | (0.10 | ) | | | (0.04 | ) |
Net realized and unrealized gain (loss) on investments | | | (0.17 | ) | | | 3.02 | | | | 5.51 | | | | (13.63 | ) | | | 7.23 | | | | 5.41 | |
| | | | | | | | | | | | | | | | | | | | | | | | |
Total from investment operations | | | (0.11 | ) | | | 3.01 | | | | 5.51 | | | | (13.52 | ) | | | 7.13 | | | | 5.37 | |
Less distributions from: | | | | | | | | | | | | | | | | | | | | | | | | |
Net investment income | | | — | | | | 0.12 | | | | 0.10 | | | | — | | | | 0.09 | | | | 0.01 | |
Net realized gain | | | — | | | | — | | | | — | | | | 0.94 | | | | 4.54 | | | | 0.11 | |
| | | | | | | | | | | | | | | | | | | | | | | | |
Total distributions | | | — | | | | 0.12 | | | | 0.10 | | | | 0.94 | | | | 4.63 | | | | 0.12 | |
| | | | | | | | | | | | | | | | | | | | | | | | |
Net asset value, end of year | | $ | 15.65 | | | $ | 15.76 | | | $ | 12.87 | | | $ | 7.46 | | | $ | 21.92 | | | $ | 19.42 | |
| | | | | | | | | | | | | | | | | | | | | | | | |
Total Return (%)* | | | (0.70 | ) | | | 23.44 | | | | 73.85 | | | | (61.71 | ) | | | 37.75 | | | | 37.90 | |
Ratios to average daily net assets (%):** | | | | | | | | | | | | | | | | | | | | | | | | |
Expenses, net of waivers and reimbursements | | | 1.66 | | | | 1.63 | | | | 1.70 | | | | 1.67 | | | | 1.65 | | | | 1.65 | |
Expenses, before waivers and reimbursements | | | 1.66 | | | | 1.63 | | | | 1.81 | | | | 1.65 | | | | 1.69 | | | | 1.78 | |
Net investment income (loss), net of waivers and reimbursements | | | 0.75 | | | | (0.05 | ) | | | 0.04 | | | | 0.65 | | | | (0.45 | ) | | | (0.22 | ) |
Net investment income (loss), before waivers and reimbursements | | | 0.75 | | | | (0.05 | ) | | | (0.07 | ) | | | 0.67 | | | | (0.49 | ) | | | (0.35 | ) |
| |
| | | Class I | |
| | | Period Ended
June 30, | | | Years Ended December 31, | |
| | | 2011 | | | 2010 | | | 2009 | | | 2008 | | | 2007 | | | 2006 | |
Net asset value, beginning of year | | $ | 15.87 | | | $ | 12.95 | | | $ | 7.51 | | | $ | 21.99 | | | $ | 19.47 | | | $ | 14.19 | |
Income (loss) from investment operations: | | | | | | | | | | | | | | | | | | | | | | | | |
Net investment income (loss) (a) | | | 0.08 | | | | 0.04 | | | | 0.03 | | | | 0.15 | | | | (0.04 | ) | | | (0.01 | ) |
Net realized and unrealized gain (loss) on investments | | | (0.17 | ) | | | 3.03 | | | | 5.54 | | | | (13.69 | ) | | | 7.26 | | | | 5.41 | |
| | | | | | | | | | | | | | | | | | | | | | | | |
Total from investment operations | | | (0.09 | ) | | | 3.07 | | | | 5.57 | | | | (13.54 | ) | | | 7.22 | | | | 5.40 | |
Less distributions from: | | | | | | | | | | | | | | | | | | | | | | | | |
Net investment income | | | — | | | | 0.15 | | | | 0.13 | | | | — | | | | 0.16 | | | | 0.01 | |
Net realized gain | | | — | | | | — | | | | — | | | | 0.94 | | | | 4.54 | | | | 0.11 | |
| | | | | | | | | | | | | | | | | | | | | | | | |
Total distributions | | | — | | | | 0.15 | | | | 0.13 | | | | 0.94 | | | | 4.70 | | | | 0.12 | |
| | | | | | | | | | | | | | | | | | | | | | | | |
Net asset value, end of year | | $ | 15.78 | | | $ | 15.87 | | | $ | 12.95 | | | $ | 7.51 | | | $ | 21.99 | | | $ | 19.47 | |
| | | | | | | | | | | | | | | | | | | | | | | | |
Total Return (%)* | | | (0.57 | ) | | | 23.77 | | | | 74.18 | | | | (61.60 | ) | | | 38.13 | | | | 38.07 | |
Ratios to average daily net assets (%):** | | | | | | | | | | | | | | | | | | | | | | | | |
Expenses, net of waivers and reimbursements | | | 1.35 | | | | 1.36 | | | | 1.41 | | | | 1.41 | | | | 1.40 | | | | 1.40 | |
Expenses, before waivers and reimbursements | | | 1.35 | | | | 1.36 | | | | 1.41 | | | | 1.39 | | | | 1.40 | | | | 1.47 | |
Net investment income (loss), net of waivers and reimbursements | | | 1.10 | | | | 0.26 | | | | 0.31 | | | | 0.91 | | | | (0.20 | ) | | | (0.06 | ) |
Net investment income (loss), before waivers and reimbursements | | | 1.10 | | | | 0.26 | | | | 0.31 | | | | 0.93 | | | | (0.20 | ) | | | (0.13 | ) |
| | | | | | | | | | | | | | | | | | | | | | | | |
| | | | |
| | | Period Ended
June 30, | | | Years Ended December 31, | |
| | | 2011 | | | 2010 | | | 2009 | | | 2008 | | | 2007 | | | 2006 | |
Supplemental data for all classes: | | | | | | | | | | | | | | | | | | | | | | | | |
Net assets at end of year (in thousands) | | $ | 879,589 | | | $ | 1,250,543 | | | $ | 1,038,260 | | | $ | 385,588 | | | $ | 1,165,854 | | | $ | 813,649 | |
Portfolio turnover rate (%)* | | | 53 | | | | 121 | | | | 113 | | | | 118 | | | | 100 | | | | 113 | |
| (a) | | Excludes $0.11, $0.15, $(0.09), $0.21, and $0.00 of PFIC mark to market which is treated as ordinary income for Federal tax purposes for the years 2010, 2009, 2008, 2007 and 2006 respectively. |
| * | | Rates not annualized for periods that are less than a year. |
| ** | | Rates are annualized for periods that are less than a year. |
| ^ | | Amount is less than $0.005 per share. |
Performance cited represents past performance. Past performance does not guarantee future results and current performance may be lower or higher than the data quoted. Results shown are annual returns, which assume reinvestment of dividends and capital gains. Investment returns and principal will fluctuate and you may have a gain or loss when you sell shares. For the most current month-end performance information, please call 1-800-742-7272 or visit our Web site at www.williamblairfunds.com.
Note: Net investment income (loss) per share is based on the average shares outstanding during the year.
June 30, 2011 | William Blair Funds 135 |
Financial Highlights
Emerging Leaders Growth Fund
| | | | | | | | |
| | | Class N | |
| | | Period Ended
June 30, | | | Period Ended
December 31, | |
| | | 2011 | | | 2010(a) | |
Net asset value, beginning of year | | $ | 10.34 | | | $ | 8.80 | |
Income (loss) from investment operations: | | | | | | | | |
Net investment income (loss) (c) | | | 0.03 | | | | (0.02 | ) |
Net realized and unrealized gain (loss) on investments | | | (0.28 | ) | | | 1.64 | |
| | | | | | | | |
Total from investment operations | | | (0.25 | ) | | | 1.62 | |
Less distributions from: | | | | | | | | |
Net investment income | | | (0.06 | ) | | | 0.02 | |
Net realized gain | | | 0.06 | | | | 0.06 | |
| | | | | | | | |
Total distributions | | | — | | | | 0.08 | |
| | | | | | | | |
Net asset value, end of year | | $ | 10.09 | | | $ | 10.34 | |
| | | | | | | | |
Total Return (%)* | | | (2.42 | ) | | | 18.43 | |
Ratios to average daily net assets (%):** | | | | | | | | |
Expenses, net of waivers and reimbursements | | | 1.65 | | | | 1.65 | |
Expenses, before waivers and reimbursements | | | 1.81 | | | | 1.71 | |
Net investment income (loss), net of waivers and reimbursements | | | 0.65 | | | | (0.38 | ) |
Net investment income (loss), before waivers and reimbursements | | | 0.49 | | | | (0.44 | ) |
| | | | | | | | | | | | | | | | |
| | | Class I | |
| | | Period Ended
June 30, | | | Periods Ended December 31, | |
| | | 2011 | | | 2010 | | | 2009 | | | 2008(b) | |
Net asset value, beginning of year | | $ | 10.35 | | | $ | 8.43 | | | $ | 4.79 | | | $ | 10.00 | |
Income (loss) from investment operations: | | | | | | | | | | | | | | | | |
Net investment income (loss) (c) | | | 0.05 | | | | 0.02 | | | | 0.02 | | | | 0.04 | |
Net realized and unrealized gain (loss) on investments | | | (0.30 | ) | | | 1.98 | | | | 3.73 | | | | (5.25 | ) |
| | | | | | | | | | | | | | | | |
Total from investment operations | | | (0.25 | ) | | | 2.00 | | | | 3.75 | | | | (5.21 | ) |
Less distributions from: | | | | | | | | | | | | | | | | |
Net investment income | | | (0.06 | ) | | | 0.02 | | | | 0.11 | | | | 0.00 | ^ |
Net realized gain | | | 0.06 | | | | 0.06 | | | | — | | | | — | |
| | | | | | | | | | | | | | | | |
Total distributions | | | — | | | | 0.08 | | | | 0.11 | | | | 0.00 | ^ |
| | | | | | | | | | | | | | | | |
Net asset value, end of year | | $ | 10.10 | | | $ | 10.35 | | | $ | 8.43 | | | $ | 4.79 | |
| | | | | | | | | | | | | | | | |
Total Return (%)* | | | (2.42 | ) | | | 23.70 | | | | 78.38 | | | | (52.09 | ) |
Ratios to average daily net assets (%):** | | | | | | | | | | | | | | | | |
Expenses, net of waivers and reimbursements | | | 1.40 | | | | 1.40 | | | | 1.40 | | | | 1.40 | |
Expenses, before waivers and reimbursements | | | 1.54 | | | | 1.52 | | | | 1.54 | | | | 1.56 | |
Net investment income (loss), net of waivers and reimbursements | | | 0.97 | | | | 0.25 | | | | 0.37 | | | | 0.70 | |
Net investment income (loss), before waivers and reimbursements | | | 0.83 | | | | 0.13 | | | | 0.23 | | | | 0.54 | |
| |
| | | | |
| | | Period Ended
June 30, | | | Periods Ended December 31, | |
| | | 2011 | | | 2010 | | | 2009 | | | 2008(b) | |
Supplemental data for all classes: | | | | | | | | | | | | | | | | |
Net assets at end of year (in thousands) | | $ | 100,402 | | | $ | 94,901 | | | $ | 115,136 | | | $ | 46,676 | |
Portfolio turnover rate (%)* | | | 102 | | | | 176 | | | | 176 | | | | 151 | |
| (a) | | For the period May 3, 2010 (Commencement of Operations) to December 31, 2010. |
| (b) | | For the period March 26, 2008 (Commencement of Operations) to December 31, 2008. |
| (c) | | Excludes $0.96, $1.29 and $0.00 of PFIC mark to market which is treated as ordinary income for Federal tax purposes for the years 2010, 2009 and 2008 respectively. |
| * | | Rates not annualized for periods that are less than a year. |
| ** | | Rates are annualized for periods that are less than a year. |
| ^ | | Amount is less than $0.005 per share. |
Performance cited represents past performance. Past performance does not guarantee future results and current performance may be lower or higher than the data quoted. Results shown are annual returns, which assume reinvestment of dividends and capital gains. Investment returns and principal will fluctuate and you may have a gain or loss when you sell shares. For the most current month-end performance information, please call 1-800-742-7272 or visit our Web site at www.williamblairfunds.com.
Note: Net investment income (loss) per share is based on the average shares outstanding during the year.
136 Semi-Annual Report | June 30, 2011 |
Financial Highlights
Small Cap Value Fund
| | | | | | | | | | | | | | | | | | | | | | | | |
| | | Class N | |
| | | Period Ended
June 30, | | | Years Ended December 31, | |
| | | 2011 | | | 2010 | | | 2009 | | | 2008 | | | 2007 | | | 2006 | |
Net asset value, beginning of year | | $ | 13.71 | | | $ | 10.49 | | | $ | 8.33 | | | $ | 11.31 | | | $ | 16.27 | | | $ | 14.95 | |
Income (loss) from investment operations: | | | | | | | | | | | | | | | | | | | | | | | | |
Net investment income (loss) | | | 0.00 | ^ | | | 0.03 | | | | 0.06 | | | | 0.09 | | | | 0.02 | | | | 0.03 | |
Net realized and unrealized gain (loss) on investments | | | 0.30 | | | | 3.22 | | | | 2.13 | | | | (3.02 | ) | | | (0.96 | ) | | | 3.22 | |
| | | | | | | | | | | | | | | | | | | | | | | | |
Total from investment operations | | | 0.30 | | | | 3.25 | | | | 2.19 | | | | (2.93 | ) | | | (0.94 | ) | | | 3.25 | |
Less distributions from: | | | | | | | | | | | | | | | | | | | | | | | | |
Net investment income | | | — | | | | 0.03 | | | | 0.03 | | | | 0.05 | | | | — | | | | 0.01 | |
Net realized gain | | | — | | | | — | | | | — | | | | — | | | | 4.02 | | | | 1.92 | |
| | | | | | | | | | | | | | | | | | | | | | | | |
Total distributions | | | — | | | | 0.03 | | | | 0.03 | | | | 0.05 | | | | 4.02 | | | | 1.93 | |
| | | | | | | | | | | | | | | | | | | | | | | | |
Net asset value, end of year | | $ | 14.01 | | | $ | 13.71 | | | $ | 10.49 | | | $ | 8.33 | | | $ | 11.31 | | | $ | 16.27 | |
| | | | | | | | | | | | | | | | | | | | | | | | |
Total Return (%)* | | | 2.19 | | | | 30.94 | | | | 26.24 | | | | (25.85 | ) | | | (5.54 | ) | | | 21.78 | |
Ratios to average daily net assets (%):** | | | | | | | | | | | | | | | | | | | | | | | | |
Expenses, net of waivers and reimbursements | | | 1.37 | | | | 1.33 | | | | 1.29 | | | | 1.29 | | | | 1.33 | | | | 1.34 | |
Expenses, before waivers and reimbursements | | | 1.56 | | | | 1.57 | | | | 1.78 | | | | 1.82 | | | | 1.66 | | | | 1.75 | |
Net investment income (loss), net of waivers and reimbursements | | | 0.06 | | | | 0.25 | | | | 0.68 | | | | 0.84 | | | | 0.10 | | | | 0.21 | |
Net investment income (loss), before waivers and reimbursements | | | (0.13 | ) | | | 0.01 | | | | 0.19 | | | | 0.31 | | | | (0.23 | ) | | | (0.20 | ) |
| | | | | | | | | | | | | | | | | | | | | | | | |
| | | Class I | |
| | | Period Ended
June 30, | | | Years Ended December 31, | |
| | | 2011 | | | 2010 | | | 2009 | | | 2008 | | | 2007 | | | 2006 | |
Net asset value, beginning of year | | $ | 13.93 | | | $ | 10.65 | | | $ | 8.45 | | | $ | 11.50 | | | $ | 16.51 | | | $ | 15.12 | |
Income (loss) from investment operations: | | | | | | | | | | | | | | | | | | | | | | | | |
Net investment income (loss) | | | 0.02 | | | | 0.05 | | | | 0.08 | | | | 0.11 | | | | 0.09 | | | | 0.03 | |
Net realized and unrealized gain (loss) on investments | | | 0.31 | | | | 3.27 | | | | 2.16 | | | | (3.08 | ) | | | (1.01 | ) | | | 3.30 | |
| | | | | | | | | | | | | | | | | | | | | | | | |
Total from investment operations | | | 0.33 | | | | 3.32 | | | | 2.24 | | | | (2.97 | ) | | | (0.92 | ) | | | 3.33 | |
Less distributions from: | | | | | | | | | | | | | | | | | | | | | | | | |
Net investment income | | | — | | | | 0.04 | | | | 0.04 | | | | 0.08 | | | | 0.07 | | | | 0.02 | |
Net realized gain | | | — | | | | — | | | | — | | | | — | | | | 4.02 | | | | 1.92 | |
| | | | | | | | | | | | | | | | | | | | | | | | |
Total distributions | | | — | | | | 0.04 | | | | 0.04 | | | | 0.08 | | | | 4.09 | | | | 1.94 | |
| | | | | | | | | | | | | | | | | | | | | | | | |
Net asset value, end of year | | $ | 14.26 | | | $ | 13.93 | | | $ | 10.65 | | | $ | 8.45 | | | $ | 11.50 | | | $ | 16.51 | |
| | | | | | | | | | | | | | | | | | | | | | | | |
Total Return (%)* | | | 2.37 | | | | 31.16 | | | | 26.56 | | | | (25.77 | ) | | | (5.31 | ) | | | 22.10 | |
Ratios to average daily net assets (%):** | | | | | | | | | | | | | | | | | | | | | | | | |
Expenses, net of waivers and reimbursements | | | 1.12 | | | | 1.10 | | | | 1.09 | | | | 1.09 | | | | 1.09 | | | | 1.09 | |
Expenses, before waivers and reimbursements | | | 1.27 | | | | 1.29 | | | | 1.50 | | | | 1.57 | | | | 1.37 | | | | 1.50 | |
Net investment income (loss), net of waivers and reimbursements | | | 0.34 | | | | 0.43 | | | | 0.86 | | | | 1.06 | | | | 0.52 | | | | 0.16 | |
Net investment income (loss), before waivers and reimbursements | | | 0.19 | | | | 0.24 | | | | 0.45 | | | | 0.58 | | | | 0.24 | | | | (0.25 | ) |
| | | | | | | | | | | | | | | | | | | | | | | | |
| | | | |
| | | Period Ended
June 30, | | | Years Ended December 31, | |
| | | 2011 | | | 2010 | | | 2009 | | | 2008 | | | 2007 | | | 2006 | |
Supplemental data for all classes: | | | | | | | | | | | | | | | | | | | | | | | | |
Net assets at end of year (in thousands) | | $ | 229,443 | | | $ | 164,499 | | | $ | 54,859 | | | $ | 36,249 | | | $ | 47,118 | | | $ | 146,777 | |
Portfolio turnover rate (%)* | | | 32 | | | | 71 | | | | 62 | | | | 87 | | | | 102 | | | | 162 | |
| * | | Rates not annualized for periods that are less than a year. |
| ** | | Rates are annualized for periods that are less than a year. |
| ^ | | Amount is less than $0.005 per share. |
Performance cited represents past performance. Past performance does not guarantee future results and current performance may be lower or higher than the data quoted. Results shown are annual returns, which assume reinvestment of dividends and capital gains. Investment returns and principal will fluctuate and you may have a gain or loss when you sell shares. For the most current month-end performance information, please call 1-800-742-7272 or visit our Web site at www.williamblairfunds.com.
Note: Net investment income (loss) per share is based on the average shares outstanding during the year.
June 30, 2011 | William Blair Funds 137 |
Financial Highlights
Mid Cap Value Fund
| | | | | | | | |
| | | Class N | |
| | | Period Ended
June 30, | | | Period Ended
December 31, | |
| | | 2011 | | | 2010(a) | |
Net asset value, beginning of year | | $ | 10.75 | | | $ | 10.00 | |
Income (loss) from investment operations: | | | | | | | | |
Net investment income (loss) | | | 0.06 | | | | 0.09 | |
Net realized and unrealized gain (loss) on investments | | | 0.57 | | | | 0.74 | |
| | | | | | | | |
Total from investment operations | | | 0.63 | | | | 0.83 | |
Less distributions from: | | | | | | | | |
Net investment income | | | (0.02 | ) | | | 0.06 | |
Net realized gain | | | 0.02 | | | | 0.02 | |
| | | | | | | | |
Total distributions | | | — | | | | 0.08 | |
| | | | | | | | |
Net asset value, end of year | | $ | 11.38 | | | $ | 10.75 | |
| | | | | | | | |
Total Return (%)* | | | 5.86 | | | | 8.36 | |
Ratios to average daily net assets (%):** | | | | | | | | |
Expenses, net of waivers and reimbursements | | | 1.35 | | | | 1.35 | |
Expenses, before waivers and reimbursements | | | 4.28 | | | | 5.09 | |
Net investment income (loss), net of waivers and reimbursements | | | 1.03 | | | | 0.92 | |
Net investment income (loss), before waivers and reimbursements | | | (1.90 | ) | | | (2.82 | ) |
| |
| | | Class I | |
| | | Period Ended
June 30, | | | Period Ended
December 31, | |
| | | 2011 | | | 2010(a) | |
Net asset value, beginning of year | | $ | 10.76 | | | $ | 10.00 | |
Income (loss) from investment operations: | | | | | | | | |
Net investment income (loss) | | | 0.05 | | | | 0.11 | |
Net realized and unrealized gain (loss) on investments | | | 0.58 | | | | 0.75 | |
| | | | | | | | |
Total from investment operations | | | 0.63 | | | | 0.86 | |
Less distributions from: | | | | | | | | |
Net investment income | | | (0.02 | ) | | | 0.08 | |
Net realized gain | | | 0.02 | | | | 0.02 | |
| | | | | | | | |
Total distributions | | | — | | | | 0.10 | |
| | | | | | | | |
Net asset value, end of year | | $ | 11.39 | | | $ | 10.76 | |
| | | | | | | | |
Total Return (%)* | | | 5.86 | | | | 8.66 | |
Ratios to average daily net assets (%):** | | | | | | | | |
Expenses, net of waivers and reimbursements | | | 1.10 | | | | 1.10 | |
Expenses, before waivers and reimbursements | | | 3.97 | | | | 4.92 | |
Net investment income (loss), net of waivers and reimbursements | | | 0.92 | | | | 1.10 | |
Net investment income (loss), before waivers and reimbursements | | | (1.95 | ) | | | (2.72 | ) |
| | |
| | | Period Ended
June 30, | | | Period Ended
December 31, | |
| | | 2011 | | | 2010(a) | |
Supplemental data for all classes: | | | | | | | | |
Net assets at end of year (in thousands) | | $ | 4,143 | | | $ | 3,393 | |
Portfolio turnover rate (%)* | | | 40 | | | | 35 | |
| (a) | | For the period May 3, 2010 (Commencement of Operations) to December 31, 2010. |
| * | | Rates not annualized for periods that are less than a year. |
| ** | | Rates are annualized for periods that are less than a year. |
| ^ | | Amount is less than $0.005 per share. |
Performance cited represents past performance. Past performance does not guarantee future results and current performance may be lower or higher than the data quoted. Results shown are annual returns, which assume reinvestment of dividends and capital gains. Investment returns and principal will fluctuate and you may have a gain or loss when you sell shares. For the most current month-end performance information, please call 1-800-742-7272 or visit our Web site at www.williamblairfunds.com.
Note: Net investment income (loss) per share is based on the average shares outstanding during the year.
138 Semi-Annual Report | June 30, 2011 |
Financial Highlights
Bond Fund
| | | | | | | | | | | | | | | | | | | | |
| | | Class N | |
| | | Period Ended
June 30, | | | Period Ended December 31, | |
| | | 2011 | | | 2010 | | | 2009 | | | 2008 | | | 2007(a) | |
Net asset value, beginning of year | | $ | 10.70 | | | $ | 10.40 | | | $ | 9.82 | | | $ | 10.07 | | | $ | 10.00 | |
Income (loss) from investment operations: | | | | | | | | | | | | | | | | | | | | |
Net investment income (loss) | | | 0.23 | | | | 0.46 | | | | 0.48 | | | | 0.47 | | | | 0.31 | |
Net realized and unrealized gain (loss) on investments | | | 0.07 | | | | 0.35 | | | | 0.59 | | | | (0.31 | ) | | | 0.02 | |
| | | | | | | | | | | | | | | | | | | | |
Total from investment operations | | | 0.30 | | | | 0.81 | | | | 1.07 | | | | 0.16 | | | | 0.33 | |
Less distributions from: | | | | | | | | | | | | | | | | | | | | |
Net investment income | | | 0.24 | | | | 0.48 | | | | 0.49 | | | | 0.41 | | | | 0.26 | |
Net realized gain | | | — | | | | 0.03 | | | | — | | | | — | | | | — | |
| | | | | | | | | | | | | | | | | | | | |
Total distributions | | | 0.24 | | | | 0.51 | | | | 0.49 | | | | 0.41 | | | | 0.26 | |
| | | | | | | | | | | | | | | | | | | | |
Net asset value, end of year | | $ | 10.76 | | | $ | 10.70 | | | $ | 10.40 | | | $ | 9.82 | | | $ | 10.07 | |
| | | | | | | | | | | | | | | | | | | | |
Total Return (%)* | | | 2.90 | | | | 7.86 | | | | 11.11 | | | | 1.64 | | | | 3.38 | |
Ratios to average daily net assets (%):** | | | | | | | | | | | | | | | | | | | | |
Expenses, net of waivers and reimbursements | | | 0.65 | | | | 0.65 | | | | 0.65 | | | | 0.65 | | | | 0.65 | |
Expenses, before waivers and reimbursements | | | 0.77 | | | | 0.70 | | | | 1.40 | | | | 2.47 | | | | 0.81 | |
Net investment income (loss), net of waivers and reimbursements | | | 4.29 | | | | 4.25 | | | | 4.76 | | | | 4.69 | | | | 4.80 | |
Net investment income (loss), before waivers and reimbursements | | | 4.17 | | | | 4.01 | | | | 4.01 | | | | 2.87 | | | | 4.64 | |
| |
| | | Class I | |
| | | Period Ended
June 30, | | | Period Ended December 31, | |
| | | 2011 | | | 2010 | | | 2009 | | | 2008 | | | 2007(a) | |
Net asset value, beginning of year | | $ | 10.59 | | | $ | 10.31 | | | $ | 9.72 | | | $ | 10.04 | | | $ | 10.00 | |
Income (loss) from investment operations: | | | | | | | | | | | | | | | | | | | | |
Net investment income (loss) | | | 0.23 | | | | 0.47 | | | | 0.49 | | | | 0.48 | | | | 0.32 | |
Net realized and unrealized gain (loss) on investments | | | 0.09 | | | | 0.33 | | | | 0.59 | | | | (0.31 | ) | | | 0.02 | |
| | | | | | | | | | | | | | | | | | | | |
Total from investment operations | | | 0.32 | | | | 0.80 | | | | 1.08 | | | | 0.17 | | | | 0.34 | |
Less distributions from: | | | | | | | | | | | | | | | | | | | | |
Net investment income | | | 0.25 | | | | 0.49 | | | | 0.49 | | | | 0.49 | | | | 0.30 | |
Net realized gain | | | — | | | | 0.03 | | | | — | | | | — | | | | — | |
| | | | | | | | | | | | | | | | | | | | |
Total distributions | | | 0.25 | | | | 0.52 | | | | 0.49 | | | | 0.49 | | | | 0.30 | |
| | | | | | | | | | | | | | | | | | | | |
Net asset value, end of year | | $ | 10.66 | | | $ | 10.59 | | | $ | 10.31 | | | $ | 9.72 | | | $ | 10.04 | |
| | | | | | | | | | | | | | | | | | | | |
Total Return (%)* | | | 3.09 | | | | 7.89 | | | | 11.40 | | | | 1.72 | | | | 3.50 | |
Ratios to average daily net assets (%):** | | | | | | | | | | | | | | | | | | | | |
Expenses, net of waivers and reimbursements | | | 0.50 | | | | 0.50 | | | | 0.50 | | | | 0.50 | | | | 0.50 | |
Expenses, before waivers and reimbursements | | | 0.56 | | | | 0.55 | | | | 0.58 | | | | 0.71 | | | | 0.67 | |
Net investment income (loss), net of waivers and reimbursements | | | 4.45 | | | | 4.41 | | | | 4.92 | | | | 4.90 | | | | 4.95 | |
Net investment income (loss), before waivers and reimbursements | | | 4.40 | | | | 4.36 | | | | 4.84 | | | | 4.69 | | | | 4.78 | |
| | | | | | | | | | | | | | | | | | | | |
| | | | |
| | | Period Ended
June 30, | | | Period Ended December 31, | |
| | | 2011 | | | 2010 | | | 2009 | | | 2008 | | | 2007(a) | |
Supplemental data for all classes: | | | | | | | | | | | | | | | | | | | | |
Net assets at end of year (in thousands) | | $ | 203,808 | | | $ | 192,776 | | | $ | 147,344 | | | $ | 74,613 | | | $ | 68,483 | |
Portfolio turnover rate (%)* | | | 17 | | | | 25 | | | | 29 | | | | 52 | | | | 38 | |
| (a) | | For the period May 1, 2007 (Commencement of Operations) to December 31, 2007. |
| * | | Rates not annualized for periods that are less than a year. |
| ** | | Rates are annualized for periods that are less than a year. |
Performance cited represents past performance. Past performance does not guarantee future results and current performance may be lower or higher than the data quoted. Results shown are annual returns, which assume reinvestment of dividends and capital gains. Investment returns and principal will fluctuate and you may have a gain or loss when you sell shares. For the most current month-end performance information, please call 1-800-742-7272 or visit our Web site at www.williamblairfunds.com.
Note: Net investment income (loss) per share is based on the average shares outstanding during the year.
June 30, 2011 | William Blair Funds 139 |
Financial Highlights
Income Fund
| | | | | | | | | | | | | | | | | | | | | | | | |
| | | Class N | |
| | | Period Ended
June 30, | | | Years Ended December 31, | |
| | | 2011 | | | 2010 | | | 2009 | | | 2008 | | | 2007 | | | 2006 | |
Net asset value, beginning of year | | $ | 9.22 | | | $ | 9.07 | | | $ | 8.69 | | | $ | 9.29 | | | $ | 9.74 | | | $ | 9.83 | |
Income (loss) from investment operations: | | | | | | | | | | | | | | | | | | | | | | | | |
Net investment income (loss) | | | 0.17 | | | | 0.35 | | | | 0.40 | | | | 0.37 | | | | 0.45 | | | | 0.44 | |
Net realized and unrealized gain (loss) on investments | | | 0.05 | | | | 0.19 | | | | 0.44 | | | | (0.59 | ) | | | (0.35 | ) | | | (0.04 | ) |
| | | | | | | | | | | | | | | | | | | | | | | | |
Total from investment operations | | | 0.22 | | | | 0.54 | | | | 0.84 | | | | (0.22 | ) | | | 0.10 | | | | 0.40 | |
| | | | | | |
Less distributions from: | | | | | | | | | | | | | | | | | | | | | | | | |
Net investment income | | | 0.19 | | | | 0.39 | | | | 0.46 | | | | 0.38 | | | | 0.55 | | | | 0.49 | |
Net realized gain | | | — | | | | — | | | | — | | | | — | | | | — | | | | — | |
| | | | | | | | | | | | | | | | | | | | | | | | |
Total distributions | | | 0.19 | | | | 0.39 | | | | 0.46 | | | | 0.38 | | | | 0.55 | | | | 0.49 | |
| | | | | | | | | | | | | | | | | | | | | | | | |
Net asset value, end of year | | $ | 9.25 | | | $ | 9.22 | | | $ | 9.07 | | | $ | 8.69 | | | $ | 9.29 | | | $ | 9.74 | |
| | | | | | | | | | | | | | | | | | | | | | | | |
Total Return (%)* | | | 2.48 | | | | 6.04 | | | | 9.88 | | | | (2.46 | ) | | | 1.08 | | | | 4.25 | |
Ratios to average daily net assets (%):** | | | | | | | | | | | | | | | | | | | | | | | | |
Expenses, net of waivers and reimbursements | | | 0.85 | | | | 0.85 | | | | 0.85 | | | | 0.90 | | | | 0.79 | | | | 0.74 | |
Expenses, before waivers and reimbursements | | | 0.94 | | | | 0.85 | | | | 0.93 | | | | 0.93 | | | | 0.81 | | | | 0.80 | |
Net investment income (loss), net of waivers and reimbursements | | | 3.72 | | | | 3.79 | | | | 4.48 | | | | 4.38 | | | | 4.73 | | | | 4.54 | |
Net investment income (loss), before waivers and reimbursements | | | 3.63 | | | | 3.79 | | | | 4.41 | | | | 4.35 | | | | 4.71 | | | | 4.48 | |
| |
| | | Class I | |
| | | Period Ended
June 30, | | | Years Ended December 31, | |
| | | 2011 | | | 2010 | | | 2009 | | | 2008 | | | 2007 | | | 2006 | |
Net asset value, beginning of year | | $ | 9.15 | | | $ | 9.00 | | | $ | 8.64 | | | $ | 9.30 | | | $ | 9.69 | | | $ | 9.82 | |
Income (loss) from investment operations: | | | | | | | | | | | | | | | | | | | | | | | | |
Net investment income (loss) | | | 0.18 | | | | 0.37 | | | | 0.41 | | | | 0.39 | | | | 0.47 | | | | 0.45 | |
Net realized and unrealized gain (loss) on investments | | | 0.05 | | | | 0.19 | | | | 0.43 | | | | (0.59 | ) | | | (0.34 | ) | | | (0.04 | ) |
| | | | | | | | | | | | | | | | | | | | | | | | |
Total from investment operations | | | 0.23 | | | | 0.56 | | | | 0.84 | | | | (0.20 | ) | | | 0.13 | | | | 0.41 | |
| | | | | | |
Less distributions from: | | | | | | | | | | | | | | | | | | | | | | | | |
Net investment income | | | 0.20 | | | | 0.41 | | | | 0.48 | | | | 0.46 | | | | 0.52 | | | | 0.54 | |
Net realized gain | | | — | | | | — | | | | — | | | | — | | | | — | | | | — | |
| | | | | | | | | | | | | | | | | | | | | | | | |
Total distributions | | | 0.20 | | | | 0.41 | | | | 0.48 | | | | 0.46 | | | | 0.52 | | | | 0.54 | |
| | | | | | | | | | | | | | | | | | | | | | | | |
Net asset value, end of year | | $ | 9.18 | | | $ | 9.15 | | | $ | 9.00 | | | $ | 8.64 | | | $ | 9.30 | | | $ | 9.69 | |
| | | | | | | | | | | | | | | | | | | | | | | | |
Total Return (%)* | | | 2.60 | | | | 6.33 | | | | 9.89 | | | | (2.26 | ) | | | 1.36 | | | | 4.33 | |
Ratios to average daily net assets (%):** | | | | | | | | | | | | | | | | | | | | | | | | |
Expenses, net of waivers and reimbursements | | | 0.65 | | | | 0.63 | | | | 0.66 | | | | 0.72 | | | | 0.60 | | | | 0.62 | |
Net investment income (loss), net of waivers and reimbursements | | | 3.93 | | | | 4.01 | | | | 4.67 | | | | 4.57 | | | | 4.91 | | | | 4.66 | |
| | | | | | | | | | | | | | | | | | | | | | | | |
| | | | |
| | | Period Ended
June 30, | | | Years Ended December 31, | |
| | | 2011 | | | 2010 | | | 2009 | | | 2008 | | | 2007 | | | 2006 | |
Supplemental data for all classes: | | | | | | | | | | | | | | | | | | | | | | | | |
Net assets at end of year (in thousands) | | $ | 95,128 | | | $ | 113,277 | | | $ | 117,608 | | | $ | 140,435 | | | $ | 204,630 | | | $ | 297,077 | |
Portfolio turnover rate (%)* | | | 16 | | | | 29 | | | | 40 | | | | 38 | | | | 34 | | | | 33 | |
| * | | Rates not annualized for periods that are less than a year. |
| ** | | Rates are annualized for periods that are less than a year. |
Performance cited represents past performance. Past performance does not guarantee future results and current performance may be lower or higher than the data quoted. Results shown are annual returns, which assume reinvestment of dividends and capital gains. Investment returns and principal will fluctuate and you may have a gain or loss when you sell shares. For the most current month-end performance information, please call 1-800-742-7272 or visit our Web site at www.williamblairfunds.com.
Note: Net investment income (loss) per share is based on the average shares outstanding during the year.
140 Semi-Annual Report | June 30, 2011 |
Financial Highlights
Low Duration Fund
| | | | | | | | | | | | |
| | | Class N | |
| | | Period Ended
June 30, | | | Periods Ended December 31, | |
| | | 2011 | | | 2010 | | | 2009(a) | |
Net asset value, beginning of year | | $ | 9.90 | | | $ | 9.93 | | | $ | 10.00 | |
Income (loss) from investment operations: | | | | | | | | | | | | |
Net investment income (loss) | | | 0.07 | | | | 0.13 | | | | 0.01 | |
Net realized and unrealized gain (loss) on investments | | | 0.04 | | | | 0.05 | | | | (0.07 | ) |
| | | | | | | | | | | | |
Total from investment operations | | | 0.11 | | | | 0.18 | | | | (0.06 | ) |
Less distributions from: | | | | | | | | | | | | |
Net investment income | | | 0.12 | | | | 0.21 | | | | 0.01 | |
Net realized gain | | | — | | | | — | | | | — | |
| | | | | | | | | | | | |
Total distributions | | | 0.12 | | | | 0.21 | | | | 0.01 | |
| | | | | | | | | | | | |
Net asset value, end of year | | $ | 9.89 | | | $ | 9.90 | | | $ | 9.93 | |
| | | | | | | | | | | | |
Total Return (%)* | | | 1.13 | | | | 1.86 | | | | (0.60 | ) |
Ratios to average daily net assets (%):** | | | | | | | | | | | | |
Expenses, net of waivers and reimbursements | | | 0.70 | | | | 0.70 | | | | 0.70 | |
Expenses, before waivers and reimbursements | | | 0.74 | | | | 0.78 | | | | 0.94 | |
Net investment income (loss), net of waivers and reimbursements | | | 1.53 | | | | 1.33 | | | | 1.27 | |
Net investment income (loss), before waivers and reimbursements | | | 1.48 | | | | 1.25 | | | | 1.03 | |
| |
| | | Class I | |
| | | Period Ended
June 30, | | | Periods Ended December 31, | |
| | | 2011 | | | 2010 | | | 2009(a) | |
Net asset value, beginning of year | | $ | 9.89 | | | $ | 9.93 | | | $ | 10.00 | |
Income (loss) from investment operations: | | | | | | | | | | | | |
Net investment income (loss) | | | 0.08 | | | | 0.15 | | | | 0.01 | |
Net realized and unrealized gain (loss) on investments | | | 0.05 | | | | 0.04 | | | | (0.07 | ) |
| | | | | | | | | | | | |
Total from investment operations | | | 0.13 | | | | 0.19 | | | | (0.06 | ) |
Less distributions from: | | | | | | | | | | | | |
Net investment income | | | 0.13 | | | | 0.23 | | | | 0.01 | |
Net realized gain | | | — | | | | — | | | | — | |
| | | | | | | | | | | | |
Total distributions | | | 0.13 | | | | 0.23 | | | | 0.01 | |
| | | | | | | | | | | | |
Net asset value, end of year | | $ | 9.89 | | | $ | 9.89 | | | $ | 9.93 | |
| | | | | | | | | | | | |
Total Return (%)* | | | 1.31 | | | | 1.89 | | | | (0.59 | ) |
Ratios to average daily net assets (%):** | | | | | | | | | | | | |
Expenses, net of waivers and reimbursements | | | 0.55 | | | | 0.55 | | | | 0.55 | |
Expenses, before waivers and reimbursements | | | 0.60 | | | | 0.63 | | | | 0.79 | |
Net investment income (loss), net of waivers and reimbursements | | | 1.68 | | | | 1.46 | | | | 1.39 | |
Net investment income (loss), before waivers and reimbursements | | | 1.63 | | | | 1.38 | | | | 1.15 | |
| |
| | | | |
| | | Period Ended
June 30, | | | Periods Ended December 31, | |
| | | 2011 | | | 2010 | | | 2009(a) | |
Supplemental data for all classes: | | | | | | | | | | | | |
Net assets at end of year (in thousands) | | $ | 146,035 | | | $ | 143,470 | | | $ | 95,134 | |
Portfolio turnover rate (%)* | | | 17 | | | | 51 | | | | — | |
| (a) | | For the period December 1, 2009 (Commencement of Operations) to December 31, 2009. |
| * | | Rates not annualized for periods that are less than a year. |
| ** | | Rates are annualized for periods that are less than a year. |
Performance cited represents past performance. Past performance does not guarantee future results and current performance may be lower or higher than the data quoted. Results shown are annual returns, which assume reinvestment of dividends and capital gains. Investment returns and principal will fluctuate and you may have a gain or loss when you sell shares. For the most current month-end performance information, please call 1-800-742-7272 or visit our Web site at www.williamblairfunds.com.
Note: Net investment income (loss) per share is based on the average shares outstanding during the year.
June 30, 2011 | William Blair Funds 141 |
Financial Highlights
Ready Reserves Fund
| | | | | | | | | | | | | | | | | | | | | | | | |
| | | Class N | |
| | | Period Ended
June 30, | | | Years Ended December 31, | |
| | | 2011 | | | 2010 | | | 2009 | | | 2008 | | | 2007 | | | 2006 | |
Net asset value, beginning of year | | $ | 1.00 | | | $ | 1.00 | | | $ | 1.00 | | | $ | 1.00 | | | $ | 1.00 | | | $ | 1.00 | |
Income (loss) from investment operations: | | | | | | | | | | | | | | | | | | | | | | | | |
Net investment income (loss) | | | 0.00 | ^ | | | 0.00 | ^ | | | 0.00 | ^ | | | 0.02 | | | | 0.05 | | | | 0.04 | |
Net realized and unrealized gain (loss) on investments | | | — | | | | — | | | | — | | | | — | | | | — | | | | — | |
| | | | | | | | | | | | | | | | | | | | | | | | |
Total from investment operations | | | 0.00 | ^ | | | 0.00 | ^ | | | 0.00 | ^ | | | 0.02 | | | | 0.05 | | | | 0.04 | |
Less distributions from: | | | | | | | | | | | | | | | | | | | | | | | | |
Net investment income | | | 0.00 | ^ | | | 0.00 | ^ | | | 0.00 | ^ | | | 0.02 | | | | 0.05 | | | | 0.04 | |
Net realized gain | | | — | | | | — | | | | — | | | | — | | | | — | | | | — | |
| | | | | | | | | | | | | | | | | | | | | | | | |
Total distributions | | | 0.00 | ^ | | | 0.00 | ^ | | | 0.00 | ^ | | | 0.02 | | | | 0.05 | | | | 0.04 | |
| | | | | | | | | | | | | | | | | | | | | | | | |
Net asset value, end of year | | $ | 1.00 | | | $ | 1.00 | | | $ | 1.00 | | | $ | 1.00 | | | $ | 1.00 | | | $ | 1.00 | |
| | | | | | | | | | | | | | | | | | | | | | | | |
Total Return (%)* | | | 0.00 | | | | 0.01 | | | | 0.10 | | | | 2.20 | | | | 4.75 | | | | 4.47 | |
Ratios to average daily net assets (%):** | | | | | | | | | | | | | | | | | | | | | | | | |
Expenses, net of waivers and reimbursements | | | 0.17 | | | | 0.24 | | | | 0.46 | | | | 0.60 | | | | 0.63 | | | | 0.63 | |
Expenses, before waivers and reimbursements | | | 0.61 | | | | 0.61 | | | | 0.66 | | | | 0.60 | | | | 0.63 | | | | 0.63 | |
Net investment income (loss), net of waivers and reimbursements | | | 0.01 | | | | 0.01 | | | | 0.11 | | | | 2.12 | | | | 4.63 | | | | 4.38 | |
Net investment income (loss), before waivers and reimbursements | | | (0.43 | ) | | | (0.36 | ) | | | (0.09 | ) | | | 2.12 | | | | 4.63 | | | | 4.38 | |
| |
| | | | |
| | | Period Ended
June 30, | | | Years Ended December 31, | |
| | | 2011 | | | 2010 | | | 2009 | | | 2008 | | | 2007 | | | 2006 | |
Supplemental data for all classes: | | | | | | | | | | | | | | | | | | | | | | | | |
Net assets at end of year (in thousands) | | $ | 1,257,818 | | | $ | 1,216,543 | | | $ | 1,352,901 | | | $ | 1,841,189 | | | $ | 1,399,537 | | | $ | 1,195,593 | |
| * | | Rates not annualized for periods that are less than a year. |
| ** | | Rates are annualized for periods that are less than a year. |
| ^ | | Amount is less than $0.005 per share. |
Performance cited represents past performance. Past performance does not guarantee future results and current performance may be lower or higher than the data quoted. Results shown are annual returns, which assume reinvestment of dividends and capital gains. Investment returns and principal will fluctuate and you may have a gain or loss when you sell shares. For the most current month-end performance information, please call 1-800-742-7272 or visit our Web site at www.williamblairfunds.com.
Note: Net investment income (loss) per share is based on the average shares outstanding during the year.
142 Semi-Annual Report | June 30, 2011 |
Trustees and Officers (Unaudited). The trustees and officers of the William Blair Funds, their year of birth, their principal occupations during the last five years, their affiliations, if any, with William Blair & Company, L.L.C., and other significant affiliations are set forth below. The address of each trustee and officer is 222 West Adams Street, Chicago, Illinois 60606.
| | | | | | | | | | |
Name and Year of Birth | | Position(s)
Held with
Fund | | Term of
Office and
Length of
Time
Served(1) | | Principal Occupation(s) During Past 5 Years | | Number of
Portfolios
in Fund
Complex
Overseen
by Trustee | | Other Directorships Held by Trustee/Officer |
Interested Trustees | | | | | | | | | | |
| | | | | |
Michelle R. Seitz,
1965* | | Chairperson of the Board of Trustees and President | | Trustee since 2002; Chairperson since 2010 Since 2007 | | Principal, William Blair & Company, L.L.C.; Limited Partner, WB Holdings, L.P. (since November 2008); Member, WBC GP, L.L.P. (since November 2008) | | 19 | | Director, William Blair SI CAV |
| | | | | |
Richard W. Smirl,
1967* | | Trustee and Senior Vice President | | Trustee since 2010 and Senior Vice President Since 2007 | | Principal, William Blair & Company, L.L.C. | | 19 | | Director, William Blair SI CAV |
| | | | |
Non-Interested Trustees | | | | | | | | |
Ann P. McDermott,
1939 | | Trustee | | Since 1996 | | Board member and officer for various civic and charitable organizations over the past thirty years; professional experience prior thereto, registered representative for New York Stock Exchange firm | | 19 | | Northwestern University, Women’s Board; Rush Presbyterian St. Luke’s Medical Center, Women’s Board; University of Chicago, Women’s Board; Visiting Nurses Association, Honorary Director |
| | | | | |
Phillip O. Peterson,
1944 | | Trustee | | Since 2007 | | Retired; formerly, President, Strong Mutual Funds, 2004-2005; formerly, Partner, KPMG LLP | | 19 | | The Hartford Group of Mutual Funds (87 portfolios) |
| | | | | |
Lisa A. Pollina,
1965 | | Trustee | | Since 2011 | | Senior Advisor to head of RBC Financial Group’s International Banking and Insurance division since 2010; formerly, Bank of America Corporation, Global Financial Institutions Executive from 2006-2008 and multiple Advisory from 2008-2010; prior thereto, Managing Partner, Bordeaux Capital from 2002-2006. | | 19 | | Darkstrand, high-speed fiber optic network provider (2009 to 2010); Jane Addams Hull House Association, Board of Trustees (2003 to 2009) |
| | | | | |
Donald J. Reaves,
1946 | | Trustee | | Since 2004 | | Chancellor, Winston-Salem State University since 2007; formerly, Vice President for Administration and Chief Financial Officer, University of Chicago 2002-2007. | | 19 | | American Student Assistance Corp., guarantor of student loans; Amica Mutual Insurance Company |
| | | | | |
Donald L. Seeley,
1944 | | Trustee | | Since 2003 | | Retired; formerly, Director, Applied Investment Management Program, University of Arizona Department of Finance, prior thereto, Vice Chairman and Chief Financial Officer, True North Communications, Inc., marketing communications and advertising firm | | 19 | | Warnaco Group, Inc., intimate apparel, sportswear, and swimwear manufacturer; Center for Furniture Craftsmanship (not-for-profit) |
June 30, 2011 | William Blair Funds 143 |
| | | | | | | | | | |
Name and Year of Birth | | Position(s)
Held with
Fund | | Term of
Office and
Length of
Time
Served(1) | | Principal Occupation(s) During Past 5 Years | | Number of
Portfolios
in Fund
Complex
Overseen
by Trustee | | Other Directorships Held by Trustee/Officer |
| | | | | |
Thomas J. Skelly,
1951 | | Trustee | | Since 2007 | | Advisory Board Member for various U.S. Companies; Director and Investment Committee Chairman of the US Accenture Foundation, Inc.; prior to 2005, Managing Partner of various divisions at Accenture | | 19 | | Mutual Trust Financial Group, provider of insurance and investment products; Board Member First MetLife Investors Insurance Company, NY Chartered Company for Metropolitan Life Insurance |
| | | | | |
Officers | | | | | | | | | | |
Michael P. Balkin,
1959 | | Senior Vice President Vice President | | Since 2009 2008-2009 | | Principal, William Blair & Company, L.L.C. Associate, William Blair & Company, L.L.C.; former Partner, Magnetar Capital | | | | N/A |
| | | | | |
Karl W. Brewer,
1966 | | Senior Vice President | | Since 2000 | | Principal, William Blair & Company, L.L.C. | | | | N/A |
| | | | | |
David C. Fording,
1967 | | Senior Vice President Vice President | | Since 2009 2006-2009 | | Principal, William Blair & Company, L.L.C. Associate, William Blair & Company, L.L.C.; former Portfolio Manager, TIAA-CREF. | | | | N/A |
| | | | | |
James S. Golan,
1961 | | Senior Vice President | | Since 2005 | | Principal, William Blair & Company, L.L.C. | | | | N/A |
| | | | | |
W. George Greig,
1952 | | Senior Vice President | | Since 1996 | | Principal, William Blair & Company, L.L.C. | | | | N/A |
| | | | | |
Michael A. Jancosek,
1959 | | Senior Vice President | | Since 2004 | | Principal, William Blair & Company L.L.C. | | | | N/A |
| | | | | |
John F. Jostrand,
1954 | | Senior Vice President | | Since 1999 | | Principal, William Blair & Company, L.L.C. | | | | N/A |
| | | | | |
Chad M. Kilmer,
1975 | | Senior Vice President Vice President | | Since 2011 Since 2006 | | Principal, William Blair & Company, L.L.C. Associate, William Blair & Company, L.L.C.; former analyst and Portfolio Manager U.S. Bancorp Asset Management. | | | | N/A |
| | | | | |
Robert C. Lanphier, IV,
1956 | | Senior Vice President | | Since 2003 | | Principal, William Blair & Company, L.L.C. | | | | Chairman, AG. Med, Inc. |
| | | | | |
Mark T. Leslie,
1967 | | Senior Vice President Vice President | | Since 2008 2005-2008 | | Principal, William Blair & Company, L.L.C. Associate, William Blair & Company, L.L.C. | | | | N/A |
Matthew A. Litfin,
1972 | | Senior Vice President | | Since 2008 | | Principal, William Blair & Company, L.L.C. | | | | N/A |
| | | | | |
Kenneth J. McAtamney
1966 | | Senior Vice President | | Since 2008 | | Principal, William Blair & Company, L.L.C. | | | | N/A |
144 Semi-Annual Report | June 30, 2011 |
| | | | | | | | |
Name and Year of Birth | | Position(s) Held with Fund | | Term of
Office and
Length of Time
Served(1) | | Principal Occupation(s) During Past 5 Years | | Other Directorships Held by Trustee/Officer |
| | | | |
Todd M. McClone,
1968 | | Senior Vice President Vice President | | Since 2006 2005-2006 | | Principal, William Blair & Company, L.L.C. Associate, William Blair & Company, L.L.C. | | N/A N/A |
| | | | |
Tracy McCormick,
1954 | | Senior Vice President | | Since 2008 | | Principal, William Blair & Company, L.L.C. | | N/A |
| | | | |
David Merjan,
1960 | | Senior Vice President | | Since 2008 | | Principal, William Blair & Company, L.L.C. | | N/A |
| | | | |
David S. Mitchell,
1960 | | Senior Vice President | | Since 2004 | | Principal, William Blair & Company, L.L.C. | | N/A |
| | | | |
David P. Ricci,
1958 | | Senior Vice President | | Since 2006 | | Principal, William Blair & Company, L.L.C. | | N/A |
| | | | |
Jeffrey A. Urbina,
1955 | | Senior Vice President | | Since 1998 | | Principal, William Blair & Company, L.L.C. | | N/A |
| | | | |
Christopher T. Vincent,
1956 | | Senior Vice President | | Since 2004 | | Principal, William Blair & Company, L.L.C. | | N/A |
| | | | |
Kathleen M. Lynch,
1971 | | Vice President | | Since 2010 | | Associate, William Blair & Company, L.L.C. | | N/A |
| | | | |
Paul J. Sularz,
1967 | | Vice President | | Since 2009 | | Associate, William Blair & Company, L.L.C.; Vice President, J.P. Morgan Securities, Inc. | | N/A |
| | | | |
Walter R. Randall, Jr.,
1960 | | Chief Compliance Officer and Assistant Secretary | | Since 2009 | | Associate, William Blair & Company, L.L.C.; Associate Counsel and Chief Compliance Officer, Calamos Investments; Assistant General Counsel, American Century Investments. | | N/A |
| | | | |
Colette M. Garavalia,
1961 | | Treasurer | | Since 2009 | | Associate, William Blair & Company, L.L.C. | | N/A |
| | | | |
| | Secretary | | 2000-2009 | | Associate, William Blair & Company, L.L.C.; | | N/A |
| | | | |
Andrew T. Pfau,
1970 | | Secretary | | Since 2009 | | Associate, William Blair & Company, L.L.C.; Associate, Bell, Boyd & Lloyd, LLP; Associate, Sidley Austin LLP | | N/A |
John M. Raczek,
1970 | | Assistant Treasurer | | Since 2010 | | Associate, William Blair & Company, L.L.C.; Manager, Calamos Investments | | |
| * | | Ms. Seitz and Mr. Smirl are interested persons of the William Blair Funds because each is a principal of William Blair & Company, L.L.C., the Fund’s investment advisor, principal underwriter and distributor. |
| (1) | | Each Trustee serves until the election and qualification of a successor, or until death, resignation or retirement or removal as provided in the Fund’s Declaration of Trust. Retirement for non-interested Trustees occurs no later than at the conclusion of the first regularly scheduled Board meeting of the Fund’s fiscal year that occurs after the earlier of (a) the non-interested Trustee’s 72nd birthday or (b) the 15th anniversary of the date that the non-interested Trustee was first elected or appointed as a member of the Board of Trustees. The Fund’s officers, except the Chief Compliance Officer, are elected annually by the Trustees. The Fund’s Chief Compliance Officer is designated by the Board of Trustees and may only be removed by action of the Board of Trustees, including a majority of the non-interested Trustees. |
| (2) | | In November 2008, all principals of William Blair & Company, L.L.C. also became limited partners in WB Holdings, L.P. |
The Statement of Additional Information for the William Blair Funds includes additional information about the trustees and is available without charge by calling 1-800-635-2886 (in Massachusetts 1-800-635-2840) or by writing the Fund.
June 30, 2011 | William Blair Funds 145 |
Renewal of the Trust’s Management Agreement
On April 26, 2011, the Board of Trustees (the “Board”) of the William Blair Funds (the “Trust”), including the Trustees who are not “interested persons” of the Trust as defined in the Investment Company Act of 1940, as amended (the “Independent Trustees”), approved the renewal for an additional one-year term of the Trust’s Management Agreement with William Blair & Company, L.L.C. (the “Advisor”), on behalf of each of the William Blair Growth Fund, the William Blair Large Cap Growth Fund, the William Blair Small Cap Growth Fund, the William Blair Mid Cap Growth Fund, the William Blair Small-Mid Cap Growth Fund, the William Blair Global Growth Fund, the William Blair International Growth Fund, the William Blair International Equity Fund, the William Blair International Small Cap Growth Fund, the William Blair Emerging Markets Growth Fund, the William Blair Emerging Leaders Growth Fund, the William Blair Small Cap Value Fund, the William Blair Bond Fund, the William Blair Income Fund, the William Blair Low Duration Fund and the William Blair Ready Reserves Fund (each, a “Fund” and collectively, the “Funds”). In deciding to approve the renewal of the Management Agreement, the Board did not identify any single factor or group of factors as all-important or controlling and considered all factors together.
The information in this summary outlines the Board’s considerations associated with its renewal of the Management Agreement. In connection with its deliberations regarding the continuation of the Management Agreement, the Board considered such information and factors as it believed to be relevant. As described below, the Board considered the nature, extent and quality of the services performed by the Advisor under the existing Management Agreement; comparative management fees and expense ratios as prepared by an independent provider (Lipper Inc.); the estimated profits realized by the Advisor; the extent to which the Advisor realizes economies of scale as a Fund grows; and whether any fall-out benefits are being realized by the Advisor. In addition, the Independent Trustees discussed the renewal of the Management Agreement with Fund management and in private sessions with independent legal counsel at which no representatives of the Advisor were present.
The Board, including the Independent Trustees, considered the renewal of the Management Agreement pursuant to a process that concluded at the Board’s April 26, 2011 meeting. In preparation for the review process, the Independent Trustees met with independent legal counsel and discussed the type and nature of information to be requested and independent legal counsel sent a formal request for information to Trust management. The Advisor provided extensive information in response to the request. After reviewing the information received, the Independent Trustees requested supplemental information, which the Advisor provided in writing and/or orally. The Independent Trustees reviewed comparative performance and comparative advisory fees and expense ratios for a peer group and a peer universe of funds provided by Lipper for each Fund. In addition, the Independent Trustees considered: (i) materials describing the nature, quality and extent of services provided by the Advisor; (ii) information comparing the performance of each Fund to one or more relevant securities indexes; (iii) information comparing advisory fees of each Fund to fees charged by the Advisor to other funds and client accounts with similar investment strategies; (iv) the estimated allocated direct or indirect costs of services provided and estimated profits realized by the Advisor for both the Trust as a whole and each Fund individually; and (v) information describing other benefits to the Advisor resulting from its relationship with the Funds. The Independent Trustees also noted that they receive information from the Advisor regarding the Funds throughout the year in connection with regular Board meetings, including presentations from portfolio managers. The Independent Trustees also received a memorandum from independent legal counsel advising them of their duties and responsibilities in connection with the review of the Management Agreement. Finally, the Advisor made an in-person presentation to the Independent Trustees regarding the contract review information, including addressing the supplemental information requests, and answered questions from the Independent Trustees.
On April 14, 25 and 26, 2011, the Independent Trustees met independently of Trust management and of the interested Trustees to review and discuss with independent legal counsel the information provided by the Advisor, Lipper and independent legal counsel. The Independent Trustees noted that in evaluating the Management Agreement, they were taking into account their accumulated experience as Trustees in working with the Advisor on matters relating to the Funds. Based on their review, the Independent Trustees concluded that it was in the best interest of each Fund to renew the Management Agreement and recommended to the Board the renewal of the Management Agreement. The Board considered the recommendation of the Independent Trustees along with the other factors that the Board deemed relevant.
Nature, Quality and Extent of Services. In evaluating the nature, quality and extent of the services provided by the Advisor to the Funds, the Board noted that the Advisor is a quality firm with a reputation for integrity and honesty that employs high quality people and has a long association with the Funds, in each case other than the Growth Fund, since the inception of the Funds. The Trustees believe that a long-term relationship with a capable, conscientious advisor is in the best interests of shareholders and that shareholders have invested in the Funds knowing that the Advisor managed the Funds and knowing the
146 Semi-Annual Report | June 30, 2011 |
investment advisory fee. The Board considered biographical information about the Trust’s officers and the Funds’ portfolio managers, including information on the portfolio managers’ investments in the Funds. The Board also considered the administrative services performed by the Advisor, financial information regarding the Advisor, the Advisor’s execution quality and use of soft dollars, the compliance regime overseen by the Advisor, and the Advisor’s expense limitations in place for certain Funds. The Board was also provided with information pertaining to the Advisor’s organizational structure and senior management. The Board noted that the Advisor pays the compensation of all of the officers and the interested Trustees of the Trust.
The Board reviewed information on the annualized total returns of each Fund for the one, three, five and ten year periods ended December 31, 2010, as applicable, along with annualized total return information for the Lipper performance peer universe of funds and one or more relevant securities indexes. The Lipper performance peer universe for each Fund included all funds with a similar investment style as classified by Lipper regardless of asset size or primary channel of distribution. With respect to the comparative performance information generally, the Board considered the Advisor’s statement that it is committed to managing each Fund consistently with the Fund’s stated investment strategies through all market environments and that, as a result, the Funds’ relative performance compared to the Lipper performance peer universe and relevant securities indexes from year to year will be affected by whether the market environment favors or disfavors the Advisor’s investment strategies. The Board also considered the Advisor’s statement that its investment strategies are intended to produce superior performance over the long term. The Trustees reviewed each Fund’s ranking in its Lipper performance peer universe during the applicable periods, and based on that review, requested and discussed with the Advisor additional information regarding the performance of the International Equity Fund, the Emerging Markets Growth Fund, the Small Cap Growth Fund and the Low Duration Fund. With respect to the International Equity Fund, the Board noted that, except for 2008, the Fund had positive absolute performance for each full year since its inception and also considered the Advisor’s statement that the Fund’s lower allocations to emerging markets and small-cap securities relative to its peer funds had contributed to underperformance in recent periods. With respect to the Emerging Markets Growth Fund, the Board considered the Advisor’s statement that the Fund’s underperformance during the economic downturn in 2008 and 2009 continued to negatively impact the Fund’s three- and five-year rankings within its Lipper performance peer universe and noted that the Fund ranked in the 20th percentile of its Lipper performance peer universe over the most recent one-year period. With respect to the Small Cap Growth Fund, the Board noted the significant changes in the Fund’s ranking in its Lipper performance peer universe from year-to-year in recent periods and considered the Advisor’s statement that the such changes generally resulted from portfolio management managing the Fund consistently with the Fund’s stated investment strategies through different market environments. With respect to the Low Duration Fund, the Board considered supplemental information presented by the Advisor comparing the Fund’s performance to the performance of a different peer group of funds that the Advisor believed to be more representative of the Fund’s investment style and portfolio characteristics, including the Fund’s average duration and average credit quality. The Board considered the Advisor’s statement that the Fund’s lower average duration and higher average credit quality as compared to the funds in its Lipper performance peer universe negatively impacted its comparative performance.
Based upon all relevant factors, the Board concluded that the nature, quality and extent of the services provided by the Advisor to each Fund were satisfactory.
Fees and Expenses. The Board reviewed each Fund’s advisory fee and expense ratio and reviewed information comparing the advisory fee and expense ratio to those of a Lipper expense peer group and Lipper expense peer universe for each Fund. The Lipper expense peer group for each Fund consisted of a group of funds with a similar investment style as classified by Lipper, distribution channel and asset size as the Fund. The Lipper expense peer universe for each Fund consisted of all funds with a similar investment style as classified by Lipper and distribution channel as the Fund. The Board considered that the Advisor had proposed to contractually limit total expenses for the Large Cap Growth Fund, the Small Cap Growth Fund, the Mid Cap Growth Fund, the Small-Mid Cap Growth Fund, the Global Growth Fund, the International Growth Fund, the International Equity Fund, the International Small Cap Growth Fund, the Emerging Markets Growth Fund, the Emerging Leaders Growth Fund, the Small Cap Value Fund, the Bond Fund, the Income Fund and the Low Duration Fund. The Board also considered that the Advisor intended to continue to voluntarily waive or reimburse certain operating expenses of the Ready Reserves Fund to maintain a positive yield for the Fund. For each Fund, the Board also reviewed amounts charged by the Advisor to other pooled investment vehicles, including other registered funds for which the Advisor acts as a subadvisor, and the Advisor’s fee schedule for institutional separate accounts. With respect to other pooled investment vehicles and institutional separate accounts, the Board considered the Advisor’s statement that both the mix of services provided to the Funds and the additional regulatory responsibilities associated with sponsoring registered investment companies were greater as compared to the work involved for other pooled investment vehicles and separate accounts. In addition, the Board considered the Advisor’s statement that institutional separate accounts are distributed differently, operate under different investment and regulatory structures and have different business risks as compared to the Funds.
June 30, 2011 | William Blair Funds 147 |
In considering the information, the Board noted that the advisory fees for the Growth Fund, the Large Cap Growth Fund, the Mid Cap Growth Fund, the Small-Mid Cap Growth Fund, the Global Growth Fund, the International Growth Fund, the International Small Cap Growth Fund, the Emerging Markets Growth Fund, the Emerging Leaders Growth Fund, the Bond Fund, the Income Fund, the Low Duration Fund and the Ready Reserves Fund were below or within an acceptable range of the average advisory fees of their Lipper expense peer group. The Board also noted that the advisory fees for the Small Cap Value Fund were above although within an acceptable range of the average advisory fees of its Lipper expense peer group after giving effect to the expense limitation proposed for 2011. Finally, the Board noted that the advisory fees for the Small Cap Growth Fund and the International Equity Fund were above the average advisory fees of their Lipper expense peer group, but that such advisory fees were within an acceptable range of the average advisory fees of their Lipper expense peer group and consistent with reasonable expectations in light of the nature, quality and extent of services provided by the Advisor. On the basis of the information provided, the Board concluded that each Fund’s advisory fee, coupled with applicable expense limitations, was reasonable in light of the nature, quality and extent of services provided by the Advisor.
Profitability. With respect to the profitability of the Management Agreement to the Advisor, the Board considered the overall fees paid under the Management Agreement, including the estimated allocated costs of the services provided and profits realized by the Advisor from its relationship with the Trust as a whole and each Fund individually. The Board concluded that the estimated profits realized by the Advisor were not unreasonable.
Economies of Scale. The Board considered the extent to which economies of scale would be realized as the Funds grow and whether fee levels reflect these economies of scale for the benefit of investors. The Board noted the Advisor’s representation that certain Fund expenses are relatively fixed and unrelated to asset size and that the Advisor may enjoy some economies of scale as a Fund’s assets grow. The Board also noted that the Advisor increased the number of personnel working on Fund matters during 2010. In considering whether fee levels reflect economies of scale for the benefit of Fund investors, the Board reviewed each Fund’s asset size, breakpoints for those Funds with breakpoints in the advisory fee schedule, the Fund’s total and net expense ratios and the expense limitations in place and/or proposed, and concluded that in the aggregate they reasonably reflect appropriate recognition of any economies of scale.
Other Benefits to the Advisor. The Board considered benefits derived by the Advisor from its relationship with the Funds, including (i) non-advisory fee revenue from the Funds in the form of shareholder administration fees, service fees and/or distribution fees and the payment of some or all of those revenues to affiliates or third parties, (ii) soft dollars, which pertain primarily to the Funds investing in equity securities, and (iii) favorable media coverage. The Board concluded that, taking into account these benefits, each Fund’s advisory fee was reasonable.
Conclusion. Based upon all of the information considered and the conclusions reached, the Board determined that the terms of the Management Agreement continue to be fair and reasonable and that the continuation of the Management Agreement is in the best interests of each Fund.
148 Semi-Annual Report | June 30, 2011 |
(unaudited)
Proxy Voting
A description of the policies and procedures that the Fund uses to determine how to vote proxies relating to portfolio securities and information regarding how the Fund voted proxies relating to portfolio securities for the most recent 12-month period ended June 30 are available without charge, upon request, by calling 1-800-635-2886 (in Massachusetts 1-800-635-2840), at www.williamblairfunds.com and on the SEC’s website at http://www.sec.gov.
Quarterly Portfolio Schedules
Each Portfolio files its complete schedule of portfolio holdings with the SEC for the first and third fiscal quarters of each fiscal year (quarters ended March 31 and September 30) on Form N-Q. The Fund’s Forms N-Q are available on the SEC’s website at http://www.sec.gov and may be reviewed and copied at the SEC’s Public Reference Room in Washington, D.C. Information on the operation of the SEC’s Public Reference Room may be obtained by calling 1-800-SEC-0330. The Fund’s Forms N-Q are also available on the Fund’s website at www.williamblairfunds.com.
Additional Federal Income Tax Information: (unaudited)
Under Section 852(b)(3)(C) of the Code, the Funds hereby designate the following amounts as capital gain dividends for the fiscal year ended December 31, 2010:
| | | | |
Emerging Leaders Growth | | Small Cap Value | | Bond |
$505,181 | | $135,089 | | $493,757 |
The following table provides the percentage of the 2010 year-end distributions that qualify for the dividend received deduction, and the qualified dividend income percentage:
| | | | | | | | |
Portfolio | | Dividend
Received
Deduction% | | | Qualified
Dividend
Income% | |
Growth | | | 100.00 | % | | | 100.00 | % |
Large Cap Growth | | | 100.00 | % | | | 100.00 | % |
Small Cap Growth | | | 0.00 | % | | | 0.00 | % |
Mid Cap Growth | | | 0.00 | % | | | 0.00 | % |
Small-Mid Cap Growth | | | 0.00 | % | | | 0.00 | % |
Global Growth | | | 99.93 | % | | | 100.00 | % |
International Growth | | | 0.00 | % | | | 85.61 | % |
International Equity | | | 0.43 | % | | | 100.00 | % |
International Small Cap Growth | | | 0.13 | % | | | 100.00 | % |
Emerging Markets Growth | | | 0.16 | % | | | 83.93 | % |
Emerging Leaders Growth | | | 0.00 | % | | | 100.00 | % |
Small Cap Value | | | 100.00 | % | | | 100.00 | % |
Mid Cap Value | | | 75.51 | % | | | 100.00 | % |
Bond | | | 0.00 | % | | | 0.00 | % |
Income | | | 0.00 | % | | | 0.00 | % |
Low Duration | | | 0.00 | % | | | 0.00 | % |
Ready Reserves | | | 0.00 | % | | | 0.00 | % |
In January 2011, you were notified on IRS Form 1099-Div or substitute 1099 DIV as to the Federal tax status of the distributions received by you in the calendar year 2010.
June 30, 2011 | William Blair Funds 149 |
Useful Information About Your Report (unaudited)
Please refer to this information when reviewing the Expense Example for each Portfolio.
Expense Example
As a shareholder of a Portfolio, you incur two types of costs: (1) transaction costs such as redemption fees and (2) ongoing costs, including management fees, distribution (12b-1) fees (for Class N shares except for the Ready Reserves Portfolio), service fees (for Class N shares of the Ready Reserves Portfolio), shareholder administration fees (for Class N and Class I shares of the Global Growth Portfolio, the International Small Cap Growth Portfolio, the Emerging Markets Growth Portfolio, the Emerging Leaders Growth Portfolio, the Bond Portfolio and the Low Duration Portfolio) and other Portfolio expenses. The example is intended to help you understand your ongoing costs (in dollars) of investing in the Portfolio and to compare these costs with the ongoing costs of investing in other mutual funds. To do so, compare the Portfolio’s 5% hypothetical example with the 5% hypothetical examples that appear in the shareholder reports of other funds. The example is based on an investment of $1,000 invested at the beginning of the period and held for the entire six-month period from January 1, 2011 to June 30, 2011.
Actual Expenses
In each example, the first line for each share class in the table provides information about the actual account values and actual expenses. These expenses reflect the effect of any expense cap applicable to the share class during the period. Without this expense cap, the costs shown in the table would have been higher. You may use the information in this line, together with the amount you invested, to estimate the expenses that you paid over the period. Simply divide your account value by $1,000 (example, an $8,600 account value divided by $1,000 = 8.6), then multiply the result by the number in the first line under the heading entitled “Expenses Paid During the Period” to estimate the expenses you paid on your account during the period.
Hypothetical Example for Comparison Purposes
In each example, the second line for each share class in the table provides information about hypothetical account values and hypothetical expenses based on the Portfolio’s actual expense ratio and an assumed rate of return of 5% per year before expenses. This is not the Portfolio’s actual return. The hypothetical account values and expenses may not be used to estimate the actual ending account balance or expenses you paid for the period. You may use this information to compare the ongoing costs of investing in the Portfolio to other funds. To do so, compare this 5% hypothetical example with the 5% hypothetical examples that appear in the shareholder reports of other funds.
Please note that the expenses shown in both examples are meant to highlight your ongoing costs only and do not reflect any transactional costs or account type fees, such as redemption fees and IRA Fiduciary Administration fees, respectively. These fees are fully described in the prospectus. Therefore, the second line of each share class in the table is useful in comparing ongoing costs only and will not help you determine the relative costs of owning different funds. In addition, if these transactional costs or account fees were included, your costs would have been higher.
150 Semi-Annual Report | June 30, 2011 |
Fund Expenses (unaudited)
The examples below show you the ongoing costs (in dollars) of investing in your fund and allows you to compare these costs with those of other mutual funds. Please refer to the previous page for a detailed explanation of the information presented on this chart.
| | | | | | | | | | | | | | | | |
Expense Example | | Beginning
Account Value
1/1/2011 | | | Ending
Account Value
6/30/2011 | | | Expenses Paid
During the
Period(a) | | | Annualized
Expense Ratio | |
Growth Fund | | | | | | | | | | | | | | | | |
Class N—actual return | | $ | 1,000.00 | | | $ | 1,056.70 | | | $ | 6.01 | | | | 1.18 | % |
Class N—hypothetical 5% return | | | 1,000.00 | | | | 1,018.95 | | | | 5.90 | | | | 1.18 | |
Class I—actual return | | | 1,000.00 | | | | 1,058.90 | | | | 4.27 | | | | 0.84 | |
Class I—hypothetical 5% return | | | 1,000.00 | | | | 1,020.65 | | | | 4.19 | | | | 0.84 | |
Large Cap Growth Fund | | | | | | | | | | | | | | | | |
Class N—actual return | | | 1,000.00 | | | | 1,036.40 | | | | 6.06 | | | | 1.20 | |
Class N—hypothetical 5% return | | | 1,000.00 | | | | 1,018.84 | | | | 6.01 | | | | 1.20 | |
Class I—actual return | | | 1,000.00 | | | | 1,038.40 | | | | 4.80 | | | | 0.95 | |
Class I—hypothetical 5% return | | | 1,000.00 | | | | 1,020.08 | | | | 4.76 | | | | 0.95 | |
Small Cap Growth Fund | | | | | | | | | | | | | | | | |
Class N—actual return | | | 1,000.00 | | | | 1,013.80 | | | | 7.49 | | | | 1.50 | |
Class N—hypothetical 5% return | | | 1,000.00 | | | | 1,017.36 | | | | 7.50 | | | | 1.50 | |
Class I—actual return | | | 1,000.00 | | | | 1,014.50 | | | | 6.24 | | | | 1.25 | |
Class I—hypothetical 5% return | | | 1,000.00 | | | | 1,018.60 | | | | 6.26 | | | | 1.25 | |
Mid Cap Growth Fund | | | | | | | | | | | | | | | | |
Class N—actual return | | | 1,000.00 | | | | 1,120.00 | | | | 7.10 | | | | 1.35 | |
Class N—hypothetical 5% return | | | 1,000.00 | | | | 1,018.10 | | | | 6.76 | | | | 1.35 | |
Class I—actual return | | | 1,000.00 | | | | 1,120.70 | | | | 5.78 | | | | 1.10 | |
Class I—hypothetical 5% return | | | 1,000.00 | | | | 1,019.34 | | | | 5.51 | | | | 1.10 | |
Small-Mid Cap Growth Fund | | | | | | | | | | | | | | | | |
Class N—actual return | | | 1,000.00 | | | | 1,115.30 | | | | 7.09 | | | | 1.35 | |
Class N—hypothetical 5% return | | | 1,000.00 | | | | 1,018.09 | | | | 6.76 | | | | 1.35 | |
Class I—actual return | | | 1,000.00 | | | | 1,117.20 | | | | 5.76 | | | | 1.10 | |
Class I—hypothetical 5% return | | | 1,000.00 | | | | 1,019.36 | | | | 5.49 | | | | 1.10 | |
Global Growth Fund | | | | | | | | | | | | | | | | |
Class N—actual return | | | 1,000.00 | | | | 1,061.90 | | | | 7.67 | | | | 1.50 | |
Class N—hypothetical 5% return | | | 1,000.00 | | | | 1,017.36 | | | | 7.50 | | | | 1.50 | |
Class I—actual return | | | 1,000.00 | | | | 1,063.10 | | | | 6.39 | | | | 1.25 | |
Class I—hypothetical 5% return | | | 1,000.00 | | | | 1,018.60 | | | | 6.26 | | | | 1.25 | |
International Growth Fund | | | | | | | | | | | | | | | | |
Class N—actual return | | | 1,000.00 | | | | 1,019.70 | | | | 7.26 | | | | 1.45 | |
Class N—hypothetical 5% return | | | 1,000.00 | | | | 1,017.60 | | | | 7.25 | | | | 1.45 | |
Class I—actual return | | | 1,000.00 | | | | 1,021.00 | | | | 5.65 | | | | 1.13 | |
Class I—hypothetical 5% return | | | 1,000.00 | | | | 1,019.20 | | | | 5.65 | | | | 1.13 | |
International Equity Fund | | | | | | | | | | | | | | | | |
Class N—actual return | | | 1,000.00 | | | | 1,032.20 | | | | 7.31 | | | | 1.45 | |
Class N—hypothetical 5% return | | | 1,000.00 | | | | 1,017.60 | | | | 7.25 | | | | 1.45 | |
Class I—actual return | | | 1,000.00 | | | | 1,033.60 | | | | 6.05 | | | | 1.20 | |
Class I—hypothetical 5% return | | | 1,000.00 | | | | 1,018.84 | | | | 6.01 | | | | 1.20 | |
International Small Cap Growth Fund | | | | | | | | | | | | | | | | |
Class N—actual return | | | 1,000.00 | | | | 1,054.30 | | | | 8.22 | | | | 1.61 | |
Class N—hypothetical 5% return | | | 1,000.00 | | | | 1,016.79 | | | | 8.07 | | | | 1.61 | |
Class I—actual return | | | 1,000.00 | | | | 1,056.90 | | | | 6.35 | | | | 1.25 | |
Class I—hypothetical 5% return | | | 1,000.00 | | | | 1,018.62 | | | | 6.23 | | | | 1.25 | |
Emerging Markets Growth Fund | | | | | | | | | | | | | | | | |
Class N—actual return | | | 1,000.00 | | | | 993.00 | | | | 8.21 | | | | 1.66 | |
Class N—hypothetical 5% return | | | 1,000.00 | | | | 1,016.55 | | | | 8.31 | | | | 1.66 | |
Class I—actual return | | | 1,000.00 | | | | 994.30 | | | | 6.69 | | | | 1.35 | |
Class I—hypothetical 5% return | | | 1,000.00 | | | | 1,018.08 | | | | 6.77 | | | | 1.35 | |
| (a) | | Expenses are equal to the annualized expense ratio, multiplied by the average account value over the period, multiplied by the number of days in the period 181, and divided by 365 (to reflect the one-half year period). |
June 30, 2011 | William Blair Funds 151 |
| | | | | | | | | | | | | | | | |
Expense Example | | Beginning
Account Value
1/1/2011 | | | Ending
Account Value
6/30/2011 | | | Expenses Paid
During the
Period(a) | | | Annualized
Expense Ratio | |
Emerging Leaders Growth Fund | | | | | | | | | | | | | | | | |
Class N—actual return | | $ | 1,000.00 | | | $ | 975.80 | | | $ | 8.08 | | | | 1.65 | % |
Class N—hypothetical 5% return | | | 1,000.00 | | | | 1,016.61 | | | | 8.25 | | | | 1.65 | |
Class I—actual return | | | 1,000.00 | | | | 975.80 | | | | 6.86 | | | | 1.40 | |
Class I—hypothetical 5% return | | | 1,000.00 | | | | 1,017.85 | | | | 7.00 | | | | 1.40 | |
Small Cap Value Fund | | | | | | | | | | | | | | | | |
Class N—actual return | | | 1,000.00 | | | | 1,021.90 | | | | 6.86 | | | | 1.37 | |
Class N—hypothetical 5% return | | | 1,000.00 | | | | 1,018.01 | | | | 6.84 | | | | 1.37 | |
Class I—actual return | | | 1,000.00 | | | | 1,023.70 | | | | 5.62 | | | | 1.12 | |
Class I—hypothetical 5% return | | | 1,000.00 | | | | 1,019.24 | | | | 5.60 | | | | 1.12 | |
Mid Cap Value Fund | | | | | | | | | | | | | | | | |
Class N—actual return | | | 1,000.00 | | | | 1,058.60 | | | | 6.89 | | | | 1.35 | |
Class N—hypothetical 5% return | | | 1,000.00 | | | | 1,018.10 | | | | 6.75 | | | | 1.35 | |
Class I—actual return | | | 1,000.00 | | | | 1,058.60 | | | | 5.61 | | | | 1.10 | |
Class N—hypothetical 5% return | | | 1,000.00 | | | | 1,019.34 | | | | 5.51 | | | | 1.10 | |
Bond Fund | | | | | | | | | | | | | | | | |
Class N—actual return | | | 1,000.00 | | | | 1,029.00 | | | | 3.27 | | | | 0.65 | |
Class N—hypothetical 5% return | | | 1,000.00 | | | | 1,021.57 | | | | 3.26 | | | | 0.65 | |
Class I—actual return | | | 1,000.00 | | | | 1,030.90 | | | | 2.52 | | | | 0.50 | |
Class I—hypothetical 5% return | | | 1,000.00 | | | | 1,022.32 | | | | 2.51 | | | | 0.50 | |
Income Fund | | | | | | | | | | | | | | | | |
Class N—actual return | | | 1,000.00 | | | | 1,024.80 | | | | 4.27 | | | | 0.85 | |
Class N—hypothetical 5% return | | | 1,000.00 | | | | 1,020.58 | | | | 4.26 | | | | 0.85 | |
Class I—actual return | | | 1,000.00 | | | | 1,026.00 | | | | 3.26 | | | | 0.65 | |
Class I—hypothetical 5% return | | | 1,000.00 | | | | 1,021.57 | | | | 3.26 | | | | 0.65 | |
Low Duration Fund | | | | | | | | | | | | | | | | |
Class N—actual return | | | 1,000.00 | | | | 1,011.30 | | | | 3.49 | | | | 0.70 | |
Class N—hypothetical 5% | | | 1,000.00 | | | | 1,021.33 | | | | 3.51 | | | | 0.70 | |
Class I—actual return | | | 1,000.00 | | | | 1,013.10 | | | | 2.74 | | | | 0.55 | |
Class I—hypothetical 5% | | | 1,000.00 | | | | 1,022.07 | | | | 2.75 | | | | 0.55 | |
Ready Reserve Fund | | | | | | | | | | | | | | | | |
Class N—actual return | | | 1,000.00 | | | | 1,000.00 | | | | 0.86 | | | | 0.17 | |
Class N—hypothetical 5% return | | | 1,000.00 | | | | 1,023.93 | | | | 0.87 | | | | 0.17 | |
| (a) | | Expenses are equal to the annualized expense ratio, multiplied by the average account value over the period, multiplied by the number of days in the period 181, and divided by 365 (to reflect the one-half year period). |
152 Semi-Annual Report | June 30, 2011 |
BOARD OF TRUSTEES
Ann P. McDermott
Director and Trustee
Profit and not-for-profit organizations
Phillip O. Peterson
Retired Partner, KPMG LLP
Lisa A. Pollina
Senior Advisor to RBC Financial Group—International Banking and Insurance Division
Donald J. Reaves
Chancellor, Winston-Salem State University
Donald L. Seeley
Retired Adjunct Lecturer and Director, University of Arizona Department of Finance
Michelle R. Seitz, Chairperson and President
Principal, William Blair & Company, L.L.C.,
Thomas J. Skelly
Retired Managing Partner, Accenture U.S.
Richard W. Smirl, Senior Vice President
Principal, William Blair & Company L.L.C.
Officers
Michael P. Balkin, Senior Vice President
Karl W. Brewer, Senior Vice President
David C. Fording, Senior Vice President
James S. Golan, Senior Vice President
W. George Greig, Senior Vice President
Michael A. Jancosek, Senior Vice President
John F. Jostrand, Senior Vice President
Chad M. Kilmer, Senior Vice President
Robert C. Lanphier, IV, Senior Vice President
Mark T. Leslie, Senior Vice President
Matthew A. Litfin, Senior Vice President
Kenneth J. McAtamney, Senior Vice President
Todd M. McClone, Senior Vice President
Tracy McCormick, Senior Vice President
David Merjan, Senior Vice President
David S. Mitchell, Senior Vice President
David P. Ricci, Senior Vice President
Jeffrey A. Urbina, Senior Vice President
Christopher T. Vincent, Senior Vice President
Kathleen M. Lynch, Vice President
Paul J. Sularz, Vice President
Walter R. Randall, Jr., Chief Compliance Officer and Assistant Secretary
Colette M. Garavalia, Treasurer
Andrew T. Pfau, Secretary
John M. Raczek, Assistant Treasurer
Investment Advisor
William Blair & Company, L.L.C.
Legal Counsel
Vedder Price P.C.
Transfer Agent
Boston Financial Data Services, Inc.
P.O. Box 8506
Boston, MA 02266-8506
For customer assistance, call 1-800-635-2886
(Massachusetts 1-800-635-2840)
June 30, 2011 | William Blair Funds 153 |
| | | | |
EQUITY | | GLOBAL EQUITY | | FIXED-INCOME |
Growth Fund | | Global Growth Fund | | Bond Fund |
Large Cap Growth Fund | | | | Income Fund |
Small Cap Growth Fund | | INTERNATIONAL EQUITY | | Low Duration Fund |
Mid Cap Growth Fund | | International Growth Fund | | |
Small-Mid Cap Growth Fund | | International Equity Fund | | MONEY MARKET |
Small Cap Value Fund | | International Small Cap Growth Fund | | Ready Reserves Fund |
Mid Cap Value Fund | | Emerging Markets Growth Fund | | |
| | Emerging Leaders Growth Fund | | |

222 West Adams Street
Chicago, IL 60606
800.742.7272 Ÿ www.williamblairfunds.com
©William Blair & Company, L.L.C., distributor

INSTITUTIONAL
SEMI-ANNUAL REPORT
June 30, 2011
Table of Contents
The views expressed in the commentary for each Fund reflect those of the portfolio management team only through the end of the period of the report as stated on the cover. The portfolio management team’s views are subject to change at any time based on market and other conditions and should not be construed as a recommendation. Statements involving predictions, assessments, analyses, or outlook for individual securities, industries, market sectors, and/or markets involve risks and uncertainties, and there is no guarantee they will come to pass.
This report is submitted for the general information of the shareholders of the William Blair Funds. It is not authorized for distribution to prospective investors unless accompanied or preceded by a prospectus of the William Blair Funds. Please consider the Funds’ investment objectives, risks, charges, and expenses before investing. This and other information is contained in the Funds’ prospectus, which you may obtain by calling 1-800-742-7272. Read it carefully before you invest or send money. William Blair & Company, LLC., distributor.
June 30, 2011 | William Blair Funds 1 |
GLOBAL MARKETS OVERVIEW
Summary
Despite rallying earlier in the second quarter, the global market fell in June on concerns about the sustainability of the recovery as many developed economies hit a “soft patch.” This growth slowdown was exacerbated by supply chain disruptions and reduced growth expectations following the Japanese earthquake and tsunami, resurfacing European sovereign debt concerns, U.S. debt ceiling worries, and continued inflationary pressures in emerging markets. As a result, the global equity market was virtually flat during the second quarter, returning 0.13%, with developed markets up 0.33% as measured by the MSCI World IMI, while emerging markets fell 1.13%.
During the second quarter the World Index return benefited from U.S. dollar weakness versus most developed market currencies, coupled with strength in Europe and the U.K. In particular, Germany and France performed well, benefiting from strong export demand coupled with improved consumer confidence and spending. These positives more than offset market weakness in a number of the peripheral European countries on debt concerns. Canada also underperformed, falling 4.96%, as Energy prices eased. Within emerging markets, Asia outperformed, falling 0.16%, as Indonesia, Korea, and Taiwan rallied, offsetting negative returns in China and India on inflation and growth concerns. Emerging Latin America and Emerging Europe Middle East and Asia each fell over 2% during the quarter, hampered by concerns about rising interest rates and inflationary pressures in Brazil, along with weakness in Turkey and a weakening Russian ruble. Healthcare was the strongest sector globally during the second quarter, up approximately 7%, followed by Consumer Discretionary. Conversely, Energy fell over 5% after prices subsided following spikes earlier in the year.
Year to date the global equity market rose 4.66%, led by Continental Europe and the U.S., which were particularly strong during the first quarter, on reduced European debt concerns and an improving outlook at the outset of 2011. Japan was the worst performing developed market, falling nearly 4%, due largely concerns arising from the March earthquake. Emerging markets eked out a 0.32% return during the first half, led by approximately 8% and 9% returns in Korea and Russia, respectively, which somewhat offset weakness in India, Turkey, Brazil, and South Africa. Year to date, non-U.S. developed small cap stocks trailed their larger cap counterparts, due to second quarter relative weakness in Canada and Continental Europe. All sectors had positive returns during the first half of 2011, led by strength in Healthcare, which rose over 12%, along with Consumer, Energy, and Telecommunication Services, which were each up approximately 7%. Conversely, Information Technology returned 0.6%, while Financials and Materials each rose just over 1%.
Outlook
Over the last several months, the global investment agenda has been plagued by macroeconomic concerns of perceived threats to global growth and/or financial stability. Specifically, there are increasing concerns regarding the sustainability of Chinese growth, an increased potential for the slowdown to transition to a harder landing, and the implication for asset quality within the Financials sector. We believe that China’s development is the most important input into global economic growth and any slowdown in that economy would have significant effects on sustainable growth in this cycle.
Europe is facing more clear cut challenges regarding public sector fiscal sustainability. This is what the market has been focused on—peripheral European public sector debt and the attendant risks on the Financial system and, by implication, global growth. Despite these
2 Semi-Annual Report | June 30, 2011 |
fears, core European economies have been relatively strong and corporate performance has been sound. The details surrounding a deal for peripheral European public sector debt will continue to be debated and we expect that these questions will be more elongated than investors would like. The U.S. is facing similar public sector finance issues as Europe, which will be noisier over the short term, but will likely be resolved more quickly, given a more straightforward set of tradeoffs.
Global growth has been led by emerging markets post the 2008 financial crisis. There are now clear signs of a global growth plateau, as the global growth impulse is not feeding through the economy. As a result, economic growth and earnings growth expectations no longer are increasing, which has been exemplified in negative earnings revisions across regions and sectors. However, macroeconomic concerns have depressed equity valuations globally relative to historic norms and interest rates. The European uncertainly in particular may extend through the third quarter before there is a satisfactory outcome. This will be an opportunity for market appreciation particularly during the latter part of the year.
We believe this framework suggests a market environment favoring high quality companies that can deliver strong performance in a weaker growth environment where there are no longer cyclical tailwinds creating earnings surprises quarterly. The companies that outperform in even a sluggish environment will be rewarded with better valuations. From a short term strategy perspective, the less cyclical regions have outperformed more recently—U.S. and Japan. We believe that if there is a resolution to the European financial crisis and moderating Chinese inflation, these areas could outperform at the expense of the U.S. and Japan.
Long Term Strategy Considerations
In terms of long term strategy, equities remain attractive versus fixed income. The trade towards safe government bonds and money market instruments has led investors to neglect alternative income and growth investment opportunities in favor of fixed value and fixed income opportunities. This has created significant opportunities for equities and other income producing assets, as the prospective return and yield differentials have increased. Secondly, following a cycle that favored small cap companies over larger cap, we believe that we may be at a point where large cap equities are poised to do better, particularly if the financial outlook stabilizes. Our portfolio strategies generally reflect this trend, with a higher allocation than normal to large cap companies at the expense of smaller cap holdings. Finally, we believe there is a favorable outlook for developed markets versus emerging markets over the long term. Emerging markets have outperformed consistently over the last decade or so. As a result, emerging markets are currently at a similar peak in relative performance as they were in 1993, after the late 1980s-early 1990s emerging markets bubble. Clearly, emerging markets are in a significantly different position in the world than in the early 1990s given improved corporate returns and significant growth; however, there are underlying structural risks in emerging markets that continue to this day. Over the long term, these risks will need to be addressed, which may result in underperformance vis-à-vis developed markets over a period of several years.
June 30, 2011 | William Blair Funds 3 |

W. George Greig
INSTITUTIONAL INTERNATIONAL GROWTH FUND
The Institutional International Growth Fund seeks long-term capital appreciation.
AN OVERVIEW FROM THE PORTFOLIO MANAGER
The Institutional International Growth Fund posted a 2.16% increase for the six months ended June 30, 2011. By comparison, the Fund’s benchmark, the MSCI All Country World ex-U.S. IMI Index (net), gained 3.52%.
Despite strong results the majority of the year, the Fund underperformed the Index year to date due to weakness in January and February, coupled with the Fund’s currency hedges, as the USD depreciated versus most currencies year to date. Key detractors from return included the Fund’s U.K. Consumer Staples holdings, which underperformed during the first quarter on rising raw materials costs and slower than expected revenue growth. Emerging Latin America also detracted from results on pricing pressure. Energy stock selection was negative due to a focus on services holdings, lack of European and Russian integrated oil exposure, and Latin American stock selection. Financials stock selection detracted from performance during the first two months of the year and, therefore, year to date due to weakness in Singaporean real estate holdings, overweighted Japanese Financials exposure, and residual Egyptian and Turkish bank exposure. Somewhat offsetting these negative relative results were the overweighting and stock selection in Consumer Discretionary, along with Industrials, Information Technology, Materials and Utilities stock selection. Regionally, stock selection was additive in Japan, Europe Ex-U.K., Canada and Emerging Asia, but was offset by weakness in Pacific Ex-Japan, the U.K. and Emerging Europe, Middle-East, and Africa.
Over the six month period the emerging markets weighting was reduced from approximately 25% as of year end to 19% as of June 30, due largely to a decline in Latin America near the beginning of the year on inflationary and growth concerns. Conversely Japanese exposure, which totaled approximately 14.6% as of year end, increased during the first quarter on growth and valuation opportunities, and then after the March earthquake on opportunistic valuation opportunities. Subsequent to first quarter end, we reduced Japanese Financial and Industrials exposure on a valuation recovery, coupled with lower growth expectations as the reconstruction began. From a sector perspective, the Fund maintained its focus in the Discretionary and Industrials sectors as of June 30, albeit at lower weightings than December 31. Within Consumer Discretionary the focus remained on auto-related and luxury holdings, while Industrials positioning was largely the result of capital equipment and machinery names. The Fund remained underweighted in Financials during the period, approximating 20% of the Fund, although European exposure was reduced during the period in favor of emerging Asian financials following a series of interest rate hikes. Energy and Materials exposures remained underweighted during the six month period, due to lower energy exploration and production and mining exposures, and despite a focus on energy services and chemicals. From a capitalization perspective, the Fund was at the lower end of its small capitalization range, as growth expectations and valuations favored larger cap peers.
4 Semi-Annual Report | June 30, 2011 |
Institutional International Growth Fund
Performance Highlights (unaudited)
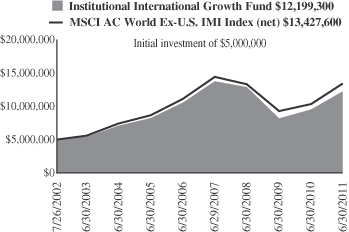
Average Annual Total Return at 6/30/2011
| | | | | | | | | | | | | | | | | | | | |
| | | Year To
Date | | | 1
Year | | | 3
Year | | | 5
Year | | | Since
Inception(a) | |
Institutional International Growth Fund | | | 2.16 | % | | | 28.26 | % | | | (1.72 | )% | | | 3.03 | % | | | 10.48 | % |
MSCI All Country World Ex-U.S. IMI (net) | | | 3.52 | | | | 30.26 | | | | 0.31 | | | | 3.96 | | | | 11.66 | |
| | (a) | | For the period July 26, 2002 (Commencement of Operations) to June 30, 2011. |
Performance cited represents past performance. Past performance does not guarantee future results and current performance may be lower or higher than the data quoted. Results shown are average annual returns, which assume reinvestment of dividends and capital gains. Investment returns and principal will fluctuate and you may have a gain or loss when you sell shares. For the most current month-end performance information, please call 1-800-742-7272, or visit our Web site at www.williamblairfunds.com. International investing involves special risk considerations, including currency fluctuations, lower liquidity, economic and political risk.
The performance highlights and graph presented above do not reflect the deduction of taxes that a shareholder would pay on fund distributions or the redemption of fund shares.
The Morgan Stanley Capital International (MSCI) All Country World Ex-U.S. Investable Market Index (IMI) (net) is a free float-adjusted market capitalization weighted index that is designed to measure the equity market performance of developed and emerging markets, excluding the United States. This series approximates the minimum possible dividend reinvestment.
This report identifies the Fund’s investments on June 30, 2011. These holdings are subject to change. Not all stocks in the Fund performed the same, nor is there any guarantee that these stocks will perform as well in the future. Market forecasts provided in this report may not necessarily come to pass.
Sector Diversification (unaudited)
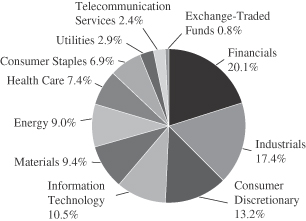
The sector diversification shown is based on the total long-term securities.
June 30, 2011 | William Blair Funds 5 |
Institutional International Growth Fund
Portfolio of Investments, June 30, 2011 (all dollar amounts in thousands) (unaudited)
| | | | | | | | |
Issuer | | Shares | | | Value | |
| |
Common Stocks | | | | | |
| |
Europe, Mid-East—30.6% | | | | | |
Austria—0.1% | | | | | | | | |
Schoeller-Bleckmann Oilfield Equipment AG (Energy equipment & services) | | | 27,713 | | | $ | 2,400 | |
| | | | | | | | |
Belgium—1.4% | | | | | | | | |
Anheuser-Busch InBev N.V. (Beverages) | | | 300,154 | | | | 17,411 | |
Colruyt S.A. (Food & staples retailing) | | | 128,967 | | | | 6,452 | |
| | | | | | | | |
| | | | | | | 23,863 | |
| | | | | | | | |
Denmark—1.4% | | | | | | | | |
Coloplast A/S (Health care equipment & supplies) | | | 57,377 | | | | 8,712 | |
Novo Nordisk A/S (Pharmaceuticals) | | | 97,100 | | | | 12,186 | |
SimCorp A/S (Software) | | | 13,528 | | | | 2,670 | |
| | | | | | | | |
| | | | | | | 23,568 | |
| | | | | | | | |
Finland—1.5% | | | | | | | | |
Kone Oyj (Machinery) | | | 171,209 | | | | 10,758 | |
Nokian Renkaat Oyj (Auto components) | | | 138,092 | | | | 6,929 | |
UPM-Kymmene Oyj (Paper & forest products) | | | 463,867 | | | | 8,482 | |
| | | | | | | | |
| | | | | | | 26,169 | |
| | | | | | | | |
France—7.0% | | | | | | | | |
Air Liquide S.A. (Chemicals) | | | 66,614 | | | | 9,548 | |
*Arkema S.A. (Chemicals) | | | 69,036 | | | | 7,107 | |
AXA S.A. (Insurance) | | | 785,739 | | | | 17,855 | |
BNP Paribas (Commercial banks) | | | 281,989 | | | | 21,767 | |
Essilor International S.A. (Health care equipment & supplies) | | | 212,503 | | | | 17,235 | |
L’Oreal S.A. (Personal products) | | | 177,344 | | | | 23,033 | |
Schneider Electric S.A. (Electrical equipment) | | | 85,139 | | | | 14,223 | |
SEB S.A. (Household durables) | | | 43,696 | | | | 4,578 | |
Suez Environnement Co. (Multi-utilities) | | | 345,301 | | | | 6,888 | |
| | | | | | | | |
| | | | | | | 122,234 | |
| | | | | | | | |
Germany—7.1% | | | | | | | | |
Aixtron AG (Semiconductors & semiconductor equipment) | | | 118,657 | | | | 4,049 | |
BASF SE (Chemicals) | | | 261,092 | | | | 25,584 | |
Bayer AG (Pharmaceuticals) | | | 310,493 | | | | 24,962 | |
*Bayerische Motoren Werke AG (Automobiles) | | | 199,302 | | | | 19,887 | |
Gerry Weber International AG (Textiles, apparel & luxury goods) | | | 46,124 | | | | 3,028 | |
Infineon Technologies AG (Semiconductors & semiconductor equipment) | | | 998,512 | | | | 11,225 | |
Lanxess AG (Chemicals) | | | 91,384 | | | | 7,501 | |
MTU Aero Engines Holding AG (Aerospace & defense) | | | 79,845 | | | | 6,378 | |
SAP AG (Software) | | | 281,985 | | | | 17,072 | |
Wincor Nixdorf AG (Computers & peripherals) | | | 64,713 | | | | 4,677 | |
| | | | | | | | |
| | | | | | | 124,363 | |
| | | | | | | | |
Ireland—0.4% | | | | | | | | |
Paddy Power plc (Hotels, restaurants & leisure) | | | 84,859 | | | | 4,614 | |
Shire plc (Pharmaceuticals) | | | 96,686 | | | | 3,018 | |
| | | | | | | | |
| | | | | | | 7,632 | |
| | | | | | | | |
| | | | | | | | |
Issuer | | Shares | | | Value | |
|
Common Stocks—Europe, Mid-East—30.6%—(continued) | |
Israel—1.7% | | | | | |
*Check Point Software Technologies, Ltd. (Software)† | | | 133,008 | | | $ | 7,562 | |
Israel Chemicals, Ltd. (Chemicals) | | | 645,996 | | | | 10,254 | |
Teva Pharmaceutical Industries, Ltd.—ADR (Pharmaceuticals) | | | 238,494 | | | | 11,500 | |
| | | | | | | | |
| | | | | | | 29,316 | |
| | | | | | | | |
Italy—1.2% | | | | | | | | |
Ansaldo STS SpA (Transportation infrastructure) | | | 255,401 | | | | 3,580 | |
DiaSorin SpA (Health care equipment & supplies) | | | 87,261 | | | | 4,188 | |
Saipem SpA (Energy equipment & services) | | | 255,858 | | | | 13,209 | |
| | | | | | | | |
| | | | | | | 20,977 | |
| | | | | | | | |
Luxembourg—0.0% | | | | | | | | |
*L’Occitane International S.A. (Specialty retail) | | | 211,000 | | | | 564 | |
| | | | | | | | |
Netherlands—0.6% | | | | | | | | |
*ASML Holding N.V. (Semiconductors & semiconductor equipment) | | | 292,268 | | | | 10,765 | |
| | | | | | | | |
Norway—0.2% | | | | | | | | |
*Norwegian Air Shuttle ASA (Airlines) | | | 138,200 | | | | 2,549 | |
Opera Software ASA (Internet software & services) | | | 215,749 | | | | 1,355 | |
| | | | | | | | |
| | | | | | | 3,904 | |
| | | | | | | | |
Spain—1.3% | | | | | | | | |
Banco Santander S.A. (Commercial banks) | | | 1,282,744 | | | | 14,813 | |
Prosegur Cia de Seguridad S.A. (Commercial services & supplies) | | | 74,861 | | | | 3,981 | |
Tecnicas Reunidas S.A. (Energy equipment & services) | | | 28,381 | | | | 1,456 | |
*Viscofan S.A. (Food products) | | | 74,509 | | | | 2,966 | |
| | | | | | | | |
| | | | | | | 23,216 | |
| | | | | | | | |
Sweden—2.3% | | | | | | | | |
Atlas Copco AB (Machinery) | | | 530,051 | | | | 13,953 | |
Elekta AB (Health care equipment & supplies) | | | 129,565 | | | | 6,137 | |
*Hexagon AB (Machinery) | | | 554,301 | | | | 13,653 | |
JM AB (Household durables) | | | 131,970 | | | | 3,114 | |
Mekonomen AB (Specialty retail) | | | 25,413 | | | | 880 | |
NIBE Industrier AB (Building products) | | | 103,430 | | | | 1,790 | |
| | | | | | | | |
| | | | | | | 39,527 | |
| | | | | | | | |
Switzerland—4.4% | | | | | | | | |
*ABB, Ltd. (Electrical equipment) | | | 672,537 | | | | 17,438 | |
Cie Financiere Richemont S.A. (Textiles, apparel & luxury goods) | | | 116,985 | | | | 7,660 | |
*Glencore International plc (Metals & mining) | | | 249,741 | | | | 1,968 | |
*Julius Baer Group, Ltd. (Capital markets) | | | 142,486 | | | | 5,886 | |
*Meyer Burger Technology AG (Machinery) | | | 63,422 | | | | 2,802 | |
*Orascom Development Holding AG (Hotels, restaurants & leisure) | | | 71,619 | | | | 2,360 | |
Partners Group Holding AG (Capital markets) | | | 40,043 | | | | 7,087 | |
SGS S.A. (Professional services) | | | 4,914 | | | | 9,328 | |
See accompanying Notes to Financial Statements.
6 Semi-Annual Report | June 30, 2011 |
Institutional International Growth Fund
Portfolio of Investments, June 30, 2011 (all dollar amounts in thousands) (unaudited)
| | | | | | | | |
Issuer | | Shares | | | Value | |
|
Common Stocks—Europe, Mid-East—30.6%—(continued) | |
Switzerland—(continued) | | | | | | | | |
Sika AG (Chemicals) | | | 2,452 | | | $ | 5,912 | |
Xstrata plc (Metals & mining) | | | 720,917 | | | | 15,869 | |
| | | | | | | | |
| | | | | | | 76,310 | |
| | | | | | | | |
| | |
United Kingdom—20.3% | | | | | | | | |
Abcam plc (Biotechnology) | | | 753,393 | | | | 5,039 | |
Admiral Group plc (Insurance) | | | 264,465 | | | | 7,050 | |
Aggreko plc (Commercial services & supplies) | | | 210,221 | | | | 6,508 | |
AMEC plc (Energy equipment & services) | | | 582,764 | | | | 10,176 | |
Amlin plc (Insurance) | | | 932,038 | | | | 6,075 | |
Antofagasta plc (Metals & mining) | | | 278,128 | | | | 6,222 | |
Ashmore Group plc (Capital markets) | | | 682,488 | | | | 4,364 | |
*Autonomy Corporation plc (Software) | | | 224,395 | | | | 6,148 | |
Babcock International Group plc (Commercial services & supplies) | | | 938,423 | | | | 10,724 | |
BG Group plc (Oil, gas & consumable fuels) | | | 762,650 | | | | 17,308 | |
BHP Billiton plc (Metals & mining) | | | 748,329 | | | | 29,449 | |
Britvic plc (Beverages) | | | 539,810 | | | | 3,418 | |
Burberry Group plc (Textiles, apparel & luxury goods) | | | 308,471 | | | | 7,179 | |
*Cairn Energy plc (Oil, gas & consumable fuels) | | | 595,024 | | | | 3,961 | |
*Carphone Warehouse Group plc (Specialty retail) | | | 1,024,283 | | | | 6,954 | |
Centrica plc (Multi-utilities) | | | 4,793,130 | | | | 24,871 | |
Diageo plc (Beverages) | | | 1,111,544 | | | | 22,710 | |
Dunelm Group plc (Specialty retail) | | | 496,372 | | | | 3,099 | |
*EnQuest plc (Oil, gas & consumable fuels) | | | 781,394 | | | | 1,542 | |
Halma plc (Electronic equipment, instruments & components) | | | 491,608 | | | | 3,269 | |
Hargreaves Lansdown plc (Capital markets) | | | 342,619 | | | | 3,340 | |
Hiscox, Ltd. (Insurance) | | | 455,088 | | | | 3,060 | |
IG Group Holdings plc (Diversified financial services) | | | 628,161 | | | | 4,400 | |
*John Wood Group plc (Energy equipment & services) | | | 523,236 | | | | 5,437 | |
Johnson Matthey plc (Chemicals) | | | 427,368 | | | | 13,485 | |
Jupiter Fund Management plc (Capital markets) | | | 542,914 | | | | 2,204 | |
Lancashire Holdings, Ltd. (Insurance) | | | 462,146 | | | | 4,840 | |
Meggitt plc (Aerospace & defense) | | | 673,908 | | | | 4,126 | |
Michael Page International plc (Professional services) | | | 315,044 | | | | 2,705 | |
Next plc (Multiline retail) | | | 273,503 | | | | 10,206 | |
*Ocado Group plc (Internet & catalog retail) | | | 935,655 | | | | 2,738 | |
Petrofac, Ltd. (Energy equipment & services) | | | 692,003 | | | | 16,815 | |
Restaurant Group plc (Hotels, restaurants & leisure) | | | 347,227 | | | | 1,638 | |
*Rolls-Royce Holdings plc (Aerospace & defense) | | | 1,232,713 | | | | 12,761 | |
Rotork plc (Machinery) | | | 200,023 | | | | 5,412 | |
RPS Group plc (Commercial services & supplies) | | | 816,151 | | | | 3,212 | |
Scottish & Southern Energy plc (Electric utilities) | | | 768,785 | | | | 17,188 | |
| | | | | | | | |
Issuer | | Shares | | | Value | |
|
Common Stocks—United Kingdom—20.3%—(continued) | |
Spirax-Sarco Engineering plc (Machinery) | | | 168,677 | | | $ | 5,417 | |
St James’s Place plc (Insurance) | | | 445,903 | | | | 2,433 | |
*Telecity Group plc (Internet software & services) | | | 496,884 | | | | 4,418 | |
*The Berkeley Group Holdings plc (Household durables) | | | 365,768 | | | | 7,561 | |
The Weir Group plc (Machinery) | | | 300,444 | | | | 10,256 | |
Tullow Oil plc (Oil, gas & consumable fuels) | | | 260,162 | | | | 5,178 | |
Ultra Electronics Holdings plc (Aerospace & defense) | | | 59,714 | | | | 1,645 | |
Victrex plc (Chemicals) | | | 184,500 | | | | 4,442 | |
Vodafone Group plc (Wireless telecommunication services) | | | 2,376,361 | | | | 6,304 | |
Whitbread plc (Hotels, restaurants & leisure) | | | 289,946 | | | | 7,515 | |
| | | | | | | | |
| | | | | | | 354,802 | |
| | | | | | | | |
| | |
Japan—16.6% | | | | | | | | |
Asics Corporation (Textiles, apparel & luxury goods) | | | 290,000 | | | | 4,312 | |
CyberAgent, Inc. (Media) | | | 1,741 | | | | 6,075 | |
Daito Trust Construction Co., Ltd. (Real estate management & development) | | | 94,100 | | | | 7,960 | |
Dena Co., Ltd. (Internet & catalog retail) | | | 245,200 | | | | 10,523 | |
Dr Ci:Labo Co., Ltd. (Personal products) | | | 410 | | | | 2,093 | |
Exedy Corporation (Auto components) | | | 161,100 | | | | 5,503 | |
F.C.C. Co., Ltd. (Auto components) | | | 112,652 | | | | 2,695 | |
Fanuc, Ltd. (Machinery) | | | 112,100 | | | | 18,631 | |
Fast Retailing Co., Ltd. (Specialty retail) | | | 86,100 | | | | 13,871 | |
Gree, Inc. (Internet software & services) | | | 459,400 | | | | 9,992 | |
K’s Holdings Corporation (Specialty retail) | | | 181,100 | | | | 7,817 | |
Kakaku.com, Inc. (Internet software & services) | | | 801 | | | | 5,622 | |
Kaken Pharmaceutical Co., Ltd. (Pharmaceuticals) | | | 186,000 | | | | 2,604 | |
Keyence Corporation (Electronic equipment, instruments & components) | | | 64,100 | | | | 18,106 | |
Komatsu, Ltd. (Machinery) | | | 557,500 | | | | 17,292 | |
Makita Corporation (Machinery) | | | 209,200 | | | | 9,693 | |
Miraca Holdings, Inc. (Health care providers & services) | | | 94,100 | | | | 3,805 | |
MISUMI Group, Inc. (Trading companies & distributors) | | | 178,100 | | | | 4,595 | |
Murata Manufacturing Co., Ltd. (Electronic equipment, instruments & components) | | | 152,100 | | | | 10,108 | |
Nitori Co., Ltd. (Specialty retail) | | | 125,580 | | | | 11,902 | |
Nitto Denko Corporation (Chemicals) | | | 135,100 | | | | 6,822 | |
ORIX Corporation (Diversified financial services) | | | 150,820 | | | | 14,594 | |
Osaka Securities Exchange Co., Ltd. (Diversified financial services) | | | 349 | | | | 1,554 | |
Sawai Pharmaceutical Co., Ltd. (Pharmaceuticals) | | | 34,300 | | | | 3,609 | |
SMC Corporation (Machinery) | | | 66,100 | | | | 11,856 | |
Softbank Corporation (Wireless telecommunication services) | | | 759,600 | | | | 28,589 | |
Sumitomo Mitsui Financial Group, Inc. (Commercial banks) | | | 657,500 | | | | 20,157 | |
See accompanying Notes to Financial Statements.
June 30, 2011 | William Blair Funds 7 |
Institutional International Growth Fund
Portfolio of Investments, June 30, 2011 (all dollar amounts in thousands) (unaudited)
| | | | | | | | |
Issuer | | Shares | | | Value | |
| |
Common Stocks—Japan—16.6%—(continued) | | | | | |
United Arrows, Ltd. (Specialty retail) | | | 14,700 | | | $ | 310 | |
Yahoo! Japan Corporation (Internet software & services) | | | 56,826 | | | | 19,482 | |
Yamada Denki Co., Ltd. (Specialty retail) | | | 123,500 | | | | 10,017 | |
| | | | | | | | |
| | | | | | | 290,189 | |
| | | | | | | | |
| | |
Emerging Asia—11.8% | | | | | | | | |
China—4.4% | | | | | | | | |
AAC Technologies Holdings, Inc. (Communications equipment) | | | 924,000 | | | | 2,152 | |
Ajisen China Holdings, Ltd. (Hotels, restaurants & leisure) | | | 1,245,000 | | | | 2,579 | |
*China Minzhong Food Corporation, Ltd. (Food products) | | | 968,000 | | | | 1,182 | |
China Overseas Land & Investment, Ltd. (Real estate management & development) | | | 5,644,000 | | | | 12,098 | |
China Shenhua Energy Co., Ltd. (Oil, gas & consumable fuels) | | | 2,016,500 | | | | 9,614 | |
CNOOC, Ltd. (Oil, gas & consumable fuels) | | | 7,086,000 | | | | 16,536 | |
Haitian International Holdings, Ltd. (Machinery) | | | 1,961,000 | | | | 2,540 | |
*Hollysys Automation Technologies, Ltd. (Electronic equipment, instruments & components)† | | | 139,391 | | | | 1,299 | |
Industrial and Commercial Bank of China, Ltd. Class “H” (Commercial banks) | | | 33,427,000 | | | | 25,387 | |
Lonking Holdings, Ltd. (Machinery) | | | 5,627,000 | | | | 3,073 | |
| | | | | | | | |
| | | | | | | 76,460 | |
| | | | | | | | |
India—1.4% | | | | | | | | |
Axis Bank, Ltd. (Commercial banks) | | | 188,453 | | | | 5,436 | |
HDFC Bank, Ltd. (Commercial banks) | | | 81,726 | | | | 4,599 | |
Infosys Technologies, Ltd. (IT services) | | | 74,551 | | | | 4,854 | |
Shriram Transport Finance Co., Ltd. (Consumer finance) | | | 221,933 | | | | 3,062 | |
Tata Consultancy Services, Ltd. (IT services) | | | 274,203 | | | | 7,264 | |
| | | | | | | | |
| | | | | | | 25,215 | |
| | | | | | | | |
Indonesia—2.1% | | | | | | | | |
PT Bank Rakyat Indonesia (Commercial banks) | | | 9,773,000 | | | | 7,408 | |
PT Indo Tambangraya Megah (Oil, gas & consumable fuels) | | | 991,000 | | | | 5,171 | |
PT Indofood Sukses Makmur Tbk (Food products) | | | 11,594,500 | | | | 7,774 | |
PT Kalbe Farma Tbk (Pharmaceuticals) | | | 10,178,500 | | | | 4,006 | |
PT United Tractors Tbk (Machinery) | | | 4,241,651 | | | | 12,316 | |
| | | | | | | | |
| | | | | | | 36,675 | |
| | | | | | | | |
Philippines—0.2% | | | | | | | | |
Alliance Global Group, Inc. (Industrial conglomerates) | | | 16,347,300 | | | | 4,127 | |
| | | | | | | | |
South Korea—2.4% | | | | | | | | |
Halla Climate Control Corporation (Auto components) | | | 94,725 | | | | 2,280 | |
Hyundai Mobis (Auto components) | | | 24,300 | | | | 9,104 | |
| | | | | | | | |
Issuer | | Shares | | | Value | |
|
Common Stocks—Emerging Asia—11.8%—(continued) | |
South Korea—(continued) | | | | | | | | |
Hyundai Motor Co. (Automobiles) | | | 60,579 | | | $ | 13,448 | |
Samsung Engineering Co., Ltd. (Construction & engineering) | | | 37,300 | | | | 8,909 | |
Samsung Fire & Marine Insurance Co., Ltd. (Insurance) | | | 35,759 | | | | 8,306 | |
| | | | | | | | |
| | | | | | | 42,047 | |
| | | | | | | | |
Taiwan—0.8% | | | | | | | | |
HTC Corporation (Communications equipment) | | | 220,000 | | | | 7,399 | |
Powertech Technology, Inc. (Semiconductors & semiconductor equipment) | | | 784,000 | | | | 2,631 | |
*TPK Holding Co., Ltd. (Electronic equipment, instruments & components) | | | 114,000 | | | | 3,473 | |
| | | | | | | | |
| | | | | | | 13,503 | |
| | | | | | | | |
Thailand—0.5% | | | | | | | | |
Bangkok Dusit Medical Services PCL (Health care providers & services) | | | 919,500 | | | | 1,578 | |
Kasikornbank PCL (Commercial banks) | | | 1,559,300 | | | | 6,344 | |
| | | | | | | | |
| | | | | | | 7,922 | |
| | | | | | | | |
| | |
Canada—6.2% | | | | | | | | |
Alimentation Couche Tard, Inc. (Food & staples retailing) | | | 310,062 | | | | 9,040 | |
*Bankers Petroleum, Ltd. (Oil, gas & consumable fuels) | | | 324,460 | | | | 2,315 | |
Brookfield Asset Management, Inc.
Class “A” (Real estate management & development)† | | | 714,842 | | | | 23,711 | |
Canadian Western Bank (Commercial banks) | | | 145,103 | | | | 4,634 | |
CI Financial Corporation (Capital markets) | | | 221,453 | | | | 5,258 | |
Crescent Point Energy Corporation (Oil, gas & consumable fuels) | | | 145,201 | | | | 6,710 | |
Gildan Activewear, Inc. (Textiles, apparel & luxury goods) | | | 177,100 | | | | 6,242 | |
Home Capital Group, Inc. (Thrifts & mortgage finance) | | | 33,037 | | | | 1,773 | |
Intact Financial Corporation (Insurance) | | | 104,666 | | | | 6,001 | |
Laurentian Bank of Canada (Commercial banks) | | | 44,624 | | | | 2,062 | |
National Bank of Canada (Commercial banks) | | | 126,313 | | | | 10,244 | |
PetroBakken Energy, Ltd. Class “A” (Oil, gas & consumable fuels) | | | 312,845 | | | | 4,295 | |
Petrominerales, Ltd. (Oil, gas & consumable fuels) | | | 107,973 | | | | 3,169 | |
Peyto Exploration & Development Corporation (Oil, gas & consumable fuels) | | | 201,947 | | | | 4,502 | |
Saputo, Inc. (Food products) | | | 185,471 | | | | 8,944 | |
Tim Hortons, Inc. (Hotels, restaurants & leisure) | | | 179,106 | | | | 8,745 | |
| | | | | | | | |
| | | | | | | 107,645 | |
| | | | | | | | |
See accompanying Notes to Financial Statements.
8 Semi-Annual Report | June 30, 2011 |
Institutional International Growth Fund
Portfolio of Investments, June 30, 2011 (all dollar amounts in thousands) (unaudited)
| | | | | | | | |
Issuer | | Shares | | | Value | |
| | |
Common Stocks—(continued) | | | | | | | | |
| | |
Emerging Latin America—4.3% | | | | | | | | |
Brazil—2.3% | | | | | | | | |
BM&F BOVESPA S.A. (Diversified financial services) | | | 24,100 | | | $ | 160 | |
BR Malls Participacoes S.A. (Real estate management & development) | | | 472,400 | | | | 5,403 | |
BR Properties S.A. (Real estate management & development) | | | 246,600 | | | | 2,765 | |
Cia de Concessoes Rodoviarias (Transportation infrastructure) | | | 223,300 | | | | 6,646 | |
Cia Hering (Specialty retail) | | | 194,200 | | | | 4,467 | |
Drogasil S.A. (Food & staples retailing) | | | 161,100 | | | | 1,099 | |
Iochpe-Maxion S.A. (Machinery) | | | 179,700 | | | | 2,453 | |
Mills Estruturas e Servicos de Engenharia S.A. (Trading companies & distributors) | | | 155,880 | | | | 2,247 | |
Natura Cosmeticos S.A. (Personal products) | | | 86,300 | | | | 2,157 | |
OdontoPrev S.A. (Health care providers & services) | | | 264,200 | | | | 4,402 | |
*OGX Petroleo e Gas Participacoes S.A. (Oil, gas & consumable fuels) | | | 496,400 | | | | 4,641 | |
Sul America S.A. (Insurance) | | | 279,200 | | | | 3,506 | |
*T4F Entretenimento S.A. (Media) | | | 35,100 | | | | 316 | |
| | | | | | | | |
| | | | | | | 40,262 | |
| | | | | | | | |
Chile—0.7% | | | | | | | | |
Banco Santander Chile—ADR (Commercial banks) | | | 68,436 | | | | 6,420 | |
*CFR Pharmaceuticals S.A. (Pharmaceuticals) | | | 10,149,135 | | | | 2,758 | |
Parque Arauco S.A. (Real estate management & development) | | | 1,139,457 | | | | 2,548 | |
| | | | | | | | |
| | | | | | | 11,726 | |
| | | | | | | | |
Colombia—0.5% | | | | | | | | |
Pacific Rubiales Energy Corporation (Oil, gas & consumable fuels) | | | 294,189 | | | | 7,885 | |
| | | | | | | | |
Mexico—0.4% | | | | | | | | |
Compartamos S.A.B. de C.V. (Consumer finance) | | | 2,281,900 | | | | 4,141 | |
*Genomma Lab Internacional S.A.B. de C.V. (Pharmaceuticals) | | | 1,195,162 | | | | 3,042 | |
Grupo Mexico S.A.B. de C.V. Series “B” (Metals & mining) | | | 186,200 | | | | 615 | |
| | | | | | | | |
| | | | | | | 7,798 | |
| | | | | | | | |
Peru—0.4% | | | | | | | | |
Credicorp, Ltd. (Commercial banks)† | | | 83,988 | | | | 7,231 | |
| | | | | | | | |
| | |
Asia—2.8% | | | | | | | | |
Australia—0.2% | | | | | | | | |
Iluka Resources, Ltd. (Metals & mining) | | | 205,248 | | | | 3,694 | |
| | | | | | | | |
Hong Kong—1.1% | | | | | | | | |
China High Precision Automation Group, Ltd. (Electronic equipment, instruments & components) | | | 1,410,000 | | | | 1,103 | |
| | | | | | | | |
Issuer | | Shares | | | Value | |
| |
Common Stocks—Asia—2.8%—(continued) | | | | | |
Hong Kong—(continued) | | | | | | | | |
Hutchison Telecommunications Hong Kong Holdings, Ltd. (Diversified telecommunication services) | | | 9,294,000 | | | $ | 2,866 | |
Noble Group, Ltd. (Trading companies & distributors) | | | 5,895,000 | | | | 9,455 | |
SmarTone Telecommunications Holdings, Ltd. (Wireless telecommunication services) | | | 1,020,000 | | | | 1,518 | |
Value Partners Group, Ltd. (Capital markets) | | | 3,939,000 | | | | 3,371 | |
| | | | | | | | |
| | | | | | | 18,313 | |
| | | | | | | | |
Singapore—1.5% | | | | | | | | |
CapitaMalls Asia, Ltd. (Real estate management & development) | | | 5,304,000 | | | | 6,348 | |
*Global Logistic Properties, Ltd. (Real estate management & development) | | | 5,354,000 | | | | 8,979 | |
Keppel Corporation, Ltd. (Industrial conglomerates) | | | 1,211,300 | | | | 10,927 | |
Midas Holdings, Ltd. (Metals & mining) | | | 297,000 | | | | 157 | |
| | | | | | | | |
| | | | | | | 26,411 | |
| | | | | | | | |
|
Emerging Europe, Mid-East, Africa—2.4% | |
Egypt—0.3% | | | | | | | | |
Commercial International Bank Egypt S.A.E. (Commercial banks) | | | 542,873 | | | | 2,707 | |
Egyptian Financial Group-Hermes Holding (Capital markets) | | | 784,948 | | | | 2,643 | |
| | | | | | | | |
| | | | | | | 5,350 | |
| | | | | | | | |
South Africa—1.7% | | | | | | | | |
Clicks Group, Ltd. (Multiline retail) | | | 660,768 | | | | 4,129 | |
Life Healthcare Group Holdings, Ltd. (Health care providers & services) | | | 1,447,708 | | | | 3,766 | |
Sasol, Ltd. (Oil, gas & consumable fuels) | | | 146,039 | | | | 7,688 | |
Shoprite Holdings, Ltd. (Food & staples retailing) | | | 438,166 | | | | 6,597 | |
*The Foschini Group, Ltd. (Specialty retail) | | | 392,321 | | | | 5,118 | |
Wilson Bayly Holmes-Ovcon, Ltd. (Construction & engineering) | | | 175,665 | | | | 2,858 | |
| | | | | | | | |
| | | | | | | 30,156 | |
| | | | | | | | |
Turkey—0.4% | | | | | | | | |
Tofas Turk Otomobil Fabrikasi A.S. (Automobiles) | | | 560,837 | | | | 2,557 | |
Turkiye Halk Bankasi A.S. (Commercial banks) | | | 646,686 | | | | 4,841 | |
| | | | | | | | |
| | | | | | | 7,398 | |
| | | | | | | | |
Total Common Stocks—95.0%
(cost $1,402,398) | | | | 1,659,617 | |
| | | | | | | | |
See accompanying Notes to Financial Statements.
June 30, 2011 | William Blair Funds 9 |
Institutional International Growth Fund
Portfolio of Investments, June 30, 2011 (all dollar amounts in thousands) (unaudited)
| | | | | | | | |
Issuer | | Shares or
Principal
Amount | | | Value | |
| | |
Convertible Bond | | | | | | | | |
Brazil—0.0% | | | | | | | | |
Lupatech S.A., 6.500%, due 4/15/18 (Machinery)**§ | | $ | 941 | | | $ | 620 | |
| | | | | | | | |
Total Convertible Bond—0.0%
(cost $488) | | | | 620 | |
| | | | | | | | |
| | |
Exchange-Traded Fund | | | | | | | | |
China—0.8% | | | | | | | | |
iShares FTSE/Xinhua A50 China Index | | | 8,445,900 | | | | 14,044 | |
| | | | | | | | |
Total Exchange-Traded Fund—0.8%
(cost $14,189) | | | | 14,044 | |
| | | | | | | | |
| | |
Repurchase Agreement | | | | | | | | |
Fixed Income Clearing Corporation, 0.010% dated 6/30/11, due 7/1/11, repurchase price $24,274, collateralized by FHLMC, 2.000%, due 12/03/15 | | $ | 24,274 | | | | 24,274 | |
| | | | | | | | |
Total Repurchase Agreement—1.4%
(cost $24,274) | | | | 24,274 | |
| | | | | | | | |
Total Investments—97.2%
(cost $1,441,349) | | | | 1,698,555 | |
Cash and other assets, less liabilities—2.8% | | | | 49,273 | |
| | | | | | | | |
Net assets—100.0% | | | $ | 1,747,828 | |
| | | | | | | | |
ADR = American Depository Receipt
* Non-income producing securities
† = U.S. listed foreign security
** = Fair valued pursuant to Valuation Procedures adopted by the Board of Trustees. This holding represents 0.04% of the Fund’s net assets at June 30, 2011.
§ = Deemed illiquid pursuant to Liquidity Procedures approved by the Board of Trustees. This holding represents 0.04% of the net assets at June 30, 2011.
For securities primarily traded on exchanges or markets that close before the close of regular trading on the New York Stock Exchange, the Fund may use an independent pricing service to fair value price the securities pursuant to Valuation Procedures approved by the Board of Trustees.
At June 30, 2011, the Fund’s Portfolio of Investments includes the following industry categories:
| | | | | | |
Financials | | | 20.1% | |
Industrials | | | 17.4% | |
Consumer Discretionary | | | 13.2% | |
Information Technology | | | 10.5% | |
Materials | | | 9.4% | |
Energy | | | 9.0% | |
Health Care | | | 7.4% | |
Consumer Staples | | | 6.9% | |
Utilities | | | 2.9% | |
Telecommunication Services | | | 2.4% | |
Exchange-Traded Funds | | | 0.8% | |
| | | | | | |
Total | | | 100.0% | |
| | | | | | |
At June 30, 2011, the Fund’s Portfolio of Investments includes the following currency categories:
| | | | | | |
British Pound Sterling | | | 22.4% | |
Euro | | | 21.4% | |
Japanese Yen | | | 17.3% | |
Hong Kong Dollar | | | 5.8% | |
Canadian Dollar | | | 5.5% | |
Swiss Franc | | | 3.5% | |
U.S. Dollar | | | 3.5% | |
South Korean Won | | | 2.5% | |
Brazilian Real | | | 2.5% | |
Swedish Krona | | | 2.4% | |
Singapore Dollar | | | 2.2% | |
Indonesian Rupiah | | | 2.2% | |
South African Rand | | | 1.8% | |
Indian Rupee | | | 1.5% | |
Danish Krone | | | 1.4% | |
All Other Currencies | | | 4.1% | |
| | | | | | |
Total | | | 100.0% | |
| | | | | | |
See accompanying Notes to Financial Statements.
10 Semi-Annual Report | June 30, 2011 |

David Merjan
INSTITUTIONAL INTERNATIONAL EQUITY FUND
The Institutional International Equity Fund seeks long-term capital appreciation.
AN OVERVIEW FROM THE PORTFOLIO MANAGER
The Institutional International Equity Fund posted a 3.62% increase for the six months ended June 30, 2011. By comparison, the Fund’s benchmark, the MSCI World Ex-U.S. (net) Index, increased 4.72%.
Year to date, the Fund trailed the MSCI World Ex-U.S. (net) Index, due primarily to the Fund’s emerging markets exposure, which detracted approximately 1% from relative results. The other primary detractor from performance during the six month period was Healthcare stock selection, as Sonova Holding AG underperformed on concerns about lower demand prospectively, while Terumo Corporation underperformed on production delays; as a result, we sold these stocks. Teva Pharmaceutical Industries, Ltd. also underperformed on concerns about slowing revenue growth and concerns about potential generic competition to its blockbuster drug, Copaxone. Somewhat offsetting these effects were strong stock selection in Japan and Canada, coupled with outperformance in European Industrials holdings.
Over the six month period the Fund’s emerging markets exposure was reduced from 19.3% to 15.8%, largely through a reduction in Latin America early in the year on interest rate and growth concerns. This decrease was invested in European and Canadian holdings. European exposure increased particularly in Financials, Information Technology and Materials, which more than offset a reduction in Consumer Discretionary and Industrials. From a sector perspective, Industrials remained the most overweighted throughout the six month period, approximating 22%, well ahead of the 12% Index weighting, due to a focus in capital equipment and machinery names, as well as holdings in low-cost airlines. Financials was underweighted during the entire period, although developed markets increased at the expense of emerging markets. The Fund was underweighted in the Materials sector for the entire six month period on lower mining exposure, despite exposure in chemicals and fertilizer.
June 30, 2011 | William Blair Funds 11 |
Institutional International Equity Fund
Performance Highlights (unaudited)
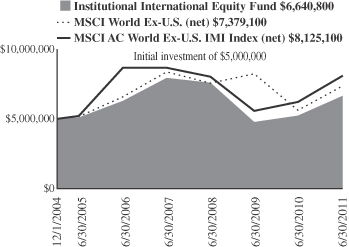
Average Annual Total Return at 6/30/2011
| | | | | | | | | | | | | | | | | | | | |
| | | Year to
Date | | | 1
Year | | | 3
Year | | | 5
Year | | | Since
Inception(a) | |
Institutional International Equity Fund | | | 3.62 | % | | | 26.87 | % | | | (4.52 | )% | | | 1.02 | % | | | 4.41 | % |
MSCI World Ex-U.S. (net) | | | 4.72 | | | | 30.33 | | | | (1.56 | ) | | | 2.02 | | | | 6.07 | |
MSCI All Country World Ex-U.S. IMI (net) | | | 3.52 | | | | 30.26 | | | | 0.31 | | | | 3.96 | | | | 7.63 | |
| | (a) | | For the period December 1, 2004 (Commencement of Operations) to June 30, 2011. |
Performance cited represents past performance. Past performance does not guarantee future results and current performance may be lower or higher than the data quoted. Results shown are average annual returns, which assume reinvestment of dividends and capital gains. Investment returns and principal will fluctuate and you may have a gain or loss when you sell shares. For the most current month-end performance information, please call 1-800-742-7272, or visit our Web site at www.williamblairfunds.com. From time to time, the investment advisor may waive fees or reimburse expenses for the Fund. Without these waivers, performance would be lower. International investing involves special risk considerations, including currency fluctuations, lower liquidity, economic and political risk.
The performance highlights and graph presented above do not reflect the deduction of taxes that a shareholder would pay on fund distributions or the redemption of fund shares.
The Morgan Stanley Capital International (MSCI) World Ex-U.S. (net) is a free float-adjusted market capitalization weighted index that is designed to measure the equity market performance of developed markets, excluding the United States. This series approximates the minimum possible dividend reinvestment.
The Morgan Stanley Capital International (MSCI) All Country World Ex-U.S. Investable Market Index (IMI) (net) is a free float-adjusted market capitalization weighted index that is designed to measure the equity market performance of developed and emerging markets, excluding the United States. This series approximates the minimum possible dividend reinvestment.
On May 1, 2011, the Fund’s benchmark changed from the MSCI All Country World Ex-U.S. IMI (net) to the MSCI World Ex-U.S. (net). The primary reason for this change is to compare the Fund to a benchmark that more closely reflects the market capitalization focus the Fund uses in its investment strategy.
This report identifies the Fund’s investments on June 30, 2011. These holdings are subject to change. Not all stocks in the Fund performed the same, nor is there any guarantee that these stocks will perform as well in the future. Market forecasts provided in this report may not necessarily come to pass.
Sector Diversification (unaudited)
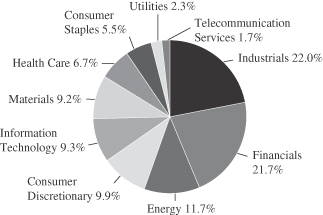
The sector diversification shown is based on the total long-term securities.
12 Semi-Annual Report | June 30, 2011 |
Institutional International Equity Fund
Portfolio of Investments, June 30, 2011 (all dollar amounts in thousands) (unaudited)
| | | | | | | | |
Issuer | | Shares | | | Value | |
| | |
Common Stocks | | | | | | | | |
| | |
Europe, Mid-East—32.4% | | | | | | | | |
Belgium—1.8% | | | | | | | | |
Anheuser-Busch InBev N.V. (Beverages) | | | 79,300 | | | $ | 4,600 | |
| | | | | | | | |
Denmark—1.6% | | | | | | | | |
Novo Nordisk A/S (Pharmaceuticals) | | | 33,507 | | | | 4,205 | |
| | | | | | | | |
Finland—0.5% | | | | | | | | |
Kone Oyj (Machinery) | | | 20,839 | | | | 1,309 | |
| | | | | | | | |
France—7.4% | | | | | | | | |
Air Liquide S.A. (Chemicals) | | | 7,103 | | | | 1,018 | |
AXA S.A. (Insurance) | | | 146,849 | | | | 3,337 | |
BNP Paribas (Commercial banks) | | | 72,463 | | | | 5,594 | |
Cie Generale des Etablissements Michelin (Auto components) | | | 28,016 | | | | 2,740 | |
L’Oreal S.A. (Personal products) | | | 30,451 | | | | 3,955 | |
Schneider Electric S.A. (Electrical equipment) | | | 16,560 | | | | 2,766 | |
| | | | | | | | |
| | | | | | | 19,410 | |
| | | | | | | | |
Germany—8.6% | | | | | | | | |
BASF SE (Chemicals) | | | 16,869 | | | | 1,653 | |
Bayer AG (Pharmaceuticals) | | | 60,411 | | | | 4,857 | |
Fresenius Medical Care AG & Co. KGaA (Health care providers & services) | | | 59,058 | | | | 4,415 | |
Infineon Technologies AG (Semiconductors & semiconductor equipment) | | | 187,572 | | | | 2,108 | |
MAN SE (Machinery) | | | 19,130 | | | | 2,551 | |
Muenchener Rueckversicherungs AG (Insurance) | | | 21,052 | | | | 3,219 | |
SAP AG (Software) | | | 60,266 | | | | 3,649 | |
| | | | | | | | |
| | | | | | | 22,452 | |
| | | | | | | | |
Ireland—1.3% | | | | | | | | |
Ryanair Holdings plc—ADR (Airlines) | | | 113,381 | | | | 3,327 | |
| | | | | | | | |
Israel—2.3% | | | | | | | | |
*Check Point Software Technologies, Ltd. (Software)† | | | 46,564 | | | | 2,647 | |
Teva Pharmaceutical Industries, Ltd.—ADR (Pharmaceuticals) | | | 71,263 | | | | 3,436 | |
| | | | | | | | |
| | | | | | | 6,083 | |
| | | | | | | | |
Italy—2.1% | | | | | | | | |
Saipem SpA (Energy equipment & services) | | | 106,448 | | | | 5,495 | |
| | | | | | | | |
Spain—1.1% | | | | | | | | |
Banco Santander S.A. (Commercial banks) | | | 237,994 | | | | 2,748 | |
| | | | | | | | |
Sweden—1.8% | | | | | | | | |
Atlas Copco AB (Machinery) | | | 102,036 | | | | 2,686 | |
*Hexagon AB (Machinery) | | | 76,350 | | | | 1,881 | |
| | | | | | | | |
| | | | | | | 4,567 | |
| | | | | | | | |
Switzerland—3.9% | | | | | | | | |
*ABB, Ltd. (Electrical equipment) | | | 128,497 | | | | 3,332 | |
*Julius Baer Group, Ltd. (Capital markets) | | | 56,053 | | | | 2,315 | |
*Syngenta AG (Chemicals) | | | 10,907 | | | | 3,682 | |
Xstrata plc (Metals & mining) | | | 40,227 | | | | 886 | |
| | | | | | | | |
| | | | | | | 10,215 | |
| | | | | | | | |
| | | | | | | | |
Issuer | | Shares | | | Value | |
| | |
Common Stocks—(continued) | | | | | | | | |
| | |
United Kingdom—21.6% | | | | | | | | |
Amlin plc (Insurance) | | | 202,749 | | | $ | 1,321 | |
*Autonomy Corporation plc (Software) | | | 97,603 | | | | 2,674 | |
Barclays plc (Commercial banks) | | | 472,123 | | | | 1,943 | |
BG Group plc (Oil, gas & consumable fuels) | | | 209,572 | | | | 4,756 | |
British Sky Broadcasting Group plc (Media) | | | 202,138 | | | | 2,746 | |
Burberry Group plc (Textiles, apparel & luxury goods) | | | 156,120 | | | | 3,633 | |
Centrica plc (Multi-utilities) | | | 625,775 | | | | 3,247 | |
Compass Group plc (Hotels, restaurants & leisure) | | | 266,641 | | | | 2,572 | |
Experian plc (Professional services) | | | 219,635 | | | | 2,797 | |
HSBC Holdings plc (Commercial banks) | | | 296,678 | | | | 2,938 | |
Johnson Matthey plc (Chemicals) | | | 81,401 | | | | 2,569 | |
Pearson plc (Media) | | | 141,381 | | | | 2,668 | |
Petrofac, Ltd. (Energy equipment & services) | | | 128,026 | | | | 3,111 | |
Prudential plc (Insurance) | | | 449,557 | | | | 5,195 | |
*Rolls-Royce Holdings plc (Aerospace & defense) | | | 383,299 | | | | 3,968 | |
Rotork plc (Machinery) | | | 43,135 | | | | 1,167 | |
Scottish & Southern Energy plc (Electric utilities) | | | 117,669 | | | | 2,631 | |
Standard Chartered plc (Commercial banks) | | | 129,096 | | | | 3,394 | |
Tullow Oil plc (Oil, gas & consumable fuels) | | | 154,387 | | | | 3,073 | |
| | | | | | | | |
| | | | | | | 56,403 | |
| | | | | | | | |
| | |
Canada—12.5% | | | | | | | | |
Agrium, Inc. (Chemicals)† | | | 27,650 | | | | 2,427 | |
Brookfield Asset Management, Inc. Class “A” (Real estate management & development)† | | | 117,287 | | | | 3,890 | |
Canadian National Railway Co. (Road & rail)† | | | 66,394 | | | | 5,305 | |
Goldcorp, Inc. (Metals & mining)† | | | 71,072 | | | | 3,431 | |
National Bank of Canada (Commercial banks) | | | 39,393 | | | | 3,195 | |
Potash Corporation of Saskatchewan, Inc. (Chemicals)† | | | 29,376 | | | | 1,674 | |
Saputo, Inc. (Food products) | | | 46,627 | | | | 2,248 | |
The Toronto-Dominion Bank (Commercial banks) | | | 61,965 | | | | 5,254 | |
Thomson Reuters Corporation (Media) | | | 53,025 | | | | 1,991 | |
Tim Hortons, Inc. (Hotels, restaurants & leisure) | | | 66,004 | | | | 3,223 | |
| | | | | | | | |
| | | | | | | 32,638 | |
| | | | | | | | |
| | |
Japan—12.4% | | | | | | | | |
Chiyoda Corporation (Construction & engineering) | | | 131,000 | | | | 1,502 | |
Fanuc, Ltd. (Machinery) | | | 22,600 | | | | 3,756 | |
Keyence Corporation (Electronic equipment, instruments & components) | | | 12,600 | | | | 3,559 | |
Komatsu, Ltd. (Machinery) | | | 122,400 | | | | 3,797 | |
Mitsubishi Corporation (Trading companies & distributors) | | | 151,100 | | | | 3,754 | |
Mitsubishi Electric Corporation (Electrical equipment) | | | 216,000 | | | | 2,495 | |
Mitsubishi UFJ Financial Group, Inc. (Commercial banks) | | | 817,500 | | | | 3,960 | |
See accompanying Notes to Financial Statements.
June 30, 2011 | William Blair Funds 13 |
Institutional International Equity Fund
Portfolio of Investments, June 30, 2011 (all dollar amounts in thousands) (unaudited)
| | | | | | | | |
Issuer | | Shares | | | Value | |
| |
Common Stocks—Japan—12.4%—(continued) | | | | | |
Nitori Co., Ltd. (Specialty retail) | | | 14,850 | | | $ | 1,408 | |
Nitto Denko Corporation (Chemicals) | | | 39,100 | | | | 1,974 | |
Softbank Corporation (Wireless telecommunication services) | | | 115,000 | | | | 4,328 | |
Sony Financial Holdings, Inc. (Insurance) | | | 103,100 | | | | 1,856 | |
| | | | | | | | |
| | | | | | | 32,389 | |
| | | | | | | | |
| | |
Emerging Asia—10.1% | | | | | | | | |
China—3.0% | | | | | | | | |
China Overseas Land & Investment, Ltd. (Real estate management & development) | | | 954,000 | | | | 2,045 | |
China Shenhua Energy Co., Ltd. (Oil, gas & consumable fuels) | | | 517,500 | | | | 2,467 | |
CNOOC, Ltd. (Oil, gas & consumable fuels) | | | 1,370,000 | | | | 3,197 | |
| | | | | | | | |
| | | | | | | 7,709 | |
| | | | | | | | |
India—1.4% | | | | | | | | |
Infosys Technologies, Ltd. (IT services) | | | 54,449 | | | | 3,545 | |
| | | | | | | | |
Indonesia—0.8% | | | | | | | | |
PT Bank Rakyat Indonesia (Commercial banks) | | | 2,949,500 | | | | 2,236 | |
| | | | | | | | |
South Korea—4.0% | | | | | | | | |
Hyundai Motor Co. (Automobiles) | | | 17,624 | | | | 3,912 | |
Samsung Electronics Co., Ltd. (Semiconductors & semiconductor equipment) | | | 4,072 | | | | 3,150 | |
Samsung Engineering Co., Ltd. (Construction & engineering) | | | 13,653 | | | | 3,261 | |
| | | | | | | | |
| | | | | | | 10,323 | |
| | | | | | | | |
Taiwan—0.9% | | | | | | | | |
HTC Corporation (Communications equipment) | | | 66,000 | | | | 2,220 | |
| | | | | | | | |
| | |
Emerging Latin America—3.6% | | | | | | | | |
Brazil—1.9% | | | | | | | | |
BM&F BOVESPA S.A. (Diversified financial services) | | | 70,171 | | | | 465 | |
Embraer S.A.—ADR (Aerospace & defense) | | | 63,391 | | | | 1,951 | |
Petroleo Brasileiro S.A.—ADR (Oil, gas & consumable fuels) | | | 60,935 | | | | 2,063 | |
Weg S.A. (Machinery) | | | 48,600 | | | | 554 | |
| | | | | | | | |
| | | | | | | 5,033 | |
| | | | | | | | |
Mexico—1.1% | | | | | | | | |
Wal-Mart de Mexico S.A.B. de C.V. (Food & staples retailing) | | | 1,000,900 | | | | 2,970 | |
| | | | | | | | |
Panama—0.6% | | | | | | | | |
Copa Holdings S.A. Class “A” (Airlines)† | | | 22,949 | | | | 1,532 | |
| | | | | | | | |
| | |
Asia—2.3% | | | | | | | | |
Australia—1.5% | | | | | | | | |
BHP Billiton, Ltd.—ADR (Metals & mining) | | | 41,893 | | | | 3,965 | |
| | | | | | | | |
Hong Kong—0.8% | | | | | | | | |
Noble Group, Ltd. (Trading companies & distributors) | | | 1,219,090 | | | | 1,955 | |
| | | | | | | | |
| | | | | | | | |
Issuer | | Shares or
Principal
Amount | | | Value | |
| | |
Common Stocks—(continued) | | | | | | | | |
| |
Emerging Europe, Mid-East, Africa—0.9% | | | | | |
South Africa—0.9% | | | | | | | | |
Sasol, Ltd. (Oil, gas & consumable fuels) | | | 43,220 | | | $ | 2,275 | |
| | | | | | | | |
Total Common Stocks—95.8%
(cost $197,901) | | | | 249,604 | |
| | | | | | | | |
| | |
Preferred Stock | | | | | | | | |
Brazil—1.1% | | | | | | | | |
Petroleo Brasileiro S.A. (Oil, gas & consumable fuels) | | | 196,508 | | | | 2,987 | |
| | | | | | | | |
Total Preferred Stock—1.1%
(cost $2,421) | | | | | | | 2,987 | |
| | | | | | | | |
| | |
Repurchase Agreement | | | | | | | | |
Fixed Income Clearing Corporation, 0.010% dated 6/30/11, due 7/1/11, repurchase price $10,625, collateralized by FHLMC, 2.000%, due 12/3/15 | | $ | 10,625 | | | | 10,625 | |
| | | | | | | | |
Total Repurchase Agreement—4.1%
(cost $10,625) | | | | 10,625 | |
| | | | | | | | |
Total Investments—101.0%
(cost $210,947) | | | | 263,216 | |
Liabilities, plus cash and other assets—(1.0)% | | | | (2,691 | ) |
| | | | | | | | |
Net assets—100.0% | | | $ | 260,525 | |
| | | | | | | | |
ADR = American Depository Receipt
* Non-income producing securities
† = U.S. listed foreign security
For securities primarily traded on exchanges or markets that close before the close of regular trading on the New York Stock Exchange, the Fund may use an independent pricing service to fair value price the securities pursuant to Valuation Procedures approved by the Board of Trustees.
See accompanying Notes to Financial Statements.
14 Semi-Annual Report | June 30, 2011 |
Institutional International Equity Fund
Portfolio of Investments, June 30, 2011 (all dollar amounts in thousands) (unaudited)
At June 30, 2011, the Fund’s Portfolio of Investments includes the following industry categories:
| | | | |
Industrials | | | 22.0% | |
Financials | | | 21.7% | |
Energy | | | 11.7% | |
Consumer Discretionary | | | 9.9% | |
Information Technology | | | 9.3% | |
Materials | | | 9.2% | |
Health Care | | | 6.7% | |
Consumer Staples | | | 5.5% | |
Utilities | | | 2.3% | |
Telecommunication Services | | | 1.7% | |
| | | | |
Total | | | 100.0% | |
| | | | |
At June 30, 2011, the Fund’s Portfolio of Investments includes the following currency categories:
| | | | |
Euro | | | 22.2% | |
British Pound Sterling | | | 21.5% | |
U.S. Dollar | | | 14.1% | |
Japanese Yen | | | 12.8% | |
Canadian Dollar | | | 6.3% | |
Hong Kong Dollar | | | 4.2% | |
South Korean Won | | | 4.1% | |
Swiss Franc | | | 3.7% | |
Swedish Krona | | | 1.8% | |
Danish Krone | | | 1.7% | |
Brazilian Real | | | 1.6% | |
Indian Rupee | | | 1.4% | |
Mexican Peso | | | 1.2% | |
All Other Currencies | | | 3.4% | |
| | | | |
Total | | | 100.0% | |
| | | | |
See accompanying Notes to Financial Statements.
June 30, 2011 | William Blair Funds 15 |

Jeffrey A. Urbina
INTERNATIONAL SMALL CAP GROWTH FUND
The International Small Cap Growth Fund seeks long-term capital appreciation.
AN OVERVIEW FROM THE PORTFOLIO MANAGER
The International Small Cap Growth Fund increased 5.82% (Institutional Share Class) for the six months ended June 30, 2011. By comparison, the Fund’s benchmark, the MSCI All Country World Ex-U.S. Small Cap Index (net), gained 1.51%.
Year to date performance was augmented by strong Discretionary, Industrials, Information Technology (IT) and Materials performance. Japanese Discretionary holdings performed particularly well, with social media and retailers rallying strongly. Auto-related and luxury holdings also performed well on strong operational results and IPO activity within the luxury arena. Industrials stock selection was bolstered by strong testing, defense and transportation performance. IT stock selection was strong across regions, with particular value added in Japan, as the Fund’s IT stocks were up over 50%, compared to the -2.46% Index returns. UK and Emerging Asian stock selection was strong within Materials during the first half of the year. Somewhat detracting from year to date results was Pacific Ex-Japan performance, coupled with underperformance by the Fund’s European Financials holdings.
The Fund maintained its significant focus on Discretionary holdings during the six month period, averaging 25% invested across auto-related companies, luxury and specialty retailers, and approximately 40% of the sector weighting invested directly in emerging markets. IT was also significantly overweighted at approximately 17% on average during the period, due to a focus on suppliers to smartphone and tablet manufacturers, social networking and business services companies. Healthcare was another area of focus versus the market, while Financials and Materials were significantly underweighted throughout the period: Financials due to the lower Japan and European banking exposure and Materials due to a lack of mining opportunities. Portfolio positioning did not change substantially at a regional level, with emerging markets averaging 26% over the period, above the market weighting. The UK at 20% was significantly overweighted due largely to UK Industrials holdings, while Pacific ex-Japan had minimal exposure throughout the period.
16 Semi-Annual Report | June 30, 2011 |
International Small Cap Growth Fund
Performance Highlights (unaudited)
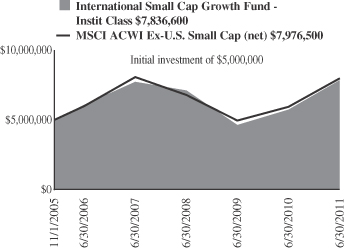
Average Annual Total Return at 6/30/2011
| | | | | | | | | | | | | | | | | | | | |
| | | Year To
Date | | | 1
Year | | | 3
Year | | | 5
Year | | | Since
Inception(a) | |
Institutional Class | | | 5.82% | | | | 36.61% | | | | 3.29 | % | | | 5.24 | % | | | 8.26 | % |
MSCI All Country World Ex-U.S. Small Cap Index (net) | | | 1.51 | | | | 34.24 | | | | 5.56 | | | | 5.92 | | | | 8.57 | |
| | (a) | | For the period November 1, 2005 (Commencement of Operations) to June 30, 2011. |
Performance cited represents past performance. Past performance does not guarantee future results and current performance may be lower or higher than the data quoted. Results shown are average annual returns, which assume reinvestment of dividends and capital gains. Investment returns and principal will fluctuate and you may have a gain or loss when you sell shares. For the most current month-end performance information, please call 1-800-742-7272, or visit our Web site at www.williamblairfunds.com. From time to time, the investment advisor may waive fees or reimburse expenses for the Fund. Without these waivers, performance would be lower. International investing involves special risk considerations, including currency fluctuations, lower liquidity, economic and political risk.
The performance highlights and graph presented above do not reflect the deduction of taxes that a shareholder would pay on fund distributions or the redemption of fund shares.
The Morgan Stanley Capital International (MSCI) All Country World Ex-U.S. Small Cap Index (net) is a free float-adjusted market capitalization weighted index that is designed to measure the equity market performance of small capitalization developed and emerging markets, excluding the United States. This series approximates the minimum possible dividend reinvestment.
This report identifies the Fund’s investments on June 30, 2011. These holdings are subject to change. Not all stocks in the Fund performed the same, nor is there any guarantee that these stocks will perform as well in the future. Market forecasts provided in this report may not necessarily come to pass.
Sector Diversification (unaudited)
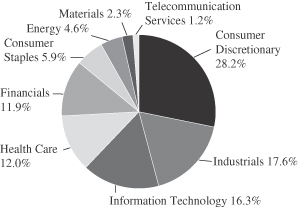
The sector diversification shown is based on the total long-term securities.
June 30, 2011 | William Blair Funds 17 |
International Small Cap Growth Fund
Portfolio of Investments, June 30, 2011 (all dollar amounts in thousands) (unaudited)
| | | | | | | | |
Issuer | | Shares | | | Value | |
| | |
Common Stocks | | | | | | | | |
| | |
Europe—25.1% | | | | | | | | |
Finland—1.3% | | | | | | | | |
Nokian Renkaat Oyj (Auto components) | | | 202,154 | | | $ | 10,143 | |
| | | | | | | | |
Germany—6.3% | | | | | | | | |
Aixtron AG (Semiconductors & semiconductor equipment) | | | 395,468 | | | | 13,494 | |
Gerry Weber International AG (Textiles, apparel & luxury goods) | | | 75,381 | | | | 4,949 | |
MTU Aero Engines Holding AG (Aerospace & defense) | | | 190,585 | | | | 15,223 | |
Wincor Nixdorf AG (Computers & peripherals) | | | 144,441 | | | | 10,438 | |
Wirecard AG (IT services) | | | 262,235 | | | | 4,687 | |
| | | | | | | | |
| | | | | | | 48,791 | |
| | | | | | | | |
Ireland—1.9% | | | | | | | | |
Paddy Power plc (Hotels, restaurants & leisure) | | | 269,904 | | | | 14,674 | |
| | | | | | | | |
Italy—3.6% | | | | | | | | |
De’Longhi SpA (Household durables) | | | 288,832 | | | | 3,365 | |
DiaSorin SpA (Health care equipment & supplies) | | | 145,433 | | | | 6,981 | |
*Salvatore Ferragamo Italia SpA | | | 380,979 | | | | 5,691 | |
Tod’s SpA (Textiles, apparel & luxury goods) | | | 85,472 | | | | 11,434 | |
| | | | | | | | |
| | | | | | | 27,471 | |
| | | | | | | | |
Luxembourg—0.9% | | | | | | | | |
*L’Occitane International S.A.
(Specialty retail) | | | 2,733,000 | | | | 7,305 | |
| | | | | | | | |
Netherlands—1.1% | | | | | | | | |
BinckBank N.V. (Capital markets) | | | 142,650 | | | | 1,956 | |
Gemalto N.V. (Computers & peripherals) | | | 139,461 | | | | 6,669 | |
| | | | | | | | |
| | | | | | | 8,625 | |
| | | | | | | | |
Norway—0.2% | | | | | | | | |
Opera Software ASA (Internet software & services) | | | 187,687 | | | | 1,179 | |
| | | | | | | | |
Poland—0.5% | | | | | | | | |
*Lubelski Wegiel Bogdanka S.A. (Oil, gas & consumable fuels) | | | 84,808 | | | | 3,553 | |
| | | | | | | | |
Spain—2.7% | | | | | | | | |
Prosegur Cia de Seguridad S.A. (Commercial services & supplies) | | | 120,842 | | | | 6,426 | |
*Viscofan S.A. (Food products) | | | 362,597 | | | | 14,434 | |
| | | | | | | | |
| | | | | | | 20,860 | |
| | | | | | | | |
Sweden—3.6% | | | | | | | | |
Elekta AB (Health care equipment & supplies) | | | 197,373 | | | | 9,349 | |
JM AB (Household durables) | | | 409,940 | | | | 9,673 | |
Mekonomen AB (Specialty retail) | | | 78,944 | | | | 2,733 | |
NIBE Industrier AB (Building products) | | | 322,100 | | | | 5,576 | |
| | | | | | | | |
| | | | | | | 27,331 | |
| | | | | | | | |
Switzerland—3.0% | | | | | | | | |
*Meyer Burger Technology AG (Machinery) | | | 168,546 | | | | 7,447 | |
*Orascom Development Holding AG (Hotels, restaurants & leisure) | | | 11,402 | | | | 376 | |
Partners Group Holding AG (Capital markets) | | | 85,024 | | | | 15,048 | |
| | | | | | | | |
| | | | | | | 22,871 | |
| | | | | | | | |
| | | | | | | | |
Issuer | | Shares | | | Value | |
|
Common Stocks—(continued) | |
| | |
United Kingdom—19.8% | | | | | | | | |
Abcam plc (Biotechnology) | | | 1,010,249 | | | $ | 6,757 | |
Aveva Group plc (Software) | | | 274,468 | | | | 7,546 | |
Babcock International Group plc (Commercial services & supplies) | | | 1,505,734 | | | | 17,206 | |
*Blinkx plc (Internet software & services) | | | 1,381,166 | | | | 2,660 | |
*Carphone Warehouse Group plc (Specialty retail) | | | 874,590 | | | | 5,938 | |
Dunelm Group plc (Specialty retail) | | | 474,514 | | | | 2,963 | |
*EnQuest plc (Oil, gas & consumable fuels) | | | 1,883,379 | | | | 3,718 | |
Fenner plc (Machinery) | | | 785,623 | | | | 5,062 | |
Fidessa Group plc (Software) | | | 103,193 | | | | 3,208 | |
Halma plc (Electronic equipment, instruments & components) | | | 561,801 | | | | 3,736 | |
Hargreaves Lansdown plc (Capital markets) | | | 489,823 | | | | 4,776 | |
Hikma Pharmaceuticals plc (Pharmaceuticals) | | | 303,744 | | | | 3,705 | |
IG Group Holdings plc (Diversified financial services) | | | 427,893 | | | | 2,997 | |
*Imagination Technologies Group plc (Computers & peripherals) | | | 543,044 | | | | 3,287 | |
Intertek Group plc (Professional services) | | | 131,284 | | | | 4,157 | |
Lancashire Holdings, Ltd. (Insurance) | | | 1,147,411 | | | | 12,016 | |
Meggitt plc (Aerospace & defense) | | | 1,091,027 | | | | 6,680 | |
Michael Page International plc (Professional services) | | | 440,010 | | | | 3,778 | |
Moneysupermarket.com Group plc (Internet software & services) | | | 2,199,545 | | | | 3,590 | |
*Ocado Group plc (Internet & catalog retail) | | | 382,267 | | | | 1,118 | |
Restaurant Group plc (Hotels, restaurants & leisure) | | | 716,015 | | | | 3,379 | |
*Salamander Energy plc (Oil, gas & consumable fuels) | | | 172,514 | | | | 777 | |
Serco Group plc (Commercial services & supplies) | | | 797,509 | | | | 7,072 | |
Spirax-Sarco Engineering plc (Machinery) | | | 294,154 | | | | 9,447 | |
*Sports Direct International plc (Specialty retail) | | | 1,052,913 | | | | 3,993 | |
St James’s Place plc (Insurance) | | | 996,070 | | | | 5,435 | |
*Telecity Group plc (Internet software & services) | | | 434,970 | | | | 3,868 | |
Ultra Electronics Holdings plc (Aerospace & defense) | | | 281,141 | | | | 7,743 | |
Victrex plc (Chemicals) | | | 238,318 | | | | 5,737 | |
| | | | | | | | |
| | | | | | | 152,349 | |
| | | | | | | | |
| | |
Emerging Asia—17.5% | | | | | | | | |
China—8.8% | | | | | | | | |
AAC Technologies Holdings, Inc. (Communications equipment) | | | 3,409,559 | | | | 7,939 | |
Ajisen China Holdings, Ltd. (Hotels, restaurants & leisure) | | | 4,434,429 | | | | 9,186 | |
China Shanshui Cement Group, Ltd. (Construction materials) | | | 4,109,000 | | | | 4,747 | |
Comba Telecom Systems Holdings, Ltd. (Communications equipment) | | | 2,717,526 | | | | 2,864 | |
Great Wall Motor Co., Ltd. (Automobiles) | | | 4,394,250 | | | | 7,228 | |
Haitian International Holdings, Ltd. (Machinery) | | | 6,451,496 | | | | 8,357 | |
Hengdeli Holdings, Ltd. (Specialty retail) | | | 13,632,000 | | | | 7,200 | |
See accompanying Notes to Financial Statements.
18 Semi-Annual Report | June 30, 2011 |
International Small Cap Growth Fund
Portfolio of Investments, June 30, 2011 (all dollar amounts in thousands) (unaudited)
| | | | | | | | |
Issuer | | Shares | | | Value | |
|
Common Stocks—Emerging Asia—17.5%—(continued) | |
China—(continued) | | | | | | | | |
*Hollysys Automation Technologies, Ltd. (Electronic equipment, instruments & components)† | | | 217,113 | | | $ | 2,024 | |
Lonking Holdings, Ltd. (Machinery) | | | 15,078,000 | | | | 8,235 | |
Minth Group, Ltd. (Auto components) | | | 3,241,384 | | | | 5,240 | |
*Noah Holdings, Ltd.—ADR (Capital markets) | | | 106,979 | | | | 1,202 | |
*Simcere Pharmaceutical Group—ADR (Pharmaceuticals) | | | 82,832 | | | | 809 | |
*WuXi PharmaTech Cayman, Inc.—ADR (Life sciences tools & services) | | | 153,713 | | | | 2,699 | |
| | | | | | | | |
| | | | | | | 67,730 | |
| | | | | | | | |
India—2.6% | | | | | | | | |
eClerx Services, Ltd. (Professional services) | | | 257,570 | | | | 4,864 | |
Ipca Laboratories, Ltd. (Pharmaceuticals) | | | 565,748 | | | | 4,357 | |
*Jubilant Foodworks, Ltd. (Hotels, restaurants & leisure) | | | 253,570 | | | | 5,406 | |
Motherson Sumi Systems, Ltd. (Auto components) | | | 752,786 | | | | 3,797 | |
Oberoi Realty, Ltd. (Real estate management & development) | | | 294,587 | | | | 1,583 | |
| | | | | | | | |
| | | | | | | 20,007 | |
| | | | | | | | |
Indonesia—2.7% | | | | | | | | |
PT Harum Energy Tbk (Oil, gas & consumable fuels) | | | 6,983,000 | | | | 7,777 | |
PT Indofood CBP Sukses Makmur Tbk (Food products) | | | 4,792,000 | | | | 3,017 | |
PT Kalbe Farma Tbk (Pharmaceuticals) | | | 15,742,500 | | | | 6,196 | |
PT Perusahaan Perkebunan London Sumatra Indonesia Tbk (Food products) | | | 14,399,500 | | | | 3,904 | |
| | | | | | | | |
| | | | | | | 20,894 | |
| | | | | | | | |
South Korea—0.5% | | | | | | | | |
Daum Communications Corporation (Internet software & services) | | | 39,833 | | | | 4,141 | |
| | | | | | | | |
Taiwan—2.5% | | | | | | | | |
Powertech Technology, Inc. (Semiconductors & semiconductor equipment) | | | 1,690,000 | | | | 5,672 | |
Simplo Technology Co., Ltd. (Computers & peripherals) | | | 375,000 | | | | 3,022 | |
Tripod Technology Corporation (Electronic equipment, instruments & components) | | | 313,000 | | | | 1,297 | |
TSRC Corporation (Chemicals) | | | 2,224,000 | | | | 6,542 | |
TXC Corporation (Electronic equipment, instruments & components) | | | 1,362,269 | | | | 2,381 | |
| | | | | | | | |
| | | | | | | 18,914 | |
| | | | | | | | |
Thailand—0.4% | | | | | | | | |
Bangkok Dusit Medical Services PCL (Health care providers & services) | | | 1,588,700 | | | | 2,728 | |
| | | | | | | | |
| | |
Japan—15.7% | | | | | | | | |
Ain Pharmaciez, Inc. (Food & staples retailing) | | | 119,900 | | | | 4,915 | |
| | | | | | | | |
Issuer | | Shares | | | Value | |
| |
Common Stocks—Japan—15.7%—(continued) | | | | | |
Asics Corporation (Textiles, apparel & luxury goods) | | | 384,000 | | | | 5,709 | |
CyberAgent, Inc. (Media) | | | 2,802 | | | | 9,777 | |
Dr Ci:Labo Co., Ltd. (Personal products) | | | 1,011 | | | | 5,161 | |
Exedy Corporation (Auto components) | | | 496,800 | | | | 16,970 | |
F.C.C. Co., Ltd. (Auto components) | | | 346,509 | | | | 8,290 | |
Gree, Inc. (Internet software & services) | | | 723,430 | | | | 15,735 | |
K’s Holdings Corporation (Specialty retail) | | | 206,500 | | | | 8,914 | |
Kakaku.com, Inc. (Internet software & services) | | | 780 | | | | 5,474 | |
Miraca Holdings, Inc. (Health care providers & services) | | | 398,600 | | | | 16,116 | |
Nabtesco Corporation (Machinery) | | | 173,000 | | | | 4,165 | |
Nitori Co., Ltd. (Specialty retail) | | | 59,950 | | | | 5,682 | |
Osaka Securities Exchange Co., Ltd. (Diversified financial services) | | | 585 | | | | 2,605 | |
Sawai Pharmaceutical Co., Ltd. (Pharmaceuticals) | | | 83,800 | | | | 8,817 | |
United Arrows, Ltd. (Specialty retail) | | | 101,100 | | | | 2,135 | |
| | | | | | | | |
| | | | | | | 120,465 | |
| | | | | | | | |
|
Emerging Europe, Mid-East, Africa—5.0% | |
Russia—0.3% | | | | | | | | |
*Etalon Group Ltd.—144A—GDR (Real estate management & development)† | | | 366,337 | | | | 2,524 | |
| | | | | | | | |
South Africa—3.2% | | | | | | | | |
Capitec Bank Holdings, Ltd. (Commercial banks) | | | 135,119 | | | | 3,617 | |
Clicks Group, Ltd. (Multiline retail) | | | 1,606,486 | | | | 10,038 | |
Coronation Fund Managers, Ltd. (Capital markets) | | | 941,647 | | | | 2,688 | |
Mr Price Group, Ltd. (Specialty retail) | | | 791,515 | | | | 7,983 | |
| | | | | | | | |
| | | | | | | 24,326 | |
| | | | | | | | |
Turkey—1.1% | | | | | | | | |
Tofas Turk Otomobil Fabrikasi A.S. (Automobiles) | | | 992,081 | | | | 4,523 | |
Turkiye Sinai Kalkinma Bankasi A.S. (Commercial banks) | | | 2,300,672 | | | | 3,686 | |
| | | | | | | | |
| | | | | | | 8,209 | |
| | | | | | | | |
United Arab Emirates—0.4% | | | | | | | | |
Aramex Co. (Air freight & logistics) | | | 7,033,580 | | | | 3,370 | |
| | | | | | | | |
|
Canada—4.9% | |
Canadian Western Bank (Commercial banks) | | | 381,300 | | | | 12,177 | |
Dollarama, Inc. (Multiline retail) | | | 61,408 | | | | 2,080 | |
Home Capital Group, Inc. (Thrifts & mortgage finance) | | | 94,036 | | | | 5,046 | |
*Legacy Oil + Gas, Inc. (Oil, gas & consumable fuels) | | | 360,301 | | | | 4,375 | |
Petrominerales, Ltd. (Oil, gas & consumable fuels) | | | 240,600 | | | | 7,062 | |
Peyto Exploration & Development Corporation (Oil, gas & consumable fuels) | | | 293,282 | | | | 6,538 | |
| | | | | | | | |
| | | | | | | 37,278 | |
| | | | | | | | |
See accompanying Notes to Financial Statements.
June 30, 2011 | William Blair Funds 19 |
International Small Cap Growth Fund
Portfolio of Investments, June 30, 2011 (all dollar amounts in thousands) (unaudited)
| | | | | | | | |
Issuer | | Shares or
Principal
Amount | | | Value | |
|
Common Stocks—(continued) | |
Emerging Latin America—4.6% | | | | | | | | |
Brazil—3.1% | | | | | | | | |
*Arezzo Industria e Comercio S.A. (Textiles, apparel & luxury goods) | | | 246,596 | | | $ | 3,453 | |
*CETIP S.A.—Balcao Organizado de Ativos e Derivativos (Capital markets) | | | 2,455 | | | | 37 | |
CETIP S.A.—Balcao Organizado de Ativos e Derivativos (Capital markets) | | | 333,400 | | | | 5,159 | |
Drogasil S.A. (Food & staples retailing) | | | 423,500 | | | | 2,890 | |
OdontoPrev S.A. (Health care providers & services) | | | 362,500 | | | | 6,039 | |
Restoque Comercio e Confeccoes de Roupas S.A. (Textiles, apparel & luxury goods) | | | 201,200 | | | | 2,578 | |
*T4F Entretenimento S.A. (Media) | | | 146,500 | | | | 1,319 | |
Tegma Gestao Logistica S.A. (Road & rail) | | | 147,300 | | | | 2,383 | |
| | | | | | | | |
| | | | | | | 23,858 | |
| | | | | | | | |
Chile—0.5% | | | | | | | | |
*CFR Pharmaceuticals S.A. (Pharmaceuticals) | | | 14,325,161 | | | | 3,893 | |
| | | | | | | | |
Mexico—1.0% | | | | | | | | |
Compartamos S.A.B. de C.V. (Consumer finance) | | | 665,828 | | | | 1,208 | |
*Genomma Lab Internacional S.A.B. de C.V. (Pharmaceuticals) | | | 1,830,020 | | | | 4,658 | |
Grupo Comercial Chedraui S.A. de C.V. (Food & staples retailing) | | | 626,187 | | | | 1,965 | |
| | | | | | | | |
| | | | | | | 7,831 | |
| | | | | | | | |
| | |
Asia—3.2% | | | | | | | | |
Australia—1.4% | | | | | | | | |
Cochlear, Ltd. (Health care equipment & supplies) | | | 68,660 | | | | 5,302 | |
Iress Market Technology, Ltd. (IT services) | | | 547,781 | | | | 5,294 | |
| | | | | | | | |
| | | | | | | 10,596 | |
| | | | | | | | |
Hong Kong—1.6% | | | | | | | | |
SmarTone Telecommunications Holdings, Ltd. (Wireless telecommunication services) | | | 6,073,000 | | | | 9,037 | |
Value Partners Group, Ltd. (Capital markets) | | | 3,943,000 | | | | 3,375 | |
| | | | | | | | |
| | | | | | | 12,412 | |
| | | | | | | | |
Singapore—0.2% | | | | | | | | |
Goodpack, Ltd. (Air freight & logistics) | | | 1,228,000 | | | | 1,829 | |
| | | | | | | | |
Total Common Stocks—95.8%
(cost $619,162) | | | | 736,157 | |
| | | | | | | | |
| | |
Convertible Bond | | | | | | | | |
Brazil—0.1% | | | | | | | | |
Lupatech S.A., 6.500%, due 4/15/18 (Machinery)**§ | | $ | 959 | | | | 632 | |
| | | | | | | | |
Total Convertible Bond—0.1%
(cost $497) | | | | 632 | |
| | | | | | | | |
| | | | | | | | |
Issuer | | Shares or
Principal
Amount | | | Value | |
|
Common Stocks—(continued) | |
| | |
Repurchase Agreement | | | | | | | | |
Fixed Income Clearing Corporation, 0.010% dated 6/30/11, due 7/1/11, repurchase price $21,114, collateralized by FHLMC, 2.000%, due 12/3/15 | | $ | 21,114 | | | $ | 21,114 | |
| | | | | | | | |
Total Repurchase Agreement—2.7%
(cost $21,114) | | | | 21,114 | |
| | | | | | | | |
Total Investments—98.6%
(cost $640,773) | | | | 757,903 | |
Cash and other assets, less liabilities—1.4% | | | | 10,696 | |
| | | | | | | | |
Net assets—100.0% | | | $ | 768,599 | |
| | | | | | | | |
ADR = American Depository Receipt
* Non-income producing securities
† = U.S. listed foreign security
** = Fair valued pursuant to Valuation Procedures adopted by the Board of Trustees. This holding represents 0.08% of the Fund’s net assets at June 30, 2011.
§ = Deemed illiquid pursuant to Liquidity Procedures approved by the Board of Trustees. This holding represents 0.08% of the net assets at June 30, 2011.
For securities primarily traded on exchanges or markets that close before the close of regular trading on the New York Stock Exchange, the Fund may use an independent pricing service to fair value price the securities pursuant to Valuation Procedures approved by the Board of Trustees.
At June 30, 2011, the Fund’s Portfolio of Investments includes the following industry categories:
| | | | | | |
Consumer Discretionary | | | 28.2% | |
Industrials | | | 17.6% | |
Information Technology | | | 16.3% | |
Health Care | | | 12.0% | |
Financials | | | 11.9% | |
Consumer Staples | | | 5.9% | |
Energy | | | 4.6% | |
Materials | | | 2.3% | |
Telecommunication Services | | | 1.2% | |
| | | | |
Total | | | 100.0% | |
| | | | |
At June 30, 2011, the Fund’s Portfolio of Investments includes the following currency categories:
| | | | | | |
British Pound Sterling | | | 20.7% | |
Euro | | | 17.7% | |
Japanese Yen | | | 16.3% | |
Hong Kong Dollar | | | 11.0% | |
Canadian Dollar | | | 5.1% | |
Swedish Krona | | | 3.7% | |
Brazilian Real | | | 3.3% | |
South African Rand | | | 3.3% | |
Swiss Franc | | | 3.1% | |
Indonesian Rupiah | | | 2.8% | |
Indian Rupee | | | 2.7% | |
New Taiwan Dollar | | | 2.6% | |
Australian Dollar | | | 1.4% | |
U.S. Dollar | | | 1.3% | |
Turkish Lira | | | 1.1% | |
Mexican Peso | | | 1.1% | |
All Other Currencies | | | 2.8% | |
| | | | |
Total | | | 100.0% | |
| | | | |
See accompanying Notes to Financial Statements.
20 Semi-Annual Report | June 30, 2011 |

Todd M. McClone
Jeffrey A. Urbina
EMERGING MARKETS GROWTH FUND
The Emerging Markets Growth Fund seeks long-term capital appreciation.
AN OVERVIEW FROM THE PORTFOLIO MANAGERS
The Emerging Markets Growth Fund posted a 0.44% decrease (Institutional Share Class) for the six months ended June 30, 2011. By comparison, the Fund’s benchmark, the MSCI Emerging Markets IMI Index (net), declined 0.32%.
Despite strong second quarter results, the Fund slightly trailed the Index year to date, due to underperformance in January and February. In particular, the Fund’s lack of Russian energy holdings detracted approximately 0.50% from relative results year to date, while a focus on higher growth exploration companies also detracted from results, as lower growth integrated oils outperformed. Moreover, Pacific Rubiales, the Colombian oil and gas company, lagged on production delays. In addition, the Fund’s investment in Commercial International Bank in Egypt detracted from results as the government was overthrown, along with Turkish Banks, which underperformed the broader market on monetary policy tightening. Somewhat offsetting these effects was the Fund’s weighting and stock selection in Consumer Discretionary, on auto-related and retail strength, coupled with strong Emerging Asian Financials performance on positive commercial bank, real estate and insurance stock selection. Information Technology (IT) and Materials also outperformed on strong performance by Baidu, the Chinese web search company on good results and a positive outlook, coupled with a focus on chemicals.
Over the six month period, the Fund maintained its significant exposure to Consumer stocks, well ahead of the Index weighting due largely to auto-related exposure and a higher Staples weightings. Conversely, the Energy and Materials sectors were significantly underweighted as the Fund had lower exposure in mining shares as well as Energy exploration and production companies. Financials were also underweighted during the period, given the increasing interest rate environment amidst inflationary concerns, and the impact on net interest margins and profitability. IT increased during the period from approximately 11% to 16% as corporate fundamentals improved given increased smartphone and tablet demand and a positive product cycle. Regionally, the Fund had a higher exposure than the Index in Latin America holdings, due largely to Brazil, at the expense of Emerging Europe, Middle East, and Africa, where there was no exposure in Resources and limited Russian and Eastern European holdings. Emerging Asia, while underweighted during the entire period, increased as the Fund invested in additional Korean companies on improving outlooks, Taiwanese tech on improving demand, and incrementally in China as its central bank moved further along in the tightening cycle.
June 30, 2011 | William Blair Funds 21 |
Emerging Markets Growth Fund
Performance Highlights (unaudited)
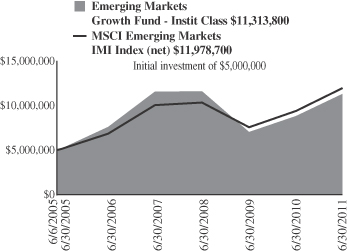
Average Annual Total Return at 6/30/2011
| | | | | | | | | | | | | | | | | | | | |
| | | Year To
Date | | | 1
Year | | | 3
Year | | | 5
Year | | | Since
Inception(a) | |
Institutional
Class | | | (0.44 | )% | | | 28.60 | % | | | (0.76 | )% | | | 8.34 | % | | | 14.40 | % |
MSCI Emerging
Markets IMI (net) | | | 0.32 | | | | 27.53 | | | | 5.13 | | | | 11.90 | | | | 15.43 | |
| | (a) | | For the period June 6, 2005 (Commencement of Operations) to June 30, 2011. |
Performance cited represents past performance. Past performance does not guarantee future results and current performance may be lower or higher than the data quoted. Results shown are average annual returns, which assume reinvestment of dividends and capital gains. Investment returns and principal will fluctuate and you may have a gain or loss when you sell shares. For the most current month-end performance information, please call 1-800-742-7272, or visit our Web site at www.williamblairfunds.com. From time to time, the investment advisor may waive fees or reimburse expenses for the Fund. Without these waivers, performance would be lower. International investing involves special risk considerations, including currency fluctuations, lower liquidity, economic and political risk.
The performance highlights and graph presented above do not reflect the deduction of taxes that a shareholder would pay on fund distributions or the redemption of fund shares.
The Morgan Stanley Capital International (MSCI) Emerging Markets Investable Market Index (IMI) (net) is a free float-adjusted market capitalization weighted index that is designed to measure the equity market performance of emerging markets. This series approximates the minimum possible dividend reinvestment.
This report identifies the Fund’s investments on June 30, 2011. These holdings are subject to change. Not all stocks in the Fund performed the same, nor is there any guarantee that these stocks will perform as well in the future. Market forecasts provided in this report may not necessarily come to pass.
Sector Diversification (unaudited)
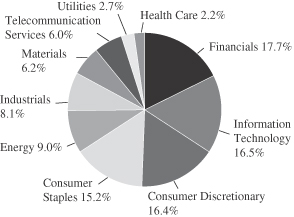
The sector diversification shown is based on the total long-term securities.
22 Semi-Annual Report | June 30, 2011 |
Emerging Markets Growth Fund
Portfolio of Investments, June 30, 2011 (all dollar amounts in thousands) (unaudited)
| | | | | | | | |
Issuer | | Shares | | | Value | |
|
Common Stocks—Emerging Asia—57.3% | |
China—15.5% | | | | | | | | |
AAC Technologies Holdings, Inc. (Communications equipment) | | | 1,205,949 | | | $ | 2,808 | |
Ajisen China Holdings, Ltd. (Hotels, restaurants & leisure) | | | 1,500,078 | | | | 3,107 | |
Anhui Conch Cement Co., Ltd. (Construction materials) | | | 2,124,500 | | | | 9,938 | |
Anta Sports Products, Ltd. (Textiles, apparel & luxury goods) | | | 1,306,000 | | | | 2,333 | |
*Baidu, Inc.—ADR (Internet software & services) | | | 106,759 | | | | 14,960 | |
Belle International Holdings, Ltd. (Specialty retail) | | | 4,757,000 | | | | 10,025 | |
China Shanshui Cement Group, Ltd. (Construction materials) | | | 1,909,000 | | | | 2,205 | |
China Vanke Co., Ltd. (Real estate management & development) | | | 5,594,249 | | | | 7,534 | |
China Yurun Food Group, Ltd. (Food products) | | | 1,232,000 | | | | 3,467 | |
CNOOC, Ltd. (Oil, gas & consumable fuels) | | | 7,413,000 | | | | 17,300 | |
Comba Telecom Systems Holdings, Ltd. (Communications equipment) | | | 2,084,496 | | | | 2,197 | |
Dongfeng Motor Group Co., Ltd. (Automobiles) | | | 5,748,000 | | | | 10,858 | |
Great Wall Motor Co., Ltd. (Automobiles) | | | 1,620,500 | | | | 2,666 | |
Haitian International Holdings, Ltd. (Machinery) | | | 1,460,185 | | | | 1,891 | |
Hengdeli Holdings, Ltd. (Specialty retail) | | | 5,724,000 | | | | 3,023 | |
Industrial and Commercial Bank of China, Ltd. Class “H” (Commercial banks) | | | 22,936,580 | | | | 17,420 | |
Lonking Holdings, Ltd. (Machinery) | | | 5,675,000 | | | | 3,099 | |
Minth Group, Ltd. (Auto components) | | | 724,000 | | | | 1,170 | |
Tencent Holdings, Ltd. (Internet software & services) | | | 166,600 | | | | 4,522 | |
Want Want China Holdings, Ltd. (Food products) | | | 4,894,000 | | | | 4,748 | |
Weichai Power Co., Ltd. (Machinery) | | | 578,088 | | | | 3,373 | |
*WuXi PharmaTech Cayman, Inc.—ADR (Life sciences tools & services) | | | 96,496 | | | | 1,695 | |
*Youku.com, Inc.—ADR (Internet software & services) | | | 102,085 | | | | 3,507 | |
Zhuzhou CSR Times Electric Co., Ltd. (Electrical equipment) | | | 658,861 | | | | 2,223 | |
| | | | | | | | |
| | | | | | | 136,069 | |
| | | | | | | | |
India—9.4% | | | | | | | | |
Asian Paints, Ltd. (Chemicals) | | | 70,630 | | | | 5,033 | |
Axis Bank, Ltd. (Commercial banks) | | | 222,205 | | | | 6,410 | |
Bajaj Auto, Ltd. (Automobiles) | | | 116,007 | | | | 3,652 | |
Bharat Heavy Electricals, Ltd. (Electrical equipment) | | | 148,377 | | | | 6,806 | |
Dabur India, Ltd. (Personal products) | | | 867,230 | | | | 2,212 | |
Housing Development Finance Corporation (Thrifts & mortgage finance) | | | 272,951 | | | | 4,313 | |
IndusInd Bank, Ltd. (Commercial banks) | | | 346,602 | | | | 2,109 | |
Infosys Technologies, Ltd. (IT services) | | | 310,940 | | | | 20,244 | |
ITC, Ltd. (Tobacco) | | | 1,602,902 | | | | 7,277 | |
*Jubilant Foodworks, Ltd. (Hotels, restaurants & leisure) | | | 157,714 | | | | 3,362 | |
Lupin, Ltd. (Pharmaceuticals) | | | 301,509 | | | | 3,030 | |
| | | | | | | | |
Issuer | | Shares | | | Value | |
|
Common Stocks—Emerging Asia—57.3%—(continued) | |
India—(continued) | | | | | | | | |
Motherson Sumi Systems, Ltd. (Auto components) | | | 467,205 | | | $ | 2,356 | |
Nestle India, Ltd. (Food products) | | | 59,028 | | | | 5,425 | |
Shriram Transport Finance Co., Ltd. (Consumer finance) | | | 92,800 | | | | 1,280 | |
Tata Consultancy Services, Ltd. (IT services) | | | 191,892 | | | | 5,083 | |
Tata Motors, Ltd. (Machinery) | | | 191,020 | | | | 4,248 | |
| | | | | | | | |
| | | | | | | 82,840 | |
| | | | | | | | |
Indonesia—6.2% | | | | | | | | |
PT Astra International Tbk (Automobiles) | | | 2,169,000 | | | | 16,074 | |
PT Bank Rakyat Indonesia (Commercial banks) | | | 13,474,500 | | | | 10,213 | |
PT Indo Tambangraya Megah (Oil, gas & consumable fuels) | | | 1,376,500 | | | | 7,183 | |
PT Indofood Sukses Makmur Tbk (Food products) | | | 6,788,000 | | | | 4,551 | |
PT Kalbe Farma Tbk (Pharmaceuticals) | | | 8,234,500 | | | | 3,241 | |
PT Perusahaan Gas Negara (Gas utilities) | | | 9,405,500 | | | | 4,415 | |
PT Unilever Indonesia Tbk (Household products) | | | 2,572,000 | | | | 4,469 | |
PT United Tractors Tbk (Machinery) | | | 967,257 | | | | 2,808 | |
PT XL Axiata Tbk (Diversified telecommunication services) | | | 2,409,500 | | | | 1,728 | |
| | | | | | | | |
| | | | | | | 54,682 | |
| | | | | | | | |
Malaysia—3.5% | | | | | | | | |
Axiata Group Bhd (Wireless telecommunication services) | | | 5,319,900 | | | | 8,827 | |
CIMB Group Holdings Bhd (Commercial banks) | | | 4,764,300 | | | | 14,090 | |
Genting Bhd (Hotels, restaurants & leisure) | | | 1,154,300 | | | | 4,289 | |
Kuala Lumpur Kepong Bhd (Food products) | | | 450,800 | | | | 3,309 | |
| | | | | | | | |
| | | | | | | 30,515 | |
| | | | | | | | |
Papua New Guinea—1.2% | | | | | | | | |
Oil Search, Ltd. (Oil, gas & consumable fuels) | | | 1,479,460 | | | | 10,552 | |
| | | | | | | | |
Philippines—0.2% | | | | | | | | |
Alliance Global Group, Inc. (Industrial conglomerates) | | | 8,233,100 | | | | 2,078 | |
| | | | | | | | |
South Korea—11.2% | | | | | | | | |
Honam Petrochemical Corporation (Chemicals) | | | 12,098 | | | | 4,482 | |
Hyundai Mobis (Auto components) | | | 45,849 | | | | 17,178 | |
Hyundai Motor Co. (Automobiles) | | | 79,477 | | | | 17,642 | |
LG Household & Health Care, Ltd. (Household products) | | | 19,445 | | | | 8,360 | |
Samsung Electronics Co., Ltd. (Semiconductors & semiconductor equipment) | | | 33,315 | | | | 25,775 | |
Samsung Engineering Co., Ltd. (Construction & engineering) | | | 64,433 | | | | 15,389 | |
Samsung Fire & Marine Insurance Co., Ltd. (Insurance) | | | 31,780 | | | | 7,382 | |
Samsung Heavy Industries Co., Ltd. (Machinery) | | | 54,491 | | | | 2,429 | |
| | | | | | | | |
| | | | | | | 98,637 | |
| | | | | | | | |
See accompanying Notes to Financial Statements.
June 30, 2011 | William Blair Funds 23 |
Emerging Markets Growth Fund
Portfolio of Investments, June 30, 2011 (all dollar amounts in thousands) (unaudited)
| | | | | | | | |
Issuer | | Shares | | | Value | |
|
Common Stocks—Emerging Asia—57.3%—(continued) | |
Taiwan—7.8% | | | | | | | | |
Hon Hai Precision Industry Co., Ltd. (Electronic equipment, instruments & components) | | | 5,860,992 | | | $ | 20,099 | |
HTC Corporation (Communications equipment) | | | 580,000 | | | | 19,506 | |
Powertech Technology, Inc. (Semiconductors & semiconductor equipment) | | | 1,080,000 | | | | 3,625 | |
Simplo Technology Co., Ltd. (Computers & peripherals) | | | 793,000 | | | | 6,391 | |
*TPK Holding Co., Ltd. (Electronic equipment, instruments & components) | | | 241,000 | | | | 7,341 | |
Tripod Technology Corporation (Electronic equipment, instruments & components) | | | 190,000 | | | | 787 | |
TSRC Corporation (Chemicals) | | | 1,324,000 | | | | 3,895 | |
Yuanta Financial Holding Co., Ltd. (Capital markets) | | | 9,877,000 | | | | 6,843 | |
| | | | | | | | |
| | | | | | | 68,487 | |
| | | | | | | | |
Thailand—2.3% | | | | | | | | |
CP ALL PCL (Food & staples retailing) | | | 7,411,100 | | | | 10,673 | |
Kasikornbank PCL (Commercial banks) | | | 2,192,700 | | | | 8,921 | |
Minor International PCL (Hotels, restaurants & leisure) | | | 1,966,700 | | | | 730 | |
| | | | | | | | |
| | | | | | | 20,324 | |
| | | | | | | | |
| | |
Emerging Latin America—24.1% | | | | | | | | |
Brazil—13.7% | | | | | | | | |
BR Malls Participacoes S.A. (Real estate management & development) | | | 602,300 | | | | 6,889 | |
BR Properties S.A. (Real estate management & development) | | | 187,345 | | | | 2,101 | |
CETIP S.A.—Balcao Organizado de Ativos e Derivativos (Capital markets) | | | 299,600 | | | | 4,636 | |
*CETIP S.A.—Balcao Organizado de Ativos e Derivativos (Capital markets) | | | 2,889 | | | | 43 | |
Cia de Bebidas das Americas—ADR (Beverages) | | | 811,836 | | | | 27,383 | |
Cia de Concessoes Rodoviarias (Transportation infrastructure) | | | 229,300 | | | | 6,825 | |
Cia Hering (Specialty retail) | | | 234,400 | | | | 5,392 | |
CPFL Energia S.A.—ADR (Electric utilities) | | | 101,881 | | | | 8,853 | |
Drogasil S.A. (Food & staples retailing) | | | 261,600 | | | | 1,785 | |
Embraer S.A.—ADR (Aerospace & defense) | | | 311,752 | | | | 9,596 | |
Lojas Renner S.A. (Multiline retail) | | | 201,300 | | | | 7,675 | |
Natura Cosmeticos S.A. (Personal products) | | | 29,100 | | | | 727 | |
OdontoPrev S.A. (Health care providers & services) | | | 142,900 | | | | 2,381 | |
*OGX Petroleo e Gas Participacoes S.A. (Oil, gas & consumable fuels) | | | 410,900 | | | | 3,841 | |
Sul America S.A. (Insurance) | | | 197,257 | | | | 2,477 | |
Totvs S.A. (Software) | | | 198,000 | | | | 3,654 | |
Tractebel Energia S.A. (Independent power producers & energy traders) | | | 565,300 | | | | 9,961 | |
Vale S.A.—ADR (Metals & mining) | | | 500,156 | | | | 15,980 | |
| | | | | | | | |
| | | | | | | 120,199 | |
| | | | | | | | |
Chile—2.8% | | | | | | | | |
Banco Santander Chile—ADR (Commercial banks) | | | 154,427 | | | | 14,487 | |
*CFR Pharmaceuticals S.A. (Pharmaceuticals) | | | 8,816,489 | | | | 2,396 | |
Sociedad Quimica y Minera de Chile S.A.—ADR (Chemicals) | | | 71,213 | | | | 4,609 | |
Sonda S.A. (IT services) | | | 1,079,025 | | | | 2,976 | |
| | | | | | | | |
| | | | | | | 24,468 | |
| | | | | | | | |
| | | | | | | | |
Issuer | | Shares | | | Value | |
|
Common Stocks—Emerging Latin America—24.1%—(continued) | |
Colombia—0.6% | | | | | | | | |
Pacific Rubiales Energy Corporation (Oil, gas & consumable fuels) | | | 215,522 | | | $ | 5,777 | |
| | | | | | | | |
Mexico—6.5% | | | | | | | | |
America Movil S.A.B. de C.V. (Wireless telecommunication services) | | | 16,570,500 | | | | 22,347 | |
Coca-Cola Femsa S.A.B. de C.V.—ADR (Beverages) | | | 65,200 | | | | 6,064 | |
*Genomma Lab Internacional S.A.B. de C.V. (Pharmaceuticals) | | | 1,266,134 | | | | 3,222 | |
Grupo Comercial Chedraui S.A. de C.V. (Food & staples retailing) | | | 360,966 | | | | 1,133 | |
Grupo Mexico S.A.B. de C.V. Series “B” (Metals & mining) | | | 1,763,228 | | | | 5,822 | |
Mexichem S.A.B. de C.V. (Chemicals) | | | 398,400 | | | | 1,614 | |
Wal-Mart de Mexico S.A.B. de C.V. (Food & staples retailing) | | | 5,621,700 | | | | 16,685 | |
| | | | | | | | |
| | | | | | | 56,887 | |
| | | | | | | | |
Peru—0.5% | | | | | | | | |
Credicorp, Ltd. (Commercial banks)† | | | 49,504 | | | | 4,262 | |
| | | | | | | | |
|
Emerging Europe, Mid-East, Africa—14.2% | |
Poland—0.4% | | | | | | | | |
Eurocash S.A. (Food & staples retailing) | | | 388,230 | | | | 4,176 | |
| | | | | | | | |
Qatar—1.7% | | | | | | | | |
Industries Qatar QSC (Industrial conglomerates) | | | 229,427 | | | | 8,581 | |
Qatar National Bank S.A.Q. (Commercial banks) | | | 162,184 | | | | 6,280 | |
| | | | | | | | |
| | | | | | | 14,861 | |
| | | | | | | | |
Russia—1.9% | | | | | | | | |
* Etalon Group Ltd.—144A—GDR (Real estate management & development) | | | 328,708 | | | | 2,265 | |
Magnit OAO (Food & staples retailing)† | | | 73,220 | | | | 9,858 | |
*X5 Retail Group N.V.—GDR (Food & staples retailing) | | | 113,593 | | | | 4,441 | |
| | | | | | | | |
| | | | | | | 16,564 | |
| | | | | | | | |
South Africa—8.9% | | | | | | | | |
Clicks Group, Ltd. (Multiline retail) | | | 956,170 | | | | 5,974 | |
Life Healthcare Group Holdings, Ltd. (Health care providers & services) | | �� | 1,256,331 | | | | 3,268 | |
Mr Price Group, Ltd. (Specialty retail) | | | 466,397 | | | | 4,704 | |
MTN Group, Ltd. (Wireless telecommunication services) | | | 915,239 | | | | 19,478 | |
Naspers, Ltd. (Media) | | | 118,109 | | | | 6,672 | |
Sasol, Ltd. (Oil, gas & consumable fuels) | | | 293,110 | | | | 15,431 | |
Shoprite Holdings, Ltd. (Food & staples retailing) | | | 348,941 | | | | 5,253 | |
Standard Bank Group, Ltd. (Commercial banks) | | | 451,232 | | | | 6,671 | |
*The Foschini Group, Ltd. (Specialty retail) | | | 353,142 | | | | 4,607 | |
Truworths International, Ltd. (Specialty retail) | | | 579,601 | | | | 6,282 | |
| | | | | | | | |
| | | | | | | 78,340 | |
| | | | | | | | |
See accompanying Notes to Financial Statements.
24 Semi-Annual Report | June 30, 2011 |
Emerging Markets Growth Fund
Portfolio of Investments, June 30, 2011 (all dollar amounts in thousands) (unaudited)
| | | | | | | | |
Issuer | | Shares or
Principal
Amount | | | Value | |
|
Common Stocks—Emerging Europe, Mid-East,
Africa—14.2%—(continued) | |
Turkey—1.3% | | | | | | | | |
Tofas Turk Otomobil Fabrikasi A.S. (Automobiles) | | | 630,894 | | | $ | 2,877 | |
Turkiye Halk Bankasi A.S. (Commercial banks) | | | 1,121,029 | | | | 8,392 | |
| | | | | | | | |
| | | | | | | 11,269 | |
| | | | | | | | |
Total Common Stocks—95.6%
(cost $719,190) | | | | 840,987 | |
| | | | | | | | |
| | |
Preferred Stocks | | | | | | | | |
Brazil—3.1% | | | | | | | | |
Itau Unibanco Holding S.A. (Commercial banks) | | | 393,254 | | | | 9,185 | |
Petroleo Brasileiro S.A. (Oil, gas & consumable fuels) | | | 1,178,615 | | | | 17,913 | |
| | | | | | | | |
| | | | | | | 27,098 | |
| | | | | | | | |
Total Preferred Stocks—3.1%
(cost $26,521) | | | | 27,098 | |
| | | | | | | | |
| | |
Convertible Bond | | | | | | | | |
Brazil—0.1% | | | | | | | | |
Lupatech S.A., 6.500%, due 4/15/18 (Machinery)**§ $ | | $ | 1,602 | | | | 1,055 | |
| | | | | | | | |
Total Convertible Bond—0.1%
(cost $831) | | | | 1,055 | |
| | | | | | | | |
Total Investments—98.8%
(cost $746,542) | | | | 869,140 | |
Cash and other assets, less liabilities—1.2% | | | | 10,449 | |
| | | | | | | | |
Net assets—100.0% | | | $ | 879,589 | |
| | | | | | | | |
ADR = American Depository Receipt
GDR = Global Depository Receipt
* Non-income producing securities
† = U.S. listed foreign security
** = Fair valued pursuant to Valuation Procedures adopted by the Board of Trustees. This holding represents 0.12% of the Fund’s net assets at June 30, 2011.
§ = Deemed illiquid pursuant to Liquidity Procedures approved by the Board of Trustees. This holding represents 0.12% of the net assets at June 30, 2011.
For securities primarily traded on exchanges or markets that close before the close of regular trading on the New York Stock Exchange, the Fund may use an independent pricing service to fair value price the securities pursuant to Valuation Procedures approved by the Board of Trustees.
At June 30, 2011, the Fund’s Portfolio of Investments includes the following industry categories:
| | | | |
Financials | | | 17.7% | |
Information Technology | | | 16.5% | |
Consumer Discretionary | | | 16.4% | |
Consumer Staples | | | 15.2% | |
Energy | | | 9.0% | |
Industrials | | | 8.1% | |
Materials | | | 6.2% | |
Telecommunication Services | | | 6.0% | |
Utilities | | | 2.7% | |
Health Care | | | 2.2% | |
| | | | |
Total | | | 100.0% | |
| | | | |
At June 30, 2011, the Fund’s Portfolio of Investments includes the following currency categories:
| | | | |
U.S. Dollar | | | 14.7% | |
Hong Kong Dollar | | | 13.3% | |
South Korean Won | | | 11.4% | |
Brazilian Real | | | 10.0% | |
Indian Rupee | | | 9.5% | |
South African Rand | | | 9.0% | |
New Taiwan Dollar | | | 7.9% | |
Indonesian Rupiah | | | 6.3% | |
Mexican Peso | | | 5.9% | |
Malaysian Ringgit | | | 3.5% | |
Thai Baht | | | 2.3% | |
Qatari Rial | | | 1.7% | |
Turkish Lira | | | 1.3% | |
Australian Dollar | | | 1.2% | |
All Other Currencies | | | 2.0% | |
| | | | |
Total | | | 100.0% | |
| | | | |
See accompanying Notes to Financial Statements.
June 30, 2011 | William Blair Funds 25 |
Todd M. McClone
Jeffrey A. Urbina
EMERGING LEADERS GROWTH FUND
The Emerging Leaders Growth Fund seeks long-term capital appreciation.
AN OVERVIEW FROM THE PORTFOLIO MANAGERS
The Emerging Leaders Growth Fund posted a 2.32% decrease (Institutional Share Class) for the six months ended June 30, 2011. By comparison, the Fund’s benchmark, the MSCI Emerging Markets Large Cap Index (net) increased by 0.97%.
Despite second quarter outperformance, the Emerging Leaders Growth Fund trailed the Index year to date, due to underperformance at the outset of 2011. Underperformance was largely driven by Energy and Financials stock selection. Within Energy, the Fund’s lack of Russian Energy exposure during the first quarter was a key detractor, costing approximately 0.65% in relative performance year to date. In addition, production delays by Pacific Rubiales Energy Corporation, one of the top holdings of the Fund, also contributed approximately 0.55% to underperformance during the period. The Fund sold the company in the second quarter on an uncertain production growth outlook. Financials underperformed across regions.
Over the six month period, the Fund maintained significant exposure in Consumer Discretionary stocks, well ahead of the Index weighting, due largely to auto-related exposure and Consumer Staples weightings, in addition to select specialty retailers, as these companies benefited from increased disposable income as wages increased. Conversely, the Fund was underweighted in Financials, given tightening monetary policy on inflationary concerns and the impact on net interest margins and profitability. During the six month period, we reduced Materials holdings. The Energy reduction followed the spike in energy prices earlier in the year and as valuations increased, while Materials was reduced largely due to individual company issues, although also resulting from moderating commodity prices. Conversely, Information Technology (IT) increased from approximately 10% as of year end to 16% mid year, as corporate fundamentals improved given increased smart phone and tablet demand and a consumer driven product cycle. Regionally, the Fund remained overweighted in Emerging Latin America throughout the six month period, with a lower exposure in Emerging Europe, Middle East, and Africa as there were no Energy and Materials holdings in the region, coupled with lower Eastern European and Russian weightings. Emerging Asia increased during the period due to higher IT weightings.
26 Semi-Annual Report | June 30, 2011 |
Emerging Leaders Growth Fund
Performance Highlights (unaudited)
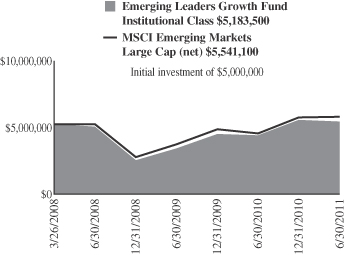
Average Annual Total Return at 6/30/2011
| | | | | | | | | | | | |
| | | Year
To Date | | | 1
Year | | | Since
Inception(a) | |
Institutional Class | | | (2.32 | )% | | | 23.46 | % | | | 1.11 | % |
MSCI Emerging Markets
Large Cap (net) | | | 0.97 | | | | 27.87 | | | | 3.19 | |
| | (a) | | For the period March 26, 2008 (Commencement of Operations) to June 30, 2011. |
Performance cited represents past performance. Past performance does not guarantee future results and current performance may be lower or higher than the data quoted. Results shown are average annual total returns, which assume reinvestment of dividends and capital gains. Investment returns and principal will fluctuate and you may have a gain or loss when you sell shares. For the most current month-end performance information, please call 1-800-742-7272, or visit our Web site at www.williamblairfunds.com. International investing includes special risk considerations, including currency fluctuations, lower liquidity, economic and political risk. From time to time, the investment advisor may waive fees or reimburse expenses for the Fund. Without these waivers, performance would be lower.
The performance highlights and graph presented above do not reflect the deduction of taxes that a shareholder would pay on fund distributions or the redemption of fund shares.
The Morgan Stanley Capital International (MSCI) Emerging Markets Large Cap Index (net) is a free float-adjusted market capitalization weighted index that is designed to measure market performance of large capitalization on stocks in emerging markets. This series approximates the minimum possible dividend reinvestment.
This report identifies the Fund’s investments on June 30, 2011. These holdings are subject to change. Not all stocks in the Fund performed the same, nor is there any guarantee that these stocks will perform as well in the future. Market forecasts provided in this report may not necessarily come to pass.
Sector Diversification (unaudited)
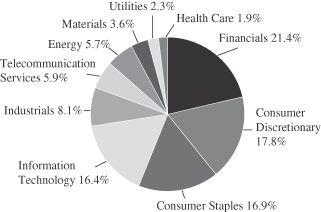
The sector diversification shown is based on the total long-term securities.
June 30, 2011 | William Blair Funds 27 |
Emerging Leaders Growth Fund
Portfolio of Investments, June 30, 2011 (all dollar amounts in thousands) (unaudited)
| | | | | | | | |
Issuer | | Shares | | | Value | |
| | |
Common Stocks—Emerging Asia—55.6% | | | | | | | | |
China—16.6% | | | | | | | | |
*Baidu, Inc.—ADR (Internet software & services) | | | 21,584 | | | $ | 3,025 | |
Belle International Holdings, Ltd. (Specialty retail) | | | 921,973 | | | | 1,943 | |
China Vanke Co., Ltd. (Real estate management & development) | | | 633,771 | | | | 853 | |
CNOOC, Ltd. (Oil, gas & consumable fuels) | | | 811,000 | | | | 1,893 | |
Dongfeng Motor Group Co., Ltd. (Automobiles) | | | 1,018,790 | | | | 1,924 | |
Industrial and Commercial Bank of China, Ltd. Class “H” (Commercial banks) | | | 2,513,000 | | | | 1,909 | |
Ping An Insurance Group Co. of China, Ltd. Class “H” (Insurance) | | | 145,609 | | | | 1,503 | |
Shandong Weigao Group Medical Polymer Co., Ltd. (Health care equipment & supplies) | | | 280,000 | | | | 404 | |
Tencent Holdings, Ltd. (Internet software & services) | | | 68,905 | | | | 1,870 | |
Want Want China Holdings, Ltd. (Food products) | | | 1,428,948 | | | | 1,386 | |
| | | | | | | | |
| | | | | | | 16,710 | |
| | | | | | | | |
India—13.6% | | | | | | | | |
Bajaj Auto, Ltd. (Automobiles) | | | 15,628 | | | | 492 | |
HDFC Bank, Ltd. (Commercial banks) | | | 26,533 | | | | 1,493 | |
Housing Development Finance Corporation (Thrifts & mortgage finance) | | | 64,930 | | | | 1,026 | |
Infosys Technologies, Ltd. (IT services) | | | 28,535 | | | | 1,858 | |
ITC, Ltd. (Tobacco) | | | 437,650 | | | | 1,987 | |
Larsen & Toubro, Ltd. (Construction & engineering) | | | 37,647 | | | | 1,536 | |
Nestle India, Ltd. (Food products) | | | 5,046 | | | | 463 | |
Sun Pharmaceutical Industries, Ltd. (Pharmaceuticals) | | | 128,025 | | | | 1,426 | |
Tata Consultancy Services, Ltd. (IT services) | | | 74,018 | | | | 1,961 | |
Tata Motors, Ltd. (Machinery) | | | 64,514 | | | | 1,435 | |
| | | | | | | | |
| | | | | | | 13,677 | |
| | | | | | | | |
Indonesia—5.9% | | | | | | | | |
PT Astra International Tbk (Automobiles) | | | 387,500 | | | | 2,872 | |
PT Bank Rakyat Indonesia (Commercial banks) | | | 2,470,000 | | | | 1,872 | |
PT Indofood Sukses Makmur Tbk (Food products) | | | 1,707,500 | | | | 1,145 | |
| | | | | | | | |
| | | | | | | 5,889 | |
| | | | | | | | |
Malaysia—1.9% | | | | | | | | |
CIMB Group Holdings Bhd (Commercial banks) | | | 646,457 | | | | 1,912 | |
| | | | | | | | |
South Korea—11.6% | | | | | | | | |
Hyundai Mobis (Auto components) | | | 7,009 | | | | 2,626 | |
Hyundai Motor Co. (Automobiles) | | | 12,804 | | | | 2,842 | |
LG Household & Health Care, Ltd. (Household products) | | | 3,331 | | | | 1,432 | |
Samsung Electronics Co., Ltd. (Semiconductors & semiconductor equipment) | | | 3,601 | | | | 2,786 | |
Samsung Engineering Co., Ltd. (Construction & engineering) | | | 8,192 | | | | 1,957 | |
| | | | | | | | |
| | | | | | | 11,643 | |
| | | | | | | | |
| | | | | | | | |
Issuer | | Shares | | | Value | |
|
Common Stocks—Emerging Asia—55.6%—(continued) | |
Taiwan—4.6% | | | | | | | | |
Hon Hai Precision Industry Co., Ltd. (Electronic equipment, instruments & components) | | | 605,000 | | | $ | 2,075 | |
HTC Corporation (Communications equipment) | | | 76,000 | | | | 2,556 | |
| | | | | | | | |
| | | | | | | 4,631 | |
| | | | | | | | |
Thailand—1.4% | | | | | | | | |
CP ALL PCL (Food & staples retailing) | | | 959,300 | | | | 1,381 | |
| | | | | | | | |
| | |
Emerging Latin America—22.9% | | | | | | | | |
Brazil—10.4% | | | | | | | | |
BR Malls Participacoes S.A. (Real estate management & development) | | | 127,800 | | | | 1,462 | |
Cia de Bebidas das Americas—ADR (Beverages) | | | 95,253 | | | | 3,213 | |
Cia de Concessoes Rodoviarias (Transportation infrastructure) | | | 32,100 | | | | 955 | |
CPFL Energia S.A.—ADR (Electric utilities) | | | 11,178 | | | | 971 | |
Embraer S.A.—ADR (Aerospace & defense) | | | 31,129 | | | | 958 | |
Natura Cosmeticos S.A. (Personal products) | | | 3,000 | | | | 75 | |
Tractebel Energia S.A. (Independent power producers & energy traders) | | | 73,600 | | | | 1,297 | |
Vale S.A.—ADR (Metals & mining) | | | 46,249 | | | | 1,478 | |
| | | | | | | | |
| | | | | | | 10,409 | |
| | | | | | | | |
Chile—4.1% | | | | | | | | |
Banco Santander Chile—ADR (Commercial banks) | | | 20,583 | | | | 1,931 | |
S.A.C.I. Falabella (Multiline retail) | | | 115,302 | | | | 1,214 | |
Sociedad Quimica y Minera de Chile S.A.—ADR (Chemicals) | | | 15,360 | | | | 994 | |
| | | | | | | | |
| | | | | | | 4,139 | |
| | | | | | | | |
Mexico—7.9% | | | | | | | | |
America Movil S.A.B. de C.V.—ADR (Wireless telecommunication services) | | | 54,908 | | | | 2,958 | |
Grupo Financiero Banorte S.A.B. de C.V. (Commercial banks) | | | 425,200 | | | | 1,931 | |
Grupo Mexico S.A.B. de C.V. Series “B” (Metals & mining) | | | 329,626 | | | | 1,088 | |
Wal-Mart de Mexico S.A.B. de C.V. (Food & staples retailing) | | | 668,500 | | | | 1,984 | |
| | | | | | | | |
| | | | | | | 7,961 | |
| | | | | | | | |
Peru—0.5% | | | | | | | | |
Credicorp, Ltd. (Commercial banks)† | | | 5,443 | | | | 469 | |
| | | | | | | | |
| | |
Emerging Europe, Mid-East, Africa—15.2% | | | | | | | | |
Qatar—1.0% | | | | | | | | |
Industries Qatar QSC (Industrial conglomerates) | | | 28,493 | | | | 1,066 | |
| | | | | | | | |
Russia—3.1% | | | | | | | | |
Magnit OJSC—144A—GDR (Food & staples retailing)† | | | 44,538 | | | | 1,200 | |
Sberbank of Russian Federation (Commercial banks)† | | | 272,972 | | | | 1,004 | |
*X5 Retail Group N.V.—GDR (Food & staples retailing) | | | 23,074 | | | | 902 | |
| | | | | | | | |
| | | | | | | 3,106 | |
| | | | | | | | |
See accompanying Notes to Financial Statements.
28 Semi-Annual Report | June 30, 2011 |
Emerging Leaders Growth Fund
Portfolio of Investments, June 30, 2011 (all dollar amounts in thousands) (unaudited)
| | | | | | | | |
Issuer | | Shares | | | Value | |
|
Common Stocks—Emerging Europe, Mid-East,
Africa—15.2%—(continued) | |
South Africa—9.4% | | | | | | | | |
MTN Group, Ltd. (Wireless telecommunication services) | | | 135,628 | | | $ | 2,886 | |
Naspers, Ltd. (Media) | | | 44,803 | | | | 2,531 | |
Sasol, Ltd. (Oil, gas & consumable fuels) | | | 29,140 | | | | 1,534 | |
Shoprite Holdings, Ltd. (Food & staples retailing) | | | 95,140 | | | | 1,432 | |
Truworths International, Ltd. (Specialty retail) | | | 96,000 | | | | 1,041 | |
| | | | | | | | |
| | | | | | | 9,424 | |
| | | | | | | | |
Turkey—1.7% | | | | | | | | |
Turkiye Garanti Bankasi A.S. (Commercial banks) | | | 379,052 | | | | 1,719 | |
| | | | | | | | |
Total Common Stocks—93.7%
(cost $84,854) | | | | | | | 94,136 | |
| | | | | | | | |
| | |
Preferred Stocks | | | | | | | | |
Brazil—4.1% | | | | | | | | |
Itau Unibanco Holding S.A. (Commercial banks) | | | 84,485 | | | | 1,973 | |
Petroleo Brasileiro S.A. (Oil, gas & consumable fuels) | | | 141,655 | | | | 2,153 | |
| | | | | | | | |
| | | | | | | 4,126 | |
| | | | | | | | |
Total Preferred Stocks—4.1%
(cost $3,865) | | | | 4,126 | |
| | | | | | | | |
| | |
Repurchase Agreement | | | | | | | | |
Fixed Income Clearing Corporation, 0.010% dated 6/30/11, due 7/1/11, repurchase price $174, collateralized by FHLMC, 2.000%, due 12/3/15 $ | | $ | 174 | | | $ | 174 | |
| | | | | | | | |
Total Repurchase Agreement—0.2%
(cost $174) | | | | 174 | |
| | | | | | | | |
Total Investments—98.0%
(cost $88,893) | | | | 98,436 | |
Cash and other assets, less liabilities—2.0% | | | | 1,966 | |
| | | | | | | | |
Net assets—100.0% | | | $ | 100,402 | |
| | | | | | | | |
ADR = American Depository Receipt
GDR = Global Depository Receipt
* Non-income producing securities
† = U.S. listed foreign security
For securities primarily traded on exchanges or markets that close before the close of regular trading on the New York Stock Exchange, the Fund may use an independent pricing service to fair value price the securities pursuant to Valuation Procedures approved by the Board of Trustees.
At June 30, 2011, the Fund’s Portfolio of Investments includes the following industry categories:
| | | | |
Financials | | | 21.4% | |
Consumer Discretionary | | | 17.8% | |
Consumer Staples | | | 16.9% | |
Information Technology | | | 16.4% | |
Industrials | | | 8.1% | |
Telecommunication Services | | | 5.9% | |
Energy | | | 5.7% | |
Materials | | | 3.6% | |
Utilities | | | 2.3% | |
Health Care | | | 1.9% | |
| | | | |
Total | | | 100.0% | |
| | | | |
At June 30, 2011, the Fund’s Portfolio of Investments includes the following currency categories:
| | | | |
U.S. Dollar | | | 19.4% | |
Hong Kong Dollar | | | 13.9% | |
Indian Rupee | | | 13.9% | |
South Korean Won | | | 11.9% | |
South African Rand | | | 9.6% | |
Brazilian Real | | | 8.1% | |
Indonesian Rupiah | | | 6.0% | |
Mexican Peso | | | 5.1% | |
New Taiwan Dollar | | | 4.7% | |
Malaysian Ringgit | | | 1.9% | |
Turkish Lira | | | 1.8% | |
Thai Baht | | | 1.4% | |
Chilean Peso | | | 1.2% | |
Qatari Rial | | | 1.1% | |
| | | | |
Total | | | 100.0% | |
| | | | |
See accompanying Notes to Financial Statements.
June 30, 2011 | William Blair Funds 29 |
FIXED-INCOME MARKET OVERVIEW
Summary
The first half of 2011 was marked by market volatility, as geopolitical events during the first quarter and renewed concerns over the European sovereign debt crisis during the second quarter weighed on capital markets.
During the first quarter, improvements in the U.S. economy offset concerns stemming from geopolitical events, continued concern about the fiscal situations in certain European countries, and the U.S. budget deficit. The markets reacted favorably to U.S. economic data released during the quarter, which revealed that growth continued, the labor market had improved, and inflation expectations remained in check. However, global events had a mitigating effect on the market’s optimism. The seminal event during the quarter was the Japanese earthquake and tsunami that caused explosions at nuclear power plants in northern Japan. Political unrest throughout Northern Africa and the Middle East resulted in heightened market volatility and a spike in oil prices. The markets remained concerned over the precarious fiscal situation of Portugal, Ireland, Greece, and Spain, and the potential growth-hindering impact that austerity measures might have on the Eurozone region.
The Greek debt crisis took center stage during the second quarter, although concerns over other European countries continued. A string of disappointing economic data releases rekindled fears of a “double-dip” recession in the U.S. New figures on employment, housing, manufacturing, consumer spending, and other indicators pointed to a slowdown in growth from relatively modest first-quarter levels.
Interest rates rose during the first quarter but fell during the second. Year-to-date, interest rates have declined and fixed income instruments generated positive returns. The 10-year Treasury note yielded 3.17% at the end of June, compared to 3.47% at the end of March, and 3.29% at the end of 2010.
Outlook
The Federal Reserve Board’s Quantitative Easing II program expired with a whimper, not a bang. We believe the program was a successful endeavor on the part of the Fed to “reflate” the economy and to prevent deflation. At its meeting on June 22, The Federal Reserve’s Federal Open Market Committee (“FOMC”) left the Federal Funds target rate unchanged at a range of 0.00% - 0.25%.
The FOMC views the recent spike in food and energy prices to be a temporary aberration. In fact, the Fed said that it expects inflation to “subside to levels at or below those consistent with the Committee’s dual mandate.”
U.S. economic data continues to show very modest economic growth. Unemployment remains stubbornly high, and until there is improvement in job creation, the housing market is likely to remain in a depressed state.
Until fundamentals in the economy show significant signs of improvement—including gains in employment and strength in the housing market—and until inflation picks up, we believe the Fed will leave its Federal Funds target rate at that level, which may remain the case through the balance of 2011 and into next year.
30 Semi-Annual Report | June 30, 2011 |

Christopher T. Vincent

Paul J. Sularz
BOND FUND
The Bond Fund seeks to outperform the Barclays Capital U.S. Aggregate Bond Index by maximizing total return through a combination of income and capital appreciation.
AN OVERVIEW FROM THE PORTFOLIO MANAGERS
Bond Fund
The Bond Fund posted a 3.17% increase on a total return basis (Institutional Share Class) for the six months ended June 30, 2011. By comparison, the Fund’s benchmark, the Barclays Capital Aggregate Index, gained 2.72%.
The Fund posted positive performance results, in spite of what could be considered headwinds to our style of investing. Security selection was the main driver of Fund performance.
The Fund has been defensively positioned against rising interest rates, which worked well for the Fund in the first quarter but worked against it during the second.
U.S. Treasury securities were the best performing asset class during the second quarter. The “spread” between U.S. Treasury securities and Corporate bonds widened as interest rates fell during the second quarter. High yield bonds underperformed investment grade securities by 1.25% over this time period.
The Fund typically overweights Corporate bonds and underweights U.S. Treasury securities, so the Fund’s investment style proved challenging to relative performance during the quarter. However, security selection results in the Corporate and Mortgage-Backed sectors mitigated the magnitude of the Fund’s relative underperformance.
Several of the Fund’s Corporate bond holdings had a positive impact on performance during the quarter. Motorola Solutions, Inc. continued to be a stellar performer for the Fund. In addition, positions in Georgia-Pacific LLC, Comcast Corporation, JPMorgan Chase & Co., and Anheuser-Busch InBev Worldwide, Inc. were additive to performance as their incremental yield offset the impact of widening risk spreads during the quarter.
The Fund’s Mortgage-Backed securities holdings were another source of value during the quarter. The Fund emphasizes specified pools with low loan balances, seasoning, or above-market coupon rates in an attempt to earn a yield advantage while experiencing slower-than-expected prepayment speeds. During the second quarter, the Fund’s holdings in such securities had a positive effect on performance.
We believe the Fund’s investment strategy is designed to help the Fund hold its ground in market conditions such as those just experienced in the first half of the year, and the Fund did just that.
Security selection within the Mortgage-backed and Corporate bond sectors—which provide more yield than U.S. Treasury securities—provided a solid underpinning to the Fund. On the other hand, the Fund’s defensive interest rate positioning was a limiting factor as interest rates have declined since the start of the year.
The Fund’s holdings of High Yield Corporate bonds performed strongly, as did its holdings of investment grade Corporate securities. The Fund’s holdings of longer-dated TIPS (Treasury Inflation Protected Securities) also benefited the Fund.
June 30, 2011 | William Blair Funds 31 |
Motorola Solutions was a standout performer for the Fund. Motorola Solutions represents one of the two units of Motorola spun off by the company this year (the other being Motorola Mobility). Motorola Solutions represents the more commercial mobile phone handset business, whose customers include police and fire departments, while Motorola Mobility makes retail phone handsets. We believe Motorola Solutions has a more stable, predictable business, while Motorola Mobility’s business is much more cyclical in nature. Confusion about these new yet different business units resulted in conflicting opinions about the ratings of Motorola Solution’s bonds from different rating agencies, with the company actually receiving both investment grade as well as high yield ratings on its newly-issued bonds.
We, however, conduct our own research about every company whose bonds we buy, and do not exclusively rely on the rating agencies. We identified Motorola Solution’s Bonds—overlooked by the largest fix income managers because of the divergent opinions of the rating agencies and the relatively small $400 million size of the offering—as an attractive value. The convergence of positive opinions by the rating agencies about Motorola Solutions resulted in price appreciation for its bonds, and a success for our research efforts.
The Fund continues to maintain its overweight position—versus its benchmark—to “spread” products: Corporate Bonds, Mortgage-backed securities and Asset-backed securities. The Fund maintains its exposure to Treasury Securities through its holdings of TIPs (Treasury Inflation-Protected Securities).
In particular, the Fund maintains an overweight allocation to Corporate Bonds. In the current low growth, low inflation environment, corporate balance sheets have improved drastically, which improves the quality profile of corporate bonds. Investment ratings on some securities have risen. We believe that U.S. GDP growth will likely remain subpar due to structural unemployment in the U.S. economy. We believe this current environment is one that should remain favorable for Corporate bonds.
Within our Mortgage-backed securities holdings, we favor securities that we believe are less likely to be refinanced through emphasizing specified pools with low loan balances and above-market coupon rates. Put simply, we are seeking pools least likely to be “called away,” or pre-paid as interest rates decline and refinancings increase. The Fund has benefited from this strategy, especially given the fact that lenders have more stringent financial criteria in place for borrowers to refinance their existing mortgages. Higher coupon mortgages, in turn, provide a cushion through better convexity characteristics, because they typically do not decline as much when interest rates fall. Finally, this strategy enables the Fund to generate and maintain the Fund’s cash flow and current income.
32 Semi-Annual Report | June 30, 2011 |
Bond Fund
Performance Highlights (unaudited)
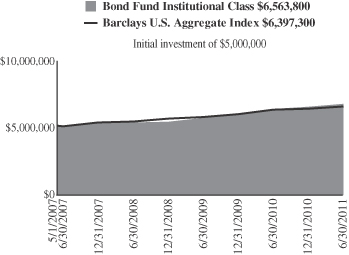
Average Annual Total Return at 6/30/2011
| | | | | | | | | | | | | | | | |
| | | Year
To Date | | | 1
Year | | | 3
Year | | | Since
Inception(a) | |
Institutional Class | | | 3.17 | % | | | 5.81 | % | | | 7.85 | % | | | 6.74 | % |
Barclays Capital U.S. Aggregate Bond Index | | | 2.72 | | | | 3.90 | | | | 6.46 | | | | 6.07 | |
| | (a) | | For the period May 1, 2007 (Commencement of Operations) to June 30, 2011. |
Performance cited represents past performance. Past performance does not guarantee future results and current performance may be lower or higher than the data quoted. Results shown are average annual total returns, which assume reinvestment of dividends and capital gains. Investment returns and principal will fluctuate and you may have a gain or loss when you sell shares. For the most current month-end performance information, please call 1-800-742-7272, or visit our Web site at www.williamblairfunds.com. From time to time, the investment advisor may waive fees or reimburse expenses for the Fund. Without these waivers, performance would be lower.
The performance highlights and graph presented above do not reflect the deduction of taxes that a shareholder would pay on fund distributions or the redemption of fund shares.
The Barclays Capital U.S. Aggregate Bond Index indicates broad intermediate government/corporate bond market performance.
This report identifies the Fund’s investments on June 30, 2011. These holdings are subject to change. Not all investments in the Fund performed the same, nor is there any guarantee that these investments will perform as well in the future. Market forecasts provided in this report may not necessarily come to pass.
Sector Diversification (unaudited)

The sector diversification shown is based on the total investments.
June 30, 2011 | William Blair Funds 33 |
Bond Fund
Portfolio of Investments, June 30, 2011 (all dollar amounts in thousands) (unaudited)
| | | | | | | | | | |
Issuer | | Principal
Amount | | | Value | |
|
U.S. Government and U.S. Government Agency—49.0% | |
U.S. Treasury Inflation Indexed Notes/Bonds—7.8% | |
U.S. Treasury Inflation Indexed Bond,
3.875%, due 4/15/29 | | $ | 8,207 | | | $ | 11,245 | |
U.S. Treasury Inflation Indexed Note,
1.875%, due 7/15/13 | | | 735 | | | | 781 | |
U.S. Treasury Inflation Indexed Note,
2.375%, due 1/15/17 | | | 3,345 | | | | 3,816 | |
| | | | | | | | |
Total U.S. Treasury Inflation Indexed Notes/Bonds | | | | | | | 15,842 | |
| | | | | | | | | | |
U.S. Treasury—1.0% | | | | | | | | |
U.S. Treasury Bond, 3.875%, due 8/15/40 | | | 500 | | | | 458 | |
U.S. Treasury Strip Principal, 0.000%, due 5/15/20 | | | 2,000 | | | | 1,512 | |
| | | | | | | | |
Total U.S. Treasury Obligations | | | | | | | 1,970 | |
| | | | | | | | | | |
Government National Mortgage
Association (GNMA)—4.6% | |
GNR 2004-2 M5, 4.891%, due 7/16/34 | | | 125 | | | | 136 | |
GNR 2006-67 GB, 4.588%, due 9/16/34, VRN | | | 1,540 | | | | 1,663 | |
#699118, 6.000%, due 9/15/38 | | | 6,702 | | | | 7,527 | |
| | | | | | | | |
Total GNMA Mortgage Obligations | | | | | | | 9,326 | |
| | | | | | | | | | |
Federal Home Loan Mortgage Corp.
(FHLMC)—9.0% | |
#G90024, 7.000%, due 1/20/13 | | | 22 | | | | 23 | |
#G30093, 7.000%, due 12/1/17 | | | 34 | | | | 38 | |
#G30255, 7.000%, due 7/1/21 | | | 73 | | | | 84 | |
#G12792, 4.500%, due 12/1/21 | | | 391 | | | | 418 | |
#D95897, 5.500%, due 3/1/23 | | | 205 | | | | 221 | |
#G30372, 5.000%, due 9/1/27 | | | 512 | | | | 551 | |
#G01728, 7.500%, due 7/1/32 | | | 290 | | | | 339 | |
#C01385, 6.500%, due 8/1/32 | | | 346 | | | | 392 | |
#G02141, 6.000%, due 3/1/36 | | | 1,714 | | | | 1,909 | |
#A62179, 6.000%, due 6/1/37 | | | 971 | | | | 1,082 | |
#A63539, 6.000%, due 7/1/37 | | | 1,175 | | | | 1,309 | |
#A62858, 6.500%, due 7/1/37 | | | 622 | | | | 702 | |
#G03170, 6.500%, due 8/1/37 | | | 1,654 | | | | 1,867 | |
#A66843, 6.500%, due 10/1/37 | | | 2,303 | | | | 2,620 | |
#A78138, 5.500%, due 6/1/38 | | | 1,264 | | | | 1,384 | |
#A81799, 6.500%, due 9/1/38 | | | 2,771 | | | | 3,153 | |
#C03665, 9.000%, due 4/1/41 | | | 1,916 | | | | 2,357 | |
| | | | | | | | |
Total FHLMC Mortgage Obligations | | | | 18,449 | |
| | | | | | | | | | |
Federal National Mortgage
Association (FNMA)—26.6% | |
#535559, 7.500%, due 9/1/12 | | | 31 | | | | 31 | |
#689612, 5.000%, due 5/1/18 | | | 360 | | | | 387 | |
#695910, 5.000%, due 5/1/18 | | | 744 | | | | 809 | |
#747903, 4.500%, due 6/1/19 | | | 330 | | | | 353 | |
#745735, 5.000%, due 3/1/21 | | | 801 | | | | 867 | |
#253847, 6.000%, due 5/1/21 | | | 215 | | | | 236 | |
#900725, 6.000%, due 8/1/21 | | | 184 | | | | 202 | |
#AD8164, 4.000%, due 8/1/25 | | | 1,267 | | | | 1,330 | |
#545437, 7.000%, due 2/1/32 | | | 181 | | | | 209 | |
#545759, 6.500%, due 7/1/32 | | | 1,927 | | | | 2,193 | |
#254548, 5.500%, due 12/1/32 | | | 761 | | | | 829 | |
#684601, 6.000%, due 3/1/33 | | | 1,946 | | | | 2,184 | |
#190340, 5.000%, due 9/1/33 | | | 1,627 | | | | 1,739 | |
#254868, 5.000%, due 9/1/33 | | | 806 | | | | 861 | |
#739243, 6.000%, due 9/1/33 | | | 1,814 | | | | 2,023 | |
| | | | | | | | | | | | |
Issuer | | NRSRO
Rating | | | Principal
Amount | | | Value | |
|
U.S. Government and U.S. Government Agency—(continued) | |
Federal National Mortgage Association (FNMA)—(continued) | |
#739331, 6.000%, due 9/1/33 | | | $ | 844 | | | $ | 941 | |
#555800, 5.500%, due 10/1/33 | | | | 341 | | | | 371 | |
#725027, 5.000%, due 11/1/33 | | | | 635 | | | | 678 | |
#555880, 5.500%, due 11/1/33 | | | | 410 | | | | 447 | |
#555946, 5.500%, due 11/1/33 | | | | 763 | | | | 837 | |
#756153, 5.500%, due 11/1/33 | | | | 2,126 | | | | 2,330 | |
#725231, 5.000%, due 2/1/34 | | | | 662 | | | | 708 | |
#725205, 5.000%, due 3/1/34 | | | | 1,417 | | | | 1,514 | |
#725220, 5.000%, due 3/1/34 | | | | 610 | | | | 652 | |
#725232, 5.000%, due 3/1/34 | | | | 3,049 | | | | 3,259 | |
#725238, 5.000%, due 3/1/34 | | | | 1,412 | | | | 1,509 | |
#763798, 5.500%, due 3/1/34 | | | | 445 | | | | 486 | |
#725424, 5.500%, due 4/1/34 | | | | 441 | | | | 480 | |
#725611, 5.500%, due 6/1/34 | | | | 433 | | | | 472 | |
#786546, 6.000%, due 7/1/34 | | | | 843 | | | | 935 | |
#787816, 6.000%, due 7/1/34 | | | | 875 | | | | 975 | |
#190353, 5.000%, due 8/1/34 | | | | 465 | | | | 497 | |
#357883, 5.000%, due 5/1/35 | | | | 994 | | | | 1,062 | |
#745092, 6.500%, due 7/1/35 | | | | 1,024 | | | | 1,165 | |
#357944, 6.000%, due 9/1/35 | | | | 113 | | | | 125 | |
#829306, 6.000%, due 9/1/35 | | | | 308 | | | | 341 | |
#843487, 6.000%, due 10/1/35 | | | | 260 | | | | 289 | |
#849191, 6.000%, due 1/1/36 | | | | 162 | | | | 180 | |
#848782, 6.500%, due 1/1/36 | | | | 732 | | | | 831 | |
#745349, 6.500%, due 2/1/36 | | | | 1,065 | | | | 1,213 | |
#895637, 6.500%, due 5/1/36 | | | | 448 | | | | 508 | |
#831540, 6.000%, due 6/1/36 | | | | 183 | | | | 203 | |
#745802, 6.000%, due 7/1/36 | | | | 603 | | | | 672 | |
#886220, 6.000%, due 7/1/36 | | | | 1,250 | | | | 1,393 | |
#893318, 6.500%, due 8/1/36 | | | | 228 | | | | 259 | |
#909480, 6.000%, due 2/1/37 | | | | 1,295 | | | | 1,436 | |
#928561, 6.000%, due 8/1/37 | | | | 726 | | | | 809 | |
#948689, 6.000%, due 8/1/37 | | | | 1,681 | | | | 1,857 | |
#888967, 6.000%, due 12/1/37 | | | | 1,651 | | | | 1,840 | |
#962058, 6.500%, due 3/1/38 | | | | 4,293 | | | | 4,907 | |
#934006, 6.500%, due 9/1/38 | | | | 1,512 | | | | 1,728 | |
#986856, 6.500%, due 9/1/38 | | | | 987 | | | | 1,120 | |
#991911, 7.000%, due 11/1/38 | | | | 724 | | | | 848 | |
| | | | | | | | | | | | |
Total FNMA Mortgage Obligations | | | | 54,130 | |
| | | | | | | | | | | | |
| |
Non-Agency Mortgage-Backed Obligations—0.3% | | | | | |
First Plus Home Loan Trust, 1997-4, Tranche M1, 7.640%, 9/11/23§** | | | D | | | | 199 | | | | 179 | |
First Horizon Asset Securities, Inc., 2004-AR4, Tranche 3A1, 3.815%, 8/25/34, VRN | | | AAA | | | | 432 | | | | 386 | |
| | | | | | | | | | | | |
Total Non-Agency Mortgage-Backed Obligations | | | | 565 | |
| | | | | | | | | | | | |
| |
Asset-Backed Securities—4.2% | | | | | |
Avis Budget Rental Car Funding AESOP LLC—144A, 2009-1A, Tranche A, 9.310%, 10/20/13 | | | Aa1 | | | | 2,000 | | | | 2,167 | |
Hertz Vehicle Financing LLC—144A, 2009-2A, Tranche A1, 4.260%, 3/25/14 | | | Aaa | | | | 2,230 | | | | 2,330 | |
Centre Point Funding LLC—144A, 2010-1A, Tranche 1, 5.430%, 7/20/16 | | | A2 | | | | 2,255 | | | | 2,395 | |
Sierra Receivables Funding Co. LLC—144A, 2011-1A, Tranche A, 3.350%, 4/20/26 | | | A | | | | 1,712 | | | | 1,717 | |
| | | | | | | | | | | | |
Total Asset-Backed Securities | | | | 8,609 | |
| | | | | | | | | | | | |
See accompanying Notes to Financial Statements.
34 Semi-Annual Report | June 30, 2011 |
Bond Fund
Portfolio of Investments, June 30, 2011 (all dollar amounts in thousands) (unaudited)
| | | | | | | | | | | | |
Issuer | | NRSRO
Rating | | | Principal
Amount | | | Value | |
| |
Corporate Obligations—45.5% | | | | | |
CME Group, Inc., 5.750%, due 2/15/14 | | | AA | | | $ | 700 | | | $ | 778 | |
Bank of America Corporation, 7.375%, due 5/15/14 | | | A | + | | | 700 | | | | 787 | |
American Express Co., 7.250%, due 5/20/14 | | | A | + | | | 500 | | | | 572 | |
AT&T, Inc., 5.100%, due 9/15/14 | | | A2 | | | | 1,250 | | | | 1,374 | |
D.R. Horton, Inc., 5.625%, due 9/15/14 | | | BB | | | | 1,500 | | | | 1,556 | |
Corporation Nacional del Cobre de Chile—144A, 4.750%, due 10/15/14 | | | A1 | | | | 1,350 | | | | 1,447 | |
The Kroger Co., 4.950%, due 1/15/15 | | | BBB | | | | 1,175 | | | | 1,291 | |
Yum! Brands, Inc., 4.250%, due 9/15/15 | | | BBB- | | | | 350 | | | | 372 | |
Yum! Brands, Inc., 6.250%, due 4/15/16 | | | BBB- | | | | 700 | | | | 803 | |
Owens-Brockway Glass Container, Inc., 7.375%, due 5/15/16 | | | BB | + | | | 1,250 | | | | 1,359 | |
Fiserv, Inc., 3.125%, due 6/15/16 | | | Baa2 | | | | 1,825 | | | | 1,815 | |
FUEL Trust—144A, 3.984%, due 6/15/16 | | | Baa2 | | | | 2,000 | | | | 1,984 | |
SABMiller plc—144A, 6.500%, due 7/1/16 | | | BBB | + | | | 700 | | | | 810 | |
Petrobras International Finance Co., 6.125%, due 10/6/16 | | | A3 | | | | 1,350 | | | | 1,503 | |
EI du Pont de Nemours & Co., 5.250%, due 12/15/16 | | | A | | | | 500 | | | | 565 | |
Comcast Corporation, 6.500%, due 1/15/17 | | | BBB | + | | | 350 | | | | 408 | |
Corrections Corporation of America, 7.750%, due 6/1/17 | | | Ba1 | | | | 1,250 | | | | 1,361 | |
ERP Operating L.P., 5.750%, due 6/15/17 | | | BBB | + | | | 2,000 | | | | 2,217 | |
JPMorgan Chase & Co., 6.125%, due 6/27/17 | | | A1 | | | | 600 | | | | 670 | |
Smithfield Foods, Inc., 7.750%, due 7/1/17 | | | B | + | | | 1,000 | | | | 1,037 | |
American Express Co., 6.150%, due 8/28/17 | | | A | + | | | 1,000 | | | | 1,140 | |
Capital One Financial Corporation, 6.750%, due 9/15/17 | | | A- | | | | 1,775 | | | | 2,052 | |
Exelon Generation Co. LLC, 6.200%, due 10/1/17 | | | A3 | | | | 1,100 | | | | 1,241 | |
Toll Brothers Finance Corporation, 8.910%, due 10/15/17 | | | BBB- | | | | 1,000 | | | | 1,172 | |
Motorola Solutions, Inc., 6.000%, due 11/15/17 | | | BBB | | | | 1,500 | | | | 1,707 | |
Triumph Group, Inc., 8.000%, due 11/15/17 | | | B | + | | | 1,500 | | | | 1,579 | |
Union Pacific Corporation, 5.750%, due 11/15/17 | | | BBB | + | | | 800 | | | | 919 | |
Wells Fargo & Co., 5.625%, due 12/11/17 | | | AA- | | | | 1,000 | | | | 1,105 | |
Kohl’s Corporation, 6.250%, due 12/15/17 | | | BBB | + | | | 350 | | | | 411 | |
American Tower Corporation, 4.500%, due 1/15/18 | | | Baa3 | | | | 1,150 | | | | 1,149 | |
Morgan Stanley, 6.625%, due 4/1/18 | | | A | | | | 2,000 | | | | 2,203 | |
General Electric Capital Corporation, 5.625%, due 5/1/18 | | | AA | + | | | 1,250 | | | | 1,367 | |
Philip Morris International, Inc., 5.650%, due 5/16/18 | | | A | | | | 1,000 | | | | 1,125 | |
Simon Property Group L.P., 6.125%, due 5/30/18 | | | A- | | | | 1,750 | | | | 1,962 | |
| | | | | | | | | | | | |
Issuer | | NRSRO
Rating | | | Principal
Amount | | | Value | |
| |
Corporate Obligations—(continued) | | | | | |
Time Warner Cable, Inc., 6.750%, due 7/1/18 | | | BBB | | | $ | 1,000 | | | $ | 1,160 | |
Petrohawk Energy Corporation, 7.250%, due 8/15/18 | | | B | + | | | 1,000 | | | | 1,026 | |
Merrill Lynch & Co., Inc., 6.875%, due 11/15/18 | | | A | + | | | 1,075 | | | | 1,179 | |
Anheuser-Busch InBev Worldwide, Inc., 7.750%, due 1/15/19 | | | A- | | | | 1,000 | | | | 1,258 | |
FedEx Corporation, 8.000%, due 1/15/19 | | | BBB | | | | 750 | | | | 943 | |
CSX Corporation, 7.375%, due 2/1/19 | | | BBB | | | | 800 | | | | 975 | |
Honeywell International, Inc., 5.000%, due 2/15/19 | | | A | | | | 1,000 | | | | 1,099 | |
Pfizer, Inc.,
6.200%, due 3/15/19 | | | AA | | | | 1,250 | | | | 1,462 | |
BHP Billiton Finance USA, Ltd.,
6.500%, due 4/1/19 | | | A | + | | | 1,300 | | | | 1,556 | |
Owens Corning,
9.000%, due 6/15/19 | | | BBB- | | | | 1,000 | | | | 1,194 | |
Discovery Communications LLC,
5.625%, due 8/15/19 | | | BBB | | | | 500 | | | | 553 | |
Roper Industries, Inc.,
6.250%, due 9/1/19 | | | Baa2 | | | | 1,225 | | | | 1,387 | |
Republic Services, Inc.,
5.500%, due 9/15/19 | | | BBB | | | | 1,650 | | | | 1,799 | |
Boston Properties L.P.,
5.875%, due 10/15/19 | | | A- | | | | 1,500 | | | | 1,643 | |
Crown Castle International Corporation,
7.125%, due 11/1/19 | | | BB- | | | | 1,000 | | | | 1,052 | |
Toll Brothers Finance Corporation, 6.750%, due 11/1/19 | | | BBB- | | | | 500 | | | | 517 | |
Ford Motor Credit Co. LLC,
8.125%, due 1/15/20 | | | Ba2 | | | | 1,515 | | | | 1,755 | |
Jarden Corporation,
7.500%, due 1/15/20 | | | B | | | | 1,500 | | | | 1,560 | |
Johnson Controls, Inc.,
5.000%, due 3/30/20 | | | BBB | + | | | 1,625 | | | | 1,727 | |
United Technologies Corporation, 4.500%, due 4/15/20 | | | A | + | | | 1,500 | | | | 1,588 | |
The Goldman Sachs Group, Inc.,
6.000%, due 6/15/20 | | | A1 | | | | 1,800 | | | | 1,937 | |
Commonwealth Edison Co.,
4.000%, due 8/1/20 | | | A- | | | | 1,000 | | | | 990 | |
Alcoa, Inc.,
6.150%, due 8/15/20 | | | BBB- | | | | 1,775 | | | | 1,880 | |
Omnicom Group, Inc.,
4.450%, due 8/15/20 | | | A- | | | | 2,000 | | | | 1,984 | |
The Goodyear Tire & Rubber Co., 8.250%, due 8/15/20 | | | B | + | | | 1,000 | | | | 1,080 | |
BE Aerospace, Inc.,
6.875%, due 10/1/20 | | | BB | | | | 1,000 | | | | 1,047 | |
Georgia-Pacific LLC—144A,
5.400%, due 11/1/20 | | | BBB | | | | 1,500 | | | | 1,529 | |
Progress Energy, Inc.,
4.400%, due 1/15/21 | | | BBB | | | | 1,625 | | | | 1,643 | |
Wyndham Worldwide Corporation, 5.625%, due 3/1/21 | | | BBB- | | | | 1,000 | | | | 997 | |
Ball Corporation,
5.750%, due 5/15/21 | | | BB | + | | | 1,000 | | | | 1,003 | |
Energizer Holdings, Inc.—144A,
4.700%, due 5/19/21 | | | BBB- | | | | 2,000 | | | | 1,975 | |
See accompanying Notes to Financial Statements.
June 30, 2011 | William Blair Funds 35 |
Bond Fund
Portfolio of Investments, June 30, 2011 (all dollar amounts in thousands) (unaudited)
| | | | | | | | | | | | |
Issuer | | NRSRO
Rating | | | Principal
Amount | | | Value | |
| | |
Corporate Obligations—(continued) | | | | | | | | | |
Discovery Communications LLC,
4.375%, due 6/15/21 | | | BBB | | | $ | 1,000 | | | $ | 990 | |
Southwest Airlines Co. 2007-1 Pass Through Trust, 6.150%, due 8/1/22 | | | A2 | | | | 649 | | | | 701 | |
The Kroger Co., 8.000%, due 9/15/29 | | | BBB | | | | 425 | | | | 533 | |
Conoco Funding Co., 7.250%, due 10/15/31 | | | A1 | | | | 400 | | | | 493 | |
Kohl’s Corporation, 6.000%, due 1/15/33 | | | BBB | + | | | 1,000 | | | | 1,034 | |
Wisconsin Electric Power Co., 5.700%, due 12/1/36 | | | A | + | | | 500 | | | | 530 | |
Comcast Corporation, 6.450%, due 3/15/37 | | | BBB | + | | | 650 | | | | 695 | |
Yum! Brands, Inc., 6.875%, due 11/15/37 | | | BBB- | | | | 600 | | | | 681 | |
JPMorgan Chase & Co., 6.400%, due 5/15/38 | | | Aa3 | | | | 900 | | | | 1,016 | |
COX Communications, Inc.—144A, 6.950%, due 6/1/38 | | | Baa2 | | | | 350 | | | | 394 | |
General Electric Capital Corporation, 6.875%, due 1/10/39 | | | AA | + | | | 750 | | | | 849 | |
NRSRO = Nationally Recognized Statistical Rating Organization—The credit quality ratings of the securities in the Fund reflect the highest category rating by either Fitch Ratings, Moody’s Investors Service Inc., or Standard & Poor’s, a division of the McGraw-Hill Companies, Inc.
The obligations of certain U. S. Government-sponsored securities are neither issued nor guaranteed by the U. S. Treasury.
VRN = Variable Rate Note
§ = Deemed illiquid pursuant to Liquidity Procedures approved by the Board of Trustees. This holding represents 0.09% of the net assets at June 30, 2011.
** = Fair valued pursuant to Valuation Procedures adopted by the Board of Trustees. This holding represents 0.09% of the Fund’s net assets at June 30, 2011.
| | | | | | | | | | | | |
Issuer | | NRSRO
Rating | | | Principal
Amount | | | Value | |
| | |
Corporate Obligations—(continued) | | | | | | | | | |
Burlington Northern Santa Fe LLC, 5.750%, due 5/1/40 | | | A3 | | | $ | 1,515 | | | $ | 1,561 | |
| | | | | | | | | | | | |
Total Corporate Obligations | | | | 92,816 | |
| | | | | | | | | | | | |
Total Long-Term Investments—99.0%
(cost $191,646) | | | | 201,707 | |
| | | | | | | | | | | | |
| | | |
Repurchase Agreement | | | | | | | | | | | | |
Fixed Income Clearing Corporation, 0.010% dated 6/30/11, due 7/1/11, repurchase price $2,256, collateralized by Federal National Mortgage Association, 3.420%, due 11/24/20 | | | AAA | | | | 2,256 | | | | 2,256 | |
| | | | | | | | | | | | |
Total Repurchase Agreement—1.1%
(cost $2,256) | | | | 2,256 | |
| | | | | | | | | | | | |
Total Investments—100.1%
(cost $193,902) | | | | 203,963 | |
Liabilities, plus cash and other assets—(0.1)% | | | | (155 | ) |
| | | | | | | | | | | | |
Net assets—100.0% | | | $ | 203,808 | |
| | | | | |
See accompanying Notes to Financial Statements.
36 Semi-Annual Report | June 30, 2011 |
Christopher T. Vincent
Paul J. Sularz
LOW DURATION FUND
The Low Duration Fund seeks to maximize total return. Total return includes both income and capital appreciation.
AN OVERVIEW FROM THE PORTFOLIO MANAGERS
The Low Duration Fund posted a 1.38% increase on a total return basis (Institutional Share Class) for the six months ended June 30, 2011. By comparison, the Fund’s benchmark, the Merrill Lynch 1-Year U.S. Treasury Note Index, gained 0.35%.
The Fund had a positive first half of 2011, with the Fund outperforming its Merrill Lynch 1-Year U.S. Treasury Note Index benchmark. We believe the Fund has been able to accomplish this objective without sacrificing credit quality. The Fund does not own securities with a rating below “A” from a Nationally Recognized Statistical Rating Organization (“NRSRO”).
The majority of the Fund’s portfolio is invested in seasoned U.S. Government-guaranteed short duration Mortgage-backed Fannie Mae and Freddie Mac securities. This is the Fund’s major sector emphasis. We favor such securities because they are high quality instruments, provide excellent liquidity, and pay monthly principal and interest, which we then are able to reinvest. The benefits of this strategy are evident in a rising rate environment such as the one we experienced during the first quarter.
Asset-backed Securities are another segment of the market in which we invest that offers monthly payment of principal and interest. We continued to invest in credit card securitizations issued by top-tier banking institutions. As mentioned, all Asset-backed Securities held in the Fund must maintain a rating above “A.”
Since the beginning of this year we have increased the Fund’s holdings of Asset-backed Securities whose coupons are reset monthly and are tied to LIBOR—the London Interbank Offered Rate. The income from these securities will rise with any increase in rates and will protect the Fund against falling prices. The percentage of these floating-rate securities in the Fund’s portfolio rose from approximately 15% at the beginning of 2011 to 17% at the end of June.
The Fund purchased TIPS (Treasury Inflation-Protected Securities) earlier this year. TIPS have been the strongest-performing investment grade security. We believe in holding TIPS instead of nominal Treasuries, as TIPS provide protection against unexpected inflation and diversification benefits.
The Fund kept its exposure to cash and cash equivalents extremely low, given the very low rates currently available from money market instruments.
Assets in this Fund continued to build since the Fund’s inception on December 1, 2009, with assets increasing to a new high “watermark” of approximately $155 million at the end of the first quarter.
June 30, 2011 | William Blair Funds 37 |
Low Duration Fund
Performance Highlights (unaudited)
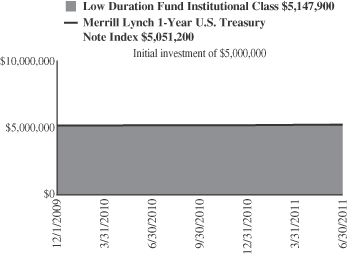
Average Annual Total Return at 6/30/2011
| | | | | | | | | | | | |
| | | Year
To Date | | | 1
Year | | | Since
Inception(a) | |
Institutional Class | | | 1.38 | % | | | 1.87 | % | | | 1.86 | % |
Merrill Lynch 1-Year U.S. Treasury Note Index | | | 0.35 | | | | 0.67 | | | | 0.65 | |
| | (a) | | For the period December 1, 2009 (Commencement of Operations to June 30, 2011. |
Performance cited represents past performance. Past performance does not guarantee future results and current performance may be lower or higher than the data quoted. Results shown are average annual total returns, which assume reinvestment of dividends and capital gains. Investment returns and principal will fluctuate and you may have a gain or loss when you sell shares. For the most current month-end performance information, please call 1-800-742-7272, or visit our Web site at www.williamblairfunds.com. From time to time, the investment advisor may waive fees or reimburse expenses for the Fund. Without these waivers, performance would be lower.
The performance highlights and graph presented above do not reflect the deduction of taxes that a shareholder would pay on fund distributions or the redemption of fund shares.
The Merrill Lynch 1-Year U.S. Treasury Note Index is comprised of a single U.S. Treasury Note issue purchased at the beginning of the month and held for a full month. Each month the index is rebalanced and the issue selected is the outstanding U.S. Treasury Note that matures closest to, but not beyond one year from the rebalancing date.
This report identifies the Fund’s investments on June 30, 2011. These holdings are subject to change. Not all investments in the Fund performed the same, nor is there any guarantee that these investments will perform as well in the future. Market forecasts provided in this report may not necessarily come to pass.
Sector Diversification (unaudited)
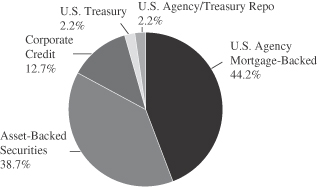
The sector diversification shown is based on the total investments.
38 Semi-Annual Report | June 30, 2011 |
Low Duration Fund
Portfolio of Investments, June 30, 2011 (all dollar amounts in thousands) (unaudited)
| | | | | | | | |
Issuer | | Principal
Amount | | | Value | |
|
U.S. Government and U.S. Government Agency—47.2% | |
U.S. Treasury Inflation Indexed Notes/Bonds—2.2% | | | | | |
U.S. Treasury Inflation Indexed Note, 2.000%, due 7/15/14 | | $ | 2,982 | | | $ | 3,252 | |
| | | | | | | | |
Government National Mortgage
Association (GNMA)—0.5% | |
#781567, 5.000%, due 2/15/18 | | | 118 | | | | 127 | |
#606406, 5.000%, due 4/15/18 | | | 183 | | | | 198 | |
#003438, 4.500%, due 9/20/18 | | | 293 | | | | 316 | |
#003465, 4.500%, due 11/20/18 | | | 87 | | | | 93 | |
| | | | | | | | |
Total GNMA Mortgage Obligations | | | | 734 | |
| | | | | | | | |
Federal Home Loan Mortgage Corp.
(FHLMC)—13.1% | | | | | |
#M80931, 5.500%, due 8/1/11 | | | 9 | | | | 9 | |
#M80953, 4.000%, due 12/1/11 | | | 221 | | | | 224 | |
#M80970, 4.500%, due 5/1/12 | | | 44 | | | | 44 | |
#B18053, 5.000%, due 3/1/15 | | | 80 | | | | 84 | |
#G11885, 5.000%, due 1/1/16 | | | 251 | | | | 269 | |
#E86134, 5.000%, due 11/1/16 | | | 231 | | | | 248 | |
#E96536, 5.000%, due 3/1/18 | | | 391 | | | | 423 | |
#E95355, 5.000%, due 4/1/18 | | | 492 | | | | 531 | |
#E01377, 4.500%, due 5/1/18 | | | 486 | | | | 517 | |
#G11618, 4.500%, due 5/1/18 | | | 2,288 | | | | 2,445 | |
#E01411, 5.000%, due 7/1/18 | | | 246 | | | | 264 | |
#E01424, 4.000%, due 8/1/18 | | | 6 | | | | 7 | |
#E99963, 4.500%, due 10/1/18 | | | 140 | | | | 150 | |
#E01488, 5.000%, due 10/1/18 | | | 524 | | | | 564 | |
#E99895, 5.000%, due 10/1/18 | | | 1,027 | | | | 1,110 | |
#G12093, 4.500%, due 12/1/18 | | | 630 | | | | 673 | |
#B11386, 5.000%, due 12/1/18 | | | 227 | | | | 246 | |
#B11362, 5.500%, due 12/1/18 | | | 33 | | | | 35 | |
#G13367, 5.500%, due 12/1/18 | | | 182 | | | | 198 | |
#E01545, 5.000%, due 1/1/19 | | | 300 | | | | 323 | |
#B12826, 4.500%, due 3/1/19 | | | 429 | | | | 459 | |
#G11766, 5.000%, due 3/1/19 | | | 214 | | | | 231 | |
#G18001, 4.500%, due 7/1/19 | | | 280 | | | | 299 | |
#G11596, 5.500%, due 8/1/19 | | | 240 | | | | 261 | |
#B16291, 5.000%, due 9/1/19 | | | 1,803 | | | | 1,949 | |
#G11690, 4.000%, due 2/1/20 | | | 41 | | | | 44 | |
#G18045, 5.000%, due 3/1/20 | | | 234 | | | | 253 | |
#G11892, 4.000%, due 4/1/20 | | | 248 | | | | 263 | |
#B19078, 5.000%, due 4/1/20 | | | 158 | | | | 171 | |
#G18048, 5.000%, due 4/1/20 | | | 158 | | | | 171 | |
#J08152, 5.000%, due 5/1/20 | | | 201 | | | | 217 | |
#G11720, 4.500%, due 8/1/20 | | | 51 | | | | 55 | |
#G12394, 5.000%, due 5/1/21 | | | 298 | | | | 322 | |
#G13296, 5.000%, due 5/1/21 | | | 794 | | | | 858 | |
#G12113, 5.500%, due 5/1/21 | | | 395 | | | | 431 | |
#G12286, 5.000%, due 7/1/21 | | | 164 | | | | 177 | |
#E02322, 5.500%, due 5/1/22 | | | 44 | | | | 49 | |
#J06484, 5.500%, due 11/1/22 | | | 927 | | | | 1,011 | |
#C00351, 8.000%, due 7/1/24 | | | 145 | | | | 172 | |
#G00363, 8.000%, due 6/1/25 | | | 175 | | | | 208 | |
#C80329, 8.000%, due 8/1/25 | | | 44 | | | | 52 | |
#J13022, 4.000%, due 9/1/25 | | | 2,936 | | | | 3,081 | |
| | | | | | | | |
Total FHLMC Mortgage Obligations | | | | 19,098 | |
| | | | | | | | |
| | | | | | | | |
Issuer | | Principal
Amount | | | Value | |
|
U.S. Government and U.S. Government Agency—(continued) | |
Federal National Mortgage Association
(FNMA)—31.4% | |
#255325, 4.500%, due 7/1/11 | | $ | 41 | | | $ | 41 | |
#256224, 5.500%, due 4/1/16 | | | 44 | | | | 48 | |
#256559, 5.500%, due 1/1/17 | | | 24 | | | | 25 | |
#256606, 5.500%, due 2/1/17 | | | 32 | | | | 34 | |
#256646, 5.500%, due 3/1/17 | | | 23 | | | | 26 | |
#545898, 5.500%, due 9/1/17 | | | 668 | | | | 726 | |
#545899, 5.500%, due 9/1/17 | | | 765 | | | | 831 | |
#257067, 5.000%, due 1/1/18 | | | 111 | | | | 117 | |
#663692, 5.000%, due 1/1/18 | | | 317 | | | | 343 | |
#674713, 5.000%, due 1/1/18 | | | 25 | | | | 27 | |
#679305, 5.000%, due 1/1/18 | | | 107 | | | | 116 | |
#254591, 5.500%, due 1/1/18 | | | 499 | | | | 540 | |
#677680, 4.500%, due 2/1/18 | | | 18 | | | | 19 | |
#681310, 4.500%, due 2/1/18 | | | 405 | | | | 434 | |
#683100, 5.500%, due 2/1/18 | | | 623 | | | | 681 | |
#254684, 5.000%, due 3/1/18 | | | 35 | | | | 38 | |
#675717, 5.000%, due 3/1/18 | | | 481 | | | | 520 | |
#681361, 5.000%, due 3/1/18 | | | 125 | | | | 135 | |
#656564, 5.000%, due 4/1/18 | | | 2,288 | | | | 2,473 | |
#696677, 5.000%, due 4/1/18 | | | 164 | | | | 178 | |
#702888, 5.000%, due 4/1/18 | | | 154 | | | | 167 | |
#929388, 4.500%, due 5/1/18 | | | 595 | | | | 634 | |
#254721, 5.000%, due 5/1/18 | | | 380 | | | | 410 | |
#702332, 5.000%, due 5/1/18 | | | 80 | | | | 87 | |
#704049, 5.500%, due 5/1/18 | | | 1,167 | | | | 1,279 | |
#735357, 5.500%, due 5/1/18 | | | 1,899 | | | | 2,079 | |
#254785, 4.000%, due 6/1/18 | | | 292 | | | | 309 | |
#555622, 4.500%, due 6/1/18 | | | 498 | | | | 533 | |
#656573, 5.000%, due 6/1/18 | | | 331 | | | | 358 | |
#709848, 5.000%, due 6/1/18 | | | 292 | | | | 316 | |
#713380, 4.000%, due 7/1/18 | | | 273 | | | | 289 | |
#254802, 4.500%, due 7/1/18 | | | 413 | | | | 442 | |
#713807, 4.500%, due 7/1/18 | | | 243 | | | | 260 | |
#735003, 5.500%, due 7/1/18 | | | 1,781 | | | | 1,949 | |
#254840, 4.000%, due 8/1/18 | | | 137 | | | | 145 | |
#711991, 5.000%, due 8/1/18 | | | 277 | | | | 299 | |
#254919, 4.000%, due 9/1/18 | | | 35 | | | | 37 | |
#740444, 4.500%, due 9/1/18 | | | 395 | | | | 422 | |
#734741, 4.000%, due 10/1/18 | | | 27 | | | | 29 | |
#743183, 5.000%, due 10/1/18 | | | 120 | | | | 130 | |
#255003, 4.000%, due 11/1/18 | | | 17 | | | | 18 | |
#747823, 4.000%, due 11/1/18 | | | 734 | | | | 777 | |
#749596, 5.000%, due 11/1/18 | | | 424 | | | | 458 | |
#745237, 5.000%, due 12/1/18 | | | 101 | | | | 109 | |
#725171, 4.000%, due 1/1/19 | | | 17 | | | | 18 | |
#255079, 5.000%, due 2/1/19 | | | 50 | | | | 54 | |
#766276, 5.000%, due 3/1/19 | | | 524 | | | | 566 | |
#MA0045, 4.000%, due 4/1/19 | | | 613 | | | | 648 | |
#255233, 4.000%, due 5/1/19 | | | 625 | | | | 661 | |
#725445, 4.500%, due 5/1/19 | | | 1,123 | | | | 1,202 | |
#785259, 5.000%, due 8/1/19 | | | 522 | | | | 565 | |
#725953, 5.000%, due 10/1/19 | | | 146 | | | | 159 | |
#745240, 4.500%, due 12/1/19 | | | 646 | | | | 691 | |
#735401, 5.500%, due 3/1/20 | | | 401 | | | | 436 | |
#735646, 4.500%, due 7/1/20 | | | 764 | | | | 817 | |
#745440, 4.500%, due 7/1/20 | | | 14 | | | | 14 | |
#825912, 4.000%, due 9/1/20 | | | 78 | | | | 82 | |
#MA0517, 4.000%, due 9/1/20 | | | 1,278 | | | | 1,352 | |
See accompanying Notes to Financial Statements.
June 30, 2011 | William Blair Funds 39 |
Low Duration Fund
Portfolio of Investments, June 30, 2011 (all dollar amounts in thousands) (unaudited)
| | | | | | | | | | | | |
Issuer | | NRSRO
Rating | | | Principal
Amount | | | Value | |
|
U.S. Government and U.S. Government Agency—(continued) | |
Federal National Mortgage Association (FNMA)—(continued) | |
#836016, 4.500%, due 9/1/20 | | | $ | 994 | | | $ | 1,063 | |
#MA0548, 3.500%, due 10/1/20 | | | | 2,311 | | | | 2,407 | |
#879607, 5.500%, due 4/1/21 | | | | 170 | | | | 186 | |
#881284, 4.500%, due 12/1/21 | | | | 1,434 | | | | 1,529 | |
#190988, 9.000%, due 6/1/24 | | | | 227 | | | | 268 | |
#AC9560, 5.000%, due 1/1/25 | | | | 4,815 | | | | 5,217 | |
#AD0855, 4.000%, due 3/1/25 | | | | 196 | | | | 206 | |
#932723, 4.000%, due 4/1/25 | | | | 881 | | | | 925 | |
#935995, 4.000%, due 6/1/25 | | | | 247 | | | | 259 | |
#AD4677, 4.000%, due 6/1/25 | | | | 1,997 | | | | 2,097 | |
#AD8164, 4.000%, due 8/1/25 | | | | 2,157 | | | | 2,265 | |
#AE1176, 4.000%, due 8/1/25 | | | | 1,066 | | | | 1,120 | |
#AH2671, 4.000%, due 1/1/26 | | | | 2,025 | | | | 2,127 | |
| | | | | |
Total FNMA Mortgage Obligations | | | | 45,822 | |
| | | | | | | | |
| |
Asset-Backed Securities—39.4% | | | | | |
Volkswagen Auto Lease Trust, 2009-A, Tranche A3, 3.410%, 4/16/12 | | | AAA | | | | 342 | | | | 343 | |
Ford Credit Auto Owner Trust, 2007-B, Tranche A4A, 5.240%, 7/15/12 | | | AAA | | | | 226 | | | | 228 | |
Daimler Chrysler Auto Trust, 2008-B, Tranche A3A, 4.710%, 9/10/12 | | | AAA | | | | 31 | | | | 31 | |
BMW Vehicle Lease Trust, 2010-1, Tranche A2, 0.580%, 9/17/12 | | | Aaa | | | | 428 | | | | 428 | |
BMW Vehicle Owner Trust, 2010-A, Tranche A2, 0.680%, 9/25/12 | | | AAA | | | | 406 | | | | 406 | |
Capital Auto Receivables Asset Trust, 2008-2, Tranche A3B, 1.637%, 10/15/12, VRN | | | AAA | | | | 200 | | | | 200 | |
Ford Credit Auto Owner Trust, 2010-B, Tranche A2, 0.650%, 12/15/12 | | | Aaa | | | | 736 | | | | 736 | |
Chrysler Financial Auto Securitization Trust, 2010-A, Tranche A2, 0.690%, 1/8/13 | | | AAA | | | | 878 | | | | 879 | |
Honda Auto Receivables Owner Trust, 2009-2, Tranche A3, 2.790%, 1/15/13 | | | AAA | | | | 398 | | | | 401 | |
CarMax Auto Owner Trust, 2009-1, Tranche A3, 4.120%, 3/15/13 | | | AAA | | | | 197 | | | | 199 | |
Nissan Auto Lease Trust, 2010-A, Tranche A2, 1.100%, 3/15/13 | | | AAA | | | | 345 | | | | 345 | |
Ford Credit Auto Owner Trust, 2009-A, Tranche A3A, 3.960%, 5/15/13 | | | AAA | | | | 215 | | | | 217 | |
Ford Credit Auto Owner Trust, 2009-A, Tranche A3B, 2.687%, 5/15/13, VRN | | | AAA | | | | 538 | | | | 541 | |
Harley-Davidson Motorcycle Trust, 2007-1, Tranche A4, 5.210%, 6/17/13 | | | AAA | | | | 383 | | | | 387 | |
USAA Auto Owner Trust, 2009-1, Tranche A3, 3.020%, 6/17/13 | | | AAA | | | | 392 | | | | 395 | |
American Express Issuance Trust, 2007-2, Tranche A, 0.437%, 7/15/13, VRN | | | AAA | | | | 373 | | | | 373 | |
Ally Auto Receivables Trust, 2010-3, Tranche A2, 0.287%, 8/15/13, VRN | | | AAA | | | | 726 | | | | 726 | |
BMW Vehicle Lease Trust, 2009-1, Tranche A4, 3.660%, 8/15/13 | | | AAA | | | | 500 | | | | 502 | |
| | | | | | | | | | | | |
Issuer | | NRSRO
Rating | | | Principal
Amount | | | Value | |
| | |
Asset-Backed Securities—(continued) | | | | | | | | | |
Ford Credit Auto Owner Trust, 2009-B, Tranche A3, 2.790%, 8/15/13 | | | AAA | | | $ | 308 | | | $ | 311 | |
Ford Credit Auto Owner Trust, 2009-D, Tranche A3, 2.170%, 10/15/13 | | | AAA | | | | 791 | | | | 798 | |
John Deere Owner Trust, 2009-A, Tranche A3, 2.590%, 10/15/13 | | | AAA | | | | 712 | | | | 716 | |
John Deere Owner Trust, 2009-B, Tranche A3, 1.570%, 10/15/13 | | | AAA | | | | 540 | | | | 542 | |
Avis Budget Rental Car Funding AESOP LLC—144A, 2009-1A, Tranche A, 9.310%, 10/20/13 | | | Aa1 | | | | 2,000 | | | | 2,166 | |
Harley-Davidson Motorcycle Trust, 2009-1, Tranche A3, 3.190%, 11/15/13 | | | AAA | | | | 1,272 | | | | 1,282 | |
CNH Equipment Trust, 2009-C, Tranche A3, 1.850%, 12/16/13 | | | AAA | | | | 222 | | | | 222 | |
Volkswagen Auto Loan Enhanced Trust, 2010-1, Tranche A3, 1.310%, 1/20/14 | | | AAA | | | | 864 | | | | 868 | |
USAA Auto Owner Trust, 2008-3, Tranche A4, 4.710%, 2/18/14 | | | AAA | | | | 45 | | | | 45 | |
Harley-Davidson Motorcycle Trust, 2009-2, Tranche A3, 2.620%, 3/15/14 | | | AAA | | | | 496 | | | | 500 | |
Citibank Credit Card Issuance Trust, 2009-A1, Tranche A1, 1.937%, 3/17/14, VRN | | | AAA | | | | 200 | | | | 202 | |
Volkswagen Auto Lease Trust, 2009-A, Tranche A4, 4.590%, 3/17/14 | | | AAA | | | | 2,000 | | | | 2,013 | |
Hertz Vehicle Financing LLC—144A, 2009-2A, Tranche A1, 4.260%, 3/25/14 | | | Aaa | | | | 1,765 | | | | 1,844 | |
BMW Vehicle Owner Trust, 2010-A, Tranche A3, 1.390%, 4/25/14 | | | AAA | | | | 300 | | | | 302 | |
Citibank Credit Card Issuance Trust, 2009-A2, Tranche A2, 1.737%, 5/15/14, VRN | | | AAA | | | | 500 | | | | 506 | |
Ford Credit Auto Owner Trust, 2010-A, Tranche A3, 1.320%, 6/15/14 | | | AAA | | | | 500 | | | | 503 | |
Chase Issuance Trust, 2007-A9, Tranche A, 3.151%, 6/16/14, VRN | | | AAA | | | | 2,000 | | | | 1,999 | |
Nissan Auto Receivables Owner Trust, 2008-A, Tranche A4, 4.280%, 6/16/14 | | | AAA | | | | 71 | | | | 72 | |
Capital Auto Receivables Asset Trust, 2008-1, Tranche A4B, 1.537%, 7/15/14, VRN | | | AAA | | | | 605 | | | | 608 | |
CNH Equipment Trust, 2010-A, Tranche A3, 1.540%, 7/15/14 | | | AAA | | | | 837 | | | | 841 | |
Nissan Auto Receivables Owner Trust, 2010-A, Tranche A3, 0.870%, 7/15/14 | | | Aaa | | | | 500 | | | | 500 | |
Daimler Chrysler Auto Trust, 2008-A, Tranche A4, 4.480%, 8/8/14 | | | AAA | | | | 1,495 | | | | 1,513 | |
American Express Credit Account Master Trust, 2009-1, Tranche A, 1.537%, 12/15/14, VRN | | | AAA | | | | 450 | | | | 455 | |
Nissan Master Owner Trust Receivables—144A, 2010-AA, Tranche A, 1.337%, 1/15/15, VRN | | | AAA | | | | 2,000 | | | | 2,022 | |
See accompanying Notes to Financial Statements.
40 Semi-Annual Report | June 30, 2011 |
Low Duration Fund
Portfolio of Investments, June 30, 2011 (all dollar amounts in thousands) (unaudited)
| | | | | | | | | | | | |
Issuer | | NRSRO
Rating | | | Principal
Amount | | | Value | |
| |
Asset-Backed Securities—(continued) | | | | | |
Capital One Multi-Asset Execution Trust, 2007-A4, Tranche A4, 0.217%, 3/16/15, VRN | | | AAA | | | $ | 1,778 | | | $ | 1,776 | |
CNH Equipment Trust, 2010-C, Tranche A3, 1.170%, 5/15/15 | | | AAA | | | | 500 | | | | 502 | |
Discover Card Master Trust, 2007-A2, Tranche A2, 0.587%, 6/15/15, VRN | | | AAA | | | | 192 | | | | 193 | |
MBNA Credit Card Master Note Trust, 2006-A2, Tranche A2, 0.247%, 6/15/15, VRN | | | AAA | | | | 200 | | | | 200 | |
Discover Card Master Trust I, 2005-4, Tranche A2, 0.277%, 6/16/15, VRN | | | AAA | | | | 77 | | | | 77 | |
FPL Recovery Funding LLC, 2007-A, Tranche A2, 5.044%, 8/1/15 | | | AAA | | | | 852 | | | | 893 | |
Chase Issuance Trust, 2008-A10, Tranche A10, 0.937%, 8/17/15, VRN | | | AAA | | | | 2,000 | | | | 2,026 | |
Bank of America Credit Card Trust, 2010-A1, Tranche A1, 0.487%, 9/15/15, VRN | | | AAA | | | | 2,000 | | | | 2,005 | |
Discover Card Master Trust, 2010-A1, Tranche A1, 0.837%, 9/15/15, VRN | | | Aaa | | | | 347 | | | | 350 | |
Ford Credit Floorplan Master Owner Trust, 2010-A5, Tranche A2, 0.887%, 9/15/15, VRN | | | AAA | | | | 1,800 | | | | 1,806 | |
USAA Auto Owner Trust, 2010-1, Tranche A4, 2.140%, 9/15/15 | | | AAA | | | | 685 | | | | 700 | |
American Express Credit Account Master Trust, 2010-1, Tranche A, 0.437%, 11/16/15, VRN | | | AAA | | | | 500 | | | | 501 | |
Ford Credit Floorplan Master Owner Trust, 2011-1, Tranche A2, 0.787%, 2/15/16, VRN | | | AAA | | | | 1,000 | | | | 996 | |
Chase Issuance Trust, 2008-A3, Tranche A, 1.287%, 3/15/16, VRN | | | AAA | | | | 2,000 | | | | 2,051 | |
Hertz Vehicle Financing LLC—144A, 2009-2A, Tranche A2, 5.290%, 3/25/16 | | | Aaa | | | | 2,250 | | | | 2,467 | |
Ally Master Owner Trust, 2011-3, Tranche A1, 0.817%, 5/15/16, VRN | | | Aaa | | | | 1,100 | | | | 1,100 | |
CNH Equipment Trust, 2010-C, Tranche A4, 1.750%, 5/16/16 | | | AAA | | | | 60 | | | | 60 | |
Avis Budget Rental Car Funding AESOP LLC—144A, 2010-3A, Tranche A, 4.640%, 5/20/16 | | | Aaa | | | | 1,400 | | | | 1,506 | |
Centre Point Funding LLC—144A, 2010-1A, Tranche 1, 5.430%, 7/20/16 | | | A2 | | | | 1,721 | | | | 1,828 | |
Discover Card Master Trust, 2011-A1, Tranche A1, 0.537%, 8/15/16, VRN | | | Aaa | | | | 1,400 | | | | 1,405 | |
Enterprise Fleet Financing LLC—144A, 2011-2, Tranche A2, 1.430%, 10/20/16 | | | AAA | | | | 2,000 | | | | 2,000 | |
GE Capital Credit Card Master Note Trust, 2011-1, Tranche A, 0.737%, 1/15/17, VRN | | | Aaa | | | | 500 | | | | 503 | |
Discover Card Master Trust, 2010-A2, Tranche A2, 0.767%, 3/15/18, VRN | | | AAA | | | | 350 | | | | 353 | |
Citibank Omni Master Trust—144A, 2009-A14A, Tranche A14, 2.937%, 8/15/18, VRN | | | Aaa | | | | 2,000 | | | | 2,103 | |
| | | | | | | | | | | | |
Issuer | | NRSRO
Rating | | | Principal
Amount | | | Value | |
| |
Asset-Backed Securities—(continued) | | | | | |
Capital One Multi-Asset Execution Trust, 2007-A2, Tranche A2, 0.267%, 12/16/19, VRN | | | AAA | | | $ | 215 | | | $ | 212 | |
MBNA Credit Card Master Note Trust, 2004-A3, Tranche A3, 0.447%, 8/16/21, VRN | | | AAA | | | | 300 | | | | 298 | |
Sierra Receivables Funding Co. LLC—144A, 2011-1A, Tranche A, 3.350%, 4/20/26 | | | A | | | | 1,498 | | | | 1,502 | |
| | | | | | | | | | | | |
Total Asset-Backed Securities | | | | 57,580 | |
| | | | | | | | | | | | |
| | |
Corporate Obligations—12.9% | | | | | | | | | |
American Express Bank FSB, 0.316%, due 5/29/12, VRN | | | A | + | | | 500 | | | | 499 | |
General Electric Capital Corporation, 3.500%, due 8/13/12 | | | AA | + | | | 1,000 | | | | 1,030 | |
Bank of America Corporation, 5.375%, due 9/11/12 | | | A | + | | | 1,000 | | | | 1,048 | |
ConocoPhillips, 4.750%, due 10/15/12 | | | A1 | | | | 1,000 | | | | 1,052 | |
Citigroup, Inc., 5.300%, due 10/17/12 | | | A | + | | | 1,000 | | | | 1,050 | |
Wells Fargo & Co., 5.250%, due 10/23/12 | | | AA- | | | | 1,000 | | | | 1,055 | |
The Procter & Gamble Co., 0.301%, due 11/14/12, VRN | | | AA- | | | | 700 | | | | 701 | |
The Walt Disney Co., 4.700%, due 12/1/12 | | | A | | | | 1,000 | | | | 1,056 | |
Hewlett-Packard Co., 4.500%, due 3/1/13 | | | A | + | | | 1,000 | | | | 1,059 | |
General Electric Capital Corporation, 0.418%, due 5/8/13, VRN | | | AA | + | | | 1,000 | | | | 996 | |
American Express Co., 4.875%, due 7/15/13 | | | A | + | | | 1,000 | | | | 1,063 | |
Barclays Bank plc, 1.323%, due 1/13/14, VRN | | | AA- | | | | 500 | | | | 502 | |
JPMorgan Chase & Co., 1.074%, due 1/24/14, VRN | | | Aa3 | | | | 1,000 | | | | 1,003 | |
Morgan Stanley, 1.874%, due 1/24/14, VRN | | | A | | | | 1,000 | | | | 1,007 | |
Bank of America Corporation, 1.693%, due 1/30/14, VRN | | | A | + | | | 1,000 | | | | 1,002 | |
MetLife, Inc.,
2.375%, due 2/6/14 | | | A- | | | | 1,000 | | | | 1,019 | |
The Boeing Co.,
5.000%, due 3/15/14 | | | A | | | | 375 | | | | 412 | |
Shell International Finance BV,
4.000%, due 3/21/14 | | | Aa1 | | | | 1,142 | | | | 1,229 | |
Citigroup, Inc.,
1.176%, due 4/1/14, VRN | | | A | | | | 1,000 | | | | 986 | |
Morgan Stanley,
6.000%, due 5/13/14 | | | A | | | | 1,000 | | | | 1,089 | |
| | | | | | | | | | | | |
Total Corporate Obligations | | | | 18,858 | |
| | | | | | | | | | | | |
Total Long-Term Investments—99.5%
(cost $144,761) | | | | 145,344 | |
| | | | | | | | | | | | |
See accompanying Notes to Financial Statements.
June 30, 2011 | William Blair Funds 41 |
Low Duration Fund
Portfolio of Investments, June 30, 2011 (all dollar amounts in thousands) (unaudited)
| | | | | | | | | | | | |
Issuer | | NRSRO
Rating | | | Principal
Amount | | | Value | |
| | | |
Repurchase Agreement | | | | | | | | | | | | |
State Street Bank and Trust Company, 0.010% dated 6/30/11, due 7/1/11, repurchase price $3,243, collateralized by U.S. Treasury Bill, 0.020%, due 8/11/11 | | | AAA | | | $ | 3,243 | | | $ | 3,243 | |
| | | | | | | | | | | | |
Total Repurchase Agreement—2.2%
(cost $3,243) | | | | 3,243 | |
| | | | | | | | | | | | |
Total Investments—101.7%
(cost $148,004) | | | | 148,587 | |
Liabilities, plus cash and other assets—(1.7)% | | | | (2,552 | ) |
| | | | | | | | | | | | |
Net assets—100.0% | | | $ | 146,035 | |
| | | | | | | | | | | | |
NRSRO = Nationally Recognized Statistical Rating Organization—The credit quality ratings of the securities in the Fund reflect the highest category rating by either Fitch Ratings, Moody’s Investors Service Inc., or Standard & Poor’s, a division of the McGraw-Hill Companies, Inc.
The obligations of certain U. S. Government-sponsored securities are neither issued nor guaranteed by the U. S. Treasury.
VRN = Variable Rate Note
See accompanying Notes to Financial Statements.
42 Semi-Annual Report | June 30, 2011 |
Statements of Assets and Liabilities
June 30, 2011 (dollar amounts in thousands)
| | | | | | | | | | | | |
| | | Institutional
International
Growth
Fund | | | Institutional
International
Equity
Fund | | | International
Small Cap
Growth
Fund | |
Assets | | | | | | | | | | | | |
Investments in securities, at cost | | $ | 1,441,349 | | | $ | 210,947 | | | $ | 640,773 | |
| | | |
Investments in securities, at value | | $ | 1,698,555 | | | $ | 263,216 | | | $ | 757,903 | |
Foreign currency, at value (cost $7,494; $485; $5,547) | | | 7,512 | | | | 486 | | | | 5,572 | |
Receivable for securities sold | | | 24,569 | | | | 10,225 | | | | 7,313 | |
Receivable for fund shares sold | | | 68,491 | | | | — | | | | 2,434 | |
Dividend and interest receivable | | | 4,392 | | | | 592 | | | | 1,350 | |
Unrealized appreciation on
forward foreign currency contracts | | | 2,148 | | | | — | | | | — | |
| | | | | | | | | | | | |
Total assets | | | 1,805,667 | | | | 274,519 | | | | 774,572 | |
Liabilities | | | | | | | | | | | | |
Payable for investment securities purchased | | | 55,047 | | | | 5,983 | | | | 4,890 | |
Payable for fund shares redeemed | | | 525 | | | | 7,699 | | | | 231 | |
Unrealized depreciation on
forward foreign currency contracts | | | 714 | | | | 22 | | | | 30 | |
Investment advisory fee payable | | | 1,278 | | | | 228 | | | | 610 | |
Distribution and shareholder service fee payable | | | — | | | | — | | | | 60 | |
Other payables and accrued expenses | | | 275 | | | | 62 | | | | 152 | |
| | | | | | | | | | | | |
Total liabilities | | | 57,839 | | | | 13,994 | | | | 5,973 | |
| | | | | | | | | | | | |
Net Assets | | $ | 1,747,828 | | | $ | 260,525 | | | $ | 768,599 | |
| | | | | | | | | | | | |
Capital | | | | | | | | | | | | |
Composition of Net Assets | | | | | | | | | | | | |
Par value of shares of beneficial interest | | $ | 119 | | | $ | 23 | | | $ | 55 | |
Capital paid in excess of par value | | | 1,647,067 | | | | 341,554 | | | | 709,028 | |
Accumulated net investment income (loss) | | | 14,619 | | | | 2,700 | | | | 4,319 | |
Accumulated net realized gain (loss) | | | (172,619 | ) | | | (136,002 | ) | | | (61,930 | ) |
Net unrealized appreciation (depreciation) of
investments and foreign currencies | | | 258,642 | | | | 52,250 | | | | 117,127 | |
| | | | | | | | | | | | |
Net Assets | | $ | 1,747,828 | | | $ | 260,525 | | | $ | 768,599 | |
| | | | | | | | | | | | |
| | | |
Net Assets | | $ | 1,747,828 | | | $ | 260,525 | | | | | |
Shares Outstanding | | | 119,079,011 | | | | 23,329,016 | | | | | |
Net Asset Value Per Share | | | 14.68 | | | | 11.17 | | | | | |
Institutional Share Class | | | | | | | | | | | | |
Net Assets | | | | | | | | | | $ | 305,052 | |
Shares Outstanding | | | | | | | | | | | 21,774,191 | |
Net Asset Value Per Share | | | | | | | | | | $ | 14.01 | |
See accompanying Notes to Financial Statements.
June 30, 2011 | William Blair Funds 43 |
Statements of Operations
for the Period Ended June 30, 2011 (dollar amounts in thousands)
| | | | | | | | | | | | |
| | | Institutional
International
Growth
Fund | | | Institutional
International
Equity
Fund | | | International
Small Cap
Growth
Fund | |
Investment income | | | | | | | | | | | | |
Dividends | | $ | 30,847 | | | $ | 5,044 | | | $ | 9,805 | |
Less foreign tax withheld | | | (2,603 | ) | | | (423 | ) | | | (816 | ) |
Interest | | | 94 | | | | 1 | | | | 90 | |
| | | | | | | | | | | | |
Total income | | | 28,338 | | | | 4,622 | | | | 9,079 | |
Expenses | | | | | | | | | | | | |
Investment advisory fees | | | 8,438 | | | | 1,449 | | | | 3,524 | |
Distribution fees | | | — | | | | — | | | | 28 | |
Shareholder services fees | | | — | | | | — | | | | 313 | |
Custodian fees | | | 168 | | | | 54 | | | | 93 | |
Transfer agent fees | | | 16 | | | | 4 | | | | 15 | |
Sub-transfer agent fees | | | | | | | | | | | | |
Class N | | | — | | | | — | | | | 17 | |
Class I | | | — | | | | — | | | | 57 | |
Professional fees | | | 58 | | | | 31 | | | | 33 | |
Registration fees | | | 19 | | | | 9 | | | | 48 | |
Shareholder reporting fees | | | 16 | | | | 2 | | | | 24 | |
Trustee fees | | | 30 | | | | 6 | | | | 9 | |
Other expenses | | | 40 | | | | 10 | | | | 13 | |
| | | | | | | | | | | | |
Total expenses | | | 8,785 | | | | 1,565 | | | | 4,174 | |
| | | | | | | | | | | | |
Net investment income (loss) | | | 19,553 | | | | 3,057 | | | | 4,905 | |
Realized and unrealized gain (loss) | | | | | | | | | | | | |
Net realized gain (loss) on transactions from: | | | | | | | | | | | | |
Investments | | | 120,027 | | | | 24,379 | | | | 51,734 | |
Foreign currency transactions | | | (14,581 | ) | | | (344 | ) | | | 1,996 | |
| | | | | | | | | | | | |
Total net realized gain (loss) | | | 105,446 | | | | 24,035 | | | | 53,730 | |
Change in net unrealized appreciation (depreciation) of: | | | | | | | | | | | | |
Investments | | | (87,341 | ) | | | (17,517 | ) | | | (18,159 | ) |
Foreign currency translations | | | 1,401 | | | | 88 | | | | (61 | ) |
| | | | | | | | | | | | |
Total change in net unrealized appreciation (depreciation) | | | (85,940 | ) | | | (17,429 | ) | | | (18,220 | ) |
| | | | | | | | | | | | |
Net increase (decrease) in net assets resulting from operations | | $ | 39,059 | | | $ | 9,663 | | | $ | 40,415 | |
| | | | | | | | | | | | |
See accompanying Notes to Financial Statements.
44 Semi-Annual Report | June 30, 2011 |
Statements of Changes in Net Assets
for the Period Ended June 30, 2011 and the Year Ended December 31, 2010 (dollar amounts in thousands)
| | | | | | | | | | | | | | | | | | | | | | | | |
| | | Institutional
International
Growth
Fund | | | Institutional
International
Equity
Fund | | | International
Small Cap
Growth
Fund | |
| | | 2011 | | | 2010 | | | 2011 | | | 2010 | | | 2011 | | | 2010 | |
Operations | | | | | | | | | | | | | | | | | | | | | | | | |
Net investment income (loss) | | $ | 19,553 | | | $ | 17,077 | | | $ | 3,057 | | | $ | 3,226 | | | $ | 4,905 | | | $ | 3,235 | |
Net realized gain (loss) on investments and foreign currency transactions | | | 105,446 | | | | 220,735 | | | | 24,035 | | | | 44,790 | | | | 53,730 | | | | 57,094 | |
Change in net unrealized appreciation (depreciation) on investments and foreign currency transactions | | | (85,940 | ) | | | 68,599 | | | | (17,429 | ) | | | (14,220 | ) | | | (18,220 | ) | | | 62,315 | |
| | | | | | | | | | | | | | | | | | | | | | | | |
Net increase (decrease) in net assets resulting from operations | | | 39,059 | | | | 306,411 | | | | 9,663 | | | | 33,796 | | | | 40,415 | | | | 122,644 | |
Distributions to shareholders from | | | | | | | | | | | | | | | | | | | | | | | | |
Net investment income | | | — | | | | (35,383 | ) | | | — | | | | (4,059 | ) | | | — | | | | (2,781 | ) |
Net realized gain | | | — | | | | — | | | | — | | | | — | | | | — | | | | — | |
| | | | | | | | | | | | | | | | | | | | | | | | |
| | | — | | | | (35,383 | ) | | | — | | | | (4,059 | ) | | | — | | | | (2,781 | ) |
Capital stock transactions | | | | | | | | | | | | | | | | | | | | | | | | |
Net proceeds from sale of shares | | | 182,240 | | | | 585,127 | | | | 10,029 | | | | 31,823 | | | | 136,913 | | | | 222,392 | |
Shares issued in reinvestment of income dividends and capital gain distributions | | | — | | | | 33,238 | | | | — | | | | 3,868 | | | | — | | | | 2,417 | |
Less cost of shares redeemed | | | (359,688 | ) | | | (379,024 | ) | | | (50,635 | ) | | | (139,231 | ) | | | (55,680 | ) | | | (88,572 | ) |
| | | | | | | | | | | | | | | | | | | | | | | | |
Net increase (decrease) in net assets resulting from capital share transactions | | | (177,448 | ) | | | 239,341 | | | | (40,606 | ) | | | (103,540 | ) | | | 81,233 | | | | 136,237 | |
| | | | | | | | | | | | | | | | | | | | | | | | |
Increase (decrease) in net assets | | | (138,389 | ) | | | 510,369 | | | | (30,943 | ) | | | (73,803 | ) | | | 121,648 | | | | 256,100 | |
Net assets | | | | | | | | | | | | | | | | | | | | | | | | |
Beginning of period | | $ | 1,886,217 | | | $ | 1,375,848 | | | $ | 291,468 | | | $ | 365,271 | | | $ | 646,951 | | | $ | 390,851 | |
| | | | | | | | | | | | | | | | | | | | | | | | |
End of period | | $ | 1,747,828 | | | $ | 1,886,217 | | | $ | 260,525 | | | $ | 291,468 | | | $ | 768,599 | | | $ | 646,951 | |
| | | | | | | | | | | | | | | | | | | | | | | | |
Accumulated net investment income (loss) at the end of the period | | $ | 14,619 | | | $ | (4,934 | ) | | $ | 2,700 | | | $ | (357 | ) | | $ | 4,319 | | | $ | (586 | ) |
| | | | | | | | | | | | | | | | | | | | | | | | |
See accompanying Notes to Financial Statements.
June 30, 2011 | William Blair Funds 45 |
Statements of Assets and Liabilities
June 30, 2011 (dollar amounts in thousands)
| | | | | | | | | | | | | | | | |
| | | Emerging
Markets
Growth
Fund | | | Emerging
Leaders
Fund | | | Bond
Fund | | | Low
Duration
Fund | |
Assets | | | | | | | | | | | | | | | | |
Investments in securities, at cost | | $ | 746,542 | | | $ | 88,893 | | | $ | 193,902 | | | $ | 148,004 | |
| | | | |
Investments in securities, at value | | $ | 869,140 | | | $ | 98,436 | | | $ | 203,963 | | | $ | 148,587 | |
Foreign currency, at value (cost $4,854 and $2,617) | | | 4,854 | | | | 2,629 | | | | — | | | | 1,061 | |
Receivable for securities sold . | | | 16,083 | | | | 2,138 | | | | 252 | | | | — | |
Receivable for fund shares sold | | | 101 | | | | 99 | | | | 1,071 | | | | 5 | |
Receivable from Advisor . | | | — | | | | 11 | | | | 12 | | | | — | |
Dividend and interest receivable . | | | 2,645 | | | | 286 | | | | 1,862 | | | | 486 | |
Unrealized appreciation on forward foreign currency contracts | | | — | | | | — | | | | — | | | | — | |
| | | | | | | | | | | | | | | | |
Total assets | | | 892,823 | | | | 103,599 | | | | 207,160 | | | | 150,139 | |
Liabilities | | | | | | | | | | | | | | | | |
Payable for investment securities purchased | | | 9,754 | | | | 2,937 | | | | 2,167 | | | | 3,209 | |
Payable for fund shares redeemed | | | 1,015 | | | | 112 | | | | 1,044 | | | | 798 | |
Payable to custodian | | | 1,102 | | | | — | | | | — | | | | — | |
Investment advisory fee payable | | | 963 | | | | 86 | | | | 50 | | | | 36 | |
Distribution and shareholder service fee payable | | | 32 | | | | 4 | | | | 19 | | | | 10 | |
Other payables and accrued expenses | | | 368 | | | | 58 | | | | 72 | | | | 51 | |
| | | | | | | | | | | | | | | | |
Total liabilities | | | 13,234 | | | | 3,197 | | | | 3,352 | | | | 4,104 | |
| | | | | | | | | | | | | | | | |
Net Assets | | $ | 879,589 | | | $ | 100,402 | | | $ | 203,808 | | | $ | 146,035 | |
| | | | | | | | | | | | | | | | |
Capital | | | | | | | | | | | | | | | | |
Composition of Net Assets | | | | | | | | | | | | | | | | |
Par value of shares of beneficial interest | | $ | 56 | | | $ | 10 | | | $ | 19 | | | $ | 15 | |
Capital paid in excess of par value | | | 644,901 | | | | 84,117 | | | | 192,598 | | | | 147,214 | |
Accumulated net investment income (loss) | | | (5,429 | ) | | | 336 | | | | (388 | ) | | | (710 | ) |
Accumulated net realized gain (loss) | | | 117,446 | | | | 6,390 | | | | 1,518 | | | | (1,067 | ) |
Net unrealized appreciation (depreciation) of investments and foreign currencies | | | 122,615 | | | | 9,549 | | | | 10,061 | | | | 583 | |
| | | | | | | | | | | | | | | | |
Net Assets | | $ | 879,589 | | | $ | 100,402 | | | $ | 203,808 | | | $ | 146,035 | |
| | | | | | | | | | | | | | | | |
| | | | |
Institutional Share Class | | | | | | | | | | | | | | | | |
Net Assets | | $ | 676,263 | | | $ | 67,935 | | | $ | 53,437 | | | $ | 69,695 | |
Shares Outstanding | | | 42,567,873 | | | | 6,718,394 | | | | 5,019,179 | | | | 7,041,233 | |
Net Asset Value Per Share | | $ | 15.89 | | | $ | 10.11 | | | $ | 10.65 | | | $ | 9.90 | |
See accompanying Notes to Financial Statements.
46 Semi-Annual Report | June 30, 2011 |
Statements of Operations
for the Period Ended June 30, 2011 (dollar amounts in thousands)
| | | | | | | | | | | | | | | | |
| | | Emerging
Markets
Growth
Fund | | | Emerging
Leaders
Fund | | | Bond
Fund | | | Low
Duration
Fund | |
Investment income | | | | | | | | | | | | | | | | |
Dividends | | $ | 14,909 | | | $ | 1,185 | | | $ | — | | | $ | — | |
Less foreign tax withheld | | | (1,112 | ) | | | (99 | ) | | | — | | | | — | |
Interest | | | 148 | | | | — | | | | 4,839 | | | | 1,623 | |
| | | | | | | | | | | | | | | | |
Total income | | | 13,945 | | | | 1,086 | | | | 4,839 | | | | 1,623 | |
Expenses | | | | | | | | | | | | | | | | |
Investment advisory fees | | | 6,374 | | | | 530 | | | | 294 | | | | 220 | |
Distribution fees | | | 39 | | | | — | | | | 4 | | | | 5 | |
Shareholder services fees | | | 164 | | | | 18 | | | | 113 | | | | 64 | |
Custodian fees | | | 258 | | | | 66 | | | | 27 | | | | 30 | |
Transfer agent fees | | | 24 | | | | 7 | | | | 11 | | | | 8 | |
Sub-transfer agent fees | | | | | | | | | | | | | | | | |
Class N | | | 14 | | | | — | | | | 2 | | | | — | |
Class I | | | 28 | | | | — | | | | 4 | | | | — | |
Professional fees | | | 58 | | | | 34 | | | | 17 | | | | 14 | |
Registration fees | | | 28 | | | | 27 | | | | 28 | | | | 42 | |
Shareholder reporting fees | | | 11 | | | | 1 | | | | 4 | | | | 2 | |
Trustee fees | | | 21 | | | | 2 | | | | 3 | | | | 2 | |
Other expenses | | | 28 | | | | 4 | | | | 8 | | | | 6 | |
| | | | | | | | | | | | | | | | |
Total expenses before waiver | | | 7,047 | | | | 689 | | | | 515 | | | | 393 | |
Expenses waived by the Advisor | | | — | | | | (70 | ) | | | (55 | ) | | | (32 | ) |
| | | | | | | | | | | | | | | | |
Net expenses | | | 7,047 | | | | 619 | | | | 460 | | | | 361 | |
| | | | | | | | | | | | | | | | |
Net investment income (loss) | | | 6,898 | | | | 467 | | | | 4,379 | | | | 1,262 | |
Realized and unrealized gain (loss) | | | | | | | | | | | | | | | | |
Net realized gain (loss) on transactions from: | | | | | | | | | | | | | | | | |
Investments | | | 135,105 | | | | 5,902 | | | | 1,281 | | | | 37 | |
Foreign currency transactions | | | (885 | ) | | | (177 | ) | | | — | | | | — | |
| | | | | | | | | | | | | | | | |
Total net realized gain (loss) | | | 134,220 | | | | 5,725 | | | | 1,281 | | | | 37 | |
Change in net unrealized appreciation (depreciation) of: | | | | | | | | | | | | | | | | |
Investments | | | (162,150 | ) | | | (8,084 | ) | | | 258 | | | | 683 | |
Foreign currency translations | | | (29 | ) | | | 11 | | | | — | | | | — | |
| | | | | | | | | | | | | | | | |
Total change in net unrealized appreciation (depreciation) | | | (162,179 | ) | | | (8,073 | ) | | | 258 | | | | 683 | |
| | | | | | | | | | | | | | | | |
Net increase (decrease) in net assets resulting from operations | | $ | (21,061 | ) | | $ | (1,881 | ) | | $ | 5,918 | | | $ | 1,982 | |
| | | | | | | | | | | | | | | | |
See accompanying Notes to Financial Statements.
June 30, 2011 | William Blair Funds 47 |
Statements of Changes in Net Assets
for the Period Ended June 30, 2011 (dollar amounts in thousands)
| | | | | | | | | | | | | | | | | | | | | | | | | | | | | | | | |
| | | Emerging
Markets
Growth
Fund | | | Emerging
Leaders
Fund | | | Bond
Fund | | | Low
Duration
Fund | |
| | | 2011 | | | 2010 | | | 2011 | | | 2010 | | | 2011 | | | 2010 | | | 2011 | | | 2010 | |
Operations | | | | | | | | | | | | | | | | | | | | | | | | | | | | | | | | |
Net investment income (loss) | | $ | 6,898 | | | $ | 4,305 | | | $ | 467 | | | $ | 468 | | | $ | 4,379 | | | $ | 8,051 | | | $ | 1,262 | | | $ | 1,915 | |
Net realized gain (loss) on investments and foreign currency transactions | | | 134,220 | | | | 245,341 | | | | 5,725 | | | | 33,656 | | | | 1,281 | | | | 2,212 | | | | 37 | | | | (60 | ) |
Change in net unrealized appreciation (depreciation) on investments and foreign currency transactions | | | (162,179 | ) | | | 13,556 | | | | (8,073 | ) | | | (16,315 | ) | | | 258 | | | | 3,290 | | | | 683 | | | | 468 | |
| | | | | | | | | | | | | | | | | | | | | | | | | | | | | | | | |
Net increase (decrease) in net assets resulting from operations | | | (21,061 | ) | | | 263,202 | | | | (1,881 | ) | | | 17,809 | | | | 5,918 | | | | 13,553 | | | | 1,982 | | | | 2,323 | |
Distributions to shareholders from | | | | | | | | | | | | | | | | | | | | | | | | | | | | | | | | |
Net investment income | | | — | | | | (13,461 | ) | | | — | | | | (255 | ) | | | (4,768 | ) | | | (8,566 | ) | | | (1,972 | ) | | | (2,958 | ) |
Net realized gain | | | — | | | | — | | | | — | | | | (505 | ) | | | — | | | | (494 | ) | | | — | | | | — | |
| | | | | | | | | | | | | | | | | | | | | | | | | | | | | | | | |
| | | — | | | | (13,461 | ) | | | — | | | | (760 | ) | | | (4,768 | ) | | | (9,060 | ) | | | (1,972 | ) | | | (2,958 | ) |
Capital stock transactions | | | | | | | | | | | | | | | | | | | | | | | | | | | | | | | | |
Net proceeds from sale of shares | | | 125,492 | | | | 357,761 | | | | 17,588 | | | | 14,224 | | | | 51,086 | | | | 90,709 | | | | 69,555 | | | | 149,882 | |
Shares issued in reinvestment of income dividends and capital gain distributions | | | — | | | | 12,072 | | | | — | | | | 681 | | | | 3,450 | | | | 6,013 | | | | 1,574 | | | | 2,297 | |
Less cost of shares redeemed | | | (475,385 | ) | | | (407,291 | ) | | | (10,206 | ) | | | (52,189 | ) | | | (44,654 | ) | | | (55,783 | ) | | | (68,574 | ) | | | (103,208 | ) |
| | | | | | | | | | | | | | | | | | | | | | | | | | | | | | | | |
Net increase (decrease) in net assets resulting from capital share transactions | | | (349,893 | ) | | | (37,458 | ) | | | 7,382 | | | | (37,284 | ) | | | 9,882 | | | | 40,939 | | | | 2,555 | | | | 48,971 | |
| | | | | | | | | | | | | | | | | | | | | | | | | | | | | | | | |
Increase (decrease) in net assets | | | (370,954 | ) | | | 212,283 | | | | 5,501 | | | | (20,235 | ) | | | 11,032 | | | | 45,432 | | | | 2,565 | | | | 48,336 | |
Net assets | | | | | | | | | | | | | | | | | | | | | | | | | | | | | | | | |
Beginning of year | | $ | 1,250,543 | | | $ | 1,038,260 | | | $ | 94,901 | | | $ | 115,136 | | | $ | 192,776 | | | $ | 147,344 | | | $ | 143,470 | | | $ | 95,134 | |
| | | | | | | | | | | | | | | | | | | | | | | | | | | | | | | | |
End of year | | $ | 879,589 | | | $ | 1,250,543 | | | $ | 100,402 | | | $ | 94,901 | | | $ | 203,808 | | | $ | 192,776 | | | $ | 146,035 | | | $ | 143,470 | |
| | | | | | | | | | | | | | | | | | | | | | | | | | | | | | | | |
Accumulated net investment income (loss) at the end of the year | | $ | (5,429 | ) | | $ | (12,327 | ) | | $ | 336 | | | $ | (131 | ) | | $ | (388 | ) | | $ | 1 | | | $ | (710 | ) | | $ | — | |
| | | | | | | | | | | | | | | | | | | | | | | | | | | | | | | | |
See accompanying Notes to Financial Statements.
48 Semi-Annual Report | June 30, 2011 |
Notes to Financial Statements
(1) Significant Accounting Policies
The following is a summary of William Blair Funds’ (the “Fund”) significant accounting policies in effect during the period covered by the financial statements, which are in accordance with U.S. generally accepted accounting principles.
(a) Description of the Fund
The Fund is a diversified mutual fund registered under the Investment Company Act of 1940 (the “1940 Act”), as amended, as an open-end management investment company. The number of shares authorized for this Fund is unlimited. The Fund currently consists of the following nineteen portfolios (the “Portfolios”), each with its own investment objective and policies.
| | |
Equity Portfolios | | International Equity Portfolios |
Growth Large Cap Growth Small Cap Growth Mid Cap Growth Small-Mid Cap Growth Small Cap Value Mid Cap Value Global Equity Portfolio Global Growth | | International Growth International Equity Institutional International Growth Institutional International Equity International Small Cap Growth Emerging Markets Growth Emerging Leaders Growth Fixed-Income Portfolios Bond Income Low Duration Money Market Portfolio Ready Reserves |
The investment objectives of the Portfolios are as follows:
| | |
Equity | | Long-term capital appreciation. |
Global Equity | | Long-term capital appreciation. |
International Equity | | Long-term capital appreciation. |
Fixed-Income | | High level of current income with relative stability of principal.
(Maximize total return—Low Duration) |
Money Market | | Current income, a stable share price and daily liquidity. |
The Institutional International Growth Portfolio, the Institutional International Equity Portfolio and the Institutional Share Classes of the International Small Cap Growth Portfolio, the Emerging Markets Growth Portfolio, the Emerging Leaders Growth Portfolio, Bond Portfolio, and the Low Duration Portfolio are the only Portfolios covered in this report.
(b) Share Classes
Three different classes of shares of the International Small Cap Growth Fund, Emerging Markets Growth Fund, Emerging Leaders Growth Fund, Bond Fund and the Low Duration Fund currently exist: N, I and Institutional. This report includes financial information for only the Institutional Class. The Institutional share class is sold to institutional investors, including but not limited to employee benefit plans, endowments, foundations, trusts and corporations, who are able to meet the Fund’s high minimum investment requirement. The minimum initial investment required is $5 million.
Investment income realized and unrealized gains and losses, and certain Portfolio level expenses and expense reductions, if any, are allocated based on the relative net assets of each class, except for certain class specific expenses, which are charged directly to the appropriate class. Differences in class expenses may result in the payment of different per share dividends by class. All share classes of the Portfolios have equal rights with respect to voting subject to class specific arrangements.
June 30, 2011 | William Blair Funds 49 |
(c) Investment Valuation
The market value of domestic equity securities is determined by valuing securities traded on national securities markets or in the over-the-counter markets at the last sale price or, if applicable, the official closing price or, in the absence of a recent sale on the date of determination, at the latest bid price.
The value of foreign equity securities is generally determined based upon the last sale price on the foreign exchange or market on which it is primarily traded and in the currency of that market as of the close of the appropriate exchange or, if there have been no sales during that day, at the latest bid price. The Board of Trustees has determined that the passage of time between when the foreign exchanges or markets close and when the Portfolios compute their net asset values could cause the value of foreign equity securities to no longer be representative or accurate, and as a result, may necessitate that such securities be fair valued. Accordingly, for foreign equity securities, the Portfolios may use an independent pricing service to fair value the security as of the close of regular trading on the New York Stock Exchange. As a result, a Portfolio’s value for a security may be different from the last sale price (or the latest bid price).
Fixed-income securities are valued by using market quotations or independent pricing services that use either prices provided by market-makers or matrixes that produce estimates of market values obtained from yield data relating to instruments or securities with similar characteristics.
Other securities, and all other assets, including securities for which a market price is not available or is deemed unreliable, (e.g., securities affected by unusual or extraordinary events, such as natural disasters or securities affected by market or economic events, such as bankruptcy filings), or the value of which is affected by a significant valuation event, are valued at a fair value as determined in good faith by, or under the direction of, the Board of Trustees and in accordance with the Trust’s valuation procedures. The value of fair valued securities may be different from the last sale price (or the latest bid price), and there is no guarantee that a fair valued security will be sold at the price at which a Portfolio is carrying the security.
Investments in other funds are valued at the underlying fund’s net asset value on the date of valuation. As of June 30, 2011, there were securities held in the Institutional International Growth, International Small Cap Growth, Emerging Markets Growth and Bond Portfolios requiring fair valuation pursuant to the Funds’ Valuation Procedures.
(d) Investment income and transactions
Dividend income is recorded on the ex-dividend date, except for those dividends from certain foreign securities that are recorded when the information is available.
Interest income is recorded on an accrual basis, adjusted for amortization of premium or discount. Variable rate bonds and floating rate notes earn interest at coupon rates that fluctuate at specific time intervals. The interest rate shown on the Portfolio of Investments for the Bond Fund and Low Duration Fund were the rates in effect on June 30, 2011. Put bonds may be redeemed at the discretion of the holder on specified dates prior to maturity.
Premiums and discounts are accreted and amortized on a straight-line basis for short-term investments and on an effective interest method for long-term investments.
Paydown gains and losses on mortgage and asset-backed securities are treated as an adjustment to interest income. For the period ended June 30, 2011, the Bond and Low Duration Portfolios recognized an increase of interest income and a decrease of net realized loss of $(390) and $(709), respectively (in thousands). This reclassification had no effect on the net asset value or the net assets of the Portfolios.
The Funds do not isolate that portion of the results of operations resulting from changes in foreign exchange rates on investments from the fluctuations arising from changes in market prices of securities held. Such fluctuations are included with the net realized and unrealized gain or loss from investments.
Reported net realized foreign currency gains or losses arise from disposition of foreign currency, the difference in the foreign exchange rates between the trade and settlement dates on securities transactions, and the difference between the amounts of dividends, interest and foreign withholding taxes recorded on the ex-date or accrual date and the U.S. dollar equivalent of the amounts actually received or paid. Net unrealized foreign exchange gains and losses arise from changes (due to the changes in the exchange rate) in the value of foreign currency and other assets and liabilities denominated in foreign currencies held at year end.
50 Semi-Annual Report | June 30, 2011 |
Security and shareholder transactions are accounted for no later than one business day following the trade date. However, for financial reporting purposes, security and shareholder transactions are accounted for on the trade date of the last business day of the reporting period. Realized gains and losses from securities transactions are recognized on a specifically identified cost basis.
Awards from class action litigation may be recorded as a reduction of cost. If the Portfolios no longer own the applicable securities, the proceeds are recorded as realized gains.
(e) Share Valuation and Dividends to Shareholders
Shares are sold and redeemed on a continuous basis at net asset value. The net asset value per share is determined by dividing the Portfolio’s net assets by the number of shares outstanding as of the close of regular trading on the New York Stock Exchange, which is generally 4:00 p.m. Eastern time, on each day the Exchange is open.
Dividends from net investment income, if any, are declared at least annually for the Institutional International Growth, Institutional International Equity, International Small Cap Growth, Emerging Markets Growth and Emerging Leaders Growth Portfolio. Dividends from the Bond and Low Duration Portfolio are declared daily and paid monthly. Dividends payable to shareholders are recorded on the ex-dividend date.
(f) Foreign Currency Translation and Foreign Currency Forward Contracts
The Portfolios (excluding the Bond Portfolio and the Low Duration Portfolio) may invest in securities denominated in foreign currencies. As such, assets and liabilities denominated in foreign currencies are translated into U.S. dollar amounts at the current exchange rate on the date of valuation. The values of foreign investments, forward open foreign currency contracts, and cash denominated in foreign currencies are translated into U.S. dollars using a spot market rate of exchange as of the time of the determination of each Fund’s net asset value, typically 4:00 p.m. Eastern time on days when there is regular trading on the New York Stock Exchange (the “Exchange”). Payables and receivables for securities transactions, dividends, interest income and tax reclaims are translated into U.S. dollars using a spot market rate of exchange as of 4:00 p.m. Eastern time. Settlement of purchases and sales and dividend and interest receipts are translated into U.S. dollars using a spot market rate of exchange as of 11:00 a.m. Eastern time.
(g) Income Taxes
Each Portfolio intends to comply with the provisions of Subchapter M of the Internal Revenue Code available to regulated investment companies. Each portfolio intends to make the requisite distributions of income and capital gains to its shareholders sufficient to relieve it from all, or substantially all, federal income and excise taxes. No provision for federal income and excise taxes has been made.
The Institutional International Growth, Institutional International Equity, International Small Cap Growth, Emerging Markets Growth, and Emerging Leaders Growth Portfolios may be subject to a tax imposed on net realized gains on securities of certain foreign countries.
Each Portfolio is subject to the provisions of Accounting Standards Codification (“ASC”) 740, Income Taxes. ASC 740 provides guidance for how uncertain tax positions should be recognized, measured, presented and disclosed in the financial statements. Management has evaluated the implications of ASC 740 and all of the uncertain tax positions of the Portfolios and has determined that no liability is required to be recorded in the financial statements.
The statute of limitations on the Portfolios’ tax returns for each of the tax years in the four year period ended December 31, 2010 remains open and the returns are subject to examination.
June 30, 2011 | William Blair Funds 51 |
The Portfolios have elected to mark-to-market their investments in Passive Foreign Investment Companies (“PFICs”) for federal income tax purposes. The Portfolios also treat the deferred loss associated with current and prior year wash sales as an adjustment to the cost of investments for tax purposes. The cost of investments for federal income tax purposes and related gross unrealized appreciation/(depreciation) and net unrealized appreciation/(depreciation) at June 30, 2011 were as follows (in thousands):
| | | | | | | | | | | | | | | | |
Portfolio | | Cost of
Investments | | | Gross
Unrealized
Appreciation | | | Gross
Unrealized
Depreciation | | | Net
Unrealized
Appreciation/
Depreciation | |
Institutional International Growth | | | $1,444,706 | | | $ | 283,899 | | | $ | 28,614 | | | $ | 255,285 | |
Institutional International Equity | | | 213,753 | | | | 51,600 | | | | 2,156 | | | | 49,444 | |
International Small Cap Growth | | | 641,583 | | | | 124,962 | | | | 8,645 | | | | 116,317 | |
Emerging Markets Growth | | | 753,870 | | | | 127,720 | | | | 12,433 | | | | 115,287 | |
Emerging Leaders Growth | | | 89,549 | | | | 9,746 | | | | 853 | | | | 8,893 | |
Bond | | | 193,902 | | | | 10,501 | | | | 440 | | | | 10,061 | |
Low Duration | | | 148,004 | | | | 918 | | | | 335 | | | | 583 | |
The timing and characterization of certain income and capital gain distributions are determined annually in accordance with federal income tax regulations that may differ from U.S. generally accepted accounting principles. As a result, net investment income or loss and net realized gain or loss for a reporting period may differ from the amount distributed during such period. In addition, the Portfolios may periodically record reclassifications among certain capital accounts to reflect differences between financial reporting and income tax basis distributions. The reclassifications were reported in order to reflect the tax treatment for certain permanent differences that exist between income tax regulations and U.S. generally accepted accounting principles. The reclassifications generally relate to Section 988 currency gains and losses, PFIC gains and losses and redemptions in-kind. These reclassifications have no impact on the net asset values of the Portfolios. Accordingly, at December 31, 2010 (the Funds’ most recent fiscal year end), the following reclassifications were recorded (in thousands):
| | | | | | | | | | | | |
Portfolio | | Accumulated Net
Investment Income (Loss) | | | Accumulated Net Realized Gain/(Loss) | | | Capital Paid in Excess of Par Value | |
Institutional International Growth | | $ | 17,554 | | | $ | (17,554 | ) | | $ | - | |
Institutional International Equity | | | 475 | | | | (475 | ) | | | - | |
International Small Cap Growth | | | (849 | ) | | | 849 | | | | - | |
Emerging Markets Growth | | | 4,413 | | | | (33,541 | ) | | | 29,128 | |
Emerging Leaders Growth | | | (47 | ) | | | 51 | | | | (4 | ) |
Bond | | | 516 | | | | (516 | ) | | | - | |
Low Duration | | | 1,043 | | | | (1,043 | ) | | | - | |
Distributions from net realized gains for book purposes may include short-term capital gains, which are included as ordinary income for tax purposes. The tax character of distributions paid during 2010 and 2009 was as follows (in thousands):
| | | | | | | | | | | | | | | | | | | | | | | | |
| | | Distributions Paid in 2010 | | | | | | Distributions Paid in 2009 | | | | |
Portfolio | | Ordinary Income | | | Long-Term Capital Gains | | | Total Distributions | | | Ordinary Income | | | Long-Term Capital Gains | | | Total
Distributions | |
Institutional International Growth | | | $35,383 | | | $ | - | | | | $35,383 | | | | $18,261 | | | $ | - | | | | $18,261 | |
Institutional International Equity | | | 4,059 | | | | - | | | | 4,059 | | | | 2,719 | | | | - | | | | 2,719 | |
International Small Cap Growth | | | 2,781 | | | | - | | | | 2,781 | | | | 778 | | | | - | | | | 778 | |
Emerging Markets Growth | | | 13,461 | | | | - | | | | 13,461 | | | | 11,127 | | | | - | | | | 11,127 | |
Emerging Leaders Growth | | | 255 | | | | 505 | | | | 760 | | | | 1,588 | | | | - | | | | 1,588 | |
Bond | | | 8,566 | | | | 494 | | | | 9,060 | | | | 6,213 | | | | - | | | | 6,213 | |
Low Duration | | | 2,958 | | | | - | | | | 2,958 | | | | 86 | | | | - | | | | 86 | |
As of December 31, 2010, the components of distributable earnings on a tax basis were as follows (in thousands):
| | | | | | | | | | | | | | | | |
Portfolio | | Undistributed Ordinary Income | | | Accumulated Capital and Other Losses | | | Undistributed Long-Term Capital Gain | | | Net Unrealized Appreciation/ Depreciation | |
Institutional International Growth | | $ | 1,998 | | | $ | (270,900 | ) | | $ | - | | | $ | 330,485 | |
Institutional International Equity | | | 23 | | | | (155,726 | ) | | | - | | | | 64,988 | |
International Small Cap Growth | | | 5,932 | | | | (113,021 | ) | | | - | | | | 126,190 | |
Emerging Markets Growth | | | - | | | | (5,861 | ) | | | - | | | | 261,554 | |
52 Semi-Annual Report | June 30, 2011 |
| | | | | | | | | | | | | | | | |
Portfolio | | Undistributed Ordinary Income | | | Accumulated Capital and Other Losses | | | Undistributed Long-Term Capital Gain | | | Net Unrealized Appreciation/ Depreciation | |
Emerging Leaders Growth | | | 987 | | | | (14 | ) | | | 539 | | | | 16,644 | |
Bond | | | 2 | | | | - | | | | 236 | | | | 9,803 | |
Low Duration | | | - | | | | (1,104 | ) | | | - | | | | (100 | ) |
As of December 31, 2010, the Portfolios have unused capital loss carry forwards available for federal income tax purposes to be applied against future gains, if any. If not applied, the carryforward will expire as follows (in thousands):
| | | | | | | | | | | | | | | | | | | | | | | | | | | | | | | | | | | | |
Portfolio | | 2011 | | | 2012 | | | 2013 | | | 2014 | | | 2015 | | | 2016 | | | 2017 | | | 2018 | | | Total | |
Institutional International Growth | | $ | - | | | $ | - | | | $ | - | | | $ | - | | | $ | - | | | $ | - | | | $ | 270,881 | | | $ | - | | | $ | 270,881 | |
Institutional International Equity | | | - | | | | - | | | | - | | | | - | | | | - | | | | 42,759 | | | | 113,087 | | | | - | | | | 155,846 | |
International Small Cap Growth | | | - | | | | - | | | | - | | | | - | | | | - | | | | 26,723 | | | | 86,330 | | | | - | | | | 113,053 | |
Emerging Markets Growth | | | - | | | | - | | | | - | | | | - | | | | - | | | | - | | | | 5,572 | | | | - | | | | 5,572 | |
Emerging Leaders Growth | | | - | | | | - | | | | - | | | | - | | | | - | | | | - | | | | - | | | | - | | | | - | |
Bond | | | - | | | | - | | | | - | | | | - | | | | - | | | | - | | | | - | | | | - | | | | - | |
Low Duration | | | - | | | | - | | | | - | | | | - | | | | - | | | | - | | | | - | | | | 955 | | | | 955 | |
For the period from November 1, 2010 through December 31, 2010, the following Portfolios incurred net realized capital losses or foreign currency losses. Each Portfolio intends to treat this loss as having occurred in fiscal year 2011 for federal income tax purposes (in thousands):
| | | | | | | | |
Portfolio | | Capital
Amount | | | Currency
Amount | |
Institutional International Growth | | $ | - | | | $ | - | |
Institutional International Equity | | | - | | | | - | |
International Small Cap Growth | | | - | | | | - | |
Emerging Markets Growth | | | - | | | | 324 | |
Emerging Leaders Growth | | | - | | | | - | |
Bond | | | - | | | | - | |
Low Duration | | | 149 | | | | - | |
(h) Repurchase Agreements
In a repurchase agreement, a Portfolio buys a security at one price and at the time of sale, the seller agrees to repurchase the obligation at a mutually agreed upon time and price (usually within seven days). The repurchase agreement thereby determines the yield during the purchaser’s holding period, while the seller’s obligation to repurchase is secured by the value of the underlying security. William Blair & Company, L.L.C. (the “Advisor”) will monitor, on an ongoing basis, the value of the underlying securities to ensure that the value always equals or exceeds the repurchase price plus accrued interest. Repurchase agreements could involve certain risks in the event of a default or insolvency of the other party to the agreement, including possible delays or restrictions upon a Portfolio’s ability to dispose of the underlying securities. The risk to a Portfolio is limited to the ability of the seller to pay the agreed upon sum on the delivery date. In the event of default, a repurchase agreement provides that a Portfolio is entitled to sell the underlying collateral. The loss, if any, to a Portfolio will be the difference between the proceeds from the sale and the repurchase price. However, if bankruptcy proceedings are commenced with respect to the seller of the security, disposition of the collateral by the Portfolio may be delayed or limited. Although no definitive creditworthiness criteria are used, the Advisor reviews the creditworthiness of the banks and non-bank dealers with which a Portfolio enters into repurchase agreements to evaluate those risks. A Portfolio may, for tax purposes, deem repurchase agreements collateralized by U.S. Government securities to be investments in U.S. Government securities.
(i) Use of Estimates
The preparation of financial statements in conformity with U.S. generally accepted accounting principles requires management to make estimates and assumptions that affect the amounts reported in the financial statements. Actual results may differ from those estimates.
June 30, 2011 | William Blair Funds 53 |
(j) Fair Value Measurements
The Portfolios are subject to ASC 820, Fair Value measurement and Disclosures, formally known as SFAS (Statement of Financial Accounting Standards) No. 157, “Fair Value Measurements”. In accordance with ASC 820, “fair value” is defined as the price that a Portfolio would receive upon selling a security in an orderly transaction to an independent buyer in the principal or most advantageous market for the investment. Various inputs are used in determining the value of a Portfolio’s investments. ASC 820 establishes a three-tier hierarchy of inputs to classify fair value measurements for disclosure purposes. The three-tier hierarchy of inputs is summarized in the three broad levels listed below.
| | • | | Level 1—Quoted prices in active markets for an identical security. |
| | • | | Level 2—Prices determined using other significant observable inputs. Observable inputs are inputs that other market participants would use in pricing a security. These may include quoted prices for similar securities, interest rates, prepayment speeds, credit risk, and others. In addition, other observable inputs such as foreign exchange rates, benchmark securities indices and foreign futures contracts may be utilized in the valuation of certain foreign securities when significant events occur between the last sale on the foreign securities exchange and the time the net asset value of the Portfolio is calculated. |
| | • | | Level 3—Prices determined using significant unobservable inputs. In situations where quoted prices or observable inputs are unavailable (for example, when there is little or no market activity for an investment), unobservable inputs may be used. Unobservable inputs reflect the Portfolio’s own assumptions about the factors market participants would use in pricing an investment, and would be based on the best information available. |
The inputs or methodology used for valuing an investment are not necessarily an indication of the risk associated with investing in those securities. For example, money market securities are valued using amortized cost, in accordance with rules under the 1940 Act. Generally, amortized cost approximates the current fair value of a security, but since the value is not obtained from a quoted price in an active market, such securities are reflected as Level 2.
Any transfers between Level 1 and Level 2 are disclosed, effective beginning of the period, in the tables below with the reasons for the transfers disclosed in a note to the tables, if applicable.
At June 30, 2011, the Portfolios held no other financial instruments, such as options or futures, that required fair valuation.
As of June 30, 2011, the hierarchical input levels of securities in each Portfolio, segregated by security class, are as follows (in thousands):
| | | | | | | | | | | | | | | | | | | | |
| | | Institutional
International
Growth | | | Institutional
International
Equity | | | International
Small Cap
Growth | | | Emerging
Markets
Growth | | | Emerging
Leaders
Growth | |
Investments in securities | | | | | | | | | | | | | | | | | | | | |
Level 1—Quoted prices | | | | | | | | | | | | | | | | | | | | |
Common Stocks | | $ | 1,659,617 | | | $ | 249,604 | | | $ | 736,157 | | | $ | 840,987 | | | $ | 94,136 | |
Preferred Stocks | | | — | | | | 2,987 | | | | — | | | | 27,098 | | | | 4,126 | |
Rights | | | — | | | | — | | | | — | | | | — | | | | — | |
Exchange traded funds | | | 14,044 | | | | — | | | | — | | | | — | | | | — | |
Level 2—Other significant observable inputs | | | | | | | | | | | | | | | | | | | | |
Convertible Bonds | | | 620 | | | | — | | | | 632 | | | | 1,055 | | | | — | |
Short-Term Investments | | | 24,274 | | | | 10,625 | | | | 21,114 | | | | — | | | | 174 | |
Level 3—Significant unobservable inputs | | | | | | | | | | | | | | | | | | | | |
None | | | — | | | | — | | | | — | | | | — | | | | — | |
| | | | | | | | | | | | | | | | | | | | |
Total investments in securities | | $ | 1,698,555 | | | $ | 263,216 | | | $ | 757,903 | | | $ | 869,140 | | | $ | 98,436 | |
| | | | | | | | | | | | | | | | | | | | |
Other financial instruments—Assets | | | | | | | | | | | | | | | | | | | | |
Level 2—Other significant observable inputs | | | | | | | | | | | | | | | | | | | | |
Forward foreign currency contracts | | $ | 2,148 | | | $ | — | | | $ | — | | | $ | — | | | $ | — | |
| | | | | | | | | | | | | | | | | | | | |
Other financial instruments—Liabilities | | | | | | | | | | | | | | | | | | | | |
Level 2—Other significant observable inputs | | | | | | | | | | | | | | | | | | | | |
Forward foreign currency contracts | | $ | 714 | | | $ | 22 | | | $ | 30 | | | $ | — | | | $ | — | |
| | | | | | | | | | | | | | | | | | | | |
54 Semi-Annual Report | June 30, 2011 |
| | | | | | | | |
| | | Bond | | | Low
Duration Fund | |
Investments in securities | | | | | | | | |
Level 1—Quoted Prices | | | | | | | | |
None | | $ | — | | | $ | — | |
Level 2—Other significant observable inputs | | | | | | | | |
US Government and Agency Bonds | | | 99,717 | | | | 68,906 | |
Corporate Bonds | | | 92,816 | | | | 18,858 | |
Asset Backed Bonds | | | 8,995 | | | | 57,580 | |
Short-Term Investments | | | 2,256 | | | | 3,243 | |
Level 3—Significant unobservable inputs | | | | | | | | |
Asset Backed Bonds | | | 179 | | | | — | |
| | | | | | | | |
Total investments in securities | | $ | 203,963 | | | $ | 148,587 | |
| | | | | | | | |
Level 1 Common Stocks are exchange-traded securities with a quoted price. See Portfolio of Investments for Sector Classification.
The following is a reconciliation of Level 3 securities for which significant unobservable inputs were used to determine fair value:
| | | | | | | | | | | | | | | | | | | | | | | | | | | | | | | | |
| | | Balance January 1, 2011 | | | (Sales) | | | Purchases | | | Transfers
to Level 3 | | | Transfers
(from)
Level 3 | | | Change in
Unrealized Gain (Loss) | | | Realized Gain (Loss) | | | Balance
June 30, 2011 | |
| | | | | | | | |
Bond | | $ | 170 | | | | — | | | | — | | | | — | | | | — | | | $ | 9 | | | | — | | | $ | 179 | |
The fair value estimate for the Level 3 security in the Bond Portfolio was determined in good faith by the Pricing Committee in consultation with the Valuation Committee, pursuant to the Valuation Procedures adopted by the Board of Trustees. There were various factors considered in reaching this fair value determination, including, but not limited to, the following: the type of security, the extent of public trading of the security, information obtained from a broker-dealer for the security, analysis of the company’s performance, market trends that influence its performance and the potential for an adverse outcome in pending litigation. At June 30, 2011, this security represented 0.09%, of the net assets of the Bond Portfolio. The change in unrealized gain (loss) related to the security held at June 30, 2011 was $9, in thousands, and is included in the change in unrealized appreciation (depreciation) of investments on the Statement of Operations.
The First Plus Home Loan Trust bond held in the Bond Portfolio transferred from Level 2 to Level 3 during the period due to the lack of significant other observable inputs.
(k) Redemptions In- Kind
In accordance with the Funds’ prospectus, the Portfolios may distribute portfolio securities rather than cash as payment for a redemption of fund shares (in-kind redemption). For financial reporting purposes, the Portfolio recognizes a gain or loss on the transfer of securities depending on the market value of those securities on the date of redemption. Gains and losses realized on in-kind redemptions are not recognized for tax purposes and are reclassified from undistributed realized gain (loss) to paid-in capital. During the period ended June 30, 2011, the Emerging Markets Growth Fund transferred in-kind (in thousands) $74,711 for a realized gain of $32,340.
(2) Accounting Pronouncement and Regulations
On December 22, 2010, the Regulated Investment Company Modernization Act of 2010 (the “Act”) was enacted, which changed various technical rules governing the tax treatment of regulated investment companies. The changes are generally effective for taxable years beginning after the date of enactment. One of the more prominent changes addresses capital loss carryforwards. Under the Act, each fund will be permitted to carry forward capital losses incurred in taxable years beginning after the date of enactment for an unlimited period. However, any losses incurred during those future taxable years will be required to be utilized prior to the losses incurred in pre-enactment taxable years, which carry an expiration date. As a result of this ordering rule, pre-enactment capital loss carryforwards may be more likely to expire unused. Additionally, post-enactment capital loss carryforwards will retain their character as either short-term or long-term capital losses rather than being considered all short-term as permitted under previous regulation.
In April 2011, the FASB issued ASU 2011-03 Reconsideration of Effective Control for Repurchase Agreements. ASU 2011-03 amends ASC 860, Transfers and Servicing, in relation to the accounting for repurchase agreements and similar agreements that
June 30, 2011 | William Blair Funds 55 |
both entitle and obligate a transferor to repurchase or redeem financial assets before their maturity. ASU 2011-03 modifies the criteria for determining effective control of transferred assets and as a result certain agreements may not be accounted for as secured borrowings. ASU 2011-03 is effective prospectively for new transfers and existing transitions that are modified in the first interim or annual period beginning on or after December 15, 2011. At this time, management is evaluating the implication of this change and its impact on the financial statements has not been determined.
On May 12, 2011, the Financial Accounting Standards Board (“FASB”) issued Accounting Standard Update (“ASU”) 2011-04, modifying Topic 820, Fair Value Measurements and Disclosures. The ASU requires reporting entities to disclose (i) the amounts of any transfers between Level 1 and Level 2, and the reasons for the transfers, (ii) for Level 3 fair value measurements, quantitative information about significant unobservable inputs used, (iii) a description of the valuation processes used by the reporting entity and, (iv) a narrative description of the sensitivity of the fair value measurement to changes in unobservable inputs if a change in those inputs might result in a significantly higher or lower fair value measurement. The effective date of ASU 2011-04 is for interim and annual periods beginning after December 15, 2011. At this time, management is evaluating the implication of this change and its impact on the financial statements has not been determined.
(3) Transactions with Affiliates
(a) Management and Expense Limitation Agreements
Each Portfolio has a management agreement with the “Advisor” for investment advisory, clerical, bookkeeping and administrative services. Each Portfolio pays the Advisor an annual fee, payable monthly, based on a specified percentage of its average daily net assets. A Summary of the annual rates expressed as a percentage of average daily net assets is as follows:
| | | | | | | | | | |
International Portfolios: | | | | | Fixed-Income Portfolios | | | |
Institutional International Growth: | | | | | | Bond | | | 0.30% | |
First $500 million | | | 1.00% | | | Low Duration | | | 0.35% | |
Next $500 million | | | 0.95% | | | | | | | |
Next $1.5 billion | | | 0.90% | | | | | | | |
Next $2.5 billion | | | 0.875% | | | | | | | |
Next $5 billion | | | 0.85% | | | | | | | |
Next $5 billion | | | 0.825% | | | | | | | |
In excess of $15 billion | | | 0.80% | | | | | | | |
Institutional International Equity: | | | | | | | | | | |
First $500 million | | | 1.000% | | | | | | | |
Next $500 million | | | 0.950% | | | | | | | |
In excess of $1 billion | | | 0.900% | | | | | | | |
International Small Cap Growth | | | 1.00% | | | | | | | |
Emerging Markets Growth | | | 1.10% | | | | | | | |
Emerging Leaders | | | 1.10% | | | | | | | |
All of the Portfolios, except Institutional International Growth Fund, have also entered into Expense Limitation Agreements with the Advisor. Under the terms of these agreements, the Advisor will waive its management fee and/or reimburse the Portfolio for expenses in excess of the agreed upon rate. The amount the Advisor owes a Portfolio as of the report date is recorded as the Receivable from Advisor on the Statement of Assets and Liabilities. The Advisor reimburses the Portfolios on an annual basis. Under the terms of these Agreements, the Advisor has agreed to waive its advisory fees and/or absorb other operating expenses through April 30, 2012, if total expenses of the Portfolios exceed the following rates (as a percentage of average daily net assets):
| | | | | | | | |
Portfolio | | Effective
May 1, 2011
through
April 30, 2012 | | | Effective
May 1, 2010
through
April 30, 2011 | |
Institutional International Equity | | | 1.10 | % | | | 1.10 | % |
International Small Cap Growth | | | 1.25 | % | | | 1.25 | % |
Emerging Markets Growth | | | 1.30 | % | | | 1.30 | % |
Emerging Leaders Growth | | | 1.25 | % | | | 1.25 | % |
Bond | | | 0.35 | % | | | 0.35 | % |
Low Duration | | | 0.40 | % | | | 0.40 | % |
56 Semi-Annual Report | June 30, 2011 |
For a period of three years subsequent to the Commencement of Operations of the Portfolio, the Advisor is entitled to reimbursement from the Emerging Leaders Growth and Low Duration Portfolios for previously waived fees and expenses to the extent the overall expense ratio remains below the percentages indicated. The total amount available for recapture at June 30, 2011 is $144 (in thousands) for the Low Duration Bond Portfolio. As a result, the total expense ratio for a Portfolio during the period the agreement is in effect will not fall below the percentage indicated.
For the period ended June 30, 2011, the fees incurred by the Portfolio and related fee waivers and/or reimbursements were as follows (in thousands):
| | | | | | | | | | | | |
Portfolio | | Fund
Level
Waiver | | | Class
Specific
Waiver | | | Total
Waiver | |
Emerging Leaders Growth | | $ | 70 | | | $ | — | | | $ | 70 | |
Bond | | | 48 | | | | 7 | | | | 55 | |
Low Duration | | | 31 | | | | 1 | | | | 32 | |
(4) Investment Transactions
Investment transactions, excluding money market instruments, for the period ended June 30, 2011 were as follows (in thousands):
| | | | | | | | |
Portfolio | | Purchases | | | Sales | |
Institutional International Growth | | $ | 975,834 | | | $ | (1,158,684 | ) |
Institutional International Equity | | | 117,210 | | | | (160,580 | ) |
International Small Cap Growth | | | 372,888 | | | | (304,131 | ) |
Emerging Markets Growth | | | 571,199 | | | | (879,959 | ) |
Emerging Leaders Growth | | | 105,072 | | | | (98,650 | ) |
Bond | | | 52,814 | | | | (40,488 | ) |
Low Duration | | | 59,628 | | | | (50,537 | ) |
(5) Forward Foreign Currency Contracts
The Portfolios (excluding the Bond and Low Duration Portfolios) from time to time may enter into forward foreign currency contracts with the Fund’s custodian and other counterparties in an attempt to hedge against a decline in the value of foreign currency against the U.S. dollar. The Portfolios bear the market risk that arises from changes in foreign currency rates and bear the credit risk if the counterparty fails to perform under the contract.
For the period ended June 30, 2011, the Institutional International Growth, Institutional International Equity, and International Small Cap Growth Portfolios engaged in forward foreign currency contracts with notional volume (in thousands) of $2,997,201, $115,039 and $222,182, respectively.
The following tables present the value of forward foreign currency contracts as of June 30, 2011 and their respective location on the Statement of Assets and Liabilities (values in thousands):
| | | | | | | | | | | | |
| | | Assets | | | Liabilities | |
Portfolio | | Statement of Assets and
Liabilities Location | | Value | | | Statement of Assets and
Liabilities Location | | Value | |
Institutional International Growth | | Unrealized appreciation on foreign
forward currency contracts | | $ | 2,148 | | | Unrealized depreciation on foreign
forward currency contracts | | $ | 714 | |
Institutional International Equity | | Unrealized appreciation on foreign
forward currency contracts | | | — | | | Unrealized depreciation on foreign
forward currency contracts | | | 22 | |
Institutional International Small Cap Growth | | Unrealized appreciation on foreign
forward currency contracts | | | — | | | Unrealized depreciation on foreign
forward currency contracts | | | 30 | |
June 30, 2011 | William Blair Funds 57 |
The effect of forward contracts on the Statements of Operations for the period ended June 30, 2011 (values in thousands) are as follows:
| | | | |
Realized gain (loss) recognized in foreign currency transactions | |
Portfolio | | Value | |
Institutional International Growth | | $ | (12,354 | ) |
Institutional International Equity | | | (271 | ) |
Institutional International Small Cap Growth | | | 2,660 | |
|
Change in unrealized gain (loss) recognized in foreign currency translations | |
Portfolio | | Value | |
Institutional International Growth | | $ | 1,434 | |
Institutional International Equity | | | 205 | |
Institutional International Small Cap Growth | | | (30 | ) |
The following table presents open forward foreign currency contracts as of June 30, 2011 (values in thousands):
| | | | | | | | | | | | | | | | | | |
Institutional International Growth | |
Counterparty | | Short Contracts | | Settlement Date | | | Local Currency | | | Current Value | | | Unrealized Gain/(Loss) | |
State Street Bank and Trust | | Canadian Dollar | | | 9/22/2011 | | | | 23,442 | | | | 24,258 | | | | (379 | ) |
Northern Trust Corporation | | Swiss Franc | | | 9/20/2011 | | | | 19,393 | | | | 23,078 | | | | (5 | ) |
State Street Bank and Trust | | European Monetary Unit | | | 9/19/2011 | | | | 80,793 | | | | 116,912 | | | | (330 | ) |
Morgan Stanley and Company | | Great British Pound | | | 9/23/2011 | | | | 68,534 | | | | 109,887 | | | | 2,019 | |
Bank of New York | | Japanese Yen | | | 9/21/2011 | | | | 10,709,033 | | | | 133,081 | | | | 129 | |
|
Institutional International Equity | |
Counterparty | | Short Contracts | | Settlement Date | | | Local Currency | | | Current Value | | | Unrealized Gain/(Loss) | |
Northern Trust Corporation | | Japanese Yen | | | 7/20/2011 | | | | 670,013 | | | | 8,323 | | | | (22 | ) |
|
Institutional International Small Cap Growth | |
Counterparty | | Short Contracts | | Settlement Date | | | Local Currency | | | Current Value | | | Unrealized Gain/(Loss) | |
Northern Trust Corporation | | Swiss Franc | | | 9/20/2011 | | | | 2,402 | | | | 2,858 | | | | (9 | ) |
Bank of New York | | Japanese Yen | | | 9/21/2011 | | | | 2,314,926 | | | | 28,768 | | | | (21 | ) |
58 Semi-Annual Report | June 30, 2011 |
(6) Fund Share Transactions
The following table summarizes the activity in capital shares of each Portfolio (in thousands):
| | | | | | | | | | | | | | | | |
| | | Dollars | |
| | | For the period ended June 30, 2011 | |
Portfolio | | Sales | | | Reinvested
Distributions | | | Redemptions | | | Net change in
Net Assets
relating to fund
share activity | |
Institutional International Growth | | $ | 182,240 | | | $ | — | | | $ | 359,688 | | | $ | (177,448 | ) |
Institutional International Equity | | | 10,029 | | | | — | | | | 50,635 | | | | (40,606 | ) |
International Small Cap Growth | | | 33,031 | | | | — | | | | 20,592 | | | | 12,439 | |
Emerging Markets Growth | | | 109,094 | | | | — | | | | 434,669 | | | | (325,575 | ) |
Emerging Leaders Growth | | | — | | | | — | | | | 8,633 | | | | (8,633 | ) |
Bond | | | 29,858 | | | | 875 | | | | 18,052 | | | | 12,681 | |
Low Duration | | | 43,888 | | | | 820 | | | | 23,037 | | | | 21,671 | |
| |
| | | Dollars | |
| | | For the year ended December 31, 2010 | |
Portfolio | | Sales | | | Reinvested
Distributions | | | Redemptions | | | Net change in
Net Assets
relating to fund
share activity | |
Institutional International Growth | | $ | 585,127 | | | $ | 33,238 | | | $ | 379,024 | | | $ | 239,341 | |
Institutional International Equity | | | 31,823 | | | | 3,868 | | | | 139,231 | | | | (103,540 | ) |
International Small Cap Growth | | | 76,119 | | | | 1,301 | | | | 20,893 | | | | 56,527 | |
Emerging Markets Growth | | | 299,213 | | | | 10,490 | | | | 331,182 | | | | (21,479 | ) |
Emerging Leaders Growth | | | 2,611 | | | | 602 | | | | 45,497 | | | | (42,284 | ) |
Bond | | | 23,201 | | | | 1,159 | | | | 620 | | | | 23,740 | |
Low Duration | | | 65,503 | | | | 1,032 | | | | 31,723 | | | | 34,812 | |
| |
| | | Shares | |
| | | For the period ended June 30, 2011 | |
Portfolio | | Sales | | | Reinvested
Distributions | | | Redemptions | | | Net change in
Net Assets
relating to fund
share activity | |
Institutional International Growth | | | 12,592 | | | | — | | | | 24,731 | | | | (12,139 | ) |
Institutional International Equity | | | 940 | | | | — | | | | 4,651 | | | | (3,711 | ) |
International Small Cap Growth | | | 2,454 | | | | — | | | | 1,472 | | | | 982 | |
Emerging Markets Growth | | | 7,041 | | | | — | | | | 28,470 | | | | (21,429 | ) |
Emerging Leaders Growth | | | — | | | | — | | | | 867 | | | | (867 | ) |
Bond | | | 2,809 | | | | 82 | | | | 1,698 | | | | 1,193 | |
Low Duration | | | 4,438 | | | | 83 | | | | 2,326 | | | | 2,195 | |
| |
| | | Shares | |
| | | For the year ended December 31, 2010 | |
Portfolio | | Sales | | | Reinvested
Distributions | | | Redemptions | | | Net change in
Net Assets
relating to fund
share activity | |
Institutional International Growth | | | 45,848 | | | | 2,351 | | | | 29,748 | | | | 18,451 | |
Institutional International Equity | | | 3,407 | | | | 365 | | | | 13,836 | | | | (10,064 | ) |
International Small Cap Growth | | | 6,879 | | | | 100 | | | | 1,893 | | | | 5,086 | |
Emerging Markets Growth | | | 22,585 | | | | 677 | | | | 23,038 | | | | 224 | |
Emerging Leaders Growth | | | 271 | | | | 60 | | | | 5,354 | | | | (5,023 | ) |
Bond | | | 2,199 | | | | 109 | | | | 58 | | | | 2,250 | |
Low Duration | | | 6,561 | | | | 104 | | | | 3,179 | | | | 3,486 | |
June 30, 2011 | William Blair Funds 59 |
Financial Highlights
Institutional International Growth Fund
| | | | | | | | | | | | | | | | | | | | | | | | | | |
| | | Period Ended
June 30, | | | | | Years Ended December 31, | |
| | | 2011 | | | | | 2010 | | | 2009 | | | 2008 | | | 2007 | | | 2006 | |
Net asset value, beginning of year | | | $14.37 | | | | | $ | 12.20 | | | $ | 8.66 | | | $ | 19.20 | | | $ | 19.39 | | | $ | 18.11 | |
Income (loss) from investment operations: | | | | | | | | | | | | | | | | | | | | | | | | | | |
Net investment income (loss)(a) | | | 0.16 | | | | | | 0.14 | | | | 0.10 | | | | 0.25 | | | | 0.15 | | | | 0.11 | |
Net realized and unrealized gain (loss) on investments | | | 0.15 | | | | | | 2.31 | | | | 3.61 | | | | (10.24 | ) | | | 3.30 | | | | 4.09 | |
| | | | | | | | | | | | | | | | | | | | | | | | | | |
Total from investment operations | | | 0.31 | | | | | | 2.45 | | | | 3.71 | | | | (9.99 | ) | | | 3.45 | | | | 4.20 | |
Less distributions from: | | | | | | | | | | | | | | | | | | | | | | | | | | |
Net investment income | | | — | | | | | | 0.28 | | | | 0.17 | | | | — | | | | 0.35 | | | | 0.38 | |
Net realized gain | | | — | | | | | | — | | | | — | | | | 0.55 | | | | 3.29 | | | | 2.54 | |
| | | | | | | | | | | | | | | | | | | | | | | | | | |
Total distributions | | | — | | | | | | 0.28 | | | | 0.17 | | | | 0.55 | | | | 3.64 | | | | 2.92 | |
| | | | | | | | | | | | | | | | | | | | | | | | | | |
Net asset value, end of year | | | $14.68 | | | | | $ | 14.37 | | | $ | 12.20 | | | $ | 8.66 | | | $ | 19.20 | | | $ | 19.39 | |
| | | | | | | | | | | | | | | | | | | | | | | | | | |
Total Return (%)* | | | 2.16 | | | | | | 20.10 | | | | 42.83 | | | | (51.99 | ) | | | 18.49 | | | | 23.45 | |
Ratios to average daily net assets (%):** | | | | | | | | | | | | | | | | | | | | | | | | | | |
Expenses | | | 0.98 | | | | | | 0.99 | | | | 1.01 | | | | 0.98 | | | | 1.02 | | | | 1.03 | |
Net investment income (loss) | | | 2.18 | | | | | | 1.12 | | | | 0.95 | | | | 1.68 | | | | 0.74 | | | | 0.54 | |
| | | | | | | | | | | | | | | | | | | | | | | | | | |
| | | Period Ended
June 30, | | | | | Years Ended December 31, | |
| | | 2011 | | | | | 2010 | | | 2009 | | | 2008 | | | 2007 | | | 2006 | |
Supplemental data for all classes: | | | | | | | | | | | | | | | | | | | | | | | | | | |
Net assets at end of year (in thousands) | | $ | 1,747,828 | | | | | $ | 1,886,217 | | | $ | 1,375,848 | | | $ | 998,266 | | | $ | 2,145,312 | | | $ | 1,875,341 | |
Portfolio turnover rate (%)* | | | 55 | | | | | | 99 | | | | 125 | | | | 86 | | | | 61 | | | | 74 | |
| (a) | | Excludes $0.09, $0.05, $(0.10), $0.06, and $0.29 of PFIC mark to market which is treated as ordinary income for Federal tax purposes for the years 2010, 2009, 2008, 2007, and 2006, respectively. |
| * | | Rates not annualized for periods that are less than a year. |
| ** | | Rates are annualized for periods that are less than a year. |
Performance cited represents past performance. Past performance does not guarantee future results and current performance may be lower or higher than the data quoted. Results shown are annual returns, which assume reinvestment of dividends and capital gains. Investment returns and principal will fluctuate and you may have a gain or loss when you sell shares. For the most current month-end performance information, please call 1-800-742-7272 or visit our Web site at www.williamblairfunds.com.
Note: Net investment income (loss) per share is based on the average shares outstanding during the year.
60 Semi-Annual Report | June 30, 2011 |
Financial Highlights
Institutional International Equity Fund
| | | | | | | | | | | | | | | | | | | | | | | | | | |
| | | Period Ended
June 30, | | | | | Years Ended December 31, | |
| | | 2011 | | | | | 2010 | | | 2009 | | | 2008 | | | 2007 | | | 2006 | |
Net asset value, beginning of year | | $ | 10.78 | | | | | $ | 9.84 | | | $ | 7.44 | | | $ | 15.03 | | | $ | 14.27 | | | $ | 12.04 | |
Income (loss) from investment operations: | | | | | | | | | | | | | | | | | | | | | | | | | | |
Net investment income (loss)(a) | | | 0.12 | | | | | | 0.10 | | | | 0.09 | | | | 0.15 | | | | 0.13 | | | | 0.07 | |
Net realized and unrealized gain (loss) on investments | | | 0.27 | | | | | | 0.99 | | | | 2.38 | | | | (7.60 | ) | | | 2.42 | | | | 2.37 | |
| | | | | | | | | | | | | | | | | | | | | | | | | | |
Total from investment operations | | | 0.39 | | | | | | 1.09 | | | | 2.47 | | | | (7.45 | ) | | | 2.55 | | | | 2.44 | |
Less distributions from: | | | | | | | | | | | | | | | | | | | | | | | | | | |
Net investment income | | | — | | | | | | 0.15 | | | | 0.07 | | | | — | | | | 0.22 | | | | 0.16 | |
Net realized gain | | | — | | | | | | — | | | | — | | | | 0.14 | | | | 1.57 | | | | 0.05 | |
| | | | | | | | | | | | | | | | | | | | | | | | | | |
Total distributions | | | — | | | | | | 0.15 | | | | 0.07 | | | | 0.14 | | | | 1.79 | | | | 0.21 | |
| | | | | | | | | | | | | | | | | | | | | | | | | | |
Net asset value, end of year | | $ | 11.17 | | | | | $ | 10.78 | | | $ | 9.84 | | | $ | 7.44 | | | $ | 15.03 | | | $ | 14.27 | |
| | | | | | | | | | | | | | | | | | | | | | | | | | |
Total Return (%)* | | | 3.62 | | | | | | 11.12 | | | | 33.27 | | | | (49.57 | ) | | | 18.36 | | | | 20.22 | |
Ratios to average daily net assets (%):** | | | | | | | | | | | | | | | | | | | | | | | | | | |
Expenses, net of waivers and reimbursements | | | 1.08 | | | | | | 1.07 | | | | 1.09 | | | | 1.05 | | | | 1.09 | | | | 1.10 | |
Expenses, before waivers and reimbursements | | | 1.08 | | | | | | 1.07 | | | | 1.09 | | | | 1.05 | | | | 1.06 | | | | 1.12 | |
Net investment income (loss), net of waivers and reimbursements | | | 2.11 | | | | | | 0.97 | | | | 1.04 | | | | 1.26 | | | | 0.86 | | | | 0.50 | |
Net investment income (loss), before waivers and reimbursements | | | 2.11 | | | | | | 0.97 | | | | 1.04 | | | | 1.26 | | | | 0.89 | | | | 0.48 | |
| | | Period Ended
June 30, | | | | | Years Ended December 31, | |
| | | 2011 | | | | | 2010 | | | 2009 | | | 2008 | | | 2007 | | | 2006 | |
Supplemental data for all classes: | | | | | | | | | | | | | | | | | | | | | | | | | | |
Net assets at end of year (in thousands) | | $ | 260,525 | | | | | $ | 291,468 | | | $ | 365,271 | | | $ | — | | | $ | 618,179 | | | $ | 598,375 | |
Portfolio turnover rate (%)* | | | 41 | | | | | | 73 | | | | 78 | | | | 91 | | | | 66 | | | | 79 | |
| (a) | | Excludes $0.04, $0.00, $0.00, $(0.07), and $0.01 of PFIC mark to market which is treated as ordinary income for Federal tax purposes for the years 2010, 2009, 2008, 2007 and 2006 respectively. |
| * | | Rates not annualized for periods that are less than a year. |
| ** | | Rates are annualized for periods that are less than a year. |
Performance cited represents past performance. Past performance does not guarantee future results and current performance may be lower or higher than the data quoted. Results shown are annual returns, which assume reinvestment of dividends and capital gains. Investment returns and principal will fluctuate and you may have a gain or loss when you sell shares. For the most current month-end performance information, please call 1-800-742-7272 or visit our Web site at www.williamblairfunds.com.
Note: Net investment income (loss) per share is based on the average shares outstanding during the year.
June 30, 2011 | William Blair Funds 61 |
Financial Highlights
International Small Cap Growth Fund
| | | | | | | | | | | | | | | | | | | | | | | | | | |
| | | | | | | | Institutional Class Shares | |
| | | Period Ended
June 30, | | | | | Years Ended December 31, | |
| | | 2011 | | | | | 2010 | | | 2009 | | | 2008 | | | 2007 | | | 2006 | |
Net asset value, beginning of year | | $ | 13.24 | | | | | $ | 10.53 | | | $ | 6.69 | | | $ | 14.04 | | | $ | 13.43 | | | $ | 11.16 | |
Income (loss) from investment operations: | | | | | | | | | | | | | | | | | | | | | | | | | | |
Net investment income (loss)(a) | | | 0.10 | | | | | | 0.09 | | | | 0.04 | | | | 0.03 | | | | 0.05 | | | | (0.01 | ) |
Net realized and unrealized gain (loss) on investments | | | 0.67 | | | | | | 2.69 | | | | 3.83 | | | | (7.26 | ) | | | 1.72 | | | | 2.34 | |
| | | | | | | | | | | | | | | | | | | | | | | | | | |
Total from investment operations | | | 0.77 | | | | | | 2.78 | | | | 3.87 | | | | (7.23 | ) | | | 1.77 | | | | 2.33 | |
Less distributions from: | | | | | | | | | | | | | | | | | | | | | | | | | | |
Net investment income | | | — | | | | | | 0.07 | | | | 0.03 | | | | — | | | | 0.12 | | | | 0.01 | |
Net realized gain | | | — | | | | | | — | | | | — | | | | 0.12 | | | | 1.04 | | | | 0.05 | |
| | | | | | | | | | | | | | | | | | | | | | | | | | |
Total distributions | | | — | | | | | | 0.07 | | | | 0.03 | | | | 0.12 | | | | 1.16 | | | | 0.06 | |
| | | | | | | | | | | | | | | | | | | | | | | | | | |
Net asset value, end of year | | $ | 14.01 | | | | | $ | 13.24 | | | $ | 10.53 | | | $ | 6.69 | | | $ | 14.04 | | | $ | 13.43 | |
| | | | | | | | | | | | | | | | | | | | | | | | | | |
Total Return (%)* | | | 5.82 | | | | | | 26.40 | | | | 57.84 | | | | (51.53 | ) | | | 13.53 | | | | 20.86 | |
Ratios to average daily net assets (%):** | | | | | | | | | | | | | | | | | | | | | | | | | | |
Expenses, net of waivers and reimbursements | | | 1.07 | | | | | | 1.08 | | | | 1.13 | | | | 1.14 | | | | 1.14 | | | | 1.25 | |
Expenses, before waivers and reimbursements | | | 1.07 | | | | | | 1.08 | | | | 1.13 | | | | 1.11 | | | | 1.14 | | | | 1.31 | |
Net investment income (loss), net of waivers and reimbursements | | | 1.50 | | | | | | 0.77 | | | | 0.48 | | | | 0.28 | | | | 0.32 | | | | (0.12 | ) |
Net investment income (loss), before waivers and reimbursements | | | 1.50 | | | | | | 0.77 | | | | 0.48 | | | | 0.32 | | | | 0.32 | | | | (0.18 | ) |
| | | Period Ended
June 30, | | | | | Years Ended December 31, | |
| | | 2011 | | | | | 2010 | | | 2009 | | | 2008 | | | 2007 | | | 2006 | |
Supplemental data for all classes: | | | | | | | | | | | | | | | | | | | | | | | | | | |
Net assets at end of year (in thousands) | | $ | 768,599 | | | | | $ | 646,951 | | | $ | 390,851 | | | $ | 291,988 | | | $ | 401,459 | | | $ | 231,969 | |
Portfolio turnover rate (%)* | | | 44 | | | | | | 85 | | | | 136 | | | | 78 | | | | 88 | | | | 109 | |
| (a) | | Excludes $0.15, $0.01, $(0.02), $0.05, and $0.00 of PFIC mark to market which is treated as ordinary income for Federal tax purposes for the years 2010, 2009, 2008, 2007, and 2006, respectively. |
| * | | Rates not annualized for periods that are less than a year. |
| ** | | Rates are annualized for periods that are less than a year. |
Performance cited represents past performance. Past performance does not guarantee future results and current performance may be lower or higher than the data quoted. Results shown are annual returns, which assume reinvestment of dividends and capital gains. Investment returns and principal will fluctuate and you may have a gain or loss when you sell shares. For the most current month-end performance information, please call 1-800-742-7272 or visit our Web site at www.williamblairfunds.com.
Note: Net investment income (loss) per share is based on the average shares outstanding during the year.
62 Semi-Annual Report | June 30, 2011 |
Financial Highlights
Emerging Markets Growth Fund
| | | | | | | | | | | | | | | | | | | | | | | | |
| | | | | | Institutional Class Shares | |
| | | Period Ended
June 30, | | | Years Ended December 31, | |
| | | 2011 | | | 2010 | | | 2009 | | | 2008 | | | 2007 | | | 2006 | |
Net asset value, beginning of year | | $ | 15.96 | | | $ | 13.03 | | | $ | 7.56 | | | $ | 22.07 | | | $ | 19.54 | | | $ | 14.20 | |
Income (loss) from investment operations: | | | | | | | | | | | | | | | | | | | | | | | | |
Net investment income (loss) (a) | | | 0.09 | | | | 0.06 | | | | 0.06 | | | | 0.17 | | | | (0.01 | ) | | | 0.02 | |
Net realized and unrealized gain (loss) on investments | | | (0.16 | ) | | | 3.05 | | | | 5.55 | | | | (13.74 | ) | | | 7.27 | | | | 5.44 | |
| | | | | | | | | | | | | | | | | | | | | | | | |
Total from investment operations | | | (0.07 | ) | | | 3.11 | | | | 5.61 | | | | (13.57 | ) | | | 7.26 | | | | 5.46 | |
Less distributions from: | | | | | | | | | | | | | | | | | | | | | | | | |
Net investment income | | | — | | | | 0.18 | | | | 0.14 | | | | — | | | | 0.19 | | | | 0.01 | |
Net realized gain | | | — | | | | — | | | | — | | | | 0.94 | | | | 4.54 | | | | 0.11 | |
| | | | | | | | | | | | | | | | | | | | | | | | |
Total distributions | | | — | | | | 0.18 | | | | 0.14 | | | | 0.94 | | | | 4.73 | | | | 0.12 | |
| | | | | | | | | | | | | | | | | | | | | | | | |
Net asset value, end of year | | $ | 15.89 | | | $ | 15.96 | | | $ | 13.03 | | | $ | 7.56 | | | $ | 22.07 | | | $ | 19.54 | |
| | | | | | | | | | | | | | | | | | | | | | | | |
Total Return (%)* | | | (0.44 | ) | | | 23.91 | | | | 74.33 | | | | (61.51 | ) | | | 38.21 | | | | 38.49 | |
Ratios to average daily net assets (%):** | | | | | | | | | | | | | | | | | | | | | | | | |
Expenses, net of waivers and reimbursements | | | 1.17 | | | | 1.17 | | | | 1.22 | | | | 1.22 | | | | 1.25 | | | | 1.25 | |
Expenses, before waivers and reimbursements | | | 1.17 | | | | 1.17 | | | | 1.22 | | | | 1.20 | | | | 1.25 | | | | 1.32 | |
Net investment income (loss), net of waivers and reimbursements | | | 1.22 | | | | 0.43 | | | | 0.54 | | | | 1.08 | | | | (0.05 | ) | | | 0.09 | |
Net investment income (loss), before waivers and reimbursements | | | 1.22 | | | | 0.43 | | | | 0.54 | | | | 1.10 | | | | (0.05 | ) | | | 0.02 | |
| | | | | | | |
| | | Period Ended
June 30, | | | Years Ended December 31, | |
| | | 2011 | | | 2010 | | | 2009 | | | 2008 | | | 2007 | | | 2006 | |
Supplemental data for all classes: | | | | | | | | | | | | | | | | | | | | | | | | |
Net assets at end of year (in thousands) | | $ | 879,589 | | | $ | 1,250,543 | | | $ | 1,038,260 | | | $ | 385,588 | | | $ | 1,165,854 | | | $ | 813,649 | |
Portfolio turnover rate (%)* | | | 53 | | | | 121 | | | | 113 | | | | 118 | | | | 100 | | | | 113 | |
| (a) | | Excludes $0.11,$0.15, $(0.09), $0.21, and $0.00 of PFIC mark to market which is treated as ordinary income for Federal tax purposes for the years 2010, 2009, 2008, 2007 and 2006 respectively. |
| * | | Rates not annualized for periods that are less than a year. |
| ** | | Rates are annualized for periods that are less than a year. |
Performance cited represents past performance. Past performance does not guarantee future results and current performance may be lower or higher than the data quoted. Results shown are annual returns, which assume reinvestment of dividends and capital gains. Investment returns and principal will fluctuate and you may have a gain or loss when you sell shares. For the most current month-end performance information, please call 1-800-742-7272 or visit our Web site at www.williamblairfunds.com.
Note: Net investment income (loss) per share is based on the average shares outstanding during the year.
June 30, 2011 | William Blair Funds 63 |
Financial Highlights
Emerging Leaders Growth Fund
| | | | | | | | | | | | | | | | | | |
| | | | | | | | Institutional Class Shares | |
| | | Period Ended
June 30, | | | | | Periods Ended December 31, | |
| | | 2011 | | | | | 2010 | | | 2009 | | | 2008(a) | |
Net asset value, beginning of year | | $ | 10.35 | | | | | $ | 8.43 | | | $ | 4.78 | | | $ | 10.00 | |
Income (loss) from investment operations: | | | | | | | | | | | | | | | | | | |
Net investment income (loss) (c) | | | 0.05 | | | | | | 0.04 | | | | 0.04 | | | | 0.04 | |
Net realized and unrealized gain (loss) on investments | | | (0.29 | ) | | | | | 1.97 | | | | 3.73 | | | | (5.26 | ) |
| | | | | | | | | | | | | | | | | | |
Total from investment operations | | | (0.24 | ) | | | | | 2.01 | | | | 3.77 | | | | (5.22 | ) |
Less distributions from: | | | | | | | | | | | | | | | | | | |
Net investment income | | | — | | | | | | 0.03 | | | | 0.12 | | | | 0.00 | ^ |
Net realized gain | | | — | | | | | | 0.06 | | | | — | | | | — | |
| | | | | | | | | | | | | | | | | | |
Total distributions | | | — | | | | | | 0.09 | | | | 0.12 | | | | 0.00 | ^ |
| | | | | | | | | | | | | | | | | | |
Net asset value, end of year | | $ | 10.11 | | | | | $ | 10.35 | | | $ | 8.43 | | | $ | 4.78 | |
| | | | | | | | | | | | | | | | | | |
Total Return (%)* | | | (2.32 | ) | | | | | 23.84 | | | | 78.93 | | | | (52.11 | ) |
Ratios to average daily net assets (%):** | | | | | | | | | | | | | | | | | | |
Expenses, net of waivers and reimbursements | | | 1.25 | | | | | | 1.26 | | | | 1.25 | | | | 1.25 | |
Expenses, before waivers and reimbursements | | | 1.39 | | | | | | 1.35 | | | | 1.36 | | | | 1.41 | |
Net investment income (loss), net of waivers and reimbursements | | | 0.97 | | | | | | 0.50 | | | | 0.58 | | | | 0.70 | |
Net investment income (loss), before waivers and reimbursements | | | 0.83 | | | | | | 0.83 | | | | 0.47 | | | | 0.54 | |
| | | Period Ended
June 30, | | | | | Periods Ended December 31, | |
| | | 2011 | | | | | 2010 | | | 2009 | | | 2008(a) | |
Supplemental data for all classes: | | | | | | | | | | | | | | | | | | |
Net assets at end of year (in thousands) | | $ | 100,402 | | | | | $ | 94,901 | | | $ | 115,136 | | | $ | 46,676 | |
Portfolio turnover rate (%)* | | | 102 | | | | | | 176 | | | | 176 | | | | 151 | |
| (a) | | For the period May 3, 2010 (Commencement of Operations) to December 31, 2010. |
| (c) | | Excludes $0.96, $1.29, and $0.00 of PFIC mark to market which is treated as ordinary income for Federal tax purposes for the years 2010, 2009, and 2008 respectively. |
| * | | Rates not annualized for periods that are less than a year. |
| ** | | Rates are annualized for periods that are less than a year. |
| ^ | | Amount is less than $0.005 per share. |
Performance cited represents past performance. Past performance does not guarantee future results and current performance may be lower or higher than the data quoted. Results shown are annual returns, which assume reinvestment of dividends and capital gains. Investment returns and principal will fluctuate and you may have a gain or loss when you sell shares. For the most current month-end performance information, please call 1-800-742-7272 or visit our Web site at www.williamblairfunds.com.
Note: Net investment income (loss) per share is based on the average shares outstanding during the year.
64 Semi-Annual Report | June 30, 2011 |
Financial Highlights
Bond Fund
| | | | | | | | | | | | | | | | | | | | | | |
| | | | | | | | Institutional Class Shares | |
| | | Period Ended
June 30, | | | | | Periods Ended December 31, | |
| | | 2011 | | | | | 2010 | | | 2009 | | | 2008 | | | 2007(a) | |
Net asset value, beginning of year | | $ | 10.58 | | | | | $ | 10.30 | | | $ | 9.72 | | | $ | 10.00 | | | $ | 10.00 | |
Income (loss) from investment operations: | | | | | | | | | | | | | | | | | | | | | | |
Net investment income (loss) | | | 0.24 | | | | | | 0.48 | | | | 0.51 | | | | 0.50 | | | | 0.32 | |
Net realized and unrealized gain (loss) on investments | | | 0.07 | | | | | | 0.34 | | | | 0.58 | | | | (0.31 | ) | | | 0.03 | |
| | | | | | | | | | | | | | | | | | | | | | |
Total from investment operations | | | 0.31 | | | | | | 0.82 | | | | 1.09 | | | | 0.19 | | | | 0.35 | |
Less distributions from: | | | | | | | | | | | | | | | | | | | | | | |
Net investment income | | | 0.24 | | | | | | 0.51 | | | | 0.51 | | | | 0.47 | | | | 0.35 | |
Net realized gain | | | — | | | | | | 0.03 | | | | — | | | | — | | | | 0.00 | |
| | | | | | | | | | | | | | | | | | | | | | |
Total distributions | | | 0.24 | | | | | | 0.54 | | | | 0.51 | | | | 0.47 | | | | 0.35 | |
| | | | | | | | | | | | | | | | | | | | | | |
Net asset value, end of year | | $ | 10.65 | | | | | $ | 10.58 | | | $ | 10.30 | | | $ | 9.72 | | | $ | 10.00 | |
| | | | | | | | | | | | | | | | | | | | | | |
Total Return (%)* | | | 3.17 | | | | | | 8.06 | | | | 11.47 | | | | 1.95 | | | | 3.57 | |
Ratios to average daily net assets (%):** | | | | | | | | | | | | | | | | | | | | | | |
Expenses, net of waivers and reimbursements | | | 0.35 | | | | | | 0.35 | | | | 0.34 | | | | 0.35 | | | | 0.35 | |
Expenses, before waivers and reimbursements | | | 0.40 | | | | | | 0.40 | | | | 0.43 | | | | 0.56 | | | | 0.52 | |
Net investment income (loss), net of waivers and reimbursements | | | 4.56 | | | | | | 4.54 | | | | 5.07 | | | | 5.04 | | | | 5.09 | |
Net investment income (loss), before waivers and reimbursements | | | 4.51 | | | | | | 4.49 | | | | 4.98 | | | | 4.83 | | | | 4.92 | |
| | | Period Ended
June 30, | | | | | Periods Ended December 31, | |
| | | 2011 | | | | | 2010 | | | 2009 | | | 2008 | | | 2007(a) | |
Supplemental data for all classes: | | | | | | | | | | | | | | | | | | | | | | |
Net assets at end of year (in thousands) | | $ | 203,808 | | | | | $ | 192,776 | | | $ | 147,344 | | | $ | 74,613 | | | $ | 68,483 | |
Portfolio turnover rate (%)* | | | 17 | | | | | | 25 | | | | 29 | | | | 52 | | | | 38 | |
| (a) | | For the period May 1, 2007 (Commencement of Operations) to December 31, 2007. |
| * | | Rates not annualized for periods that are less than a year. |
| ** | | Rates are annualized for periods that are less than a year. |
Performance cited represents past performance. Past performance does not guarantee future results and current performance may be lower or higher than the data quoted. Results shown are annual returns, which assume reinvestment of dividends and capital gains. Investment returns and principal will fluctuate and you may have a gain or loss when you sell shares. For the most current month-end performance information, please call 1-800-742-7272 or visit our Web site at www.williamblairfunds.com.
Note: Net investment income (loss) per share is based on the average shares outstanding during the year.
June 30, 2011 | William Blair Funds 65 |
Financial Highlights
Low Duration Fund
| | | | | | | | | | | | | | |
| | | | | | | | Institutional Class Shares | |
| | | Period Ended
June 30, | | | | | Periods Ended December 31, | |
| | | 2011 | | | | | 2010 | | | 2009(a) | |
Net asset value, beginning of year | | $ | 9.90 | | | | | $ | 9.93 | | | $ | 10.00 | |
Income (loss) from investment operations: | | | | | | | | | | | | | | |
Net investment income (loss) | | | 0.09 | | | | | | 0.16 | | | | 0.01 | |
Net realized and unrealized gain (loss) on investments | | | 0.03 | | | | | | 0.05 | | | | (0.07 | ) |
| | | | | | | | | | | | | | |
Total from investment operations | | | 0.12 | | | | | | 0.21 | | | | (0.06 | ) |
Less distributions from: | | | | | | | | | | | | | | |
Net investment income | | | 0.12 | | | | | | 0.24 | | | | 0.01 | |
Net realized gain | | | — | | | | | | — | | | | — | |
| | | | | | | | | | | | | | |
Total distributions | | | 0.12 | | | | | | 0.24 | | | | 0.01 | |
| | | | | | | | | | | | | | |
Net asset value, end of year | | $ | 9.90 | | | | | $ | 9.90 | | | $ | 9.93 | |
| | | | | | | | | | | | | | |
Total Return (%)* | | | 1.38 | | | | | | 2.15 | | | | (0.58 | ) |
Ratios to average daily net assets (%):** | | | | | | | | | | | | | | |
Expenses, net of waivers and reimbursements | | | 0.40 | | | | | | 0.40 | | | | 0.40 | |
Expenses, before waivers and reimbursements | | | 0.43 | | | | | | 0.48 | | | | 0.64 | |
Net investment income (loss), net of waivers and reimbursements | | | 1.80 | | | | | | 1.61 | | | | 1.54 | |
Net investment income (loss), before waivers and reimbursements | | | 1.77 | | | | | | 1.53 | | | | 1.30 | |
| | | Period Ended
June 30, | | | | | Periods Ended December 31, | |
| | | 2011 | | | | | 2010 | | | 2009(a) | |
Supplemental data for all classes: | | | | | | | | | | | | | | |
Net assets at end of year (in thousands) | | $ | 146,035 | | | | | $ | 143,470 | | | $ | 95,134 | |
Portfolio turnover rate (%)* | | | 17 | | | | | | 51 | | | | — | |
| (a) | | For the period December 1, 2009 (Commencement of Operations) to December 31, 2009. |
| * | | Rates not annualized for periods that are less than a year. |
| ** | | Rates are annualized for periods that are less than a year. |
Performance cited represents past performance. Past performance does not guarantee future results and current performance may be lower or higher than the data quoted. Results shown are annual returns, which assume reinvestment of dividends and capital gains. Investment returns and principal will fluctuate and you may have a gain or loss when you sell shares. For the most current month-end performance information, please call 1-800-742-7272 or visit our Web site at www.williamblairfunds.com.
Note: Net investment income (loss) per share is based on the average shares outstanding during the year.
66 Semi-Annual Report | June 30, 2011 |
Trustees and Officers (Unaudited). The trustees and officers of the William Blair Funds, their year of birth, their principal occupations during the last five years, their affiliations, if any, with William Blair & Company, L.L.C., and other significant affiliations are set forth below. The address of each trustee and officer is 222 West Adams Street, Chicago, Illinois 60606.
| | | | | | | | | | |
Name and Year of Birth | | Position(s)
Held with
Fund | | Term of
Office and
Length of
Time
Served(1) | | Principal Occupation(s) During Past 5 Years | | Number of
Portfolios
in Fund
Complex
Overseen
by Trustee | | Other Directorships Held by Trustee/Officer |
Interested Trustees | | | | | | | | | | |
Michelle R. Seitz,
1965* | | Chairperson of the Board of Trustees and President | | Trustee since 2002; Chairperson since 2010 Since 2007 | | Principal, William Blair & Company, L.L.C.; Limited Partner, WB Holdings, L.P. (since November 2008); Member, WBC GP, L.L.P. (since November 2008) | | 19 | | Director, William Blair SI CAV |
| | | | | |
Richard W. Smirl,
1967 | | Trustee and Senior Vice President | | Trustee since 2010 and Senior Vice President since 2007 | | Principal, William Blair & Company, L.L.C. | | 19 | | Director, William Blair SI CAV |
| | | | |
Non-Interested Trustees | | | | | | | | |
Ann P. McDermott,
1939 | | Trustee | | Since 1996 | | Board member and officer for various civic and charitable organizations over the past thirty years; professional experience prior thereto, registered representative for New York Stock Exchange firm | | 19 | | Northwestern University, Women’s Board; Rush Presbyterian St. Luke’s Medical Center, Women’s Board; University of Chicago, Women’s Board; Visiting Nurses Association, Honorary Director |
| | | | | |
Phillip O. Peterson,
1944 | | Trustee | | Since 2007 | | Retired; formerly, President, Strong Mutual Funds, 2004-2005; formerly, Partner, KPMG LLP | | 19 | | The Hartford Group of Mutual Funds (87 portfolios) |
| | | | | |
Lisa A. Pollina,
1965 | | Trustee | | Since 2011 | | Senior Advisor to head of RBC Financial Group’s International Banking and Insurance division since 2010; formerly, Bank of America Corporation, Global Financial Institutions Executive from 2006-2008 and multiple Advisory from 2008-2010; prior thereto, Managing Partner, Bordeaux Capital from 2002-2006. | | 19 | | Darkstrand, high-speed fiber optic network provider (2009 to 2010); Jane Addams Hull House Association, Board of Trustees (2003 to 2009) |
| | | | | |
Donald J. Reaves,
1946 | | Trustee | | Since 2004 | | Chancellor, Winston-Salem State University since 2007; formerly, Vice President for Administration and Chief Financial Officer, University of Chicago 2002-2007. | | 19 | | American Student Assistance Corp., guarantor of student loans; Amica Mutual Insurance Company |
June 30, 2011 | William Blair Funds 67 |
68 Semi-Annual Report | June 30, 2011 |
| | | | | | | | | | |
Name and Year of Birth | | Position(s)
Held with
Fund | | Term of
Office and
Length of
Time
Served(1) | | Principal Occupation(s) During Past 5 Years | | Number of
Portfolios
in Fund
Complex
Overseen
by Trustee | | Other Directorships Held by Trustee/Officer |
Donald L. Seeley,
1944 | | Trustee | | Since 2003 | | Retired; formerly, Director, Applied Investment Management Program, University of Arizona Department of Finance, prior there to, Vice Chairman and Chief Financial Officer, True North Communications, Inc., marketing communications and advertising firm | | 19 | | Warnaco Group, Inc., intimate apparel, sportswear, and swimwear manufacturer; Center for Furniture Craftsmanship (not-for-profit) |
| | | | | |
Thomas J. Skelly,
1951 | | Trustee | | Since 2007 | | Advisory Board member for various U.S. companies; Director and Investment Committee Chairman of the US Accenture Foundation, Inc.; prior to 2005, Managing Partner of various divisions at Accenture | | 19 | | Mutual Trust Financial Group, provider of insurance and investment products; Board Member, First MetLife Investors Insurance Company, NY Chartered Company for Metropolitan Life Insurance |
Officers | | | | | | | | | | |
Michael P. Balkin,
1959 | | Senior Vice President | | Since 2009 | | Principal, William Blair & Company, L.L.C. | | | | N/A |
| | | | | |
| | Vice President | | 2008-2009 | | Associate, William Blair & Company, L.L.C.; former Partner, Magnetar Capital | | | | |
| | | | | |
Karl W. Brewer,
1966 | | Senior Vice President | | Since 2000 | | Principal, William Blair & Company, L.L.C. | | | | N/A |
| | | | | |
David C. Fording,
1967 | | Senior Vice President | | Since 2009 | | Principal, William Blair & Company, L.L.C. | | | | N/A |
| | | | | |
| | Vice President | | 2006-2009 | | Associate, William Blair & Company, L.L.C.; former Portfolio Manager, TIAA-CREF. | | | | |
| | | | | |
James S. Golan,
1961 | | Senior Vice President | | Since 2005 | | Principal, William Blair & Company, L.L.C. | | | | N/A |
| | | | | |
W. George Greig,
1952 | | Senior Vice President | | Since 1996 | | Principal, William Blair & Company, L.L.C. | | | | N/A |
| | | | | |
Michael A. Jancosek,
1959 | | Senior Vice President | | Since 2004 | | Principal, William Blair & Company L.L.C. | | | | N/A |
| | | | | |
John F. Jostrand,
1954 | | Senior Vice President | | Since 1999 | | Principal, William Blair & Company, L.L.C. | | | | N/A |
| | | | | |
Chad M. Kilmer,
1975 | | Senior Vice President | | Since 2011 | | Associate, William Blair & Company, L.L.C.; former analyst and Portfolio | | | | N/A |
| | | | | |
| | Vice President | | Since 2006 | | Manager U.S. Bancorp Asset Management. | | | | |
| | | | | |
Robert C. Lanphier, IV,
1956 | | Senior Vice President | | Since 2003 | | Principal, William Blair & Company, L.L.C. | | | | Chairman, AG. Med, Inc. |
| | | | | | | | |
Name and Year of Birth | | Position(s)
Held with
Fund | | Term of
Office and
Length of
Time
Served(1) | | Principal
Occupation(s)
During Past 5 Years(2) | | Other Directorships Held by Trustee/Officer |
Mark T. Leslie,
1967 | | Senior Vice President | | Since 2008 | | Principal, William Blair & Company, L.L.C. | | N/A |
| | | | |
| | Vice President | | 2005-2008 | | Associate, William Blair & Company, L.L.C. | | |
| | | | |
Matthew A. Litfin,
1972 | | Senior Vice President | | Since 2008 | | Principal, William Blair & Company, L.L.C. | | N/A |
| | | | |
Kenneth J. McAtamney
1966 | | Senior Vice President | | Since 2008 | | Principal, William Blair & Company, L.L.C. | | N/A |
| | | | |
Todd M. McClone,
1968 | | Senior Vice President | | Since 2006 | | Principal, William Blair & Company, L.L.C. | | N/A |
| | | | |
| | Vice President | | 2005-2006 | | Associate, William Blair & Company, L.L.C. | | N/A |
| | | | |
Tracy McCormick,
1954 | | Senior Vice President | | Since 2008 | | Principal, William Blair & Company, L.L.C. | | N/A |
| | | | |
David Merjan,
1960 | | Senior Vice President | | Since 2008 | | Principal, William Blair & Company, L.L.C. | | N/A |
| | | | |
David S. Mitchell,
1960 | | Senior Vice President | | Since 2004 | | Principal, William Blair & Company, L.L.C. | | N/A |
| | | | |
David P. Ricci,
1958 | | Senior Vice President | | Since 2006 | | Principal, William Blair & Company, L.L.C. | | N/A |
| | | | |
Richard W. Smirl,
1967 | | Senior Vice President | | Since 2004 | | Principal, William Blair & Company, L.L.C. | | N/A |
| | | | |
Jeffrey A. Urbina,
1955 | | Senior Vice President | | Since 1998 | | Principal, William Blair & Company, L.L.C. | | N/A |
| | | | |
Christopher T. Vincent,
1956 | | Senior Vice President | | Since 2004 | | Principal, William Blair & Company, L.L.C. | | N/A |
| | | | |
Kathleen M. Lynch,
1971 | | Vice President | | Since 2010 | | Associate, William Blair & Company, L.L.C. | | N/A |
| | | | |
Paul J. Sularz,
1967 | | Vice President | | Since 2009 | | Associate, William Blair & Company, L.L.C.; Vice President, J.P. Morgan Securities, Inc. | | N/A |
| | | | |
Walter R. Randall, Jr.,
1960 | | Chief Compliance Officer and Assistant Secretary | | Since 2009 | | Associate, William Blair & Company, L.L.C.; Associate Counsel and Chief Compliance Officer, Calamos Investments; Assistant General Counsel, American Century Investments. | | N/A |
| | | | |
Colette M. Garavalia,
1961 | | Treasurer | | Since 2009 | | Associate, William Blair & Company, L.L.C. | | N/A |
| | | | |
| | Secretary | | 2000-2009 | | Associate, William Blair & Company, L.L.C.; | | N/A |
June 30, 2011 | William Blair Funds 69 |
| | | | | | | | |
Name and Year of Birth | | Position(s)
Held with
Fund | | Term of
Office and
Length of
Time
Served(1) | | Principal
Occupation(s)
During Past 5 Years(2) | | Other Directorships Held by Trustee/Officer |
Andrew T. Pfau,
1970 | | Secretary | | Since 2009 | | Associate, William Blair & Company, L.L.C.; Associate, Bell, Boyd & Lloyd, LLP; Associate, Sidley Austin LLP | | N/A |
| | | | |
John M. Raczek,
1970 | | Assistant Treasurer | | Since 2010 | | Associate, William Blair & Company, L.L.C.; Manager, Calamos Investments | | |
| * | | Ms. Seitz and Mr. Smirl are interested persons of the William Blair Funds because each is a principal of William Blair & Company, L.L.C., the Fund’s investment advisor, principal underwriter and distributor. |
| (1) | | Each Trustee serves until the election and qualification of a successor, or until death, resignation or retirement or removal as provided in the Fund’s Declaration of Trust. Retirement for non-interested Trustees occurs no later than at the conclusion of the first regularly scheduled Board meeting of the Fund’s fiscal year that occurs after the earlier of (a) the non-interested Trustee’s 72nd birthday or (b) the 15th anniversary of the date that the non-interested Trustee was first elected or appointed as a member of the Board of Trustees. The Fund’s officers, except the Chief Compliance Officer, are elected annually by the Trustees. The Fund’s Chief Compliance Officer is designated by the Board of Trustees and may only be removed by action of the Board of Trustees, including a majority of the non-interested Trustees. |
| (2) | | In November 2008, all principals of William Blair & Company, L.L.C. also became limited partners in WB Holdings, L.P. |
The Statement of Additional Information for the William Blair Funds includes additional information about the trustees and is available without charge by calling 1-800-635-2886 (in Massachusetts 1-800-635-2840) or by writing the Fund.
70 Semi-Annual Report | June 30, 2011 |
Renewal of the Trust’s Management Agreement
On April 26, 2011, the Board of Trustees (the “Board”) of the William Blair Funds (the “Trust”), including the Trustees who are not “interested persons” of the Trust as defined in the Investment Company Act of 1940, as amended (the “Independent Trustees”), approved the renewal for an additional one-year term of the Trust’s Management Agreement with William Blair & Company, L.L.C. (the “Advisor”), on behalf of each of the William Blair Global Growth Fund, the William Blair Institutional International Growth Fund, the William Blair Institutional International Equity Fund, the William Blair International Small Cap Growth Fund, the William Blair Emerging Markets Growth Fund, the William Blair Emerging Leaders Growth Fund, the William Blair Bond Fund and the William Blair Low Duration Fund (each, a “Fund” and collectively, the “Funds”). In deciding to approve the renewal of the Management Agreement, the Board did not identify any single factor or group of factors as all-important or controlling and considered all factors together.
The information in this summary outlines the Board’s considerations associated with its renewal of the Management Agreement. In connection with its deliberations regarding the continuation of the Management Agreement, the Board considered such information and factors as it believed to be relevant. As described below, the Board considered the nature, extent and quality of the services performed by the Advisor under the existing Management Agreement; comparative management fees and expense ratios as prepared by an independent provider (Lipper Inc.); the estimated profits realized by the Advisor; the extent to which the Advisor realizes economies of scale as a Fund grows; and whether any fall-out benefits are being realized by the Advisor. In addition, the Independent Trustees discussed the renewal of the Management Agreement with Fund management and in private sessions with independent legal counsel at which no representatives of the Advisor were present.
The Board, including the Independent Trustees, considered the renewal of the Management Agreement pursuant to a process that concluded at the Board’s April 26, 2011 meeting. In preparation for the review process, the Independent Trustees met with independent legal counsel and discussed the type and nature of information to be requested and independent legal counsel sent a formal request for information to Trust management. The Advisor provided extensive information in response to the request. After reviewing the information received, the Independent Trustees requested supplemental information, which the Advisor provided in writing and/or orally. The Independent Trustees reviewed comparative performance and comparative advisory fees and expense ratios for a peer group and a peer universe of funds provided by Lipper for each Fund. In addition, the Independent Trustees considered: (i) materials describing the nature, quality and extent of services provided by the Advisor; (ii) information comparing the performance of each Fund to one or more relevant securities indexes; (iii) information comparing advisory fees of each Fund to fees charged by the Advisor to other funds and client accounts with similar investment strategies; (iv) the estimated allocated direct or indirect costs of services provided and estimated profits realized by the Advisor for both the Trust as a whole and each Fund individually; and (v) information describing other benefits to the Advisor resulting from its relationship with the Funds. The Independent Trustees also noted that they receive information from the Advisor regarding the Funds throughout the year in connection with regular Board meetings, including presentations from portfolio managers. The Independent Trustees also received a memorandum from independent legal counsel advising them of their duties and responsibilities in connection with the review of the Management Agreement. Finally, the Advisor made an in-person presentation to the Independent Trustees regarding the contract review information, including addressing the supplemental information requests, and answered questions from the Independent Trustees.
On April 14, 25 and 26, 2011, the Independent Trustees met independently of Trust management and of the interested Trustees to review and discuss with independent legal counsel the information provided by the Advisor, Lipper and independent legal counsel. The Independent Trustees noted that in evaluating the Management Agreement, they were taking into account their accumulated experience as Trustees in working with the Advisor on matters relating to the Funds. Based on their review, the Independent Trustees concluded that it was in the best interest of each Fund to renew the Management Agreement and recommended to the Board the renewal of the Management Agreement. The Board considered the recommendation of the Independent Trustees along with the other factors that the Board deemed relevant.
Nature, Quality and Extent of Services. In evaluating the nature, quality and extent of the services provided by the Advisor to the Funds, the Board noted that the Advisor is a quality firm with a reputation for integrity and honesty that employs high quality people and has a long association with the Funds, in each case other than the Growth Fund, since the inception of the Funds. The Trustees believe that a long-term relationship with a capable, conscientious advisor is in the best interests of shareholders and that shareholders have invested in the Funds knowing that the Advisor managed the Funds and knowing the investment advisory fee. The Board considered biographical information about the Trust’s officers and the Funds’ portfolio managers, including information on the portfolio managers’ investments in the Funds. The Board also considered the administrative services performed by the Advisor, financial information regarding the Advisor, the Advisor’s execution quality and use of soft dollars, the compliance regime overseen by the Advisor, and the Advisor’s expense limitations in
June 30, 2011 | William Blair Funds 71 |
place for certain Funds. The Board was also provided with information pertaining to the Advisor’s organizational structure and senior management. The Board noted that the Advisor pays the compensation of all of the officers and the interested Trustees of the Trust.
The Board reviewed information on the annualized total returns of each Fund for the one, three, five and ten year periods ended December 31, 2010, as applicable, along with annualized total return information for the Lipper performance peer universe of funds and one or more relevant securities indexes. The Lipper performance peer universe for each Fund included all funds with a similar investment style as classified by Lipper regardless of asset size or primary channel of distribution. With respect to the comparative performance information generally, the Board considered the Advisor’s statement that it is committed to managing each Fund consistently with the Fund’s stated investment strategies through all market environments and that, as a result, the Funds’ relative performance compared to the Lipper performance peer universe and relevant securities indexes from year to year will be affected by whether the market environment favors or disfavors the Advisor’s investment strategies. The Board also considered the Advisor’s statement that its investment strategies are intended to produce superior performance over the long term. The Trustees reviewed each Fund’s ranking in its Lipper performance peer universe during the applicable periods, and based on that review, requested and discussed with the Advisor additional information regarding the performance of the Institutional International Equity Fund, the Emerging Markets Growth Fund and the Low Duration Fund. With respect to the Institutional International Equity Fund, the Board noted that, except for 2008, the Fund had positive absolute performance for each full year since its inception and also considered the Advisor’s statement that the Fund’s lower allocations to emerging markets and small-cap securities relative to its peer funds had contributed to underperformance in recent periods. With respect to the Emerging Markets Growth Fund, the Board considered the Advisor’s statement that the Fund’s underperformance during the economic downturn in 2008 and 2009 continued to negatively impact the Fund’s three- and five-year rankings within its Lipper performance peer universe and noted that the Fund ranked in the 20th percentile of its Lipper performance peer universe over the most recent one-year period. With respect to the Low Duration Fund, the Board considered supplemental information presented by the Advisor comparing the Fund’s performance to the performance of a different peer group of funds that the Advisor believed to be more representative of the Fund’s investment style and portfolio characteristics, including the Fund’s average duration and average credit quality. The Board considered the Advisor’s statement that the Fund’s lower average duration and higher average credit quality as compared to the funds in its Lipper performance peer universe negatively impacted its comparative performance.
Based upon all relevant factors, the Board concluded that the nature, quality and extent of the services provided by the Advisor to each Fund were satisfactory.
Fees and Expenses. The Board reviewed each Fund’s advisory fee and expense ratio and reviewed information comparing the advisory fee and expense ratio to those of a Lipper expense peer group and Lipper expense peer universe for each Fund. The Lipper expense peer group for each Fund consisted of a group of funds with a similar investment style as classified by Lipper, distribution channel and asset size as the Fund. The Lipper expense peer universe for each Fund consisted of all funds with a similar investment style as classified by Lipper and distribution channel as the Fund. The Board considered that the Advisor had proposed to contractually limit total expenses for the Global Growth Fund, the Institutional International Equity Fund, the International Small Cap Growth Fund, the Emerging Markets Growth Fund, the Emerging Leaders Growth Fund, the Bond Fund and the Low Duration Fund. For each Fund, the Board also reviewed amounts charged by the Advisor to other pooled investment vehicles, including other registered funds for which the Advisor acts as a subadvisor, and the Advisor’s fee schedule for institutional separate accounts. With respect to other pooled investment vehicles and institutional separate accounts, the Board considered the Advisor’s statement that both the mix of services provided to the Funds and the additional regulatory responsibilities associated with sponsoring registered investment companies were greater as compared to the work involved for other pooled investment vehicles and separate accounts. In addition, the Board considered the Advisor’s statement that institutional separate accounts are distributed differently, operate under different investment and regulatory structures and have different business risks as compared to the Funds.
In considering the information, the Board noted that the advisory fees for the Global Growth Fund, the Institutional International Growth Fund, the International Small Cap Growth Fund, the Emerging Markets Growth Fund, the Emerging Leaders Growth Fund, the Bond Fund and the Low Duration Fund were below or within an acceptable range of the average advisory fees of their Lipper expense peer group. The Board also noted that the advisory fees for the Institutional International Equity Fund were above the average advisory fees of their Lipper expense peer group, but that such advisory fees were within an acceptable range of the average advisory fees of their Lipper expense peer group and consistent with reasonable expectations in light of the nature, quality and extent of services provided by the Advisor. On the basis of the information provided, the Board concluded that each Fund’s advisory fee, coupled with applicable expense limitations, was reasonable in light of the nature, quality and extent of services provided by the Advisor.
72 Semi-Annual Report | June 30, 2011 |
Profitability. With respect to the profitability of the Management Agreement to the Advisor, the Board considered the overall fees paid under the Management Agreement, including the estimated allocated costs of the services provided and profits realized by the Advisor from its relationship with the Trust as a whole and each Fund individually. The Board concluded that the estimated profits realized by the Advisor were not unreasonable.
Economies of Scale. The Board considered the extent to which economies of scale would be realized as the Funds grow and whether fee levels reflect these economies of scale for the benefit of investors. The Board noted the Advisor’s representation that certain Fund expenses are relatively fixed and unrelated to asset size and that the Advisor may enjoy some economies of scale as a Fund’s assets grow. The Board also noted that the Advisor increased the number of personnel working on Fund matters during 2010. In considering whether fee levels reflect economies of scale for the benefit of Fund investors, the Board reviewed each Fund’s asset size, breakpoints for those Funds with breakpoints in the advisory fee schedule, the Fund’s total and net expense ratios and the expense limitations in place and/or proposed, and concluded that in the aggregate they reasonably reflect appropriate recognition of any economies of scale.
Other Benefits to the Advisor. The Board considered benefits derived by the Advisor from its relationship with the Funds, including (i) non-advisory fee revenue from the Funds in the form of shareholder administration fees, service fees and/or distribution fees and the payment of some or all of those revenues to affiliates or third parties, (ii) soft dollars, which pertain primarily to the Funds investing in equity securities, and (iii) favorable media coverage. The Board concluded that, taking into account these benefits, each Fund’s advisory fee was reasonable.
Conclusion. Based upon all of the information considered and the conclusions reached, the Board determined that the terms of the Management Agreement continue to be fair and reasonable and that the continuation of the Management Agreement is in the best interests of each Fund.
June 30, 2011 | William Blair Funds 73 |
(unaudited)
Proxy Voting
A description of the policies and procedures that the Fund uses to determine how to vote proxies relating to portfolio securities and information regarding how the Fund voted proxies relating to portfolio securities for the most recent 12-month period ended December 31 are available without charge, upon request, by calling 1-800-635-2886 (in Massachusetts 1-800-635-2840), at www.williamblairfunds.com and on the SEC’s website at http://www.sec.gov.
Quarterly Portfolio Schedules
Each Portfolio files its complete schedule of portfolio holdings with the SEC for the first and third fiscal quarters of each fiscal year (quarters ended March 31 and September 30) on Form N-Q. The Fund’s Forms N-Q are available on the SEC’s website at http://www.sec.gov and may be reviewed and copied at the SEC’s Public Reference Room in Washington, D.C. Information on the operation of the SEC’s Public Reference Room may be obtained by calling 1-800-SEC-0330. The Fund’s Forms N-Q are also available on the Fund’s website at www.williamblairfunds.com.
Additional Federal Income Tax Information: (unaudited)
Under Section 852(b)(3)(C) of the Code, the Funds hereby designate the following amounts as capital gain dividends for the fiscal year ended December 31, 2010:
| | |
Emerging Leaders Growth | | Bond |
$505,181 | | $493,757 |
The following table provides the percentage of the 2010 year-end distributions that qualify for the dividend received deduction, and the qualified dividend income percentage:
| | | | | | | | |
Portfolio | | Dividend
Received
Deduction% | | | Qualified
Dividend
Income% | |
Institutional International Growth | | | 0.00 | % | | | 80.38 | % |
Institutional International Equity | | | 0.31 | % | | | 100.00 | % |
International Small Cap Growth | | | 0.13 | % | | | 100.00 | % |
Emerging Markets Growth | | | 0.16 | % | | | 83.93 | % |
Emerging Leaders Growth | | | 0.00 | % | | | 100.00 | % |
Bond | | | 0.00 | % | | | 0.00 | % |
Low Duration | | | 0.00 | % | | | 0.00 | % |
In January 2011, you were notified on IRS Form 1099-Div or substitute 1099 DIV as to the Federal tax status of the distributions received by you in the calendar year 2010.
74 Semi-Annual Report | June 30, 2011 |
Useful Information About Your Report (unaudited)
Please refer to this information when reviewing the Expense Example for each Portfolio.
Expense Example
As a shareholder of a Portfolio, you incur ongoing costs, including management fees and other Portfolio expenses. The example is intended to help you understand your ongoing costs (in dollars) of investing in the Portfolio and to compare these costs with the ongoing costs of investing in other mutual funds. To do so, compare the Portfolio’s 5% hypothetical example with the 5% hypothetical examples that appear in the shareholder reports of other funds. The example is based on an investment of $1,000 invested at the beginning of the period and held for the entire six-month period from January 1, 2011 to June 30, 2011.
Actual Expenses
In each example, the first line for each share class in the table provides information about the actual account values and actual expenses. These expenses reflect the effect of any expense cap applicable to the share class during the period. Without this expense cap, the costs shown in the table would have been higher. You may use the information in this line, together with the amount you invested, to estimate the expenses that you paid over the period. Simply divide your account value by $1,000 (example, an $8,600 account value divided by $1,000 = 8.6), then multiply the result by the number in the first line under the heading entitled “Expenses Paid During the Period” to estimate the expenses you paid on your account during the period.
Hypothetical Example for Comparison Purposes
In each example, the second line for each share class in the table provides information about hypothetical account values and hypothetical expenses based on the Portfolio’s actual expense ratio and an assumed rate of return of 5% per year before expenses. This is not the Portfolio’s actual return. The hypothetical account values and expenses may not be used to estimate the actual ending account balance or expenses you paid for the period. You may use this information to compare the ongoing costs of investing in the Portfolio to other funds. To do so, compare this 5% hypothetical example with the 5% hypothetical examples that appear in the shareholder reports of other funds.
Please note that the expenses shown in both examples are meant to highlight your ongoing costs only and do not reflect any transactional costs or account type fees. These fees are fully described in the prospectus. Therefore, the second line of each share class in the table is useful in comparing ongoing costs only and will not help you determine the relative costs of owning different funds.
June 30, 2011 | William Blair Funds 75 |
Fund Expenses; (unaudited)
The example below shows you the ongoing costs (in dollars) of investing in your fund and allows you to compare these costs with those of other mutual funds. Please refer to the previous page for a detailed explanation of the information presented in these charts.
| | | | | | | | | | | | | | | | |
Expense Example | | Beginning
Account Value
1/1/2011 | | | Ending
Account Value
6/30/2011 | | | Expenses Paid
During the
Period(a) | | | Annualized
Expense Ratio | |
Institutional International Growth Fund | | | | | | | | | | | | | | | | |
Institutional Class—actual return | | $ | 1,000.00 | | | $ | 1,021.60 | | | $ | 4.92 | | | | 0.98 | % |
Institutional Class—hypothetical 5% return | | $ | 1,000.00 | | | $ | 1,019.93 | | | $ | 4.91 | | | | 0.98 | |
Institutional International Equity Fund | | | | | | | | | | | | | | | | |
Class I-actual return | | $ | 1,000.00 | | | $ | 1,036.20 | | | $ | 5.45 | | | | 1.08 | |
Institutional Class—hypothetical 5% return | | $ | 1,000.00 | | | $ | 1,019.44 | | | $ | 5.41 | | | | 1.08 | |
International Small Cap Growth Fund | | | | | | | | | | | | | | | | |
Institutional Class—actual return | | $ | 1,000.00 | | | $ | 1,058.20 | | | $ | 5.44 | | | | 1.07 | |
Institutional Class—hypothetical 5% return | | $ | 1,000.00 | | | $ | 1,019.51 | | | $ | 5.34 | | | | 1.07 | |
Emerging Markets Growth Fund | | | | | | | | | | | | | | | | |
Institutional Class—actual return | | $ | 1,000.00 | | | $ | 995.60 | | | $ | 5.81 | | | | 1.17 | |
Institutional Class—hypothetical 5% return | | $ | 1,000.00 | | | $ | 1,018.97 | | | $ | 5.88 | | | | 1.17 | |
Emerging Leaders Growth Fund | | | | | | | | | | | | | | | | |
Institutional Class—actual return | | $ | 1,000.00 | | | $ | 976.80 | | | $ | 6.13 | | | | 1.25 | |
Institutional Class—hypothetical 5% return | | $ | 1,000.00 | | | $ | 1,018.60 | | | $ | 6.26 | | | | 1.25 | |
Bond Fund | | | | | | | | | | | | | | | | |
Institutional Class—actual return | | $ | 1,000.00 | | | $ | 1,031.70 | | | $ | 1.75 | | | | 0.35 | |
Institutional Class—hypothetical 5% return | | $ | 1,000.00 | | | $ | 1,023.07 | | | $ | 1.74 | | | | 0.35 | |
Low Duration Fund | | | | | | | | | | | | | | | | |
Institutional Class—actual return | | $ | 1,000.00 | | | $ | 1,013.80 | | | $ | 1.97 | | | | 0.40 | |
Institutional Class—hypothetical 5% return | | $ | 1,000.00 | | | $ | 1,022.83 | | | $ | 1.98 | | | | 0.40 | |
| (a) | Expenses are equal to the annualized expense ratio, multiplied by the average account value over the period, multiplied by the number of days in the period 181, and divided by 365 (to reflect the one-half year period). |
76 Semi-Annual Report | June 30, 2011 |
BOARD OF TRUSTEES
Ann P. McDermott
Director and Trustee
Profit and not-for-profit organizations
Phillip O. Peterson
Retired Partner, KPMG LLP
Lisa A. Pollina
Senior Advisor to RBC Financial Group-International Banking and Insurance Division.
Donald J. Reaves
Chancellor, Winston-Salem State University
Donald L. Seeley
Retired Adjunct Lecturer and Director, University of Arizona Department of Finance
Michelle R. Seitz, Chairperson and President
Principal, William Blair & Company, L.L.C.
Thomas J. Skelly
Retired Managing Partner, Accenture U.S.
Richard W. Smirl, Senior Vice President
Principal, William Blair & Company, L.L.C.
Officers
Michael P. Balkin, Senior Vice President
Karl W. Brewer, Senior Vice President
David C. Fording, Senior Vice President
James S. Golan, Senior Vice President
W. George Greig, Senior Vice President
Michael A. Jancosek, Senior Vice President
John F. Jostrand, Senior Vice President
Chad M. Kilmer, Senior Vice President
Robert C. Lanphier, IV, Senior Vice President
Mark T. Leslie, Senior Vice President
Matthew A. Litfin, Senior Vice President
Kenneth J. McAtamney, Senior Vice President
Todd M. McClone, Senior Vice President
Tracy McCormick, Senior Vice President
David Merjan, Senior Vice President
David S. Mitchell, Senior Vice President
David P. Ricci, Senior Vice President
Jeffrey A. Urbina, Senior Vice President
Christopher T. Vincent, Senior Vice President
Kathleen M. Lynch, Vice President
Paul J. Sularz, Vice President
Walter R. Randall, Jr., Chief Compliance Officer an Assistant Secretary
Colette M. Garavalia, Treasurer
Andrew T. Pfau, Secretary
John Raczek, Assistant Treasurer
Investment Advisor
William Blair & Company, L.L.C.
Legal Counsel
Vedder Price P.C.
Transfer Agent
Boston Financial Data Services, Inc.
P.O. Box 8506
Boston, MA 02266-8506
For customer assistance, call 1-800-635-2886
(Massachusetts 1-800-635-2840)
June 30, 2011 | William Blair Funds 77 |
INSTITUTIONALFUNDS
Institutional International Growth Fund
Institutional International Equity Fund
International Small Cap Growth Fund - Institutional Class Shares
Emerging Markets Growth Fund - Institutional Class Shares
Emerging Leaders Growth Fund - Institutional Class Shares
Bond Fund - Institutional Class Shares
Low Duration Fund - Institutional Class Shares

222 West Adams Street
Chicago, IL 60606
800.742.7272 Ÿ www.williamblairfunds.com
©William Blair & Company, L.L.C., distributor
Not applicable to this filing.
| Item 3. | Audit Committee Financial Expert |
Not applicable to this filing.
| Item 4. | Principal Accountant Fees and Services |
Not applicable to this filing.
| Item 5. | Audit Committee of Listed Registrants |
Not Applicable to this Registrant, insofar as the Registrant is not a listed company.
| Item 6. | Schedule of Investments |
See Schedule of Investments in Item 1
| Item 7. | Disclosure of Proxy Voting Policies and Procedures for Closed-End Management Investment Companies |
Not applicable to this Registrant, insofar as the Registrant is not a closed-end management investment company.
| Item 8. | Portfolio Managers of Closed Investment Companies |
Not applicable to this Registrant, insofar as the Registrant is not a closed-end management investment company.
| Item 9. | Purchase of Equity Securities by Closed-End Management Investment Companies and Affiliated Purchasers |
Not applicable to this Registrant, insofar as the Registrant is not a closed-end management investment company.
| Item 10. | Submission of Matters to a Vote of Security Holders |
There have been no material changes to the procedures by which shareholders may recommend nominees to the Registrant’s Board of Trustees since the Registrant last provided disclosure in response to this item.
Controls and Procedures
(a) The Registrant’s principal executive and principal financial officer, or persons performing similar functions, have concluded that the Registrant’s Disclosure Controls and Procedures (as defined in Rule 30a-3(c) under the Investment Company Act of 1940, as amended (the “1940 Act”) (17 CFR 270.30a-3(c)) are effective, as of a date within 90 days of the filing date of this report that includes the disclosure required by this paragraph, based on their evaluation of these controls and procedures required by Rule 30a-3 (b) under the 1940 Act (17 CFR 270.30a-3(b) and Rules 13a-15(b) or 15d-15(b) under the Exchange Act (17 CFR 240.13a-15(b) or 240.15d-15(b)).
(b) There were no changes in the Registrant’s internal control over financial reporting (as defined in Rule 30a-3(d) under the 1940 Act (17 CFR 270.30a-3(d)) that occurred during the final quarter of the period covered by this report that has materially affected, or is reasonably likely to materially affect, the Registrant’s internal control over financial reporting.
12. (a) (1) Code of Ethics
Not applicable because it is posted on Registrant’s website.
12. (a) (2) (1)
Certification of Principal Executive Officer Required by Rule 30a-2(a) of the Investment Company Act
12. (a) (2) (2)
Certification of Principal Financial Officer Required by Rule 30a-2(a) of the Investment Company Act.
12. (a) (3)
Not applicable to this Registrant.
12. (b)
Certification of Chief Executive Officer and Certification of Chief Financial Officer Required by Rule 30a-2(b) of the Investment Company Act
Signatures
Pursuant to the requirements of the Securities Exchange Act of 1934 and the Investment Company Act of 1940, the Registrant has duly caused this report to be signed on its behalf by the undersigned, thereunto duly authorized.
| | |
| | | William Blair Funds |
| |
| | | /s/ Michelle R. Seitz |
| By: | | Michelle R. Seitz |
| | | President (Chief Executive Officer) |
Date: August 25, 2011
Pursuant to the requirements of the Securities Exchange Act of 1934 and the Investment Company Act of 1940, this report has been signed below by the following persons on behalf of the Registrant and in the capacities and on the dates indicated
| | |
| By: | | Michelle R. Seitz |
| | | President (Chief Executive Officer) |
Date: August 25, 2011
| | |
| By: | | Colette M. Garavalia |
| | | Treasurer (Chief Financial Officer) |
Date: August 25, 2011